PEABODY ENERGY CORP
10-Ks and 10-Qs
|
|
|
|
|
|
|
|
|
|
|
|
|
|
|
|
|
|
|
|
|
|
|
|
|
|
|
|
|
|
|
|
|
|
|
|
|
|
|
|
|
|
|
|
|
|
|
|
|
|
|
|
|
UNITED STATES
SECURITIES AND EXCHANGE COMMISSION
Washington, D.C. 20549
_____________________________________________
FORM 10-K
|
þ
ANNUAL REPORT PURSUANT TO SECTION 13 OR 15(d) OF THE
SECURITIES EXCHANGE ACT OF 1934
|
|
For the Fiscal Year Ended December 31, 2017
|
|
or
|
|
o
TRANSITION REPORT PURSUANT TO SECTION 13 OR 15(d) OF THE
SECURITIES EXCHANGE ACT OF 1934
|
Commission File Number 1-16463
____________________________________________

PEABODY ENERGY CORPORATION
(Exact name of registrant as specified in its charter)
|
Delaware
(State or other jurisdiction of incorporation or organization)
|
|
13-4004153
(I.R.S. Employer Identification No.)
|
|
701 Market Street, St. Louis, Missouri
(Address of principal executive offices)
|
|
63101
(Zip Code)
|
(314) 342-3400
Registrant’s telephone number, including area code
Securities Registered Pursuant to Section 12(b) of the Act:
|
Title of Each Class
|
Name of Each Exchange on Which Registered
|
|
|
Common Stock, par value $0.01 per share
|
New York Stock Exchange
|
|
Securities Registered Pursuant to Section 12(g) of the Act:
None
Indicate by check mark if the registrant is a well-known seasoned issuer, as defined in Rule 405 of the Securities Act. Yes
o
No
þ
Indicate by check mark if the registrant is not required to file reports pursuant to Section 13 or Section 15(d) of the Act. Yes
o
No
þ
Indicate by check mark whether the registrant (1) has filed all reports required to be filed by Section 13 or 15(d) of the Securities Exchange Act of 1934 during the preceding 12 months (or for such shorter period that the registrant was required to file such reports) and (2) has been subject to such filing requirements for the past 90 days. Yes
þ
No
o
Indicate by check mark whether the registrant has submitted electronically and posted on its corporate Web site, if any, every Interactive Data File required to be submitted and posted pursuant to Rule 405 of Regulation S-T (§ 232.405 of this chapter) during the preceding 12 months (or for such shorter period that the registrant was required to submit and post such files). Yes
þ
No
o
Indicate by check mark if disclosure of delinquent filers pursuant to Item 405 of Regulation S-K (§ 229.405 of this chapter) is not contained herein, and will not be contained, to the best of registrant’s knowledge, in definitive proxy or information statements incorporated by reference in Part III of this Form 10-K or any amendment to this Form 10-K.
þ
Indicate by check mark whether the registrant is a large accelerated filer, an accelerated filer, a non-accelerated filer, a smaller reporting company, or an emerging growth company. See the definitions of “large accelerated filer,” “accelerated filer,” “smaller reporting company,” and “emerging growth company” in Rule 12b-2 of the Exchange Act. (Check one):
|
Large accelerated filer
þ
|
Accelerated filer
o
|
Non-accelerated filer
o
|
Smaller reporting company
o
|
Emerging growth company
o
|
(Do not check if a smaller reporting company)
If an emerging growth company, indicate by check mark if the registrant has elected not to use the extended transition period for complying with any new or revised financial accounting standards provided pursuant to Section 13(a) of the Exchange Act.
o
Indicate by check mark whether the registrant is a shell company (as defined in Rule 12b-2 of the Exchange Act). Yes
o
No
þ
Aggregate market value of the voting stock held by non-affiliates (stockholders who are not directors or executive officers) of the Registrant, calculated using the closing price on
June 30, 2017
: Common Stock, par value $0.01 per share,
$1.4 billion
.
Indicate by check mark whether the registrant has filed all documents and reports required to be filed by Section 12, 13 or 15(d) of the Securities Exchange Act of 1934 subsequent to the distribution of securities under a plan confirmed by a court. Yes
þ
No
o
Number of shares outstanding of each of the Registrant’s classes of Common Stock, as of
February 19, 2018
: Common Stock, par value $0.01 per share,
129,717,428
shares outstanding.
DOCUMENTS INCORPORATED BY REFERENCE
Portions of the Company’s Proxy Statement to be filed with the Securities and Exchange Commission in connection with the Company’s
2018
Annual Meeting of Shareholders (the Company’s
2018
Proxy Statement) are incorporated by reference into Part III hereof. Other documents incorporated by reference in this report are listed in the Exhibit Index of this Form 10-K.
CAUTIONARY NOTICE REGARDING FORWARD-LOOKING STATEMENTS
This report includes statements of our expectations, intentions, plans and beliefs that constitute “forward-looking statements” within the meaning of Section 27A of the Securities Act of 1933 and Section 21E of the Securities Exchange Act of 1934, as amended, and are intended to come within the safe harbor protection provided by those sections. These statements relate to future events or our future financial performance, including, without limitation, the section captioned “Outlook” in Management’s Discussion and Analysis of Financial Condition and Results of Operations. We use words such as “anticipate,” “believe,” “expect,” “may,” “forecast,” “project,” “should,” “estimate,” “plan,” “outlook,” “target,” “likely,” “will,” “to be” or other similar words to identify forward-looking statements.
Without limiting the foregoing, all statements relating to our future operating results, anticipated capital expenditures, future cash flows and borrowings, and sources of funding are forward-looking statements and speak only as of the date of this report. These forward-looking statements are based on numerous assumptions that we believe are reasonable, but are subject to a wide range of uncertainties and business risks, and actual results may differ materially from those discussed in these statements. These factors are difficult to accurately predict and may be beyond our control. Factors that could affect our results or an investment in our securities include, but are not limited to:
|
•
|
as a result of our emergence from our Chapter 11 Cases, our historical financial information is not indicative of our future financial performance;
|
|
•
|
our profitability depends upon the prices we receive for our coal;
|
|
•
|
if a substantial number of our long-term coal supply agreements terminate, our revenues and operating profits could suffer if we are unable to find alternate buyers willing to purchase our coal on comparable terms to those in our contracts;
|
|
•
|
the loss of, or significant reduction in, purchases by our largest customers could adversely affect our revenues;
|
|
•
|
our trading and hedging activities do not cover certain risks, and may expose us to earnings volatility and other risks;
|
|
•
|
our operating results could be adversely affected by unfavorable economic and financial market conditions;
|
|
•
|
our ability to collect payments from our customers could be impaired if their creditworthiness or contractual performance deteriorates;
|
|
•
|
risks inherent to mining could increase the cost of operating our business;
|
|
•
|
if transportation for our coal becomes unavailable or uneconomic for our customers, our ability to sell coal could suffer;
|
|
•
|
a decrease in the availability or increase in costs of key supplies, capital equipment or commodities such as diesel fuel, steel, explosives and tires could decrease our anticipated profitability;
|
|
•
|
take-or-pay arrangements within the coal industry could unfavorably affect our profitability;
|
|
•
|
an inability of trading, brokerage, mining or freight counterparties to fulfill the terms of their contracts with us could reduce our profitability;
|
|
•
|
we may not recover our investments in our mining, exploration and other assets, which may require us to recognize impairment charges related to those assets;
|
|
•
|
our ability to operate our company effectively could be impaired if we lose key personnel or fail to attract qualified personnel;
|
|
•
|
we could be negatively affected if we fail to maintain satisfactory labor relations;
|
|
•
|
we could be adversely affected if we fail to appropriately provide financial assurances for our obligations;
|
|
•
|
our mining operations are extensively regulated, which imposes significant costs on us, and future regulations and developments could increase those costs or limit our ability to produce coal;
|
|
•
|
our operations may impact the environment or cause exposure to hazardous substances, and our properties may have environmental contamination, which could result in material liabilities to us;
|
|
•
|
we may be unable to obtain, renew or maintain permits necessary for our operations, which would reduce our production, cash flows and profitability;
|
|
•
|
our mining operations are subject to extensive forms of taxation, which imposes significant costs on us, and future regulations and developments could increase those costs or limit our ability to produce coal competitively;
|
|
•
|
if the assumptions underlying our asset retirement obligations for reclamation and mine closures are materially inaccurate, our costs could be significantly greater than anticipated;
|
|
•
|
our future success depends upon our ability to continue acquiring and developing coal reserves that are economically recoverable;
|
|
Peabody Energy Corporation
|
2017 Form 10-K
|
i
|
|
•
|
we face numerous uncertainties in estimating our economically recoverable coal reserves and inaccuracies in our estimates could result in lower than expected revenues, higher than expected costs and decreased profitability;
|
|
•
|
our global operations increase our exposure to risks unique to international mining and trading operations;
|
|
•
|
joint ventures, partnerships or non-managed operations may not be successful and may not comply with our operating standards;
|
|
•
|
we may undertake further repositioning plans that would require additional charges;
|
|
•
|
we could be exposed to significant liability, reputational harm, loss of revenue, increased costs or other risks if we sustain cyber attacks or other security breaches that disrupt our operations or result in the dissemination of proprietary or confidential information about us, our customers or other third-parties;
|
|
•
|
our expenditures for postretirement benefit and pension obligations could be materially higher than we have predicted if our underlying assumptions prove to be incorrect;
|
|
•
|
concerns about the environmental impacts of coal combustion, including perceived impacts on global climate issues, are resulting in increased regulation of coal combustion in many jurisdictions, unfavorable lending policies by government-backed lending institutions and development banks toward the financing of new overseas coal-fueled power plants and divestment efforts affecting the investment community, which could significantly affect demand for our products or our securities;
|
|
•
|
our financial performance could be adversely affected by our indebtedness;
|
|
•
|
despite our and our subsidiaries’ indebtedness, we may still be able to incur substantially more debt, including secured debt. This could further increase the risks associated with our indebtedness;
|
|
•
|
we may not be able to generate sufficient cash to service all of our indebtedness or other obligations;
|
|
•
|
the terms of our indenture governing our senior secured notes and the agreements and instruments governing our other post-emergence indebtedness impose restrictions that may limit our operating and financial flexibility;
|
|
•
|
the price of our securities may be volatile;
|
|
•
|
our Common Stock is subject to dilution and may be subject to further dilution in the future;
|
|
•
|
there may be circumstances in which the interests of a significant stockholder could be in conflict with other stockholders’ interests;
|
|
•
|
the payment of dividends on our stock or repurchases of our stock is dependent on a number of factors, and future payments and repurchases cannot be assured;
|
|
•
|
we may not be able to fully utilize our deferred tax assets;
|
|
•
|
divestitures and acquisitions are a potentially important part of our long-term strategy, subject to our investment criteria, and involve a number of risks, any of which could cause us not to realize the anticipated benefits;
|
|
•
|
our certificate of incorporation and by-laws include provisions that may discourage a takeover attempt;
|
|
•
|
diversity in interpretation and application of accounting literature in the mining industry may impact our reported financial results; and
|
|
•
|
other risks and factors, including those discussed in “Legal Proceedings,” set forth in Part I, Item 3 of this report and “Risk Factors,” set forth in Part I, Item 1A of this report.
|
When considering these forward-looking statements, you should keep in mind the cautionary statements in this document and in our other Securities and Exchange Commission (SEC) filings. These forward-looking statements speak only as of the date on which such statements were made, and we undertake no obligation to update these statements except as required by federal securities laws.
|
Peabody Energy Corporation
|
2017 Form 10-K
|
ii
|
TABLE OF CONTENTS
|
|
|
Page
|
|
|
||
|
|
||
|
Peabody Energy Corporation
|
2017 Form 10-K
|
1
|
|
Note:
|
The words “we,” “us,” “our,” “Peabody” or “the Company” as used in this report, refer to Peabody Energy Corporation or its applicable subsidiary or subsidiaries. Unless otherwise noted herein, disclosures in this Annual Report on Form 10-K relate only to our continuing operations.
|
|
When used in this filing, the term “ton” refers to short or net tons, equal to 2,000 pounds (907.18 kilograms), while “tonne” refers to metric tons, equal to 2,204.62 pounds (1,000 kilograms).
|
|
Item 1.
Business.
Overview
We are the world’s largest private-sector coal company by volume. We own interests in
23
coal mining operations located in the United States (U.S.) and Australia. We have a majority interest in
22
of those mining operations and a 50% equity interest in Middlemount Coal Pty Ltd. (Middlemount), which owns the Middlemount Mine in Queensland, Australia. In addition to our mining operations, we market and broker coal from other coal producers, both as principal and agent, and trade coal and freight-related contracts through trading and business offices in the U.S., Australia, China, and the United Kingdom. In 2017, we achieved a global safety incidence rate of 1.38 incidents per 200,000 hours worked, which was a 26% improvement in our global safety performance over the past five years. We were also recognized by the U.S. National Mining Association as the first in the industry to achieve independent certification under the CORESafety® system.
Filing Under Chapter 11 of the United States Bankruptcy Code
On April 13, 2016 (the Petition Date), Peabody Energy Corporation and a majority of its wholly owned domestic subsidiaries as well as one international subsidiary in Gibraltar (the Filing Subsidiaries, and together with Peabody, the Debtors) filed voluntary petitions for reorganization (the Bankruptcy Petitions) under Chapter 11 of Title 11 of the U.S. Code (the Bankruptcy Code) in the United States Bankruptcy Court for the Eastern District of Missouri (the Bankruptcy Court). The Company’s Australian operations and other international subsidiaries were not included in the filings. The Debtors’ Chapter 11 cases (collectively, the Chapter 11 Cases) were jointly administered under the caption
In re Peabody Energy Corporation, et al.
, Case No. 16-42529 (Bankr. E.D. Mo.). During the Chapter 11 Cases, the Debtors continued to operate their business as “debtors-in-possession” under the jurisdiction of the Bankruptcy Court and in accordance with the applicable provisions of the Bankruptcy Code and orders of the Bankruptcy Court. In general, as debtors-in-possession, the Debtors were authorized under Chapter 11 to continue to operate as an ongoing business, but could not engage in transactions outside the ordinary course of business without the prior approval of the Bankruptcy Court.
On January 27, 2017, the Debtors filed with the Bankruptcy Court the Second Amended Joint Plan of Reorganization of Debtors and Debtors in Possession (as further modified, the Plan) and the Second Amended Disclosure Statement with Respect to the Second Amended Joint Plan of Reorganization of Debtors and Debtors in Possession (previous versions of the Plan and Disclosure Statement were filed with the Bankruptcy Court on December 22, 2016 and January 25, 2017). Subsequently, the Debtors solicited votes on the Plan. On March 15, 2017, the Debtors filed a revised version of the Plan and on March 16, 2017, the Bankruptcy Court held a hearing to determine whether the Plan should be confirmed. On March 17, 2017, the Bankruptcy Court entered an order, Docket No. 2763 (the Confirmation Order), confirming the Plan. On April 3, 2017 (the Effective Date), the Debtors satisfied the conditions to effectiveness set forth in the Plan, the Plan became effective in accordance with its terms and the Debtors emerged from the Chapter 11 Cases.
A group of creditors (the Ad Hoc Committee) that held certain interests in the Company's prepetition indebtedness appealed the Bankruptcy Court's order confirming the Plan. On December 29, 2017, the United States District Court for the Eastern District of Missouri (the District Court) entered an order dismissing the Ad Hoc Committee's appeal, and, in the alternative, affirming the order confirming the Plan. On January 26, 2018, the Ad Hoc Committee appealed the District Court's order to the United States Court of Appeals for the Eighth Circuit (the Eighth Circuit). In its appeal, the Ad Hoc Committee does not ask the Eighth Circuit to reverse the order confirming the Plan. Instead, the Ad Hoc Committee asks the Eighth Circuit to award the Ad Hoc Committee members either unspecified damages or the right to buy an unspecified amount of Company stock at a discount. The Company does not believe the appeal is meritorious and will vigorously defend it.
Upon emergence, in accordance with Accounting Standards Codification (ASC) 852, we applied fresh start reporting to our consolidated financial statements as of April 1, 2017 and became a new entity for financial reporting purposes reflecting the Successor (as defined below) capital structure. As a new entity, a new accounting basis in the identifiable assets and liabilities assumed was established with no retained earnings or accumulated other comprehensive income (loss). For additional details, refer to Note 1. “Summary of Significant Accounting Policies” and Note 2. “Emergence from the Chapter 11 Cases and Fresh Start Reporting” to the accompanying consolidated financial statements.
|
Peabody Energy Corporation
|
2017 Form 10-K
|
2
|
In connection with our emergence from the Chapter 11 Cases and the adoption of fresh start reporting, the results of operations for 2017 separately present a Successor period (for the period April 2, 2017 through December 31, 2017) and a Predecessor period (for the period January 1, 2017 through April 1, 2017). The results of operations for the years ended 2016 and 2015 are presented as Predecessor periods. References to “Successor” are in reference to reporting dates on or after April 2, 2017; references to “Predecessor” are in reference to reporting dates through April 1, 2017, which include the impact of the Plan provisions and the application of fresh start reporting. Although the 2017 Successor period and the 2017 Predecessor period are distinct reporting periods, the effects of emergence and fresh start reporting did not have a material impact on the comparability of our results of operations between the periods, unless otherwise noted herein. Accordingly, references to 2017 results of operations for year ended December 31, 2017 combine the two periods to enhance the comparability of such information to the prior year.
Segment and Geographic Information
We conduct business through six operating segments: Powder River Basin Mining, Midwestern U.S. Mining, Western U.S. Mining, Australian Metallurgical Mining, Australian Thermal Mining and Trading and Brokerage. Segment and geographic financial information is contained in Note 27. “Segment and Geographic Information” to our consolidated financial statements and is incorporated herein by reference.
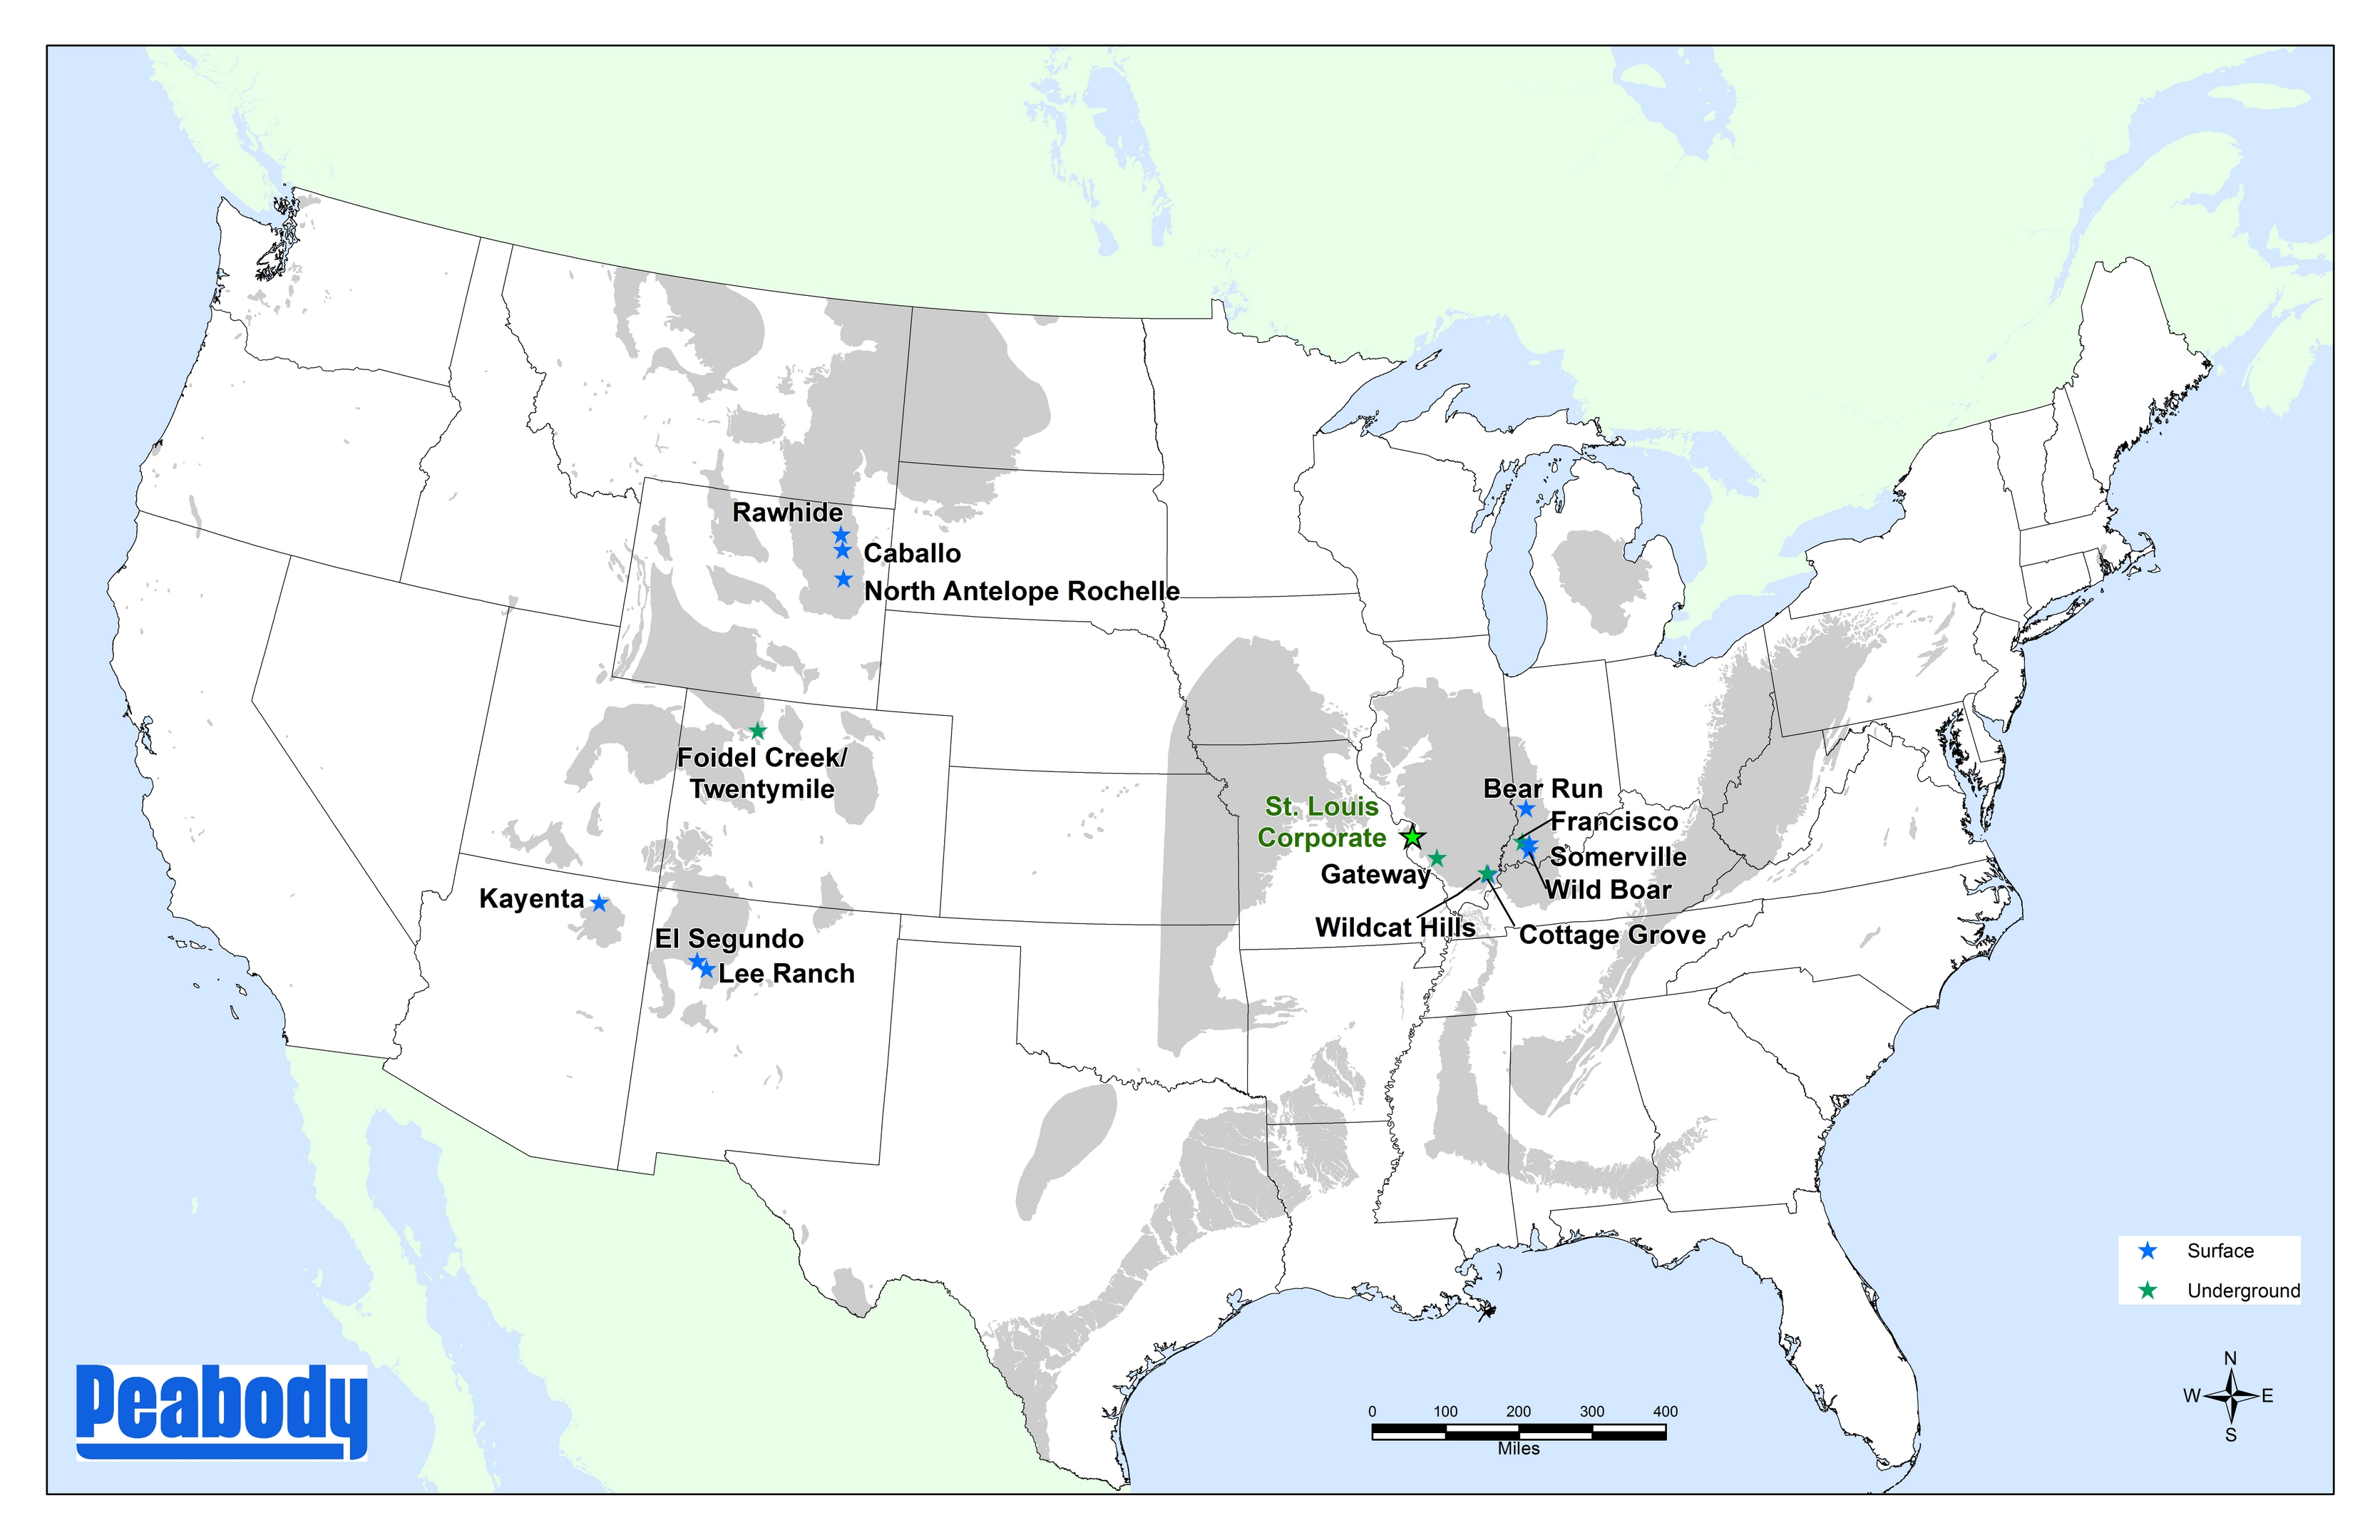
Mining Segments
The maps that follow display our active mine locations as of December 31, 2017. Also shown are the primary ports that we use in Australia for coal exports and our corporate headquarters in St. Louis, Missouri.
U.S. Mining Operations - Powder River Basin, Midwestern, Western
|
Peabody Energy Corporation
|
2017 Form 10-K
|
3
|
The principal business of our mining segments in the U.S. is the mining, preparation and sale of thermal coal, sold primarily to electric utilities in the U.S. under long-term contracts, with a portion sold as international exports as conditions warrant. Our Powder River Basin Mining operations consist of our mines in Wyoming. The mines in that segment are characterized by surface mining extraction processes, coal with a lower sulfur content and Btu and higher customer transportation costs (due to longer shipping distances). Our Midwestern U.S. Mining operations include our Illinois and Indiana mining operations, which are characterized by a mix of surface and underground mining extraction processes, coal with a higher sulfur content and Btu, and lower customer transportation costs (due to shorter shipping distances). Our Western U.S. Mining operations reflect the aggregation of our New Mexico, Arizona and Colorado mining operations. The mines in that segment are characterized by a mix of surface and underground mining extraction processes, coal with a mid-range sulfur content and Btu. Geologically, our Powder River Basin Mining operations mine sub-bituminous coal deposits, our Midwestern U.S. Mining operations mine bituminous coal deposits and our Western U.S. Mining operations mine both bituminous and sub-bituminous coal deposits.
As described more fully in Part I, Item 1 under the heading “Transportation”, coal consumed in the U.S. is usually sold at the mine with transportation costs borne by the purchaser. Our U.S. mine sites are typically adjacent to a rail loop; however in limited circumstances coal may be trucked to a barge site. Title predominately passes to the purchaser at the rail or barge, as applicable.
Our U.S. export coal is more typically sold on a delivered basis into the unloading port, and we pay ocean freight. In each case, exporters usually pay shipping costs from the mine to the port, including any demurrage costs (fees paid to third-party shipping companies for loading time that exceeded the stipulated time). The primary ports used for U.S. exports are the United Bulk Terminal near New Orleans, Louisiana, the St. James Stevedoring Anchorages terminal in Convent, Louisiana and the Kinder Morgan terminal near Houston, Texas.
|
Peabody Energy Corporation
|
2017 Form 10-K
|
4
|
Australian Mining Operations - Metallurgical, Thermal

|
Peabody Energy Corporation
|
2017 Form 10-K
|
5
|
The business of our Australian operating platform is primarily export focused with customers spread across several countries, while a portion of our metallurgical and thermal coal is sold within Australia. Generally, revenues from individual countries vary year by year based on electricity and steel demand, the strength of the global economy, governmental policies and several other factors, including those specific to each country. Our Australian Metallurgical Mining operations consist of mines in Queensland and one in New South Wales, Australia. The mines in that segment are characterized by both surface and underground extraction processes used to mine various qualities of metallurgical coal (low-sulfur, high Btu coal). The metallurgical coal qualities include hard coking coal, semi-hard coking coal, semi-soft coking coal and low-volatile pulverized coal injection (LV PCI) coal. Our Australian Thermal Mining operations consist of mines in New South Wales, Australia. The mines in that segment are characterized by both surface and underground extraction processes used to mine low-sulfur, high Btu thermal coal. We classify our Australian mines within the Australian Metallurgical Mining or Australian Thermal Mining segments based on the primary customer base and coal reserve type of each mining operation. A small portion of the coal mined by the Australian Metallurgical Mining segment is of a thermal grade. Similarly, a small portion of the coal mined by the Australian Thermal Mining segment is of a metallurgical grade. Additionally, we may market some of our metallurgical coal products as a thermal coal product from time to time depending on supply and demand conditions.
As described more fully in Part I, Item 1 under the heading “Transportation”, our Australian export coal is usually sold at the loading port, with purchasers paying ocean freight. We have generally secured our ability to transport coal in Australia through rail and port contracts and interests in five east coast coal export terminals. In Queensland, seaborne metallurgical and thermal coal from our mines is exported through the Dalrymple Bay Coal Terminal, in addition to the Abbot Point Coal Terminal used by our joint venture Middlemount Mine. In New South Wales, our primary ports for exporting metallurgical and thermal coal are at Port Kembla and Newcastle, which includes both the Port Waratah Coal Services terminal and the terminal operated by Newcastle Coal Infrastructure Group (NCIG).
|
Peabody Energy Corporation
|
2017 Form 10-K
|
6
|
The table below summarizes information regarding the operating characteristics of each of our mines that were active in
2017
in the U.S. and Australia. The mines are listed within their respective mining segment in descending order, as determined by tons sold in
2017
.
|
Segment/Mining Complex
|
Location
|
Mine
Type
|
Mining
Method
|
Coal
Type
|
Primary
Transport
Method
|
2017 Tons Sold
(In millions)
|
|||||||
|
Powder River Basin Mining
|
|||||||||||||
|
North Antelope Rochelle
|
Wyoming
|
S
|
D, DL, T/S
|
T
|
R
|
101.5
|
|
||||||
|
Caballo
|
Wyoming
|
S
|
D, T/S
|
T
|
R
|
11.1
|
|
||||||
|
Rawhide
|
Wyoming
|
S
|
D, T/S
|
T
|
R
|
10.3
|
|
||||||
|
Third party
(1)
|
—
|
—
|
—
|
—
|
—
|
2.1
|
|
||||||
|
Midwestern U.S. Mining
|
|
|
|
|
|
||||||||
|
Bear Run
|
Indiana
|
S
|
DL, D, T/S
|
T
|
Tr, R
|
7.3
|
|
||||||
|
Wild Boar
|
Indiana
|
S
|
D, T/S
|
T
|
Tr, R, R/B, T/B
|
2.7
|
|
||||||
|
Gateway North
|
Illinois
|
U
|
CM
|
T
|
Tr, R, R/B, T/B
|
2.5
|
|
||||||
|
Somerville Central
|
Indiana
|
S
|
DL, D, T/S
|
T
|
R, R/B, T/B, T/R
|
2.2
|
|
||||||
|
Francisco Underground
|
Indiana
|
U
|
CM
|
T
|
R
|
2.1
|
|
||||||
|
Wildcat Hills Underground
|
Illinois
|
U
|
CM
|
T
|
T/B
|
1.4
|
|
||||||
|
Cottage Grove
|
Illinois
|
S
|
D, T/S
|
T
|
T/B
|
0.3
|
|
||||||
|
Western U.S. Mining
|
|
|
|
|
|
||||||||
|
Kayenta
|
Arizona
|
S
|
DL, T/S
|
T
|
R
|
6.2
|
|
||||||
|
El Segundo
|
New Mexico
|
S
|
D, DL, T/S
|
T
|
R
|
5.1
|
|
||||||
|
Twentymile
|
Colorado
|
U
|
LW
|
T
|
R, Tr
|
3.4
|
|
||||||
|
Lee Ranch
|
New Mexico
|
S
|
T/S
|
T
|
R
|
—
|
|
||||||
|
Australian Metallurgical Mining
|
|
|
|
|
|
||||||||
|
Coppabella
(2)
|
Queensland
|
S
|
DL, D, T/S
|
P
|
R, EV
|
2.9
|
|
||||||
|
North Goonyella
|
Queensland
|
U
|
LW
|
M
|
R, EV
|
2.9
|
|
||||||
|
Millennium
|
Queensland
|
S
|
D, T/S
|
M, P
|
R, EV
|
2.8
|
|
||||||
|
Moorvale
(2)
|
Queensland
|
S
|
D, T/S
|
P, T
|
R, EV
|
2.0
|
|
||||||
|
Metropolitan
|
New South Wales
|
U
|
LW
|
M, P, T
|
R, EV
|
1.1
|
|
||||||
|
Middlemount
(3)
|
Queensland
|
S
|
D, T/S
|
M, P
|
R, EV
|
—
|
|
||||||
|
Australian Thermal Mining
|
|||||||||||||
|
Wilpinjong
|
New South Wales
|
S
|
D, T/S
|
T
|
R, EV
|
13.4
|
|
||||||
|
Wambo Open-Cut
(4)
|
New South Wales
|
S
|
T/S
|
T
|
R, EV
|
3.5
|
|
||||||
|
Wambo Underground
(4)
|
New South Wales
|
U
|
LW
|
M, T
|
R, EV
|
2.3
|
|
||||||
|
Legend:
|
||||
|
S
|
Surface Mine
|
Tr
|
Truck
|
|
|
U
|
Underground Mine
|
R/B
|
Rail to Barge
|
|
|
DL
|
Dragline
|
T/B
|
Truck to Barge
|
|
|
D
|
Dozer/Casting
|
T/R
|
Truck to Rail
|
|
|
T/S
|
Truck and Shovel
|
EV
|
Export Vessel
|
|
|
LW
|
Longwall
|
T
|
Thermal/Steam
|
|
|
CM
|
Continuous Miner
|
M
|
Metallurgical
|
|
|
R
|
Rail
|
P
|
Pulverized Coal Injection
|
|
|
(1)
|
Third party purchased coal used to satisfy coal supply agreements.
|
|
(2)
|
We own a 73.3% undivided interest in an unincorporated joint venture that owns the Coppabella and Moorvale mines. The tons shown reflect our share.
|
|
(3)
|
We own a 50% equity interest in Middlemount, which owns the Middlemount Mine. Because that entity is accounted for as an unconsolidated equity affiliate,
2017
tons sold from that mine, which totaled 4.2 million tons (on a 100% basis), have been excluded from the table above.
|
|
(4)
|
Represents our majority-owned mines in which there is an outside non-controlling ownership interest.
|
Refer to the “Summary of Coal Production and Sulfur Content of Assigned Reserves” table within Part I, Item 2. “Properties,” which is incorporated by reference herein, for additional information regarding coal reserves, product characteristics and production volume associated with each mine.
|
Peabody Energy Corporation
|
2017 Form 10-K
|
7
|
Trading and Brokerage Segment
Our Trading and Brokerage segment engages in the direct and brokered trading of coal and freight-related contracts through our trading and business offices. Coal brokering is conducted both as principal and agent in support of various coal production-related activities that may involve coal produced from our mines, including optimization and blending of such coal, coal sourcing arrangements with third-party mining companies or offtake agreements with other coal producers. Our Trading and Brokerage segment also provides transportation-related services, which involve both financial derivative contracts and physical contracts. Collectively, coal and freight-related hedging activities include both economic hedging and, from time to time, cash flow hedging in support of our coal trading strategy.
Corporate and Other Segment
Our Corporate and Other segment includes selling and administrative expenses, including our technical and shared services functions, corporate hedging activities, mining and export/transportation joint ventures, restructuring charges and activities associated with the optimization of our coal reserve and real estate holdings, minimum charges on certain transportation-related contracts, the closure of inactive mining sites and certain energy-related commercial matters.
Resource Management.
As of December 31,
2017
, we controlled approximately
5.2
billion tons of proven and probable coal reserves and approximately 600,000 acres of surface property through ownership and lease agreements. We have an ongoing asset optimization program whereby our property management group regularly reviews these reserves and surface properties for opportunities to generate earnings and cash flow through the sale or exchange of non-strategic coal reserves and surface lands. These surface lands include acres where we have completed post-mining reclamation. In addition, we generate revenue through royalties from coal reserves and oil and gas rights leased to third parties and farm income from surface lands under third-party contracts.
Middlemount Mine.
We own a 50% equity interest in Middlemount, which owns the Middlemount Mine in Queensland, Australia. The mine predominantly produces semi-hard coking coal and LV PCI coal for sale into seaborne coal markets through rail and port capacity contracted through Abbot Point Coal Terminal, with future capacity also secured at Dalrymple Bay Coal Terminal. Mining operations first commenced at the Middlemount Mine in late 2011. During the years ended December 31, 2017, 2016 and 2015, the mine sold 4.2 million, 4.5 million and 4.2 million tons of coal, respectively (on a 100% basis).
Coal Supply Agreements
Customers.
Our coal supply agreements are primarily with electricity generators, industrial facilities and steel manufacturers. Most of our sales (excluding trading and brokerage transactions) are made under long-term coal supply agreements (those with initial terms of one year or longer and which often include price reopener and/or extension provisions). A smaller portion of our sales are made under contracts with terms of less than one year, including sales made on a spot basis. Sales under long-term coal supply agreements comprised approximately
83%
,
86%
and
88%
of our worldwide sales from our mining operations (by volume) for the years ended December 31,
2017
,
2016
and
2015
, respectively. A recent trend has been for our customers under long-term coal supply agreements to seek contracts of shorter duration.
For the year ended December 31,
2017
, we derived
27%
of our total revenues from our five largest customers. Those five customers were supplied primarily from
21
coal supply agreements (excluding trading and brokerage transactions) expiring at various times from 2018 to 2025. The contract contributing the greatest amount of annual revenue in
2017
was approximately $
277 million
, or approximately
5%
of our
2017
total revenues, and is due to expire in 2019.
Backlog.
Our sales backlog (excluding trading and brokerage transactions), which includes coal supply agreements subject to price reopener and/or extension provisions, was approximately
507 million
and
587 million
tons of coal as of January 1,
2018
and
2017
, respectively. Contracts in backlog have remaining terms ranging from one to
12
years and represent approximately
three
years of production based on our
2017
production volume of
188.3 million
tons. Approximately
69%
of our backlog is expected to be filled beyond
2018
.
|
Peabody Energy Corporation
|
2017 Form 10-K
|
8
|
U.S. Mining Operations.
Revenues from our Powder River Basin Mining, Western U.S. Mining and Midwestern U.S. Mining segments, in aggregate, represented approximately 53%, 59% and 63% of our total revenue base for the years ended December 31,
2017
,
2016
and
2015
, respectively, during which periods the coal mining activities of those segments contributed respective aggregate amounts of approximately
84%
,
81%
and
83%
of our sales volumes from mining operations. We expect to continue selling a significant portion of our Powder River Basin Mining, Western U.S. Mining and Midwestern U.S. Mining segment coal production under long-term supply agreements, and customers of those segments continue to pursue long-term sales agreements in recognition of the importance of reliability, service and predictable coal prices to their operations. The terms of coal supply agreements result from competitive bidding and extensive negotiations with customers. Consequently, the terms of those agreements vary significantly in many respects, including price adjustment features, price reopener terms, coal quality requirements, quantity parameters, permitted sources of supply, treatment of environmental constraints, extension options, force majeure and termination and assignment provisions. Our approach is to selectively renew, or enter into new, long-term supply agreements when we can do so at prices and terms and conditions we believe are favorable.
Australian Mining Operations.
Revenues from our Australian Metallurgical Mining and Australian Thermal Mining segments represented approximately 46%, 41% and 36% of our total revenue base for the years ended December 31,
2017
,
2016
and
2015
, respectively, during which periods the coal mining activities of those segments contributed respective amounts of
16%
,
19%
and
17%
of our sales volumes from mining operations. Our production is primarily sold into the seaborne metallurgical and thermal markets, with a majority of those sales executed through annual and multi-year international coal supply agreements that contain provisions requiring both parties to renegotiate pricing periodically. Industry commercial practice, and our typical practice, is to negotiate pricing for seaborne metallurgical coal contracts on a quarterly, spot or index basis and seaborne thermal coal contracts on an annual, spot or index basis. The portion of volume priced on a shorter-term basis and index linked basis has increased in recent years and represented 30% in 2017.
Transportation
Methods of Distribution.
Coal consumed in the U.S. is usually sold at the mine with transportation costs borne by the purchaser. Our Australian export coal is usually sold at the loading port, with purchasers paying ocean freight. Our U.S. export coal is more typically sold on a delivered basis into the unloading port, and we pay ocean freight. In each case, exporters usually pay shipping costs from the mine to the port, including any demurrage costs (fees paid to third-party shipping companies for loading time that exceeded the stipulated time).
We believe we have good relationships with U.S. and Australian rail carriers and port and barge companies due, in part, to our modern coal-loading facilities and the experience of our transportation coordinators. Refer to the table in the foregoing “Mining Segments” section for a summary of transportation methods by mine.
Export Facilities.
Our U.S. Mining operations exported approximately 1%, 0% and 0% of its annual tons sold for the years ended December 31,
2017
,
2016
and
2015
, respectively. The primary ports used for U.S. exports are the United Bulk Terminal near New Orleans, Louisiana, the St. James Stevedoring Anchorages terminal in Convent, Louisiana and the Kinder Morgan terminal near Houston, Texas. We periodically assess opportunities for access to West Coast port facilities that will allow us to export our Powder River Basin coal products to serve demand in the Asian region, should market conditions warrant.
Our Australian Mining operations sold approximately 73%, 75% and 77% of its tons into the seaborne coal markets for the years ended December 31,
2017
,
2016
and
2015
, respectively. We have generally secured our ability to transport coal in Australia through rail and port contracts and interests in five east coast coa
l export terminals that are primarily funded through take-or-pay arrangements (refer to the “Liquidity and Capital Resources” section in Part II, Item 7. “Management’s Discussion and Analysis of Financial Condition and Results of Operations” for additional information on our take-or-pay obligations).
In Queensland, seaborne metallurgical and thermal coal from our mines is exported through the Dalrymple Bay Coal Terminal, in addition to the Abbot Point Coal Terminal used by our joint venture Middlemount Mine. In New South Wales, our primary ports for exporting metallurgical and thermal coal are at Port Kembla and Newcastle, which includes both the Port Waratah Coal Services terminal and the terminal operated by NCIG.
Suppliers
Mining Supplies and Equipment.
The principal goods we purchase in support of our mining activities are mining equipment and replacement parts, diesel fuel, ammonium-nitrate and emulsion-based explosives, off-the-road (OTR) tires, steel-related products (including roof control materials), lubricants and electricity. We have many well-established, strategic relationships with our key suppliers of goods and do not believe that we are overly dependent on any of our individual suppliers.
|
Peabody Energy Corporation
|
2017 Form 10-K
|
9
|
There has been consolidation in the supplier base providing certain mining materials and equipment to the coal industry. This has limited the number of global sources for these items, such as surface and underground mining equipment. In situations where we have elected to concentrate a large portion of our purchases with one supplier in lieu of seeking other alternatives, it has been to take advantage of cost savings from larger volumes of purchases, benefit from long-term pricing for parts, ensure security of supply and/or allow for equipment fleet standardization. Supplier concentration related to our mining equipment also allows us to benefit from fleet standardization, which in turn improves asset utilization by facilitating the development of common maintenance practices across our global platform and enhancing our flexibility to move equipment between mines as necessary.
Surface and underground mining equipment demand and lead times have begun to extend in recent periods due to recovering market conditions experienced across several extractive industry sectors. We do not expect this to impact our own near-term demand for such equipment as we extend the lives of existing equipment through improved maintenance practices and equipment rebuilds in order to defer the requirement for larger capital purchases. We continue to use our global leverage with major suppliers to ensure security of supply to meet the requirements of our active mines.
Services.
We also purchase services at our mine sites, including services related to maintenance for mining equipment, construction, temporary labor, use of explosives and various other requirements. We do not believe that we have undue operational or financial risk associated with our dependence on any individual service providers.
Competition
Demand for coal and the prices that we will be able to obtain for our coal are highly competitive and influenced by factors beyond our control, including but not limited to global economic conditions, the demand for electricity and steel, the cost of alternative fuels, the cost of electricity generation from alternative fuels, including wind, solar, oil, hydro, nuclear, natural gas and biomass, the impact of weather on heating and cooling demand and taxes and environmental regulations imposed by the U.S. and foreign governments.
Thermal Coal
Demand for our thermal coal products is impacted by economic conditions, demand for electricity, including the impact of energy efficient products, and the cost of electricity generation from coal and alternative fuels. Our products compete with producers of other forms of electric generation, including natural gas, oil, nuclear, hydro, wind, solar and biomass, that provide an alternative to coal use. The use and price of thermal coal is heavily influenced by the availability and relative cost of alternative fuels and the generation of electricity utilizing alternative fuels, with customers focused on securing the lowest cost fuel supply in order to coordinate the most efficient utilization of generating resources in the economic dispatch of the power grid at the most competitive price.
In the U.S., natural gas is highly competitive (along with other alternative fuel sources) with thermal coal for electricity generation. The competitiveness of natural gas has been strengthened by accelerated growth in domestic natural gas production and transmission facilities over the last five years and comparatively low natural gas prices (versus historic levels). Gas prices averaged $3.02 per mmBtu in 2017, versus $2.55, $2.63 and $4.26 per mmBtu in 2016, 2015 and 2014, respectively. Natural gas price trends can significantly impact U.S. coal burn and production. We believe the U.S. Powder River and Illinois basins in which we produce are competitive against natural gas when natural gas prices average in excess of $2.50 to $2.75 per mmBtu and $3.00 to $3.50 per mmBtu, respectively. In addition, the competitiveness of other alternative fuel sources for electricity generation with coal has been strengthened by the growth of low-cost and government subsidized generation fueled by other alternative fuel sources.
Internationally, thermal coal also competes with alternative forms of electric generation. The competitiveness and availability of natural gas, oil, nuclear, hydro, wind, solar and biomass varies by country and region. In addition, seaborne thermal coal import demand can be significantly impacted by the availability of indigenous coal production, particularly in the two leading coal import countries, China and India, among others, and the competitiveness of seaborne supply from leading thermal coal exporting countries, including Indonesia, Australia, Russia, Colombia and South Africa, among others.
In addition to our alternative fuel source competitors, our principal U.S. direct coal supply competitors (listed alphabetically) are other large coal producers, including Alliance Resource Partners, Arch Coal, Inc., Cloud Peak Energy Inc., Contura Energy Inc., Murray Energy Corporation and Westmoreland Coal Company, which collectively accounted for approximately 43% of total U.S. coal production in 2016 according to the U.S. Energy Information Administration’s “Annual Coal Report 2016,” the most recent data publicly available as of November 15, 2017. Major international direct coal supply competitors (listed alphabetically) include Anglo-American PLC, BHP Billiton, China Coal, Coal India Limited, Glencore PLC, PT Bumi Resources Tbk., Rio Tinto, Shenhua Group and Yancoal Australia Ltd, among others.
|
Peabody Energy Corporation
|
2017 Form 10-K
|
10
|
Metallurgical Coal
Demand for our metallurgical coal products is impacted by economic conditions, demand for steel and competing technologies used to make steel, some of which do not use coal as a manufacturing input. We compete on the basis of coal quality and characteristics, delivered energy cost (including transportation costs), customer service and support and reliability of supply.
Seaborne metallurgical coal import demand can be significantly impacted by the availability of indigenous coal production, particularly in leading metallurgical coal import countries of China, India, Japan, South Korea and Brazil, among others, and the competitiveness of seaborne metallurgical coal supply, including from leading metallurgical coal exporting countries of Australia, U.S., Russia, Canada and Mongolia, among others.
Major international direct competitors (listed alphabetically) include Anglo-American PLC, BHP Billiton, China Coal, Glencore PLC, PT Bumi Resources Tbk., Rio Tinto and Shenhua Group, among others.
Working Capital
We generally fund our working capital requirements through a combination of existing cash and cash equivalents, proceeds from the sale of our coal production to customers and our trading and brokerage activities. Our current accounts receivable securitization program and revolving credit facility are also available to fund our working capital requirements to the extent we have remaining availability. Refer to the “Liquidity and Capital Resources” section of Part II, Item 7. “Management’s Discussion and Analysis of Financial Condition and Results of Operations” for additional information regarding working capital.
Employees
We had approximately
7,100
employees as of
December 31, 2017
, including approximately
5,500
hourly employees. Additional information on our employees and related labor relations matters is contained in Note 23. “Management - Labor Relations” to our consolidated financial statements, which information is incorporated herein by reference.
Executive Officers of the Company
Set forth below are the names, ages and positions of our executive officers. Executive officers are appointed by, and hold office at the discretion of, our Board of Directors, subject to the terms of any employment agreements.
|
Name
|
Age
(1)
|
Position
(1)
|
||
|
Glenn L. Kellow
|
50
|
President and Chief Executive Officer
|
||
|
Amy B. Schwetz
|
43
|
Executive Vice President and Chief Financial Officer
|
||
|
A. Verona Dorch
|
50
|
Executive Vice President, Chief Legal Officer, Government Affairs and Corporate Secretary
|
||
|
Charles F. Meintjes
|
55
|
Executive Vice President - Corporate Services and Chief Commercial Officer
|
||
|
Paul V. Richard
|
58
|
Senior Vice President and Chief Human Resources Officer
|
||
|
George J. Schuller Jr.
|
54
|
President - Australia
|
||
|
Kemal Williamson
|
58
|
President - Americas
|
||
(1)
As of
February 19, 2018
.
Glenn L. Kellow
was named our President and Chief Operating Officer in August 2013; our President, Chief Executive Officer-elect and a director in January 2015; and our President and Chief Executive Officer in May 2015. Mr. Kellow has extensive experience in the global resource industry, where he has served in multiple executive, operational and financial roles in coal and other commodities in the United States, Australia and South America. From 1985 to 2013, Mr. Kellow served in a number of roles with BHP Ltd., including senior appointments as President, Aluminum and Nickel (2012-2013), President, Stainless Steel Materials (2010-2012), President and Chief Operating Officer, New Mexico Coal (2007-2010), and Chief Financial Officer, Base Metals (2003-2007). He is a Vice Chairman of the World Coal Association, a director and executive committee member of the U.S. National Mining Association and the Vice Chairman of the International Energy Agency Coal Industry Advisory Board. Mr. Kellow is a graduate of the Advanced Management Program at the University of Pennsylvania’s Wharton School of Business, holds a Master’s of Business Administration and a Bachelor’s Degree in Commerce from the University of Newcastle, and is a Fellow of CPA Australia. He holds an honorary Doctor of Science degree from the South Dakota School of Mines and Technology.
|
Peabody Energy Corporation
|
2017 Form 10-K
|
11
|
Amy B. Schwetz
was named our Executive Vice President and Chief Financial Officer in July 2015. Ms. Schwetz serves as our principal accounting officer. Ms. Schwetz has executive responsibility for the Company’s financial and accounting functions, including treasury, insurance, risk management, accounting, financial reporting, tax, forecasting, capital management and budgeting, as well as investor relations and communications. She has previously served as our Senior Vice President of Finance and Administration - Australia, from June 2013 to June 2015; Senior Vice President of Finance and Administration - Americas, from March 2012 to June 2013; Vice President of Investor Relations, from December 2011 to March 2012; Vice President of Capital and Financial Planning, from November 2009 to December 2011; Director of Financial Planning, from August 2007 to October 2009; and Director of Compliance and Accounting Policies, from August 2005 to August 2007. Prior to joining us, Ms. Schwetz was employed by Ernst & Young LLP, an international accounting firm, where she held multiple audit roles over eight years. She holds a bachelor’s degree in Accounting from Indiana University. Ms. Schwetz is a member of the Dean’s Council at Indiana University’s Kelley School of Business and serves on the board of Downtown STL, Inc.
A. Verona Dorch
was named our Executive Vice President, Chief Legal Officer, Governmental Affairs and Corporate Secretary in August 2015. In this role, she has executive responsibility for providing comprehensive legal counsel for Peabody's business activities and leads the Company's global legal, compliance and government affairs functions. Ms. Dorch has more than 20 years of legal experience counseling diverse global businesses. Prior to joining Peabody, from 2006 to March 2015, she served in a variety of roles for Harsco Corporation, a leading global industrial services company, where she advised the leadership team and board on strategic legal and business initiatives, most recently serving as Chief Legal Officer, Chief Compliance Officer and Corporate Secretary. She also has experience in corporate and securities law from top-tier law firms and with Sumitomo Chemical Co. following a multi-year secondment in Tokyo, Japan. Ms. Dorch is a Fellow of the American Bar Foundation and is a member of the Boards of Directors of Girls Inc. (St. Louis) and the United Way (St. Louis). Ms. Dorch holds a bachelor’s degree from Dartmouth College and a Juris Doctor degree from Harvard Law School.
Charles F. Meintjes
was named our Executive Vice President - Corporate Services and Chief Commercial Officer in April 2017. Mr. Meintjes has executive responsibility for sales and marketing, corporate development, information technology, business services, technical services, and coal generation and emissions technology. Mr. Meintjes has extensive senior operational, strategy, continuous improvement and information technology experience with mining companies on three continents. He has also led financial and technical functions, large re-engineering programs, information technology system implementations and large industrial construction projects. He joined us in 2007, and prior to serving in his current post, he was our President - Australia. Other past positions with us include Acting President - Americas, Group Executive of Midwest and Colorado Operations, Senior Vice President of Operations Improvement and Senior Vice President Engineering and Continuous Improvement. Prior to joining us, Mr. Meintjes served as a consultant to Exxaro Resources Limited in South Africa, and is a former Executive Director and Board Member for Kumba Resources Limited in South Africa. He has senior management experience in the steel and the aluminum industry with Iscor and Alusaf in South Africa. Mr. Meintjes holds dual Bachelor of Commerce degrees in accounting from Rand Afrikaans University and the University of South Africa. He is a Chartered Accountant in South Africa and completed the advanced management program at the University of Pennsylvania’s Wharton School of Business.
Paul V. Richard
was named our Senior Vice President and Chief Human Resources Officer in November 2017. He has executive responsibility for organizational and employee development, benefits, compensation, international human resources, security, travel and facilities management. Mr. Richard has more than 30 years of human resources experience and has been instrumental in leading his prior organizations to achieve Great Place to Work and Top Training Organization designations. From 2002 to 2017, Mr. Richard served as Vice President - Human Resources for Shaw Industries Group, Inc., a leading flooring materials producer and a subsidiary of Berkshire Hathaway, Inc. Prior to that, he served as a human resources leader for 19 years at Ferro Corporation, a global supplier of technology-based manufacturing, including 4 years as Vice President - Human Resources. Mr. Richard holds a Bachelor of Science degree in Management and a Masters of Business Administration from Louisiana Tech University.
George J. Schuller, Jr.
was named our President - Australia in April 2017. He has executive responsibility for our Australia operating platform, which includes overseeing the areas of health and safety, operations, sales and marketing, product delivery and support functions. Mr. Schuller has been with the Company for three decades serving in both domestic and international operational posts. His extensive experience includes operations management for both surface and underground mining, continuous improvement and engineering services. Prior to serving as Chief Operations Officer in Australia, he served as Group Executive PRB & SW, Senior Vice President Engineering Services, Vice President Engineering Technical Services and Vice President Continuous Improvement following his holding various operations and mine management positions with increasing responsibility. Mr. Schuller originally joined the Company as a Mine Engineer-in-Training following a student co-op program. He holds a Bachelor of Science in mining engineering from West Virginia University as well as a Master of Business Administration degree from the University of Charleston.
|
Peabody Energy Corporation
|
2017 Form 10-K
|
12
|
Kemal Williamson
was named our President - Americas in October 2012. He has executive responsibility for our U.S. operating platform, which includes overseeing the areas of health and safety, operations, product delivery and support functions. Mr. Williamson has more than 30 years of experience in mining engineering and operations roles across North America and Australia. He most recently served as Group Executive Operations for the Peabody Energy Australia operations. He also has held executive leadership roles across project development, as well as in positions overseeing our Western U.S., Powder River Basin and Midwest operations. Mr. Williamson joined us in 2000 as Director of Land Management. Prior to that, he served for two years at Cyprus Australia Coal Corporation as Director of Operations and managed coal operations in Australia for half a decade. He also has mining engineering, financial analysis and management experience across Colorado, Kentucky and Illinois. Mr. Williamson holds a Bachelor of Science degree in mining engineering from Pennsylvania State University as well as a Master of Business Administration degree from the Kellogg School of Management, Northwestern University in Evanston, Illinois.
Regulatory Matters — U.S.
Federal, state and local authorities regulate the U.S. coal mining industry with respect to matters such as employee health and safety, permitting and licensing requirements, air quality standards, water pollution, plant and wildlife protection, the reclamation and restoration of mining properties after mining has been completed, the discharge of materials into the environment, surface subsidence from underground mining and the effects of mining on groundwater quality and availability. In addition, the industry is affected by significant requirements mandating certain benefits for current and retired coal miners. Numerous federal, state and local governmental permits and approvals are required for mining operations. We believe that we have obtained all permits currently required to conduct our present mining operations.
We endeavor to conduct our mining operations in compliance with all applicable federal, state and local laws and regulations. However, because of extensive and comprehensive regulatory requirements, violations during mining operations occur from time to time in the industry.
Mine Safety and Health
We are subject to health and safety standards both at the federal and state level. The regulations are comprehensive and affect numerous aspects of mining operations, including training of mine personnel, mining procedures, blasting, the equipment used in mining operations and other matters.
The Mine Safety and Health Administration (MSHA) is the entity responsible for monitoring compliance with the federal mine health and safety standards. MSHA employs various enforcement measures for noncompliance, including the issuance of monetary penalties and orders of withdrawal from a mine or part of a mine.
In Part I, Item 4. “Mine Safety Disclosures” and in Exhibit 95 to this Annual Report on Form 10-K, we provide additional details on MSHA compliance, through the mine safety disclosures required by SEC regulations.
Black Lung (Coal Worker’s Pneumoconiosis)
Under the U.S. Black Lung Benefits Revenue Act of 1977 and the Black Lung Benefits Reform Act of 1977, as amended in 1981, each U.S. coal mine operator must pay federal black lung benefits and medical expenses to claimants who are current and former employees who last worked for the operator after July 1, 1973, and whose claims for benefits are allowed. Coal mine operators must also make payments to a trust fund for the payment of benefits and medical expenses to claimants who last worked in the coal industry prior to July 1, 1973. Historically, very few of the miners who sought federal black lung benefits were awarded these benefits; however, the approval rate has increased following implementation of black lung provisions contained in the Affordable Care Act. The trust fund is funded by an excise tax on U.S. production of up to $1.10 per ton for deep-mined coal and up to $0.55 per ton for surface-mined coal, neither amount to exceed 4.4% of the gross sales price.
Environmental Laws and Regulations
We are subject to various federal, state, local and tribal environmental laws and regulations. These laws and regulations place substantial requirements on our coal mining operations, and require regular inspection and monitoring of our mines and other facilities to ensure compliance. We are also affected by various other federal, state, local and tribal environmental laws and regulations that impact our customers.
|
Peabody Energy Corporation
|
2017 Form 10-K
|
13
|
Surface Mining Control and Reclamation Act
. In the U.S., the Surface Mining Control and Reclamation Act of 1977 (SMCRA), which is administered by the Office of Surface Mining Reclamation and Enforcement (OSMRE), established mining, environmental protection and reclamation standards for all aspects of U.S. surface mining and many aspects of underground mining. Mine operators must obtain SMCRA permits and permit renewals for mining operations from the OSMRE. Where state regulatory agencies have adopted federal mining programs under SMCRA, the state becomes the primary regulatory authority, with oversight from OSMRE. Except for Arizona, states in which we have active mining operations have achieved primary control of enforcement through federal authorization. In Arizona, we mine on tribal lands and are regulated by the OSMRE because the tribes do not have SMCRA authorization.
SMCRA provides for three categories of bonds: surety bonds, collateral bonds and self-bonds. A surety bond is an indemnity agreement in a sum certain payable to the regulatory authority, executed by the permittee as principal and which is supported by the performance guarantee of a surety corporation. A collateral bond can take several forms, including cash, letters of credit, first lien security interest in property or other qualifying investment securities. A self-bond is an indemnity agreement in a sum certain executed by the permittee or by the permittee and any corporate guarantor made payable to the regulatory authority.
Our total reclamation bonding requirements in the U.S. were $1,249.2 million as of December 31, 2017. The bond requirements for a mine represent the calculated cost to reclaim the current operations of a mine if it ceased to operate in the current period. The cost calculation for each bond must be completed according to the regulatory authority of each state. Our asset retirement obligations calculated in accordance with generally accepted accounting principles for our U.S. operations were $457.9 million as of December 31, 2017. The bond requirement amount for our U.S. operations significantly exceeds the financial liability for final mine reclamation because the asset retirement obligation liability is discounted from the end of the mine’s economic life to the balance sheet date in recognition that the final reclamation cash outlay is a number of years (and in some cases decades) away. The bond amount, in contrast with the asset retirement obligation, presumes reclamation begins immediately.
After a permit application is prepared and submitted to the regulatory agency, it goes through a completeness and technical review. Public notice of the proposed permit is given for a comment period before a permit can be issued. Regulatory authorities have considerable discretion in the timing of the permit issuance and the public has the right to comment on and otherwise engage in the permitting process, including public hearings and through intervention in the courts. Before a SMCRA permit is issued, a mine operator must submit a bond or other form of financial security to guarantee the performance of reclamation bonding requirements.
In situations where our coal resources are federally owned, the U.S. Bureau of Land Management oversees a substantive exploration and leasing process. If surface land is managed by the U.S. Forest Service, that agency serves as the cooperating agency during the federal coal leasing process. Federal coal leases also require an approved federal mining permit under the signature of the Assistant Secretary of the Department of the Interior.
The SMCRA Abandoned Mine Land Fund requires a fee on all coal produced in the U.S. The proceeds are used to rehabilitate lands mined and left unreclaimed prior to August 3, 1977 and to pay health care benefit costs of orphan beneficiaries of the Combined Fund created by the Coal Industry Retiree Health Benefit Act of 1992. The fee amount can change periodically based on changes in federal legislation. Pursuant to the Tax Relief and Health Care Act of 2006, from October 1, 2007 to September 30, 2012, the fee was $0.315 and $0.135 per ton of surface-mined and underground-mined coal, respectively. From October 1, 2012 through September 30, 2021, the fee is $0.28 and $0.12 per ton of surface-mined and underground-mined coal, respectively. We recognized expense related to the fees of $31.6 million for the Successor period April 2 through December 31, 2017 and $10.3 million, $38.7 million and $47.0 million for the Predecessor period January 1 through April 1, 2017 and the years ended December 31, 2016 and 2015, respectively.
Clean Air Act (CAA)
. The CAA, enacted in 1970, and comparable state and tribal laws that regulate air emissions affect our U.S. coal mining operations both directly and indirectly.
Direct impacts on coal mining and processing operations may occur through the CAA permitting requirements and/or emission control requirements relating to particulate matter (PM), nitrogen dioxide, ozone and sulfur dioxide (SO
2
). In recent years the United States Environmental Protection Agency (EPA) has adopted more stringent national ambient air quality standards (NAAQS) for PM, nitrogen oxide, ozone and SO
2
. It is possible that these modifications as well as future modifications to NAAQS could directly or indirectly impact our mining operations in a manner that includes, but is not limited to, designating new nonattainment areas or expanding existing nonattainment areas, serving as a basis for changes in vehicle emission standards or prompting additional local control measures pursuant to state implementation plans required to address revised NAAQS.
|
Peabody Energy Corporation
|
2017 Form 10-K
|
14
|
In 2009, the EPA adopted revised rules to add more stringent PM emissions limits for coal preparation and processing plants constructed or modified after April 28, 2008. The PM NAAQS was thereafter revised and made more stringent in 2012. In 2015, the EPA issued a final rule setting the ozone NAAQS at 70 parts per billion (ppb). (80 Fed. Reg. 65,292, (Oct. 25, 2015)). This final rule has been challenged in the United States Court of Appeals for the D.C. Circuit (D.C. Circuit), however, the case has been held in abeyance pending the EPA’s review of the final rule. More stringent ozone standards would require new state implementation plans to be developed and filed with the EPA and may trigger additional control technology for mining equipment, or result in additional challenges to permitting and expansion efforts. This could also be the case with respect to the implementation for other NAAQS for nitrogen oxide and SO
2
.
The CAA also indirectly, but significantly affects the U.S. coal industry by extensively regulating the air emissions of SO
2
, nitrogen oxides, mercury, PM and other substances emitted by coal-fueled electricity generating plants, imposing more capital and operating costs on such facilities. In addition, other CAA programs may require further emission reductions to address the interstate transport of air pollution or regional haze. The air emissions programs that may affect our operations, directly or indirectly, include, but are not limited to, the Acid Rain Program, interstate transport rules such as the Cross-State Air Pollution Rule (CSAPR) and the CSAPR Update Rule, New Source Performance Standards (NSPS), Maximum Achievable Control Technology (MACT) emissions limits for Hazardous Air Pollutants, the Regional Haze program and source permitting programs, including requirements related to New Source Review.
In addition, since 2011, the EPA has required underground coal mines to report on their greenhouse gas emissions. Regulations regarding reporting requirements for underground coal mines were updated in 2016 and now include the ability to cease reporting if mines are abandoned and sealed. At present, however, the EPA does not directly regulate such emissions.
Final NSPS for Fossil Fuel-Fired Electricity Utility Generating Units (EGUs)
. The EPA promulgated a final rule to limit carbon dioxide (CO
2
) from new, modified and reconstructed fossil fuel-fired EGUs under section 111(b) of the CAA on August 3, 2015, and published it in the Federal Register on October 23, 2015.
This rule requires that newly-constructed fossil fuel-fired steam generating units achieve an emission standard for carbon dioxide of 1,400 lb carbon dioxide per megawatt-hour gross output (CO
2
/MWh-gross). The standard is based on the performance of a supercritical pulverized coal boiler implementing partial carbon capture, utilization and storage (CCUS). Modified and reconstructed fossil fuel-fired steam generating units must implement the most efficient generation achievable through a combination of best operating practices and equipment upgrades, to meet an emission standard consistent with best historical performance. Reconstructed units must implement the most efficient generating technology based on the size of the unit (supercritical steam conditions for larger units, to meet a standard of 1,800 lb CO
2
/MWh-gross, and subcritical conditions for smaller units to meet a standard of 2,000 lb CO
2
/MWh-gross.).
Numerous legal challenges to the final rule were filed in the D.C. Circuit. Sixteen separate petitions for review were filed, and the challengers include 25 states, utilities, mining companies (including Peabody Energy), labor unions, trade organizations and other groups. The cases were consolidated under the case filed by North Dakota (D.C. Cir. No. 15-1381). Four additional cases were filed seeking review of the EPA’s denial of reconsideration petitions in a final action published in the May 6, 2016 Federal Register entitled “Reconsideration of Standards of Performance for Greenhouse Gas Emissions From New, Modified, and Reconstructed Stationary Sources: Electric Generating Units; Notice of final action denying petitions for reconsideration.” Pursuant to an order of the court, these cases remain in abeyance, subject to requirements for the EPA to file 90-day status reports. Thus, the NSPS remains in effect.
Final Rule Regulating Carbon Dioxide Emissions From Existing Fossil Fuel-Fired EGUs
. On October 23, 2015, the EPA published a final rule in the Federal Register regulating CO
2
emissions from existing fossil fuel-fired EGUs under section 111(d) of the CAA (80 Fed. Reg. 64,662 (Oct. 23, 2015)). The rule (known as the Clean Power Plan (CPP)) establishes emission guidelines for states to follow in developing plans to reduce greenhouse gas emissions from existing fossil fuel-fired EGUs. These final guidelines require that the states individually or collectively create systems that would reduce carbon emissions from any EGU located within their borders by 28% in 2025 and 32% in 2030 (compared with a 2005 baseline).
Following Federal Register publication, 39 separate petitions for review of the CPP by approximately 157 entities were filed in the D.C. Circuit. The petitions reflect challenges by 27 states and governmental entities, as well as challenges by utilities, industry groups, trade associations, coal companies, and other entities. The lawsuits were consolidated with the case filed by West Virginia and Texas (in which other states have also joined). (D.C. Cir. No. 15-1363). On October 29, 2015, we filed a motion to intervene in the case filed by West Virginia and Texas, in support of the petitioning states. The motion was granted on January 11, 2016. Numerous states and cities have also been allowed to intervene in support of the EPA.
On February 9, 2016, the Supreme Court granted a motion to stay implementation of the CPP until its legal challenges are resolved. Thereafter, oral arguments in the case were heard in the D.C. Circuit sitting en banc by ten active D.C. Circuit judges, but to date, the D.C. Circuit has not issued an opinion. On April 28, 2017, the D.C. Circuit granted a motion by the EPA to hold the case in abeyance while the Agency reconsidered the rule.
|
Peabody Energy Corporation
|
2017 Form 10-K
|
15
|
In October 2017, the EPA proposed to change its legal interpretation of CAA section 111(d), the authority that the Agency relied on for the 2015 CPP. (82 Fed. Reg. 48,035 (Oct. 16, 2017)). The EPA will accept public comments through April 26, 2018. If this proposed reinterpretation is finalized by the EPA, the CPP would be repealed. The EPA has also published an Advance Notice of Proposed Rulemaking to solicit information concerning a potential new rule for emission guidelines for existing EGUs pursuant to CAA section 111(d). 82 Fed. Reg. 61,508 (Dec. 28, 2017).
EPA’s Greenhouse Gas (GHG) Permitting Regulations for Major Emission Sources
. In May 2010, the EPA published final rules requiring permitting and control technology requirements for GHGs under the Prevention of Significant Deterioration (PSD) and Title V permitting programs that apply to stationary sources of air pollution. The EPA determined that these requirements were “triggered” by the EPA’s prior regulation of GHGs from motor vehicles.These rules were subsequently upheld by the D.C. Circuit on June 26, 2012. On June 23, 2014, however, the U.S. Supreme Court ruled that the EPA could not require PSD and Title V permitting for GHGs emitted from stationary sources if those sources were not otherwise considered to be “major sources” of conventional pollutants for purposes of PSD and Title V. Affected sources are required to employ the best available control technology for GHGs as determined by the governmental entity that issues the permit (most often a state environmental agency).
Cross State Air Pollution Rule (CSAPR) and CSAPR Update Rule
. On July 6, 2011, the EPA finalized the CSAPR, which requires the District of Columbia and 27 states from Texas eastward (not including the New England states or Delaware) to reduce power plant emissions that cross state lines and significantly contribute to ozone and/or fine particle pollution in other states. Following litigation in the D.C. Circuit and U.S. Supreme Court, the first phase of the nitrogen oxide and SO
2
emissions reductions required by CSAPR commenced in January 2015; further reductions of both pollutants in the second phase of CSAPR became effective in January 2017. The EPA subsequently revised CSAPR requirements for the state of Texas to remove that state from second phase requirements regarding SO
2
(82 Fed. Reg. 45,481 (Sept. 29, 2017)).
On October 26, 2016, the EPA promulgated the CSAPR Update Rule to address implementation of the 2008 ozone national air quality standards. This rule imposed further reductions in nitrogen oxides in 2017 in 22 states subject to CSAPR. Several states and utilities as well as agricultural and industry groups utilities have filed petitions for review of the CSAPR Update Rule in the D.C. Circuit. Other states and interest groups have filed to intervene on behalf of the EPA. These petitions have been consolidated under D.C. Cir. No. 16-1406.
Mercury and Air Toxic Standards (MATS)
. The EPA published the final MATS rule in the Federal Register on February 16, 2012. The MATS rule revised the NSPS for nitrogen oxides, SO
2
and PM for new and modified coal-fueled electricity generating plants, and imposed MACT emission limits on hazardous air pollutants (HAPs) from new and existing coal-fueled and oil-fueled electric generating plants. MACT standards limit emissions of mercury, acid gas HAPs, non-mercury HAP metals and organic HAPs. The rule provided three years for compliance with MACT standards and a possible fourth year if a state permitting agency determined that such was necessary for the installation of controls.
Following issuance of the final rule, numerous petitions for review were filed. The D.C. Circuit upheld the NSPS portion of the rulemaking in a unanimous decision on March 11, 2014, and upheld the limits on HAPs against all challenges on April 15, 2014, in a two-to-one decision. Industry groups and a number of states filed and were granted review of the D.C. Circuit decision in the U.S. Supreme Court. On June 29, 2015 the U.S. Supreme Court held that the EPA interpreted the CAA unreasonably when it deemed cost irrelevant to the decision to regulate HAPs from power plants. The court reversed the D.C. Circuit and remanded the case for further proceedings. On December 1, 2015, in response to the court’s decision the EPA published a proposed supplemental finding in the Federal Register that consideration of costs does not alter the EPA’s previous determination regarding the control of HAPs in the MATS rule. On December 15, 2015, the D.C. Circuit issued an order providing that the rule will remain in effect while the EPA responds to the U.S. Supreme Court decision.
On April 14, 2016, the EPA issued a final supplemental finding that largely tracked its proposed finding. Several states, companies and industry groups challenged that supplemental finding in the D.C. Circuit in separate petitions for review, which were subsequently consolidated. D.C. Cir. No. 116-1127. Several states and environmental groups also filed as intervenors for the respondent EPA. Although briefing in this litigation has concluded, the case remains in abeyance while the EPA reviews the supplemental finding to determine whether the rule should be maintained, modified, or otherwise reconsidered.
Federal Coal Leasing Moratorium.
President Trump’s Executive Order on Promoting Energy Independence and Economic Growth (EI Order) signed on March 28, 2017, lifted the Department of Interior’s federal coal leasing moratorium and rescinded guidance on the inclusion of social cost of carbon in federal rulemaking. Following the EI Order, the Interior Secretary issued Order 3349 ending the federal coal leasing moratorium.
|
Peabody Energy Corporation
|
2017 Form 10-K
|
16
|
Stream Protection Rule
. On July 27, 2015, the OSMRE issued its proposed Stream Protection Rule (SPR). The proposed rule would have impacted both surface and underground mining operations and would have increased testing and monitoring requirements related to the quality or quantity of surface water and groundwater or the biological condition of streams. The SPR would have also required the collection of increased pre-mining data about the site of the proposed mining operation and adjacent areas to establish a baseline for evaluation of the impacts of mining and the effectiveness of reclamation associated with returning streams to pre-mining conditions. Both chambers of Congress have already passed legislation to repeal and invalidate the rulemaking, pursuant to the Congressional Review Act. The House passed H.J. Res. 38 on February 1, 2017 and the Senate passed the bill the next day. On February 16, 2017, President Trump signed H.J. Res. 38, resulting in the repeal of the SPR and preventing the OSMRE from promulgating any substantially similar rule.
Clean Water Act (CWA)
. The CWA of 1972 directly impacts U.S. coal mining operations by requiring effluent limitations and treatment standards for wastewater discharge from mines through the National Pollutant Discharge Elimination System (NPDES). Regular monitoring, reporting and performance standards are requirements of NPDES permits that govern the discharge of water from mine-related point sources into receiving waters.
The U.S. Army Corps of Engineers (Corps) regulates certain activities affecting navigable waters and waters of the U.S., including wetlands. Section 404 of the CWA requires mining companies to obtain Corps permits to place material in streams for the purpose of creating slurry ponds, water impoundments, refuse areas, valley fills or other mining activities.
States are empowered to develop and apply “in stream” water quality standards. These standards are subject to change and must be approved by the EPA. Discharges must either meet state water quality standards or be authorized through available regulatory processes such as alternate standards or variances. “In stream” standards vary from state to state. Additionally, through the CWA section 401 certification program, states have approval authority over federal permits or licenses that might result in a discharge to their waters. States consider whether the activity will comply with their water quality standards and other applicable requirements in deciding whether or not to certify the activity.
A final rule defining the scope of waters protected under the Clean Water Act (commonly called the Waters of the United States (WOTUS) Rule) was published by the EPA and the Corps in June 2015, but the U.S. Court of Appeals for the Sixth Circuit stayed the rule nationwide since October 9, 2015. Numerous lawsuits challenging the 2015 WOTUS Rule remain pending at this time, though all litigation has been stayed, while the U.S. Supreme Court considered whether the Sixth Circuit (where all challenges that were filed in the courts of appeals were consolidated) has exclusive jurisdiction over challenges to the rule or whether challenges must begin in district courts. On January 22, 2018, the Supreme Court held that challenges to the WOTUS Rule must begin in the district courts, and ordered the Sixth Circuit to dismiss the challenges pending before it. As a result of the Supreme Court’s ruling, litigation on the merits of the 2015 WOTUS Rule will likely resume in one or more district courts. On February 28, 2017 the Trump Administration released an Executive Order directing the EPA and the Corps to consider rescinding or revising the WOTUS Rule, and the EPA and the Corps issued a similar notice that same day. The EPA and the Corps are in the process of repealing the 2015 WOTUS Rule and developing a replacement rule. The agencies have proposed, but not yet finalized, a repeal action, and they plan to propose a replacement rule in mid-2018. The agencies also recently revised the 2015 WOTUS Rule by postponing its application until February 6, 2020. Several states and environmental groups immediately challenged this action, but for the time being, the pre-2015 definitions of WOTUS remain in effect nationwide. If CWA authority is eventually expanded, it may impact our operations in some areas by way of additional requirements.
National Environmental Policy Act (NEPA)
. NEPA, signed into law in 1970, requires federal agencies to review the environmental impacts of their decisions and issue either an environmental assessment or an environmental impact statement. We must provide information to agencies when we propose actions that will be under the authority of the federal government. The NEPA process involves public participation and can involve lengthy timeframes.
Resource Conservation and Recovery Act (RCRA)
. RCRA, which was enacted in 1976, affects U.S. coal mining operations by establishing “cradle to grave” requirements for the treatment, storage and disposal of hazardous wastes. Typically, the only hazardous wastes generated at a mine site are those from products used in vehicles and for machinery maintenance. Coal mine wastes, such as overburden and coal cleaning wastes, are not considered hazardous wastes under RCRA.
Subtitle C of RCRA exempted fossil fuel combustion wastes from hazardous waste regulation until the EPA completed a report to Congress and made a determination on whether the wastes should be regulated as hazardous. On December 19, 2014, the EPA announced the final rule on coal combustion residuals (CCR or coal ash). As finalized, the rule continues the exemption of CCR from regulation as a hazardous waste, but does impose new requirements at existing CCR surface impoundments and landfills that will need to be implemented over a number of different time-frames in the coming months and years, as well as at new surface impoundments and landfills. Generally these requirements will increase the cost of CCR management, but not as much as if the rule had regulated CCR as hazardous. This EPA initiative is separate from the OSMRE CCR rulemaking mentioned above.
|
Peabody Energy Corporation
|
2017 Form 10-K
|
17
|
Comprehensive Environmental Response, Compensation and Liability Act (CERCLA).
Although generally not a prominent environmental law in the coal mining sector, CERCLA, which was enacted in 1980, nonetheless may affect U.S. coal mining operations by creating liability for investigation and remediation in response to releases of hazardous substances into the environment and for damages to natural resources. Under CERCLA, joint and several liabilities may be imposed on waste generators, site owners or operators and others, regardless of fault.
Toxic Release Inventory
. Arising out of the passage of the Emergency Planning and Community Right-to-Know Act in 1986 and the Pollution Prevention Act passed in 1990, the EPA’s Toxic Release Inventory program requires companies to report the use, manufacture or processing of listed toxic materials that exceed established thresholds, including chemicals used in equipment maintenance, reclamation, water treatment and ash received for mine placement from power generation customers.
Endangered Species Act (ESA)
. The ESA of 1973 and counterpart state legislation is intended to protect species whose populations allow for categorization as either endangered or threatened. Changes in listings or requirements under these regulations could have a material adverse effect on our costs or our ability to mine some of our properties in accordance with our current mining plans.
Use of Explosives
. Our surface mining operations are subject to numerous regulations relating to blasting activities. Pursuant to these regulations, we incur costs to design and implement blast schedules and to conduct pre-blast surveys and blast monitoring. The storage of explosives is subject to strict federal regulatory requirements. The U.S. Bureau of Alcohol, Tobacco and Firearms (ATF) regulates the use of explosive blasting materials. In addition to ATF regulation, the Department of Homeland Security is expected to finalize an ammonium nitrate security program rule. The OSMRE has also initiated a rulemaking addressing nitrous clouds that may be produced during blasting. While such new regulations may result in additional costs related to our surface mining operations, such costs are not expected to have a material adverse effect on our results of operations, financial condition or cash flows.
OSMRE Self-Bonding Notice of Rulemaking
. On August 16, 2016, the OSMRE announced a decision to initiate a rulemaking process to update the OSMRE’s bonding regulations. The decision stated that the OSMRE will be reviewing the self-bonding program and will consider revising the review process for determining if a company qualifies for self-bonding as well as the process for replacing self-bonds in the event a company no longer qualifies for self-bonding. There is no anticipated timing for the proposed rule and the new Director of OSMRE has not indicated he will continue with the proposed rulemaking.
Grid Resiliency Pricing Rule
. On October 10, 2017, the Secretary of Energy (the Secretary) published a Notice of Proposed Rulemaking entitled the Grid Resiliency Pricing Rule (the Proposed Rule). The Proposed Rule was issued by the Secretary pursuant to section 403 of the Department of Energy Organization Act. 42 U.S.C. § 7173. In the Proposed Rule, the Secretary instructed the Federal Energy Regulatory Commission (FERC) to impose rules to ensure that reliability and resiliency attributes of certain electric generation units with a 90-day on-site fuel supply are fully compensated for the benefits and services they provide to grid operations. The Secretary directed FERC to take final action on the Proposed Rule within 60 days of publication or, in the alternative, to issue the rule as an interim final rule immediately, with provision for later modifications after consideration of public comments. The Proposed Rule cites the retirements of coal and nuclear plants as a potential threat to grid reliability and resilience, and provides for the creation of a “reliability and resiliency rate” that would compensate certain eligible resources for the benefits and services they provide to grid operations, allowing such eligible resources to recover their fully allocated costs and a fair return on equity. The “reliability and resiliency rate” would be available to eligible resources operating within FERC-approved independent system operators or regional transmission organizations with energy and capacity markets. The rate would apply only to generators that are not currently subject to cost-of-service regulation by a state or other authority. On January 8, 2018, FERC unanimously denied the petition and requested additional information from power grid operators thus putting off any new rulemaking by at least two months, dismissing the Secretary's call to act immediately. FERC has opened a new proceeding to "take additional steps to explore resilience issues in the [regional transmission organizations and independent system operators]." That docket will aim to develop an understanding of what resilience actually means for the grid and to understand how each grid operator addresses the issue.
Regulatory Matters — Australia
The Australian mining industry is regulated by Australian federal, state and local governments with respect to environmental issues such as land reclamation, water quality, air quality, dust control, noise, planning issues (such as approvals to expand existing mines or to develop new mines) and health and safety issues. The Australian federal government retains control over the level of foreign investment and export approvals. Industrial relations are regulated under both federal and state laws. Australian state governments also require coal companies to post deposits or give other security against land which is being used for mining, with those deposits being returned or security released after satisfactory reclamation is completed.
|
Peabody Energy Corporation
|
2017 Form 10-K
|
18
|
Native Title and Cultural Heritage
. Since 1992, the Australian courts have recognized that native title to lands, as recognized under the laws and customs of the Aboriginal inhabitants of Australia, may have survived the process of European settlement. These developments are supported by the Federal Native Title Act which recognizes and protects native title, and under which a national register of native title claims has been established. Native title rights do not extend to minerals; however, native title rights can be affected by the mining process unless those rights have previously been extinguished thereby requiring negotiation with the traditional owners (and potentially the payment of compensation) prior to the grant of certain mining tenements. There is also federal and state legislation to prevent damage to Aboriginal cultural heritage and archaeological sites.
Mining Tenements and Environmental
. In Queensland and New South Wales, the development of a mine requires both the grant of a right to extract the resource and an approval which authorizes the environmental impact. These approvals are obtained under separate legislation from separate government authorities. However, the application processes run concurrently and are also concurrent with any native title or cultural heritage process that is required. The environmental impacts of mining projects are regulated by state and federal governments. Federal regulation will only apply if the particular project will significantly impact a matter of national environmental significance (for example, a water resource, an endangered species or particular protected places). Environmental approvals processes involve complex issues that, on occasion, require lengthy studies and documentation. Typically mining proponents must also reach agreement with the owners of land underlying proposed mining tenements prior to the grant and/or conduct of mining activities or otherwise acquire the land. These arrangements generally involve the payment of compensation in lieu of the impacts of mining on the land.
Our Australian mining operations are generally subject to local, state and federal laws and regulations. At the federal level, these legislative acts include, but are not limited to, the Environment Protection and Biodiversity Conservation Act 1999, Native Title Act 1993, Fair Work Act 2009 and the Aboriginal and Torres Strait Islander Heritage Protection Act 1984.
In Queensland, laws and regulations related to mining include, but are not limited to, the Mineral Resources Act 1989, Environmental Protection Act 1994 (EP Act), Environmental Protection Regulation 1998, Sustainable Planning Act 2009, Building Act 1975, Explosives Act 1999, Aboriginal Cultural Heritage Act 2003, Water Act 2000, State Development and Public Works Organisation Act 1971, Queensland Heritage Act 1992, Transport Infrastructure Act 1994, Nature Conservation Act 1992, Vegetation Management Act 1999, Land Protection (Pest and Stock Route Management) Act 2002, Land Act 1994, Regional Planning Interests Act 2014, Fisheries Act 1994 and Forestry Act 1959. Under the EP Act, policies have been developed to achieve the objectives of the law and provide guidance on specific areas of the environment, including air, noise, water and waste management. State planning policies address matters of Queensland State interest, and must be adhered to during mining project approvals. Increased emphasis has recently been placed on topics including, but not limited to, hazardous dams assessment and the protection of strategic cropping land. The Mineral Resources Act 1989 was amended effective September 27, 2016 to include significant changes to the management of overlapping coal and coal seam gas tenements and the coordination of activities and access to private and public land. In November 2016, amendments to the EP Act and the Water Act 2000 became effective and facilitate regulatory scrutiny of the environmental impacts of underground water extraction during the operational phase of resource projects for all tenements yet to commence mineral extraction. The ‘Chain of Responsibility’ provisions of the EP Act, effective in April 2016, allow the regulator to issue an environmental protection order (EPO) to a related person of a company in two circumstances; (a) if an EPO has been issued to the company, an EPO can also be issued to a related person of the company (at the same time or later); or (b) if the company is a high risk company (as defined in the EP Act), an EPO can be issued to a related person of the company (whether or not an EPO has also been issued to the company). A guideline has been issued to provide more certainty to the industry on the circumstances when an EPO may be issued.
In New South Wales, laws and regulations related to mining include, but are not limited to, the Mining Act 1992, Work Health and Safety (Mines) Act 2013, Mine Subsidence Compensation Act 1961, Environmental Planning and Assessment Act 1979 (EP&A Act), Environmental Planning and Assessment Regulations 2000, Protection of the Environment Operations Act 1997, Contaminated Land Management Act 1997, Explosives Act 2003, Water Management Act 2000, Water Act 1912, Radiation Control Act 1990, Heritage Act 1977, Aboriginal Land Rights Act 1983, Crown Lands Act 1989, Dangerous Goods (Road and Rail Transport) Act 2008, Fisheries Management Act 1994, Forestry Act 1916, Native Title (New South Wales) Act 1994, Native Vegetation Act 2003, Noxious Weeds Act 1993, Roads Act 1993 and National Parks & Wildlife Act 1974. Under the EP&A Act, environmental planning instruments must be considered when approving a mining project development application. There are multiple State Environmental Planning Policies (SEPPs) relevant to coal projects in New South Wales. Amendments to the SEPPs that cover mining have occurred in the past two years and are aimed at protecting agriculture, water resources and critical industry clusters. One SEPP, referred to as the Mining SEPP, was amended in late 2013 to make it mandatory for decision makers to consider the economic significance of coal resources when determining a development application for a mine and to give primacy to that consideration. This amendment was repealed in 2015. However, decision makers review the significance of a resource and the state and regional economic benefits of a proposed coal mine when considering a development application on the basis that it is an element of the “public interest” consideration contained in the legislation.
|
Peabody Energy Corporation
|
2017 Form 10-K
|
19
|
Mining Rehabilitation (Reclamation).
Mine reclamation is regulated by state specific legislation. As a condition of approval for mining operations, companies are required to progressively reclaim mined land and provide appropriate bonding to the relevant state government as a safeguard to cover the costs of reclamation in circumstances where mine operators are unable to do so. Self-bonding is not permitted. Our mines provide financial assurance to the relevant authorities which is calculated in accordance with current regulatory requirements. This financial assurance is in the form of cash or bank guarantees which are supported by a combination of cash collateral and letters of credit drawn upon our credit facility and securitization program. We operate in both the Queensland and New South Wales state jurisdictions.
Our reclamation bonding requirements in Australia were $281.3 million as of December 31, 2017. The bond requirements represent the calculated cost to reclaim the current operations of a mine if it ceased to operate in the current period less any discounts agreed with the state. The cost calculation for each bond must be completed according to the regulatory authority of each state. The costs associated with our Australian asset retirement obligations are calculated in accordance with generally accepted accounting principles and were $233.2 million as of December 31, 2017. The total bonding requirements for our Australian operations differ from the calculated costs associated with the asset retirement obligations because the costs associated with asset retirement obligations are discounted from the end of the mine’s economic life to the balance sheet date in recognition of the economic reality that reclamation is conducted progressively and final reclamation is a number of years (and in some cases decades) away, whereas the bonding amount represents the cost of reclamation if a mine ceases to operate immediately.
New South Wales Reclamation.
The Mining Act 1992 (Mining Act) is administered by the Department of Industry - Resources & Energy and authorizes the holder of a mining tenement to extract a mineral subject to obtaining consent under the Environmental Planning & Assessment Act 1979 and other auxiliary approvals and licenses.
Through the Mining Act, environmental protection and reclamation are regulated by conditions in all mining leases including requirements for the submission of a Mining Operations Plan (MOP) prior to the commencement of operations. All mining operations must be carried out in accordance with the MOP which describes site activities and the progress toward environmental and reclamation outcomes and are updated on a regular basis or if mine plans change. The mines publicly report their reclamation performance on an annual basis.
In support of the MOP process, a reclamation cost estimate is calculated periodically to determine the amount of bond support required to cover the cost of reclamation based on extent of disturbance during the MOP period.
Queensland Reclamation.
The Environmental Protection Act 1994 (EP Act) is administered by the Department of Environment and Heritage Protection which authorizes environmentally relevant activities such as mining activities relating to a mining lease through an Environmental Authority (EA). Environmental protection and reclamation activities are regulated by conditions in the EA, including the requirement for the submission of a Plan of Operations (PO) prior to the commencement of operations. All mining operations must be carried out in accordance with the PO which describes site activities and the progress toward environmental and rehabilitation outcomes and are updated on a regular basis or if mine plans change. The mines submit an annual return reporting on their EA compliance including reclamation performance.
As a condition of the EA, bonding requirements are calculated to determine the amount of bonding required to cover the cost of reclamation based on extent of disturbance during the PO period.
In May 2017, the Queensland government announced broad policy reform proposals in relation to financial assurance (FA) and rehabilitation for the mining and petroleum sector. The proposed regime represents a new approach to managing Queensland’s existing rehabilitation risks.
On October 25, 2017, the Queensland Parliament introduced the Mineral and Energy Resources (Financial Provisioning) Bill 2017 (MERFP Bill), which contained proposed legislation to give effect to some of the policy reforms, including a remodeled FA framework that takes into account the financial strength of the FA holder and the risk level of the mine, a state-wide pooled FA fund covering most mines and most of the total industry liability, discontinuation of prior discounting of FA requirements, other options for providing FA for those mines that are not part of the pooled FA fund (for example, allowing insurance bonds or cash), updated rehabilitation calculations, and regular monitoring and reporting measures for progressive mine rehabilitation.
However, the MERFP Bill lapsed on October 29, 2017 when a Queensland state election was called. It is expected that the MERFP Bill, or a bill substantially similar thereto, will be reintroduced into Parliament in the near future.
Federal Reclamation.
In February 2017, the Australian Senate established a Committee of Inquiry into the rehabilitation of mining and resources projects as it relates to Commonwealth responsibilities, for example, under the Environment Protection and Biodiversity Conservation Act 1999. The Committee is holding public hearings and is expected to issue a report during the second quarter of 2018.
|
Peabody Energy Corporation
|
2017 Form 10-K
|
20
|
Occupational Health and Safety
. State legislation requires us to provide and maintain a safe workplace by providing safe systems of work, safety equipment and appropriate information, instruction, training and supervision. In recognition of the specialized nature of mining and mining activities, specific occupational health and safety obligations have been mandated under state legislation specific to the coal mining industry. There are some differences in the application and detail of the laws, and mining operators, directors, officers and certain other employees are all subject to the obligations under this legislation.
A small number of coal mine workers in Queensland and New South Wales have been diagnosed with coal worker’s pneumoconiosis (CWP, also known as black lung) following decades of assumed eradication of the disease. This has led the Queensland government to sponsor review of the system of screening coal mine workers for the disease with a view to improving early detection. The Queensland government has instituted increased reporting requirements for dust monitoring results, broader coal mine worker health assessment requirements and voluntary retirement examinations for coal mine workers to be arranged by the relevant employer and further reform may follow. Peabody has undertaken a review of its practices and offered its Queensland workers the opportunity for additional CWP screening.
The Queensland government held a Parliamentary inquiry into the re-emergence of CWP in the State which included public hearings with appearances by representatives of the coal mining industry, including us, coal mine workers, the Department of Natural Resources and others. The Queensland Parliamentary Committee conducting the inquiry issued its final report on May 29, 2017. In finding that it is highly unlikely CWP was ever eradicated in Queensland, the Committee made 68 recommendations to ensure the safety and health of mine workers. These include an immediate reduction to the occupational exposure limit for respirable coal dust equivalent to 1.5mg/m
3
for coal dust and 0.05 mg/m
3
for silica and the establishment of a new and independent Mine Safety Authority to be funded by a dedicated proportion of coal and mineral royalties and overseeing the Mines Safety Inspectorate.
On August 23, 2017, the Queensland Parliament passed the Workers’ Compensation and Rehabilitation (Coal Workers’ Pneumoconiosis) and Other Legislation Amendment Act 2017, which amends the Workers’ Compensation and Rehabilitation Act 2003 by establishing a medical examination process for retired or former coal workers with suspected CWP, introducing an additional lump sum compensation for workers with CWP, and clarifying that a worker with CWP can access further workers’ compensation entitlements if they experience disease progression.
On August 24, 2017, the Queensland Parliamentary Committee released a report containing a draft of the Mine Safety and Health Authority Bill 2017, which proposes to establish the Mine Safety Authority foreshadowed in the Committee’s recommendations released in May 2017. The draft bill has been referred to the Parliamentary Portfolio Committee for review.
On September 7, 2017, the Queensland Parliament introduced a bill to amend legislation which, if passed, would increase civil penalties for mining companies breaching their obligations under the Coal Mining Safety and Health Act 1999 (CMSHA Bill). The proposed amendments would also give the Chief Executive of the Department of Natural Resources and Mining new powers to suspend or cancel an individual’s statutory certificate of competency and issue site senior executives (SSEs) notices if they fail to meet their safety and health obligations. Higher levels of competency for the statutory position of ventilation officer at underground mines will also be required if the legislation is passed.
However, the CMSHA Bill lapsed on October 29, 2017 when a Queensland state election was called. It is expected that the bill, or one substantially similar thereto, will be reintroduced into Parliament in the near future.
Industrial Relations
. A national industrial relations system administered by the federal government applies to all private sector employers and employees. The matters regulated under the national system include employment conditions, unfair dismissal, enterprise bargaining, bullying claims, industrial action and resolution of workplace disputes. Many of the workers employed in our mines are covered by enterprise agreements approved under the national system.
National Greenhouse and Energy Reporting Act 2007 (NGER Act)
. The NGER Act imposes requirements for corporations meeting a certain threshold to register and report greenhouse gas emissions and abatement actions, as well as energy production and consumption as part of a single, national reporting system. The Clean Energy Regulator administers the NGER Act. The Department of Environment and Energy is responsible for NGER Act-related policy developments and review. Both foreign and local corporations that meet the prescribed carbon dioxide and energy production or consumption limits in Australia (Controlling Corporations) must comply with the NGER Act. One of our subsidiaries is now registered as a Controlling Corporation and must report annually on the greenhouse gas emissions and energy production and consumption of our Australian entities.
On July 1, 2016, amendments to the NGER Act implemented the Emissions Reduction Fund Safeguard Mechanism. From that date, large designated facilities such as coal mines were issued with a baseline for their covered emissions and must take steps to keep their emissions at or below the baseline or face penalties.
|
Peabody Energy Corporation
|
2017 Form 10-K
|
21
|
Queensland Royalty
. Royalties are payable to the State of Queensland at a rate of 12.5% on coal prices over $100 Australian dollars per tonne and up to $150 Australian dollars per tonne and 15% on pricing over $150 Australian dollars per tonne. The rate is 7% for coal sold below $100 Australian dollars per tonne. The periodic impact of these royalty rates is dependent upon the volume of tonnes produced at each of our Queensland mining locations and coal prices received for those tonnes. The Queensland Office of State Revenue issues determinations setting out its interpretation of the laws that impose royalties and provide guidance on how royalty rates should be calculated.
New South Wales Royalty
. In New South Wales, the royalty applicable to coal is charged as a percentage of the value of production (total revenue less allowable deductions). This is equal to 6.2% for deep underground mines (coal extracted at depths greater than 400 meters below ground surface), 7.2% for underground mines and 8.2% for open-cut mines.
Global Climate
In the U.S., Congress has considered legislation addressing global climate issues and greenhouse gas emissions, but to date nothing has been enacted. While it is possible that the U.S. will adopt legislation in the future, the timing and specific requirements of any such legislation are uncertain. In the absence of new U.S. federal legislation, the EPA is undertaking steps to regulate greenhouse gas emissions pursuant to the Clean Air Act. In response to the 2007 U.S. Supreme Court ruling in Massachusetts v. EPA, the EPA commenced several rulemaking projects as described under “Regulatory Matters-U.S. - Environmental Laws and Regulations.” In particular, on August 3, 2015, the EPA announced the final rules (which were published in the Federal Register on October 23, 2015) for regulating carbon dioxide emissions from existing and new fossil fuel-fired EGUs. The EPA has set emission performance rates for existing plants to be phased in over the period from 2022 through 2030. This rule is intended to reduce carbon dioxide emissions from the 2005 baseline by 28% in 2025 and 32% in 2030. The EPA has also set standards applying to new, modified and reconstructed sources beginning in 2015.
A number of states in the U.S. have adopted programs to regulate greenhouse gas emissions. For example, 10 northeastern states (Connecticut, Delaware, Maine, Maryland, Massachusetts, New Hampshire, New Jersey, New York, Rhode Island and Vermont) entered into the Regional Greenhouse Gas Initiative (RGGI) in 2005, which is a mandatory cap-and-trade program to cap regional carbon dioxide emissions from power plants. In 2011, New Jersey announced its withdrawal from RGGI effective January 1, 2012. Six mid-western states (Illinois, Iowa, Kansas, Michigan, Minnesota and Wisconsin) and one Canadian province have entered into the Midwestern Regional Greenhouse Gas Reduction Accord (MGGRA) to establish voluntary regional greenhouse gas reduction targets and develop a voluntary multi-sector cap-and-trade system to help meet the targets. It has been reported that, while the MGGRA has not been formally suspended, the participating states are no longer pursuing it. Seven western states (Arizona, California, Montana, New Mexico, Oregon, Utah and Washington) and four Canadian provinces entered into the Western Climate Initiative (WCI) in 2008 to establish a voluntary regional greenhouse gas reduction goal and develop market-based strategies to achieve emissions reductions. However, in November 2011, the WCI announced that six states had withdrawn from the WCI, leaving California and four Canadian provinces as the remaining members. Of those five jurisdictions, only California and Quebec have adopted greenhouse gas cap-and-trade regulations to date and both programs have begun operating. Many of the states and provinces that left WCI, RGGI and MGGRA, along with many that continue to participate, have joined the new North America 2050 initiative, which seeks to reduce greenhouse gas emissions and create economic opportunities in ways not limited to cap-and-trade programs.
In the U.S., several states have enacted legislation establishing greenhouse gas emissions reduction goals or requirements. In addition, several states have enacted legislation or have in effect regulations requiring electricity suppliers to use renewable energy sources to generate a certain percentage of power or that provide financial incentives to electricity suppliers for using renewable energy sources. Some states have initiated public utility proceedings that may establish values for carbon emissions.
We participated in the Department of Energy’s Voluntary Reporting of Greenhouse Gases Program until its suspension in May 2011, and regularly disclose in our Corporate and Social Responsibility Report the quantity of emissions per ton of coal produced by us in the U.S. The vast majority of our emissions are generated by the operation of heavy machinery to extract and transport material at our mines and fugitive emissions from the extraction of coal.
In 2013, the U.S. and a number of international development banks, including the World Bank, the European Investment Bank and the European Bank for Reconstruction and Development, announced that they would no longer provide financing for the development of new coal-fueled power plants or would do so only in narrowly defined circumstances. Other international development banks, such as the Asian Development Bank and the Japanese Bank for International Cooperation, have continued to provide such financing.
|
Peabody Energy Corporation
|
2017 Form 10-K
|
22
|
The Kyoto Protocol, adopted in December 1997 by the signatories to the 1992 United Nations Framework Convention on Climate Change (UNFCCC), established a binding set of greenhouse gas emission targets for developed nations. The U.S. signed the Kyoto Protocol but it has never been ratified by the U.S. Senate. Australia ratified the Kyoto Protocol in December 2007 and became a full member in March 2008. There were discussions to develop a treaty to replace the Kyoto Protocol after the expiration of its commitment period in 2012, including at the UNFCCC conferences in Cancun (2010), Durban (2011), Doha (2012) and Paris (2015). At the Durban conference, an ad hoc working group was established to develop a protocol, another legal instrument or an agreed outcome with legal force under the UNFCCC, applicable to all parties. At the Doha meeting, an amendment to the Kyoto Protocol was adopted, which included new commitments for certain parties in a second commitment period, from 2013 to 2020. In December 2012, Australia signed on to the second commitment period. During the UNFCCC conference in Paris, France in late 2015, an agreement was adopted calling for voluntary emissions reductions contributions after the second commitment period ends in 2020. The agreement was entered into force on November 4, 2016 after ratification and execution by more than 55 countries, including Australia, that account for at least 55% of global greenhouse gas emissions. The Trump Administration has announced the U.S. will begin the process of withdrawing from the Paris Agreement.
Australia’s Parliament passed carbon pricing legislation in November 2011. The first program involved the imposition of a carbon tax that commenced in July 2012. On July 16, 2014, Australia’s Parliament repealed the legislation, which was retrospectively abolished from July 1, 2014.
In October 2017, the Australian government announced the National Energy Guarantee (NEG). The NEG is intended to reduce the supply volatility and escalating prices that currently exist in the Australian east coast electricity network and provide for affordable, reliable electricity while still meeting Australia’s emissions targets. The NEG has an energy neutral focus. It is expected that the Renewable Energy Target (RET) will not continue beyond its currently planned end date in 2020.
The impact of the NEG on the Company’s operations using electricity is yet to be determined as the details of the NEG are still being formulated by the Australian government. The NEG requires approval of the Council of Australian Governments to come into effect.
Enactment of laws or passage of regulations regarding emissions from the use of coal by the U.S., some of its states or other countries, or other actions to limit such emissions, could result in electricity generators switching from coal to other fuel sources. Further, policies limiting available financing for the development of new coal-fueled power stations could adversely impact the global demand for coal in the future. The potential financial impact on us of future laws, regulations or other policies will depend upon the degree to which any such laws or regulations force electricity generators to diminish their reliance on coal as a fuel source. That, in turn, will depend on a number of factors, including the specific requirements imposed by any such laws, regulations or other policies, the time periods over which those laws, regulations or other policies would be phased in, the state of development and deployment of CCUS technologies as well as acceptance of CCUS technologies to meet regulations and the alternative uses for coal. Similarly, higher-efficiency coal-fired power plants may also be an option for meeting laws or regulations related to emissions from coal use. Several countries, including some major coal users such as China, India and Japan, included using higher-efficiency coal-fueled power plants in their plans under the Paris Agreement. From time to time, we attempt to analyze the potential impact on the Company of as-yet-unadopted, potential laws, regulations and policies. Such analyses require that we make significant assumptions as to the specific provisions of such potential laws, regulations and policies. These analyses sometimes show that certain potential laws, regulations and policies, if implemented in the manner assumed by the analyses, could result in material adverse impacts on our operations, financial condition or cash flow, in view of the significant uncertainty surrounding each of these potential laws, regulations and policies. We do not believe that such analyses reasonably predict the quantitative impact that future laws, regulations or other policies may have on our results of operations, financial condition or cash flows.
Available Information
We file or furnish annual, quarterly and current reports (including any exhibits or amendments to those reports), proxy statements and other information with the SEC. These materials are available free of charge through our website (www.peabodyenergy.com) as soon as reasonably practicable after such material is electronically filed with, or furnished to, the SEC. Information included on our website does not constitute part of this document. These materials may also be accessed through the SEC’s website (www.sec.gov) or in the SEC’s Public Reference Room located at 100 F Street, N.E., Washington, D.C. 20549. Information on the operation of the Public Reference Room may be obtained by calling 1-800-SEC-0330.
In addition, copies of our filings will be made available, free of charge, upon request by telephone at (314) 342-7900 or by mail at: Peabody Energy Corporation, Peabody Plaza, 701 Market Street, St. Louis, Missouri 63101-1826, attention: Investor Relations.
|
Peabody Energy Corporation
|
2017 Form 10-K
|
23
|
Item 1A.
Risk Factors.
We operate in a rapidly changing environment that involves a number of risks. The following discussion highlights some of these risks and others are discussed elsewhere in this report. These and other risks could materially and adversely affect our business, financial condition, prospects, operating results or cash flows. The following risk factors are not an exhaustive list of the risks associated with our business. New factors may emerge or changes to these risks could occur that could materially affect our business.
Risks Associated with Our Emergence from the Chapter 11 Cases
As a result of our emergence from our Chapter 11 Cases, our historical financial information is not indicative of our future financial performance.
Our capital structure was significantly altered through the implementation of the Plan. As a result, we are subject to the fresh start reporting rules required under the Financial Accounting Standards Board Accounting Standards Codification Topic 852, Reorganizations. Under applicable fresh start reporting rules, our assets and liabilities were adjusted to fair values and our accumulated deficit was restated to zero. Accordingly, our consolidated financial condition and results of operations from and after the Effective Date are not comparable to the financial condition or results of operations reflected in our consolidated historical financial statements.
Risks Associated with Our Operations
Our profitability depends upon the prices we receive for our coal.
We operate in a competitive and highly regulated industry that has previously experienced strong headwinds. In 2017, the coal industry saw sharp upturns in seaborne metallurgical and thermal coal pricing primarily due to restrictive production policies in China. However, these recent industry events do not demonstrate that these prices will be sustainable in the future and the vast majority of third-party analysts project that prices are likely to decline. If coal prices decrease or return to depressed levels, our operating results and profitability and value of our coal reserves could be materially and adversely affected.
Coal prices are dependent upon factors beyond our control, including:
|
•
|
the demand for electricity;
|
|
•
|
the strength of the global economy;
|
|
•
|
the relative price of natural gas and other energy sources used to generate electricity;
|
|
•
|
the demand for electricity and capacity utilization of electricity generating units (whether coal or non-coal);
|
|
•
|
the demand for steel, which may lead to price fluctuations in the monthly and quarterly repricing of our metallurgical coal contracts;
|
|
•
|
the global supply and production costs of thermal and metallurgical coal;
|
|
•
|
changes in the fuel consumption and dispatch patterns of electric power generators;
|
|
•
|
weather patterns and natural disasters;
|
|
•
|
competition within our industry and the availability, quality and price of alternative fuels, including natural gas, fuel oil, nuclear, hydroelectric, wind, biomass and solar power;
|
|
•
|
the proximity, capacity and cost of transportation and terminal facilities;
|
|
•
|
coal and natural gas industry output and capacity;
|
|
•
|
governmental regulations and taxes, including those establishing air emission standards for coal-fueled power plants or mandating or subsidizing increased use of electricity from renewable energy sources;
|
|
•
|
regulatory, administrative and judicial decisions, including those affecting future mining permits and leases; and
|
|
•
|
technological developments, including those related to alternative energy sources, those intended to convert coal-to-liquids or gas and those aimed at capturing, using and storing carbon dioxide.
|
In the U.S., our strategy is to selectively renew, or enter into new, long-term supply agreements when we can do so at prices we believe are favorable. In Australia we negotiate pricing for metallurgical coal contracts on a quarterly, spot or index basis and seaborne thermal coal contracts on an annual, spot or index basis.
|
Peabody Energy Corporation
|
2017 Form 10-K
|
24
|
Thermal coal accounted for the majority of our coal sales during 2016 and 2017. The vast majority of our sales of thermal coal were to electric power generators. The demand for coal consumed for electric power generation is affected by many of the factors described above, but primarily by (i) the overall demand for electricity; (ii) the availability, quality and price of competing fuels, such as natural gas, nuclear fuel, oil and alternative energy sources; (iii) utilization of all electricity generating units (whether using coal or not), including the relative cost of producing electricity from all fuels, including coal; (iv) increasingly stringent environmental and other governmental regulations; and (v) the coal inventories of utilities. Gas-fueled generation has displaced and is expected to continue to displace coal-fueled generation, particularly from older, less efficient coal-powered generators. Many of the new power plants in the U.S. may be fueled by natural gas because gas-fired plants are viewed as cheaper to construct and permits to construct these plants are easier to obtain as natural gas is seen as having a lower environmental impact than coal-fueled generators. Increasingly stringent regulations along with flat electricity demand have also reduced the number of new power plants being built. These trends have reduced demand for our coal and the related prices. Any further reduction in the amount of coal consumed by electric power generators could reduce the volume and price of coal that we mine and sell.
Lower demand for metallurgical coal by steel producers would reduce our revenues and could further reduce the price of our metallurgical coal. We produce metallurgical coal that is used in the global steel industry. Metallurgical coal accounted for approximately 28% and 23% of our coal sales revenue in 2017 and 2016, respectively. Deteriorating conditions in the steel industry, including the demand for steel, could reduce the demand for our metallurgical coal. Lower demand for metallurgical coal in international markets would reduce the amount of metallurgical coal that we sell and the prices that we receive for it, thereby reducing our revenues and adversely impacting our earnings and the value of our coal reserves.
Additionally, we compete with numerous other domestic and foreign coal producers for domestic and international sales. This competition affects domestic and foreign coal prices and our ability to attract and retain customers. The balance between coal demand and supply within the coal industry, factoring in demand and supply of closely related and competing segments such as natural gas, both domestically and internationally, could materially reduce coal prices and therefore materially reduce our revenues and profitability. We compete with producers of other low cost fuels used for electricity generation, such as natural gas and renewables. Declines in the price of natural gas, or continued low natural gas prices, could cause demand for coal to decrease and adversely affect the price of coal. Sustained periods of low natural gas prices or other fuels may also cause utilities to phase out or close existing coal-fired power plants or reduce construction of new coal-fired power plants, which could have a material adverse effect on demand and prices for our coal, thereby reducing our revenues and materially and adversely affecting our business and results of operations.
If a substantial number of our long-term coal supply agreements terminate, our revenues and operating profits could suffer if we are unable to find alternate buyers willing to purchase our coal on comparable terms to those in our contracts.
Most of our sales are made under coal supply agreements, which are important to the stability and profitability of our operations. The execution of a satisfactory coal supply agreement is frequently the basis on which we undertake the development of coal reserves required to be supplied under the contract, particularly in the U.S.
Many of our coal supply agreements contain provisions that permit the parties to adjust the contract price upward or downward at specified times. We may adjust these contract prices based on inflation or deflation and/or changes in the factors affecting the cost of producing coal, such as taxes, fees, royalties and changes in the laws regulating the mining, production, sale or use of coal. In a limited number of contracts, failure of the parties to agree on a price under those provisions may allow either party to terminate the contract. We sometimes experience a reduction in coal prices in new long-term coal supply agreements replacing some of our expiring contracts. Coal supply agreements also typically contain force majeure provisions allowing temporary suspension of performance by us or the customer during the duration of specified events beyond the control of the affected party. Most of our coal supply agreements contain provisions requiring us to deliver coal meeting quality thresholds for certain characteristics such as Btu, sulfur content, ash content, grindability and ash fusion temperature. Failure to meet these specifications could result in economic penalties, including price adjustments, the rejection of deliveries or termination of the contracts. Moreover, some of these agreements allow our customers to terminate their contracts in the event of changes in regulations affecting our industry that restrict the use or type of coal permissible at the customer’s plant or increase the price of coal beyond specified limits.
The operating profits we realize from coal sold under supply agreements depend on a variety of factors. In addition, price adjustment and other provisions may increase our exposure to short-term coal price volatility provided by those contracts. If a substantial portion of our coal supply agreements were modified or terminated, we could be materially adversely affected to the extent that we are unable to find alternate buyers for our coal at the same level of profitability. Prices for coal vary by mining region and country. As a result, we cannot predict the future strength of the coal industry overall or by mining region and cannot provide assurance that we will be able to replace existing long-term coal supply agreements at the same prices or with similar profit margins when they expire.
|
Peabody Energy Corporation
|
2017 Form 10-K
|
25
|
The loss of, or significant reduction in, purchases by our largest customers could adversely affect our revenues.
For the year ended December 31, 2017, we derived
27%
of our total revenues from our five largest customers, similar to the prior year. Those five customers were supplied primarily from
21
coal supply agreements (excluding trading transactions) expiring at various times from 2018 to 2025. On an ongoing basis, we discuss the extension of existing agreements or entering into new long-term agreements with various customers, but these negotiations may not be successful and these customers may not continue to purchase coal from us under long-term supply agreements. If a number of these customers significantly reduce their purchases of coal from us, or if we are unable to sell coal to them on terms as favorable to us as the terms under our current agreements, our financial condition and results of operations could suffer materially. In addition, our revenue could be adversely affected by a decline in customer purchases (including contractually obligated purchases) due to lack of demand and oversupply, cost of competing fuels and environmental and other governmental regulations.
One of our five largest customers, the Navajo Generating Station (NGS) is served by a single Peabody mine, included in our Western U.S. Mining operations, that has no other customers. Given the mine’s location, it is currently unable to economically market its coal to other utility customers. This mine has a contract to supply coal to NGS through December 2019. We estimate that the mine will sell between five million and six million tons in 2018 at Adjusted EBTIDA Margin per Ton in line with those seen in our Western U.S. Mining Segment during the Successor period ended December 31, 2017. NGS is owned by several private companies and one governmental entity. The non-governmental owners of the customer recently completed an evaluation of the plant and determined to continue operating the plant through December 2019, subject to certain conditions. Those non-governmental owners of the plant then issued a statement that they do not currently intend to be the operators of the plant beyond December 2019.
We have engaged an investment banking firm to lead an ownership transition process for the plant. On October 2, 2017, we confirmed that a number of potential investors had expressed interest in pursuing an ownership position in NGS. Additionally, we are currently discussing options to improve the plant’s economics. If the customer closes the plant, our Western U.S. Mining operations revenues, Adjusted EBITDA and cash flows would be materially reduced and our proven and probable reserves would be reduced by approximately 180 million tons. We could also incur accelerated costs related to the mine’s closure and may be required to record other charges. Under the terms of the contract, NGS is responsible for reimbursing us for the majority of our post-mining obligations, including reclamation and retiree healthcare costs.
Our trading and hedging activities do not cover certain risks, and may expose us to earnings volatility and other risks.
We historically entered into hedging arrangements designed primarily to manage market price volatility of foreign currency (primarily the Australian dollar), diesel fuel and coal. Currently, we primarily enter into hedging arrangements designed to manage coal industry price through our trading and marketing functions and increases in foreign currency exchange rates; however, we may in the future enter into hedging arrangements to manage the volatility of diesel fuel, or other matters.
Some of these derivative trading instruments require us to post margin based on the value of those instruments and other credit factors. If the fair value of our hedge portfolio moves significantly, or if laws or regulations are passed requiring all hedge arrangements to be exchange-traded or exchange-cleared, we could be required to post additional margin, which could negatively impact our liquidity.
Through our trading and hedging activities, we are also exposed to nonperformance and credit risk with various counterparties, including exchanges and other financial intermediaries. Should the counterparties to these arrangements fail to perform, we may be forced to enter into alternative arrangements, which could negatively impact our profitability and/or liquidity.
We are currently subject to price risk on diesel fuel utilized in our mining operations. As noted above, we have historically used derivative financial instruments, including forward contracts, swaps and options, designated as cash flow hedges, to manage these risks. We are exposed to the risk of fluctuations in the price of fuel.
Our operating results could be adversely affected by unfavorable economic and financial market conditions.
Our profits are affected, in large part, by industry conditions. Industry conditions are subject to a variety of factors beyond our control. In recent years, the global economic recession and the worldwide financial and credit market disruptions had a negative impact on us and on the coal industry generally. These conditions, among other factors, led to the filing of the Chapter 11 Cases. If any of these conditions return, if coal prices continue at or below levels experienced in 2015 and early 2016 for a prolonged period or if there are further downturns in economic conditions, particularly in developing countries such as China and India, our business, financial condition or results of operations could be adversely affected. While we are focused on cost control, productivity improvements, increased contributions from our higher-margin operations and capital discipline, there can be no assurance that these actions, or any others we may take, will be sufficient in response to challenging economic and financial conditions.
|
Peabody Energy Corporation
|
2017 Form 10-K
|
26
|
Our ability to collect payments from our customers could be impaired if their creditworthiness or contractual performance deteriorates.
Our ability to receive payment for coal sold and delivered or for financially settled contracts will depend on the continued creditworthiness and contractual performance of our customers and counterparties. Our customer base has changed with deregulation in the U.S. as utilities have sold their power plants to their non-regulated affiliates or third parties. These new customers may have credit ratings that are below investment grade or are not rated. If deterioration of the creditworthiness of our customers occurs or if they fail to perform the terms of their contracts with us, our accounts receivable securitization program and our business could be adversely affected.
Risks inherent to mining could increase the cost of operating our business.
Our mining operations are subject to conditions that can impact the safety of our workforce, or delay coal deliveries or increase the cost of mining at particular mines for varying lengths of time. These conditions include:
|
•
|
fires and explosions, including from methane gas or coal dust;
|
|
•
|
accidental mine water discharges;
|
|
•
|
weather, flooding and natural disasters;
|
|
•
|
hazardous geologic events such as roof falls and high wall failures;
|
|
•
|
key equipment failures;
|
|
•
|
variations in coal seam thickness, coal quality, the amount of rock and soil overlying coal deposits, and geologic conditions impacting mine sequencing;
|
|
•
|
unexpected maintenance problems; and
|
|
•
|
unforeseen delays in implementation of mining technologies that are new to our operations.
|
We maintain insurance policies that provide limited coverage for some of these risks, although there can be no assurance that these risks would be fully covered by our insurance policies. Despite our efforts, such conditions could occur and have a substantial impact on our results of operations, financial condition or cash flows.
If transportation for our coal becomes unavailable or uneconomic for our customers, our ability to sell coal could suffer.
Transportation costs represent a significant portion of the total cost of coal use and the cost of transportation is a critical factor in a customer’s purchasing decision. Increases in transportation costs and the lack of sufficient rail and port capacity could lead to reduced coal sales.
We depend upon rail, barge, trucking, overland conveyor and ocean-going vessels to deliver coal to our customers. While our coal customers typically arrange and pay for transportation of coal from the mine or port to the point of use, disruption of these transportation services because of weather-related problems, infrastructure damage, strikes, lock-outs, lack of fuel or maintenance items, underperformance of the port and rail infrastructure, congestion and balancing systems which are imposed to manage vessel queuing and demurrage, non-performance or delays by co-shippers, transportation delays or other events could temporarily impair our ability to supply coal to our customers and thus could adversely affect our results of operations.
A decrease in the availability or increase in costs of key supplies, capital equipment or commodities such as diesel fuel, steel, explosives and tires could decrease our anticipated profitability.
Our mining operations require a reliable supply of mining equipment, replacement parts, fuel, explosives, tires, steel-related products (including roof control materials), lubricants and electricity. There has been some consolidation in the supplier base providing mining materials to the coal industry, such as with suppliers of explosives in the U.S. and both surface and underground equipment globally, that has limited the number of sources for these materials. In situations where we have chosen to concentrate a large portion of purchases with one supplier, it has been to take advantage of cost savings from larger volumes of purchases and to ensure security of supply. If the cost of any of these inputs increased significantly, or if a source for these supplies or mining equipment were unavailable to meet our replacement demands, our profitability could be reduced or we could experience a delay or halt in our production.
|
Peabody Energy Corporation
|
2017 Form 10-K
|
27
|
Take-or-pay arrangements within the coal industry could unfavorably affect our profitability.
We have substantial take-or-pay arrangements, predominately in Australia, totaling
$1.3 billion
, with terms ranging up to
25
years, that commit us to pay a minimum amount for rail and port commitments for the delivery of coal even if those commitments go unused. The take-or-pay provisions in these contracts sometimes allow us to apply amounts paid for subsequent deliveries, but these provisions have limitations and we may not be able to apply all such amounts so paid in all cases. Also, we may not be able to utilize the amount of capacity for which we have previously paid. Additionally, coal companies, including us, may continue to deliver coal during times when it might otherwise be optimal to suspend operations because these take-or-pay provisions effectively convert a variable cost of selling coal to a fixed operating cost.
We have contract-based intangible liabilities primarily consisting of unutilized capacity under port and rail take-or-pay contracts. Future unutilized capacity and the amortization periods related to the take-or-pay contract intangible liabilities are based upon estimates of forecasted usage. We anticipate that the amortization of the intangible liability, which is classified as a reduction to “Operating costs and expenses,” will extend through 2043.
An inability of trading, brokerage, mining or freight counterparties to fulfill the terms of their contracts with us could reduce our profitability.
In conducting our trading, brokerage and mining operations, we utilize third-party sources of coal production and transportation, including contract miners and brokerage sources, to fulfill deliveries under our coal supply agreements. Employee relations at mines that use contractors are the responsibility of the contractor.
Our profitability or exposure to loss on transactions or relationships is dependent upon the reliability (including financial viability) and price of the third-party suppliers; our obligation to supply coal to customers in the event that weather, flooding, natural disasters or adverse geologic mining conditions restrict deliveries from our suppliers; our willingness to participate in temporary cost increases experienced by our third-party coal suppliers; our ability to pass on temporary cost increases to our customers; the ability to substitute, when economical, third-party coal sources with internal production or coal purchased in the market and the ability of our freight sources to fulfill their delivery obligations. Market volatility and price increases for coal or freight on the international and domestic markets could result in non-performance by third-party suppliers under existing contracts with us, in order to take advantage of the higher prices in the current market. Such non-performance could have an adverse impact on our ability to fulfill deliveries under our coal supply agreements.
We may not recover our investments in our mining, exploration and other assets, which may require us to recognize impairment charges related to those assets.
The value of our assets may be adversely affected by numerous uncertain factors, some of which are beyond our control, including unfavorable changes in the economic environments in which we operate, lower-than-expected coal pricing, technical and geological operating difficulties, an inability to economically extract our coal reserves and unanticipated increases in operating costs. These may cause us to fail to recover all or a portion of our investments in those assets and may trigger the recognition of impairment charges in the future, which could have a substantial impact on our results of operations. This may be mitigated by our application of fresh start reporting rules.
As described in Note 3. “Asset Impairment” to the accompanying consolidated financial statements, we recognized aggregate asset impairment costs of
$30.5 million
,
$247.9 million
and
$1,277.8 million
in the predecessor period January 1 through April 1, 2017 and the years ended December 31,
2016
and
2015
, respectively. Because of the volatile and cyclical nature of U.S. and international coal markets, it is reasonably possible that our current estimates of projected future cash flows from our mining assets may change in the near term, which may result in the need for adjustments to the carrying value of our assets.
Our ability to operate our company effectively could be impaired if we lose key personnel or fail to attract qualified personnel.
We manage our business with a number of key personnel, the loss of whom could have a material adverse effect on us, absent the completion of an orderly transition. In addition, we believe that our future success will depend greatly on our continued ability to attract and retain highly skilled and qualified personnel, particularly personnel with mining experience. We cannot provide assurance that key personnel will continue to be employed by us or that we will be able to attract and retain qualified personnel in the future. Failure to retain or attract key personnel could have a material adverse effect on us.
|
Peabody Energy Corporation
|
2017 Form 10-K
|
28
|
We could be negatively affected if we fail to maintain satisfactory labor relations.
As of December 31, 2017, we had approximately
7,100
employees (excluding employees that were employed at operations classified as discontinued), which included approximately
5,500
hourly employees. Approximately
38%
of our hourly employees were represented by organized labor unions and generated approximately
20%
of 2017 coal production for the 12 months ended December 31, 2017. Relations with our employees and, where applicable, organized labor are important to our success. If some or all of our current non-union operations were to become unionized, we could incur an increased risk of work stoppages, reduced productivity and higher labor costs. Also, if we fail to maintain good relations with our employees who are represented by unions, we could potentially experience labor disputes, work stoppages or other disruptions in production that could negatively impact our profitability.
We could be adversely affected if we fail to appropriately provide financial assurances for our obligations.
U.S. federal and state laws and Australian laws require us to provide financial assurances related to requirements to reclaim lands used for mining, to pay federal and state workers’ compensation, to provide financial assurances for coal lease obligations and to satisfy other miscellaneous obligations. The primary methods we use to meet those obligations are to provide a third-party surety bond or provide a letter of credit. In the past in the U.S., we also posted a corporate guarantee (
i.e.
, self- bond). As of December 31, 2017, we had outstanding surety bonds with third parties, bank guarantees and letters of credit of $1,675.2 million, of which $1,325.3 million was for post-mining reclamation, $214.5 million related to workers’ compensation and other insurance obligations, $95.4 million was for coal lease obligations and $40.0 million was for other obligations, including road maintenance and performance guarantees. In addition, as of December 31, 2017, we had posted cash collateral of $323.1 million, primarily in support of our reclamation obligations in Australia. Surety bond issuers may demand additional collateral, which may in turn affect our available liquidity.
Our bonding obligations may increase due to a number of factors, and we may not qualify to self-bond or self-bonding programs may be terminated. Alternative forms of financial assurance such as surety bonds and letters of credit may not be available to us. Our failure to retain, or inability to obtain surety bonds, bank guarantees or letters of credit, or to provide a suitable alternative, could have a material adverse effect on us. That failure could result from a variety of factors including the following:
|
•
|
lack of availability, higher expense or unfavorable market terms of new surety bonds; and
|
|
•
|
inability to provide or fund collateral for current and future third-party surety bond issuers.
|
Our failure to maintain adequate bonding would invalidate our mining permits and prevent mining operations from continuing, which would cast substantial doubt on our ability to continue as a going concern.
Our mining operations are extensively regulated, which imposes significant costs on us, and future regulations and developments could increase those costs or limit our ability to produce coal.
The coal mining industry is subject to regulation by federal, state and local authorities with respect to matters such as:
|
•
|
workplace health and safety;
|
|
•
|
limitations on land use;
|
|
•
|
mine permitting and licensing requirements;
|
|
•
|
reclamation and restoration of mining properties after mining is completed;
|
|
•
|
the storage, treatment and disposal of wastes;
|
|
•
|
remediation of contaminated soil, sediment and groundwater;
|
|
•
|
air quality standards;
|
|
•
|
water pollution;
|
|
•
|
protection of human health, plant-life and wildlife, including endangered or threatened species and habitats;
|
|
•
|
protection of wetlands;
|
|
•
|
the discharge of materials into the environment; and
|
|
•
|
the effects of mining on surface water and groundwater quality and availability.
|
Regulatory agencies have the authority under certain circumstances following significant health and safety incidents to order a mine to be temporarily or permanently closed. In the event that such agencies ordered the closing of one of our mines, our production and sale of coal would be disrupted and we may be required to incur cash outlays to re-open the mine. Any of these actions could have a material adverse effect on our financial condition, results of operations and cash flows.
|
Peabody Energy Corporation
|
2017 Form 10-K
|
29
|
The possibility exists that new legislation or regulations and orders, including without limitation related to the environment or employee health and safety may be adopted and may materially adversely affect our mining operations, our cost structure or our customers’ ability to use coal. New legislation or administrative regulations (or new interpretations by the relevant government of existing laws, regulations and approvals), including proposals related to the protection of the environment or the reduction of greenhouse gas emissions that would further regulate and tax the coal industry, may also require us or our customers to change operations significantly or incur increased costs. Some of our coal supply agreements contain provisions that allow a purchaser to terminate its contract if legislation is passed that either restricts the use or type of coal permissible at the purchaser’s plant or results in specified increases in the cost of coal or its use. These factors and legislation, if enacted, could have a material adverse effect on our financial condition and results of operations.
For additional information about the various regulations affecting us, see the sections entitled “Regulatory Matters
—U.S.” and “Regulatory Matters —
Australia”.
Our operations may impact the environment or cause exposure to hazardous substances, and our properties may have environmental contamination, which could result in material liabilities to us.
Our operations currently use hazardous materials and generate limited quantities of hazardous wastes from time to time. A number of laws, including in the U.S., CERCLA and RCRA, impose liability relating to contamination by hazardous substances. Such liability may involve the costs of investigating or remediating contamination and damages to natural resources, as well as claims seeking to recover for property damage or personal injury caused by hazardous substances. Such liability may arise from conditions at formerly, as well as currently, owned or operated properties, and at properties to which hazardous substances have been sent for treatment, disposal or other handling. Liability under RCRA, CERCLA and similar state statutes is without regard to fault, and typically is joint and several, meaning that a person may be held responsible for more than its share, or even all, of the liability involved.
We may be unable to obtain, renew or maintain permits necessary for our operations, which would reduce our production, cash flows and profitability.
Numerous governmental and tribal permits and approvals are required for mining operations. The permitting rules, and the interpretations of these rules, are complex and are often subject to discretionary interpretations by regulators, all of which may make compliance more difficult or impractical. As part of this permitting process, when we apply for permits and approvals, we are required to prepare and present to governmental authorities data pertaining to the potential impact or effect that any proposed exploration for or production of coal may have upon the environment. The public, including non-governmental organizations, opposition groups and individuals, have statutory rights to comment upon and submit objections to requested permits and approvals (including modifications and renewals of certain permits and approvals). In recent years, the permitting required for coal mining has been the subject of increasingly stringent regulatory and administrative requirements and extensive litigation by environmental groups.
The costs, liabilities and requirements associated with these permitting requirements and opposition may be costly and time-consuming and may delay commencement or continuation of exploration or production and as a result, adversely affect our coal production, cash flows and profitability. Further, required permits may not be issued or renewed in a timely fashion or at all, or permits issued or renewed may be conditioned in a manner that may restrict our ability to efficiently and economically conduct our mining activities, any of which would materially reduce our production, cash flow and profitability.
The Corps regulates certain activities affecting navigable waters and waters of the U.S., including wetlands. Section 404 of the CWA requires mining companies like us to obtain Corps permits to place material in streams for the purpose of creating slurry ponds, water impoundments, refuse areas, valley fills or other mining activities. In recent years, the Section 404 permitting process has been subject to increasingly stringent regulatory and administrative requirements and a series of court challenges, which have resulted in increased costs and delays in the permitting process. Additionally, increasingly stringent requirements governing coal mining also are being considered or implemented under the Surface Mining Control and Reclamation Act, the National Pollution Discharge Elimination System permit process and various other environmental programs. Potential laws, regulations and policies could result in material adverse impacts on our operations, financial condition or cash flow, in view of the significant uncertainty surrounding each of these potential laws, regulations and policies.
Our mining operations are subject to extensive forms of taxation, which imposes significant costs on us, and future regulations and developments could increase those costs or limit our ability to produce coal competitively.
Federal, state, provincial or local governmental authorities in nearly all countries across the global coal mining industry impose various forms of taxation, including production taxes, sales-related taxes, royalties, environmental taxes, mining profits taxes and income taxes. If new legislation or regulations related to various forms of coal taxation, which increase our costs or limit our ability to compete in the areas in which we sell our coal, are adopted, our business, financial condition or results of operations could be adversely affected.
|
Peabody Energy Corporation
|
2017 Form 10-K
|
30
|
If the assumptions underlying our asset retirement obligations for reclamation and mine closures are materially inaccurate, our costs could be significantly greater than anticipated.
Our asset retirement obligations primarily consist of spending estimates for surface land reclamation and support facilities at both surface and underground mines in accordance with federal and state reclamation laws in the U.S. and Australia as defined by each mining permit. These obligations are determined for each mine using various estimates and assumptions including, among other items, estimates of disturbed acreage as determined from engineering data, estimates of future costs to reclaim the disturbed acreage and the timing of these cash flows, which is driven by the estimated economic life of the mine and the applicable reclamation laws. These cash flows are discounted using a credit-adjusted, risk-free rate. Our management and engineers periodically review these estimates. If our assumptions do not materialize as expected, actual cash expenditures and costs that we incur could be materially different than currently estimated. Moreover, regulatory changes could increase our obligation to perform reclamation, mine closing and post-closure activities. The resulting estimated asset retirement obligation could change significantly if actual amounts change significantly from our assumptions, which could have a material adverse effect on our results of operations and financial condition.
Our future success depends upon our ability to continue acquiring and developing coal reserves that are economically recoverable.
Our recoverable reserves decline as we produce coal. We have not yet applied for the permits required or developed the mines necessary to use all of our reserves. Moreover, the amount of proven and probable coal reserves described in Part I, Item 2. “Properties” involves the use of certain estimates and those estimates could be inaccurate. Information about our reserves consists of estimates based on engineering, economic and geological data assembled and analyzed by our staff. Some of the factors and assumptions which impact economically recoverable coal reserve estimates include geological conditions, historical production from the area compared with production from other producing areas, the assumed effects of regulations and taxes by governmental agencies and assumptions governing future prices and future operating costs. Actual production, revenues and expenditures with respect to our coal reserves may vary materially from estimates.
Our future success depends upon our conducting successful exploration and development activities or acquiring properties containing economically recoverable reserves. Our current strategy includes increasing our reserves through acquisitions of government and other leases and producing properties and continuing to use our existing properties and infrastructure. In certain locations, leases for oil, natural gas and coalbed methane reserves are located on, or adjacent to, some of our reserves, potentially creating conflicting interests between us and lessees of those interests. Other lessees’ rights relating to these mineral interests could prevent, delay or increase the cost of developing our coal reserves. These lessees may also seek damages from us based on claims that our coal mining operations impair their interests. Additionally, the U.S. federal government limits the amount of federal land that may be leased by any company to
75,000
acres in any one state and
150,000
acres nationwide. As of December 31, 2017, we leased a total of
55,228
acres from the federal government subject to those limitations. Many of these leases are in place for the next 20 years.
Our planned mine development projects and acquisition activities may not result in significant additional reserves, and we may not have success developing additional mines. Most of our mining operations are conducted on properties owned or leased by us. Our right to mine some of our reserves may be materially adversely affected if defects in title or boundaries exist. In order to conduct our mining operations on properties where these defects exist, we may incur unanticipated costs. In addition, in order to develop our reserves, we must also own the rights to the related surface property and receive various governmental permits. We cannot predict whether we will continue to receive the permits or appropriate land access necessary for us to operate profitably in the future. We may not be able to negotiate new leases from the government or from private parties, obtain mining contracts for properties containing additional reserves or maintain our leasehold interest in properties on which mining operations have not commenced or have not met minimum quantity or product royalty requirements. From time to time, we have experienced litigation with lessors of our coal properties and with royalty holders. In addition, from time to time, our permit applications and federal and state coal leases have been challenged, causing production delays.
To the extent that our existing sources of liquidity are not sufficient to fund our planned mine development projects and reserve acquisition activities, we may require access to capital markets, which may not be available to us or, if available, may not be available on satisfactory terms. If we are unable to fund these activities, we may not be able to maintain or increase our existing production rates and we could be forced to change our business strategy, which could have a material adverse effect on our financial condition, results of operations and cash flows.
|
Peabody Energy Corporation
|
2017 Form 10-K
|
31
|
We face numerous uncertainties in estimating our economically recoverable coal reserves and inaccuracies in our estimates could result in lower than expected revenues, higher than expected costs and decreased profitability.
Coal is economically recoverable when the price at which our coal can be sold exceeds the costs and expenses of mining and selling the coal. The costs and expenses of mining and selling the coal are determined on a mine-by-mine basis, and as a result, the price at which our coal is economically recoverable varies based on the mine. Forecasts of our future performance are based on, among other things, estimates of our recoverable coal reserves. We base our reserve information on engineering, economic and geological data assembled and analyzed by our staff and third parties, which includes various engineers and geologists. The reserve estimates as to both quantity and quality are updated from time to time to reflect production of coal from the reserves and new drilling or other data received. There are numerous uncertainties inherent in estimating quantities and qualities of coal and costs to mine recoverable reserves, including many factors beyond our control. Estimates of economically recoverable coal reserves necessarily depend upon a number of variable factors and assumptions, any one of which may, if incorrect, result in an estimate that varies considerably from actual results. These factors and assumptions include:
|
•
|
geologic and mining conditions, which may not be fully identified by available exploration data and may differ from our experience in areas we currently mine;
|
|
•
|
current and future market prices for coal, contractual arrangements, operating costs and capital expenditures;
|
|
•
|
severance and excise taxes, royalties and development and reclamation costs;
|
|
•
|
future mining technology improvements;
|
|
•
|
the effects of regulation by governmental agencies;
|
|
•
|
the ability to obtain, maintain and renew all required permits;
|
|
•
|
employee health and safety; and
|
|
•
|
historical production from the area compared with production from other producing areas
|
As a result, actual coal tonnage recovered from identified reserve areas or properties and revenues and expenditures with respect to our reserves may vary materially from estimates. These estimates thus may not accurately reflect our actual reserves. Any material inaccuracy in our estimates related to our reserves could result in lower than expected revenues, higher than expected costs or decreased profitability which could materially and adversely affect our business, results of operations, financial position and cash flows.
Our global operations increase our exposure to risks unique to international mining and trading operations.
Our international platform increases our exposure to country risks, international regulatory requirements and the effects of changes in currency exchange rates. Some of our international activities are in developing countries where the economic strength, business practices and counterparty reputations may not be as well developed as in our U.S. or Australian operations. We are exposed to various business and political risks, including political instability, heightened levels of corruption or fraud in certain markets, the potential for expropriation of assets, costs associated with the repatriation of earnings and the potential for unexpected changes in regulatory requirements. Despite our efforts to perform due diligence, screening, training and auditing of internal and external business agents, vendors, partners and customers to mitigate these risks, our results of operations, financial position or cash flows could be adversely affected by these activities.
Joint ventures, partnerships or non-managed operations may not be successful and may not comply with our operating standards.
We participate in several joint venture and partnership arrangements and may enter into others, all of which necessarily involve risk. Whether or not we hold majority interests or maintain operational control in our joint ventures, our partners may, among other things, (1) have economic or business interests or goals that are inconsistent with, or opposed to, ours; (2) seek to block actions that we believe are in our or the joint venture’s best interests; or (3) be unable or unwilling to fulfill their obligations under the joint venture or other agreements, such as contributing capital, each of which may adversely impact our results of operations and our liquidity or impair our ability to recover our investments.
Where our joint ventures are jointly controlled or not managed by us, we may provide expertise and advice but have limited control over compliance with our operational standards. We also utilize contractors across our mining platform, and may be similarly limited in our ability to control their operational practices. Failure by non-controlled joint venture partners or contractors to adhere to operational standards that are equivalent to ours could unfavorably affect operating costs and productivity and adversely impact our results of operations and reputation.
|
Peabody Energy Corporation
|
2017 Form 10-K
|
32
|
We may undertake further repositioning plans that would require additional charges.
As a result of our continuing review of our business or changing demand, we may choose to further reduce our workforce in the future. These actions may result in further restructuring charges, cash expenditures and the consumption of management resources, any of which could cause our operating results to decline and may fail to yield the expected benefits.
We could be exposed to significant liability, reputational harm, loss of revenue, increased costs or other risks if we sustain cyber attacks or other security breaches that disrupt our operations or result in the dissemination of proprietary or confidential information about us, our customers or other third-parties.
We have implemented security protocols and systems with the intent of maintaining the physical security of our operations and protecting our and our counterparties’ confidential information and information related to identifiable individuals against unauthorized access. Despite such efforts, we may be subject to security breaches which could result in unauthorized access to our facilities or the information we are trying to protect. Unauthorized physical access to one of our facilities or electronic access to our information systems could result in, among other things, unfavorable publicity, litigation by affected parties, damage to sources of competitive advantage, disruptions to our operations, loss of customers, financial obligations for damages related to the theft or misuse of such information and costs to remediate such security vulnerabilities, any of which could have a substantial impact on our results of operations, financial condition or cash flows.
Our expenditures for postretirement benefit and pension obligations could be materially higher than we have predicted if our underlying assumptions prove to be incorrect.
We provide postretirement health and life insurance benefits to eligible employees. Our total accumulated postretirement benefit obligation related to such benefits was a liability of
$783.3 million
as of December 31, 2017, of which
$53.3 million
was classified as a current liability. Certain of our U.S. subsidiaries also sponsor defined benefit pension plans. Net pension liabilities were
$98.0 million
as of December 31, 2017, of which
none
was classified a current liability.
These liabilities are actuarially determined and we use various actuarial assumptions, including the discount rate, future cost trends, and rates of return on plan assets to estimate the costs and obligations for these items. Our discount rate is determined by utilizing a hypothetical bond portfolio model which approximates the future cash flows necessary to service our liabilities. A decrease in the discount rate used to determine our postretirement benefit and defined benefit pension obligations could result in an increase in the valuation of these obligations, thereby increasing the cost in subsequent fiscal years. We have made assumptions related to future trends for medical care costs in the estimates of retiree health care obligations. Our medical trend assumption is developed by annually examining the historical trend of our cost per claim data. If our assumptions do not materialize as expected, actual cash expenditures and costs that we incur could differ materially from our current estimates. Moreover, regulatory changes or changes in healthcare benefits provided by the government could increase our obligation to satisfy these or additional obligations. Additionally, our reported defined benefit pension funding status may be affected, and we may be required to increase employer contributions, due to increases in our defined benefit pension obligation or poor financial performance in asset markets in future years.
Our defined benefit pension plans are subject to the provisions of the Employee Retirement Income Security Act of 1974, as amended (ERISA). It is implicit in our underlying assumptions that those plans continue to operate in the normal course of business. However, the Pension Benefit Guaranty Corporation (PBGC) may terminate our plans under certain circumstances pursuant to ERISA, including in the event that the PBGC concludes that its risk may increase unreasonably if such plans continue to operate based on its assessment of the plans’ funded status, our financial condition or other factors. Termination of the plans would require us to provide immediate funding or other financial assurance to the PBGC for all or a substantial portion of the underfunded amounts, as determined by the PBGC based on its own assumptions. Those assumptions may differ from our own. Any of those consequences could have a material adverse effect on our results of operations, financial conditions or available liquidity.
Concerns about the environmental impacts of coal combustion, including perceived impacts on global climate issues, are resulting in increased regulation of coal combustion in many jurisdictions, unfavorable lending policies by government-backed lending institutions and development banks toward the financing of new overseas coal-fueled power plants and divestment efforts affecting the investment community, which could significantly affect demand for our products or our securities.
Global climate issues continue to attract public and scientific attention. Numerous reports, such as the Fourth and the Fifth Assessment Report of the Intergovernmental Panel on Climate Change, have also engendered concern about the impacts of human activity, especially fossil fuel combustion, on global climate issues. In turn, increasing government attention is being paid to global climate issues and to emissions of what are commonly referred to as greenhouse gases, including emissions of carbon dioxide from coal combustion by power plants.
|
Peabody Energy Corporation
|
2017 Form 10-K
|
33
|
Enactment of laws or passage of regulations regarding emissions from the combustion of coal by the U.S., some of its states or other countries, or other actions to limit such emissions, could result in electricity generators switching from coal to other fuel sources or coal-fueled power plant closures. Further, policies limiting available financing for the development of new coal-fueled power plants could adversely impact the global demand for coal. The potential financial impact on us of future laws, regulations or other policies will depend upon the degree to which any such laws or regulations force electricity generators to diminish their reliance on coal as a fuel source. That, in turn, will depend on a number of factors, including the specific requirements imposed by any such laws, regulations or other policies, the time periods over which those laws, regulations or other policies would be phased in, the state of commercial development and deployment of CCUS technologies and the alternative markets for coal. From time to time, we attempt to analyze the potential impact on the Company of as-yet-unadopted potential laws, regulations and policies. Such analyses require that we make significant assumptions as to the specific provisions of such potential laws, regulations and policies. These analyses sometimes show that certain potential laws, regulations and policies, if implemented in the manner assumed by the analyses, could result in material adverse impacts on our operations, financial condition or cash flow, in view of the significant uncertainty surrounding each of these potential laws, regulations and policies. We do not believe that such analyses reasonably predict the quantitative impact that future laws, regulations or other policies may have on our results of operations, financial condition or cash flows.
There have also been efforts in recent years affecting the investment community, including investment advisors, sovereign wealth funds, public pension funds, universities and other groups, promoting the divestment of fossil fuel equities and also pressuring lenders to limit funding to companies engaged in the extraction of fossil fuel reserves. The impact of such efforts may adversely affect the demand for and price of securities issued by us and impact our access to the capital and financial markets.
Risks Related to Our Indebtedness and Capital Structure
Our financial performance could be adversely affected by our indebtedness.
As of December 31, 2017, we had approximately
$1.4 billion
of indebtedness outstanding, excluding capital leases, on a consolidated basis.
The degree to which we are leveraged could have important consequences, including, but not limited to:
|
•
|
making it more difficult for us to pay interest and satisfy our debt obligations;
|
|
•
|
increasing the cost of borrowing under our credit facilities;
|
|
•
|
increasing our vulnerability to general adverse economic and industry conditions;
|
|
•
|
requiring the dedication of a substantial portion of our cash flow from operations to the payment of principal and interest on our indebtedness, thereby reducing the availability of our cash flow to fund working capital, capital expenditures, business development or other general corporate requirements;
|
|
•
|
limiting our ability to obtain additional financing to fund future working capital, capital expenditures, business development or other general corporate requirements;
|
|
•
|
making it more difficult to obtain surety bonds, letters of credit, bank guarantees or other financing, particularly during periods in which credit markets are weak;
|
|
•
|
limiting our flexibility in planning for, or reacting to, changes in our business and in the coal industry;
|
|
•
|
causing a decline in our credit ratings; and
|
|
•
|
placing us at a competitive disadvantage compared to less leveraged competitors.
|
In addition, our indebtedness subjects us to certain restrictive covenants. Failure by us to comply with these covenants could result in an event of default that, if not cured or waived, could have a material adverse effect on us and result in amounts outstanding thereunder to be immediately due and payable.
Any downgrade in our credit ratings could result in, among other matters, additional required financial assurances related to our reclamation bonding requirements, a requirement to post additional collateral on derivative trading instruments that we may enter into, the loss of trading counterparties for corporate hedging and trading and brokerage activities or an increase in the cost of, or a limit on our access to, various forms of credit used in operating our business.
|
Peabody Energy Corporation
|
2017 Form 10-K
|
34
|
If our cash flows and capital resources are insufficient to fund our debt service obligations, we may be forced to sell assets, seek additional capital or seek to restructure or refinance our indebtedness. These alternative measures may not be successful and may not permit us to meet our scheduled debt service obligations. In the absence of sufficient operating results and resources, we could face substantial liquidity problems and might be required to sell material assets or operations to attempt to meet our debt service and other obligations. Our indebtedness restricts our ability to sell assets outside of the ordinary course of business and restricts the use of the proceeds from any such sales. We may not be able to complete those sales or obtain the proceeds which we could realize from them, and these proceeds may not be adequate to meet any debt service obligations then due. In addition, the terms of our indebtedness provide that if we cannot meet our debt service obligations, the lenders could foreclose against the assets securing their borrowings and we could be forced into bankruptcy or liquidation.
Despite our and our subsidiaries’ indebtedness, we may still be able to incur substantially more debt, including secured debt. This could further increase the risks associated with our indebtedness.
We and our subsidiaries may be able to incur substantial additional indebtedness in the future, including additional secured debt. Although covenants under the indenture governing our senior secured notes and the agreements governing our other post-emergence indebtedness, including our senior secured term loan facility and capital leases limit our ability to incur additional indebtedness, these restrictions are subject to a number of qualifications and exceptions and, under certain circumstances, debt incurred in compliance with these restrictions can be substantial. In addition, the indenture governing the senior secured notes and the agreements governing our other indebtedness do not limit us from incurring obligations that do not constitute indebtedness as defined therein.
We may not be able to generate sufficient cash to service all of our indebtedness or other obligations.
Our ability to make scheduled payments on, or refinance our debt obligations, depends on our financial condition and operating performance, which are subject to prevailing economic, industry, and competitive conditions and to certain financial, business, legislative, regulatory, and other factors beyond our control. We may be unable to maintain a level of cash flow from operating activities sufficient to permit us to pay the principal, premium, if any, and interest on our indebtedness or other obligations.
The terms of our indenture governing our senior secured notes and the agreements and instruments governing our other post-emergence indebtedness impose restrictions that may limit our operating and financial flexibility.
The indenture governing our senior secured notes and the agreements and instruments governing our other post-emergence indebtedness will contain certain restrictions and covenants which restrict our ability to incur liens and/or debt or provide guarantees in respect of obligations of any other person, which could adversely affect our ability to operate our business, as well as significantly affect our liquidity, and therefore could adversely affect our results of operations. Our senior secured term loan facility also contains a mandatory prepayment provision providing that certain amounts of excess cash flow (as defined in the agreements governing the facility) must be utilized to make payments on the outstanding balance under that facility.
These covenants restrict, among other things, our ability to:
|
•
|
incur additional indebtedness;
|
|
•
|
pay dividends on or make distributions in respect of stock or make certain other restricted payments or investments;
|
|
•
|
enter into agreements that restrict distributions from certain subsidiaries;
|
|
•
|
sell or otherwise dispose of assets;
|
|
•
|
incur capital expenditures beyond a specified amount;
|
|
•
|
enter into transactions with affiliates;
|
|
•
|
create or incur liens;
|
|
•
|
merge, consolidate or sell all or substantially all of our assets; and
|
|
•
|
place restrictions on the ability of subsidiaries to pay dividends or make other payments to us.
|
Our ability to comply with these covenants may be affected by events beyond our control and we may need to refinance existing debt in the future. A breach of any of these covenants together with the expiration of any cure period, if applicable, could result in a default under our senior secured notes. If any such default occurs, subject to applicable grace periods, the holder of our senior secured notes may elect to declare all outstanding senior secured notes, together with accrued interest and other amounts payable thereunder, to be immediately due and payable. If the obligations under our senior secured notes were to be accelerated, our financial resources may be insufficient to repay the notes and any other indebtedness becoming due in full.
|
Peabody Energy Corporation
|
2017 Form 10-K
|
35
|
In addition, if we breach the covenants in the indentures governing the senior secured notes and do not cure such breach within the applicable time periods specified therein, we would cause an event of default under the indenture governing the senior secured notes and a cross-default to certain of our other post-emergence indebtedness and the lenders or holders thereunder could accelerate their obligations. If our indebtedness is accelerated, we may not be able to repay our indebtedness or borrow sufficient funds to refinance it. Even if we are able to obtain new financing, it may not be on commercially reasonable terms or on terms that are acceptable to us. If our indebtedness is in default for any reason, our business, financial condition and results of operations could be materially and adversely affected. In addition, complying with these covenants may make it more difficult for us to successfully execute our business strategy and compete against companies who are not subject to such restrictions.
Risks Related to Ownership of Our Securities
The price of our securities may be volatile.
The price of our common stock (“Common Stock”) may fluctuate due to a variety of market and industry factors that may materially reduce the market price of our Common Stock regardless of our operating performance, including, among others:
|
•
|
actual or anticipated fluctuations in our quarterly and annual results and those of other public companies in our industry;
|
|
•
|
industry cycles and trends;
|
|
•
|
mergers and strategic alliances in the coal industry;
|
|
•
|
changes in government regulation;
|
|
•
|
potential or actual military conflicts or acts of terrorism;
|
|
•
|
the failure of securities analysts to publish research about us or to accurately predict the results we actually achieve;
|
|
•
|
the limited trading history of our Common Stock;
|
|
•
|
changes in accounting principles;
|
|
•
|
announcements concerning us or our competitors; and
|
|
•
|
the general state of the securities market.
|
In addition, the stock market in general has experienced significant volatility that often has been unrelated to the operating performance of companies whose shares are traded. These market fluctuations could adversely affect the trading price of our Common Stock, regardless of our actual operating performance. As a result of all of these factors, investors in our Common Stock may not be able to resell their stock at or above the price they paid or at all. Further, we could be the subject of securities class action litigation due to any such stock price volatility, which could divert management’s attention and have a material adverse effect on our results of operation.
Our Common Stock is subject to dilution and may be subject to further dilution in the future.
Our Common Stock is subject to dilution from our long-term incentive plan. In addition, in the future, we may issue equity securities in connection with future investments, acquisitions or capital raising transactions. Such issuances or grants could constitute a significant portion of the then-outstanding Common Stock, which may result in significant dilution in ownership of Common Stock.
There may be circumstances in which the interests of a significant stockholder could be in conflict with other stockholders’ interests.
Circumstances may arise in which a significant stockholder may have an interest in exerting influence to pursue or prevent acquisitions, divestitures or other transactions, including the issuance of additional shares or debt, that, in its judgment, could enhance its investment in us or another company in which it invests. Such transactions might adversely affect us or other holders of our Common Stock.
|
Peabody Energy Corporation
|
2017 Form 10-K
|
36
|
The payment of dividends on our stock or repurchases of our stock is dependent on a number of factors, and future payments and repurchases cannot be assured.
Restrictive covenants in our Credit Facility and in the indenture governing our senior secured notes limit our ability to pay cash dividends and repurchase shares. Other debt instruments to which we or our subsidiaries are, or may be, a party, also contain restrictive covenants that may limit our ability to pay dividends or for us to receive dividends from our subsidiaries, any of which may negatively impact the trading price of the Common Stock. In addition, holders of capital stock will only be entitled to receive such cash dividends as our Board of Directors may declare out of funds legally available for such payments, and our Board of Directors may only authorize us to repurchase shares of our capital stock with funds legally available for such repurchases. The payment of future cash dividends and future repurchases will depend upon our earnings, economic conditions, liquidity and capital requirements, and other factors, including our debt leverage. Accordingly, we cannot make any assurance that future dividends will be paid or future repurchases will be made.
Other Business Risks
We may not be able to fully utilize our deferred tax assets.
We are subject to income and other taxes in the U.S. and numerous foreign jurisdictions, most significantly Australia. As of December 31, 2017, we had gross deferred income tax assets, including net operating loss carryforwards, and liabilities of
$2,981.3 million
and
$468.6 million
, respectively, as described further in Note 11. “Income Taxes” to the accompanying consolidated financial statements. At that date, we also had recorded a valuation allowance of
$2,432.5 million
, substantially comprised of a full valuation allowance against our net deferred tax asset positions in the U.S. and Australia driven by recent cumulative book losses, as determined by considering all sources of available income (including items classified as discontinued operations or recorded directly to “Accumulated other comprehensive income (loss)”), which limited our ability to look to future taxable income in assessing the likelihood of realizing those assets.
Although we may be able to utilize some or all of those deferred tax assets in the future if we have income of the appropriate character in those jurisdictions (subject to loss carryforward and tax credit expiry, in certain cases), there is no assurance that we will be able to do so. Further, we are presently unable to record tax benefits on future losses in the U.S. and Australia until such time as sufficient income is generated by our operations in those jurisdictions to support the realization of the related net deferred tax asset positions. Our results of operations, financial condition and cash flows may adversely be affected in future periods by these limitations.
Divestitures and acquisitions are a potentially important part of our long-term strategy, subject to our investment criteria, and involve a number of risks, any of which could cause us not to realize the anticipated benefits.
We may engage in divestiture or acquisition activity based on our set of investment criteria to produce outcomes that increase shareholder value. As it relates to divestitures, we may dispose of certain assets within our portfolio if we determine that the price received is more beneficial to us than keeping the assets within our portfolio. Conversely, acquisitions are a potentially important part of our long-term strategy, and we may pursue acquisition opportunities. If we fail to accurately estimate the future results and value of a divested or acquired business and the related risk associated with such a transaction, or are unable to successfully integrate the businesses or properties we acquire, our business, financial condition or results of operations could be negatively affected. Moreover, any transactions we pursue could materially impact our liquidity and an acquisition could increase capital resource needs and may require us to incur indebtedness, seek equity capital or both. We may not be able to satisfy these liquidity and capital resource needs on acceptable terms or at all. In addition, future acquisitions could result in our assuming significant long-term liabilities relative to the value of the acquisitions.
Our certificate of incorporation and by-laws include provisions that may discourage a takeover attempt.
Provisions contained in our certificate of incorporation and by-laws and Delaware law could make it more difficult for a third-party to acquire us, even if doing so might be beneficial to our stockholders. Provisions of our by-laws and certificate of incorporation impose various procedural and other requirements that could make it more difficult for stockholders to effect certain corporate actions. These provisions could limit the price that certain investors might be willing to pay in the future for shares of our Common Stock and may have the effect of delaying or preventing a change in control.
Diversity in interpretation and application of accounting literature in the mining industry may impact our reported financial results.
The mining industry has limited industry-specific accounting literature and, as a result, we understand diversity in practice exists in the interpretation and application of accounting literature to mining-specific issues. As diversity in mining industry accounting is addressed, we may need to restate our reported results if the resulting interpretations differ from our current accounting practices. Refer to Note 1. “Summary of Significant Accounting Policies” to the accompanying consolidated financial statements for a summary of our significant accounting policies.
|
Peabody Energy Corporation
|
2017 Form 10-K
|
37
|
Item 1B.
Unresolved Staff Comments.
None.
Item 2.
Properties.
Coal Reserves
We controlled an estimated
5.2
billion tons of proven and probable coal reserves as of
December 31, 2017
. An estimated
4.7
billion tons of our attributable proven and probable coal reserves are in the U.S., with the remainder in Australia. Approximately 51% of our Australian proven and probable coal reserves, or 282 million tons, are metallurgical coal, comprised of approximately 151 million and 131 million tons of coking coal and LV PCI coals, respectively. The remainder of our Australian coal reserves consists of thermal coal. We own approximately 30% of these reserves and leased property comprises the remaining 70%. Approximately 63% of our reserves, or 3.3 billion tons, are compliance coal and 37% are non-compliance coal (assuming application of the U.S. industry standard definition of compliance coal to all of our reserves). Compliance coal is defined by Phase II of the CAA as coal having sulfur dioxide content of 1.2 pounds or less per million Btu. Electricity generators are able to use coal that exceeds these specifications by using emissions reduction technology, using emission allowance credits or blending higher sulfur coal with lower sulfur coal.
Below is a table summarizing the locations and proven and probable coal reserves of our major mining segments.
|
Proven and Probable
Reserves as of
December 31, 2017
(1)
|
|||||||||||
|
|
|
Owned
Tons
|
Leased
Tons
|
Total
Tons
|
|||||||
|
Mining Segment
|
Locations
|
||||||||||
|
|
|
(Tons in millions)
|
|||||||||
|
Powder River Basin Mining
|
Wyoming
|
—
|
|
2,568
|
|
2,568
|
|
||||
|
Midwestern U.S. Mining
|
Illinois, Indiana and Kentucky
|
1,386
|
|
289
|
|
1,675
|
|
||||
|
Western U.S. Mining
|
Arizona, New Mexico and Colorado
|
161
|
|
285
|
|
446
|
|
||||
|
Total United States
|
|
1,547
|
|
3,142
|
|
4,689
|
|
||||
|
Australian Metallurgical Mining
|
Queensland and New South Wales
|
—
|
|
256
|
|
256
|
|
||||
|
Australian Thermal Mining
|
New South Wales
|
—
|
|
291
|
|
291
|
|
||||
|
Total Australia
|
|
—
|
|
547
|
|
547
|
|
||||
|
Total Proven and Probable Coal Reserves
|
|
1,547
|
|
3,689
|
|
5,236
|
|
||||
|
(1)
|
Estimated proven and probable coal reserves have been adjusted to account for estimated process dilutions and losses during mining and processing involved in producing a saleable coal product.
|
Reserves are defined by SEC Industry Guide 7 as that part of a mineral deposit which could be economically and legally extracted or produced at the time of the reserve determination. Proven and probable coal reserves are defined by SEC Industry Guide 7 as follows:
|
•
|
Proven (Measured) Reserves
— Reserves for which (a) quantity is computed from dimensions revealed in outcrops, trenches, workings or drill holes; grade and/or quality are computed from the results of detailed sampling and (b) the sites for inspection, sampling and measurement are spaced so closely and the geologic character is so well defined that size, shape, depth and mineral content of reserves are well-established.
|
|
•
|
Probable (Indicated) Reserves
— Reserves for which quantity and grade and/or quality are computed from information similar to that used for proven (measured) reserves, but the sites for inspection, sampling and measurement are farther apart or are otherwise less adequately spaced. The degree of assurance, although lower than that for proven (measured) reserves, is high enough to assume continuity between points of observation.
|
Our estimates of proven and probable coal reserves are established within these guidelines. Estimates within the proven category have the highest degree of assurance, while estimates within the probable category have only a moderate degree of geologic assurance. Further exploration is necessary to place probable reserves into the proven reserve category. Our active properties generally have a much higher degree of reliability because of increased drilling density.
|
Peabody Energy Corporation
|
2017 Form 10-K
|
38
|
Our guidelines for geologic assurance surrounding estimated proven and probable U.S. and Australian coal reserves generally follow the respective industry-accepted practices of those countries. In the U.S., our estimated proven coal reserves lie within one-quarter mile of a valid point of measure or point of observation, such as exploratory drill holes or previously mined areas, while our estimated probable coal reserves may lie more than one-quarter mile, but less than three-quarters of a mile, from a point of thickness measurement. In Australia, our estimated proven coal reserves generally lie within 250 meters of a point of observation, while our estimated probable coal reserves may lie more than 250 meters, but less than 500 meters, from a point of observation. For some of our Australian coal reserves, the distance between points of observation is determined by a geostatistical study.
The preparation of our coal reserve estimates is completed in accordance with our prescribed internal control procedures, which include verification of input data into a coal reserve forecasting and economic evaluation software system, as well as multi-functional management review. Our reserve estimates are prepared by our staff of experienced geologists and engineers. Our corporate Geological Services group is responsible for tracking changes in reserve estimates, supervising our other geologists and coordinating periodic third-party reviews of our reserve estimates by qualified mining consultants.
Our coal reserve estimates are predicated on information obtained from an extensive historical database of drill holes and information obtained from our ongoing drilling program. We compile data from individual drill holes in a computerized drill-hole database from which the depth, thickness and, where core drilling is used, the quality of the coal is determined. The density of a drill pattern determines whether the related coal reserves will be classified as proven or probable. Our coal reserve estimates are then input into our computerized land management system, which overlays that geological data with data on ownership or control of the mineral and surface interests to determine the extent of our attributable coal reserves in a given area. Our land management system contains reserve information, including the quantity and quality (where available) of reserves, as well as production data, surface and coal ownership, lease payments and other information relating to our coal reserves and land holdings. We periodically update our coal reserve estimates to reflect production of coal from those reserves and new drilling or other data received. Accordingly, our coal reserve estimates will change from time to time to reflect the effects of our mining activities, analysis of new engineering and geological data, changes in coal reserve holdings, modification of mining methods and other factors.
Our estimate of the economic recoverability of our coal reserves is generally based upon a comparison of unassigned reserves to assigned reserves currently in production in the same geologic setting to determine an estimated mining cost. These estimated mining costs are compared to expected market prices for the quality of coal expected to be mined and take into consideration typical contractual sales agreements for the region and product. Where possible, we also review coal production by competitors in similar mining areas. Only coal reserves expected to be mined economically are included in our reserve estimates. Finally, our coal reserve estimates consider dilutions and losses during mining and processing for recoverability factors to estimate a saleable product. Factors impacting our assessment include geological conditions, production expectations for certain areas, the effects of regulation and taxes by governmental agencies, future price and operating cost assumptions and adverse changes in market conditions and mine closure activities. The estimates are also impacted by decreases resulting from current year production and increases resulting from information obtained from additional drilling. Our estimation as of December 31, 2017 reflected a net reduction compared to the prior year of 407 million tons of coal reserves. The decrease was driven by changes to our estimates of economic recoverability, the modification and rejection of certain leases, mine plan changes and the sale of non-strategic coal reserves, partially offset by acquisitions and new drilling with the addition of 55 million production tons.
We periodically engage independent mining and geological consultants and consider their input regarding the procedures used by us to prepare our internal estimates of coal reserves, selected property reserve estimates and tabulation of reserve groups according to standard classifications of reliability. Our December 31, 2017 reserve estimates for the Indiana region in the U.S. were audited by John T. Boyd Company, an independent mining and geological consulting firm, which included a review of the data, procedures and parameters employed by us in developing our Indiana reserve estimates. The audit found that (1) the reserve estimates we prepared for the region were properly calculated in accordance with our stated procedures, (2) the procedures used by us are reasonable and comply with accepted industry standards and (3) our Indiana reserve estimates, as a whole, provided a reasonable estimate of available controlled mineralization that can be expected to be legally and economically extractable at the time of determination. We plan to complete additional audits of our reserve estimates on a cycled basis for each of our major operating regions.
With respect to the accuracy of our coal reserve estimates, our experience is that recovered reserves are within plus or minus 10% of our proven and probable estimates, on average, and our probable estimates are generally within the same statistical degree of accuracy when the necessary drilling is completed to move reserves from the probable to the proven classification.
|
Peabody Energy Corporation
|
2017 Form 10-K
|
39
|
For each mine or future mine, we employ a market-driven, risk adjusted capital allocation process to guide long-term mine planning of active operations and development projects for economically mineable coal. We refer to this process as Life-of-Mine (LOM) planning. The LOM plan projects, among other things, annual quantities and qualities for each coal product. The saleable product mix for a mine may include multiple thermal and metallurgical products with different targeted qualities. The expected volumes for each mine and product, as well as annual pricing forecasts for each product, developed as described below, and related cost forecasts, developed as described below, are then evaluated to determine the economically recoverable coal in the LOM plan.
Pricing
The pricing information used to establish our reserves includes internal, proprietary price forecasts and existing contract economics, in each case on a mine-by-mine and product-by-product basis. In general, our price forecasts are based on a thorough analytical process utilizing detailed supply and demand models, global economic indicators, projected foreign exchange rates, analyses of price relationships among various commodities, competing fuels analyses, projected steel demand, analyses of supplier costs and other variables. Price forecasts, supply and demand models and other key assumptions and analyses are stress tested against independent third-party research not commissioned by us to confirm the conclusions reached through our analytical processes, and our price forecasts fall within the ranges of the projections included in this third-party research. The development of the analyses, price forecasts, supply and demand models and related assumptions are subject to multiple levels of management review.
Below is a description of some of the specific factors that we evaluate in developing our price forecasts for thermal and metallurgical coal products on a mine-by-mine and product-by-product basis. Differences between the assumptions and analyses included in our price forecasts and realized factors could cause actual pricing to differ from our forecasts.
Thermal.
Several factors can influence thermal coal supply and demand and pricing. Demand is sensitive to total electric power generation volumes, which are determined in part by the impact of weather on heating and cooling demand, inter-fuel competition in the electric power generation mix, changes in capacity (additions and retirements), inter-basin or inter-country coal competition, coal stockpiles and policy and regulations. Supply considerations impacting pricing include reserve positions, mining methods, strip ratios, production costs and capacity and the cost of new supply (greenfield developments or extensions at existing mines).
In the United States, natural gas is the most significant substitute for thermal coal for electricity generation and can be one of the largest drivers of shifts in supply and demand and pricing. The competitiveness of natural gas as a generation fuel source has been strengthened by accelerated growth in domestic natural gas production over the last five years and comparatively low natural gas prices versus historic levels. The build out of renewable generation and subsidized power can also be a key driver of power market pricing and hence coal prices.
Internationally, thermal coal-fueled generation also competes with alternative forms of electric generation. The competiveness and availability of generation fueled by natural gas, oil, nuclear, hydro, wind, solar and biomass vary by country and region and can have a meaningful impact on coal pricing. Policy and regulations, which vary from country to country, can also influence prices. In addition, seaborne thermal coal import demand can be significantly impacted by the availability of indigenous coal production, particularly in the two leading coal import countries, China and India, and the competitiveness of seaborne supply from leading thermal coal exporting countries, including Indonesia, Australia, Russia, Colombia and South Africa.
Metallurgical.
Several factors can influence metallurgical coal supply and demand and pricing. Demand is impacted by economic conditions and demand for steel, and is also impacted by competing technologies used to make steel, some of which do not use coal as a manufacturing input. Competition from other types of coal is also a key price consideration and can be impacted by coal quality and characteristics, delivered energy cost (including transportation costs), customer service and support and reliability of supply.
Seaborne metallurgical coal import demand can also be significantly impacted by the availability of indigenous coal production, particularly in metallurgical coal import countries such as China and India, among others, as well as country-specific policies restricting or promoting domestic supply. The competitiveness of seaborne metallurgical coal supply from coal exporting countries, including Australia, the United States, Russia, Canada and Mongolia, among others, is also an important price consideration.
In addition to the factors noted above, the prices which may be obtained at each individual mine or future mine can be impacted by factors such as (i) the mine’s location, which impacts the total delivered energy costs to its customers, (ii) quality characteristics, particularly if they are unique relative to competing mines, (iii) assumed transportation costs and (iv) other mine costs that are contractually passed on to customers in certain commercial relationships.
|
Peabody Energy Corporation
|
2017 Form 10-K
|
40
|
Costs
The cost estimates we use to establish our reserves are generally estimated according to internal processes that project future costs based on historic costs and expected future trends. The estimated costs normally include mining, processing, transportation, royalty, add-on tax and other mining-related costs. Our estimated mining and processing costs reflect projected changes in prices of consumable commodities (mainly diesel fuel, explosives and steel), labor costs, geological and mining conditions, targeted product qualities and other mining-related costs. Estimates for other sales-related costs (mainly transportation, royalty and add-on tax) are based on contractual prices or fixed rates. Specific factors that may impact the cost at our various operations include:
|
•
|
Geological settings
. The geological characteristics of each mine are among the most important factors that determine the mining cost. Our geology department conducts the exploration program and provides geological models for the LOM process. Coal seam depth, thickness, dipping angle, partings and quality constrain the available mining methods and size of operations. Shallow coal is typically mined by surface mining methods by which the primary cost is overburden removal. Deep coal is typically mined by underground mining methods where the primary costs include coal extraction, conveyance and roof control.
|
|
•
|
Scale of operations and the equipment sizes
. For surface mines, our dragline systems generally have a lower unit cost than truck-and-shovel systems for overburden removal. The longwall operations generally are more cost effective than room-and-pillar operations for underground mines.
|
|
•
|
Commodity prices
. For surface mines, the costs of diesel fuel and explosives are major components of the total mining cost. For underground mines, the steel used for roof bolts represents a significant cost. Forecasted commodity prices are used to project those costs in the financial models we use to establish our reserves.
|
|
•
|
Target product quality
. By targeting a premium quality product, our mining and processing processes may experience more coal losses. By lowering product quality the coal losses can be minimized and therefore a lower cost per ton can be achieved. In our mine plans, the product qualities are estimated to correspond to existing contracts and forecasted market demands.
|
|
•
|
Transportation costs
. Transportation costs vary by region. Most of our U.S. operations sell coal at mine loadouts. Therefore, no transportation expenses are included in our U.S. cost estimates. Our Australian operations sell coal at designated ports or local power plants. The estimated costs for our Australian operations include rail transportation and related fees at ports.
|
|
•
|
Royalty costs
. Our royalty costs are based upon contractual agreements for the coal leased from governments or private owners. The royalty rates for coal leased from governments differ by country and, in some cases, by mining method. Estimated add-on taxes and other sales-related costs are determined according to government regulations or historic costs.
|
|
•
|
Exchange rates
. Costs related to our Australian production are predominantly denominated in Australian dollars, while the Australian coal that we export is sold in U.S. dollars. As a result, Australian/U.S. dollar exchange rates impact the U.S. dollar cost of Australian production.
|
Based on our evaluations of the estimated prices for our coal, and costs and expenses of mining and selling our coal, which evaluations are performed on a mine-by-mine and product-by-product basis, we have concluded our reserves were economically recoverable as of December 31, 2017.
We have numerous U.S. federal coal leases that are administered by the U.S. Department of the Interior under the Federal Coal Leasing Amendments Act of 1976. These leases cover our principal reserves in the Powder River Basin and other reserves in Colorado and New Mexico. Each of these leases continues indefinitely, provided there is diligent development of the property and continued operation of the related mine or mines. The U.S. Bureau of Land Management (BLM) has asserted the right to adjust the terms and conditions of these leases, including rent and royalties, after the first 20 years of their term and at 10-year intervals thereafter. Annual rents on surface land under our federal coal leases are now set at $3.00 per acre. Production royalties on federal leases are set by statute at 12.5% of the gross proceeds of coal mined and sold for surface-mined coal and 8% for underground-mined coal. The U.S. federal government limits by statute the amount of federal land that may be leased by any company and its affiliates at any time to
75,000
acres in any one state and
150,000
acres nationwide. As of
December 31, 2017
, we leased
6,407
acres of federal land in
Colorado
,
640
acres in
New Mexico
and
48,181
acres in
Wyoming
, for a total of
55,228
acres nationwide subject to those limitations.
Similar provisions govern three coal leases with the Navajo and Hopi Indian tribes. These leases cover coal contained in
64,783
acres of land in northern Arizona lying within the boundaries of the Navajo Nation and Hopi Indian reservations. We also lease coal-mining properties from various state governments in the U.S.
|
Peabody Energy Corporation
|
2017 Form 10-K
|
41
|
Private U.S. coal leases normally have terms of between 10 and 20 years and usually give us the right to renew the lease for a stated period or to maintain the lease in force until the exhaustion of mineable and merchantable coal contained on the relevant site. These private U.S. leases provide for royalties to be paid to the lessor either as a fixed amount per ton or as a percentage of the sales price. Many U.S. leases also require payment of a lease bonus or minimum royalty, payable either at the time of execution of the lease or in periodic installments. The terms of our private U.S. leases are normally extended by active production at or near the end of the lease term. U.S. leases containing undeveloped reserves may expire or these leases may be renewed periodically.
Mining and exploration in Australia is generally carried out under leases or licenses granted by state governments. Mining leases are typically for an initial term of up to 21 years (but which may be renewed) and contain conditions relating to such matters as minimum annual expenditures, restoration and rehabilitation. Royalties are paid to the state government as a percentage of the sales price. Generally landowners do not own the mineral rights or have the ability to grant rights to mine those minerals. These rights are retained by state governments. Compensation is payable to landowners for loss of access to the land, and the amount of compensation can be determined by agreement or arbitration. Surface rights are typically acquired directly from landowners and, in the absence of agreement, there is an arbitration provision in the mining law.
Consistent with industry practice, we conduct only limited investigation of title to our coal properties prior to leasing. Title to lands and reserves of the lessors or grantors and the boundaries of our leased properties are not completely verified until we prepare to mine those reserves.
With a portfolio of approximately
5.2
billion tons, we believe that we have sufficient coal reserves to replace capacity from depleting mines for the foreseeable future and that our significant coal reserve holdings are one of our competitive strengths.
|
Peabody Energy Corporation
|
2017 Form 10-K
|
42
|
The following charts provide a summary, by mining complex, of production (in descending order by mining segment) for the years ended
December 31, 2017
,
2016
and
2015
, tonnage of coal reserves that are assigned to our active operating mines, our property interest in those reserves and other characteristics of the facilities.
|
SUMMARY OF COAL PRODUCTION AND SULFUR CONTENT OF ASSIGNED RESERVES
|
|||||||||||||||||||||||
|
(Tons in millions)
|
|||||||||||||||||||||||
|
Production
|
Sulfur Content of Assigned Reserves as of December 31, 2017
(1)
|
||||||||||||||||||||||
|
<1.2 lbs.
|
>1.2 to 2.5 lbs.
|
>2.5 lbs.
|
As
|
||||||||||||||||||||
|
Sulfur
|
Sulfur
|
Sulfur
|
Received
|
||||||||||||||||||||
|
Year Ended December 31,
|
Type of
|
Dioxide per
|
Dioxide per
|
Dioxide per
|
Btu per
|
||||||||||||||||||
|
Segment/Mining Complex
|
2017
|
2016
|
2015
|
Coal
|
Million Btu
|
Million Btu
|
Million Btu
|
pound
(2)
|
|||||||||||||||
|
Powder River Basin Mining:
|
|||||||||||||||||||||||
|
North Antelope Rochelle
|
101.6
|
|
92.9
|
|
109.3
|
|
T
|
1,797
|
|
—
|
|
—
|
|
8,800
|
|
||||||||
|
Caballo
|
11.1
|
|
11.2
|
|
11.4
|
|
T
|
465
|
|
6
|
|
6
|
|
8,400
|
|
||||||||
|
Rawhide
|
10.4
|
|
8.1
|
|
15.2
|
|
T
|
242
|
|
51
|
|
1
|
|
8,300
|
|
||||||||
|
Total
|
123.1
|
|
112.2
|
|
135.9
|
|
2,504
|
|
57
|
|
7
|
|
|||||||||||
|
Midwestern U.S. Mining:
|
|||||||||||||||||||||||
|
Bear Run
|
7.3
|
|
7.3
|
|
7.9
|
|
T
|
4
|
|
27
|
|
202
|
|
10,900
|
|
||||||||
|
Wild Boar
|
2.7
|
|
2.6
|
|
2.7
|
|
T
|
—
|
|
—
|
|
39
|
|
11,100
|
|
||||||||
|
Gateway North
|
2.5
|
|
1.8
|
|
1.8
|
|
T
|
—
|
|
—
|
|
55
|
|
10,900
|
|
||||||||
|
Somerville Central
|
2.2
|
|
2.3
|
|
3.0
|
|
T
|
—
|
|
—
|
|
11
|
|
11,200
|
|
||||||||
|
Francisco Underground
|
2.2
|
|
2.1
|
|
2.9
|
|
T
|
—
|
|
—
|
|
21
|
|
11,500
|
|
||||||||
|
Wildcat Hills Underground
|
1.5
|
|
1.5
|
|
1.7
|
|
T
|
—
|
|
—
|
|
43
|
|
12,100
|
|
||||||||
|
Cottage Grove
|
0.3
|
|
0.2
|
|
1.1
|
|
T
|
—
|
|
—
|
|
5
|
|
12,100
|
|
||||||||
|
Total
|
18.7
|
|
17.8
|
|
21.1
|
|
4
|
|
27
|
|
376
|
|
|||||||||||
|
Western U.S. Mining:
|
|||||||||||||||||||||||
|
Kayenta
(3)
|
6.2
|
|
5.4
|
|
6.8
|
|
T
|
134
|
|
59
|
|
3
|
|
10,600
|
|
||||||||
|
El Segundo
|
4.9
|
|
4.9
|
|
7.5
|
|
T
|
12
|
|
32
|
|
36
|
|
9,000
|
|
||||||||
|
Twentymile
|
3.8
|
|
2.0
|
|
3.5
|
|
T
|
30
|
|
—
|
|
—
|
|
11,200
|
|
||||||||
|
Lee Ranch
|
—
|
|
—
|
|
—
|
|
T
|
14
|
|
66
|
|
9
|
|
9,300
|
|
||||||||
|
Total
|
14.9
|
|
12.3
|
|
17.8
|
|
190
|
|
157
|
|
48
|
|
|||||||||||
|
Australian Metallurgical Mining:
|
|||||||||||||||||||||||
|
North Goonyella
|
3.4
|
|
1.3
|
|
2.6
|
|
M
|
71
|
|
—
|
|
—
|
|
12,700
|
|
||||||||
|
Millennium
|
3.3
|
|
3.5
|
|
4.4
|
|
M/P
|
3
|
|
—
|
|
—
|
|
12,600
|
|
||||||||
|
Coppabella
|
2.8
|
|
2.4
|
|
2.8
|
|
P
|
23
|
|
—
|
|
—
|
|
12,600
|
|
||||||||
|
Moorvale
|
1.8
|
|
1.9
|
|
2.2
|
|
P/T
|
15
|
|
—
|
|
—
|
|
12,500
|
|
||||||||
|
Metropolitan
|
1.0
|
|
1.9
|
|
2.1
|
|
M/P/T
|
25
|
|
—
|
|
—
|
|
12,600
|
|
||||||||
|
Burton
(4)
(Operations ceased in 2016)
|
—
|
|
1.5
|
|
1.3
|
|
M/T
|
—
|
|
—
|
|
—
|
|
NA
|
|
||||||||
|
Middlemount
(5)
|
—
|
|
—
|
|
—
|
|
M/P
|
25
|
|
—
|
|
—
|
|
12,400
|
|
||||||||
|
Total
|
12.3
|
|
12.5
|
|
15.4
|
|
162
|
|
—
|
|
—
|
|
|||||||||||
|
Australian Thermal Mining:
|
|||||||||||||||||||||||
|
Wilpinjong
|
13.4
|
|
14.0
|
|
12.0
|
|
T
|
133
|
|
—
|
|
—
|
|
10,000
|
|
||||||||
|
Wambo
(6)
|
5.9
|
|
6.8
|
|
6.5
|
|
T/M
|
158
|
|
—
|
|
—
|
|
11,300
|
|
||||||||
|
Total
|
19.3
|
|
20.8
|
|
18.5
|
|
291
|
|
—
|
|
—
|
|
|||||||||||
|
Total Assigned
|
188.3
|
|
175.6
|
|
208.7
|
|
3,151
|
|
241
|
|
431
|
|
|||||||||||
T: Thermal
M: Metallurgical
P: Pulverized Coal Injection Metallurgical
|
Peabody Energy Corporation
|
2017 Form 10-K
|
43
|
|
ASSIGNED RESERVES
(7)
|
||||||||||||||||||||||||||||||||||||||
|
AS OF DECEMBER 31, 2017
|
||||||||||||||||||||||||||||||||||||||
|
Attributable Ownership
|
100% Project Basis
|
Modifying Factors
(8)
|
||||||||||||||||||||||||||||||||||||
|
(Tons in millions)
|
Proven and Probable Reserves
|
Proven and Probable Reserves
|
||||||||||||||||||||||||||||||||||||
|
Segment/Mining Complex
|
Interest
|
Owned
|
Leased
|
Surface
|
Underground
|
Owned
|
Leased
|
Surface
|
Underground
|
ROM Factor
|
Yield
|
|||||||||||||||||||||||||||
|
Powder River Basin Mining:
|
||||||||||||||||||||||||||||||||||||||
|
North Antelope Rochelle
|
100%
|
1,797
|
|
—
|
|
1,797
|
|
1,797
|
|
—
|
|
1,797
|
|
—
|
|
1,797
|
|
1,797
|
|
—
|
|
92
|
%
|
100
|
%
|
|||||||||||||
|
Caballo
|
100%
|
477
|
|
—
|
|
477
|
|
477
|
|
—
|
|
477
|
|
—
|
|
477
|
|
477
|
|
—
|
|
90
|
%
|
100
|
%
|
|||||||||||||
|
Rawhide
|
100%
|
294
|
|
—
|
|
294
|
|
294
|
|
—
|
|
294
|
|
—
|
|
294
|
|
294
|
|
—
|
|
93
|
%
|
100
|
%
|
|||||||||||||
|
Total
|
2,568
|
|
—
|
|
2,568
|
|
2,568
|
|
—
|
|
||||||||||||||||||||||||||||
|
Midwestern U.S. Mining:
|
||||||||||||||||||||||||||||||||||||||
|
Bear Run
|
100%
|
233
|
|
101
|
|
132
|
|
233
|
|
—
|
|
233
|
|
101
|
|
132
|
|
233
|
|
—
|
|
107
|
%
|
70
|
%
|
|||||||||||||
|
Wild Boar
|
100%
|
39
|
|
19
|
|
20
|
|
39
|
|
—
|
|
39
|
|
19
|
|
20
|
|
39
|
|
—
|
|
102
|
%
|
79
|
%
|
|||||||||||||
|
Gateway North
|
100%
|
55
|
|
54
|
|
1
|
|
—
|
|
55
|
|
55
|
|
54
|
|
1
|
|
—
|
|
55
|
|
65
|
%
|
66
|
%
|
|||||||||||||
|
Somerville Central
|
100%
|
11
|
|
10
|
|
1
|
|
11
|
|
—
|
|
11
|
|
10
|
|
1
|
|
11
|
|
—
|
|
108
|
%
|
71
|
%
|
|||||||||||||
|
Francisco Underground
|
100%
|
21
|
|
4
|
|
17
|
|
—
|
|
21
|
|
21
|
|
4
|
|
17
|
|
—
|
|
21
|
|
74
|
%
|
63
|
%
|
|||||||||||||
|
Wildcat Hills Underground
|
100%
|
43
|
|
10
|
|
33
|
|
—
|
|
43
|
|
43
|
|
10
|
|
33
|
|
—
|
|
43
|
|
74
|
%
|
58
|
%
|
|||||||||||||
|
Cottage Grove
|
100%
|
5
|
|
3
|
|
2
|
|
5
|
|
—
|
|
5
|
|
3
|
|
2
|
|
5
|
|
—
|
|
104
|
%
|
82
|
%
|
|||||||||||||
|
Total
|
407
|
|
201
|
|
206
|
|
288
|
|
119
|
|
|
|
|
|
|
|||||||||||||||||||||||
|
Western U.S. Mining:
|
||||||||||||||||||||||||||||||||||||||
|
Kayenta
(3)
|
100%
|
196
|
|
—
|
|
196
|
|
196
|
|
—
|
|
196
|
|
—
|
|
196
|
|
196
|
|
—
|
|
88
|
%
|
100
|
%
|
|||||||||||||
|
El Segundo
|
100%
|
80
|
|
66
|
|
14
|
|
80
|
|
—
|
|
80
|
|
66
|
|
14
|
|
80
|
|
—
|
|
87
|
%
|
100
|
%
|
|||||||||||||
|
Twentymile
|
100%
|
30
|
|
8
|
|
22
|
|
—
|
|
30
|
|
30
|
|
8
|
|
22
|
|
—
|
|
30
|
|
106
|
%
|
66
|
%
|
|||||||||||||
|
Lee Ranch
|
100%
|
89
|
|
86
|
|
3
|
|
89
|
|
—
|
|
89
|
|
86
|
|
3
|
|
89
|
|
—
|
|
87
|
%
|
100
|
%
|
|||||||||||||
|
Total
|
395
|
|
160
|
|
235
|
|
365
|
|
30
|
|
|
|
|
|
|
|||||||||||||||||||||||
|
Australian Metallurgical Mining:
|
||||||||||||||||||||||||||||||||||||||
|
North Goonyella
|
100%
|
71
|
|
—
|
|
71
|
|
—
|
|
71
|
|
71
|
|
—
|
|
71
|
|
—
|
|
71
|
|
62
|
%
|
78
|
%
|
|||||||||||||
|
Millennium
|
100%
|
3
|
|
—
|
|
3
|
|
3
|
|
—
|
|
3
|
|
—
|
|
3
|
|
3
|
|
—
|
|
92
|
%
|
80
|
%
|
|||||||||||||
|
Coppabella
|
73.3%
|
23
|
|
—
|
|
23
|
|
23
|
|
—
|
|
31
|
|
—
|
|
31
|
|
31
|
|
—
|
|
92
|
%
|
78
|
%
|
|||||||||||||
|
Moorvale
|
73.3%
|
15
|
|
—
|
|
15
|
|
15
|
|
—
|
|
20
|
|
—
|
|
20
|
|
20
|
|
—
|
|
107
|
%
|
79
|
%
|
|||||||||||||
|
Metropolitan
|
100%
|
25
|
|
—
|
|
25
|
|
—
|
|
25
|
|
25
|
|
—
|
|
25
|
|
—
|
|
25
|
|
116
|
%
|
79
|
%
|
|||||||||||||
|
Middlemount
(5)
|
50.0%
|
25
|
|
—
|
|
25
|
|
25
|
|
—
|
|
50
|
|
—
|
|
50
|
|
50
|
|
—
|
|
85
|
%
|
77
|
%
|
|||||||||||||
|
Total
|
162
|
|
—
|
|
162
|
|
66
|
|
96
|
|
||||||||||||||||||||||||||||
|
Australian Thermal Mining:
|
||||||||||||||||||||||||||||||||||||||
|
Wilpinjong
|
100%
|
133
|
|
—
|
|
133
|
|
133
|
|
—
|
|
133
|
|
—
|
|
133
|
|
133
|
|
—
|
|
112
|
%
|
84
|
%
|
|||||||||||||
|
Wambo
(6)
|
100%
|
158
|
|
—
|
|
158
|
|
43
|
|
115
|
|
158
|
|
—
|
|
158
|
|
43
|
|
115
|
|
100
|
%
|
73
|
%
|
|||||||||||||
|
Total
|
291
|
|
—
|
|
291
|
|
176
|
|
115
|
|
|
|
|
|
|
|||||||||||||||||||||||
|
Total Assigned
|
3,823
|
|
361
|
|
3,462
|
|
3,463
|
|
360
|
|
|
|
|
|
|
|||||||||||||||||||||||
|
Peabody Energy Corporation
|
2017 Form 10-K
|
44
|
|
ASSIGNED AND UNASSIGNED PROVEN AND PROBABLE COAL RESERVES
(7)
|
||||||||||||||||||||||||||||||
|
AS OF DECEMBER 31, 2017
|
||||||||||||||||||||||||||||||
|
(Tons in millions)
|
||||||||||||||||||||||||||||||
|
Attributable Ownership
|
100% Project Basis
|
|||||||||||||||||||||||||||||
|
Proven and
|
Proven and
|
|||||||||||||||||||||||||||||
|
Total Tons
|
Probable
|
Total Tons
|
Probable
|
|||||||||||||||||||||||||||
|
Coal Seam Location
|
Assigned
|
Unassigned
|
Reserves
|
Proven
|
Probable
|
Assigned
|
Unassigned
|
Reserves
|
Proven
|
Probable
|
||||||||||||||||||||
|
Powder River Basin Mining (Wyoming)
|
2,568
|
|
—
|
|
2,568
|
|
2,445
|
|
123
|
|
2,568
|
|
—
|
|
2,568
|
|
2,445
|
|
123
|
|
||||||||||
|
Midwestern U.S. Mining:
|
||||||||||||||||||||||||||||||
|
Illinois
|
103
|
|
1,154
|
|
1,257
|
|
556
|
|
701
|
|
103
|
|
1,154
|
|
1,257
|
|
556
|
|
701
|
|
||||||||||
|
Indiana
|
304
|
|
14
|
|
318
|
|
270
|
|
48
|
|
304
|
|
14
|
|
318
|
|
270
|
|
48
|
|
||||||||||
|
Kentucky
(9)
|
—
|
|
100
|
|
100
|
|
46
|
|
54
|
|
—
|
|
100
|
|
100
|
|
46
|
|
54
|
|
||||||||||
|
Total
|
407
|
|
1,268
|
|
1,675
|
|
872
|
|
803
|
|
|
|
|
|
|
|||||||||||||||
|
Western U.S. Mining:
|
||||||||||||||||||||||||||||||
|
Arizona
(3)
|
196
|
|
—
|
|
196
|
|
196
|
|
—
|
|
196
|
|
—
|
|
196
|
|
196
|
|
—
|
|
||||||||||
|
New Mexico
|
169
|
|
—
|
|
169
|
|
168
|
|
1
|
|
169
|
|
—
|
|
169
|
|
168
|
|
1
|
|
||||||||||
|
Colorado
|
30
|
|
51
|
|
81
|
|
65
|
|
16
|
|
30
|
|
51
|
|
81
|
|
65
|
|
16
|
|
||||||||||
|
Total
|
395
|
|
51
|
|
446
|
|
429
|
|
17
|
|
|
|
|
|
|
|||||||||||||||
|
Australian Metallurgical Mining:
|
||||||||||||||||||||||||||||||
|
New South Wales
|
25
|
|
—
|
|
25
|
|
4
|
|
21
|
|
25
|
|
—
|
|
25
|
|
4
|
|
21
|
|
||||||||||
|
Queensland
|
137
|
|
94
|
|
231
|
|
135
|
|
96
|
|
175
|
|
122
|
|
297
|
|
168
|
|
129
|
|
||||||||||
|
Total
|
162
|
|
94
|
|
256
|
|
139
|
|
117
|
|
|
|
|
|
|
|||||||||||||||
|
Australian Thermal Mining (New South Wales)
|
291
|
|
—
|
|
291
|
|
252
|
|
39
|
|
291
|
|
—
|
|
291
|
|
252
|
|
39
|
|
||||||||||
|
Total Proven and Probable
|
3,823
|
|
1,413
|
|
5,236
|
|
4,137
|
|
1,099
|
|
|
|
|
|
|
|||||||||||||||
|
Peabody Energy Corporation
|
2017 Form 10-K
|
45
|
|
ASSIGNED AND UNASSIGNED - RESERVE CONTROL AND MINING METHOD
|
||||||||||||||||||||||||
|
AS OF DECEMBER 31, 2017
|
||||||||||||||||||||||||
|
(Tons in millions)
|
||||||||||||||||||||||||
|
Attributable Ownership
|
100% Project Basis
|
|||||||||||||||||||||||
|
Reserve Control
|
Mining Method
|
Reserve Control
|
Mining Method
|
|||||||||||||||||||||
|
Coal Seam Location
|
Owned
|
Leased
|
Surface
|
Underground
|
Owned
|
Leased
|
Surface
|
Underground
|
||||||||||||||||
|
Powder River Basin Mining (Wyoming)
|
—
|
|
2,568
|
|
2,568
|
|
—
|
|
—
|
|
2,568
|
|
2,568
|
|
—
|
|
||||||||
|
Midwestern U.S. Mining:
|
||||||||||||||||||||||||
|
Illinois
|
1,208
|
|
49
|
|
5
|
|
1,252
|
|
1,208
|
|
49
|
|
5
|
|
1,252
|
|
||||||||
|
Indiana
|
143
|
|
175
|
|
293
|
|
25
|
|
143
|
|
175
|
|
293
|
|
25
|
|
||||||||
|
Kentucky
(9)
|
35
|
|
65
|
|
—
|
|
100
|
|
35
|
|
65
|
|
—
|
|
100
|
|
||||||||
|
Total
|
1,386
|
|
289
|
|
298
|
|
1,377
|
|
|
|
|
|
||||||||||||
|
Western U.S. Mining:
|
||||||||||||||||||||||||
|
Arizona
(3)
|
—
|
|
196
|
|
196
|
|
—
|
|
—
|
|
196
|
|
196
|
|
—
|
|
||||||||
|
New Mexico
|
152
|
|
17
|
|
169
|
|
—
|
|
152
|
|
17
|
|
169
|
|
—
|
|
||||||||
|
Colorado
|
9
|
|
72
|
|
—
|
|
81
|
|
9
|
|
72
|
|
—
|
|
81
|
|
||||||||
|
Total
|
161
|
|
285
|
|
365
|
|
81
|
|
|
|
|
|
||||||||||||
|
Australia Metallurgical Mining:
|
||||||||||||||||||||||||
|
New South Wales
|
—
|
|
25
|
|
—
|
|
25
|
|
—
|
|
25
|
|
—
|
|
25
|
|
||||||||
|
Queensland
|
—
|
|
231
|
|
90
|
|
141
|
|
—
|
|
297
|
|
132
|
|
165
|
|
||||||||
|
Total
|
—
|
|
256
|
|
90
|
|
166
|
|
|
|
|
|
||||||||||||
|
Australian Thermal Mining (New South Wales)
|
—
|
|
291
|
|
176
|
|
115
|
|
—
|
|
291
|
|
176
|
|
115
|
|
||||||||
|
Total Proven and Probable
|
1,547
|
|
3,689
|
|
3,497
|
|
1,739
|
|
|
|
|
|
||||||||||||
|
Peabody Energy Corporation
|
2017 Form 10-K
|
46
|
|
ASSIGNED AND UNASSIGNED PROVEN AND PROBABLE COAL RESERVES - SULFUR CONTENT
|
|||||||||||||||||||||||
|
AS OF DECEMBER 31, 2017
|
|||||||||||||||||||||||
|
(Tons in millions)
|
|||||||||||||||||||||||
|
Attributable Ownership
|
100% Project Basis
|
||||||||||||||||||||||
|
Sulfur Content
(1)
|
Sulfur Content
(1)
|
||||||||||||||||||||||
|
<1.2 lbs.
|
>1.2 to 2.5 lbs.
|
>2.5 lbs.
|
<1.2 lbs.
|
>1.2 to 2.5 lbs.
|
>2.5 lbs.
|
As
|
|||||||||||||||||
|
Sulfur Dioxide
|
Sulfur Dioxide
|
Sulfur Dioxide
|
Sulfur Dioxide
|
Sulfur Dioxide
|
Sulfur Dioxide
|
Received
|
|||||||||||||||||
|
Type of
|
per
|
per
|
per
|
per
|
per
|
per
|
Btu
|
||||||||||||||||
|
Coal Seam Location
|
Coal
|
Million Btu
|
Million Btu
|
Million Btu
|
Million Btu
|
Million Btu
|
Million Btu
|
per Pound
(2)
|
|||||||||||||||
|
Powder River Basin Mining (Wyoming)
|
T
|
2,504
|
|
57
|
|
7
|
|
2,504
|
|
57
|
|
7
|
|
8,700
|
|
||||||||
|
Midwestern U.S. Mining:
|
|||||||||||||||||||||||
|
Illinois
|
T
|
—
|
|
—
|
|
1,257
|
|
—
|
|
—
|
|
1,257
|
|
10,800
|
|
||||||||
|
Indiana
|
T
|
4
|
|
27
|
|
287
|
|
4
|
|
27
|
|
287
|
|
11,000
|
|
||||||||
|
Kentucky
(9)
|
T
|
—
|
|
—
|
|
100
|
|
—
|
|
—
|
|
100
|
|
12,000
|
|
||||||||
|
Total
|
4
|
|
27
|
|
1,644
|
|
|
|
|
|
|||||||||||||
|
Western U.S. Mining:
|
|||||||||||||||||||||||
|
Arizona
(3)
|
T
|
134
|
|
59
|
|
3
|
|
134
|
|
59
|
|
3
|
|
10,600
|
|
||||||||
|
New Mexico
|
T
|
26
|
|
98
|
|
45
|
|
26
|
|
98
|
|
45
|
|
9,200
|
|
||||||||
|
Colorado
|
T
|
81
|
|
—
|
|
—
|
|
81
|
|
—
|
|
—
|
|
11,200
|
|
||||||||
|
Total
|
241
|
|
157
|
|
48
|
|
|
|
|
|
|||||||||||||
|
Australia Metallurgical Mining:
|
|||||||||||||||||||||||
|
New South Wales
|
M/P/T
|
25
|
|
—
|
|
—
|
|
25
|
|
—
|
|
—
|
|
12,600
|
|
||||||||
|
Queensland
|
M/P/T
|
231
|
|
—
|
|
—
|
|
297
|
|
—
|
|
—
|
|
12,400
|
|
||||||||
|
Total
|
256
|
|
—
|
|
—
|
|
|
|
|
|
|||||||||||||
|
Australian Thermal Mining (New South Wales)
|
T/M
|
291
|
|
—
|
|
—
|
|
291
|
|
—
|
|
—
|
|
10,700
|
|
||||||||
|
Total Proven and Probable
|
3,296
|
|
241
|
|
1,699
|
|
|
|
|
|
|||||||||||||
T: Thermal
M: Metallurgical
P: Pulverized Coal Injection Metallurgical
|
Peabody Energy Corporation
|
2017 Form 10-K
|
47
|
|
(1)
|
Compliance coal is defined by Phase II of the CAA as coal having sulfur dioxide content of 1.2 pounds or less per million Btu. Non-compliance coal is defined as coal having sulfur dioxide content in excess of this standard. Electricity generators are able to use coal that exceeds these specifications by using emissions reduction technology, using emission allowance credits or blending higher sulfur coal with lower sulfur coal.
|
|
(2)
|
As-received Btu per pound includes the weight of moisture in the coal on an as sold basis. The range of variability of the moisture content in coal across a given region may affect the actual shipped Btu content of current production from assigned reserves.
|
|
(3)
|
Coal reserves are estimated based on coal reserves leased from the Navajo Nation and the Hopi Tribe that are administered by the U.S. Department of the Interior. These leases expire upon exhaustion of the leased reserves or upon the permanent ceasing of all mining activities on the related reserves as a whole. The Kayenta Mine serves a single customer and has contract to supply coal to that customer through December 2019. If the customer closes the plant at the end of that contract, proven and probable reserves at the mine would be reduced by approximately 180 million tons. See Item 1A. “Risk Factors” for additional information.
|
|
(4)
|
On November 27, 2017, Peabody completed the sale of the majority of its Burton Mine and related infrastructure to the Lenton Joint Venture.
|
|
(5)
|
Represents our 50% interest in Middlemount Coal Pty Ltd. (Middlemount), which owns the Middlemount Mine in Queensland, Australia. Because that entity is accounted for as an unconsolidated equity affiliate, 2017, 2016 and 2015 tons produced by Middlemount have been excluded from the “Summary of Coal Production and Sulfur Content of Assigned Reserves” table. Middlemount produced 4.3 million tons, 4.5 million tons, and 4.8 million tons of coal in 2017, 2016 and 2015, respectively (on a 100% basis).
|
|
(6)
|
Includes the Wambo Open-Cut Mine and the Wambo Underground Mine areas.
|
|
(7)
|
Assigned reserves represent recoverable coal reserves that are controlled and accessible at active operations as of
December 31, 2017
. Unassigned reserves represent coal at currently non-producing locations that would require significant new mine development, mining equipment or plant facilities before operations could begin on the property.
|
|
(8)
|
The modifying factors reflect the assumptions which are utilized to convert coal quantities and qualities as in ground to run of mine (ROM) coal after mining, and eventually to saleable product coal after processing. Coal reserves are reported as an estimation of the final saleable quantity, which takes into account any losses and dilutions during mining and processing. We generally keep track of coal reserves through in place coal, ROM coal and product coal. In place coal for U.S. underground reserves excludes planned barrier pillars, but includes regular pillars from projected underground extractions. In place coal for Australian underground reserves is exclusive of all planned pillars. The difference is due to historic practice and software used by each country. The ROM factor represents the estimated ROM coal in relation to the coal in place with considerations of coal losses, dilutions and remaining pillars during mining processes. The yield is the ratio of estimated saleable product coal over ROM coal tons with mainly processing loss considered.
|
|
(9)
|
All coal reserves in Kentucky are leased to third parties.
|
Item 3.
Legal Proceedings.
See Note 25. “Commitments and Contingencies” to our consolidated financial statements for a description of our pending legal proceedings, which information is incorporated herein by reference.
Item 4.
Mine Safety Disclosures.
Our “Safety a Way of Life Management System” has been designed to set clear and consistent expectations for safety and health across our business. It aligns to the National Mining Association’s CORESafety® framework and encompasses three fundamental areas: leadership and organization, safety and health risk management and assurance. We also partner with other companies and certain governmental agencies to pursue new technologies that have the potential to improve our safety performance and provide better safety protection for employees.
We continually monitor our safety performance and regulatory compliance. The information concerning mine safety violations or other regulatory matters required by SEC regulations is included in Exhibit 95 to this Annual Report on Form 10-K.
Item 5.
Market for Registrant’s Common Equity, Related Stockholder Matters and Issuer Purchases of Equity Securities.
Our Common Stock is listed on the New York Stock Exchange, under the symbol “BTU.” As of
February 19, 2018
there were 934 holders of record of our Common Stock.
|
Peabody Energy Corporation
|
2017 Form 10-K
|
48
|
The table below sets forth the range of quarterly high and low sales prices (including intraday prices) for our Common Stock since emergence from the Chapter 11 Cases as reported on the New York Stock Exchange and the amount of cash dividends paid per share of our Common Stock during the calendar quarters indicated.
|
|
Share Price
|
Dividends
|
|||||||||
|
|
High
|
Low
|
Paid
|
||||||||
|
2017
|
|
|
|
|
|
|
|||||
|
Second Quarter
|
$
|
32.50
|
|
$
|
22.58
|
|
$
|
—
|
|
||
|
Third Quarter
|
30.95
|
|
24.37
|
|
—
|
|
|||||
|
Fourth Quarter
|
39.86
|
|
28.08
|
|
—
|
|
|||||
Dividend Policy
The payment of dividends is subject to certain limitations following the Effective Date, as set forth in our debt provisions. Such limitations on dividends are discussed in Part II, Item 7. “Management’s Discussion and Analysis of Financial Condition and Results of Operations.” On February 7, 2018, our Board of Directors declared a dividend of $0.115 per share of Common Stock, payable on March 5, 2018, to shareholders of record on February 19, 2018. Our Board of Directors will continue to evaluate the appropriate dividend rate on a quarterly basis and the declaration and payment of dividends in the future and the amount of those dividends will depend on our results of operations, financial condition, cash requirements, future prospects, any limitations imposed by our debt covenants and other factors that our Board of Directors may deem relevant to such evaluations.
Share Relinquishments
We routinely allow employees to relinquish Common Stock to pay estimated taxes upon the vesting of restricted stock units and the payout of performance units that are settled in Common Stock under our equity incentive plans. The value of Common Stock tendered by employees is determined based on the closing price of our Common Stock on the dates of the respective relinquishments.
Share Repurchase Programs
On August 1, 2017, we announced that our Board of Directors authorized a share repurchase program to allow repurchases of up to $500 million of the then outstanding shares of our common stock and/or preferred stock (Repurchase Program). Repurchases may be made from time to time at the Company’s discretion. The specific timing, price and size of purchases will depend on the share price, general market and economic conditions and other considerations, including compliance with various debt agreements as they may be amended from time to time. The Repurchase Program does not have an expiration date and may be discontinued at any time. During the Successor period ended December 31, 2017, we repurchased approximately 1.5 million shares of our Common Stock for $40.0 million in connection with an underwritten secondary offering and made additional open-market purchases of approximately 4.3 million shares of our Common Stock for $135.7 million. Subsequent to December 31, 2017 and through February 19, 2018, we have purchased an additional
0.9 million
shares of our Common Stock for
$38.5 million
. The purchases were made in compliance with our debt provisions that limit our ability to repurchase shares following the Effective Date. Limitations on share repurchases imposed by our debt instruments are discussed in Part II, Item 7. “Management’s Discussion and Analysis of Financial Condition and Results of Operations.”
Purchases of Equity Securities
The following table summarizes all share purchases for the three months ended December 31, 2017:
|
Period
|
Total Number of Shares
Purchased
(1)
|
Average Price Paid per Share
|
Total Number of Shares Purchased as Part of Publicly Announced Program
|
Maximum Dollar Value of Shares that May Yet Be Used to Repurchase Shares Under the Publicly Announced Program (In millions)
|
||||||||||
|
October 1 through October 31, 2017
|
1,313,405
|
|
$
|
29.58
|
|
1,308,737
|
|
$
|
392.1
|
|
||||
|
November 1 through November 30, 2017
|
1,045,343
|
|
32.23
|
|
1,045,191
|
|
358.5
|
|
||||||
|
December 1 through December 31, 2017
|
958,588
|
|
35.60
|
|
955,799
|
|
324.5
|
|
||||||
|
Total
|
3,317,336
|
|
$
|
32.16
|
|
3,309,727
|
|
|
|
|||||
(1)
Includes shares withheld to cover the withholding taxes upon the vesting of equity awards, which are not a part of the Repurchase Program.
|
Peabody Energy Corporation
|
2017 Form 10-K
|
49
|
Mandatory Conversion of Preferred Shares
Each outstanding share of our Preferred Stock was subject to mandatory automatic conversion into a number of shares of Common Stock if the volume weighted average price of the Common Stock exceeded
$32.50
for at least
45
trading days in a
60
consecutive trading day period, including each of the last
20
days in such
60
consecutive trading day period. On
January 31, 2018
, the requirements for such a mandatory conversion were met and the then outstanding
13.2 million
shares of Preferred Stock were automatically converted into
24.8 million
shares of Common Stock. As a result of this mandatory conversion, we expect to record a non-cash preferred dividend charge of approximately $103 million in the the first quarter of 2018.
Item 6.
Selected Financial Data.
This item presents selected financial and other data about us for the most recent five fiscal years.
The table that follows and the discussion of our results of operations in
2017
,
2016
and
2015
in Part II, Item 7. “Management’s Discussion and Analysis of Financial Condition and Results of Operations” includes references to and analysis of Adjusted EBITDA which is a financial measure not recognized in accordance with U.S. generally accepted accounting principles (U.S. GAAP). These financial measures are not intended to serve as alternatives to U.S. GAAP measures of performance and may not be comparable to similarly-titled measures presented by other companies.
Adjusted EBITDA is used by management as the primary metric to measure our segments’ operating performance. We also believe non-GAAP performance measures are used by investors to measure our operating performance and lenders to measure our ability to incur and service debt. Adjusted EBITDA is defined as income (loss) from continuing operations before deducting net interest expense, income taxes, asset retirement obligation expenses, depreciation, depletion and amortization and reorganization items, net. Adjusted EBITDA is also adjusted for the discrete items that management excluded in analyzing each of our segments’ operating performance, as displayed in the reconciliation. A reconciliation of income (loss) from continuing operations, net of income taxes to Adjusted EBITDA is included on page 52 of this report. Adjusted EBITDA is not intended to serve as an alternative to U.S. GAAP measures of performance and may not be comparable to similarly-titled measures presented by other companies.
The selected financial data for all periods presented reflect the classification as discontinued operations of certain operations previously divested (by sale or otherwise).
We have derived the selected historical financial data as of and for the years ended December 31,
2017
,
2016
,
2015
,
2014
and
2013
from our audited financial statements, adjusted retrospectively for items subsequently classified as discontinued operations and the implementation of certain accounting literature. Also, all share and per share data have been retroactively restated to reflect the September 30, 2015 1-for-15 reverse stock split. The following table should be read in conjunction with the accompanying financial statements, including the related notes to those financial statements, and Part II, Item 7. “Management’s Discussion and Analysis of Financial Condition and Results of Operations.”
|
Peabody Energy Corporation
|
2017 Form 10-K
|
50
|
The results of operations for the historical periods included in the following table are not necessarily indicative of the results to be expected for future periods. In addition, Part I, Item 1A. “Risk Factors” of this report includes a discussion of risk factors that could impact our future results of operations.
|
Successor
|
Predecessor
|
|||||||||||||||||||||||
|
|
April 2 through December 31, 2017
|
January 1 through April 1, 2017
|
Year Ended December 31,
|
|||||||||||||||||||||
|
|
|
2016
|
|
2015
|
|
2014
|
|
2013
|
||||||||||||||||
|
|
(In millions, except per share data)
|
|||||||||||||||||||||||
|
Results of Operations Data
|
|
|
|
|
|
|
|
|
|
|
||||||||||||||
|
Total revenues
|
$
|
4,252.6
|
|
$
|
1,326.2
|
|
$
|
4,715.3
|
|
$
|
5,609.2
|
|
$
|
6,792.2
|
|
$
|
7,013.7
|
|
||||||
|
Costs and expenses
|
3,565.5
|
|
1,128.1
|
|
4,992.2
|
|
7,074.0
|
|
6,927.3
|
|
7,338.5
|
|
||||||||||||
|
Operating profit (loss)
|
687.1
|
|
198.1
|
|
(276.9
|
)
|
(1,464.8
|
)
|
(135.1
|
)
|
(324.8
|
)
|
||||||||||||
|
Interest expense, net
|
135.0
|
|
30.2
|
|
322.4
|
|
525.5
|
|
412.8
|
|
409.5
|
|
||||||||||||
|
Reorganization items, net
|
—
|
|
627.2
|
|
159.0
|
|
—
|
|
—
|
|
—
|
|
||||||||||||
|
Income (loss) from continuing operations before income taxes
|
552.1
|
|
(459.3
|
)
|
(758.3
|
)
|
(1,990.3
|
)
|
(547.9
|
)
|
(734.3
|
)
|
||||||||||||
|
Income tax (benefit) provision
|
(161.0
|
)
|
(263.8
|
)
|
(94.5
|
)
|
(207.1
|
)
|
147.4
|
|
(197.0
|
)
|
||||||||||||
|
Income (loss) from continuing operations, net of income taxes
|
713.1
|
|
(195.5
|
)
|
(663.8
|
)
|
(1,783.2
|
)
|
(695.3
|
)
|
(537.3
|
)
|
||||||||||||
|
Loss from discontinued operations, net of income taxes
|
(19.8
|
)
|
(16.2
|
)
|
(57.6
|
)
|
(175.0
|
)
|
(28.2
|
)
|
(226.6
|
)
|
||||||||||||
|
Net income (loss)
|
693.3
|
|
(211.7
|
)
|
(721.4
|
)
|
(1,958.2
|
)
|
(723.5
|
)
|
(763.9
|
)
|
||||||||||||
|
Less: Series A Convertible Preferred Stock Dividends
|
179.5
|
|
—
|
|
—
|
|
—
|
|
—
|
|
—
|
|
||||||||||||
|
Less: Net income attributable to noncontrolling interests
|
15.2
|
|
4.8
|
|
7.9
|
|
7.1
|
|
9.7
|
|
12.3
|
|
||||||||||||
|
Net income (loss) attributable to common stockholders
|
$
|
498.6
|
|
$
|
(216.5
|
)
|
$
|
(729.3
|
)
|
$
|
(1,965.3
|
)
|
$
|
(733.2
|
)
|
$
|
(776.2
|
)
|
||||||
|
Basic EPS - Income (loss) from continuing operations
|
$
|
3.85
|
|
$
|
(10.93
|
)
|
$
|
(36.72
|
)
|
$
|
(98.65
|
)
|
$
|
(39.51
|
)
|
$
|
(30.91
|
)
|
||||||
|
Diluted EPS - Income (loss) from continuing operations
|
$
|
3.81
|
|
$
|
(10.93
|
)
|
$
|
(36.72
|
)
|
$
|
(98.65
|
)
|
$
|
(39.51
|
)
|
$
|
(30.91
|
)
|
||||||
|
Weighted average shares used in calculating basic EPS
|
101.1
|
|
18.3
|
|
18.3
|
|
18.1
|
|
17.9
|
|
17.8
|
|
||||||||||||
|
Weighted average shares used in calculating diluted EPS
|
102.5
|
|
18.3
|
|
18.3
|
|
18.1
|
|
17.9
|
|
17.8
|
|
||||||||||||
|
Dividends declared per share
|
$
|
—
|
|
$
|
—
|
|
$
|
—
|
|
$
|
0.075
|
|
$
|
5.100
|
|
$
|
5.100
|
|
||||||
|
Other Data
|
|
|
|
|
|
|
|
|
|
|
||||||||||||||
|
Tons produced
|
142.7
|
|
45.6
|
|
175.6
|
|
208.7
|
|
227.2
|
|
218.4
|
|
||||||||||||
|
Tons sold
|
145.4
|
|
46.1
|
|
186.8
|
|
228.8
|
|
249.8
|
|
251.7
|
|
||||||||||||
|
Net cash provided by (used in) continuing operations:
|
|
|
|
|
|
|
|
|
|
|
||||||||||||||
|
Operating activities
|
$
|
816.0
|
|
$
|
222.2
|
|
$
|
(22.9
|
)
|
$
|
18.9
|
|
$
|
441.0
|
|
$
|
780.1
|
|
||||||
|
Investing activities
|
(93.4
|
)
|
15.1
|
|
(244.1
|
)
|
(290.0
|
)
|
(314.5
|
)
|
(514.2
|
)
|
||||||||||||
|
Financing activities
|
(745.4
|
)
|
(47.7
|
)
|
907.9
|
|
267.7
|
|
(168.1
|
)
|
(321.5
|
)
|
||||||||||||
|
Adjusted EBITDA
|
1,145.3
|
|
341.3
|
|
532.0
|
|
432.4
|
|
|
806.3
|
|
|
1,049.9
|
|
||||||||||
|
Balance Sheet Data (at period end)
|
|
|
|
|
|
|
|
|
|
|
||||||||||||||
|
Total assets
|
$
|
8,181.2
|
|
$
|
8,266.9
|
|
$
|
11,777.7
|
|
$
|
10,946.9
|
|
$
|
13,126.4
|
|
$
|
14,069.5
|
|
||||||
|
Total long-term debt (including capital leases)
|
1,460.8
|
|
1,881.4
|
|
7,791.4
|
|
6,241.2
|
|
5,922.1
|
|
5,938.5
|
|
||||||||||||
|
Total stockholders’ equity
|
3,655.8
|
|
3,131.9
|
|
181.5
|
|
751.7
|
|
2,529.0
|
|
3,696.6
|
|
||||||||||||
|
Peabody Energy Corporation
|
2017 Form 10-K
|
51
|
Adjusted EBITDA is calculated as follows:
|
Successor
|
Predecessor
|
|||||||||||||||||||||||
|
|
April 2 through December 31, 2017
|
January 1 through April 1, 2017
|
Year Ended December 31,
|
|||||||||||||||||||||
|
|
2016
|
2015
|
2014
|
2013
|
||||||||||||||||||||
|
|
(Dollars in millions)
|
|||||||||||||||||||||||
|
Income (loss) from continuing operations, net of income taxes
|
$
|
713.1
|
|
$
|
(195.5
|
)
|
$
|
(663.8
|
)
|
$
|
(1,783.2
|
)
|
$
|
(695.3
|
)
|
$
|
(537.3
|
)
|
||||||
|
Depreciation, depletion and amortization
|
521.6
|
|
119.9
|
|
465.4
|
|
572.2
|
|
655.7
|
|
740.3
|
|
||||||||||||
|
Asset retirement obligation expenses
|
41.2
|
|
14.6
|
|
41.8
|
|
45.5
|
|
81.0
|
|
66.5
|
|
||||||||||||
|
Selling and administrative expenses related to debt restructuring
|
—
|
|
—
|
|
21.5
|
|
—
|
|
—
|
|
—
|
|
||||||||||||
|
Settlement charges related to the Patriot bankruptcy reorganization
|
—
|
|
—
|
|
—
|
|
—
|
|
—
|
|
30.6
|
|
||||||||||||
|
Net mark-to-market adjustment on actuarially determined liabilities
|
(45.2
|
)
|
—
|
|
—
|
|
—
|
|
—
|
|
—
|
|
||||||||||||
|
Asset impairment
|
—
|
|
30.5
|
|
247.9
|
|
1,277.8
|
|
154.4
|
|
528.3
|
|
||||||||||||
|
Change in deferred tax asset valuation allowance and amortization of basis difference related to equity affiliates
|
(17.3
|
)
|
(5.2
|
)
|
(7.5
|
)
|
3.9
|
|
58.0
|
|
6.3
|
|
||||||||||||
|
Interest expense
|
119.7
|
|
32.9
|
|
298.6
|
|
465.4
|
|
426.6
|
|
408.3
|
|
||||||||||||
|
Loss on early debt extinguishment
|
20.9
|
|
—
|
|
29.5
|
|
67.8
|
|
1.6
|
|
16.9
|
|
||||||||||||
|
Interest income
|
(5.6
|
)
|
(2.7
|
)
|
(5.7
|
)
|
(7.7
|
)
|
(15.4
|
)
|
(15.7
|
)
|
||||||||||||
|
Reorganization items, net
|
—
|
|
627.2
|
|
159.0
|
|
—
|
|
—
|
|
—
|
|
||||||||||||
|
Gain on disposal of reclamation liability
|
(31.2
|
)
|
—
|
|
—
|
|
—
|
|
—
|
|
—
|
|
||||||||||||
|
Gain on disposal of Burton mine
|
(52.2
|
)
|
—
|
|
—
|
|
—
|
|
—
|
|
—
|
|
||||||||||||
|
Break fees related to terminated asset sales
|
(28.0
|
)
|
—
|
|
—
|
|
—
|
|
—
|
|
—
|
|
||||||||||||
|
Unrealized losses (gains) on economic hedges
|
23.0
|
|
(16.6
|
)
|
39.8
|
|
(2.2
|
)
|
(7.7
|
)
|
2.7
|
|
||||||||||||
|
Unrealized losses on non-coal trading derivative contracts
|
1.5
|
|
—
|
|
—
|
|
—
|
|
—
|
|
—
|
|
||||||||||||
|
Coal inventory revaluation
|
67.3
|
|
—
|
|
—
|
|
—
|
|
—
|
|
—
|
|
||||||||||||
|
Take-or-pay contract-based intangible recognition
|
(22.5
|
)
|
—
|
|
—
|
|
—
|
|
—
|
|
—
|
|
||||||||||||
|
Income tax (benefit) provision
|
(161.0
|
)
|
(263.8
|
)
|
(94.5
|
)
|
(207.1
|
)
|
147.4
|
|
(197.0
|
)
|
||||||||||||
|
Adjusted EBITDA
|
$
|
1,145.3
|
|
$
|
341.3
|
|
$
|
532.0
|
|
$
|
432.4
|
|
$
|
806.3
|
|
$
|
1,049.9
|
|
||||||
Item 7.
Management’s Discussion and Analysis of Financial Condition and Results of Operations.
Overview
In
2017
, we produced and sold
188.3 million
and
191.5 million
tons of coal, respectively, from continuing operations.
The principal business of our mining segments in the U.S. is the mining, preparation and sale of thermal coal, sold primarily to electric utilities in the U.S. under long-term contracts, with a portion sold into the seaborne markets as market conditions warrant. Our Powder River Basin Mining operations consist of our mines in Wyoming. The mines in that segment are characterized by surface mining extraction processes, coal with a lower sulfur content and Btu and higher customer transportation costs (due to longer shipping distances). Our Midwestern U.S. Mining operations include our Illinois and Indiana mining operations, which are characterized by a mix of surface and underground mining extraction processes, coal with a higher sulfur content and Btu and lower customer transportation costs (due to shorter shipping distances). Our Western U.S. Mining operations reflect the aggregation of the New Mexico, Arizona and Colorado mining operations. The mines in that segment are characterized by a mix of surface and underground mining extraction processes and coal with a mid-range sulfur content and Btu. Geologically, our Powder River Basin Mining operations mine sub-bituminous coal deposits, our Midwestern U.S. Mining operations mine bituminous coal deposits and our Western U.S. Mining operations mine both bituminous and sub-bituminous coal deposits.
|
Peabody Energy Corporation
|
2017 Form 10-K
|
52
|
The business of our Australian operating platform is primarily export focused with customers spread across several countries, while a portion of our metallurgical and thermal coal is sold within Australia. Generally, revenues from individual countries vary year by year based on electricity and steel demand, the strength of the global economy, governmental policies and several other factors, including those specific to each country. Our Australian Metallurgical Mining operations consist of mines in Queensland and one in New South Wales, Australia. The mines in that segment are characterized by both surface and underground extraction processes used to mine various qualities of metallurgical coal (low-sulfur, high Btu coal). The metallurgical coal qualities include hard coking coal, semi-hard coking coal, semi-soft coking coal and pulverized coal injection (PCI) coal. Our Australian Thermal Mining operations consist of mines in New South Wales, Australia. The mines in that segment are characterized by both surface and underground extraction processes used to mine low-sulfur, high Btu thermal coal. We classify our Australian mines within the Australian Metallurgical Mining or Australian Thermal Mining segments based on the primary customer base and coal reserve type of each mining operation. A small portion of the coal mined by the Australian Metallurgical Mining segment is of a thermal grade. Similarly, a small portion of the coal mined by the Australian Thermal Mining segment is of a metallurgical grade. Additionally, we may market some of our metallurgical coal products as a thermal coal product from time to time depending on market conditions.
Our Trading and Brokerage segment engages in the direct and brokered trading of coal and freight-related contracts through our trading and business offices. Coal brokering is conducted both as principal and agent in support of various coal production-related activities that may involve coal produced from our mines, coal sourcing arrangements with third-party mining companies or offtake agreements with other coal producers. Our Trading and Brokerage segment also provides transportation-related services, which involves both financial derivative contracts and physical contracts. Collectively, coal and freight-related hedging activities include both economic hedging and, from time to time, cash flow hedging in support of our coal trading strategy.
Our Corporate and Other segment includes selling and administrative expenses, corporate hedging activities, certain mining and export/transportation joint ventures, restructuring charges and activities associated with the optimization of our coal reserve and real estate holdings, minimum charges on certain transportation-related contracts, the closure of inactive mining sites and certain energy-related commercial matters.
Impact of Emergence from the Chapter 11 of the United States Bankruptcy Code
Upon emergence, in accordance with Accounting Standards Codification (ASC) 852, we applied fresh start reporting to our consolidated financial statements as of April 1, 2017 and became a new entity for financial reporting purposes reflecting the Successor (as defined below) capital structure. As a new entity, a new accounting basis in the identifiable assets and liabilities assumed was established with no retained earnings or accumulated other comprehensive income (loss). For additional details, refer to Note 1. “Summary of Significant Accounting Policies” and Note 2. “Emergence from the Chapter 11 Cases and Fresh Start Reporting” to the consolidated financial statements.
In connection with our emergence from the Chapter 11 Cases and the adoption of fresh start reporting, the results of operations for 2017 separately present a Successor period (for the period April 2, 2017 through December 31, 2017) and a Predecessor period (for the period January 1, 2017 through April 1, 2017). The results of operations for the years ended 2016 and 2015 are presented as Predecessor periods. References to “Successor” are in reference to reporting dates on or after April 2, 2017; references to “Predecessor” are in reference to reporting dates through April 1, 2017, which include the impact of the Plan provisions and the application of fresh start reporting. Although the 2017 Successor period and the 2017 Predecessor period are distinct reporting periods, the effects of emergence and fresh start reporting did not have a material impact on the comparability of our results of operations between the periods, unless otherwise noted below. Accordingly, references to 2017 results of operations for year ended December 31, 2017 combine the two periods to enhance the comparability of such information to the prior year.
Results of Operations
Non-GAAP Financial Measures
The following discussion of our results of operations includes references to and analysis of Adjusted EBITDA, which is a financial measure not recognized in accordance with U.S. GAAP. Adjusted EBITDA is used by management as the primary metric to measure each of our segment’s operating performance. We believe non-GAAP performance measures are used by investors to measure our operating performance and lenders to measure our ability to incur and service debt.
Adjusted EBITDA is defined as income (loss) from continuing operations before deducting net interest expense, income taxes, asset retirement obligation expenses, depreciation, depletion and amortization and reorganization items, net. Adjusted EBITDA is also adjusted for the discrete items that management excluded in analyzing each of our segment’s operating performance, as displayed in the reconciliation below. Adjusted EBITDA is not intended to serve as an alternative to U.S. GAAP measures of performance and may not be comparable to similarly-titled measures presented by other companies.
|
Peabody Energy Corporation
|
2017 Form 10-K
|
53
|
A reconciliation of Adjusted EBITDA to its most comparable measure under U.S. GAAP is included on page 52 of this report.
Also included in the following discussion of our results of operations are references to Revenues per Ton, Operating Costs per Ton and Adjusted EBITDA Margin per Ton for each reporting segment which are all non-GAAP measures. Revenues per Ton and Adjusted EBITDA Margin per Ton are approximately equal to revenues by segment and Adjusted EBITDA by segment, respectively, divided by segment tons sold. Operating Costs per Ton is equal to Revenues per Ton less Adjusted EBITDA Margin per Ton.
In our discussion of liquidity and capital resources, we include references to free cash flow which is a non-GAAP measure defined as net cash provided by operating activities less net cash used in investing activities. A reconciliation of free cash flow to its most comparable measure under U.S. GAAP is included herein. Free cash flow is used by management as a measure of our financial performance and our ability to generate excess cash flow from our business operations. Free cash flow is not intended to serve as an alternative to U.S. GAAP measures of performance and may not be comparable to similarly-titled measures presented by other companies.
Year Ended December 31,
2017
Compared to Year Ended December 31,
2016
Summary
Demand for seaborne metallurgical coal for the year ended December 31, 2017 increased 11 million tonnes or 4% compared to 2016, driven by a 5% increase in worldwide steel production, according to data published by the World Steel Association (WSA). Growth in seaborne metallurgical coal imports was driven by increased steel production in China and India compared to 2016. Global metallurgical coal supply and demand fundamentals were tight as total Australian metallurgical exports declined more than 15 million tonnes year-over-year through December due to cyclone impacts, logistical constraints and industry-wide operational challenges.
Demand for seaborne thermal coal for the year ended December 31, 2017 increased approximately 25 million tonnes or 3% compared to the prior year period, supported by a 5% increase in Chinese thermal electricity generation, according to data published by China Electricity Council. Growth in thermal coal imports in the Pacific region, led by China, South Korea and countries comprising the Association of Southeast Asian Nations (ASEAN), more than offset declining Atlantic basin demand. Lower year-over-year exports from Australia, Indonesia and Colombia resulted in an increase in higher-cost U.S. thermal exports to meet demand.
In the U.S., electricity generation from coal decreased 3% during the year ended December 31, 2017 compared to 2016 according to the U.S. Energy Information Administration (EIA). U.S. electricity generation from coal was unfavorably affected during that period by mild weather and weaker total electricity generation, coal plant retirements, stronger hydro generation and continued gains by renewables in the electricity generation mix. Conversely, coal benefited from higher average natural gas prices, which increased 18% year-over-year to $3.02/mmBtu from $2.55/mmBtu in 2016. Coal’s relative share of the electricity generation mix in 2017 was roughly flat at 30% of the total, while the relative share of natural gas declined from 34% in 2016 to 32% in 2017.
Spot pricing for premium low-vol hard coking coal (Premium HCC), premium low-vol pulverized coal injection (Premium PCI) coal, and Newcastle index thermal coal, and prompt month pricing for Powder River Basin (PRB) 8,880 Btu/Lb coal and Illinois Basin 11,500 Btu/Lb coal during the year ended December 31, 2017 is set forth in the table below. Pricing for our Western U.S. Mining segment is not included as there is no similar spot or prompt pricing data available.
In the U.S., the pricing included in the table below is not necessarily indicative of the pricing we realized during the year ended December 31, 2017 since we generally sell coal under long-term contracts where pricing is determined based on various factors. Such long-term contracts in the U.S. may vary significantly in many respects, including price adjustment features, price reopener terms, coal quality requirements, quantity parameters, permitted sources of supply, treatment of environmental constraints, extension options, force majeure and termination and assignment provisions. Competition from alternative fuels such as natural gas and other coal producers may also impact our realized pricing.
|
Peabody Energy Corporation
|
2017 Form 10-K
|
54
|
The seaborne pricing included in the table below is also not necessarily indicative of the pricing we realized during the year ended December 31, 2017 due to price discounts based on coal qualities and properties.
|
High
|
Low
|
Average
|
December 31, 2017
|
|||||||||||||
|
Premium HCC
|
$
|
304.00
|
|
$
|
139.50
|
|
$
|
188.00
|
|
$
|
262.25
|
|
||||
|
Premium PCI coal
|
$
|
185.00
|
|
$
|
101.15
|
|
$
|
119.10
|
|
$
|
147.05
|
|
||||
|
Newcastle index thermal coal
|
$
|
101.20
|
|
$
|
73.25
|
|
$
|
88.15
|
|
$
|
100.80
|
|
||||
|
PRB 8,800 Btu/Lb coal
|
$
|
12.60
|
|
$
|
10.95
|
|
$
|
11.75
|
|
$
|
12.60
|
|
||||
|
Illinois Basin 11,500 Btu/Lb coal
|
$
|
36.75
|
|
$
|
32.50
|
|
$
|
34.35
|
|
$
|
36.75
|
|
||||
Net income from continuing operations, net of income taxes of
$713.1 million
for the Successor period April 2 through December 31, 2017 included revenues of
$4,252.6 million
, a tax benefit of
$161.0 million
and net gain on disposals of
$84.0 million
. These were offset by operating costs of
$3,067.9 million
, depreciation, depletion and amortization of
$521.6 million
, interest expense of
$119.7 million
and selling and administrative expenses of
$105.4 million
. Adjusted EBITDA for the Successor period April 2 through December 31, 2017 was
$1,145.3 million
.
For the Predecessor period January 1 through April 1, 2017, net loss from continuing operations, net of income taxes of $195.5 million included revenues of $1,326.2 million and a tax benefit of $263.8 million. These were offset by operating costs of $963.7 million, depreciation, depletion and amortization of $119.9 million, interest expense of $32.9 million and reorganization items, net of $627.2 million which included the impact of the Plan provisions and the application of fresh start reporting. Adjusted EBITDA for the Predecessor period January 1 through April 1, 2017 was $341.3 million.
Net loss from continuing operations, net of income taxes of $663.8 million for the Predecessor Company’s year ended December 31, 2016 included revenues of $4,715.3 million, which were offset by operating costs of $4,107.6 million, depreciation, depletion and amortization of $465.4 million, interest expense of $298.6 million, asset impairment charges of $247.9 million, reorganization items, net of $159.0 million and selling and administrative expenses of $153.4 million. The Adjusted EBITDA for the year ended December 31, 2016 was $532.0 million.
As of December 31, 2017, our available liquidity was approximately $1.2 billion. Refer to the “Liquidity and Capital Resources” section contained within this Item 7 for a further discussion of factors affecting our available liquidity.
Tons Sold
The following table presents tons sold by operating segment:
|
2017
|
|
2016
|
||||||||||||||||
|
Successor
|
Predecessor
|
Combined
|
Predecessor
|
Increase (Decrease)
|
||||||||||||||
|
|
April 2 through December 31
|
|
|
January 1 through April 1
|
Year Ended
|
to Volumes
|
||||||||||||
|
|
|
|
December 31
|
Tons
|
%
|
|||||||||||||
|
|
(Tons in millions)
|
|
||||||||||||||||
|
Powder River Basin Mining
|
94.0
|
|
31.0
|
|
125.0
|
|
113.1
|
|
11.9
|
|
10.5
|
%
|
||||||
|
Midwestern U.S. Mining
|
14.0
|
|
4.5
|
|
18.5
|
|
18.3
|
|
0.2
|
|
1.1
|
%
|
||||||
|
Western U.S. Mining
|
11.3
|
|
3.4
|
|
14.7
|
|
13.7
|
|
1.0
|
|
7.3
|
%
|
||||||
|
Australian Metallurgical Mining
|
9.5
|
|
2.2
|
|
11.7
|
|
13.4
|
|
(1.7
|
)
|
(12.7
|
)%
|
||||||
|
Australian Thermal Mining
|
14.6
|
|
4.6
|
|
19.2
|
|
21.3
|
|
(2.1
|
)
|
(9.9
|
)%
|
||||||
|
Total tons sold from mining segments
|
143.4
|
|
45.7
|
|
189.1
|
|
179.8
|
|
9.3
|
|
5.2
|
%
|
||||||
|
Trading and Brokerage
|
2.0
|
|
0.4
|
|
2.4
|
|
7.0
|
|
(4.6
|
)
|
(65.7
|
)%
|
||||||
|
Total tons sold
|
145.4
|
|
46.1
|
|
191.5
|
|
186.8
|
|
4.7
|
|
2.5
|
%
|
||||||
|
Peabody Energy Corporation
|
2017 Form 10-K
|
55
|
Supplemental Financial Data
The following table presents supplemental financial data by operating segment:
|
2017
|
|
2016
|
|||||||||||||||||||||
|
Successor
|
Predecessor
|
Combined
|
Predecessor
|
||||||||||||||||||||
|
April 2 through December 31
|
|
|
January 1 through April 1
|
Year Ended
|
(Decrease) Increase
|
||||||||||||||||||
|
|
|
|
December 31
|
$
|
%
|
||||||||||||||||||
|
|
|
||||||||||||||||||||||
|
Revenues per Ton - Mining Operations
|
|||||||||||||||||||||||
|
Powder River Basin
|
$
|
12.54
|
|
$
|
12.70
|
|
$
|
12.58
|
|
$
|
13.02
|
|
$
|
(0.44
|
)
|
(3.4
|
)%
|
||||||
|
Midwestern U.S.
|
42.45
|
|
42.96
|
|
42.58
|
|
43.39
|
|
(0.81
|
)
|
(1.9
|
)%
|
|||||||||||
|
Western U.S.
|
38.75
|
|
44.68
|
|
40.10
|
|
38.30
|
|
1.80
|
|
4.7
|
%
|
|||||||||||
|
Australian Metallurgical
|
128.14
|
|
150.22
|
|
132.29
|
|
81.41
|
|
50.88
|
|
62.5
|
%
|
|||||||||||
|
Australian Thermal
|
52.84
|
|
48.65
|
|
51.83
|
|
38.79
|
|
13.04
|
|
33.6
|
%
|
|||||||||||
|
Operating Costs per Ton - Mining Operations
(1)
|
|
|
|||||||||||||||||||||
|
Powder River Basin
|
$
|
9.57
|
|
$
|
9.75
|
|
$
|
9.62
|
|
$
|
9.66
|
|
$
|
(0.04
|
)
|
(0.4
|
)%
|
||||||
|
Midwestern U.S.
|
33.53
|
|
31.84
|
|
33.13
|
|
31.49
|
|
1.64
|
|
5.2
|
%
|
|||||||||||
|
Western U.S.
|
27.16
|
|
29.76
|
|
27.75
|
|
30.90
|
|
(3.15
|
)
|
(10.2
|
)%
|
|||||||||||
|
Australian Metallurgical
|
84.60
|
|
100.16
|
|
87.52
|
|
82.63
|
|
4.89
|
|
5.9
|
%
|
|||||||||||
|
Australian Thermal
|
31.87
|
|
32.27
|
|
31.97
|
|
28.56
|
|
3.41
|
|
11.9
|
%
|
|||||||||||
|
Adjusted EBITDA Margin per Ton - Mining Operations
(1)
|
|
|
|||||||||||||||||||||
|
Powder River Basin
|
$
|
2.97
|
|
$
|
2.95
|
|
$
|
2.96
|
|
$
|
3.36
|
|
$
|
(0.40
|
)
|
(11.9
|
)%
|
||||||
|
Midwestern U.S.
|
8.92
|
|
11.12
|
|
9.45
|
|
11.90
|
|
(2.45
|
)
|
(20.6
|
)%
|
|||||||||||
|
Western U.S.
|
11.59
|
|
14.92
|
|
12.35
|
|
7.40
|
|
4.95
|
|
66.9
|
%
|
|||||||||||
|
Australian Metallurgical
|
43.54
|
|
50.06
|
|
44.77
|
|
(1.22
|
)
|
45.99
|
|
3,769.7
|
%
|
|||||||||||
|
Australian Thermal
|
20.97
|
|
16.38
|
|
19.86
|
|
10.23
|
|
9.63
|
|
94.1
|
%
|
|||||||||||
|
(1)
|
Includes revenue-based production taxes and royalties; excludes depreciation, depletion and amortization; asset retirement obligation expenses; selling and administrative expenses; restructuring charges; asset impairment; coal inventory revaluation; take-or-pay contract-based intangible recognition; and certain other costs related to post-mining activities. Adjusted EBITDA margin per ton is approximately equivalent to segment Adjusted EBITDA divided by segment tons sold.
|
Revenues
The following table presents revenues by reporting segment:
|
2017
|
2016
|
||||||||||||||||||||||
|
Successor
|
Predecessor
|
Combined
|
Predecessor
|
Increase (Decrease)
|
|||||||||||||||||||
|
April 2 through December 31
|
|
|
January 1 through April 1
|
Year Ended
|
to Revenues
|
||||||||||||||||||
|
|
|
|
December 31
|
$
|
%
|
||||||||||||||||||
|
|
(Dollars in millions)
|
|
|||||||||||||||||||||
|
Powder River Basin Mining
|
$
|
1,178.7
|
|
$
|
394.3
|
|
$
|
1,573.0
|
|
$
|
1,473.3
|
|
$
|
99.7
|
|
6.8
|
%
|
||||||
|
Midwestern U.S. Mining
|
592.3
|
|
193.2
|
|
785.5
|
|
792.5
|
|
(7.0
|
)
|
(0.9
|
)%
|
|||||||||||
|
Western U.S. Mining
|
440.7
|
|
149.7
|
|
590.4
|
|
526.0
|
|
64.4
|
|
12.2
|
%
|
|||||||||||
|
Australian Metallurgical Mining
|
1,221.0
|
|
328.9
|
|
1,549.9
|
|
1,090.4
|
|
459.5
|
|
42.1
|
%
|
|||||||||||
|
Australian Thermal Mining
|
772.5
|
|
224.8
|
|
997.3
|
|
824.9
|
|
172.4
|
|
20.9
|
%
|
|||||||||||
|
Trading and Brokerage
|
33.6
|
|
15.0
|
|
48.6
|
|
28.9
|
|
19.7
|
|
68.2
|
%
|
|||||||||||
|
Corporate and Other
|
13.8
|
|
20.3
|
|
34.1
|
|
(20.7
|
)
|
54.8
|
|
264.7
|
%
|
|||||||||||
|
Total revenues
|
$
|
4,252.6
|
|
$
|
1,326.2
|
|
$
|
5,578.8
|
|
$
|
4,715.3
|
|
$
|
863.5
|
|
18.3
|
%
|
||||||
|
Peabody Energy Corporation
|
2017 Form 10-K
|
56
|
Powder River Basin Mining.
The increase in Powder River Basin Mining segment revenues during the year ended December 31, 2017 compared to the prior year was due to demand-based volume increases of 11.9 million tons across the region as the result of increased natural gas pricing ($159.7 million) which drove a switch from natural gas to coal by customers. This increase was partially offset by lower realized coal pricing ($60.0 million).
Midwestern U.S. Mining.
Revenues from our Midwestern U.S. Mining segment were adversely impacted during the year ended December 31, 2017 compared to the prior year by lower realized coal pricing ($8.6 million) which was slightly offset by favorable volume and mix variances ($1.6 million).
Western U.S. Mining.
The increase in Western U.S. Mining segment revenues for the year ended December 31, 2017 compared to the prior year was predominately driven by favorable volume and mix variances ($46.8 million) and collection of liquidated damage settlements ($21.5 million).
Australian Metallurgical Mining.
The increase in our Australian Metallurgical Mining segment revenues for the year ended December 31, 2017 compared to the prior year was primarily due to significantly improved realized coal pricing ($590.6 million) which was partially offset by an unfavorable volume and mix variance ($131.1 million). The volume decrease which reflected the cessation of mining activities at our Burton Mine during the fourth quarter of 2016, the impact of Cyclone Debbie and an extended longwall move at the Metropolitan Mine during the first half of 2017, was partially offset by increased productivity at the North Goonyella Mine during 2017.
Australian Thermal Mining.
The increase in our Australian Thermal Mining segment revenues for the year ended December 31, 2017 compared to the prior year was primarily driven by significantly improved realized coal pricing ($240.0 million). The increase was partially offset by the unfavorable impact of changes in volume and mix ($67.6 million) which was attributable to lower sales volumes from our Wambo Mine as the result of temporary geological issues and an extended longwall move.
Trading and Brokerage.
Revenues from our Trading and Brokerage segment increased for the year ended December 31, 2017 compared to the prior year due to increased prices.
Corporate and Other.
The increase in Corporate and Other revenues for the year ended December 31, 2017 compared to the prior year was due to improved results on economic hedges ($33.4 million) and the receipt of break fees ($28.0 million) related to terminated asset sale agreements which are further described in Note 21. “Resource Management, Acquisitions and Other Commercial Events” of the accompanying consolidated financial statements.
|
Peabody Energy Corporation
|
2017 Form 10-K
|
57
|
Income (Loss) From Continuing Operations, Net of Income Taxes
The following table presents income (loss) from continuing operations, net of income taxes:
|
2017
|
|
2016
|
||||||||||||||
|
|
Successor
|
Predecessor
|
Combined
|
Predecessor
|
||||||||||||
|
|
April 2 through December 31
|
|
|
January 1 through April 1
|
Year Ended
|
|||||||||||
|
|
|
|
December 31
|
|||||||||||||
|
|
(Dollars in millions)
|
|||||||||||||||
|
Income (loss) from continuing operations, net of income taxes
|
$
|
713.1
|
|
$
|
(195.5
|
)
|
$
|
517.6
|
|
$
|
(663.8
|
)
|
||||
|
Depreciation, depletion and amortization
|
(521.6
|
)
|
(119.9
|
)
|
(641.5
|
)
|
(465.4
|
)
|
||||||||
|
Asset retirement obligation expenses
|
(41.2
|
)
|
(14.6
|
)
|
(55.8
|
)
|
(41.8
|
)
|
||||||||
|
Selling and administrative expenses related to debt restructuring
|
—
|
|
—
|
|
—
|
|
(21.5
|
)
|
||||||||
|
Net mark-to-market adjustment on actuarially determined liabilities
|
45.2
|
|
—
|
|
45.2
|
|
—
|
|
||||||||
|
Asset impairment
|
—
|
|
(30.5
|
)
|
(30.5
|
)
|
(247.9
|
)
|
||||||||
|
Changes in deferred tax asset valuation allowance and amortization of basis difference related to equity affiliates
|
17.3
|
|
5.2
|
|
22.5
|
|
7.5
|
|
||||||||
|
Interest expense
|
(119.7
|
)
|
(32.9
|
)
|
(152.6
|
)
|
(298.6
|
)
|
||||||||
|
Loss on early debt extinguishment
|
(20.9
|
)
|
—
|
|
(20.9
|
)
|
(29.5
|
)
|
||||||||
|
Interest income
|
5.6
|
|
2.7
|
|
8.3
|
|
5.7
|
|
||||||||
|
Reorganization items, net
|
—
|
|
(627.2
|
)
|
(627.2
|
)
|
(159.0
|
)
|
||||||||
|
Gain on disposal of reclamation liability
|
31.2
|
|
—
|
|
31.2
|
|
—
|
|
||||||||
|
Gain on disposal of Burton Mine
|
52.2
|
|
—
|
|
52.2
|
|
—
|
|
||||||||
|
Break fees related to terminated asset sales
|
28.0
|
|
—
|
|
28.0
|
|
—
|
|
||||||||
|
Unrealized (losses) gains on economic hedges
|
(23.0
|
)
|
16.6
|
|
(6.4
|
)
|
(39.8
|
)
|
||||||||
|
Unrealized losses on non-coal trading derivative contracts
|
(1.5
|
)
|
—
|
|
(1.5
|
)
|
—
|
|
||||||||
|
Coal inventory revaluation
|
(67.3
|
)
|
—
|
|
(67.3
|
)
|
—
|
|
||||||||
|
Take-or-pay contract-based intangible recognition
|
22.5
|
|
—
|
|
22.5
|
|
—
|
|
||||||||
|
Income tax benefit
|
161.0
|
|
263.8
|
|
424.8
|
|
94.5
|
|
||||||||
|
Adjusted EBITDA
|
$
|
1,145.3
|
|
$
|
341.3
|
|
$
|
1,486.6
|
|
$
|
532.0
|
|
||||
Results from continuing operations, net of income taxes for the Successor period ended December 31, 2017 included Adjusted EBITDA of $1,145.3 million and income tax benefit of $161.0 million, which were partially offset by depreciation, depletion and amortization and interest expense.
Results from continuing operations, net of income taxes for the Predecessor period January 1 through April 1, 2017 were impacted by reorganization items, net, depreciation, depletion and amortization and interest expense. These results were partially offset by Adjusted EBITDA of $341.3 million and income tax benefit of $263.8 million.
During the year ended December 31, 2016, the Predecessor Company’s results from continuing operations, net of income taxes included Adjusted EBITDA of $532.0 million, which was offset by depreciation, depletion and amortization, interest expense, asset impairment charges and reorganization items, net.
|
Peabody Energy Corporation
|
2017 Form 10-K
|
58
|
Adjusted EBITDA
The following table presents Adjusted EBITDA for each of our reporting segments:
|
2017
|
|
2016
|
|||||||||||||||||||||
|
Successor
|
Predecessor
|
Combined
|
Predecessor
|
(Decrease) Increase to
|
|||||||||||||||||||
|
|
April 2 through December 31
|
|
|
January 1 through April 1
|
Year Ended
|
Adjusted EBITDA
|
|||||||||||||||||
|
|
|
|
December 31
|
$
|
%
|
||||||||||||||||||
|
|
(Dollars in millions)
|
|
|||||||||||||||||||||
|
Powder River Basin Mining
|
$
|
278.8
|
|
$
|
91.7
|
|
$
|
370.5
|
|
$
|
379.9
|
|
$
|
(9.4
|
)
|
(2.5
|
)%
|
||||||
|
Midwestern U.S. Mining
|
124.4
|
|
50.0
|
|
174.4
|
|
217.3
|
|
(42.9
|
)
|
(19.7
|
)%
|
|||||||||||
|
Western U.S. Mining
|
131.8
|
|
50.0
|
|
181.8
|
|
101.6
|
|
80.2
|
|
78.9
|
%
|
|||||||||||
|
Australian Metallurgical Mining
|
414.9
|
|
109.6
|
|
524.5
|
|
(16.3
|
)
|
540.8
|
|
3,317.8
|
%
|
|||||||||||
|
Australian Thermal Mining
|
306.6
|
|
75.6
|
|
382.2
|
|
217.6
|
|
164.6
|
|
75.6
|
%
|
|||||||||||
|
Trading and Brokerage
|
(6.9
|
)
|
8.8
|
|
1.9
|
|
(32.4
|
)
|
34.3
|
|
105.9
|
%
|
|||||||||||
|
Corporate and Other
|
(104.3
|
)
|
(44.4
|
)
|
(148.7
|
)
|
(335.7
|
)
|
187.0
|
|
55.7
|
%
|
|||||||||||
|
Adjusted EBITDA
|
$
|
1,145.3
|
|
$
|
341.3
|
|
$
|
1,486.6
|
|
$
|
532.0
|
|
$
|
954.6
|
|
179.4
|
%
|
||||||
Powder River Basin Mining.
The decrease in Powder River Basin Mining segment Adjusted EBITDA during the year ended December 31, 2017 compared to the prior year was due to lower realized coal pricing, net of sales-related costs ($64.9 million), increased pricing for fuel and explosives ($13.9 million) and higher materials, services and repairs costs ($13.0 million). This was partially offset by improved volumes driven by increased natural gas pricing ($44.3 million), reduced expenses for leases due to early lease buyouts ($21.9 million) and favorable labor spending ($8.3 million).
Midwestern U.S. Mining.
The decrease in Midwestern U.S. Mining segment Adjusted EBITDA for the year ended December 31, 2017 compared to the prior year was due to higher materials, services and repairs costs ($19.2 million), lower realized coal pricing, net of sales-related costs ($11.4 million), increased pricing for fuel and explosives ($10.9 million) and higher labor spending ($9.0 million), partially offset by improved volumes primarily at our Gateway North Mine ($11.6 million).
Western U.S. Mining.
The increase in Western U.S. Mining segment Adjusted EBITDA during the year ended December 31, 2017 compared to the prior year was driven by improved sales volumes from higher margin operations ($42.0 million), liquidated damage settlements collected during 2017 ($21.5 million), the favorable impact of mine sequencing at our Kayenta Mine ($10.7 million) and decreased spending for materials, services and repairs costs ($10.3 million)
Australian Metallurgical Mining.
The improvement in Australian Metallurgical Mining segment Adjusted EBITDA during the year ended December 31, 2017 compared to the prior year reflected improved realized coal pricing, net of sales-related costs ($544.4 million), improved production volumes at our North Goonyella Mine ($87.6 million) primarily due to longwall moves in the prior year and lower contractor and rail costs due to the cessation of mining activities at our Burton Mine during the fourth quarter of 2016 ($10.6 million). The increases were offset by lower production at our Metropolitan Mine due to an extended longwall move in the first half of 2017 ($40.4 million), higher fuel pricing and cost escalations ($32.6 million), unfavorable foreign exchange rate movements ($16.0 million) and increased demurrage costs ($9.1 million) due to the impact of Cyclone Debbie, logistical constraints and scheduled port maintenance.
Australian Thermal Mining.
The increase in Australian Thermal Mining segment Adjusted EBITDA during the year ended December 31, 2017 compared to the prior year reflected improved realized coal pricing, net of sales-related costs ($221.2 million), offset by lower sales volumes primarily at our Wambo Mine as the result of temporary geological issues and an extended longwall move ($27.2 million) and higher fuel pricing and other cost escalations ($17.6 million).
Trading and Brokerage.
The increase in Trading and Brokerage segment Adjusted EBITDA during the year ended December 31, 2017 compared to the prior year reflected normalization of business and overall market opportunities during 2017.
|
Peabody Energy Corporation
|
2017 Form 10-K
|
59
|
Corporate and Other Adjusted EBITDA.
The following table presents a summary of the components of Corporate and Other Adjusted EBITDA:
|
2017
|
|
2016
|
|||||||||||||||||||||
|
Successor
|
Predecessor
|
Combined
|
Predecessor
|
(Decrease) Increase
|
|||||||||||||||||||
|
April 2 through December 31
|
|
|
January 1 through April 1
|
Year Ended
|
to Income
|
||||||||||||||||||
|
|
|
|
December 31
|
$
|
%
|
||||||||||||||||||
|
|
(Dollars in millions)
|
||||||||||||||||||||||
|
Resource management activities
(1)
|
$
|
2.5
|
|
$
|
2.9
|
|
$
|
5.4
|
|
$
|
19.0
|
|
$
|
(13.6
|
)
|
(71.6
|
)%
|
||||||
|
Selling and administrative expenses
(excluding debt restructuring)
|
(105.4
|
)
|
(37.2
|
)
|
(142.6
|
)
|
(131.9
|
)
|
(10.7
|
)
|
(8.1
|
)%
|
|||||||||||
|
Restructuring charges
|
(7.6
|
)
|
—
|
|
(7.6
|
)
|
(15.5
|
)
|
7.9
|
|
51.0
|
%
|
|||||||||||
|
Corporate hedging
|
3.2
|
|
(27.6
|
)
|
(24.4
|
)
|
(241.0
|
)
|
216.6
|
|
89.9
|
%
|
|||||||||||
|
UMWA voluntary employee beneficiary association settlement
|
—
|
|
—
|
|
—
|
|
68.1
|
|
(68.1
|
)
|
(100.0
|
)%
|
|||||||||||
|
Gain on sale of interest in Dominion Terminal Associates
|
—
|
|
19.7
|
|
19.7
|
|
—
|
|
19.7
|
|
n.m.
|
|
|||||||||||
|
Other items, net
(2)
|
3.0
|
|
(2.2
|
)
|
0.8
|
|
(34.4
|
)
|
35.2
|
|
102.3
|
%
|
|||||||||||
|
Corporate and Other Adjusted EBITDA
|
$
|
(104.3
|
)
|
$
|
(44.4
|
)
|
$
|
(148.7
|
)
|
$
|
(335.7
|
)
|
$
|
187.0
|
|
55.7
|
%
|
||||||
|
(1)
|
Includes gains (losses) on certain surplus coal reserve and surface land sales and property management costs and revenues.
|
|
(2)
|
Includes results from equity affiliates (before the impact of related changes in deferred tax asset valuation allowance and amortization of basis difference), costs associated with post mining activities, certain coal royalty expenses, gains (losses) on certain asset disposals, minimum charges on certain transportation-related contracts and expenses related to our other commercial activities.
|
The increase associated with corporate hedging results, which includes foreign currency and commodity hedging, was due to a decrease in realized losses during the year ended December 31, 2017 as compared to the same period in the prior year due to changes in our hedging activity and elimination of amounts previously deferred in “Accumulated other comprehensive income (loss)” resulting from the application of fresh start reporting. The increase associated with “Other items, net” was primarily attributable to improved Middlemount results driven by higher pricing as compared to the prior year. During the first quarter of 2017, a $19.7 million gain was recorded in connection with the sale of our interest in Dominion Terminal Associates. The reduction in restructuring charges for the year ended December 31, 2017 was driven by workforce reductions made during 2016 at multiple mines in our Powder River Basin Mining and Midwestern U.S. Mining segments, partially offset by a provision recorded during 2017 for the expected closure of the Millennium Mine in the second half of 2019. During 2016, a gain of $68.1 million was recognized for the voluntary employee beneficiary association (VEBA) settlement with the United Mine Workers of America (UMWA) as further described in Note 4. “Discontinued Operations” of the accompanying consolidated financial statements. Resource management results decreased during the year ended December 31, 2017 as compared to the prior year due to higher gains from the disposal of surplus lands during 2016. The increase in selling and administrative expenses was driven by charges for shared-based compensation expense.
Depreciation, Depletion and Amortization.
The following table presents a summary of depreciation, depletion and amortization expense by segment:
|
2017
|
2016
|
|||||||||||
|
Successor
|
Predecessor
|
Predecessor
|
||||||||||
|
April 2 through December 31
|
|
|
January 1 through April 1
|
Year Ended
|
||||||||
|
|
|
|
December 31
|
|||||||||
|
|
(Dollars in millions)
|
|||||||||||
|
Powder River Basin Mining
|
$
|
(156.6
|
)
|
$
|
(32.0
|
)
|
$
|
(123.4
|
)
|
|||
|
Midwestern U.S. Mining
|
(105.2
|
)
|
(13.3
|
)
|
(56.2
|
)
|
||||||
|
Western U.S. Mining
|
(87.8
|
)
|
(23.6
|
)
|
(45.2
|
)
|
||||||
|
Australian Metallurgical Mining
|
(100.2
|
)
|
(20.6
|
)
|
(118.7
|
)
|
||||||
|
Australian Thermal Mining
|
(62.3
|
)
|
(24.0
|
)
|
(102.5
|
)
|
||||||
|
Trading and Brokerage
|
(0.2
|
)
|
—
|
|
(0.2
|
)
|
||||||
|
Corporate and Other
|
(9.3
|
)
|
(6.4
|
)
|
(19.2
|
)
|
||||||
|
Total
|
$
|
(521.6
|
)
|
$
|
(119.9
|
)
|
$
|
(465.4
|
)
|
|||
|
Peabody Energy Corporation
|
2017 Form 10-K
|
60
|
Additionally, the following table presents a summary of our weighted-average depletion rate per ton for active mines in each of our mining segments:
|
2017
|
2016
|
|||||||||||
|
Successor
|
Predecessor
|
Predecessor
|
||||||||||
|
April 2 through December 31
|
January 1 through April 1
|
Year Ended December 31
|
||||||||||
|
Powder River Basin Mining
|
$
|
0.82
|
|
$
|
0.69
|
|
$
|
0.71
|
|
|||
|
Midwestern U.S. Mining
|
0.79
|
|
0.61
|
|
0.53
|
|
||||||
|
Western U.S. Mining
|
1.06
|
|
4.30
|
|
0.92
|
|
||||||
|
Australian Metallurgical Mining
|
0.72
|
|
4.72
|
|
4.36
|
|
||||||
|
Australian Thermal Mining
|
0.59
|
|
2.62
|
|
2.53
|
|
||||||
Depreciation, depletion and amortization expense for the Successor period ended December 31, 2017 included depreciation expense ($203.3 million), depletion expense ($132.0 million), amortization of the fair value of certain U.S. coal supply agreements ($121.3 million) and amortization associated with our asset retirement obligation assets ($40.3 million).
Depreciation, depletion and amortization expense for the Predecessor period January 1 through April 1, 2017 reflected additional expense at some of our mines due to changes in the estimated life of mine and at Corporate and Other for leasehold improvements that were vacated in 2017. The additional expense was offset by a decrease at our Metropolitan Mine as the assets were classified as held for sale during the period and depreciation, depletion and amortization was therefore not recorded. The share sale and purchase agreement related to our Metropolitan Mine was terminated in April 2017, as discussed in Note 21. “Resource Management, Acquisitions and Other Commercial Events” to the accompanying consolidated financial statements. Depreciation, depletion and amortization expense for the year ended December 31, 2016 was impacted by a reduction in the asset bases at several of our mines due to impairment charges that had been recognized during 2015.
Asset Retirement Obligation Expenses.
Included in the asset retirement obligation expenses recorded during the Successor period ended December 31, 2017 were unfavorable closed mine true-ups and increased ongoing reclamation adjustments related to rate increases at various locations. During the Predecessor year ended December 31, 2016, credits were recorded for ongoing reclamation due to accelerated work which lowered the overall expense.
Selling and Administrative Expenses Related to Debt Restructuring.
The general and administrative expenses related to debt restructuring recorded during the year ended December 31, 2016 related to legal and other expenditures made in connection with debt restructuring initiatives prior to the Debtors’ filing of the Bankruptcy Petitions.
Net Mark-to-Market Adjustment on Actuarially Determined Liabilities.
In connection with fresh start reporting, an accounting policy election was made to record amounts attributable to prior service cost and actuarial valuation changes for our pension and postretirement plans in earnings rather than accumulated other comprehensive income. During the Successor period ended December 31, 2017 a gain was recorded that was driven by actuarial gains on pension assets ($46.7 million), changes to demographic assumptions, including terminations, retirement and morbidity rates, for our postretirement plans ($34.9 million) and mortality rates for both the pension and postretirement plans ($32.7 million). These gains were offset by decreases to the discount rates for all plans ($71.1 million).
Asset Impairment.
We recognized
$30.5 million
and $247.9 million in aggregate asset impairment charges during the Predecessor period of January 1 through April 1, 2017 and the year ended December 31, 2016, respectively. Refer to Note 3. “Asset Impairment” to the accompanying consolidated financial statements for further information regarding the nature and composition of those charges, which information is incorporated herein by reference.
Interest Expense.
Interest expense for the Successor period ended December 31, 2017 primarily related to the 6.000% Senior Secured Notes due March 2022, the 6.375% Senior Secured Notes due March 2025 and the Senior Secured Term Loan due 2022 (Senior Secured Term Loan). For additional details on debt, refer to Note 2. “Emergence from the Chapter 11 Cases and Fresh Start Reporting” and Note 13. “Current and Long-term Debt” to the accompanying consolidated financial statements.
Interest expense for the Predecessor period January 1 through April 1, 2017 and the year ended December 31, 2016, was impacted by our filing of the Bankruptcy Petitions, which resulted in only accruing adequate protection payments subsequent to the Petition Date to certain secured lenders and other parties in accordance with Section 502(b)(2) of the Bankruptcy Code.
|
Peabody Energy Corporation
|
2017 Form 10-K
|
61
|
Loss on Early Debt Extinguishment.
The loss on early debt extinguishment recorded during the Successor period ended December 31, 2017 related to the voluntary prepayments and amendment of the Senior Secured Term Loan as described in Note 13. “Current and Long-term Debt” to the accompanying consolidated financial statements. The loss on early debt extinguishment recorded during the Predecessor year ended December 31, 2016 was related to the repayment of our Debtor-In-Possession (DIP) Term Loan Facility.
Reorganization Items, Net.
The reorganization items recorded during the Predecessor period January 1 through April 1, 2017 reflected the impact of the Plan provisions and the application of fresh start reporting. Expense recorded during the year ended December 31, 2016 related to expenses recorded in connection with our Chapter 11 Cases. Refer to Note 2. “Emergence from the Chapter 11 Cases and Fresh Start Reporting” to the accompanying consolidated financial statements for further information regarding our reorganization items.
Gain on Disposal of Reclamation Liability.
During the Successor period ended December 31, 2017, we recorded a gain of $31.2 million on the extinguishment of a guarantee liability for reclamation and bonding commitments which is further described in Note 21. “Resource Management, Acquisitions and Other Commercial Events” of the accompanying consolidated financial statements.
Gain on Disposal of Burton Mine.
During the Successor period ended December 31, 2017, we recorded a gain of $52.2 million on the sale of our majority of the Burton Mine and related infrastructure which is further described in Note 21. “Resource Management, Acquisitions and Other Commercial Events” of the accompanying consolidated financial statements.
Break Fees Related to Terminated Asset Sales.
During the Successor period ended December 31, 2017 we received break fees of $28.0 million related to terminated asset sale agreements which are further described in Note 21. “Resource Management, Acquisitions and Other Commercial Events” of the accompanying consolidated financial statements.
Unrealized (Losses) Gains on Economic Hedges.
Unrealized (losses) gains primarily related to mark-to-market activity from financial contract trading activities.
Coal Inventory Revaluation.
As a part of the fresh start reporting adjustments, the book value of coal inventories was increased to reflect the estimated fair value, less costs to sell the inventories. During the Successor period ended December 31, 2017, this adjustment was fully amortized as the inventory was sold. For additional details, refer to Note 2. “Emergence from the Chapter 11 Cases and Fresh Start Reporting” to the accompanying consolidated financial statements.
Take-or-Pay Contract-Based Intangible Recognition
. Included in the fresh start reporting adjustments were contract-based intangible liabilities for port and rail take-or-pay contracts. During the Successor period ended December 31, 2017 we ratably recognized these contract-based intangible liabilities. For additional details, refer to Note 2. “Emergence from the Chapter 11 Cases and Fresh Start Reporting” to the accompanying consolidated financial statements.
Income Tax Benefit
. The income tax benefit recorded for the Successor period ended December 31, 2017 reflected the estimated benefit for the newly enacted tax legislation primarily related to alternative minimum tax credits and expected refunds for U.S. net operating loss carrybacks.
The income tax benefit recorded for the Predecessor period January 1 through April 1, 2017, was primarily comprised of benefits related to Predecessor deferred tax liabilities ($177.8 million), accumulated other comprehensive income ($81.5 million) and unrecognized tax benefits ($6.7 million). Refer to Note 11. “Income Taxes” in the accompanying consolidated financial statements for additional information.
|
Peabody Energy Corporation
|
2017 Form 10-K
|
62
|
Net Income (Loss) Attributable to Common Stockholders
The following table presents net income (loss) attributable to common stockholders:
|
2017
|
|
2016
|
||||||||||
|
Successor
|
Predecessor
|
Predecessor
|
||||||||||
|
April 2 through December 31
|
|
|
January 1 through April 1
|
Year Ended
|
||||||||
|
|
|
December 31
|
||||||||||
|
|
(Dollars in millions)
|
|||||||||||
|
Income (loss) from continuing operations, net of income taxes
|
$
|
713.1
|
|
$
|
(195.5
|
)
|
$
|
(663.8
|
)
|
|||
|
Loss from discontinued operations, net of income taxes
|
(19.8
|
)
|
(16.2
|
)
|
(57.6
|
)
|
||||||
|
Net income (loss)
|
693.3
|
|
(211.7
|
)
|
(721.4
|
)
|
||||||
|
Less: Series A Convertible Preferred Stock dividends
|
179.5
|
|
—
|
|
—
|
|
||||||
|
Less: Net income attributable to noncontrolling interests
|
15.2
|
|
4.8
|
|
7.9
|
|
||||||
|
Net income (loss) attributable to common stockholders
|
$
|
498.6
|
|
$
|
(216.5
|
)
|
$
|
(729.3
|
)
|
|||
Loss from Discontinued Operations, Net of Income Taxes
. The loss from discontinued operations for the Predecessor period of January 1 through April 1, 2017 primarily consisted of fresh start tax adjustments ($12.1 million) as discussed in Note 2. “Emergence from the Chapter 11 Cases and Fresh Start Reporting” to the accompanying consolidated financial statements. The loss from discontinued operations for the Predecessor year ended December 31, 2016 included a charge of $54.3 million associated with the UMWA 1974 Pension Plan which is further described in Note 4. “Discontinued Operations” to the accompanying consolidated financial statements.
Series A Convertible Preferred Stock Dividends
. The Series A Convertible Preferred Stock dividends for the Successor period ended December 31, 2017 were comprised of the deemed dividends ($160.7 million) granted for the preferred stock shares that were converted during the period and the semi-annual payable in-kind preferred dividends ($18.8 million).
Diluted EPS
The following table presents diluted EPS:
|
2017
|
2016
|
|||||||||||
|
Successor
|
Predecessor
|
Predecessor
|
||||||||||
|
April 2 through December 31
|
January 1 through April 1
|
Year Ended
|
||||||||||
|
|
December 31
|
|||||||||||
|
Diluted EPS attributable to common stockholders:
|
||||||||||||
|
Income (loss) from continuing operations
|
$
|
3.81
|
|
$
|
(10.93
|
)
|
$
|
(36.72
|
)
|
|||
|
Loss from discontinued operations
|
(0.14
|
)
|
(0.88
|
)
|
(3.15
|
)
|
||||||
|
Net income (loss)
|
$
|
3.67
|
|
$
|
(11.81
|
)
|
$
|
(39.87
|
)
|
|||
Diluted EPS is commensurate with the changes in results from continuing operations and discontinued operations during that period. Diluted EPS for the Successor Company reflects weighted average diluted common shares outstanding of 102.5 million for the period April 2 through December 31, 2017. Diluted EPS for the Predecessor periods January 1 through April 1, 2017 and the year ended December 31, 2016 reflect weighted average diluted common shares outstanding of 18.3 million, respectively.
Year Ended December 31, 2016 Compared to Year Ended December 31, 2015
Summary
Demand for seaborne metallurgical coal for the year ended December 31, 2016 increased compared to 2015, driven by stronger demand in China following policy measures reducing domestic coal production and on stronger China steel production. Worldwide steel production increased by 0.8% in 2016, according to data published by the WSA, with China’s crude steel production up 1.2% compared to 2015. International seaborne metallurgical and thermal coal prices increased sharply in the second half of 2016, reaching multi-year highs driven by tightening coal supply and improved coal import demand from China.
|
Peabody Energy Corporation
|
2017 Form 10-K
|
63
|
Spot pricing for Premium HCC, Premium PCI coal, and Newcastle index thermal coal, and prompt month pricing for PRB 8,880 Btu/Lb coal and Illinois Basin 11,500 Btu/Lb coal during the year ended December 31, 2016 is set forth in the table below. Pricing for our Western U.S. Mining segment is not included as there is no similar spot or prompt pricing data available. In the U.S., the pricing included in the table below is not necessarily indicative of the pricing we realized during the year ended December 31, 2016 since we generally sell coal under long-term contracts where pricing is determined based on various factors. Such long-term contracts in the U.S. may vary significantly in many respects, including price adjustment features, price reopener terms, coal quality requirements, quantity parameters, permitted sources of supply, treatment of environmental constraints, extension options, force majeure and termination and assignment provisions. Competition from alternative fuels such as natural gas and other coal producers may also impact our realized pricing.
The pricing included in the table below is also not necessarily indicative of the pricing we realized during the year ended December 31, 2016 due to price discounts based on coal qualities and properties.
|
High
|
Low
|
Average
|
December 31, 2016
|
|||||||||||||
|
Premium HCC
|
$
|
300.00
|
|
$
|
73.25
|
|
$
|
143.24
|
|
$
|
230.00
|
|
||||
|
Premium PCI coal
|
$
|
188.65
|
|
$
|
65.65
|
|
$
|
97.23
|
|
$
|
112.10
|
|
||||
|
Newcastle index thermal coal
|
$
|
114.75
|
|
$
|
48.80
|
|
$
|
65.65
|
|
$
|
88.40
|
|
||||
|
PRB 8,800 Btu/Lb coal
|
$
|
12.10
|
|
$
|
8.48
|
|
$
|
10.19
|
|
$
|
12.10
|
|
||||
|
Illinois Basin 11,500 Btu/Lb coal
|
$
|
37.00
|
|
$
|
28.50
|
|
$
|
31.39
|
|
$
|
35.00
|
|
||||
In the U.S., electricity generation from coal decreased 9% during the year ended December 31, 2016 compared to 2015, according to the U.S. EIA. U.S. electricity generation from coal was unfavorably affected during that period by coal-to-gas switching due to comparatively low natural gas prices during the first half of 2016, high coal stockpiles and lower heating-degree days due to mild weather. During the first half of 2016 coal and natural gas accounted for 28% and 33%, respectively, of the electricity generation mix. During the second half of 2016, coal increased its relative share of the generation mix, as coal and natural gas accounted for approximately 32% and 34%, respectively, of electricity generation.
Our revenues decreased during the year ended December 31, 2016 compared to the prior year (
$893.9 million
) primarily due to lower realized pricing in the U.S. and internationally and lower sales volumes driven by the demand and production factors mentioned above.
To mitigate the impact of lower coal pricing, we continued to drive operational efficiencies, optimize production across our mining platform and control expenses at all operational and administrative levels of the organization, which contributed to year-over-year decreases in our operating costs and expenses ($900.1 million) and selling and administrative expenses ($23.0 million). Also included in operating results for the year ended December 31, 2016 were aggregate restructuring charges of $15.5 million, recognized in connection with certain actions initiated to reduce headcount and costs across our operating segments and administrative functions, which were expected to better align our workforce with our near-term outlook and improve our cost position moving forward.
Loss from continuing operations, net of income taxes was
$663.8 million
for the year ended December 31, 2016, a decrease of
$1,119.4 million
compared to the loss from continuing operations, net of income taxes of
$1,783.2 million
in the prior year. Overall, Adjusted EBITDA of $532.0 million for the year ended December 31, 2016 reflected a year-over-year increase of $99.6 million. In addition to higher Adjusted EBITDA, the results were favorably impacted by lower asset impairment charges and decreased interest expense. These factors were partially offset by reorganization items recorded in connection with our Chapter 11 Cases.
|
Peabody Energy Corporation
|
2017 Form 10-K
|
64
|
Tons Sold
The following table presents tons sold by operating segment:
|
Predecessor
|
|||||||||||
|
|
Year Ended December 31
|
(Decrease) Increase
to Tons Sold
|
|||||||||
|
|
2016
|
|
2015
|
Tons
|
%
|
||||||
|
|
(Tons in millions)
|
||||||||||
|
Powder River Basin Mining
|
113.1
|
|
138.8
|
|
(25.7
|
)
|
(18.5
|
)%
|
|||
|
Midwestern U.S. Mining
|
18.3
|
|
21.2
|
|
(2.9
|
)
|
(13.7
|
)%
|
|||
|
Western U.S. Mining
|
13.7
|
|
17.9
|
|
(4.2
|
)
|
(23.5
|
)%
|
|||
|
Australian Metallurgical Mining
|
13.4
|
|
15.7
|
|
(2.3
|
)
|
(14.6
|
)%
|
|||
|
Australian Thermal Mining
|
21.3
|
|
20.1
|
|
1.2
|
|
6.0
|
%
|
|||
|
Total tons sold from mining segments
|
179.8
|
|
213.7
|
|
(33.9
|
)
|
(15.9
|
)%
|
|||
|
Trading and Brokerage
|
7.0
|
|
15.1
|
|
(8.1
|
)
|
(53.6
|
)%
|
|||
|
Total tons sold
|
186.8
|
|
228.8
|
|
(42.0
|
)
|
(18.4
|
)%
|
|||
Supplemental Financial Data
The following table presents supplemental financial data by operating segment:
|
Predecessor
|
||||||||||||||
|
Year Ended December 31
|
(Decrease) Increase
|
|||||||||||||
|
|
2016
|
2015
|
$
|
%
|
||||||||||
|
|
|
|||||||||||||
|
Revenues per Ton - Mining Operations
|
||||||||||||||
|
Powder River Basin
|
$
|
13.02
|
|
$
|
13.45
|
|
$
|
(0.43
|
)
|
(3.2
|
)%
|
|||
|
Midwestern U.S.
|
43.39
|
|
46.18
|
|
(2.79
|
)
|
(6.0
|
)%
|
||||||
|
Western U.S.
|
38.30
|
|
38.09
|
|
0.21
|
|
0.6
|
%
|
||||||
|
Australian Metallurgical
|
81.41
|
|
75.04
|
|
6.37
|
|
8.5
|
%
|
||||||
|
Australian Thermal
|
38.79
|
|
41.00
|
|
(2.21
|
)
|
(5.4
|
)%
|
||||||
|
Operating Costs per Ton - Mining Operations
(1)
|
||||||||||||||
|
Powder River Basin
|
$
|
9.66
|
|
$
|
9.97
|
|
$
|
(0.31
|
)
|
(3.1
|
)%
|
|||
|
Midwestern U.S.
|
31.49
|
|
33.49
|
|
(2.00
|
)
|
(6.0
|
)%
|
||||||
|
Western U.S.
|
30.90
|
|
27.78
|
|
3.12
|
|
11.2
|
%
|
||||||
|
Australian Metallurgical
|
82.63
|
|
76.20
|
|
6.43
|
|
8.4
|
%
|
||||||
|
Australian Thermal
|
28.56
|
|
31.36
|
|
(2.80
|
)
|
(8.9
|
)%
|
||||||
|
Adjusted EBITDA Margin per Ton - Mining Operations
(1)
|
||||||||||||||
|
Powder River Basin
|
$
|
3.36
|
|
$
|
3.48
|
|
$
|
(0.12
|
)
|
(3.4
|
)%
|
|||
|
Midwestern U.S.
|
11.90
|
|
12.69
|
|
(0.79
|
)
|
(6.2
|
)%
|
||||||
|
Western U.S.
|
7.40
|
|
10.31
|
|
(2.91
|
)
|
(28.2
|
)%
|
||||||
|
Australian Metallurgical
|
(1.22
|
)
|
(1.16
|
)
|
(0.06
|
)
|
(5.2
|
)%
|
||||||
|
Australian Thermal
|
10.23
|
|
9.64
|
|
0.59
|
|
6.1
|
%
|
||||||
|
(1)
|
Includes revenue-based production taxes and royalties; excludes depreciation, depletion and amortization; asset retirement obligation expenses; selling and administrative expenses; restructuring charges; asset impairment; and certain other costs related to post-mining activities. Adjusted EBITDA margin per ton is approximately equivalent to segment Adjusted EBITDA divided by segment tons sold.
|
|
Peabody Energy Corporation
|
2017 Form 10-K
|
65
|
Revenues
The following table presents revenues by reporting segment:
|
Predecessor
|
||||||||||||||
|
Year Ended December 31
|
(Decrease) Increase
to Revenues
|
|||||||||||||
|
|
2016
|
|
2015
|
$
|
%
|
|||||||||
|
|
(Dollars in millions)
|
|||||||||||||
|
Powder River Basin Mining
|
$
|
1,473.3
|
|
$
|
1,865.9
|
|
$
|
(392.6
|
)
|
(21.0
|
)%
|
|||
|
Midwestern U.S. Mining
|
792.5
|
|
981.2
|
|
(188.7
|
)
|
(19.2
|
)%
|
||||||
|
Western U.S. Mining
|
526.0
|
|
682.3
|
|
(156.3
|
)
|
(22.9
|
)%
|
||||||
|
Australian Metallurgical Mining
|
1,090.4
|
|
1,181.9
|
|
(91.5
|
)
|
(7.7
|
)%
|
||||||
|
Australian Thermal Mining
|
824.9
|
|
823.5
|
|
1.4
|
|
0.2
|
%
|
||||||
|
Trading and Brokerage
|
28.9
|
|
40.6
|
|
(11.7
|
)
|
(28.8
|
)%
|
||||||
|
Corporate and Other
|
(20.7
|
)
|
33.8
|
|
(54.5
|
)
|
(161.2
|
)%
|
||||||
|
Total revenues
|
$
|
4,715.3
|
|
$
|
5,609.2
|
|
$
|
(893.9
|
)
|
(15.9
|
)%
|
|||
Powder River Basin Mining.
The decrease in our Powder River Basin Mining segment revenues for the year ended December 31, 2016 compared to the prior year was largely driven by lower volume ($335.7 million) and lower realized coal prices ($56.9 million). The decline in volume across all mines in the segment reflected the impacts on customer demand of lower natural gas prices during the first half of 2016 and mild winter weather.
Midwestern U.S. Mining.
Revenues from our Midwestern U.S. Mining segment decreased for the year ended December 31, 2016 compared to the prior year due to lower volume ($146.7 million) driven by the impacts on customer demand of lower natural gas prices. Revenues for the segment were also impacted by lower realized coal prices ($42.0 million) that resulted from the repricing of certain long-term supply contracts.
Western U.S. Mining.
The decrease in our Western U.S. Mining segment revenues for the year ended December 31, 2016 compared to the prior year was primarily driven by an unfavorable volume and mix variance ($146.4 million). The volume decrease reflected lower sales volumes at our Twentymile Mine due to lower production resulting from longwall moves (including an extended move to a new seam) and geological issues. The volume decrease was also driven by litigation with Arizona Public Service Company and PacifiCorp.
Australian Metallurgical Mining.
The decrease in our Australian Metallurgical Mining segment revenues for the year ended December 31, 2016 compared to the prior year was driven by unfavorable volume and mix variances ($186.9 million), partially offset by higher realized coal prices ($95.4 million). The volume decrease reflected lower sales volumes from Queensland mines due to weather impacts and lower production at our North Goonyella Mine resulting from a longwall move and a significant geological event which resulted in the cessation of the current longwall top coal caving system.
Australian Thermal Mining.
The slight increase in our Australian Thermal Mining segment revenues for the year ended December 31, 2016 compared to the prior year was primarily driven by higher volumes ($47.6 million) offset by lower realized coal prices ($46.2 million). The increase in tons sold was primarily driven by increased production at our Wilpinjong Mine as the result of receiving temporary approval during 2016 to ship tons in excess of its government mandated limit.
Trading and Brokerage.
The decline in Trading and Brokerage segment revenues for the year ended December 31, 2016 compared to the prior year reflected lower physical volumes shipped due to the impact of depressed coal pricing.
Corporate and Other.
The decrease in Corporate and Other revenues for the year ended December 31, 2016 compared to the prior year was due to unfavorable results on economic hedges ($42.0 million).
|
Peabody Energy Corporation
|
2017 Form 10-K
|
66
|
Loss From Continuing Operations, Net of Income Taxes
The following table presents loss from continuing operations, net of income taxes:
|
Predecessor
|
||||||||||||||
|
Year Ended December 31
|
Increase (Decrease) to Income
|
|||||||||||||
|
|
2016
|
|
2015
|
$
|
%
|
|||||||||
|
|
(Dollars in millions)
|
|||||||||||||
|
Loss from continuing operations, net of income taxes
|
$
|
(663.8
|
)
|
$
|
(1,783.2
|
)
|
$
|
1,119.4
|
|
62.8
|
%
|
|||
|
Depreciation, depletion and amortization
|
(465.4
|
)
|
(572.2
|
)
|
106.8
|
|
18.7
|
%
|
||||||
|
Asset retirement obligation expenses
|
(41.8
|
)
|
(45.5
|
)
|
3.7
|
|
8.1
|
%
|
||||||
|
Selling and administrative expenses related to debt restructuring
|
(21.5
|
)
|
—
|
|
(21.5
|
)
|
n.m.
|
|
||||||
|
Asset impairment
|
(247.9
|
)
|
(1,277.8
|
)
|
1,029.9
|
|
80.6
|
%
|
||||||
|
Changes in deferred tax asset valuation allowance and amortization of basis difference related to equity affiliates
|
7.5
|
|
(3.9
|
)
|
11.4
|
|
292.3
|
%
|
||||||
|
Interest expense
|
(298.6
|
)
|
(465.4
|
)
|
166.8
|
|
35.8
|
%
|
||||||
|
Loss on early debt extinguishment
|
(29.5
|
)
|
(67.8
|
)
|
38.3
|
|
56.5
|
%
|
||||||
|
Interest income
|
5.7
|
|
7.7
|
|
(2.0
|
)
|
(26.0
|
)%
|
||||||
|
Unrealized (losses) gains on economic hedges
|
(39.8
|
)
|
2.2
|
|
(42.0
|
)
|
(1,909.1
|
)%
|
||||||
|
Reorganization items, net
|
(159.0
|
)
|
—
|
|
(159.0
|
)
|
n.m.
|
|
||||||
|
Income tax benefit
|
94.5
|
|
207.1
|
|
(112.6
|
)
|
(54.4
|
)%
|
||||||
|
Adjusted EBITDA
|
$
|
532.0
|
|
$
|
432.4
|
|
$
|
99.6
|
|
23.0
|
%
|
|||
Results from continuing operations, net of income taxes for the year ended December 31, 2016 increased compared to the prior year primarily due to asset impairment charges recorded during the year ended December 31, 2015, improved Adjusted EBITDA, decreased interest expense and decreased depreciation, depletion and amortization expenses. Those factors were partially offset by reorganization items, net and decreased income tax benefit recorded during the year ended December 31, 2016.
Adjusted EBITDA
The following table presents Adjusted EBITDA for each of our reporting segments:
|
Predecessor
|
||||||||||||||
|
Year Ended December 31
|
(Decrease) Increase to
Adjusted EBITDA
|
|||||||||||||
|
|
2016
|
|
2015
|
$
|
%
|
|||||||||
|
|
(Dollars in millions)
|
|
||||||||||||
|
Powder River Basin Mining
|
$
|
379.9
|
|
$
|
482.9
|
|
$
|
(103.0
|
)
|
(21.3
|
)%
|
|||
|
Midwestern U.S. Mining
|
217.3
|
|
269.7
|
|
(52.4
|
)
|
(19.4
|
)%
|
||||||
|
Western U.S. Mining
|
101.6
|
|
184.6
|
|
(83.0
|
)
|
(45.0
|
)%
|
||||||
|
Australian Metallurgical Mining
|
(16.3
|
)
|
(18.2
|
)
|
1.9
|
|
10.4
|
%
|
||||||
|
Australian Thermal Mining
|
217.6
|
|
193.6
|
|
24.0
|
|
12.4
|
%
|
||||||
|
Trading and Brokerage
|
(32.4
|
)
|
24.8
|
|
(57.2
|
)
|
(230.6
|
)%
|
||||||
|
Corporate and Other
|
(335.7
|
)
|
(705.0
|
)
|
369.3
|
|
52.4
|
%
|
||||||
|
Adjusted EBITDA
|
$
|
532.0
|
|
$
|
432.4
|
|
$
|
99.6
|
|
23.0
|
%
|
|||
Powder River Basin Mining.
The decrease in Powder River Basin Mining segment Adjusted EBITDA during the year ended December 31, 2016 compared to the prior year was due to lower volume driven by lower natural gas prices, particularly in the first half of 2016 ($87.4 million), lower coal pricing, net of sales-related costs ($38.5 million) and the impact of mine sequencing, primarily at our North Antelope Rochelle Mine ($21.6 million). These factors were partially offset by reductions in materials, services and repairs resulting from our ongoing cost containment initiatives ($32.4 million) and lower diesel fuel and explosives pricing ($11.1 million).
|
Peabody Energy Corporation
|
2017 Form 10-K
|
67
|
Midwestern U.S. Mining.
The decrease in Midwestern U.S. Mining segment Adjusted EBITDA for the year ended December 31, 2016 compared to the prior year was due to lower volume driven by lower natural gas prices, particularly in the first half of 2016 ($50.1 million) and lower coal pricing, net of sales-related costs ($38.6 million), partially offset by favorable materials, services and repairs costs ($15.2 million) and reductions in labor and overhead charges ($11.4 million) resulting from our ongoing cost containment initiatives and favorable pricing and usage of fuel and explosives ($9.5 million).
Western U.S. Mining.
The decrease in Western U.S. Mining segment Adjusted EBITDA during the year ended December 31, 2016 compared to the prior year was driven by longwall move costs at our Twentymile Mine ($38.5 million), a decline in volume driven by the contract litigation with Arizona Public Service Company and PacifiCorp ($33.0 million) and the unfavorable impact of mine sequencing, primarily at our El Segundo Mine ($12.2 million).
Australian Metallurgical Mining.
The improvement in Australian Metallurgical Mining segment Adjusted EBITDA during the year ended December 31, 2016 compared to the prior year reflected higher coal pricing (driven by fourth quarter price settlements), net of sales-related costs ($88.9 million), offset by lower volume across the segment caused by the impact of longwall moves and geological issues at our North Goonyella Mine and the impact of wet weather at certain mines ($79.7 million).
Australian Thermal Mining.
The increase in Australian Thermal Mining segment Adjusted EBITDA during the year ended December 31, 2016 compared to the prior year reflected production efficiencies attributable to mine sequencing and lower port costs ($41.7 million), an increase in volume ($25.6 million), partially offset by lower coal pricing, net of sales-related costs ($42.6 million).
Trading and Brokerage.
The decrease in Trading and Brokerage segment Adjusted EBITDA during the year ended December 31, 2016 compared to the prior year reflected the impact of decreased revenues described above and the impact of damages awarded in 2015 relating to the Eagle Mining, LLC (Eagle) arbitration and the settlement of the matter.
Corporate and Other Adjusted EBITDA.
The following table presents a summary of the components of Corporate and Other Adjusted EBITDA:
|
Predecessor
|
||||||||||||||
|
Year Ended December 31
|
(Decrease) Increase
to Income
|
|||||||||||||
|
|
2016
|
|
2015
|
$
|
%
|
|||||||||
|
|
(Dollars in millions)
|
|||||||||||||
|
Resource management activities
(1)
|
$
|
19.0
|
|
$
|
32.2
|
|
$
|
(13.2
|
)
|
(41.0
|
)%
|
|||
|
Selling and administrative expenses (excluding debt restructuring)
|
(131.9
|
)
|
(176.4
|
)
|
44.5
|
|
25.2
|
%
|
||||||
|
Restructuring charges
|
(15.5
|
)
|
(23.5
|
)
|
8.0
|
|
34.0
|
%
|
||||||
|
Corporate hedging
|
(241.0
|
)
|
(436.8
|
)
|
195.8
|
|
44.8
|
%
|
||||||
|
UMWA VEBA Settlement
|
68.1
|
|
—
|
|
68.1
|
|
n.m.
|
|
||||||
|
Other items, net
(2)
|
(34.4
|
)
|
(100.5
|
)
|
66.1
|
|
65.8
|
%
|
||||||
|
Corporate and Other Adjusted EBITDA
|
$
|
(335.7
|
)
|
$
|
(705.0
|
)
|
$
|
369.3
|
|
52.4
|
%
|
|||
|
(1)
|
Includes gains (losses) on certain surplus coal reserve and surface land sales and property management costs and revenues.
|
|
(2)
|
Includes results from equity affiliates (before the impact of related changes in deferred tax asset valuation allowance and amortization of basis difference), costs associated with post mining activities, certain coal royalty expenses, gains (losses) on certain asset disposals, minimum charges on certain transportation-related contracts and expenses related to our other commercial activities.
|
The increase associated with corporate hedging results, which includes foreign currency and commodity hedging, was due to lower hedge realizations. During the year ended December 31, 2016, a gain of $68.1 million was recognized for the VEBA settlement with the UMWA as further described in Note 4. “Discontinued Operations” of our consolidated financial statements. The significant reduction in selling and administrative expenses during the year ended December 31, 2016 compared to the prior year largely reflected the impact of our ongoing cost containment initiatives, including past restructuring activities. The increase associated with “Other items, net” is primarily attributable to lower charges on certain transportation-related contracts as compared to prior year and improved Middlemount results driven by favorable pricing in the fourth quarter of 2016. Restructuring charges decreased during the year ended December 31, 2016 compared to the prior year due to the larger staffing reductions at corporate and regional offices during the first half of 2015. Resource management results decreased during the year ended December 31, 2016 compared to the prior year due to increased gains from the disposal of non-core assets, primarily from surplus lands in the Midwestern U.S. during 2015.
|
Peabody Energy Corporation
|
2017 Form 10-K
|
68
|
Depreciation, Depletion and Amortization.
The following table presents a summary of depreciation, depletion and amortization expense by segment:
|
Predecessor
|
||||||||||||||
|
Year Ended December 31
|
Increase
|
|||||||||||||
|
to Income
|
||||||||||||||
|
|
2016
|
|
2015
|
$
|
%
|
|||||||||
|
|
(Dollars in millions)
|
|
||||||||||||
|
Powder River Basin Mining
|
$
|
(123.4
|
)
|
$
|
(138.5
|
)
|
$
|
15.1
|
|
10.9
|
%
|
|||
|
Midwestern U.S. Mining
|
(56.2
|
)
|
(69.0
|
)
|
12.8
|
|
18.6
|
%
|
||||||
|
Western U.S. Mining
|
(45.2
|
)
|
(55.3
|
)
|
10.1
|
|
18.3
|
%
|
||||||
|
Australian Metallurgical Mining
|
(118.7
|
)
|
(178.9
|
)
|
60.2
|
|
33.7
|
%
|
||||||
|
Australian Thermal Mining
|
(102.5
|
)
|
(108.0
|
)
|
5.5
|
|
5.1
|
%
|
||||||
|
Trading and Brokerage
|
(0.2
|
)
|
(0.6
|
)
|
0.4
|
|
66.7
|
%
|
||||||
|
Corporate and Other
|
(19.2
|
)
|
(21.9
|
)
|
2.7
|
|
12.3
|
%
|
||||||
|
Total
|
$
|
(465.4
|
)
|
$
|
(572.2
|
)
|
$
|
106.8
|
|
18.7
|
%
|
|||
Additionally, the following table presents a summary of our weighted-average depletion rate per ton for active mines in each of our mining segments:
|
Predecessor
|
|||||||
|
Year Ended December 31
|
|||||||
|
|
2016
|
|
2015
|
||||
|
Powder River Basin Mining
|
$
|
0.71
|
|
$
|
0.69
|
|
|
|
Midwestern U.S. Mining
|
0.53
|
|
0.45
|
|
|||
|
Western U.S. Mining
|
0.92
|
|
0.93
|
|
|||
|
Australian Metallurgical Mining
|
4.36
|
|
5.27
|
|
|||
|
Australian Thermal Mining
|
2.53
|
|
2.51
|
|
|||
The decrease in depreciation, depletion and amortization expense during the year ended December 31, 2016 compared to the prior year reflected lower sales volumes from our mining platform. Depreciation, depletion and amortization was also impacted compared to the prior year by a reduction in the carrying value at certain of our Australian Metallurgical mines due to impairment charges recognized during 2015.
Selling and Administrative Expenses Related to Debt Restructuring.
The general and administrative expenses related to debt restructuring recorded during the year ended December 31, 2016 related primarily to legal and other professional fees incurred in connection with debt restructuring initiatives prior to the Debtors’ filing of the Bankruptcy Petitions.
Asset Impairment.
We recognized
$247.9 million
and
$1,277.8 million
in aggregate asset impairment charges during the years ended December 31, 2016 and 2015, respectively. Refer to Note 3. “Asset Impairment” to the accompanying consolidated financial statements for further information regarding the nature and composition of those charges, which information is incorporated herein by reference.
Interest Expense.
The decrease in interest expense for the year ended December 31, 2016 compared to the prior year is primarily due to the impact of our filing of the Bankruptcy Petitions, specifically only accruing adequate protection payments subsequent to the Petition Date to certain secured lenders and other parties in accordance with Section 502(b)(2) of the Bankruptcy Code, partially offset by increased interest recorded in connection with additional prepetition borrowings under the 2013 Revolver and increased expense related to additional letters of credit issued in support of various obligations.
Loss on Early Debt Extinguishment.
The decrease in loss on early debt extinguishment charges for the year ended December 31, 2016 as compared to prior year was driven by higher charges recorded during the year ended December 31, 2015 related to the repurchase of $566.9 million aggregate principal amount of our 2016 Notes compared to the charges recorded during the year ended December 31, 2016 related to the repayment of our DIP Term Loan Facility.
Reorganization Items, Net.
The reorganization items recorded during the year ended December 31, 2016 related to expenses in connection with our Chapter 11 Cases. Refer to Note 2. “Emergence from the Chapter 11 Cases and Fresh Start Reporting” to the accompanying consolidated financial statements for further information regarding our reorganization items.
|
Peabody Energy Corporation
|
2017 Form 10-K
|
69
|
Income Tax Benefit.
The year-over-year unfavorable effect of income taxes was driven by higher benefits recorded in 2015 as compared to 2016 for the tax allocation to continuing operations related to the tax effects of items credited directly to “Accumulated other comprehensive income (loss)”, the release of reserves related to uncertain tax positions and the election to carry back specified liability losses ten years. These unfavorable factors were partially offset by lower expense in Australia due to reduced before-tax earnings in 2016 as compared to 2015. Refer to Note 11. “Income Taxes” to the accompanying consolidated financial statements for additional information.
Net Loss Attributable to Common Stockholders
The following table presents net loss attributable to common stockholders:
|
Predecessor
|
||||||||||||||
|
Year Ended December 31
|
Increase (Decrease)
to Income
|
|||||||||||||
|
|
2016
|
|
2015
|
$
|
%
|
|||||||||
|
|
(Dollars in millions)
|
|||||||||||||
|
Loss from continuing operations, net of income taxes
|
$
|
(663.8
|
)
|
$
|
(1,783.2
|
)
|
$
|
1,119.4
|
|
62.8
|
%
|
|||
|
Loss from discontinued operations, net of income taxes
|
(57.6
|
)
|
(175.0
|
)
|
117.4
|
|
67.1
|
%
|
||||||
|
Net loss
|
(721.4
|
)
|
(1,958.2
|
)
|
1,236.8
|
|
63.2
|
%
|
||||||
|
Net income attributable to noncontrolling interests
|
7.9
|
|
7.1
|
|
(0.8
|
)
|
(11.3
|
)%
|
||||||
|
Net loss attributable to common stockholders
|
$
|
(729.3
|
)
|
$
|
(1,965.3
|
)
|
$
|
1,236.0
|
|
62.9
|
%
|
|||
Net results attributable to common stockholders increased during the year ended December 31, 2016 compared to the prior year largely due to the favorable change in results from continuing operations, net of income taxes, as discussed above, and the favorable impact of changes in results from discontinued operations.
Loss from Discontinued Operations, Net of Income Taxes.
The improved results from discontinued operations for the year ended December 31, 2016 compared to the prior year was driven primarily by Patriot bankruptcy related charges associated with black lung liabilities and the UMWA Combined Benefit Fund totaling $132.5 million recognized during 2015. Results for the year ended December 31, 2015 also reflected a $34.7 million charge related to credit support that we provided to Patriot and a charge of $9.7 million associated with the Queensland Bulk Handling Pty Ltd. litigation. These costs were partially offset by charges of $54.3 million recorded during the year ended December 31, 2016 associated with the UMWA 1974 Pension Plan settlement, which is discussed further in Note 4. “Discontinued Operations” to the accompanying consolidated financial statements.
Diluted EPS
The following table presents diluted EPS:
|
Predecessor
|
||||||||||||||
|
Year Ended December 31
|
Increase
to EPS
|
|||||||||||||
|
|
2016
|
2015
|
$
|
%
|
||||||||||
|
Diluted EPS attributable to common stockholders:
|
||||||||||||||
|
Loss from continuing operations
|
$
|
(36.72
|
)
|
$
|
(98.65
|
)
|
$
|
61.93
|
|
62.8
|
%
|
|||
|
Loss from discontinued operations
|
(3.15
|
)
|
(9.64
|
)
|
6.49
|
|
67.3
|
%
|
||||||
|
Net loss
|
$
|
(39.87
|
)
|
$
|
(108.29
|
)
|
$
|
68.42
|
|
63.2
|
%
|
|||
Diluted EPS increased in the year ended December 31, 2016 compared to the prior year commensurate with the favorable change in results from continuing and discontinued operations between those periods.
Outlook
As part of its normal planning and forecasting process, Peabody utilizes a broad approach to develop macroeconomic assumptions for key variables, including country-level gross domestic product (GDP), industrial production, fixed asset investment and third-party inputs, driving detailed supply and demand projections for key demand centers for coal, electricity generation and steel. Specific to the U.S., the Company evaluates individual plant needs, including expected retirements, on a plant by plant basis in developing its demand models. Supply models and cost curves concentrate on major supply regions/countries that impact the regions in which the Company operates.
|
Peabody Energy Corporation
|
2017 Form 10-K
|
70
|
Our estimates involve risks and uncertainties, including those outlined in Part I, Item 1A. “Risk Factors” of this report, and are subject to change based on various factors.
Our near-term outlook is intended to coincide with the next 12 to 24 months, with subsequent periods addressed in our long-term outlook.
Near-Term Outlook
Seaborne Thermal Coal.
During 2017 global seaborne thermal coal demand increased approximately 25 million tonnes over the prior year largely driven by South Korea, China and other developing Pacific countries. South Korean imports continued to show strength in the fourth quarter driven by new coal capacity and low nuclear availability, leading to an increase in full-year 2017 demand of 16 million tonnes over the prior year. Chinese thermal coal imports increased 5 million tonnes over 2016 on a 5% increase in thermal electricity generation. Demand from ASEAN countries increased 8 million tonnes on continued strong economic growth and increases in coal-fueled generation. While India imports declined 11 million tonnes overall for the year, fourth quarter imports rose 17% compared to the prior year largely due to depleted stockpiles.
During 2017, seaborne thermal coal demand outpaced supply as Australian, Colombian and Indonesian thermal coal exports declined from the prior year, despite high pricing levels.
Seaborne Metallurgical Coal.
Within seaborne metallurgical coal, 2017 demand was driven by a 5% increase in global steel production, with December marking the twentieth consecutive month of year-over-year steel production increases. Through year end, Chinese metallurgical coal imports rose approximately 10 million tonnes, or more than 15% even as steel exports decreased 30% year-over-year. Indian metallurgical coal imports increased approximately 6% over the prior year, largely driven by growth in the back half of the year to support rising steel production. Global metallurgical coal supply and demand fundamentals remained tight at year end as total Australian metallurgical exports declined more than 15 million tonnes through December due to cyclone impacts, logistical constraints and industry-wide operational challenges.
Seaborne metallurgical coal prompt prices increased to an average $205 per tonne in the fourth quarter with the index-based settlement price for premium hard coking coal set at approximately $192 per tonne. Peabody negotiated first quarter benchmark low-vol PCI pricing of $156.50 per tonne.
In 2018 seaborne thermal and metallurgical demand are expected to be most impacted by growth in India and ASEAN countries and changes in Chinese policy. Seaborne supply remains tight on continued logistic and operational constraints across the industry.
U.S. Thermal Coal.
In the U.S., 2017 coal demand was impacted by mild weather in coal heavy regions, moderate natural gas prices and increased renewable demand. Utility consumption of Powder River Basin coal rose approximately 5% in 2017 compared to the prior year, despite overall load, natural gas and total coal demand all decreasing. As a result, Southern Powder River Basin coal inventories declined approximately 9 million tons from the prior year to 54 days of maximum burn. Winter weather continues to reduce stockpile levels across the U.S. resulting in average year-end stockpiles at lows not seen since 2014. U.S. coal production increased approximately 5% over 2016 levels, driven by a nearly 60% increase in exports, along with rising domestic consumption of Southern Powder River Basin coal.
Looking ahead to 2018, changes in demand for electric power sector consumption of coal are expected to be most impacted by changes in natural gas prices and availability of renewable generation. Peabody projects plant retirements to reduce base demand by approximately 25 to 35 million tons. The 2017 price of natural gas averaged $3.02 per mmBtu, and on average every $0.20 movement in the price of natural gas from those levels equates to an approximate 25 million ton change in U.S. coal demand over the course of the year, subject to regional natural gas prices and availability of renewable generation.
Long-Term Outlook
Seaborne Fundamentals.
Peabody anticipates 8% to 10% aggregate growth in seaborne metallurgical coal demand over the next five years. Peabody assumes stable European and Chinese imports, with increases led by India, Japan and ASEAN nations.
For seaborne thermal coal, Peabody anticipates total demand to be in line with 2017 as aggregate growth of 3% to 5% in Pacific seaborne demand is offset by declines in Atlantic seaborne demand. Peabody assumes Chinese imports decline but are more than offset by import growth from ASEAN and other Pacific nations. Industry sources note that approximately 25 countries around the world are building new coal-fueled generating plants, with over 100 gigawatts of new capacity already online or anticipated during 2017 and 2018.
We believe Australia is well positioned to supply increased demand for both metallurgical and thermal coal. Due to the cyclical nature of the coal industry, supply and demand fundamentals are subject to extreme fluctuations over time.
|
Peabody Energy Corporation
|
2017 Form 10-K
|
71
|
U.S. Fundamentals.
U.S. coal demand is likely to be impacted by changes in natural gas prices. Peabody expects coal plant retirements to reduce demand on average by 8 gigawatts per year, leading to an incremental 15 to 20 million ton per-year decline on average over each of the next 5 years. Key variables impacting stockpiles and prices include GDP, weather, renewables and gas exports. The economics of coal pricing and volume remain highly sensitive to natural gas prices.
Liquidity and Capital Resources
Overview
Our primary sources of cash are proceeds from the sale of our coal production to customers. We have also generated cash from the sale of non-strategic assets, including coal reserves and surface lands, borrowings under our credit facilities and, from time to time, the issuance of securities. Our primary uses of cash include the cash costs of coal production, capital expenditures, coal reserve lease and royalty payments, debt service costs, capital and operating lease payments, postretirement plans, take-or-pay obligations, post-mining retirement obligations, and selling and administrative expenses. We have also used cash for dividends and share repurchases. We believe that our reorganized capital structure subsequent to the Effective Date will allow us to satisfy our working capital requirements and fund capital expenditures and debt-service obligations with cash generated from operations and cash on hand.
Any future determinations to return capital to stockholders, such as dividends or share repurchases (excluding repurchases authorized under the Repurchase Program described in “Market for Registrant’s Common Equity, Related Stockholder Matters and Issuer Purchases of Equity Securities” in Part II, Item 5 of this report), will be at the discretion of our Board of Directors and will depend on a variety of factors, including the restrictions set forth under our Successor Notes and Successor Credit Agreement, our net income or other sources of cash, liquidity position and potential alternative uses of cash, such as internal development projects or acquisitions, as well as economic conditions and expected future financial results. Our ability to declare dividends or repurchase shares in the future will depend on our future financial performance, which in turn depends on the successful implementation of our strategy and on financial, competitive, regulatory, technical and other factors, general economic conditions, demand for and selling prices of coal and other factors specific to our industry, many of which are beyond our control.
Total Indebtedness.
Our total indebtedness as of
December 31, 2017
and
2016
consisted of the following:
|
|
December 31,
|
||||||
|
|
2017
|
2016
|
|||||
|
|
(Dollars in millions)
|
||||||
|
6.00% Senior Secured Notes due March 2022
|
$
|
500.0
|
|
$
|
—
|
|
|
|
6.375% Senior Secured Notes due March 2025
|
500.0
|
|
—
|
|
|||
|
Senior Secured Term Loan due 2022, net of original issue discount
|
444.2
|
|
—
|
|
|||
|
2013 Revolver
|
—
|
|
1,558.1
|
|
|||
|
2013 Term Loan Facility due September 2020
|
—
|
|
1,162.3
|
|
|||
|
6.00% Senior Notes due November 2018
|
—
|
|
1,518.8
|
|
|||
|
6.50% Senior Notes due September 2020
|
—
|
|
650.0
|
|
|||
|
6.25% Senior Notes due November 2021
|
—
|
|
1,339.6
|
|
|||
|
10.00% Senior Secured Second Lien Notes due March 2022
|
—
|
|
979.4
|
|
|||
|
7.875% Senior Notes due November 2026
|
—
|
|
247.8
|
|
|||
|
Convertible Junior Subordinated Debentures due December 2066
|
—
|
|
386.1
|
|
|||
|
Capital lease and other obligations
|
76.0
|
|
20.1
|
|
|||
|
Less: Debt issuance costs
|
(59.4
|
)
|
(70.8
|
)
|
|||
|
1,460.8
|
|
7,791.4
|
|
||||
|
Less: Current portion of long-term debt
|
42.1
|
|
20.2
|
|
|||
|
Less: Liabilities subject to compromise
|
—
|
|
7,771.2
|
|
|||
|
Long-term debt
|
$
|
1,418.7
|
|
$
|
—
|
|
|
Refer to Note 13. “Current and Long-term Debt” to the accompanying consolidated financial statements for further information regarding our indebtedness.
|
Peabody Energy Corporation
|
2017 Form 10-K
|
72
|
Liquidity
As of
December 31, 2017
, our available liquidity was
$1,244.0 million
, which was comprised of cash and cash equivalents and availability under our revolving credit facility and receivables securitization program described below. As of December 31, 2017, our cash balances totaled
$1,012.1 million
, including approximately $661.0 million held by U.S. entities, with the remaining balance held by foreign subsidiaries in accounts predominantly domiciled in the U.S. A significant majority of the cash held by our foreign subsidiaries is denominated in U.S. dollars. This cash is generally used to support non-U.S. liquidity needs, including capital and operating expenditures in Australia and the foreign operations of our Trading and Brokerage segment. We do not expect restrictions or potential taxes on the repatriation of amounts held by our foreign subsidiaries to have a material effect on our overall liquidity, financial condition or results of operations.
Our liquidity calculation at December 31, 2017 excludes total restricted cash and cash collateral balances of $363.2 million. Of this balance, $205.2 million was related to reclamation assurance for our Australian mines, $65.7 million was related to port, rail and other contract performance requirements in Australia, $40.1 million was related to our estimate for pending claims in connection with our Chapter 11 Cases, and the remainder was related to various forms of financial assurance, primarily in Australia. We plan to significantly reduce these cash collateral requirements during 2018, including through the use of third-party surety bonding in Australia, which was previously unavailable. In January 2018, the Company successfully negotiated with insurers an initial tranche of approximately $115.0 million of surety bonds to secure reclamation and other obligations in Australia.
Our ability to maintain adequate liquidity depends on the successful operation of our business and appropriate management of operating expenses and capital spending. Our anticipated liquidity needs are highly sensitive to changes in each of these and other factors.
The Successor Notes and Successor Credit Agreement
As described in Note 2. “Emergence from the Chapter 11 Cases and Fresh Start Reporting” and Note 13. “Long-term Debt” of the accompanying consolidated financial statements, on the Effective Date, the proceeds from the 6.00% Senior Secured Notes due March 2022 and the 6.375% Senior Secured Notes due March 2025 (collectively, the Successor Notes) and the Senior Secured Term Loan under the Successor Credit Agreement were used to repay the predecessor first lien obligations. The proceeds from the Successor Notes and the Senior Secured Term Loan, net of debt issuance costs and an original issue discount, as applicable, were $950.5 million and $912.7 million, respectively.
We voluntarily prepaid $500.0 million of the original $950.0 million loan principal on the Senior Secured Term Loan in $150.0 million installments on July 31, 2017 and September 11, 2017 and a $200.0 million installment on December 29, 2017. On September 18, 2017, we entered into an amendment to the Successor Credit Agreement which lowered the interest rate from LIBOR plus 4.50% per annum with a 1.00% LIBOR floor to LIBOR plus 3.50% per annum with a 1.00% LIBOR floor. The amendment permits us to add an incremental revolving credit facility in addition to our ability to add one or more incremental term loan facilities under the Successor Credit Agreement. The incremental revolving credit facility and/or incremental term loan facilities can be in an aggregate principal amount of up to $350.0 million plus additional amounts so long as the Company maintains compliance with the Total Leverage Ratio, as defined in the agreement.The amendment also made available an additional restricted payment basket that permits additional repurchases, dividends or other distributions with respect to our Common and preferred stock in an aggregate amount up to $450.0 million so long as our Fixed Charge Coverage Ratio, as defined in the agreement, would not exceed 2.00:1.00 on a pro forma basis.
Interest payments on the Successor Notes are scheduled to occur each year on March 31 and September 30 until maturity. We may redeem the 6.00% Senior Secured Notes beginning in 2019 and the 6.375% Senior Secured Notes beginning in 2020, in whole or in part, and subject to periodically decreasing redemption premiums, through maturity. In addition, we may redeem some or all of the Successor Notes prior to the dates noted above at a calculated make-whole premium, plus accrued and unpaid interest.
The Senior Secured Term Loan principal is due in March 2022. The loan principal is voluntarily prepayable at 101% of the principal amount repaid if voluntarily prepaid prior to March 18, 2018 (subject to certain exceptions, including prepayments made with internally generated cash) and is voluntarily prepayable at any time thereafter without premium or penalty. The Senior Secured Term Loan may require mandatory principal prepayments of 75% of Excess Cash Flow (as defined in the Successor Credit Agreement) for any fiscal year (commencing with the fiscal year ending December 31, 2018). The mandatory principal prepayment requirement changes to (i) 50% of Excess Cash Flow if our Total Leverage Ratio (as defined in the Successor Credit Agreement and calculated as of December 31) is less than or equal to 2.00:1.00 and greater than 1.50:1.00, (ii) 25% of Excess Cash Flow if our Total Leverage Ratio is less than or equal to 1.50:1.00 and greater than 1.00:1.00, or (iii) zero if the our Total Leverage Ratio is less than or equal to 1.00:1.00. If required, mandatory prepayments resulting from Excess Cash Flows are payable within 100 days after the end of each fiscal year. In certain circumstances, the Senior Secured Term Loan also requires that Excess Proceeds (as defined in the Successor Credit Agreement) of $10 million or greater from sales of our assets be applied against the loan principal, unless such proceeds are reinvested within one year.
|
Peabody Energy Corporation
|
2017 Form 10-K
|
73
|
During the fourth quarter of 2017, the Company entered into the incremental revolving credit facility permitted under the Successor Credit Agreement (the Revolver) for an aggregate commitment of $350.0 million for general corporate purposes. The Revolver matures in November 2020 and permits loans which bear interest at LIBOR plus 3.25%. The Revolver is subject to a 2.00:1.00 Total Leverage Ratio requirement, modified to limit unrestricted cash netting to
$800.0 million
. Capacity under the Revolver may also be utilized for letters of credit which incur combined fees of 3.375% per annum. Unused capacity under the Revolver bears a commitment fee of 0.5% per annum. As of December 31, 2017, the Revolver had been drawn upon for letters of credit amounting to
$156.2 million
. Such letters of credit were primarily in support of our reclamation obligations.
Under the Successor Credit Agreement, our annual capital expenditures are limited to $220.0 million, $250.0 million, $250.0 million, and $300.0 million from 2018 through 2021, respectively, subject to certain carryforward, carryback and other provisions.
In addition to the $450.0 million restricted payment basket provided for under the amendment, the Successor Credit Agreement and Successor Notes allow for $50 million of otherwise restricted payments. Additive to this general limit are certain “builder basket” provisions that may increase the amount of allowable restricted payments, as calculated periodically based upon our operating performance. The payment of dividends and purchases of our own Common Stock are permitted under additional provisions of the Successor Notes and the Successor Credit Agreement in an aggregate amount in any calendar year not to exceed $25 million, so long as our Total Leverage Ratio would not exceed 1.25:1.00 on a pro forma basis.
Accounts Receivable Securitization Program
As described in Note 24. “Financial Instruments, Guarantees With Off-Balance-Sheet Risk and Other Guarantees” of the accompanying consolidated financial statements, on the Effective Date, we entered into an amended Receivables Purchase Agreement to extend the receivables securitization facility previously in place and expand that facility to include certain receivables from the Company’s Australian operations. The term of the receivables securitization program (Securitization Program) ends on April 3, 2020, subject to certain liquidity requirements and other customary events of default set forth in the Receivables Purchase Agreement. The Securitization Program provides for up to $250 million in funding accounted for as a secured borrowing, limited to the availability of eligible receivables, and may be secured by a combination of cash collateral and the trade receivables underlying the program, from time to time. Funding capacity under the Securitization Program may also be drawn upon for letters of credit in support of other obligations. During 2017, we entered into amendments to the Securitization Program to include the receivables of additional Australian operations, reduce the restrictions on the availability of certain eligible receivables, add an additional servicer, and reduce program fees.
At December 31, 2017, we had no outstanding borrowings and
$169.5 million
of letters of credit drawn under the Securitization Program. The letters of credit were primarily in support of portions of our obligations for reclamation, workers’ compensation and postretirement benefits. There was no cash collateral requirement under the Securitization Program at December 31, 2017.
Reclamation Bonding
As described in Note 24. “Financial Instruments, Guarantees With Off-Balance-Sheet Risk and Other Guarantees” of the accompanying consolidated financial statements, we are required to provide various forms of financial assurance in support of our mining reclamation obligations in the jurisdictions in which we operate. Such requirements are typically established by statute or under mining permits. Historically, such assurances have taken the form of third-party instruments such as surety bonds, bank guarantees, and letters of credit, as well as self-bonding arrangements in the U.S. In connection with our emergence from the Chapter 11 Cases, we shifted away from extensive self-bonding in the U.S. in favor of increased usage of surety bonds and similar third-party instruments, but have retained the ability to utilize self-bonding in the future, dependent upon state-by-state approval and internal cost-benefit considerations. This divergence in practice may impact our liquidity in the future due to increased cash collateral requirements and surety and related fees.
At December 31, 2017, we had total asset retirement obligations of
$691.1 million
which were backed by a combination of surety bonds, bank guarantees, letters of credit and restricted cash collateral. Cash collateral balances related to reclamation and other obligations are maintained on our balance sheets within “Investments and other assets,” but are excluded from our available liquidity. Such cash collateral related to reclamation obligations amounted to $205.2 million at December 31, 2017.
Bonding requirement amounts may differ significantly from the related asset retirement obligation because such requirements are calculated under the assumption that reclamation begins currently, whereas our accounting liabilities are discounted from the end of a mine’s economic life (when final reclamation work would begin) to the balance sheet date.
|
Peabody Energy Corporation
|
2017 Form 10-K
|
74
|
Capital Requirements
Additions to Property, Plant, Equipment and Mine Development.
We have sought to maintain a controlled, disciplined approach to capital spending in order to preserve liquidity. Our additions to property, plant, equipment and mine development increased from
$126.6 million
in 2016 to
$199.4 million
in 2017 largely due to increased capital spending subsequent to our emergence from the Chapter 11 Cases. For 2018, we are targeting capital expenditures of $275 million to $325 million, which includes approximately $85 million related to ongoing extension projects at our North Goonyella and Wilpinjong Mines and a joint venture project to expand our Wambo Mine. We plan to consider other significant growth and development projects across our global platform beyond 2018 and will continue to evaluate the timing associated with those projects based on changes in global coal supply and demand. During 2016, we completed substantially all of our required payments under U.S. federal coal reserve leases with the U.S. Bureau of Land Management.
Pension Contributions.
Annual contributions to qualified plans are made in accordance with minimum funding standards and our agreement with the Pension Benefit Guaranty Corporation. Funding decisions also consider certain funded status thresholds defined by the Pension Protection Act of 2006 (generally 80%). Subsequent to the Effective Date we no longer sponsor any non-qualified plans. During the Successor period ended December 31, 2017, we contributed $30.1 million to our qualified pension plans, including a discretionary contribution of $25.0 million. Based upon our current funding status, we have no minimum funding requirement for 2018.
Historical Cash Flows and Free Cash Flow
The following table summarizes our cash flows for the period
April 2 through December 31, 2017
,
January 1 through April 1, 2017
, and for the year ended
December 31, 2016
, as reported in the accompanying consolidated financial statements:
|
Successor
|
Predecessor
|
|||||||||
|
|
April 2 through December 31, 2017
|
January 1 through April 1, 2017
|
Year Ended December 31, 2016
|
|||||||
|
|
(Dollars in millions)
|
|||||||||
|
Net cash provided by (used in) operating activities
|
$
|
797.2
|
|
$
|
214.0
|
|
$
|
(52.8
|
)
|
|
|
Net cash (used in) provided by investing activities
|
(93.4
|
)
|
15.1
|
|
(244.1
|
)
|
||||
|
Net cash (used in) provided by financing activities
|
(745.4
|
)
|
(47.7
|
)
|
907.9
|
|
||||
|
Net change in cash and cash equivalents
|
(41.6
|
)
|
181.4
|
|
611.0
|
|
||||
|
Cash and cash equivalents at beginning of period
|
1,053.7
|
|
872.3
|
|
261.3
|
|
||||
|
Cash and cash equivalents at end of period
|
$
|
1,012.1
|
|
$
|
1,053.7
|
|
$
|
872.3
|
|
|
|
Net cash provided by (used in) operating activities
|
$
|
797.2
|
|
$
|
214.0
|
|
$
|
(52.8
|
)
|
|
|
Net cash (used in) provided by investing activities
|
(93.4
|
)
|
15.1
|
|
(244.1
|
)
|
||||
|
Free Cash Flow
|
$
|
703.8
|
|
$
|
229.1
|
|
$
|
(296.9
|
)
|
|
Cash Flow - Successor
Cash provided by operating activities in the Successor period
April 2 through December 31, 2017
resulted from improved supply and demand conditions leading to increased cash from our mining operations. In addition, $274.2 million of restricted cash collateral became unrestricted, largely as a result of our improved liquidity subsequent to emergence from the Chapter 11 Cases and our ability to replace the cash collateral required to support reclamation and other obligations with letters of credit issued under our Revolver and Securitization Program. These factors were partially offset by the greater use of working capital related to coal stockpile increases and the payment of claims and professional fees related to the Chapter 11 Cases.
Cash used in investing activities in the Successor period
April 2 through December 31, 2017
resulted from $166.6 million in additions to property, plant, equipment and mine development, partially offset by $51.3 million in repayments of loans from related parties.
Cash used in financing activities in the Successor period
April 2 through December 31, 2017
resulted primarily from $541.8 million of repayments of long-term debt, including $504.0 million related to the Senior Secured Term Loan, and $175.7 million of repurchases of Common Stock in accordance with our debt reduction and shareholder return initiatives.
Cash Flow - Predecessor
Cash provided by operating activities in the Predecessor period
January 1 through April 1, 2017
resulted from an increase in cash from our operations from improved supply and demand conditions, partially offset by a $94.1 million increase in restricted cash, $67.7 million of which was related to cash restricted for future claim payments for the Chapter 11 Cases.
|
Peabody Energy Corporation
|
2017 Form 10-K
|
75
|
Cash used in operating activities for the year ended
December 31, 2016
resulted from $168.5 million of disbursements related to our accounts receivable securitization program, $125.7 million of funds became restricted during the year as collateral for financial assurances associated with reclamation bonding requirements, partially offset by a year-over-year increase in working capital and $125.2 million of proceeds associated with the reclassification from other comprehensive income for terminated hedge contracts that occurred in 2016.
Cash provided by investing activities in the Predecessor period
January 1 through April 1, 2017
resulted from $31.1 million of loan repayments from related parties and $24.3 million of proceeds from disposals of assets, $19.4 million of which was from the sale of Dominion Terminal Associates, which was offset by $32.8 million in payments for additions to property, plant and equipment.
Cash used in investing activities for the year ended
December 31, 2016
resulted primarily from $144.4 million of proceeds from disposals of assets, primarily due to the sale of our 5.06% participation interest in the Prairie State Energy Campus, as well as our interest in undeveloped metallurgical reserve tenements in Queensland's Bowen Basin, which included the Olive Downs South, Olive Downs South Extended and Willunga tenements, offset by $249.0 million of federal coal lease expenditures.
Cash used in financing activities in the Predecessor period
January 1 through April 1, 2017
resulted from $45.4 million in payments of Predecessor deferred financing costs associated with the new Successor debt entered into upon our emergence from the Chapter 11 Cases.
Cash provided by financing activities for the year ended
December 31, 2016
resulted from proceeds from long-term debt of $1,458.4 million, primarily due to the $475.0 million of proceeds received from our DIP Term Loan Facility during the second quarter of 2016, net of original issue discount, the net draws on our 2013 Revolver of $947.0 million during the first quarter of 2016, and the $500.0 million repayment of the DIP Term Loan Facility in the fourth quarter of 2016.
Contractual Obligations
The following is a summary of our contractual obligations as of
December 31, 2017
:
|
|
Payments Due By Year
|
||||||||||||||||||
|
Total
|
Less than
1 Year
|
2 - 3
Years
|
4 - 5
Years
|
More than
5 Years
|
|||||||||||||||
|
|
(Dollars in millions)
|
||||||||||||||||||
|
Long-term debt obligations (principal and interest)
(1)
|
$
|
1,914.6
|
|
$
|
86.0
|
|
$
|
176.3
|
|
$
|
1,080.6
|
|
$
|
571.7
|
|
||||
|
Capital lease obligations (principal and interest)
|
86.3
|
|
39.9
|
|
36.2
|
|
1.0
|
|
9.2
|
|
|||||||||
|
Operating lease obligations
(2)
|
217.6
|
|
68.5
|
|
86.0
|
|
40.2
|
|
22.9
|
|
|||||||||
|
Unconditional purchase obligations
(3)
|
159.0
|
|
41.9
|
|
117.1
|
|
—
|
|
—
|
|
|||||||||
|
Coal reserve lease and royalty obligations
|
65.5
|
|
6.9
|
|
13.2
|
|
12.4
|
|
33.0
|
|
|||||||||
|
Take-or-pay obligations
(4)
|
1,336.5
|
|
182.2
|
|
288.6
|
|
197.8
|
|
667.8
|
|
|||||||||
|
Other long-term liabilities
(5)
|
3,164.8
|
|
234.9
|
|
397.4
|
|
403.6
|
|
2,128.9
|
|
|||||||||
|
Total contractual cash obligations
|
$
|
6,944.3
|
|
$
|
660.3
|
|
$
|
1,114.8
|
|
$
|
1,735.6
|
|
$
|
3,433.5
|
|
||||
|
(1)
|
Represents the original contractual maturities of our long-term debt obligations. The related interest on long-term debt was calculated using rates in effect at December 31, 2017 for the remaining contractual term of the outstanding borrowings.
|
|
(2)
|
Excludes contingent rents. Refer to Note 14. “Leases” to the accompanying consolidated financial statements for additional discussion of contingent rental agreements.
|
|
(3)
|
We routinely enter into purchase agreements with approved vendors for most types of operating expenses in the ordinary course of business. Our specific open purchase orders (which have not been recognized as a liability) under these purchase agreements, combined with any other open purchase orders, are not material and though they are considered enforceable and legally binding, the related terms generally allow us the option to cancel, reschedule or adjust our requirements based on our business needs prior to the delivery of goods or performance of services. Accordingly, the commitments in the table above relate to orders to suppliers for capital purchases.
|
|
(4)
|
Represents various short- and long-term take or pay arrangements in Australia and the U.S. associated with rail and port commitments for the delivery of coal, including amounts relating to export facilities.
|
|
(5)
|
Represents long-term liabilities relating to our postretirement benefit plans, work-related injuries and illnesses, defined benefit pension plans, mine reclamation and end of mine closure costs and exploration obligations. Also includes $9 million of required payments to the VEBA established in connection with Patriot’s bankruptcy, as well as $60 million related to the settlement of the UMWA 1974 Pension Plan Litigation described in Note 4. “Discontinued Operations” to the accompanying consolidated financial statements.
|
We do not expect any of the
$12.7 million
of net unrecognized tax benefits reported in our consolidated financial statements to require cash settlement within the next year. Beyond that, we are unable to make reasonably reliable estimates of periodic cash settlements with respect to such unrecognized tax benefits.
|
Peabody Energy Corporation
|
2017 Form 10-K
|
76
|
Off-Balance Sheet Arrangements
In the normal course of business, we are a party to guarantees and financial instruments with off-balance-sheet risk, most of which are not reflected in the accompanying consolidated balance sheets. As of
February 26, 2018
, we do not expect any material losses to result from these guarantees or off-balance-sheet instruments in excess of liabilities already provided for in the consolidated balance sheet as of
December 31, 2017
. However, we could experience a decline in our liquidity as financial assurances associated with reclamation bonding requirements, bank guarantees, surety bonds or other obligations are required to be collateralized by cash or letters of credit.
Guarantees and Other Financial Instruments with Off-Balance Sheet Risk.
See Note 24. “Financial Instruments, Guarantees with Off-Balance Sheet Risk and Other Guarantees” to our consolidated financial statements for a discussion of our accounts receivable securitization program and guarantees and other financial instruments with off-balance sheet risk.
Critical Accounting Policies and Estimates
Our discussion and analysis of our financial condition, results of operations, liquidity and capital resources is based upon our financial statements, which have been prepared in accordance with U.S. GAAP. We are also required under U.S. GAAP to make estimates and judgments that affect the reported amounts of assets, liabilities, revenues and expenses, and related disclosure of contingent assets and liabilities. On an ongoing basis, we evaluate our estimates. We base our estimates on historical experience and on various other assumptions that we believe are reasonable under the circumstances, the results of which form the basis for making judgments about the carrying values of assets and liabilities that are not readily apparent from other sources. Actual results may differ from these estimates.
Fresh Start Reporting.
On the Effective Date, we applied fresh start reporting which required us to allocate our reorganization value to the fair value of assets and liabilities in conformity with the guidance for the acquisition method of accounting for business combinations.
Fresh start reporting provides, among other things, for a determination of the value to be assigned to the equity of the emerging company as of a date selected for financial reporting purposes. In conjunction with the bankruptcy proceedings, a third-party financial advisor provided an enterprise value of the Company of approximately $4.2 billion to $4.9 billion. The final equity value of $3,081.0 million was based upon the approximate low end of the enterprise value established by the third-party valuation and cash held by the Successor company in connection with the emergence from the Chapter 11 Cases, less the fair value of Successor debt issued on the Effective Date.
Our enterprise value was estimated using two primary valuation methods: a comparable public company analysis and a discounted cash flow (DCF) analysis. The comparable public company analysis is based on the enterprise value of selected publicly traded companies that have operating and financial characteristics comparable in certain respects to the Company, for example, operational requirements and risk and profitability characteristics. Selected companies were comprised of coal mining companies with primary operations in the United States. Under this methodology, certain financial multiples and ratios that measure financial performance and value were calculated for each selected company and then applied to our financials to imply an enterprise value for the Company.
The DCF analysis is a forward-looking enterprise valuation methodology that estimates the value of an asset or business by calculating the present value of expected future cash flows by that asset or business. The basis of the DCF analysis was our prepared projections which included a variety of estimates and assumptions, such as pricing and demand for coal. Our pricing was based on our view of the market taking into account third-party forward pricing curves adjusted for the quality of products sold by us. While we consider such estimates and assumptions reasonable, they are inherently subject to significant business, economic and competitive uncertainties, many of which are beyond our control and, therefore, may not be realized. Changes in these estimates and assumptions may have a significant effect on the determination of our enterprise value.
The assumptions used in the calculations for the DCF analysis included projected revenue, cost and cash flows for the nine months ending December 31, 2017 through each respective mine life and represented the Company’s best estimates at the time the analysis was prepared. The DCF analysis was completed using discount rates ranging from 11% to 14.5%. The DCF analysis involves complex considerations and judgments concerning appropriate discount rates. Due to the unobservable inputs to the valuation, the fair value would be considered Level 3 in the fair value hierarchy.
For the impact of the adoption of fresh start reporting, see Note 2. “Emergence from the Chapter 11 Cases and Fresh Start Reporting” to our consolidated financial statements.
|
Peabody Energy Corporation
|
2017 Form 10-K
|
77
|
Impairment of Long-Lived Assets.
We evaluate our long-lived assets held and used in operations for impairment as events and changes in circumstances indicate that the carrying amount of such assets might not be recoverable. Factors that would indicate potential impairment to be present include, but are not limited to, a sustained history of operating or cash flow losses, an unfavorable change in earnings and cash flow outlook, prolonged adverse industry or economic trends and a significant adverse change in the extent or manner in which a long-lived asset is being used or in its physical condition. We generally do not view short-term declines in thermal and metallurgical coal prices as a triggering event for conducting impairment tests because of historic price volatility. However, we generally view a sustained trend of depressed coal pricing (for example, over periods exceeding one year) as an indicator of potential impairment.
Assets are grouped at the lowest level for which there are identifiable cash flows that are largely independent of the cash flows of other groups of assets. For our active mining operations, we generally group such assets at the mine level, or the mining complex level for mines that share infrastructure, with the exception of impairment evaluations triggered by mine closures. In those cases involving mine closures, the related assets are evaluated at the individual asset level for remaining economic life based on transferability to ongoing operating sites and for use in reclamation-related activities, or for expected salvage. For our development and exploration properties and portfolio of surface land and coal reserve holdings, we consider several factors to determine whether to evaluate those assets individually or on a grouped basis for purposes of impairment testing. Such factors include geographic proximity to one another, the expectation of shared infrastructure upon development based on future mining plans and whether it would be most advantageous to bundle such assets in the event of a sale to a third party.
When indicators of impairment are present, we evaluate our long-lived assets for recoverability by comparing the estimated undiscounted cash flows expected to be generated by those assets under various assumptions to their carrying amounts. If such undiscounted cash flows indicate that the carrying value of the asset group is not recoverable, impairment losses are measured by comparing the estimated fair value of the asset group to its carrying amount. As quoted market prices are unavailable for our individual mining operations, fair value is determined through the use of an expected present value technique based on the income approach, except for non-strategic coal reserves, surface lands and undeveloped coal properties excluded from our long-range mine planning. In those cases, a market approach is utilized based on the most comparable market multiples available. The estimated future cash flows and underlying assumptions used to assess recoverability and, if necessary, measure the fair value of our long-lived mining assets are derived from those developed in connection with our planning and budgeting process. We believe our assumptions to be consistent with those a market participant would use for valuation purposes. The most critical assumptions underlying our projections and fair value estimates include those surrounding future tons sold, coal prices for unpriced coal, production costs (including costs for labor, commodity supplies and contractors), transportation costs, foreign currency exchange rates and a risk-adjusted, after-tax cost of capital (all of which generally constitute unobservable Level 3 inputs under the fair value hierarchy), in addition to market multiples for non-strategic coal reserves, surface lands and undeveloped coal properties excluded from our long-range mine planning (which generally constitute Level 2 inputs under the fair value hierarchy).
While
no
impairment of long-lived assets was recorded for the Successor period April 2 through December 31, 2017,
$30.5 million
was included in continuing operations for the Predecessor period January 1 through April 1, 2017. The assumptions used are based on our best knowledge at the time we prepare our analysis but can vary significantly due to the volatile and cyclical nature of coal prices and demand, regulatory issues, unforeseen mining conditions, commodity prices and cost of labor. These types of changes may cause us to be unable to recover all or a portion of the carrying value of our long-lived assets. We conducted a review of long-lived assets for recoverability as of
December 31, 2017
and determined that no further impairment charge was necessary as of that date.
See Note 3. “Asset Impairment” to our consolidated financial statements for additional information regarding impairment charges.
Income Taxes.
We account for income taxes in accordance with accounting guidance which requires deferred tax assets and liabilities be recognized using enacted tax rates for the effect of temporary differences between the book and tax bases of recorded assets and liabilities. The guidance also requires that deferred tax assets be reduced by a valuation allowance if it is “more likely than not” that some portion or all of the deferred tax asset will not be realized. In our evaluation of the need for a valuation allowance, we take into account various factors, including the expected level of future taxable income, available tax planning strategies, reversals of existing taxable temporary differences and taxable income in carryback years. As of
December 31, 2017
, we had valuation allowances for income taxes totaling
$2,432.5 million
. If actual results differ from the assumptions made in our annual evaluation of our valuation allowance, we may record a change in valuation allowance through income tax expense in the period such determination is made.
|
Peabody Energy Corporation
|
2017 Form 10-K
|
78
|
Our liability for unrecognized tax benefits contains uncertainties because management is required to make assumptions and to apply judgment to estimate the exposures associated with our various filing positions. We recognize the tax benefit from an uncertain tax position only if it is “more likely than not” that the tax position will be sustained on examination by the taxing authorities, based on the technical merits of the position. The tax benefits recognized in the financial statements from such a position must be measured based on the largest benefit that has a greater than 50% likelihood of being realized upon ultimate settlement. As of
December 31, 2017
, we had net unrecognized tax benefits of
$12.7 million
included in recorded liabilities in the consolidated balance sheet. We believe that our judgments and estimates are reasonable; however, to the extent we prevail in matters for which liabilities have been established, or are required to pay amounts in excess of our recorded liabilities, our effective tax rate in a given period could be materially affected.
On December 22, 2017, the Tax Cuts and Jobs Act of 2017 (the Act) was signed into law making significant changes to the Internal Revenue Code. Changes include, but are not limited to: (i) reduction of the U.S. federal corporate tax rate from 35% to 21%, (ii) repeal of the corporate alternative minimum tax (AMT) system, (iii) replacement of the worldwide taxation system with a territorial tax system which exempts certain foreign operations from U.S. taxation and includes a one-time tax on deferred foreign earnings, (iv) further limitation on the deductibility of certain executive compensation and (v) allowance for immediate capital expensing of certain qualified property. We have estimated our provision for income taxes in accordance with the Act and guidance available as of the date of this filing and as a result have recorded $84.9 million as additional income tax benefit in the fourth quarter of 2017, the period in which the legislation was enacted. The provisional amount related to the release of valuation allowance on AMT credits will be refunded over the next four years due to the repeal of the corporate AMT system.
See Note 11. “Income Taxes” in the accompanying consolidated financial statements for additional information regarding valuation allowances and unrecognized tax benefits.
Postretirement Benefit and Pension Liabilities.
We have long-term liabilities for our employees’ postretirement benefit costs and defined benefit pension plans. Liabilities for postretirement benefit costs are not funded. Our pension obligations are funded in accordance with the provisions of applicable laws. In connection with fresh start reporting, we made an accounting policy election to prospectively record amounts attributable to prior service cost and actuarial valuation changes, as applicable, currently in earnings rather than recording such amounts within accumulated other comprehensive income and amortizing to expense over applicable time periods. Expense for the Successor period
April 2 through December 31, 2017
for postretirement benefit costs and pension liabilities totaled $29.3 million, while employer contributions were $59.0 million. An actuarial gain of $45.5 million was also recorded for the Successor period
April 2 through December 31, 2017
. Expense for the Predecessor period
January 1 through April 1, 2017
for postretirement benefit costs and pension liabilities totaled $19.6 million, while employer contributions were $12.6 million.
Each of these liabilities is actuarially determined and we use various actuarial assumptions, including the discount rate, future cost trends, demographic assumptions and expected asset returns to estimate the costs and obligations for these items. Our discount rate is determined by utilizing a hypothetical bond portfolio model which approximates the future cash flows necessary to service our liabilities. We make assumptions related to future trends for medical care costs in the estimates of postretirement benefit costs. Our medical trend assumption is developed by annually examining the historical trend of cost per claim data. In addition, we make assumptions related to rates of return on plan assets in the estimates of pension obligations. If our assumptions do not materialize as expected, actual cash expenditures and costs that we incur could differ materially from our current estimates. Moreover, regulatory changes could affect our obligation to satisfy these or additional obligations.
|
Peabody Energy Corporation
|
2017 Form 10-K
|
79
|
For our postretirement benefit obligation, assumed discount rates and health care cost trend rates have a significant effect on the expense and liability amounts reported for our health care plans. Below we have provided two separate sensitivity analyses to demonstrate the significance of these assumptions in relation to reported amounts.
|
For Year Ended December 31, 2017
|
|||||||
|
One-Percentage-
Point Increase
|
One-Percentage-
Point Decrease
|
||||||
|
|
(Dollars in millions)
|
||||||
|
Health care cost trend rate:
|
|||||||
|
Effect on total net periodic postretirement benefit cost
|
$
|
4.8
|
|
$
|
(4.4
|
)
|
|
|
Effect on total postretirement benefit obligation
|
$
|
69.1
|
|
$
|
(60.7
|
)
|
|
|
For Year Ended December 31, 2017
|
|||||||
|
One-Half
Percentage-
Point Increase
|
One-Half
Percentage-
Point Decrease
|
||||||
|
(Dollars in millions)
|
|||||||
|
Discount rate:
|
|||||||
|
Effect on total net periodic postretirement benefit cost
|
$
|
0.5
|
|
$
|
(0.5
|
)
|
|
|
Effect on total postretirement benefit obligation
|
$
|
(37.3
|
)
|
$
|
42.4
|
|
|
For our pension obligation, assumed discount rates and expected returns on assets have a significant effect on the expense and funded status amounts reported for our defined benefit pension plans. Below we have provided two separate sensitivity analyses to demonstrate the significance of these assumptions in relation to reported amounts.
|
For Year Ended December 31, 2017
|
|||||||
|
One-Half
Percentage-
Point Increase
|
One-Half
Percentage-
Point Decrease
|
||||||
|
|
(Dollars in millions)
|
||||||
|
Discount rate:
|
|||||||
|
Effect on total net periodic pension cost
|
$
|
0.1
|
|
$
|
(0.1
|
)
|
|
|
Effect on defined benefit pension plans’ funded status
|
$
|
(44.0
|
)
|
$
|
47.4
|
|
|
|
Expected return on assets:
|
|||||||
|
Effect on total net periodic pension cost
|
$
|
(3.8
|
)
|
$
|
3.8
|
|
|
See Note 16. “Postretirement Health Care and Life Insurance Benefits” and Note 17. “Pension and Savings Plans” to our consolidated financial statements for additional information regarding postretirement benefit and pension plans.
Asset Retirement Obligations.
Our asset retirement obligations primarily consist of spending estimates for surface land reclamation and support facilities at both surface and underground mines in accordance with applicable reclamation laws and regulations in the U.S. and Australia as defined by each mining permit. Asset retirement obligations are determined for each mine using various estimates and assumptions including, among other items, estimates of disturbed acreage as determined from engineering data, estimates of future costs to reclaim the disturbed acreage and the timing of these cash flows, discounted using a credit-adjusted, risk-free rate. As changes in estimates occur (such as mine plan revisions, changes in estimated costs or changes in timing of the performance of reclamation activities), the revisions to the obligation and asset are recognized at the appropriate credit-adjusted, risk-free rate. If our assumptions do not materialize as expected, actual cash expenditures and costs that we incur could be materially different than currently estimated. Moreover, regulatory changes could increase our obligation to perform reclamation and mine closing activities. In connection with fresh start reporting, we made an accounting policy election to classify the amortization associated with our asset retirement obligation assets within “Depreciation, depletion and amortization” in the consolidated statements of operations, rather than within “Asset retirement obligation expenses”, as in Predecessor periods. Asset retirement obligation expenses for the Successor period
April 2 through December 31, 2017
were
$41.2 million
, and payments totaled $22.5 million. Asset retirement obligation expenses for the Predecessor period
January 1 through April 1, 2017
were $
14.6 million
, and payments totaled $4.4 million. See Note 15. “Asset Retirement Obligations” to our consolidated financial statements for additional information regarding our asset retirement obligations.
|
Peabody Energy Corporation
|
2017 Form 10-K
|
80
|
Contingent liabilities.
From time to time, we are subject to legal and environmental matters related to our continuing and discontinued operations and certain historical, non-coal producing operations. In connection with such matters, we are required to assess the likelihood of any adverse judgments or outcomes, as well as potential ranges of probable losses.
A determination of the amount of reserves required for these matters is made after considerable analysis of each individual issue. We accrue for legal and environmental matters within “Operating costs and expenses” when it is probable that a liability has been incurred and the amount of the loss can be reasonably estimated. We provide disclosure surrounding loss contingencies when we believe that it is at least reasonably possible that a material loss may be incurred or an exposure to loss in excess of amounts already accrued may exist. Adjustments to contingent liabilities are made when additional information becomes available that affects the amount of estimated loss, which information may include changes in facts and circumstances, changes in interpretations of law in the relevant courts, the results of new or updated environmental remediation cost studies and the ongoing consideration of trends in environmental remediation costs.
Accrued contingent liabilities exclude claims against third parties and are not discounted. The current portion of these accruals is included in “Accounts payables and accrued expenses” and the long-term portion is included in “Other noncurrent liabilities” in our consolidated balance sheets. In general, legal fees related to environmental remediation and litigation are charged to expense. We include the interest component of any litigation-related penalties within “Interest expense” in our consolidated statements of operations. See Note 25. “Commitments and Contingencies” to our accompanying consolidated financial statements for further discussion of our contingent liabilities.
Newly Adopted Accounting Standards and Accounting Standards Not Yet Implemented
See Note 1. “Summary of Significant Accounting Policies” to our accompanying consolidated financial statements for a discussion of newly adopted accounting standards and accounting standards not yet implemented.
Item 7A.
Quantitative and Qualitative Disclosures About Market Risk.
The potential for changes in the market value of our coal and freight-related trading, crude oil, diesel fuel, natural gas and foreign currency contract portfolios, as applicable, is referred to as “market risk.” Market risk related to our coal trading and freight-related contract portfolio, which includes bilaterally-settled and over-the-counter (OTC) exchange-settled trading, in addition to, from time to time, the brokered trading of coal, is evaluated using a value at risk (VaR) analysis. VaR analysis is not used to evaluate our non-trading diesel fuel or foreign currency hedging portfolios, as applicable, or coal trading activities we employ in support of coal production (as discussed below). We attempt to manage market price risks through diversification, controlling position sizes and executing hedging strategies. Due to a lack of quoted market prices and the long-term, illiquid nature of the positions, we have not quantified market price risk related to our non-trading, long-term coal supply agreement portfolio.
Coal Trading Activities and Related Commodity Price Risk
Coal Price Risk Monitored Using VaR.
We engage in direct and brokered trading of physical coal and freight-related commodities in OTC markets. These activities give rise to commodity price risk, which represents the potential loss that can be caused by an adverse change in the market value of a particular commitment. We actively measure, monitor, manage and hedge market price risk due to current and anticipated trading activities to remain within risk limits prescribed by management. For example, we have policies in place that limit the amount of market price risk, as measured by VaR, that we may assume at any point in time from our trading and brokerage activities.
We generally account for our coal trading activities using the fair value method, which requires us to reflect contracts with third parties that meet the definition of a derivative at market value in our consolidated financial statements, with the exception of contracts for which we have elected to apply the normal purchases and normal sales exception. Our trading portfolio included futures, forwards, and options as of
December 31, 2017
. The use of VaR allows us to quantify in dollars, on a daily basis, a measure of price risk inherent in our trading portfolio. VaR represents the expected loss in portfolio value due to adverse market price movements over a defined time horizon (liquidation period) within a specified confidence level. Our VaR model is based on a variance/co-variance approach, which captures our potential loss exposure related to future, forward, swap and option positions. Our VaR model assumes a 15-day holding period at the time of VaR measurement and produces an output corresponding with a 95% one-tailed confidence interval, which means that there is a one in 20 statistical chance that our portfolio could lose more than the VaR estimates during the assumed liquidation period. Our volatility calculation incorporates an exponentially weighted moving average algorithm based on price movements during the previous 60 market days, which makes our volatility more representative of recent market conditions while still reflecting an awareness of historical price movements. VaR does not estimate the maximum potential loss expected in the 5% of the time that changes in the portfolio value during the assumed liquidation period is expected to exceed measured VaR. We use stress testing and scenario analysis to help provide visibility in such cases, as discussed further below.
|
Peabody Energy Corporation
|
2017 Form 10-K
|
81
|
VaR analysis allows us to aggregate market price risk across products in the portfolio, compare market price risk on a consistent basis and identify the drivers of risk and changes thereto over time. We use historical data to estimate price volatility as an input to VaR. Given our reliance on historical data, we believe VaR is reasonably effective in characterizing market price risk exposures in markets in which there are not sudden fundamental changes or shifts in market conditions. Nonetheless, an inherent limitation of VaR is that past changes in market price risk factors may not produce accurate predictions of future market price risk. Due to that limitation, combined with the subjectivity in the choice of the liquidation period and reliance on historical data to calibrate our models, we perform stress and scenario analyses as needed to estimate the impacts of market price changes on the value of the portfolio. Additionally, back-testing is regularly performed to monitor the effectiveness of our VaR measure. The results of these analyses are used to supplement the VaR methodology and identify additional market price-related risks.
During the year ended
December 31, 2017
, the actual low, high and average VaR was $0.6 million, $4.5 million and $1.9 million, respectively.
Other Risk Exposures.
We also use our coal trading and brokerage platform to support various coal production-related activities. These transactions may involve coal to be produced from our mines, coal sourcing arrangements with third-party mining companies, joint venture positions with producers or offtake agreements with producers. While the support activities (such as the forward sale of coal to be produced and/or purchased) may ultimately involve instruments sensitive to market price risk, the sourcing of coal in these arrangements does not involve market risk sensitive instruments and does not encompass the commodity price risks that we monitor through VaR analysis, as discussed above.
Future Realization.
As of
December 31, 2017
, the estimated future realization of the value of our trading portfolio is expected to be fully realized in
2018
.
We also monitor other types of risk associated with our coal trading activities, including credit, market liquidity and counterparty nonperformance.
Credit and Nonperformance Risk
Coal Trading.
The fair value of our coal trading assets and liabilities reflects adjustments for credit risk. Our exposure is substantially with electric utilities, energy marketers, steel producers and nonfinancial trading houses. Our policy is to independently evaluate each customer’s creditworthiness prior to entering into transactions and to regularly monitor the credit extended. If we engage in a transaction with a counterparty that does not meet our credit standards, we seek to protect its position by requiring the counterparty to provide an appropriate credit enhancement. Also, when appropriate (as determined by our credit management function), we have taken steps to reduce our exposure to customers or counterparties whose credit has deteriorated and who may pose a higher risk of failure to perform under their contractual obligations. These steps include obtaining letters of credit or cash collateral (margin), requiring prepayments for shipments or the creation of customer trust accounts held for our benefit to serve as collateral in the event of a failure to pay or perform. To reduce our credit exposure related to trading and brokerage activities, we seek to enter into netting agreements with counterparties that permit us to offset asset and liability positions with such counterparties and, to the extent required, we will post or receive margin amounts associated with exchange-cleared and certain over-the-counter positions. We also continually monitor counterparty and contract nonperformance risk, if present, on a case-by-case basis.
Non-Coal Trading.
The fair value of our non-coal trading derivative assets and liabilities reflects adjustments for credit risk. We manage our counterparty risk from our hedging activities related to foreign currency and fuel exposures, as applicable, through established credit standards, diversification of counterparties, utilization of investment grade commercial banks, adherence to established tenor limits based on counterparty creditworthiness and continual monitoring of that creditworthiness. To reduce our credit exposure for these hedging activities, we seek to enter into netting agreements with counterparties that permit us to offset receivable and payables with such counterparties in the event of default. We also continually monitor counterparties for nonperformance risk, if present, on a case-by-case basis.
Foreign Currency Risk
We have historically utilized currency forwards and options to hedge currency risk associated with anticipated Australian dollar expenditures. The accounting for these derivatives is discussed in Note 7. “Derivatives and Fair Value Measurements” to the accompanying consolidated financial statements. As of
December 31, 2017
, we had currency options outstanding with an aggregate notional amount of $1,125 million Australian dollars to hedge currency risk associated with anticipated Australian dollar expenditures during the first three quarters of
2018
. Assuming we had no foreign currency hedging instruments in place, our exposure in operating costs and expenses due to a $0.05 change in the Australian dollar/U.S. dollar exchange rate is approximately $90 to $100 million for the next twelve months. Taking into consideration the currency option contracts put into place as of
December 31, 2017
, our net exposure to unfavorable rate changes for the next twelve months is approximately $60 to $70 million.
|
Peabody Energy Corporation
|
2017 Form 10-K
|
82
|
Other Non-Coal Trading Activities — Commodity Price Risk
Long-Term Coal Contracts.
We predominantly manage our commodity price risk for our non-trading, long-term coal contract portfolio through the use of long-term coal supply agreements (those with terms longer than one year) to the extent possible, rather than through the use of derivative instruments. Sales under such agreements comprised approximately
83%
,
86%
and
88%
of our worldwide sales (by volume) for the years ended December 31,
2017
,
2016
and
2015
, respectively. As of
December 31, 2017
, approximately 90% of our projected
2018
U.S. coal production is priced at planned production levels of approximately 150 million tons. We are estimating
2018
thermal coal sales volumes from our Australian business unit of approximately 19 million to 21 million tons. We are targeting full year
2018
metallurgical coal sales from our Australian business unit of approximately 11 million to 12 million tons.
Diesel Fuel Hedges.
We have historically managed price risk of the diesel fuel and explosives used in our mining activities through the use of cost pass-through contracts and from time to time, derivatives, primarily swaps. As of
December 31, 2017
, we no longer have any diesel fuel derivative instruments in place.
We expect to consume 125 to 135 million gallons of diesel fuel during the next twelve months. A $10 per barrel change in the price of crude oil (the primary component of a refined diesel fuel product) would increase or decrease our annual diesel fuel costs by approximately $30 million based on our expected usage.
Interest Rate Risk
Our objectives in managing exposure to interest rate changes are to limit the impact of interest rate changes on earnings and cash flows and to lower overall borrowing costs. From time to time, we manage our debt to achieve a certain ratio of fixed-rate debt and variable-rate debt as a percent of net debt through the use of various hedging instruments. As of
December 31, 2017
, we had $1.1 billion of fixed-rate borrowings and $0.4 billion of variable-rate borrowings outstanding and had no interest rate swaps in place. A one percentage point increase in interest rates would result in an annualized increase to interest expense of approximately $4.5 million on our variable-rate borrowings. With respect to our fixed-rate borrowings, a one percentage point increase in interest rates would result in a decrease of approximately $51.1 million in the estimated fair value of these borrowings.
Item 8.
Financial Statements and Supplementary Data.
See Part IV, Item 15. “Exhibits and Financial Statement Schedules” of this report for the information required by this Item 8, which information is incorporated by reference herein.
Item 9.
Changes in and Disagreements with Accountants on Accounting and Financial Disclosure.
None.
Item 9A.
Controls and Procedures.
Evaluation of Disclosure Controls and Procedures
Our disclosure controls and procedures are designed to, among other things, provide reasonable assurance that material information, both financial and non-financial, and other information required under the securities laws to be disclosed is accumulated and communicated to senior management, including the principal executive officer and principal accounting officer, on a timely basis. As of
December 31, 2017
, the end of the period covered by this Annual Report on Form 10-K, we carried out an evaluation of the effectiveness of the design and operation of our disclosure controls and procedures. Based upon that evaluation, our Chief Executive Officer and Chief Financial Officer have concluded our disclosure controls and procedures, as defined in Rules 13a-15(e) and 15d-15(e) under the Securities Exchange Act of 1934, as amended (the Exchange Act) as of
December 31, 2017
are effective to provide reasonable assurance that the desired control objectives were achieved.
|
Peabody Energy Corporation
|
2017 Form 10-K
|
83
|
Changes in Internal Control Over Financial Reporting
We periodically review our internal control over financial reporting as part of our efforts to ensure compliance with the requirements of Section 404 of the Sarbanes-Oxley Act of 2002. In addition, we routinely review our system of internal control over financial reporting to identify potential changes to our processes and systems that may improve controls and increase efficiency, while ensuring that we maintain an effective internal control environment. Changes may include such activities as implementing new systems, consolidating the activities of acquired business units, migrating certain processes to our shared services organizations, formalizing and refining policies, procedures and control documentation requirements, improving segregation of duties and adding monitoring controls. In addition, when we acquire new businesses, we incorporate our controls and procedures into the acquired business as part of our integration activities. In the second quarter of 2017, management determined that the internal control around the reconciliation of tax basis balance sheets to deferred tax balances was not designed effectively and did not operate at a sufficient level of precision to prevent or detect a material misstatement on a timely basis. Specifically, an immaterial misstatement related to deferred tax liabilities of a single taxpayer outside of the consolidated Australian tax paying group was identified, which resulted in the understatement of the income tax valuation allowance required to reduce the carrying value of its deferred tax assets. The Company has subsequently revised its financial statements and related disclosures to correct these errors. To remediate the material weakness described above, we implemented an improved general ledger structure and a comprehensive analysis of all deferred tax positions. Additionally, we have revised and enhanced the design of existing controls and procedures to properly apply accounting principles in this area, which includes strengthening our income tax controls with improved documentation standards, training and technical oversight.
During the fourth quarter of fiscal 2017, we successfully completed the testing necessary to conclude that the material weakness has been remediated.
Except as noted above, there have been no changes in our internal control over financial reporting that occurred during the three months ended
December 31, 2017
that have materially affected, or are reasonably likely to materially affect, our internal control over financial reporting.
Management’s Report on Internal Control Over Financial Reporting
Management is responsible for maintaining and establishing adequate internal control over financial reporting. An evaluation of the effectiveness of the design and operation of our internal control over financial reporting, as defined in Rules 13a-15(f) and 15d-15(f) under the Exchange Act, as of the end of the period covered by this report was performed under the supervision and with the participation of management, including our Chief Executive Officer and Chief Financial Officer. This evaluation is performed to determine if our internal controls over financial reporting provide reasonable assurance regarding the reliability of financial reporting and the preparation of financial statements for external purposes in accordance with generally accepted accounting principles.
Because of inherent limitations, any system of internal control over financial reporting may not prevent or detect misstatements. Also, projections of any evaluation of effectiveness to future periods are subject to the risk that controls may become inadequate because of changes in conditions, or that the degree of compliance with the policies or procedures may deteriorate.
Management conducted an assessment of the effectiveness of our internal control over financial reporting using the criteria set by the Committee of Sponsoring Organizations of the Treadway Commission (COSO) in
Internal Control - Integrated Framework (2013).
Based on this assessment, management concluded that the Company’s internal control over financial reporting was effective to provide reasonable assurance that the desired control objectives were achieved as of December 31, 2017.
Our Independent Registered Public Accounting Firm, Ernst & Young LLP, has audited our internal control over financial reporting, as stated in their unqualified opinion report included herein.
|
/s/ Glenn L. Kellow
|
/s/ Amy B. Schwetz
|
||
|
Glenn L. Kellow
President and Chief Executive Officer
|
|
Amy B. Schwetz
Executive Vice President and Chief Financial Officer
|
|
February 26, 2018
|
Peabody Energy Corporation
|
2017 Form 10-K
|
84
|
REPORT OF INDEPENDENT REGISTERED PUBLIC ACCOUNTING FIRM
To the Stockholders and the Board of Directors of Peabody Energy Corporation
Opinion on Internal Control over Financial Reporting
We have audited Peabody Energy Corporation’s internal control over financial reporting as of December 31, 2017, based on criteria established in Internal Control-Integrated Framework issued by the Committee of Sponsoring Organizations of the Treadway Commission (2013 framework) (the COSO criteria). In our opinion, Peabody Energy Corporation (the Company) maintained, in all material respects, effective internal control over financial reporting as of December 31, 2017, based on the COSO criteria.
We also have audited, in accordance with the standards of the Public Company Accounting Oversight Board (United States) (PCAOB), the consolidated balance sheets of Peabody Energy Corporation as of December 31, 2017 (Successor) and 2016 (Predecessor), the related consolidated statements of operations, comprehensive income (loss), changes in stockholders’ equity and cash flows for the period from April 2, 2017 through December 31, 2017 (Successor), the period from January 1, 2017 through April 1, 2017 (Predecessor), and for each of the two years in the period ended December 31, 2016 (Predecessor) and the related notes and financial statement schedule listed in the index at Item 15(a) (collectively referred to as the “consolidated financial statements”) of the Company and our report dated
February 26, 2018
expressed an unqualified opinion thereon.
Basis for Opinion
The Company’s management is responsible for maintaining effective internal control over financial reporting and for its assessment of the effectiveness of internal control over financial reporting included in the accompanying Management’s Report on Internal Control over Financial Reporting. Our responsibility is to express an opinion on the Company’s internal control over financial reporting based on our audit. We are a public accounting firm registered with the PCAOB and are required to be independent with respect to the Company in accordance with the U.S. federal securities laws and the applicable rules and regulations of the Securities and Exchange Commission and the PCAOB.
We conducted our audit in accordance with the standards of the PCAOB. Those standards require that we plan and perform the audit to obtain reasonable assurance about whether effective internal control over financial reporting was maintained in all material respects.
Our audit included obtaining an understanding of internal control over financial reporting, assessing the risk that a material weakness exists, testing and evaluating the design and operating effectiveness of internal control based on the assessed risk, and performing such other procedures as we considered necessary in the circumstances. We believe that our audit provides a reasonable basis for our opinion.
Definition and Limitations of Internal Control over Financial Reporting
A company’s internal control over financial reporting is a process designed to provide reasonable assurance regarding the reliability of financial reporting and the preparation of financial statements for external purposes in accordance with generally accepted accounting principles. A company’s internal control over financial reporting includes those policies and procedures that (1) pertain to the maintenance of records that, in reasonable detail, accurately and fairly reflect the transactions and dispositions of the assets of the company; (2) provide reasonable assurance that transactions are recorded as necessary to permit preparation of financial statements in accordance with generally accepted accounting principles, and that receipts and expenditures of the company are being made only in accordance with authorizations of management and directors of the company; and (3) provide reasonable assurance regarding prevention or timely detection of unauthorized acquisition, use, or disposition of the company’s assets that could have a material effect on the financial statements.
Because of its inherent limitations, internal control over financial reporting may not prevent or detect misstatements. Also, projections of any evaluation of effectiveness to future periods are subject to the risk that controls may become inadequate because of changes in conditions, or that the degree of compliance with the policies or procedures may deteriorate.
/s/ Ernst & Young LLP
St. Louis, Missouri
February 26, 2018
|
Peabody Energy Corporation
|
2017 Form 10-K
|
85
|
Item 9B.
Other Information.
None.
Item 10.
Directors, Executive Officers and Corporate Governance.
The information required by Item 401 of Regulation S-K is included under the caption “Election of Directors-Director Qualifications” in our 2018 Proxy Statement and in Part I, Item 1. “Business” of this report under the caption “Executive Officers of the Company.” The information required by Items 405, 406 and 407(c)(3), (d)(4) and (d)(5) of Regulation S-K is included under the captions “Ownership of Company Securities — Section 16(a) Beneficial Ownership Reporting Compliance,” “Corporate Governance Matters” and “Information Regarding Board of Directors and Committees-Committees of the Board of Directors-Audit Committee” in our 2018 Proxy Statement. Such information is incorporated herein by reference.
Item 11.
Executive Compensation.
The information required by Items 402 and 407(e)(4) and (e)(5) of Regulation S-K is included under the captions “Executive Compensation,” “Compensation Committee Interlocks and Insider Participation” and “Report of the Compensation Committee” in our 2018 Proxy Statement and is incorporated herein by reference.
Item 12.
Security Ownership of Certain Beneficial Owners and Management and Related Stockholder Matters.
The information required by Item 403 of Regulation S-K is included under the caption “Ownership of Company Securities” in our 2018 Proxy Statement and is incorporated herein by reference.
Equity Compensation Plan Information
As required by Item 201(d) of Regulation S-K, the following table provides information regarding our equity compensation plans as of
December 31, 2017
:
|
(a)
Number of Securities
to be Issued
upon Exercise of
Outstanding Options,
Warrants and Rights
|
Weighted-Average
Exercise Price of
Outstanding Options,
Warrants and Rights
|
Number of Securities
Remaining Available
for Future Issuance
Under Equity
Compensation Plans
(Excluding
Securities
Reflected in Column
(a))
|
||||||||
|
Plan Category
|
|
|
||||||||
|
Equity compensation plans approved by security holders
|
24,792
|
|
(1)
|
$
|
—
|
|
(2)
|
10,508,916
|
|
|
|
Equity compensation plans not approved by security holders
|
—
|
|
|
—
|
|
|
—
|
|
||
|
Total
|
24,792
|
|
|
$
|
—
|
|
|
10,508,916
|
|
|
|
(1)
|
Includes 23,296 shares issuable pursuant to outstanding deferred stock units and 1,496 shares issuable pursuant to outstanding restricted stock units.
|
|
(2)
|
The weighted-average exercise price shown in the table does not take into account outstanding deferred stock units or restricted stock units.
|
Refer to Note 19. “Share-Based Compensation” to the accompanying consolidated financial statements for additional information regarding the material features of our current equity compensation plans.
Item 13.
Certain Relationships and Related Transactions, and Director Independence.
The information required by Items 404 and 407(a) of Regulation S-K is included under the captions “Policy for Approval of Related Person Transactions” and “Information Regarding Board of Directors and Committees-Director Independence” in our 2018 Proxy Statement and is incorporated herein by reference.
|
Peabody Energy Corporation
|
2017 Form 10-K
|
86
|
Item 14.
Principal Accountant Fees and Services.
The information required by Item 9(e) of Schedule 14A is included under the caption “Fees Paid to Independent Registered Public Accounting Firm” in our 2018 Proxy Statement and is incorporated herein by reference.
Item 15.
Exhibits and Financial Statement Schedules.
(a) Documents Filed as Part of the Report
(1) Financial Statements.
The following consolidated financial statements of Peabody Energy Corporation and the report thereon of the independent registered public accounting firm are included herein on the pages indicated:
|
|
Page
|
|
F-1
|
|
|
F-2
|
|
|
F-3
|
|
|
F-4
|
|
|
F-5
|
|
|
F-7
|
|
|
F-8
|
|
(2) Financial Statement Schedules.
The following financial statement schedule of Peabody Energy Corporation is at the page indicated:
|
|
Page
|
|
F-84
|
|
All other schedules for which provision is made in the applicable accounting regulation of the Securities and Exchange Commission are not required under the related instructions or are not applicable and, therefore, have been omitted.
(3) Exhibits.
See Exhibit Index hereto.
Pursuant to the Instructions to Exhibits, certain instruments defining the rights of holders of long-term debt securities of the Company and its consolidated subsidiaries are not filed because the total amount of securities authorized under any such instrument does not exceed 10% of the total assets of the Company and its subsidiaries on a consolidated basis. A copy of such instrument will be furnished to the Securities and Exchange Commission upon request.
|
Peabody Energy Corporation
|
2017 Form 10-K
|
87
|
SIGNATURES
Pursuant to the requirements of Section 13 or 15(d) of the Securities Exchange Act of 1934, the registrant has duly caused this report to be signed on its behalf by the undersigned, thereunto duly authorized.
|
PEABODY ENERGY CORPORATION
|
|
|
/s/ GLENN L. KELLOW
|
|
|
Glenn L. Kellow
President and Chief Executive Officer
|
|
Date: February 26, 2018
Pursuant to the requirements of the Securities Exchange Act of 1934, this report has been signed below by the following persons, on behalf of the registrant and in the capacities and on the dates indicated.
|
Signature
|
|
Title
|
|
Date
|
||
|
|
|
|
|
|
||
|
/s/ GLENN L. KELLOW
|
|
President and Chief Executive Officer,
Director (principal executive officer)
|
|
February 26, 2018
|
||
|
Glenn L. Kellow
|
||||||
|
|
|
|
|
|
||
|
/s/ AMY B. SCHWETZ
|
|
Executive Vice President and Chief Financial Officer (principal financial and accounting officer)
|
|
February 26, 2018
|
||
|
Amy B. Schwetz
|
||||||
|
|
|
|
|
|
||
|
/s/ NICHOLAS CHIREKOS
|
|
Director
|
|
February 23, 2018
|
||
|
Nicholas Chirekos
|
||||||
|
|
|
|
|
|
||
|
/s/ STEPHEN GORMAN
|
|
Director
|
|
February 23, 2018
|
||
|
Stephen Gorman
|
||||||
|
|
|
|
|
|
||
|
/s/ JOE LAYMON
|
|
Director
|
|
February 23, 2018
|
||
|
Joe Laymon
|
||||||
|
|
|
|
|
|
||
|
/s/ TERESA MADDEN
|
|
Director
|
|
February 23, 2018
|
||
|
Teresa Madden
|
||||||
|
|
|
|
|
|
||
|
/s/ ROBERT MALONE
|
|
Chairman
|
|
February 23, 2018
|
||
|
Robert Malone
|
||||||
|
|
|
|
|
|
||
|
/s/ KENNETH MOORE
|
|
Director
|
February 23, 2018
|
|||
|
Kenneth Moore
|
||||||
|
|
|
|
||||
|
/s/ MICHAEL SUTHERLIN
|
Director
|
|
February 23, 2018
|
|||
|
Michael Sutherlin
|
||||||
|
|
|
|||||
|
/s/ SHAUN USMAR
|
|
Director
|
|
February 23, 2018
|
||
|
Shaun Usmar
|
||||||
|
Peabody Energy Corporation
|
2017 Form 10-K
|
88
|
REPORT OF INDEPENDENT REGISTERED PUBLIC ACCOUNTING FIRM
To the Stockholders and the Board of Directors of Peabody Energy Corporation
Opinion on the Financial Statements
We have audited the accompanying consolidated balance sheets of Peabody Energy Corporation (the Company) as of December 31, 2017 (Successor) and 2016 (Predecessor), the related consolidated statements of operations, comprehensive income (loss), changes in stockholders’ equity and cash flows for the period from April 2, 2017 through December 31, 2017 (Successor), the period from January 1, 2017 through April 1, 2017 (Predecessor), and for each of the two years in the period ended December 31, 2016 (Predecessor), and the related notes and financial statement schedule listed in the Index at Item 15(a) (collectively referred to as the “consolidated financial statements”). In our opinion, the consolidated financial statements present fairly, in all material respects, the financial position of the Company at December 31, 2017 (Successor) and 2016 (Predecessor), and the results of its operations and its cash flows for the period from April 2, 2017 through December 31, 2017 (Successor), the period from January 1, 2017 through April 1, 2017 (Predecessor), and each of the two years in the period ended December 31, 2016 (Predecessor), in conformity with US generally accepted accounting principles.
We also have audited, in accordance with the standards of the Public Company Accounting Oversight Board (United States) (PCAOB), the Company’s internal control over financial reporting as of December 31, 2017, based on criteria established in Internal Control-Integrated Framework issued by the Committee of Sponsoring Organizations of the Treadway Commission (2013 framework), and our report dated
February 26, 2018
expressed an unqualified opinion thereon.
Basis for Opinion
These financial statements are the responsibility of the Company’s management. Our responsibility is to express an opinion on the Company’s financial statements based on our audits. We are a public accounting firm registered with the PCAOB and are required to be independent with respect to the Company in accordance with the U.S. federal securities laws and the applicable rules and regulations of the Securities and Exchange Commission and the PCAOB.
We conducted our audits in accordance with the standards of the PCAOB. Those standards require that we plan and perform the audit to obtain reasonable assurance about whether the financial statements are free of material misstatement, whether due to error or fraud. Our audits included performing procedures to assess the risks of material misstatement of the financial statements, whether due to error or fraud, and performing procedures that respond to those risks. Such procedures include examining, on a test basis, evidence regarding the amounts and disclosures in the financial statements. Our audits also included evaluating the accounting principles used and significant estimates made by management, as well as evaluating the overall presentation of the financial statements. We believe that our audits provide a reasonable basis for our opinion.
Company Reorganization
As discussed in Notes 1 and 2 to the consolidated financial statements, on March 17, 2017, the Bankruptcy Court entered an order confirming the plan of reorganization, which became effective on April 3, 2017. Accordingly, the accompanying consolidated financial statements have been prepared in conformity with Accounting Standards Codification 852-10, Reorganizations, for the Successor Company as a new entity with assets, liabilities and a capital structure having carrying amounts not comparable with prior periods (Predecessor) as described in Notes 1 and 2.
/s/ Ernst & Young LLP
We have served as the Company’s auditor since 1991.
St. Louis, Missouri
February 26, 2018
|
Peabody Energy Corporation
|
2017 Form 10-K
|
F-
1
|
PEABODY ENERGY CORPORATION
|
Successor
|
Predecessor
|
|||||||||||||
|
April 2 through December 31, 2017
|
January 1 through April 1, 2017
|
Year Ended December 31, 2016
|
|
Year Ended December 31, 2015
|
||||||||||
|
|
(Dollars in millions, except per share data)
|
|||||||||||||
|
Revenues
|
|
|
|
|
|
|
||||||||
|
Sales
|
$
|
3,625.8
|
|
$
|
1,081.4
|
|
$
|
4,087.9
|
|
$
|
5,138.3
|
|
||
|
Other revenues
|
626.8
|
|
244.8
|
|
627.4
|
|
470.9
|
|
||||||
|
Total revenues
|
4,252.6
|
|
1,326.2
|
|
4,715.3
|
|
5,609.2
|
|
||||||
|
Costs and expenses
|
|
|
||||||||||||
|
Operating costs and expenses (exclusive of items shown separately below)
|
3,067.9
|
|
963.7
|
|
4,107.6
|
|
5,007.7
|
|
||||||
|
Depreciation, depletion and amortization
|
521.6
|
|
119.9
|
|
465.4
|
|
572.2
|
|
||||||
|
Asset retirement obligation expenses
|
41.2
|
|
14.6
|
|
41.8
|
|
45.5
|
|
||||||
|
Selling and administrative expenses
|
105.4
|
|
37.2
|
|
153.4
|
|
176.4
|
|
||||||
|
Net mark-to-market adjustment on actuarially determined liabilities
|
(45.2
|
)
|
—
|
|
—
|
|
—
|
|
||||||
|
Restructuring charges
|
7.6
|
|
—
|
|
15.5
|
|
23.5
|
|
||||||
|
Other operating income (loss):
|
||||||||||||||
|
Net gain on disposals
|
(84.0
|
)
|
(22.8
|
)
|
(23.2
|
)
|
(45.0
|
)
|
||||||
|
Asset impairment
|
—
|
|
30.5
|
|
247.9
|
|
1,277.8
|
|
||||||
|
(Income) loss from equity affiliates
|
(49.0
|
)
|
(15.0
|
)
|
(16.2
|
)
|
15.9
|
|
||||||
|
Operating profit (loss)
|
687.1
|
|
198.1
|
|
(276.9
|
)
|
(1,464.8
|
)
|
||||||
|
Interest expense
|
119.7
|
|
32.9
|
|
298.6
|
|
465.4
|
|
||||||
|
Loss on early debt extinguishment
|
20.9
|
|
—
|
|
29.5
|
|
67.8
|
|
||||||
|
Interest income
|
(5.6
|
)
|
(2.7
|
)
|
(5.7
|
)
|
(7.7
|
)
|
||||||
|
Reorganization items, net
|
—
|
|
627.2
|
|
159.0
|
|
—
|
|
||||||
|
Income (loss) from continuing operations before income taxes
|
552.1
|
|
(459.3
|
)
|
(758.3
|
)
|
(1,990.3
|
)
|
||||||
|
Income tax benefit
|
(161.0
|
)
|
(263.8
|
)
|
(94.5
|
)
|
(207.1
|
)
|
||||||
|
Income (loss) from continuing operations, net of income taxes
|
713.1
|
|
(195.5
|
)
|
(663.8
|
)
|
(1,783.2
|
)
|
||||||
|
Loss from discontinued operations, net of income taxes
|
(19.8
|
)
|
(16.2
|
)
|
(57.6
|
)
|
(175.0
|
)
|
||||||
|
Net income (loss)
|
693.3
|
|
(211.7
|
)
|
(721.4
|
)
|
(1,958.2
|
)
|
||||||
|
Less: Series A Convertible Preferred Stock dividends
|
179.5
|
|
—
|
|
—
|
|
—
|
|
||||||
|
Less: Net income attributable to noncontrolling interests
|
15.2
|
|
4.8
|
|
7.9
|
|
7.1
|
|
||||||
|
Net income (loss) attributable to common stockholders
|
$
|
498.6
|
|
$
|
(216.5
|
)
|
$
|
(729.3
|
)
|
$
|
(1,965.3
|
)
|
||
|
Income (loss) from continuing operations
|
||||||||||||||
|
Basic earnings (loss) per share
|
$
|
3.85
|
|
$
|
(10.93
|
)
|
$
|
(36.72
|
)
|
$
|
(98.65
|
)
|
||
|
Diluted earnings (loss) per share
|
$
|
3.81
|
|
$
|
(10.93
|
)
|
$
|
(36.72
|
)
|
$
|
(98.65
|
)
|
||
|
Net income (loss) attributable to common stockholders
|
||||||||||||||
|
Basic earnings (loss) per share
|
$
|
3.70
|
|
$
|
(11.81
|
)
|
$
|
(39.87
|
)
|
$
|
(108.29
|
)
|
||
|
Diluted earnings (loss) per share
|
$
|
3.67
|
|
$
|
(11.81
|
)
|
$
|
(39.87
|
)
|
$
|
(108.29
|
)
|
||
|
Dividends declared per share
|
$
|
—
|
|
$
|
—
|
|
$
|
—
|
|
$
|
0.075
|
|
||
See accompanying notes to consolidated financial statements
|
Peabody Energy Corporation
|
2017 Form 10-K
|
F-
2
|
PEABODY ENERGY CORPORATION
CONSOLIDATED STATEMENTS OF COMPREHENSIVE INCOME (LOSS)
|
Successor
|
Predecessor
|
|||||||||||||
|
April 2 through December 31, 2017
|
January 1 through April 1, 2017
|
Year Ended December 31, 2016
|
Year Ended December 31, 2015
|
|||||||||||
|
(Dollars in millions)
|
||||||||||||||
|
Net income (loss)
|
$
|
693.3
|
|
$
|
(211.7
|
)
|
$
|
(721.4
|
)
|
$
|
(1,958.2
|
)
|
||
|
Other comprehensive income, net of income taxes:
|
||||||||||||||
|
Net unrealized gains (losses) on cash flow hedges (net of respective tax benefit of $0.0, $0.0, $85.9, and $72.2)
|
||||||||||||||
|
Decrease in fair value of cash flow hedges
|
—
|
|
—
|
|
—
|
|
(131.3
|
)
|
||||||
|
Reclassification for realized losses included in net income (loss)
|
—
|
|
18.6
|
|
146.3
|
|
251.7
|
|
||||||
|
Net unrealized gains on cash flow hedges
|
—
|
|
18.6
|
|
146.3
|
|
120.4
|
|
||||||
|
Postretirement plans and workers’ compensation obligations (net of respective tax (benefit) provision of $0.0, $0.0, ($1.5), and $36.2)
|
||||||||||||||
|
Prior service (cost) credit for the period
|
—
|
|
—
|
|
(4.5
|
)
|
10.4
|
|
||||||
|
Net actuarial (loss) gain for the period
|
—
|
|
—
|
|
(13.5
|
)
|
18.1
|
|
||||||
|
Amortization of actuarial loss and prior service cost included in net income (loss)
|
—
|
|
4.4
|
|
15.4
|
|
31.9
|
|
||||||
|
Postretirement plans and workers’ compensation obligations
|
—
|
|
4.4
|
|
(2.6
|
)
|
60.4
|
|
||||||
|
Foreign currency translation adjustment
|
1.4
|
|
5.5
|
|
(1.8
|
)
|
(34.9
|
)
|
||||||
|
Other comprehensive income, net of income taxes
|
1.4
|
|
28.5
|
|
141.9
|
|
145.9
|
|
||||||
|
Comprehensive income (loss)
|
694.7
|
|
(183.2
|
)
|
(579.5
|
)
|
(1,812.3
|
)
|
||||||
|
Less: Series A Convertible Preferred Stock dividends
|
179.5
|
|
—
|
|
—
|
|
—
|
|
||||||
|
Less: Comprehensive income attributable to noncontrolling interests
|
15.2
|
|
4.8
|
|
7.9
|
|
7.1
|
|
||||||
|
Comprehensive income (loss) attributable to common stockholders
|
$
|
500.0
|
|
$
|
(188.0
|
)
|
$
|
(587.4
|
)
|
$
|
(1,819.4
|
)
|
||
See accompanying notes to consolidated financial statements
|
Peabody Energy Corporation
|
2017 Form 10-K
|
F-
3
|
PEABODY ENERGY CORPORATION
|
Successor
|
Predecessor
|
||||||
|
|
December 31,
|
||||||
|
|
2017
|
2016
|
|||||
|
(Amounts in millions, except per share data)
|
|||||||
|
ASSETS
|
|||||||
|
Current assets
|
|
|
|
|
|||
|
Cash and cash equivalents
|
$
|
1,012.1
|
|
$
|
872.3
|
|
|
|
Restricted cash
|
40.1
|
|
54.3
|
|
|||
|
Accounts receivable, net of allowance for doubtful accounts of $4.6 at December 31, 2017 and $13.1 at December 31, 2016
|
552.1
|
|
473.0
|
|
|||
|
Inventories
|
291.3
|
|
203.7
|
|
|||
|
Assets from coal trading activities, net
|
2.6
|
|
0.7
|
|
|||
|
Other current assets
|
291.8
|
|
486.6
|
|
|||
|
Total current assets
|
2,190.0
|
|
2,090.6
|
|
|||
|
Property, plant, equipment and mine development, net
|
5,111.9
|
|
8,776.7
|
|
|||
|
Restricted cash collateral
|
323.1
|
|
529.3
|
|
|||
|
Investments and other assets
|
470.6
|
|
381.1
|
|
|||
|
Deferred income taxes
|
85.6
|
|
—
|
|
|||
|
Total assets
|
$
|
8,181.2
|
|
$
|
11,777.7
|
|
|
|
LIABILITIES AND STOCKHOLDERS’ EQUITY
|
|||||||
|
Current liabilities
|
|
|
|
|
|||
|
Current portion of long-term debt
|
$
|
42.1
|
|
$
|
20.2
|
|
|
|
Liabilities from coal trading activities, net
|
11.7
|
|
1.2
|
|
|||
|
Accounts payable and accrued expenses
|
1,191.1
|
|
990.4
|
|
|||
|
Total current liabilities
|
1,244.9
|
|
1,011.8
|
|
|||
|
Long-term debt, less current portion
|
1,418.7
|
|
—
|
|
|||
|
Deferred income taxes
|
5.4
|
|
173.9
|
|
|||
|
Asset retirement obligations
|
657.0
|
|
717.8
|
|
|||
|
Accrued postretirement benefit costs
|
730.0
|
|
756.3
|
|
|||
|
Other noncurrent liabilities
|
469.4
|
|
496.2
|
|
|||
|
Total liabilities not subject to compromise
|
4,525.4
|
|
3,156.0
|
|
|||
|
Liabilities subject to compromise
|
—
|
|
8,440.2
|
|
|||
|
Total liabilities
|
4,525.4
|
|
11,596.2
|
|
|||
|
Stockholders’ equity
|
|
|
|
|
|||
|
Predecessor Preferred Stock — $0.01 per share par value; 10.0 shares authorized, no shares issued or outstanding as of December 31, 2016
|
—
|
|
—
|
|
|||
|
Predecessor Perpetual Preferred Stock — 0.8 shares authorized, no shares issued or outstanding as of December 31, 2016
|
—
|
|
—
|
|
|||
|
Predecessor Series Common Stock — $0.01 per share par value; 40.0 shares authorized, no shares issued or outstanding as of December 31, 2016
|
—
|
|
—
|
|
|||
|
Predecessor Common Stock — $0.01 per share par value; 53.3 shares authorized, 19.3 shares issued and 18.5 shares outstanding as of December 31, 2016
|
—
|
|
0.2
|
|
|||
|
Successor Series A Convertible Preferred Stock — $0.01 per share par value; 50.0 shares authorized, 30.0 shares issued and 13.5 shares outstanding as of December 31, 2017
|
576.0
|
|
—
|
|
|||
|
Successor Preferred Stock — $0.01 per share par value; 50.0 shares authorized, no shares issued or outstanding as of December 31, 2017
|
—
|
|
—
|
|
|||
|
Successor Series Common Stock — $0.01 per share par value; 50.0 shares authorized, no shares issued or outstanding as of December 31, 2017
|
—
|
|
—
|
|
|||
|
Successor Common Stock — $0.01 per share par value; 450.0 shares authorized, 111.8 shares issued and 105.2 shares outstanding as of December 31, 2017
|
1.0
|
|
—
|
|
|||
|
Additional paid-in capital
|
2,590.3
|
|
2,422.0
|
|
|||
|
Treasury stock, at cost — 5.8 Successor common shares as of December 31, 2017 and 0.8 Predecessor common shares as of December 31, 2016
|
(175.9
|
)
|
(371.8
|
)
|
|||
|
Retained earnings (accumulated deficit)
|
613.6
|
|
(1,399.5
|
)
|
|||
|
Accumulated other comprehensive income (loss)
|
1.4
|
|
(477.0
|
)
|
|||
|
Peabody Energy Corporation stockholders’ equity
|
3,606.4
|
|
173.9
|
|
|||
|
Noncontrolling interests
|
49.4
|
|
7.6
|
|
|||
|
Total stockholders’ equity
|
3,655.8
|
|
181.5
|
|
|||
|
Total liabilities and stockholders’ equity
|
$
|
8,181.2
|
|
$
|
11,777.7
|
|
|
See accompanying notes to consolidated financial statements
|
Peabody Energy Corporation
|
2017 Form 10-K
|
F-
4
|
PEABODY ENERGY CORPORATION
|
|
Successor
|
Predecessor
|
||||||||||||
|
|
April 2 through December 31, 2017
|
January 1 through April 1, 2017
|
Year Ended December 31, 2016
|
Year Ended December 31, 2015
|
||||||||||
|
|
(Dollars in millions)
|
|||||||||||||
|
Cash Flows From Operating Activities
|
|
|
|
|
|
|
||||||||
|
Net income (loss)
|
$
|
693.3
|
|
$
|
(211.7
|
)
|
$
|
(721.4
|
)
|
$
|
(1,958.2
|
)
|
||
|
Loss from discontinued operations, net of income taxes
|
19.8
|
|
16.2
|
|
57.6
|
|
175.0
|
|
||||||
|
Income (loss) from continuing operations, net of income taxes
|
713.1
|
|
(195.5
|
)
|
(663.8
|
)
|
(1,783.2
|
)
|
||||||
|
Adjustments to reconcile income (loss) from continuing operations, net of income taxes to net cash provided by (used in) operating activities:
|
|
|
|
|
|
|
||||||||
|
Depreciation, depletion and amortization
|
521.6
|
|
119.9
|
|
465.4
|
|
572.2
|
|
||||||
|
Noncash coal inventory revaluation
|
67.3
|
|
—
|
|
—
|
|
—
|
|
||||||
|
Noncash interest expense including loss on early extinguishment of debt
|
34.0
|
|
0.5
|
|
61.3
|
|
30.6
|
|
||||||
|
Deferred income taxes
|
(99.6
|
)
|
(262.3
|
)
|
(97.0
|
)
|
(138.3
|
)
|
||||||
|
Noncash share-based compensation
|
21.8
|
|
1.9
|
|
12.8
|
|
28.2
|
|
||||||
|
Asset impairment
|
—
|
|
30.5
|
|
247.9
|
|
1,277.8
|
|
||||||
|
Net gain on disposals
|
(84.0
|
)
|
(22.8
|
)
|
(23.2
|
)
|
(45.0
|
)
|
||||||
|
(Income) loss from equity affiliates
|
(49.0
|
)
|
(15.0
|
)
|
(16.2
|
)
|
15.9
|
|
||||||
|
Gain on voluntary employee beneficiary association settlement
|
—
|
|
—
|
|
(68.1
|
)
|
—
|
|
||||||
|
Foreign currency option contracts
|
(0.8
|
)
|
—
|
|
—
|
|
—
|
|
||||||
|
Reclassification from other comprehensive earnings for terminated hedge contracts
|
—
|
|
27.6
|
|
125.2
|
|
—
|
|
||||||
|
Settlement of hedge positions
|
—
|
|
—
|
|
(25.0
|
)
|
(14.9
|
)
|
||||||
|
Noncash reorganization items, net
|
—
|
|
569.3
|
|
90.9
|
|
—
|
|
||||||
|
Changes in current assets and liabilities:
|
|
|
|
|
|
|
||||||||
|
Accounts receivable
|
(240.1
|
)
|
159.3
|
|
(101.3
|
)
|
188.0
|
|
||||||
|
Change in receivable from accounts receivable securitization program
|
—
|
|
—
|
|
(168.5
|
)
|
138.5
|
|
||||||
|
Inventories
|
(36.8
|
)
|
(47.2
|
)
|
104.0
|
|
96.2
|
|
||||||
|
Net assets from coal trading activities
|
9.1
|
|
(0.5
|
)
|
8.5
|
|
(27.3
|
)
|
||||||
|
Other current assets
|
(51.2
|
)
|
0.1
|
|
(24.4
|
)
|
14.8
|
|
||||||
|
Accounts payable and accrued expenses
|
(169.5
|
)
|
(54.8
|
)
|
156.5
|
|
(381.7
|
)
|
||||||
|
Restricted cash
|
274.2
|
|
(94.1
|
)
|
(125.7
|
)
|
—
|
|
||||||
|
Asset retirement obligations
|
12.1
|
|
10.2
|
|
13.1
|
|
23.9
|
|
||||||
|
Workers’ compensation obligations
|
(1.1
|
)
|
(3.1
|
)
|
(0.4
|
)
|
(4.2
|
)
|
||||||
|
Postretirement benefit obligations
|
(19.8
|
)
|
0.8
|
|
6.3
|
|
18.7
|
|
||||||
|
Pension obligations
|
(55.4
|
)
|
5.4
|
|
21.7
|
|
29.6
|
|
||||||
|
Take-or-pay obligation settlement
|
—
|
|
(5.5
|
)
|
(15.5
|
)
|
—
|
|
||||||
|
Other, net
|
(29.9
|
)
|
(2.5
|
)
|
(7.4
|
)
|
(20.9
|
)
|
||||||
|
Net cash provided by (used in) continuing operations
|
816.0
|
|
222.2
|
|
(22.9
|
)
|
18.9
|
|
||||||
|
Net cash used in discontinued operations
|
(18.8
|
)
|
(8.2
|
)
|
(29.9
|
)
|
(33.3
|
)
|
||||||
|
Net cash provided by (used in) operating activities
|
797.2
|
|
214.0
|
|
(52.8
|
)
|
(14.4
|
)
|
||||||
|
Peabody Energy Corporation
|
2017 Form 10-K
|
F-
5
|
PEABODY ENERGY CORPORATION
CONSOLIDATED STATEMENTS OF CASH FLOWS - (Continued)
|
Successor
|
Predecessor
|
|||||||||||||
|
April 2 through December 31, 2017
|
January 1 through April 1, 2017
|
Year Ended December 31, 2016
|
Year Ended December 31, 2015
|
|||||||||||
|
(Dollars in millions)
|
||||||||||||||
|
Cash Flows From Investing Activities
|
||||||||||||||
|
Additions to property, plant, equipment and mine development
|
(166.6
|
)
|
(32.8
|
)
|
(126.6
|
)
|
(126.8
|
)
|
||||||
|
Changes in accrued expenses related to capital expenditures
|
16.2
|
|
(1.4
|
)
|
(6.1
|
)
|
(9.2
|
)
|
||||||
|
Federal coal lease expenditures
|
—
|
|
(0.5
|
)
|
(249.0
|
)
|
(277.2
|
)
|
||||||
|
Proceeds from disposal of assets
|
17.9
|
|
24.3
|
|
144.4
|
|
70.4
|
|
||||||
|
Purchases of debt and equity securities
|
—
|
|
—
|
|
—
|
|
(28.8
|
)
|
||||||
|
Proceeds from sales and maturities of debt and equity securities
|
—
|
|
—
|
|
—
|
|
90.3
|
|
||||||
|
Contributions to joint ventures
|
(305.8
|
)
|
(95.4
|
)
|
(309.5
|
)
|
(425.4
|
)
|
||||||
|
Distributions from joint ventures
|
307.0
|
|
90.5
|
|
312.4
|
|
422.6
|
|
||||||
|
Advances to related parties
|
(3.0
|
)
|
(0.4
|
)
|
(40.4
|
)
|
(3.7
|
)
|
||||||
|
Repayment of loans from related parties
|
51.3
|
|
31.1
|
|
40.6
|
|
0.9
|
|
||||||
|
Other, net
|
(10.4
|
)
|
(0.3
|
)
|
(9.9
|
)
|
(3.1
|
)
|
||||||
|
Net cash (used in) provided by investing activities
|
(93.4
|
)
|
15.1
|
|
(244.1
|
)
|
(290.0
|
)
|
||||||
|
Cash Flows From Financing Activities
|
|
|
|
|
|
|
||||||||
|
Proceeds from long-term debt
|
$
|
—
|
|
$
|
1,000.0
|
|
$
|
1,458.4
|
|
$
|
975.7
|
|
||
|
Successor Notes issuance proceeds into escrow
|
—
|
|
(1,000.0
|
)
|
—
|
|
—
|
|
||||||
|
Repayments of long-term debt
|
(541.8
|
)
|
(2.1
|
)
|
(513.7
|
)
|
(671.3
|
)
|
||||||
|
Payment of deferred financing costs
|
(10.8
|
)
|
(45.4
|
)
|
(31.0
|
)
|
(28.7
|
)
|
||||||
|
Common stock repurchases
|
(175.7
|
)
|
—
|
|
—
|
|
—
|
|
||||||
|
Dividends paid
|
—
|
|
—
|
|
—
|
|
(1.4
|
)
|
||||||
|
Distributions to noncontrolling interests
|
(16.7
|
)
|
(0.1
|
)
|
(1.9
|
)
|
(6.3
|
)
|
||||||
|
Other, net
|
(0.4
|
)
|
(0.1
|
)
|
(3.9
|
)
|
(0.3
|
)
|
||||||
|
Net cash (used in) provided by financing activities
|
(745.4
|
)
|
(47.7
|
)
|
907.9
|
|
267.7
|
|
||||||
|
Net change in cash and cash equivalents
|
(41.6
|
)
|
181.4
|
|
611.0
|
|
(36.7
|
)
|
||||||
|
Cash and cash equivalents at beginning of year
|
1,053.7
|
|
872.3
|
|
261.3
|
|
298.0
|
|
||||||
|
Cash and cash equivalents at end of year
|
$
|
1,012.1
|
|
$
|
1,053.7
|
|
$
|
872.3
|
|
$
|
261.3
|
|
||
See accompanying notes to consolidated financial statements
|
Peabody Energy Corporation
|
2017 Form 10-K
|
F-
6
|
PEABODY ENERGY CORPORATION
CONSOLIDATED STATEMENTS OF CHANGES IN STOCKHOLDERS’ EQUITY
|
|
Peabody Energy Corporation Stockholders’ Equity
|
|
|
||||||||||||||||||||||||||||
|
Series A Convertible Preferred Stock
|
Common
Stock
|
Additional
Paid-in
Capital
|
Treasury
Stock
|
Retained
Earnings (Accumulated Deficit)
|
Accumulated
Other
Comprehensive (Loss) Income
|
Noncontrolling
Interests
|
Total
Stockholders’
Equity
|
||||||||||||||||||||||||
|
|
(Dollars in millions)
|
||||||||||||||||||||||||||||||
|
December 31, 2014 - Predecessor
|
$
|
—
|
|
$
|
0.2
|
|
$
|
2,386.0
|
|
$
|
(467.1
|
)
|
$
|
1,373.0
|
|
$
|
(764.8
|
)
|
$
|
1.7
|
|
$
|
2,529.0
|
|
|||||||
|
Net (loss) income
|
—
|
|
—
|
|
—
|
|
—
|
|
(1,965.3
|
)
|
—
|
|
7.1
|
|
(1,958.2
|
)
|
|||||||||||||||
|
Net change in unrealized losses on available-for-sale securities (net of $0.1 tax benefit)
|
—
|
|
—
|
|
—
|
|
—
|
|
—
|
|
—
|
|
—
|
|
—
|
|
|||||||||||||||
|
Net unrealized gains on cash flow hedges (net of $72.2 tax provision)
|
—
|
|
—
|
|
—
|
|
—
|
|
—
|
|
120.4
|
|
—
|
|
120.4
|
|
|||||||||||||||
|
Postretirement plans and workers’ compensation obligations (net of $36.2 tax provision)
|
—
|
|
—
|
|
—
|
|
—
|
|
—
|
|
60.4
|
|
—
|
|
60.4
|
|
|||||||||||||||
|
Foreign currency translation adjustment
|
—
|
|
—
|
|
—
|
|
—
|
|
—
|
|
(34.9
|
)
|
—
|
|
(34.9
|
)
|
|||||||||||||||
|
Dividends paid
|
—
|
|
—
|
|
—
|
|
—
|
|
(1.4
|
)
|
—
|
|
—
|
|
(1.4
|
)
|
|||||||||||||||
|
Share-based compensation for equity-classified awards
|
—
|
|
—
|
|
26.2
|
|
—
|
|
—
|
|
—
|
|
—
|
|
26.2
|
|
|||||||||||||||
|
Employee stock purchases
|
—
|
|
—
|
|
3.4
|
|
—
|
|
—
|
|
—
|
|
—
|
|
3.4
|
|
|||||||||||||||
|
Defined contribution plan share contribution
|
—
|
|
—
|
|
(1.4
|
)
|
97.5
|
|
(76.5
|
)
|
—
|
|
—
|
|
19.6
|
|
|||||||||||||||
|
Purchase of interest of noncontrolling stockholders
|
—
|
|
—
|
|
(3.5
|
)
|
—
|
|
—
|
|
—
|
|
(0.5
|
)
|
(4.0
|
)
|
|||||||||||||||
|
Repurchase of employee common stock relinquished for tax withholding
|
—
|
|
—
|
|
—
|
|
(2.1
|
)
|
—
|
|
—
|
|
—
|
|
(2.1
|
)
|
|||||||||||||||
|
Consolidation of noncontrolling interests
|
—
|
|
—
|
|
—
|
|
—
|
|
—
|
|
—
|
|
1.6
|
|
1.6
|
|
|||||||||||||||
|
Distributions to noncontrolling interests
|
—
|
|
—
|
|
—
|
|
—
|
|
—
|
|
—
|
|
(6.3
|
)
|
(6.3
|
)
|
|||||||||||||||
|
Dividend payable to noncontrolling interests
|
—
|
|
—
|
|
—
|
|
—
|
|
—
|
|
—
|
|
(2.0
|
)
|
(2.0
|
)
|
|||||||||||||||
|
December 31, 2015 - Predecessor
|
$
|
—
|
|
$
|
0.2
|
|
$
|
2,410.7
|
|
$
|
(371.7
|
)
|
$
|
(670.2
|
)
|
$
|
(618.9
|
)
|
$
|
1.6
|
|
$
|
751.7
|
|
|||||||
|
Net (loss) income
|
—
|
|
—
|
|
—
|
|
—
|
|
(729.3
|
)
|
—
|
|
7.9
|
|
(721.4
|
)
|
|||||||||||||||
|
Net unrealized gains on cash flow hedges (net of $85.9 tax provision)
|
—
|
|
—
|
|
—
|
|
—
|
|
—
|
|
146.3
|
|
—
|
|
146.3
|
|
|||||||||||||||
|
Postretirement plans and workers’ compensation obligations (net of $1.5 tax benefit)
|
—
|
|
—
|
|
—
|
|
—
|
|
—
|
|
(2.6
|
)
|
—
|
|
(2.6
|
)
|
|||||||||||||||
|
Foreign currency translation adjustment
|
—
|
|
—
|
|
—
|
|
—
|
|
—
|
|
(1.8
|
)
|
—
|
|
(1.8
|
)
|
|||||||||||||||
|
Share-based compensation for equity-classified awards
|
—
|
|
—
|
|
11.3
|
|
—
|
|
—
|
|
—
|
|
—
|
|
11.3
|
|
|||||||||||||||
|
Repurchase of employee common stock relinquished for tax withholding
|
—
|
|
—
|
|
—
|
|
(0.1
|
)
|
—
|
|
—
|
|
—
|
|
(0.1
|
)
|
|||||||||||||||
|
Distributions to noncontrolling interests
|
—
|
|
—
|
|
—
|
|
—
|
|
—
|
|
—
|
|
(1.9
|
)
|
(1.9
|
)
|
|||||||||||||||
|
December 31, 2016 - Predecessor
|
$
|
—
|
|
|
$
|
0.2
|
|
|
$
|
2,422.0
|
|
|
$
|
(371.8
|
)
|
|
$
|
(1,399.5
|
)
|
|
$
|
(477.0
|
)
|
|
$
|
7.6
|
|
|
$
|
181.5
|
|
|
Net (loss) income
|
—
|
|
|
—
|
|
|
—
|
|
|
—
|
|
|
(216.5
|
)
|
|
—
|
|
|
4.8
|
|
|
(211.7
|
)
|
||||||||
|
Net realized losses on cash flow hedges (net of $9.1 net tax provision)
|
—
|
|
|
—
|
|
|
—
|
|
|
—
|
|
|
—
|
|
|
18.6
|
|
|
—
|
|
|
18.6
|
|
||||||||
|
Postretirement plans and workers’ compensation obligations (net of $2.5 tax provision)
|
—
|
|
|
—
|
|
|
—
|
|
|
—
|
|
|
—
|
|
|
4.4
|
|
|
—
|
|
|
4.4
|
|
||||||||
|
Foreign currency translation adjustment
|
—
|
|
|
—
|
|
|
—
|
|
|
—
|
|
|
—
|
|
|
5.5
|
|
|
—
|
|
|
5.5
|
|
||||||||
|
Share-based compensation for equity-classified awards
|
—
|
|
|
—
|
|
|
1.9
|
|
|
—
|
|
|
—
|
|
|
—
|
|
|
—
|
|
|
1.9
|
|
||||||||
|
Repurchase of employee common stock relinquished for tax withholding
|
—
|
|
|
—
|
|
|
—
|
|
|
(0.1
|
)
|
|
—
|
|
|
—
|
|
|
—
|
|
|
(0.1
|
)
|
||||||||
|
Distributions to noncontrolling interests
|
—
|
|
|
—
|
|
|
—
|
|
|
—
|
|
|
—
|
|
|
—
|
|
|
(0.1
|
)
|
|
(0.1
|
)
|
||||||||
|
Elimination of Predecessor equity
|
—
|
|
|
(0.2
|
)
|
|
(2,423.9
|
)
|
|
371.9
|
|
|
1,616.0
|
|
|
448.5
|
|
|
(12.3
|
)
|
|
—
|
|
||||||||
|
April 1, 2017 - Predecessor
|
$
|
—
|
|
|
$
|
—
|
|
|
$
|
—
|
|
|
$
|
—
|
|
|
$
|
—
|
|
|
$
|
—
|
|
|
$
|
—
|
|
|
$
|
—
|
|
|
Issuance of Successor equity
|
1,305.4
|
|
|
0.7
|
|
|
1,774.9
|
|
|
—
|
|
|
—
|
|
|
—
|
|
|
50.9
|
|
|
3,131.9
|
|
||||||||
|
April 2, 2017 - Successor
|
$
|
1,305.4
|
|
|
$
|
0.7
|
|
|
$
|
1,774.9
|
|
|
$
|
—
|
|
|
$
|
—
|
|
|
$
|
—
|
|
|
$
|
50.9
|
|
|
$
|
3,131.9
|
|
|
Net income
|
—
|
|
|
—
|
|
|
—
|
|
|
—
|
|
|
678.1
|
|
|
—
|
|
|
15.2
|
|
|
693.3
|
|
||||||||
|
Foreign currency translation adjustment
|
—
|
|
|
—
|
|
|
—
|
|
|
—
|
|
|
—
|
|
|
1.4
|
|
|
—
|
|
|
1.4
|
|
||||||||
|
Warrant conversions
|
—
|
|
|
0.1
|
|
|
(0.1
|
)
|
|
—
|
|
|
—
|
|
|
—
|
|
|
—
|
|
|
—
|
|
||||||||
|
Series A Convertible Preferred Stock conversions
|
(748.2
|
)
|
|
0.2
|
|
|
796.7
|
|
|
—
|
|
|
(48.7
|
)
|
|
—
|
|
|
—
|
|
|
—
|
|
||||||||
|
Series A Convertible Preferred Stock dividends
|
18.8
|
|
|
—
|
|
|
(3.0
|
)
|
|
—
|
|
|
(15.8
|
)
|
|
—
|
|
|
—
|
|
|
—
|
|
||||||||
|
Share-based compensation for equity-classified awards
|
—
|
|
|
—
|
|
|
21.8
|
|
|
—
|
|
|
—
|
|
|
—
|
|
|
—
|
|
|
21.8
|
|
||||||||
|
Common stock repurchases
|
—
|
|
|
—
|
|
|
—
|
|
|
(175.7
|
)
|
|
—
|
|
|
—
|
|
|
—
|
|
|
(175.7
|
)
|
||||||||
|
Repurchase of employee common stock relinquished for tax withholding
|
—
|
|
|
—
|
|
|
—
|
|
|
(0.2
|
)
|
|
—
|
|
|
—
|
|
|
—
|
|
|
(0.2
|
)
|
||||||||
|
Distributions to noncontrolling interests
|
—
|
|
|
—
|
|
|
—
|
|
|
—
|
|
|
—
|
|
|
—
|
|
|
(16.7
|
)
|
|
(16.7
|
)
|
||||||||
|
December 31, 2017 - Successor
|
$
|
576.0
|
|
|
$
|
1.0
|
|
|
$
|
2,590.3
|
|
|
$
|
(175.9
|
)
|
|
$
|
613.6
|
|
|
$
|
1.4
|
|
|
$
|
49.4
|
|
|
$
|
3,655.8
|
|
See accompanying notes to consolidated financial statements
|
Peabody Energy Corporation
|
2017 Form 10-K
|
F-
7
|
PEABODY ENERGY CORPORATION
NOTES TO CONSOLIDATED FINANCIAL STATEMENTS
|
(1)
|
Summary of Significant Accounting Policies
|
Basis of Presentation
The consolidated financial statements include the accounts of Peabody Energy Corporation (PEC) and its affiliates. The Company, or Peabody, are used interchangeably to refer to Peabody Energy Corporation, to Peabody Energy Corporation and its subsidiaries, or to such subsidiaries, as appropriate to the context. Interests in subsidiaries controlled by the Company are consolidated with any outside stockholder interests reflected as noncontrolling interests, except when the Company has an undivided interest in an unincorporated joint venture. In those cases, the Company includes its proportionate share in the assets, liabilities, revenues and expenses of the jointly controlled entities within each applicable line item of the consolidated financial statements. All intercompany transactions, profits and balances have been eliminated in consolidation.
Description of Business
The Company is engaged in the mining of thermal coal for sale primarily to electric utilities and metallurgical coal for sale to industrial customers. The Company’s mining operations are located in the United States (U.S.) and Australia, including an equity-affiliate mining operation in Australia. The Company also markets and brokers coal from other coal producers, both as principal and agent, and trades coal and freight-related contracts through trading and business offices in the U.S., Australia, China, and the United Kingdom. The Company’s other energy-related commercial activities include managing its coal reserve and real estate holdings and supporting the development of clean coal technologies.
Plan of Reorganization and Emergence from Chapter 11 Cases
On April 13, 2016, (the Petition Date), PEC and a majority of its wholly owned domestic subsidiaries, as well as one international subsidiary in Gibraltar (collectively with PEC, the Debtors), filed voluntary petitions (the Bankruptcy Petitions) under Chapter 11 of Title 11 of the U.S. Code (the Bankruptcy Code) in the United States Bankruptcy Court for the Eastern District of Missouri (the Bankruptcy Court). The Debtors’ Chapter 11 cases (the Chapter 11 Cases) were jointly administered under the caption
In re Peabody Energy Corporation, et al.
, Case No. 16-42529.
For periods subsequent to filing the Bankruptcy Petitions, the Company applied the Financial Accounting Standards Board (FASB) Accounting Standards Codification (ASC) 852, “Reorganizations”, in preparing its consolidated financial statements. ASC 852 requires that financial statements distinguish transactions and events that are directly associated with the reorganization from the ongoing operations of the business. Accordingly, certain revenues, expenses, realized gains and losses and provisions for losses that were realized or incurred in the bankruptcy proceedings were recorded in “Reorganization items, net” in the consolidated statements of operations. In addition, the pre-petition obligations that were impacted by the bankruptcy reorganization process were classified as “Liabilities subject to compromise” in the accompanying consolidated balance sheet at December 31, 2016.
On January 27, 2017, the Debtors filed with the Bankruptcy Court the Second Amended Joint Plan of Reorganization of Debtors and Debtors in Possession (as further modified, the Plan) and the Second Amended Disclosure Statement with Respect to the Second Amended Joint Plan of Reorganization of Debtors and Debtors in Possession (previous versions of the Plan and Disclosure Statement were filed with the Bankruptcy Court on December 22, 2016 and January 25, 2017). Subsequently, the Debtors solicited votes on the Plan. On March 15, 2017, the Debtors filed a revised version of the Plan and on March 16, 2017, the Bankruptcy Court held a hearing to determine whether the Plan should be confirmed. On March 17, 2017, the Bankruptcy Court entered an order, Docket No. 2763 (the Confirmation Order), confirming the Plan. On April 3, 2017, (the Effective Date), the Debtors satisfied the conditions to effectiveness set forth in the Plan, the Plan became effective in accordance with its terms and the Debtors emerged from the Chapter 11 Cases.
On the Effective Date, in accordance with ASC 852, the Company applied fresh start reporting which requires the Company to allocate its reorganization value to the fair value of assets and liabilities in conformity with the guidance for the acquisition method of accounting for business combinations. The Company was permitted to use fresh start reporting because (i) the holders of existing voting shares of the Predecessor (as defined below) company received less than 50% of the voting shares of the emerging entity upon reorganization and (ii) the reorganization value of the Company’s assets immediately prior to Plan confirmation was less than the total of all postpetition liabilities and allowed claims.
|
Peabody Energy Corporation
|
2017 Form 10-K
|
F-
8
|
PEABODY ENERGY CORPORATION
NOTES TO CONSOLIDATED FINANCIAL STATEMENTS — (Continued)
Upon adoption of fresh start reporting, the Company became a new entity for financial reporting purposes, reflecting the Successor (as defined below) capital structure. As a result, a new accounting basis in the identifiable assets and liabilities assumed was established with no retained earnings or accumulated other comprehensive income (loss) for financial reporting purposes. The Company selected an accounting convenience date of April 1, 2017 for purposes of applying fresh start reporting as the activity between the convenience date and the Effective Date does not result in a material difference in the results. References to “Successor” in the financial statements and accompanying footnotes are in reference to reporting dates on or after April 2, 2017; references to “Predecessor” in the financial statements and accompanying footnotes are in reference to reporting dates through April 1, 2017 which includes the impact of the Plan provisions and the application of fresh start reporting. As such, the Company’s financial statements for the Successor will not be comparable in many respects to its financial statements for periods prior to the adoption of fresh start reporting and prior to the accounting for the effects of the Plan. For further information on the Plan and fresh start reporting, see Note 2. “Emergence from the Chapter 11 Cases and Fresh Start Reporting.”
In connection with fresh start reporting, the Company made certain accounting policy elections that impact the Successor periods presented herein and will impact prospective periods. The Company will classify the amortization associated with its asset retirement obligation assets within “Depreciation, depletion and amortization” in its consolidated statements of operations, rather than within “Asset retirement obligation expenses”, as in Predecessor periods. With respect to its accrued postretirement benefit and pension obligations, the Company will prospectively record amounts attributable to prior service cost and actuarial valuation changes, as applicable, currently in earnings rather than recording such amounts within accumulated other comprehensive income and amortizing to expense over applicable time periods.
Accounting Standards Not Yet Implemented
Revenue Recognition.
In May 2014, the FASB issued a comprehensive revenue recognition standard that will supersede nearly all existing revenue recognition guidance under U.S. generally accepted accounting principles (GAAP). The new standard provides a single principles-based, five-step model to be applied to all contracts with customers, which steps are to (1) identify the contract(s) with the customer, (2) identify the performance obligations in the contract, (3) determine the transaction price, (4) allocate the transaction price to the performance obligations in the contract and (5) recognize revenue when each performance obligation is satisfied. More specifically, revenue will be recognized when promised goods or services are transferred to the customer in an amount that reflects the consideration expected in exchange for those goods or services. The standard also requires entities to disclose sufficient qualitative and quantitative information to enable financial statement users to understand the nature, amount, timing and uncertainty of revenues and cash flows arising from contracts with customers.
The new standard will be effective for interim and annual periods beginning after December 15, 2017 (January 1, 2018 for the Company), with early adoption permitted. The Company’s primary source of revenue is from the sale of coal through both short-term and long-term contracts with utilities, industrial customers and steel producers whereby revenue is currently recognized when risk of loss has passed to the customer. Upon adoption of this new standard, the Company believes that the timing of revenue recognition related to its coal sales will remain consistent with its current practice. The Company has reviewed its portfolio of coal sales contracts and the various terms and clauses within each contract and believes it is unlikely that its revenue recognition policies for such contracts will be materially impacted by the standard. The Company has also evaluated other revenue streams to determine the impact related to the adoption of the standard, as well as potential disclosures required by the standard. The Company will adopt the new revenue guidance effective January 1, 2018 under the modified retrospective approach, by recognizing the cumulative effect of initially applying the new standard as a decrease to the opening balance of retained earnings. This adjustment is estimated to be less than
$15 million
, with an immaterial impact to the Company’s total revenue and net income prospectively.
Lease Accounting.
In February 2016, the FASB issued accounting guidance that will require a lessee to recognize on its balance sheet a liability to make lease payments and a right-of-use asset representing its right to use the underlying asset for the lease term for leases with lease terms of more than 12 months. Consistent with current U.S. GAAP, the recognition, measurement, and presentation of expenses and cash flows arising from a lease by a lessee primarily will depend on its classification as a finance or operating lease. Additional qualitative disclosures along with specific quantitative disclosures will also be required. The new guidance will take effect for public companies for fiscal years, and interim periods within those fiscal years, beginning after December 15, 2018 (January 1, 2019 for the Company), with early adoption permitted. Upon adoption, the Company will be required to recognize and measure leases at the beginning of the earliest period presented using a modified retrospective approach. The Company is in the process of evaluating the impact that the adoption of this guidance will have on its results of operations, financial condition, cash flows and financial statement presentation.
|
Peabody Energy Corporation
|
2017 Form 10-K
|
F-
9
|
PEABODY ENERGY CORPORATION
NOTES TO CONSOLIDATED FINANCIAL STATEMENTS — (Continued)
Financial Instruments - Credit Losses.
In June 2016, the FASB issued accounting guidance related to the measurement of credit losses on financial instruments. The pronouncement replaces the incurred loss methodology to record credit losses with a methodology that reflects the expected credit losses for financial assets not accounted for at fair value with gains and losses recognized through net income. This standard is effective for fiscal years beginning after December 15, 2019 (January 1, 2020 for the Company) and interim periods therein, with early adoption permitted for fiscal years, and interim periods therein, beginning after December 15, 2018. The Company is in the process of evaluating the impact that the adoption of this guidance will have on its results of operations, financial condition, cash flows and financial statement presentation.
Classification of Certain Cash Receipts and Cash Payments.
In August 2016, the FASB issued accounting guidance to amend the classification of certain cash receipts and cash payments in the statement of cash flows to reduce diversity in practice. The new guidance will be effective for fiscal years beginning after December 15, 2017 (January 1, 2018 for the Company) and interim periods therein, with early adoption permitted. The amendments in the classification should be applied retrospectively to all periods presented, unless deemed impracticable, in which case, prospective application is permitted. The classification requirements under the new guidance are either consistent with the Company’s current practices or are not applicable to its activities, and as such, are not expected to have a material impact on classification of cash receipts and cash payments in the Company’s statements of cash flows.
Restricted Cash.
In November 2016, the FASB issued accounting guidance which will reduce diversity in the presentation of restricted cash and restricted cash equivalents in the statement of cash flows. The new guidance will be effective retrospectively for fiscal years beginning after December 15, 2017 (January 1, 2018 for the Company) and interim periods therein, with early adoption permitted. As a result of this guidance, the Company will combine restricted cash with unrestricted cash and cash equivalents when reconciling the beginning and end of period balances on its statements of cash flows.
Compensation - Retirement Benefits.
In March 2017, the FASB issued accounting guidance which requires employers that sponsor defined benefit pension and other postretirement plans to disaggregate the service cost component from other components of net periodic benefit costs and to disclose the amounts of net periodic benefit costs that are included in each income statement line item. The standard requires employers to report the service cost component in the same line item as other compensation costs and to report the other components of net periodic benefit costs (which include interest costs, expected return on plan assets, amortization of prior service cost or credits and actuarial gains and losses) separately and outside a subtotal of operating income. The new guidance will be effective retrospectively for fiscal years beginning after December 15, 2017 (January 1, 2018 for the Company) and interim periods therein, with early adoption permitted. While adoption of this guidance will impact financial statement presentation, it will not materially impact the Company’s results of operations, financial condition, or cash flows.
Derivatives and Hedging.
In August 2017, the FASB issued accounting guidance to amend the hedge accounting rules to simplify the application of hedge accounting guidance and better align the recognition and presentation of the effects of the hedging instrument and the hedged item in the financial statements. The guidance expands the ability to hedge nonfinancial and financial risk components, reduces complexity in fair value hedges of interest rate risk, eliminates the requirement to separately measure and report hedge ineffectiveness, as well as eases certain hedge effectiveness assessment requirements. The new guidance will be effective for fiscal years beginning after December 15, 2018 (January 1, 2019 for the Company) and interim periods therein, with early adoption permitted. The amendments to cash flow and net investment hedge relationships that exist on the date of adoption will be applied using a modified retrospective approach. The presentation and disclosure requirements will be applied prospectively. The Company is currently evaluating the impact that the adoption of this guidance will have on its results of operations, financial condition, cash flows and financial statement presentation.
Sales
The majority of the Company’s revenue is derived from coal sales (excluding trading and brokerage transactions). The Company’s revenue from coal sales is realized and earned when risk of loss passes to the customer. Under the typical terms of the Company’s coal supply agreements, title and risk of loss transfer to the customer at the mine or port, where coal is loaded to the transportation source(s) that serves each of the Company’s mines. The Company incurs certain “add-on” taxes and fees on coal sales. Reported coal sales include taxes and fees charged by various federal and state governmental bodies and the freight charged on destination customer contracts.
|
Peabody Energy Corporation
|
2017 Form 10-K
|
F-
10
|
PEABODY ENERGY CORPORATION
NOTES TO CONSOLIDATED FINANCIAL STATEMENTS — (Continued)
The Company’s U.S. operating platform primarily sells thermal coal to electric utilities in the U.S. under long-term contracts, with a portion sold into the seaborne markets as market conditions warrant. A significant portion of the coal production from the U.S. mining segments is sold under long-term supply agreements, and customers of those segments continue to pursue long-term sales agreements in recognition of the importance of reliability, service and predictable coal prices to their operations. The terms of coal supply agreements result from competitive bidding and extensive negotiations with customers. Consequently, the terms of those agreements may vary in many respects, including price adjustment features, price reopener terms, coal quality requirements, quantity parameters, permitted sources of supply, treatment of environmental constraints, extension options, force majeure and termination and assignment provisions.
The Company's Australian operating platform is primarily export focused with customers spread across several countries, while a portion of the metallurgical and thermal coal is sold within Australia. Generally, revenues from individual countries vary year by year based on electricity and steel demand, the strength of the global economy, governmental policies and several other factors, including those specific to each country. A majority of these sales are executed through annual and multi-year international coal supply agreements that contain provisions requiring both parties to renegotiate pricing periodically. Industry commercial practice, and the Company’s typical practice, is to negotiate pricing for those metallurgical and seaborne thermal coal contracts on a quarterly and annual basis, respectively, with a portion sold and priced on a shorter-term basis. The portion of volume priced on a shorter-term basis has increased in recent years.
Many of the Company’s coal supply agreements contain provisions that permit the parties to adjust the contract price upward or downward at specified times. These contract prices may be adjusted based on inflation or deflation and/or changes in the factors affecting the cost of producing coal, such as taxes, fees, royalties and changes in the laws regulating the mining, production, sale or use of coal. In a limited number of contracts, failure of the parties to agree on a price under those provisions may allow either party to terminate the contract. The Company sometimes experiences a reduction in coal prices in new long-term coal supply agreements replacing some of its expiring contracts. Coal supply agreements also typically contain force majeure provisions allowing temporary suspension of performance by the Company or the customer during the duration of specified events beyond the control of the affected party. Most of the coal supply agreements contain provisions requiring the Company to deliver coal meeting quality thresholds for certain characteristics such as Btu, sulfur content, ash content, grindability and ash fusion temperature. Failure to meet these specifications could result in economic penalties, including price adjustments, the rejection of deliveries or termination of the contracts. Moreover, some of these agreements allow the Company’s customers to terminate their contracts in the event of changes in regulations affecting the industry that restrict the use or type of coal permissible at the customer’s plant or increase the price of coal beyond specified limits.
Other Revenues
"Other revenues" may include net revenues from coal trading activities as discussed in Note 8. "Coal Trading," as well as coal sales revenues that were derived from the Company’s mining operations and sold through the Company’s coal trading business. Also included are revenues from customer contract-related payments, royalties related to coal lease agreements, sales agency commissions, farm income, and property and facility rentals. Royalty income generally results from the lease or sublease of mineral rights to third parties, with payments based upon a percentage of the selling price or an amount per ton of coal produced.
Discontinued Operations and Assets Held for Sale
The Company classifies items within discontinued operations in the consolidated financial statements when the operations and cash flows of a particular component of the Company have been (or will be) eliminated from the ongoing operations of the Company as a result of a disposal (by sale or otherwise) and represents a strategic shift that has (or will have) a major effect on the entity’s operations and financial results. Refer to Note 4. “Discontinued Operations” for additional details related to discontinued operations.
Cash and Cash Equivalents
Cash and cash equivalents are stated at cost, which approximates fair value. Cash equivalents consist of highly liquid investments with original maturities of
three months or less
.
Accounts Receivable
The timing of revenue recognition, billings and cash collections results in accounts receivable from customers.
Customers are invoiced as coal is shipped or at periodic intervals in accordance with contractual terms
. Payments are generally received within thirty days of invoicing.
|
Peabody Energy Corporation
|
2017 Form 10-K
|
F-
11
|
PEABODY ENERGY CORPORATION
NOTES TO CONSOLIDATED FINANCIAL STATEMENTS — (Continued)
Inventories
Coal is reported as inventory at the point in time the coal is extracted from the mine. Raw coal represents coal stockpiles that may be sold in current condition or may be further processed prior to shipment to a customer. Saleable coal represents coal stockpiles which require no further processing prior to shipment to a customer.
Coal inventory is valued at the lower of average cost or net realizable value. Coal inventory costs include labor, supplies, equipment (including depreciation thereto) and operating overhead and other related costs incurred at or on behalf of the mining location. Net realizable value considers the projected future sales price of the particular coal product, less applicable selling costs, and, in the case of raw coal, estimated remaining processing costs. The valuation of coal inventory is subject to several additional estimates, including those related to ground and aerial surveys used to measure quantities and processing recovery rates.
Materials and supplies inventory is valued at the lower of average cost or net realizable value, less a reserve for obsolete or surplus items. This reserve incorporates several factors, such as anticipated usage, inventory turnover and inventory levels.
Property, Plant, Equipment and Mine Development
Property, plant, equipment and mine development are recorded at cost. Interest costs applicable to major asset additions are capitalized during the construction period. Capitalized interest in all periods presented was immaterial. Expenditures which extend the useful lives of existing plant and equipment assets are capitalized. Maintenance and repairs are charged to operating costs as incurred. Costs incurred to develop coal mines or to expand the capacity of operating mines are capitalized. Costs incurred to maintain current production capacity at a mine are charged to operating costs as incurred. Costs to acquire computer hardware and the development and/or purchase of software for internal use are capitalized and depreciated over the estimated useful lives.
Coal reserves are recorded at cost, or at fair value in the case of nonmonetary exchanges of reserves or business acquisitions.
Depletion of coal reserves and amortization of advance royalties is computed using the units-of-production method utilizing only proven and probable reserves (as adjusted for recoverability factors) in the depletion base. Mine development costs are principally amortized over the estimated lives of the mines using the straight-line method. Depreciation of plant and equipment is computed using the straight-line method over the shorter of the asset’s estimated useful life or the life of the mine. The estimated useful lives by category of assets are as follows:
|
|
|
|
Years
|
|
Building and improvements
|
|
|
2 to 28
|
|
Machinery and equipment
|
|
|
2 to 28
|
|
Leasehold improvements
|
|
|
Shorter of Useful Life or Remaining Life of Lease
|
Equity and Cost Method Investments
The Company accounts for its investments in less than majority owned corporate joint ventures under either the equity or cost method. The Company applies the equity method to investments in joint ventures when it has the ability to exercise significant influence over the operating and financial policies of the joint venture. Investments accounted for under the equity method are initially recorded at cost and any difference between the cost of the Company’s investment and the underlying equity in the net assets of the joint venture at the investment date is amortized over the lives of the related assets that gave rise to the difference. The Company’s pro-rata share of the operating results of joint ventures and basis difference amortization is reported in the consolidated statements of operations in “(Income) loss from equity affiliates.” Similarly, the Company’s pro-rata share of the cumulative foreign currency translation adjustment of its equity method investments whose functional currency is not the U.S. dollar is reported in the consolidated balance sheet as a component of “Accumulated other comprehensive income (loss),” with periodic changes thereto reflected in the consolidated statements of comprehensive income.
|
Peabody Energy Corporation
|
2017 Form 10-K
|
F-
12
|
PEABODY ENERGY CORPORATION
NOTES TO CONSOLIDATED FINANCIAL STATEMENTS — (Continued)
The Company monitors its equity and cost method investments for indicators that a decrease in investment value has occurred that is other than temporary. Examples of such indicators include a sustained history of operating losses and adverse changes in earnings and cash flow outlook. In the absence of quoted market prices for an investment, discounted cash flow projections are used to assess fair value, the underlying assumptions to which are generally considered unobservable Level 3 inputs under the fair value hierarchy. If the fair value of an investment is determined to be below its carrying value and that loss in fair value is deemed other than temporary, an impairment loss is recognized. Refer to Note 3. “Asset Impairment” and Note 6. “Investments” for details regarding other-than-temporary impairment losses of
$276.5 million
recorded during the year ended December 31, 2015 related to certain of the Company’s equity and cost method investments.
No
such impairment losses were recorded during the Successor period
April 2 through December 31, 2017
, or the Predecessor periods
January 1 through April 1, 2017
and the year ended
December 31, 2016
.
Asset Retirement Obligations
The Company’s asset retirement obligation (ARO) liabilities primarily consist of spending estimates for surface land reclamation and support facilities at both surface and underground mines in accordance with applicable reclamation laws and regulations in the U.S. and Australia as defined by each mining permit.
The Company estimates its ARO liabilities for final reclamation and mine closure based upon detailed engineering calculations of the amount and timing of the future cash spending for a third party to perform the required work. Spending estimates are escalated for inflation and then discounted at the credit-adjusted, risk-free rate. The Company records an ARO asset associated with the discounted liability for final reclamation and mine closure. The obligation and corresponding asset are recognized in the period in which the liability is incurred. The ARO asset is amortized on the units-of-production method over its expected life and the ARO liability is accreted to the projected spending date. As changes in estimates occur (such as mine plan revisions, changes in estimated costs or changes in timing of the performance of reclamation activities), the revisions to the obligation and asset are recognized at the appropriate credit-adjusted, risk-free rate. The Company also recognizes an obligation for contemporaneous reclamation liabilities incurred as a result of surface mining. Contemporaneous reclamation consists primarily of grading, topsoil replacement and re-vegetation of backfilled pit areas.
Contingent Liabilities
From time to time, the Company is subject to legal and environmental matters related to its continuing and discontinued operations and certain historical, non-coal producing operations. In connection with such matters, the Company is required to assess the likelihood of any adverse judgments or outcomes, as well as potential ranges of probable losses.
A determination of the amount of reserves required for these matters is made after considerable analysis of each individual issue. The Company accrues for legal and environmental matters within “Operating costs and expenses” when it is probable that a liability has been incurred and the amount of the loss can be reasonably estimated. The Company provides disclosure surrounding loss contingencies when it believes that it is at least reasonably possible that a material loss may be incurred or an exposure to loss in excess of amounts already accrued may exist. Adjustments to contingent liabilities are made when additional information becomes available that affects the amount of estimated loss, which information may include changes in facts and circumstances, changes in interpretations of law in the relevant courts, the results of new or updated environmental remediation cost studies and the ongoing consideration of trends in environmental remediation costs.
Accrued contingent liabilities exclude claims against third parties and are not discounted. The current portion of these accruals is included in “Accounts payables and accrued expenses” and the long-term portion is included in “Other noncurrent liabilities” in the consolidated balance sheets. In general, legal fees related to environmental remediation and litigation are charged to expense. The Company includes the interest component of any litigation-related penalties within “Interest expense” in the consolidated statements of operations.
Income Taxes
Income taxes are accounted for using a balance sheet approach. The Company accounts for deferred income taxes by applying statutory tax rates in effect at the reporting date of the balance sheet to differences between the book and tax basis of assets and liabilities. A valuation allowance is established if it is “more likely than not” that the related tax benefits will not be realized. Significant weight is given to evidence that can be objectively verified including history of tax attribute expiration and cumulative income or loss. In determining the appropriate valuation allowance, the Company considers the projected realization of tax benefits based on expected levels of future taxable income, available tax planning strategies, reversals of existing taxable temporary differences and taxable income in carryback years.
|
Peabody Energy Corporation
|
2017 Form 10-K
|
F-
13
|
PEABODY ENERGY CORPORATION
NOTES TO CONSOLIDATED FINANCIAL STATEMENTS — (Continued)
The Company recognizes the tax benefit from uncertain tax positions only if it is “more likely than not” the tax position will be sustained on examination by the taxing authorities based on the technical merits of the position. The tax benefits recognized from such a position are measured based on the largest benefit that has a
greater than fifty percent likelihood of being realized upon ultimate settlement
. To the extent the Company’s assessment of such tax positions changes, the change in estimate will be recorded in the period in which the determination is made. Tax-related interest and penalties are classified as a component of income tax expense.
Postretirement Health Care and Life Insurance Benefits
The Company accounts for postretirement benefits other than pensions by accruing the costs of benefits to be provided over the employees’ period of active service. These costs are determined on an actuarial basis. The Company’s consolidated balance sheets reflect the accumulated postretirement benefit obligations of its postretirement benefit plans. The Company accounts for changes in its postretirement benefit obligations as a settlement when an irrevocable action has been effected that relieves the Company of its actuarially-determined liability to individual plan participants and removes substantial risk surrounding the nature, amount and timing of the obligation’s funding and the assets used to effect the settlement. See Note 16. “Postretirement Health Care and Life Insurance Benefits” for information related to postretirement benefits.
Pension Plans
The Company sponsors non-contributory defined benefit pension plans accounted for by accruing the cost to provide the benefits over the employees’ period of active service. These costs are determined on an actuarial basis. The Company’s consolidated balance sheets reflect the funded status of the defined benefit pension plans. See Note 17. “Pension and Savings Plans” for information related to pension plans.
Restructuring Activities
From time to time, the Company initiates restructuring activities in connection with its repositioning efforts to appropriately align its cost structure or optimize its coal production relative to prevailing market conditions. Costs associated with restructuring actions can include early mine closures, voluntary and involuntary workforce reductions, office closures and other related activities. Costs associated with restructuring activities are recognized in the period incurred.
Included as a component of “Restructuring charges” in the Company’s consolidated statements of operations for the Successor period
April 2 through December 31, 2017
and the Predecessor years ended
December 31, 2016
and
2015
were aggregate restructuring charges of
$7.6 million
,
$15.5 million
and
$23.5 million
, respectively, primarily associated with voluntary and involuntary workforce reductions. There were
no
restructuring charges during the Predecessor period
January 1 through April 1, 2017
. All of the cash expenditures associated with the charges recognized in 2017 will be paid in 2018.
Derivatives
The Company recognizes at fair value all contracts meeting the definition of a derivative as assets or liabilities in the consolidated balance sheets, with the exception of certain coal trading contracts for which the Company has elected to apply a normal purchases and normal sales exception.
With respect to derivatives used in hedging activities, the Company assesses, both at inception and at least quarterly thereafter, whether such derivatives are highly effective at offsetting the changes in the anticipated exposure of the hedged item. The effective portion of the change in the fair value of derivatives designated as a cash flow hedge is recorded in “Accumulated other comprehensive income (loss)” until the hedged transaction impacts reported earnings, at which time any gain or loss is reclassified to earnings. To the extent that periodic changes in the fair value of derivatives deemed highly effective exceeds such changes in the hedged item, the ineffective portion of the periodic non-cash changes are recorded in earnings in the period of the change. If the hedge ceases to qualify for hedge accounting, the Company prospectively recognizes changes in the fair value of the instrument in earnings in the period of the change. The potential for hedge ineffectiveness is present in the design of certain of the Company’s cash flow hedge relationships and is discussed in detail in Note 7. “Derivatives and Fair Value Measurements” and Note 8. “Coal Trading.” Gains or losses from derivative financial instruments designated as fair value hedges are recognized immediately in earnings, along with the offsetting gain or loss related to the underlying hedged item.
The Company’s asset and liability derivative positions are offset on a counterparty-by-counterparty basis if the contractual agreement provides for the net settlement of contracts with the counterparty in the event of default or termination of any one contract.
Non-derivative contracts and derivative contracts for which the Company has elected to apply the normal purchases and normal sales exception are accounted for on an accrual basis.
|
Peabody Energy Corporation
|
2017 Form 10-K
|
F-
14
|
PEABODY ENERGY CORPORATION
NOTES TO CONSOLIDATED FINANCIAL STATEMENTS — (Continued)
Business Combinations
The Company accounts for business combinations using the purchase method of accounting. The purchase method requires the Company to determine the fair value of all acquired assets, including identifiable intangible assets and all assumed liabilities. The total cost of acquisitions is allocated to the underlying identifiable net assets, based on their respective estimated fair values. Determining the fair value of assets acquired and liabilities assumed requires management’s judgment and the utilization of independent valuation experts, and often involves the use of significant estimates and assumptions, including assumptions with respect to future cash inflows and outflows, discount rates and asset lives, among other items.
Impairment of Long-Lived Assets
The Company evaluates its long-lived assets held and used in operations for impairment as events and changes in circumstances indicate that the carrying amount of such assets might not be recoverable. Factors that would indicate potential impairment to be present include, but are not limited to, a sustained history of operating or cash flow losses, an unfavorable change in earnings and cash flow outlook, prolonged adverse industry or economic trends and a significant adverse change in the extent or manner in which a long-lived asset is being used or in its physical condition. The Company generally does not view short-term declines in thermal and metallurgical coal prices as a triggering event for conducting impairment tests because of historic price volatility. However, the Company generally does view a sustained trend of depressed coal pricing (for example, over periods exceeding one year) as an indicator of potential impairment.
Assets are grouped at the lowest level for which there are identifiable cash flows that are largely independent of the cash flows of other groups of assets. For its active mining operations, the Company generally groups such assets at the mine level, or the mining complex level for mines that share infrastructure, with the exception of impairment evaluations triggered by mine closures. In those cases involving mine closures, the related assets are evaluated at the individual asset level for remaining economic life based on transferability to ongoing operating sites and for use in reclamation-related activities, or for expected salvage. For its development and exploration properties and portfolio of surface land and coal reserve holdings, the Company considers several factors to determine whether to evaluate those assets individually or on a grouped basis for purposes of impairment testing. Such factors include geographic proximity to one another, the expectation of shared infrastructure upon development based on future mining plans and whether it would be most advantageous to bundle such assets in the event of sale to a third party.
When indicators of impairment are present, the Company evaluates its long-lived assets for recoverability by comparing the estimated undiscounted cash flows expected to be generated by those assets under various assumptions to their carrying amounts. If such undiscounted cash flows indicate that the carrying value of the asset group is not recoverable, impairment losses are measured by comparing the estimated fair value of the asset group to its carrying amount. As quoted market prices are unavailable for the Company’s individual mining operations, fair value is determined through the use of an expected present value technique based on the income approach, except for non-strategic coal reserves, surface lands and undeveloped coal properties excluded from the Company’s long-range mine planning. In those cases, a market approach is utilized based on the most comparable market multiples available. The estimated future cash flows and underlying assumptions used to assess recoverability and, if necessary, measure the fair value of the Company’s long-lived mining assets are derived from those developed in connection with the Company’s planning and budgeting process. The Company believes its assumptions to be consistent with those a market participant would use for valuation purposes. The most critical assumptions underlying the Company’s projections and fair value estimates include those surrounding future tons sold, coal prices for unpriced coal, production costs (including costs for labor, commodity supplies and contractors), transportation costs, foreign currency exchange rates and a risk-adjusted, after-tax cost of capital (all of which generally constitute unobservable Level 3 inputs under the fair value hierarchy), in addition to market multiples for non-strategic coal reserves, surface lands and undeveloped coal properties excluded from the Company’s long-range mine planning (which generally constitute Level 2 inputs under the fair value hierarchy).
Refer to Note 3. “Asset Impairment” for details regarding impairment charges related to long-lived assets of
$30.5 million
,
$247.9 million
, and
$1,001.3 million
recognized during the Predecessor period
January 1 through April 1, 2017
and the years ended December 31,
2016
and
2015
, respectively. There were
no
impairment charges related to long-lived assets during the Successor period
April 2 through December 31, 2017
.
Fair Value
For assets and liabilities that are recognized or disclosed at fair value in the consolidated financial statements, the Company defines fair value as the price that would be received to sell an asset or paid to transfer a liability in an orderly transaction between market participants at the measurement date.
|
Peabody Energy Corporation
|
2017 Form 10-K
|
F-
15
|
PEABODY ENERGY CORPORATION
NOTES TO CONSOLIDATED FINANCIAL STATEMENTS — (Continued)
Foreign Currency
Functional currency is determined by the primary economic environment in which an entity operates, which for the Company’s foreign operations is generally the U.S. dollar because sales prices in international coal markets and the Company’s sources of financing those operations are denominated in that currency. Accordingly, substantially all of the Company’s consolidated foreign subsidiaries utilize the U.S. dollar as their functional currency. Monetary assets and liabilities are remeasured at year-end exchange rates while non-monetary items are remeasured at historical rates. Income and expense accounts are remeasured at the average rates in effect during the year, except for those expenses related to balance sheet amounts that are remeasured at historical exchange rates. Gains and losses from foreign currency remeasurement related to tax balances are included as a component of “Income tax benefit,” while all other remeasurement gains and losses are included in “Operating costs and expenses.” The total impact of foreign currency remeasurement on the consolidated statements of operations was a net gain of
$0.7 million
and
$10.6 million
for the Successor period
April 2 through December 31, 2017
and the Predecessor period
January 1 through April 1, 2017
, respectively, and a net loss of
$7.4 million
and
$6.4 million
for the years ended December 31,
2016
and
2015
, respectively.
The Company owns a
50%
equity interest Middlemount Coal Pty Ltd. (Middlemount), which owns the Middlemount Mine in Queensland, Australia. Middlemount utilizes the Australian dollar as its functional currency. Accordingly, the assets and liabilities of that equity investee are translated to U.S. dollars at the year-end exchange rate and income and expense accounts are translated at the average rate in effect during the year. The Company’s pro-rata share of the translation gains and losses of the equity investee are recorded as a component of “Accumulated other comprehensive income (loss).” Australian dollar denominated stockholder loans to the Middlemount Mine, which are long term in nature, are considered part of the Company’s net investment in that operation. Accordingly, foreign currency gains or losses on those loans are recorded as a component of foreign currency translation adjustment. The Company recorded foreign currency translation gains of
$1.4 million
and
$5.5 million
for the Successor period
April 2 through December 31, 2017
and the Predecessor period
January 1 through April 1, 2017
, respectively, and losses of
$1.8 million
and
$34.9 million
for the years ended December 31,
2016
and
2015
, respectively.
Share-Based Compensation
The Company accounts for share-based compensation at the grant date fair value of awards and recognizes the related expense over the service period of the awards. See Note 19. “Share-Based Compensation” for information related to share-based compensation.
Exploration and Drilling Costs
Exploration expenditures are charged to operating costs as incurred, including costs related to drilling and study costs incurred to convert or upgrade mineral resources to reserves.
Advance Stripping Costs
Pre-production.
At existing surface operations, additional pits may be added to increase production capacity in order to meet customer requirements. These expansions may require significant capital to purchase additional equipment, expand the workforce, build or improve existing haul roads and create the initial pre-production box cut to remove overburden (that is, advance stripping costs) for new pits at existing operations. If these pits operate in a separate and distinct area of the mine, the costs associated with initially uncovering coal (that is, advance stripping costs incurred for the initial box cuts) for production are capitalized and amortized over the life of the developed pit consistent with coal industry practices.
Post-production.
Advance stripping costs related to post-production are expensed as incurred. Where new pits are routinely developed as part of a contiguous mining sequence, the Company expenses such costs as incurred. The development of a contiguous pit typically reflects the planned progression of an existing pit, thus maintaining production levels from the same mining area utilizing the same employee group and equipment.
Use of Estimates in the Preparation of the Consolidated Financial Statements
These consolidated financial statements have been prepared in conformity with U.S. GAAP. In doing so, estimates and assumptions are made that affect the amounts reported in the consolidated financial statements and accompanying notes. These estimates are based on historical experience and on various other assumptions deemed reasonable under the circumstances, the results of which form the basis for making judgments about the carrying amounts of assets and liabilities that are not readily apparent from other sources. The Company’s actual results may differ materially from these estimates. Significant estimates inherent in the preparation of these consolidated financial statements include, but are not limited to, accounting for sales and cost recognition, postretirement benefit plans, environmental receivables and liabilities, asset retirement obligations, evaluation of long-lived assets for impairment, income taxes including deferred tax assets, fair value measurements and contingencies.
|
Peabody Energy Corporation
|
2017 Form 10-K
|
F-
16
|
PEABODY ENERGY CORPORATION
NOTES TO CONSOLIDATED FINANCIAL STATEMENTS — (Continued)
|
(2)
|
Emergence from the Chapter 11 Cases and Fresh Start Reporting
|
The following is a summary of certain provisions of the Plan, as confirmed by the Bankruptcy Court pursuant to the Confirmation Order, and is not intended to be a complete description of the Plan, which is included in its entirety as Exhibit 2.2 of the Company’s Current Report on Form 8-K filed with the Securities and Exchange Commission (SEC) on March 20, 2017.
The consummation of the Plan resulted in the following capital structure on the Effective Date:
•
Successor Notes -
$1,000.0 million
first lien senior secured notes
•
Successor Credit Facility - a first lien credit facility of
$950.0 million
|
•
|
Series A Convertible Preferred Stock -
$750.0 million
for
30.0 million
shares of Series A Convertible Preferred Stock
|
|
•
|
Common Stock and Warrants -
$750.0 million
for common stock and warrants issued in connection with a Rights Offering (as defined below), resulting in, together with other issuances of common stock, the issuance of
70.9 million
shares of a single class of common stock and warrants to purchase
6.2 million
shares of common stock
|
The new debt and equity instruments comprising the Successor Company’s capital structure are further described below.
|
Peabody Energy Corporation
|
2017 Form 10-K
|
F-
17
|
PEABODY ENERGY CORPORATION
NOTES TO CONSOLIDATED FINANCIAL STATEMENTS — (Continued)
Treatment of Classified Claims and Interests
The following summarizes the various classes of claimants’ recoveries under the Plan. Undefined capitalized terms used in this section,
Treatment of Classified Claims and Interests
, are defined in the Plan.
|
First Lien Lender Claims (Classes 1A - 1D)
|
Paid in full in cash.
|
|
|
Second Lien Notes Claims (Classes 2A - 2D)
|
A combination of (1) $450 million of cash, first lien debt and/or new second lien notes and (2)(a) new common stock, par value $0.01 per share, of the Reorganized Peabody (Common Stock) and (b) subscription rights in the Rights Offering.
|
|
|
Other Secured Claims (Classes 3A - 3E)
|
At the election of the Debtors, (1) reinstatement, (2) payment in full in cash, (3) receipt of the applicable collateral or (4) such other treatment consistent with section 1129(b) of the Bankruptcy Code.
|
|
|
Other Priority Claims (Classes 4A - 4E)
|
Paid in full in cash.
|
|
|
General Unsecured Claims
|
Class 5A: Against Peabody Energy: a pro rata share of $5 million in cash plus an amount of additional cash (up to $2 million) not otherwise paid to holders of Convenience Claims.
|
|
|
Class 5B: Against the Encumbered Guarantor Debtors: (1) Common Stock and subscription rights in the Rights Offering or (2) at the election of the claim holder, cash from a pool of $75 million in cash to be paid by the Debtors and the Reorganized Debtors into a segregated account in accordance with the terms set forth in the Plan.
|
||
|
Class 5C: Against the Gold Fields Debtors: units in the Gold Fields Liquidating Trust.
|
||
|
Class 5D: Against Peabody Holdings (Gibraltar) Limited: no recoveries.
|
||
|
Class 5E: Against the Unencumbered Debtors: cash in the amount of such holder’s allowed claim, less any amounts attributable to late fees, postpetition interest or penalties.
|
||
|
Convenience Claims
|
Class 6A: Against Peabody Energy: up to 72.5% of such claim in cash, provided that total payments to Convenience Claims may not exceed $2 million.
|
|
|
Class 6B: Against the Encumbered Guarantor Debtors: up to 72.5% of such claim in cash, provided that total payments to Convenience Claims may not exceed $18 million.
|
||
|
United Mine Workers of America 1974 Pension Plan Claim
(Classes 7A - 7E)
|
$75 million in cash paid over five years. See Note 4. “Discontinued Operations,” for additional details.
|
|
|
Unsecured Subordinated Debentures Claims
(Class 8A)
|
(1) Payment of the reasonable and documented fees and expenses of the trustee under the 2066 subordinated indenture up to $350,000; and (2) because this class voted in favor of the Plan and in connection with the settlement of certain potential intercreditor disputes as part of the global settlement embodied therein, and because the trustee under the 2066 subordinated indenture did not object to, and affirmatively supported, the Plan, holders of allowed Unsecured Subordinated Debenture Claims received from specified noteholder co-proponents their pro rata share of penny warrants exercisable for 1.0% of the fully diluted Reorganized Peabody common stock from the pool of penny warrants issued to the noteholder co-proponents under the Rights Offering and/or the terms of the Backstop Commitment Agreement (as defined below).
|
|
|
Section 510(b) Claims
(Class 10A)
|
No recovery.
|
|
|
Peabody Energy Equity Interests
(Class 11A)
|
No recovery, as further described under
Cancellation of Prior Common Stock
below.
|
|
|
Peabody Energy Corporation
|
2017 Form 10-K
|
F-
18
|
PEABODY ENERGY CORPORATION
NOTES TO CONSOLIDATED FINANCIAL STATEMENTS — (Continued)
Cancellation of Prior Common Stock
In accordance with the Plan and as previously disclosed, each share of the Company’s common stock outstanding prior to the Effective Date, including all options and warrants to purchase such stock, were extinguished, canceled and discharged, and each such share, option or warrant has no further force or effect as of the Effective Date. Furthermore, all of the Company’s equity award agreements under prior incentive plans, and the awards granted pursuant thereto, were extinguished, canceled and discharged and have no further force or effect as of the Effective Date.
Issuance of Equity Securities
Section 1145 Securities
On the Effective Date and simultaneous with the cancellation of the prior common stock discussed above, in connection with the Company’s emergence from the Chapter 11 Cases and in reliance on the exemption from registration requirements of the Securities Act of 1933 (the Securities Act) provided by Section 1145 of the Bankruptcy Code, the Company issued:
|
•
|
11.6 million
shares of Common Stock to holders of Allowed Claims (as defined in the Plan) in Classes 2A, 2B, 2C, 2D and 5B on account of such claims as provided in the Plan; and
|
|
•
|
51.2 million
shares of Common Stock and
2.9 million
Warrants (the 1145 Warrants) pursuant to the completed Rights Offering to certain holders of the Company’s prepetition indebtedness for total consideration of
$704.4 million
.
|
Any shares of Common Stock issued pursuant to the exercise of such 1145 Warrants were similarly issued pursuant to the exemption from registration provided by Section 1145 of the Bankruptcy Code.
Section 4(a)(2) Securities
In addition, on the Effective Date, in connection with the Company’s emergence from the Chapter 11 Cases and in reliance on the exemption from registration requirements of the Securities Act provided by Section 4(a)(2) of the Securities Act, the Company issued:
|
•
|
30.0 million
shares of Series A Convertible Preferred Stock (the Preferred Stock) to parties to the Private Placement Agreement, dated as of December 22, 2016 (as amended, the Private Placement Agreement), among the Company and the other parties thereto, for total consideration of
$750.0 million
;
|
|
•
|
3.3 million
shares of Common Stock and
0.2 million
Warrants (the Private Warrants, and together with the 1145 Warrants, the Warrants) to parties to the Backstop Commitment Agreement, dated as of December 22, 2016 (as amended, the Backstop Commitment Agreement), among the Company and the other parties thereto, on account of their commitments under that agreement, for total consideration of
$45.6 million
; and
|
|
•
|
4.8 million
shares of Common Stock and
3.1 million
additional Private Warrants to specified parties to the Private Placement Agreement and Backstop Commitment Agreement on account of commitment premiums contemplated by those agreements.
|
Any shares of Common Stock issued pursuant to the conversion of the Preferred Stock or the exercise of such Private Warrants have been or will be issued pursuant to the exemption from registration provided by Section 3(a)(9) and/or Section 4(a)(2) of the Securities Act. The securities issued in reliance on Section 4(a)(2) of the Securities Act were subject to restrictions on transfer; however, substantially all such shares were registered with the SEC on a resale Form S-1 effective July 14, 2017.
Current Equity Structure
During the period
April 2 through December 31, 2017
, the Company made repurchases of approximately
5.8 million
shares of its Common Stock pursuant to its share repurchase program, as described in Note 18. “Stockholders’ Equity”. As of December 31, 2017, the Company would have had approximately
130.7 million
shares of Common Stock outstanding, assuming full conversion of the Preferred Stock (including make-whole shares issuable upon conversion of the Preferred Stock). This amount excludes approximately
3.5 million
shares of Common Stock which underlie unvested equity awards granted under the 2017 Incentive Plan (as defined below).
|
Peabody Energy Corporation
|
2017 Form 10-K
|
F-
19
|
PEABODY ENERGY CORPORATION
NOTES TO CONSOLIDATED FINANCIAL STATEMENTS — (Continued)
Other Forms of Equity Authorized under the Company’s Certificate of Incorporation
As noted on the accompanying consolidated balance sheets, the Company’s Fourth Amended and Restated Certificate of Incorporation authorizes the issuances of additional series of preferred stock, as well as series common stock. Other than the Series A Convertible Preferred Stock, no other series of preferred stock is outstanding as of December 31, 2017. Additionally, as of December 31, 2017, no series common stock is outstanding. A copy of the Company’s Fourth Amended and Restated Certificate of Incorporation is included as Exhibit 3.1 to the Company’s Current Report on Form 8-K filed by the Company with the SEC on April 3, 2017.
Preferred Stock
Prior to the Mandatory Conversion (as defined below), the Preferred Stock accrued dividends at a rate of
8.5%
per year, payable in-kind semi-annually on April 30 and October 31 of each year as additional shares of Series A Convertible Preferred Stock, and could be converted into a number of shares of Common Stock as described below.
The Preferred Stock was convertible into Common Stock at any time, at the option of the holders at an initial conversion price of
$16.25
, representing a discount of
35%
to the equity value assigned to the Common Stock by the Plan (subject to customary anti-dilution adjustments, the Conversion Price). Beginning on the Effective Date, each outstanding share of Preferred Stock would automatically convert into a number of shares of Common Stock at the Conversion Price (such conversion, the Mandatory Conversion) if the volume weighted average price of the Common Stock exceeded
$32.50
(the Conversion Threshold) for at least
45
trading days in a
60
consecutive trading day period, including each of the last
20
days in such
60
consecutive trading day period (such period, the Mandatory Conversion Period). On
January 31, 2018
, the requirements for a Mandatory Conversion were met and the then outstanding
13.2 million
shares of Preferred Stock were automatically converted into
24.8 million
shares of Common Stock. As a result of the Mandatory Conversion, the Company expects to record a non-cash preferred dividend charge of approximately
$103 million
in the the first quarter of 2018.
Upon the Mandatory Conversion of the Preferred Stock, holders of the Preferred Stock were deemed to have (1) received dividends through the last payment of dividends prior to the conversion, including dividends received on prior dividends, to the extent accrued and not previously paid; and (2) dividends on the shares of Preferred Stock then outstanding and any shares deemed issued pursuant to the preceding clause accruing from the last dividend date preceding the date of the conversion through, but not including, the
three
year anniversary of their initial issuance, and all dividends on prior dividends.
Rights Offering
Pursuant to the Plan and Rights Offering, holders of Allowed Claims in Classes 2A, 2B, 2C, 2D and 5B were offered the opportunity to purchase up to
54.5 million
units, each unit being comprised of (1)
one
share of Common Stock and (2) a fraction of a Warrant. The purchase price for the units offered in the Rights Offering was
$13.75
per unit. A total of
51.2 million
units were purchased in the Rights Offering. Pursuant to the Backstop Commitment Agreement, the remaining
3.3 million
units that were not purchased in the Rights Offering were purchased by the parties to the Backstop Commitment Agreement at the same per-unit price.
Registration Rights Agreement
On the Effective Date, the Company entered into a registration rights agreement (Registration Rights Agreement) with certain parties (together with any person or entity that becomes a party to the Registration Rights Agreement, the Holders) that received shares of the Company’s Common Stock and Preferred Stock in the Company on the Effective Date, as provided in the Plan. The Registration Rights Agreement provides Holders with registration rights for the Holders’ Registrable Securities (as defined in the Registration Rights Agreement). Substantially all of the Holders’ Registrable Securities were registered with the SEC on Form S-1 effective July 14, 2017.
The registration rights are subject to certain conditions and limitations, including the right of the underwriters to limit the number of shares to be included in an underwritten offering and the Company’s right to delay or withdraw a registration statement under certain circumstances. A copy of the Registration Rights Agreement is included as Exhibit 10.1 to the Current Report on Form 8-K filed by the Company with the SEC on April 3, 2017.
|
Peabody Energy Corporation
|
2017 Form 10-K
|
F-
20
|
PEABODY ENERGY CORPORATION
NOTES TO CONSOLIDATED FINANCIAL STATEMENTS — (Continued)
Warrant Agreement
On the Effective Date, the Company entered into a warrant agreement (the Warrant Agreement) with American Stock Transfer and Trust Company, LLC. In accordance with the Plan, the Company issued
6.2 million
warrants to purchase
one
share of Common Stock each at an exercise price of
$0.01
per share to all Noteholder Co-Proponents (as defined in the Plan) and subscribers in the Rights Offering (as defined in the Plan) and related backstop commitment. All Warrants described above under the heading
Issuance of Equity Securities
were issued under the Warrant Agreement. All unexercised Warrants expired, and the rights of the holders of such Warrants to purchase Common Stock terminated on July 3, 2017, with less than
0.1%
of the Warrants unexercised.
A copy of the Warrant Agreement is included as Exhibit 4.1 to the Current Report on Form 8-K filed by the Company with the SEC on April 3, 2017.
6.000% and 6.375% Senior Secured Notes (collectively, the Successor Notes)
On February 15, 2017, one of PEC’s subsidiaries entered into an indenture with Wilmington Trust, National Association, as trustee, relating to the issuance by PEC’s subsidiary of
$500.0 million
aggregate principal amount of
6.000%
senior secured notes due 2022 (the 2022 Notes) and
$500.0 million
aggregate principal amount of
6.375%
senior secured notes due 2025 (together with the 2022 Notes, the Successor Notes). The Successor Notes were sold on February 15, 2017 in a private transaction exempt from the registration requirements of the Securities Act.
Prior to the Effective Date, PEC’s subsidiary deposited the proceeds of the offering of the Successor Notes into an escrow account pending confirmation of the Plan and certain other conditions being satisfied. On the Effective Date, the proceeds from the Successor Notes were used to repay the predecessor first lien obligations.
The Successor Notes are further described in Note 13. “Current and Long-term Debt” and copies of the indenture documents underlying the Successor Notes are incorporated as Exhibit 4.3 to the Current Report on Form 8-K filed by the Company with the SEC on April 3, 2017.
Successor Credit Agreement
In connection with an exit facility commitment letter, on the Effective Date, the Company entered into a credit agreement, dated as of April 3, 2017, among the Company, as Borrower, Goldman Sachs Bank USA, as Administrative Agent, and other lenders party thereto (the Successor Credit Agreement). The Successor Credit Agreement originally provided for a
$950.0 million
senior secured term loan, which matures in 2022 and prior to the amendment described in Note 13. “Current and Long-term Debt,” bore interest at LIBOR plus
4.50%
per annum with a
1.00%
LIBOR floor. Following the amendment the loan bears interest at LIBOR plus
3.50%
per annum with a
1.00%
LIBOR floor. On the Effective Date, the proceeds from the Successor Credit Agreement were used to repay the predecessor first lien obligations.
The Successor Credit Agreement and the amendment are further described in Note 13. “Current and Long-term Debt.” A copy of the Successor Credit Agreement is included as Exhibit 10.3 to the Current Report on Form 8-K filed by the Company with the SEC on April 3, 2017 and a copy of the amendment is included as Exhibit 10.1 to the Current Report on Form 8-K filed by the Company on September 18, 2017.
Securitization Facility
In connection with a receivables securitization program commitment letter, on the Effective Date, the Company entered into the Sixth Amended and Restated Receivables Purchase Agreement, as amended, dated as of April 3, 2017 (Receivables Purchase Agreement), among P&L Receivables Company, LLC (P&L Receivables), as the Seller, the Company, as the Servicer, the sub-servicers party thereto, the various purchasers and purchaser agents party thereto and PNC Bank, National Association (PNC), as administrator. The Receivables Purchase Agreement extends the receivables securitization facility previously in place and expands that facility to include certain receivables from the Company’s Australian operations.
The Receivables Purchase Agreement is further described in Note 24. “Financial Instruments, Guarantees With Off-Balance-Sheet Risk and Other Guarantees” and a copy of the Receivables Purchase Agreement is included as Exhibit 10.4 to the Current Report on Form 8-K filed by the Company with the SEC on April 3, 2017.
|
Peabody Energy Corporation
|
2017 Form 10-K
|
F-
21
|
PEABODY ENERGY CORPORATION
NOTES TO CONSOLIDATED FINANCIAL STATEMENTS — (Continued)
Cancellation of Prepetition Obligations
In accordance with the Plan, on the Effective Date all of the obligations of the Debtors with respect to the following debt instruments were canceled:
|
•
|
Indenture governing
$1,000.0 million
outstanding aggregate principal amount of the Company’s
10.00%
Senior Secured Second Lien Notes due 2022, dated as of March 16, 2015, among the Company, U.S. Bank National Association (U.S. Bank), as trustee and collateral agent, and the guarantors named therein, as supplemented;
|
|
•
|
Indenture governing
$650.0 million
outstanding aggregate principal amount of the Company’s
6.50%
Senior Notes due 2020, dated as of March 19, 2004, among the Company, U.S. Bank, as trustee, and the guarantors named therein, as supplemented;
|
|
•
|
Indenture governing
$1,518.8 million
outstanding aggregate principal amount of the Company’s
6.00%
Senior Notes due 2018, dated as of November 15, 2011, among the Company, U.S. Bank, as trustee, and the guarantors named therein, as supplemented;
|
|
•
|
Indenture governing
$1,339.6 million
outstanding aggregate principal amount of the Company’s
6.25%
Senior Notes due 2021, dated as of November 15, 2011, by and among the Company, U.S. Bank, as trustee, and the guarantors named therein, as supplemented;
|
|
•
|
Indenture governing
$250.0 million
outstanding aggregate principal amount of the Company’s
7.875%
Senior Notes due 2026, dated as of March 19, 2004, among the Company, U.S. Bank, as trustee, and the guarantors named therein, as supplemented;
|
|
•
|
Subordinated Indenture governing
$732.5 million
outstanding aggregate principal amount of the Company’s Convertible Junior Subordinated Debentures due 2066, dated as of December 20, 2006, among the Company and U.S. Bank, as trustee, as supplemented; and
|
|
•
|
Amended and Restated Credit Agreement, as amended and restated as of September 24, 2013 (the 2013 Credit Facility), related to
$1,170.0 million
outstanding aggregate principal amount of term loans under a term loan facility (the 2013 Term Loan Facility) and
$1,650.0 million
under a revolving credit facility (the 2013 Revolver), which includes approximately
$675.0 million
of posted but undrawn letters of credit and approximately
$947.0 million
in outstanding borrowings, by and among the Company, Citibank, N.A., as administrative agent, swing line lender and letter of credit issuer, Citigroup Global Markets, Inc., Merrill Lynch, Pierce, Fenner & Smith Incorporated, BNP Paribas Securities Corp., Crédit Agricole Corporate and Investment Bank, HSBC Securities (USA) Inc., Morgan Stanley Senior Funding, Inc., PNC Capital Markets LLC and RBS Securities Inc., as joint lead arrangers and joint book managers, and the lender parties thereto, as amended by that certain Omnibus Amendment Agreement, dated as of February 5, 2015.
|
2017 Incentive Compensation Plan
In accordance with the Plan, the Peabody Energy Corporation 2017 Incentive Plan (the 2017 Incentive Plan) became effective as of the Effective Date. The 2017 Incentive Plan is intended to, among other things, help attract and retain employees and directors upon whom, in large measure, the Company depends for sustained progress, growth and profitability. The 2017 Incentive Plan also permits awards to consultants.
Unless otherwise determined by the Company’s Board of Directors (the Board), the compensation committee of the Board will administer the 2017 Incentive Plan. The 2017 Incentive Plan generally provides for the following types of awards:
|
•
|
options (including non-qualified stock options and incentive stock options);
|
|
•
|
stock appreciation rights;
|
|
•
|
restricted stock;
|
|
•
|
restricted stock units;
|
|
•
|
deferred stock;
|
|
•
|
performance units;
|
|
•
|
dividend equivalents; and
|
|
•
|
cash incentive awards.
|
|
Peabody Energy Corporation
|
2017 Form 10-K
|
F-
22
|
PEABODY ENERGY CORPORATION
NOTES TO CONSOLIDATED FINANCIAL STATEMENTS — (Continued)
The aggregate number of shares of Common Stock reserved for issuance pursuant to the 2017 Incentive Plan is approximately
14.0 million
. The 2017 Incentive Plan will remain in effect, subject to the right of the Board to terminate the 2017 Incentive Plan at any time, subject to certain restrictions, until the earlier to occur of (a) the date all shares of Common Stock subject to the 2017 Incentive Plan are purchased or acquired and the restrictions on all restricted stock granted under the 2017 Incentive Plan have lapsed, according to the 2017 Incentive Plan’s provisions, and (b)
ten
years from the Effective Date.
Reorganization Value
Fresh start reporting provides, among other things, for a determination of the value to be assigned to the equity of the emerging company as of a date selected for financial reporting purposes. In conjunction with the bankruptcy proceedings, a third-party financial advisor provided an enterprise value of the Company of approximately
$4.2 billion
to
$4.9 billion
. The final equity value of
$3,081.0 million
was based upon the approximate low end of the enterprise value established by the third-party valuation and cash held by the Successor company in connection with the emergence from the Chapter 11 Cases, less the fair value of Successor debt issued on the Effective Date as described above. The final equity value equated to a per share value of
$22.03
per equivalent common share issued in accordance with the Plan.
The enterprise value of the Company was estimated using two primary valuation methods: a comparable public company analysis and a discounted cash flow (DCF) analysis. The comparable public company analysis is based on the enterprise value of selected publicly traded companies that have operating and financial characteristics comparable in certain respects to the Company, for example, operational requirements and risk and profitability characteristics. Selected companies were comprised of coal mining companies with primary operations in the United States. Under this methodology, certain financial multiples and ratios that measure financial performance and value were calculated for each selected company and then applied to the Company’s financials to imply an enterprise value for the Company.
The DCF analysis is a forward-looking enterprise valuation methodology that estimates the value of an asset or business by calculating the present value of expected future cash flows by that asset or business. The basis of the DCF analysis was the Company’s prepared projections which included a variety of estimates and assumptions, such as pricing and demand for coal. The Company’s pricing was based on its view of the market taking into account third-party forward pricing curves adjusted for the quality of products sold by the Company. While the Company considers such estimates and assumptions reasonable, they are inherently subject to significant business, economic and competitive uncertainties, many of which are beyond the Company’s control and, therefore, may not be realized. Changes in these estimates and assumptions may have a significant effect on the determination of the Company’s enterprise value. The assumptions used in the calculations for the DCF analysis included projected revenue, cost and cash flows for the nine months ending December 31, 2017 through each respective mine life and represented the Company’s best estimates at the time the analysis was prepared. The DCF analysis was completed using discount rates ranging from
11%
to
14.5%
. The DCF analysis involves complex considerations and judgments concerning appropriate discount rates. Due to the unobservable inputs to the valuation, the fair value would be considered Level 3 in the fair value hierarchy.
Grant of Emergence Awards
On the Effective Date, the Company granted restricted stock units under the 2017 Incentive Plan and the terms of the relevant restricted stock unit agreement to all employees, including its executive officers (the Emergence Awards). The fair value of the Emergence Awards on the Effective Date was approximately
$80 million
. The Emergence Awards granted to the Company’s executive officers generally will vest ratably on each of the first three anniversaries of the Effective Date, subject to, among other things, each such executive officer’s continued employment with the Company. The Emergence Awards will become fully vested upon each such executive officer’s termination of employment by the Company and its subsidiaries without Cause or by the executive for Good Reason (each, as defined in the 2017 Incentive Plan or award agreement) or due to a termination of employment with the Company and its subsidiaries by reason of death or Disability (as defined in the 2017 Incentive Plan or award agreement). In order to receive the Emergence Awards, the executive officers were required to execute restrictive covenant agreements protecting the Company’s interests.
Copies of the 2017 Incentive Plan and related documents are included as Exhibits 10.7 and 10.8 to the Current Report on Form 8-K filed by the Company with the SEC on April 3, 2017.
|
Peabody Energy Corporation
|
2017 Form 10-K
|
F-
23
|
PEABODY ENERGY CORPORATION
NOTES TO CONSOLIDATED FINANCIAL STATEMENTS — (Continued)
Effect of Plan and Fresh Start Reporting Adjustments
The following balance sheet illustrates the impacts of the implementation of the Plan and the application of fresh start reporting, which results in the opening balance sheet of the Successor company.
|
As of April 1, 2017
|
Predecessor (a)
|
Effect of Plan
(b)
|
Fresh Start Adjustments (c)
|
Successor
|
|||||||||||
|
(Dollars in millions)
|
|||||||||||||||
|
ASSETS
|
|
|
|||||||||||||
|
Current assets
|
|
|
|||||||||||||
|
Cash and cash equivalents
|
$
|
1,068.1
|
|
$
|
(14.4
|
)
|
(d)
|
$
|
—
|
|
$
|
1,053.7
|
|
||
|
Restricted cash
|
80.7
|
|
(54.7
|
)
|
(d)
|
—
|
|
26.0
|
|
||||||
|
Successor Notes issuance proceeds - restricted cash
|
1,000.0
|
|
(1,000.0
|
)
|
(d)
|
—
|
|
—
|
|
||||||
|
Accounts receivable, net
|
312.1
|
|
—
|
|
—
|
|
312.1
|
|
|||||||
|
Inventories
|
250.8
|
|
—
|
|
70.1
|
|
(k)
|
320.9
|
|
||||||
|
Assets from coal trading activities, net
|
0.6
|
|
—
|
|
—
|
|
0.6
|
|
|||||||
|
Other current assets
|
493.9
|
|
(18.1
|
)
|
(e)
|
(333.0
|
)
|
(l)
|
142.8
|
|
|||||
|
Total current assets
|
3,206.2
|
|
(1,087.2
|
)
|
(262.9
|
)
|
1,856.1
|
|
|||||||
|
Property, plant, equipment and mine development, net
|
8,653.9
|
|
—
|
|
(3,461.4
|
)
|
(m)
|
5,192.5
|
|
||||||
|
Investments and other assets
|
976.4
|
|
3.9
|
|
(f)
|
238.0
|
|
(n)
|
1,218.3
|
|
|||||
|
Total assets
|
$
|
12,836.5
|
|
$
|
(1,083.3
|
)
|
$
|
(3,486.3
|
)
|
$
|
8,266.9
|
|
|||
|
LIABILITIES AND STOCKHOLDERS’ EQUITY
|
|
|
|||||||||||||
|
Current liabilities
|
|
|
|||||||||||||
|
Current portion of long-term debt
|
$
|
18.2
|
|
$
|
9.5
|
|
(g)
|
$
|
—
|
|
$
|
27.7
|
|
||
|
Liabilities from coal trading activities, net
|
0.7
|
|
—
|
|
—
|
|
0.7
|
|
|||||||
|
Accounts payable and accrued expenses
|
967.3
|
|
257.6
|
|
(h)
|
14.8
|
|
(o)
|
1,239.7
|
|
|||||
|
Total current liabilities
|
986.2
|
|
267.1
|
|
14.8
|
|
1,268.1
|
|
|||||||
|
Long-term debt, less current portion
|
950.5
|
|
903.2
|
|
(g)
|
—
|
|
1,853.7
|
|
||||||
|
Deferred income taxes
|
179.2
|
|
—
|
|
(177.8
|
)
|
(p)
|
1.4
|
|
||||||
|
Asset retirement obligations
|
707.0
|
|
—
|
|
(73.9
|
)
|
(q)
|
633.1
|
|
||||||
|
Accrued postretirement benefit costs
|
753.9
|
|
—
|
|
(6.9
|
)
|
(r)
|
747.0
|
|
||||||
|
Other noncurrent liabilities
|
511.1
|
|
—
|
|
120.6
|
|
(s)
|
631.7
|
|
||||||
|
Total liabilities not subject to compromise
|
4,087.9
|
|
1,170.3
|
|
(123.2
|
)
|
5,135.0
|
|
|||||||
|
Liabilities subject to compromise
|
8,416.7
|
|
(8,416.7
|
)
|
(i)
|
—
|
|
—
|
|
||||||
|
Total liabilities
|
12,504.6
|
|
(7,246.4
|
)
|
(123.2
|
)
|
5,135.0
|
|
|||||||
|
Stockholders’ equity
|
|||||||||||||||
|
Common Stock (Predecessor)
|
0.2
|
|
(0.2
|
)
|
(j)
|
—
|
|
—
|
|
||||||
|
Common Stock (Successor)
|
—
|
|
0.7
|
|
(b)
|
—
|
|
0.7
|
|
||||||
|
Series A Preferred Stock (Successor)
|
—
|
|
1,305.4
|
|
(b)
|
—
|
|
1,305.4
|
|
||||||
|
Additional paid-in capital (Predecessor)
|
2,423.9
|
|
(2,423.9
|
)
|
(j)
|
—
|
|
—
|
|
||||||
|
Additional paid-in capital (Successor)
|
—
|
|
1,774.9
|
|
(b)
|
—
|
|
1,774.9
|
|
||||||
|
Treasury stock, at cost
|
(371.9
|
)
|
371.9
|
|
(j)
|
—
|
|
—
|
|
||||||
|
Accumulated deficit
|
(1,284.1
|
)
|
5,134.3
|
|
(j)
|
(3,850.2
|
)
|
(t)
|
—
|
|
|||||
|
Accumulated other comprehensive loss
|
(448.5
|
)
|
—
|
|
448.5
|
|
(t)
|
—
|
|
||||||
|
Peabody Energy Corporation stockholders’ equity
|
319.6
|
|
6,163.1
|
|
(3,401.7
|
)
|
3,081.0
|
|
|||||||
|
Noncontrolling interests
|
12.3
|
|
—
|
|
38.6
|
|
(u)
|
50.9
|
|
||||||
|
Total stockholders’ equity
|
331.9
|
|
6,163.1
|
|
(3,363.1
|
)
|
3,131.9
|
|
|||||||
|
Total liabilities and stockholders’ equity
|
$
|
12,836.5
|
|
$
|
(1,083.3
|
)
|
$
|
(3,486.3
|
)
|
$
|
8,266.9
|
|
|||
|
Peabody Energy Corporation
|
2017 Form 10-K
|
F-
24
|
PEABODY ENERGY CORPORATION
NOTES TO CONSOLIDATED FINANCIAL STATEMENTS — (Continued)
|
(a)
|
Represents the Predecessor consolidated balance sheet at April 1, 2017.
|
|
(b)
|
Represents amounts recorded for the implementation of the Plan on the Effective Date. This includes the settlement of liabilities subject to compromise through a combination of cash payments, the issuance of new common stock and warrants and the issuance of new debt. The following is the calculation of the total pre-tax gain on the settlement of the liabilities subject to compromise.
|
|
(Dollars in millions)
|
||||
|
Liabilities subject to compromise
|
$
|
8,416.7
|
|
|
|
Less amounts issued to settle claims:
|
||||
|
Successor Common Stock (at par)
|
(0.7
|
)
|
||
|
Successor Series A Convertible Preferred Stock
|
(1,305.4
|
)
|
||
|
Successor Additional paid-in capital
|
(1,774.9
|
)
|
||
|
Issuance of Successor Notes
|
(1,000.0
|
)
|
||
|
Issuance of Successor Term Loan
|
(950.0
|
)
|
||
|
Cash payments and accruals for claims and professional fees
|
(336.4
|
)
|
||
|
Other:
|
||||
|
Write-off of Predecessor debt issuance costs, see also (e) below
|
(18.1
|
)
|
||
|
Total pre-tax gain on plan effects, see also (j) below
|
$
|
3,031.2
|
|
|
At the Effective Date,
70.9 million
shares of Common Stock were issued and outstanding at a par value of
$0.01
per share.
Preferred Stock was recorded at fair value and is based upon the
$750.0 million
cash raised upon emergence from bankruptcy through the Private Placement Agreement, plus a premium to account for the fair value of the Preferred Stocks’ conversion and dividend features. Each share of Preferred Stock is convertible, at the holder’s election or upon the occurrence of certain triggering events, into shares of Common Stock at a
35%
discount relative to the initial per share purchase price of
$25.00
and provides for
three
years of guaranteed paid-in-kind dividends, payable semiannually, at a rate of
8.5%
per annum. The
46.2 million
shares of Common Stock issuable upon conversion of the Preferred Stock issued under the Plan and an additional
13.1 million
shares of Common Stock attributable to such Preferred Stocks’ guaranteed paid-in-kind dividend feature constitute approximately
42%
ownership of the Plan Equity Value (as defined in the Plan) of
$3,105.0 million
in the reorganized Company, and thus have a fair value of
$1,305.4 million
.
Successor Additional paid-in capital was recorded at the Plan Equity Value less the amounts recorded for par value of the Common Stock, the fair value of the Preferred Stock, and certain fees incurred associated with the Registration Rights Agreement.
|
(c)
|
Represents the fresh start reporting adjustments required to record the assets and liabilities of the Company at fair value.
|
|
(d)
|
The following table reflects the sources and uses of cash and restricted cash at emergence:
|
|
(Dollars in millions)
|
||||
|
Sources:
|
||||
|
Private placement and rights offering
|
$
|
1,500.0
|
|
|
|
Net proceeds from Senior Secured Term Loan
|
912.7
|
|
||
|
Escrowed interest from Successor Notes offering
|
8.0
|
|
||
|
Net impact on collateral requirements
|
11.6
|
|
||
|
Uses:
|
||||
|
Payments to secured lenders
|
(3,489.2
|
)
|
||
|
Professional fees
|
(8.3
|
)
|
||
|
Securitization facility deferred financing costs
|
(3.9
|
)
|
||
|
Total cash outflow at emergence
|
$
|
(1,069.1
|
)
|
|
|
Peabody Energy Corporation
|
2017 Form 10-K
|
F-
25
|
PEABODY ENERGY CORPORATION
NOTES TO CONSOLIDATED FINANCIAL STATEMENTS — (Continued)
|
(e)
|
Primarily represents the write off of deferred financing costs associated with the cancellation and discharge of Predecessor revolving debt obligations.
|
|
(f)
|
Represents the payment of deferred financing costs associated with the Receivables Purchase Agreement.
|
|
(g)
|
Represents a new
$950 million
Senior Secured Term Loan, net of an original issue discount and deferred financing costs of
$37.3 million
, as contemplated by the Plan. Under the Plan, the Company also issued
$1.0 billion
of Successor Notes, net of
$49.5 million
of deferred financing costs. The Successor Notes and the related proceeds held in escrow were included on the Company’s unaudited condensed consolidated balance sheet at March 31, 2017. The new debt instruments issued in accordance with the Plan are further described in Note 13. “Current and Long-term Debt.”
|
|
(h)
|
Represents an accrual to account for amounts paid subsequent to the Effective Date for professional fees and certain unsecured claims and settlements set forth in the Plan.
|
|
(i)
|
Liabilities subject to compromise include secured and unsecured liabilities incurred prior to the Petition Date. These liabilities represent the amounts expected to be allowed on known or potential claims to be resolved through the Chapter 11 Cases and remain subject to future adjustments based on negotiated settlements with claimants, actions of the Bankruptcy Court, rejection of executory contracts, proofs of claims or other events. Additionally, liabilities subject to compromise also include certain items that were assumed under the Plan, and as such, were subsequently reclassified to liabilities not subject to compromise. Generally, actions to enforce or otherwise effect payment of prepetition liabilities are subject to the injunction provisions set forth in the Plan, as discussed in Note 25. “Commitments and Contingencies”. Liabilities subject to compromise consisted of the following immediately prior to emergence and at December 31, 2016:
|
|
Predecessor
|
||||||
|
April 1, 2017
|
December 31, 2016
|
|||||
|
(Dollars in millions)
|
||||||
|
Debt
(1)
|
$
|
8,077.4
|
|
$
|
8,080.3
|
|
|
Interest payable
|
172.6
|
|
172.6
|
|
||
|
Environmental liabilities
|
61.9
|
|
61.9
|
|
||
|
Trade payables
|
55.2
|
|
58.4
|
|
||
|
Postretirement benefit obligations
(2)
|
23.0
|
|
34.6
|
|
||
|
Other accrued liabilities
|
26.6
|
|
32.4
|
|
||
|
Liabilities subject to compromise
|
$
|
8,416.7
|
|
$
|
8,440.2
|
|
|
(1)
|
Includes
$7,768.3 million
and
$7,771.2 million
of first lien, second lien and unsecured debt at April 1, 2017 and December 31, 2016, respectively, and
$257.3 million
of derivative contract terminations, and
$51.8 million
of liabilities secured by prepetition letters of credit at April 1, 2017 and December 31, 2016.
|
|
(2)
|
Includes liabilities for unfunded non-qualified pension plans, all the participants of which are former employees.
|
|
(j)
|
Reflects the impacts of the reorganization adjustments:
|
|
(Dollars in millions)
|
||||
|
Total pre-tax gain on plan effects, see also (b) above
|
$
|
3,031.2
|
|
|
|
Cancellation of Predecessor Common Stock
|
0.2
|
|
||
|
Cancellation of Predecessor Additional paid-in capital
|
2,423.9
|
|
||
|
Cancellation of Predecessor Treasury stock
|
(371.9
|
)
|
||
|
Successor debt issuance costs and other items, see also (f) and (g) above
|
50.9
|
|
||
|
Net impact on accumulated deficit
|
$
|
5,134.3
|
|
|
|
(k)
|
Represents adjustment to increase the book value of coal inventories to their estimated fair value, less costs to sell the inventories.
|
|
(l)
|
Represents adjustments comprising
$228.5 million
related to assets classified as held-for-sale at March 31, 2017 which were reclassified as held-for-use and considered in connection with the valuations described in (m) below,
$89.5 million
to write off certain existing short-term mine development costs, and
$15.0 million
of various prepaid assets deemed to have no future utility subsequent to the Effective Date.
|
|
Peabody Energy Corporation
|
2017 Form 10-K
|
F-
26
|
PEABODY ENERGY CORPORATION
NOTES TO CONSOLIDATED FINANCIAL STATEMENTS — (Continued)
|
(m)
|
Represents a
$3,461.4 million
reduction in property, plant and equipment to estimated fair value as discussed below:
|
|
Predecessor
|
Fresh Start Adjustments
|
Successor
|
||||||||||
|
(Dollars in millions)
|
||||||||||||
|
Land and coal interests
|
$
|
10,297.7
|
|
$
|
(6,511.8
|
)
|
$
|
3,785.9
|
|
|||
|
Buildings and improvements
|
1,479.3
|
|
(1,013.2
|
)
|
466.1
|
|
||||||
|
Machinery and equipment
|
2,143.8
|
|
(1,203.3
|
)
|
940.5
|
|
||||||
|
Less: Accumulated depreciation, depletion and amortization
|
(5,266.9
|
)
|
5,266.9
|
|
—
|
|
||||||
|
Net impact on accumulated deficit
|
$
|
8,653.9
|
|
$
|
(3,461.4
|
)
|
$
|
5,192.5
|
|
|||
The fair value of land and coal interests, excluding the asset related to the Company’s asset retirement obligations described below, was established at
$3,504.7 million
utilizing a DCF model and the market approach. The market approach was used to provide a starting value of the coal mineral reserves without consideration for economic obsolescence. The DCF model was based on assumptions market participants would use in the pricing of these assets as well as projections of revenues and expenditures that would be incurred to mine or maintain these coal reserves through the life of mine. The basis of the DCF analysis was the Company’s prepared projections which included a variety of estimates and assumptions, such as pricing and demand for coal. The Company’s pricing was based on its view of the market taking into account third-party forward pricing curves adjusted for the quality of products sold by the Company. The fair value of land and coal interests also includes
$281.2 million
corresponding to the asset retirement obligation discussed in item (q) below.
The fair value of buildings and improvements and machinery and equipment were set at
$466.1 million
and
$940.5 million
, respectively, utilizing both market and cost approaches. The market approach was used to estimate the value of assets where detailed information for the asset was available and an active market was identified with a sufficient number of sales of comparable property that could be independently verified through reliable sources. The cost approach was utilized where there were limitations in the secondary equipment market to derive values from. The first step in the cost approach is the estimation of the cost required to replace the asset via construction or purchasing a new asset with similar utility adjusting for depreciation due to physical deterioration, functional obsolescence due to technology changes and economic obsolescence due to external factors such as regulatory changes. Useful lives were assigned to all assets based on remaining future economic benefit of each asset.
|
(n)
|
Primarily to recognize fair value of
$314.9 million
inherent in certain U.S. coal supply agreements as a result of favorable differences between contract terms and estimated market terms for the same coal products, partially offset by a reduction in the fair value of certain equity method investments. The intangible asset related to coal supply agreements will be amortized on a per ton shipped basis through 2025, predominately over the next
three
years. See also Note 9. “Intangible Contract Assets and Liabilities.”
|
|
(o)
|
Represents
$32.6 million
to account for the short-term portion of the value of certain contract-based intangibles primarily consisting of unutilized capacity of certain port and rail take-or-pay contracts, partially offset by
$15.7 million
related to liabilities classified as held-for-sale at March 31, 2017 which were reclassified as held-for-use and considered in connection with the valuations described in (m) above, and various other fair value adjustments. The intangible liabilities related to port and rail take-or-pay contracts will be amortized ratably over the terms of each contact, which vary in duration through 2043.
|
|
(p)
|
Represents the tax impact of fresh start reporting. See also Note 11. “Income Taxes.”
|
|
(q)
|
Represents the fair value adjustment related to the Company’s asset retirement obligations which was calculated using DCF models based on current mine plans. The credit-adjusted, risk-free interest rates utilized to estimate the Company’s asset retirement obligations were
9.36%
for its U.S. reclamation obligations and
4.36%
for its Australia reclamation obligations.
|
|
(r)
|
Represents the remeasurement of liabilities associated with the Company’s postretirement benefits obligations as of the Effective Date as the reorganization of the Company pursuant to the Plan represented a remeasurement event under ASC 715 “Compensation - Retirement Benefits.” The relevant discount rate was adjusted to
4.1%
from
4.15%
used in the Company’s most recent year-end remeasurement process.
|
|
Peabody Energy Corporation
|
2017 Form 10-K
|
F-
27
|
PEABODY ENERGY CORPORATION
NOTES TO CONSOLIDATED FINANCIAL STATEMENTS — (Continued)
|
(s)
|
Represents
$83.6 million
to account for the long-term portion of the value of contract-based intangibles related to unutilized capacity of port and rail take-or-pay contracts as described in (o) above and
$58.7 million
to account for the fair value inherent in certain U.S. coal supply agreements as a result of unfavorable differences between contract terms and estimated market terms for the same coal products as described in (n) above, partially offset by a remeasurement reduction of
$9.2 million
of the Company’s pension liabilities in accordance with ASC 715 as described in (r) above, as the relevant discount rate was adjusted to
4.1%
from
4.15%
used in the Company’s most recent year-end remeasurement process, and certain other valuation adjustments.
|
|
(t)
|
Represents the elimination of remaining equity balances in accordance with fresh start reporting requirements.
|
|
(u)
|
Represents adjustment to increase the book value of noncontrolling interests to fair value based on an estimate of the rights of the noncontrolling interests.
|
Reorganization Items, Net
The Company’s reorganization items for the period January 1 through April 1, 2017, and the year ended December 31, 2016 consisted of the following:
|
Predecessor
|
|||||||
|
January 1 through
April 1, 2017
|
Year Ended December 31, 2016
|
||||||
|
|
(Dollars in millions)
|
||||||
|
Gain on settlement of claims (per above)
|
$
|
(3,031.2
|
)
|
$
|
—
|
|
|
|
Fresh start adjustments, net (per above)
|
3,363.1
|
|
—
|
|
|||
|
Fresh start income tax adjustments, net
|
253.9
|
|
—
|
|
|||
|
Loss on termination of derivative contracts
|
—
|
|
75.2
|
|
|||
|
Professional fees
|
42.5
|
|
88.4
|
|
|||
|
Accounts payable settlement gains
|
(0.7
|
)
|
(1.8
|
)
|
|||
|
Interest income
|
(0.4
|
)
|
(1.8
|
)
|
|||
|
Other
|
—
|
|
(1.0
|
)
|
|||
|
Reorganization items, net
|
$
|
627.2
|
|
$
|
159.0
|
|
|
|
Cash paid for “Reorganization items, net”
|
$
|
45.8
|
|
$
|
68.1
|
|
|
The fresh start income tax adjustments included in the above table are comprised of tax benefits related to Predecessor deferred tax liabilities of
$177.8 million
, accumulated other comprehensive income of
$81.5 million
and unrecognized tax benefits of
$6.7 million
, partially offset by
$12.1 million
of tax expense related to the deferred tax assets of Predecessor discontinued operations.
Professional fees are only those that are directly related to the reorganization including, but not limited to, fees associated with advisors to the Debtors, the unsecured creditors’ committee and certain other secured and unsecured creditors.
During the Successor period April 2, 2017 through December 31, 2017, the Company paid approximately
$240.0 million
related to professional fees and certain unsecured claims and settlements set forth in the Plan.
|
(3)
|
Asset Impairment
|
The Company’s mining and exploration assets and mining-related investments may be adversely affected by numerous uncertain factors that may cause the Company to be unable to recover all or a portion of the carrying value of those assets. The Company generally does not view short-term declines in thermal and metallurgical coal prices as an indicator of impairment. However, the Company generally views a sustained trend (for example, over periods exceeding one year) of adverse coal pricing or unfavorable changes thereto as a potential indicator of impairment. Because of the volatile and cyclical nature of coal prices and demand, it is reasonably possible that coal prices may decrease and/or fail to improve in the near term, which, absent sufficient mitigation such as an offsetting reduction in the Company’s operating costs, may result in the need for future adjustments to the carrying value of the Company’s long-lived mining assets and mining-related investments.
|
Peabody Energy Corporation
|
2017 Form 10-K
|
F-
28
|
PEABODY ENERGY CORPORATION
NOTES TO CONSOLIDATED FINANCIAL STATEMENTS — (Continued)
Successor Period April 2 through December 31, 2017
As described in Note 2. “Emergence from the Chapter 11 Cases and Fresh Start Reporting,” the Company adjusted the book values of its property, plant, equipment and mine development assets to estimated fair value in connection with fresh start reporting. During the Successor period
April 2 through December 31, 2017
, the Company recognized
no
impairment charges.
Predecessor Period January 1 through April 1, 2017
During the Predecessor period
January 1 through April 1, 2017
, the Company recognized impairment charges of
$30.5 million
related to terminated coal lease contracts in the Midwestern United States.
Year Ended December 31, 2016
The following costs are reflected in “Asset impairment” in the consolidated statement of operations for the year ended December 31, 2016:
|
Predecessor
|
||||||||||||
|
Reportable Segment
|
||||||||||||
|
Australian Metallurgical
Mining
|
Corporate
and Other
|
Consolidated
|
||||||||||
|
|
(Dollars in millions)
|
|||||||||||
|
Asset impairment charges
|
$
|
193.2
|
|
$
|
54.7
|
|
$
|
247.9
|
|
|||
Australian Metallurgical Mining
On November 3, 2016, Peabody Australia Mining Pty Ltd, one of the Company’s Australian subsidiaries, entered into a definitive share sale and purchase agreement (SPA) for the sale of all of its equity interest in Metropolitan Collieries Pty Ltd, the entity that owns the Metropolitan mine in New South Wales, Australia and the associated interest in the Port Kembla Coal Terminal, to a subsidiary of South32 Limited (South32). The SPA provided for a cash purchase price of
$200.0 million
and certain contingent consideration, subject to a customary working capital adjustment. The Company determined that, as a result of entering into the transaction, and the approval of the Company’s Board of Directors of such a transaction in October 2016, the Metropolitan mine was deemed to meet held-for-sale accounting criteria in the fourth quarter of 2016. Accordingly, the Company recorded an after-tax impairment charge of
$193.2 million
to write down the assets to their estimated selling price, which is the best estimate of fair value under a held-for-sale accounting model. South32 terminated the agreement in April 2017 after it was unable to obtain necessary approvals from the Australian Competition and Consumer Commission within the timeframe required under the SPA.
Corporate and Other
During a 2016 review of its asset portfolio and prepetition leases, the Company identified certain non-strategic Midwestern coal reserves held under lease that were determined to be uneconomical to be mined in the future. As a result, the Company rejected certain leases and recognized an aggregate impairment charge of
$37.5 million
. The Company also recognized a
$17.2 million
impairment charge to record at fair value certain non-strategic Australian metallurgical assets classified as held for sale. For additional information regarding those divested assets, refer to Note 21. “Resource Management, Acquisitions and Other Commercial Events”.
|
Peabody Energy Corporation
|
2017 Form 10-K
|
F-
29
|
PEABODY ENERGY CORPORATION
NOTES TO CONSOLIDATED FINANCIAL STATEMENTS — (Continued)
Year Ended December 31, 2015
The following costs are reflected in “Asset impairment” in the consolidated statement of operations for the year ended December 31, 2015:
|
Predecessor
|
||||||||||||||||||||
|
Reportable Segment
|
||||||||||||||||||||
|
Australian Metallurgical
Mining
|
Australian Thermal Mining
|
Midwestern
U.S. Mining
|
Corporate
and Other
|
Consolidated
|
||||||||||||||||
|
|
(Dollars in millions)
|
|||||||||||||||||||
|
Asset impairment charges:
|
||||||||||||||||||||
|
Long-lived assets
|
$
|
675.2
|
|
$
|
17.5
|
|
$
|
40.2
|
|
$
|
268.4
|
|
$
|
1,001.3
|
|
|||||
|
Equity method investment
|
—
|
|
—
|
|
—
|
|
276.5
|
|
276.5
|
|
||||||||||
|
Total
|
$
|
675.2
|
|
$
|
17.5
|
|
$
|
40.2
|
|
$
|
544.9
|
|
$
|
1,277.8
|
|
|||||
Australian Metallurgical and Thermal Mining
Due to the severity of the decline in seaborne metallurgical and thermal coal pricing observed during 2015 and other adverse supply and demand conditions noted during the year that drove an unfavorable change in the expected timing of eventual seaborne supply and demand rebalancing, the Company concluded that indicators of impairment existed surrounding its Australian mining platform as of June 30, 2015 and December 31, 2015. Accordingly, the Company reviewed its Australian mining assets for recoverability at those dates and determined that the carrying values of three of its active mines that produce metallurgical coal were not recoverable and recognized impairment charges of
$230.5 million
and
$144.5 million
during the three-month periods ended June 30, 2015 and December 31, 2015, respectively, to write those assets down to their estimated fair value.
Also during 2015, the Company reviewed its portfolio of mining tenements and surface lands to identify non-strategic assets that could be monetized. In connection with that review, certain of such assets were deemed to meet held-for-sale accounting criteria or were otherwise deemed more likely to generate cash flows through divestiture rather than development, with the long-term plans for certain adjacent assets also consequently affected. Accordingly, the Company recognized an aggregate impairment charge of
$317.7 million
to write down the targeted divestiture assets and abandoned assets to their estimated fair value.
Midwestern U.S. Mining
The Company identified indicators of impairment to be present for one of its inactive surface mines due to the property no longer being part of the Company’s long-term mining plan as a result of the decline in thermal coal prices and a lack of observed interest from potential buyers in acquiring the asset. Accordingly, the Company recognized an impairment charge of
$30.5 million
to write down the asset to its estimated fair value.
Due to the severity of the decline in thermal coal pricing observed during 2015 and other adverse market conditions noted during 2015, the Company identified indicators of impairment to be present for one of its Midwestern U.S. Mining assets. Due to the adverse conditions, the Company’s long-term mining plan changed and the asset was no longer part of the long-term mining plan. Accordingly, the Company recognized an impairment charge of
$9.7 million
to write down the asset to its estimated fair value.
Corporate and Other
Long-lived Assets.
In connection with a similar review of the Company’s asset portfolio conducted during 2015 to identify non-strategic domestic assets that could be monetized, the Company identified non-strategic, non-coal-supplying assets as held-for-sale rather than held-for-use as of December 31, 2015. Accordingly, the Company recognized an impairment charge of
$182.2 million
to write the assets down to estimated fair value.
The Company also identified indicators of impairment to be present for several of its non-strategic undeveloped coal properties that are no longer part of the Company’s long-term mining plan as a result of the decline in thermal coal prices and a lack of observed interest from potential buyers in acquiring those assets. Accordingly, the Company recognized an aggregate impairment charge of
$86.2 million
to write down the assets to their estimated fair value.
|
Peabody Energy Corporation
|
2017 Form 10-K
|
F-
30
|
PEABODY ENERGY CORPORATION
NOTES TO CONSOLIDATED FINANCIAL STATEMENTS — (Continued)
Equity Method Investment.
Due to the impairment indicators noted above surrounding the Company’s Australian platform, the Company similarly reviewed its total investment in Middlemount, which owns the Middlemount Mine in Queensland, Australia, as of December 31, 2015. As a result of that review, the Company determined that the carrying value of its equity investment in Middlemount was other-than-temporarily impaired and recorded a charge of
$46.6 million
to write-off the investment.
The Company, along with the other equity interest holder, also periodically makes loans to Middlemount (Subordinated Loans) pursuant to the related stockholders’ agreement for purposes of funding capital expenditures and working capital requirements. The Company reviewed the loans for impairment and recorded a charge of
$229.9 million
to write down the full carrying value of the Subordinated Loans. The Subordinated Loans are provided on an equal and shared basis with the other equity interest holder, and the Company’s and the other equity interest holder’s claims under the Subordinated Loans are on equal footing. The Company also has priority loans to Middlemount (Priority Loans) which have seniority over the fully impaired Subordinated Loans. The Priority Loans amounted to
$84.8 million
and
$65.2 million
at December 31, 2016 and 2015, respectively, and were not impaired as of December 31, 2016 as the Company had the intent and ability to hold the loans to payoff and Middlemount had sufficient assets to settle.
The fair value estimates made during the Company’s impairment assessments were determined in accordance with the methods outlined in Note 1. “Summary of Significant Accounting Policies”, except in certain instances where indicative bids were received related to non-strategic assets being marketed for divestiture. In those instances, the indicative bids were also considered in estimating fair value.
|
(4)
|
Discontinued Operations
|
Discontinued operations include certain former Australian Thermal Mining and Midwestern U.S. Mining segment assets that have ceased production and other previously divested legacy operations, including Patriot Coal Corporation and certain of its wholly-owned subsidiaries (Patriot).
Summarized Results of Discontinued Operations
Results from discontinued operations were as follows during the years ended
December 31, 2017
,
2016
and
2015
:
|
Successor
|
Predecessor
|
||||||||||||||
|
April 2 through December 31, 2017
|
January 1 through April 1, 2017
|
Year Ended December 31, 2016
|
Year Ended December 31, 2015
|
||||||||||||
|
(Dollars in millions)
|
|||||||||||||||
|
Loss from discontinued operations before income taxes
|
$
|
(19.8
|
)
|
$
|
(16.2
|
)
|
$
|
(57.6
|
)
|
$
|
(182.2
|
)
|
|||
|
Income tax benefit
|
—
|
|
—
|
|
—
|
|
7.2
|
|
|||||||
|
Loss from discontinued operations, net of income taxes
|
$
|
(19.8
|
)
|
$
|
(16.2
|
)
|
$
|
(57.6
|
)
|
$
|
(175.0
|
)
|
|||
There were no significant revenues from discontinued operations during the years ended
December 31, 2017
,
2016
and
2015
.
|
Peabody Energy Corporation
|
2017 Form 10-K
|
F-
31
|
PEABODY ENERGY CORPORATION
NOTES TO CONSOLIDATED FINANCIAL STATEMENTS — (Continued)
Assets and Liabilities of Discontinued Operations
Assets and liabilities classified as discontinued operations included in the Company’s consolidated balance sheets were as follows:
|
Successor
|
Predecessor
|
|||||
|
December 31, 2017
|
December 31, 2016
|
|||||
|
(Dollars in millions)
|
||||||
|
Assets:
|
||||||
|
Other current assets
|
$
|
0.3
|
|
$
|
0.2
|
|
|
Investments and other assets
|
—
|
|
15.9
|
|
||
|
Total assets classified as discontinued operations
|
$
|
0.3
|
|
$
|
16.1
|
|
|
Liabilities:
|
||||||
|
Accounts payable and accrued expenses
|
$
|
70.6
|
|
$
|
55.9
|
|
|
Other noncurrent liabilities
|
170.0
|
|
198.5
|
|
||
|
Liabilities subject to compromise
|
—
|
|
20.9
|
|
||
|
Total liabilities classified as discontinued operations
|
$
|
240.6
|
|
$
|
275.3
|
|
Wilkie Creek Mine.
In December 2013, the Company ceased production and started reclamation of the Wilkie Creek Mine in Queensland, Australia. On June 30, 2014, Queensland Bulk Handling Pty Ltd (QBH) commenced litigation against Peabody (Wilkie Creek) Pty Limited, the indirect wholly-owned subsidiary of the Company that owns the Wilkie Creek Mine, alleging breach of a Coal Port Services Agreement (CPSA) between the parties. Included in “Loss from discontinued operations, net of income taxes” for the year ended December 31, 2015 is a
$9.7 million
charge related to the settlement of that litigation. In September 2016, a settlement was reached under which the Company agreed to pay
$13.0 million
Australian dollars (
$9.9 million
USD) to QBH in a full and final settlement of all claims each party had against the other in relation to the CPSA litigation.
Patriot-Related Matters
In 2012, Patriot filed voluntary petitions for relief under Chapter 11 of Title 11 of the U.S. Code. In 2013, the Company entered into a definitive settlement agreement (2013 Agreement) with Patriot and the United Mine Workers of America (UMWA), on behalf of itself, its represented Patriot employees and its represented Patriot retirees, to resolve all then disputed issues related to Patriot’s bankruptcy. In May 2015, Patriot again filed voluntary petitions for relief under Chapter 11 of Title 11 of the U.S. Code in the Eastern District of Virginia and subsequently initiated a process to sell some or all of its assets to qualified bidders. On October 9, 2015, Patriot’s bankruptcy court entered an order confirming Patriot’s plan of reorganization, which provided, among other things, for the sale of substantially all of Patriot’s assets to two different buyers.
Black Lung Occupational Disease Liabilities
Patriot had federal and state black lung occupational disease liabilities related to workers employed in periods prior to Patriot’s spin-off from the Company in 2007. Upon spin-off, Patriot indemnified the Company against any claim relating to these liabilities, which amounted to approximately
$150 million
at that time. The indemnification included any claim made by the U.S. Department of Labor (DOL) against the Company with respect to these obligations as a potentially liable operator under the Federal Coal Mine Health and Safety Act of 1969. The 2013 Agreement included Patriot’s affirmance of indemnities provided in the spin-off agreements, including the indemnity relating to such black lung liabilities; however, Patriot rejected this indemnity in its May 2015 bankruptcy.
|
Peabody Energy Corporation
|
2017 Form 10-K
|
F-
32
|
PEABODY ENERGY CORPORATION
NOTES TO CONSOLIDATED FINANCIAL STATEMENTS — (Continued)
By statute, the Company had secondary liability for the black lung liabilities related to Patriot’s workers employed by former subsidiaries of the Company. Whether the Company will ultimately be required to fund certain of those obligations in the future as a result of Patriot’s May 2015 bankruptcy remains uncertain. The amount of the liability was
$134.0 million
at
December 31, 2017
, which was determined on an actuarial basis based on the best information available to the Company. In connection with the actuarial valuation, the Company recorded a mark-to-market adjustment of
$7.9 million
to increase the liability during the Successor period ended December 31, 2017. While the Company has recorded a liability, it intends to review each claim on a case-by-case basis and contest liability estimates as appropriate. The amount of the Company’s recorded liability reflects only Patriot workers employed by former subsidiaries of the Company that are presently retired, disabled or otherwise not actively employed. The Company cannot reliably estimate the potential liabilities for Patriot’s workers employed by former subsidiaries of the Company that are presently active in the workforce because of the potential for such workers to continue to work for another coal operator that is a going concern.
The Company’s accounting for the black lung liabilities related to Patriot is based on an interpretation of applicable statutes. Management believes that there exist inconsistencies among the applicable statutes, regulations promulgated under those statutes and the Department of Labor’s interpretative guidance. The Company may seek clarification from the Department of Labor regarding these inconsistencies and the accounting for these liabilities could be reduced in the future depending on the Department of Labor’s responses to inquiries.
Combined Benefit Fund (Combined Fund)
The Combined Fund was created by the Coal Act in 1992 as a multi-employer plan to provide health care benefits to a closed group of retirees who last worked prior to 1976, as well as orphaned beneficiaries of bankrupt companies who were receiving benefits as orphans prior to the passage of the Coal Act. No new retirees will be added to this group, which includes retirees formerly employed by certain Patriot subsidiaries and their predecessors. Former employers are required to contribute to the Combined Fund according to a formula.
Under the terms of the Patriot spin-off, Patriot was primarily liable to the Combined Fund for the approximately
$40.0 million
of its subsidiaries’ obligations at that time. Once Patriot ceased meeting its obligations, the Company was held responsible for these costs and, as a result, recorded a “Loss from discontinued operations, net of income taxes” charge of
$24.6 million
during the year ended December 31, 2015. The Company recorded additional charges of
$0.6 million
during the Successor period
April 2 through December 31, 2017
and
$0.2 million
and
$1.2 million
during the Predecessor period
January 1 through April 1, 2017
and the year ended December 31, 2016, respectively. The Company made payments into the fund of
$1.7 million
during the Successor period
April 2 through December 31, 2017
and
$0.6 million
during the Predecessor period
January 1 through April 1, 2017
and estimates that the annual cash cost to fund these potential Combined Fund liabilities will range between
$2 million
and
$3 million
in the near-term, with those premiums expected to decline over time because the fund is closed to new participants. The liability related to the fund was
$20.2 million
at
December 31, 2017
.
UMWA 1974 Pension Plan (UMWA Plan) Litigation
On July 16, 2015, a lawsuit was filed by the UMWA Plan, the UMWA 1974 Pension Trust (Trust) and the Trustees of the UMWA Plan and Trust (Trustees) in the United States District Court for the District of Columbia, against PEC, PHC, a subsidiary of the Company, and Arch Coal, Inc. (Arch). The plaintiffs sought, pursuant to the Employee Retirement Income Security Act of 1974, as amended (ERISA) and the Multiemployer Pension Plan Amendments Act of 1980 (MPPAA), a declaratory judgment that the defendants were obligated to arbitrate any opposition to the Trustees’ determination that the defendants have statutory withdrawal liability as a result of the 2015 Patriot bankruptcy. After a legal and arbitration process and with the approval of the Bankruptcy Court, on January 25, 2017, the UMWA Plan and the Debtors agreed to a settlement of the claim whereby the UMWA Plan will be entitled to
$75 million
to be paid by the Company in increments through 2021. In connection with the settlement, the Company recorded a liability representing the present value of the installments of
$54.3 million
and recognized an equivalent charge to “Loss from discontinued operations, net of income taxes” in the consolidated statement of operations for the year ended December 31, 2016. The balance of the liability was
$46.0 million
at December 31, 2017.
|
Peabody Energy Corporation
|
2017 Form 10-K
|
F-
33
|
PEABODY ENERGY CORPORATION
NOTES TO CONSOLIDATED FINANCIAL STATEMENTS — (Continued)
|
(5)
|
Inventories
|
Inventories as of
December 31, 2017
and
December 31, 2016
consisted of the following:
|
|
Successor
|
Predecessor
|
||||
|
|
December 31, 2017
|
December 31, 2016
|
||||
|
|
(Dollars in millions)
|
|||||
|
Materials and supplies
|
$
|
101.5
|
|
$
|
104.5
|
|
|
Raw coal
|
78.1
|
|
29.6
|
|
||
|
Saleable coal
|
111.7
|
|
69.6
|
|
||
|
Inventories
|
$
|
291.3
|
|
$
|
203.7
|
|
Materials and supplies inventories presented above have been shown net of reserves of
$0.6 million
and
$5.6 million
as of
December 31, 2017
and
2016
, respectively.
|
(6)
|
Investments
|
Equity Method Investments
The Company’s equity method investments include its joint venture interest in Middlemount in addition to certain other equity method investments.
The table below summarizes the book value of those investments and related financing receivables, which are reported in “Investments and other assets” in the consolidated balance sheets, and the related “(Income) loss from equity affiliates”:
|
Successor
|
Predecessor
|
Successor
|
Predecessor
|
||||||||||||||||||
|
Book Value at
|
(Income) Loss from Equity Affiliates
|
||||||||||||||||||||
|
|
December 31, 2017
|
December 31, 2016
|
April 2 through December 31, 2017
|
January 1 through April 1, 2017
|
Year Ended December 31, 2016
|
Year Ended December 31, 2015
|
|||||||||||||||
|
|
(Dollars in millions)
|
||||||||||||||||||||
|
Equity method investment and financing receivables related to Middlemount
|
$
|
82.1
|
|
$
|
84.8
|
|
$
|
(48.6
|
)
|
$
|
(17.4
|
)
|
$
|
(22.6
|
)
|
$
|
7.0
|
|
|||
|
Other equity method investments
|
1.7
|
|
0.5
|
|
(0.4
|
)
|
2.4
|
|
6.4
|
|
8.9
|
|
|||||||||
|
Total equity method investments and financing receivables related to Middlemount
|
$
|
83.8
|
|
$
|
85.3
|
|
$
|
(49.0
|
)
|
$
|
(15.0
|
)
|
$
|
(16.2
|
)
|
$
|
15.9
|
|
|||
As noted in Note 2. “Emergence from the Chapter 11 Cases and Fresh Start Reporting,” the carrying value of the equity method investments and financing receivables related to Middlemount was adjusted to fair value in connection with fresh start reporting based on the net present value of future cash flows associated with the Company’s
50%
equity interest in Middlemount. As of
December 31, 2017
, the financing receivables are accounted for as in-substance common stock due to the limited fair value attributed to Middlemount’s equity.
From time to time, the Company makes loans to Middlemount pursuant to the related stockholders’ agreement for purposes of funding capital expenditures and working capital requirements. The Priority Loans (the amount loaned by the Company in excess of the amount loaned by the other stockholder) bear interest at a rate equal to the monthly average 30-day Australian Bank Bill Swap Reference Rate plus
3.50%
. The Company received loan repayments and other cash payments from Middlemount of approximately
$48 million
during the Successor period
April 2 through December 31, 2017
and approximately
$31 million
and
$41 million
during the Predecessor period
January 1 through April 1, 2017
and the year ended
December 31, 2016
, respectively.
One of the Company’s Australian subsidiaries and the other stockholder of Middlemount are parties to an agreement, as amended from time to time, to provide a revolving loan (Revolving Loans) to Middlemount not to exceed
$50.0 million
Australian dollars (Revolving Loan Limit). The Company’s participation in the Revolving Loans will not, at any time, exceed its
50%
equity interest of the Revolving Loan Limit. The Revolving Loans bear interest at
15%
per annum and expire on December 31, 2018. As of December 31, 2017 and 2016, the carrying values of the Revolving Loans due to the Company’s Australian subsidiary were
zero
.
|
Peabody Energy Corporation
|
2017 Form 10-K
|
F-
34
|
PEABODY ENERGY CORPORATION
NOTES TO CONSOLIDATED FINANCIAL STATEMENTS — (Continued)
During the Successor period
April 2 through December 31, 2017
, and the Predecessor periods of
January 1 through April 1, 2017
, and the years ended
December 31, 2016
and
2015
, Middlemount generated revenues of approximately
$193 million
,
$60 million
,
$183 million
and
$160 million
(on a
50%
basis). During the year ended December 31, 2015, due to sustained weakness in seaborne metallurgical coal prices that had persisted longer than the Company had previously anticipated, a history of operating losses at the mine and the magnitude of the difference between the estimated fair value and the carrying value of its equity investment, the Company determined the carrying value of its equity investment in Middlemount to be other-than-temporarily impaired. Correspondingly, the Company recorded an impairment charge of
$46.6 million
to write down the carrying value of its equity investment. The Company determined its Subordinated Loans to Middlemount were also fully impaired resulting in an additional impairment charge of
$229.9 million
. A total impairment charge related to Middlemount of
$276.5 million
was reflected in “Asset impairment” in the consolidated statement of operations for the year ended December 31, 2015. Refer to Note 3. “Asset Impairment” for additional background surrounding the impairment charge recognized in 2015.
Middlemount had current assets, noncurrent assets, current liabilities and noncurrent liabilities of
$61.7 million
,
$232.2 million
,
$313.9 million
and
$41.2 million
, respectively, as of
December 31, 2017
and
$47.3 million
,
$263.4 million
,
$363.5 million
and
$50.3 million
, respectively, as of
December 31, 2016
(on a
50%
basis).
|
(7)
|
Derivatives and Fair Value Measurements
|
Risk Management — Corporate Hedging Activities
The Company is exposed to several risks in the normal course of business, including (1) foreign currency exchange rate risk for non-U.S. dollar expenditures and balances, (2) price risk on coal produced by and diesel fuel utilized in the Company’s mining operations and (3) interest rate risk that has been partially mitigated by fixed rates on long-term debt. The Company manages a portion of its price risk related to the sale of coal (excluding coal trading activities) using long-term coal supply agreements (those with terms longer than one year), rather than using derivative instruments. Derivative financial instruments have historically been used to manage the Company’s risk exposure to foreign currency exchange rate risk, primarily on Australian dollar expenditures made in its Australian mining platform. This risk was historically managed using forward contracts and options designated as cash flow hedges, with the objective of reducing the variability of cash flows associated with forecasted foreign currency expenditures. The Company has also used derivative instruments to manage its exposure to the variability of diesel fuel prices used in production in the U.S. and Australia with swaps or options, which it has also designated as cash flow hedges, with the objective of reducing the variability of cash flows associated with forecasted diesel fuel purchases. These risk management activities are collectively referred to as “Corporate Hedging” and are actively monitored for compliance with the Company’s risk management policies.
During the fourth quarter of 2015, the Company performed an assessment of its risk of nonperformance with respect to derivative financial instruments designated as cash flow hedges in light of three rating agencies downgrading the Company’s corporate credit rating during 2015 and declining financial results. The Company determined its hedging relationships were expected to be “highly effective” throughout 2015 based on its quarterly assessments. However, as a result of a deterioration in the Company’s credit profile, the Company could no longer conclude, as of December 31, 2015, that its hedging relationships were expected to be “highly effective” at offsetting the changes in the anticipated exposure of the hedged item. Therefore, the Company discontinued the application of cash flow hedge accounting subsequent to December 31, 2015 and changes in the fair value of derivative instruments have been recorded as operating costs and expenses in the accompanying consolidated statements of operations after that date. Previous fair value adjustments recorded in “Accumulated other comprehensive income (loss)” were frozen until the underlying transactions impacted the Company’s earnings.
The Company’s Bankruptcy Petitions constituted an event of default under the Company’s derivative financial instrument contracts and the counterparties terminated the agreements shortly thereafter in accordance with contractual terms. The terminated positions were first-lien obligations under the Company’s secured credit agreement dated September 24, 2013 (as amended, the 2013 Credit Facility). As of December 31, 2016, the resulting net settlement liability of
$257.3 million
was accounted for as a first lien prepetition liability subject to compromise without credit valuation adjustments. On the Effective Date, the net settlement liability was discharged in connection with the Plan, as further described in Note 2. “Emergence from the Chapter 11 Cases and Fresh Start Reporting.”
|
Peabody Energy Corporation
|
2017 Form 10-K
|
F-
35
|
PEABODY ENERGY CORPORATION
NOTES TO CONSOLIDATED FINANCIAL STATEMENTS — (Continued)
As of
December 31, 2017
, the Company had no diesel fuel derivatives in place. Subsequent to the Effective Date, the Company entered into a series of currency options and, as of
December 31, 2017
, had currency options outstanding with aggregate notional amount of
$1,125.0 million
Australian dollars to hedge currency risk associated with anticipated Australian dollar expenditures during the first nine months of 2018. The instruments are quarterly average rate options whereby the Company is entitled to receive payment on the notional amount should the quarterly average Australian dollar-to-U.S. dollar exchange rate exceed amounts ranging from
$0.79
and
$0.83
over the first nine months of 2018. The currency options are not expected to receive cash flow hedge accounting treatment and changes in fair value will be reflected in current earnings. At
December 31, 2017
, the currency options’ fair value of
$4.2 million
was included in “Other current assets” in the accompanying consolidated balance sheet.
The tables below show the classification and amounts of pre-tax gains and losses related to the Company’s Corporate Hedging derivatives during the period
April 2 through December 31, 2017
,
January 1 through April 1, 2017
and the years ended December 31,
2016
and
2015
:
|
Successor
|
||||||||||||||
|
|
|
April 2 through December 31, 2017
|
||||||||||||
|
Income Statement Classification
|
Total gain recognized in income
|
Gain realized in income on derivatives
|
Unrealized loss recognized in income on derivatives
|
|||||||||||
|
Financial Instrument
|
||||||||||||||
|
|
|
(Dollars in millions)
|
||||||||||||
|
Foreign currency option contracts
|
Operating costs and expenses
|
$
|
1.8
|
|
$
|
3.3
|
|
$
|
(1.5
|
)
|
||||
|
Total
|
|
$
|
1.8
|
|
$
|
3.3
|
|
$
|
(1.5
|
)
|
||||
|
Predecessor
|
||||||||||
|
|
|
January 1 through April 1, 2017
|
||||||||
|
Income Statement Classification
|
Total loss recognized in income
|
Loss reclassified from other comprehensive loss into income
|
||||||||
|
Financial Instrument
|
||||||||||
|
|
|
(Dollars in millions)
|
||||||||
|
Commodity swap contracts
|
Operating costs and expenses
|
$
|
(11.0
|
)
|
$
|
(11.0
|
)
|
|||
|
Foreign currency forward contracts
|
Operating costs and expenses
|
(16.6
|
)
|
(16.6
|
)
|
|||||
|
Total
|
|
$
|
(27.6
|
)
|
$
|
(27.6
|
)
|
|||
|
Predecessor
|
||||||||||||||
|
|
|
Year Ended December 31, 2016
|
||||||||||||
|
Income Statement Classification
|
Total realized loss recognized in income
|
Loss
reclassified
from other
comprehensive
income into
income
(effective
portion)
(1)
|
(Loss) gain
reclassified
from other
comprehensive
income into
income
(ineffective
portion)
|
|||||||||||
|
Financial Instrument
|
||||||||||||||
|
|
|
(Dollars in millions)
|
||||||||||||
|
Commodity swap contracts
|
Operating costs and expenses
|
$
|
(98.0
|
)
|
$
|
(86.1
|
)
|
$
|
(11.9
|
)
|
||||
|
Commodity swap contracts
|
Reorganization items, net
|
(38.8
|
)
|
—
|
|
(38.8
|
)
|
|||||||
|
Foreign currency forward contracts
|
Operating costs and expenses
|
(142.9
|
)
|
(145.6
|
)
|
2.7
|
|
|||||||
|
Foreign currency forward contracts
|
Reorganization items, net
|
(36.4
|
)
|
—
|
|
(36.4
|
)
|
|||||||
|
Total
|
|
$
|
(316.1
|
)
|
$
|
(231.7
|
)
|
$
|
(84.4
|
)
|
||||
|
(1)
|
Includes the reclassification from "Accumulated other comprehensive loss" into earnings of
$13.6 million
and
$9.0 million
of previously unrecognized losses on foreign currency and fuel contracts, respectively, monetized in the first quarter of 2016.
|
|
Peabody Energy Corporation
|
2017 Form 10-K
|
F-
36
|
PEABODY ENERGY CORPORATION
NOTES TO CONSOLIDATED FINANCIAL STATEMENTS — (Continued)
|
Predecessor
|
||||||||||||||
|
|
|
Year Ended December 31, 2015
|
||||||||||||
|
Income Statement Classification
|
Loss
recognized in
other
comprehensive
income on
derivative
(effective portion)
|
Loss
reclassified
from other
comprehensive
income into
income
(effective
portion)
(1)
|
Gain
reclassified
from other
comprehensive
income into
income
(ineffective
portion)
|
|||||||||||
|
Financial Instrument
|
||||||||||||||
|
|
|
(Dollars in millions)
|
||||||||||||
|
Commodity swap contracts
|
Operating costs and expenses
|
$
|
(77.0
|
)
|
$
|
(122.0
|
)
|
$
|
1.6
|
|
||||
|
Foreign currency forward contracts
|
Operating costs and expenses
|
(122.0
|
)
|
(316.4
|
)
|
—
|
|
|||||||
|
Total
|
|
$
|
(199.0
|
)
|
$
|
(438.4
|
)
|
$
|
1.6
|
|
||||
|
(1)
|
Includes the reclassification from "Accumulated other comprehensive loss" into earnings of
$14.9 million
of previously unrecognized gains on foreign currency cash flow hedge contracts monetized in the fourth quarter of 2012.
|
Cash Flow Presentation.
The Company classifies the cash effects of its Corporate Hedging derivatives within the “Cash Flows From Operating Activities” section of the consolidated statements of cash flows.
Fair Value Measurements
The Company uses a three-level fair value hierarchy that categorizes assets and liabilities measured at fair value based on the observability of the inputs utilized in the valuation. These levels include: Level 1 - inputs are quoted prices in active markets for the identical assets or liabilities; Level 2 - inputs are other than quoted prices included in Level 1 that are directly or indirectly observable through market-corroborated inputs; and Level 3 - inputs are unobservable, or observable but cannot be market-corroborated, requiring the Company to make assumptions about pricing by market participants.
Financial Instruments Measured on a Recurring Basis.
The following tables set forth the hierarchy of the Company’s net financial asset positions for which fair value is measured on a recurring basis:
|
Successor
|
|||||||||||||||
|
|
December 31, 2017
|
||||||||||||||
|
|
Level 1
|
Level 2
|
Level 3
|
Total
|
|||||||||||
|
|
(Dollars in millions)
|
||||||||||||||
|
Foreign currency option contracts
|
$
|
—
|
|
$
|
4.2
|
|
$
|
—
|
|
$
|
4.2
|
|
|||
|
Total net financial assets
|
$
|
—
|
|
$
|
4.2
|
|
$
|
—
|
|
$
|
4.2
|
|
|||
As of December 31, 2016, the Company had no outstanding financial positions.
For Level 1 and 2 financial assets and liabilities, the Company utilizes both direct and indirect observable price quotes, including interest rate yield curves, exchange indices, broker/dealer quotes, published indices, issuer spreads, benchmark securities and other market quotes. In the case of certain debt securities, fair value is provided by a third-party pricing service. Below is a summary of the Company’s valuation techniques for Level 1 and 2 financial assets and liabilities:
|
•
|
Commodity swap contracts: valued based on a valuation that is corroborated by the use of market-based pricing (Level 2) except when credit and non-performance risk is considered to be a significant input, then the Company classifies such contracts as Level 3.
|
|
•
|
Foreign currency forward and option contracts: valued utilizing inputs obtained in quoted public markets (Level 2) except when credit and non-performance risk is considered to be a significant input, then the Company classifies such contracts as Level 3.
|
|
Peabody Energy Corporation
|
2017 Form 10-K
|
F-
37
|
PEABODY ENERGY CORPORATION
NOTES TO CONSOLIDATED FINANCIAL STATEMENTS — (Continued)
The following table summarizes the changes related to the Company’s Corporate Hedging derivative financial instruments recurring Level 3 financial liabilities:
|
Predecessor
|
||||||||||||
|
|
December 31, 2016
|
|||||||||||
|
|
Commodity Contracts
|
Foreign Currency Contracts
|
Total
|
|||||||||
|
|
(Dollars in millions)
|
|||||||||||
|
Beginning of period
|
$
|
123.7
|
|
$
|
200.7
|
|
$
|
324.4
|
|
|||
|
Total net losses realized/unrealized:
|
||||||||||||
|
Included in earnings
|
15.7
|
|
(48.0
|
)
|
(32.3
|
)
|
||||||
|
Settlements / terminations
|
(139.4
|
)
|
(152.7
|
)
|
(292.1
|
)
|
||||||
|
End of period
|
$
|
—
|
|
$
|
—
|
|
$
|
—
|
|
|||
Other Financial Instruments
. The following methods and assumptions were used by the Company in estimating fair values for other financial instruments as of
December 31, 2017
and
2016
:
|
•
|
Cash and cash equivalents, restricted cash, accounts receivable, including those within the Company’s accounts receivable securitization program, notes receivable and accounts payable have carrying values which approximate fair value due to the short maturity or the liquid nature of these instruments.
|
|
•
|
Long-term debt fair value estimates are based on observed prices for securities with an active trading market when available (Level 2), and otherwise on estimated borrowing rates to discount the cash flows to their present value (Level 3).
|
The estimated fair value of the Company’s current and long-term debt as of
December 31, 2016
is unable to be determined given it was subject to compromise in connection with the Plan. The carrying amount and estimated fair value of the Company’s current and long-term debt as of
December 31, 2017
are summarized as follows:
|
Successor
|
|||||||
|
|
December 31, 2017
|
||||||
|
Carrying
Amount
|
Estimated
Fair Value
|
||||||
|
|
(Dollars in millions)
|
||||||
|
Current and Long-term debt
|
$
|
1,460.8
|
|
$
|
1,547.4
|
|
|
The Company had no transfers between Levels 1, 2 and 3 for either financial instruments measured on a recurring basis or other financial instruments during the Successor period
April 2 through December 31, 2017
, the Predecessor period
January 1 through April 1, 2017
or the year ended
December 31, 2016
. The Company’s policy is to value all transfers between levels using the beginning of period valuation.
|
(8)
|
Coal Trading
|
The Company engages in the direct and brokered trading of coal and freight-related contracts (coal trading). Except those contracts for which the Company has elected to apply a normal purchases and normal sales exception, all derivative coal trading contracts are accounted for at fair value.
The Company includes instruments associated with coal trading transactions as a part of its trading book. Trading revenues from such transactions are recorded in “Other revenues” in the consolidated statements of operations and include realized and unrealized gains and losses on derivative instruments, including those that arise from coal deliveries related to contracts accounted for on an accrual basis under the normal purchases and normal sales exception. Therefore, the Company has elected the trading exemption surrounding disclosure of its coal trading activities.
|
Peabody Energy Corporation
|
2017 Form 10-K
|
F-
38
|
PEABODY ENERGY CORPORATION
NOTES TO CONSOLIDATED FINANCIAL STATEMENTS — (Continued)
Trading revenues recognized during the periods presented below were as follows:
|
|
Successor
|
Predecessor
|
|||||||||||||
|
Trading Revenues by Type of Instrument
|
April 2 through December 31, 2017
|
January 1 through April 1, 2017
|
Year Ended December 31, 2016
|
Year Ended December 31, 2015
|
|||||||||||
|
|
(Dollars in millions)
|
||||||||||||||
|
Futures, swaps and options
|
$
|
(37.7
|
)
|
$
|
(10.2
|
)
|
$
|
(66.5
|
)
|
$
|
107.3
|
|
|||
|
Physical purchase/sale contracts
|
71.3
|
|
25.2
|
|
95.4
|
|
(66.7
|
)
|
|||||||
|
Total trading revenues
|
$
|
33.6
|
|
$
|
15.0
|
|
$
|
28.9
|
|
$
|
40.6
|
|
|||
Offsetting and Balance Sheet Presentation
The Company’s coal trading assets and liabilities include financial instruments, such as swaps, futures and options, cleared through various exchanges, which involve the daily net settlement of open positions. The Company must post cash collateral in the form of initial margin, in addition to variation margin, on exchange-cleared positions that are in a net liability position and receives variation margin when in a net asset position. The Company also transacts in coal trading financial swaps and options through over-the-counter (OTC) markets with financial institutions and other non-financial trading entities under International Swaps and Derivatives Association (ISDA) Master Agreements, which contain symmetrical default provisions. Certain of the Company’s coal trading agreements with OTC counterparties also contain credit support provisions that may periodically require the Company to post, or entitle the Company to receive, variation margin. Physical coal and freight-related purchase and sale contracts included in the Company’s coal trading assets and liabilities are executed pursuant to master purchase and sale agreements that also contain symmetrical default provisions and allow for the netting and setoff of receivables and payables that arise during the same time period. The Company offsets its coal trading asset and liability derivative positions, and variation margin related to those positions, on a counterparty-by-counterparty basis in the consolidated balance sheets, with the fair values of those respective derivatives reflected in “Assets from coal trading activities, net” and “Liabilities from coal trading activities, net.”
The fair value of assets and liabilities from coal trading activities presented on a gross and net basis as of
December 31, 2017
and
2016
is set forth below:
|
Affected line item in the consolidated balance sheets
|
Gross Amounts of Recognized Assets (Liabilities)
|
Gross Amounts Offset in the Consolidated Balance Sheets
|
Variation margin posted
(1)
|
Net Amounts of Assets (Liabilities) Presented in the Consolidated Balance Sheets
|
||||||||||||
|
(Dollars in millions)
|
||||||||||||||||
|
Successor
|
||||||||||||||||
|
Fair Value as of December 31, 2017
|
||||||||||||||||
|
Assets from coal trading activities, net
|
$
|
77.1
|
|
$
|
(74.5
|
)
|
$
|
—
|
|
$
|
2.6
|
|
||||
|
Liabilities from coal trading activities, net
|
(122.0
|
)
|
74.5
|
|
35.8
|
|
(11.7
|
)
|
||||||||
|
Total, net
|
$
|
(44.9
|
)
|
$
|
—
|
|
$
|
35.8
|
|
$
|
(9.1
|
)
|
||||
|
Predecessor
|
||||||||||||||||
|
Fair Value as of December 31, 2016
|
||||||||||||||||
|
Assets from coal trading activities, net
|
$
|
191.2
|
|
$
|
(190.5
|
)
|
$
|
—
|
|
$
|
0.7
|
|
||||
|
Liabilities from coal trading activities, net
|
(249.1
|
)
|
190.5
|
|
57.4
|
|
(1.2
|
)
|
||||||||
|
Total, net
|
$
|
(57.9
|
)
|
$
|
—
|
|
$
|
57.4
|
|
$
|
(0.5
|
)
|
||||
|
(1)
|
None
of the net variation margin posted at December 31,
2017
and
2016
, respectively, related to cash flow hedges.
|
|
Peabody Energy Corporation
|
2017 Form 10-K
|
F-
39
|
PEABODY ENERGY CORPORATION
NOTES TO CONSOLIDATED FINANCIAL STATEMENTS — (Continued)
Fair Value Measurements
The following tables set forth the hierarchy of the Company’s net financial asset (liability) coal trading positions for which fair value is measured on a recurring basis as of
December 31, 2017
and
2016
:
|
Successor
|
|||||||||||||||
|
|
December 31, 2017
|
||||||||||||||
|
|
Level 1
|
Level 2
|
Level 3
|
Total
|
|||||||||||
|
|
(Dollars in millions)
|
||||||||||||||
|
Futures, swaps and options
|
$
|
(3.0
|
)
|
$
|
(4.2
|
)
|
$
|
—
|
|
$
|
(7.2
|
)
|
|||
|
Physical purchase/sale contracts
|
—
|
|
(1.9
|
)
|
—
|
|
(1.9
|
)
|
|||||||
|
Total net financial liabilities
|
$
|
(3.0
|
)
|
$
|
(6.1
|
)
|
$
|
—
|
|
$
|
(9.1
|
)
|
|||
|
Predecessor
|
|||||||||||||||
|
|
December 31, 2016
|
||||||||||||||
|
|
Level 1
|
Level 2
|
Level 3
|
Total
|
|||||||||||
|
|
(Dollars in millions)
|
||||||||||||||
|
Futures, swaps and options
|
$
|
—
|
|
$
|
(0.1
|
)
|
$
|
—
|
|
$
|
(0.1
|
)
|
|||
|
Physical purchase/sale contracts
|
—
|
|
0.7
|
|
(1.1
|
)
|
(0.4
|
)
|
|||||||
|
Total net financial assets (liabilities)
|
$
|
—
|
|
$
|
0.6
|
|
$
|
(1.1
|
)
|
$
|
(0.5
|
)
|
|||
For Level 1 and 2 financial assets and liabilities, the Company utilizes both direct and indirect observable price quotes, including U.S. interest rate curves; LIBOR yield curves; Chicago Mercantile Exchange (CME) Group, Intercontinental Exchange (ICE), Baltic Exchange and Singapore Exchange (SGX) contract prices; broker quotes; published indices and other market quotes. Below is a summary of the Company’s valuation techniques for Level 1 and 2 financial assets and liabilities:
|
•
|
Futures, swaps and options: generally valued based on unadjusted quoted prices in active markets (Level 1) or a valuation that is corroborated by the use of market-based pricing (Level 2) except when credit and non-performance risk is considered to be a significant input (greater than 10% of fair value), then the Company classifies as Level 3.
|
|
•
|
Physical purchase/sale contracts: purchases and sales at locations with significant market activity corroborated by market-based information (Level 2) except when credit and non-performance risk is considered to be a significant input (greater than 10% of fair value), then the Company classifies as Level 3.
|
Physical purchase/sale contracts include a credit valuation adjustment based on credit and non-performance risk (Level 3). The credit valuation adjustment has not historically had a material impact on the valuation of the contracts resulting in Level 2 classification. However, due to the Company’s corporate credit rating downgrades in 2016, the credit valuation adjustment as of December 31, 2016 is considered to be a significant unobservable input in the valuation of the contracts resulting in Level 3 classification. Upon emergence from the Chapter 11 Cases,
two
of the major rating agencies upgraded the Company’s corporate credit rating. With the credit rating upgrade, the credit valuation adjustment as of December 31, 2017 no longer has a material impact on the valuation of contracts and is in line with the Company’s historical range.
The Company’s risk management function, which is independent of the Company’s commercial trading function, is responsible for valuation policies and procedures, with oversight from executive management. Generally, the Company’s Level 3 instruments or contracts are valued using bid/ask price quotations and other market assessments obtained from multiple, independent third-party brokers or other transactional data incorporated into internally-generated discounted cash flow models. Decreases in the number of third-party brokers or market liquidity could erode the quality of market information and therefore the valuation of the Company’s market positions. The Company’s valuation techniques include basis adjustments to the foregoing price inputs for quality, such as sulfur and ash content, location differentials, expressed as port and freight costs, and credit risk. The Company’s risk management function independently validates the Company’s valuation inputs, including unobservable inputs, with third-party information and settlement prices from other sources where available. A daily process is performed to analyze market price changes and changes to the portfolio. Further periodic validation occurs at the time contracts are settled with the counterparty. These valuation techniques have been consistently applied in all periods presented, and the Company believes it has obtained the most accurate information available for the types of derivative contracts held.
|
Peabody Energy Corporation
|
2017 Form 10-K
|
F-
40
|
PEABODY ENERGY CORPORATION
NOTES TO CONSOLIDATED FINANCIAL STATEMENTS — (Continued)
Significant increases or decreases in the inputs in isolation could result in a significantly higher or lower fair value measurement. The unobservable inputs do not have a direct interrelationship; therefore, a change in one unobservable input would not necessarily correspond with a change in another unobservable input.
The following table summarizes the changes in the Company’s recurring Level 3 net financial liabilities:
|
|
Successor
|
Predecessor
|
||||||||||||
|
|
April 2 through December 31, 2017
|
January 1 through April 1, 2017
|
Year Ended December 31, 2016
|
Year Ended December 31, 2015
|
||||||||||
|
|
(Dollars in millions)
|
|||||||||||||
|
Beginning of period
|
$
|
(0.7
|
)
|
$
|
(1.1
|
)
|
$
|
(15.6
|
)
|
$
|
2.1
|
|
||
|
Transfers into Level 3
|
—
|
|
—
|
|
5.3
|
|
(4.4
|
)
|
||||||
|
Transfers out of Level 3
|
0.7
|
|
0.2
|
|
(0.4
|
)
|
—
|
|
||||||
|
Total gains realized/unrealized:
|
||||||||||||||
|
Included in earnings
|
—
|
|
0.2
|
|
(2.4
|
)
|
(10.1
|
)
|
||||||
|
Purchases
|
—
|
|
—
|
|
—
|
|
(0.5
|
)
|
||||||
|
Sales
|
—
|
|
—
|
|
—
|
|
(0.1
|
)
|
||||||
|
Settlements
|
—
|
|
—
|
|
12.0
|
|
(2.6
|
)
|
||||||
|
End of period
|
$
|
—
|
|
$
|
(0.7
|
)
|
$
|
(1.1
|
)
|
$
|
(15.6
|
)
|
||
The Company had no transfers between Levels 1 and 2 during any of the periods presented. Transfers of liabilities into/out of Level 3 from/to Level 2 during the periods presented were due to the relative value of unobservable inputs to the total fair value measurement of certain derivative contracts falling below, or in the case of transfers in, rising above, the 10% threshold. The Company’s policy is to value all transfers between levels using the beginning of period valuation.
The following table summarizes the changes in net unrealized gains (losses) relating to Level 3 net financial liabilities held both as of the beginning and the end of the period:
|
|
Successor
|
Predecessor
|
||||||||||||
|
|
April 2 through December 31, 2017
|
January 1 through April 1, 2017
|
Year Ended December 31, 2016
|
Year Ended December 31, 2015
|
||||||||||
|
|
(Dollars in millions)
|
|||||||||||||
|
Changes in unrealized gains (losses)
(1)
|
$
|
—
|
|
$
|
0.3
|
|
$
|
—
|
|
$
|
(6.2
|
)
|
||
|
(1)
|
Within the consolidated statements of operations and consolidated statements of comprehensive income for the periods presented, unrealized gains and losses from Level 3 items are combined with unrealized gains and losses on positions classified in Level 1 or 2, as well as other positions that have been realized during the applicable periods.
|
As of
December 31, 2017
, the majority of the estimated future realization of the value of the Company’s trading portfolio is expected to all be realized in
2018
.
Credit and Nonperformance Risk.
The fair value of the Company’s coal derivative assets and liabilities reflects adjustments for credit risk. The Company’s exposure is substantially with electric utilities, energy marketers, steel producers and nonfinancial trading houses. The Company’s policy is to independently evaluate each customer’s creditworthiness prior to entering into transactions and to regularly monitor the credit extended. If the Company engages in a transaction with a counterparty that does not meet its credit standards, the Company seeks to protect its position by requiring the counterparty to provide an appropriate credit enhancement. Also, when appropriate (as determined by its credit management function), the Company has taken steps to reduce its exposure to customers or counterparties whose credit has deteriorated and who may pose a higher risk of failure to perform under their contractual obligations. These steps include obtaining letters of credit or cash collateral (margin), requiring prepayments for shipments or the creation of customer trust accounts held for the Company’s benefit to serve as collateral in the event of a failure to pay or perform. To reduce its credit exposure related to trading and brokerage activities, the Company may seek to enter into netting agreements with counterparties that permit the Company to offset asset and liability positions with such counterparties and, to the extent required, the Company will post or receive margin amounts associated with exchange-cleared and certain OTC positions. The Company also continually monitors counterparty and contract non-performance risk, if present, on a case-by-case basis.
As of
December 31, 2017
,
71%
of the Company’s credit exposure related to coal trading activities was with investment grade counterparties and
29%
was with counterparties that are not rated.
|
Peabody Energy Corporation
|
2017 Form 10-K
|
F-
41
|
PEABODY ENERGY CORPORATION
NOTES TO CONSOLIDATED FINANCIAL STATEMENTS — (Continued)
Performance Assurances and Collateral
The Company is required to post variation margin on positions that are in a net liability position and is entitled to receive and hold variation margin on positions that are in a net asset position with an exchange and certain of its OTC derivative contract counterparties. The Company had posted
$35.8 million
and
$57.4 million
of net variation margin at December 31, 2017 and
December 31, 2016
, respectively.
In addition to the requirements surrounding variation margin, the Company is required by the exchanges upon which it transacts to post certain additional collateral, known as initial margin, which represents an estimate of potential future adverse price movements across the Company’s portfolio under normal market conditions. The Company posted initial margin of
$18.8 million
and
$16.2 million
as of December 31, 2017 and
December 31, 2016
, respectively, which is reflected in “Other current assets” in the consolidated balance sheets. As of
December 31, 2017
the Company was in receipt of
$1.8 million
of the required variation and initial margin, compared to December 31,
2016
when the Company had posted
$2.0 million
of margin in excess of the required variation and initial margin.
Certain of the Company’s derivative trading instruments require the parties to provide additional performance assurances whenever a material adverse event jeopardizes one party’s ability to perform under the instrument. If the Company was to sustain a material adverse event (using commercially reasonable standards), its counterparties could request collateralization on derivative trading instruments in net liability positions which, based on an aggregate fair value at
December 31, 2017
and
2016
, would have amounted to collateral postings to counterparties of approximately
$7.0 million
and
$2.0 million
, respectively. As of
December 31, 2017
, the Company was required to post approximately
$0.4 million
in collateral to counterparties for such positions. Approximately
$1.0 million
in collateral was required to be posted to counterparties as of
December 31, 2016
.
Certain of the Company’s other derivative trading instruments require the parties to provide additional performance assurances whenever a credit downgrade occurs below a certain level, as specified in each underlying contract. The terms of such derivative trading instruments typically require additional collateralization, which is commensurate with the severity of the credit downgrade. During the fourth quarter of
2017
,
one
major rating agency upgraded the Company’s corporate credit rating, thus improving the Company’s credit position with its counterparties. The Company’s collateral requirement owed to its counterparties for these ratings based derivative trading instruments for
December 31, 2017
remained at
zero
, consistent with
December 31, 2016
. As of
December 31, 2017
and
2016
,
no
collateral was posted to counterparties to support such derivative trading instruments.
|
Peabody Energy Corporation
|
2017 Form 10-K
|
F-
42
|
PEABODY ENERGY CORPORATION
NOTES TO CONSOLIDATED FINANCIAL STATEMENTS — (Continued)
|
(9)
|
Intangible Contract Assets and Liabilities
|
As described in Note 2. “Emergence from the Chapter 11 Cases and Fresh Start Reporting,” at the Effective Date, the Company recorded intangible assets of
$314.9 million
and liabilities of
$58.7 million
to reflect the inherent fair value of certain U.S. coal supply agreements as a result of favorable and unfavorable differences between contract terms and estimated market terms for the same coal products, and also recorded intangible liabilities of
$116.2 million
related to unutilized capacity under its port and rail take-or-pay contracts. The balances and respective balance sheet classifications of such assets and liabilities at December 31, 2017, net of accumulated amortization, are set forth in the following table:
|
Successor
|
|||||||||||
|
December 31, 2017
|
|||||||||||
|
(Dollars in millions)
|
|||||||||||
|
Assets
|
Liabilities
|
Net Total
|
|||||||||
|
Coal supply agreements
|
$
|
177.2
|
|
$
|
(42.7
|
)
|
$
|
134.5
|
|
||
|
Take-or-pay contracts
|
—
|
|
(106.1
|
)
|
(106.1
|
)
|
|||||
|
Total
|
$
|
177.2
|
|
$
|
(148.8
|
)
|
$
|
28.4
|
|
||
|
Balance sheet classification:
|
|||||||||||
|
Investments and other assets
|
$
|
177.2
|
|
$
|
—
|
|
$
|
177.2
|
|
||
|
Accounts payable and accrued expenses
|
—
|
|
(42.0
|
)
|
(42.0
|
)
|
|||||
|
Other noncurrent liabilities
|
—
|
|
(106.8
|
)
|
(106.8
|
)
|
|||||
|
Total
|
$
|
177.2
|
|
$
|
(148.8
|
)
|
$
|
28.4
|
|
||
Amortization of the intangible assets and liabilities related to coal supply agreements occurs ratably based upon coal volumes shipped per contract and is recorded as a component of “Depreciation, depletion and amortization” in the accompanying consolidated statements of operations. Such amortization amounted to
$121.3 million
during the Successor period April 2, 2017 through December 31, 2017. The Company anticipates net amortization of coal supply agreements, based upon expected future shipments, to be an expense of approximately
$100 million
,
$25 million
,
$7 million
,
$1 million
and
$1 million
for the years 2018 through 2022, respectively.
Future unutilized capacity and the amortization periods related to the take-or-pay contract intangible liabilities are based upon estimates of forecasted usage. Such amortization, which is classified as a reduction to “Operating costs and expenses” in the accompanying consolidated statements of operations, amounted to
$22.5 million
during the Successor period April 2, 2017 through December 31, 2017. The Company anticipates net amortization of take-or-pay contract intangible liabilities to be approximately
$30 million
,
$20 million
,
$10 million
,
$5 million
and
$5 million
, for the years 2018 through 2022, respectively.
(10) Property, Plant, Equipment and Mine Development
Property, plant, equipment and mine development, net, as of
December 31, 2017
and
December 31, 2016
consisted of the following:
|
Successor
|
Predecessor
|
|||||
|
December 31, 2017
|
December 31, 2016
|
|||||
|
(Dollars in millions)
|
||||||
|
Land and coal interests
|
$
|
3,890.5
|
|
$
|
10,330.8
|
|
|
Buildings and improvements
|
470.6
|
|
1,507.6
|
|
||
|
Machinery and equipment
|
1,149.3
|
|
2,130.2
|
|
||
|
Less: Accumulated depreciation, depletion and amortization
|
(398.5
|
)
|
(5,191.9
|
)
|
||
|
Property, plant, equipment and mine development, net
|
$
|
5,111.9
|
|
$
|
8,776.7
|
|
As more fully described in Note 2. “Emergence from the Chapter 11 Cases and Fresh Start Reporting,” all of the Company’s property, plant, equipment and mine development assets were adjusted to fair value upon emergence from the Chapter 11 Cases in connection with fresh start reporting.
|
Peabody Energy Corporation
|
2017 Form 10-K
|
F-
43
|
PEABODY ENERGY CORPORATION
NOTES TO CONSOLIDATED FINANCIAL STATEMENTS — (Continued)
Land and coal interests included coal reserves with a net book value of
$3.0 billion
and
$5.5 billion
as of December 31, 2017 and 2016, respectively. Such coal reserves were comprised of mineral rights for leased coal interests and advance royalties that had a net book value of
$2.0 billion
and
$4.4 billion
as of December 31, 2017 and 2016, respectively, and coal reserves held by fee ownership of
$1.0 billion
and
$1.1 billion
at
December 31, 2017
and 2016, respectively. The amount of coal reserves not subject to current depletion at properties where the Company was not currently engaged in mining operations or leasing to third parties was
$0.2 billion
and
$1.6 billion
as of
December 31, 2017
and 2016, respectively.
Land and coal interests also include acquired interests in mineral rights at certain Australian exploration properties that had a net book value of
$0.1 billion
and
$1.2 billion
as of
December 31, 2017
and 2016, respectively.
|
(11)
|
Income Taxes
|
As described in Note 2. “Emergence from the Chapter 11 Cases and Fresh Start Reporting”, the Plan provided that the Company’s pre-petition equity and certain obligations were canceled and extinguished and a significant portion of its long-term debt was discharged in exchange for new Common Stock and other consideration. Generally, absent an exception, for U.S. tax purposes a debtor recognizes cancellation of debt income (CODI) upon discharge of its outstanding indebtedness for an amount of consideration less than the adjusted issue price of such indebtedness. The Company excluded CODI with respect to the Plan from its taxable income in accordance with U.S. Internal Revenue Code (IRC) Section 108, which allows a taxpayer that is a debtor in a reorganization case to exclude CODI from taxable income if the discharge is granted by a bankruptcy court or pursuant to a plan of reorganization approved by a bankruptcy court. However, in such event, Section 108 requires a reduction in certain income tax attributes otherwise available to the taxpayer, in most cases by the amount of such CODI. Generally, the amount of CODI realized by a taxpayer is the adjusted issue price of any indebtedness discharged less the sum of (i) the amount of cash paid, (ii) the issue price of any new indebtedness issued and (iii) the fair market value of any consideration, including equity, issued to the creditors.
CODI from the discharge of indebtedness was
$8.5 billion
, of which,
$3.9 billion
related to third-party indebtedness. The additional
$4.6 billion
of CODI resulted from the restructuring of a foreign intercompany receivable as part of the Plan. A previous impairment of the same receivable resulted in a tax deduction which increased the Company’s federal net operating losses (NOLs) by
$4.6 billion
in 2017. The Company retains approximately
$3.6 billion
of gross U.S. federal NOLs,
$97.4 million
of general business credits (GBCs),
$91.3 million
of alternative minimum tax (AMT) credits, and
$262.0 million
of foreign tax credits (FTCs) after giving effect to such required reductions. Additionally, the Company’s tax basis in certain assets was reduced by
$587.0 million
and its capital loss carryovers were reduced by
$204.0 million
.
In connection with the Company’s emergence from bankruptcy, the Company experienced an “ownership change” as defined in U.S. IRC Section 382. As a result, the Company’s ability to use pre-ownership change NOLs, GBCs, AMT credits, FTCs and other tax attributes to offset future taxable income or taxes owed is limited. Under U.S. IRC Section 382 and Section 383, an entity that experiences an ownership change in bankruptcy generally is subject to an annual limitation (the Annual Limitation) on its use of its pre-ownership change NOLs and other tax attributes after the ownership change equal to the equity value of the entity immediately after implementation of the plan of reorganization (reflecting the increase, if any, in value resulting from the surrender or cancellation of any claims against the Company thereunder), multiplied by the long-term tax exempt rate posted by the Internal Revenue Service (IRS), subject to certain adjustments. A significant portion of the Company’s retained NOLs (stated above) are not subject to the Annual Limitation because they are deemed attributable to the period after the ownership change. The Company also had a net unrealized built-in gain at the time of the ownership change; therefore, certain built-in gains recognized within five years after the ownership change will increase the Annual Limitation for the five year recognition period beginning April 3, 2017 through April 2, 2022. The estimated Annual Limitation of
$62.0 million
, plus the estimated built-in gains recognized, will not prevent the usage of NOLs, GBCs and
$1.6 million
of FTCs, provided there is sufficient income in the carryforward period. The Company has written off
$260.4 million
of FTCs based on the Annual Limitation and their short remaining carryover period. The Company maintains a full valuation allowance against its U.S. net deferred tax assets.
Income (loss) from continuing operations before income taxes for the periods presented below consisted of the following:
|
|
Successor
|
Predecessor
|
||||||||||||
|
|
April 2 through December 31, 2017
|
January 1 through April 1, 2017
|
Year Ended December 31, 2016
|
Year Ended December 31, 2015
|
||||||||||
|
|
(Dollars in millions)
|
|||||||||||||
|
U.S.
|
$
|
10.4
|
|
$
|
2,408.7
|
|
$
|
(49.7
|
)
|
$
|
(515.9
|
)
|
||
|
Non-U.S.
|
541.7
|
|
(2,868.0
|
)
|
(708.6
|
)
|
(1,474.4
|
)
|
||||||
|
Total
|
$
|
552.1
|
|
$
|
(459.3
|
)
|
$
|
(758.3
|
)
|
$
|
(1,990.3
|
)
|
||
|
Peabody Energy Corporation
|
2017 Form 10-K
|
F-
44
|
PEABODY ENERGY CORPORATION
NOTES TO CONSOLIDATED FINANCIAL STATEMENTS — (Continued)
Total income tax benefit for the periods presented below consisted of the following:
|
|
Successor
|
Predecessor
|
||||||||||||
|
|
April 2 through December 31, 2017
|
January 1 through April 1, 2017
|
Year Ended December 31, 2016
|
Year Ended December 31, 2015
|
||||||||||
|
|
(Dollars in millions)
|
|||||||||||||
|
Current:
|
|
|
|
|
|
|
||||||||
|
U.S. federal
|
$
|
(101.4
|
)
|
$
|
(3.1
|
)
|
$
|
(12.4
|
)
|
$
|
(71.9
|
)
|
||
|
Non-U.S.
|
40.4
|
|
8.3
|
|
14.4
|
|
3.7
|
|
||||||
|
State
|
(0.4
|
)
|
(6.7
|
)
|
0.5
|
|
(0.6
|
)
|
||||||
|
Total current
|
(61.4
|
)
|
(1.5
|
)
|
2.5
|
|
(68.8
|
)
|
||||||
|
Deferred:
|
|
|
|
|
|
|
|
|
||||||
|
U.S. federal
|
(85.1
|
)
|
(101.0
|
)
|
(82.1
|
)
|
(117.4
|
)
|
||||||
|
Non-U.S.
|
(14.5
|
)
|
(160.4
|
)
|
(12.8
|
)
|
(15.0
|
)
|
||||||
|
State
|
—
|
|
(0.9
|
)
|
(2.1
|
)
|
(5.9
|
)
|
||||||
|
Total deferred
|
(99.6
|
)
|
(262.3
|
)
|
(97.0
|
)
|
(138.3
|
)
|
||||||
|
Total income tax benefit
|
$
|
(161.0
|
)
|
$
|
(263.8
|
)
|
$
|
(94.5
|
)
|
$
|
(207.1
|
)
|
||
The following is a reconciliation of the expected statutory federal income tax expense (benefit) to the Company’s income tax benefit for the periods presented below:
|
|
Successor
|
Predecessor
|
||||||||||||
|
|
April 2 through December 31, 2017
|
January 1 through April 1, 2017
|
Year Ended December 31, 2016
|
Year Ended December 31, 2015
|
||||||||||
|
|
(Dollars in millions)
|
|||||||||||||
|
Expected income tax expense (benefit) at U.S. federal statutory rate
|
$
|
193.2
|
|
$
|
(160.8
|
)
|
$
|
(265.4
|
)
|
$
|
(696.6
|
)
|
||
|
Changes in valuation allowance, income tax
|
(744.9
|
)
|
(777.2
|
)
|
2,453.9
|
|
452.9
|
|
||||||
|
Remeasurement due to the Tax Cuts and Jobs Act
|
473.5
|
|
—
|
|
—
|
|
—
|
|
||||||
|
Reorganization costs
|
—
|
|
2,130.0
|
|
29.6
|
|
—
|
|
||||||
|
Bad debt deduction
|
—
|
|
(1,639.6
|
)
|
—
|
|
—
|
|
||||||
|
Worthless partnership
|
—
|
|
—
|
|
(2,204.4
|
)
|
—
|
|
||||||
|
Changes in tax reserves
|
7.2
|
|
(9.2
|
)
|
2.3
|
|
(21.4
|
)
|
||||||
|
Excess depletion
|
(40.4
|
)
|
(11.2
|
)
|
(37.2
|
)
|
(53.7
|
)
|
||||||
|
Foreign earnings provision differential
|
(26.3
|
)
|
158.2
|
|
27.5
|
|
146.5
|
|
||||||
|
General business tax credits
|
(0.2
|
)
|
(0.1
|
)
|
(14.2
|
)
|
(15.7
|
)
|
||||||
|
Remeasurement of foreign income tax accounts
|
(0.3
|
)
|
9.4
|
|
(2.0
|
)
|
(22.1
|
)
|
||||||
|
State income taxes, net of federal tax benefit
|
(3.1
|
)
|
40.6
|
|
(90.2
|
)
|
(20.1
|
)
|
||||||
|
Other, net
|
(19.7
|
)
|
(3.9
|
)
|
5.6
|
|
23.1
|
|
||||||
|
Total income tax benefit
|
$
|
(161.0
|
)
|
$
|
(263.8
|
)
|
$
|
(94.5
|
)
|
$
|
(207.1
|
)
|
||
Certain reconciliation items included in the above table exclude the remeasurement of foreign income tax accounts as these foreign currency effects are separately presented.
|
Peabody Energy Corporation
|
2017 Form 10-K
|
F-
45
|
PEABODY ENERGY CORPORATION
NOTES TO CONSOLIDATED FINANCIAL STATEMENTS — (Continued)
On December 22, 2017, the Tax Cuts and Jobs Act of 2017 (the Act) was signed into law making significant changes to the IRC. Key provisions of the Act that impact the Company include: (i) reduction of the U.S. federal corporate tax rate from
35%
to
21%
, (ii) repeal of the corporate AMT system, (iii) replacement of the worldwide taxation system with a territorial tax system which exempts certain foreign operations from U.S. taxation and includes a one-time deemed repatriation tax on deferred foreign earnings, (iv) further limitation on the deductibility of certain executive compensation and (v) allowance for immediate capital expensing of certain qualified property. Other provisions of the Act that do not have a current impact but could impact the Company in the future include: (i) creation of a new minimum tax on global intangible low-taxed income (GILTI), (ii) creation of a new base erosion anti-abuse tax (Base Erosion), (iii) repeal of the domestic production deductions, (iv) limitation on the deduction for net interest expense incurred by a U.S. corporation and (v) modification and/or repeal of a number of other international provisions.
The Company has completed its assessment for the income tax effects of the Act for the following item:
|
•
|
One-time tax on deferred foreign earnings: The Company does not have any undistributed earnings from its foreign subsidiaries and is not impacted by the one-time transition tax.
|
The Company has not completed its assessment for the income tax effects of the Act but has recorded a reasonable estimate of the effects for the items below. The Company anticipates completing the analysis for the estimate by December 31, 2018, within the one year measurement period, for the following items:
|
•
|
Repeal of the corporate AMT system: Existing AMT credits as of December 31, 2017 will be refunded over the next four years. The refund may or may not be subject to an IRS budget sequestration reduction rate of approximately
7%
. The Company has determined that it will receive a refund of existing AMT credits of approximately
$84.9 million
after an estimated sequestration reduction of
$6.4 million
. The valuation allowance previously recorded against these credits has been released and a tax benefit of
$84.9 million
was recorded as a component of income tax expense from continuing operations. The Company’s accounting policy regarding the balance sheet presentation of the credits is to continue to reflect the balance as a deferred tax asset until a return is filed claiming the credit, at which time the amount will be presented as a tax receivable.
|
|
•
|
Remeasurement of deferred tax assets and liabilities: Deferred tax assets and liabilities attributable to the U.S. were remeasured from
35%
to the reduced tax rate of
21%
. The Company recorded a provision amount of
$473.5 million
and an offsetting valuation allowance adjustment for the remeasurement. The Company is still analyzing certain aspects of the Act and refining the calculation, which could potentially affect the measurement of these balances. Filing of both U.S. and foreign tax returns for the 2017 tax years is required to complete the analysis.
|
|
•
|
Elimination of executive compensation exemptions: The Act made major changes to the
$1 million
limit on deductible compensation paid to certain “covered” employees. The Act eliminated exemptions for qualified performance based compensation and compensation paid after termination and expanded the number of employees to which the limit applies. The Company recorded a provisional amount of
$0.5 million
and an offsetting valuation allowance adjustment for the impact of these changes. This amount is equal to the elimination of deferred tax assets associated with deferred compensation amounts that will likely exceed the
$1 million
limit when paid. The Act contains transitional rules, the implementation of which is not entirely clear at this time. The Company is still analyzing related aspects of the Act including the impact of the transitional rules. The provisional amount detailed above may change when further guidance is released that addresses these rules.
|
The Company has not completed its assessment for the income tax effects of the Act and is unable to calculate a reasonable estimate of such effect for the item below. The Company anticipates completing the analysis for this item by December 31, 2018, within the one year measurement period:
|
•
|
Changes to international taxation: The Act modifies various aspects of international taxation and the application of these changes to the current foreign tax credit system is unclear. These rules are complex and require further clarity through the issuance of regulations and final technical interpretation. The Company has a deferred tax asset of
$1.6 million
relating to FTCs that carry a full valuation allowance. Depending on the final interpretation of the new Act, it may be more likely than not that realization of a portion of the credits may occur. The Company has determined that a reasonable estimate cannot be made at this time. Information needed to complete the analysis is as follows: (i) final technical analysis of the new tax law and (ii) finalization of necessary calculations, including an assessment on how these new provisions will impact the utilization of these credits in the future.
|
|
Peabody Energy Corporation
|
2017 Form 10-K
|
F-
46
|
PEABODY ENERGY CORPORATION
NOTES TO CONSOLIDATED FINANCIAL STATEMENTS — (Continued)
The tax effects of temporary differences that gave rise to significant portions of the deferred tax assets and liabilities as of
December 31, 2017
and
2016
consisted of the following:
|
|
Successor
|
Predecessor
|
||||
|
|
December 31, 2017
|
December 31, 2016
|
||||
|
|
(Dollars in millions)
|
|||||
|
Deferred tax assets:
|
|
|
|
|
||
|
Tax loss carryforwards and credits
|
$
|
2,068.0
|
|
$
|
4,284.4
|
|
|
Property, plant, equipment and mine development, principally due to differences in depreciation, depletion and asset impairments
|
463.8
|
|
424.4
|
|
||
|
Accrued postretirement benefit obligations
|
194.2
|
|
364.5
|
|
||
|
Asset retirement obligations
|
30.6
|
|
163.6
|
|
||
|
Financial guarantees
|
2.0
|
|
77.9
|
|
||
|
Employee benefits
|
25.3
|
|
57.0
|
|
||
|
Take or pay obligations
|
27.2
|
|
—
|
|
||
|
Hedge activities
|
10.5
|
|
21.0
|
|
||
|
Investments and other assets
|
137.2
|
|
—
|
|
||
|
Workers’ compensation obligations
|
6.4
|
|
7.5
|
|
||
|
Other
|
16.1
|
|
2.1
|
|
||
|
Total gross deferred tax assets
|
2,981.3
|
|
5,402.4
|
|
||
|
Valuation allowance, income tax
|
(2,432.5
|
)
|
(4,037.5
|
)
|
||
|
Total deferred tax assets
|
548.8
|
|
1,364.9
|
|
||
|
Deferred tax liabilities:
|
|
|
|
|
||
|
Property, plant, equipment and mine development, principally due to differences in depreciation, depletion and asset impairments
|
353.3
|
|
1,324.8
|
|
||
|
Unamortized discount on Convertible Junior Subordinated Debentures
|
—
|
|
127.7
|
|
||
|
Coal supply agreements
|
29.6
|
|
—
|
|
||
|
Investments and other assets
|
85.7
|
|
86.3
|
|
||
|
Total deferred tax liabilities
|
468.6
|
|
1,538.8
|
|
||
|
Net deferred tax asset (liability)
|
$
|
80.2
|
|
$
|
(173.9
|
)
|
|
Deferred taxes are classified as follows:
|
|
|
|
|
||
|
Noncurrent deferred income tax asset
|
$
|
85.6
|
|
$
|
—
|
|
|
Noncurrent deferred income tax liability
|
(5.4
|
)
|
(173.9
|
)
|
||
|
Net deferred tax asset (liability)
|
$
|
80.2
|
|
$
|
(173.9
|
)
|
The Company’s tax loss carryforwards and credits included gross federal NOL carryforwards of
$3.6 billion
, state NOL carryforwards of
$97.0 million
, FTCs of
$1.6 million
, U.S. AMT credits of
$91.3 million
, tax GBCs of
$97.4 million
, charitable contribution carryforwards of
$2.7 million
and foreign NOL carryforwards of
$1,021.3 million
as of December 31, 2017. The AMT credits and foreign NOLs have no expiration date. The federal NOLs begin to expire in 2036. The state NOLs begin to expire in 2018. The FTCs and GBCs begin to expire in 2025 and 2027, respectively.
In assessing the near-term use of NOLs and tax credits and corresponding valuation allowance adjustments, the Company evaluated the expected level of future taxable income, available tax planning strategies, reversals of existing taxable temporary differences and taxable income in carryback years. For the year ended
December 31, 2017
, the Company continued to record valuation allowance of
$2.4 billion
against net deferred tax asset positions, comprised primarily of
$0.9 billion
in the U.S. and
$1.5 billion
in Australia. Recognition of those valuation allowances was driven by recent cumulative book losses, as determined by considering all sources of available income (including items classified as discontinued operations or recorded directly to “Accumulated other comprehensive income (loss)”), which limited the Company’s ability to look to future taxable income in assessing the realizability of the related assets.
|
Peabody Energy Corporation
|
2017 Form 10-K
|
F-
47
|
PEABODY ENERGY CORPORATION
NOTES TO CONSOLIDATED FINANCIAL STATEMENTS — (Continued)
Unrecognized Tax Benefits
Net unrecognized tax benefits (excluding interest and penalties) were recorded as follows in the consolidated balance sheets as of
December 31, 2017
and
2016
:
|
|
Successor
|
Predecessor
|
||||
|
|
December 31, 2017
|
December 31, 2016
|
||||
|
(Dollars in millions)
|
||||||
|
Deferred income taxes
|
$
|
10.9
|
|
$
|
8.9
|
|
|
Other noncurrent liabilities
|
1.8
|
|
11.2
|
|
||
|
Net unrecognized tax benefits
|
$
|
12.7
|
|
$
|
20.1
|
|
|
Gross unrecognized tax benefits
|
$
|
12.7
|
|
$
|
20.1
|
|
The amount of the Company’s gross unrecognized tax benefits decreased by
$7.4 million
since January 1, 2017 due to adjustments to existing positions as part of fresh start reporting, finalization settlement of state audits and additions for current positions. The amount of the net unrecognized tax benefits that, if recognized, would directly affect the effective tax rate was
$12.7 million
and
$20.1 million
at
December 31, 2017
and
2016
, respectively. A reconciliation of the beginning and ending amount of gross unrecognized tax benefits for the periods presented below is as follows:
|
|
Successor
|
Predecessor
|
||||||||||||
|
|
April 2 through December 31, 2017
|
January 1 through April 1, 2017
|
Year Ended December 31, 2016
|
Year Ended December 31, 2015
|
||||||||||
|
(Dollars in millions)
|
||||||||||||||
|
Balance at beginning of period
|
$
|
12.5
|
|
$
|
20.1
|
|
$
|
22.9
|
|
$
|
44.5
|
|
||
|
Additions for current year tax positions
|
0.8
|
|
—
|
|
1.5
|
|
2.3
|
|
||||||
|
Reductions for prior year tax positions
|
(0.5
|
)
|
(7.6
|
)
|
(2.8
|
)
|
(23.5
|
)
|
||||||
|
Reductions for settlements with tax authorities
|
(0.1
|
)
|
—
|
|
(1.5
|
)
|
(0.4
|
)
|
||||||
|
Balance at end of period
|
$
|
12.7
|
|
$
|
12.5
|
|
$
|
20.1
|
|
|
$
|
22.9
|
|
|
The Company recognizes interest and penalties related to unrecognized tax benefits in its income tax provision. The Company recorded
$4.8 million
of gross interest and penalties for the Successor period April 2 through December 31, 2017 and reversed gross interest and penalties of
$2.1 million
,
$0.4 million
and
$2.1 million
for the Predecessor period January 1 through April 1, 2017 and the years ended
December 31, 2016
and
2015
, respectively. The Company had
$5.0 million
and
$2.4 million
of accrued gross interest and penalties related to unrecognized tax benefits at December 31, 2017 and 2016, respectively.
The Company expects that during the next twelve months it is reasonably possible for a
$0.5 million
decrease in its net unrecognized tax benefits due to potential audit settlements and the expiration of statutes of limitations.
Tax Returns Subject to Examination
The Company’s federal income tax returns for the 2014 and 2016 tax years are subject to potential examinations by the IRS. The Company’s state income tax returns for the tax years 1999 and thereafter remain potentially subject to examination by various state taxing authorities due to NOL carryforwards. Australian income tax returns for tax years 2013 through 2016 continue to be subject to potential examinations by the Australian Taxation Office (ATO).
Foreign Earnings
As of December 31, 2017, the Company has a consolidated earnings deficit outside the U.S. but with some immaterial unremitted earnings in certain jurisdictions. The Company continues to be permanently reinvested with respect to its current and historical earnings. However, when appropriate, the Company has the ability to access foreign cash without incurring residual cash taxes due to the existence of NOLs.
|
Peabody Energy Corporation
|
2017 Form 10-K
|
F-
48
|
PEABODY ENERGY CORPORATION
NOTES TO CONSOLIDATED FINANCIAL STATEMENTS — (Continued)
Tax Payments and Refunds
The following table summarizes the Company’s income tax (refunds) payments, net for the periods presented below:
|
|
Successor
|
Predecessor
|
||||||||||||
|
|
April 2 through December 31, 2017
|
January 1 through April 1, 2017
|
Year Ended December 31, 2016
|
Year Ended December 31, 2015
|
||||||||||
|
|
(Dollars in millions)
|
|||||||||||||
|
U.S. — federal
|
$
|
(11.2
|
)
|
$
|
—
|
|
$
|
(56.5
|
)
|
$
|
(38.1
|
)
|
||
|
U.S. — state and local
|
—
|
|
—
|
|
1.4
|
|
0.4
|
|
||||||
|
Non-U.S.
|
10.4
|
|
5.5
|
|
15.0
|
|
11.9
|
|
||||||
|
Total income tax (refunds) payments, net
|
$
|
(0.8
|
)
|
$
|
5.5
|
|
$
|
(40.1
|
)
|
$
|
(25.8
|
)
|
||
|
(12)
|
Accounts Payable and Accrued Expenses
|
Accounts payable and accrued expenses consisted of the following:
|
|
Successor
|
Predecessor
|
||||
|
|
December 31, 2017
|
December 31, 2016
|
||||
|
|
(Dollars in millions)
|
|||||
|
Trade accounts payable
|
$
|
388.0
|
|
$
|
288.6
|
|
|
Accrued payroll and related benefits
|
239.7
|
|
201.2
|
|
||
|
Other accrued expenses
|
225.3
|
|
190.1
|
|
||
|
Accrued taxes other than income
|
111.7
|
|
119.6
|
|
||
|
Accrued royalties
|
67.4
|
|
62.8
|
|
||
|
Asset retirement obligations
|
34.1
|
|
41.0
|
|
||
|
Income taxes payable
|
20.6
|
|
6.2
|
|
||
|
Accrued interest
|
15.5
|
|
1.2
|
|
||
|
Accrued health care insurance
|
10.6
|
|
16.0
|
|
||
|
Workers’ compensation obligations
|
7.6
|
|
7.8
|
|
||
|
Liabilities associated with discontinued operations
|
70.6
|
|
55.9
|
|
||
|
Accounts payable and accrued expenses
|
$
|
1,191.1
|
|
$
|
990.4
|
|
|
Peabody Energy Corporation
|
2017 Form 10-K
|
F-
49
|
PEABODY ENERGY CORPORATION
NOTES TO CONSOLIDATED FINANCIAL STATEMENTS — (Continued)
|
(13)
|
|
The Company’s total indebtedness as of
December 31, 2017
and
2016
consisted of the following:
|
|
Successor
|
Predecessor
|
||||
|
|
December 31, 2017
|
December 31, 2016
|
||||
|
|
(Dollars in millions)
|
|||||
|
6.00% Senior Secured Notes due March 2022
|
$
|
500.0
|
|
$
|
—
|
|
|
6.375% Senior Secured Notes due March 2025
|
500.0
|
|
—
|
|
||
|
Senior Secured Term Loan due 2022, net of original issue discount
|
444.2
|
|
—
|
|
||
|
2013 Revolver
|
—
|
|
1,558.1
|
|
||
|
2013 Term Loan Facility due September 2020
|
—
|
|
1,162.3
|
|
||
|
6.00% Senior Notes due November 2018
|
—
|
|
1,518.8
|
|
||
|
6.50% Senior Notes due September 2020
|
—
|
|
650.0
|
|
||
|
6.25% Senior Notes due November 2021
|
—
|
|
1,339.6
|
|
||
|
10.00% Senior Secured Second Lien Notes due March 2022
|
—
|
|
979.4
|
|
||
|
7.875% Senior Notes due November 2026
|
—
|
|
247.8
|
|
||
|
Convertible Junior Subordinated Debentures due December 2066
|
—
|
|
386.1
|
|
||
|
Capital lease and other obligations
|
76.0
|
|
20.1
|
|
||
|
Less: Debt issuance costs
|
(59.4
|
)
|
(70.8
|
)
|
||
|
1,460.8
|
|
7,791.4
|
|
|||
|
Less: Current portion of long-term debt
|
42.1
|
|
20.2
|
|
||
|
Less: Liabilities subject to compromise
|
—
|
|
7,771.2
|
|
||
|
Long-term debt
|
$
|
1,418.7
|
|
$
|
—
|
|
As more fully described in Note 2. “Emergence from the Chapter 11 Cases and Fresh Start Reporting”, on the Effective Date, all of the debt instruments associated with the Predecessor indebtedness included in the above table, with the exception of “Capital lease and other obligations”, were canceled and the debt obligations discharged. In accordance with the Plan, the Company was concurrently recapitalized with new debt and equity instruments, including the
6.000%
Senior Secured Notes due March 2022, the
6.375%
Senior Secured Notes due March 2025, and the Senior Secured Term Loan due 2022, included with the Successor obligations in the above table.
In connection with the Chapter 11 Cases, the Company was required to pay monthly adequate protection payments to certain first lien creditors in accordance with the rates defined in its existing prepetition credit facility which included the 2013 Revolver and the 2013 Term Loan Facility due September 2020. The adequate protection payments were recorded as “Interest expense” in the consolidated statement of operations, which totaled
$29.8 million
during the Predecessor period
January 1 through April 1, 2017
.
For the remaining non-first lien Predecessor indebtedness included in the table above, with the exception of capital lease and other obligations, the Company did not record interest expense subsequent to the filing of the Bankruptcy Petitions. The amount of contractual interest for such obligations which was automatically stayed in accordance with Section 502(b)(2) of the Bankruptcy Code was
$92.9 million
for the period January 1, 2017 through the Effective Date.
6.00% and 6.375% Senior Secured Notes (collectively, the Successor Notes)
The Successor Notes were issued at par value. The Company paid aggregate debt issuance costs of
$49.5 million
related to the offering, which will be amortized over the respective terms of the Successor Notes.
Interest payments on the Successor Notes are scheduled to occur each year on March 31st and September 30th until maturity. During the Successor period
April 2 through December 31, 2017
, the Company recorded interest expense of
$45.7 million
related to the Successor Notes.
|
Peabody Energy Corporation
|
2017 Form 10-K
|
F-
50
|
PEABODY ENERGY CORPORATION
NOTES TO CONSOLIDATED FINANCIAL STATEMENTS — (Continued)
The Company may redeem the
6.00%
Senior Secured Notes due March 2022, in whole or in part, beginning in 2019 at
103.0%
of par, in 2020 at
101.5%
of par and in 2021 and thereafter at par. The
6.375%
Senior Secured Notes due March 2025 may be redeemed, in whole or in part, beginning in 2020 at
104.8%
of par, in 2021 at
103.2%
of par, in 2022 at
101.6%
of par and in 2023 and thereafter at par. In addition, prior to the first date on which the Successor Notes are redeemable at the redemption prices noted above, the Company may also redeem some or all of the Successor Notes at a calculated make-whole premium, plus accrued and unpaid interest.
The indenture underlying the Successor Notes (Indenture) contains customary conditions of default and imposes certain restrictions on the Company’s activities, including its ability to incur debt, incur liens, make investments, engage in fundamental changes such as mergers and dissolutions, dispose of assets, enter into transactions with affiliates and make certain restricted payments, such as cash dividends and share repurchases.
The Successor Notes rank senior in right of payment to any subordinated indebtedness and equally in right of payment with any senior indebtedness to the extent of the collateral securing that indebtedness. The Successor Notes are jointly and severally and fully and unconditionally guaranteed on a senior secured basis by substantially all of the Company’s material domestic subsidiaries and secured by first priority liens over (1) substantially all of the assets of the Company and the guarantors, except for certain excluded assets, (2)
100%
of the capital stock of each domestic restricted subsidiary of the Company, (3)
100%
of the non-voting capital stock of each first tier foreign subsidiary of the Company or a foreign subsidiary holding company and no more than
65%
of the voting capital stock of each first tier foreign subsidiary of the Company or a foreign subsidiary holding company, (4) a legal charge of
65%
of the voting capital stock and
100%
of the non-voting capital stock of Peabody Investments (Gibraltar) Limited and (5) all intercompany debt owed to the Company or any guarantor, in each case, subject to certain exceptions. The obligations under the Successor Notes are secured on a
pari passu
basis by the same collateral securing the Successor Credit Agreement, subject to certain exceptions.
Successor Credit Agreement
Following the prepayments described below, the Successor Credit Agreement provides for a
$450.0 million
first lien senior secured term loan (the Senior Secured Term Loan), which currently bears interest at LIBOR plus
3.50%
per annum with a
1.00%
LIBOR floor. During the Successor period
April 2 through December 31, 2017
, the Company recorded interest expense of
$34.9 million
related to the Senior Secured Term Loan.
Proceeds from the Senior Secured Term Loan were received net of an original issue discount and deferred financing costs of
$37.3 million
that will be amortized over its
five
-year term. The loan principal is due in March 2022. The loan principal is voluntarily prepayable at
101%
of the principal amount repaid if voluntarily prepaid prior to March 18, 2018 (subject to certain exceptions, including prepayments made with internally generated cash) and is voluntarily prepayable at any time thereafter without premium or penalty. The Senior Secured Term Loan may require mandatory principal prepayments of
75%
of Excess Cash Flow (as defined in the Successor Credit Agreement) for any fiscal year (commencing with the fiscal year ended December 31, 2018). The mandatory principal prepayment requirement is (i)
50%
of Excess Cash Flow if the Company’s Total Leverage Ratio (as defined in the Successor Credit Agreement and calculated as of December 31) is less than or equal to
2.00
:1.00 and greater than
1.50
:1.00, (ii)
25%
of Excess Cash Flow if the Company’s Total Leverage Ratio is less than or equal to
1.50
:1.00 and greater than
1.00
:1.00, or (iii)
zero
if the Company’s Total Leverage Ratio is less than or equal to
1.00
:1.00. If required, mandatory prepayments resulting from Excess Cash Flows are payable within
100
days after the end of each fiscal year. In certain circumstances, the Senior Secured Term Loan also requires that Excess Proceeds (as defined in the Successor Credit Agreement) of
$10.0 million
or greater from sales of Company assets be applied against the loan principal, unless such proceeds are reinvested within one year.
Under the Successor Credit Agreement, the Company’s annual capital expenditures are limited to
$220.0 million
,
$250.0 million
,
$250.0 million
, and
$300.0 million
from 2018 through 2021, respectively, subject to certain carryforward, carryback and other provisions. The agreement contains customary conditions of default and imposes certain restrictions on the Company’s activities, including its ability to incur liens, incur debt, make investments, engage in fundamental changes such as mergers and dissolutions, dispose of assets, enter into transactions with affiliates, and make certain restricted payments, such as cash dividends and share repurchases.
Obligations under the Successor Credit Agreement are secured on a
pari passu
basis by the same collateral securing the Successor Notes.
|
Peabody Energy Corporation
|
2017 Form 10-K
|
F-
51
|
PEABODY ENERGY CORPORATION
NOTES TO CONSOLIDATED FINANCIAL STATEMENTS — (Continued)
The Company voluntarily prepaid
$500.0 million
of the original
$950.0
loan principal amount on the Senior Secured Term Loan in
$150.0 million
installments on July 31, 2017 and September 11, 2017 and a
$200.0 million
installment on December 29, 2017. On September 18, 2017, the Company entered into an amendment to the Successor Credit Agreement (the Amendment) which lowered the interest rate from LIBOR plus
4.50%
per annum with a
1.00%
LIBOR floor to LIBOR plus
3.50%
per annum with a
1.00%
LIBOR floor. The Amendment permitted the Company to add an incremental revolving credit facility in addition to the Company’s ability to add one or more incremental term loan facilities under the Successor Credit Agreement. The incremental revolving credit facility and/or incremental term loan facilities can be in an aggregate principal amount of up to
$350.0 million
plus additional amounts so long as the Company is below Total Leverage Ratio requirements as set forth in the Successor Credit Agreement. The Amendment also made available an additional restricted payment basket that permits additional repurchases, dividends or other distributions with respect to the Company’s Common and Preferred Stock in an aggregate amount up to
$450.0 million
so long as the Company’s Fixed Charge Coverage Ratio (as defined in the Successor Credit Agreement) would not exceed
2.00
:1.00 on a pro forma basis.
During the fourth quarter of 2017, the Company entered into the incremental revolving credit facility (the Revolver) for an aggregate commitment of
$350.0 million
for general corporate purposes. The Company paid aggregate debt issuance costs of
$4.7 million
. The Revolver matures in November 2020 and permits loans which bear interest at LIBOR plus
3.25%
. The Revolver is subject to a
2.00
:1.00 Total Leverage Ratio requirement, modified to limit unrestricted cash netting to
$800.0 million
. Capacity under the Revolver may also be utilized for letters of credit which incur combined fees of
3.375%
per annum. Unused capacity under the Revolver bears a commitment fee of
0.5%
per annum. As of December 31, 2017, the Revolver had only been drawn upon for letters of credit amounting to
$156.2 million
. Such letters of credit were primarily in support of the Company’s reclamation obligations, as further described in Note 24. “Financial Instruments, Guarantees With Off-Balance-Sheet Risk and Other Guarantees.”
The voluntary prepayments of
$500.0 million
were accounted for as a partial debt extinguishment and accordingly, a pro rata portion of debt issuance costs and original issue discount of
$19.0 million
was charged to “Loss on early debt extinguishment” in the accompanying consolidated statements of operations during the Successor period April 2 through December 31, 2017. The Amendment was accounted for partially as a debt modification and partially as an extinguishment, the latter of which relating to certain lenders no longer participating in the Senior Secured Term Loan syndicate subsequent to the Amendment. As a result, the Company charged an additional pro rata portion of debt issuance costs and original issue discount of
$1.9 million
to “Loss on early debt extinguishment” in the accompanying consolidated statements of operations during the Successor period of
April 2 through December 31, 2017
. The Company also recorded
$6.1 million
of deferred financing costs paid to the remaining lenders and expensed
$2.0 million
of other fees associated with the Amendment to “Interest expense” in the accompanying consolidated statements of operations during the Successor period of
April 2 through December 31, 2017
.
Restricted Payments Under the Successor Notes and Successor Credit Agreement
In addition to the
$450.0 million
restricted payment basket provided for under the Amendment, the Indenture and the Successor Credit Agreement allow for
$50.0 million
of otherwise restricted payments. Additive to this general limit are certain “builder basket” provisions that may increase the amount of allowable restricted payments, as calculated periodically based upon the Company’s operating performance. Beginning on January 1, 2018, the payment of dividends and purchases of the Company’s Common Stock are permitted under additional provisions in the Indenture and the Successor Credit Agreement in an aggregate amount in any calendar year not to exceed
$25.0 million
, so long as the Company’s Total Leverage Ratio would not exceed
1.25
:1.00 on a pro forma basis. During the Successor period of
April 2 through December 31, 2017
, the Company made repurchases of its Common Stock, as described in Note 21. “Resource Management and Other Commercial Events”.
Capital Lease Obligations
Refer to Note 14. “Leases” for additional information associated with the Company’s capital leases, which pertain to the financing of mining equipment used in operations.
|
Peabody Energy Corporation
|
2017 Form 10-K
|
F-
52
|
PEABODY ENERGY CORPORATION
NOTES TO CONSOLIDATED FINANCIAL STATEMENTS — (Continued)
|
(14)
|
Leases
|
The Company leases equipment and facilities under various non-cancellable lease agreements and historically, the majority of the Company’s leases have been accounted for as operating leases. Certain lease agreements are subject to the restrictive covenants of the Company’s credit facilities and include cross-acceleration provisions, under which the lessor could require certain remedies including, but not limited to, immediate recovery of the present value of any remaining lease payments. During the Chapter 11 Cases, the Company amended and assumed certain leases and made lump sum payments to terminate certain other leases. In relation to the Company's non-Debtor subsidiaries, the Company successfully negotiated standstill agreements during the Chapter 11 Cases and successfully amended the leases, with those amendments becoming effective upon emergence from the Chapter 11 Cases. Certain of these amendments resulted in new lease agreements which are being accounted for as capital leases with an initial aggregate obligation of approximately
$79.9 million
.
Rental expense under operating leases, including expense related to short-term operating leases, was
$146.3 million
for the Successor period
April 2 through December 31, 2017
and
$57.6 million
,
$264.7 million
and
$290.1 million
for the Predecessor period
January 1 through April 1, 2017
and the years ended
December 31, 2016
and
2015
, respectively. One of the Company’s operating lease agreements for underground mining equipment in Australia entered into in 2013 requires contingent rent to be paid only if and when certain coal is mined at a specified margin as defined in the agreements. There was
no
contingent expense related to that arrangement for the Successor period
April 2 through December 31, 2017
or the Predecessor period
January 1 through April 1, 2017
and the years ended
December 31, 2016
and
2015
. The gross book value of property, plant, and equipment under capital leases was
$125.3 million
and
$77.9 million
as of
December 31, 2017
and
2016
, respectively, related primarily to the leasing of mining equipment. The accumulated depreciation for these items was
$20.6 million
and
$48.6 million
at
December 31, 2017
and
2016
, respectively, and changes thereto have been included in “Depreciation, depletion and amortization” in the consolidated statements of operations.
The Company also leases coal reserves under agreements that require royalties to be paid as the coal is mined. Certain agreements also require minimum annual royalties to be paid regardless of the amount of coal mined during the year. Total royalty expense was
$364.6 million
for the Successor period
April 2 through December 31, 2017
and
$115.2 million
,
$389.7 million
and
$444.5 million
for the Predecessor period
January 1 through April 1, 2017
and the years ended
December 31, 2016
and
2015
, respectively.
A substantial amount of the coal mined by the Company is produced from mineral reserves leased from the owner. One of the major lessors is the U.S. government, from which the Company leases substantially all of the coal it mines in Wyoming under terms set by Congress and administered by the U.S. Bureau of Land Management. These leases are generally for an initial term of
ten years
but may be extended by diligent development and mining of the reserves until all economically recoverable reserves are depleted. The Company has met the diligent development requirements for substantially all of these federal leases either directly through production, by including the lease as a part of a logical mining unit with other leases upon which development has occurred, or by paying an advance royalty in lieu of continued operations. Annual production on these federal leases must total at least
1.0%
of the leased reserve or the original amount of coal in the entire logical mining unit in which the leased reserve resides. During 2016, the Company completed substantially all of its required lease payments under U.S. federal coal reserve leases with the U.S. Bureau of Land Management. In addition, royalties are payable monthly at a rate of
12.5%
of the gross realization from the sale of the coal mined using surface mining methods and at a rate of
8.0%
of the gross realization for coal produced using underground mining methods.
The Company also leases coal reserves in Arizona from The Navajo Nation and the Hopi Tribe under leases that are administered by the U.S. Department of the Interior. These leases expire upon exhaustion of the leased reserves or upon the permanent ceasing of all mining activities on the related reserves as a whole. The royalty rates are also generally based upon a percentage of the gross realization from the sale of coal. These rates are subject to redetermination
every ten years
under the terms of the leases. The remainder of the leased coal is generally leased from state governments, land holding companies and various individuals. The duration of these leases varies greatly. Typically, the lease terms are automatically extended as long as active mining continues. Royalty payments are generally based upon a specified rate per ton or a percentage of the gross realization from the sale of the coal.
Mining and exploration in Australia is generally conducted under leases, licenses or permits granted by state governments. Mining and exploration licenses and their associated environmental protection approvals contain conditions relating to such matters as minimum annual expenditures, environmental compliance, restoration and rehabilitation. Royalties are paid to the state government as a percentage of the sales price (less certain allowable deductions in some cases). Generally, landowners do not own the mineral rights or have the ability to grant rights to mine those minerals. These rights are retained by state governments. Compensation is often payable to landowners, occupiers and Aboriginal traditional owners with residual native title rights and interests for the loss of access to the land from the proposed mining activities. The amount and type of compensation and the ability to proceed to grant of a mining tenement may be determined by agreement or court determination, as provided by law.
|
Peabody Energy Corporation
|
2017 Form 10-K
|
F-
53
|
PEABODY ENERGY CORPORATION
NOTES TO CONSOLIDATED FINANCIAL STATEMENTS — (Continued)
Future minimum lease and royalty payments as of
December 31, 2017
are as follows:
|
Capital
Leases
|
Operating
Leases
|
Coal Lease
and
Royalty
Obligations
|
||||||||||
|
Year Ending December 31,
|
||||||||||||
|
|
(Dollars in millions)
|
|||||||||||
|
2018
|
$
|
39.9
|
|
$
|
68.5
|
|
$
|
6.9
|
|
|||
|
2019
|
28.1
|
|
46.7
|
|
6.7
|
|
||||||
|
2020
|
8.1
|
|
39.3
|
|
6.5
|
|
||||||
|
2021
|
0.5
|
|
29.0
|
|
6.3
|
|
||||||
|
2022
|
0.5
|
|
11.2
|
|
6.1
|
|
||||||
|
2023 and thereafter
|
9.2
|
|
22.9
|
|
33.0
|
|
||||||
|
Total minimum lease payments
|
86.3
|
|
$
|
217.6
|
|
$
|
65.5
|
|
||||
|
Less interest
|
10.3
|
|
|
|
|
|
||||||
|
Present value of minimum capital lease payments
|
$
|
76.0
|
|
|
|
|
|
|||||
As of
December 31, 2017
, certain of the Company’s coal lease obligations were secured by outstanding surety bonds totaling
$95.4 million
.
|
(15)
|
Asset Retirement Obligations
|
Reconciliations of the Company’s asset retirement obligations are as follows:
|
|
Successor
|
Predecessor
|
||||||||
|
|
April 2 through December 31, 2017
|
January 1 through April 1, 2017
|
Year Ended December 31, 2016
|
|||||||
|
|
(Dollars in millions)
|
|||||||||
|
Balance at beginning of period
|
$
|
664.2
|
|
$
|
758.8
|
|
$
|
712.1
|
|
|
|
Liabilities settled or disposed
|
(65.2
|
)
|
(2.7
|
)
|
(41.5
|
)
|
||||
|
Accretion expense
|
32.6
|
|
12.5
|
|
45.7
|
|
||||
|
Revisions to estimates
|
59.5
|
|
(104.4
|
)
|
42.5
|
|
||||
|
Balance at end of period
|
$
|
691.1
|
|
$
|
664.2
|
|
$
|
758.8
|
|
|
|
Less: Current portion (included in “Accounts payable and accrued expenses”)
|
34.1
|
|
31.1
|
|
41.0
|
|
||||
|
Noncurrent obligation (included in “Asset retirement obligations”)
|
$
|
657.0
|
|
$
|
633.1
|
|
$
|
717.8
|
|
|
|
Balance at end of period — active locations
|
$
|
612.9
|
|
$
|
540.1
|
|
$
|
634.8
|
|
|
|
Balance at end of period — closed or inactive locations
|
$
|
78.2
|
|
$
|
124.1
|
|
$
|
124.0
|
|
|
During the Successor period
April 2 through December 31, 2017
, the Company sold its Burton Mine and the related asset retirement obligations, as further discussed in Note 21. “Resource Management, Acquisitions and Other Commercial Events.” The changes in mine operations impacted reclamation estimates and are reflected in the asset retirement obligation asset and liability as of
December 31, 2017
.
The credit-adjusted, risk-free interest rates utilized to estimate the Company’s asset retirement obligations were
9.71%
,
9.36%
and
13.45%
for its U.S. reclamation obligations and
4.65%
,
4.36%
and
4.92%
for its Australia reclamation obligations at
December 31, 2017
, April 1, 2017 and
December 31, 2016
, respectively. The credit-adjusted, risk-free interest rate at December 31, 2015 was
50.83%
. For
2017
and 2016, a distinct rate was developed for Australia due to the amount of cash collateral held in support of the related obligations as of December 31,
2017
,
April 1, 2017
and
December 31, 2016
.
|
Peabody Energy Corporation
|
2017 Form 10-K
|
F-
54
|
PEABODY ENERGY CORPORATION
NOTES TO CONSOLIDATED FINANCIAL STATEMENTS — (Continued)
As of
December 31, 2017
and
2016
, the Company had
$1,136.8 million
and
$374.3 million
, respectively, in surety bonds and bank guarantees outstanding to secure reclamation obligations. The amount of reclamation self-bonding in certain U.S. states in which the Company qualified was
$1,094.2 million
as of December 31,
2016
. Additionally, the Company had
$188.5 million
and
$80.0 million
, respectively, of letters of credit in support of reclamation obligations as of
December 31, 2017
and
2016
. The Company also had restricted cash and cash collateral of
$205.2 million
and
$233.2 million
as of December 31,
2017
and
2016
, respectively, in support of reclamation obligations.
|
(16)
|
Postretirement Health Care and Life Insurance Benefits
|
The Company currently provides health care and life insurance benefits to qualifying salaried and hourly retirees of its current and certain former subsidiaries and their dependents from benefit plans established by the Company. Plan coverage for health benefits is provided to future hourly and salaried retirees in accordance with the applicable plan document. Life insurance benefits are provided to future hourly retirees in accordance with the applicable labor agreement.
Net periodic postretirement benefit cost included the following components:
|
|
Successor
|
Predecessor
|
||||||||||||
|
|
April 2 through December 31, 2017
|
January 1 through April 1, 2017
|
Year Ended December 31, 2016
|
Year Ended December 31, 2015
|
||||||||||
|
|
(Dollars in millions)
|
|||||||||||||
|
Service cost for benefits earned
|
$
|
6.9
|
|
$
|
2.3
|
|
$
|
10.4
|
|
$
|
11.2
|
|
||
|
Interest cost on accumulated postretirement benefit obligation
|
24.2
|
|
8.4
|
|
34.5
|
|
33.8
|
|
||||||
|
Amortization of prior service credit
|
—
|
|
(2.3
|
)
|
(9.2
|
)
|
(6.8
|
)
|
||||||
|
Amortization of actuarial loss
|
—
|
|
5.5
|
|
20.4
|
|
24.9
|
|
||||||
|
Net actuarial gain
|
(22.0
|
)
|
—
|
|
—
|
|
—
|
|
||||||
|
Net periodic postretirement benefit cost
|
$
|
9.1
|
|
$
|
13.9
|
|
$
|
56.1
|
|
$
|
63.1
|
|
||
In connection with fresh start reporting, the Company made a policy election to prospectively record amounts attributable to prior service cost and actuarial valuation changes, as applicable, currently in earnings rather than recording such amounts within accumulated other comprehensive income and amortizing to expense over applicable time periods.
The following includes pre-tax amounts recorded in “Accumulated other comprehensive income (loss)”:
|
|
Predecessor
|
||||||||||
|
|
January 1 through April 1, 2017
|
Year Ended December 31, 2016
|
|
Year Ended December 31, 2015
|
|||||||
|
|
(Dollars in millions)
|
||||||||||
|
Net actuarial loss (gain) arising during year
|
$
|
—
|
|
$
|
32.3
|
|
$
|
(35.1
|
)
|
||
|
Amortization:
|
|
|
|
|
|
|
|||||
|
Actuarial loss
|
(5.5
|
)
|
(20.4
|
)
|
(24.9
|
)
|
|||||
|
Prior service credit
|
2.3
|
|
9.2
|
|
6.8
|
|
|||||
|
Settlement related to the Patriot bankruptcy:
|
|||||||||||
|
Prior service credit (cost)
|
—
|
|
7.2
|
|
(16.6
|
)
|
|||||
|
Total recorded in “Accumulated other comprehensive income (loss)”
|
$
|
(3.2
|
)
|
$
|
28.3
|
|
$
|
(69.8
|
)
|
||
Prior to April 2, 2017, the Company amortized actuarial gain and loss using a
0%
corridor with an amortization period that covered the average future working lifetime of active employees (
10.31
years at January 1,
2017
).
|
Peabody Energy Corporation
|
2017 Form 10-K
|
F-
55
|
PEABODY ENERGY CORPORATION
NOTES TO CONSOLIDATED FINANCIAL STATEMENTS — (Continued)
The following table sets forth the plans’ funded status reconciled with the amounts shown in the consolidated balance sheets:
|
|
Successor
|
Predecessor
|
||||||||
|
|
April 2 through December 31, 2017
|
January 1 through April 1, 2017
|
Year Ended December 31, 2016
|
|||||||
|
|
(Dollars in millions)
|
|||||||||
|
Change in benefit obligation:
|
|
|
|
|
||||||
|
Accumulated postretirement benefit obligation at beginning of period
|
$
|
803.1
|
|
$
|
812.1
|
|
$
|
776.1
|
|
|
|
Service cost
|
6.9
|
|
2.3
|
|
10.4
|
|
||||
|
Interest cost
|
24.2
|
|
8.4
|
|
34.5
|
|
||||
|
Participant contributions
|
0.4
|
|
0.2
|
|
0.6
|
|
||||
|
Plan changes
|
—
|
|
—
|
|
7.2
|
|
||||
|
Benefits paid
|
(29.3
|
)
|
(12.8
|
)
|
(49.0
|
)
|
||||
|
Actuarial (gain) loss
|
(22.0
|
)
|
—
|
|
32.3
|
|
||||
|
Fresh start reporting adjustments
|
—
|
|
(7.1
|
)
|
—
|
|
||||
|
Accumulated postretirement benefit obligation at end of period
|
783.3
|
|
803.1
|
|
812.1
|
|
||||
|
Change in plan assets:
|
|
|
|
|
|
|
||||
|
Fair value of plan assets at beginning of period
|
—
|
|
—
|
|
—
|
|
||||
|
Employer contributions
|
28.9
|
|
12.6
|
|
48.4
|
|
||||
|
Participant contributions
|
0.4
|
|
0.2
|
|
0.6
|
|
||||
|
Benefits paid and administrative fees (net of Medicare Part D reimbursements)
|
(29.3
|
)
|
(12.8
|
)
|
(49.0
|
)
|
||||
|
Fair value of plan assets at end of period
|
—
|
|
—
|
|
—
|
|
||||
|
Funded status at end of period
|
(783.3
|
)
|
(803.1
|
)
|
(812.1
|
)
|
||||
|
Less: Current portion (included in “Accounts payable and accrued expenses”)
|
53.3
|
|
56.1
|
|
55.8
|
|
||||
|
Noncurrent obligation (included in “Accrued postretirement benefit costs”)
|
$
|
(730.0
|
)
|
$
|
(747.0
|
)
|
$
|
(756.3
|
)
|
|
The weighted-average assumptions used to determine the benefit obligations as of the end of each year were as follows:
|
Successor
|
Predecessor
|
|||
|
December 31,
|
||||
|
|
2017
|
2016
|
||
|
Discount rate
|
3.70
|
%
|
4.15
|
%
|
|
Measurement date
|
December 31, 2017
|
|
December 31, 2016
|
|
The weighted-average assumptions used to determine net periodic benefit cost during each period were as follows:
|
Successor
|
Predecessor
|
|||||||||
|
|
April 2 through December 31, 2017
|
January 1 through April 1, 2017
|
Year Ended December 31, 2016
|
Year Ended December 31, 2015
|
||||||
|
|
||||||||||
|
Discount rate
|
4.10
|
%
|
4.15
|
%
|
4.50
|
%
|
4.10
|
%
|
||
|
Measurement date
|
April 1, 2017
|
|
December 31, 2016
|
|
December 31, 2015
|
|
December 31, 2014
|
|
||
|
Peabody Energy Corporation
|
2017 Form 10-K
|
F-
56
|
PEABODY ENERGY CORPORATION
NOTES TO CONSOLIDATED FINANCIAL STATEMENTS — (Continued)
The following presents information about the assumed health care cost trend rate:
|
|
Successor
|
Predecessor
|
||
|
|
Year Ended December 31, 2017
|
Year Ended December 31, 2016
|
||
|
Pre-Medicare:
|
||||
|
Health care cost trend rate assumed for next year
|
7.00
|
%
|
6.20
|
%
|
|
Rate to which the cost trend is assumed to decline (the ultimate trend rate)
|
4.75
|
%
|
4.75
|
%
|
|
Year that the rate reaches the ultimate trend rate
|
2023
|
|
2021
|
|
|
Post-Medicare:
|
||||
|
Health care cost trend rate assumed for next year
|
6.50
|
%
|
5.60
|
%
|
|
Rate to which the cost trend is assumed to decline (the ultimate trend rate)
|
4.75
|
%
|
4.75
|
%
|
|
Year that the rate reaches the ultimate trend rate
|
2023
|
|
2021
|
|
Assumed health care cost trend rates have a significant effect on the expense and liability amounts reported for health care plans. A one-percentage-point change in the assumed health care cost trend would have the following effects for the year ended December 31, 2017:
|
One Percentage-
Point Increase
|
One Percentage-
Point Decrease
|
||||||
|
|
(Dollars in millions)
|
||||||
|
Effect on total service and interest cost components
|
$
|
3.2
|
|
$
|
(2.9
|
)
|
|
|
Effect on total postretirement benefit obligation
|
$
|
69.1
|
|
$
|
(60.7
|
)
|
|
Plan Assets
The Company’s postretirement benefit plans are unfunded.
Estimated Future Benefit Payments
The following benefit payments (net of retiree contributions), which reflect expected future service, as appropriate, are expected to be paid by the Company:
|
|
Postretirement
|
||
|
|
Benefits
|
||
|
|
(Dollars in millions)
|
||
|
2018
|
$
|
52.2
|
|
|
2019
|
53.5
|
|
|
|
2020
|
55.9
|
|
|
|
2021
|
57.6
|
|
|
|
2022
|
56.9
|
|
|
|
Years 2023-2027
|
266.4
|
|
|
|
(17)
|
Pension and Savings Plans
|
One of the Company’s subsidiaries, Peabody Investments Corp. (PIC), sponsors a defined benefit pension plan covering certain U.S. salaried employees and eligible hourly employees at certain PIC subsidiaries (the Peabody Plan). A subsidiary of PIC also has a defined benefit pension plan covering eligible employees who are represented by the UMWA under the Western Surface Agreement (the Western Plan). Prior to April 2, 2017, PIC also sponsored an unfunded supplemental retirement plan to provide senior management with benefits in excess of limits under the federal tax law (collectively, the Pension Plans).
|
Peabody Energy Corporation
|
2017 Form 10-K
|
F-
57
|
PEABODY ENERGY CORPORATION
NOTES TO CONSOLIDATED FINANCIAL STATEMENTS — (Continued)
Effective May 31, 2008, the Peabody Plan was frozen in its entirety for both participation and benefit accrual purposes. The Company adopted an enhanced savings plan contribution structure in lieu of benefits formerly accrued under the Peabody Plan. In November 2017, the Company purchased a group annuity contract from an insurance company to pay future pension benefits to approximately
1,950
retirees and beneficiaries of the Peabody Plan. As a result of this transaction, the Company settled
$71.4 million
of its pension obligation, paid from plan assets. The Company also recorded a settlement charge of
$2.1 million
as a result of this transaction.
Net periodic pension (benefit) cost included the following components:
|
|
Successor
|
Predecessor
|
||||||||||||
|
|
April 2 through December 31, 2017
|
January 1 through April 1, 2017
|
Year Ended December 31, 2016
|
Year Ended December 31, 2015
|
||||||||||
|
|
(Dollars in millions)
|
|||||||||||||
|
Service cost for benefits earned
|
$
|
1.6
|
|
$
|
0.6
|
|
$
|
2.5
|
|
$
|
2.7
|
|
||
|
Interest cost on projected benefit obligation
|
28.0
|
|
9.7
|
|
41.5
|
|
40.4
|
|
||||||
|
Expected return on plan assets
|
(33.5
|
)
|
(11.0
|
)
|
(45.3
|
)
|
(48.2
|
)
|
||||||
|
Amortization of prior service cost
|
—
|
|
0.1
|
|
0.3
|
|
1.0
|
|
||||||
|
Amortization of net actuarial losses
|
—
|
|
6.3
|
|
24.7
|
|
39.6
|
|
||||||
|
Settlement charge
|
2.1
|
|
—
|
|
—
|
|
—
|
|
||||||
|
Net actuarial gain
|
(23.5
|
)
|
—
|
|
—
|
|
—
|
|
||||||
|
Net periodic pension (benefit) cost
|
$
|
(25.3
|
)
|
$
|
5.7
|
|
$
|
23.7
|
|
$
|
35.5
|
|
||
In connection with fresh start reporting, the Company made a policy election to prospectively record amounts attributable to prior service cost and actuarial valuation changes, as applicable, currently in earnings rather than recording such amounts within accumulated other comprehensive income and amortizing to expense over applicable time periods.
The following includes pre-tax amounts recorded in “Accumulated other comprehensive income (loss)”:
|
|
Predecessor
|
||||||||||
|
|
January 1 through April 1, 2017
|
Year Ended December 31, 2016
|
Year Ended December 31, 2015
|
||||||||
|
|
(Dollars in millions)
|
||||||||||
|
Net actuarial loss arising during period
|
$
|
—
|
|
$
|
6.6
|
|
$
|
30.6
|
|
||
|
Amortization:
|
|
|
|
|
|
|
|||||
|
Net actuarial loss
|
(6.3
|
)
|
(24.7
|
)
|
(39.6
|
)
|
|||||
|
Prior service cost
|
(0.1
|
)
|
(0.3
|
)
|
(1.0
|
)
|
|||||
|
Total recorded in “Accumulated other comprehensive income (loss)”
|
$
|
(6.4
|
)
|
$
|
(18.4
|
)
|
$
|
(10.0
|
)
|
||
Prior to April 2, 2017, the Company amortized actuarial gain and loss using a
5%
corridor with a
five
-year amortization period.
|
Peabody Energy Corporation
|
2017 Form 10-K
|
F-
58
|
PEABODY ENERGY CORPORATION
NOTES TO CONSOLIDATED FINANCIAL STATEMENTS — (Continued)
The following summarizes the change in benefit obligation, change in plan assets and funded status of the Pension Plans:
|
|
Successor
|
Predecessor
|
||||||||
|
|
April 2 through December 31, 2017
|
January 1 through April 1, 2017
|
Year Ended December 31, 2016
|
|||||||
|
|
(Dollars in millions)
|
|||||||||
|
Change in benefit obligation:
|
|
|
|
|
||||||
|
Projected benefit obligation at beginning of period
|
$
|
936.4
|
|
$
|
959.3
|
|
$
|
939.3
|
|
|
|
Service cost
|
1.6
|
|
0.6
|
|
2.5
|
|
||||
|
Interest cost
|
28.0
|
|
9.7
|
|
41.5
|
|
||||
|
Benefits paid
|
(45.3
|
)
|
(15.0
|
)
|
(61.1
|
)
|
||||
|
Actuarial loss
|
25.3
|
|
—
|
|
37.1
|
|
||||
|
Settlement
|
(71.4
|
)
|
—
|
|
—
|
|
||||
|
Fresh start reporting adjustments
|
—
|
|
(18.2
|
)
|
—
|
|
||||
|
Projected benefit obligation at end of period
|
874.6
|
|
936.4
|
|
959.3
|
|
||||
|
Change in plan assets:
|
|
|
|
|
|
|
||||
|
Fair value of plan assets at beginning of period
|
783.1
|
|
773.0
|
|
757.3
|
|
||||
|
Actual return on plan assets
|
80.1
|
|
25.1
|
|
75.7
|
|
||||
|
Employer contributions
|
30.1
|
|
—
|
|
1.1
|
|
||||
|
Benefits paid
|
(45.3
|
)
|
(15.0
|
)
|
(61.1
|
)
|
||||
|
Settlement
|
(71.4
|
)
|
—
|
|
—
|
|
||||
|
Fair value of plan assets at end of period
|
776.6
|
|
783.1
|
|
773.0
|
|
||||
|
Funded status at end of period
|
$
|
(98.0
|
)
|
$
|
(153.3
|
)
|
$
|
(186.3
|
)
|
|
|
Amounts recognized in the consolidated balance sheets:
|
|
|
|
|
|
|
||||
|
Noncurrent obligation (included in “Other noncurrent liabilities”)
|
$
|
(98.0
|
)
|
$
|
(153.3
|
)
|
$
|
(163.5
|
)
|
|
|
Liabilities subject to compromise
|
—
|
|
—
|
|
(22.8
|
)
|
||||
|
Net amount recognized
|
$
|
(98.0
|
)
|
$
|
(153.3
|
)
|
$
|
(186.3
|
)
|
|
The weighted-average assumptions used to determine the benefit obligations as of the end of each year were as follows:
|
Successor
|
Predecessor
|
|||||
|
|
December 31,
|
|||||
|
|
2017
|
2016
|
||||
|
Discount rate
|
3.70
|
%
|
4.15
|
%
|
||
|
Measurement date
|
December 31, 2017
|
|
December 31, 2016
|
|
||
The weighted-average assumptions used to determine net periodic pension (benefit) cost during each period were as follows:
|
Successor
|
Predecessor
|
|||||||||
|
April 2 through December 31, 2017
|
January 1 through April 1, 2017
|
Year Ended December 31, 2016
|
Year Ended December 31, 2015
|
|||||||
|
|
||||||||||
|
Discount rate
|
4.10
|
%
|
4.15
|
%
|
4.55
|
%
|
4.15
|
%
|
||
|
Expected long-term return on plan assets
|
5.90
|
%
|
5.90
|
%
|
6.00
|
%
|
6.25
|
%
|
||
|
Measurement date
|
April 1, 2017
|
|
December 31, 2016
|
|
December 31, 2015
|
|
December 31, 2014
|
|
||
The expected rate of return on plan assets is determined by taking into consideration expected long-term returns associated with each major asset class based on long-term historical ranges, inflation assumptions and the expected net value from active management of the assets based on actual results. Effective January 1, 2018, the Company lowered its expected rate of return on plan assets from
5.90%
to
5.65%
reflecting the impact of the Company’s asset allocation and capital market expectations.
|
Peabody Energy Corporation
|
2017 Form 10-K
|
F-
59
|
PEABODY ENERGY CORPORATION
NOTES TO CONSOLIDATED FINANCIAL STATEMENTS — (Continued)
The projected benefit obligation and the accumulated benefit obligation exceeded plan assets for all plans as of
December 31, 2017
and
2016
. The accumulated benefit obligation for all plans was
$874.6 million
and
$959.3 million
as of
December 31, 2017
and
2016
, respectively.
Assets of the Pension Plans
Assets of the PIC Master Trust (the Master Trust) are invested in accordance with investment guidelines established by the Peabody Plan Retirement Committee and the Peabody Western Plan Retirement Committee (collectively, the Retirement Committees) after consultation with outside investment advisors and actuaries.
The asset allocation targets have been set with the expectation that the assets of the Master Trust will be managed with an appropriate level of risk to fund each Pension Plan’s expected liabilities. To determine the appropriate target asset allocations, the Retirement Committees consider the demographics of each Pension Plan’s participants, the funded status of each Pension Plan, the business and financial profile of the Company and other associated risk preferences. These allocation targets are reviewed by the Retirement Committees on a regular basis and revised as necessary. The Retirement Committees have developed and implemented a dynamic asset-liability management investment strategy (the Dynamic Investment Strategy) designed to reduce each Pension Plan’s funded status volatility risk as funded status increases resulting from changes in liabilities due to discount rates and other factors, investment returns and funding contributions. The Dynamic Investment Strategy adjusts allocations between return-seeking (i.e., equities and other similar investments) and liability hedging (i.e., fixed income duration and spread exposure) portfolios in a pre-established manner, with changes triggered when the Pension Plans reach certain funded status thresholds. As of December 31, 2017 and 2016, the Master Trust investment portfolio reflected the Company’s target asset mix of
27%
and
31%
equity securities and
73%
and
69%
fixed income investments, respectively. Master Trust assets also include funds invested in various real estate properties representing approximately
2%
of total Master Trust assets as of December 31, 2017 and 2016. The Retirement Committees’ intention is to liquidate these real estate holdings when allowable per the terms of the limited partnership agreements. Generally, dissolution and liquidation of the limited partnerships is required before the Master Trust’s real estate holdings can be liquidated and is estimated to occur at various times through 2021.
Assets of the Master Trust are either under active management by third-party investment advisors or in index funds, all of which are selected and monitored by the Retirement Committees. Specific investment guidelines have been established by the Retirement Committees for each major asset class including performance benchmarks, allowable and prohibited investment types and concentration limits. In general, investment guidelines do not permit leveraging the assets held in the Master Trust. However, investment managers may employ various strategies and derivative instruments in establishing overall portfolio characteristics consistent with the guidelines and investment objectives established by the Retirement Committees for their portfolios. Equity investment guidelines do not permit entering into put or call options (except as deemed appropriate to manage currency risk), and futures contracts are permitted only to the extent necessary to facilitate liquidity management. Fixed income investment guidelines only allow for exchange-traded derivatives if the investment manager deems the derivative vehicle to be more attractive than a similar direct investment in an underlying cash market or to manage the duration of the fixed income portfolio.
A financial instrument’s level within the valuation hierarchy is based upon the lowest level of input that is significant to the fair value measurement. Following is a description of the valuation techniques and inputs used for investments measured at fair value, including the general classification of such investments pursuant to the valuation hierarchy.
Mutual funds.
The Master Trust invests in mutual funds for growth and diversification. Investment vehicles include a fund (benchmarked against the performance of the S&P 500 Index) that invests in large-cap publicly traded common stocks (Large-Cap Fund), an institutional fund that holds a diversified portfolio of long-duration corporate fixed income investments (Corporate Bond Fund) and an institutional fund that consists of a diversified portfolio of liquid, short-term instruments of varying maturities (Short-Term Fund). The Large-Cap Fund, which is traded on a national securities exchange in an active market, is valued using daily publicly quoted net asset value (NAV) prices and accordingly classified within Level 1 of the valuation hierarchy. The Corporate Bond Fund and the Short-Term Fund are not traded on a national securities exchange and are valued at NAV, the practical expedient to estimate fair value.
Corporate bonds
. The Master Trust invests in corporate bonds for diversification, volatility reduction of equity securities and to provide a hedge to interest rate movements affecting liabilities. Investment vehicles include investment-grade corporate bonds. Fair value for these securities is provided by a third-party pricing service that utilizes various inputs such as benchmark yields, reported trades, broker/dealer quotes, issuer spreads and benchmark securities as well as other relevant economic measures. Corporate bonds are classified within the Level 2 valuation hierarchy since fair value inputs are derived prices in active markets and the bonds are not traded on a national securities exchange.
|
Peabody Energy Corporation
|
2017 Form 10-K
|
F-
60
|
PEABODY ENERGY CORPORATION
NOTES TO CONSOLIDATED FINANCIAL STATEMENTS — (Continued)
U.S. government securities.
The Master Trust invests in U.S. government securities for diversification, volatility reduction of equity securities and to provide a hedge to interest rate movements affecting liabilities. Investment vehicles include U.S. government bonds, agency securities and municipal bonds. Fair value for these securities is provided by a third-party pricing service that utilizes various inputs such as benchmark yields, reported trades, broker/dealer quotes, issuer spreads and benchmark securities as well as other relevant economic measures. If fair value is based on quoted prices in active markets and traded on a national securities exchange, U.S. government securities are classified within the Level 1 valuation hierarchy; otherwise, U.S. government securities are classified within the Level 2 valuation hierarchy.
International government securities.
The Master Trust invests in international government securities for diversification, volatility reduction of equity securities and to provide a hedge to interest rate movements affecting liabilities. Investment vehicles include non-U.S. government bonds. Fair value for these securities is provided by a third-party pricing service that utilizes various inputs such as benchmark yields, reported trades, broker/dealer quotes, issuer spreads and benchmark securities as well as other relevant economic measures. International government securities are classified within the Level 2 valuation hierarchy since fair value inputs are derived prices in active markets and the bonds are not traded on a national securities exchange.
Common/collective trusts
. The Master Trust invests in common/collective trusts (CCT) for growth and diversification. Investment vehicles include a CCT (benchmarked against the performance of the Russell 2000 Index) that invests in small-cap publicly traded common stocks (the Small-Cap CCT), a CCT that invests in publicly traded non-U.S. equity securities (the Equity CCT) and a CCT (benchmarked against the performance of the MSCI Emerging Markets Index) that primarily invests in equity index securities of companies in global emerging markets (the Equity Index CCT). The Equity CCT and the Equity Index CCT are valued using the closing price reported by their primary stock exchange and translated at each valuation date from local currency into U.S. dollars based on independently published currency exchange rates. The NAV is determined in U.S. dollars and calculated as of the last business day of each month for the Equity CCT and daily for the Equity Index CCT. All CCTs are not traded on a national securities exchange and are valued at NAV, the practical expedient to estimate fair value.
Cash funds
. The Master Trust invests in cash funds to manage liquidity resulting from payment of participant benefits and certain administrative fees. Investment vehicles primarily include a non-interest bearing cash fund with an earnings credit allowance feature and various exchange-traded derivative instruments consisting of futures and interest rate swap agreements used to manage the duration of certain liability-hedging investments. The non-interest bearing cash fund is classified within the Level 1 valuation hierarchy. Exchange traded derivatives, such as options and futures, for which market quotations are readily available, are valued at the last reported sale price or official closing price on the primary market or exchange on which they are traded and are classified within the Level 1 valuation hierarchy.
Real estate investment trusts
. The Master Trust invests in real estate interests for diversification. Investments in real estate represent interests in several limited partnerships, which invest in various real estate properties. Interests in real estate are valued using various methodologies, including independent third party appraisals; fair value measurements are not developed by the Company. For some investments, little market activity may exist and determination of fair value is then based on the best information available in the circumstances. This involves a significant degree of judgment by taking into consideration a combination of internal and external factors. Accordingly, interests in real estate are classified within the Level 3 valuation hierarchy. Some limited partnerships issue dividends to their investors in the form of cash distributions that the Pension Plans invest elsewhere within the Master Trust.
The methods described above may produce a fair value calculation that may not be indicative of net realizable value or reflective of future fair values. Furthermore, while the Company believes its valuation methods are appropriate and consistent with other market participants, the use of different methodologies or assumptions to determine the fair value of certain financial instruments could result in a different fair value measurement at the reporting date. The inputs or methodologies used for valuing investments are not necessarily an indication of the risk associated with investing in those investments.
|
Peabody Energy Corporation
|
2017 Form 10-K
|
F-
61
|
PEABODY ENERGY CORPORATION
NOTES TO CONSOLIDATED FINANCIAL STATEMENTS — (Continued)
The following tables present the fair value of assets in the Master Trust by asset category and by fair value hierarchy:
|
Successor
|
|||||||||||||||
|
|
December 31, 2017
|
||||||||||||||
|
|
Level 1
|
Level 2
|
Level 3
|
Total
|
|||||||||||
|
|
(Dollars in millions)
|
||||||||||||||
|
Mutual funds
|
$
|
108.0
|
|
$
|
—
|
|
$
|
—
|
|
$
|
108.0
|
|
|||
|
Corporate bonds
|
—
|
|
291.1
|
|
—
|
|
291.1
|
|
|||||||
|
U.S. government securities
|
7.5
|
|
21.8
|
|
—
|
|
29.3
|
|
|||||||
|
International government securities
|
—
|
|
17.7
|
|
—
|
|
17.7
|
|
|||||||
|
Cash funds
|
30.8
|
|
—
|
|
—
|
|
30.8
|
|
|||||||
|
Real estate investment trusts
|
—
|
|
—
|
|
11.8
|
|
11.8
|
|
|||||||
|
Total assets at fair value
|
$
|
146.3
|
|
$
|
330.6
|
|
$
|
11.8
|
|
488.7
|
|
||||
|
Assets measured at net asset value practical expedient
(1)
|
|||||||||||||||
|
Private mutual funds
|
180.4
|
|
|||||||||||||
|
Common collective trusts
|
107.5
|
|
|||||||||||||
|
287.9
|
|
||||||||||||||
|
Total plan assets
|
$
|
776.6
|
|
||||||||||||
|
Predecessor
|
|||||||||||||||
|
|
December 31, 2016
|
||||||||||||||
|
|
Level 1
|
Level 2
|
Level 3
|
Total
|
|||||||||||
|
|
(Dollars in millions)
|
||||||||||||||
|
Mutual funds
|
$
|
119.9
|
|
$
|
—
|
|
$
|
—
|
|
$
|
119.9
|
|
|||
|
Corporate bonds
|
—
|
|
265.7
|
|
—
|
|
265.7
|
|
|||||||
|
U.S. government securities
|
25.1
|
|
22.7
|
|
—
|
|
47.8
|
|
|||||||
|
International government securities
|
—
|
|
12.6
|
|
—
|
|
12.6
|
|
|||||||
|
Cash funds
|
17.8
|
|
—
|
|
—
|
|
17.8
|
|
|||||||
|
Real estate investment trusts
|
—
|
|
—
|
|
14.1
|
|
14.1
|
|
|||||||
|
Total assets at fair value
|
$
|
162.8
|
|
$
|
301.0
|
|
$
|
14.1
|
|
477.9
|
|
||||
|
Assets measured at net asset value practical expedient
(1)
|
|||||||||||||||
|
Private mutual funds
|
186.1
|
|
|||||||||||||
|
Common collective trusts
|
109.0
|
|
|||||||||||||
|
295.1
|
|
||||||||||||||
|
Total plan assets
|
$
|
773.0
|
|
||||||||||||
(1)
In accordance with Accounting Standards Update 2015-07, investments that are measured at fair value using the net asset value per share practical expedient have not been classified in the fair value hierarchy. The fair value amounts presented in this table are intended to permit reconciliation of the fair value hierarchy to the total value of assets of the plans.
|
Peabody Energy Corporation
|
2017 Form 10-K
|
F-
62
|
PEABODY ENERGY CORPORATION
NOTES TO CONSOLIDATED FINANCIAL STATEMENTS — (Continued)
The table below sets forth a summary of changes in the fair value of the Master Trust’s Level 3 investments:
|
|
Successor
|
Predecessor
|
||||||||
|
April 2 through December 31, 2017
|
January 1 through April 1, 2017
|
Year Ended December 31, 2016
|
||||||||
|
|
(Dollars in millions)
|
|||||||||
|
Balance, beginning of period
|
$
|
13.8
|
|
$
|
14.1
|
|
$
|
23.0
|
|
|
|
Realized gains
|
—
|
|
0.6
|
|
1.8
|
|
||||
|
Unrealized gains (losses) relating to investments still held at the reporting date
|
2.2
|
|
(0.6
|
)
|
0.2
|
|
||||
|
Purchases, sales and settlements, net
|
(4.2
|
)
|
(0.3
|
)
|
(10.9
|
)
|
||||
|
Balance, end of period
|
$
|
11.8
|
|
$
|
13.8
|
|
$
|
14.1
|
|
|
Contributions
Annual contributions to qualified plans are made in accordance with minimum funding standards and the Company’s agreement with the Pension Benefit Guaranty Corporation (PBGC). Funding decisions also consider certain funded status thresholds defined by the Pension Protection Act of 2006 (generally
80%
). During the year Successor period
April 2 through December 31, 2017
, the Company contributed
$30.1 million
to its qualified pension plans including a discretionary contribution of
$25.0 million
. The Company did not make any contributions to its qualified and non-qualified plans during the Predecessor period January 1 through April 1, 2017. Effective April 2, 2017, the Company no longer sponsors any non-qualified pension plans. As of December 31, 2017, the Company’s qualified plans are expected to be at or above the Pension Protection Act thresholds. Minimum funding standards are legislated by ERISA and are modified by pension funding stabilization provisions included in the Moving Ahead for Progress in the 21st Century Act of 2012, the Highway and Transportation Funding Act of 2014 and the Bipartisan Budget Act of 2015. Based upon minimum funding requirements, the Company is not required to make any payments to its qualified pension plans to meet minimum funding requirements.
Estimated Future Benefit Payments
The following benefit payments, which reflect expected future service, as appropriate, are expected to be paid in connection with the Company’s benefit obligation:
|
Successor
|
|||
|
|
Pension Benefits
|
||
|
|
(Dollars in millions)
|
||
|
2018
|
$
|
57.2
|
|
|
2019
|
57.2
|
|
|
|
2020
|
58.6
|
|
|
|
2021
|
59.5
|
|
|
|
2022
|
58.9
|
|
|
|
Years 2023-2027
|
280.1
|
|
|
Defined Contribution Plans
The Company sponsors employee retirement accounts under
two
401(k) plans for eligible U.S. employees. The Company matches voluntary contributions to each plan up to specified levels. The expense for these plans was
$25.5 million
for the Successor period April 2 through December 31, 2017 and
$5.5 million
,
$19.2 million
and
$22.0 million
for the Predecessor period January 1 through April 1, 2017 and the years ended December 31,
2016
and
2015
, respectively. A performance contribution feature in one of the plans allows for additional discretionary contributions from the Company. The performance contribution expected to be paid in 2018, relating to the 2017 plan year is
$9.5 million
. There were no performance contributions paid during the Successor period
April 2 through December 31, 2017
, the Predecessor period
January 1 through April 1, 2017
or the year ended December 31, 2016. The performance contribution paid during the year ended December 31,
2015
was
$19.5 million
.
|
Peabody Energy Corporation
|
2017 Form 10-K
|
F-
63
|
PEABODY ENERGY CORPORATION
NOTES TO CONSOLIDATED FINANCIAL STATEMENTS — (Continued)
|
(18)
|
Stockholders’ Equity
|
Successor Company
Common Stock
The following table summarizes Common Stock activity from April 2, 2017 to December 31, 2017:
|
Successor
|
||
|
April 2 through December 31, 2017
|
||
|
(In millions)
|
||
|
Shares outstanding at the beginning of the period
|
70.9
|
|
|
Shares issued for preferred share conversions
|
33.8
|
|
|
Shares issued for warrant conversions
|
6.2
|
|
|
Shares issued for vested restricted stock units
|
0.1
|
|
|
Shares repurchased
|
(5.8
|
)
|
|
Shares outstanding at the end of the period
|
105.2
|
|
See Note 2. “Emergence from the Chapter 11 Cases and Fresh Start Reporting” for additional information.
Preferred Stock
The following table summarizes the Series A Convertible Preferred Stock activity from April 2, 2017 to December 31, 2017:
|
Successor
|
||
|
April 2 through December 31, 2017
|
||
|
(In millions)
|
||
|
Shares outstanding at the beginning of the period
|
30.0
|
|
|
Shares converted to Common Stock
|
(17.2
|
)
|
|
Shares issued for payable in-kind preferred stock dividends
|
0.7
|
|
|
Shares outstanding at the end of the period
|
13.5
|
|
As of December 31, 2017, there were
13.5 million
outstanding shares of Series A Convertible Preferred Stock. No other series of preferred stock was outstanding as of December 31, 2017. On January 31, 2018, the remaining outstanding shares of Series A Convertible Preferred Stock were converted into shares of Common Stock. See Note 2. “Emergence from the Chapter 11 Cases and Fresh Start Reporting” for additional information.
Treasury Stock
Share repurchases.
On August 1, 2017, the Board authorized a
$500.0 million
share repurchase program. Repurchases may be made from time to time at the Company’s discretion. The specific timing, price and size of purchases will depend on the share price, general market and economic conditions and other considerations, including compliance with various debt agreements as they may be amended from time to time. No expiration date has been set for the repurchase program, and the program may be discontinued at any time. During the Successor period ended December 31, 2017, the Company repurchased approximately
1.5 million
shares of its Common Stock for
$40.0 million
in connection with an underwritten secondary offering and made additional open-market purchases of approximately
4.3 million
shares of its Common Stock for
$135.7 million
. Subsequent to December 31, 2017 and through February 19, 2018, the Company purchased approximately
0.9 million
additional shares of Common Stock for
$38.5 million
.
Shares relinquished.
The Company routinely allows employees to relinquish Common Stock to pay estimated taxes upon the vesting of restricted stock units and the payout of performance units that are settled in Common Stock under its equity incentive plans. The number of shares of Common Stock relinquished was less than
0.1 million
for the Successor period ended
December 31, 2017
. The value of the Common Stock tendered by employees was based upon the closing price on the dates of the respective transactions.
|
Peabody Energy Corporation
|
2017 Form 10-K
|
F-
64
|
PEABODY ENERGY CORPORATION
NOTES TO CONSOLIDATED FINANCIAL STATEMENTS — (Continued)
Predecessor Company
As described in Note 2. “Emergence from the Chapter 11 Cases and Fresh Start Reporting,” in accordance with the Plan and as previously disclosed, each share of the Company’s common stock outstanding prior to the Effective Date, including all options and warrants to purchase such stock, were extinguished, canceled and discharged, and each such share, option or warrant has no further force or effect as of the Effective Date. Furthermore, all of the Company’s equity award agreements under prior incentive plans, and the awards granted pursuant thereto, were extinguished, canceled and discharged and have no further force or effect as of the Effective Date.
|
(19)
|
Share-Based Compensation
|
Successor Company
The Company has established the 2017 Incentive Plan (the 2017 Incentive Plan) for employees, non-employee directors and consultants that allows for the issuance of share-based compensation in various forms including options (including non-qualified stock options and incentive stock options), stock appreciation rights, restricted stock, restricted stock units, deferred stock, performance units, dividend equivalents and cash incentive awards. In accordance with the Plan, the 2017 Incentive Plan became effective as of the Effective Date. Refer to Note 2. “Emergence from the Chapter 11 Cases and Fresh Start Reporting” for additional information regarding the 2017 Incentive Plan and the grant of emergence awards. Under the 2017 Incentive Plan, approximately
14.0 million
shares of the Company’s Common Stock were reserved for issuance. As of
December 31, 2017
, there are approximately
10.5 million
shares of the Company’s Common Stock available for grant.
Share-Based Compensation Expense and Cash Flows
The Company’s share-based compensation expense is recorded in “Selling and administrative expenses” in the consolidated statements of operations. Cash received by the Company upon the exercise of stock options is reflected as a financing activity in the consolidated statements of cash flows. Share-based compensation expense and cash flow amounts were as follows:
|
|
Successor
|
||
|
|
April 2 through December 31, 2017
|
||
|
|
(Dollars in millions)
|
||
|
Share-based compensation expense - equity classified awards
|
$
|
21.8
|
|
|
Share-based compensation expense - liability classified awards
|
—
|
|
|
|
Total share-based compensation expense
|
21.8
|
|
|
|
Tax benefit
|
—
|
|
|
|
Share-based compensation expense, net of tax benefit
|
$
|
21.8
|
|
|
Cash received upon the exercise of stock options and from employee stock purchases
|
—
|
|
|
|
Write-off tax benefits related to share-based compensation
|
—
|
|
|
As of
December 31, 2017
, the total unrecognized compensation cost related to nonvested awards was
$57.5 million
, net of taxes, which is expected to be recognized over
2.5
years with a weighted-average period of
1.0
years.
Deferred Stock Units
During the Successor period
April 2 through December 31, 2017
, the Company granted deferred stock units to each of its non-employee directors. The fair value of these units is equal to the market price of the Company’s Common Stock at the date of grant. These deferred stock units generally vest on a monthly basis over
12
months and are settled in Common Stock
three
years after the date of grant.
|
Peabody Energy Corporation
|
2017 Form 10-K
|
F-
65
|
PEABODY ENERGY CORPORATION
NOTES TO CONSOLIDATED FINANCIAL STATEMENTS — (Continued)
Restricted Stock Units
On the Effective Date, the Company granted the Emergence Awards. The Emergence Awards granted to the Company’s executive officers generally will vest ratably on each of the first
three
anniversaries of the Effective Date, subject to, among other things, each such executive officer’s continued employment with the Company. The Emergence Awards will become fully vested upon each such executive officer’s termination of employment by the Company and its subsidiaries without Cause or by the executive for Good Reason (each, as defined in the 2017 Incentive Plan or award agreement) or due to a termination of employment with the Company and its subsidiaries by reason of death or Disability (as defined in the 2017 Incentive Plan or award agreement). In order to receive the Emergence Awards, the executive officers were required to execute restrictive covenant agreements protecting the Company’s interests.
The Company grants restricted stock units to certain senior management and non-senior management employees. For units granted to both senior and non-senior management employees containing only service conditions, the fair value of the award is equal to the market price of the Company’s Common Stock at the date of grant. Units granted to senior management employees vest at various times (none of which exceed
three
years) in accordance with the underlying award agreement. Compensation cost for both senior and non-senior management employees is recognized on a straight-line basis over the requisite service period. The payouts for active grants awarded during the Successor period
April 2 through December 31, 2017
will be settled in the Company’s Common Stock.
A summary of restricted stock unit activity is as follows:
|
Successor
|
||||||
|
April 2 through December 31, 2017
|
Weighted
Average
Grant-Date
Fair Value
|
|||||
|
Nonvested at April 2, 2017
|
—
|
|
$
|
—
|
|
|
|
Granted
|
3,618,309
|
|
22.04
|
|
||
|
Vested
|
(29,555
|
)
|
22.03
|
|
||
|
Forfeited
|
(74,801
|
)
|
22.03
|
|
||
|
Nonvested at December 31, 2017
|
3,513,953
|
|
$
|
22.04
|
|
|
The total fair value at grant date of restricted stock units granted during the Successor period
April 2 through December 31, 2017
was
$79.8 million
. The total fair value of restricted stock units vested was
$0.9 million
during the Successor period
April 2 through December 31, 2017
Predecessor Company
In accordance with the Plan and as previously disclosed, each share of the Company’s common stock outstanding prior to the Effective Date, including all options and warrants to purchase such stock, were extinguished, canceled and discharged, and each such share, option or warrant has no further force or effect as of the Effective Date. Furthermore, all of the Company’s equity award agreements under prior incentive plans, and the awards granted pursuant thereto, were extinguished, canceled and discharged and have no further force or effect as of the Effective Date.
|
Peabody Energy Corporation
|
2017 Form 10-K
|
F-
66
|
PEABODY ENERGY CORPORATION
NOTES TO CONSOLIDATED FINANCIAL STATEMENTS — (Continued)
Share-Based Compensation Expense and Cash Flows
The Predecessor Company’s share-based compensation expense was recorded in “Selling and administrative expenses” in the consolidated statements of operations. Cash received by the Predecessor Company upon the exercise of stock options and when employees purchased stock under the employee stock purchase plans was reflected as a financing activity in the consolidated statements of cash flows. Share-based compensation expense and cash flow amounts were as follows:
|
|
Predecessor
|
||||||||||
|
|
January 1 through April 1, 2017
|
Year Ended December 31, 2016
|
Year Ended December 31, 2015
|
||||||||
|
|
(Dollars in millions)
|
||||||||||
|
Share-based compensation expense - equity classified awards
|
$
|
1.9
|
|
$
|
11.3
|
|
$
|
26.2
|
|
||
|
Share-based compensation expense - liability classified awards
|
—
|
|
1.5
|
|
2.0
|
|
|||||
|
Total share-based compensation expense
|
1.9
|
|
12.8
|
|
28.2
|
|
|||||
|
Tax benefit
|
—
|
|
—
|
|
—
|
|
|||||
|
Share-based compensation expense, net of tax benefit
|
$
|
1.9
|
|
$
|
12.8
|
|
$
|
28.2
|
|
||
|
Cash received upon the exercise of stock options and from employee stock purchases
|
—
|
|
—
|
|
3.4
|
|
|||||
|
Write-off tax benefits related to share-based compensation
|
—
|
|
—
|
|
—
|
|
|||||
|
(20)
|
Accumulated Other Comprehensive Income (Loss)
|
The following table sets forth the after-tax components of comprehensive income (loss):
|
Foreign
Currency
Translation
Adjustment
|
Net
Actuarial Loss
Associated with
Postretirement
Plans and
Workers’
Compensation
Obligations
|
Prior Service
Credit (Cost) Associated
with
Postretirement
Plans
|
Cash Flow
Hedges
|
Total
Accumulated
Other
Comprehensive Income (Loss)
|
|||||||||||||||
|
|
(Dollars in millions)
|
||||||||||||||||||
|
Predecessor Company
|
|||||||||||||||||||
|
December 31, 2014
|
$
|
(111.5
|
)
|
$
|
(317.5
|
)
|
$
|
25.1
|
|
$
|
(360.9
|
)
|
$
|
(764.8
|
)
|
||||
|
Net change in fair value
|
—
|
|
—
|
|
—
|
|
(131.3
|
)
|
(131.3
|
)
|
|||||||||
|
Reclassification from other comprehensive income to earnings
|
—
|
|
35.6
|
|
(3.7
|
)
|
251.7
|
|
283.6
|
|
|||||||||
|
Current period change
|
(34.9
|
)
|
18.1
|
|
10.4
|
|
—
|
|
(6.4
|
)
|
|||||||||
|
December 31, 2015
|
(146.4
|
)
|
(263.8
|
)
|
31.8
|
|
(240.5
|
)
|
(618.9
|
)
|
|||||||||
|
Reclassification from other comprehensive income to earnings
|
—
|
|
21.0
|
|
(5.6
|
)
|
146.3
|
|
161.7
|
|
|||||||||
|
Current period change
|
(1.8
|
)
|
(13.5
|
)
|
(4.5
|
)
|
—
|
|
(19.8
|
)
|
|||||||||
|
December 31, 2016
|
(148.2
|
)
|
(256.3
|
)
|
21.7
|
|
(94.2
|
)
|
(477.0
|
)
|
|||||||||
|
Reclassification from other comprehensive income to earnings
|
—
|
|
5.8
|
|
(1.4
|
)
|
18.6
|
|
23.0
|
|
|||||||||
|
Current period change
|
5.5
|
|
—
|
|
—
|
|
—
|
|
5.5
|
|
|||||||||
|
Fresh start reporting adjustment
|
142.7
|
|
250.5
|
|
(20.3
|
)
|
75.6
|
|
448.5
|
|
|||||||||
|
April 1, 2017
|
$
|
—
|
|
$
|
—
|
|
$
|
—
|
|
$
|
—
|
|
$
|
—
|
|
||||
|
Successor Company
|
|||||||||||||||||||
|
Current period change
|
1.4
|
|
—
|
|
—
|
|
—
|
|
1.4
|
|
|||||||||
|
December 31, 2017
|
$
|
1.4
|
|
$
|
—
|
|
$
|
—
|
|
$
|
—
|
|
$
|
1.4
|
|
||||
|
Peabody Energy Corporation
|
2017 Form 10-K
|
F-
67
|
PEABODY ENERGY CORPORATION
NOTES TO CONSOLIDATED FINANCIAL STATEMENTS — (Continued)
The components of accumulated other comprehensive income (loss) related to postretirement plans and workers’ compensation obligations and cash flow hedges related to Predecessor periods were eliminated in accordance with fresh start reporting as described in Note 2. “Emergence from the Chapter 11 Cases and Fresh Start Reporting. The following table provides additional information regarding items reclassified out of “Accumulated other comprehensive income (loss)” into earnings during the periods presented below:
|
Amount reclassified from accumulated other comprehensive income (loss)
(1)
|
||||||||||||
|
Predecessor
|
||||||||||||
|
Details about accumulated other comprehensive loss components
|
January 1 through April 1, 2017
|
Year Ended December 31, 2016
|
Year Ended December 31, 2015
|
Affected line item in the consolidated statement of operations
|
||||||||
|
(Dollars in millions)
|
||||||||||||
|
Net actuarial loss associated with postretirement plans and workers’ compensation obligations:
|
||||||||||||
|
Postretirement health care and life insurance benefits
|
$
|
(5.5
|
)
|
$
|
(20.4
|
)
|
$
|
(24.9
|
)
|
Operating costs and expenses
|
||
|
Defined benefit pension plans
|
(5.3
|
)
|
(20.5
|
)
|
(32.9
|
)
|
Operating costs and expenses
|
|||||
|
Defined benefit pension plans
|
(1.0
|
)
|
(4.2
|
)
|
(6.7
|
)
|
Selling and administrative expenses
|
|||||
|
Workers’ compensation amortization
|
2.7
|
|
11.7
|
|
8.0
|
|
Operating costs and expenses
|
|||||
|
(9.1
|
)
|
(33.4
|
)
|
(56.5
|
)
|
Total before income taxes
|
||||||
|
3.3
|
|
12.4
|
|
20.9
|
|
Income tax benefit
|
||||||
|
$
|
(5.8
|
)
|
$
|
(21.0
|
)
|
$
|
(35.6
|
)
|
Total after income taxes
|
|||
|
Prior service credit (cost) associated with postretirement plans:
|
||||||||||||
|
Postretirement health care and life insurance benefits
|
$
|
2.3
|
|
$
|
9.2
|
|
$
|
6.8
|
|
Operating costs and expenses
|
||
|
Defined benefit pension plans
|
(0.1
|
)
|
(0.3
|
)
|
(1.0
|
)
|
Operating costs and expenses
|
|||||
|
2.2
|
|
8.9
|
|
5.8
|
|
Total before income taxes
|
||||||
|
(0.8
|
)
|
(3.3
|
)
|
(2.1
|
)
|
Income tax provision
|
||||||
|
$
|
1.4
|
|
$
|
5.6
|
|
$
|
3.7
|
|
Total after income taxes
|
|||
|
Cash flow hedges:
|
||||||||||||
|
Foreign currency cash flow contracts
|
$
|
(16.6
|
)
|
$
|
(145.6
|
)
|
$
|
(316.4
|
)
|
Operating costs and expenses
|
||
|
Fuel and explosives commodity swaps
|
(11.0
|
)
|
(86.1
|
)
|
(120.4
|
)
|
Operating costs and expenses
|
|||||
|
Coal trading commodity futures, swaps and options
|
—
|
|
—
|
|
51.8
|
|
Other revenues
|
|||||
|
Insignificant items
|
(0.1
|
)
|
(0.5
|
)
|
(0.7
|
)
|
||||||
|
(27.7
|
)
|
(232.2
|
)
|
(385.7
|
)
|
Total before income taxes
|
||||||
|
9.1
|
|
85.9
|
|
134.0
|
|
Income tax benefit
|
||||||
|
$
|
(18.6
|
)
|
$
|
(146.3
|
)
|
$
|
(251.7
|
)
|
Total after income taxes
|
|||
(1)
Presented as gains (losses) in the consolidated statements of operations.
Comprehensive loss for the Predecessor periods differed from net loss by the amount of unrealized gain or loss resulting from valuation changes of the Company’s cash flow hedges (see Note 7. “Derivatives and Fair Value Measurements” and Note 8. “Coal Trading” for information related to the Company’s cash flow hedges), the change in actuarial loss and prior service cost of postretirement plans and workers’ compensation obligations (see Note 16. “Postretirement Health Care and Life Insurance Benefits,” Note 17. “Pension and Savings Plans” and Note 4. “Discontinued Operations” for information related to the Company’s postretirement and pension plans) and foreign currency translation adjustment related to the Company’s investments in Middlemount, whose functional currency is the Australian dollar. The values of the Company’s cash flow hedging instruments were primarily affected by the U.S. dollar/Australian dollar exchange rate and changes in the prices of certain coal and diesel fuel products.
|
Peabody Energy Corporation
|
2017 Form 10-K
|
F-
68
|
PEABODY ENERGY CORPORATION
NOTES TO CONSOLIDATED FINANCIAL STATEMENTS — (Continued)
|
(21)
|
Resource Management, Acquisitions and Other Commercial Events
|
Organizational Realignment
From time to time, the Company initiates restructuring activities in connection with its repositioning efforts to appropriately align its cost structure or optimize its coal production relative to prevailing global coal industry conditions. Costs associated with restructuring actions can include early mine closures, voluntary and involuntary workforce reductions, office closures and other related activities. Included in the Company’s consolidated statements of operations were aggregate restructuring charges, primarily comprised of cash severance costs of
$7.6 million
during the Successor period April 2 through December 31, 2017 and
$15.5 million
and
$23.5 million
during the years ended December 31, 2016 and 2015, respectively.
Divestitures and Other Transactions
On November 28, 2017, the Company paid
$3.0 million
for a third-party’s assumption of all rights and obligations related to a guarantee liability recorded pursuant to a 2007 transaction wherein the Company purchased approximately
345 million
tons of coal reserves and surface lands in the Illinois Basin. In conjunction with the 2007 purchase, the Company agreed to guarantee certain reclamation and bonding commitments of an affiliate of the seller. The Company extinguished its associated
$34.2 million
liability upon completion of the 2017 transaction and recorded a gain of
$31.2 million
which is included within “Net gain on disposals” in the accompanying consolidated statements of operations for the Successor period ended December 31, 2017.
On November 27, 2017, the Company completed the sale of the majority of its Burton Mine and related infrastructure to the Lenton Joint Venture for
$11.7 million
. The Lenton Joint Venture assumed the reclamation obligations associated with the assets acquired in the sale. The transaction reduced the Company’s asset retirement obligation by
$40.5 million
and reduced the amount of restricted cash held in support of such obligations by approximately
$30.0 million
. The Burton Mine, located in Queensland’s Bowen Basin, entered a care, maintenance and rehabilitation phase in December 2016 and had no carrying value at the time of sale. In connection with the transaction, the Company recorded a gain of
$52.2 million
which is included within “Net gain on disposals” in the accompanying consolidated statements of operations for the Successor period ended December 31, 2017.
On August 29, 2017, the Company entered into an agreement to sell its
50%
interest in the Red Mountain Joint Venture (RMJV) with BHP Billiton Mitsui Coal Pty Ltd (BMC) for
$20.0 million
. RMJV operates the coal handling and preparation plant utilized by the Company’s Millennium Mine. The transaction closed on February 6, 2018. BMC assumed the reclamation obligations and other commitments associated with the assets of RMJV. The Millennium Mine will have continued usage of the coal handling and preparation plant and the associated rail loading facility until the end of 2019.
The Company had a
37.5%
interest in Dominion Terminal Associates, a partnership that operates a coal export terminal in Newport News, Virginia that exports both metallurgical and thermal coal primarily to Europe and Brazil. On March 31, 2017, the Company completed a sale of its interest in Dominion Terminal Associates to Contura Terminal, LLC and Ashland Terminal, Inc., both of which are partners of the Dominion Terminal Associates. The Company collected
$20.5 million
in proceeds and recorded
$19.7 million
of gain on the sale, which was classified in “Net gain on disposals” in the consolidated statement of operations during the Predecessor period January 1, 2017 through April 1, 2017.
In November 2016, the Company entered into a definitive share sale and purchase agreement (SPA) for the sale of all of its equity interest in Metropolitan Collieries Pty Ltd, the entity that owns the Metropolitan Mine in New South Wales, Australia and the associated interest in the Port Kembla Coal Terminal, to South32 Limited (South32). The SPA provided for a cash purchase price of
$200.0 million
and certain contingent consideration, subject to a customary working capital adjustment. South32 terminated the agreement in April 2017 after it was unable to obtain necessary approvals from the Australian Competition and Consumer Commission within the timeframe required under the SPA. As a result of the termination, the Company retained an earnest deposit posted by South32 which was recorded in “Other revenues” in the accompanying consolidated statements of operations during the Successor period April 2, 2017 through December 31, 2017.
|
Peabody Energy Corporation
|
2017 Form 10-K
|
F-
69
|
PEABODY ENERGY CORPORATION
NOTES TO CONSOLIDATED FINANCIAL STATEMENTS — (Continued)
In May 2016, the Company completed the sale of its
5.06%
participation interest in the Prairie State Energy Campus to the Wabash Valley Power Association for
$57.1 million
. The Company recognized a gain on sale of
$6.2 million
related to the transaction, which was classified in “Net gain on disposals” in the consolidated statement of operations for the year ended December 31, 2016.
In May 2016, the Company entered into sale and purchase agreements with Australia-based Pembroke Resources to sell its interest in undeveloped metallurgical reserve tenements in Queensland’s Bowen Basin. The transaction included Olive Downs South, Olive Downs South Extended and Willunga tenements, which were sold for
$64.1 million
in cash plus a royalty stream. The Company recognized a gain on sale of
$2.8 million
related to those tenements, which was classified in “Net gain on disposals” in the consolidated statement of operations for the year ended December 31, 2016. The sale and purchase agreement for the remaining tenements, namely the Olive Downs North tenements, terminated in October 2017 as certain closing conditions were not satisfied within the prescribed time period.
In November 2015, the Company entered into a definitive agreement to sell its New Mexico and Colorado assets to Bowie Resource Partners, LLC (Bowie) in exchange for cash proceeds of
$358 million
and the assumption of certain liabilities. Bowie agreed to pay the Company a termination fee of
$20 million
(Termination Fee) in the event the Company terminated the agreement because Bowie failed to obtain financing and close the transaction. On April 12, 2016, Peabody terminated the agreement and demanded payment of the Termination Fee. Following a favorable judgment by the Bankruptcy Court, the Company collected the Termination Fee from Bowie. The Termination Fee is included in “Other revenues” in the accompanying consolidated statements of operations during the Successor period April 2, 2017 through December 31, 2017.
Joint Venture
In 2014, the Company agreed to establish an unincorporated joint venture project with Glencore plc (Glencore), in which each party will hold a
50%
interest, to combine the existing operations of the Company’s Wambo Open-Cut Mine in Australia with the adjacent coal reserves of Glencore’s United Mine. The Company expects the project to result in several operation synergies, including improved mining productivity, lower per-unit operating costs and an extended mine life. The joint venture operations are expected to commence in the fourth quarter of 2018, subject to substantive contingencies, including the requisite regulatory and permitting approvals. At such time as those contingencies have been resolved or are no longer considered to be substantive, the Company will account for its beneficial interest in the combined operations at fair value.
|
(22)
|
Earnings per Share (EPS)
|
Basic and diluted EPS are computed using the two-class method, which is an earnings allocation that determines EPS for each class of common stock and participating securities according to dividends declared and participation rights in undistributed earnings. The Company’s convertible preferred stock is considered a participating security because holders are entitled to receive dividends on an if-converted basis. The Predecessor Company’s restricted stock awards were considered participating securities because holders were entitled to receive non-forfeitable dividends during the vesting term.
Diluted EPS includes securities that could potentially dilute basic EPS during a reporting period and assumes that participating securities are not executed or converted. As such, the Company includes the share-based compensation awards in its potentially dilutive securities. The calculation of diluted EPS for the Predecessor Company also considered the impact of the Debentures. Dilutive securities are not included in the computation of loss per share when a company reports a net loss from continuing operations as the impact would be anti-dilutive.
For all but the Predecessor Company’s performance units, the potentially dilutive impact of the Company’s share-based compensation awards is determined using the treasury stock method. Under the treasury stock method, awards are treated as if they had been exercised with any proceeds used to repurchase common stock at the average market price during the period. Any incremental difference between the assumed number of shares issued and purchased is included in the diluted share computation.For the Predecessor Company’s performance units, their contingent features resulted in an assessment for any potentially dilutive common stock by using the end of the reporting period as if it were the end of the contingency period for all units granted. For further discussion of the Company’s share-based compensation awards, see Note 19. “Share-Based Compensation.”
Up to the time of cancellation, a conversion of the Debentures could have resulted in payment for any conversion value in excess of the principal amount of the Debentures in the Predecessor Company’s common stock. For diluted EPS purposes, potential common stock was calculated based on whether the market price of the Predecessor Company’s common stock at the end of each reporting period was in excess of the conversion price of the Debentures. The effect of the Debentures was excluded from the calculation of diluted EPS for all periods presented herein because to do so would have been anti-dilutive for those periods.
|
Peabody Energy Corporation
|
2017 Form 10-K
|
F-
70
|
PEABODY ENERGY CORPORATION
NOTES TO CONSOLIDATED FINANCIAL STATEMENTS — (Continued)
The computation of diluted EPS for the Successor Company excluded aggregate share-based compensation awards of less than
0.1 million
for the period
April 2 through December 31, 2017
. The computation of diluted EPS for the Predecessor Company excluded aggregate share-based compensation awards of approximately
0.2 million
,
0.4 million
and
0.6 million
for the period
January 1 through April 1, 2017
, and the years ended
December 31, 2016
and
2015
, respectively, because to do so would have been anti-dilutive for those periods. Because the potential dilutive impact of such share-based compensation awards is calculated under the treasury stock method, anti-dilution generally occurs when the exercise prices or unrecognized compensation cost per share of such awards are higher than the Company’s average stock price during the applicable period.
The following illustrates the earnings allocation method utilized in the calculation of basic and diluted EPS:
|
|
Successor
|
Predecessor
|
||||||||||||
|
|
April 2 through December 31, 2017
|
January 1 through April 1, 2017
|
Year Ended December 31, 2016
|
Year Ended December 31, 2015
|
||||||||||
|
|
(In millions, except per share amounts)
|
|||||||||||||
|
EPS numerator:
|
|
|
|
|
|
|
||||||||
|
Income (loss) from continuing operations, net of income taxes
|
$
|
713.1
|
|
$
|
(195.5
|
)
|
$
|
(663.8
|
)
|
$
|
(1,783.2
|
)
|
||
|
Less: Series A Convertible Preferred Stock dividends
|
179.5
|
|
—
|
|
—
|
|
—
|
|
||||||
|
Less: Net income attributable to noncontrolling interests
|
15.2
|
|
4.8
|
|
7.9
|
|
7.1
|
|
||||||
|
Income (loss) from continuing operations attributable to common stockholders, before allocation of earnings to participating securities
|
518.4
|
|
(200.3
|
)
|
(671.7
|
)
|
(1,790.3
|
)
|
||||||
|
Less: Earnings allocated to participating securities
|
129.0
|
|
—
|
|
—
|
|
—
|
|
||||||
|
Income (loss) from continuing operations attributable to common stockholders, after allocation of earnings to participating securities
(1)
|
389.4
|
|
(200.3
|
)
|
(671.7
|
)
|
(1,790.3
|
)
|
||||||
|
Loss from discontinued operations, net of income taxes
|
(19.8
|
)
|
(16.2
|
)
|
(57.6
|
)
|
(175.0
|
)
|
||||||
|
Less: Loss from discontinued operations allocated to participating securities
|
(4.9
|
)
|
—
|
|
—
|
|
—
|
|
||||||
|
Loss from discontinued operations attributable to common stockholders, after allocation of earnings to participating securities
|
(14.9
|
)
|
(16.2
|
)
|
(57.6
|
)
|
(175.0
|
)
|
||||||
|
Net income (loss) attributable to common stockholders, after allocation of earnings to participating securities
(1)
|
$
|
374.5
|
|
$
|
(216.5
|
)
|
$
|
(729.3
|
)
|
$
|
(1,965.3
|
)
|
||
|
EPS denominator:
|
|
|
|
|
|
|
||||||||
|
Weighted average shares outstanding — basic
|
101.1
|
|
18.3
|
|
18.3
|
|
18.1
|
|
||||||
|
Impact of dilutive securities
|
1.4
|
|
—
|
|
—
|
|
—
|
|
||||||
|
Weighted average shares outstanding — diluted
(2)
|
102.5
|
|
18.3
|
|
18.3
|
|
18.1
|
|
||||||
|
Basic EPS attributable to common stockholders:
|
|
|
|
|
|
|
||||||||
|
Income (loss) from continuing operations
|
$
|
3.85
|
|
$
|
(10.93
|
)
|
$
|
(36.72
|
)
|
$
|
(98.65
|
)
|
||
|
Loss from discontinued operations
|
(0.15
|
)
|
(0.88
|
)
|
(3.15
|
)
|
(9.64
|
)
|
||||||
|
Net income (loss) attributable to common stockholders
|
$
|
3.70
|
|
$
|
(11.81
|
)
|
$
|
(39.87
|
)
|
$
|
(108.29
|
)
|
||
|
Diluted EPS attributable to common stockholders:
|
||||||||||||||
|
Income (loss) from continuing operations
|
$
|
3.81
|
|
$
|
(10.93
|
)
|
$
|
(36.72
|
)
|
$
|
(98.65
|
)
|
||
|
Loss from discontinued operations
|
$
|
(0.14
|
)
|
$
|
(0.88
|
)
|
$
|
(3.15
|
)
|
$
|
(9.64
|
)
|
||
|
Net income (loss) attributable to common stockholders
|
$
|
3.67
|
|
$
|
(11.81
|
)
|
$
|
(39.87
|
)
|
$
|
(108.29
|
)
|
||
|
(1)
|
The reallocation adjustment for participating securities to arrive at the numerator to calculate diluted EPS was
$1.2 million
for the Successor period
April 2 through December 31, 2017
.
|
|
(2)
|
The two-class method assumes that participating securities are not exercised or converted. As such, weighted average diluted shares outstanding excluded
33.5 million
shares related to the participating securities for the Successor period
April 2 through December 31, 2017
.
|
|
Peabody Energy Corporation
|
2017 Form 10-K
|
F-
71
|
PEABODY ENERGY CORPORATION
NOTES TO CONSOLIDATED FINANCIAL STATEMENTS — (Continued)
In accordance with the Plan, each share of the Predecessor Company’s common stock outstanding prior to the Effective Date, including all options and warrants to purchase such stock, were extinguished, canceled and discharged, and each such share, option or warrant has no further force or effect after the Effective Date. Furthermore, all of the Predecessor Company’s equity award agreements under prior incentive plans, and the equity awards granted pursuant thereto, were extinguished, canceled and discharged and have no further force or effect after the Effective Date.
As of December 31, 2017, approximately
17.2 million
shares of Preferred Stock had been converted and
no
Warrants remained unexercised, which together resulted in the issuance of an additional
40.0 million
shares of Common Stock. As discussed in Note 13. “Current and Long-term Debt” and Note 18. “Stockholders’ Equity,” approximately
5.8 million
shares of Common Stock had been repurchased as of December 31, 2017.
(23) Management — Labor Relations
On
December 31, 2017
, the Company had approximately
7,100
employees worldwide, including approximately
5,500
hourly employees; the employee amounts exclude employees that were employed at operations classified as discontinued operations. Approximately
38%
of those hourly employees were represented by organized labor unions and were employed by mines that generated
20%
of the Company’s
2017
coal production from continuing operations. In the U.S.,
one
surface mine is represented by an organized labor union. In Australia, the coal mining industry is unionized and the majority of hourly workers employed at the Company’s Australian Mining operations are members of trade unions. The Construction Forestry Mining and Energy Union generally represents the Company’s Australian subsidiaries’ hourly production and engineering employees, including those employed through contract mining relationships. The Company believes labor relations with its employees are good. Should that condition change, the Company could experience labor disputes, work stoppages or other disruptions in production that could negatively impact the Company’s results of operations and cash flows.
The following table presents the Company’s active mining operations as of
December 31, 2017
in which the employees are represented by organized labor unions:
|
Mine
|
Current Agreement Expiration Date
|
|
|
U. S.
|
||
|
Kayenta
(1)
|
September 2019
|
|
|
Australia
|
||
|
Owner-operated mines:
|
||
|
Wambo Open-Cut
(2)
|
December 2018
|
|
|
Wambo Underground
(2)
|
April 2015
|
|
|
North Goonyella
(3)
|
December 2018
|
|
|
Metropolitan
(4)
|
January 2021
|
|
|
Millennium
(5)
|
March 2019
|
|
|
Wilpinjong
(6)
|
May 2020
|
|
|
Coppabella
(7)
|
December 2016
|
|
|
Moorvale
(8)
|
June 2020
|
|
|
Peabody Energy Corporation
|
2017 Form 10-K
|
F-
72
|
PEABODY ENERGY CORPORATION
NOTES TO CONSOLIDATED FINANCIAL STATEMENTS — (Continued)
|
(1)
|
Hourly workers at the Company’s Kayenta Mine in Arizona are represented by the UMWA under the Western Surface Agreement, which is effective through September 16, 2019. This agreement covers approximately
7%
of the Company’s U.S. subsidiaries’ hourly employees, who generated approximately
4%
of the Company’s U.S. production during the year ended
December 31, 2017
.
|
|
(2)
|
Employees of the Wambo Open-Cut Mine operate under a separate enterprise agreement which will expire in December 2018. Negotiations for a new agreement are expected to commence in the fourth quarter of 2018. There were no wage increases over the three-year term of the current labor agreement. Employees of the Company's Wambo Underground Mine operate under a separate labor agreement. That agreement expired in April 2015. The parties are currently renegotiating the new labor agreement and reached an agreement in principle which is subject to an employee vote in the first quarter of 2018. There have been no wage increases and no disruptions in the mine’s operations since the agreement expired. The Wambo coal handling and preparation plant hourly employees are under a separate labor agreement that expires in December 2018 and extension negotiations are expected to commence in the fourth quarter of 2018. Hourly employees of these mines comprise approximately
20%
of the Company’s Australian subsidiaries’ hourly employees, who generated approximately
19%
of the Company’s Australian production during the year ended
December 31, 2017
.
|
|
(3)
|
Employees of the North Goonyella Mine operate under a separate enterprise agreement which will expire in December 2018. Negotiations for a new agreement are expected to commence in the fourth quarter of 2018. There were no wage increases over the three-year term of the current labor agreement. Hourly employees of this mine comprise approximately
7%
of the Company’s Australian subsidiaries’ hourly employees, who generated approximately
11%
of the Company’s Australian production during the year ended December 31, 2017.
|
|
(4)
|
Employees of the Company’s Metropolitan Mine operate under a separate labor agreement, which expires in January 2021. There is also a deputy labor agreement which expired in September 2015. The parties have been in ongoing negotiations for an extension to the agreement. There have been no disruptions to the mine’s operations as a result of the expiration of the agreement. Hourly employees of this mine comprise approximately
12%
of the Company’s Australian subsidiaries’ hourly employees, who generated approximately
3%
of the Company’s Australian production during the year ended
December 31, 2017
.
|
|
(5)
|
In March 2017, the Company entered into a new two-year labor agreement which expires in March 2019. The new agreement has minimal wage increases. Hourly employees of this mine comprise approximately
15%
of the Company’s Australian subsidiaries’ hourly employees, who generated approximately
10%
of the Company’s Australian production during the year ended December 31, 2017.
|
|
(6)
|
In May 2017, the Company entered into a new three-year labor agreement which expires in May 2020. The new agreement has minimal wage increases. Hourly employees of this mine comprise approximately
21%
of the Company’s Australian subsidiaries’ hourly employees, who generated approximately
42%
of the Company’s Australian production during the year ended
December 31, 2017
.
|
|
(7)
|
Employees of the Company’s Coppabella Mine operate under a separate enterprise agreement which expired in December 2016. The negotiations for a new labor agreement are progressing and the parties reached an agreement in principle which is subject to an employee vote in the first quarter of 2018. There were no wage increases or disruptions to the mine’s operations as a result of the expiration of the agreement. Hourly employees of this mine comprise approximately
16%
of the Company’s Australian subsidiaries’ hourly employees, who generated approximately
9%
of the Company’s Australian production during the year ended
December 31, 2017
.
|
|
(8)
|
Employees of the Company’s Moorvale Mine operate on individual contracts underpinned by a non-union enterprise agreement. Employees are managed according to their individual contracts rather than the enterprise agreement. In July 2017, all employees signed a memorandum of understanding agreeing to a rollover of the existing enterprise agreement until June 20, 2020.
|
|
(24)
|
Financial Instruments, Guarantees With Off-Balance-Sheet Risk and Other Guarantees
|
In the normal course of business, the Company is a party to guarantees and financial instruments, some of which carry off-balance-sheet risk and are not reflected in the accompanying consolidated balance sheets. Such financial instruments are valued based on the amount of exposure under the instrument and the likelihood of required performance.
Reclamation Bonding
The Company is required to provide various forms of financial assurance in support of its mining reclamation obligations in the jurisdictions in which it operates. Such requirements are typically established by statute or under mining permits. Historically, such assurances have taken the form of third-party instruments such as surety bonds, bank guarantees, letters of credit, cash collateral held in restricted accounts, and self-bonding arrangements in the U.S. In connection with its emergence from the Chapter 11 Cases, the Company elected to utilize primarily a portfolio of surety bonds to support its U.S. obligations.
At
December 31, 2017
, the Company’s asset retirement obligations for its U.S. operations of
$457.9 million
were supported by surety bonds of
$1,075.2 million
, as well as letters of credit issued under the Company’s receivables securitization program and Revolver amounting to
$174.0 million
. At
December 31, 2017
, the Company’s asset retirement obligations for its Australia operations of
$233.2 million
were supported by a combination of
$205.2 million
of restricted cash and cash collateral,
$61.6 million
of bank guarantees and
$14.5 million
of similarly issued letters of credit.
|
Peabody Energy Corporation
|
2017 Form 10-K
|
F-
73
|
PEABODY ENERGY CORPORATION
NOTES TO CONSOLIDATED FINANCIAL STATEMENTS — (Continued)
Accounts Receivable Securitization
As described in Note 2. “Emergence from the Chapter 11 Cases and Fresh Start Reporting,” the Company entered into the Receivables Purchase Agreement to extend the receivables securitization facility previously in place and expand that facility to include certain receivables from the Company’s Australian operations. The term of the receivables securitization program (Securitization Program) ends on April 3, 2020, subject to certain liquidity requirements and other customary events of default set forth in the Receivables Purchase Agreement. The Securitization Program provides for up to
$250.0 million
in funding accounted for as a secured borrowing, limited to the availability of eligible receivables, and may be secured by a combination of cash collateral and the trade receivables underlying the program, from time to time. Funding capacity under the Securitization Program may also be drawn upon for letters of credit in support of other obligations. During 2017, the Company entered into amendments to the Securitization Program to include the receivables of additional Australian operations, reduce the restrictions on the availability of certain eligible receivables, add an additional servicer and reduce program fees.
Under the terms of the Securitization Program, the Company contributes the trade receivables of its participating subsidiaries on a revolving basis to P&L Receivables, its wholly-owned, bankruptcy-remote subsidiary, which then sells the receivables to unaffiliated banks. P&L Receivables retains the ability to repurchase the receivables in certain circumstances. The assets and liabilities of P&L Receivables are consolidated with Peabody, and the Securitization Program is treated as a secured borrowing for accounting purposes, but the assets of P&L Receivables will be used first to satisfy the creditors of P&L Receivables, not Peabody’s creditors. The borrowings under the Securitization Program remain outstanding throughout the term of the agreement, subject to the Company maintaining sufficient eligible receivables, by continuing to contribute trade receivables to P&L Receivables, unless an event of default occurs.
At
December 31, 2017
, the Company had
no
outstanding borrowings and
$169.5 million
of letters of credit drawn under the Securitization Program. The letters of credit were primarily in support of portions of the Company’s obligations for reclamation, workers’ compensation and postretirement benefits. The Company had
no
cash collateral requirement under the Securitization Program at
December 31, 2017
and
$40.5 million
required under its former receivables securitization facility in place prior to the Effective Date at December 31, 2016. The Company incurred fees associated with the Securitization Program of
$5.3 million
during the Successor period April 2, 2017 through
December 31, 2017
, which have been recorded as “Interest expense” in the accompanying statements of operations. As it relates to the former receivables securitization facility in place prior to the Effective Date, the Company incurred interest expense of
$2.0 million
during the Predecessor Period January 1, 2017 through April 1, 2017 and
$8.2 million
and
$1.8 million
for the years ended
December 31, 2016
and 2015.
Restricted Cash Collateral
The Company has restricted cash held as collateral for financial assurances associated with a variety of long-term obligations and commitments surrounding the mining, reclamation and shipping of its production. At
December 31, 2017
and
December 31, 2016
, the Company had
$323.1 million
and
$529.3 million
, respectively, related to such obligations. The Company also had
$40.1 million
and
$13.8 million
of restricted cash at
December 31, 2017
and
December 31, 2016
, respectively, related to various short-term obligations.
Other
The Company is the lessee under numerous equipment and property leases. It is common in such commercial lease transactions for the Company, as the lessee, to agree to indemnify the lessor for the value of the property or equipment leased, should the property be damaged or lost during the course of the Company’s operations. The Company expects that losses with respect to leased property, if any, would be covered by insurance (subject to deductibles). The Company and certain of its subsidiaries have guaranteed other subsidiaries’ performance under various lease obligations. Aside from indemnification of the lessor for the value of the property leased, the Company’s maximum potential obligations under its leases are equal to the respective future minimum lease payments, and the Company assumes that no amounts could be recovered from third parties.
The Company has provided financial guarantees under certain long-term debt agreements entered into by its subsidiaries and substantially all of the Company’s U.S. subsidiaries provide financial guarantees under long-term debt agreements entered into by the Company. The maximum amounts payable under the Company’s debt agreements are equal to the respective principal and interest payments.
|
Peabody Energy Corporation
|
2017 Form 10-K
|
F-
74
|
PEABODY ENERGY CORPORATION
NOTES TO CONSOLIDATED FINANCIAL STATEMENTS — (Continued)
|
(25)
|
Commitments and Contingencies
|
Commitments
Unconditional Purchase Obligations
As of
December 31, 2017
, purchase commitments for capital expenditures were
$159.0 million
, all of which is obligated within the next three years, with
$41.9 million
obligated in the next year.
In Australia, the Company has generally secured the ability to transport coal through rail contracts and ownership interests in five east coast coal export terminals that are primarily funded through take-or-pay arrangements with terms ranging up to
25
years. In the U.S., the Company has entered into certain long-term coal export terminal agreements to secure export capacity through the Gulf Coast. As of
December 31, 2017
, these Australian and U.S. commitments under take-or-pay arrangements totaled
$1.3 billion
, of which approximately
$182 million
is obligated within the next year.
Contingencies
From time to time, the Company or its subsidiaries are involved in legal proceedings arising in the ordinary course of business or related to indemnities or historical operations. The Company believes it has recorded adequate reserves for these liabilities. The Company discusses its significant legal proceedings below, including ongoing proceedings and those that impacted the Company’s results of operations for the periods presented.
Effect of Automatic Stay.
The Debtors filed voluntary petitions for relief under the Bankruptcy Code on the Petition Date in the Bankruptcy Court. During the pendency of the Chapter 11 Cases, each of the Debtors continued to operate its business and manage its property as a debtor-in-possession pursuant to Sections 1107 and 1108 of the Bankruptcy Code. Subject to certain exceptions under the Bankruptcy Code, the filing of the Debtors’ Chapter 11 Cases, pursuant to Section 362(a) of the Bankruptcy Code, automatically enjoined, or stayed, among other things, the continuation of most judicial or administrative proceedings or the filing of other actions against or on behalf of the Debtors or their property to recover on, collect or secure a claim arising prior to the Petition Date or to exercise control over property of the Debtors’ bankruptcy estates.
The automatic stay was lifted when the Plan became effective on April 3, 2017 and was replaced by the injunction provisions under the Debtors’ confirmed Plan. The Plan’s injunction provisions provide that all holders of prepetition claims or interests are enjoined, or stayed, from, among other things, (a) commencing, conducting or continuing any suit, action or other proceeding against the Debtors, their estates or the reorganized Debtors, (b) enforcing, levying, attaching, collecting or otherwise recovering an award against the Debtors, their property or the assets or property of the reorganized Debtors, (c) creating, perfecting or otherwise enforcing a lien against the Debtors, their estates or the reorganized Debtors, and (d) asserting any setoff, right of subrogation or recoupment against any obligation due a Debtor or a reorganized Debtor.
The Chapter 11 Cases impacted the liabilities of the Debtors described below and in Note 4. “Discontinued Operations,” as well as certain other contingent liabilities the Debtors may have. For example, if a contingent litigation liability of the Debtors is ultimately allowed as a prepetition claim under the Bankruptcy Code, that claim will be subject to the applicable treatment set forth in the Plan and be discharged pursuant to the terms of the Plan.
A group of creditors (the Ad Hoc Committee) that held certain interests in the Company's prepetition indebtedness appealed the Bankruptcy Court's order confirming the Plan. On December 29, 2017, the United States District Court for the Eastern District of Missouri (the District Court) entered an order dismissing the Ad Hoc Committee's appeal, and, in the alternative, affirming the order confirming the Plan. On January 26, 2018, the Ad Hoc Committee appealed the District Court's order to the United States Court of Appeals for the Eighth Circuit (the Eighth Circuit). In its appeal, the Ad Hoc Committee does not ask the Eighth Circuit to reverse the order confirming the Plan. Instead, the Ad Hoc Committee asks the Eighth Circuit to award the Ad Hoc Committee members either unspecified damages or the right to buy an unspecified amount of Company stock at a discount. The Company does not believe the appeal is meritorious and will vigorously defend it.
|
Peabody Energy Corporation
|
2017 Form 10-K
|
F-
75
|
PEABODY ENERGY CORPORATION
NOTES TO CONSOLIDATED FINANCIAL STATEMENTS — (Continued)
Litigation Relating to Continuing Operations
Peabody Monto Coal Pty Ltd, Monto Coal 2 Pty Ltd and Peabody Energy Australia PCI Pty Ltd (PEA-PCI).
In October 2007, a statement of claim was delivered to Peabody Monto Coal Pty Ltd, a wholly-owned subsidiary of PEA-PCI, that was then known as Macarthur Coal Limited, and Monto Coal 2 Pty Ltd, an equity accounted investee, from the minority interest holders in the Monto Coal Joint Venture, alleging that Monto Coal 2 Pty Ltd breached the Monto Coal Joint Venture Agreement and Peabody Monto Coal Pty Ltd breached the Monto Coal Management Agreement. Peabody Monto Coal Pty Ltd is the manager of the Monto Coal Joint Venture pursuant to the Management Agreement. Monto Coal 2 Pty Ltd holds a
51%
interest in the Monto Coal Joint Venture. The plaintiffs are Sanrus Pty Ltd, Edge Developments Pty Ltd and H&J Enterprises (Qld) Pty Ltd. An additional statement of claim was delivered to PEA-PCI in November 2010 from the same minority interest holders in the Monto Coal Joint Venture, alleging that PEA-PCI induced Monto Coal 2 Pty Ltd and Peabody Monto Coal Pty Ltd to breach the Monto Coal Joint Venture Agreement and the Monto Coal Management Agreement, respectively. The plaintiffs later amended their claim to allege damages for lost opportunities to sell their joint venture interest. These actions, which are pending before the Supreme Court of Queensland, Australia, seek damages from the three defendants collectively of amounts ranging from
$15.6 million
Australian dollars to
$1.8 billion
Australian dollars, plus interest and costs. The defendants dispute the claims and are vigorously defending their positions. Orders have been made by the court relating to trial preparation steps, with the steps expected to be completed by the end of April 2018. The court ordered the parties to participate in a mediation by the end of August 2018 and expects to set some trial dates in the second half of 2018 with the remainder of trial to be completed in 2019. Based on the Company’s evaluation of the issues and their potential impact, the amount of any future loss currently cannot be reasonably estimated.
Berenergy Corporation.
The Company has been in a legal dispute with Berenergy Corporation (Berenergy) regarding Berenergy’s access to certain of its underground oil deposits beneath the Company’s North Antelope Rochelle Mine and contiguous undisturbed areas. The Company believes that any claims related to this matter constitute prepetition claims. On October 13, 2016, the Sixth Judicial Court in the state of Wyoming (Wyoming Court) entered an order (Wyoming Court Decision) allowing the Company the right to mine through certain wells owned by Berenergy but required the Company to compensate Berenergy for damages of
$0.9 million
, which the Company recognized during 2016. Further, the Wyoming Court ruled that should Berenergy obtain approval from the Wyoming Oil and Gas Conservation Commission (the Commission) to recover certain secondary deposits beneath the mine’s contiguous undisturbed areas, the Company would be liable to Berenergy for the cost of certain special procedures and equipment required to access the secondary deposits remotely from outside the Company’s mine area, which has been estimated as
$13.1 million
by Berenergy. Berenergy so far has not applied to the Commission for approval and the Company believes it is not probable that the Commission would approve access to the secondary deposits if Berenergy applied based on the Company’s view of a lack of economic feasibility and certain restrictions on Berenergy’s legal claim to the deposits. Based upon these factors, the Company has not accrued a liability related to the secondary deposits as of December 31, 2017. On December 21, 2016, Berenergy filed a Notice of Appeal with the Wyoming Supreme Court of the Wyoming Court Decision. On January 5, 2017, Peabody filed a Notice of Cross-Appeal with the Wyoming Supreme Court of the Wyoming Court Decision. Both parties filed appellate briefs on April 17, 2017. The matter before the Wyoming Supreme Court has been fully briefed by the parties and oral arguments were held on August 16, 2017. On June 22, 2017, the Bankruptcy Court entered an order disallowing Berenergy’s proof of claim for the amounts awarded in the Wyoming Court Decision, which the Company believes discharged its obligation to pay these amounts. On January 4, 2018, the Wyoming Supreme Court vacated the Wyoming Court Decision and remanded the case with instructions to dismiss the case if the federal lessors could not be joined. On February 6, 2018, the Wyoming Supreme Court ordered a rehearing to decide whether its January 4, 2018 decision would apply to Berenergy’s access rights under a private, as opposed to a Federal, lease.
County of San Mateo, County of Marin, City of Imperial Beach.
The Company was named as a defendant, along with numerous other companies, in three nearly identical lawsuits. The lawsuits seek to hold a wide variety of companies that produce fossil fuels liable for the alleged impacts of the greenhouse gas emissions attributable to those fuels. The lawsuits primarily assert that the companies’ products have caused a sea level rise that is damaging the plaintiffs. The complaints specifically alleged that the defendants’ activities from 1965 to 2015 caused such damage. The Company filed a motion to enforce the Confirmation Order in the Bankruptcy Court because the Confirmation Order enjoins claims that arose before the effective date of the Plan. The motion to enforce was heard on October 5, 2017 and granted on October 24, 2017. The Bankruptcy Court ordered the plaintiffs to dismiss their lawsuits against the Company. On November 26, 2017, the plaintiffs appealed the Bankruptcy Court’s October 24, 2017 order to the U.S. District Court for the Eastern District of Missouri. On November 28, 2017, plaintiffs sought a stay pending appeal from the Bankruptcy Court, which was denied December 8, 2017. On December 19, 2017, the plaintiffs moved the U.S. District Court for the Eastern District of Missouri for a stay pending appeal. In the underlying cases pending in California, the parties are litigating whether the complaints should be heard in federal or state court.
|
Peabody Energy Corporation
|
2017 Form 10-K
|
F-
76
|
PEABODY ENERGY CORPORATION
NOTES TO CONSOLIDATED FINANCIAL STATEMENTS — (Continued)
10th Circuit U.S. Bureau of Land Management (BLM) Appeal.
On September 15, 2017, the Tenth Circuit Court of Appeals reversed the District Court of Wyoming’s decision upholding BLM’s approval of four coal leases in the Powder River Basin. Two of the four leases relate to the Company’s North Antelope Rochelle Mine in Wyoming. There is no immediate impact on the Company’s leases as the Court of Appeals did not vacate the leases as part of its ruling. Rather, the Court of Appeals remanded the case back to the District Court with directions to order BLM to revise its environmental analysis. On November 27, 2017, the District Court remanded BLM to revise its environmental analysis. On January 31, 2018, the federal respondents filed a status report advising the District Court that they would conduct an environmental assessment to remedy the National Environmental Policy Act defect found by the Tenth Circuit, and anticipated that the environmental assessment would be completed in approximately six months. The Company’s operations will continue in the normal course during this period since the decision has no impact on mining at this time. The Company currently believes that its operations are unlikely to be materially impacted by this case, but the timing and magnitude of any impact on the Company’s future operations is not certain.
Wilpinjong Extension Project (WEP).
Wollar Progress Association has applied to the Land & Environment Court for a judicial review of the New South Wales Planning Assessment Commission’s decision to approve the WEP. The matter was heard by the court in early February 2018. However, a decision has not yet been ordered. In the interim, the Company’s Wilpinjong Mine continues to mine in accordance with its approvals.
Claims, Litigation and Settlements Relating to Indemnities or Historical Operations
Environmental Claims and Litigation Arising From Historical, Non-Coal Producing Operations.
Gold Fields Mining, LLC (Gold Fields) is a non-coal producing entity that was previously managed and owned by Hanson plc, the Company’s predecessor owner. In a February 1997 spin-off, Hanson plc transferred ownership of Gold Fields to PEC despite the fact that Gold Fields and many of its subsidiaries had no ongoing operations and PEC had no prior involvement in the past operations of Gold Fields and its subsidiaries. Prior to the Effective Date, Gold Fields was one of PEC’s subsidiaries. As part of separate transactions, both PEC and Gold Fields agreed to indemnify Blue Tee with respect to certain claims relating to the historical operations of a predecessor of Blue Tee, which is a former affiliate of Gold Fields. Neither PEC nor Gold Fields had any involvement with the past operations of the Blue Tee predecessor. Environmental assessments for remediation, past and future costs, and/or natural resource damages were also asserted by the United States Environmental Protection Agency (EPA) and natural resources trustees against Gold Fields related to historical activities of Gold Fields’ predecessor.
As a result of filing the Chapter 11 Cases, Gold Fields ceased its response actions and other engagements with the EPA at these sites and ceased paying remediation costs on Blue Tee’s behalf. During the Chapter 11 Cases, Blue Tee and several governmental entities including the EPA, the Department of the Interior and several states filed claims against Gold Fields and PEC and objections to the Plan. Gold Fields and PEC filed various objections to the claims.
On March 16, 2017, the Debtors agreed to settle the objections to the Plan filed by Blue Tee and several government entities in the Chapter 11 Cases. Under the settlements, the Debtors will (1) not seek to recover federal tax refunds owed to Debtors in the amount of approximately
$11 million
; (2) transfer
$12 million
of insurance settlement proceeds from Century and Pacific Employers Insurance Company relating to environmental liabilities to the Gold Fields Liquidating Trust (as described in the Plan); and (3) pay
$20 million
to the Gold Fields Liquidating Trust. On March 16 and 17, 2017, the Bankruptcy Court entered orders approving these settlements. On July 13, 2017, the Debtors and government entities entered into a settlement agreement to reflect the above settlement. Notice of the settlement agreement was given in the Federal Register on July 20, 2017. On September 5, 2017, the Bankruptcy Court gave final approval of the settlement agreement after the notice and comment period expired. As of the Effective Date, all Gold Fields assets and liabilities have been transferred to the Gold Fields Liquidating Trust and the Reorganized Debtors have no further obligations with respect to Gold Fields.
Other
At times the Company becomes a party to other disputes, including those related to contract miner performance, claims, lawsuits, arbitration proceedings, regulatory investigations and administrative procedures in the ordinary course of business in the U.S., Australia and other countries where the Company does business. Based on current information, the Company believes that such other pending or threatened proceedings are likely to be resolved without a material adverse effect on its financial condition, results of operations or cash flows.
|
Peabody Energy Corporation
|
2017 Form 10-K
|
F-
77
|
PEABODY ENERGY CORPORATION
NOTES TO CONSOLIDATED FINANCIAL STATEMENTS — (Continued)
|
(26)
|
Summary of Quarterly Financial Information (Unaudited)
|
A summary of the unaudited quarterly results of operations for the years ended
December 31, 2017
and
2016
is presented below.
|
|
Year Ended December 31, 2017
|
|||||||||||||||||
|
Predecessor
|
Successor
|
|||||||||||||||||
|
|
First Quarter
|
April 1
|
April 2 through June 30
|
Third Quarter
|
Fourth Quarter
|
|||||||||||||
|
|
(In millions, except per share data)
|
|||||||||||||||||
|
Revenues
|
$
|
1,326.2
|
|
$
|
—
|
|
$
|
1,258.3
|
|
$
|
1,477.2
|
|
$
|
1,517.1
|
|
|||
|
Operating profit
|
198.1
|
|
—
|
|
146.0
|
|
202.9
|
|
338.2
|
|
||||||||
|
Income (loss) from continuing operations, net of income taxes
|
124.3
|
|
(319.8
|
)
|
101.4
|
|
233.7
|
|
378.0
|
|
||||||||
|
Net income (loss)
|
120.2
|
|
(331.9
|
)
|
98.7
|
|
230.0
|
|
364.6
|
|
||||||||
|
Net income (loss) attributable to common stockholders
|
115.4
|
|
(331.9
|
)
|
(20.2
|
)
|
201.4
|
|
317.4
|
|
||||||||
|
Basic EPS — continuing operations
(1)
|
$
|
6.46
|
|
$
|
(17.44
|
)
|
$
|
(0.18
|
)
|
$
|
1.51
|
|
$
|
2.50
|
|
|||
|
Diluted EPS — continuing operations
(1)
|
$
|
6.44
|
|
$
|
(17.44
|
)
|
$
|
(0.18
|
)
|
$
|
1.49
|
|
$
|
2.47
|
|
|||
|
Weighted average shares used in calculating basic EPS
|
18.3
|
|
18.3
|
|
96.8
|
|
101.6
|
|
104.8
|
|
||||||||
|
Weighted average shares used in calculating diluted EPS
|
18.4
|
|
18.3
|
|
96.8
|
|
103.1
|
|
106.5
|
|
||||||||
|
(1)
|
EPS for the quarters may not sum to the amounts for the year as each period is computed on a discrete basis.
|
Operating profit for the first quarter of
2017
included
$30.5 million
of asset impairment costs, related to terminated coal lease contracts in the Midwestern U.S. Operating profit for the fourth quarter of
2017
reflected
$45.2 million
of net mark-to-market gains on actuarially determined liabilities partially offset by
$6.6 million
of restructuring charges. The operating profit for the fourth quarter of
2017
also included net gain on disposals of
$83.1 million
, primarily driven by the sale of the Burton Mine and the extinguishment of a guarantee liability for reclamation and bonding commitments of
$52.2 million
and
$31.2 million
, respectively. Operating profit for the first, third and fourth quarters of
2017
, as well as the period April 2 through June 30,
2017
included steady income from equity affiliates of
$15.0 million
,
$10.5 million
,
$22.8 million
, and
$15.7 million
, respectively, due to favorable coal pricing at Middlemount. Income from continuing operations, net of income taxes for the first quarter and April 1,
2017
reflected
$41.4 million
and
$585.8 million
, respectively, of reorganization items, net due to the Company’s emergence from the Chapter 11 Cases. Income from continuing operations, net of income taxes for the period April 2 through June 30,
2017
and the third quarter of
2017
reflected
$41.4 million
and
$42.5 million
, respectively, of interest expense, while the fourth quarter experienced a decrease in interest expense due to prepayments on the Senior Secured Term Loan, reducing interest payments. Income from continuing operations, net of income taxes for the third and fourth quarters of
2017
included a loss on debt extinguishment of
$12.9 million
and
$8.0 million
, respectively, resulting from the prepayments of the Senior Secured Term Loan.
|
|
Year Ended December 31, 2016
|
||||||||||||||
|
Predecessor
|
|||||||||||||||
|
|
First Quarter
|
Second Quarter
|
Third Quarter
|
Fourth Quarter
|
|||||||||||
|
|
(In millions, except per share data)
|
||||||||||||||
|
Revenues
|
$
|
1,027.2
|
|
$
|
1,040.2
|
|
$
|
1,207.1
|
|
$
|
1,440.8
|
|
|||
|
Operating profit (loss)
|
(102.7
|
)
|
(107.7
|
)
|
(21.6
|
)
|
(44.9
|
)
|
|||||||
|
Loss from continuing operations, net of income taxes
|
(167.7
|
)
|
(223.2
|
)
|
(97.7
|
)
|
(175.2
|
)
|
|||||||
|
Net loss
|
(171.1
|
)
|
(226.2
|
)
|
(135.8
|
)
|
(188.3
|
)
|
|||||||
|
Net loss attributable to common stockholders
|
(171.1
|
)
|
(227.9
|
)
|
(137.6
|
)
|
(192.7
|
)
|
|||||||
|
Basic and diluted EPS — continuing operations
(1)
|
$
|
(9.17
|
)
|
$
|
(12.30
|
)
|
$
|
(5.44
|
)
|
$
|
(9.82
|
)
|
|||
|
Weighted average shares used in calculating basic and diluted EPS
|
18.3
|
|
18.3
|
|
18.3
|
|
18.3
|
|
|||||||
|
(1)
|
EPS for the quarters may not sum to the amounts for the year as each period is computed on a discrete basis.
|
|
Peabody Energy Corporation
|
2017 Form 10-K
|
F-
78
|
PEABODY ENERGY CORPORATION
NOTES TO CONSOLIDATED FINANCIAL STATEMENTS — (Continued)
Operating loss for the first quarter and second quarter of 2016 reflected
$26.4 million
and
$10.3 million
of debt restructuring costs, respectively. Operating loss for the first and fourth quarters of 2016 included
$17.2 million
and
$230.7 million
of asset impairment costs, respectively, primarily driven by the impairment of Metropolitan Mine to reflect estimated selling price. The operating loss for the second quarter of 2016 included net gain on disposals of
$13.7 million
, primarily driven by net gains on sale of the Olive Downs South tenements and participation interest in Prairie State Energy Campus of
$2.8 million
and
$6.2 million
, respectively. Operating loss for the fourth quarter of 2016 included income from equity affiliates of
$28.8 million
, due to favorable coal pricing at Middlemount. Loss from continuing operations, net of income taxes for the first quarter included
$126.2 million
of interest expense, while the following three quarters experienced significant decreases in interest expense due to the bankruptcy filing and stay of interest payments. Loss from continuing operations, net of income taxes for the second, third and fourth quarters of 2016 reflected
$95.4 million
,
$29.7 million
and
$33.9 million
of reorganization items, net due to the bankruptcy filing and ongoing Chapter 11 cases, respectively. Loss from continuing operations, net of income taxes for the fourth quarter of 2016 included a loss on debt extinguishment of
$29.5 million
resulting from the repayment of debtor-in-possession term loan. Loss from discontinued operations, net of income for the third and fourth quarters reflected
$38.1 million
and
$13.1 million
of Patriot bankruptcy related charges associated with black lung liabilities and the UMWA Combined Benefit fund, respectively.
|
(27)
|
Segment and Geographic Information
|
The Company reports its results of operations primarily through the following reportable segments: Powder River Basin Mining, Midwestern U.S. Mining, Western U.S. Mining, Australian Metallurgical Mining, Australian Thermal Mining, Trading and Brokerage and Corporate and Other.
The principal business of the Company’s mining segments in the U.S. is the mining, preparation and sale of thermal coal, sold primarily to electric utilities in the U.S. under long-term contracts, with a portion sold into the seaborne markets as market conditions warrant. The Company’s Powder River Basin Mining operations consist of its mines in Wyoming. The mines in that segment are characterized by surface mining extraction processes, coal with a lower sulfur content and Btu and higher customer transportation costs (due to longer shipping distances). The Company’s Midwestern U.S. Mining operations include the Company’s Illinois and Indiana mining operations, which are characterized by a mix of surface and underground mining extraction processes, coal with a higher sulfur content and Btu and lower customer transportation costs (due to shorter shipping distances). The Company’s Western U.S. Mining operations reflect the aggregation of the New Mexico, Arizona and Colorado mining operations. The mines in that segment are characterized by a mix of surface and underground mining extraction processes and coal with a mid-range sulfur content and Btu. Geologically, the Company’s Powder River Basin Mining operations mine sub-bituminous coal deposits, its Midwestern U.S. Mining operations mine bituminous coal deposits and its Western U.S. Mining operations mine both bituminous and sub-bituminous coal deposits.
The business of the Company’s Australian operating platform is primarily export focused with customers spread across several countries, while a portion of the metallurgical and thermal coal is sold within Australia. Generally, revenues from individual countries vary year by year based on electricity and steel demand, the strength of the global economy, governmental policies and several other factors, including those specific to each country. The Company’s Australian Metallurgical Mining operations consist of mines in Queensland and one in New South Wales, Australia. The mines in that segment are characterized by both surface and underground extraction processes used to mine various qualities of metallurgical coal (low-sulfur, high Btu coal). The metallurgical coal qualities include hard coking coal, semi-hard coking coal, semi-soft coking coal and pulverized coal injection coal. The Company’s Australian Thermal Mining operations consist of mines in New South Wales, Australia. The mines in that segment are characterized by both surface and underground extraction processes used to mine low-sulfur, high Btu thermal coal. The Company classifies its Australian mines within the Australian Metallurgical Mining or Australian Thermal Mining segments based on the primary customer base and coal reserve type of each mining operation. A small portion of the coal mined by the Australian Metallurgical Mining segment is of a thermal grade. Similarly, a small portion of the coal mined by the Australian Thermal Mining segment is of a metallurgical grade. Additionally, the Company may market some of its metallurgical coal products as a thermal coal product from time to time depending on market conditions.
The Company’s Trading and Brokerage segment engages in the direct and brokered trading of coal and freight-related contracts through its trading and business offices. Coal brokering is conducted both as principal and agent in support of various coal production-related activities that may involve coal produced from the Company’s mines, coal sourcing arrangements with third-party mining companies or offtake agreements with other coal producers. The Trading and Brokerage segment also provides transportation-related services, which involves both financial derivative contracts and physical contracts. Collectively, coal and freight-related hedging activities include both economic hedging and, from time to time, cash flow hedging in support of the Company’s coal trading strategy.
|
Peabody Energy Corporation
|
2017 Form 10-K
|
F-
79
|
PEABODY ENERGY CORPORATION
NOTES TO CONSOLIDATED FINANCIAL STATEMENTS — (Continued)
The Company’s Corporate and Other segment includes selling and administrative expenses, corporate hedging activities, certain mining and export/transportation joint ventures, restructuring charges and activities associated with the optimization of coal reserve and real estate holdings, minimum charges on certain transportation-related contracts, the closure of inactive mining sites and certain energy-related commercial matters.
The Company’s chief operating decision maker (CODM) uses Adjusted EBITDA as the primary metric to measure the segments’ operating performance. Adjusted EBITDA is defined as income (loss) from continuing operations before deducting net interest expense, income taxes, asset retirement obligation expenses, depreciation, depletion and amortization and reorganization items, net. Adjusted EBITDA is also adjusted for the discrete items, which are reflected in the reconciliation below, that management excluded in analyzing the segments’ operating performance. Adjusted EBITDA is not intended to serve as an alternative to U.S. GAAP measures of performance and may not be comparable to similarly-titled measures presented by other companies.
Segment results for the Successor period
April 2 through December 31, 2017
were as follows:
|
Successor
|
|||||||||||||||||||||||||||||||
|
Powder River Basin Mining
|
Midwestern
U.S. Mining |
Western
U.S. Mining |
Australian Metallurgical Mining
|
Australian Thermal Mining
|
Trading and
Brokerage |
Corporate
and Other |
Consolidated
|
||||||||||||||||||||||||
|
|
(Dollars in millions)
|
||||||||||||||||||||||||||||||
|
Revenues
|
$
|
1,178.7
|
|
$
|
592.3
|
|
$
|
440.7
|
|
$
|
1,221.0
|
|
$
|
772.5
|
|
$
|
33.6
|
|
$
|
13.8
|
|
$
|
4,252.6
|
|
|||||||
|
Adjusted EBITDA
|
278.8
|
|
124.4
|
|
131.8
|
|
414.9
|
|
306.6
|
|
(6.9
|
)
|
(104.3
|
)
|
1,145.3
|
|
|||||||||||||||
|
Additions to property, plant, equipment and mine development
|
32.6
|
|
21.7
|
|
13.8
|
|
56.0
|
|
39.2
|
|
—
|
|
3.3
|
|
166.6
|
|
|||||||||||||||
|
Income from equity affiliates
|
—
|
|
—
|
|
—
|
|
—
|
|
—
|
|
—
|
|
(49.0
|
)
|
(49.0
|
)
|
|||||||||||||||
Segment results for the Predecessor period
January 1 through April 1, 2017
were as follows:
|
Predecessor
|
|||||||||||||||||||||||||||||||
|
Powder River Basin Mining
|
Midwestern
U.S. Mining
|
Western
U.S. Mining
|
Australian Metallurgical Mining
|
Australian Thermal Mining
|
Trading and
Brokerage
|
Corporate
and Other
|
Consolidated
|
||||||||||||||||||||||||
|
|
(Dollars in millions)
|
||||||||||||||||||||||||||||||
|
Revenues
|
$
|
394.3
|
|
$
|
193.2
|
|
$
|
149.7
|
|
$
|
328.9
|
|
$
|
224.8
|
|
$
|
15.0
|
|
$
|
20.3
|
|
$
|
1,326.2
|
|
|||||||
|
Adjusted EBITDA
|
91.7
|
|
50.0
|
|
50.0
|
|
109.6
|
|
75.6
|
|
8.8
|
|
(44.4
|
)
|
341.3
|
|
|||||||||||||||
|
Additions to property, plant, equipment and mine development
|
19.3
|
|
2.8
|
|
3.1
|
|
5.2
|
|
2.3
|
|
—
|
|
0.1
|
|
32.8
|
|
|||||||||||||||
|
Federal coal lease expenditures
|
—
|
|
—
|
|
0.5
|
|
—
|
|
—
|
|
—
|
|
—
|
|
0.5
|
|
|||||||||||||||
|
Income from equity affiliates
|
—
|
|
—
|
|
—
|
|
—
|
|
—
|
|
—
|
|
(15.0
|
)
|
(15.0
|
)
|
|||||||||||||||
|
Peabody Energy Corporation
|
2017 Form 10-K
|
F-
80
|
PEABODY ENERGY CORPORATION
NOTES TO CONSOLIDATED FINANCIAL STATEMENTS — (Continued)
Segment results for the year ended
December 31, 2016
were as follows:
|
Predecessor
|
|||||||||||||||||||||||||||||||
|
Powder River Basin Mining
|
Midwestern
U.S. Mining
|
Western
U.S. Mining
|
Australian Metallurgical Mining
|
Australian Thermal Mining
|
Trading and
Brokerage
|
Corporate
and Other
|
Consolidated
|
||||||||||||||||||||||||
|
|
(Dollars in millions)
|
||||||||||||||||||||||||||||||
|
Revenues
|
$
|
1,473.3
|
|
$
|
792.5
|
|
$
|
526.0
|
|
$
|
1,090.4
|
|
$
|
824.9
|
|
$
|
28.9
|
|
$
|
(20.7
|
)
|
$
|
4,715.3
|
|
|||||||
|
Adjusted EBITDA
|
379.9
|
|
217.3
|
|
101.6
|
|
(16.3
|
)
|
217.6
|
|
(32.4
|
)
|
(335.7
|
)
|
532.0
|
|
|||||||||||||||
|
Additions to property, plant, equipment and mine development
|
33.0
|
|
18.7
|
|
20.8
|
|
29.9
|
|
22.1
|
|
—
|
|
2.1
|
|
126.6
|
|
|||||||||||||||
|
Federal coal lease expenditures
|
248.4
|
|
—
|
|
0.6
|
|
—
|
|
—
|
|
—
|
|
—
|
|
249.0
|
|
|||||||||||||||
|
Income from equity affiliates
|
—
|
|
—
|
|
—
|
|
—
|
|
—
|
|
—
|
|
(16.2
|
)
|
(16.2
|
)
|
|||||||||||||||
Segment results for the year ended
December 31, 2015
were as follows:
|
Predecessor
|
|||||||||||||||||||||||||||||||
|
Powder River Basin Mining
|
Midwestern
U.S. Mining
|
Western
U.S. Mining
|
Australian Metallurgical Mining
|
Australian Thermal Mining
|
Trading and
Brokerage
|
Corporate
and Other
|
Consolidated
|
||||||||||||||||||||||||
|
|
(Dollars in millions)
|
||||||||||||||||||||||||||||||
|
Revenues
|
$
|
1,865.9
|
|
$
|
981.2
|
|
$
|
682.3
|
|
$
|
1,181.9
|
|
$
|
823.5
|
|
$
|
40.6
|
|
$
|
33.8
|
|
$
|
5,609.2
|
|
|||||||
|
Adjusted EBITDA
|
482.9
|
|
269.7
|
|
184.6
|
|
(18.2
|
)
|
193.6
|
|
24.8
|
|
(705.0
|
)
|
432.4
|
|
|||||||||||||||
|
Additions to property, plant, equipment and mine development
|
15.0
|
|
51.3
|
|
19.3
|
|
25.5
|
|
13.6
|
|
—
|
|
2.1
|
|
126.8
|
|
|||||||||||||||
|
Federal coal lease expenditures
|
276.9
|
|
—
|
|
0.3
|
|
—
|
|
—
|
|
—
|
|
—
|
|
277.2
|
|
|||||||||||||||
|
Loss from equity affiliates
|
—
|
|
—
|
|
—
|
|
—
|
|
—
|
|
—
|
|
15.9
|
|
15.9
|
|
|||||||||||||||
Asset details are reflected at the division level only for the Company’s mining segments and are not allocated between each individual segment as such information is not regularly reviewed by the Company’s CODM. Further, some assets service more than one segment within the division and an allocation of such assets would not be meaningful or representative on a segment by segment basis.
Assets as of
December 31, 2017
were as follows:
|
Successor
|
|||||||||||||||||||
|
U.S. Mining
|
Australian Mining
|
Trading and
Brokerage
|
Corporate
and Other
|
Consolidated
|
|||||||||||||||
|
(Dollars in millions)
|
|||||||||||||||||||
|
Total assets
|
$
|
3,848.6
|
|
$
|
2,656.3
|
|
$
|
99.1
|
|
$
|
1,577.2
|
|
$
|
8,181.2
|
|
||||
|
Property, plant, equipment and mine development, net
|
3,361.0
|
|
1,501.7
|
|
0.5
|
|
248.7
|
|
5,111.9
|
|
|||||||||
|
Peabody Energy Corporation
|
2017 Form 10-K
|
F-
81
|
PEABODY ENERGY CORPORATION
NOTES TO CONSOLIDATED FINANCIAL STATEMENTS — (Continued)
Assets as of
December 31, 2016
were as follows:
|
Predecessor
|
|||||||||||||||||||
|
U.S. Mining
|
Australian Mining
|
Trading and
Brokerage
|
Corporate
and Other
|
Consolidated
|
|||||||||||||||
|
(Dollars in millions)
|
|||||||||||||||||||
|
Total assets
|
$
|
4,255.9
|
|
$
|
5,402.2
|
|
$
|
128.7
|
|
$
|
1,990.9
|
|
$
|
11,777.7
|
|
||||
|
Property, plant, equipment and mine development, net
|
3,970.6
|
|
3,905.8
|
|
0.2
|
|
900.1
|
|
8,776.7
|
|
|||||||||
Assets as of
December 31, 2015
were as follows:
|
Predecessor
|
|||||||||||||||||||
|
U.S. Mining
|
Australian Mining
|
Trading and
Brokerage
|
Corporate
and Other
|
Consolidated
|
|||||||||||||||
|
(Dollars in millions)
|
|||||||||||||||||||
|
Total assets
|
$
|
4,105.8
|
|
$
|
5,319.9
|
|
$
|
217.2
|
|
$
|
1,304.0
|
|
$
|
10,946.9
|
|
||||
|
Property, plant, equipment and mine development, net
|
3,854.5
|
|
4,469.6
|
|
0.5
|
|
933.9
|
|
9,258.5
|
|
|||||||||
A reconciliation of consolidated income (loss) from continuing operations, net of income taxes to Adjusted EBITDA follows:
|
|
Successor
|
Predecessor
|
||||||||||||
|
|
April 2 through December 31, 2017
|
January 1 through April 1, 2017
|
Year Ended December 31, 2016
|
Year Ended December 31, 2015
|
||||||||||
|
|
(Dollars in millions)
|
|||||||||||||
|
Income (loss) from continuing operations, net of income taxes
|
$
|
713.1
|
|
$
|
(195.5
|
)
|
$
|
(663.8
|
)
|
$
|
(1,783.2
|
)
|
||
|
Depreciation, depletion and amortization
|
521.6
|
|
119.9
|
|
465.4
|
|
572.2
|
|
||||||
|
Asset retirement obligation expenses
|
41.2
|
|
14.6
|
|
41.8
|
|
45.5
|
|
||||||
|
Selling and administrative expenses related to debt restructuring
|
—
|
|
—
|
|
21.5
|
|
—
|
|
||||||
|
Net mark-to-market adjustment on actuarially determined liabilities
|
(45.2
|
)
|
—
|
|
—
|
|
—
|
|
||||||
|
Asset impairment
|
—
|
|
30.5
|
|
247.9
|
|
1,277.8
|
|
||||||
|
Changes in deferred tax asset valuation allowance and amortization of basis difference related to equity affiliates
|
(17.3
|
)
|
(5.2
|
)
|
(7.5
|
)
|
3.9
|
|
||||||
|
Interest expense
|
119.7
|
|
32.9
|
|
298.6
|
|
465.4
|
|
||||||
|
Loss on early debt extinguishment
|
20.9
|
|
—
|
|
29.5
|
|
67.8
|
|
||||||
|
Interest income
|
(5.6
|
)
|
(2.7
|
)
|
(5.7
|
)
|
(7.7
|
)
|
||||||
|
Break fees related to terminated asset sales
|
(28.0
|
)
|
—
|
|
—
|
|
—
|
|
||||||
|
Unrealized losses on non-coal trading derivative contracts
|
1.5
|
|
—
|
|
—
|
|
—
|
|
||||||
|
Unrealized losses (gains) on economic hedges
|
23.0
|
|
(16.6
|
)
|
39.8
|
|
(2.2
|
)
|
||||||
|
Coal inventory revaluation
|
67.3
|
|
—
|
|
—
|
|
—
|
|
||||||
|
Take-or-pay contract-based intangible recognition
|
(22.5
|
)
|
—
|
|
—
|
|
—
|
|
||||||
|
Reorganization items, net
|
—
|
|
627.2
|
|
159.0
|
|
—
|
|
||||||
|
Gain on disposal of reclamation liability
|
(31.2
|
)
|
—
|
|
—
|
|
—
|
|
||||||
|
Gain on disposal of Burton Mine
|
(52.2
|
)
|
—
|
|
—
|
|
—
|
|
||||||
|
Income tax benefit
|
(161.0
|
)
|
(263.8
|
)
|
(94.5
|
)
|
(207.1
|
)
|
||||||
|
Total Adjusted EBITDA
|
$
|
1,145.3
|
|
$
|
341.3
|
|
$
|
532.0
|
|
$
|
432.4
|
|
||
|
Peabody Energy Corporation
|
2017 Form 10-K
|
F-
82
|
PEABODY ENERGY CORPORATION
NOTES TO CONSOLIDATED FINANCIAL STATEMENTS — (Continued)
The following table presents revenues as a percent of total revenue from external customers by geographic region:
|
|
Successor
|
Predecessor
|
||||||||
|
|
April 2 through December 31, 2017
|
January 1 through April 1, 2017
|
Year Ended December 31, 2016
|
Year Ended December 31, 2015
|
||||||
|
U.S.
|
48.9
|
%
|
55.2
|
%
|
54.7
|
%
|
57.4
|
%
|
||
|
Japan
|
11.7
|
%
|
11.4
|
%
|
6.9
|
%
|
8.1
|
%
|
||
|
Taiwan
|
8.7
|
%
|
5.7
|
%
|
4.6
|
%
|
3.5
|
%
|
||
|
China
|
7.5
|
%
|
5.6
|
%
|
5.4
|
%
|
7.1
|
%
|
||
|
India
|
6.7
|
%
|
2.7
|
%
|
3.0
|
%
|
4.0
|
%
|
||
|
Australia
|
5.3
|
%
|
4.2
|
%
|
4.2
|
%
|
3.0
|
%
|
||
|
South Korea
|
1.1
|
%
|
0.5
|
%
|
1.5
|
%
|
4.1
|
%
|
||
|
Other
|
10.1
|
%
|
14.7
|
%
|
19.7
|
%
|
12.8
|
%
|
||
|
Total
|
100.0
|
%
|
100.0
|
%
|
100.0
|
%
|
100.0
|
%
|
||
The Company attributes revenue to individual countries based on the location of the physical delivery of the coal.
|
Peabody Energy Corporation
|
2017 Form 10-K
|
F-
83
|
PEABODY ENERGY CORPORATION
SCHEDULE II — VALUATION AND QUALIFYING ACCOUNTS
|
Description
|
Balance at
Beginning of Period |
Charged to
Costs and Expenses |
Charged to Other Accounts
|
Deductions
(1)
|
Other
|
|
Balance
at End of Period |
|||||||||||||||||
|
|
(Dollars in millions)
|
|||||||||||||||||||||||
|
Successor
|
|
|
|
|
|
|
|
|
|
|
|
|||||||||||||
|
April 2 through December 31, 2017
|
||||||||||||||||||||||||
|
Reserves deducted from asset accounts:
|
|
|
|
|||||||||||||||||||||
|
Advance royalty recoupment reserve
|
$
|
—
|
|
$
|
—
|
|
$
|
—
|
|
$
|
—
|
|
$
|
—
|
|
$
|
—
|
|
||||||
|
Reserve for materials and supplies
|
—
|
|
1.0
|
|
—
|
|
(0.4
|
)
|
—
|
|
0.6
|
|
||||||||||||
|
Allowance for doubtful accounts
|
—
|
|
4.6
|
|
—
|
|
—
|
|
—
|
|
4.6
|
|
||||||||||||
|
Tax valuation allowances
|
3,288.4
|
|
(744.9
|
)
|
—
|
|
—
|
|
(111.0
|
)
|
(6)
|
2,432.5
|
|
|||||||||||
|
Predecessor
|
||||||||||||||||||||||||
|
January 1 through April 1, 2017
|
||||||||||||||||||||||||
|
Reserves deducted from asset accounts:
|
||||||||||||||||||||||||
|
Advance royalty recoupment reserve
|
$
|
7.8
|
|
$
|
—
|
|
$
|
(7.4
|
)
|
(5)
|
$
|
(0.4
|
)
|
$
|
—
|
|
$
|
—
|
|
|||||
|
Reserve for materials and supplies
|
5.6
|
|
0.5
|
|
(6.1
|
)
|
(5)
|
—
|
|
—
|
|
—
|
|
|||||||||||
|
Allowance for doubtful accounts
|
13.1
|
|
—
|
|
(12.8
|
)
|
(5)
|
(0.3
|
)
|
—
|
|
—
|
|
|||||||||||
|
Tax valuation allowances
|
4,037.5
|
|
(777.2
|
)
|
28.1
|
|
(5)
|
—
|
|
—
|
|
3,288.4
|
|
|||||||||||
|
Year Ended December 31, 2016
|
|
|
|
|
|
|
|
|
|
|
|
|||||||||||||
|
Reserves deducted from asset accounts:
|
|
|
|
|
|
|
|
|
|
|
|
|||||||||||||
|
Advance royalty recoupment reserve
|
$
|
8.3
|
|
$
|
0.5
|
|
$
|
—
|
|
$
|
(1.0
|
)
|
(2)
|
$
|
—
|
|
$
|
7.8
|
|
|||||
|
Reserve for materials and supplies
|
4.7
|
|
4.3
|
|
—
|
|
(3.4
|
)
|
—
|
|
5.6
|
|
||||||||||||
|
Allowance for doubtful accounts
|
6.6
|
|
7.9
|
|
—
|
|
(1.4
|
)
|
—
|
|
13.1
|
|
||||||||||||
|
Tax valuation allowances
|
1,614.1
|
|
2,453.9
|
|
—
|
|
—
|
|
|
(30.5
|
)
|
(3)
|
4,037.5
|
|
||||||||||
|
Year Ended December 31, 2015
|
|
|
|
|
|
|
|
|
|
|
|
|||||||||||||
|
Reserves deducted from asset accounts:
|
|
|
|
|
|
|
|
|
|
|
|
|||||||||||||
|
Advance royalty recoupment reserve
|
$
|
7.6
|
|
$
|
—
|
|
$
|
—
|
|
$
|
(0.9
|
)
|
(2)
|
$
|
1.6
|
|
(4)
|
$
|
8.3
|
|
||||
|
Reserve for materials and supplies
|
4.6
|
|
0.4
|
|
—
|
|
(0.3
|
)
|
—
|
|
4.7
|
|
||||||||||||
|
Allowance for doubtful accounts
|
5.8
|
|
8.0
|
|
—
|
|
(7.2
|
)
|
—
|
|
6.6
|
|
||||||||||||
|
Tax valuation allowances
|
1,366.5
|
|
452.9
|
|
—
|
|
—
|
|
(205.3
|
)
|
(3)
|
1,614.1
|
|
|||||||||||
|
(1)
|
Reserves utilized, unless otherwise indicated.
|
|
(2)
|
Deductions to advance royalty recoupment reserve represents the termination of federal and state leases.
|
|
(3)
|
Includes the impact of the decrease in Australian dollar exchange rates.
|
|
(4)
|
Balances transferred from other accounts.
|
|
(5)
|
Fresh start reporting adjustments.
|
|
(6)
|
Release of valuation allowance primarily related to carrybacks of U.S. net operating losses.
|
|
Peabody Energy Corporation
|
2017 Form 10-K
|
F-
84
|
EXHIBIT INDEX
The exhibits below are numbered in accordance with the Exhibit Table of Item 601 of Regulation S-K.
|
Exhibit No.
|
Description of Exhibit
|
|
|
2.1
|
||
|
2.2
|
||
|
3.1
|
||
|
3.2
|
||
|
3.3
|
||
|
4.1
|
||
|
4.2
|
||
|
4.3
|
||
|
4.4
|
||
|
10.1
|
Federal Coal Lease WYW0321779: North Antelope/Rochelle Mine (Incorporated by reference to Exhibit 10.3 of the Registrant’s Form S-4 Registration Statement No. 333-59073, filed July 14, 1998).
|
|
|
10.2
|
Federal Coal Lease WYW119554: North Antelope/Rochelle Mine (Incorporated by reference to Exhibit 10.4 of the Registrant’s Form S-4 Registration Statement No. 333-59073, filed July 14, 1998).
|
|
|
10.3
|
Federal Coal Lease WYW5036: Rawhide Mine (Incorporated by reference to Exhibit 10.5 of the Registrant’s Form S-4 Registration Statement No. 333-59073, filed July 14, 1998).
|
|
|
10.4
|
Federal Coal Lease WYW3397: Caballo Mine (Incorporated by reference to Exhibit 10.6 of the Registrant's Form S-4 Registration Statement No. 333-59073, filed July 14, 1998).
|
|
|
10.5
|
Federal Coal Lease WYW83394: Caballo Mine (Incorporated by reference to Exhibit 10.7 of the Registrant's Form S-4 Registration Statement No. 333-59073, filed July 14, 1998).
|
|
|
10.6
|
Federal Coal Lease WYW136142 (Incorporated by reference to Exhibit 10.8 of Amendment No. 1 to the Registrant's Form S-4 Registration Statement No. 333-59073, filed September 8, 1998).
|
|
|
10.7
|
Royalty Prepayment Agreement by and among Peabody Natural Resources Company, Gallo Finance Company and Chaco Energy Company, dated September 30, 1998 (incorporated by reference to Exhibit 10.9 of the Registrant’s Quarterly Report on Form 10-Q for the quarter ended September 30, 1998).
|
|
|
10.8
|
||
|
10.9
|
||
|
10.10
|
||
|
10.11
|
||
|
10.12
|
||
|
Exhibit No.
|
Description of Exhibit
|
|
|
10.13
|
||
|
10.14
|
||
|
10.15
|
||
|
10.16
|
||
|
10.17
|
||
|
10.18
|
||
|
10.19
|
||
|
10.20
|
||
|
10.21
|
||
|
10.22
|
||
|
10.23*
|
||
|
10.24*
|
||
|
10.25*
|
||
|
10.26*
|
||
|
10.27*
|
||
|
10.28*
|
||
|
10.29*
|
||
|
10.30*
|
||
|
10.31*
|
||
|
10.32*
|
||
|
10.33*
|
||
|
Exhibit No.
|
Description of Exhibit
|
|
|
10.34
|
||
|
10.35
|
||
|
10.36
|
||
|
10.37
|
||
|
10.38
|
||
|
10.39
|
||
|
10.40
|
||
|
10.41
|
||
|
10.42
|
||
|
10.43
|
||
|
10.44
|
||
|
10.45
|
||
|
10.46
|
||
|
10.47
|
||
|
10.48
|
||
|
Exhibit No.
|
Description of Exhibit
|
|
|
10.49
|
||
|
10.50
|
||
|
10.51
|
||
|
10.52
|
||
|
10.53
|
||
|
10.54
|
||
|
10.55
|
||
|
10.56
|
||
|
10.57†
|
||
|
10.58
|
||
|
10.59
|
||
|
10.60
|
||
|
10.61
|
||
|
10.62*
|
||
|
10.63
|
||
|
10.64
|
||
|
Exhibit No.
|
Description of Exhibit
|
|
|
10.65*
|
||
|
10.66*
|
||
|
10.67*
|
||
|
10.68*†
|
||
|
12.1†
|
||
|
21†
|
||
|
23.1†
|
||
|
23.2†
|
||
|
31.1†
|
||
|
31.2†
|
||
|
32.1†
|
||
|
32.2†
|
||
|
95†
|
||
|
101†
|
Interactive Data File (Form 10-K for the year ended December 31, 2017 filed in XBRL). The financial information contained in the XBRL-related documents is “unaudited” and “unreviewed.”
|
|
|
*
|
These exhibits constitute all management contracts, compensatory plans and arrangements required to be filed as an exhibit to this form pursuant to Item 15(a)(3) and 15(b) of this report.
|
|
|
|
|
†
|
Filed herewith.
|
TABLE OF CONTENTS
Part IItem 1. BusinessItem 1A. Risk FactorsItem 1B. Unresolved Staff CommentsItem 2. PropertiesItem 3. Legal ProceedingsItem 4. Mine Safety DisclosuresPart IIItem 5. Market For Registrant S Common Equity, Related Stockholder Matters and Issuer Purchases Of Equity SecuritiesItem 6. Selected Financial DataItem 7. Management S Discussion and Analysis Of Financial Condition and Results Of OperationsItem 7A. Quantitative and Qualitative Disclosures About Market RiskItem 8. Financial Statements and Supplementary DataItem 9. Changes in and Disagreements with Accountants on Accounting and Financial DisclosureItem 9A. Controls and ProceduresItem 9B. Other InformationPart IIIItem 10. Directors, Executive Officers and Corporate GovernanceItem 11. Executive CompensationItem 12. Security Ownership Of Certain Beneficial Owners and Management and Related Stockholder MattersItem 13. Certain Relationships and Related Transactions, and Director IndependenceItem 14. Principal Accountant Fees and ServicesPart IVItem 15. Exhibits and Financial Statement Schedules