UNITED STATES
SECURITIES AND EXCHANGE COMMISSION
WASHINGTON, D.C. 20549
FORM 20-F
¨
REGISTRATION
STATEMENT PURSUANT TO SECTION 12(b) OR (g)
OF THE SECURITIES EXCHANGE ACT OF 1934
OR
x
ANNUAL REPORT PURSUANT TO SECTION 13 OR 15(d)
OF THE SECURITIES EXCHANGE ACT OF 1934
For the fiscal year ended December 31, 2016
OR
¨
TRANSITION
REPORT PURSUANT TO SECTION 13 OR 15(d) OF THE
SECURITIES EXCHANGE ACT OF 1934
OR
¨
SHELL
COMPANY REPORT PURSUANT TO SECTION 13 OR 15(d)
OF THE SECURITIES EXCHANGE ACT OF 1934
Date of event requiring this shell company report
For the transition period from to
Commission file number 001-14370
COMPAÑÍA DE MINAS BUENAVENTURA
S.A.A.
(Exact name of Registrant as specified in its charter)
BUENAVENTURA MINING COMPANY INC.
(Translation of Registrant’s name into English)
REPUBLIC OF PERU
(Jurisdiction of incorporation or organization)
LAS BEGONIAS 415 FLOOR 19,
SAN ISIDRO, LIMA 27, PERU
(Address of principal executive offices)
Carlos E. Gálvez, Vice President
and Chief Financial Officer
Telephone: (511) 419-2540
Facsimile: (511) 419-2502
Address: LAS BEGONIAS 415 FLOOR 19,
SAN ISIDRO, LIMA 27, PERU
(Name, telephone, e-mail and/or facsimile number and address of company contact person)
Securities registered or to be registered pursuant to Section 12(b) of the Act:
|
Title of each class |
Name of each exchange on which registered |
|
| Common shares , nominal (par) value of ten Peruvian Soles per share (“Common Shares”) |
New York Stock Exchange Inc.
*
Lima Stock Exchange |
|
| American Depositary Shares (“ADSs”) representing one Common Share each | New York Stock Exchange Inc.٭ |
Securities registered or to be registered pursuant to Section 12(g) of the Act: None
Securities for which there is a reporting obligation pursuant to Section 15(d) of the Act: None
Indicate the number of outstanding shares of each of the issuer’s classes of capital or common stock as of the close of the period covered by the annual report.
| Common Shares nominal (par) value of S/.10.00 per share | 274,889,924 |
| Investment Shares nominal (par) value of S/.10.00 per share | 744,640 |
Indicate by check mark if the registrant is a well-known seasoned issuer, as defined in Rule 405 of the Securities Act.
Yes x No ¨
If this report is an annual or transition report, indicate by check mark if the registrant is not required to file reports pursuant to Section 13 or 15(d) of the Securities Exchange Act of 1934.
Yes ¨ No x
Indicate by check mark whether the registrant (1) has filed all reports required to be filed by Section 13 or 15(d) of the Securities Exchange Act of 1934 during the preceding 12 months (or for such shorter period that the registrant was required to file such reports), and (2) has been subject to such filing requirements for the past 90 days.
Yes x No ¨
*Not for trading but only in connection with the registration of ADSs pursuant to the requirements of the Securities and Exchange Commission.
Indicate by check mark whether the registrant has submitted electronically and posted on its corporate Web site, if any, every Interactive Data File required to be submitted and posted pursuant to Rule 405 of Regulation S-T (§232.405 of this chapter) during the preceding 12 months (or for such shorter period that the registrant was required to submit and post such files).
Yes ¨ No ¨
Indicate by check mark whether the registrant is a large accelerated filer, an accelerated filer, a non-accelerated filer, or an emerging growth company. See definition of “accelerated filer,” “large accelerated filer,” and “emerging growth company” in Rule 12b-2 of the Exchange Act.
Large accelerated filer x Accelerated filer ¨ Non-accelerated filer ¨ Emerging growth company ¨
If an emerging growth company that prepares its financial statements in accordance with U.S. GAAP, indicate by check mark if the registrant has elected not to use the extended transition period for complying with any new or revised financial accounting standards† provided pursuant to Section 13(a) of the Exchange Act.
† The term “new or revised financial accounting standard” refers to any update issued by the Financial Accounting Standards Board to its Accounting Standards Codification after April 5, 2012.
Indicate by check mark which basis of accounting the registrant has used to prepare the financial statements included in this filing:
U.S. GAAP ¨ International Financial Reporting Standards as issued by Other ¨
the International Accounting Standards Board x
If “Other” has been checked in response to the previous question, indicate by check mark which financial statement item the registrant has elected to follow.
Item 17 ¨ Item 18 ¨
If this is an annual report, indicate by check mark whether the registrant is a shell company (as defined in Rule 12b-2 of the Exchange Act).
Yes ¨ No x
TABLE OF CONTENTS
| i |
Presentation of Financial Information
As used in this Annual Report on Form 20-F, or “Annual Report,” unless the context otherwise requires, references to “we,” “us,” “our,” “Company,” “BVN” and “Buenaventura” mean Compañía de Minas Buenaventura S.A.A. and its consolidated subsidiaries. Unless otherwise specified or the context otherwise requires, references to “$,” “US$,” “Dollars” and “U.S. Dollars” are to United States Dollars and references to “S/.,” “Sol” or “Soles” are to Peruvian Soles, the legal currency of the Republic of Peru, or “Peru.”
Unless otherwise specified, references to a value denominated in “t” or “tons” refers to tons; references to a value denominated “DST” refers to dry short tons; the terms “g” or “gr” refer to metric grams; the terms “oz.” or “ounces” refer to troy ounces of a fineness of 999.9 parts per 1,000, equal to 31.1035 grams.
Until December 31, 2010, we presented our consolidated financial statements, which we refer to as our Financial Statements, in conformity with accounting principles generally accepted in Peru, or “Peruvian GAAP.” Effective January 1, 2011, we began presenting our consolidated financial statements in accordance with International Financial Reporting Standards (“IFRS”), as issued by the International Accounting Standards Board (the “IASB”).
Pursuant to the rules of the United States Securities and Exchange Commission, or the SEC, this Annual Report includes certain separate financial statements and other financial information of Minera Yanacocha S.R.L., or “Yanacocha,” and Sociedad Minera Cerro Verde S.A.A., or “Cerro Verde.” Yanacocha and Cerro Verde maintain their financial books and records in U.S. Dollars and present their financial statements in accordance with IFRS as issued by the IASB.
We record our investments in Yanacocha and Cerro Verde in accordance with the equity method as described in “Item 5. Operating and Financial Review and Prospects—Buenaventura—A. Operating Results—General” and Note 2.4(f) to the Financial Statements. Our partnership interest in Yanacocha was calculated at 43.65% for the years ended December 31, 2014, 2015 and 2016. As of December 31, 2014, 2015 and 2016, our equity interest in Cerro Verde was 19.58%.
Forward-Looking Statements
This Annual Report contains “forward-looking statements” as defined in the U.S. Private Securities Litigation Reform Act of 1995 and are intended to be covered by the safe harbor provided for under these sections. Our forward-looking statements are based on management’s assumptions and beliefs in light of the information currently available to it and may include, without limitation:
| · | our, Yanacocha’s and Cerro Verde’s costs and expenses; |
| · | estimates of future costs applicable to sales; |
| · | estimates of future exploration and production results; |
| · | plans for capital expenditures; |
| · | expected commencement dates of mining or metal production operations; and |
| · | estimates regarding potential cost savings and operating performance. |
The words “anticipate,” “may,” “can,” “plan,” “believe,” “estimate,” “expect,” “project,” “intend,” “likely,” “will,” “should,” “to be” and any similar expressions are intended to identify those assertions as forward-looking statements. In making any forward-looking statements, we believe that the expectations are based on reasonable assumptions. We caution readers that those statements are not guarantees of future performance and our actual results may differ materially from those anticipated, projected or assumed in the forward-looking statements. Important factors that can cause our actual results to differ materially from those anticipated in the forward-looking statements include:
| 3 |
| · | our, Yanacocha’s and Cerro Verde’s results of exploration; |
| · | the results of our joint ventures and our share of the production of, and the income received from, such joint ventures; |
| · | commodity prices; |
| · | production rates; |
| · | geological and metallurgical assumptions; |
| · | industry risks; |
| · | timing of receipt of necessary governmental permits or approvals; |
| · | regulatory changes; |
| · | political risks; |
| · | inaccurate estimates of reserves or Mineralized Material Not in Reserve; |
| · | anti-mining protests or other potential issues with local community relationships; |
| · | labor relations; |
| · | environmental risks; and |
| · | other factors described in more detail under “Item 3. Key Information—D. Risk Factors.” |
Many of the assumptions on which our forward-looking statements are based are likely to change after our forward-looking statements are made, including, for example, commodity prices, which we cannot control, and our, Yanacocha’s and Cerro Verde’s production volumes and costs, some aspects of which we may or may not be able to control. Further, we may make changes to our business plans that could or will affect our results. We do not intend to update our forward-looking statements, notwithstanding any changes in our assumptions, changes in our business plans, our actual experience or other changes, and we undertake no obligation to update any forward-looking statements more frequently than required by applicable securities laws.
ITEM 1. Identity of Directors, Senior Management and Advisers
Not applicable.
ITEM 2. Offer Statistics and Expected Timetable
Not applicable.
| 4 |
| A. | Selected Financial Data |
Selected Financial Information and Operating Data
This selected financial information should be read in conjunction with, and is qualified in its entirety by reference to, the Financial Statements, including the notes thereto appearing elsewhere in this Annual Report. The selected financial information as of December 31, 2015 and 2016 and for the years ended December 31, 2014, 2015 and 2016, is derived from the consolidated statements of financial position, consolidated statements of profit or loss and consolidated statements of other comprehensive income, included in the Financial Statements appearing elsewhere in this Annual Report. The selected financial information as of December 31, 2012, 2013 and 2014 and for the years ended December 31, 2012 and 2013 has been derived from a consolidated statement of financial position, consolidated statements of profit or loss and consolidated statements of other comprehensive income, respectively, which are not included in this Annual Report. The report of Paredes, Burga & Asociados S. Civil de R.L. (a member firm of EY Global) on our Financial Statements as of December 31, 2015 and 2016 and for the years ended December 31, 2014, 2015 and 2016 appears elsewhere in this Annual Report. The Financial Statements are prepared and presented in accordance with IFRS as issued by the IASB, which differs in certain respects from U.S. GAAP. The operating data presented below is derived from our records and has not been subject to audit. The financial information and operating data presented below should be read in conjunction with “Item 5. Operating and Financial Review and Prospects—Buenaventura,” the Financial Statements and the related notes thereto and other financial information included in this Annual Report.
| As of and for the year ended December 31, | ||||||||||||||||||||
| 2016 | 2015 | 2014 |
2013 (6) |
2012 (6) |
||||||||||||||||
| (US$ in thousands) (1) | ||||||||||||||||||||
| Statements of profit or loss data: | ||||||||||||||||||||
| Continuing operations: | ||||||||||||||||||||
| Operating income: | ||||||||||||||||||||
|
Net sales of goods |
1,015,670 | 846,269 | 959,286 | 1,015,966 | 1,376,179 | |||||||||||||||
| Net sales of services | 28,782 | 50,839 | 71,159 | 79,585 | 46,664 | |||||||||||||||
| Royalty income | 24,339 | 32,414 | 36,867 | 44,185 | 67,178 | |||||||||||||||
| Total operating income | 1,068,791 | 929,522 | 1,067,312 | 1,139,736 | 1,490,021 | |||||||||||||||
| Operating costs: | ||||||||||||||||||||
| Cost of sales of goods, excluding depreciation and amortization | (497,812 | ) | (513,490 | ) | (498,714 | ) | (463,631 | ) | (540,504 | ) | ||||||||||
| Cost of services, excluding depreciation and amortization | (10,754 | ) | (59,612 | ) | (77,927 | ) | (114,120 | ) | (30,739 | ) | ||||||||||
| Exploration in operating units | (96,149 | ) | (89,699 | ) | (97,357 | ) | (98,939 | ) | (102,907 | ) | ||||||||||
| Depreciation and amortization | (192,647 | ) | (232,583 | ) | (172,999 | ) | (133,639 | ) | (111,025 | ) | ||||||||||
| Mining royalties | (27,611 | ) | (27,188 | ) | (27,428 | ) | (29,434 | ) | (37,496 | ) | ||||||||||
| Total operating costs | (824,973 | ) | (922,572 | ) | (874,425 | ) | (839,763 | ) | (822,671 | ) | ||||||||||
| Gross profit | 243,818 | 6,950 | 192,887 | 299,973 | 667,350 | |||||||||||||||
| Operating expenses: | ||||||||||||||||||||
| Administrative expenses | (81,692 | ) | (84,372 | ) | (93,753 | ) | (67,990 | ) | (94,118 | ) | ||||||||||
| Exploration in non-operating areas | (26,589 | ) | (30,610 | ) | (50,007 | ) | (32,805 | ) | (89,920 | ) | ||||||||||
| Selling expenses | (21,733 | ) | (19,365 | ) | (16,212 | ) | (14,842 | ) | (15,491 | ) | ||||||||||
| Excess of workers’ profit sharing | - | - | - | (704 | ) | (2,164 | ) | |||||||||||||
| Impairment loss of long-lived assets | - | (3,803 | ) | - | - | - | ||||||||||||||
| Other, net | 18,392 | (5,735 | ) | 3,169 | (1,996 | ) | 19,367 | |||||||||||||
| Total operating expenses | (111,622 | ) | (143,885 | ) | (156,803 | ) | (118,337 | ) | (182,326 | ) | ||||||||||
| Operating profit (loss) | 132,196 | (136,935 | ) | 36,084 | 181,636 | 485,024 | ||||||||||||||
| Other income (expenses), net: | ||||||||||||||||||||
| Share in the results of associates under equity method | (365,321 | ) | (173,375 | ) | (74,600 | ) | (114,145 | ) | 478,987 | |||||||||||
| Finance costs | (31,580 | ) | (27,572 | ) | (11,276 | ) | (9,734 | ) | (8,290 | ) | ||||||||||
| Net gain (loss) from currency exchange difference | 2,638 | (13,693 | ) | (8,457 | ) | (7,128 | ) | 1,799 | ||||||||||||
| Gain on business combination | - | - | 59,852 | - | - | |||||||||||||||
| Finance income | 6,830 | 11,026 | 8,408 | 6,621 | 9,486 | |||||||||||||||
| Total other income (expenses), net | (387,433 | ) | (203,614 | ) | (26,073 | ) | (124,386 | ) | 482,038 | |||||||||||
| Profit (loss) before income tax | (255,237 | ) | (340,549 | ) | 10,011 | 57,250 | 967,006 | |||||||||||||
| Current income tax | (39,444 | ) | (14,222 | ) | (18,815 | ) | (56,799 | ) | (130,507 | ) | ||||||||||
| Deferred income tax | (14,060 | ) | (541 | ) | (47,006 | ) | (29,154 | ) | (12,451 | ) | ||||||||||
| Profit (loss) from continuing operations | (308,741 | ) | (355,312 | ) | (55,810 | ) | (28,703 | ) | 824,048 | |||||||||||
| Discontinued operations: | ||||||||||||||||||||
| Profit (loss) from discontinued operations (7) | (19,073 | ) | (20,233 | ) | (5,830 | ) | (51,033 | ) | (63,528 | ) | ||||||||||
| Net profit (loss) | (327,814 | ) | (375,545 | ) | (61,640 | ) | (79,736 | ) | 760,520 | |||||||||||
| Attributable to equity owners of the parent | (323,492 | ) | (317,210 | ) | (76,065 | ) | (107,257 | ) | 701,100 | |||||||||||
| Attributable to non-controlling interest | (4,322 | ) | (58,335 | ) | 14,425 | 27,521 | 59,420 | |||||||||||||
| Net profit (loss) | (327,814 | ) | (375,545 | ) | (61,640 | ) | (79,736 | ) | 760,520 | |||||||||||
| Basic and diluted profit (loss) per share attributable to equity holders of the parent (2)(3) | (1.27 | ) | (1.25 | ) | (0.30 | ) | (0.42 | ) | 2.76 | |||||||||||
| Basic and diluted profit (loss) per ADS attributable to equity holders of the parent (2)(3) | (1.27 | ) | (1.25 | ) | (0.30 | ) | (0.42 | ) | 2.76 | |||||||||||
| Basic and diluted profit (loss) per share attributable to equity holders of the parent, from continuing operations | (1.20 | ) | (1.17 | ) | (0.28 | ) | (0.09 | ) | 2.98 | |||||||||||
| Dividends per share | 0.03 | - | 0.03 | 0.31 | 0.60 | |||||||||||||||
| Average number of common and investment shares outstanding | 254,111,250 | 254,186,867 | 254,186,867 | 254,186,867 | 254,232,571 | |||||||||||||||
| Statement of financial position data: | ||||||||||||||||||||
| Total assets | 4,266,415 | 4,547,181 | 4,672,274 | 4,552,267 | 4,622,447 | |||||||||||||||
| Financial obligations | 592,342 | 353,710 | 383,305 | 234,397 | 179,304 | |||||||||||||||
| Capital stock | 750,497 | 750,497 | 750,497 | 750,497 | 750,540 | |||||||||||||||
| Total shareholders’ equity | 3,047,213 | 3,389,236 | 3,762,125 | 3,824,421 | 4,011,879 | |||||||||||||||
| Operating data (unaudited): | ||||||||||||||||||||
| Production (4) | ||||||||||||||||||||
| Gold (oz.) | 357,570 | 356,367 | 438,426 | 462,856 | 447,472 | |||||||||||||||
| Silver (oz.) | 23,035,110 | 24,648,761 | 20,119,162 | 19,193,075 | 18,884,824 | |||||||||||||||
| Proven and probable reserves (5) | ||||||||||||||||||||
| Gold (oz.) | 1,416,000 | 1,185,000 | 1,119,000 | 1,036,000 | 1,385,000 | |||||||||||||||
| Silver (oz.) | 160,082,090 | 134,391,000 | 139,699,000 | 136,464,000 | 154,606,000 | |||||||||||||||
| 5 |
_________________
(1) Except per share, per ADS, outstanding shares and operating data.
| (2) | Profit (loss) per share has been calculated for each year as net profit (loss) divided by average number of shares outstanding during the year. As of December 31, 2015 and 2016, we had 274,889,924 Common Shares outstanding, including 21,174,734 treasury shares as of December 31, 2015 and 2016. As of December 31, 2012, 2013, 2014, 2015 and 2016, we had 744,640 of Investment Shares outstanding, including 271,733 treasury shares as of December 31, 2012, 272,963 treasury shares as of December 31, 2013, 2014 and 2015, and 472,963 treasury shares as of December 31, 2016. |
| (3) | We have no outstanding options, warrants or convertible securities that would have a dilutive effect on earnings per share. As a result, there is no difference between basic and diluted earnings per share or ADS. |
| (4) | The amounts in this table reflect the total production of all of our consolidated subsidiaries, including Sociedad Minera El Brocal S.A.A., or “El Brocal,” in which we owned a 61.32% controlling equity interest as of December 31, 2016 (54.07% controlling equity interest as of December 31, 2015) and Minera La Zanja S.R.L., or “La Zanja,” in which we owned a 53.06% controlling equity interest, as of December 31, 2016. The production data in this table reflect 100% of El Brocal’s and La Zanja’s production. For the years ended December 31, 2013 to 2016, El Brocal produced 2.0 million, 2.5 million, 3.7 million and 2.6 million ounces of silver, of which our equity share was 1.1 million, 1.4 million, 2.0 million and 1.5 million ounces of silver and La Zanja produced 137,395, 143,573, 141,071 and 139,724 ounces of gold, of which our equity share was 72,902, 76,180, 74,852 and 74,137 ounces of gold, and 391,832, 422,395, 331,080 and 217,292 ounces of silver, of which our equity share was 207,906, 224,123, 175,671 and 115,295 ounces of silver. Amounts for 2015 and 2016 exclude production coming from the operating mines classified as discontinued operations. |
| 6 |
| (5) | The amounts in this table reflect the reserves of all of our consolidated subsidiaries, including El Brocal and La Zanja, in each case as of December 31, 2016. The conceptual framework used to estimate proven and probable reserves for our wholly-owned mines (i) as of December 31, 2012 and 2013, was reviewed by independent consultant Algon Investment S.R.L. and (ii) as of December 31, 2014 and 2015 was reviewed by independent consultant Geominería S.A.C. For 2016, Geominería S.A.C. audited the process used to estimate proven and probable ore reserves for Orcopampa, Uchucchacua, Julcani and Mallay. Hatch Asociados S.A., an independent consultant, audited the process used to estimate proven and probable ore reserves for Tambomayo as of December 31, 2016. The conceptual framework used to estimate proven and probable reserves for El Brocal’s mines as of December 31, 2012, 2013, 2014 and 2015 was reviewed by an independent consultant. The conceptual framework used to estimate proven and probable reserves for El Brocal’s mines as of December 31, 2016 was reviewed by consultant Buenaventura Ingenieros S.A. |
| (6) | IFRIC 20 “Stripping Costs in Production Phase of a Surface Mine” became effective January 1, 2013. Our results for the year 2012 includes adjustments in connection with the application of IFRIC 20 “Stripping Costs in the Production Phase of a Surface Mine.” |
| (7) | In 2014, we publicly announced our decision to dispose of our four non-operational mining units (Poracota, Recuperada, Antapite and Shila-Paula); because of this decision, they were presented as mining units held for sale in accordance with IFRS 5 “Non-current Assets Held for Sale and Discontinued Operations.” During 2016, we decided to change the classification of three mining units (Poracota, Recuperada and Shila-Paula) from mining units held for sale and began finalizing the mine closures. In December 2016, we sold the Antapite mining unit. In 2016, we started the final closing process of our Breapampa mining unit; as a result, the related income, costs and expenses were classified as discontinued operations for the years 2016, 2015 and 2014. On January 2017, the Breapampa mining unit was sold. For comparative purposes, we modified figures for 2012, 2013, 2014 and 2015 to give effect to the discontinuance of the Breapampa mining unit, which were previously reported as continued operations in our Forms 20-F. See Note 1(e) to the Financial Statements for further information. |
Yanacocha Selected Financial Information and Operating Data
The following table presents selected financial information and operating data for Yanacocha at the dates and for each of the periods indicated. This information should be read in conjunction with, and is qualified in its entirety by reference to, Yanacocha’s audited consolidated financial statements as of December 31, 2015 and 2016 and for the years ended December 31, 2014, 2015 and 2016, or the Yanacocha Consolidated Financial Statements. The report of Paredes, Burga & Asociados S. Civil de R.L. (a member firm of EY Global) on the Yanacocha Consolidated Financial Statements as of and for the years ended December 31, 2016 and 2015 appears elsewhere in this Annual Report. The selected financial information for Yanacocha as of December 31, 2012, 2013 and 2014, and for the years ended December 31, 2012 and 2013 has been derived from consolidated statements of financial position, consolidated statements of profit or loss and consolidated statements of other comprehensive income, respectively, which are not included in this Annual Report. Yanacocha’s audited consolidated financial statements as of December 31, 2012, 2013 and 2014 and for the years ended December 31, 2012, 2013 and 2014 were audited by Gaveglio, Aparicio y Asociados Sociedad Civil de Responsabilidad Limitada, a member firm of PricewaterhouseCoopers Limited. The Yanacocha Consolidated Financial Statements are prepared and presented in accordance with IFRS as issued by the IASB, which differs in certain respects from U.S. GAAP, as indicated in Note 23 and 24 to the Yanacocha Consolidated Financial Statements. The operating data presented below, which are based on 100% of Yanacocha’s production and reserves, are derived from Yanacocha’s records and have not been subject to audit. The financial information presented below should be read in conjunction with “Item 5. Operating and Financial Review and Prospects—Yanacocha,” the Yanacocha Consolidated Financial Statements and the related notes thereto and other financial information included in this Annual Report.
| 7 |
| As of and for the year ended December 31, | ||||||||||||||||||||
| 2016 | 2015 | 2014 | 2013 | 2012 | ||||||||||||||||
| (US$ in thousands) (1) | ||||||||||||||||||||
| Statement of comprehensive income: | ||||||||||||||||||||
| Operating income: | ||||||||||||||||||||
| Revenue from sales (2) | 761,193 | 1,031,174 | 1,165,299 | 1,406,825 | 2,146,641 | |||||||||||||||
| Other operating income | 17,713 | 10,625 | 30,300 | 37,207 | 22,861 | |||||||||||||||
| Total gross income | 778,906 | 1,041,799 | 1,195,599 | 1,444,032 | 2,169,502 | |||||||||||||||
| Costs applicable to sales | (776,394 | ) | (751,736 | ) | (920,300 | ) | (991,264 | ) | (832,116 | ) | ||||||||||
| Other operating costs | (2,951 | ) | (2,524 | ) | (22,422 | ) | (28,672 | ) | (22,069 | ) | ||||||||||
| Total operating costs | (779,345 | ) | (754,260 | ) | (942,722 | ) | (1,019,936 | ) | (854,185 | ) | ||||||||||
| Gross profit (loss) | (439 | ) | 287,539 | 252,877 | 424,096 | 1,315,317 | ||||||||||||||
| Operating expenses: | ||||||||||||||||||||
| Operating expenses, net | (71,496 | ) | (82,846 | ) | (77,781 | ) | (77,534 | ) | (192,869 | ) | ||||||||||
| Administrative expenses | (8,780 | ) | (26,325 | ) | (38,262 | ) | (67,064 | ) | (70,916 | ) | ||||||||||
| Selling Expenses | (3,695 | ) | (3,534 | ) | (4,458 | ) | (3,740 | ) | (4,498 | ) | ||||||||||
| Impairment loss | (889,499 | ) |
― |
(541,141 | ) | (1,038,548 | ) | ― | ||||||||||||
| Operating profit (loss) | (973,909 | ) | 174,834 | (408,765 | ) | (762,790 | ) | 1,047,034 | ||||||||||||
| Other expenses, net: | ||||||||||||||||||||
| Finance income | 2,132 | 673 | 298 | 720 | 1,019 | |||||||||||||||
| Finance costs | (15,107 | ) | (22,734 | ) | (23,504 | ) | (18,745 | ) | (13,135 | ) | ||||||||||
| Net gain (loss) from currency exchange difference | (13,741 | ) | (251 | ) | 1,142 | 2,065 | (1,216 | ) | ||||||||||||
| Total other expenses, net | (26,716 | ) | (22,312 | ) | (22,064 | ) | (15,960 | ) | (13,332 | ) | ||||||||||
| Income (loss) before income tax | (1,000,625 | ) | 152,522 | (430,829 | ) | (778,750 | ) | 1,033,702 | ||||||||||||
| Income tax benefit (expense) | (43,127 | ) | (602,717 | ) | 30,491 | 203,471 | (385,827 | ) | ||||||||||||
| Income (loss) for the year | (1,043,752 | ) | (450,195 | ) | (400,338 | ) | (575,279 | ) | 647,875 | |||||||||||
| Comprehensive income (loss): | ||||||||||||||||||||
| Income (loss) for the year | (1,043,752 | ) | (450,195 | ) | (400,338 | ) | (575,279 | ) | 647,875 | |||||||||||
| Other comprehensive income (loss) to be reclassified as profit or loss in subsequent periods | ||||||||||||||||||||
| Changes in the fair value of available-for-sale financial asset, net of tax effect | 651 | (757 | ) | (65 | ) | (226 | ) | 1,129 | ||||||||||||
| Statement of financial position: | ||||||||||||||||||||
| Total assets | 2,045,885 | 2,965,430 | 3,483,169 | 3,754,692 | 4,512,803 | |||||||||||||||
| Capital stock | 398,216 | 398,216 | 398,216 | 398,216 | 398,216 | |||||||||||||||
| Total partners’ equity | 885,724 | 2,228,825 | 2,679,777 | 3,080,050 | 3,655,555 | |||||||||||||||
| U.S. GAAP | ||||||||||||||||||||
| Net income (loss) | (1,191,319 | ) | (252,159 | ) | (31,914 | ) | 140,997 | 626,540 | ||||||||||||
| Total equity | 1,928,321 | 3,418,989 | 3,671,148 | 3,711,461 | 3,570,690 | |||||||||||||||
| Operating data (unaudited) | ||||||||||||||||||||
| Gold produced (oz.) | 654,934 | 917,691 | 969,944 | 1,017,259 | 1,345,992 | |||||||||||||||
| Gold proven and probable reserves (thousands of oz.) | 4,358 | 5,057 | 17,436 | 18,345 | 18,500 | |||||||||||||||
________________________
| (1) | Except operating data |
| (2) | Royalties netted to sales |
Cerro Verde Selected Financial Information and Operating Data
The following table presents selected financial information and operating data for Cerro Verde as of the end of and for each of the periods indicated. This information should be read in conjunction with, and is qualified in its entirety by reference to, Cerro Verde’s audited financial statements as of December 31, 2015 and 2016 and for the years ended December 31, 2014, 2015 and 2016, or the Cerro Verde Financial Statements. The selected financial information as of December 31, 2014 and for the years ended December 31, 2012 and 2013 have been derived from Cerro Verde’s financial statements that are not included in this Annual Report. The report of Paredes, Burga & Asociados S. Civil de R.L. (a member firm of EY Global) on Cerro Verde’s financial statements appears elsewhere in this Annual Report. The Cerro Verde Financial Statements are prepared and presented in accordance with IFRS as issued by the IASB, which differs in certain respects from U.S. GAAP, as indicated in Note 23 and Note 24 to the Cerro Verde Financial Statements. The operating data presented below, which are based on 100% of Cerro Verde’s production and reserves, are derived from Cerro Verde’s records and have not been subject to audit. The financial information presented below should be read in conjunction with “Item 5. Operating and Financial Review and Prospects—Cerro Verde,” the Cerro Verde Financial Statements and the related notes thereto and other financial information included in this Annual Report.
| 8 |
| As of and for the year ended December 31, | ||||||||||||||||||||
| 2016 | 2015 | 2014 |
2013 (2) |
2012 (2) |
||||||||||||||||
| (US$ in thousands) (1) | ||||||||||||||||||||
| Statement of comprehensive income: | ||||||||||||||||||||
| Sales of goods | 2,384,154 | 1,115,617 | 1,467,097 | 1,811,488 | 2,127,023 | |||||||||||||||
| Costs of sales of goods | (1,553,040 | ) | (862,004 | ) | (797,481 | ) | (795,064 | ) | (765,789 | ) | ||||||||||
| Gross profit | 831,114 | 253,613 | 669,616 | 1,016,424 | 1,361,234 | |||||||||||||||
| Operating expenses | ||||||||||||||||||||
| Selling expenses | (131,391 | ) | (56,215 | ) | (54,210 | ) | (68,448 | ) | (78,674 | ) | ||||||||||
| Expense related to water plant | - | - | - | - | (19,606 | ) | ||||||||||||||
| Other operating (expenses), income net | (24,107 | ) | (26,600 | ) | (3,629 | ) | 147 | (9,898 | ) | |||||||||||
| (155,498 | ) | (82,815 | ) | (57,839 | ) | (68,301 | ) | (108,178 | ) | |||||||||||
| Operating profit | 675,616 | 170,798 | 611,777 | 948,123 | 1,253,056 | |||||||||||||||
| Other income (expenses) | ||||||||||||||||||||
| Financial income | 954 | 512 | 2,443 | 2,178 | 1,886 | |||||||||||||||
| Financial expenses | (80,438 | ) | (16,010 | ) | (369 | ) | (1,843 | ) | (6,951 | ) | ||||||||||
| Exchange differences, net | 7,857 | (75,770 | ) | 2,284 | (1,858 | ) | 3,149 | |||||||||||||
| (71,627 | ) | (91,268 | ) | 4,358 | (1,523 | ) | (1,916 | ) | ||||||||||||
| Profit before income tax | 603,989 | 79,530 | 616,135 | 946,600 | 1,251,140 | |||||||||||||||
| Income tax expense | (263,082 | ) | (46,246 | ) | (238,529 | ) | (333,338 | ) | (454,556 | ) | ||||||||||
| Profit for the year | 340,907 | 33,284 | 377,606 | 613,262 | 796,584 | |||||||||||||||
| Basic and diluted earnings per share | 0.974 | 0.095 | 1.078 | 1.752 | 2.276 | |||||||||||||||
| Dividends per share | – | – | – | – | – | |||||||||||||||
| Weighted average number of shares outstanding | 350,056,012 | 350,056,012 | 350,056,012 | 350,056,012 | 350,056,012 | |||||||||||||||
| Statement of financial position data: | ||||||||||||||||||||
| Total assets | 7,635,623 | 7,852,692 | 5,771,984 | 4,828,201 | 4,078,553 | |||||||||||||||
| Total financial obligations | 1,996,004 | 2,425,164 | 452,849 | 5,903 | – | |||||||||||||||
| Capital Stock | 990,659 | 990,659 | 990,659 | 990,659 | 990,659 | |||||||||||||||
| Total shareholder’s equity, net | 4,839,281 | 4,498,374 | 4,465,090 | 4,087,484 | 3,474,222 | |||||||||||||||
| U.S. GAAP | ||||||||||||||||||||
| Profit for the year | 345,461 | 4,097 | 341,617 | 599,371 | 1,012,070 | |||||||||||||||
| Total shareholder’s equity, net | 4,742,139 | 4,396,678 | 4,392,581 | 4,050,964 | 3,451,593 | |||||||||||||||
| Operating data (unaudited): | ||||||||||||||||||||
| Production: | ||||||||||||||||||||
| Copper (in thousands of recoverable pounds) | 1,107,810 | 544,482 | 500,242 | 557,239 | 594,474 | |||||||||||||||
| Proven and probable reserves: | ||||||||||||||||||||
| Copper Ore (in thousands of tons) | 3,673,229 | 3,855,939 | 3,953,234 | 4,047,372 | 4,194,537 | |||||||||||||||
_________________________
| (1) | Except per share and operating data. |
| (2) | IFRIC 20 became effective January 1, 2013. Our results for the year 2012 include adjustments in connection with the application of IFRIC 20 “Stripping Cost in the Production Phase.” See Note 2(i) to the Cerro Verde Financial Statements. |
| 9 |
Exchange Rates
The following table sets forth the high and low month-end rates and the average and end-of-period offered rates for the sale of Soles in U.S. Dollars for the periods indicated. The Federal Reserve Bank of New York does not report a noon buying rate for Soles.
|
Exchange Rates
(Soles per US$) (1) |
||||||||||||||||
| Year |
High (2) |
Low (2) |
Average (3) |
Period end (4) |
||||||||||||
| 2014 | 2.990 | 2.761 | 2.840 | 2.989 | ||||||||||||
| 2015 | 3.413 | 2.983 | 3.187 | 3.408 | ||||||||||||
| 2016 | 3.532 | 3.244 | 3.376 | 3.357 | ||||||||||||
| 2016 |
High (5) |
Low (5) |
Average (6) |
Period end (7) |
||||||||||||
| October | 3.409 | 3.353 | 3.386 | 3.364 | ||||||||||||
| November | 3.438 | 3.356 | 3.404 | 3.414 | ||||||||||||
| December | 3.419 | 3.357 | 3.395 | 3.357 | ||||||||||||
| 2017 | ||||||||||||||||
| January | 3.395 | 3.274 | 3.340 | 3.274 | ||||||||||||
| February | 3.305 | 3.247 | 3.266 | 3.274 | ||||||||||||
| March | 3.302 | 3.244 | 3.269 | 3.254 | ||||||||||||
________________________
| (1) | Expressed in nominal (not inflation adjusted) Soles. |
| (2) | Highest and lowest of the twelve month-end exchange rates for each year based on the offered rate. |
| (3) | Average of month-end exchange rates based on the offered rate. |
| (4) | End-of-period exchange rates based on the offered rate. |
| (5) | Highest and lowest of the exchange rates based on the offered rate on the last day of each month. |
| (6) | Average of the exchange rates based on the offered rate on the last date of each day in the relevant month. |
| (7) | The exchange rate based on the offered rate on the last day of each relevant month. |
Source: Bloomberg
On April 27, 2017, the offered rate for Dollars as published by the SBS was S/.3.247 per US$1.00.
| B. | Capitalization and Indebtedness |
Not applicable.
| C. | Reasons for the Offer and Use of Proceeds |
Not applicable.
| D. | Risk Factors |
Factors Relating to the Company
Our financial performance is highly dependent on the performance of our partners under our mining exploration and operating agreements.
Our participation in joint venture mining exploration projects and mining operations with other experienced mining companies is an integral part of our business strategy. Our partners, co-venturers and other shareholders in these projects generally contribute capital to cover the expenses of the joint venture or provide critical technological, management and organizational expertise. The results of these projects can be highly dependent upon the efforts of our joint venture partners and we rely on them to fulfill their obligations under our agreements. For example, our Yanacocha joint venture with Newmont Mining Corporation, a Delaware corporation, or “Newmont Mining,” depends on Newmont Peru Limited, Peruvian Branch, or “Newmont Peru,” to provide management and other expertise to the Yanacocha project. If our counterparts do not carry out their obligations to us or to third parties, or any disputes arise with respect to the parties’ respective rights and obligations, the value of our investment in the applicable project could be adversely affected and we could incur significant expense in enforcing our rights or pursuing remedies. We cannot assure you that our current or future partners will fulfill their obligations under our agreements. In addition, we may be unable to exert control over strategic decisions made in respect of such properties. See “Item 4. Information on the Company—Yanacocha” and “Item 4. Information on the Company—Buenaventura—B. Business Overview—Exploration.”
| 10 |
Our financial performance is highly dependent on the prices of gold, silver, copper and other metals.
The results of our operations are significantly affected by the market price of specific metals, which are cyclical and subject to substantial price fluctuations. Our revenues and the revenues of Yanacocha, in which we have a material equity investment, are derived primarily from the sale of gold and silver and the revenues of Cerro Verde, in which we have a material equity investment, are derived primarily from copper sales. The prices that we, Yanacocha and Cerro Verde obtain for gold, silver, copper and ore concentrates containing such metals, as applicable, are directly related to world market prices for such metals. Such prices have historically fluctuated widely and are affected by numerous factors beyond our control, including (i) the overall demand for and worldwide supply of gold, silver, copper and other metals; (ii) levels of supply and demand for a broad range of industrial products; (iii) the availability and price of competing commodities; (iv) international economic and political trends; (v) currency exchange fluctuations (specifically, the U.S. Dollar relative to other currencies); (vi) expectations with respect to the rate of inflation; (vii) interest rates; (viii) actions of commodity markets participants; and (ix) global or regional political or economic crises.
We have in the past engaged in hedging activities, such as forward sales and option contracts, to minimize our exposure to fluctuations in the prices of gold, silver and other metals; however, we and our wholly-owned subsidiaries no longer hedge the price at which our gold and silver will be sold. In the case of El Brocal, we use derivative instruments to manage its exposure to changes in the base metal prices. In addition, neither Yanacocha nor Cerro Verde engages in hedging activities. As a result, the prices at which we, Yanacocha and Cerro Verde sell gold, silver, copper and ore concentrates, as applicable, are fully exposed to the effects of changes in prevailing market prices. See “Item 11. Quantitative and Qualitative Disclosures About Market Risk” and Note 33 to the Financial Statements. For information on gold and silver prices for each of the years in the five-year period ended December 31, 2016, see “Item 4. Information on the Company—Buenaventura—B. Business Overview—Sales of Metal Concentrates.”
On December 30, 2016 and March 31, 2017, the morning fixing price for gold on the London Bullion Market was US$1,159.10 per ounce and US$1,241.70 per ounce, respectively. On December 29, 2016 and March 31, 2017, the afternoon fixing spot price of silver on the London market, or “London Spot,” was US$1,145.90 per ounce and US$1,244.85 per ounce, respectively. On December 30, 2016 and March 31, 2017, the London Metal Exchange Settlement Price for copper was US$5,523 per ton and US$5,816, per ton, respectively.
The world market prices of gold, silver and copper have historically fluctuated widely. We cannot predict whether metal prices will rise or fall in the future. A continued decline in the market price of one or more of these metals could adversely impact our revenues, net income and cash flows and adversely affect our ability to meet our financial obligations. If prices of gold, silver and/or copper should decline below our cash costs of production and remain at such levels for any sustained period, we could determine that it is not economically feasible to continue production at any or all of our mines. We may also curtail or suspend some or all of our exploration activities, with the result that our depleted reserves are not replaced. This could further reduce revenues by reducing or eliminating the profit that we currently expect from reserves. Such declines in price and/or reductions in operations could cause significant volatility in our financial performance and adversely affect the trading prices of our Common Shares and ADSs.
Economic, mining and other regulatory policies of the Peruvian government, as well as political, regulatory and economic developments in Peru, may have an adverse impact on our, Yanacocha’s and Cerro Verde’s businesses.
Our, Yanacocha’s and Cerro Verde’s activities in Peru require us to obtain mining concessions or provisional permits for exploration and processing concessions for the treatment of mining ores from the Peruvian Ministry of Energy and Mines (the “MEM”). Under Peru’s current legal and regulatory regime, these mining and processing rights are maintained by meeting a minimum annual level of production or investment and by the annual payment of a concession fee. A fine is payable for the years in which minimum production or investment requirements are not met. Although we are, and Yanacocha and Cerro Verde have informed us that they are, current in the payment of all amounts due in respect of mining and processing concessions, failure to pay such concession fees, processing fees or related fines for two consecutive years could result in the loss of one or more mining rights and processing concessions, as the case may be.
| 11 |
Mining companies are also required to pay the Peruvian government mining royalties and/or mining taxes. See “Item 4. Information on the Company—Buenaventura—B. Business Overview—Regulatory Framework—Mining Royalties and Taxes.” We cannot assure you that the Peruvian government will not impose additional mining royalties or taxes in the future or that such mining royalties or taxes will not have an adverse effect on our, Yanacocha’s or Cerro Verde’s results of operations or financial condition. Future regulatory changes, changes in the interpretation of existing regulations or stricter enforcement of such regulations, including changes to our concession agreements, may increase our compliance costs and could potentially require us to alter our operations. We cannot assure you that future regulatory changes will not adversely affect our business, financial condition or results of operations.
Environmental and other laws and regulations may increase our costs of doing business, restrict our operations or result in operational delays.
Our, Yanacocha’s and Cerro Verde’s exploration, mining and milling activities, as well our and Yanacocha’s smelting and refining activities, are subject to a number of Peruvian laws and regulations, including environmental laws and regulations.
Additional matters subject to regulation include, but are not limited to, concession fees, transportation, production, water use and discharges, power use and generation, use and storage of explosives, surface rights, housing and other facilities for workers, reclamation, taxation, labor standards, mine safety and occupational health.
We anticipate additional laws and regulations will be enacted over time with respect to environmental matters. The development of more stringent environmental protection programs in Peru could impose constraints and additional costs on our, Yanacocha’s and Cerro Verde’s operations and require us, Yanacocha and Cerro Verde to make significant capital expenditures in the future. Although we believe that we are substantially in compliance, and Yanacocha and Cerro Verde have advised us that they are substantially in compliance, with all applicable environmental regulations, we cannot assure you that future legislative or regulatory developments will not have an adverse effect on our, Yanacocha’s or Cerro Verde’s business or results of operations. See “Item 4. Information on the Company—Buenaventura—B. Business Overview—Regulatory Framework—Environmental Matters” and “—Permits” and “Item 4. Information on the Company—Yanacocha—B. Business Overview—Regulation, Permit and Environmental Matters.”
Our and Yanacocha’s ability to successfully obtain key permits and approvals to explore for, develop and successfully operate mines will likely depend on our and Yanacocha’s ability to do so in a manner that is consistent with the creation of social and economic benefits in the surrounding communities. Our and Yanacocha’s ability to obtain permits and approvals and to successfully operate in particular communities or to obtain financing may be adversely impacted by real or perceived detrimental events associated with our and Yanacocha’s activities or those of other mining companies affecting the environment, human health and safety or the surrounding communities. Delays in obtaining or failure to obtain government permits and approvals may adversely affect our and Yanacocha’s operations, including our and Yanacocha’s ability to explore or develop properties, commence production or continue operations.
Our metals exploration efforts are highly speculative in nature and may not be successful.
Precious metals exploration, particularly gold exploration, is highly speculative in nature, involves many risks and frequently is unsuccessful. We cannot assure you that our, Yanacocha’s or Cerro Verde’s metals exploration efforts will be successful. Once mineralization is discovered, it may take a number of years from the initial phases of drilling before production is possible, during which time the economic feasibility of production may change. Substantial expenditures are required to establish proven and probable ore reserves through drilling, to determine metallurgical processes to extract the metals from the ore and, in the case of new properties, to construct mining and processing facilities. As a result of these uncertainties, we cannot assure you that our or Yanacocha’s exploration programs will result in the expansion or replacement of current production with new proven and probable ore reserves.
| 12 |
We base our estimates of proven and probable ore reserves and estimates of future cash operating costs largely on the interpretation of geologic data obtained from drill holes and other sampling techniques and feasibility studies. Advanced exploration projects have no operating history upon which to base estimates of proven and probable ore reserves and estimates of future cash operating costs. Such estimates are, to a large extent, based upon the interpretation of geologic data obtained from drill holes and other sampling techniques, feasibility studies which derive estimates of cash operating costs based upon anticipated tonnage and grades of ore to be mined and processed, the configuration of the ore body, expected recovery rates of the mineral from the ore, comparable facility and equipment operating costs, anticipated climatic conditions and other factors. As a result, it is possible that actual cash operating costs and economic returns based upon proven and probable ore reserves may differ significantly from those originally estimated. Moreover, significant decreases in actual over expected prices may mean reserves, once found, will be uneconomical to produce. It is not unusual in new mining operations to experience unexpected problems during the start-up phase. See “Item 4. Information on the Company—Yanacocha—C. Property, Plants and Equipment—Our Properties—Reserves,” “—Yanacocha—C. Property, Plants and Equipment—Yanacocha’s Properties—Reserves” and “Item 5. Operating and Financial Review and Prospects—Cerro Verde—A. Operating Results” for the price per ounce used by us, Yanacocha and Cerro Verde, respectively, to calculate our respective proven and probable reserves.
Increased operating costs could affect our profitability.
Costs at any particular mining location frequently are subject to variation due to a number of factors, such as changing ore grade, changing metallurgy and revisions to mine plans in response to the physical shape and location of the ore body. In addition, costs are affected by the price of commodities, such as fuel and electricity, as well as by the price of labor. Commodity costs are at times subject to volatile price movements, including increases that could make production at certain operations less profitable. Reported costs may be affected by changes in accounting standards. A material increase in costs at any significant location could have a significant effect on our profitability.
Our business is capital-intensive and we may not be able to finance necessary capital expenditures required to execute our business plans.
Precious metals exploration requires substantial capital expenditures for the exploration, extraction, production and processing stages and for machinery, equipment and experienced personnel. Our estimates of the capital required for our projects may be preliminary or based on assumptions we have made about the mineral deposits, equipment, labor, permits and other factors required to complete our projects. If any of these estimates or assumptions change, the actual timing and amount of capital required may vary significantly from our current anticipated costs. In addition, we may require additional funds in the event of unforeseen delays, cost overruns, design changes or other unanticipated expenses. We may also incur debt in future periods or reduce our holdings of cash and cash equivalents in connection with funding future acquisitions, existing operations, capital expenditures or in pursuing other business opportunities. Our ability to meet our payment obligations will depend on our future financial performance, which will be affected by financial, business, economic and other factors, many of which we are unable to control. There can be no assurance that we or Yanacocha will generate sufficient cash flow or that we will have access to sufficient external sources of funds in the form of outside investment or loans to continue exploration activities at the same or higher levels than in the past or that we will be able to obtain additional financing, if necessary, on a timely basis and on commercially acceptable terms.
Estimates of proven and probable reserves are subject to uncertainties and the volume and grade of ore actually recovered may vary from our estimates.
The proven and probable ore reserve figures presented in this Annual Report are our, Yanacocha’s and Cerro Verde’s estimates, and there can be no assurance that the estimated levels of recovery of gold, silver, copper and certain other metals will be realized. Such estimates depend on geological interpretation and statistical inferences or assumptions drawn from drilling and sampling analysis, which may prove to be materially inaccurate. Actual mineralization or formations may be different from those predicted. As a result, reserve estimates may require revision based on further exploration, development activity or actual production experience, which could materially and adversely affect such estimates. No assurance can be given that our, Yanacocha’s or Cerro Verde’s mineral resources constitute or will be converted into reserves. Market price fluctuations of gold, silver and other metals, as well as increased production costs or reduced recovery rates, may render proven and probable ore reserves containing relatively lower grades of mineralization uneconomic to exploit and may ultimately result in a restatement of proven and probable ore reserves. Moreover, short-term operating factors relating to the reserves, such as the processing of different types of ore or ore grades, could adversely affect our or Yanacocha’s profitability in any particular accounting period. See “Item 4. Information on the Company—Yanacocha—C. Property, Plants and Equipment—Our Properties—Reserves” and “Item 4. Information on the Company—Yanacocha—C. Property, Plants and Equipment—Yanacocha’s Properties—Reserves.”
| 13 |
We and Yanacocha may be unable to replace reserves as they become depleted by production.
As we and Yanacocha produce gold, silver, zinc and other metals, we and Yanacocha deplete our respective ore reserves for such metals. To maintain production levels, we and Yanacocha must replace depleted reserves by exploiting known ore bodies and locating new deposits. Exploration for gold, silver and the other metals produced is highly speculative in nature. Our and Yanacocha’s exploration projects involve significant risks and are often unsuccessful. Once a site is discovered with mineralization, we and Yanacocha may require several years between initial drilling and mineral production, and the economic feasibility of production may change during such period. Substantial expenditures are required to establish proven and probable reserves and to construct mining and processing facilities. There can be no assurance that current or future exploration projects will be successful and there is a risk that our depletion of reserves will not be offset by new discoveries. See “Item 4. Information on the Company—Buenaventura—B. Business Overview—Exploration,” “—Yanacocha—B. Business Overview—Exploration,” “—Yanacocha—C. Property, Plants and Equipment—Our Properties,” “—Yanacocha—C. Property, Plants and Equipment—Yanacocha’s Properties,” “—Yanacocha—C. Property, Plants and Equipment—Reserves,” and “Item 5. Operating and Financial Review and Prospects—Cerro Verde—A. Operating Results” for a summary of our, Yanacocha’s and Cerro Verde’s estimated proven and probable reserves as of December 31, 2016.
Our operations are subject to risks, many of which are not insurable.
The business of mining, smelting and refining gold, silver, copper and other metals is generally subject to a number of risks and hazards, including industrial accidents, labor disputes, unavailability of materials and equipment, unusual or unexpected geological conditions, changes in the regulatory environment, environmental hazards and weather and other natural phenomena such as earthquakes, most of which are beyond our control. Such occurrences could result in damage to, or destruction of, mining properties or production facilities, personal injury or death, environmental damage, delays in mining, monetary losses and possible legal liability. We, Yanacocha and Cerro Verde each maintain insurance against risks that are typical in the mining industry in Peru and in amounts that we, Yanacocha and Cerro Verde believe to be adequate but which may not provide adequate coverage in certain circumstances. No assurance can be given that such insurance will continue to be available at economically feasible premiums or at all. Insurance against certain risks (including certain liabilities for environmental pollution or other hazards as a result of exploration and production) is not generally available to us or to other companies within the industry.
Increases in equipment costs, energy costs and other production costs, disruptions in energy supply and shortages in equipment and skilled labor may adversely affect our results of operations.
In recent years, there has been a significant increase in mining activity worldwide in response to increased demand and significant increases in the prices of natural resources. The opening of new mines and the expansion of existing ones have led to increased demand for, and increased costs and shortages of, equipment, supplies and experienced personnel. These cost increases have significantly increased overall operating and capital budgets of companies like ours, and continuing shortages could affect the timing and feasibility of expansion projects.
Energy represents a significant portion of our production costs. Our principal energy sources are electricity, purchased petroleum products and natural gas. An inability to procure sufficient energy at reasonable prices or disruptions in energy supply could adversely affect our profits, cash flow and growth opportunities. Our production costs are also affected by the prices of commodities we consume or use in our operations, such as sulfuric acid, grinding media, steel, reagents, liners, explosives and diluents. The prices of such commodities are influenced by supply and demand trends affecting the mining industry in general and other factors outside our control and such prices are at times subject to volatile movements. Increases in the cost of these commodities or disruptions in energy supply could make our operations less profitable, even in an environment of relatively high copper, gold or silver prices. Increases in the costs of commodities that we consume or use may also significantly affect the capital costs of new projects.
| 14 |
We may be adversely affected by labor disputes.
Our ability to achieve our goals and objectives is dependent, in part, on maintaining good relations with our employees. A prolonged labor disruption at any of our material properties could have a material adverse impact on our results of operations. We, Compañía Minera Coimolache S.A., or “Coimolache,” Yanacocha and Cerro Verde have all experienced strikes or other labor-related work stoppages in the past.
As of December 31, 2016, unions represented approximately 35% of the employees of our mining companies on a consolidated basis. Although we consider our relationship with our employees to be positive, there can be no assurance that we will not experience strikes or other labor-related work stoppages that could have a material adverse effect on our operations and/or operating results in the future.
Our, Yanacocha and Cerro Verde’s operations are subject to political and social risks.
Our, Yanacocha and Cerro Verde’s exploration and production activities are potentially subject to political and social risks. Over the past several years, we and Yanacocha have been the target of local political protests. In recent years, certain areas in the south and northern highlands of Peru with significant mining developments have experienced strikes and protests related to the environmental impact of mining activities. Such strikes and protests have resulted in commercial disruptions and a climate of uncertainty with respect to future mining projects. As a result of local political and community protests, construction and development activities at the Conga project were largely suspended in November 2011. The results of the Peruvian Central Government’s Environmental Impact Assessment (“EIA”) independent review were reported on April 20, 2012. The review indicated the project’s EIA met Peruvian and international standards. The review made recommendations to provide additional water capacity and social funds, which Yanacocha has largely accepted. Yanacocha announced the decision to advance the project on a “water-first” basis on June 22, 2012. In the first half of 2014, a Conga Restart Study was completed to identify and test alternatives to advancing development of the project. Following this assessment, a new plan was developed to reduce spending to focus only on the most critical work (protecting people and assets, engaging with communities and maintaining existing project infrastructure), while maintaining optionality. Newmont Mining will not proceed with the full development of the Conga project without social acceptance, solid project economics and, potentially, another partner to help defray costs and risk. It is difficult to predict when or whether such events may occur. Under the current social and political environment, we do not anticipate being able to develop the Conga project in the foreseeable future. The continued delay and evaluation of other alternatives may result in a potential accounting impairment or further reclassification of mineralized material.
We cannot assure you that these types of incidents will not continue or that similar incidents will not occur in areas in which we and Yanacocha operate, or that the continuation or intensification of community protests will not adversely affect our or Yanacocha’s exploration and production activities or our or Yanacocha’s results of operations or financial condition.
In addition, during 2011, Peru enacted Law No. 29785, the Law of Prior Consultation for Indigenous and Native Communities ( Ley del Derecho a la Consulta Previa a los Pueblos Indígenas y Originarios, Reconocido en el Convenio 169 de la Organización Internacional del Trabajo ). Implementing regulations thereunder were approved by Supreme Decree No. 001-2012-MC, which became effective on April 2, 2012. This law establishes a prior consultation procedure that the Peruvian government must undertake in concert with any local indigenous communities whose collective rights may be directly affected by new legislative or administrative measures, including the granting of new mining concessions. The implementing regulations specify the form and circumstances of the required consultation and the manner in which agreements will be formalized, and cap the consultation process at 120 calendar days. Under the law, the Peruvian governmental body responsible for issuing or approving the administrative measure or decree in question, rather than the affected local indigenous community, retains the right to approve or reject the relevant legislative or administrative matter following such consultation. However, to the extent that any future projects operated by us, Yanacocha or Cerro Verde require legislative or administrative measures that impact local indigenous communities, the required prior consultation procedure may result in delays, additional expenses or failure to obtain approval for such new project.
| 15 |
We could face geotechnical challenges, which could adversely impact our production and profitability.
No assurances can be given that unanticipated adverse geotechnical and hydrological conditions, such as landslides and pit wall failures, will not occur in the future or that such events will be detected in advance. Geotechnical instabilities can be difficult to predict and are often affected by risks and hazards outside of our control, such as severe weather and considerable rainfall, which may lead to periodic floods, mudslides, wall instability and seismic activity, which may result in slippage of material.
Geotechnical failures could result in limited or restricted access to mine sites, suspension of operations, government investigations, increased monitoring costs, remediation costs, loss of ore and other impacts, which could cause one or more of our projects to be less profitable than currently anticipated and could result in a material adverse effect on our results of operations and financial position.
We rely on contractors to conduct a significant portion of our operations and mine development projects.
A significant portion of our operations and mine development projects are currently conducted by contractors. As a result, our operations are subject to a number of risks, some of which are outside our control, including:
| · | failure of a contractor to perform under its agreement; |
| · | interruption of operations or increased costs if a contractor ceases its business due to insolvency or other unforeseen events; |
| · | failure of a contractor to comply with applicable legal and regulatory requirements, to the extent it is responsible for such compliance; and |
| · | problems of a contractor with managing its workforce, labor unrest or other employment issues. |
In addition, we may incur liability to third parties as a result of the actions of our contractors. The occurrence of one or more of these risks could adversely affect our results of operations and financial position.
We are not, and do not intend to become, regulated as an investment company under the U.S. Investment Company Act of 1940, as amended (the “Investment Company Act”), and if we were deemed an “investment company” under the Investment Company Act, applicable restrictions could make it impractical for us to operate as contemplated.
As of December 31, 2016, we owned a 43.65% partnership interest in Yanacocha and a 19.58% equity interest in Cerro Verde. These interests may constitute “investment securities” for purposes of the Investment Company Act.
Under the Investment Company Act, an investment company is defined in relevant part to include (i) any company that is or holds itself out as being engaged primarily, or proposes to engage primarily, in the business of investing, reinvesting or trading in securities and (ii) any company that owns or proposes to acquire investment securities having a value exceeding 40% of such company’s total assets (exclusive of certain items) on an unconsolidated basis. Issuers that are investment companies within the meaning of the Investment Company Act, and which do not qualify for an exemption from the provisions of such act, are required to register with the Securities and Exchange Commission (the “SEC”) and are subject to substantial regulations with respect to capital structure, operations, transactions with affiliates and other matters. If we were deemed to be an investment company and did not qualify for an exemption from the provisions of the Investment Company Act, we would be required to register with the SEC and would be subject to such regulations, which would be unduly burdensome and costly for us and possibly adversely impact us.
| 16 |
We received an order from the SEC on April 19, 1996 declaring us to be primarily engaged in a business other than that of an investment company and, therefore, not an investment company within the meaning of the Investment Company Act. We intend to conduct our operations and maintain our investments in a manner, and will take appropriate actions as necessary, to ensure we will not be deemed to be an investment company in the future. The SEC, however, upon its motion or upon application, may find that the circumstances that gave rise to the issuance of the order no longer exist, and as a result may revoke such order. There can be no assurance that such order will not be revoked.
Our or Yanacocha’s inability to maintain positive relationships with the communities in which we operate may affect our or Yanacocha’s reputation and financial condition.
Our and Yanacocha’s relationships with the communities in which we operate are critical to ensuring the future success of our existing operations and the construction and development of our projects. Adverse publicity generated by non-governmental organizations or local communities related to extractive industries generally, or our or Yanacocha’s operations specifically, could have an adverse effect on our reputations or financial condition and may impact our relationships with the communities in which we operate. In addition, following the enactment of Law No. 29785, the Law of Prior Consultation for Indigenous and Native Communities in 2011, the Peruvian government must undertake a prior consultation procedure in concert with local indigenous communities whose collective rights may be directly affected by new legislative or administrative measures, including the granting of new mining concessions. Implementing regulations under Law No. 29785 were approved by Supreme Decree No. 001-2012-MC, which became effective on April 2, 2012. The implementing regulations specify the form and circumstances of the required consultation and the manner in which agreements will be formalized, and cap the consultation process at 120 calendar days. Our and Yanacocha’s national reputation for maintaining positive relationships with the communities in which we operate may affect the outcome of any such prior consultation process involving approvals that we or Yanacocha seek for new projects. While we and Yanacocha are committed to operating in a socially responsible manner, there is no guarantee that our efforts in this regard will mitigate this potential risk. We and Yanacocha have implemented extensive community relations and security and safety initiatives to anticipate and manage social issues that may arise at our operations. See “Item 4. Information on the Company—Yanacocha—B. Business Overview—Social Development.”
The Conga project is located within close proximity of existing operations at Yanacocha. Due to local political and community protests, construction and development activities at the Conga project were largely suspended in November 2011. The results of the Peruvian central government-initiated EIA, independent review, announced on April 20, 2012, confirmed that Yanacocha’s initial EIA met Peruvian and international standards. The review made recommendations to provide additional water capacity and social funds, which Yanacocha has largely accepted. Yanacocha announced its decision to move the project forward on a “water first” basis on June 22, 2012, which consists of building the originally planned community water reservoirs before resuming any mine development. As a result, during 2013 the project was focused on building water reservoirs, completing the remaining engineering activities, and accepting delivery of the main equipment purchases. In 2013, the Chailhuagon reservoir was completed. There can be no assurance that Yanacocha will be able to continue to develop the Conga project. Should Yanacocha be unable to continue with the current development plan at the Conga project, we or our mining partners in this project may reprioritize and reallocate capital to development alternatives, which may result in a potential accounting impairment. See “Item 4. Information on the Company—Yanacocha—B. Business Overview—Exploration.
Deterioration in our financial position or a downgrade of our ratings by a credit rating agency could increase our borrowing costs and our business relationships could be adversely affected.
Credit rating agencies could downgrade our ratings either due to factors specific to Buenaventura, a prolonged cyclical downturn in the precious metals mining industries, macroeconomic trends (such as global or regional recessions) or trends in credit and capital markets more generally. For instance, on March 22, 2016, Moody’s downgraded our unsecured corporate rating from “Ba1” to “Ba2” due to the deterioration of the commodities markets and a downturn in the precious metals mining sector, as well as concerns about our liquidity. Currently, our unsecured rating from Fitch is “BBB-.”
A deterioration of our financial position or a further downgrade of any of our credit ratings for any reason could increase our borrowing costs and have an adverse effect on our business relationships with customers and suppliers. A subsequent downgrade could adversely affect our existing financings, limit access to the capital or credit markets, or otherwise adversely affect the availability of other new financing on favorable terms, if at all, result in more restrictive covenants in agreements governing the terms of any future indebtedness that we incur, increase our borrowing costs, or otherwise impair our business, financial condition and operating results.
| 17 |
Factors Relating to Peru
Peruvian political conditions may have an adverse impact on our, Yanacocha’s and Cerro Verde’s business.
All of our, Yanacocha’s and Cerro Verde’s operations are conducted in Peru. Accordingly, our, Yanacocha’s and Cerro Verde’s business, financial condition or results of operations could be affected by changes in economic or other policies of the Peruvian government or other political, regulatory or economic developments in Peru.
Peru has had a history of political instability that has included military coups and a succession of regimes with differing policies and programs. Past governments have frequently played an interventionist role in the nation’s economy and social structure. Among other things, past governments have imposed controls on prices, exchange rates and local and foreign investment as well as limitations on imports, restricted the ability of companies to dismiss employees, expropriated private sector assets (including mining companies) and prohibited the remittance of profits to foreign investors.
The administration under President Ollanta Humala largely supported mining as a driver for the continued growth and future development of Peru. However, Peru held its elections for President in April 2016 in which President Ollanta Humala was ineligible to run due to constitutional term limits. With no candidate receiving a 50% majority of the vote, a run-off election was held in June 2016. Pedro Pablo Kuczynski ultimately defeated opponent Keiko Fujimori by less than half of a percentage point and was sworn in as president on July 28, 2016. We cannot predict future government positions on mining concessions, land tenure, environmental regulation or taxation or assure you that future governments will maintain a generally favorable business climate and economic policies. Furthermore, the regional governor in Cajamarca, who was re-elected in October 2014, actively opposed the Conga project in 2012 and continues to reject the viability of its development. We cannot predict the future positions of either the central government or regional governments on foreign investment, mining concessions, land tenure or other regulation. Any change in government positions or laws on these issues could adversely affect the assets and operations of us, Yanacocha or the Conga project, which could have a material adverse effect on our business, results of operations and financial position. Regulatory changes may include increased labor regulations, environmental and other regulatory requirements and additional taxes and royalties, and we may experience future protests, community demands and road blockages. Additionally, any inability to continue to develop the Conga project or operate at Yanacocha could have a material adverse impact on our business, results of operations and financial position if Yanacocha is not able to replace its expected production.
Inflation, reduced economic growth and fluctuations in the Sol exchange rate may adversely affect our financial condition and results of operations.
Prior to 1994, Peru periodically experienced high inflation, slow or negative economic growth and substantial currency devaluation. The inflation rate in Peru, as measured by the Indice de Precios al Consumidor and published by Instituto Nacional de Estadística e Informática has fallen from a high of 7,649.7% in 1990 to 3.35% in 2016. Our revenues and operating expenses are primarily denominated in U.S. Dollars. If inflation in Peru were to increase without a corresponding devaluation of the Sol relative to the U.S. Dollar, our financial position and results of operations, and the market price of our Common Shares and ADSs, could be affected. Although the Peruvian government’s stabilization plan has significantly reduced inflation since 1999, and the Peruvian economy has experienced strong growth in recent years, there can be no assurance that inflation will not increase from its current level or that such growth will continue in the future at similar rates or at all.
Among the economic circumstances that could lead to a devaluation would be the decline of Peruvian foreign reserves to inadequate levels. Peru’s foreign reserves at December 31, 2016 were US$61.69 billion as compared to US$61.48 billion at December 31, 2015. Although actual foreign reserves must be maintained at levels that will allow the succeeding government the ability to manage the Peruvian economy and to assure monetary stability in the near future, there can be no assurance that Peru will be able to maintain adequate foreign reserves to meet its foreign currency denominated obligations, or that Peru will not devalue its currency should its foreign reserves decline. See “Item 3. Key Information—A. Selected Financial Data—Exchange Rates.”
| 18 |
Peru’s current account deficit is being funded partially by foreign direct investment. There can be no assurance that foreign direct investment will continue at current levels, particularly if adverse political or economic developments in Peru arise, a development that may also contribute to devaluation pressure.
Deterioration in economic and market conditions in Latin America, Peru and other emerging market countries could affect the prices of our Common Shares and American Depositary Receipts (“ADRs”).
Although economic conditions are different in each country, the reaction of investors to developments in one country is likely to cause the capital markets in other countries to fluctuate. For example, political and economic events, such as the crises in Venezuela, Ecuador, Bolivia, Brazil and Argentina, have influenced investors’ perceptions of risk with regard to Peru. The negative investor reaction to developments in Latin America, particularly in our neighboring countries, may adversely affect the market for securities issued by countries in the region, cause foreign investors to decrease the flow of capital into Latin America and introduce uncertainty about plans for further integration of regional economies.
Peruvian exchange and investment control policies could affect dividends paid to holders of Common Shares and ADRs.
Peruvian law currently imposes no restrictions on the ability of companies operating in Peru to transfer foreign currency from Peru to other countries, to convert Peruvian currency into foreign currency or foreign currency into Peruvian currency or to remit dividends abroad, or on the ability of foreign investors to liquidate their investment and repatriate their capital. Before 1991, Peru had restrictive exchange controls and exchange rates. During the latter part of the 1980s, exchange restrictions prevented payment of dividends to our shareholders in the United States (the “U.S.”) in U.S. Dollars. Accordingly, should such or similar controls be instituted, dividends paid to holders of Common Shares and, consequently, holders of ADRs, could be affected. There can be no assurance that the Peruvian government will continue to permit such transfers, remittances or conversion without restriction. See “Item 10. Additional Information—D. Exchange Controls.”
U.S. securities laws do not require us to disclose as much information to investors as a U.S. issuer is required to disclose, and you may receive less information about us than you might otherwise receive from a comparable U.S. company.
The corporate disclosure requirements applicable to us may not be equivalent to the requirements applicable to a U.S. company and, as a result, you may receive less information about us than you might otherwise receive in connection with a comparable U.S. company. We are subject to the periodic reporting requirements of the United States Securities Exchange Act of 1934, as amended, or the Exchange Act, that apply to “foreign private issuers.” The periodic disclosure required of foreign private issuers under the Exchange Act is more limited than the periodic disclosure required of U.S. issuers.
Holders of our securities may find it difficult to enforce judgments against us outside of Peru.
We are organized under the laws of Peru. A significant majority of our directors and officers reside outside the U.S. (principally in Peru). All or a substantial portion of our assets or the assets of such persons are located outside the U.S. As a result, it may not be possible for investors to effect service of process within the U.S. upon us or upon such persons or to enforce against them in federal or state courts in the U.S. judgments predicated upon the civil liability provisions of the federal securities laws of the U.S. We have been advised by our Peruvian counsel that there is uncertainty as to the enforceability, in original actions in Peruvian courts, of liabilities predicated solely under the U.S. federal securities laws and as to the enforceability in Peruvian courts of judgments of U.S. courts obtained in actions predicated upon the civil liability provisions of the U.S. federal securities laws.
Factors Relating to the Common Shares and ADSs
The concentration of our capital stock ownership with the Benavides Family will limit our stockholders’ ability to influence corporate matters.
| 19 |
As of March 31, 2017, the Benavides family, referring to certain members, and their spouses, of the immediate and extended family of Elsa Ganoza Benavides, spouse of the late Alberto Benavides de la Quintana, our founder and former Chairman (collectively, the “Benavides Family”), held 27.24% (including outstanding Common Shares and Investment Shares) of Buenaventura’s outstanding share capital. Because of the significant ownership interest the Benavides Family holds in Common Shares, the Benavides Family has the power to elect a significant number of the outstanding directors and has significant influence over the outcome of substantially all matters to be decided by a vote of shareholders.
In addition, under the terms of the Amended and Restated Deposit Agreement dated May 3, 2002, as further amended and restated as of November 12, 2003, among us, The Bank of New York Mellon (formerly The Bank of New York), as depositary, or the “Depositary”, and the owners and beneficial owners of ADSs, or the Amended and Restated Deposit Agreement, relating to our ADSs, if holders of ADSs do not provide the Depositary with timely instructions for the voting of Common Shares represented by such ADRs, the Depositary will be deemed to be instructed to give a person designated by us, which will likely be a member of the Benavides Family, a discretionary proxy to vote such shares, unless we inform the Depositary that we do not wish such proxy to be given.
Shareholders’ rights under Peruvian law may be fewer and less well-defined than shareholders’ rights in other countries, including the U.S.
Our shareholders have fewer and less well-defined rights under applicable Peruvian law than they might have as shareholders of a corporation incorporated in a jurisdiction of the U.S. or certain other countries. For example, Peruvian law does not provide for proceedings by which non-controlling shareholders may file class action lawsuits or shareholder derivative actions against controlling shareholders or officers and directors, and the procedural requirements to file shareholder actions in Peru differ from those of the U.S. As a result, holders of our shares may face difficulty enforcing their rights.
A sale of a substantial number of shares by the Benavides Family could have an adverse impact on the price of our Common Shares and ADSs.
The sale of a substantial number of our shares by members of the Benavides Family, or a market perception of the intention of members of the Benavides Family to sell a substantial number of shares, could materially and adversely affect prevailing market prices for the Common Shares and ADSs. There is no contractual restriction on the disposition of shares of our share capital by our shareholders, including the Benavides Family. Furthermore, under the Ley General de Sociedades Peruanas , or “Peruvian Companies Law,” any restriction on the free sale of shares in a sociedad anónima abierta (open stock company) such as we are, is null and void.
Holders of ADSs may be unable to exercise preemptive rights and accretion rights available to the Common Shares underlying the ADSs.
Holders of the ADSs are, under Peruvian law, entitled to exercise preemptive rights and accretion rights on the Common Shares underlying the ADSs in the event of any future capital increase by us unless (x) the increase is approved, expressly stating that the shareholders have no preemptive rights to subscribe and pay for the Shares to be issued in such increase, by holders of Common Shares holding at least 40% of the Common Shares at a properly called meeting with a proper quorum and (y) the increase is not designed to improve directly or indirectly the shareholding of any shareholder. However, U.S. holders of ADSs may not be able to exercise through the Depositary for the ADSs the preemptive rights and accretion rights for Common Shares underlying their ADSs unless a registration statement under the Securities Act of 1933, as amended, or the “Securities Act,” is effective with respect to such rights or an exemption from the registration requirement thereunder is available. Any such rights offering would have a dilutive effect upon shareholders who are unable or unwilling to exercise their rights. We intend to evaluate, at the time of any rights offering, the costs and potential liabilities associated with any registration statement as well as the associated benefits of enabling the holders of ADSs to exercise such rights and will then make a decision as to whether to file such a registration statement. Therefore, no assurance can be given that we will file any such registration statement. To the extent that holders of ADSs are unable to exercise such rights because a registration statement has not been filed and no exemption from such registration statement under the Securities Act is available, the Depositary will, to the extent practicable, sell such holders’ preemptive rights or accretion rights and distribute the net proceeds thereof, if any, to the holders of ADSs, and such holders’ equity interest in us will be diluted proportionately. The Depositary has discretion to make rights available to holders of ADSs or to dispose of such rights and to make any net proceeds available to such holders. If, by the terms of any rights offering or for any other reason, the Depositary is not able to make such rights or such net proceeds available to any holder of ADSs, the Depositary may allow the rights to lapse.
| 20 |
ITEM 4. Information on the Company
In this Item 4, we present information first with respect to Buenaventura, followed by information with respect to Yanacocha, in which we have a 43.65% partnership interest.
BUENAVENTURA
| A. | History and Development |
Overview
We are Peru’s largest publicly traded precious metals company and are engaged in the exploration, mining and processing of gold, silver and, to a lesser extent, other metals in Peru. We currently operate the Orcopampa, Uchucchacua, Julcani and Mallay mines and have controlling interests in three other mining companies which operate the Colquijirca-Marcapunta, Tantahuatay and La Zanja mines. We also own an electric power transmission company, a hydroelectric plant, a processing plant and an engineering services consulting company and non-controlling interests in several other mining companies, including a significant ownership interest in Yanacocha, a Peruvian partnership that operates the largest gold mine in South America, and Cerro Verde, a Peruvian company that operates a copper mine located in the south of Peru. For the year ended December 31, 2016, our consolidated net sales were US$1,069 million and our consolidated net loss was US$328 million.
Discontinued operations. In 2014, we publicly announced our decision to sell four of our mining units: Poracota, Recuperada, Antapite and Shila-Paula. As a consequence, these mining units were presented in the Financial Statements as mining units held for sale. According to IFRS 5 “Non-current Assets Held for Sale and Discontinued Operations,” the related assets and liabilities are presented in the consolidated statement of financial position at the lower of cost and fair value less cost to sale. During 2016, we decided to change the classification of three mining units (Poracota, Recuperada and Shila-Paula) from mining units held for sale and begin finalizing the mine closures. In December 2016, we sold the Antapite mining unit. In 2016, we started the final closing process of the Breapampa mining unit. As a result, income, costs and expenses related to this mining unit were classified as discontinued operations for the years 2016, 2015 and 2014. On January 2017, the Breapampa mining unit was sold. See Note 1(e) and Note 2.4(w) to the Financial Statements.
The table below summarizes the total production and our equity share of production for the Julcani, Orcopampa, Uchucchacua, Mallay, Colquijirca, La Zanja, Tantahuatay, Yanacocha and Cerro Verde mines for the year ended December 31, 2016:
| Total Production | Buenaventura’s Equity Share of Production | |||||||||||||||||||||||||||||||||||||||||||
| UNIT |
Buenaventura’s
Equity Ownership |
Silver
(oz.) |
Gold
(oz.) |
Lead
(t) |
Zinc
(t) |
Copper
(t) |
Silver
(oz.) |
Gold
(oz.) |
Lead
(t) |
Zinc
(t) |
Copper
(t) |
|||||||||||||||||||||||||||||||||
| Orcopampa | 100 | % | 692,318 | 191,102 | - | - | - | 692,318 | 191,102 | - | - | - | ||||||||||||||||||||||||||||||||
| Uchucchacua | 100 | % | 16,212,746 | - | 10,724 | 7,227 | - | 16,212,746 | - | 10,724 | 7,227 | - | ||||||||||||||||||||||||||||||||
| Julcani | 100 | % | 3,264,420 | 246 | 2,883 | - | 291 | 3,264,420 | 246 | 2,883 | - | 291 | ||||||||||||||||||||||||||||||||
| Mallay | 100 | % | 1,627,246 | 1,784 | 7,383 | 10,463 | - | 1,627,246 | 1,784 | 7,383 | 10,463 | - | ||||||||||||||||||||||||||||||||
| El Brocal | 61.32 | % | 2,634,739 | 23,511 | 12,860 | 57,385 | 49,170 | 1,536,807 | 13,817 | 7,541 | 33,775 | 28,904 | ||||||||||||||||||||||||||||||||
| La Zanja | 53.06 | % | 217,292 | 139,724 | - | - | - | 115,295 | 74,137 | - | - | - | ||||||||||||||||||||||||||||||||
| Tantahuatay | 40.10 | % | 711,337 | 150,816 | - | - | - | 285,211 | 60,470 | - | - | - | ||||||||||||||||||||||||||||||||
| Yanacocha | 43.65 | % | 457,246 | 654,934 | - | - | - | 199,588 | 285,879 | - | - | - | ||||||||||||||||||||||||||||||||
| Cerro Verde | 19.58 | % | 3,773,955 | - | - | - | 502,495 | 738,940 | - | - | - | 98,388 | ||||||||||||||||||||||||||||||||
| Total Production | 100 | % | 29,591,299 | 1,162,117 | 33,850 | 75,075 | 551,955 | 24,672,571 | 627,434 | 28,531 | 51,465 | 127,584 | ||||||||||||||||||||||||||||||||
Compañía de Minas Buenaventura S.A.A., a sociedad anónima abierta (open stock company) under the laws of Peru, was originally established in 1953 as a sociedad anónima (stock company) under the laws of Peru, and currently operates under the laws of Peru. Our registered office is located at Las Begonias 415 – Floor 19, Lima 27, Peru, telephone no. 511-419-2500. Our website may be found at http://www.buenaventura.com. The information on our website is not a part of, and is not incorporated into, this document.
| 21 |
History
During the first several decades of our operations, we focused on the exploration and development of silver mines in Peru, including our Julcani, Orcopampa and Uchucchacua mines. Beginning in the early 1980s, we began to explore for gold and other metals in Peru to diversify our business and reduce our dependence on silver. We expanded our mineral reserves through property acquisition and intensive exploration programs designed to increase reserves and production of gold. We also conducted exploration leading to the discovery of gold mineralization and subsequent production of gold at our Orcopampa, La Zanja, Breapampa and Tambomayo mines. In addition, we made significant equity investments in Yanacocha, which operates an open-pit gold mine in Peru, Cerro Verde, which operates an open-pit copper mine in Peru, and Coimolache, which owns the Tantahuatay gold mine that we operate. As a result of these initiatives, the majority of our revenues are now derived from the production of gold.
Business Strategy
Our strategy is to sustain our position as Peru’s largest, publicly-traded gold and silver mining company by expanding our reserves and production. We are currently engaged in an active exploration and mine development program and participate in several mining exploration projects with Newmont Mining, Southern Copper Corporation, Corporación Aceros Arequipa S.A. and Compañía de Minas Caudalosa S.A.C. In addition, we seek to increase the efficiency and capacity of our mining operations. We are aware of our social and environmental responsibilities and aim to excel in the prevention, mitigation and rehabilitation of mining-related disturbances.
Maintaining an Active Exploration Program
During 2016, we spent US$26.6 million on “exploration in non-operating areas” and US$96.1 million on “exploration in units in operations.” Our “exploration in non-operating areas” investments mainly focused on the following exploration projects: Tambomayo, Alejandra, Marcapunta, Pisacalla and Trapiche. Our “exploration in units in operations” investments were mainly focused in the Uchucchacua, Orcopampa and Julcani mining units.
In 2017, we intend to invest approximately US$100 to US$120 million in exploration in units in operations (mainly Tambomayo, Orcopampa and Uchucchacua) and US$20 to US$30 million mainly in the following explorations in non-operating areas: Trapiche, San Gabriel and Daniela, among others.
Participation in Mining Exploration Agreements
In addition to managing and operating precious metals mines, we participate in mining exploration agreements with mining partners to reduce risks, gain exposure to new technologies and diversify revenues to include other base metals, such as copper and zinc. See “B. Business Overview—Exploration.” We believe that maintaining our focus on mining operations complements our partnership strategy because the engineering and geological expertise gained from such operations enhances our ability to participate in and contribute to those projects.
Capital Expenditures
Our capital expenditures during the past three years have related principally to the acquisition of new mining properties, construction of new facilities and renewal of plant and equipment. Capital expenditures relating to exploration are not included in the table below and are discussed separately in “B. Business Overview— Exploration.” Set forth below is information concerning capital expenditures incurred by us in respect of each of our principal operating mines (not including capital expenditures for administrative purposes or other non-mining or non-energy subsidiaries) and by category of expenditure:
| Year Ended December 31, | ||||||||||||
| 2014 | 2015 | 2016 | ||||||||||
| (US$ in thousands) | ||||||||||||
| Julcani | 691 | 1,323 | 759 | |||||||||
| Uchucchacua | 12,668 | 20,245 | 28,899 | |||||||||
| Orcopampa | 8,963 | 8,198 | 3,451 | |||||||||
| Colquijirca and Marcapunta | 41,045 | 37,571 | 51,289 | |||||||||
| Conenhua | 670 | 5,003 | 3,779 | |||||||||
| Mallay | 963 | 2,259 | 2,729 | |||||||||
| 22 |
| Year Ended December 31, | ||||||||||||
| 2014 | 2015 | 2016 | ||||||||||
| (US$ in thousands) | ||||||||||||
| Breapampa | 2,394 | - | - | |||||||||
| La Zanja | 29,113 | 27,741 | 14,995 | |||||||||
| Tambomayo | 55,248 | 77,093 | 230,223 | |||||||||
| San Gabriel | 21,035 | 22,657 | 23,476 | |||||||||
| Huanza | 16,373 | 1,156 | 457 | |||||||||
| Río Seco | 10,064 | 2,140 | 3,719 | |||||||||
| Molle Verde | 15,641 | 4,049 | 1,861 | |||||||||
| Others | 12,696 | 1,851 | 1,197 | |||||||||
| Total | 227,564 | 211,286 | 366,834 | |||||||||
| Year Ended December 31, | ||||||||||||
| 2014 | 2015 | 2016 | ||||||||||
| (US$ in thousands) | ||||||||||||
| Fixed assets | 69,318 | 49,398 | 55,423 | |||||||||
| Work in progress | 54,517 | 81,333 | 210,915 | |||||||||
| Development costs | 102,666 | 80,555 | 100,496 | |||||||||
| Total | 227,564 | 211,286 | 366,834 | |||||||||
______________
We partially funded the El Brocal Expansion and the construction of the Huanza hydroelectric power plant with leasing facilities. See “Item 5. Operating and Financial Review and Prospects—Buenaventura—B. Liquidity and Capital Resources—Long-Term Debt.”
We have budgeted approximately US$145 to US$175 million for capital expenditures for 2017. We continuously evaluate opportunities to expand our business within Peru, as well as in other countries as opportunities arise, and expect to continue to do so in the future. We may in the future decide to acquire part or all of the equity of, or undertake other transactions with, other companies involved in the same business as us or in other related businesses. However, there can be no assurance that we will decide to pursue any such new activity or transaction.
| B. | Business Overview |
We mainly produce refined gold and silver, either as concentrates or doré bars, and other metals such as lead, zinc and copper as concentrates that we distribute and sell locally and internationally. The following table sets forth the production of the Orcopampa, Uchucchacua, Julcani, Mallay, La Zanja and Colquijirca-Marcapunta mines by type of product for the last three years, calculated in each case on the basis of 100% of the applicable mine’s production. Production from Cerro Verde, Yanacocha and Tantahuatay are not included in these production figures.
|
Year Ended December 31, (1)(2) |
||||||||||||
| 2014 | 2015 | 2016 | ||||||||||
| Gold (oz.) | 438,426 | 356,367 | 357,570 | |||||||||
| Silver (oz.) | 19,728,191 | 24,648,761 | 23,035,110 | |||||||||
| Zinc (t) | 26,706 | 68,184 | 75,075 | |||||||||
| Lead (t) | 22,185 | 37,072 | 33,850 | |||||||||
| Copper (t) | 43,557 | 32,400 | 49,460 | |||||||||
_______________________
| (1) | The amounts in this table reflect the total production of all of our consolidated subsidiaries, including El Brocal and La Zanja. |
| (2) | Amounts for 2015 and 2016 exclude production from the operating mines that are classified as discontinued operations. |
Exploration
We view exploration as our primary means of generating value for our shareholders and we maintain a portfolio of active exploration projects at various stages of exploration for mineral resources in Peru. During 2016, we spent US$26.6 million on “exploration in non-operating areas” mainly focused in the Tambomayo, Alejandra, Marcapunta, Pisacalla and Trapiche exploration projects, and US$96.1 million on “exploration in units in operations” mainly focused in the Orcopampa, Uchucchacua and Julcani mining units. During 2017, we expect to invest approximately US$120 to US$150 million in these exploration activities.
| 23 |
Our exploration department develops programs and budgets for individual projects each year and we allocate, subject to board approval, the proper amount to fund each particular exploration program. Because of the nature of mining exploration and to maintain flexibility to take advantage of opportunities, we allocate budgeted amounts by property or project only in the case of high probability of success. We also allocate non-budgeted amounts over the course of the year to new projects that our technical team considers highly prospective.
We have active joint venture exploration agreements with other mining companies, including Newmont Peru S.R.L., Southern Copper Corporation, Corporación Aceros Arequipa S.A. and Compañía de Minas Caudalosa S.A.C. In this way we have access to financing for exploration of our own mining properties as well as third-party properties without the costs and risks of outright acquisition, increased exposure to new exploration technologies and expansion of knowledge and sharing of experiences of management, geologists and engineers. In these mining exploration agreements, we may be the operator, an equity participant, the manager or a combination of these and other functions.
The following table lists our principal exploration projects in non-operating areas, our effective participation in each project, our partners with respect to each project, the total number of hectares in each project, observed mineralization of each project and the exploration expenditures for each project during 2015 and 2016.
|
Exploration
|
Buenaventura’s
Effective Participation |
Principal
Partners |
Property
Hectares |
Observed
Mineralization |
Total Exploration
Expenditures During |
||||||||||||||
| at March 31, 2017 | 2015 | 2016 | |||||||||||||||||
| (US$ in millions) | |||||||||||||||||||
| Tambomayo | 100 | % | 37,502 | Gold, Silver, Lead and Zinc | 11.19 | 7.52 | |||||||||||||
| San Gabriel | 100 | % | 56,900 | Gold, Silver and Copper | 1.33 | 7.40 | |||||||||||||
| Palla Palla | 100 | % | 8,216 | Gold and Silver | 0.42 | 0.85 | |||||||||||||
| Daniela | 100 | % | 20,600 | Copper and Gold | - | 0.51 | |||||||||||||
| Ccelloccasa | 100 | % | 9,826 | Gold and Silver | 0.19 | 0.24 | |||||||||||||
| Trapiche | 100 | % | 36,798 | Copper and Molybdenum | 0.64 | 0.62 | |||||||||||||
| San Gregorio | 61.32 | % | 4,382 | Zinc | 0.03 | 0.03 | |||||||||||||
| Brownfield exploration | 2.24 | 4.62 | |||||||||||||||||
| Other minor projects | 16.04 | 4.80 | |||||||||||||||||
| Total exploration in non-operating areas | 30.61 | 26.59 | |||||||||||||||||
________________
| (1) | In addition to these projects, we continue to conduct exploration at all of our operating mines and our subsidiaries. |
| (2) | Only includes explorations conducted by Buenaventura. |
The following table lists the mines in which we directed our principal explorations efforts, mineralization of each mine and the exploration expenditures for 2015 and 2016.
|
Operating
Units |
Observed
Mineralization |
Total Exploration
Expenditures During 2015 |
Total Exploration
Expenditures During 2016 |
|||||||||||||||
| Total | Buenaventura | Total | Buenaventura | |||||||||||||||
| (US$ in millions) | (US$ in millions) | |||||||||||||||||
| Buenaventura’s Units: | ||||||||||||||||||
| Orcopampa | Silver and Gold | 41.71 | 41.71 | 31.41 | 31.41 | |||||||||||||
| Uchucchacua | Silver, Lead and Zinc | 27.78 | 27.78 | 45.11 | 45.11 | |||||||||||||
| Julcani | Silver | 12.70 | 12.70 | 11.07 | 11.07 | |||||||||||||
| Mallay | Zinc, Lead and Silver | 7.54 | 7.54 | 7.96 | 7.96 | |||||||||||||
| Breapampa | Gold | 1.82 | 1.82 | - | - | |||||||||||||
| La Zanja | Gold | 0.04 | 0.04 | 0.60 | 0.60 | |||||||||||||
| Marcapunta | Copper and Gold | 0.00 | 0.00 | - | - | |||||||||||||
| 24 |
The following is a brief summary of current exploration activities conducted by Buenaventura directly and through joint exploration agreements, which we believe represent the best prospects for discovering new reserves. There can be no assurance, however, that any of our current exploration projects will result in viable mineral production or that any of the mineralization identified to date will ultimately result in an increase in our ore reserves. Set forth below is a map of our principal exploration projects in Peru as of December 31, 2016.
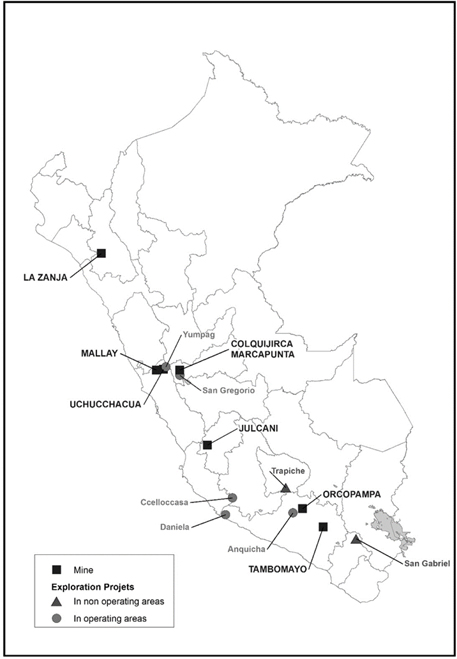
| 25 |
Exploration Projects in Non-Operating Areas
Trapiche. The Trapiche project consists of 36,798 hectares, with porphyry copper and skarn mineralization in the Apurimac region, Antabamba province and Juan Espinoza Medrano district. The Apurimac region is part of a mineralized belt known as the Abancay Batholith where several iron, copper and gold deposits have been identified. During 2017, we will focus on reaching an agreement with the Mollebamba community in order to improve the economic benefits to the community, which we anticipate will allow us to restart field activities and complete a prefeasibility study of this project.
San Gabriel . San Gabriel is located in the region of Moquegua and is wholly-owned by Buenaventura. This deposit is an intermediate sulfidation deposit hosted by diatreme breccia body at the sediment-intrusive contact. In 2017, we plan to invest US$0.47 million to conduct a follow-up survey on stream sediment anomalies outlined during the second half of 2016.
Daniela. The Daniela project is located in the Arequipa region within the highly prospective coastal Iron Oxide Copper Gold deposit/Porphyry belt of southern Peru, consisting of 18,400 hectares of mining concessions, of which we own 11,700 hectares and lease 6,700 hectares from Union Mines S.A.C. In 2017, we plan to invest US$1.39 million to conduct a drilling campaign of 2,500 meters.
Ccelloccasa . The Ccelloccasa project is an epithermal vein deposit located in the Ayacucho region and consists of 8,717 hectares of mining concessions wholly-owned by Buenaventura. During 2017, we plan to complete a geophysical survey and obtain the necessary environmental and social permits in order to conduct a drilling campaign in 2018.
Palla Palla. Palla Palla is located in the Ayacucho region. The property consists in 6,894 hectares of mining concessions owned by Cia. de Minas Caudalosa S.A., which has leased those hectares to Minera Azola S.A.C., our wholly-owned subsidiary. In 2016, we invested US$0.85 million to conduct 1,441 meters of diamond drilling. The results were not encouraging and we discontinued the project.
San Gregorio. San Gregorio is located in the Cerro Pasco region. During 2016, we invested in outreach efforts to engage with the Vicco community in order to regain the community’s confidence and cooperation, with the aim of re-activating the drilling program in 2017.
Exploration in Operating Areas
Uchucchacua . We are currently focusing our exploration efforts on the Yumpag project, which is located four kilometers northeast of the Uchucchacua mine. The project is an epithermal silver deposit, structurally influenced by the Cachipampa fault. This fault also influences significant areas of silver mineralization at the Uchucchacua mine. During 2016, we invested US$2.32 million and completed 8,885 meters of diamond drilling and conducted metallurgical tests with encouraging results. In 2017, we expect to invest US$3.41 million in order to conduct 10,000 meters of diamond drilling at this project.
Orcopampa . In 2016, we focused our exploration efforts on the Anquicha project, which is an epithermal deposit with gold mineralization in sandstone-hosted oxidized fractures and breccias. We completed geological mapping, sampling and column leach tests with encouraging results. However, the project will be kept on hold until an agreement is reached with the local community. We also explored the Apuñe project, located 3 kilometers along the south western trend of the of precious metals veins of the Chipmo mine. In Apuñe, we identified and sampled a linear trend of float blocks of quartz veins and hydrothermal breccias extending over approximately 2 kilometers with encouraging results. A geophysical survey shows a big structure to which the float blocks of quartz could be related. In 2017, we plan to invest US$1.03 million in brownfields exploration in Orcopampa.
Tambomayo . During 2016, we invested US$1.19 million to conduct geological mapping and sampling with encouraging results at the Gaby and Mayra projects. In 2017, we plan to conduct 2,600 meters of diamond drilling at the Asuncion project. In addition, we will continue the geological mapping and sampling at the Gaby Norte project. Finally, in Mayra, we expect to obtain the environmental permits necessary to conduct a drilling campaign in 2018.
| 26 |
Competition
We believe that competition in the metals market is based primarily upon cost. We also compete with other mining companies and private individuals for the acquisition of mining concessions and leases in Peru and for the recruitment and retention of qualified employees.
Sales of Metal Concentrates
All of our metal production is sold to smelters and traders, either in concentrate or metal form, such as gold-silver concentrate, silver-lead concentrate, zinc concentrate, lead-gold-copper concentrate, gold-copper concentrate and gold and silver bullion. Our concentrates sales are made under one- to three-year, U.S. Dollar-denominated contracts, pursuant to which the selling price is based on world metal prices as follows: generally, in the case of gold and silver-based concentrates, the London Spot settlement prices for gold, less certain allowances, and the London Spot or the U.S. Commodities Exchange settlement price for silver, less certain allowances; and, in the case of base-metal concentrates, such as zinc, lead and copper, the London Metals Exchange (“LME”) settlement prices for the specific metal, less certain allowances. Sales prices vary according to formulas that take into account agreed contractual average prices for a quotational period, generally being the month of, the month before, or the month following the scheduled month of shipment or delivery according to the terms of the contracts.
The historical average annual prices for gold and silver per ounce and our average annual gold and silver prices per ounce for each of the last two years and through March 31, 2017 are set forth below:
| Gold | Silver | |||||||||||||||
|
Average Annual
Market Price |
Our Average
|
Average Annual
Market Price |
Our Average
|
|||||||||||||
| US$/oz. (2) | US$/oz. | US$/oz. (3) | US$/oz. | |||||||||||||
| 2015 | 1,218.45 | 1,151.44 | 16.71 | 15.06 | ||||||||||||
| 2016 | 1,250.74 | 1,244.02 | 17.14 | 17.65 | ||||||||||||
| 2017 (through March 31, 2017) | 1,219.50 | 1,230.72 | 17.42 | 16.65 | ||||||||||||
__________________
| (1) | Our average annual price includes only the consolidated average annual price from our mines. |
| (2) | Average annual gold prices are based on the London PM fix as provided by Metals Week. |
| (3) | Average annual silver prices are based on London Spot prices. |
Most of the sales contracts we enter into with our customers state a specific amount of metal or concentrate the customer will purchase. We have sales commitments from various parties for nearly all of our estimated 2017 production; however, concentrates not sold under any of our contracts may be sold on a spot sale basis to merchants and consumers.
Sales and Markets
The following table sets forth our total revenues from the sale of gold, silver, lead, zinc and copper in the past two fiscal years:
|
Year ended December 31, (1) |
||||||||
| Product | 2015 | 2016 | ||||||
| (US$ in thousands) | ||||||||
| Gold | 419,541 | 440,603 | ||||||
| Silver | 313,418 | 385,989 | ||||||
| Lead | 55,445 | 58,690 | ||||||
| Zinc | 102,110 | 142,425 | ||||||
| Copper | 131,356 | 224,649 | ||||||
_________________
| (1) | Does not include refinery charges and penalties incurred in 2016 of US$244.4 million and in 2015 of US$196.2 million. |
Approximately 62.86% and 60.48% of our concentrate and gold bullion sales in 2015 and 2016 (without considering adjustments to prior periods, embedded derivatives from sale of concentrate or hedge operations), were sold outside Peru. Set forth below is a table that shows the percentage of sales of concentrate and gold bullion from our mines and gold bullion that was sold to our various customers from 2015 to 2016.
| 27 |
| Percent of Concentrates and Gold Bullion Sales | ||||||||
| 2015 | 2016 | |||||||
| Export Sales: | ||||||||
| Asahi Refining Canada Ltd and Asahi Refining USA Inc. | 50.58 | 38.53 | ||||||
| Lois Dreyfus Commodities Metal Suisse SA | 2.06 | 3.43 | ||||||
| Mercuria Energy Trading SA | 1.43 | 3.40 | ||||||
| Metalor Technologies | - | 2.76 | ||||||
| N.V. Umicore SA | 3.75 | 2.38 | ||||||
| MRI Trading AG | 0.99 | 1.46 | ||||||
| Werco Trade AG | 2.07 | - | ||||||
| Others | 1.98 | 8.52 | ||||||
| Total Export Sales | 62.86 | % | 60.48 | % | ||||
| Domestic Sales: | ||||||||
| Andina Trade S.A.C | 0.36 | 0.67 | ||||||
| Glencore Peru S.A.C | 23.43 | 20.74 | ||||||
| Trafigura Peru S.A.C | 6.73 | 7.58 | ||||||
| Sudamericana Trading SRL | 2.85 | 2.14 | ||||||
| Lois Dreyfus Commodities Peru S.R.L | 2.45 | 3.23 | ||||||
| Optamine S.A.C | 0.17 | - | ||||||
| Others | 1.15 | 5.16 | ||||||
| Total Domestic Sales | 37.14 | % | 39.52 | % | ||||
| Total Sales | 100 | % | 100 | % | ||||
The following table shows our committed sales volumes of silver-lead, gold-silver and zinc concentrates from 2017 to 2019:
| Wet tons | Wet tons | Wet tons | ||||||||||
| Concentrate | 2017 | 2018 | 2019 | |||||||||
| Uchucchacua’s Silver-Lead | 80,000 | 33,000 | 0 | |||||||||
| Uchucchacua’s Zinc | 24,500 | 24,500 | 6,400 | |||||||||
| Julcani’s Silver-Lead | 6,400 | 5,600 | 0 | |||||||||
| Mallay’s Silver-Lead | 17,800 | 0 | 0 | |||||||||
| Mallay’s Zinc | 21,600 | 5,000 | 0 | |||||||||
| Tambomayo’s Silver-Lead | 6,000 | 3,000 | 0 | |||||||||
| Tambomayo’s Zinc | 6,000 | 3,000 | 0 | |||||||||
| El Brocal’s Copper | 225,000 | 232,000 | 179,000 | |||||||||
| El Brocal’s Lead-Silver | 51,000 | 63,000 | 30,000 | |||||||||
| El Brocal’s Zinc | 152,000 | 167,000 | 55,000 | |||||||||
________________
Note: The price of the concentrate supplied under the contract is based on specified market quotations minus deductions.
We also sell refined gold, which is derived from our operations at Orcopampa, Coimoloache and La Zanja to Asahi Refining, or “Asahi,” which further refines the gold. During 2016, the price of gold supplied was determined based on, for the gold content, the quotation for gold at the London Gold Market PM fixing in U.S. Dollars, and for the silver content, the quotation for silver at the London Silver Market spot fixing in U.S. Dollars or at spot prices, minus, in each case, certain minimum charges, as well as charges for customs clearance and treatment of the gold (which varies depending on its gold and silver content). We may elect to have our material toll refined at Asahi’s works and returned to our account for sale to third parties. Pursuant to our agreement, we are responsible for delivering the gold to Asahi’s designated flight at the Lima airport.
| 28 |
Hedging/Normal Sales Contracts
We and our wholly-owned subsidiaries are completely unhedged as to the prices at which our gold and silver will be sold. See “Item 3. Key Information—D. Risk Factors—Factors Relating to the Company—Our financial performance is highly dependent on the prices of gold, silver, copper and other metals.”
El Brocal uses derivative instruments to manage its exposure to changes in the price of metals. Such derivative financial instruments are initially recognized at fair value on the date on which a derivative contract is entered into and are subsequently re-measured at fair value. Derivatives are carried as financial assets when the fair value is positive and as financial liabilities when the fair value is negative.
El Brocal’s hedge is classified as a cash flow hedge. The effective portion of gain or loss on the hedging instrument is initially recognized in the consolidated statements of changes in equity, under the caption other equity reserves, while the ineffective portion is recognized immediately in the consolidated statements of profit or loss in the finance costs caption. Yanacocha and Cerro Verde have not engaged in, and are currently not engaged in, gold or copper price hedging activities, such as forward sales or option contracts, to minimize their respective exposures to fluctuations in the price of gold and copper.
From January to December 2017, El Brocal had outstanding hedging commitments amounting to 16,107 metric tons of copper at an average fixed price of US$5,395 per ton.
Regulatory Framework
Mining and Processing Concessions
In Peru, as in many other countries, surface land is owned by private landowners, while the government retains ownership of all subsurface land and mineral resources. Our right to explore, exploit, extract, process and/or produce silver, gold and other metals is granted by the Peruvian government in the form of mining and processing concessions. The rights and obligations of holders of mining and/or concessions, provisional permits and processing concessions and other similar matters are currently set forth in the General Mining Law (Single Unified Text approved by Supreme Decree 014-92-EM), which is administered by the MEM.
Pursuant to the General Mining Law, filers of mining claims must obtain a mining concession before they may start any mining activity. Applications for mining concessions must be filed with the regional mining directors of each regional government where the mining concession is located and with Instituto Geológico Minero y Metalúrgico the Geological, Mining and Metallurgical Institute of Peru.
Mining concessions are irrevocable, provided the holder of a mining concession complies with the obligations set forth in the General Mining Law. Such concessions have an indefinite term, subject to payment of an annual concession fee per hectare claimed and achievement of minimum annual production for each hectare. Failure to achieve annual production targets will result in a fine. Failure to pay concession fees or fines for two consecutive years could result in the loss of one or more of the mining concessions. Failure to satisfy minimum annual production thresholds for a specified period of time (currently thirty years beginning the year after the mining concessions were granted for mining concessions granted after October 10, 2008, and thirty years beginning on January 1, 2019 for mining concessions granted before October 10, 2008) could result in cancellation of the mining concessions.
Our and Yanacocha’s processing concessions enjoy the same duration and tenure as our mining concessions, subject to payment of a fee based on nominal capacity of the applicable processing plant. Failure to pay processing fees or fines for two consecutive years could result in the loss of the processing concessions.
Our mining rights and processing concessions are in full force and effect under applicable Peruvian laws. We believe that we are in compliance with all material terms and requirements applicable to the mining rights and processing concessions and that we are not subject to any condition, occurrence or event that would cause the revocation, cancellation, lapse, expiration or termination thereof, except that we may, from time to time, allow to lapse, revoke, cancel or terminate mining rights and processing concessions that are not material to the conduct of our business.
| 29 |
In addition to obtaining mining rights from the Peruvian government, applicable Peruvian regulations require us to obtain easements or other rights from private landowners that own the surface land above the mineral resources that we intend to explore or mine. Supreme Decree 020-2008-EM requires us to obtain such easements or other rights before commencing exploration activities. We have been actively seeking to acquire land surface rights, easements for land containing prospective geological exploration target sites, deposits that can be exploited in the future and areas suitable for plants or facility sites. Regarding processing concessions, Article 35 of Supreme Decree Nº 018-92-EM, as amended (“Article 35”), requires holders of such concessions to own the land underlying the concession or to have the authorization of the owner of the land, deposits that can be exploited in the future and areas suitable as plant or facility sites. In the case of processing concessions, Article 35 requires holders of such concessions to own the land underlying the concession or to have the authorization of the owner of the land.
The possibility of developing mining activities in an urban area or urban expansion area is directly linked to the compatibility of such areas and the mining activity. The Law Regulating Mining Concessions in Urban Areas and Urban Expansion Areas and related regulations set forth procedures for the granting of mining rights in urban and urban expansion areas. To grant a mining concession in an urban area and an urban expansion area, the MEM is required to receive the approval of the council of the applicable provincial municipality. The council has sixty days to issue its decision. Mining concessions in urban expansion areas are granted for 10-year terms, which may be renewed by the MEM subject to the approval of municipal authorities, but cannot exceed 100 hectares.
Law No. 28964, which became effective on January 25, 2007, created the Organismo Supervisor de la Inversión en Energía y Minería (“OSINERGMIN”) as the government agency in charge of regulating and auditing the electricity, hydrocarbon and mining activities of companies. Law No. 28964 provides that the overview and audit of activities related to the environment, mining safety and health regulations may be performed by companies duly certified and approved by OSINERGMIN. However, pursuant to Supreme Decree 001-2010-MINAM, OSINERGMIN has transferred its environmental supervisory functions to the Environmental Evaluation and Oversight Agency (“OEFA”). Beginning July 22, 2010, OEFA assumed the authority to carry out unexpected audits and levy fines on companies if they fail to comply with enforceable environmental regulations and approved environmental assessments. According to Supreme Decree No. 128-2013-PCM, mining companies are required to make monetary contributions to OSINERGMIN and, according to Supreme Decree No. 130-2013-PCM, monetary contributions are also required to be made to OEFA.
With respect to employee safety and employer liability, Law No. 28964 has been replaced by Law No. 29783. Such employee safety and employer liability and related matters are now audited by the Ministerio de Trabajo y Promoción del Empleo . Law No. 29783, as amended by Law No. 30222, establishes the minimum rules designed to prevent employee safety risks and allocate liabilities in relation to such risks. The main principle of this law is that the employer assumes the economic, legal and any other type of liability arising from accidents or diseases suffered by the employee while working and guarantees the employee’s health and safety in connection with the employee’s work. This legislation entitles labor inspectors to inspect commercial facilities and, under certain circumstances, suspend operations. By Supreme Decree N° 009-2012—TR, the Ministerio de Trabajo y Promoción del Empleo transferred its security supervisory, audit and sanctioning functions to the National Labor Audit Entity – SUNAFIL. Such law amended the relevant provision of the criminal code, which currently establishes that a person who intentionally breaches the safety and health provisions, and who after being required by the relevant authority, does not adopt the measures contemplated in such provisions, is deemed to jeopardize the life, health or physical integrity of such person’s employees and may be held criminally liable for such behavior.
Environmental Matters
In 2005, Peru enacted the General Environmental Law (Law No. 28611), which establishes the main environmental guidelines and principles applicable in Peru. Pursuant to the General Environmental Law, the Ministry of the Environment issued national environmental regulations, which have gradually replaced prior guidelines governing governmental agencies environmental competencies. OEFA, as the environmental enforcement agency, has the authority to inspect mining operations and fine companies that fail to comply with prescribed environmental regulations and their approved environmental assessments.
Each mining company that began operations before May 1993 was required to file a Preliminary Environmental Assessment (“EVAP”), for each of its mining units to disclose any negative environmental impacts of its operations and, thereafter, to submit a follow-up Programa de Adecuación y Manejo Ambiental (“PAMA”) aimed at implementing measures to solve problems identified in the EVAP. Companies must correct those negative environmental impacts relating to their mining activities within five years, while smelters must take corrective measures within ten years. These companies must allocate funds in an amount corresponding to no less than 1% of their annual sales to redress the problems identified in their EVAPs and contemplated in their PAMAs.
| 30 |
In addition, the MEM has issued regulations that establish maximum permissible levels (“LMP”) of (i) emissions of liquid effluents and (ii) elements and compounds present in gaseous emissions resulting from the mining activities. Generally, mining rights holders and processing plants that were in operation before May 1993 were required to comply with LMP within 10 years. In the meantime, mining operators are required to prepare Environmental Adaptation and Management Programs, or PAMAs, that set forth plans to ensure compliance with more stringent LMP.
In May 2008, MINAM was established by Legislative Decree N° 1013. MINAM’s main functions include formulating and implementing policies and regulations relating to environmental matters and controlling pollution, including regulating air and water quality standards, through supervision and education.
In 2008 and 2010, MINAM enacted new water quality standards and new LMP for liquid effluents. In 2009, all Peruvian mining companies were required to submit updated environmental management plans to the MEM that complied with water quality standards and new LMP for liquid effluents. At the end of 2015, Supreme Decree No. 015-2015 - MINAM (the “2015 Decree”) was published, which modified the water quality standards and established supplementary provisions related to compliance.
Under the 2015 Decree, mining companies must incorporate new water quality standards into affected Environmental Management Plans by (1) where the MEM has already approved such plan, submitting an updated plan or (2) where the MEM is currently evaluating a plan, submitting a modified plan. The Company plans to submit updated and modified plans to the MEM as required by the 2015 Decree.
Regarding soil quality, on March 26, 2013, Supreme Decree No. 002-2014-MINAM became effective. It approves the Environmental Quality Standards ( Estándares de Calidad Ambiental ) (“ECA”) for soils, or “Standards,” which are applicable to any project or activity that may generate an environmental impact. Subsequently, on March 25, 2014, supplementary provisions for the application of the Standards were approved through Supreme Decree No. 002-2014-MINAM. Projects operating at the time those regulations came into force were required to submit the first phase of soil characterization within twelve months of the passage of the decree. Buenaventura and its associated companies submitted this information within the required time.
Since May 1993, new mining and processing activities have been required to file and obtain approval for a Semi-detailed Environmental Assessment ( Estudio de Impacto Ambiental ) (“EIAsd”) before being authorized to commence operations. New mining and plant processing activities are required to comply with the LMP from the initiation of their operations. In 2009, MEM approved the EIAsd for the La Zanja, Mallay, Tantahuatay and Esperanza projects. In 2010, MEM approved the EIAsd for the Angélica Rublo Chico project. In 2011, the MEM approved the EIAsd for our Orcopampa and Breampampa projects. MEM approved the modified EIAsd for the Mallay mine and the second modified EIAsd for the Shila cyanidation circuit in 2012. In 2014, MEM approved the modified EIAsd of Uchucchacua. In 2015, the EIAsd of Tambomayo was approved.
In 2012, Peru enacted Supreme Decree No. 020-2012-EM, which added Chapter XVII to the Mining Proceedings Regulations approved by Supreme Decree No. 018-92-EM. The new provisions require the approval of the General Mining Directorate of the MEM or of the relevant regional government before proceeding to start and re-start exploration, development, preparation and exploitation. The authorizations to start and re-start mining activities may need to be pre-approved by MEM if the mining activities affect indigenous or native people.
| 31 |
Regulations governing mining explorations . In May 2008, the Peruvian government enacted Supreme Decree 020-2008-EM, which governs mining exploration activities and related matters. Under Supreme Decree 020-2008-EM, exploration activities fall into two categories: Category I and Category II. Category I exploration activities are those involving no more than 20 drilling platforms or affecting a surrounding area that measures less than 10 hectares in size, while Category II exploration activities are those involving more than 20 drilling platforms and affecting an area larger than 10 hectares. For Category I exploration activities, an Environmental Impact Declaration ( Declaración de Impacto Ambiental ) (“DIA”) is required. For Category II exploration activities, a Semi-detailed EIA ( Estudio de Impacto Ambiental ) (“EIAsd”) that incorporates technical, environmental and social matters is required. Exploration activities must start within twelve months following the date that a DIA or EIAsd is approved. Both the DIA and the EIAsd must be approved before exploration activities begin. Any commitments assumed by mining companies in a DIA or EIAsd are mandatory and, if they are not fulfilled, OEFA has the authority to fine non-compliant mining companies. The regulation also provides that the holder of mining concessions will perform specified closure and post closure activities during exploration programs. In addition, fines can be imposed if exploration programs begin before the DIA and the EIAsd are approved, and the approval of environmental assessments for exploration activities performed within protected natural areas requires the approval of the competent authority. Exploration in Prehispanic Archeological Sites (referred to in Supreme Decree N° 004-2000-ED) is forbidden unless expressly authorized by the Ministry of Culture.
Also in May 2008, MEM enacted Supreme Decree 028-2008, which regulates the citizen participation process within the framework of environmental permit approval. The DIA and EIAsd provide local communities with an opportunity to actively engage in this process.
The following DIAs and EIAsd were approved in 2016
|
Buenaventura |
||||||
|
Mine/Project |
Type of Study |
Approving Resolution |
Date of Approval |
|||
| Orcopampa | Modification | 041-2016-MEM-DGAAM | 04.02.2016 | |||
|
La Zanja SRL |
||||||
|
Mine/Project |
Type of Study |
Approving Resolution |
Date of Approval |
|||
| La Zanja | 4th Modification | 268-2016-MEM/DGAAM | 09.09.2016 | |||
|
Coimolache |
||||||
|
Mine/Project |
Type of Study |
Approving Resolution |
Date of Approval |
|||
| Tantahuatay | 2nd Modification | 311-2016-MEM/DGAAM | 26.10.2016 | |||
Investment Promotion Regulations. Supreme Decree 054-2013-PCM was passed to promote investment projects. It allows companies to submit a supporting technical report, ITS (Informe Técnico Sustentatorio), to modify ancillary components, capacity expansions, or introduce technological improvements. SENACE (EISd) and MEM (EID and EISsd) will then issue a compliance waiver within no more than 15 working days from the date of submission.
Regulations governing mine closures . In 2003, Law No. 28090, Ley que Regula el Cierre de Minas (Law that Regulates the Closing of Mines), established the obligations and procedures that mining companies must follow to prepare, submit and execute plans for the closing of mines, or “Closure Plans,” and the granting of financial environmental guarantees to secure compliance with Closure Plans. We are required to submit a Closure Plan for new projects to MEM within one year following approval of an EIA or PAMA; and inform MEM semi-annually of any progress on the conditions established in the Closure Plan. We are also required to perform the Closure Plan consistent with the schedule approved by MEM during the life of the project; and set up a financial environmental guarantee that covers the estimated amount of the Closure Plan.
In addition, Supreme Decree No. 020-2008-EM requires mining companies that perform exploration activities to conduct certain closing activities in accordance with the approved environmental assessment, subject to deferral under certain circumstances, and contemplates a Closure Plan to be submitted by the mining company following the terms and conditions of Supreme Decree Nº 033-2005-EM.
Our Closure Plans were approved by MEM for all of our mines and advanced explorations. To date, MEM has approved our Closure Plans for Julcani, Recuperada, Uchucchacua, Orcopampa, Poracota, Antapite, Caravelí, Shila, Paula, Esperanza, Pozo Rico, Mallay, Trapiche, Breapampa, Angélica Rublo Chico, Anamaray-Jancapata, La Zanja, Tantahuatay and Tambomayo.
The following mine closure plan modifications were approved in 2016:
|
Buenaventura |
||||||
| Mine/Project | Type of Study | Approving Resolution | Date of Approval | |||
| Julcani | 4th Modification PdC | 103-2016-MEM-DGAAM | 08.04.2016 | |||
| Mallay | 3rd Modification PdC | 099-2016-MEM-DGAAM | 04.04.2016 | |||
| Tambomayo | PdC | 138-2016-MEM-DGAAM | 04.05.2016 | |||
| Breapampa | Modification PdC | 185-2016-MEM-DGAAM | 10.06.2016 | |||
| Esperanza | Actualization PdC | 217-2016-MEM-DGAAM | 14.07.2016 | |||
| Orcopampa | 5th Modification PdC | 313-2016-MEM-DGAAM | 28.10.2016 | |||
| La Zanja SRL | ||||||
| Mine/Project | Type of Study | Approving Resolution | Date of Approval | |||
| La Zanja | 2nd Modification PdC | 078-2016-MEM-DGAAM | 16.03.2016 | |||
| 32 |
On November 9, 2009 Supreme Decree No. 078-2009-EM became effective, creating additional environmental obligations for mining concessions holders. Under this provision, mining concessions holders that performed mining activities, including mining exploration, production and processing activities or related activities, without having an Environmental Certification are required to prepare and perform an Environmental Remediation Plan to address the environmental impact in the areas in which such activities have been conducted. Environmental Remediation Plans can only be filed once mining activities have ceased. Environmental Remediation Plans contain a detailed description of all the mining facilities and activities performed without the correspondent Environmental Certification, including maps and related information, a detailed description of the environmental impacts created by such activities, a detailed description of the remediation actions, a detailed description of the compensation that is proposed to be made, a budget and schedule of the remediation activities, including their costs, and a bond in favor of Ministerio de Energía y Minas (MINEM) for the cost of the execution of the measures contained in the Environmental Remediation Plan. Once the Environmental Remediation Plan is completed, mining concessions holders are required to inform the auditing entity so it can verify that the actions were carried out as approved. The auditing entity is required to send the respective report to the relevant authority so that the bond may be returned.
Law No. 28271, Law that Regulates the Environmental Liabilities of Mining Activities ( Ley que Regula los Pasivos Ambientales de la Actividad Minera ), came into force on July 7, 2004 and serves to regulate the identification of environmental liabilities and financial responsibility for remediation in mining activities, in each case to mitigate any negative impact mining may have with respect to the health of the population, environment and property. Pursuant to Law No. 28271, as amended by Law No. 28526 and Legislative Decree No. 1042, MEM’s technical branch will identify environmental liabilities, mining companies responsible for abandoned mining facilities, mining works and residue deposits that may be linked to such environmental liabilities and holders of inactive mining concessions with mining liabilities. Holders of inactive mining concessions with environmental mining liabilities will be required to submit a Closure Plan and enter into environmental remediation agreements with MEM to perform any studies and work necessary to control and mitigate the risk and effects of any contamination. Regulations under Law No. 28271, Regulations of Environmental Liabilities of Mining Activities ( Reglamento de Pasivos Ambientales de la Actividad Minera ), were approved by Supreme Decree No. 059-2005-EM.
We have presented Closure Plans to the MEM for all our mining concessions with environmental mining liabilities. To date, the Hualchocopa, Lircay, Bella Unión-Paucaray and Chaquelle mining units have all been closed and post-closure activities at each of these units are currently underway.
On November 12, 2014, a new regulation for the Environmental Protection and Management by-law was enacted, which covers mining production, processing, common labor, transport and storage, which sets forth a new set of requirements for these activities. Going forward, social and technical teams from MEM will accompany the collection of baseline information. Early involvement of the statutory authority throughout the environmental assessments process is expected to bring about shorter approval times.
On December 28, 2015, the Servicio Nacional de Certificación Ambiental (“SENACE”), which operates under the auspices of MINAM, took responsibility for the assessment and approval of detailed EIA submitted by private, public, or mixed-capital organizations. This development is consistent with the expansion of MINAM’s technical and regulatory capacities.
We anticipate additional laws and regulations relating to environmental matters will be enacted over time. The development of more stringent environmental regulations in Peru could impose additional constraints and additional costs on our operations, that would require us to make significant additional capital expenditures in the future. Although we believe that we are substantially in compliance with all applicable environmental regulations of which we are now aware, there is no assurance that future legislation or regulatory developments will not have an adverse effect on our business or results of operations.
| 33 |
In connection to the approval of environmental assessments, the Peruvian government has issued several decrees intended to simplify the issuance of permits, including Supreme Decree No. 054-2013-PCM (effective since June 2, 2013), Supreme Decree No. 060-2013-PCM (effective since May 26, 2013) and Ministerial Resolution No. 092-2014-MEM/DM (effective since May 27, 2014). We believe these provisions should facilitate the approval of environmental assessments for our new exploration projects and simplify the issuance of certificates of non-existence of archeological remains required for mining projects.
Prior Consultation with Local Indigenous Communities
In 2011, Peru enacted Law No. 29785, the Law of Prior Consultation for Indigenous and Native Communities ( Ley del Derecho a la Consulta Previa a los Pueblos Indígenas y Originarios – ILO 169 Convention). This law establishes a prior consultation procedure that the Peruvian government must undertake in concert with local indigenous communities whose collective rights may be directly affected by new legislative or administrative measures. Under this law, the Peruvian governmental agency responsible for issuing or approving the administrative measure or decree in question, rather than the affected local indigenous community, retains the right to approve or reject the relevant legislative or administrative matter following such consultation. However, to the extent that any of our future projects require the promulgation of legislative or administrative measures that impact collective rights of local indigenous communities, the required prior consultation procedure may result in delays, additional expenses or failure to obtain approval for such new project.
Regulations under Law No. 29785 were approved by Supreme Decree No. 001-2012-MC, which became effective on April 2, 2012. These regulations specify the form and circumstances of the required consultation and the manner in which agreements will be formalized, and provide for a consultation process that lasts no more than 120 calendar days.
Permits
We believe that our mines and facilities have all necessary material permits to operate. All future exploration projects will require a variety of permits. Although we believe the permits for these projects can be obtained in a timely fashion, permitting procedures are complex, time-consuming and subject to potential regulatory delay. We cannot predict whether we will be able to renew our existing permits or whether material changes in existing permitting conditions will be imposed. Non-renewal of existing permits or the imposition of additional permitting conditions could have a material adverse effect on our financial condition or results of operations.
Insurance
We maintain a comprehensive insurance program designed to address specific risks associated with our operations, in addition to covering the insured risks common to major mining companies. Our insurance program is provided through the local Peruvian insurance market and includes employers’ liability, comprehensive third-party general liability and comprehensive automobile liability, all risk property on a replacement basis, including transit risks, as well as business interruption insurance and mining equipment insurance.
Mining Royalties and Taxes
Under Peruvian law, holders of mining concessions are required to pay the Peruvian government a mining royalty ( regalia minera ) for the exploitation of metallic and non-metallic resources. In accordance with Law No. 28258, as amended by Law No. 29788, mining royalties are payable either as a specified percentage of operating profit or 1% of revenues, whichever is higher. If the mining royalty is calculated as a percentage of operating profit, marginal rates ranging from 1% to 12% that increase progressively for companies with higher operating margins will apply.
Mining companies that are a party to mining stabilization agreements will not be required to pay a mining royalty during the tenure of their stabilization agreements. Although we are not party to any stabilization agreements, Yanacocha currently has effective stabilization agreements for the Yanacocha, La Quinua and Maqui Maqui mines.
| 34 |
In addition to mining royalties, pursuant to Law No. 29789, effective from October 1, 2011, mining operations in Peru are subject to an extraordinary mining tax. Mining companies that do not have taxation stability agreements with the Peruvian government, such as Buenaventura, will pay the “Special Mining Tax” ( Impuesto Especial a la Minería ). The Special Mining Tax is calculated each quarter as a percentage of operating profit. Marginal rates ranging from 2% to 8.4% that increase progressively for companies with higher operating margins will apply. Mining companies that have stability agreements with the Peruvian government will pay the “Special Mining Duty” ( Gravamen Especial a la Minería ). The Special Mining Duty is calculated as a percentage of operating profit, with marginal rates ranging from 4% to 13.12% that increase progressively for companies with higher operating margins.
Safety
During 2016, we experienced 67 reportable injuries, which comprised of 64 lost-time injuries and three fatal injuries, as compared to 70 total reportable injuries during 2015, which comprised lost-time injuries and three fatal injuries. Under Peruvian legislation, reportable injuries include: accidental injuries resulting in lost-time, fatal accidents, accidents that require medical treatment or result in a loss of consciousness, an inability to perform all job duties on any workday after the injury or the temporary assignment or transfer to another job. Injuries involving first-aid only are not reportable as they are considered minor accidents.
| C. | Organizational Structure |
As of March 31, 2017, we conducted our mining operations, explorations projects and other activities directly and through various majority-owned subsidiaries, controlled companies and other associate companies as described in the following organizational chart:
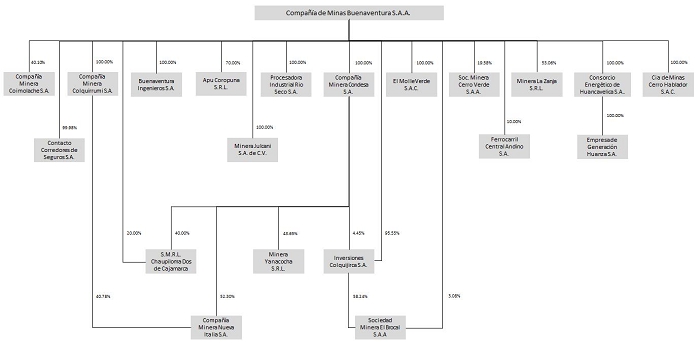
| † | All entities in this chart, with the exception of Minera Julcani S.A. de C.V. (which is organized in Mexico), Compañía de Minas Buenaventura Chile Ltda. (which is organized in Chile) and BISA Argentina S.A. (which is organized in Argentina), are incorporated in Peru. |
| * | Compañía Minera Condesa S.A. holds 21,160,260 common shares of Compañía de Minas Buenaventura S.A.A., or approximately 7.70% of our total common shares. |
| 35 |
Intermediate Holding Companies, Subsidiaries and Equity Participations
Compañía Minera Condesa S.A.
Compañía Minera Condesa S.A., or “Condesa,” our wholly-owned subsidiary, is a mining and facilities holding company with both direct and indirect ownership participation in Yanacocha. As a partner in Yanacocha, Condesa shares responsibility for the investments made in the Yanacocha mine. In addition, Condesa holds an equity interest in Chaupiloma, and, as a result, receives a portion of the royalty revenues paid by Yanacocha to Chaupiloma in an amount equal to its ownership interest. Condesa also holds a 7.70% interest in Buenaventura.
S.M.R.L. Chaupiloma Dos de Cajamarca
S.M.R.L. Chaupiloma Dos de Cajamarca, or “Chaupiloma,” is a Peruvian limited liability company that holds all of the mining rights for the areas mined by Yanacocha. Chaupiloma receives a royalty that is calculated as a percentage of the total revenues of Yanacocha. We own, directly and indirectly, through our interest in Condesa, a 60% interest in Chaupiloma. Newmont Peru owns the remaining 40% equity interest.
Consorcio Energético Huancavelica S.A. / Empresa de Generación Huanza S.A.
Consorcio Energético Huancavelica S.A., or “Conenhua,” is an electrical transmission company that provides a significant portion of our electrical needs through its transmission facilities. We own 100% of Conenhua and manage its operations. Conenhua obtained its concession for power transmission in the Huancavelica area in 1983 and subsequently obtained concessions in the Cajamarca and Arequipa regions, which enabled us to transmit electric power to certain of our mining units and affiliates, as well as to other mining companies and municipalities in the area, through our own facilities.
To secure a reliable energy supply from a clean and renewable source for our direct operations and projects at competitive prices, Conenhua, through its subsidiary Empresa de Generación Huanza S.A., or “Huanza,” was commissioned to construct a 90.6 megawatt (“MW”), capacity hydroelectric power plant in the valley of Santa Eulalia. This hydroelectrical plant began operating at full capacity in June 2014.
Buenaventura Ingenieros S.A.
Buenaventura Ingenieros S.A., or “BISA,” one of our wholly-owned subsidiaries, has provided geological, engineering, design and construction consulting services to the mining sector for over 30 years. During this time, BISA has consulted in Peru, Chile, Argentina, Mexico and Ecuador on a range of projects, operations and expansions.
Contacto Corredores de Seguros S.A.
During 2015, Buenaventura paid US$8.8 million to BISA in order to obtain 99.98% ownership of Contacto Corredores de Seguros S.A., an insurance brokerage company that provides insurance brokerage and related services to us and our affiliates
Minera Julcani S.A. de C.V.
Minera Julcani S.A. de C.V. is one of our wholly-owned subsidiaries and was created for the purpose of conducting mining activities in Mexico. Minera Julcani S.A. de C.V. has had no exploration activities since 2014, when the exploration agreement with Surutato Mining, S.A. de C.V., to conduct exploration activities within its property located in Sinaloa, Mexico, was terminated.
Inversiones Colquijirca S.A. / Sociedad Minera El Brocal S.A.A.
El Brocal owns the Colquijirca and Marcapunta Norte mines and the San Gregorio exploration project. El Brocal was formed in 1956 and is engaged in the extraction, concentration and sale of concentrates of polymetallic minerals, mainly copper, zinc, lead and silver. Currently, we own 61.32% of El Brocal through both direct and indirect ownership interests.
| 36 |
Minera La Zanja S.R.L.
La Zanja is located 35 kilometers northwest of the city of Cajamarca. La Zanja, which is currently 53.06% owned by us, began operations in September 2010 as an open-pit mine producing gold and silver.
Compañía Minera Coimolache S.A.
Coimolache is a mining company that owns the Tantahuatay mine which is located in the province and district of Hualgayoc in the Cajamarca region, which is 35 kilometers northwest of the Yanacocha mine. We hold a 40.10% interest and operate this mine, which commenced operations in mid-2011 as an open-pit mine producing gold and silver.
Ferrovías Central Andino S.A.
We hold 10% of Ferrovías Central Andino S.A. (“Ferrovías”), a railroad company, pursuant to a concession granted to a consortium of several companies in April 2000. Ferrovías provides transportation for concentrates from El Brocal’s mining operations.
Apu Coropuna S.R.L.
Buenaventura currently owns 70% of Apu Coropuna S.R.L., with the other 30% owned by Southern Peru Copper Corporation. Apu Coropuna S.A. was created for the purpose of conducting exploration within properties situated in Castilla, Arequipa.
Compañía de Minas Cerro Hablador S.A.C.
Compañía de Minas Cerro Hablador S.A.C., is our wholly-owned subsidiary created for the purpose of conducting exploration activities pursuant to our agreement with Corporación Aceros Arequipa S.A. Under this agreement, Corporación Aceros Arequipa S.A. granted us the exclusive right to conduct exploration activities within its properties situated in Livitaca, Cusco.
Procesadora Industrial Rio Seco S.A.
Procesadora Industrial Rio Seco S.A. is our wholly-owned subsidiary that owns and operates a monohydrate manganese sulphate crystallization plant situated in Huaral, Lima. This processing plant will allow mining from areas with high silver and manganese content within the Uchucchacua mine, which will improve silver recovery.
El Molle Verde S.A.C.
El Molle Verde S.A.C. is our wholly-owned subsidiary that develops the Trapiche project, located in the Apurimac region. See “—B. Business Overview—Exploration Projects in Non-Operating Areas” above for further information about this project.
| 37 |
YANACOCHA
A. History and Development of the Company
Founded in Peru in 1992, Yanacocha is one of the largest gold producers in South America, having produced 654,934 ounces of gold in 2016. Yanacocha’s operations are located in the Andes Mountains in Northern Peru in the region of Cajamarca, located approximately 600 kilometers north of Lima and north of the city of Cajamarca at an altitude of 4,000 meters above sea level. The Yanacocha property consists of the following open-pit mines: Chaquicocha, Cerro Yanacocha, La Quinua Complex (La Quinua, El Tapado, El Tapado Oeste), Western Oxide pits (La Quinua Sur and Cerro Negro Oeste), Eastern Oxide pits (Quecher Norte) and Carachugo Alto. Mining activities in Maqui Maqui, Marleny and Cerro Negro Este ceased during 2016. Yanacocha also owns the Conga project, which is located approximately 24 kilometers northeast of the Yanacocha operating mine in the provinces of Celendin, Cajamarca and Hualgayoc.
As of December 31, 2016, Yanacocha’s proven and probable reserves (excluding the Conga project, for which reserves were reclassified as resources or non-reserve mineralization (“NRM”) as of December 31, 2015) were estimated to be 4.4 million ounces of gold, representing a 14% decrease over Yanacocha’s proven and probable reserves as of December 31, 2015, which were estimated to be 5.1 million ounces of gold.
Proven and probable reserves are based on extensive drilling, sampling, mine modeling and metallurgical testing from which economic feasibility is determined. Under the Management Contract (as defined below), Newmont Mining, in conjunction with Yanacocha, calculates Yanacocha’s reserves by methods generally applied within the mining industry and in accordance with SEC Industry Guide 7. Reserves represent estimated quantities of proven and probable ore that, under present and anticipated conditions, may be economically mined and processed.
In 2016, Yanacocha produced 654,934 ounces of gold, compared to 917,691 ounces of gold produced in 2015. This decrease in gold production in 2016 as compared to 2015 was mainly attributable to:
| · | Lower production at the Yanacocha Gold Mill, due to lower recovery (75.6% in 2016, compared to 80.2% in 2015), lower throughput (5,868,912 dst in 2016, compared to 6,683,162 dst in 2015) and lower head grade (2.65 grams per ton in 2016, compared to 3.27 grams per ton in 2015); and |
| · | Lower leach pad production as a result of not mining the Tapado Oeste, Maqui Maqui and Chaquicocha pits and decreased mining at Cerro Negro and La Quinua Sur. |
Silver production was 447,376 ounces in 2015 and 457,246 ounces in 2016. This increase in silver production in 2016 as compared to 2015 was mainly due to deep transitional ore processed at the Yanacocha Gold Mill, which had higher silver recovery by more retention time and higher sodium cyanide at the leach circuit.
Newmont Mining owns 51.35% of Yanacocha through its wholly-owned subsidiary Newmont Second. We own 43.65% of Yanacocha through our wholly-owned subsidiary Condesa and the remaining 5% is owned by IFC. Yanacocha is managed by Newmont Peru. See “B. Business Overview—Management of Yanacocha—General Manager/Management Agreement.” Although Yanacocha has no fixed dividend policy, there is an understanding among the partners that the net income not required for sustaining capital expenditures or future development projects should be distributed following approval by the two major shareholders of Yanacocha (Newmont Mining and Buenaventura).
Capital Expenditures
Yanacocha’s capital expenditures from its formation in 1992 through 2016 have related principally to:
| · | the construction of the Carachugo, Chaquicocha, Maqui Maqui, San José, Cerro Yanacocha, La Quinua Complex (La Quinua, El Tapado and Tapado Oeste), Cerro Negro Este, Western Oxide pits (La Quinua Sur and Cerro Negro Oeste), Eastern Oxide pits (Quecher Norte and Marleny) and Carachugo Alto mining operations; |
| 38 |
| · | the construction of two plants at Carachugo and Yanacocha, each of which includes a leach solution processing facility and a smelter; |
| · | the construction of the Yanacocha Gold Mill; |
| · | the construction of four carbon column plants at Cerro Yanacocha and La Quinua; |
| · | the acquisition of both new and used mining equipment; |
| · | the construction of two dams; |
| · | the construction of one agglomeration plant at La Quinua; |
| · | the expansion of storage at La Quinua Tailings; |
| · | the initial construction of a water treatment plant at La Quinua Tailings; |
| · | the construction of gold mill tailing pipeline and equipment components |
| · | the expansion of the tailings facilities for the Yanacocha 6 and 7 stockpiles; and |
| · | several expansions of the leach pads located at the Carachugo, Maqui Maqui, Cerro Yanacocha and La Quinua mining operations. |
Yanacocha’s capital expenditures for the last three years amounted to approximately US$296 million, including capital expenditures of US$117 million in 2014, US$96 million in 2015 and US$83 million in 2016.
In 2016, Yanacocha’s principal capital expenditures included the construction of water treatment facilities, a tailings facility expansion, capitalized component purchases and infrastructure improvements.
Yanacocha anticipates that its capital expenditures for 2017 will be approximately US$49 million, of which it plans to use approximately US$21 million for equipment components, US$11 million for expansion of tailings facilities, US$10 million for laybacks, US$5 million for a water treatment project and US$2 million for other minor projects.
Yanacocha expects that it will meet its working capital, capital expenditure and exploration requirements for the next several years from internally-generated funds, cash on hand and financing from banks and financial institutions, if required. There can be no assurance that sufficient funding will be available to Yanacocha from internal or external sources to finance future working capital, capital expenditures and exploration and construction requirements, or that external funding will be available for such purposes on terms or at prices favorable to Yanacocha. A further decline in the price of gold would be reasonably likely to affect the availability of such sources of liquidity. See “Item 5. Operating and Financial Review and Prospects—Yanacocha—B. Liquidity and Capital Resources” and “—Yanacocha—C. Capital Expenditures.”
| B. | Business Overview |
Description of Yanacocha’s Operations
The Yanacocha property began production in 1993 and consists of the following open-pit mines: the La Quinua Complex, Cerro Yanacocha, the Carachugo Complex and Maqui Maqui. In addition, Yanacocha has four leach pads, three processing facilities and one mill.
Leach pads are located at La Quinua (581 million ton capacity), Cerro Yanacocha (426 million ton capacity), Carachugo (372 million ton capacity) and Maqui Maqui (64 million ton capacity). Each of these leach pads includes at least two leach solution storage ponds and storm water ponds located down gradient from each leach pad. The Cerro Yanacocha site has two additional solution ponds for the segregation of solution generated from the treatment of transition ores. A raw water pond is used both for storm containment and to store excess solution during the wet season.
| 39 |
Yanacocha’s processing facilities (Pampa Larga, Yanacocha Norte and La Quinua) are located adjacent to the solution storage ponds and are used to process gold-bearing solutions from Yanacocha’s leach pads through a network of solution-pumping facilities. The Yanacocha Gold Mill processes high-grade gold ore to produce a gold-bearing solution for treatment at the La Quinua processing plant. The Yanacocha Gold Mill commenced operations in March 2008 and it processes between 5.5 and 6.0 million tons per year.
Yanacocha’s mining activities encompass 260,212 acres (105,304 hectares) that are covered by 182 mining concessions. Yanacocha (51.35% owned by Newmont Peru) holds the mining rights related to 95,719 acres (38,736 hectares), covered by 71 concessions. Chaupiloma holds the mining rights to the remaining acres and concessions and has assigned these mining concessions to Yanacocha. Each concession has an initial term of 17 to 20 years, which are renewable at Yanacocha’s request for additional 17 to 20 year terms. Yanacocha has three processing concessions from the Ministry of Energy and Mines for its processing plants: Cerro Yanacocha (Yanacocha Gold Mill, Cerro Negro, La Quinua and Yanacocha), Yanacocha (Carachugo and Pampa Larga) and China Linda (a limestone processing facility). The processing concessions have indefinite terms, subject to the payment of an annual fee based on nominal capacity for the processing plant.
Mining consists of a sequence of drilling, blasting, loading and hauling. Ore containing gold is transported from each mine to the nearest active leach pad while waste is taken to specially designed storage facilities. Ore is then leached by introducing diluted solutions of cyanide through an irrigation system placed on top of the ore. This solution percolates through the ore, dissolving gold and silver as AuCN and AgCN complexes, and results in a “pregnant” solution that drains to solution storage ponds to be transferred to the nearest recovery facility. The end product is doré bars composed of approximately 65-66% gold and approximately 29% silver. The doré bars are transported from the processing plant by an outside security firm to be refined outside of Peru. See “—Transportation and Refining.” The solution from which the gold is removed (barren solution) is recycled to the leach pads for further heap-leaching after having been reconstituted with cyanide. The leaching process is generally a closed system. However, during periods of high rainfall, excess water must be treated at the facilities located at Yanacocha Norte and Pampa Larga, which have been designed to meet or exceed standards for drinking water and for agriculture and livestock as set out by the Peruvian Ministry of Health, the U.S. Environmental Protection Agency, the State of Nevada Regulations and World Bank guidelines. See “Regulation, Permit and Environmental Matters.”
Since 1997, the energy and power supply for Yanacocha has been obtained from the Peruvian national electricity system through a 220 kilovolt (“kV”) transmission line from the Trujillo-Norte substation in Trujillo to the Cajamarca-Norte substation in Cajamarca. This transmission line is owned by Consorcio Energético Huancavelica–CONENHUA, and has a design capacity of approximately 150MW.
In August 2011, a new 220kV called Interandina line was brought online from Carhuamayo-Paracsha–Conococha-Kiman Ayllu (Huallanca) and connected to the Cajamarca-Norte substation. This line belongs to Abengoa and provides Yanacocha with energy and power, leaving the old transmission line with the energy flow to Trujillo.
Currently, Yanacocha has a contract to supply energy and power with generator Engie Energia Perú S.A, which is valid until December 2020.
Yanacocha is powered from the Cajamarca-Norte substation through a 60 kV transmission line and a 220 kV transmission line, both owned by Conenhua. Alternatively, in case of emergency, reduced supply or other event affecting the national electrical system, Yanacocha has its own power generators with a capacity of approximately 27MW. This system allows the Company to maintain the sustainability of its operation system and reduce its operational risks.
In 2016, Yanacocha’s power consumption was approximately 445 Giga Watt Hours at a cost of US$27.8 million. The maximum demand was 61.1 MW in March 2016. Compared to the consumption in 2015, this was a reduction of 22 Giga Watt Hours, which represents a decrease of US$0.5 million. Approximately 85% of Yanacocha’s energy consumption is required by its processing plants, 13% by its mining facilities and 2% by the Yanacocha Verde plant.
| 40 |
Water for Yanacocha’s operations is collected from rainfall and wells. All excess water used by Yanacocha undergoes treatment at the facilities described above.
Set forth below are certain unaudited operating data for the years shown for each of Yanacocha’s mining operations that were then in operation:
| 2014 | 2015 | 2016 | ||||||||||
| Mining Operations: | ||||||||||||
| Ore mined (DST): | ||||||||||||
| Cerro Yanacocha | 883,573 | 6,379,952 | 15,641,667 | |||||||||
| Carachugo | 7,721,830 | 2,775,440 | 1,448,536 | |||||||||
| Maqui Maqui | 619,755 | 1,490,496 | 44,297 | |||||||||
| La Quinua | 27,414,341 | 17,312,927 | 8,745,953 | |||||||||
| Cerro Negro | 3,644,896 | 12,875,105 | 6,017,662 | |||||||||
| Total ore mined (DST) | 40,281,395 | 40,833,920 | 31,898,114 | |||||||||
| Average gold grade of ore mined (oz./DST): | ||||||||||||
| Cerro Yanacocha | 0.019 | 0.010 | 0.011 | |||||||||
| Carachugo | 0.031 | 0.031 | 0.011 | |||||||||
| Maqui Maqui | 0.025 | 0.066 | 0.074 | |||||||||
| La Quinua | 0.043 | 0.037 | 0.023 | |||||||||
| Cerro Negro | 0.024 | 0.018 | 0.014 | |||||||||
| Total average gold grade of ore mined (oz./DST) | 0.038 | 0.027 | 0.015 | |||||||||
| Gold production (oz.): | ||||||||||||
| Cerro Yanacocha | 30,713 | 54,677 | 176,263 | |||||||||
| Carachugo | 286,062 | 87,146 | 124,886 | |||||||||
| Maqui Maqui | 5,669 | 67,195 | 28,105 | |||||||||
| La Quinua | 595,751 | 596,638 | 188,095 | |||||||||
| Cerro Negro | 51,749 | 112,033 | 137,584 | |||||||||
| Total gold (oz.) | 969,944 | 917,690 | 654,934 | |||||||||
Exploration
Advanced exploration and early-stage development expenditures for the Yanacocha District during 2016 totaled $7.6 million. Expenditures focused on oxide development and advanced exploration projects including reserve conversion drilling at Carachugo and inventory drilling at Cerro Negro, complementary geologic modeling work at Yanacocha Verde, underground drilling at Chaquicocha and developing exploration of Antonio sulfides.
At Carachugo, reserve drilling led to conversion of 0.15 million ounces as of December 31, 2016. At Yanacocha Norte, an initial inventory of oxides-transitional near surface was assessed, yielding an initial 0.10 million ounces. The economic evaluation continues in 2017.
At Chaquicocha, underground results are yielding gold grades higher than expected and some intervals with less tonnage, overall the resource estimated of 2.2 million ounces remains same. Exploration of Antonio sulfides confirmed areas 20 meters to 40 meters thick with grades averaging 7 Au g/t. Resource estimates remain unchanged and more drilling is required to delineate this deposit.
Yanacocha’s exploration expenditures include all costs associated with exploration activities such as drilling, assaying, geological and metallurgical testing, roads and access restoration, etc. Yanacocha prepares a budget for each year and allocates an amount for exploration activities based on specific projects or regions.
The total budget for 2017 is US$12.7 million. It includes expenditures of US$2.4 million for exploration, US$5.9 million to delineate Chaquicocha underground and Antonio sulfides and US$1.2 million for reserves conversion at Carachugo-Quecher connection, among other projects.
| 41 |
As of December 31, 2016, proven and probable gold reserves were calculated using a gold price assumption of US$1,200 per ounce.
Transportation and Refining
The doré bars produced by Yanacocha are transported to refineries outside of Peru and, as a result, Yanacocha has entered into pre-established transportation contracts. Yanacocha has engaged Hermes Transportes Blindados S.A., or “Hermes,” to service its local transportation requirements. Under the terms of Yanacocha’s agreement with Hermes, the risk of loss with respect to the doré bars is assumed in its entirety by Hermes during the transportation of the doré bars from the mines to Jorge Chávez Airport in Lima. Thereafter, the responsibility for the doré bars shifts to the refiner, which has entered into a contract with an outside security firm to provide offshore transportation. The doré bars are melted, weighed and sampled in refineries abroad, which store the doré bars in strong-room vaults and assume responsibility for the doré bars. Yanacocha pays a predetermined fee for the refining service. The final output from refineries, known as London Good Delivery gold and silver, is credited to Yanacocha’s London bullion accounts until transferred to purchasers.
Sales of Gold
Yanacocha’s gold sales are made through a monthly open-bidding process in which Yanacocha auctions its production corresponding to the next four to five weeks. This bidding process is set up by Yanacocha with approximately 10 financial institutions and trading firms before each month. Yanacocha collects bids and confirms sales. The gold is typically sold on the date of departure from Jorge Chávez Airport in Lima. If a portion of gold remains unsold, it is sold on the spot market within a few days. Silver is sold on the spot market approximately once a month to financial institutions or trading firms. The cash from such sales is received into a collection account in London against orders to the London bullion bank for deliveries of the gold and silver to the purchasers.
Delivery is made once a week and payments are collected on the day of confirmation. The payment price for the gold consists of either (i) the market price at the confirmation of the sale, or (ii) the average London PM fixing price over the tendered period plus a small premium established pursuant to the bidding process. Since 1994, Yanacocha has consistently sold to five or six financial institutions and trading firms at each auction. Such buyers are market makers and active participants in precious metal markets.
Employees
As of December 31, 2016, Yanacocha had 1,599 employees. The compensation granted by Yanacocha to its employees includes a base salary and other non-cash benefits such as a health program and life insurance. Additionally, according to the profit sharing plan required by Peruvian labor laws, Yanacocha employees have the right to receive 8% of Yanacocha’s annual profits before taxes. Fifty percent of these profits must be distributed in proportion to the number of days each employee worked during the previous year, and the remaining 50% of such profits must be distributed according to each employee’s total annual salary.
Yanacocha has agreements with independent contractors that are responsible for the security services and staffing for the execution of the Company’s projects in compliance with applicable legal regulations. As of December 31, 2016, independent contractors had hired 3,578 persons who were working in the Company’s operations, including the Conga project.
In 2004, Yanacocha signed its first collective bargaining agreement with a union representing some of its employees, which was created on December 9, 2003. In 2012, a new union was established. During 2016, a direct collective agreement was signed with this union for a three-year period (2016-2019). In the case of the older union, the collective negotiation ended in an arbitral tribunal that issued an arbitral award for a one-year period (2016-2017) based on Yanacocha’s proposal. Because the arbitral award is valid for just one year, during 2017 Yanacocha will start a new negotiation process with one of the existing unions.
| 42 |
The Labor Relations Department meets with union leaders on a monthly basis to address various subjects and concerns in order to promote the creation of a productive and harmonious work environment. The parties resolve their differences through open and transparent talks.
Yanacocha offers employees opportunities to collaborate, innovate and succeed in their careers. The employee performance assessment system is associated with Yanacocha’s core values and measures our employee’s performance from a social responsibility, relationship management and leadership point of view. The work culture encompasses diversity, interacts with employees, encourages the environmental and social responsibility, rewards outstanding performance and develops great leaders at all levels.
Social Development
From the start, Yanacocha has centered its attention on its relationship with the community and on participating in the community’s development. Since 1993, Yanacocha has invested US$449 million in social development programs in the areas of education, health, social infrastructure (schools and medical dispensaries), projects for productive infrastructure and irrigation, rural electricity, roads, programs for the promotion of entrepreneurship, local tourism programs and agricultural assistance .
Despite all of this important social investment, in recent years, Yanacocha has experienced many conflicts. In some instances, these conflicts have affected the normal course of its operations. In response to this discord, Yanacocha has made a greater effort to listen to and to address the expectations and worries of the local population.
To that end, Yanacocha continues to implement its legitimacy approach in its engagement with the community, putting special emphasis on the following areas: respect for the city of Cajamarca, transparency and credibility, responsibility for the care of the environment and water and being a partner for development. Yanacocha believes that this legitimacy approach is acknowledged by the community and that this is a sign of a positive change in Yanacocha.
During 2016, Yanacocha invested a total of US$4.47 million on social matters, US$4.08 million of which was invested mainly on agricultural activities (this includes the Conga project and the Los Andes of Cajamarca Association – ALAC), the promotion of the development of capabilities in the community, and public and educational infrastructure. In addition, Yanacocha invested US$0.39 million in the mitigation of mining’s social impacts in its areas of operations, agricultural and cattle raising projects, irrigation infrastructure, social development projects and the fulfillment of pending commitments with the surrounding communities.
In 2016, Yanacocha also invested US$0.82 million in contributions for social investment through the Solidaridad Cajamarca mining fund.
During 2017, Yanacocha will continue to focus on improving perception and acceptance of the Company, actively participating in pro-development efforts with the civil society of Cajamarca, and strengthening the institutional and government relations to ensure the viability of its activities and maximize Company value.
Security
Yanacocha has nine security employees on its payroll and two employees responsible for the security of the region as a whole (50% paid by Yanacocha). In addition, Yanacocha has a contracted security force of over 258 persons assigned to rotating shifts at its mines and the city of Cajamarca. At its Lima offices, there are 11 security employees. The Conga project has a total of 83 contracted security personnel responsible for patrolling and providing security to the project in rotating shifts.
Mining and Processing Concessions
Yanacocha believes that the mining concessions assigned to it are in full force and effect under applicable Peruvian laws and that it is in compliance with all material terms and requirements applicable to these mining concessions. To the best of its knowledge, Yanacocha is not subject to any condition, occurrence or event that would cause the revocation, cancellation, lapse, expiration or termination of any of its concessions, except that Yanacocha and Chaupiloma may, from time to time, remake, cancel, terminate or allow to lapse mining concessions assigned to Yanacocha that are not material to the conduct of Yanacocha’s business.
| 43 |
Yanacocha has been actively pursuing the acquisition of the land surface rights or obtaining easements relating to land positions containing prospective geological exploration target sites, deposits that can be developed in the future or areas that would be considered for plant or facility sites. To date, Yanacocha has acquired all the surface rights with respect to 24,685 hectares of the surface land covering its Carachugo, Chaquicocha, Maqui Maqui, Haussing, Laboratorio, Línea de Alta Tensión, Presas, Sorpresa Mishacocha, San José, Cerro Yanacocha, Las Lagunas, the Conga project, China Linda, Amaro, Chasu, Solitario, La Carpa, Canjes and La Quinua (which includes the Cerro Negro deposit) mining operations, and a majority of the Cerro Quilish deposit and of Calera China Linda. See “—A. History and Development of the Company” above.
Regulation, Permit and Environmental Matters
Yanacocha is subject to a full range of governmental regulation and supervision generally applicable to companies engaged in business in Peru, including mining laws, labor laws, social security laws, public health, consumer protection laws, environmental laws, securities laws and antitrust laws. See “—Buenaventura—B. Business Overview —Regulatory Framework—Mining and Processing Concessions” and “—Buenaventura—B. Business Overview—Regulatory Framework—Environmental Matters” for a general description of Peruvian regulations of mining companies and environmental obligations. See “—Mining and Processing Concessions” above for a discussion of Peruvian regulations relating to the mining and processing concessions utilized by Yanacocha in its mining operations.
Mining operations must meet a series of requirements to obtain the legal authorization for new activities and planned operational changes. These authorizations have to be reviewed and approved by the corresponding authorities of the Peruvian Government, including the Ministry of Energy and Mines (MEM), the Ministry of Agriculture, National Water Authority, Ministry of the Environment (MINAM), Ministry of Culture, Ministry of Internal Affairs and the Ministry of Health. Modifications to the existing permits are necessary when the expected rates of production, disturbed areas or other attributes of the project exceed those authorized in the previous permits.
A total of 31 different permits were approved for Yanacocha and only one for the Conga project (currently suspended) in 2016.
The most significant approval for Yanacocha during 2016 was the Fifth Modification of the EIA “Suplementario Yanacocha Este” (SYE5) that mainly includes the expansion of the Chaquicocha Pit (Layback, Quecher Main, Quecher Norte and oxide underground mine), stage 2 of the Maqui Maqui pit and stage 14 of the Carachugo Pad. Three minor modifications of existing EIAs were also approved with an ITS (Informe Técnico Minero) for the Cerro Negro pit and water management in the Eastern and Western areas. Beneficiation Concession permit approvals included the construction of stage 10B of the Carachugo pad, operation of the raise to the south tailing storage facility, continued operation of the Bioleaching Plant of Copper and operation of the newly constructed La Quinua excess water treatment plant.
The National Water Authority also approved two discharge permits for the Eastern and Western zones and the Local Water Authority for the Marañón basin renewed the dewatering permits for the pits of Chaquicocha, La Quinua, Yanacocha and Maqui Maqui. Additionally during 2016, preparation started on the EIA modification explaining how Yanacocha will comply with the new 2015 Water Quality Standards (ECA) that becomes effective in the next three years.
Relative to exploration, the Second Modification of the semi-detailed EIA for Maqui Maqui was extended for five years. This allows for continued underground exploration at Chaquicocha and the continuance of exploration on the surface.
At the Conga project, the only permit approved was the extension of water use from the Chailhuagon Sediment pond for dust control.
| 44 |
Yanacocha has a policy that requires compliance with all applicable laws, regulations, permits, licenses and other authorizations for operation. The procedures that protect both human health and the environment have been developed and implemented in connection with the operations. International standards such as the ones from the International Finance Corporation (“IFC”) and the associated environmental guidelines are also used as guidance when applicable in an effort to implement best practices for environmental protection during project implementation and operations.
During 2005, Yanacocha became a signatory to the International Cyanide Management Code, which establishes specific and strict standards on how to properly manage cyanide from production through closure. Yanacocha has been audited and re-certified in 2008, 2011 and 2015. During 2016, Yanacocha also re-certified its Environmental Management System under the ISO 14001 standard.
The environmental laboratory of Yanacocha was accredited under standard ISO 17025 for environmental analytical laboratories in 2006. The importance of the accreditation is the recognition of the technical competence of the on-site laboratory to ensure reliable and accurate results of the analysis of the water samples. Yanacocha has consistently maintained this certification and the last follow-up audit was in November 2016 when the lab successfully obtained re-accreditation for the period 2017 to 2018.
The Government Agency for Evaluation and Environmental Supervision (Organismo de Evaluación y Fiscalización Ambiental - OEFA) carried out a total of three compliance supervisions within the operations areas of Yanacocha and China Linda during 2016. A single inspection was conducted of the currently suspended Conga project. There were no fines or monetary penalties imposed by OEFA during 2016.
During 2016, support continued for the drinking water supply system improvement projects for the city of Cajamarca as part of the public-private partnership between the Provincial Municipality of Cajamarca, the Local Water Supply Company for Sanitation (SEDACAJ), Yanacocha and Asociación Los Andes de Cajamarca (ALAC-Spanish initials). These projects have been underway since March 2012 with a total of approximately $10.7 million contributed.
The accomplishments made in the year 2016 are:
| · | Completion of the project Urban Sanitary Education, which included 2,500 students from nine educational institutions and 60 leaders from the southern zone of the city that took actions for water care and improving health conditions. |
| · | Completion of the technical profile for the improvement of the Potable Water Plants of Santa Apolonia and El Milagro. |
Insurance
Yanacocha maintains a comprehensive insurance program designed to address the specific risks associated with its operations, in addition to covering the normal insured risks encountered by major mining companies.
Yanacocha’s insurance program consists of a “Primary Program” and an “Umbrella/Excess Program.” Coverage under the Primary Program is provided through the local Peruvian insurance market and includes employers’ liability, comprehensive third-party general liability, comprehensive automobile liability and all risk property on a replacement basis, including transit risks, business interruption insurance and mining equipment. Coverage under the Umbrella/Excess Program is provided through Newmont Mining’s master worldwide insurance program and addresses claims that the Primary Program cannot, or will not, cover.
By-Laws of Yanacocha
Yanacocha is governed by the Peruvian Companies Law and the estatutos (the combined articles of incorporation and by-laws) of Yanacocha, or the “Yanacocha By-Laws.”
Control Over Major Corporate Events
Pursuant to the Peruvian Companies Law and the Yanacocha By-Laws (including applicable quorum requirements), without the affirmative vote of the partners of Yanacocha representing at least 51% of the voting shares, none of the following may occur:
| 45 |
| · | an increase or decrease in Yanacocha’s capital; |
| · | the issuance of any debentures; |
| · | any sale of an asset whose book value is at least 50% of the paid-in capital relating to such asset; |
| · | any amendment to the Yanacocha By-Laws to change its business form; |
| · | the merger, consolidation, dissolution or liquidation of Yanacocha; or |
| · | any other amendment of the Yanacocha By-Laws. |
Pursuant to the shareholders agreement among Newmont Second, Condesa, Compagnie Miniére Internationale Or S.A. and IFC, dated as of August 16, 1993, as amended by a General Amendment Letter, dated August 17, 1994, any member of the Executive Committee of Yanacocha who wishes to propose that Yanacocha’s Executive Committee authorize Yanacocha to take a Significant Action (as defined below) must (i) give written notice to each partner of such proposal before consideration thereof at a meeting of the Executive Committee and (ii) refrain from voting to approve such Significant Action until (x) the Executive Committee has received the consent of 80% of the partners of Yanacocha (a partner is deemed to have consented if no objection is received from such partner within 30 days after being notified) or (y) the Executive Committee has received the consent of at least 51% of the partners of Yanacocha and 45 days have elapsed since the member of the Executive Committee who proposed the Significant Action has responded in writing to objections received from objecting partners. “Significant Action” means:
| · | a disposal or sale of more than 20% by value of Yanacocha’s fixed assets; |
| · | any planned shutdown or cessation of Yanacocha’s mining activities that is planned to last for more than one year; |
| · | any capital expenditure by Yanacocha exceeding US$20 million; |
| · | any disposal or sale by Yanacocha of the mining rights covered by certain concessions; or |
| · | the approval of the construction of a project in the area owned by Yanacocha (other than the Carachugo mine and processing facilities). |
Preemptive Rights
The Peruvian Companies Law and the Yanacocha By-Laws provide preemptive rights to all partners of Yanacocha. In the event of a capital increase, any partner has a preemptive right to pay its pro rata share of such increase to maintain such partner’s existing participation in Yanacocha.
In the event of a proposed transfer, exchange or sale, either voluntary or involuntary, of participation, collectively referred to as the “Offered Participation,” of one or more partners, any partner has a right to acquire the Offered Participation in proportion to its holdings of partners’ capital. If the entire partnership fails to exercise this right or some partners indicate their decision to acquire a smaller share than that to which they are entitled, the other partners will receive an increase, and consequently, the remaining participation will be distributed among them in proportion to such partners’ capital participation and within the maximum limit of the participation they have stated their intention to acquire. Finally, any Offered Participation remaining unsubscribed by the partners must first be offered to Yanacocha before they may be offered to third parties.
In addition, in the event of the occurrence of a change of control (as defined) with respect to a significant partner, or the parent of a significant partner, in Yanacocha, the other significant partner will have the right to acquire the first partner’s participation interest in Yanacocha. No change of control will occur with respect to a significant partner so long as the parent of such partner is publicly traded or if such partner’s parent is acquired, the acquiring company is publicly traded.
| 46 |
Legal Proceedings
For a discussion of legal proceedings, see Note 20 to the Consolidated Yanacocha Financial Statements.
Other than the legal proceedings described in the Consolidated Yanacocha Financial Statements, Yanacocha is also involved in certain legal proceedings arising in the normal course of its business, none of which individually or in the aggregate is material to Yanacocha or its operations.
Management of Yanacocha
Executive Committee
Pursuant to the Yanacocha By-Laws, Yanacocha’s Executive Committee consists of six members, all of whom are appointed by the partners of Yanacocha. Gary J. Goldberg, President and Chief Executive Officer of Newmont Mining Corporation, has been appointed Chairman of Yanacocha’s Executive Committee and Roque Benavides, our Chairman of the Board, serves as the Vice Chairman of Yanacocha’s Executive Committee . The Vice Chairman has the power to preside over the meetings of Yanacocha’s Executive Committee in the Chairman’s absence. The members of the Executive Committee are elected for a three-year term but may continue in their positions until the next election takes place and the newly elected members accept their positions. Alternate members are elected in the same manner as members and can act in place of and with all the authority of members when a member is unavailable, except that an alternate member may not preside over the meetings of Yanacocha’s Executive Committee. The Chairman has the right to cast the deciding vote in the event of a deadlock among Yanacocha’s Executive Committee.
General Manager/Management Agreement
The Yanacocha By-Laws provide that the Yanacocha Partners’ Meeting has the power to appoint and remove the Manager of Yanacocha; the Executive Committee has the power to appoint and remove other officers of Yanacocha, determine their duties and compensation and grant and revoke powers of attorney. Newmont Peru was named as Yanacocha’s Manager according to a publicly filed deed, and it continues to hold that position. Newmont Peru’s duties as Manager are defined in the Management Contract dated February 28, 1992, as amended, between Yanacocha and Newmont Peru (the “Management Contract”). Pursuant to the Management Contract, Newmont Peru is responsible for managing, conducting and controlling the day-to-day operations of Yanacocha and keeping Yanacocha’s Executive Committee informed of all operations through the delivery of various written reports. The Management Contract was amended as of December 19, 2000. The amendment extends the term of the Management Contract for a period of 20 years starting at the date of amendment and provides that it may be extended for additional terms of 20 years upon request by Newmont Peru. Newmont Peru, however, may cancel the Management Contract by giving six months’ prior notice to Yanacocha. The Management Contract will be deemed terminated if, due to reasons attributable to the bad management of Yanacocha, except for reasons beyond its control, Newmont Peru is unable to substantially complete the agreed work programs. In exchange for its services as Manager, Newmont Peru receives remuneration of US$2 per ounce of gold production and its equivalent for copper production paid on a quarterly basis, which amount is expected to cover the overhead and administrative expenses for the management of the operations. Also, Newmont Peru may charge Yanacocha for the salaries of employees of Newmont Peru or its affiliates who are directly involved in the operation of Yanacocha. In 2016, Yanacocha accrued fees of US$9 million owed to Newmont Peru and its affiliates under the Management Contract.
Control Over Major Corporate Events
See “—By-Laws of Yanacocha” above for a description of certain provisions of Peruvian law and of the Yanacocha By-Laws relating to control over major corporate events.
Preemptive Rights and Rights of First Refusal
See “—By-Laws of Yanacocha” above for a description of certain provisions of Peruvian law and of the Yanacocha By-Laws relating to preemptive rights and rights of first refusal.
| 47 |
| C. | Property, Plants and Equipment |
Our Properties
Introduction
We currently have four wholly-owned operating mines (Orcopampa, Uchucchacua, Julcani and Mallay) and controlling interests in two mining companies which operate the Colquijirca-Marcapunta and La Zanja mines. We also own an electric power transmission company, an energy generation company, a chemical processing company, an engineering services consulting company and an insurance brokerage company. We also have non-controlling interests in Yanacocha, Cerro Verde and Tantahuatay mines. See “Buenaventura—C. Organizational Structure” and “Intermediate Holding Companies, Subsidiaries and Equity Participations.” Set forth below is a map of our principal mining operations.
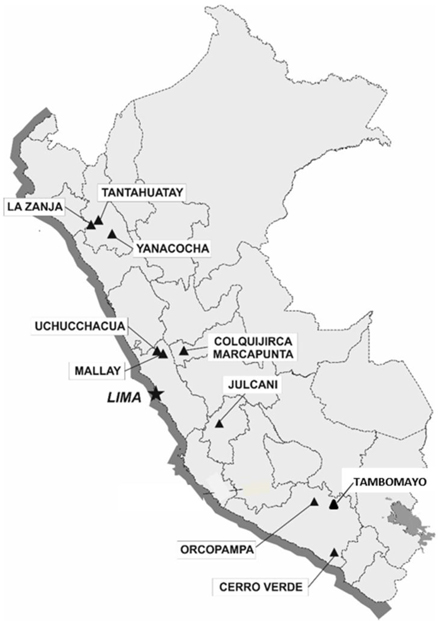
| 48 |
Directly Operated Properties
Orcopampa
The Orcopampa mine is wholly-owned and operated by Buenaventura. We lease the rights to the mining concessions of Orcopampa from a group of private investors. This lease, which expires in 2043, requires us to pay 10% of production value, subject to certain conditions. Operations began at the Orcopampa mine in 1965. In 2016, we made lease payments of US$19.8 million. We operated Orcopampa as a silver mine until the late 1990s, when we also began to mine gold-bearing veins.
The Orcopampa mine is located in the province of Castilla, department of Arequipa, approximately 1,350 kilometers southeast of the city of Lima, at an altitude between 3,800 and 4,500 meters above sea level.
The Orcopampa mine consists of an epithermal gold telluride deposit, hosted into lava flows and domes of Sarpane complex (calc-alkaline to high potassium), of early Miocene to Holocene, which forms part of the tertiary metallogenic belt of Southern Peru (Au-Ag).
Mining at Orcopampa is conducted underground using the mechanized cut-and-fill method. Mine ore is processed by the Carbon in Leach method in a plant located in Orcopampa, which was also outfitted for the treatment of old tailings. Electric power is primarily obtained from the Peruvian national electricity grid. Water for operations at Orcopampa is obtained from a lake and rivers.
In 2016, geological exploration activities were focused on the Pucará Sur, Pucarina, Nazareno, Lucía–Julissa veins system, Esperanza and Prometida Ramal 1.
As of December 31, 2016, proven and probable ore reserves were 763,885 tons, with 47.28 grams per ton of silver and 14.70 grams per ton of gold.
Set forth below are certain unaudited operating data for the periods shown for Orcopampa, calculated on the basis of 100% of the mine’s production.
|
Year Ended December 31, (1) |
||||||||
| 2015 | 2016 | |||||||
| Mining Operations: | ||||||||
| Ore mined (t) | 458,222 | 464,366 | ||||||
| Average gold grade (g/t) | 14.32 | 12.66 | ||||||
| Average silver grade (g/t) | 69.86 | 59.72 | ||||||
| Production: | ||||||||
| Gold (oz.) | 204,629 | 191,102 | ||||||
| Silver (oz.) | 562,795 | 692,318 | ||||||
| Recovery rate (gold) (%) | 95.30 | 96.33 | ||||||
| Recovery rate (silver) (%) | 53.64 | 73.39 | ||||||
| Cost applicable to sales per oz. of gold (2) | US$ | 678 | US$ | 704 | ||||
| Cost applicable to sales per oz. of silver (2) | US$ | 8.82 | US$ | 9.62 | ||||
| (1) | Incorporates losses for mining dilution and recovery. |
| (2) | Cost applicable to sales per unit of mineral sold is not a measure of financial performance under IFRS and may not be comparable to similarly titled measures of other companies. Cost applicable to sales per ounce of gold or ounce of silver consists of cost applicable to sales for gold or silver sold, divided by the volume of gold or silver produced in the specified period. The cost applicable to sales per unit of mineral sold figures disclosed herein are calculated without adjusting for by-product revenue amounts. We consider cost applicable to sales per unit of mineral to be a key measure in managing and evaluating our operating performance. We believe this measure is widely reported in the precious metals industry as a benchmark for performance, but does not have standardized meanings. You should not consider cost applicable to sales per unit of mineral sold as an alternative to cost of sales determined in accordance with IFRS as an indicator of our operating performance. See “Item 5. Operating and Financial Review and Prospects—Buenaventura—G. Reconciliation of Cost Applicable to Sales and Cost Applicable to Sales per Unit Sold” for a reconciliation of Cost applicable to sales per unit sold to Cost of sales, excluding depreciation and amortization. |
Uchucchacua
The Uchucchacua mine is wholly-owned and operated by Buenaventura. Operations began in 1975 and Uchucchacua is currently our largest wholly-owned silver producing mine. Uchucchacua is located in the province of Oyón, department of Lima, approximately 265 kilometers northeast of the city of Lima at an altitude of between 4,000 and 5,000 meters above sea level.
| 49 |
Uchucchacua’s mineral structures are hosted by Mesozoic limestone of the Jumasha Formation and are classified as a mesothermal polymetallic deposit of silver-lead-zinc with important contents of manganese. The main mineralized structures are veins and ore bodies with high-grade silver content.
Mining at Uchucchacua is conducted underground and utilizes cut-and-fill stopping, shrinkage stopping and sublevel stopping methods. Ore is processed at a mill located at Uchucchacua. The mill has a rated capacity of 3,860 tons per day and utilizes differential flotation to obtain a lead-silver concentrate and a zinc concentrate. Electric power is obtained from the Peruvian national electricity grid, a hydroelectric plant and a diesel generator. We utilize a power line connecting Uchucchacua to the Peruvian national electricity grid and have electrical distribution facilities within the Uchucchacua mine. Water for operations at Uchucchacua is obtained from three lakes.
During 2016, the manganese sulfate plant of Rio Seco treated 24,424 tons of concentrates from the Uchucchacua mine, with 142.3 ounces per ton of silver, 7.0% lead and 25.7% manganese. Following treatment, 18,848 tons were obtained, with 213.5 ounces per ton of silver, 10.5% lead and 3.6% manganese. This process also allowed for the production of 16,651 tons of sulfuric acid of 98.0% purity and 17,056 tons of commercial grade manganese sulfate monohydrated.
During 2016, the main exploration efforts were focused on the Socorro mine, earning the largest volume of mineral reserves. In Huantajalla, the Carmen and Casualidad mines were explored with relative success finding narrow structures, but high silver contents.
At December 31, 2016, proven and probable ore reserves were 4,652,675 tons, with 442.35 grams per ton of silver, 1.42% lead and 1.87% zinc.
Set forth below are certain unaudited operating data for the periods shown for Uchucchacua, calculated on the basis of 100% of the mine’s production.
|
Year Ended December 31, (1) |
||||||||
| 2015 | 2016 | |||||||
| Mining Operations: | ||||||||
| Ore mined (t) | 1,121,474 | 1,267,752 | ||||||
| Average silver grade (g/t) | 460.33 | 473.71 | ||||||
| Average zinc grade (%) | 1.05 | 1.17 | ||||||
| Average lead grade (%) | 0.82 | 0.93 | ||||||
| Production: | ||||||||
| Silver (oz.) | 13,919,922 | 16,212,746 | ||||||
| Zinc (t) | 5,693 | 7,227 | ||||||
| Lead (t) | 7,947 | 10,724 | ||||||
| Recovery rate (silver) (%) | 83.87 | 83.95 | ||||||
| Cost applicable to sales per oz. of silver (2) | US$ | 13.93 | US$ | 11.03 | ||||
| Cost applicable to sales per ton of zinc (2) | US$ | 2,426 | US$ | 2,223 | ||||
| Cost applicable to sales per ton of lead (2) | US$ | 1,548 | US$ | 1,214 | ||||
| (1) | Incorporates losses for mining dilution and recovery. |
| (2) | Cost applicable to sales per unit of mineral sold is not a measure of financial performance under IFRS and may not be comparable to similarly titled measures of other companies. Cost applicable to sales per ounce of silver, ton of zinc or ton of lead consists of cost applicable to sales for silver, zinc or lead sold, divided by the volume of silver, zinc or lead produced in the specified period. The cost applicable to sales per unit of mineral sold figures disclosed herein are calculated without adjusting for by-product revenue amounts. We consider cost applicable to sales per unit of mineral to be a key measure in managing and evaluating our operating performance. We believe this measure is widely reported in the precious metals industry as a benchmark for performance, but does not have standardized meanings. You should not consider cost applicable to sales per unit of mineral sold as an alternative to cost of sales determined in accordance with IFRS as an indicator of our operating performance. See “Item 5. Operating and Financial Review and Prospects—Buenaventura—G. Reconciliation of Cost Applicable to Sales and Cost Applicable to Sales per Unit Sold” for a reconciliation of Cost applicable to sales per unit sold to Cost of sales, excluding depreciation and amortization. |
| 50 |
Julcani
Julcani is an underground mine that is wholly-owned and operated by us. We acquired Julcani in 1953 as our first operating mine. Julcani is located in the province of Angaraes, department of Huancavelica, approximately 500 kilometers southeast of Lima at an altitude between 4,200 and 5,000 meters above sea level.
Julcani is a large polymetallic deposit in Central Peru, which principally produces silver, that occurs mainly in sulfosalts in a multitude of mineralogically complex veins in dacite domes, tuffs, breccias and other tertiary volcanic rocks.
Ore is processed by bulk flotation to obtain a concentrate of silver-lead-copper-gold. The plant has a rated capacity of 550 tons per day.
Electric power is generated by three hydroelectric plants, Huapa, Tucsipampa and El Ingenio. We are also connected to the Peruvian national electricity grid. Water for operations in Julcani is obtained from mine drainage, a stream and a small lagoon.
During 2016, we focused our exploration activities on the main mineralized structures of the Acchilla and Estela mines. In the Acchilla mine we have continued the exploration of deeper levels that confirm the deepening of silver mineralization in all main veins. We have also begun the exploration of underground work, searching for silver mineralization in an interesting new area called Taype-Galindo.
At December 31, 2016, total proven and probable ore reserves were 294,852 tons, with 652.08 grams per ton of silver, 0.288 grams per ton of gold, 2.30% lead and 0.49% copper.
Set forth below are certain unaudited operating data for the periods shown for Julcani, calculated on the basis of 100% of the mine’s production.
|
Year Ended December 31, (1) |
||||||||
|
2015 (2)(3) |
2016 (2)(3) |
|||||||
| Mining Operations: | ||||||||
| Ore mined (t) | 177,948 | 173,865 | ||||||
| Average gold grade (g/t) | 0.22 | 0.12 | ||||||
| Average silver grade (g/t) | 597.66 | 606.83 | ||||||
| Average lead grade (%) | 1.55 | 1.76 | ||||||
| Average copper grade (%) | 0.21 | 0.18 | ||||||
| Production: | ||||||||
| Gold (oz.) | 607 | 246 | ||||||
| Silver (oz.) | 3,266,453 | 3,264,420 | ||||||
| Lead (t) | 2,592 | 2,883 | ||||||
| Copper (t) | 339 | 291 | ||||||
| Recovery rate (silver) (%) | 95.52 | 96.25 | ||||||
| Cost applicable to sales per oz. of gold (4) | US$ | 955 | US$ | 825 | ||||
| Cost applicable to sales per oz. of silver (4) | US$ | 12.30 | US$ | 11.62 | ||||
| Cost applicable to sales per ton of lead (4) | US$ | 1,425 | US$ | 1,241 | ||||
| Cost applicable to sales per ton of copper (4) | US$ | 4,416 | US$ | 2,837 | ||||
| (1) | Includes losses due to mining dilution and recovery. |
| (2) | Includes total Acchilla and Estela mine production. |
| (3) | Reflects total recovery percentage of Acchilla and Estela ore. |
| (4) | Cost applicable to sales per unit of mineral sold is not a measure of financial performance under IFRS and may not be comparable to similarly titled measures of other companies. Cost applicable to sales per ounce of gold, ounce of silver, ton of lead or ton of copper consists of cost applicable to sales for gold, silver, lead or copper sold, divided by the volume of gold, silver, lead or copper produced in the specified period. The cost applicable to sales per unit of mineral sold figures disclosed herein are calculated without adjusting for by-product revenue amounts. We consider cost applicable to sales per unit of mineral to be a key measure in managing and evaluating our operating performance. We believe this measure is widely reported in the precious metals industry as a benchmark for performance, but does not have standardized meanings. You should not consider cost applicable to sales per unit of mineral sold as an alternative to cost of sales determined in accordance with IFRS as an indicator of our operating performance. See “Item 5. Operating and Financial Review and Prospects—Buenaventura—G. Reconciliation of Cost Applicable to Sales and Cost Applicable to Sales per Unit Sold” for a reconciliation of Cost applicable to sales per unit sold to Cost of sales, excluding depreciation and amortization. |
| 51 |
Mallay
The Mallay mine is wholly-owned and operated by us and is located 21 kilometers southwest of the Uchucchacua mine in the district of Mallay, province of Oyón, department of Lima. Mallay is considered an epithermal deposit of silver, lead, zinc and gold. We have recognized the following main ore structures: Isguiz body-vein (silver, lead, zinc), Pierina (gold vein), María (silver vein) and Fortuna (skarn type lead, zinc, silver).
During 2016, we have continued geological exploration with tunnels and diamond drilling mainly focused on the Isguiz body-vein and the María-Dana-Pierina and Nicole system silver veins. In 2017, we plan to explore deeper levels in accordance with the diamond drilling campaign’s 2016 results.
District explorations have identified a new target area 5 kilometers west of Isguiz with indications of gold and silver mineralization in Cretaceous sandstones and quartzites that will be explored with diamond drilling during 2017.
As of December 31, 2016, proven and probable ore reserves were 162,125 tons, with 286.17 grams per ton of silver, 0.47 grams per ton of gold, 4.65% lead and 7.69% zinc.
Set forth below are certain unaudited operating data for the Mallay mine, calculated on the basis of 100% of the mine’s production.
|
Year Ended December 31, (1)(2) |
||||||||
| 2015 | 2016 | |||||||
| Mining Operations: | ||||||||
| Ore mined (t) | 158,124 | 204,035 | ||||||
| Average silver grade (g/t) | 269.48 | 264.07 | ||||||
| Average lead grade (%) | 5.05 | 3.98 | ||||||
| Average zinc grade (%) | 6.60 | 5.79 | ||||||
| Production: | ||||||||
| Silver (oz.) | 1,285,361 | 1,627,246 | ||||||
| Lead (t) | 7,193 | 7,383 | ||||||
| Zinc (t) | 9,173 | 10,463 | ||||||
| Recovery rate (silver) (%) | 93.82 | 93.92 | ||||||
| Cost applicable to sales per oz. of silver (3) | US$ | 13.90 | US$ | 12.78 | ||||
| Cost applicable to sales per ton of lead (3) | US$ | 1,544 | US$ | 1,406 | ||||
| Cost applicable to sales per ton of zinc (3) | US$ | 1,794 | US$ | 1,869 | ||||
| (1) | Incorporates losses for mining dilution and recovery. |
| (2) | Data reflect mining operations at Mallay mine. |
| (3) | Cost applicable to sales per unit of mineral sold is not a measure of financial performance under IFRS and may not be comparable to similarly titled measures of other companies. Cost applicable to sales per ounce of silver, ton of lead or ton of zinc consists of cost applicable to sales for silver, lead or zinc sold, divided by the volume of silver, lead or zinc produced in the specified period. The cost applicable to sales per unit of mineral sold figures disclosed herein are calculated without adjusting for by-product revenue amounts. We consider cost applicable to sales per unit of mineral to be a key measure in managing and evaluating our operating performance. We believe this measure is widely reported in the precious metals industry as a benchmark for performance, but does not have standardized meanings. You should not consider cost applicable to sales per unit of mineral sold as an alternative to cost of sales determined in accordance with IFRS as an indicator of our operating performance. See “Item 5. Operating and Financial Review and Prospects—Buenaventura—G. Reconciliation of Cost Applicable to Sales and Cost Applicable to Sales per Unit Sold” for a reconciliation of Cost applicable to sales per unit sold to Cost of sales, excluding depreciation and amortization. |
La Zanja
The La Zanja mine is located in the district of Pulan, province of Santa Cruz, department of Cajamarca in northern Peru. La Zanja is located 48 kilometers northwest of the Yanacocha gold mine, at an average altitude of 3,500 meters above sea level. We hold a 53.06% interest in La Zanja and Newmont Holdings ULC holds a 46.94% interest.
| 52 |
La Zanja is located within a large area of hydrothermal alteration, mainly related to epithermal gold deposits in high sulfidation environments, in addition to some vein systems of intermediate to low sulfidation. We have recognized two ore deposits: San Pedro Sur and Cerro Pampa Verde.
Mining operations are conducted through the open-pit method, the plant utilizes a carbon-in-column circuit as well as a Merrill Crowe circuit to recover gold from heap leach operations. The gold laden carbon is then transported to Yanacocha to be processed into doré bars.
During 2016, we continued diamond drilling for increased resources in San Pedro Sur and Pampa Verde. We have also continued exploring with diamond drilling in other areas around San Pedro Sur, Pampa Verde such as Casa Blanca and El Buitre.
Total proven and probable ore reserves at December 31, 2016 were 15,116,370 tons, with 8.55 grams per ton of silver and 0.52 grams per ton of gold.
Set forth below are certain unaudited operating data for La Zanja, calculated on the basis of 100% of the mine’s production.
| Year Ended December 31, | ||||||||
| 2015 | 2016 | |||||||
| Mining Operations: | ||||||||
| Ore treated (t) | 8,576,614 | 9,317,652 | ||||||
| Average gold grade (g/t) | 0.70 | 0.75 | ||||||
| Average silver grade (g/t) | 5.97 | 3.95 | ||||||
| Production: | ||||||||
| Gold (oz.) | 141,071 | 139,724 | ||||||
| Silver (oz.) | 331,080 | 217,292 | ||||||
| Cost applicable to sales per oz. of gold (1) | US$ | 753 | US$ | 607 | ||||
| Cost applicable to sales per oz. of silver (1) | US$ | 10.08 | US$ | 8.01 | ||||
| (1) | Cost applicable to sales per unit of mineral sold is not a measure of financial performance under IFRS and may not be comparable to similarly titled measures of other companies. Cost applicable to sales per ounce of gold or ounce of silver consists of cost applicable to sales for gold or silver sold, divided by the volume of gold or silver produced in the specified period. The cost applicable to sales per unit of mineral sold figures disclosed herein are calculated without adjusting for by-product revenue amounts. We consider cost applicable to sales per unit of mineral to be a key measure in managing and evaluating our operating performance. We believe this measure is widely reported in the precious metals industry as a benchmark for performance, but does not have standardized meanings. You should not consider cost applicable to sales per unit of mineral sold as an alternative to cost of sales determined in accordance with IFRS as an indicator of our operating performance. See “Item 5. Operating and Financial Review and Prospects—Buenaventura—G. Reconciliation of Cost Applicable to Sales and Cost Applicable to Sales per Unit Sold” for a reconciliation of Cost applicable to sales per unit sold to Cost of sales, excluding depreciation and amortization. |
Tantahuatay
Tantahuatay is a gold-copper mine located in the district and province of Hualgayoc, department of Cajamarca, in northern Peru, at an average altitude of 3,900 meters above sea level. The Tantahuatay mine is operated by Buenaventura and wholly-owned by Coimolache, in which we hold a 40.10% equity interest.
Geologically, the Tantahuatay deposits are located at diatremes or volcanic necks in a sequence volcano-magmatic hydrothermal predominant linked to the regional mineralized sector north of Peru.
Tantahuatay consists of five areas of Au-Ag mineralization, contained in material of supergenic oxidation (Mirador Norte, Mirador Sur, Cienaga Norte, Cienaga Sur and Tantahuatay). We have also discovered that below the oxides level of the Cerro Tantahuatay area, there is a significant resource of Cu-Au-Ag in pyrite-enargite ore (sulphides), which is present as disseminations and fracture fillings associated with advanced argillic alteration and multiphase breccia bodies.
During 2016, we continued diamond drilling to update the block model for reserves of the open pits Tantahuatay 2 and Ciénaga Norte and to convert resources to reserves in the Mirador Sur, Mirador Norte and Ciénaga Norte projects.
| 53 |
Total proven and probable ore reserves at December 31, 2016 were 81,267,346 tons, with 8.07 grams per ton of silver and 0.39 grams per ton of gold.
Set forth below are certain unaudited operating data for the Tantahuatay mine, calculated on the basis of 100% of the mine’s production
|
Year Ended December 31, (1)(2) |
||||||||
| 2015 | 2016 | |||||||
| Mining Operations: | ||||||||
| Ore treated (t) | 12,185,425 | 10,624,498 | ||||||
| Average gold grade (g/t) | 0.50 | 0.56 | ||||||
| Average silver grade (g/t) | 13.00 | 12.25 | ||||||
| Production: | ||||||||
| Gold (oz.) | 144,782 | 150,816 | ||||||
| Silver (oz.) | 879,832 | 711,337 | ||||||
| Cost applicable to sales per oz. of gold (3) | US$ | 489 | US$ | 492 | ||||
| Cost applicable to sales per oz. of silver (3) | US$ | 6.59 | US$ | 6.71 | ||||
| (1) | Incorporates losses for mining dilution and recovery. |
| (2) | Data reflect mining operations at the Tantahuatay 2 deposit only. |
| (3) | Cost applicable to sales per unit of mineral sold is not a measure of financial performance under IFRS and may not be comparable to similarly titled measures of other companies. Cost applicable to sales per ounce of gold or ounce of silver consists of cost applicable to sales for gold or silver sold, divided by the volume of gold or silver produced in the specified period. The cost applicable to sales per unit of mineral sold figures disclosed herein are calculated without adjusting for by-product revenue amounts. We consider cost applicable to sales per unit of mineral to be a key measure in managing and evaluating our operating performance. We believe this measure is widely reported in the precious metals industry as a benchmark for performance, but does not have standardized meanings. You should not consider cost applicable to sales per unit of mineral sold as an alternative to cost of sales determined in accordance with IFRS as an indicator of our operating performance. See “Item 5. Operating and Financial Review and Prospects—Buenaventura—G. Reconciliation of Cost Applicable to Sales and Cost Applicable to Sales per Unit Sold” for a reconciliation of Cost applicable to sales per unit sold to Cost of sales, excluding depreciation and amortization |
Colquijirca and Marcapunta Norte
The Colquijirca (also known as Tajo Norte) and Marcapunta Norte mines are wholly-owned by El Brocal. El Brocal was founded in 1956 and is engaged in the extraction, concentration and sale of concentrates of polymetallic minerals – mainly zinc, copper, lead and silver. Our aggregate direct and indirect equity interest in El Brocal was 61.32% at December 31, 2016.
The Colquijirca and Marcapunta Norte mines are adjacent and are located 285 kilometers east of the city of Lima and 10 kilometers south of the city of Cerro de Pasco. El Brocal produces zinc, lead and silver concentrates from the Colquijirca mine and copper concentrates from the Marcapunta Norte mine. The Colquijirca mine consists of three important polymetallic deposits: (1) Tajo Norte–Smelter, which contains zinc, silver and lead ore; (2) Marcapunta, which contains an auriferous mineralization in breccia oxides and an arsenic copper enargite mineralization as a continuation of the mineralized mantles of the Marcapunta Norte mine; and (3) San Gregorio, which contains zinc.
Mining at Colquijirca is conducted through the open-pit method from which zinc and lead concentrates are produced. El Brocal’s zinc concentrate typically contains 50% zinc, while its lead concentrate typically contains approximately 50% lead. Mining at Marcapunta Norte is conducted through the sublevel stopping method, from which copper concentrates are produced. El Brocal’s copper concentrates typically contain approximately 27% copper, 4% silver and 8% arsenic.
The Huaraucaca concentrator plant processes ore from both mines. In 2016, average treated ore at the plant was 16,700 tons per day, with amounts in the third and fourth quarter of 2016 reaching 18,200 and 18,700 tons per day, respectively. The Colquijirca and Marcapunta mines primarily relies on a power line connected to the Peruvian national electricity grid.
| 54 |
In 2016, we invested US$24.7 million primarily in the overland conveyor belt infrastructure and system logic change, new secondary crushers, drilling and social investment for a smelter project and the initial investment in a water treatment plant expansion. In 2016, exploration was halted in prospective areas such as San Gregorio, Marcapunta Oeste and other areas to focus efforts on maintaining the crushing, milling and flotation processes to the expected capacity of 18,000 tons daily in a sustainable manner.
Total proven and probable reserves of Colquijirca as of December 31, 2016 were 25,040,000 tons, with 34.21 grams of silver per ton, 2.59% of zinc and 0.96% of lead, plus 48,881,000 tons in smelter expansion, with 1.41% of copper and 16.48 grams of silver per ton. Total proven and probable reserves of Marcapunta Norte as of December 31, 2016 were 15,911 tons with 13.68 grams of silver per ton, 0.37 grams of gold per ton and 1.88% copper.
Set forth below are certain unaudited operating data for the Colquijirca mine, calculated on the basis of 100% of the mine’s production.
|
Year Ended December 31, (1) |
||||||||
| 2015 | 2016 | |||||||
| Mining Operations: | ||||||||
| Ore mined (t) | 3,101,851 | 3,513,959 | ||||||
| Average silver grade (oz./t) | 1.34 | 0.88 | ||||||
| Average zinc grade (%) | 2.77 | 2.67 | ||||||
| Average lead grade (%) | 1.03 | 0.77 | ||||||
| Production: | ||||||||
| Silver (oz.) | 2,811,391 | 1,835,242 | ||||||
| Zinc (t) | 53,319 | 57,385 | ||||||
| Lead (t) | 18,854 | 12,860 | ||||||
| Recovery rate (silver) (%) | 67.52 | 59.55 | ||||||
| Recovery rate (zinc) (%) | 61.96 | 61.13 | ||||||
| Recovery rate (lead) (%) | 58.73 | 47.61 | ||||||
| Cost applicable to sales per ton of mine (2) | 1,601 | 1,808 | ||||||
| (1) | Incorporates losses for mining dilution and recovery. |
| (2) | Represents cost applicable to sales per ton of zinc for El Brocal. Cost applicable to sales per unit of mineral sold is not a measure of financial performance under IFRS and may not be comparable to similarly titled measures of other companies. Cost applicable to sales per ton of zinc consists of cost applicable to sales for zinc divided by the volume of zinc produced in the specified period. The cost applicable to sales per unit of mineral sold figures disclosed herein are calculated without adjusting for by-product revenue amounts. We consider cost applicable to sales per unit of mineral to be a key measure in managing and evaluating our operating performance. We believe this measure is widely reported in the precious metals industry as a benchmark for performance, but does not have standardized meanings. You should not consider cost applicable to sales per unit of mineral sold as an alternative to cost of sales determined in accordance with IFRS as an indicator of our operating performance. See “Item 5. Operating and Financial Review and Prospects—Buenaventura—G. Reconciliation of Cost Applicable to Sales and Cost Applicable to Sales per Unit Sold” for a reconciliation of Cost applicable to sales per unit sold to Cost of sales, excluding depreciation and amortization. |
Set forth below are certain unaudited operating data for the Marcapunta Norte mine, calculated on the basis of 100% of the mine’s production.
|
Year Ended December 31, (1) |
||||||||
| 2015 | 2016 | |||||||
| Mining Operations: | ||||||||
| Ore mined (t) | 1,962,627 | 2,597,926 | ||||||
| Average silver grade (oz./t) | 0.75 | 0.59 | ||||||
| Average gold grade (gr/t) | 0.31 | 0.53 | ||||||
| Average copper grade (%) | 1.92 | 2.07 | ||||||
| Production: | ||||||||
| Silver (oz.) | 858,109 | 799,497 | ||||||
| Gold (oz.) | 11,263 | 23,511 | ||||||
| Copper (t) | 32,061 | 49,170 | ||||||
| Recovery rate (silver) in copper (%) | 58.40 | 62.24 | ||||||
| Recovery rate (gold) in copper (%) | 50.93 | 58.91 | ||||||
| Recovery rate copper (%) | 85.22 | 90.36 | ||||||
| Cost applicable to sales per ton of mine (2) | 5,322 | 4,651 | ||||||
| 55 |
| (1) | Incorporates losses for mining dilution and recovery. |
| (2) | Represents cost applicable to sales per ton of copper for El Brocal. Cost applicable to sales per unit of mineral sold is not a measure of financial performance under IFRS and may not be comparable to similarly titled measures of other companies. Cost applicable to sales per ton of copper consists of cost applicable to sales for copper divided by the volume of copper produced in the specified period. The cost applicable to sales per unit of mineral sold figures disclosed herein are calculated without adjusting for by-product revenue amounts. We consider cost applicable to sales per unit of mineral to be a key measure in managing and evaluating our operating performance. We believe this measure is widely reported in the precious metals industry as a benchmark for performance, but does not have standardized meanings. You should not consider cost applicable to sales per unit of mineral sold as an alternative to cost of sales determined in accordance with IFRS as an indicator of our operating performance. See “Item 5. Operating and Financial Review and Prospects—Buenaventura—G. Reconciliation of Cost Applicable to Sales and Cost Applicable to Sales per Unit Sold” for a reconciliation of Cost applicable to sales per unit sold to Cost of sales, excluding depreciation and amortization. |
Reserves
We calculate our ore reserves by methods generally applied within the mining industry and in accordance with SEC Industry Guide 7. All mineral reserves are estimates of proven and probable ore quantities that under present conditions may be economically mined and processed.
The proven and probable ore reserve figures presented in this Annual Report are estimates, and no assurance can be given that the level of recovery of gold, silver and certain other metals will be realized. See “Item 3. Key Information—D. Risk Factors—Factors Relating to the Company—Estimates of proven and probable reserves are subject to uncertainties and the volume and grade of ore actually recovered may vary from our estimates.”
The term “reserves” refers to mineral deposits that could be economically and legally extracted or produced at the time of reserve determination. The term “proven reserves” means ore reserves for which (a) quantity is computed from dimensions revealed in outcrops, trenches, workings or drill holes, and grade and/or quality are computed from the results of detailed sampling, and (b) the sites for inspection, sampling and measurement are spaced so closely and the geologic character is so well defined that size, shape, depth and mineral content of reserves are well established. The term “probable reserves” means ore reserves for which quantity and grade and/or quality are computed from information similar to that used for proven reserves, but the sites for inspection, sampling and measurement are farther apart or are otherwise less adequately spaced. The degree of assurance, although lower than that for proven reserves, is high enough to assume continuity between points of observation.
As of December 31, 2016, our total proven and probable reserves, including our equity share in the proven and probable reserves of El Brocal (61.32%), La Zanja (53.06%), Coimolache (40.10%) and Yanacocha (43.65%), were estimated to be 3.54 million ounces of gold representing a 0.03% decrease compared to our total proven and probable reserves as of December 31, 2015, which were estimated to be 3.537 million ounces of gold.
As of December 31, 2016, our total proven and probable reserves, including our equity share in El Brocal (61.32%), La Zanja (53.06%), Coimolache (Tantahuatay) (40.10%) and Yanacocha (43.65%), were estimated to be 209.65 million ounces of silver, representing a 14.54% increase over our total proven and probable reserves as of December 31, 2015, which were estimated to be 183.03 million ounces of silver
The following table lists proven and probable ore reserves, as of December 31, 2016, for each of our consolidated mining operations and the Tantahuatay mine, in which we have a 40.10% equity interest, the La Zanja mine, in which we have a 53.06% equity interest, and the Colquijirca and Marcapunta mines (El Brocal), in which we have a 61.32% equity interest. The reserves shown in the table below are the total reserves for each mine and do not reflect our equity share of reserves in non-wholly-owned mines.
| 56 |
Proven Ore Reserves at December 31, 2016 (1) (2)
|
Orcopampa (3) |
Uchucchacua (4) |
Julcani (5) |
Mallay (6) |
Tambomayo (7) |
La Zanja (8) |
Tantahuatay (9) |
Colquijirca (10)(11) |
Marcapunta (10)(12) |
Total/
Average |
|||||||||||||||||||||||||||||||
| Ore Reserves (t) | 514,434 | 2,712,540 | 190,476 | 99,399 | 642,765 | 9,588,337 | 72,118,232 | 52,499,000 | 9,413,000 | 147,778,183 | ||||||||||||||||||||||||||||||
| Grade: | ||||||||||||||||||||||||||||||||||||||||
| Gold (g/t) | 14.64 | - | 0.31 | 0.46 | 6.04 | 0.52 | 0.40 | - | 0.50 | 0.34 | ||||||||||||||||||||||||||||||
| Silver (g/t) | 45.82 | 418.32 | 650.53 | 293.37 | 419.39 | 9.78 | 8.07 | 25.34 | 18.69 | 25.46 | ||||||||||||||||||||||||||||||
| Copper (%) | - | - | 0.52 | - | - | - | - | 0.82 | 2.04 | 0.42 | ||||||||||||||||||||||||||||||
| Zinc (%) | - | 1.98 | - | 7.17 | 1.41 | - | - | 1.26 | - | 0.49 | ||||||||||||||||||||||||||||||
| Lead (%) | - | 1.46 | 2.29 | 4.58 | 0.93 | - | - | 0.50 | - | 0.21 | ||||||||||||||||||||||||||||||
| Content: | ||||||||||||||||||||||||||||||||||||||||
| Gold (oz.) | 242,047 | - | 1,905 | 1,471 | 124,731 | 159,767 | 931,153 | - | 151,317 | 1,612,391 | ||||||||||||||||||||||||||||||
| Silver (oz.) | 757,846 | 36,481,810 | 3,983,806 | 937,529 | 8,666,923 | 3,015,471 | 18,717,041 | 42,766,810 | 5,647,800 | 120,975,036 | ||||||||||||||||||||||||||||||
| Copper (t) | - | - | 990 | - | - | - | - | 428,810 | 192,025 | 621,825 | ||||||||||||||||||||||||||||||
| Zinc (t) | - | 53,803 | - | 7,129 | 9,034 | - | - | 659,255 | - | 729,221 | ||||||||||||||||||||||||||||||
| Lead (t) | - | 39,541 | 4,365 | 4,551 | 6,004 | - | - | 261,493 | - | 315,953 | ||||||||||||||||||||||||||||||
Probable Ore Reserves at December 31, 2016 (1) (2)
|
Orcopampa (3) |
Uchucchacua (4) |
Julcani (5) |
Mallay (6) |
Tambomayo (7) |
La Zanja (8) |
Tantahuatay (9) |
Colquijirca (10)(11) |
Marcapunta (10)(12) |
Total/
Average |
|||||||||||||||||||||||||||||||
| Ore Reserves (t) | 249,452 | 1,940,135 | 104,376 | 62,726 | 1,485,006 | 5,528,033 | 9,149,114 | 21,422,000 | 6,498,000 | 46,438,842 | ||||||||||||||||||||||||||||||
| Grade: | 14.82 | - | 0.31 | 0.49 | 9.89 | 0.53 | 0.31 | – | 0.18 | 0.34 | ||||||||||||||||||||||||||||||
| Gold (g/t) | 49.85 | 475.95 | 654.73 | 274.77 | 248.67 | 6.42 | 8.03 | 15.16 | 6,22 | 40.16 | ||||||||||||||||||||||||||||||
| Silver (g/t) | - | - | 0.44 | - | - | - | - | 1.34 | 1.65 | 0.85 | ||||||||||||||||||||||||||||||
| Copper (%) | - | 1.71 | - | 8.52 | 2.85 | - | - | 0.20 | – | 0.27 | ||||||||||||||||||||||||||||||
| Zinc (%) | - | 1.37 | 2.33 | 4.77 | 1.32 | - | - | 0.12 | – | 0.17 | ||||||||||||||||||||||||||||||
| Lead (%) | ||||||||||||||||||||||||||||||||||||||||
| Content: | 399,787 | 29,687,966 | 2,197,115 | 554,126 | 11,872,459 | 1,140,902 | 2,360,696 | 10,441,404 | 1,299,600 | 59,954,054 | ||||||||||||||||||||||||||||||
| Gold (oz.) | - | - | 459 | - | - | - | - | 286,339 | 107,217 | 394,015 | ||||||||||||||||||||||||||||||
| Silver (oz.) | - | 33,147 | - | 5,344 | 42,343 | - | - | 43,459 | – | 124,293 | ||||||||||||||||||||||||||||||
| Copper (t) | - | 26,537 | 2,434 | 2,991 | 19,542 | - | - | 25,685 | – | 77,189 | ||||||||||||||||||||||||||||||
| Zinc (t) | 249,452 | 1,940,135 | 104,376 | 62,726 | 1,485,006 | 5,528,033 | 9,149,114 | 21,422,000 | 6,498,000 | 46,438,842 | ||||||||||||||||||||||||||||||
| Lead (t) | ||||||||||||||||||||||||||||||||||||||||
| (1) | Geominería S.A.C., an independent consultant company, audited the process used to estimate proven and probable ore reserves for Orcopampa, Uchucchacua, Julcani and Mallay as of December 31, 2016. El Brocal engaged the consulting firm BISA to update the resources model as of December 31, 2016. HATCH, an independent consultant, audited the process used to estimate proven and probable ore reserves for Tambomayo, La Zanja and Tantahuatay as of December 31, 2016. |
| (2) | For the year ended December 31, 2016, reserves for our wholly-owned and operated mines, were calculated using the following prices: US$1,250 per ounce of gold, US$19 per ounce of silver, US$2,100 per metric ton of zinc, US$1,800 per metric ton of lead and US$5,000 per metric ton of copper. |
| (3) | The metallurgical recovery factors that impacted the calculated reserves for Orcopampa as of December 31, 2016 were water quality (recycled water contains impurities that can interfere with the chemical reaction of the reagents) and ore grade being lower than estimated or expected. |
| (4) | The metallurgical recovery factors that impacted the calculated reserves for Uchucchacua as of December 31, 2016 were the complexity of the ore, the variation of head ore grades and the high manganese content. |
| (5) | The metallurgical recovery factors that impacted the calculated reserves for Julcani as of December 31, 2016 were when the ore contained iron sulfide (Pyrite) higher than 8% and the quality of water used in the processing plant. |
| (6) | The metallurgical recovery factors that impacted the calculated reserves for Mallay as of December 31, 2016 were the high variation in ore grade and the variation in the hardness of the host rocks. |
| (7) | The metallurgical recovery factors that impacted the calculated reserves for Tambomayo as of December 31, 2016 were the complex process to treat polymetallic ore and the variation in the hardness of the host rocks. |
| (8) | The reserves shown for La Zanja, in which we owned a 53.06% of equity interest as of December 31, 2016, are the total reserves of the mine and do not indicate our equity share. They were calculated using the following metal prices: US$1,250 per ounce of gold and US$19 per ounce of silver. The metallurgical recovery factors that impacted the calculated reserves were when the clay content in ore being higher than 10% and the copper presence in the ore. |
| (9) | The reserves shown for Tantahuatay, in which we own a 40.10% of equity interest as of December 31, 2016, are the total reserves for the mine and do not indicate our equity share. They were calculated using the following prices: US$1,250 per ounce of gold and US$19 per ounce of silver. The metallurgical recovery factors that impacted the calculated reserves were when the clay content in ore being higher than 10% and the iron sulfide (Pyrite) content in ore being higher than 3%. |
| (10) | El Brocal, in which we own a 61.32% controlling equity interest as of December 31, 2016, owns the Colquijirca and Marcapunta mines. The reserves shown for Colquijirca and Marcapunta are the total reserves of the mines and do not indicate our shareholdings. |
| (11) | The metallurgical recovery factors that impacted the calculated reserves for Colquijirca as of December 31, 2016 were the high content of clay and soluble salts in the ore. |
| (12) | The metallurgical recovery factors that impacted the calculated reserves for Marcapunta as of December 31, 2015 were the high content of arsenic in the ore and the hardness of the host rocks. |
| 57 |
Yanacocha’s Properties
Operating Properties
For operating data (including ore mined, average gold grade of ore mined and gold production) for each of Yanacocha’s operating properties and a description of how ore is processed and the source of electricity and water for each of Yanacocha’s operating properties, see “—Yanacocha— B. Business Overview—Description of Yanacocha’s Operations.”
Maqui Maqui
Maqui Maqui is a 75-hectare gold deposit with a leach pad covering 67 hectares, located five kilometers northeast of the Carachugo pit. Mining operations at Maqui Maqui began in October 1994 and used the open-pit mining method. Although mining operations at Maqui Maqui ceased in September 2000, gold recovery from the leach pad continues. The Maqui Maqui East expansion commenced operations in 2010 and mining at this deposit was completed in July 2016.
Cerro Yanacocha
Cerro Yanacocha is a 247-hectare gold deposit (ultimate pit) with a leach pad covering approximately 310 hectares. The Cerro Yanacocha pit is located two kilometers northwest of the Carachugo pit. Operations began in the fourth quarter of 1997 using the open-pit mining method. Cerro Yanacocha includes a carbon column gold recovery plant and a Merrill-Crowe-type ore processing facility. Cerro Yanacocha temporarily ceased operations in October 2010 and restarted operations in 2015 with mining in the layback area and the deep transitional stockpiles located inside the current open pit. Mining activities are scheduled to cease by 2019.
La Quinua
La Quinua is a 450-hectare gold deposit (ultimate pit) with a leach pad covering 426 hectares. The La Quinua, El Tapado and El Tapado Oeste pits are located three kilometers southwest of the Cerro Yanacocha pit. Operations began in the fourth quarter of 2001 using the open-pit mining method. All solution processing occurs at the Cerro Yanacocha plant following treatment at the La Quinua leach pad and carbon column facility. The La Quinua pit ceased operations at the end of 2010 and the El Tapado pit ceased operations in July 2012.
The La Quinua mining operation included Cerro Negro Este, a 15-hectare gold deposit (ultimate pit) which is located six kilometers southwest of the La Quinua pit. Cerro Negro Este utilized the La Quinua leach pad. Operations began in April 2004 using the open-pit mining method and all solution processing occurred at the Cerro Yanacocha plant following treatment at the La Quinua leach pad and carbon column facility. Mining operations at Cerro Negro Este ceased in March 2005.
Mining operations in Tapado Oeste were completed at the end of 2015. The Tapado Oeste layback began mining operations on January 2015. Mining activities are scheduled to cease by 2019.
Western Oxides
The Western Oxides are composed of the Cerro Negro Oeste and La Quinua Sur open-pit mines. Cerro Negro Oeste, a 40-hectare gold deposit, is located 6.5 kilometers southwest of the La Quinua pit. This pit utilizes the La Quinua leach pad as its ore facility. La Quinua Sur, a 110-hectare gold deposit, is located south of the Tapado Oeste pit and is completely covered by La Quinua gravel. Mining activities started in Cerro Negro West in August 2011 and mining at this deposit was completed in August 2016. La Quinua Sur commenced mining activities in July 2014 and is scheduled to cease operations in 2019. The ore mined from this pit will be processed at the La Quinua leach pad expansion.
Eastern Oxides
The Eastern Oxides consist of the Marleny open-pit mine. The Marleny pit, an 8-hectare deposit, is located to the west of the Carachugo backfill. Marleny started mining operations in May 2013 and ceased operations in April 2014. Mining was restarted to deepen the current pit in February 2016 and was completed in June 2016.
| 58 |
China Linda
Yanacocha owns and operates the China Linda lime plant, which is located in Cajamarca, 12 kilometers to the northeast of the Yanacocha installations. Access to the plant from Yanacocha is by a ten-kilometer private, unpaved road. Lime is used in the gold and silver mining process to regulate the alkalinity of the cyanide solutions in the leaching process and for pH control in water treatment applications. Currently, the plant has a production capacity of 78,000 tons of lime per year.
Reserves
Proven and probable reserves are based on extensive drilling, sampling, mine modeling and metallurgical testing from which economic feasibility is determined. Under the Management Contract, Newmont Mining, in conjunction with Yanacocha, calculates Yanacocha’s reserves by methods generally applied within the mining industry and in accordance with SEC Industry Guide 7. Reserves represent estimated quantities of proven and probable ore that under present and anticipated conditions may be economically mined and processed.
The following table lists proven and probable reserves and the average grade of ore as of December 31, 2016 for Yanacocha. Calculations with respect to the estimates of proven and probable reserves are based on a gold price of US$1,200 per ounce and a silver price of US$17 per pound as of December 31, 2016. The proven and probable reserves presented below represent the total quantity of ore to be extracted from the deposits, allowing for mining efficiencies and ore dilution. Ounces of gold in the districts of Yanacocha’s proven and probable reserves are calculated before any losses during metallurgical treatment.
| Proven and Probable Reserves at December 31, 2016 ǂ | ||||||||||||
|
Tonnage
(thousands of DST) |
Average Gold Grade
(oz./DST) |
Ounces Contained
(thousands of ounces) |
||||||||||
| Quecher Main | 98,872 | 0.02 | 1,513 | |||||||||
| Marleny | 2,976 | 0.02 | 70 | |||||||||
| Yanacocha | 11,829 | 0.01 | 146 | |||||||||
| Yanacocha Layback | 2,016 | 0.07 | 135 | |||||||||
| La Quinua Sur | 22,882 | 0.01 | 316 | |||||||||
| Tapado Oeste Layback | 31,659 | 0.01 | 460 | |||||||||
| Cerro Negro | 23,064 | 0.04 | 886 | |||||||||
| Transition Stockpile | 5,231 | 0.03 | 143 | |||||||||
| Deep Transitional Stockpile | 5,441 | 0.06 | 325 | |||||||||
| Gold Mill Stockpile | 636 | 0.05 | 34 | |||||||||
| Maqui Maqui Leach Pad | 184 | 0.04 | 8 | |||||||||
| Carachugo Leach Pad | 168 | 0.02 | 4 | |||||||||
| Yanacocha Leach Pad | 231 | 0.03 | 6 | |||||||||
| La Quinua Leach Pad | 16,137 | 0.02 | 312 | |||||||||
| Total | 221,326 | 0.02 | 4,358 | |||||||||
| ǂ | Proven and probable reserves, as of December 31, 2016, were calculated using a gold price assumption of US$1,200 per ounce. |
As of December 31, 2016, Yanacocha’s total proven and probable reserves (excluding the Conga project, the reserves for which were reclassified as resources or NRM as of December 31, 2015) were estimated to be 4.4 million ounces of gold, representing a 14% decrease over Yanacocha’s total proven and probable reserves as of December 31, 2015, which were estimated to be 5.06 million ounces of gold.
Based on the current recovery rate and estimated gold production levels in 2016, most of Yanacocha’s proven and probable reserves as of December 31, 2016 will be depleted by 2025 unless Yanacocha continues adding reserves to the production plan. Yanacocha’s management believes that its prospective land positions and mining concessions provide it with potential for future exploration and additions to its reserves.
| ITEM 4A. | Unresolved Staff Comments |
None.
| 59 |
| ITEM 5. | Operating and Financial Review and Prospects |
In this Item 5, we present information first with respect to Buenaventura, followed by information with respect to Yanacocha, in which we have a 43.65% partnership interest, followed by information with respect to Cerro Verde, in which we have a 19.58% equity interest.
BUENAVENTURA
Introduction
The following discussion should be read in conjunction with the Financial Statements as of December 31, 2015 and 2016 and for the years ended December 31, 2014, 2015 and 2016 and the related notes thereto included elsewhere in this Annual Report. The Financial Statements are prepared and presented in accordance with IFRS as issued by the IASB. We present our financial statements in U.S. Dollars.
| A. | Operating Results |
General
Overview. We were established in 1953 and are one of Peru’s leading producers of gold, silver and other metals. Our consolidated financial statements comprise all of our accounts and those of our subsidiaries, which include:
| · | the Julcani, Mallay, Uchucchacua and Orcopampa mining units; |
| · | the Colquijirca, Marcapunta and La Zanja mines, which are owned by our non-wholly-owned consolidated subsidiaries; |
| · | Chaupiloma, which receives a royalty payment from Yanacocha; |
| · | Condesa, which is mainly a holding company for internal investments and investments in Yanacocha and other affiliated mining companies; |
| · | Conenhua, which is mainly engaged in the transmission of electric power to Yanacocha and other mining companies; |
| · | other minor subsidiaries; and |
| · | discontinued operations. |
We also have material equity investments in (i) Yanacocha, which is an equity investee engaged in the exploitation and commercialization of gold, (ii) Cerro Verde, which is an equity investee engaged in the exploitation and commercialization of copper and (iii) Coimolache, which is an equity investee engaged in the exploitation and commercialization of gold and silver. We account for these investments under the equity method.
Yanacocha. Historically, a substantial part of our net loss before income tax was derived from our equity interest in Yanacocha. We have a 43.65% equity participation in Yanacocha, which is held through our wholly-owned subsidiary, Condesa. Our partnership interest in Yanacocha is accounted for under the equity method and is included under the caption “Investment in associates” on our consolidated statements of financial position. Although Yanacocha has no fixed dividend policy, there is an understanding among the partners that the net income not required for sustaining capital expenditures or future development projects should be distributed after agreement between the two major shareholders, Newmont Mining and Buenaventura.
Cerro Verde. As of December 31, 2016, we had a 19.58% equity participation in Cerro Verde, which allows us to exercise significant influence over this company. As a result, we account for our investment in Cerro Verde using the equity method. Although Cerro Verde has no fixed dividend policy, there is an understanding that earnings not required for capital expenditures or future development projects are expected to be distributed.
| 60 |
Results of operations. The primary factors affecting our results of operations are:
| · | the amount of gold, silver, zinc and copper produced and sold; |
| · | prevailing world market prices for gold, silver, zinc and copper; |
| · | commercial terms with respect to the sale of ore concentrates; and |
| · | our operating expenses. |
Gold and silver price hedging. Our revenues and earnings are strongly influenced by world market prices for gold, silver, zinc and copper that fluctuate widely and over which we have no control. Depending upon the metal markets and other conditions, we may from time to time hedge our gold and silver sales to decrease our exposure to fluctuations in the prices of these metals. We and our wholly-owned subsidiaries are currently completely unhedged as to the price at which our gold and silver will be sold. As a result, we are fully exposed to the effects of changes in prevailing market prices of gold and silver.
In the case of El Brocal, it had outstanding hedging commitments amounting to 16,107 metric tons of copper at an average fixed price of US$5,395 per ton from January to December 2017.
Operating costs and expenses. Operating costs and expenses consist of:
| · | operating costs, which are direct production costs, the major component of operating expenses; |
| · | exploration costs in operational mining sites; |
| · | depreciation and amortization expenses; |
| · | exploration costs in non-operational mining areas; |
| · | administrative expenses, which principally consist of personnel expenses; |
| · | royalties, which consist of payments to third parties and the Peruvian government to operate leased mining rights; and |
| · | selling expenses, which principally consist of freight expenses. |
Reserves. We utilize geological mapping, projection of ore-bearing structures, diamond drilling, core logging and chemical assaying, in addition to drifting along previously indicated mineralization, to replace and grow reserves. In addition, we use metallurgical test-work of core and bulk samples as a follow-up activity to prove the amenability of any previously indicated mineralization to certain extraction methods available on site. We continuously analyze this information with respect to tonnage, precious-metals average grades, metallurgical recoveries and economic value and allocate funds preferentially to those projects that have the best potential to sustain or enhance profitable mine production in the near-term. Our mining operations are primarily conducted underground and consist of deposits that are difficult to explore and measure in advance of mining and in which the value or prospects for ore based on geologic evidence exceeds the value based on proved reserves throughout most of the life of mines supported by them, or extramensurate deposits.
In addition, underground mine infrastructure, such as declines, shafts and/or dewatering/ore haulage crosscuts, that facilitate access to ore reserves are constructed and categorized as mine development. We consider such underground mine infrastructure vital to assure sustainable mine production and reserve production. The design, construction and implementation of our underground mine infrastructure are presented and supervised by our Operations Manager with the Board of Directors’ (the “Board”) approval. We capitalize mine development and mineral land costs incurred after we have identified proven and probable reserves. Upon commencement of production, we amortize these costs over the expected life of the mining area, based on proven and probable reserves and other factors.
| 61 |
Our other mining operations are smaller and have variable fluctuations in production and reserves due to complexities of the ore located in certain mining operations (such as the Colquijirca mine); the sale of certain mining operations; partial and temporary closures of mining operations; and the production of silver only as by-product of gold (such as the Orcopampa mine).
Net income and net distributable income. Under Peruvian law, each company is required to establish a legal reserve equal to at least 20% of its paid-in capital on an unconsolidated basis. An annual contribution of at least 10% of net income must be made until such legal reserve equals 20% of paid-in capital. The legal reserve may offset losses or be capitalized. However, following any instance in which the reserve is used, Peruvian law calls for mandatory replenishment of the reserve.
Royalties. Royalty expenses consist mainly of payments made by us pursuant to lease agreements relating to mining rights for the Orcopampa mine. Specifically, we pay the lessor a royalty of 10% of the value of the concentrates produced. We are also required to pay the Peruvian government mining royalties and taxes. In addition to mining royalties, pursuant to Law No. 29789, effective October 1, 2011, mining operations in Peru are subject to an extraordinary mining tax. See “Item 4. Information on the Company—Buenaventura—B. Business Overview—Regulatory Framework—Mining Royalties and Taxes.”
Environmental protection laws and related regulations. Our business is subject to Peruvian laws and regulations relating to the exploration and mining of mineral properties, as well as the possible effects of such activities on the environment. We conduct our operations substantially in accordance with such laws and regulations.
Discontinued operations. In 2014, we publicly announced our decision to sell four of our mining units: Poracota, Recuperada, Antapite and Shila-Paula. As a consequence, these mining units are presented in the Financial Statements as mining units held for sale. According to IFRS 5 “Non-current Assets Held for Sale and Discontinued Operations,” the related assets and liabilities were presented in the consolidated statement of financial position at the lower of cost and fair value less cost to sale. During 2016, we decided to change the classification of three mining units (Poracota, Recuperada and Shila-Paula) from mining units held for sale and began the final closing process for these mines. In December 2016, we sold the Antapite mining unit. In 2016, we started the final closing process for the Breapampa mining unit. As a result, income, costs and expenses related to this mining unit were classified as discontinued operations for the years 2016, 2015 and 2014. In January 2017, the Breapampa mining unit was sold. See Note 1(e) and Note 2.4(w) to the Financial Statements.
Critical Accounting Policies and Estimates
The following is a discussion of our application of critical accounting policies that require our management, or Management, to make certain assumptions about matters that are highly uncertain at the time the accounting estimate is made, and where different estimates that Management reasonably could have used in the current period, or changes in the accounting estimate that are reasonably likely to occur from period to period, would have a material impact on our financial statements. Management has identified the following accounting estimates and policies as critical:
| · | mineral reserves and resources; |
| · | unit-of-production depreciation; |
| · | mine rehabilitation provision; |
| · | inventories; |
| · | impairment of non-financial assets; |
| · | taxes; |
| · | fair value of contingent consideration; and |
| 62 |
| · | segment reporting. |
Other significant accounting policies include:
| · | contingencies; |
| · | development start date; |
| · | production start date; and |
| · | useful life of property, plant and equipment. |
We also have certain accounting policies that we consider to be important, such as our policies for investments carried at fair value, revenue recognition and exploration costs, that do not meet the definition of critical accounting estimates as they do not require Management to make estimates or judgments that are subjective or highly uncertain.
Management has discussed the development and selection of our critical accounting estimates with the Audit Committee of the Board.
Mineral reserves and resources
Recoverable proven and probable reserves are the part of a mineral deposit that can be economically and legally extracted or produced at the time of the reserve determination. The determination of reserves involves numerous uncertainties with respect to the ultimate geology of the ore bodies, including quantities, grades and recovery rates. Estimating the quantity and grade of reserves requires us to determine the size, shape and depth of our ore bodies by analyzing geological data, such as samplings of drill holes, tunnels and other underground workings. In addition to the geology of our mines, assumptions are required to determine the economic feasibility of mining these reserves, including estimates of future commodity prices and demand, the mining methods we use and the related costs incurred to develop and mine our reserves. The conceptual framework used to estimate proven and probable reserves for our wholly-owned mines as of December 31, 2014 and 2015 was reviewed by independent consultant Geomineria S.A.C. For 2016, Geominería S.A.C. audited the process used to estimate proven and probable ore reserves for Orcopampa, Uchucchacua, Julcani and Mallay, and Hatch Asociados S.A., an independent consultant, audited the process used to estimate proven and probable ore reserves for Tambomayo as of December 31, 2016. The conceptual framework used to estimate proven and probable reserves for El Brocal’s mines as of December 31, 2014 and 2015 was reviewed by independent consultant MINTEC Inc. The conceptual framework used to estimate proven and probable reserves for El Brocal’s mines as of December 31, 2016 was reviewed by consultant Buenaventura Ingenieros S.A.
Changes in estimated reserves could affect mainly the depreciation of fixed assets related directly to mining activity, the provision for mine closure, the assessment of the deferred asset’s recoverability and the amortization period for development costs.
Unit-of-production depreciation
Reserves and resources are used in determining the depreciation and amortization of mine-specific assets. This results in a depreciation or amortization charge proportional to the depletion of the anticipated remaining life of mine production. Each mine’s life is assessed annually to evaluate: (i) physical life limitations and (ii) present assessments of economically recoverable reserves of the mine property. These calculations require the use of estimates and assumptions, including the amount of recoverable reserves. Changes are recorded prospectively.
This results in a depreciation or amortization charge proportional to the depletion of the anticipated remaining life-of-mine production. The life of each item, which is assessed at least annually, is determined based on both its physical life limitations and present assessments of economically recoverable reserves of the mine property where the asset is located. These calculations require the use of estimates and assumptions, including the amount of recoverable reserves. Changes in estimates are accounted for prospectively.
| 63 |
Mine rehabilitation provision
We record a provision for mine closure when a legally enforceable obligation arises, which is independent of the full depletion of the mine reserves. Once such an obligation has been appropriately measured, it is recorded by creating a liability equal to the amount of the obligation and recording a corresponding increase to the carrying amount of the related long-lived asset (mine development cost and property, plant and equipment). Over time, the amount of the obligation changes, impacting recording and accretion expenses. Additionally, the capitalized cost is depreciated and/or amortized based on the useful lives of the related assets.
Any difference in the settlement of the liability will be recorded in the results of the period in which such settlement occurs. The changes in the fair value of an obligation or the useful life of the related assets that occur from the revision of the initial estimates should be recorded as an increase or decrease in the book value of each of the obligation and related asset.
Following our accounting treatment, as of December 31, 2016, we have recorded an accrual for mine closure costs of US$206.46 million to comply with governmental requirements for environmental remediation for Buenaventura and its mining subsidiaries. Please see Note 16(a) to the Consolidated Financial Statements.
We assess our provision for closure of mining units annually. This assessment entails significant estimates and assumptions because there are a number of factors that will affect the ultimate liability for this obligation. These factors include estimating the scope and costs of closing activities, technological changes, regulatory changes, increases in costs compared to inflation rates and changes in the discount rates. Such estimates or assumptions may result in actual expenses in the future that differ from the amounts provisioned at the time the provisions were established. The provision at the date of this report represents our best estimate of the present value of future costs for the closure of mining units.
Inventories
Inventories are classified as short-term or long-term depending on the length of time that management estimates will be needed to reach the production state of concentrate extraction for each mining unit.
Net realizable value tests are performed at least annually and represent the estimated future sales price of the product based on prevailing spot metals prices at the reporting date, less estimated costs to complete production and bring the product to sale. Additionally, management also considers the time value of money in calculating the net realizable value of our long-term inventories.
Classified minerals, which are materials with metal content that were removed from the pit of the Colquijirca mining unit for treatment at the expansion operation plant, contain lower grade ore than the average of treated minerals and are available to continue in the process of recovery of mineral and concentrates. Because it is generally impracticable to determine the mineral contained in the classified mineral located in the deposit field near Tajo Norte by physical count, reasonable estimation methods are employed. The quantity of minerals delivered to classified mineral is based on surveyed volumes of mined material and daily production records. Sampling and assaying of blasthole cuttings determine the estimated copper, lead and zinc grades of material delivered to classified minerals.
For minerals outside leach platform inventories, finished and in-progress goods are measured by estimating the number of tons added and removed. The number of contained gold ounces is based on assay data, and the estimated recovery percentage is based on the expected processing method. Tonnages and ounces of mineral are verified by periodic surveys.
For minerals inside leach platform inventories, reasonable estimation methods are employed because it is generally impracticable to determine the mineral contained in leach platforms by physical count. The quantity of material delivered to leach platforms are based on surveyed volumes of mined material and daily production records. Sampling and assaying of blasthole cuttings determine the estimated ore grades of material delivered to leach platforms.
| 64 |
Impairment of non-financial assets
We determine whether the operations of each mining unit are cash generating units, considering each mining unit operation independently. We assess at each reporting date whether there is an indication that an asset may be impaired. If any such indication exists, we estimate the asset’s recoverable amount. An asset’s recoverable amount is the higher of the asset’s fair value less costs to sell and its use value and is determined for an individual asset (cash-generating unit) unless the asset does not generate cash inflows that are clearly independent of those from other assets or groups of assets. These assessments require the use of estimates and assumptions such as long-term commodity prices, discount rates, operating costs and others.
A cash-generating unit is the smallest identifiable group of assets that generates cash inflows from continuing use that are independent of the cash inflow generated by other assets or groups of assets.
In assessing use value, the estimated future cash flows are discounted to their present value using a pre-tax discount rate that reflects current market assessments of the time value of money and the risks specific to the asset.
At each reporting date, we update our assessment of the recoverability of the book value of our long-term assets under the procedures established by IAS 36 – “Impairment of Assets” for all of our mining units. As a result, we recorded impairment losses during 2014, 2015 and 2016.
In 2014, we recorded an impairment loss for one of our mining units (Shila-Paula) of US$0.8 million (recognized as operating expense).
In 2015, we recorded impairment losses for two of our mining units (La Zanja and Breapampa) of US$11.2 million (recognized as an operating expense).
In 2016, we recorded an impairment loss for one of our mining units (Shila-Paula) of US$2.0 million (recognized as an operating expense).
These impairment charges had no impact on our operating cash flows. Cash flows used to assess recoverability of our long-lived assets and measure the carrying value of our mining operations were derived from current business plans using near-term price forecasts reflecting of the current environment and Management’s projections for long-term average metal prices and operating costs.
Our asset impairment evaluations required us to make several assumptions in the discounted cash flow valuation of (i) our individual mining operations, including near and long-term metal price assumptions, production volumes, estimates of commodity-based and other input costs and (ii) proven and probable reserve estimates, including any costs to develop the reserves and the timing of producing the reserves, as well as the appropriate discount rate. Our December 31, 2014, 2015 and 2016, impairment evaluation was based on price assumptions reflecting prevailing metals prices for the following years.
We believe events that could result in additional impairment of our long-lived assets include, but are not limited to, (i) decreases in future metal prices, (ii) decreases in estimated recoverable proven and probable reserves and (iii) any event that might otherwise have a material effect on mine site production levels or costs
Deferred income tax asset and recoverability
In preparing our annual consolidated financial statements, we estimate the actual amount of taxes currently payable or receivable as well as deferred tax assets and liabilities attributable to temporary differences between the tax and book bases of assets and liabilities. Deferred income tax assets and liabilities are measured using tax rates applicable to taxable income in the years in which these temporary differences are expected to be recovered or settled. The effect on deferred tax assets and liabilities of a change in tax rates and laws is recognized in income in the period in which such changes are enacted.
All deductible temporary differences and loss carry-forwards generate the recognition of deferred assets to the extent that it is probable that they can be used in calculating taxable income in future years. Deferred income tax liability is recognized for all deductible temporary differences and tax loss carry-forwards, to the extent that it is probable that taxable profit will be available against which the deductible temporary differences and unused tax losses can be utilized. The carrying amount of the deferred income tax asset is reviewed at each consolidated statement of financial position date and reduced to the extent that it is no longer probable that sufficient taxable profit will be available to allow all or part of the deferred asset to be utilized. Unrecognized deferred assets are reassessed at each consolidated statement of financial position date.
| 65 |
Deferred assets and liabilities are offset if there is a legal right to set them off and the taxes deferred relate to the same entity and the same tax authority.
Deferred tax assets, including those resulting from unused tax losses, require that we assess the likelihood that we would generate taxable earnings in future periods to apply the deferred tax assets. Estimated future taxable income is based on projections of cash flow from operations and application of the tax law existing in each jurisdiction. To the extent to which actual future cash flows and taxable income differ significantly from those estimated, our ability to realize the deferred tax assets posted as of the reporting date may be affected.
In addition, future changes in the tax law in jurisdictions where we operate could limit our ability to obtain tax deductions in future periods.
As of December 31, 2014, 2015 and 2016, our valuation allowance totaled US$4.2 million, US$18.2 million and US$37.0, respectively.
Fair Value of contingent consideration
The contingent consideration arising from a business combination is measured at fair value at the date of acquisition, as part of the business combination. If the contingent consideration is eligible to be recognized as a financial liability the fair value is subsequently re-measured at each date of the consolidated financial statements. Determining the fair value of the contingent consideration is based on a model of discounted future cash flows. The key assumptions take into account the likelihood of achieving each goal of financial performance as well as the discount factor.
Segment Reporting
Management has determined its operating segments based on reports that the Company’s Chief Operating Decision Maker (the “CODM”) uses for making decisions. The Company’s operations are organized into business units based on its products and services, activities and geographic locations. The broad categories of the Company’s business units are:
| · | Production and sale of minerals; |
| · | Exploration and development activities; |
| · | Construction and engineering services; |
| · | Energy generation and transmission services; |
| · | Insurance brokerage; |
| · | Rental of mining concessions; |
| · | Holding of investment in shares (mainly in Yanacocha); and |
| · | Industrial activities. |
The CODM monitors the operating results of the business units separately for the purpose of making decisions about resource allocation and performance assessment. Segment performance is evaluated based on operating profit or loss and is measured consistently with operating profit or loss in the Company’s consolidated financial statements. Also, the Company’s financing and income taxes are managed at the corporate level and are not allocated to the operating segments, except for those entities which are managed independently. See Note 31 to the Financial Statements.
| 66 |
Contingencies
Contingent liabilities, when identified, are assessed as either remote, possible or probable. Contingent liabilities are recorded in the consolidated financial statements when it is probable that future events will confirm them and when their amount can be reasonably estimated. Contingent liabilities deemed as possible are only disclosed, together with a possible debit range, when determinable, in notes to the Financial Statements.
Contingent assets are not recognized in the financial statements; however, they may be disclosed in notes to the financial statements if it is probable that such contingent assets will be realized. See Note 29(f) and (g) to the Financial Statements.
Determining contingencies inherently involves the exercise of judgment and calculation of the estimated outcomes of future events.
Development start date
We assess the status of each exploration project of our mining units to determine when the development phase begins. One of the criteria used to evaluate the development start date is when we determine that the property can be economically developed.
Production start date
We assess the stage of each mine under development to determine when a mine moves into the production stage. The criteria used to assess the start date are determined based on the nature of each mining project, the complexity of a plant and its location. We consider various relevant criteria for assessing when the mine is substantially complete and ready for its planned use. Some of these criteria are the level of capital expenditure compared to development cost estimates, a reasonable testing period for the mine’s plant and equipment and the ability to produce ongoing production of metal.
When a mine development project moves into the production stage, the capitalization of certain costs ceases, and they are considered as inventory or expenses, except for costs that qualify for capitalization relating to mining asset additions or improvements, underground mine development or mineable reserve development. It is also at this point that depreciation or amortization commences.
Useful life of property, plant and equipment
Straight-line method
Depreciation is calculated under the straight-line method of accounting considering the lower of estimated useful lives of the asset or estimated reserves of the mining unit. The useful lives are the following:
|
Property, Plant and Equipment |
Estimated Years of Useful Life |
|
| Buildings, constructions and other | Between 6 and 20 | |
| Machinery and equipment | Between 5 and 10 | |
| Transportation units | 5 | |
| Furniture and fixtures | 10 | |
| Computer equipment | 4 |
An item of property, plant and equipment is de-recognized upon disposal or when no future economic benefits are expected from its use or disposal. Any gain or loss arising from de-recognizing an asset (calculated as the difference between the proceeds from the sale and the book value of the asset) is included in the consolidated statement of profit or loss in the year the asset is de-recognized.
Revenues
According to our accounting policies, revenue is recognized to the extent that it is probable that the economic benefits will flow to us. Revenue is measured at the fair value of the consideration received, excluding discounts and other sales taxes or duty.
| 67 |
Revenues from sales of concentrates, gold and silver are recognized when the significant risks and rewards of ownership have been transferred, which is considered to occur when title passes to the customer. This generally occurs when the product is physically transferred to the buyer.
Revenues for engineering services rendered by BISA are recognized based on the progress of the current service contracts.
Revenues for construction services rendered by BISA Construction S.A. until 2015 were recognized when the outcome of a contract can be estimated reliably. Contract revenue associated with a construction contract were recognized by reference to the stage of completion of the contract activity at the end of the reporting period.
Fair value of embedded derivative for concentrate sales
Substantially all of our concentrate sales contracts provide final pricing in a specified period (generally one to four months from the shipment date) based on quoted LME prices. We ultimately receive market prices based on prices in the specified future period, however, the accounting rules applied to these sales result in changes recorded as revenue until the specified future period. We record revenues and invoice customers at the time of shipment based on current LME prices, which result in an embedded derivative on our provisional priced concentrate sales that are adjusted to fair value through earnings of each period until the date of final pricing. To the extent final prices are higher or lower than what was recorded on a provisional basis, an increase or decrease to revenues is recorded in each reporting period until the date of final pricing. See Note 21(a) and Note 32(b) to the Financial Statements.
Results of Operations for the Years Ended December 31, 2016 and 2015
Net sales of goods. Net sales of goods increased by 20%, mainly due to the increase in sales of metal, as set forth in the chart below:
| Sales by metal | Year ended December 31, | |||||||||||||||
| 2015 | 2016 | Variation | Variation | |||||||||||||
| (US$ in thousands) | ||||||||||||||||
| Gold (a)… | 419,541 | 440,603 | 21,062 | 5.02 | % | |||||||||||
| Silver (b). | 313,418 | 385,989 | 72,571 | 23.15 | % | |||||||||||
| Lead (c). | 55,445 | 58,690 | 3,245 | 5.85 | % | |||||||||||
| Zinc (d). | 102,110 | 142,425 | 40,315 | 39.48 | % | |||||||||||
| Copper (e). | 131,356 | 224,649 | 93,293 | 71.02 | % | |||||||||||
| Manganese sulfate | 3,649 | 5,982 | 2,333 | 63.94 | % | |||||||||||
| 1,025,519 | 1,258,338 | 232,819 | 22.70 | % | ||||||||||||
| Commercial deductions (f) | (196,145 | ) | (244,414 | ) | 48,269 | 24.61 | % | |||||||||
| Adjustments to prior period liquidations | 7,467 | 4,611 | (2,856 | ) | (38.25 | )% | ||||||||||
| Embedded derivatives from sale of concentrate | (388 | ) | 880 | 1,268 | n.a. | |||||||||||
| Hedge operations | 9,816 | (3,745 | ) | (13,561 | ) | n.a. | ||||||||||
| Total sales by metal | 846,269 | 1,015,670 | 169,401 | 20.02 | % | |||||||||||
| (a) | Gold sales. The increase in gold sales is mainly due to the net effect of an increase in average realized sales prices for gold, partially offset by a decrease in gold sales volume due to a decrease in gold production at the Orcopampa mining unit. |
| (b) | Silver sales . The increase in silver sales is mainly due to an increase in the average realized sales prices for silver and an increase in silver production at our Uchucchacua, Mallay and Julcani mining units. |
| (c) | Lead sales . The increase in lead sales is mainly due to the net effect of an increase in the average realized sales prices, partially offset by a decrease in lead sales volume, mainly due to decreased lead production in our Colqujirca mining unit. |
| (d) | Zinc sales. The increase in zinc sales is mainly due to an increase of average realized sales prices for zinc and an increase in zinc sales volume, mainly due to increased zinc production at our Colquijirca mining unit. |
| 68 |
| (e) | Copper sales. The increase in copper sales is mainly due to an increase in average realized sales prices for copper and an increase in copper sales volume, mainly due to increased copper production at our Colquijirca mining unit. |
(f) Commercial deductions . Net sales of goods figures are obtained by deducting the refinery charges and penalties incurred (a total of US$244.4 million of refinery charges and penalties were incurred in 2016, compared to US$196.2 million incurred in 2015) and revenues from discontinued operations (a total of US$1.1 million revenues provided from mining units held for sales in 2016, compared to US$22.7 million provided in 2015) from the gross sales of all metals sold. See Note 21(a) and Note 1(e) to the Financial Statements.
The following tables reflect the average realized prices and volumes of gold, silver, lead, zinc and copper sold during the years ended December 31, 2015 and 2016, as well as the variation in such average realized prices and volumes recorded for the year ended December 31, 2016 as compared to the year ended December 31, 2015:
| Average Realized Price | Year ended December 31, | |||||||||||
| 2015 | 2016 | Variation | ||||||||||
| Gold (US$/oz.) | 1,151.44 | 1,244.24 | 8.20 | % | ||||||||
| Silver (US$/oz.) | 15.06 | 17.65 | 17.20 | % | ||||||||
| Lead (US$/t) | 1,711.87 | 1,977.53 | 15.52 | % | ||||||||
| Zinc (US$/t) | 1,838.86 | 2,266.85 | 23.27 | % | ||||||||
| Copper (US$/t) | 4,514.93 | 4,918.52 | 8.94 | % | ||||||||
| Volume Sold | Year ended December 31, | |||||||||||
| 2015 | 2016 | Variation* | ||||||||||
| Gold (oz.) | 364,831 | 354,116 | (2.94 | )% | ||||||||
| Silver (oz.) | 20,811,046 | 21,863,019 | (0.05 | )% | ||||||||
| Lead (t) | 32,389 | 29,678 | (8.37 | )% | ||||||||
| Zinc (t) | 55,529 | 62,829 | 13.15 | % | ||||||||
| Copper (t) | 29,094 | 45,674 | 56.99 | % | ||||||||
Net sales of services. Sales of services decreased by 43.3%, from US$50.8 million in 2015 to US$28.8 million in 2016, mainly due to a decrease in sales of services in our construction segment as a result of Bisa Construccion S.A. ceasing operations.
Royalty income . In 2016, royalty income received by our subsidiary Chaupiloma amounted to US$24.3 million, representing a 25% decrease from the US$32.4 million in royalty income received in 2015. This decrease was due to a decrease in the average realized price of gold and a decrease in production at Yanacocha. We hold a 60% interest in Chaupiloma, to which Yanacocha pays a royalty that corresponds to 3% of its net sales.
Total operating costs . Total operating costs decreased by 10.6% due to changes in the following components:
| Operating Costs | Year ended December 31, | |||||||||||||||
| 2015 | 2016 | Variation | Variation | |||||||||||||
| (US$ in thousands) | ||||||||||||||||
| Cost of sales of goods, excluding depreciation and amortization | 513,490 | 497,812 | (15,678 | ) | (3.05 | )% | ||||||||||
| Cost of services, excluding depreciation and amortization (a) | 59,612 | 10,754 | (48,858 | ) | (81.96 | )% | ||||||||||
| Exploration in operating units (b) | 89,699 | 96,149 | 6,450 | 7.19 | % | |||||||||||
| Depreciation and amortization (c) | 232,583 | 192,647 | (39,936 | ) | (17.17 | )% | ||||||||||
| Mining royalties | 27,188 | 27,611 | 423 | 1.56 | % | |||||||||||
| Total operating costs | 922,572 | 824,973 | (97,599 | ) | (10.58 | )% | ||||||||||
| (a) | The decrease in cost of services was mainly due to reduced costs from our construction segment as a result of Bisa Construccion S.A. ceasing operations in the fourth quarter of 2015. |
| 69 |
| (b) | The increase in exploration in operating units was primarily due to an increase of US$3.6 million in the Uchucchacua mining unit and an increase of US$3.4 million in the Orcopampa mining unit from looking for additional mining reserves. See Note 23 to the Consolidated Financial Statements. |
| (c) | The decrease in depreciation and amortization costs was mainly due to: |
| · | lower depreciation and amortization expense incurred in the La Zanja mining unit of US$37.5 million, which decreased from US$105.0 million in 2015 to US$67.5 million in 2016 as a result of the decrease in the reserves during 2015 which caused higher depreciation and amortization expenses during 2015 and, therefore, fewer net assets to be depreciated during 2016; |
| · | higher depreciation and amortization expenses incurred in the Colquijirca mining unit of US$7.9 million, which increased from US$45.7 million in 2015 to US$53.6 million in 2016 as a result of higher assets base due to the expansion project for increasing production; and |
| · | lower depreciation and amortization expenses in the Orcopampa, Julcani and Mallay mining units of US$5.9 million, US$4.6 million and US$4.1 million, respectively, as a result of an increase in the reserves that extended the life of mine of the depreciation and amortization period during 2016. |
Total operating expenses . Operating expenses decreased by 22.42% due to changes in the following components:
| Operating Expenses (Income) | Year ended December 31, | |||||||||||||||
| 2015 | 2016 | Variation | Variation | |||||||||||||
| (US$ in thousands) | ||||||||||||||||
| Administrative expenses (a) | 84,372 | 81,692 | (2,680 | ) | (3.18 | )% | ||||||||||
| Exploration in non-operating areas (b) | 30,610 | 26,589 | (4,021 | ) | (13.14 | )% | ||||||||||
| Selling expenses | 19,365 | 21,733 | 2,368 | 12.23 | % | |||||||||||
| Impairment loss of long-lived assets (c) | 3,803 | - | (3,803 | ) | (100.00 | )% | ||||||||||
| Other, net (d) | 5,735 | (18,392 | ) | (24,127 | ) | N.A. | ||||||||||
| Total operating expenses (income) | 143,885 | 111,622 | (32,263 | ) | (22.42 | )% | ||||||||||
| (a) | The decrease in administrative expenses was mainly due to a decrease of US$7.4 million in the Colquijirca mining unit due to a reduction of costs, partially offset by an increase of US$1.6 million in payments to communities surrounding the Julcani mining unit and an increase of US$2.2 million related to a provision of doubtful accounts in Colquirrumi related to accounts receivable for sales of assets. |
| (b) | The decrease in exploration in non-operating areas is mainly due to decreased expenditures in exploration activities, primarily in the Alejandra project. During 2016, our main exploration efforts were focused on the San Gabriel project, the Tambomayo project and Marcapunta Norte. See Note 26 to the Financial Statements. |
| (c) | During 2016, no impairment loss was recorded. |
| (d) | The variation in other expenses was mainly due to the reversal of contingences in La Zanja, sale of assets in the energy segment and reversal of provision for impairment of inventories during 2016. |
Other income (expense), net. Other income (expense), net increased by 90% from US$203.6 million in 2015 to US$387.4 million in 2016, mainly explained by:
| (a) | Share in the results of associates under equity method . Loss from equity investments in associates increased by 111%, from US$173.4 million in 2015 to US$365.3 million in 2016, primarily due to an increase in net loss from our equity investment in our associate company, Yanacocha, partially offset by an increase in net income from our equity investment in Cerro Verde. |
| 70 |
Net loss from our interest in Yanacocha increased by 132%, from US$196.5 million in 2015 to US$455.6 million in 2016. Net income from our interest in Cerro Verde increased by 928%, from US$6.5 million in 2015 to US$66.8 million in 2016. Finally, net income from our interest in Coimolache increased by 41%, from US$16.6 million in 2015 to US$23.5 million in 2016.
See “Item 5. Operating and Financial Review and Prospects—Yanacocha” and “Item 5. Operating and Financial Review and Prospects—Cerro Verde” for more information.
| (b) | Finance costs. Finance costs increased by 15%, from US$27.6 million in 2015 to US$31.6 million in 2016, primarily due to an increase of US$3.7 million in the fair value of the contingent consideration liability due to higher projected revenues. See Note 5 to the Consolidated Financial Statements. |
| (c) | Finance income. Finance income decreased by 38%, from US$11.0 million in 2015 to US$6.8 million in 2016 due to a decrease of US$6.0 million in the changes in the fair value of the contingent consideration liability, which resulted in a higher provision during 2016 and therefore a higher finance cost (lower provision during 2015). |
| (d) | Gain (loss) from currency exchange difference. During 2016, the currency exchange difference changed from a loss of US$13.7 million to an income of US$2.6 million as a result of the variations detailed in “Item 3.—Key Information—A. Selected Financial Data—Exchange Rates.” |
Income tax . Provision for income tax increased by 262%, from US$14.8 million in 2015 to US$53.5 million in 2016, primarily due to an increase in the provision for income tax at the La Zanja and at the Buenaventura mining units of US$24.0 million and US$19.6 million, respectively, due to those segments showing net losses during 2015.
Non-controlling interest income (loss) . Non-controlling interest income changed from a loss of US$58.3 million in 2015 to a loss of US$4.3 million in 2016, primarily due to an increase in the contribution of profits from the La Zanja and El Brocal units of US$34.8 million and US$21.6 million, respectively. See Note 19(a) to the Financial Statements.
Net loss . As a result of the foregoing, net loss decreased from US$375.5 million in 2015 to US$327.8 million in 2016. Net loss was 40.4% of revenues in 2015 and 30.7% of revenues in 2016.
Results of Operations for the Years Ended December 31, 2016 and 2015 by Segment
We present the operating results for each of our operating segments for the years ended December 31, 2015 and 2016 in more detail in Note 31 to the Financial Statements.
Sales of goods – Mining Segments
The following tables set forth the volumes of gold, silver, lead, zinc and copper sold at each of our principal mining segments during the years ended December 31, 2016 and 2015, as well as the variation in such volumes sold for the year ended December 31, 2016 as compared to the year ended December 31, 2015:
| Mining Segment | Volume Sold for the year ended December 31, 2016 | |||||||||||||||||||
| Gold (oz.) | Silver (oz.) | Lead (t) | Zinc (t) | Copper (t) | ||||||||||||||||
| Julcani | 32 | 3,090,967 | 2,679 | - | 54 | |||||||||||||||
| Mallay | 1,041 | 1,426,986 | 6,775 | 8,728 | - | |||||||||||||||
| Orcopampa | 188,511 | 680,708 | - | - | 48 | |||||||||||||||
| Uchucchacua | 279 | 14,739,128 | 8,349 | 5,295 | - | |||||||||||||||
| La Zanja | 151,189 | 229,055 | - | - | - | |||||||||||||||
| Colquijirca | 13,062 | 1,696,175 | 11,874 | 48,806 | 45,572 | |||||||||||||||
| 71 |
| Mining Segment | Volume Sold for the year ended December 31, 2015 | |||||||||||||||||||
| Gold (oz.) | Silver (oz.) | Lead (t) | Zinc (t) | Copper (t) | ||||||||||||||||
| Julcani | 94 | 3,493,166 | 2,478 | - | 103 | |||||||||||||||
| Mallay | 396 | 1,134,528 | 6,612 | 7,482 | - | |||||||||||||||
| Orcopampa | 214,821 | 555,314 | - | - | - | |||||||||||||||
| Uchucchacua | 38 | 12,666,673 | 6,560 | 4,750 | - | |||||||||||||||
| La Zanja | 142,300 | 324,151 | - | - | - | |||||||||||||||
| Colquijirca | 7,181 | 2,637,215 | 16,739 | 43,297 | 28,991 | |||||||||||||||
| Mining Segment | 2016 vs 2015 Change ()% | |||||||||||||||||||
| Gold (oz.) | Silver (oz.) | Lead (t) | Zinc (t) | Copper (t) | ||||||||||||||||
| Julcani | (66 | )% | (12 | )% | 8 | % | - | (48 | )% | |||||||||||
| Mallay | 163 | % | 26 | % | 2 | % | 17 | % | - | |||||||||||
| Orcopampa | (12 | )% | 23 | % | - | - | (100 | )% | ||||||||||||
| Uchucchacua | 634 | % | 16 | % | 27 | % | 11 | % | - | |||||||||||
| La Zanja | 6 | % | (29 | )% | - | - | - | |||||||||||||
| Colquijirca | 82 | % | (36 | )% | (29 | )% | 13 | % | 57 | % | ||||||||||
The change in sales of goods for the year ended December 31, 2016 as compared to the year ended December 31, 2015 is mainly explained by the changes in volume sold, as presented in the following chart:
| Sales of goods – Mining Segments | Year ended December 31, | |||||||||||||||
| 2015 | 2016 | Variation | Variation | |||||||||||||
| (US$ in thousands) | ||||||||||||||||
| Julcani | 50,254 | 54,666 | 4,412 | 8.78 | % | |||||||||||
| Mallay (a) | 32,018 | 46,741 | 14,723 | 45.98 | % | |||||||||||
| Orcopampa | 254,118 | 244,745 | (9,373 | ) | (3.69 | )% | ||||||||||
| Ucchuchacua (b) | 166,055 | 240,470 | 74,415 | 44.81 | % | |||||||||||
| La Zanja | 161,007 | 178,922 | 17,915 | 11.13 | % | |||||||||||
| Colquijirca (c) | 171,294 | 230,611 | 59,317 | 34.63 | % | |||||||||||
| (a) | Mallay. Net sales of goods increased by US$14.7 million in 2016 as compared to 2015 due to increases in the average realized price and amount of silver sold at that unit. |
| (b) | Uchucchacua. Net sales of goods increased by US$74.4 million in 2016 as compared to 2015 due to a 16% increase in the amount of silver sold and an increase in the average realized silver price. |
| (c) | Colquijirca. Net sales of goods increased by US$59.3 million in 2016 as compared to 2015 due to a 57% increase in the amount of copper sold and an increase in the average realized copper price. |
Sales of services – Other Segments
Sales of services - construction and engineering segment. Net sales for the construction and engineering segment decreased by US$36.1 million in 2016 as compared to 2015 due to a decrease of US$22.0 million from the stoppage of BISA Construcción S.A. operations.
Sales of services - insurance brokerage segment. Net sales for the insurance brokerage segment increased by US$0.7 million in 2016 as compared to 2015 due to an increase in the number of clients in the insurance portfolio due to our strategic associations with smaller brokers.
Sales of services - energy generation and transmission segment . Net sales for the energy and transmission segment increased by US$9.0 million in 2016 as compared to 2015 due to the increase in the demand for energy from our other operating segments.
Total operating expenses – Mining Segments . The change in operating expenses for the year ended December 31, 2016 as compared to the year ended December 31, 2015 is mainly explained by:
| 72 |
| Operating Expenses – Mining Segments | Year ended December 31, | |||||||||||||||
| 2015 | 2016 | Variation | Variation | |||||||||||||
| (US$ in thousands) | ||||||||||||||||
| Julcani | 4,803 | 5,983 | 1,180 | 24.57 | % | |||||||||||
| Mallay | 3,571 | 4,580 | 1,009 | 28.26 | % | |||||||||||
| Orcopampa (a) | 18,731 | 14,121 | (4,610 | ) | (24.61 | )% | ||||||||||
| Ucchuchacua (b) | 12,455 | 15,632 | 3,177 | 25.51 | % | |||||||||||
| La Zanja (c) | 16,902 | 3,300 | (13,602 | ) | (80.48 | )% | ||||||||||
| Colquijirca (d) | 33,260 | 24,115 | (9,145 | ) | (27.50 | )% | ||||||||||
| (a) | Orcopampa . The decrease in total operating expenses was mainly due to a decrease in administrative expenses of US$2.9 million. |
| (b) | Uchucchacua. The increase in total operating expenses was mainly due to an increase in administrative expenses of US$2.5 million. |
| (c) | La Zanja. The decrease in total operating expenses was mainly due to a decrease in exploration in non-operating areas of US$4.3 million, which were partially offset by a decrease in impairment losses of US$3.8 million due to no impairment loss in 2016. |
| (d) | Colquijirca. The decrease in total operating expenses was mainly due to a decrease in administrative expenses of US$7.4 million and a decrease in other expenses (income) net of US$2.4 million. |
Total operating expenses - Other Segments
| Operating expenses – Other Segments | Year ended December 31, | |||||||||||||||
| 2015 | 2016 | Variation | Variation | |||||||||||||
| Construction and engineering segment | (442 | ) | (2,580 | ) | (2,138 | ) | 483.71 | % | ||||||||
| Insurance brokerage segment | (11,300 | ) | (12,245 | ) | (945 | ) | 8.36 | % | ||||||||
| Energy generation and transmission segment (a) | (4,533 | ) | 6,953 | 11,486 | N.A. | |||||||||||
(a) During 2016, the energy segment recorded an income of US$17.0 million related to sales of assets to third parties of US$3 million and intercompany of US$14.0 million.
Results of Operations for the Years Ended December 31, 2015 and 2014
Net sales of goods. Net sales of goods decreased by 11.78%, mainly due to the decrease in sales of metal, as explained by the chart below:
| Sales by metal | Year ended December 31, | |||||||||||||||
| 2014 | 2015 | Variation | Variation | |||||||||||||
| (US$ in thousands) | ||||||||||||||||
| Gold (a) | 449,404 | 419,541 | (29,863 | ) | (6.65 | )% | ||||||||||
| Silver (b) | 348,171 | 313,418 | (34,753 | ) | (9.98 | )% | ||||||||||
| Lead (c) | 39,185 | 55,445 | 16,260 | 41.50 | % | |||||||||||
| Zinc (d) | 46,903 | 102,110 | 55,207 | 117.7 | % | |||||||||||
| Copper (e) | 271,282 | 131,356 | (139,926 | ) | (51.58 | )% | ||||||||||
| Manganese sulfate | 483 | 3,649 | 3,166 | 655.49 | % | |||||||||||
| 1,155,428 | 1,025,519 | (129,909 | ) | (11.24 | )% | |||||||||||
| Commercial deductions (f) | (184,385 | ) | (196,145 | ) | (11,760 | ) | 6.38 | % | ||||||||
| Adjustments to prior period liquidations | (6,073 | ) | 7,467 | 13,540 | n.a | |||||||||||
| Embedded derivatives from sale of concentrate | (9,570 | ) | (388 | ) | 9,182 | (95.95 | )% | |||||||||
| Hedge operations | 3,886 | 9,816 | 5,930 | 152.60 | ||||||||||||
| Total sales by metal | 959,286 | 846,269 | (113,017 | ) | (11.78 | )% | ||||||||||
| (a) | Gold sales. The decrease in gold sales was mainly due to a decrease in average realized sales prices for gold and a decrease in gold sales volume mainly due to decreased gold production at our Orcopampa mining unit. |
| 73 |
| (b) | Silver sales . The decrease in silver sales was mainly due to the combined effect of a decrease in the average realized sales prices for silver and an increase in silver sales volume, mainly due to increased silver production at our Uchucchacua, Colquijirca and Julcani mining units. |
| (c) | Lead sales . The increase in lead sales was mainly due to the combined effect of a decrease in the average realized sales prices for lead and an increase in lead sales volume, mainly due to increased lead production at our Colquijirca mining unit. |
| (d) | Zinc sales . The increase in zinc sales was mainly due to the combined effect of a decrease in average realized sales prices for zinc and an increase in zinc sales volume, mainly due to increased zinc production at our Colquijirca mining unit. |
| (e) | Copper sales. The decrease in copper sales was mainly due to decreased average realized sales prices for copper and a decreased copper sales volume, mainly due to decreased copper production at our Colquijirca mining unit. |
| (f) | Commercial deductions . Net sales of goods figures are obtained by deducting the refinery charges and penalties incurred (a total of US$196.2 million of refinery charges and penalties were incurred in 2015, compared with US$184.4 million incurred in 2014) and revenues from discontinued operations (a total of US$22.7 million revenues provided from mining units held for sales in 2015, compared to US$113.6 million provided in 2014) from the gross sales of all metals sold. See Note 21(a) and 1(e) to the Financial Statements. |
The following tables reflect the average realized prices and volumes of gold, silver, lead, zinc and copper sold during the years ended December 31, 2014 and 2015, as well as the variation in such average realized prices and volumes recorded for the year ended December 31, 2015 as compared to the year ended December 31, 2014:
| Average Realized Price | Year ended December 31, | |||||||||||
| 2014 | 2015 | Variation* | ||||||||||
| Gold (US$/oz.) | 1,262.73 | 1,149.96 | (8.93 | )% | ||||||||
| Silver (US$/oz.) | 18.66 | 15.06 | (19.29 | )% | ||||||||
| Lead (US$/t) | 2,106.87 | 1,711.87 | (18.75 | )% | ||||||||
| Zinc (US$/t) | 2,243.76 | 1,838.86 | (18.05 | )% | ||||||||
| Copper (US$/t) | 6,737.78 | 4,514.93 | (32.99 | )% | ||||||||
| Volume Sold | Year ended December 31, | |||||||||||
| 2014 | 2015 | Variation* | ||||||||||
| Gold (oz.) | 355,899 | 364,831 | 2.51 | % | ||||||||
| Silver (oz.) | 18,661,277 | 20,811,046 | 11.52 | % | ||||||||
| Lead (t) | 18,599 | 32,389 | 74.14 | % | ||||||||
| Zinc (t) | 20,904 | 55,529 | 165.64 | % | ||||||||
| Copper (t) | 40,263 | 29,094 | (27.74 | )% | ||||||||
Sales of services. Sales of services decreased by 28.65%, from US$71.2 million in 2014 to US$50.8 million in 2015, mainly due to a US$18.1 million decrease in sales of services in our construction and engineering segments, a result of a reduction in the number of contracts related to the development and construction of mining projects in 2015.
Royalty income . In 2015, royalty income received by our subsidiary Chaupiloma amounted to US$32.4 million, representing a 12.1% decrease from the US$36.9 million in royalty income received in 2014. This decrease was due to a decrease in 2015 in the net sales of Yanacocha, which was primarily due to a decrease in the average realized price of gold and a decrease in production at Yanacocha. We hold a 60% interest in Chaupiloma, to which Yanacocha pays a royalty that corresponds to 3% of its net sales.
Total operating costs . Total operating costs increased by 5.5%, from US$874.4 million in 2014 to US$922.6 million in 2015, due to changes in the following components:
| 74 |
(a) Cost of sales of goods, excluding depreciation and amortization, increased by 3.0%, from US$498.7 million in 2014 to US$513.5 million in 2015.
(b) Cost of services, excluding depreciation and amortization, decreased by 23.5% from US$77.9 million in 2014 to US$59.6 million in 2015, which was mainly due to costs from our construction and engineering unit decreasing by US$20.4 million as a result of lower net sales and a lower headcount.
(c) Exploration in operating units decreased by 7.9%, from US$97.4 million in 2014 to US$89.7 million in 2015. This decrease was primarily due to a decrease of US$10.1 million in diamond drilling activities at the Orcopampa mining unit, which was partially offset by an increase of US$1.7 million and US$1.3 million at the Julcani mining units, respectively, due to increased exploration efforts. See Note 23 to the Consolidated Financial Statements.
(d) Depreciation and amortization costs increased by 34.45%, from US$173.0 million in 2014 to US$232.6 million in 2015, mainly due to:
| · | higher depreciation and amortization costs incurred in La Zanja mining unit of US$32.2 million, which increased from US$72.8 million in 2014 to US$105.0 million in 2015 as a result of the decrease in the reserves during 2015. |
| · | higher depreciation and amortization costs incurred in the Colquijirca mining unit of US$18.7 million, which increased from US$27.0 million in 2014 to US$45.7 million in 2015 as a result of the capitalization of the expansion project at the beginning of 2015. |
| · | lower depreciation and amortization costs incurred in the Orcopampa and Mallay mining units of US$13.2 million and US$9.3 million, respectively, which decreased from US$55.3 million in 2014 to US$32.7 million in 2015 as a result of changes in the reserves during 2015. |
(e) Mining royalties decreased by 0.9%, from US$27.4 million in 2014 to US$27.2 million in 2015. Royalties paid to third parties by Orcopampa amounted to US$21.7 million and US$21.9 million in 2014 and 2015, respectively. Royalties paid to the Peruvian government amounted to US$5.7 million and US$5.3 million in 2014 and 2015, respectively. The increase in royalties paid to third parties are explained by the higher production in Orcopampa, partially offset by the decrease in the price of gold in 2015. The decrease in royalties paid to Peruvian government was primarily due to the decrease in the price of gold in 2015, compared with 2014.
Total operating expenses . Operating expenses decreased by 8.23%, from US$156.8 million in 2014 to US$143.9 million in 2015, due to changes in the following components:
(a) Administrative expenses decreased by 10.0%, from US$93.7 million in 2014 to US$84.4 million in 2015, mainly due to:
| · | a decrease of US$8.3 million in the construction and engineering unit due to a decrease in the contracts during 2015; |
| · | a decrease of US$3.7 million in the La Zanja mining unit due to a provision for environmental contingencies for US$4.3 million recorded in 2014; and |
(b) Exploration in non-operating areas decreased by 38.8%, from US$50.0 million in 2014 to US$30.6 million in 2015 due to decreased expenditures in exploration activities beginning in 2014, primarily in the Tambomayo and Alejandra projects. See Note 26 to the Financial Statements.
(c) Impairment loss of long-lived assets increased by US$3.8 million as a result of our assessment of the recoverability of the book value of our long-term assets under the procedures established by IAS 36 for two of our mining units (La Zanja).
Operating profit (loss) . As a result of the foregoing, we generated an operating profit of US$36.1 million in 2014 compared to an operating loss of US$136.9 million in 2015.
| 75 |
Other income (expense), net. Other income (expenses), net increased by 680.9% from US$26.1 million in 2014 to US$203.6 million in 2015, mainly explained by:
(a) Share in the results of associates under equity method . Loss from equity investments in associates increased by 132.4%, from US$74.6 million in 2014 to US$173.4 million in 2015, primarily due to an increase in net loss from our equity investment in our associate company, Yanacocha, and a decrease in net income from our equity investment in Cerro Verde.
Net loss from our interest in Yanacocha increased by 12.5%, from US$174.7 million in 2014 to US$196.5 million in 2015. Net income from our interest in Cerro Verde decreased by 91.6%, from US$77.9 million in 2014 to US$6.5 million in 2015. Finally, net income from our interest in Coimolache decreased by 25.3%, from US$22.3 million in 2014 to US$16.6 million in 2015.
(b) Gain on business combination. In 2014, we recognized a gain of US$59.9 million in connection with our acquisition of the controlling interest in Canteras del Hallazgo S.A.C. from Minera Gold Fields Perú S.A. due to the revaluation of the previously held equity interest at fair value as of the acquisition date.
(c) Finance costs. Finance costs increased by 144.5%, from US$11.3 million in 2014 to US$27.6 million in 2015, primarily due to:
| · | an increase of the interests of financial obligations of US$9.9 million and an increase of the interests of bank loans of US$4.8 million; and |
| · | an increase of US$1.6 million in the financial cost related to closing mining units, due to the higher provision recorded in 2015. |
Income tax . Provision for income tax decreased by 77.6%, from US$65.8 million in 2014 to US$14.8 million in 2015, primarily due to a decrease in the provision for income tax at the El Brocal and La Zanja mining units, and at the corporate unit of US$25.7 million, US$18.1 million and US$11.3 million, respectively, due to those segments showing net losses during 2015.
Non-controlling interest income (loss) . Non-controlling interest changed from an income of US$14.4 million in 2014 to a loss of US$58.3 million in 2015, primarily due to a decrease in contribution of profits from the La Zanja and El Brocal units by US$33.2 million and US$38.4 million, respectively. See Note 19(a) to the Financial Statements.
Net loss . As a result of the foregoing, net loss increased from US$61.6 million in 2014 to US$375.5 million in 2015. Net loss was 5.8% of revenues in 2014 and 40.4% of operating income in 2015.
Results of Operations for the Years Ended December 31, 2015 and 2014 by Segment
We present the operating results for each of our operating segments for the years ended December 31, 2014 and 2015 in more detail in Note 31 to the Financial Statements.
Sales of goods -Mining Segments
The following tables set forth the volumes of gold, silver, lead, zinc and copper sold at each of our principal mining segments during the years ended December 31, 2015 and 2014, as well as the variation in such volumes sold for the year ended December 31, 2015 as compared to the year ended December 31, 2014:
| Mining Segment | Volume Sold for the year ended December 31, 2015 | |||||||||||||||||||
| Gold (oz.) | Silver (oz.) | Lead (t) | Zinc (t) | Copper (t) | ||||||||||||||||
| Julcani | 94 | 3,493,166 | 2,478 | - | 103 | |||||||||||||||
| Mallay | 396 | 1,134,528 | 6,612 | 7,482 | - | |||||||||||||||
| Orcopampa | 214,821 | 555,314 | - | - | - | |||||||||||||||
| Uchucchacua | 38 | 12,666,673 | 6,560 | 4,750 | - | |||||||||||||||
| La Zanja | 142,300 | 324,151 | - | - | - | |||||||||||||||
| Colquijirca | 7,181 | 2,637,215 | 16,739 | 43,297 | 28,991 | |||||||||||||||
| 76 |
| Mining Segment | Volume Sold for the year ended December 31, 2014 | |||||||||||||||||||
| Gold (oz.) | Silver (oz.) | Lead (t) | Zinc (t) | Copper (t) | ||||||||||||||||
| Julcani | 12 | 2,851,318 | 2,057 | - | 64 | |||||||||||||||
| Mallay | - | 1,121,202 | 7,253 | 8,609 | - | |||||||||||||||
| Orcopampa | 204,862 | 401,782 | - | - | - | |||||||||||||||
| Uchucchacua | - | 11,940,167 | 6,530 | 4,288 | - | |||||||||||||||
| La Zanja | 143,151 | 418,565 | - | - | - | |||||||||||||||
| Colquijirca | 7,874 | 1,928,243 | 2,759 | 8,007 | 40,198 | |||||||||||||||
| Mining Segment | 2015 vs 2014 Change ()% | |||||||||||||||||||
| Gold (oz.) | Silver (oz.) | Lead (t) | Zinc (t) | Copper (t) | ||||||||||||||||
| Julcani | 683 | % | 23 | % | 20 | % | - | 61 | % | |||||||||||
| Mallay | 100 | % | 1 | % | (9 | )% | (13 | )% | - | |||||||||||
| Orcopampa | 5 | % | 38 | % | - | - | - | |||||||||||||
| Uchucchacua | 100 | % | 6 | % | - | 11 | % | - | ||||||||||||
| La Zanja | (1 | )% | (23 | )% | - | - | - | |||||||||||||
| Colquijirca | (9 | )% | 37 | % | 507 | % | 441 | % | (28 | )% | ||||||||||
The change in sales of goods for the year ended December 31, 2016 as compared to the year ended December 31, 2015 is mainly due to the changes in volume sold, as described by the chart below:
| Sales of goods – Mining Segments | Year ended December 31, | |||||||||||||||
| 2014 | 2015 | Variation | Variation | |||||||||||||
| (US$ in thousands) | ||||||||||||||||
| Julcani | 49,767 | 50,254 | 487 | 0.98 | % | |||||||||||
| Mallay (a) | 42,974 | 32,018 | (10,956 | ) | (25.49 | )% | ||||||||||
| Orcopampa | 264,049 | 254,118 | (9,931 | ) | (3.76 | )% | ||||||||||
| Ucchuchacua (b) | 202,543 | 166,055 | (36,488 | ) | (18.01 | )% | ||||||||||
| La Zanja (c) | 185,286 | 161,007 | (24,279 | ) | (13.10 | )% | ||||||||||
| Colquijirca (d) | 210,002 | 171,294 | (38,708 | ) | (18.43 | )% | ||||||||||
| (a) | Mallay. Net sales of goods decreased by US$11.0 million in 2015 as compared to 2014 due to a decline in the average realized price of silver, partially offset by an increase in the amount of silver sold at that unit. |
| (b) | Uchucchacua. Net sales of goods decreased by US$36.5 million in 2015 as compared to 2014 due to a decline in the average realized prices of lead and silver, partially offset by an increase in the amount of lead and silver sold at that unit. |
| (c) | La Zanja. Net sales of goods decreased by US$24.3 million in 2015 as compared to 2014 due to a decline in gold and silver prices, and a decrease in the volume of silver sold from 418,565 ounces sold in 2014 to 324,151 ounces sold in 2015 and gold sold from 143,151 ounces sold in 2014 to 142,300 ounces sold in 2015. |
| (d) | Colquijirca. Net sales of goods decreased by US$38.7 million in 2015 as compared to 2014 due to a decline in mineral prices, partially offset by an increase in tons of lead and zinc and ounces of silver sold during 2015. |
Sales of services – Other Segments
Sales of services - construction and engineering segment. Net sales for the construction and engineering segment decreased by US$18.1 million in 2015 as compared to 2014 due to a reduction in the development and construction of mining projects.
Sales of services - insurance brokerage segment. Net sales for the insurance brokerage segment increased by US$1.3 million in 2015 as compared to 2014 due to an increase in the number of clients in the insurance portfolio due to our strategic associations with smaller brokers.
| 77 |
Sales of services - energy generation and transmission segment . Net sales for the energy and transmission segment increased by US$9.4 million in 2015 as compared to 2014 due to the increase in the demand of energy from our other operating segments.
Total operating expenses – Mining Segments . The change in operating expenses for the year ended December 31, 2015 as compared to the year ended December 31, 2014 is explained by the chart below:
| Operating Expenses – Mining Segments | Year ended December 31, | |||||||||||||||
| 2014 | 2015 | Variation | Variation | |||||||||||||
| (US$ in thousands) | ||||||||||||||||
| Julcani (a) | 9,017 | 4,803 | (4,214 | ) | (46.73 | )% | ||||||||||
| Mallay | 3,553 | 3,571 | 18 | 0.51 | % | |||||||||||
| Orcopampa (b) | 16,375 | 18,731 | 2,356 | 14.39 | % | |||||||||||
| Ucchuchacua (c) | 14,429 | 12,455 | (1,974 | ) | (13.68 | )% | ||||||||||
| La Zanja (d) | 10,194 | 16,902 | 6,708 | 65.80 | % | |||||||||||
| Colquijirca (e) | 29,596 | 33,260 | 3,664 | 12.38 | % | |||||||||||
| (a) | Julcani. The decrease in operating expenses was due to a decrease in other expenses of US$4.6 million compared to 2014. |
| (b) | Orcopampa . The increase in operating expenses was due to an increase in other income as a result of higher sales to third parties. |
| (c) | Uchucchacua. The decrease in operating expenses was due to a decrease in administrative expenses as compared to 2014, as a result of a cost reduction plan adopted in 2014. |
| (d) | La Zanja. The increase in operating expenses was due to an increase in exploration in non-operating areas of US$8.9 million which were partially offset by an increase an impairment loss by US$3.8 million, each as compared to 2014. |
| (e) | Colquijirca. The increase in operating expenses was due to increases in administrative expenses and selling expenses, which were partially offset by an increase in other expenses-net, each as compared to 2014. |
Total operating expenses - Other Segments
Total operating expenses—construction and engineering segment. During 2015, total operating expenses for the construction and engineering segment decreased by US$7.6 million for the year ended December 31, 2015 as compared to 2014 due to decrease in administrative expenses.
Total operating expenses—insurance brokerage segment. During 2015, total operating expenses for the insurance brokerage segment increased by US$2.5 million as compared to 2014 due to an increase in administrative expenses.
Total operating expenses—energy generation and transmission segment. During 2015, total operating expenses for the energy and transmission segment decreased by US$7.6 million as compared to 2014 due to a decrease of US$8.0 million in other expenses, net.
| B. | Liquidity and Capital Resources |
As of December 31, 2016 and 2015, we had cash and cash equivalents of US$80.5 million and of US$78.5 million, respectively.
Cash provided by operating activities for the years ended December 31 , 2016 and 2015. Net cash and cash equivalents provided by operating activities increased by US$264.1 million, primarily due to the changes shown in the chart below:
| 78 |
| Operating activities cash flows | Year ended December 31, | |||||||||||||||
| 2015 | 2016 | Variation | Variation | |||||||||||||
| (US$ in thousands) | ||||||||||||||||
| Proceeds from sales | 965,273 | 1,003,422 | 38,149 | 3.95 | % | |||||||||||
| Dividends received (a) | 6,691 | 142,340 | 135,649 | 2,027.34 | % | |||||||||||
| Value-added tax recovered | 81,692 | 117,661 | 35,969 | 44.03 | % | |||||||||||
| Royalty received | 38,983 | 25,961 | (13,022 | ) | (33.40 | )% | ||||||||||
| Interest received | 3,650 | 2,140 | (1,510 | ) | (41.37 | )% | ||||||||||
| Payments to suppliers and third parties (b) | (727,017 | ) | (672,419 | ) | 54,598 | (7.51 | )% | |||||||||
| Payments to employees (b) | (175,329 | ) | (138,113 | ) | 37,216 | (21.23 | )% | |||||||||
| Interest paid | (21,518 | ) | (34,138 | ) | (12,620 | ) | 58.65 | % | ||||||||
| Payments of mining royalties | (22,836 | ) | (20,052 | ) | 2,784 | (12.19 | )% | |||||||||
| Income tax paid | (22,330 | ) | (35,401 | ) | (13,071 | ) | 58.54 | % | ||||||||
| Net cash and cash equivalents provided by operating activities | 127,259 | 391,401 | 264,142 | 207.56 | % | |||||||||||
| (a) | The increase in dividends received was mainly due to a distribution to the partners, in proportion to their equity interests, of US$300 million, which correspond to the portion of the retained earnings as of December 31, 2014, that originated in 2011. As a result, we received dividends of US$130.9 million in 2016. |
| (b) | As part of the cost reduction and optimization program, we had lower costs related to suppliers, third parties and employees in 2016. |
Cash provided by operating activities for the years ended December 31 , 2015 and 2014. Net cash and cash equivalents provided by operating activities decreased by US$35.2 million, primarily due to the changes shown in the chart below:
| Operating activities cash flows | Year ended December 31, | |||||||||||||||
| 2014 | 2015 | Variation |
Variation
% |
|||||||||||||
| (US$ in thousands) | ||||||||||||||||
| Proceeds from sales | 1,144,394 | 965,273 | (179,121 | ) | (15.65 | )% | ||||||||||
| Dividends received | 12,938 | 6,691 | (6,247 | ) | (48.28 | )% | ||||||||||
| Value added tax recovered | 39,685 | 81,692 | 42,007 | 105.85 | % | |||||||||||
| Royalty received | 31,252 | 38,983 | 7,731 | 24.74 | % | |||||||||||
| Interest received | 8,333 | 3,650 | (4,683 | ) | (56.20 | )% | ||||||||||
| Payments to suppliers and third parties | (805,413 | ) | (727,017 | ) | 78,396 | (9.73 | )% | |||||||||
| Payments to employees | (203,496 | ) | (175,329 | ) | 28,167 | (13.84 | )% | |||||||||
| Interest paid | (9,405 | ) | (21,518 | ) | (12,113 | ) | 128.79 | % | ||||||||
| Payments of mining royalties | (22,631 | ) | (22,836 | ) | (205 | ) | 0.91 | % | ||||||||
| Income tax paid | (33,161 | ) | (22,330 | ) | 10,831 | (32.66 | )% | |||||||||
| Net cash and cash equivalents provided by operating activities | 162,496 | 127,259 | (35,237 | ) | (21.68 | )% | ||||||||||
Cash used in investing activities for the years ended December 31 , 2016 and 2015. Net cash and cash equivalents used in investing activities increased by US$23.2 million primarily due to the changes shown in the chart below:
| Investing activities cash flows | Year ended December 31, | |||||||||||||||
| 2015 | 2016 | Variation |
Variation
% |
|||||||||||||
| (US$ in thousands) | ||||||||||||||||
| Proceeds from sale of mining concessions, development costs, property, plant and equipment | 5,481 | 7,180 | 1,699 | 31.00 | % | |||||||||||
| Additions to mining concessions, development costs, property, plant and equipment (a) | (211,286 | ) | (366,834 | ) | (155,548 | ) | 73.62 | % | ||||||||
| Loans to associates | (124,800 | ) | - | 124,800 | (100.00 | )% | ||||||||||
| Loans to third parties | (829 | ) | - | 829 | (100.00 | )% | ||||||||||
| Payments for acquisition of other assets | (10,238 | ) | (5,222 | ) | 5,016 | (48.99 | )% | |||||||||
| Net cash and cash equivalents used in investing activities | (341,672 | ) | (364,876 | ) | (23,204 | ) | 6.79 | % | ||||||||
| (a) | The increase in additions to mining concessions, development costs, property, plant and equipment was mainly due to the construction of the Tambomayo mining unit. During 2016, the Company invested US$230.2 million in Tambomayo’s assets as compared to US$77.1 million during 2015. See “Item 4: Information on the Company—Buenaventura—A. History and Development—Capital Expenditures.” |
| 79 |
Cash used in investing activities for the years ended December 31 , 2015 and 2014. Net cash and cash equivalents used in investing activities increased by US$49.0 million primarily due to the changes shown in the chart below:
| Investing activities cash flows | Year ended December 31, | |||||||||||||||
| 2014 | 2015 | Variation |
Variation
% |
|||||||||||||
| (US$ in thousands) | ||||||||||||||||
| Proceeds from collection of loan to an associate | 15,553 | - | (15,553 | ) | (100.00 | )% | ||||||||||
| Proceeds from sale of mining concessions, development costs, property, plant and equipment | 1,681 | 5,481 | 3,800 | 226.06 | % | |||||||||||
| Additions to mining concessions, development costs, property, plant and equipment | (227,564 | ) | (211,286 | ) | 16,278 | (7.15 | )% | |||||||||
| Loans to associates | - | (124,800 | ) | (124,800 | ) | 100.00 | % | |||||||||
| Loans to third parties | - | (829 | ) | (829 | ) | 100.00 | % | |||||||||
| Payments for acquisition of other assets | - | (10,238 | ) | (10,238 | ) | 100.00 | % | |||||||||
| Payments for acquisition of shares in associate, net of cash acquired | (80,316 | ) | - | 80,316 | (100.00 | )% | ||||||||||
| Contributions in associates | (2,012 | ) | - | 2,012 | (100.00 | )% | ||||||||||
| Net cash and cash equivalents used in investing activities | (292,658 | ) | (341,672 | ) | (49,014 | ) | (16.75 | )% | ||||||||
Cash provided by financing activities for the years ended December 31 , 2016 and 2015. Net cash and cash equivalents used in financing activities decreased by US$238.90 million, primarily due to the changes shown in the chart below:
| Financing activities cash flows | Year ended December 31, | |||||||||||||||
| 2015 | 2016 | Variation | Variation | |||||||||||||
| (US$ in thousands) | ||||||||||||||||
| Proceeds from financial obligations | 296 | 275,210 | 274,914 | 92,876.35 | % | |||||||||||
| Proceeds from bank loans | 344,503 | 200,500 | (144,003 | ) | (41.80 | )% | ||||||||||
| Payments of bank loans | (90,000 | ) | (442,957 | ) | (352,957 | ) | 392.17 | % | ||||||||
| Payments of financial obligations | (29,891 | ) | (33,476 | ) | (3,585 | ) | 11.99 | % | ||||||||
| Dividends paid to controlling shareholders | - | (7,621 | ) | (7,621 | ) | 100.00 | % | |||||||||
| Dividends paid to non-controlling shareholders | (10,488 | ) | (7,400 | ) | 3,088 | (29.44 | )% | |||||||||
| Acquisition of non-controlling interest | - | (5,459 | ) | (5,459 | ) | 100.00 | % | |||||||||
| Increase of restricted bank accounts | - | (2,087 | ) | (2,087 | ) | 100.00 | % | |||||||||
| Purchase of treasury shares | - | (1,210 | ) | (1,210 | ) | 100.00 | % | |||||||||
| Net cash and cash equivalents used in financing activities | 214,420 | (24,500 | ) | (238,920 | ) | (111.43 | )% | |||||||||
Cash provided by financing activities for the years ended December 31 , 2015 and 2014. Net cash and cash equivalents provided by financing activities increased by US$57.0 million primarily due to the changes shown in the chart below:
| Financing activities cash flows | Year ended December 31, | |||||||||||||||
| 2014 | 2015 | Variation | Variation | |||||||||||||
| (US$ in thousands) | ||||||||||||||||
| Proceeds from financial obligations | 177,125 | 296 | (176,829 | ) | (99.83 | )% | ||||||||||
| Proceeds from bank loans | 40,000 | 344,503 | 304,503 | 761.26 | % | |||||||||||
| Payments of bank loans | - | (90,000 | ) | (90,000 | ) | 100 | % | |||||||||
| Payments of financial obligations | (42,205 | ) | (29,891 | ) | 12,314 | (29.18 | )% | |||||||||
| Dividends paid to controlling shareholders | (8,642 | ) | - | 8,642 | (100.00 | )% | ||||||||||
| Dividends paid to non-controlling shareholders | (8,880 | ) | (10,488 | ) | (1,608 | ) | 18.11 | % | ||||||||
| Net cash and cash equivalents used in financing activities | 157,398 | 214,420 | 57,022 | 36.23 | % | |||||||||||
| 80 |
Short-Term Debt
We borrow from time to time short-term unsecured loans from local Peruvian banks to supplement our working capital needs at favorable short-term interest rates. As of December 31, 2016 and 2015, the amount outstanding under such short-term loans was US$55.0 million and US$285.3 million, respectively. In 2016, we used the proceeds of such short-term loans for general working capital purposes.
Long-Term Debt
On December 2, 2009 Banco de Crédito del Perú executed a financial lease agreement with Conenhua, Huanza and us in the amount of US$119.0 million for construction of a hydroelectric power station. The lease was executed in favor of Huanza as lessee. The term of the lease is six years from August 2014 and the interest rate is three-month LIBOR plus 4.60%. On June 30, 2014, Banco de Crédito del Perú extended this financial lease agreement with Conenhua, Huanza and us in the amount of US$103.4 million. The term of the lease is six years from August 2014 and the interest rate is three-month LIBOR plus 4.70%. As of December 31, 2016 and 2015, the amount outstanding under this lease was US$176.1 million and US$188.1 million, respectively.
In 2013, El Brocal entered into a financing arrangement with Banco de Crédito del Perú in an aggregate amount of US$180.0 million in the form of a series of sale and leaseback agreements relating to certain specified El Brocal assets, including equipment, machinery and production plants located in the Colquijirca mining unit. The first disbursement of US$116.5 million was received in November 2013, which was used to repay El Brocal’s medium term loan with Banco de Crédito del Perú during the fourth quarter of 2013. The second disbursement of US$63.5 million was received in January 2014. The renewable arrangement had a term of five years that commenced on the first lease payment date in March 2014. During the term of the arrangement, El Brocal has the right to repurchase the assets. On June 9, 2015, the board of directors of El Brocal approved the modification of the sale and finance leaseback contract in an aggregate amount of US$166.5 million. The new arrangement has a term of five years that commenced on the payment date in June 2015. The quarterly lease payments have an embedded interest rate of nine-month LIBOR plus 4.75%. The agreements contain certain covenants, including several financial covenants such as a limitation on the payment of dividends by El Brocal. El Brocal’s obligations under the agreements are supported by trust contracts, which, among other things, relate to collection rights, sales contracts and cash flows granting Banco de Crédito del Perú the right to receive all cash flows before any funds are made available to El Brocal. The obligations of El Brocal under these agreements are not recourse to, or guaranteed by, Buenaventura or any of its other subsidiaries. The compliance with the financial ratios described above is monitored by El Brocal’s management. In 2016, Management obtained a waiver for any possible breach of the financial ratios that occur until December 31, 2017.
On March 28, 2014, Banco de Crédito del Perú executed a financial lease agreement with BISA in the amount of US$14.9 million for the construction of a building with administrative offices. The term of the lease is five years and four months starting April 2014 and the interest rate is 4.60%.
On June 27, 2016, in order to repay short-term contracts held as of December 31, 2015, we entered into a long-term finance contract, referred to as the Syndicated Term Loan, in the amount of US$275 million among us, as borrower, Condesa, Inversiones Colquijirca S.A. and Conenhua as guarantors, Banco de Credito del Peru, as administrative agent, and the lenders party thereto. Borrowings under the Syndicated Term Loan bear interest at a rate per annum equal to LIBOR plus 2.00%. Interest and installments of principal equal to 1/7th of the aggregate principal amount borrowed are payable every six months until maturity in June 2021 (on which date all amounts outstanding shall be payable). Obligations under the Syndicated Term Loan are guaranteed by Condesa and Conenhua, our wholly-owned subsidiaries, and Inversiones Colquijirca S.A., for which we own 100%. The term loan agreement governing the Syndicated Term Loan contains certain customary covenants, including certain financial maintenance covenants, and events of default. See Exhibit 2.1.
Exploration Costs and Capital Expenditures
We have budgeted approximately US$145 to US$175 million for capital expenditures for 2017. These budgeted capital expenditures mainly include maintenance capital expenditures of US$120 to US$140 million.
During 2016, we spent US$26.6 million on “exploration in non-operating areas” and US$96.1 million on “exploration in units in operations.” Our “exploration in non-operating areas” investments mainly focused on the following exploration projects: Tambomayo, Alejandra, Marcapunta, Pisacalla and Trapiche projects. Our “exploration in units in operations” investments were mainly focused in the Uchucchacua, Orcopampa, Julcani and Mallay units.
| 81 |
In 2017, we intend to invest approximately US$100 to US$120 million in exploration in units in operations (mainly Tambomayo, Orcopampa and Uchucchacua) and US$20 to US$30 million mainly in the following explorations in non-operating areas: Trapiche, San Gabriel and Daniela, among others.
We expect that we will meet our working capital, capital expenditure and exploration expense requirements for the next several years from internally generated funds, cash on hand and dividends received from our investments in non-consolidated mining operations, including Yanacocha. Additional financing, if necessary for the construction of any project, is expected to be obtained from borrowings under bank loans and the issuance of debt securities. There can be no assurance, however, that sufficient funding will be available to us from the internal or external sources to finance any future capital expenditure program, or that external funding will be available to us for such purpose on terms or at prices favorable to us. A very significant decline in the prices of gold and silver would be reasonably likely to affect the availability of such sources of liquidity. In addition, if we fund future capital expenditures from internal cash flow, there may be fewer funds available for the payment of dividends.
Recent Accounting Pronouncements
IFRS
We prepare and present the Financial Statements in accordance with IFRS as issued by the IASB.
The standards and interpretations that are issued, but not yet effective, up to the date of issuance of our Financial Statements are disclosed below. We intend to adopt these standards, if applicable, when they become effective:
IFRS 9, “Financial Instruments: Classification and Measurement.” In July 2014, the IASB issued the final version of IFRS 9 Financial Instruments which reflects all phases of the financial instruments project and replaces IAS 39 and all previous versions of IFRS 9. IFRS 9 brings together all three aspects of the accounting for financial instruments project: classification and measurement, impairment and hedge accounting. IFRS 9 is effective for annual periods beginning on or after January 1, 2018, with early application permitted. Except for hedge accounting, retrospective application is required, but the provision of comparative information is not compulsory. For hedge accounting, the requirements are generally applied prospectively, with some limited exceptions. We are evaluating the impact of the adoption of this standard.
IFRS 15, “Revenues from Contracts with Customers.” We expect to adopt this new standard on the date it enters into force. For this purpose, our Management has prepared a detailed plan of adoption that contemplates diverse tasks (systems review, internal control and policies and procedures), deadlines and responsibilities, which will begin in May 2017 and will end during the fourth quarter of 2017.
More than 90% of our revenues in 2016 came from the sales of metals and polymetallic concentrates, all of which are formalized through contracts. Based on a preliminary analysis, the Company’s Management does not expect to identify significant situations that may require a different accounting treatment under IFRS 15. To date, it is not possible to effect a quantitative disclosure as a result of the subsequent adoption of this standard.
If any material effects arise, we plan to use the modified retroactive method in the process of adopting IFRS 15, according to which the cumulative effect resulting from applying this new standard will be presented by adjusting the initial balance of retained earnings (January 1, 2018).
In addition, IFRS 15 establishes filing and disclosure requirements that represent a significant change in current practice and significantly increases the volume of disclosures required in our financial statements, many of which will be completely new.
IFRS 16 “Leases.” IFRS 16 sets out the principles for the recognition, measurement, presentation and disclosure of leases and requires lessees to account for all leases under a single on-balance sheet model similar to the accounting for finance leases under IAS 17. The standard includes two recognition exemptions for lessees: leases of “low-value” assets and short-term leases. It is effective for annual periods beginning on or after January 1, 2019, with early application permitted. We are currently evaluating the impact of IFRS 16 in its consolidated financial statements and expects to adopt this new standard on the required effective date.
| 82 |
IAS 7 “Disclosure Initiative – Amendments to IAS 7.” The amendments to IAS 7, Statement of Cash Flows, are part of the IASB’s Disclosure Initiative and require an entity to provide disclosures that enable users of financial statements to evaluate changes in liabilities arising from financing activities, including both changes arising from cash flows and non-cash changes. On initial application of the amendment, entities are not required to provide comparative information for preceding periods. These amendments are effective for annual periods beginning on or after January 1, 2017, with early application permitted. Application of the amendments will result in our providing additional disclosure.
IAS 12 “Recognition of Deferred Tax Assets for Unrealized Losses – Amendments to IAS 12.” The amendments clarify that an entity needs to consider whether tax law restricts the sources of taxable profits against which it may make deductions on the reversal of that deductible temporary difference. Furthermore, the amendments provide guidance on how an entity should determine future taxable profits and explain the circumstances in which taxable profit may include the recovery of some assets for more than their carrying amount. Entities are required to apply the amendments retrospectively. However, on initial application of the amendments, the change in the opening equity of the earliest comparative period may be recognized in the opening retained earnings (or in another component of equity, as appropriate), without allocating the change between opening retained earnings and other components of equity. Entities applying this relief must disclose that fact.
These amendments are effective for annual periods beginning on or after January 1, 2017 with early application permitted. If an entity applies the amendments for an earlier period, it must disclose that fact. These amendments are not expected to have any impact on us.
| C. | Research and Development |
Not applicable.
| D. | Trend Information |
Other than as disclosed in this Annual Report, we are not aware of any trends, uncertainties, demands, commitments or events which are reasonably likely to have a material effect upon our net sales or revenues, income from continuing operations, profitability, liquidity or capital resources, or that would cause reported financial information to be not necessarily indicative of future operating results or financial condition.
For our exploration activities, there is no production, sales or inventory in a conventional sense. Our financial success is dependent upon the extent to which we are capable of discovering mineralization and the economic viability of exploration properties. The construction and operation of such properties may take years to complete and the resulting income, if any, cannot be determined with certainty. Further, the sales value of mineralization discovered by us is largely dependent upon factors beyond our control, including the market value at any given time of the metals produced.
| E. | Off-Balance Sheet Arrangements |
There are no off-balance sheet arrangements that have or are reasonably likely to have a current or future effect on our financial condition, changes in financial condition, revenues or expenses, results of operations, liquidity, capital expenditures or capital resources that are material to investors.
| 83 |
| F. | Tabular Disclosure of Contractual Obligations |
The following table shows our contractual obligations as of December 31, 2016:
| Payments due by Period (US$ in millions) | ||||||||||||||||||||
| Total |
Less than
1 year |
1-2
years |
2-5
years |
More than
5 years |
||||||||||||||||
| Long-Term Debt (principal and interest)(*) | 309.8 | 13.0 | 48.1 | 248.7 | – | |||||||||||||||
| Capital Lease Obligations (**) | 376.7 | 57.4 | 65.0 | 254.3 | – | |||||||||||||||
| Open Purchase Orders | – | – | – | – | – | |||||||||||||||
| Other Long-Term Obligations | 238.4 | 37.8 | 22.4 | 79.7 | 98.5 | |||||||||||||||
| Total Contractual Cash Obligations | 924.9 | 108.2 | 135.5 | 582.7 | 98.5 | |||||||||||||||
(*) Long-Term Debt includes US$310.8 million (including US$272.1 million in principal and US$38.7 million interest payments), which relates to long-term debt of Buenaventura.
(**) Capital lease obligations include:
(i) US$209.3 million (including US$176.1 million in principal and US$33.2 million in interest payments), which relates to a financial lease between Banco de Crédito del Perú and Conenhua, Huanza and us for construction of a hydroelectric power station;
(ii) US$158.4 million (including US$136.8 million in principal and US$21.6 million in interest payments), which relates to a sale and leaseback arrangement between Banco de Crédito del Perú and El Brocal; and
(iii) US$8.0 million (including US$7.4 million in principal and US$0.6 million in interest payments), which relates to a financial lease between Banco de Crédito del Perú and BISA for construction of administrative offices.
As of December 31, 2016, we had no other commercial commitments.
| G. | Reconciliation of Costs Applicable to Sales and Cost Applicable to Sales per Unit Sold |
Cost applicable to sales and Cost applicable to sales per unit of mineral sold are not measures of financial performance under IFRS, and may not be comparable to similarly titled measures of other companies. We consider Cost applicable to sales and Cost applicable to sales per unit of mineral sold to be key measures in managing and evaluating our operating performance. These measures are widely reported in the precious metals industry as a benchmark for performance, but do not have standardized meanings. You should not consider Cost applicable to sales or Cost applicable to sales per unit of mineral sold as alternatives to cost of sales determined in accordance with IFRS, as indicators of our operating performance. Cost applicable to sales and Cost applicable to sales per unit of mineral sold are calculated without adjusting for by-product revenue amounts.
In calculating these figures, we utilize financial records maintained with respect to the various mining units and subsidiaries, each on a standalone basis. Within the stand-alone accounts for each mining unit or subsidiary, we then allocate cost of sales (excluding depreciation and amortization), exploration in units in operation and selling expenses in the proportion to each mineral’s commercial value (realized price multiplied by volume sold).
The tables below set forth (i) a reconciliation of consolidated Cost of sales, excluding depreciation and amortization to consolidated Cost applicable to sales, (ii) reconciliations of the components of Cost applicable to sales (by mine and mineral) to the corresponding consolidated line items set forth on our consolidated statements of profit or loss for the years ended December 31, 2015 and 2016 and (iii) reconciliations of Cost of sales, excluding depreciation and amortization to Cost applicable to sales for each of our mining units. The amounts set forth in Cost applicable to sales and Cost applicable to sales per unit sold for each mine and mineral indicated in the tables below can be reconciled to the amounts set forth on our consolidated statements of profit or loss for the years ended December 31, 2015 and 2016 by reference to the reconciliations of Cost of sales, excluding depreciation and amortization (by mine and mineral), Selling Expenses (by mine and metal) expenses and Exploration in units in operations (by mine and mineral) to consolidated Cost of sales, excluding depreciation and amortization, consolidated Selling Expenses and Consolidated Exploration in units in operations expenses, set forth below.
| 84 |
Set forth below is a reconciliation of consolidated Cost of sales, excluding depreciation and amortization, to consolidated Cost applicable to sales:
| For the year ended December 31, | ||||||||
| 2015 | 2016 | |||||||
| (in thousands of US$) | ||||||||
| Consolidated Cost of sales excluding depreciation and amortization | 573,102 | 508,566 | ||||||
| Add: | ||||||||
| Consolidated Exploration in units in operation | 89,699 | 96,149 | ||||||
| Commercial Deductions | 196,145 | 244,413 | ||||||
| Consolidated Selling Expenses | 19,365 | 21,733 | ||||||
| Consolidated Cost applicable to sales | 878,311 | 870,861 | ||||||
Set forth below is a reconciliation of Cost of sales, excluding depreciation and amortization (by mine and mineral) to consolidated Cost of sales, excluding depreciation and amortization:
| For the year ended December 31, | ||||||||
| 2015 | 2016 | |||||||
| Cost of sales by mine and mineral | (US$ in thousands) | |||||||
| Julcani, Gold | 49 | 15 | ||||||
| Julcani, Silver | 23,134 | 20,032 | ||||||
| Julcani, Lead | 1,906 | 1,855 | ||||||
| Julcani, Copper | 242 | 83 | ||||||
| Mallay, Gold | 201 | 512 | ||||||
| Mallay, Silver | 8,014 | 9,461 | ||||||
| Mallay, Lead | 5,190 | 4,943 | ||||||
| Mallay, Zinc | 6,256 | 7,371 | ||||||
| Orcopampa, Gold | 104,204 | 88,213 | ||||||
| Orcopampa, Silver | 3,512 | 4,271 | ||||||
| Orcopampa, Copper | 0 | 92 | ||||||
| Uchucchacua, Gold | 25 | 123 | ||||||
| Uchucchacua, Silver | 110,351 | 92,188 | ||||||
| Uchucchacua, Lead | 6,356 | 5,763 | ||||||
| Uchucchacua, Zinc | 4,825 | 4,262 | ||||||
| La Zanja, Gold | 105,795 | 89,816 | ||||||
| La Zanja, Silver | 3,213 | 1,787 | ||||||
| El Brocal, Gold | 4,258 | 6,773 | ||||||
| El Brocal, Silver | 21,024 | 12,161 | ||||||
| El Brocal, Lead | 15,244 | 9,878 | ||||||
| El Brocal, Zinc | 42,157 | 45,506 | ||||||
| El Brocal, Copper | 68,711 | 92,224 | ||||||
| Non Mining Units | 38,435 | 11,237 | ||||||
| Consolidated Cost of sales, excluding depreciation and amortization | 573,102 | 508,566 | ||||||
| 85 |
Set forth below is a reconciliation of Exploration in units in operation expenses (by mine and mineral) to consolidated Exploration in units in operation expenses:
| For the year ended December 31, | ||||||||
| Exploration in units in operation by mine and mineral | 2015 | 2016 | ||||||
| (US$ in thousands) | ||||||||
| Julcani, Gold | 25 | 8 | ||||||
| Julcani, Silver | 11,597 | 10,086 | ||||||
| Julcani, Lead | 956 | 934 | ||||||
| Julcani, Copper | 121 | 42 | ||||||
| Mallay, Gold | 77 | 183 | ||||||
| Mallay, Silver | 3,073 | 3,379 | ||||||
| Mallay, Lead | 1,990 | 1,765 | ||||||
| Mallay, Zinc | 2,399 | 2,633 | ||||||
| Orcopampa, Gold | 40,344 | 42,985 | ||||||
| Orcopampa, Silver | 1,360 | 2,081 | ||||||
| Orcopampa, Copper | 0 | 45 | ||||||
| Uchucchacua, Gold | 6 | 38 | ||||||
| Uchucchacua, Silver | 25,160 | 28,292 | ||||||
| Uchucchacua, Lead | 1,449 | 1,769 | ||||||
| Uchucchacua, Zinc | 1,100 | 1,308 | ||||||
| La Zanja, Gold | 41 | 591 | ||||||
| La Zanja, Silver | 1 | 12 | ||||||
| El Brocal, Gold | 0 | 0 | ||||||
| El Brocal, Silver | 0 | 0 | ||||||
| El Brocal, Lead | 0 | 0 | ||||||
| El Brocal, Zinc | 0 | 0 | ||||||
| El Brocal, Copper | 0 | 0 | ||||||
| Non Mining Units | 0 | 0 | ||||||
| Consolidated Exploration in units in operation | 89,690 | 96,149 | ||||||
| 86 |
Set forth below is a reconciliation of Commercial Deductions (by mine and mineral) to consolidated Commercial Deductions in operation expenses:
| For the year ended December 31, | ||||||||
| Commercial Deductions in units in operation by mine and mineral | 2015 | 2016 | ||||||
| (US$ in thousands) | ||||||||
| Julcani, Gold | 14 | 3 | ||||||
| Julcani, Silver | 7,258 | 5,021 | ||||||
| Julcani, Lead | 591 | 465 | ||||||
| Julcani, Copper | 81 | 25 | ||||||
| Mallay, Gold | 89 | 192 | ||||||
| Mallay, Silver | 4,098 | 4,745 | ||||||
| Mallay, Lead | 2,655 | 2,471 | ||||||
| Mallay, Zinc | 4,313 | 5,796 | ||||||
| Orcopampa, Gold | 255 | 496 | ||||||
| Orcopampa, Silver | 0 | 149 | ||||||
| Orcopampa, Copper | 0 | 21 | ||||||
| Uchucchacua, Gold | 7 | 46 | ||||||
| Uchucchacua, Silver | 37,753 | 37,877 | ||||||
| Uchucchacua, Lead | 2,161 | 2,348 | ||||||
| Uchucchacua, Zinc | 5,457 | 6,006 | ||||||
| La Zanja, Gold | 194 | 293 | ||||||
| La Zanja, Silver | 18 | 15 | ||||||
| El Brocal, Gold | 4,847 | 9,028 | ||||||
| El Brocal, Silver | 13,583 | 9,971 | ||||||
| El Brocal, Lead | 6,669 | 5,490 | ||||||
| El Brocal, Zinc | 24,622 | 39,944 | ||||||
| El Brocal, Copper | 81,479 | 114,012 | ||||||
| Non Mining Units | 0 | 0 | ||||||
| Consolidated Commercial Deductions in units in operation | 196,145 | 244,413 | ||||||
| 87 |
Set forth below is a reconciliation of selling expenses (by mine and mineral) to consolidated selling expenses:
| For the year ended December 31, | ||||||||
| Selling expenses by mine and mineral | 2015 | 2016 | ||||||
| (US$ in thousands) | ||||||||
| Julcani, Gold | 2 | 1 | ||||||
| Julcani, Silver | 963 | 770 | ||||||
| Julcani, Lead | 79 | 71 | ||||||
| Julcani, Copper | 10 | 3 | ||||||
| Mallay, Gold | 15 | 36 | ||||||
| Mallay, Silver | 580 | 658 | ||||||
| Mallay, Lead | 376 | 344 | ||||||
| Mallay, Zinc | 453 | 512 | ||||||
| Orcopampa, Gold | 823 | 1,024 | ||||||
| Orcopampa, Silver | 28 | 50 | ||||||
| Orcopampa, Copper | 0 | 1 | ||||||
| Uchucchacua, Gold | 1 | 6 | ||||||
| Uchucchacua, Silver | 3,225 | 4,173 | ||||||
| Uchucchacua, Lead | 186 | 261 | ||||||
| Uchucchacua, Zinc | 141 | 193 | ||||||
| La Zanja, Gold | 1,171 | 1,032 | ||||||
| La Zanja, Silver | 36 | 21 | ||||||
| El Brocal, Gold | 255 | 419 | ||||||
| El Brocal, Silver | 1,258 | 752 | ||||||
| El Brocal, Lead | 912 | 611 | ||||||
| El Brocal, Zinc | 2,522 | 2,815 | ||||||
| El Brocal, Copper | 4,110 | 5,704 | ||||||
| Non Mining Units | 2,220 | 2,278 | ||||||
| Consolidated Selling expenses | 19,365 | 21,733 | ||||||
Set forth below is a reconciliation of Cost of sales, excluding depreciation and amortization, to Cost applicable to sales and Cost applicable to sales per unit of mineral for the Julcani mine:
| JULCANI | ||||||||||||||||||||||||||||||||
| COPPER (t) | GOLD (oz.) | LEAD (t) | SILVER (oz.) | |||||||||||||||||||||||||||||
| For the year ended December 31, | For the year ended December 31, | For the year ended December 31, | For the year ended December 31, | |||||||||||||||||||||||||||||
| 2015 | 2016 | 2015 | 2016 | 2015 | 2016 | 2015 | 2016 | |||||||||||||||||||||||||
| (US$ in thousands except operating and per unit data) | ||||||||||||||||||||||||||||||||
| Cost of Sales, excluding depreciation and amortization | 242 | 83 | 49 | 15 | 1,906 | 1,855 | 23,134 | 20,032 | ||||||||||||||||||||||||
| Add: | ||||||||||||||||||||||||||||||||
| Exploration in units in operation | 121 | 42 | 25 | 8 | 956 | 934 | 11,597 | 10,086 | ||||||||||||||||||||||||
| Commercial Deductions | 81 | 25 | 14 | 3 | 591 | 465 | 7,258 | 5,021 | ||||||||||||||||||||||||
| Selling expenses | 10 | 3 | 2 | 1 | 79 | 71 | 963 | 770 | ||||||||||||||||||||||||
| Cost applicable to sales | 454 | 153 | 90 | 27 | 3,533 | 3,325 | 42,953 | 35,908 | ||||||||||||||||||||||||
| Divide: | ||||||||||||||||||||||||||||||||
| Volume Sold | 103 | 54 | 94 | 32 | 2,478 | 2,679 | 3,493,166 | 3,090,967 | ||||||||||||||||||||||||
| Cost applicable to sales per unit of mineral sold (US$) | 4,416 | 2,837 | 955 | 825 | 1,425 | 1,241 | 12.30 | 11.62 | ||||||||||||||||||||||||
Set forth below is a reconciliation of Cost of sales, excluding depreciation and amortization, to cost applicable to sales and Cost applicable to sales per unit of mineral for the Mallay mine:
| 88 |
| MALLAY | ||||||||||||||||||||||||
| LEAD (t) | SILVER (oz.) | ZINC (t) | ||||||||||||||||||||||
| For the year ended December 31, | For the year ended December 31, | For the year ended December 31, | ||||||||||||||||||||||
| 2015 | 2016 | 2015 | 2016 | 2015 | 2016 | |||||||||||||||||||
| (US$ in thousands except operating and per unit data) | ||||||||||||||||||||||||
| Cost of Sales, excluding depreciation and amortization | 5,190 | 4,943 | 8,014 | 9,461 | 6,256 | 7,371 | ||||||||||||||||||
| Add: | ||||||||||||||||||||||||
| Exploration in units in operation | 1,990 | 1,765 | 3,073 | 3,379 | 2,399 | 2,633 | ||||||||||||||||||
| Commercial Deductions | 2,655 | 2,471 | 4,098 | 4,745 | 4,313 | 5,796 | ||||||||||||||||||
| Selling expenses | 376 | 344 | 580 | 658 | 453 | 512 | ||||||||||||||||||
| Cost applicable to sales | 10,211 | 9,523 | 15,766 | 18,242 | 13,421 | 16,312 | ||||||||||||||||||
| Divide: | ||||||||||||||||||||||||
| Volume Sold | 6,612 | 6,775 | 1,134,528 | 1,426,986 | 7,482 | 8,728 | ||||||||||||||||||
| Cost applicable to sales per unit of mineral sold (US$) | 1,544 | 1,406 | 13.90 | 12.78 | 1,794 | 1,869 | ||||||||||||||||||
Set forth below is a reconciliation of Cost of sales, excluding depreciation and amortization, to cost applicable to sales and Cost applicable to sales per unit of mineral for the Orcopampa mine:
| ORCOPAMPA | ||||||||||||||||
| GOLD (oz.) | SILVER (oz.) | |||||||||||||||
| For the year ended December 31, | For the year ended December 31, | |||||||||||||||
| 2015 | 2016 | 2015 | 2016 | |||||||||||||
| (US$ in thousands except operating and per unit data) | ||||||||||||||||
| Cost of Sales, excluding depreciation and amortization | 104,204 | 88,213 | 3,512 | 4,271 | ||||||||||||
| Add: | ||||||||||||||||
| Exploration in units in operation | 40,344 | 42,985 | 1,360 | 2,081 | ||||||||||||
| Commercial Deductions | 255 | 496 | 0 | 149 | ||||||||||||
| Selling expenses | 823 | 1,024 | 28 | 50 | ||||||||||||
| Cost applicable to sales | 145,626 | 132,718 | 4,900 | 6,552 | ||||||||||||
| Divide: | ||||||||||||||||
| Volume Sold | 214,821 | 188,511 | 555,314 | 680,708 | ||||||||||||
| Cost applicable to sales per unit of mineral sold (US$) | 678 | 704 | 8.82 | 9.62 | ||||||||||||
Set forth below is a reconciliation of Cost of sales, excluding depreciation and amortization, to cost applicable to sales and Cost applicable to sales per unit of mineral for the Uchucchacua mine:
| UCHUCCHACUA | ||||||||||||||||||||||||
| LEAD (t) | SILVER (oz.) | ZINC (t) | ||||||||||||||||||||||
| For the year ended December 31, | For the year ended December 31, | For the year ended December 31, | ||||||||||||||||||||||
| 2015 | 2016 | 2015 | 2016 | 2015 | 2016 | |||||||||||||||||||
| (US$ in thousands except operating and per unit data) | ||||||||||||||||||||||||
| Cost of Sales, excluding depreciation and amortization | 6,356 | 5,763 | 110,351 | 92,188 | 4,825 | 4,262 | ||||||||||||||||||
| Add: | ||||||||||||||||||||||||
| Exploration in units in operation | 1,449 | 1,769 | 25,160 | 28,292 | 1,100 | 1,308 | ||||||||||||||||||
| Commercial Deductions | 2,161 | 2,348 | 37,753 | 37,877 | 5,457 | 6,006 | ||||||||||||||||||
| Selling expenses | 186 | 261 | 3,228 | 4,173 | 141 | 193 | ||||||||||||||||||
| Cost applicable to sales | 10,152 | 10,140 | 176,490 | 162,529 | 11,523 | 11,770 | ||||||||||||||||||
| Divide: | ||||||||||||||||||||||||
| Volume Sold | 6,560 | 8,350 | 12,666,673 | 14,739,128 | 4,750 | 5,295 | ||||||||||||||||||
| Cost applicable to sales per unit of mineral sold (US$) | 1,548 | 1,214 | 13.93 | 11.03 | 2,426 | 2,223 | ||||||||||||||||||
| 89 |
Set forth below is a reconciliation of Cost of sales, excluding depreciation and amortization, to cost applicable to sales and Cost applicable to sales per unit of mineral for the La Zanja mine:
| LA ZANJA | ||||||||||||||||
| GOLD (oz.) | SILVER (oz.) | |||||||||||||||
| For the year ended December 31, | For the year ended December 31, | |||||||||||||||
| 2015 | 2016 | 2015 | 2016 | |||||||||||||
| (US$ in thousands except operating and per unit data) | ||||||||||||||||
| Cost of Sales, excluding depreciation and amortization | 105,795 | 89,816 | 3,213 | 1,787 | ||||||||||||
| Add: | ||||||||||||||||
| Exploration in units in operation | 41 | 591 | 1 | 12 | ||||||||||||
| Commercial Deductions | 194 | 293 | 18 | 15 | ||||||||||||
| Selling expenses | 1,171 | 1,032 | 36 | 21 | ||||||||||||
| Cost applicable to sales | 107,201 | 91,732 | 3,268 | 1,835 | ||||||||||||
| Divide: | ||||||||||||||||
| Volume Sold | 142,299 | 151,189 | 324,151 | 229,055 | ||||||||||||
| Cost applicable to sales per unit of mineral sold (US$) | 753 | 607 | 10.08 | 8.01 | ||||||||||||
Set forth below is a reconciliation of Cost of sales, excluding depreciation and amortization, to cost applicable to sales and Cost applicable to sales per unit of mineral for the El Brocal mine:
| EL BROCAL | ||||||||||||||||||||||||||||||||||||||||
| COPPER (t) | GOLD (oz.) | LEAD (t) | SILVER (oz.) | ZINC (t) | ||||||||||||||||||||||||||||||||||||
|
For the year ended
December 31, |
For the year ended
December 31, |
For the year ended
December 31, |
For the year ended December 31, |
For the year ended
December 31, |
||||||||||||||||||||||||||||||||||||
| 2015 | 2016 | 2015 | 2016 | 2015 | 2016 | 2015 | 2016 | 2015 | 2016 | |||||||||||||||||||||||||||||||
| (US$ in thousands except operating and per unit data) | ||||||||||||||||||||||||||||||||||||||||
| Cost of Sales, excluding depreciation and amortization | 68,711 | 92,224 | 4,258 | 6,773 | 15,244 | 9,878 | 21,024 | 12,161 | 42,157 | 45,506 | ||||||||||||||||||||||||||||||
| Add: | ||||||||||||||||||||||||||||||||||||||||
| Exploration in units in operation | - | - | - | - | - | - | - | - | - | - | ||||||||||||||||||||||||||||||
| Commercial Deductions | 81,479 | 114,012 | 4,847 | 9,028 | 6,669 | 5,490 | 13,583 | 9,971 | 24,622 | 39,944 | ||||||||||||||||||||||||||||||
| Selling expenses | 4,110 | 5,704 | 255 | 419 | 912 | 611 | 1,258 | 752 | 2,522 | 2,815 | ||||||||||||||||||||||||||||||
| Cost applicable to sales | 154,300 | 211,940 | 9,359 | 16,220 | 22,826 | 15,979 | 35,865 | 22,884 | 69,301 | 88,265 | ||||||||||||||||||||||||||||||
| Divide: | ||||||||||||||||||||||||||||||||||||||||
| Volume Sold | 28,991 | 45,572 | 7,181 | 13,062 | 16,739 | 11,874 | 2,637,215 | 1,696,176 | 43,297 | 48,806 | ||||||||||||||||||||||||||||||
| Cost applicable to sales per unit of mineral sold (US$) | 5,322 | 4,651 | 1,303 | 1,242 | 1,364 | 1,346 | 13.60 | 13.49 | 1,364 | 1,808 | ||||||||||||||||||||||||||||||
Set forth below is a reconciliation of Cost of sales, excluding depreciation and amortization, to cost applicable to sales and Cost applicable to sales per unit of mineral for non-mining units
| NON-MINING UNITS | ||||||||
| TOTAL | ||||||||
| For the year ended December 31, | ||||||||
| 2015 | 2016 | |||||||
| (US$ in thousands) | ||||||||
| Cost of Sales, excluding depreciation and amortization | 38,435 | 11,237 | ||||||
| Add: | ||||||||
| Exploration in units in operation | 0 | 0 | ||||||
| Commercial Deductions | 0 | 0 | ||||||
| Selling expenses | 2,220 | 2,278 | ||||||
| Total Cost applicable to sales | 40,655 | 13,515 | ||||||
| 90 |
YANACOCHA
Introduction
The following discussion should be read in conjunction with the Yanacocha Consolidated Financial Statements as of December 31, 2015 and 2016 and for the years ended December 31, 2014, 2015 and 2016 and the related Notes thereto included elsewhere in this Annual Report. The Yanacocha Consolidated Financial Statements are prepared and presented in accordance with IFRS and in U.S. Dollars.
| A. | Operating Results |
Overview
Yanacocha, the largest gold producer in South America, was established in Peru in January 1992 and commenced production activities in August 1993. Yanacocha’s operations are located in the Andes Mountains in Northern Peru, in the area of Cajamarca which is located approximately 600 kilometers north of Lima and north of the city of Cajamarca, at an altitude of 4,000 meters above sea level. Yanacocha is 51.35% owned by Newmont Mining through its wholly-owned subsidiary Newmont Second, 43.65% owned by Buenaventura through our wholly-owned subsidiary Condesa and 5% owned by IFC Yanacocha is managed by Newmont Peru S.R.L. See “Item 4. Information on the Company—Yanacocha—B. Business Overview—Management of Yanacocha—General Manager/Management Agreement.”
The table below highlights Yanacocha’s key financial and operating results:
Summary of Financial and Operating Performance
| Year Ended December 31, | ||||||||||||
| 2016 | 2015 | 2014 | ||||||||||
| Gold sales (in thousands of US$) | 791,766 | 1,070,021 | 1,210,457 | |||||||||
| Gold sold (oz.) (*) | 636,931 | 924,175 | 967,970 | |||||||||
| Average gold price received (US$/oz.) | 1,243 | 1,159 | 1,250 | |||||||||
| Costs applicable to sales (US$/oz.) | 1,219 | 819 | 949 | |||||||||
| Other operating expenses, net (in thousands of US$) | 71,496 | 82,846 | 77,781 | |||||||||
| Loss for the year (in thousands of US$) | (1,043,752 | ) | (450,195 | ) | (400,338 | ) | ||||||
Gold sales . Gold sales decreased by 26%, or US$278 million, from 2015 to 2016, due to lower ounces sold as a result of lower production, partially offset by the increased realized price. Gold ounces produced decreased 31% due primarily to lower mill throughput, recovery and grade, and lower leach tons placed at a lower grade.
Costs applicable to sales . Costs applicable to sales include: (i) operating costs, consisting primarily of direct production costs such as mining and treatment of the ore, which are the most significant components of costs applicable to sales, (ii) workers’ participation profit sharing of 8% of pre-tax profits based on Peruvian labor legislation, (iii) write downs of ore on leach pads to net realizable value expense and (iv) other costs. Costs applicable to sales increased by 3% or US$25 million from 2015 to 2016. Ounces sold decreased by 31% from 2015 to 2016. Costs applicable to sales per ounce of gold increased by 49%, from US$819 in 2015 to US$1,219 in 2016.
Other operating expenses, net. Other operating expenses, net decreased by 14% or US$11 million from 2015 to 2016, primarily due to lower exploration and advanced project expenses.
Income tax benefit (expense). Yanacocha’s financial and operating results included an income and mining tax expense of US$43.1 million in 2016 compared to an expense of US$602.7 million in 2015. The difference was primarily due to the write off of a deferred tax asset during 2015.
Dividends . On February 15, 2016, Yanacocha’s board of directors unanimously agreed to distribute dividends in the amount of US$300 million, in proportion to each shareholder’s equity interest, which corresponds to a portion of the accumulated results as of December 31, 2014, which were generated in 2011. During the year ended December 31, 2015 Yanacocha did not pay dividends to its partners and did not reserve any money related to reinvestment programs.
| 91 |
Critical Accounting Policies
Yanacocha has furnished us with a discussion of its critical accounting policies or methods used in the preparation of its financial statements. Critical accounting policies are those that are reflective of significant judgments and uncertainties and could potentially impact results under different assumptions and conditions. See Note 2 to the Yanacocha Consolidated Financial Statements for a more complete listing Yanacocha’s accounting policies.
Currency
The Yanacocha Consolidated Financial Statements are presented in U.S. Dollars, which is also Yanacocha’s functional currency. Transactions in foreign currency (a currency other than functional currency) are initially recorded by Yanacocha at the exchange rates prevailing at the time of the transactions. Monetary assets and liabilities denominated in other currencies are translated into the U.S. Dollar at exchange rates prevailing at the statements of financial position dates. Gains or losses from exchange differences arising from the settlement or translation of monetary assets and liabilities are recognized in the consolidated statements of comprehensive income. Non-monetary assets and liabilities recognized in terms of historical cost are translated using the exchange rates prevailing at the dates of the initial transactions.
Stockpiles, Ore on Leach Pads and Inventories
Costs that are incurred in or benefit the productive process are accumulated as stockpiles, ore on leach pads and inventories. Stockpiles, ore on leach pads and inventories are carried at the lower of average cost or net realizable value. Net realizable value represents the estimated future sales price of the product based on current and long-term metals prices, less the estimated costs to complete production and bring the product to sale. Write-downs of stockpiles, ore on leach pads and inventories to net realizable value are reported as a component of costs applicable to sales. The current portion of stockpiles, ore on leach pads and inventories is determined based on the expected amounts to be processed within the next twelve months. Stockpiles, ore on leach pads and inventories not expected to be processed within the next twelve months are classified as non-current. The major classifications are as follows:
Stockpile . Stockpiles represent ore that has been extracted from the mine and is available for further processing. Stockpiles are measured by estimating the number of tons added and removed from the stockpile, the number of contained ounces (based on assay data) and the estimated metallurgical recovery rates (based on the expected processing method). Stockpile ore tonnages are verified by periodic surveys. Costs are allocated to stockpiles based on relative values of material stockpiled and processed using current mining costs incurred up to the point of stockpiling the ore, including applicable overhead and depreciation and amortization relating to mining operations, and removed at each stockpile’s average cost per recoverable unit as material is processed.
Ore on Leach Pad. The recovery of gold from certain gold oxide ores is achieved through the heap leaching process. Under this method, oxide ore is placed on leach pads where it is treated with a chemical solution, which dissolves the gold contained in the ore. The resulting gold-bearing solution is later processed in a plant where the gold is recovered. Costs are added to ore on leach pads based on current mining costs, including applicable overhead and depreciation and amortization relating to mining operations. Costs are removed from ore on leach pads as ounces are recovered based on the average cost per estimated recoverable ounce of gold on the leach pad.
The estimates of recoverable gold on the leach pads are calculated from the quantities of ore placed on the pads (measured tons added to the leach pads), the grade of ore placed on the leach pads (based on assay data) and a recovery percentage (based on ore type). In general, the leach pads recover between 50% and 95% of the ultimate recoverable ounces in the first year of leaching, declining each year thereafter until the leaching process is complete.
Although the quantities of recoverable gold placed on the leach pads are reconciled by comparing the grades of ore placed on the pads to the quantities of gold actually recovered (metallurgical balancing), the nature of the leaching process inherently limits the ability to precisely monitor inventory levels. As a result, the metallurgical balancing process is constantly monitored and estimates are refined based on actual results over time. Historically, Yanacocha’s operating results have not been materially impacted by variations between the estimated and actual recoverable quantities of gold on its leach pads. Variations between actual and estimated quantities resulting from changes in assumptions and estimates that do not result in write-downs to net realizable value are accounted for on a prospective basis.
| 92 |
In-process Inventory. In-process inventories represent materials that are currently in the process of being converted to a saleable product. Conversion processes vary depending on the nature of the ore and the specific processing facility, and include mill in-circuit and leach in-circuit. In-process material is measured based on assays of the material fed into the process and the projected recoveries of the respective plants. In-process inventories are valued at the average cost of the material fed into the process attributable to the source material coming from the mines, stockpiles and/or leach pads plus the in-process conversion costs, including applicable amortization relating to the process facilities incurred to that point in the process.
Precious Metals Inventory. Precious metals include gold doré and/or gold bullion. Precious metals that result from Yanacocha’s mining and processing activities are valued at the average cost of the respective in-process inventories incurred prior to the refining process, plus applicable refining costs.
Mine Development
Mine development costs include engineering and metallurgical studies, drilling and other related costs to delineate an ore body, and the removal of overburden to initially expose an ore body at open pit surface mines. Costs incurred before mineralization is classified as proven and probable reserves are expensed and classified as Exploration or Advanced projects expense. Capitalization of mine development project costs, that meet the definition of an asset, begins once mineralization is classified as proven and probable reserves.
Drilling and related costs are capitalized for an ore body where proven and probable reserves exist; the activities are directed at obtaining additional information on the ore body or converting mineralized material to proven and probable reserves. All other drilling and related costs are expensed as incurred. Drilling costs incurred during the production phase for operational ore control are allocated to inventory costs and then included as a component of Costs applicable to sales .
The cost of removing overburden and waste materials to access the ore body at an open-pit mine prior to the production phase are referred to as “pre-stripping costs.” Pre-stripping costs are capitalized during the development of an open pit mine. Where multiple open pits exist at a mining complex utilizing common processing facilities, pre-stripping costs are capitalized at each pit. The removal and production of de minimis saleable materials may occur during development and are recorded as Other income , net of incremental mining and processing costs.
The production phase of an open-pit mine commences when saleable minerals, beyond a de minimis amount, are produced. Stripping costs incurred during the production phase of a mine are variable production costs that are included as a component of inventory to be recognized in Costs applicable to sales in the same period as the revenue from the sale of inventory. Yanacocha’s definition of a mine and the mine’s production phase may differ from that of other companies in the mining industry resulting in incomparable allocations of stripping costs to deferred mine development and production costs.
Mine development costs are amortized using the units-of-production (“UOP”) method based on estimated recoverable ounces in proven and probable reserves. To the extent that these costs benefit an entire ore body, they are amortized over the estimated life of the ore body. Costs incurred to access specific ore blocks or areas that only provide benefit over the life of that area are amortized over the estimated life of that specific ore block or area.
Stripping costs are incurred during the production phase of a surface mining in accordance with IFRIC 20 “Stripping costs in the production phase of as surface mine” whereby a stripping asset is recognized if, and only if, all of the following are met:
| · | It is probable that the future economic benefit (improved access to the ore body) associated with the stripping activity will flow to the entity; |
| · | The entity can identify the component of the ore body for which access has been improved; and |
| · | The costs relating to the stripping activity associated with that component can be measured reliably. |
| 93 |
The primary components of the ore body on a pit by pit basis as well as within major pits are identified. Based on these components, stripping activities are analyzed and costs are assigned based on whether they pertained to current inventory production or improved access to future ore bodies (or components of an ore body).
Based on this analysis, Yanacocha allocates the costs associated with improved access as a “stripping activity asset”. This allocation is based on the volume of waste and ore extracted in the period compared to expected volume life-of-mine per component of ore body .
Costs allocated to the production stripping activity asset are subsequently depreciated. Depreciation of the production stripping asset was calculated on a systematic basis method over the expected useful life of the identified component of the ore body that becomes more accessible as a result of the stripping costs. This depreciation is a production cost.
Mineral Interests
Mineral interests include acquired interests in production, development and exploration stage properties. The mineral interests are capitalized at their fair value at the acquisition date.
The value of such assets is primarily driven by the nature and amount of mineralized material believed to be contained in such properties. Production stage mineral interests represent interests in operating properties that contain proven and probable reserves. Development stage mineral interests represent interests in properties under development that contain proven and probable reserves. Exploration stage mineral interests represent interests in properties that are believed to potentially contain mineralized material consisting of (i) mineralized material such as inferred material within pits; mineralized material with insufficient drill spacing to qualify as proven and probable reserves; and mineralized material in close proximity to proven and probable reserves; (ii) around-mine exploration potential not immediately adjacent to existing reserves and mineralization, but located within the immediate mine area; (iii) other mine-related exploration potential that is not part of current mineralized material and is composed mainly of material outside of the immediate mine area; (iv) greenfield exploration potential that is not associated with any other production, development or exploration stage property, as described above; or (v) any acquired right to explore or extract a potential mineral deposit. Yanacocha’s mineral rights generally are enforceable regardless of whether proven and probable reserves have been established. Yanacocha has the ability and intent to renew mineral interests where the existing term is not sufficient to recover all identified and valued proven and probable reserves and/or undeveloped mineralized material.
Impairment of non-financial assets
The carrying amounts of non-financial assets are reviewed for impairment whenever events or changes in circumstances indicate that the related carrying value may not be recoverable. If there are indicators of impairment, a review is undertaken to determine whether the carrying values are in excess of the recoverable amount. The recoverable amount is determined as the higher of an asset’s fair value, less costs of disposal, and its value in use. Such review is undertaken on an asset-by-asset basis, except where such assets do not generate cash flows independently from other assets, in which case the review is undertaken at the cash generating unit level. Yanacocha identified two separate cash generating units according to its segments: Yanacocha and the Conga project.
Future cash flows are estimated based on quantities of recoverable minerals, expected gold and other commodity prices (considering current and historical prices, trends and related factors), production levels, operating costs, capital requirements and reclamation costs, all based on life-of-mine plans and the appropriate discount rate. These estimates, used in the determination of future cash flows, are based on numerous assumptions and it is possible that actual future cash flows will be significantly different than the estimates, as actual future quantities of recoverable minerals, gold and other commodity prices, production levels, costs and capital and interest rates are each subject to significant risks and uncertainties.
If the carrying amount of an asset exceeds its recoverable amount, an impairment loss is recorded in the statement of comprehensive income to reflect the asset at the lower amount. In assessing the recoverable amount for assets, the relevant future cash flows expected to arise from the fair value less costs of disposal have been discounted to their present value.
| 94 |
An impairment loss is reversed in the statement of comprehensive income if there is a change in estimate used to determine recoverable amount since the prior impairment loss was recognized.
The carrying amount of an asset is increased to the recoverable amount but not beyond the carrying amount net of depreciation or amortization which would have arisen if the prior impairment loss had not been recognized. After such a reversal, the depreciation charge is adjusted in future periods to allocate the asset’s revised carrying amount, less any residual value, on a systematic basis over its remaining useful life.
Current income tax
Current income tax assets and liabilities for the current and prior periods are measured at the amount expected to be recovered from, or paid to, the taxation authorities. The tax rates and tax laws used to compute the amount are those that are enacted or substantively enacted at the reporting date in Peru. Current income tax relating to items recognized directly in other comprehensive income or equity is recognized in other comprehensive income or equity and not in profit or loss. Yanacocha’s management periodically evaluates positions taken in the tax returns with respect to situations where applicable tax regulations are subject to interpretation and establishes provisions where appropriate.
Deferred income tax
Yanacocha accounts for income and mining taxes using the liability method, recognizing certain temporary differences between the financial reporting basis of Yanacocha’s liabilities and assets and the related income tax basis for such liabilities and assets. This method generates a net deferred income tax liability or net deferred income tax asset for Yanacocha, as measured by the statutory tax rates in effect as enacted. Yanacocha derives its deferred income tax charge or benefit by recording the change in the net deferred income tax liability or net deferred income tax asset balance for the year, based on Peruvian income and mining tax laws. Royalty taxes are calculated based on operating profit, as such are shown as income tax. Yanacocha’s deferred income tax assets include certain future tax benefits. Yanacocha determines a valuation allowance to any portion of those deferred income tax assets when it believes, based on the weight of available evidence, it is more likely than not that some portion or all of the deferred income tax asset will not be realized. See Note 14 to the Yanacocha Consolidated Financial Statements.
Deferred income tax assets are recognized only to the extent that it is probable that future taxable profit will be available against which the temporary differences can be utilized. Deferred income tax assets and liabilities are offset when there is a legally enforceable right to offset current tax assets against current tax liabilities and when the deferred income tax assets and liabilities relate to income taxes levied by the same taxation authority on either the same taxable entity or different taxable entities where there is an intention to settle the balances on a net basis.
Sales tax
Expenses and assets are recognized net of the amount of sales tax, except:
| · | When the sales tax incurred on a purchase of assets or services is not recoverable from the taxation authority, in which case the sales tax is recognized as part of the cost of acquisition of the asset or as part of the expense item, as applicable; |
| · | When receivables and payables are stated with the amount of sales tax included. |
The net amount of sales tax recoverable from, or payable to, the taxation authority is included as part of receivables or payables in the consolidated statements of financial position.
Reclamation and Remediation Costs
Reclamation obligations are recognized when incurred and recorded as liabilities at fair value. The liability is accreted over time through periodic charges to earnings. In addition, the asset retirement cost (“ARC”) is capitalized as part of the asset’s carrying value and amortized over the life of the related asset. Reclamation costs are periodically adjusted to reflect changes in the estimated present value resulting from the passage of time and revisions to the estimates of either the timing or amount of the reclamation costs. The estimated retirement obligation is based on when spending for an existing environmental disturbance is expected to occur. Yanacocha reviews, on an annual basis, unless otherwise deemed necessary, the reclamation obligation at each mine site.
| 95 |
Future remediation costs for inactive mines are accrued based on management’s best estimate at the end of each period of the costs expected to be incurred at a site. Such cost estimates include, where applicable, ongoing care, maintenance and monitoring costs. Changes in estimates at inactive mines are reflected in earnings in the period an estimate is revised.
Recently Adopted Accounting Pronouncements
Certain standards and amendments are effective for annual periods beginning on or after January 1, 2016. However, they do not impact the annual consolidated financial statements of Yanacocha and, hence, have not been disclosed. Yanacocha has not early adopted any standard, interpretation or amendment that has been issued but is not yet effective.
Recently Issued Accounting Pronouncements
IFRS 9 Financial Instruments
In July 2014, the IASB issued the final version of IFRS 9 Financial Instruments that replaces IAS 39 and all previous versions of IFRS 9. IFRS 9 brings together all three aspects of the accounting for financial instruments project: classification and measurement, impairment and hedge accounting. IFRS 9 is effective for annual periods beginning on or after January 1, 2018, with early application permitted. Except for hedge accounting, retrospective application is required, but the provision of comparative information is not compulsory. For hedge accounting, the requirements are generally applied prospectively, with some limited exceptions.
IFRS 15 Revenue from Contracts with Customers
In May 2014, IFRS 15 was issued related to revenue from contracts with customers. The new standard provides a five-step approach to be applied to all contracts with customers and also requires expanded disclosures about revenue recognition. The effective date of IFRS is for annual periods, beginning on or after January 1, 2018. Early adoption is permitted.
Yanacocha is currently performing an assessment of the revised standards and impacts on Yanacocha’s Consolidated Financial Statements and disclosures. Its management is still in the process of completing its assessment of the impacts; however, based on a preliminary analysis, Yanacocha anticipates the standard having a potential impact to the timing of revenue recognition due to a potential change in the timing of when control is transferred to the customer. Yanacocha continues to evaluate the potential impacts due to timing of revenue recognition, but does not expect it to have a material impact on the Consolidated Financial Statements. Additionally, Yanacocha continues to assess the potential impacts on insurance payments, variable consideration on concentrate sales, and refining fee classification under the new standard. Based on preliminary findings, Yanacocha does not expect these areas to have a significant impact on revenue recognition. Yanacocha expects to have an update to the impacts of the standard in second quarter of 2017.
Yanacocha anticipates adopting the new standard effective January 1, 2018. The guidance may be applied retrospectively for all periods presented or retrospectively with the cumulative effect of initially applying the guidance recognized at the date of initial application. Yanacocha currently anticipates adopting the standard retrospectively with the cumulative effect of initially applying the amended guidance recognized at January 1, 2018.
| 96 |
IFRS 16 Leases
IFRS 16 was issued in January 2016 and it replaces IAS 17 Leases. IFRS 16 sets out the principles for the recognition, measurement, presentation and disclosure of leases and requires lessees to account for all leases under a single on-balance sheet model similar to the accounting for finance leases under IAS 17. The standard includes two recognition exemptions for lessees – leases of ‘low-value’ assets (e.g., personal computers) and short-term leases (i.e., leases with a lease term of 12 months or less). IFRS 16 is effective for annual periods beginning on or after January 1, 2019. Early application is permitted, but not before an entity applies IFRS 15. In 2017, Yanacocha plans to assess the potential effect of IFRS 16 on its consolidated financial statements.
Results of Operations for the Years Ended December 31, 2016 and 2015
Sales
Gold sales. Gold sales decreased by 26%, or US$278 million, from 2015 to 2016, due to lower ounces sold as a result of lower production, partially offset by the increased realized price. Gold ounces produced decreased 29% due primarily to lower mill throughput, recovery and grade, and lower leach tons placed at a lower grade. Yanacocha has not engaged in gold price hedging activities, such as forward sales or option contracts, to minimize its exposure to fluctuations in the price of gold. Production by mine was as follows:
| Mine (1) | 2016 | 2015 | ||||||
| (ounces) | ||||||||
| Cerro Yanacocha | 176,263 | 54,677 | ||||||
| Carachugo | 124,886 | 87,146 | ||||||
| Maqui Maqui | 28,105 | 67,195 | ||||||
| La Quinua | 188,095 | 596,638 | ||||||
| Cerro Negro | 137,584 | 112,035 | ||||||
| Total | 654,934 | 917,690 | ||||||
Costs applicable to sales
Costs applicable to sales for the year ending December 31, 2016 and 2015 comprised:
| 2016 | 2015 | |||||||
| (US$ in thousands) | ||||||||
| Beginning balance of finished goods and in-process | 544,325 | 660,763 | ||||||
| Beginning balance of provision for net realizable value | (90,298 | ) | (163,094 | ) | ||||
| Consumption of supplies | 228,376 | 210,384 | ||||||
| Personnel expenses | 87,258 | 102,867 | ||||||
| Other services | 73,779 | 76,490 | ||||||
| Maintenance | 36,213 | 38,646 | ||||||
| Power | 27,270 | 27,713 | ||||||
| Depreciation and amortization | 140,712 | 223,142 | ||||||
| Workers’ profit participation | 12,394 | 28,852 | ||||||
| Reclamation expenses related to leach pad | 78,494 | - | ||||||
| Ending balance of provisions for net realizable value | 84,374 | 90,298 | ||||||
| Ending balance of finished goods and in-process | (446,503 | ) | (544,325 | ) | ||||
| 776,394 | 751,736 | |||||||
Costs applicable to sales . Costs applicable to sales include: (i) operating costs, consisting primarily of direct production costs such as mining and treatment of the ore, which are the most significant components of costs applicable to sales, (ii) workers’ participation profit sharing of 8% of pre-tax profits based on Peruvian labor legislation, (iii) write downs of ore on leach pads to net realizable value expense and (iv) other costs. Costs applicable to sales increased by 3% or US$25 million from 2015 to 2016. Costs applicable to sales per ounce of gold increased by 49% from US$819 in 2015 to US$1,219 in 2016.
Operating costs decreased by 1% from US$456 million in 2015 to US$453 million in 2016. Operating costs consist primarily of drilling, blasting, loading, hauling and milling costs.
| 97 |
Reclamation expenses related to leach pads of US$78 million is due to a non-cash charge to reclamation expenses for the quarter ended December 31, 2016, related to the areas of Yanacocha’s operations no longer in production. The increase to the reclamation liability is primarily due to higher estimated long-term water management costs, heap leach earthworks and related support activities.
Workers’ profit participation decreased by 57%, from US$29 million in 2015 to US$12 million in 2016. This decrease was directly related to the decrease in Yanacocha’s taxable income from 2015 to 2016. Workers’ profit participation expense is calculated based on taxable net income and in accordance with Peruvian labor legislation.
The portion of leach pad inventory write-downs associated with costs applicable to sales decreased from US$72,8 million to US$5.9 million due to the lower mineral in stock.
Inventory variation decreased by 16% from US$116.4 million in 2015 to US$97.8 million in 2016, which increased costs applicable to sales, due to lower consumption of ounces in stock offset by higher costs per ounce in stock compared to the prior year.
Depreciation, depletion and amortization decreased by 37% from US$223 million in 2015 to US$141 million in 2016. This decrease was attributable principally to lower depreciation associated with asset retirement costs and deferred mine development.
Administrative expenses
Administrative expenses for the years ended December 31, 2016 and 2015 were composed of:
| 2016 | 2015 | |||||||
| Management expenses | $ | 7,191 | $ | 18,108 | ||||
| Community development expenses and | ||||||||
| external affairs | - | 6,297 | ||||||
| Other | 1,589 | 1,920 | ||||||
| $ | 8,780 | $ | 26,325 | |||||
Other operating expenses, net
Other operating expenses, net for the years ended December 31, 2016 and 2015 were as follows:
| 2016 | 2015 | |||||||
| Exploration and advance project | $ | 49,580 | $ | 64,230 | ||||
| Severance program | 9,659 | 14,904 | ||||||
| Write-off of fixed assets | 14,036 | 2,411 | ||||||
| Others, net | (1,779 | ) | 1,301 | |||||
| $ | 71,496 | $ | 82,846 | |||||
Exploration and advanced project costs decreased from US$64 million in 2015 to US$50 million in 2016. This decrease was primarily due to less drilling activity in 2016, reduction in the number of drill machines (from ten in 2015 to three in 2016) and lower headcount expenses in 2016 than 2015.
Impairment of long-lived assets
As a result of the recoverable amount analysis performed during the year, Yanacocha recorded an impairment loss related to the Yanacocha mine of US$889.5 million (US$872.2 million and US$17.3 million related to property, plant and equipment and intangible assets, respectively). In 2015, Yanacocha did not recognize an impairment loss. In 2014, Yanacocha recorded an impairment loss amounting to US$541.1 million related to the Conga project, and no loss was recorded for the Yanacocha mine.
Key assumptions used for the impairment testing as of December 31, 2016 included:
Production volumes : Estimated production volumes are based on detailed life-of-mine plans and take into account development plans for the mines agreed by management as part of planning process. Production volumes are dependent on a number of variables, such as: the recoverable quantities; the production profile; the cost of the development of the infrastructure necessary to extract the reserves; the production costs; the contractual duration of mining rights; and the selling price of the commodities extracted.
| 98 |
As each producing mining unit has specific reserve characteristics and economic circumstances, the cash flows of the mines are computed using appropriate individual economic models and key assumptions established by management. The production profiles used were consistent with the reserves and resource volumes approved as part of Yanacocha’s process for the estimation of proved and probable reserves and resource estimates.
Commodity prices : Forecasted commodity prices are based on management’s estimates and are derived from forward price curves and long-term views of global supply and demand, building on past experience of the industry and consistent with external sources. These prices were adjusted to arrive at appropriate consistent price assumptions for the different qualities and type of commodities, or, where appropriate, contracted prices were applied. These prices are reviewed at least annually.
Estimated prices for the current and long-term periods that have been used to estimate future revenues are as follows:
| Current | Long-term | |||||||
| US$ | US$ | |||||||
| Gold (per ounce) | 1,221 | 1,300 | ||||||
Discount rate : In calculating the value in use, a pre-tax discount rate of 7.1% was applied to the pre-tax cash flows. This discount rate is derived from Yanacocha’s post-tax weighted average cost of capital, with appropriate adjustments made to reflect the risks specific to the cash generating unit.
Income tax provision.
Yanacocha’s financial and operating results included income and mining tax expense of US$43 million in 2016 compared to US$602.7 million in 2015. This decrease was directly related to the decrease in Yanacocha’s income from 2016 to 2015.
Net loss
Net loss increased by US$593.6 million, from net loss of US$450.2 million in 2015 to net loss of US$1,043.7 million in 2016, mainly explained by an impairment adjustment of US$889.5 million, partially offset by the write-off of the deferred income tax asset recorded in 2015 of US$483.0 million.
Results of Operations for the Years Ended December 31, 2015 and 2014
Sales
Gold sales. Gold sales decreased by 12%, or US$140 million, from 2014 to 2015, due to a decrease in the number of ounces sold and a decreased average realized price of gold. The decline in ounces sold was proportionate to lower gold production. Gold ounces produced decreased 5.4% due to a decrease in the amount of leach grade material placed on the leach pads compared to prior year as well as lower mill grade and recovery. Yanacocha has not engaged in gold price hedging activities, such as forward sales or option contracts, to minimize its exposure to fluctuations in the price of gold. Production by mine was as follows:
| Mine (1) | 2015 | 2014 | ||||||
| (ounces) | ||||||||
| Cerro Yanacocha | 54,677 | 30,713 | ||||||
| Carachugo | 87,146 | 286,062 | ||||||
| Maqui Maqui | 67,195 | 5,669 | ||||||
| La Quinua | 596,638 | 595,751 | ||||||
| Cerro Negro | 112,035 | 51,749 | ||||||
| Total | 917,690 | 969,944 | ||||||
| 99 |
| (1) | Ounces produced included El Tapado Oeste Pit, Cerro Negro Pit, Marleny Pit production and Verde Bioleach Demonstration Facility. |
Costs applicable to sales
Costs applicable to sales for the year ending December 31, 2015 and 2014 comprised:
| 2015 | 2014 | |||||||
| (US$ in thousands) | ||||||||
| Beginning balance of finished goods and in-process | 660,763 | 669,938 | ||||||
| Beginning balance of provision for net realizable value | (163,094 | ) | (147,342 | ) | ||||
| Consumption of supplies | 210,384 | 246,106 | ||||||
| Other services | 76,490 | 82,805 | ||||||
| Maintenance | 38,646 | 38,526 | ||||||
| Power | 27,713 | 24,942 | ||||||
| Depreciation and amortization | 223,142 | 360,334 | ||||||
| Workers’ profit participation | 28,852 | 35,055 | ||||||
| Reclamation expenses related to leach pad | - | 20,315 | ||||||
| Ending balance of provision for net realizable value | 90,298 | 163,094 | ||||||
| Ending balance of inventories | (544,325 | ) | (660,763 | ) | ||||
| 751,736 | 920,300 | |||||||
Costs applicable to sales . Costs applicable to sales include: (i) operating costs, consisting primarily of direct production costs such as mining and treatment of the ore, which are the most significant components of costs applicable to sales, (ii) workers’ participation profit sharing of 8% of pre-tax profits based on Peruvian labor legislation, (iii) write downs of ore on leach pads to net realizable value expense and (iv) other costs. Costs applicable to sales decreased 18% or US$169 million from 2014 to 2015. Ounces sold decreased 4.5% from 2014 to 2015. Costs applicable to sales per ounce of gold decreased by 14%, from US$949 in 2014 to US$819 in 2015.
Operating costs decreased by 9% from US$499.9 million in 2014 to US$456.0 million in 2015. Operating costs consist primarily of drilling, blasting, loading, hauling and milling costs. These costs decreased in 2015 primarily as a result of lower expenses relating to surface mining costs (lower diesel price and lower repairs and maintenance) and lower heap leaching costs, partially offset by higher milling costs (related to cyanide and lime consumption).
Workers’ profit participation decreased by 18%, from US$35 million in 2014 to US$29 million in 2015. This decrease was directly related to the decrease in Yanacocha’s taxable income from 2014 to 2015. Workers’ profit participation expense is calculated based on taxable net income and in accordance with Peruvian labor legislation.
The portion of leach pad inventory write-downs associated with costs applicable to sales decreased from US$15.7 million in 2014 to US$72.8 million (reversal) in 2015 due to higher consumption ounces in stock compared to the prior year.
Inventory variation increased from US$9.2 million in 2014 to US$116.4 million in 2015, which decreased costs applicable to sales, due to higher consumption of ounces in stock offset by the lower costs per ounce in stock compared to the prior year.
Depreciation, depletion and amortization decreased by 38% from US$360 million in 2014 to US$223 million in 2015. This decrease was attributable principally to lower depreciation associated with assets retirement costs and deferred mine development.
Administrative expenses
Administrative expenses for the years ended December 31, 2015 and 2014 were composed of:
| 100 |
| 2015 | 2014 | |||||||
| Management expenses | $ | 18,108 | $ | 19,938 | ||||
| Community development expenses and | ||||||||
| external affairs | 6,297 | 15,653 | ||||||
| Other | 1,920 | 2,671 | ||||||
| $ | 26,325 | $ | 38,262 | |||||
Other operating expense (net)
Other expenses, net for the years ended December 31, 2015 and 2014 were as follows:
| 2015 | 2014 | |||||||
| Exploration and advance project | $ | 64,223 | $ | 58,880 | ||||
| Severance program | 14,904 | 16,438 | ||||||
| Disposal of fixed assets | (135 | ) | 13,530 | |||||
| Other expenses | (671 | ) | (6,149 | ) | ||||
| Others, net | 4,525 | (4,918 | ) | |||||
| $ | 82,846 | $ | 77,781 | |||||
Exploration and advanced projects costs also increased from US$58.8 million in 2014 to US$64 million in 2015. This increase was primarily due to higher activities in 2014 than 2015 for projects such as the Chaquicocha tunnel and Quecher main.
Income tax provision.
Yanacocha’s financial and operating results included income and mining tax expense of US$(602.7) million in 2015 compared to US$30.5 million in 2014. The difference was primarily due to the write-off of the deferred income tax asset of US$510 million.
Net income.
Net income decreased by US$49.9 million, from US$(400.3) million in 2014 to US$(450.2) million in 2015, mainly explained by higher expenses in income tax provision due to a the write-off of the deferred income tax asset and lower revenues from sales due to lower production, offset by reduction in operating costs and the lack of asset impairments during 2015.
B. Liquidity and Capital Resources
As of December 31, 2016, Yanacocha had cash and cash equivalents of US$667 million, substantially all of which were held in U.S. Dollars, as compared to US$944 million as of December 31, 2015.
Cash provided by operating activities
Yanacocha generated net cash flow from operations of US$140 million in 2016 and US$274 million in 2015. The net cash flow from operations in 2016 was 49% or US$134 million lower than in 2015. The decrease was primarily driven by lower gold sales.
Yanacocha generated net cash flow from operations of US$274 million in 2015 and US$375 million in 2014. The net cash flow from operations in 2015 was 27% or US$101 million lower than in 2014. The decrease was primarily driven by a lower gold sales and higher expenses for explorations and advanced projects.
Cash used in investing activities
Net cash used in investing activities was US$106 million in 2016 compared to US$117 million in 2015. The decrease in cash used in investing activities was mainly due to lower costs associated with the construction of the water treatment plant located in Quinua (in 2015 the purchase of older equipment was made) and lower investment in assets componentization due to equipment condition monitoring, offsetting higher expenses in 2016 related to the Yanacocha Laybacks Project for the construction of the northern tailing.
| 101 |
Net cash used in investing activities was US$117 million in 2015 and US$176 million in 2014. The decrease in cash used in investing activities was due primarily to decreased capital expenditures.
Cash used in financing activities
Net cash used in financing activities was US$300 million in 2016, (US$0 million in 2015 and 2014). On February 15, 2016, Yanacocha’s board of directors unanimously agreed to distribute dividends in the amount of US$300 million, in proportion to each shareholder’s equity interest, which corresponds to a portion of the accumulated results as of December 31, 2014, that were generated in 2011.
C. Capital Expenditures
Yanacocha’s capital expenditures from its formation in 1992 through 2016 totaled approximately US$296 million, including capital expenditures of US$117 million in 2014, US$96.2 million in 2015 and US$83 million in 2016.
In 2016, Yanacocha’s principal capital expenditures included the construction of water treatment facilities, a tailings facility expansion, capitalized component purchases and infrastructure improvements.
D. Research and Development
Yanacocha is a mining exploration and production company and does not engage in research and development activities.
E. Trend Information
Other than as disclosed in this Annual Report and the Yanacocha Consolidated Financial Statements (included elsewhere in this Annual Report), Yanacocha has informed us that it is not aware of any trends, uncertainties, demands, commitments or events which are reasonably likely to have a material effect upon Yanacocha’s net sales or revenues, income from continuing operations, profitability, liquidity or capital resources, or that would cause reported financial information to not necessarily be indicative of future operating results or financial condition.
F. Off-Balance Sheet Arrangements
Yanacocha has informed us that there are no off-balance sheet arrangements that have or are reasonably likely to have a current or future effect on Yanacocha’s financial condition, changes in financial condition, revenues or expenses, results of operations, liquidity, capital expenditures or capital resources that are material to investors.
G. Tabular Disclosure of Contractual Obligations
The following table shows Yanacocha’s contractual obligations as of December 31, 2016:
| Payments due by Period (US$ in millions) | ||||||||||||||||||||
| Total | Less than1 year | 1-3 years | 3-5 years |
More than
5 years |
||||||||||||||||
| Long-Term Debt | - | - | - | - | - | |||||||||||||||
| Capital Lease Obligations | - | - | - | - | - | |||||||||||||||
| Reclamation and Remediation Liability | 1,013 | 16 | 67 | 90 | 840 | |||||||||||||||
| Open Purchase Orders receipt | - | - | - | - | - | |||||||||||||||
| Other Long-Term Obligations (*) | 24 | - | 24 | - | - | |||||||||||||||
| Total Contractual Cash Obligations | 1,037 | 16 | 91 | 90 | 840 | |||||||||||||||
| (*) | Other Long-Term Obligations includes obligations relating to social development projects and commitments. |
| 102 |
CERRO VERDE
Introduction
The following discussion should be read in conjunction with the Cerro Verde Financial Statements as of December 31, 2015 and 2016 and for the years ended December 31, 2014, 2015, and 2016 and the related notes thereto included elsewhere in this Annual Report. The Cerro Verde Financial Statements are prepared and presented in accordance with IFRS as issued by the IASB.
A. Operating Results
Overview
We hold a 19.58% interest in Cerro Verde, which operates an open-pit copper and molybdenum mining complex located 20 miles southwest of Arequipa, Peru. The site is accessible by paved highway. The Cerro Verde mine has been in operation since 1976, and was previously owned by the Peruvian government before its privatization in 1993. Freeport-McMoRan Inc. holds a majority interest in Cerro Verde.
The Cerro Verde mine is a porphyry copper deposit that has leachable oxide and secondary sulfide mineralization, and millable primary sulfide mineralization. The predominant oxide copper minerals are brochantite, chrysocolla, malachite and copper “pitch.” Chalcocite and covellite are the most important secondary copper sulfide minerals. Chalcopyrite and molybdenite are the dominant primary sulfides.
In September 2015, Cerro Verde’s expansion project commenced operations. The project achieved full capacity operating rates during the first quarter of 2016. The project, with a cost of US$5.3 billion, expanded the processing capacity from 120,000 metric tons of ore per day to 360,000 metric tons of ore per day.
Cerro Verde’s current operations consist of an open-pit copper mine, a 360,000 ton-per-day concentrator and leaching facilities. Leach-copper production is derived from a 39,000 ton-per-day crushed leach facility and a leach system. This leaching operation has a capacity of approximately 200 million pounds of copper per year.
Cerro Verde has sufficient equipment to move an average of 308,000 tons of material per day using a fleet of haul trucks. Copper cathodes and concentrate production are transported approximately 70 miles by truck and rail to the Pacific Port of Matarani for shipment to international markets.
Cerro Verde receives electrical power under long-term contracts with electric utility companies. Water for Cerro Verde’s processing operations comes from renewable sources through a series of storage reservoirs, which Cerro Verde believes will be sufficient to support its currently planned operations.
Presented in the table below are certain summary financial and operating data regarding Cerro Verde for the years ended December 31, 2014, 2015 and 2016:
| As of and for the year ended December 31, | ||||||||||||
| 2014 | 2015 | 2016 | ||||||||||
| Income statement data (1) | ||||||||||||
| Sales of goods (US$ in thousands) | 1,467,097 | 1,115,617 | 2,384,154 | |||||||||
| Profit for the year (US$ in thousands) | 377,606 | 33,284 | 340,907 | |||||||||
| Proven and Probable Reserves (2) | ||||||||||||
| Proven: | ||||||||||||
| Leachable ore reserves (tons in thousands) | 46,426 | 47,603 | 43,000 | |||||||||
| Millable ore reserves (tons in thousands) | 881,338 | 925,365 | 854,000 | |||||||||
| Probable: | ||||||||||||
| Leachable ore reserves (tons in thousands) | 121,954 | 104,963 | 78,000 | |||||||||
| Millable ore reserves (tons in thousands) | 2,903,516 | 2,778,009 | 2,698,000 | |||||||||
| Average copper grade of leachable ore reserves (%) | 0.37 | 0.35 | 0.32 | |||||||||
| Average copper grade of millable ore reserves (%) | 0.38 | 0.38 | 0.37 | |||||||||
| Production (3) | ||||||||||||
| Cathodes (in thousands of recoverable pounds) | 124,804 | 105,077 | 107,960 | |||||||||
| Concentrates (in thousands of recoverable pounds) | 375,438 | 439,405 | 999,850 | |||||||||
| Average realized price of copper sold (US$ per ton payable) | 6,452 | 4,518 | 4,759 | |||||||||
| 103 |
| (1) | Derived from Cerro Verde’s financial statements. See the Cerro Verde Financial Statements, including the notes thereto, appearing elsewhere in this Annual Report. |
| (2) | Reserve calculations are derived from “Item 3. Key Information – A. Selected Financial Data”. Cerro Verde used US$2.00 per pound of copper to determine copper as of December 31, 2016. The calculation or estimation of proven and probable ore reserves for Cerro Verde may differ in some respects from the calculations of proven and probable reserves for us and Yanacocha located elsewhere in this Annual Report. According to Cerro Verde, ore estimates for Cerro Verde are based upon engineering evaluations of assay values derived from samplings of drill holes and other openings. Cerro Verde’s ore estimates include assessments of the resource, mining and metallurgy, as well as consideration of economic, marketing, legal, environmental, social and governmental factors, including projected long-term prices for copper and molybdenum and Cerro Verde’s estimate of future cost trends. |
| (3) | Derived from “Item 3. Key Information – A. Selected Financial Data”. |
Cerro Verde Mining Royalties
On June 23, 2004, Law N° 28528 was approved, which requires the holder of a mineral concession to pay a royalty in return for the exploitation of metallic and non-metallic minerals. The royalty is calculated using rates ranging from 1% to 3% of the value of concentrate or its equivalent according to the international price of the commodity published by the Ministry of Energy and Mines. As described in Note 13(a) to the Cerro Verde Financial Statements prior to January 1, 2014, these royalties were not applicable to Cerro Verde because Cerro Verde operated under the 1998 Stability Agreement with the Peruvian government. However, beginning January 1, 2014, Cerro Verde began paying royalties and a new special mining tax for its entire production base under its current 15-year stability agreement. See Note 13(b) to the Cerro Verde Financial Statements for a summary of amounts recognized by Cerro Verde for special mining tax and mining royalties for the years ended December 31, 2016, 2015 and 2014.
Superintendencia Nacional de Administración Tributaria (“SUNAT”), has assessed mining royalties on materials processed by Cerro Verde’s concentrator, which commenced operations in late 2006. These assessments cover the period December 2006 to December 2007 and the years 2008 to September 2011.
SUNAT issued resolutions denying the claims made by Cerro Verde from December 2006 through December 2009. Cerro Verde appealed this decision to tax court. In July 2013, the Peruvian Tax Tribunal issued two decisions reaffirming assessments for the period December 2006 through December 2008. Decisions by the tax court ended the administrative stage of the appeal procedures for these assessments.
On September 18, 2013, Cerro Verde filed two administrative demands in the court system. In connection with demands for the periods 2006 to 2007, the Eighteenth Contentious Administrative Court dismissed this claim. On May 2, 2016, Cerro Verde appealed this decision.
With respect to the judiciary appeal related to the assessment for the year 2008, on December 17, 2014, the Eighteenth Contentious Administrative Court rendered its decision upholding Cerro Verde’s position and nullifying SUNAT’s assessment and the Peruvian Tax Tribunal’s resolution (S/106.4 million). The Court’s position also invalidates all penalties and interest assessed by SUNAT for that period (S/139.7 million). In December 2014, SUNAT and the tax court appealed this decision. On January 29, 2016, the Sixth Superior Justice Court nullified the decision of the Eighteenth Contentious Administrative Court. On February 23, 2016, Cerro Verde appealed the decision to the Supreme Court.
In September 2013, Cerro Verde filed a constitutional claim in the court system related to the assessments. Cerro Verde believes that its 1998 Stability Agreement exempted all minerals extracted from its mining concessions from royalties, irrespective of the method used for processing those minerals. On September 15, 2016, the Judiciary court dismissed the constitutional claim and on October 25, 2016, Cerro Verde appealed this decision.
| 104 |
On October 1, 2013, SUNAT served Cerro Verde a demand for payment totaling S/492 million (approximately US$146 million based on the December 31, 2016 exchange rate, including interest and penalties of US$86 million) based on the Peruvian Tax Tribunal’s decisions for the period December 2006 to December 2008. As permitted by law, Cerro Verde requested, and was granted, an installment payment program that deferred payment for six months and thereafter satisfies the amount via 66 equal monthly payments. As of December 31, 2016, Cerro Verde has made payments totaling S/323 million (US$104 million based on the date of payment and US$96 million based on December 31, 2016 exchange rates) under the installment program, which are presented in the non-current portion of other non-financial assets in the statements of financial position (see Note 7 to the Cerro Verde Financial Statements). Based on the results rendered by the Eighteenth Contentious Administrative Court as is described above, Cerro Verde requested an injunction that was accepted by the Judiciary and implied a modification of the installment program excluding the 2008 portion through SUNAT’s resolution notified to Cerro Verde on October 29, 2015. On August 18, 2016, the Sixth Superior Justice Court nullified the injunction described above and on September 28, 2016, SUNAT modified the Installment payment program to include the 2008 portion.
In July 2013, a hearing on SUNAT’s assessment for 2009 was held, but no decision has been issued by the Peruvian Tax Tribunal for that year. As of December 31, 2016, the amount of the assessment, including interest and penalties, for the year 2009 was S/268 million (approximately US$80 million based on the December 31, 2016 exchange rate).
In April 2016, Cerro Verde received assessments from SUNAT for the year 2010 and for January to September 2011. On May 11, 2016, Cerro Verde appealed these assessments. At December 31, 2016, the amount of assessments from SUNAT including interest and penalties for the years 2010 and January to September 2011 is S/543 million (approximately US$162 million based on the December 31, 2016 exchange rate).
As of December 31, 2016, Cerro Verde estimates that the total exposure associated with mining royalties for the period from December 2006 to December 2013, including interest and penalties, totals US$544 million (based on the December 31, 2016 exchange rate).
As of December 31, 2016, no provisions were recorded for these assessments or for the amounts paid under the installment payment program because management and its external legal advisors believe Cerro Verde’s 1998 Stability Agreement exempted it from these royalties and believe that the resolution will be favorable to Cerro Verde and any payments should be recoverable.
Critical Accounting Policies
Cerro Verde has furnished us with a discussion of its critical accounting policies and methods used in the preparation of its financial statements. Critical accounting policies are defined as those that are reflective of significant judgments and uncertainties and could potentially impact results under different assumptions and conditions. Note 2 to the Cerro Verde Financial Statements includes a summary of the significant accounting policies and methods used in the preparation of the Cerro Verde Financial Statements. The following is a brief discussion of the identified critical accounting policies and the estimates and judgments made by Cerro Verde.
Estimates of Ore Reserves and Resources
Mineral reserves are the parts of mineral deposit ore that can be economically and legally extracted from the mine concessions. Cerro Verde estimates its mineral reserves based on information compiled by individuals qualified in reference to geological data about the size, depth and form of the ore body, and requires geological judgments in order to interpret the data.
| 105 |
The estimation of recoverable reserves involves numerous uncertainties with respect to the ultimate geology of the ore body, including quantities, grades and recovery rates. Estimating the quantity and grade of mineral reserves requires Cerro Verde to determine the size, shape and depth of the ore body by analyzing geological data. In addition to the geology, assumptions are required to determine the economic feasibility of mining the reserves, including estimates of future commodity prices and demand, future requirements of capital and production costs and estimated exchange rates. Revisions in reserve or resource estimates have an impact on the value of mining properties, property, plant and equipment, provisions for cost of mine closure, recognition of assets for deferred taxes and depreciation and amortization of assets.
UOP Depreciation
Estimated mineral reserves are used in determining the depreciation and/or amortization of mine-specific assets. This results in a depreciation/amortization charge proportional to the depletion of the anticipated remaining life-of-mine production. The life of each item, which is assessed at least annually, is impacted by both its physical life limitations and present assessments of economically recoverable reserves of the mine property where the asset is located. These calculations require the use of estimates and assumptions, including the amount of recoverable reserves.
Inventories
Net realizable value tests are performed at least annually and represent the estimated future sales price of the product based on prevailing spot metals prices, less estimated costs to complete production and bring the inventory to sale. Additionally, in calculating the net realizable value of Cerro Verde’s long-term stockpiles, Cerro Verde’s management also considers the time value of money.
Mill and leach stockpiles generally contain lower grade ores that have been extracted from the ore body and are available for copper recovery. Mill stockpiles contain sulfide ores and recovery of metal is through milling and concentrating. Leach stockpiles contain oxide ores and certain secondary sulfide ores and recovery of metal is through exposure to acidic solutions that dissolve contained copper and deliver it in solution to extraction processing facilities.
Because it is generally impracticable to determine copper contained in mill and leach stockpiles by physical count, a reasonable estimation method is employed. The quantity of material delivered to mill and leach stockpiles is based on surveyed volumes of mined material and daily production records. Sampling and assaying of blast holes cuttings determine the estimated copper grades of material delivered to mill and leach stockpiles.
Expected copper recovery rates for mill stockpiles are determined by metallurgical testing. The recoverable copper in mill stockpiles, once entered into the production process, can be produced into copper concentrate almost immediately.
Expected copper recovery rates for leach stockpiles are determined using small-scale laboratory tests, historical trends and other factors, including mineralogy of the ore and rock type. Total copper recovery in leach stockpiles can vary significantly depending on several variables, including type of copper recovery, mineralogy and the size of the rock. For newly placed material of active stockpiles, as much as 80% of total copper recovery may be extracted during the first year, and the remaining copper may be recovered over many years. Processes and recovery rates are monitored continuously, and recovery rate estimates are adjusted periodically as additional information becomes available and as related technology changes.
Mine Closure Provision
Cerro Verde assesses its provision for remediation and mine closure quarterly. It is necessary to make estimates and assumptions in determining this provision, including cost estimates of activities that are necessary for the rehabilitation of the site, technological and regulatory changes, interest rates and inflation rates. As discussed in Note 2(k) to the Cerro Verde Financial Statements, estimated changes in the fair value of the provision for remediation and mine closure or the useful life of the related assets are recognized as an increase or decrease in the book value of the provision and related asset retirement cost (ARC) in accordance with IAS 16, “Property, Plant and Equipment.”
| 106 |
According to Cerro Verde’s accounting policies, the provision for remediation and mine closure represents the present value of the costs that are expected to be incurred in the closure period of the operating activities of Cerro Verde. Closure budgets are reviewed regularly to take into account any significant change in the studies conducted. Nevertheless, the closure costs of mining units will depend on the market prices for the closure work required, which would reflect future economic conditions. Also, the timing of disbursements depends on the useful life of the mine, which is based on estimates of future commodity prices.
If any change in the estimate results in an increase to the provision for remediation and mine closure and related ARC, Cerro Verde shall consider whether or not this is an indicator of impairment of the assets and will apply impairment tests in accordance with IAS 36, “Impairments of Assets.”
Impairment of Long-lived Assets
Cerro Verde has determined that its operations consist of one cash generating unit. Therefore, Cerro Verde’s operations are evaluated at least annually in order to determine if there are impairment indicators. If any such indication exists, Cerro Verde makes an estimate of the recoverable amount, which is the greater of the fair value less costs to sell and the value in use. These assessments require the use of estimates and assumptions, such as long-term commodity prices, discount rates, operating costs and others.
Fair value is defined as the amount that would be obtained from the sale of the asset in an arm’s-length transaction between willing and knowledgeable parties. The fair value of assets is generally determined as the current value of future cash flows derived from the continuous use of the asset, which includes estimates, such as the cost of future expansion plans and eventual disposal, while applying assumptions that an independent market participant may take into account. The cash flows are discounted by applying a discount rate that reflects the current market, the time value of money and the risks specific to the asset.
Contingencies
By their nature, contingencies will only be resolved only when one or more uncertain future events occur or fail to occur. The assessment of the existence and potential amount of contingencies inherently involves the exercise of significant judgment and the use of estimates regarding the outcome of future events.
Stripping cost
Cerro Verde incurs waste removal costs (stripping costs) during the development and production phases of its surface mining operations. During the production phase, stripping costs (production stripping costs) can be incurred both in relation to the production of inventory in that period and the creation of improved access and mining flexibility in relation to ore to be mined in the future. The former are included as part of the costs of inventory, while the latter are capitalized as a stripping activity asset, where certain criteria are met.
Once Cerro Verde has identified its production stripping costs for each surface mining operation, it identifies the separate components of the ore bodies for each of its mining operations. An identifiable component is the specific volume of the ore body that is made more accessible by the stripping activity. Significant judgment is required to identify and define these components, and also to determine the expected volumes (e.g., in tons) of waste to be stripped and ore to be mined in each of these components.
Results of Operations for the Years Ended December 31, 2016 and 2015
Net sales. Net sales, including and mark-to-market adjustments for pounds of copper pending settlement, increased by 114%, from US$1,115.6 million in 2015 to US$2,384.1 million in 2016, principally due to higher copper concentrate volume sold as a result of achieving full production in the new concentrator. The following table reflects the average realized price and volume sold of copper (both cathode and concentrate) during the years ended December 31, 2015 and 2016:
| Year ended December 31, | ||||||||||||
| 2015 | 2016 | Variation | ||||||||||
| Average price | ||||||||||||
| Copper (US$ per ton) | 4,518 | 4,759 | 5 | % | ||||||||
| Volume sold | ||||||||||||
| Copper (in tons) | 246,913 | 501,000 | 103 | % | ||||||||
| 107 |
Average realized copper prices per ton increased from US$4,518 in 2015 to US$4,759 in 2016. The volume of copper sold increased from 246,913 tons in 2015 to 501,000 tons in 2016, due to increased production from the new concentrator, which reached maximum operating rates in the first quarter of 2016. The combined effect of these changes resulted in a US$1,268.5 million increase in income from sales of copper in 2016 compared to 2015.
Total costs of sales of goods . Total costs of sales of goods increased from US$862.0 million in 2015 to US$1,533.0 million in 2016, due mainly to the net effect of the following:
(a) Material and supplies consumption cost increased by 36%, from US$364.2 million in 2015 to US$496.9 million in 2016, mainly due to supplies needed for Cerro Verde’s new concentrator;
(b) Labor costs, including workers’ profit sharing, increased by 47%, from US$146.4 million in 2015 to US$215.8 million in 2016, mainly due to an increased number of employees needed to staff the new concentrator and expanded mining operations and profit sharing expenses;
(c) The variation of in process inventories decreased from US$118.3 million in 2015 to US$3.8 million in 2016 as a result of less lower concentrate grade material placed in 2016;
(d) Depreciation and amortization costs increased by 93%, from US$244.5 million in 2015 to US$473.0 million in 2016, mainly due to higher depreciation associated with the plant and equipment related to the new concentrator;
(e) Repair and maintenance services increased by 6%, from US$95.1 million in 2015 to US$100.9 million in 2016; and
(f) Energy costs increased by 94%, from US$118.0 million in 2015 to US$229.0 million in 2016, mainly due to increased electricity used by the new concentrator.
Total operating expenses. Operating expenses increased by 88%, from US$82.8 million in 2015 to US$155.5 million in 2016, due mainly to the following:
(a) Selling expenses increased by 134%, from US$56.2 million in 2015 to US$131.4 million in 2016, mainly due to a greater volume sold during 2016; and
(b) Other expenses decreased by US$2.6 million in 2016.
Income tax . Income tax expense, including current and deferred expense, increased by 469%, from an expense of US$46.2 million in 2015 to an expense of US$263.1 million in 2016. Net current income tax expense (including mining taxes) increased by US$167.3 million due to higher profits in 2016.
Net income. As a result of the foregoing, net income increased by 924%, from US$33.3 million in 2015 to US$340.9 million in 2016. As a percentage of net sales, net income was 14% in 2016, compared with 3% in 2015.
Results of Operations for the Years Ended December 31, 2015 and 2014
Net sales. Net sales, including and mark-to-market adjustments for pounds of copper pending settlement, decreased by 24%, from US$1,467.1 million in 2014 to US$1,115.6 million in 2015, principally due to a decrease in average realized copper prices during 2014 partially offset by higher volume of copper sold. The following table reflects the average realized price and volume sold of copper (both cathode and concentrate) during the years ended December 31, 2014 and 2015:
| Year ended December 31, | ||||||||||||
| 2014 | 2015 | Variation | ||||||||||
| Average price | ||||||||||||
| Copper (US$ per ton) | $ | 6,452 | 4,518 | -30 | % | |||||||
| Volume sold | ||||||||||||
| Copper (in tons) | 227,402 | 246,913 | 9 | % | ||||||||
| 108 |
Average realized copper prices per ton decreased from US$6,452 in 2014 to US$4,518 in 2015. The volume of copper sold increased from 227,402 tons in 2014 to 246,913 tons in 2015, due to an increase in the volume of copper concentrates sold associated with Cerro Verde’s new concentrator plant that commenced operation in September 2015. The combined effect of these changes resulted in a US$351.5 million decrease in income from sales of copper in 2015 compared to 2014.
Total costs of sales of goods . Total costs of sales of goods increased from US$797.5 million in 2014 to US$862.0 million in 2015, due mainly to the net effect of the following:
(a) Material and supplies consumption cost increased by 9%, from US$333.5 million in 2014 to US$364.2 million in 2015, mainly due to increased consumption of supplies for Cerro Verde’s new concentrator plant.
(b) Labor costs, including workers’ profit sharing, decreased by 15%, from US$171.6 million in 2014 to US$146.4 million in 2015, mainly due to lower profit sharing in 2015 as compared to 2014 as a result of lower profits;
(c) The variation of in process inventories increased from US$70.5 million in 2014 to US$118.3 million in 2015 as a result of higher material due to the new concentrator plant and the current mining plan of processing high grade concentrates first and then low grade concentrates;
(d) Depreciation and amortization costs increased by 48%, from US$165.0 million in 2014 to US$244.5 million in 2015, mainly due to depreciation associated with Cerro Verde’s new concentrator plant;
(e) Repair and maintenance services increased by 9%, from US$87.5 million in 2014 to US$95.1 million in 2015; and
(f) Energy costs increased by 29%, from US$91.8 million in 2014 to US$118.0 million in 2015, mainly due to Cerro Verde’s new concentrator plant.
Total operating expenses. Operating expenses increased by 43%, from US$57.8 million in 2014 to US$82.8 million in 2015, due mainly to changes in the following components:
(a) Selling expenses increased by 4%, from US$54.2 million in 2014 to US$56.2 million in 2015, mainly due to higher copper concentrate sales during 2015; and
(b) Other expenses increased by US$23.0 million in 2015 mainly due to costs associated with commencing operations at Cerro Verde’s new concentrator plant.
Income tax. Income tax expense, including current and deferred expense, decreased by 81%, from an expense of US$238.5 million in 2014 to an expense of US$46.2 million in 2015. Net current income tax expense (including mining taxes) decreased by US$262.1 million due to lower taxable income and an increase in deferred tax expense by 69.8 million (mainly related to a temporary tax difference associated with the depreciation of fixed assets).
Net income. As a result of the foregoing, net income decreased by 9%, from US$377.6 million in 2014 to US$33.3 million in 2015. As a percentage of net sales, net income was 3% in 2015, compared with 26% in 2014.
B. Liquidity and Capital Resources
As of December 31, 2016, Cerro Verde had cash and cash equivalents of US$30.0 million, compared to US$6.0 million at December 31, 2015.
| 109 |
Cash provided by (used in) operating activities for the years ended December 31 , 2016 and 2015. Net cash and cash equivalents provided by operating activities were US$946 million in 2016, compared to net cash used in operating activities of US$194.4 million in 2015. This change in net cash flow provided by operating activities in 2016 compared with 2015 was mainly attributable to the following factors:
| · | an increase in proceeds from sales from US$1,120 million in 2015 to US$2,158 million in 2016; |
| · | an increase in value-added tax (VAT) refunds from SUNAT from US$3 million in 2015 to US$360 million in 2016; |
| · | a decrease in payments of income tax from US$121 million in 2015 to US$69 million in 2016; and |
| · | an increase in payments to the supplier and other operational expenses from US$1,196 million in 2015 to US$1,503 million in 2016. |
Cash provided by operating activities for the years ended December 31 , 2015 and 2014. Net cash and cash equivalents used in operating activities were US$194.4 million in 2015, compared to net cash provided by operating activities of US$186.6 million in 2014. This change in net cash flow provided by (used in) operating activities in 2015 compared with 2014 was mainly attributable to the following factors:
| · | a decrease in proceeds from sales from US$1,691 million in 2014 to US$1,120 million in 2015; |
| · | a decrease in payment of income tax from US$315 million in 2014 to US$121 million in 2015; and |
| · | a decrease in payments under protest related to tax assessments from SUNAT from US$166 million in 2014 to US$35 million in 2015; partially offset by: |
| · | an increase of payments to supplier and operational expenses from US$1,023 million in 2014 to US$1,158 million in 2015. |
Cash used in investing activities for the years ended December 31, 2016 and 2015. Net cash used in investing activities decreased from US$1,784.7 million in 2015 to US$478.8 million in 2016, mainly due to lower payments related to the purchase of property, plant and equipment of US$1,242 million, primarily related to the Cerro Verde Unit Expansion Project during 2016, and a decrease in stripping asset activity of US$51 million in 2016.
Cash used in investing activities for the years ended December 31, 2015 and 2014. Net cash used in investing activities increased from US$1,469.4 million in 2014 to US$1,784.7 million in 2015, mainly due to the return in 2014 of a time deposit in the amount of US$225 million at a local bank in order to endorse a guarantee letter as an injunction to SUNAT, and an increase in stripping asset activity of US$62.7 million in 2015.
Cash used in financing activities for the years ended December 31 , 2016 and 2015 . Net cash and cash equivalents used in financing activities was US$443.2 million in 2016, compared to net cash provided in financing activities of US$1,965.5 million in 2015. The decrease in net cash in financing activities was primarily due to a decrease in proceeds from loans under all Cerro Verde credit facilities, including partners, of US$2,146 million, and an increase in repayment of loans of US$265 million.
Cash used in financing activities for the years ended December 31 , 2015 and 2014 . Net cash and cash equivalents used in financing activities was US$1,965.5 million in 2015, mainly associated with aggregate drawings of US$1,375 million from the US$1.8 billion available under a syndicated credit facility that Cerro Verde entered into in March 2014 and US$600 million borrowed under a shareholder loan. Net cash used in financing activities was US$447.8 million in 2014.
Long-term Debt
As of December 31, 2016, Cerro Verde had total long-term debt of US$1.4 million in connection with amounts drawn from a five year US$1.8 billion unsecured credit facility and financial lease contract liability (excluding loans with shareholders).
| 110 |
C. Research and Development
Not applicable.
D. Trend Information
Other than as disclosed in this Annual Report, Cerro Verde has informed us that it is not aware of any trends, uncertainties, demands, commitments or events which are reasonably likely to have a material effect upon Cerro Verde’s net sales or revenues, income from continuing operations, profitability, liquidity or capital resources, or that would cause reported financial information to not necessarily be indicative of future operating results or financial condition
E. Off-Balance Sheet Arrangements
Cerro Verde has informed us that there are no off-balance sheet arrangements that have or are reasonably likely to have a current or future effect on Cerro Verde’s financial condition, changes in financial condition, revenues or expenses, results of operations, liquidity, capital expenditures or capital resources that are material to investors.
F. Tabular Disclosure of Contractual Obligations
The following table shows Cerro Verde’s contractual obligations as of December 31, 2016:
| Payments due by Period (US$ in millions) | ||||||||||||||||
| Total |
Less than 1
year |
1-5
years |
More than 5
years |
|||||||||||||
| Provision for Remediation and Mine Closure | 153 | - | 5 | 148 | ||||||||||||
|
Other Current and Long-Term Contractual
Obligations |
2,174 | 168 | 2,006 | - | ||||||||||||
| Total Contractual Cash Obligations | 2,327 | 168 | 2,011 | 148 | ||||||||||||
| ITEM 6. | Directors, Senior Management and Employees |
A. Board of Directors and Senior Management
Our Board is responsible for policy decisions and our overall direction and other corporate matters in accordance with our By-laws and the Peruvian Companies Law. Our executive officers oversee our business and are responsible for the execution of the policy decisions of the Board. The Board, which must be composed of seven members, is elected at the annual obligatory meeting of shareholders, or the “Annual Obligatory Meeting,” for a three-year term. The last election took place in March 2017, and the next election is scheduled for March 2020. See “Item 10. Additional Information—B. Memorandum and Articles of Association.”
Our current directors and executive officers are as follows:
| Name | Age | Position |
Date First
Appointed |
Current Term
Ends |
||||||||
| Directors | ||||||||||||
| Roque Benavides (1) | 62 | Chairman of the Board | 1980 | March 2020 | ||||||||
| Jose Miguel Morales (1) | 71 | Director | 2012 | March 2020 | ||||||||
| Igor Gonzales | 62 | Director | 2014 | March 2020 | ||||||||
| Felipe Ortiz-de-Zevallos | 69 | Director | 2003 | March 2020 | ||||||||
| Germán Suárez | 76 | Director | 2005 | March 2020 | ||||||||
| William Champion | 63 | Director | 2016 | March 2020 | ||||||||
| Diego de la Torre | 54 | Director | 2017 | March 2020 | ||||||||
| 111 |
| Executive Officers | ||||||||||||
| Victor Gobitz | 52 | President and Chief Executive Officer | 2017 | |||||||||
| Carlos E. Gálvez | 64 | Vice President and Chief Financial Officer | 2001 | |||||||||
| Raúl Benavides (1) | 61 | Vice President Business Development | 2014 | |||||||||
| Alejandro Hermoza | 55 | Vice President Community Relations | 2008 | |||||||||
| Igor Gonzales | 62 | Vice President Operations | 2014 | |||||||||
| Gulnara la Rosa | 52 | General Counsel | 2012 | |||||||||
| Leandro Garcia | 49 | General Comptroller and Compliance Officer | 2011 |
| (1) | Roque Benavides is the brother of Raúl Benavides, and José Miguel Morales is the brother-in-law of Roque Benavides and Raúl Benavides. |
Set forth below is biographical information concerning members of our management.
Roque Benavides, Chairman of the Board and member of the Nominating Committee. Mr. Benavides received a B.S. in Engineering from Pontificia Universidad Católica del Perú in Lima, Peru in 1977 and an M.B.A. from Henley, The Management College of Brunnel University in 1980 and completed the Program for Management Development at the Harvard Business School in 1985 and the Advanced Management Program at Templeton College of Oxford University in 1997. He is a board member of Banco de Crédito and UNACEM, both Peruvian companies. He currently is serving as an executive officer and as a member of the board of several of our related companies. Mr. Benavides was previously President of Sociedad Nacional de Minería, Petróleo y Energía and Confederación Nacional de Instituciones Empresariales Privadas (National Confederation of Private Companies, or CONFIEP).
José Miguel Morales, Director and member of the Nominating and Corporate Governance Committees. Mr. Morales received his law degree from Pontificia Universidad Católica del Perú in 1968 and completed the Sloan Program at Stanford University’s Graduate School of Business in 1976. Mr. Morales was our General Counsel from 1973 to 2012 and was appointed a member of the Board in 2012. Since 1973, he also has been a partner of Estudio Aurelio García Sayán Abogados, a Lima law firm, and has been the Senior Partner since 2007. On January 31, 2005, Mr. Morales ended his tenure as President of Sociedad Nacional de Minería, Petróleo y Energía and served as President of CONFIEP until 2007. He promoted the incorporation of Empresarios por la Educación, a non-profit organization to improve education in Peru, serving as its President since 2007.
Igor Gonzales, Director, Vice President Operations and member of the Nominating/Corporate Governance Committee. Mr. Gonzales is a Chemical Engineer from Universidad Nacional San Antonio Abad del Cusco, Peru, with 35 years of experience. Mr. Gonzales received an M.S. in Extractive Metallurgy from New Mexico Institute of Mining and Technology – Socorro, N.M U.S.A. in 1983 and completed the Advance Management Programme at Henley Management College-England in 2007. He was Vice President and General Manager of Pierina Mine Peru, President of Barrick South America, Chief Operating Officer of Barrick Gold Corporation and worked for Southern Peru Copper Corporation Toquepala –Perú. He has been a board member of Hudbay Minerals Incorporated, Sierra Metals and Minera Corona. He has been a member of the Board since February 27, 2014.
Felipe Ortiz-de-Zevallos, Director and member of the Audit Committee, Compensation Committee and Nominating/Corporate Governance Committee. Mr. Ortiz-de-Zevallos has been a member of the Board since August 2003. He was President of the Universidad del Pacífico, Lima, from 2004 to 2006 and is the founder and chairman of the Board of the Think Tank Grupo APOYO since 1977. Mr. Ortiz-de-Zevallos received a degree in Industrial Engineering from The National University of Engineering in 1968, received an M.S. in Administration and System Analysis from the University of Rochester in 1970 and completed the Owner/President Management program at Harvard Business School in 1996. He was the Peruvian ambassador to the U.S. from 2006 to March 2009. He has also acted as counselor to the Peruvian President, an ad honorem designation as member of the Advisory Committee to the Office of the President.
| 112 |
Carlos del Solar , Director , member of the Audit Committee , Compensation Committee and Nominating/Corporate Governance Committee. Mr. del Solar was appointed a director in March 2011. He graduated with degrees in Geology and Geological Engineering from the National University of San Marcos, earned a Master of Science degree from Stanford University, California and completed the Advanced Executive Management Program at the University of Piura. He started his professional career as an exploration geologist for Mobil Oil in Peru and Central America. Between 1977 and 1998 he worked for Occidental Petroleum in Peru as Exploration Vice President, California as Regional Exploration Manager for Latin America and the Caribbean. Then as Exploration Vice President in Malaysia, Regional Operations Manager for Latin America and later, President and General Manager of the Business Unit in Venezuela. Between 1998 and 2001, Mr. del Solar served as President and General Manager of ARCO for Brazil, Colombia, Peru and Trinidad. In April 2001, he joined Hunt Oil in Peru as President and General Manager and participated in the development of the Camisea gas project and the LNG export project. From January 2005 through January 2007, he served as President of the National Society of Mining, Petroleum and Energy and as First Vice President of CONFIEP from March 2007 through March 2009. From March 2010 to March 2012 Mr. del Solar has served as Second Vice President of the Peruvian Exporters Committee (“COMEXPERU”). He is currently a director and member of the Executive Committees of the National Society of Mining, Petroleum and Energy and of COMEXPERU. Mr. del Solar also serves as President of the Advisory Council of the Graduate School of the Universidad de Ciencias Aplicadas (“UPC”).
German Suárez , Director and Chairman of the Audit Committee and Compensation Committee . Mr. Suárez graduated from the National University of San Marcos with a B.S. in Economics in 1965 and received an M.A. in Economics from Columbia University in 1969. Mr. Suárez has been a member of the Board since March 2005. Mr. Suárez is an economist who was employed by the Central Bank from 1964 to 1990. From 1979 to 1980, he worked at the International Monetary Fund (the “IMF”), representing Perú, and from 1981 to 1990 he was in charge of different posts at the Ministry of Economy and Finance. Mr. Súarez served as Chairman of Banco de la Nación from 1990 to 1992 and Chairman of the Central Bank of Perú from 1992 to 2001. He was a member of the board of directors at Bladex, Extebandes and Arlabank, Latin American Reserves Fund, Credicorp Ltd. and Banco de Crédito del Perú. From 1993 to 2001, Mr. Suárez served as Governor of the IMF and Alternate Governor of the Inter-American Development. For the period from 2000 to 2001, Mr. Suárez was elected Chairman of the G-24 (IMF-World Bank).
Diego de la Torre. Mr. de la Torre holds a degree in Administration from Universidad del Pacifico (Lima, Peru) and a Master of Business Administration from London Business School (England). He is chairman of the board of several Peruvian industrial companies and a board member of Peruvian Precious Metals Corp. (PPX). He is president of the United Nations Global Compact for Peru and a member of the advisory board of the David Rockefeller Center for Latin American Studies at Harvard University. In 2007, he was president of CADE, the most relevant annual business event in Peru.
William Champion , Director. Mr. Champion has been a member of the Board since January 2016. Mr. Champion received Bachelor of Science degrees in Chemical Engineering and Biological Sciences from the University of Arizona. He serves currently as a Principal with Gladiator Mining Group, LLC, a company formed to pursue global investment opportunities within the mining sector. Mr. Champion has worked for over 40 years in the mining industry, and he has extensive executive, management and operations experience across a wide range of mining commodities and global mining jurisdictions. From 2002 to 2014, Mr. Champion worked for Rio Tinto PLC in various senior executive management roles that included Managing Director of Rio Tinto Coal Australia, Managing Director of Rio Tinto Diamonds and President and CEO of Kennecott Utah Copper. Prior to that, Mr. Champion held the position of Executive Vice President for Cyprus Climax Metals from 1995 to 2000, with worldwide responsibilities for copper and molybdenum operations. Additionally, he worked for Phelps Dodge Mining Company in various positions from 1984 to 1995 where, among other duties, he was President of Phelps Dodge Chile.
Victor Gobitz, President and Chief Executive Officer . Mr. Gobitz has served as Chief Executive Officer since January 2017. During his twenty five-year career in the mining industry, Mr. Gobitz has held senior leadership positions with industry-leading mining companies in Peru, Chile, Brazil and Canada. He was Chief Operating Officer of Sociedad Minera El Brocal, as well as Chief Executive Officer of Compañía Minera Milpo and other mining companies. Mr. Gobitz has a degree in Mining Engineering by the Pontificia Universidad Catolica del Peru, received an MBA from the Escuela de Administracion de Negocios (Universidad ESAN) and received executive education from the Wharton and Kellogg business schools.
Carlos E. Gálvez , Vice President and Chief Financial Officer. Mr. Gálvez was the Deputy Manager, Finance and Information Systems, from 1985 to February 2001, when he was appointed Vice President and Chief Financial Officer. He served as Deputy Manager of our Treasury from 1980 to 1985, and as Treasurer from 1978 to 1980. Mr. Gálvez has also served as director of Colquirrumi, our subsidiary, and was appointed director and General Manager of Conenhua in 2000, director and General Manager of Empresa de Generacion Huanza in 2007, director of Compañía Minera Condesa in 2010, director of El Brocal in 2002, director of Contacto S.A. in 2005 and other three related companies. He has served as an alternate member of the Executive Committee of Yanacocha since 2005, Minera La Zanja since 2012 and an alternate board member of Cerro Verde since 2005. He was named President of the Sociedad Nacional de Minería, Petróleo y Energía del Perú (Mining, Petroleum and Energy Society of Peru) in 2015 and has served as director of the same since 2000. Before joining us, Mr. Gálvez served as Managerial Adjunct for Finance and Credit from 1971 to 1978 at Banco Minero del Perú (Mining Bank of Peru). He has also served as a board member of the Comité de Operación Económica del Sistema Eléctrico Nacional (Committee of Economic Operation of the National Electric System). Mr. Gálvez received his B.A. in Economics from the Universidad Nacional Federico Villarreal in 1976, his M.B.A. from the Universidad del Pacifico de Lima in 1980 and completed the Program for Management Development, in 1997, and the Advanced Management Program, in 2005, at The Harvard Business School.
| 113 |
Raúl Benavides Ganoza , Vice President of Business Development. Mr. Benavides has been Vice President of Business Development since 1992. He is also a member of the Executive Committee of Yanacocha and board member of Cerro Verde and several of our related companies. From 1984 to 1996 he was General Manager (CEO) of Compañía de Minas Orcopampa. Before that time, Mr. Benavides was Manager of Operations from 1983 to 1984 and Mine Manager from 1980 to 1983 at Colquirrumi. Since 1995, he has been a professor of mining administration at Pontificia Universidad Católica del Perú . Mr. Benavides also has served as President of the Instituto de Ingenieros de Minas (Institute of Mining Engineering), was also the Founder and President of the Instituto de Seguridad Minera del Perú (Mining Safety Institute of Peru) from 1996 to 2000. Mr. Benavides received a B.S. in Mining Engineering from the University of Missouri-Rolla in 1980, an M.S. in Mineral Engineering-Management from Pennsylvania State University in 1984 and completed the Advanced Management Program at The Harvard Business School in 2001. Since 2014, Mr. Benavides has assumed the management of the Explorations Department.
Alejandro Hermoza Maraví, Vice President Social and Environmental Affairs . A Mechanical Engineer graduated from the University of Maryland, Mr. Hermoza also holds an MSc in Engineering from the same University and an MBA from UPC. He worked as Development Manager for CONFIEP, and later joined us in 2003, where he began as Deputy Manager for Administration and Human Resources. In 2011, Mr. Hermoza completed the Advance Management Program at Harvard Business School.
Leandro Garcia , General Comptroller and Compliance Officer . Mr. Garcia received his Bachelor of Business Administration and Bachelor of Accounting from Universidad del Pacifico and his M.B.A. from the University of Miami, Florida. Mr. Garcia worked at Buenaventura from 1990 to 1997, where he served as Head of Treasury. He performed as CFO in Sociedad Minera El Brocal until 2000. He was also General Manager of BTL Drugstores until 2005 and General Manager of Inkafarma Drugstores until June 2011. He rejoined Buenaventura as General Comptroller in July 2011.
Gulnara La Rosa , General Counsel . Ms. La Rosa has worked at Buenaventura since 1990. She was the Legal Director from 2006 to June 2012 and was appointed as Legal Manager and General Counsel in July 2012. Ms. La Rosa served as Head of the Legal Department from 1997 to 2006 and as a lawyer from 1991 to 1997. Ms. La Rosa received her law degree from Pontificia Universidad Católica del Perú in 1992. She also completed the Corporate Law Specialization Program at Universidad de Navarra , Spain, in 1991 and the High Specialization Program of Finance and Corporate Law at ESAN Graduate School of Business, Perú, in 2001. In addition, Ms. La Rosa attended the Management Program for Lawyers at Yale School of Management in 2005 and the Corporate Governance and Performance Program at Yale School of Management in 2012.
B. Compensation
During the year ended December 31, 2016, the aggregate amount of compensation that we paid to all directors and executive officers was approximately US$1.1 million, including director’s fees accrued in 2015 and paid in 2016. We do not disclose to our shareholders or otherwise make public information with respect to the compensation of our individual directors or executive officers. Please refer to Note 30(e) to the Financial Statements for further information.
C. Board Practices
Audit Committee
The Audit Committee, which is composed entirely of independent directors as defined in Section 303A.02 of the New York Stock Exchange’s Listed Company Manual, is responsible for assisting the Board in the appointment of independent auditors, upon delegation of such responsibility by the shareholders at the general meeting of shareholders, or the “General Meeting,” and reviewing the scope of internal and external audits. The Audit Committee also reviews compliance with internal control systems, reviews our annual and quarterly financial statements, reviews financial statements before their presentation to the Superintendencia del Mercado de Valores , or the SMV (formerly known as the Comisión Nacional Supervisora de Empresas y Valores (National Supervisory Commission of Business and Securities) (“CONASEV”)), the Bolsa de Valores de Lima (Lima Stock Exchange) and the SEC and maintains the integrity of the preparation of audits. The members of the Audit Committee for 2016 were Messrs. Suárez, Ortiz-de-Zevallos and del Solar.
| 114 |
Compensation Committee
The Compensation Committee is responsible for evaluating executive performance and approving executive compensation, including compensation of the chief executive officer and any stock option compensation plans. The members of the Compensation Committee for 2016 were Messrs. del Solar, Ortiz-de-Zevallos and Suárez.
Nominating Committee
The Nominating Committee is responsible for preparing the proposals for the general meetings in respect of the composition of the Board along with the director remuneration to be approved by the shareholders. During 2016 all the members of the Board were also members of this committee.
Corporate Governance Committee
The Corporate Governance Committee is responsible for monitoring issues and practices related to corporate governance and proposing necessary actions in respect thereof. During 2016 all the members of the Board were also members of this committee.
D. Employees
As of December 31, 2016 we, including our subsidiaries and Coimolache, had 3,722 employees (including employees from our mining trainee program and teachers at the schools in our mines). In addition, we have entered into arrangements with independent contractors that employed 14,652 workers at our operations as of December 31, 2016. We have sought to strengthen our workforce by implementing a qualifications-based hiring policy and, with respect to employees working in the mines, reducing the average age of the workforce. As of December 31, 2016, the average tenure of Buenaventura’s permanent laborers was approximately eight years.
Of the 2,982 permanent employees employed by Buenaventura and its subsidiaries directly, approximately 35% are members of 11 different labor unions (including four unions for clerical workers, seven unions for laborers), which represent all clerical workers and laborers in collective bargaining negotiations with us. There are also five unions for workers employed by independent contractors that were formed over the last six years in our mines at Uchucchacua, Orcopampa, La Zanja, Julcani and El Brocal.
Each of the labor unions is a company-based union with an affiliation to a national union. Administrative personnel are not represented by unions. Labor relations for unionized and non-unionized employees in our production facilities, including compensation and benefits, are governed by collective bargaining agreements, the terms and length of which are negotiated throughout the year as the various collective bargaining agreements come up for renewal. These collective bargaining agreements are typically one year in length and set wages for the applicable period, including increases as negotiated and certain other employee benefits, such as overtime, bonuses and family benefits.
During 2016, we did not experience any strikes at our mines. We did experience six days of work stoppage at our Uchucchacua mine, but it was related to affairs with the neighboring community of Oyón rather than to conflicts with our labor unions.
| 115 |
Compensation received by our employees includes salary, other cash payments (such as overtime, vacation pay and bonuses including, but not limited to, high altitude and underground mining bonuses) and non-cash benefits. Non-cash benefits include medical insurance, life insurance and training programs for workers and administrative staff. For mine and processing plant workers, benefits also include transportation services, meals or food allowances, education for children of our employees and housing, hospitals and a full range of social services for our permanent employees and their families at town sites near our mines in compliance with mining regulations. We voluntarily provide power, water and sewage services for the camp and houses of the workers as well as for certain towns nearby. In addition, pursuant to a profit-sharing plan mandated by Peruvian labor legislation, employees of mining companies in Peru are entitled to receive the Employee Profit Sharing Amount equivalent to 8% of the annual pre-tax profits of their employer, 50% of such profits to be distributed based on the number of days each employee worked during the preceding year and the remaining 50% of such profits to be distributed based on the aggregate annual salary of each employee. Effective January 1, 1997, the annual payment to each employee under the profit sharing plan cannot exceed 18 times such employee’s monthly salary, and any difference between the Employee Profit Sharing Amount and the aggregate amount paid to employees must be contributed by us to FONDOEMPLEO, a fund established to promote employment and employee training.
Under Peruvian law, we may dismiss workers for cause by following certain formal procedures. We may dismiss a worker without cause, provided that we pay such worker a layoff indemnification in an amount equal to one and a half month’s salary for each full year worked plus the pro rata portion for any uncompleted year, not to exceed in the aggregate 12 months’ salary. Several decisions adopted by the Peruvian Constitutional Court, holding that an employee is entitled for reinstatement if no cause for dismissal is expressed by the employer or for failure to present evidence supporting the employer’s grounds, have limited our ability to dismiss a worker without cause. However, all employees are entitled to a severance payment upon termination of their employment, regardless of the reason for such termination, equal to approximately one month’s salary for each full year worked plus the pro rata portion for any uncompleted year. Pursuant to the Peruvian labor laws enacted in 1992, we deposit funds for severance payments in a bank account selected by each employee and for the benefit of such employee, in both May and November of each year.
Our permanent employees receive the benefit of one of two types of pension arrangements. All workers can choose to enroll in a public pension fund managed by the state (the “ONP” system) or in a private pension fund (the “AFP” system). We are required to withhold from each of the salaries of the employees enrolled in the ONP system 13% of such employee’s salary, and pay such amount to the ONP system and withhold from the salary of each employee enrolled in the AFP system approximately 12.5% of such employee’s salary, and pay such amounts to the respective AFP (exact amount varies from one AFP to another). Additionally, for workers involved in mining and metallurgical processes, an additional 2% is withheld from their salaries, and we contribute an additional 2% to increase their pension funds. We have no liability for the performance of these pension plans. In addition, our independent contractors are responsible for covering severance and pension payments with respect to their employees.
In addition, we pay ESSALUD 9% of our total payroll for general health services for all permanent employees. Further, Law No. 26790 also requires us to provide private insurance representing an average payment equal to 1.30% of the payroll of covered employees for employment-related incapacity and death for blue collar employees and other employees exposed to mining-related hazards.
E. Share Ownership
As of March 31, 2017, our directors and executive officers, as a group, owned 41,602,976 Common Shares, representing 16.38% of all the 253,986,867 Common and Investment Shares outstanding. Our directors and executive officers do not own any Investment Shares.
The share ownership of the Company’s directors and executive officers on an individual basis as of March 31, 2017 is set forth below:
| Shareholder |
Number
of
Common Shares |
Percentage
Beneficial Ownership of Common Shares |
Number
of
Investment Shares |
Percentage
Beneficial Ownership of Investment Shares |
Number
of
Common Shares and Investment Shares |
Percentage
Beneficial Ownership of Common Shares and Investment Shares |
||||||||||||||||||
| Roque Benavides † | 13,912,006 | 5.48 | 13,912,006 | 5.48 | ||||||||||||||||||||
| William Champion | — | — | — | — | — | — | ||||||||||||||||||
| José Miguel Morales † | 13,813,836 | 5.44 | 13,813,836 | 5.44 | ||||||||||||||||||||
| Igor Gonzalez | — | — | — | — | — | — | ||||||||||||||||||
| Felipe Ortiz-de-Zevallos | — | — | — | — | — | — | ||||||||||||||||||
| Carlos del Solar | — | — | — | — | — | — | ||||||||||||||||||
| Germán Suárez | — | — | — | — | — | — | ||||||||||||||||||
| Raúl Benavides † | 13,813,836 | 5.44 | — | — | 13,813,836 | 5.44 | ||||||||||||||||||
| Diego de la Torre | 14,528 | 0.01 | — | — | 14,528 | 0.01 | ||||||||||||||||||
| Carlos E. Gálvez. | 48,770 | 0.02 | — | — | 48,770 | 0.02 | ||||||||||||||||||
| Alejandro Hermoza | — | — | — | — | — | — | ||||||||||||||||||
| Gulnara la Rosa | — | — | — | — | — | — | ||||||||||||||||||
| Leandro Garcia | — | — | — | — | — | — | ||||||||||||||||||
| Directors and Executive Officers as a Group † | 41,602,976 | 16.40 | — | — | 41,602,976 | 16.40 | ||||||||||||||||||
| † | Includes Common Shares owned by the applicable Benavides family member and his or her spouse. |
| 116 |
| ITEM 7. | Major Shareholders and Related Party Transactions |
A. Major Shareholders
As of March 31, 2017, we had 274,889,924 Common Shares outstanding, including 21,144,734 treasury shares, and 744,640 Investment Shares, including 472,733 treasury shares. The Common Shares are voting securities. The table below sets forth certain information concerning ownership of (i) the Common Shares and Investment Shares and (ii) the aggregate Common Shares and Investment Shares, as of March 31, 2017, with respect to each shareholder known to us to own more than 2.5% of the outstanding Common Shares and with respect to all directors and executive officers as a group.
| Shareholder |
Number
of
Common Shares |
Percentage
Beneficial
|
Number
of
Investment Shares |
Percentage
Beneficial
|
Number
of Common
Shares and Investment Shares |
Percentage
Beneficial
|
||||||||||||||||||
| Benavides Family (5) | 69,187,744 | 27.27 | — | — | 69,187,744 | 27.2 | ||||||||||||||||||
|
Market Vectors ETF Trust
Gold Miners ETF |
17,588,012 | 6.93 | — | — | 17,588,012 | 6.92 | ||||||||||||||||||
| Templeton Asset Management Ltd. Hong Kong | 16,440,875 | 6.48 | — | — | 16,440,875 | 6.47 | ||||||||||||||||||
| BlackRock Investment Management (UK) Ltd. | 7,663,049 | 3.02 | — | — | 7,663,049 | 3.02 | ||||||||||||||||||
| (1) | The table above excludes treasury shares. As of March 31, 2017 Buenaventura held 14,474 common shares and 1,230 Investment Shares and our wholly-owned subsidiary, Condesa, held 21,160,260 Common Shares and 471,733 Investment Shares. |
| (2) | Percentage calculated on the basis of 253,715,190 Common Shares outstanding, which excludes 21,174,734 treasury shares. |
| (3) | Percentage calculated on the basis of 271,677 Investment Shares outstanding, which excludes 472,963 treasury shares. |
| (4) | Percentage calculated on the basis of 253,986,867 Common Shares and Investment Shares outstanding, which excludes 21,647,697 treasury shares. |
| (5) | These Common Shares are owned by certain members, and their spouses, of the immediate and extended family of Elsa Ganoza Benavides (spouse of the late Alberto Benavides de la Quintana, our founder and former Chairman). |
As of March 31, 2017, we estimate that 190,620,961 were held in the U.S., which represented approximately 75.13% of Common Shares outstanding. The number of institutional record holders of our Common Shares (or of ADSs representing our Common Shares) in the U.S. was 66 institutions.
B. Related Party Transactions
Except as otherwise disclosed herein, no director, senior officer, principal shareholder or any associate or affiliate thereof had any material interest, direct or indirect, in any transaction since the beginning of our last financial year that has materially affected us, or in any proposed transaction that would materially affect us. Except as otherwise disclosed herein, we have entered into no transactions with parties that are not “related parties” but who would otherwise be able to negotiate terms not available on an arm’s-length basis. From time to time in the ordinary course of business, we enter into management, exploration, mine construction, engineering and employment contracts with joint venture companies in which one or more of our direct or indirect subsidiaries holds equity or partnership interests.
The compensation of our key executives (including the related income taxes we assumed in connection therewith) totaled US$4.8 million in 2015 and US$9.9 million in 2016. Please refer to Note 30(e) to the Financial Statements for further information.
Chaupiloma is the legal owner of the mineral rights operated by Yanacocha and receives a 3% royalty based on quarterly sales, after deducting refinery and transportation costs. Royalties amounted to US$36.9 million, US$32.4 million and US$24.3 million in 2014, 2015 and 2016, and are presented as royalty income in our consolidated statements of income.
| 117 |
During 2016, Yanacocha’s board of directors unanimously agreed to distribute to the partners, in proportion to their equity interests, US$300 million, which corresponds to the portion of the retained earnings as of December 31, 2014 that originated in 2011.
Condesa did not receive a cash dividend from Yanacocha in 2014 or 2015.
We did not receive a cash dividend from Cerro Verde in 2014, 2015 or 2016.
We received cash dividends from Coimolache of approximately US$12.9 million in 2014, US$6.7 million in 2015 and US$11.4 million in 2016.
In March 2002, BISA signed a technical service agreement with Yanacocha to perform a number of specialized activities and services. Pursuant to the agreement, the services performed relate to the construction of mining projects and include completion of analysis and studies, work plan design, and functions related to planning, monitoring and administrating the infrastructure projects required by Yanacocha in its operations.
In November 2000, Conenhua signed an agreement with Yanacocha for the construction and operation of a 220 kW transmission line between Trujillo and Cajamarca, a 60 kW transmission line between Cajamarca and La Pajuela, and the Cajamarca Norte substation; this agreement also encompassed activities necessary to enlarge the Trujillo substation. Pursuant to this contract, the construction work was completed in October 2001. Concurrently, we and Yanacocha signed a 10-year agreement covering electric energy transmission and infrastructure operation beginning in November 2001. In exchange for us operating and managing the transmission project, Yanacocha pays a fee of US$3.7 million with annual maturities. The annual revenues for these services amounted to approximately US$0.9 million in each of 2014, 2015 and 2016.
C. Interests of Experts and Counsel
Not applicable.
| ITEM 8. | Financial Information |
A. Consolidated Statements and Other Financial Information
Consolidated Financial Statements
See “Item 19. Exhibits” for a list of financial statements filed under Item 18.
Other Financial Information
Export Sales
See “Item 4. Information on the Company—Buenaventura—B. Business Overview—Sales of Metal Concentrates—Sales and Markets” for information on export sales.
Legal Proceedings
Other than the legal proceedings relating to Yanacocha described in “Item 4. Information on the Company—Yanacocha—B. Business Overview—Legal Proceedings,” we and Yanacocha are each parties to certain other legal proceedings arising in the normal course of business, none of which, individually or in the aggregate, is material.
Dividends and Dividend Policy
We can distribute three kinds of dividends: (i) cash dividends, which are paid out of our net distributable income for each year, (ii) stock dividends that are akin to stock splits rather than distributions of earnings, which are issued for the purpose of adjusting the book value per share of our stock and (iii) stock dividends for the purpose of capitalizing profits, in each case as described in more detail below. All shares outstanding and fully paid are entitled to share equally in any dividend declared based on the portion of our capital represented by such share. Shares of capital stock that are only partially paid participate in a dividend or distribution in the same proportion that such shares have been paid at the time of the dividend or distribution. No cash dividend may be declared in respect of a given year unless we have earned net distributable income in respect of such year. However, we may declare dividends during the year. We may make interim provisional payments to shareholders in respect of net distributable income for the current fiscal year, which are referred to as “provisional dividends,” as explained below.
| 118 |
The Board, following the end of each fiscal year, makes a recommendation at the annual obligatory shareholders’ meeting regarding the amount and timing of payments, if any, to be made as dividends on our Common Shares and Investment Shares.
The dividend policy establishes that Buenaventura will distribute an annual cash dividend of at least 20% of net income generated by majority-owned operations and subsidiaries. In the case of Buenaventura’s Associates (Coimolache, Cerro Verde and Yanacocha), 20% of attributable to Buenaventura’s net income will be included if they distribute cash dividends to Buenaventura. In principle there are two kinds of dividend payments: interim dividends, which are approved by the Board and are generally paid during the fourth quarter of the year, and the final dividend payment, which will be paid in accordance with the general shareholders’ meeting resolutions. However, the amount and timing of such payments is subject to the final approval at such annual obligatory shareholders’ meeting and Board meeting, as well as to the availability of earnings to distribute. According to the Peruvian Companies Law, holders of at least 20% of the total Common Shares outstanding can request a dividend of 50% or less of the previous year’s after-tax profits, net of amounts allocated to the legal reserve.
Available earnings are subject to the following priorities. First, the mandatory employee profit sharing of 8% of pre-tax profits (which may differ from pre-tax profits determined under IFRS due to different depreciation treatment and different adjustments of non-taxable income and/or non-deductible expenses) is paid.
Next, remaining earnings are taxed at the standard corporate income tax rate, which was 28% for 2016. For 2017 and thereafter the tax rate will increase to 29.50%. Not less than 10% of such after-tax net profits must then be allocated to a legal reserve, which is not available thereafter except to cover future losses or for use in future capitalizations. Amounts reserved are nevertheless included in taxable income. The obligation to fund this reserve continues until the reserve constitutes 20% of the paid-in share capital. In addition, the holders of Common Shares can agree to allocate any portion of the net profits to any special reserve. The remainder of the net profits is available for distribution to shareholders.
Dividends are subject to an additional withholding tax for shareholders that are either (i) individuals, whether domiciled or non-domiciled in Peru, or (ii) non-domiciled companies or entities. For dividends paid out of our accumulated net profits, the withholding tax rate was 6.8% for 2016. From January 1, 2017 and thereafter, the tax rate will be 5% until 2019, when it will become 9.3% for 2019 and thereafter. Dividends paid to domiciled companies or entities are not subject to such withholding tax. If any tax or other governmental charge will become payable by Scotiabank Peru, as custodian, the Depositary or us with respect to any ADR or any deposited securities represented by the ADSs evidenced by such ADR, such tax or other governmental charge will be payable by the owner or beneficial owner of such ADR to the Depositary.
Dividends paid to domiciled companies or entities are not subject to such withholding tax. If any tax or other governmental charge will become payable by Scotiabank Peru, as custodian, the Depositary or us with respect to any ADR or any deposited securities represented by the ADSs evidenced by such ADR, such tax or other governmental charge will be payable by the owner or beneficial owner of such ADR to the Depositary.
Dividends on issued and outstanding Common Shares and Investment Shares are distributed in accordance with the proportion of the total capital represented by such respective shares. Dividends are distributed pro rata in accordance with the number of Common Shares or Investment Shares. Accordingly, any dividend declared would be apportioned 99.73% to the holders of Common Shares and 0.27% to the holders of Investment Shares. This proportion will not change in the future except and to the extent holders of Common Shares and Investment Shares exercise their preemptive rights disproportionately in any future issuance of Common Shares and Investment Shares, or we issue Common Shares without preemptive rights in accordance with Article 259 of the Peruvian Companies Law.
Holders of Common Shares and Investment Shares are not entitled to interest on dividend payments.
| 119 |
Holders of ADRs are entitled to receive dividends with respect to the Common Shares underlying the ADSs evidenced by such ADRs, subject to the terms of the related Amended and Restated Deposit Agreement, to the same extent as owners of Common Shares.
To the extent that we declare and pay dividends on the Common Shares, owners of the ADSs on the relevant record date are entitled to receive the dividends payable in respect of the Common Shares underlying the ADSs, subject to the terms of the Amended and Restated Deposit Agreement. Cash dividends are paid to the Depositary in Soles and, except as otherwise described under the Amended and Restated Deposit Agreement, are converted by the Depositary into U.S. Dollars and paid to owners of ADRs net of currency conversion expenses. Under the Amended and Restated Deposit Agreement, the Depositary may, and will if we so request, distribute stock dividends in the form of additional ADRs evidencing whole ADSs resulting from a dividend or free distribution of Common Shares by us received by the Depositary. Cash dividends paid with respect to the Common Shares and amounts distributed with respect to ADSs were subject to a Peruvian withholding income tax of 6.8% in 2016. The withholding tax rate will decrease to 5% for dividends paid out of our accumulated net profits after December 31, 2016. See “Item 10. Additional Information—E. Taxation—Peruvian Tax Considerations.”
We issue stock dividends for value per share of our stock. The book value of our share capital is based on the nominal (par) value of each share but is adjusted to account for inflation; thus, in inflationary periods, our book value will increase while the nominal value will remain constant. To adjust the book value of each share to equal or approximate the nominal value, we periodically issue new shares that are distributed as stock dividends to each existing shareholder in proportion to such shareholder’s existing holdings, unless it increases the nominal value of the existing shares. These stock dividends (which under the Peruvian income tax law are not considered dividends) do not change a stockholder’s percentage of interest in us. In addition, we may from time to time capitalize profits and, in such case, we have to distribute stock dividends representing the profits capitalized.
Dividends not collected within 10 years will be retained by us, increasing our legal reserve, and the right to collect such dividends will expire.
Under Peruvian law, each company may make formal cash distributions only out of net distributable income (calculated on an individual, unconsolidated basis and demonstrated by a statement of financial position at any given time). We, however, may pay provisional dividends. Payment of provisional dividends will be approved on the basis of financial statements which show the existence of net distributable income obtained during the current fiscal year. If, following such an interim provisional payment, we suffer a loss or if we finish the fiscal year with a net income that is lower than the amount of provisional dividends paid during such fiscal year, we could legally require all shareholders (including holders of ADRs) to return such payment to us with interest. However, it has been and continues to be our policy not to require shareholders to return such payment of provisional dividends, but rather to cover such contingency through a “dividends paid in advance” account to be offset by future net distributable income.
The following table sets forth the amounts of interim and final cash dividends and the aggregate of cash dividends paid with respect to the years 2013 to 2016. Dividends with respect to the years 2013 to 2016 were paid per Common Share and ADS.
|
Year ended December 31, (1) |
Per
Common Share |
Per
ADSs |
Per
Investment Share |
|||||||||||||||||||||||||||||||||
| Interim | Final | Total | Interim | Final | Total | Interim | Final | Total | ||||||||||||||||||||||||||||
| 2013 | 0.010 | 0.011 | 0.021 | 0.010 | 0.011 | 0.021 | 0.010 | 0.011 | 0.021 | |||||||||||||||||||||||||||
| 2014 | 0.023 | 0.000 | 0.023 | 0.023 | 0.000 | 0.023 | 0.023 | 0.000 | 0.023 | |||||||||||||||||||||||||||
| 2015 | 0.000 | 0.000 | 0.000 | 0.000 | 0.000 | 0.000 | 0.000 | 0.000 | 0.000 | |||||||||||||||||||||||||||
| 2016 | 0.030 | 0.057 | 0.087 | 0.030 | 0.057 | 0.087 | 0.030 | 0.057 | 0.087 | |||||||||||||||||||||||||||
| (1) | Interim and final dividend amounts are expressed in U.S. Dollars. |
| 120 |
Non-controlling Shareholders
Law No. 28370, published on October 30, 2004, included in the Peruvian Companies Law certain provisions for the protection of non-controlling shareholders that were formerly contained in Law No. 26985, which had been abrogated. Legislative Decree No. 1061, effective since June 29, 2008, Law No. 29782, effective since July 29, 2011, and most recently Law No. 30050, effective since June 27, 2013, have abrogated or amended certain of these provisions. Pursuant to Article 262-A of the Peruvian Companies Law, we will furnish on our website and on the SMV’s website, upon the earlier to occur of (1) sixty days after the Annual Obligatory Shareholders’ Meeting, or (2) the expiration of the three-month period after the end of the prior fiscal year in which such Annual Obligatory Shareholders’ Meeting is required to be held, the information regarding total number and value of any shares not claimed by shareholders, the name of such shareholders, the share quote in the securities market for such shares, the total amount of uncollected dividends and where shares and dividends pending claim are available for the non-controlling shareholders. Article 262-B describes the procedure to request share certificates and/or dividends and that the holder of the shares can instruct us to deposit the dividends in a specific bank account. Article 262-F describes the procedure for handling any claim that the non-controlling shareholders may file, such claims to be resolved by the SMV.
B. Significant Changes
No significant change in our financial affairs has occurred since the date of the annual financial statements included in this Annual Report.
A. Offer and Listing Details
Trading Information
The table below sets forth the trading volume and the high and low closing prices of the Common Shares and Investment Shares in Soles. The table also includes the trading volume and the high and low closing prices of the ADSs representing the Common Shares in U.S. Dollars for the same periods.
|
Common Shares (1) |
ADSs (2) |
Investment Shares (1) |
||||||||||||||||||||||||||||||||||
|
Trading
Volume |
High | Low |
Trading
Volume |
High | Low |
Trading
Volume |
High | Low | ||||||||||||||||||||||||||||
| (in millions) | (in nominal S/. per share) | (in millions) | (in US$ per ADS) | (in millions) | (in nominal S/. per share) | |||||||||||||||||||||||||||||||
| Annual highs and lows | ||||||||||||||||||||||||||||||||||||
| 2013 | 2.06 | 90.99 | 29.70 | 472.08 | 36.58 | 10.54 | 0.00 | 30.00 | 30.00 | |||||||||||||||||||||||||||
| 2014 | 0.44 | 39.80 | 28.11 | 467.73 | 14.82 | 8.64 | 0.001 | 26.00 | 26.00 | |||||||||||||||||||||||||||
| 2014 | 1.31 | 38.8 | 14.35 | 409.75 | 12.37 | 3.88 | - | - | - | |||||||||||||||||||||||||||
| 2015 | 1.31 | 38.00 | 14.00 | 410.23 | 12.51 | 3.80 | - | - | - | |||||||||||||||||||||||||||
| Quarterly highs and lows | ||||||||||||||||||||||||||||||||||||
| 2015 | ||||||||||||||||||||||||||||||||||||
| 1st quarter | 0.25 | 35.51 | 31.00 | 106.07 | 11.74 | 9.67 | - | - | - | |||||||||||||||||||||||||||
| 2nd quarter | 0.46 | 38.80 | 32.55 | 83.37 | 12.37 | 10.38 | - | - | - | |||||||||||||||||||||||||||
| 3rd quarter | 0.41 | 32.10 | 18.50 | 107.61 | 10.15 | 5.80 | - | - | - | |||||||||||||||||||||||||||
| 4th quarter | 0.20 | 25.46 | 14.00 | 112.68 | 8.22 | 3.88 | - | - | - | |||||||||||||||||||||||||||
| 2016 | ||||||||||||||||||||||||||||||||||||
| 1st quarter | 0.11 | 24.66 | 12.05 | 136.31 | 7.50 | 3.30 | - | - | - | |||||||||||||||||||||||||||
| 2nd quarter | 0.54 | 34.55 | 24.60 | 162.14 | 12.00 | 7.02 | - | - | - | |||||||||||||||||||||||||||
| 3rd quarter | 0.16 | 53.00 | 33.65 | 95.04 | 16.45 | 11.72 | 0.20 | 25 | 20 | |||||||||||||||||||||||||||
| 4th quarter | 0.19 | 48.50 | 34.37 | 109.72 | 14.21 | 9.87 | - | - | - | |||||||||||||||||||||||||||
| Monthly highs and lows | ||||||||||||||||||||||||||||||||||||
| 2016 | ||||||||||||||||||||||||||||||||||||
| October | 0.00 | 44.10 | 42.00 | 28.31 | 14.21 | 11.91 | - | - | - | |||||||||||||||||||||||||||
| November | 0.02 | 43.00 | 36.90 | 45.37 | 13.99 | 10.30 | - | - | - | |||||||||||||||||||||||||||
| December | 0.17 | 40.00 | 34.37 | 36.04 | 12.30 | 9.87 | - | - | - | |||||||||||||||||||||||||||
| 2017 | ||||||||||||||||||||||||||||||||||||
| January | 0.10 | 45.50 | 38.10 | 21.69 | 13.79 | 11.45 | - | 24.50 | 24.50 | |||||||||||||||||||||||||||
| February | 0.02 | 45.99 | 40.00 | 28.37 | 14.59 | 12.11 | - | - | - | |||||||||||||||||||||||||||
| March | 0.02 | 40.50 | 38.05 | 32.12 | 12.96 | 11.29 | - | 24.00 | 23.99 | |||||||||||||||||||||||||||
| (1) | Source: Lima Stock Exchange |
| (2) | Source: Bloomberg; Yahoo Finance |
| 121 |
As of March 31, 2017, the share capital with respect to the Common Shares was S/.2,748,899,240 represented by 274,889,924 shares and the share capital with respect to the Investment Shares was S/.7,446,400 represented by 744,640 shares. The Common Shares represent 100% of our outstanding share capital. The Investment Shares have no voting rights and are not, under Peruvian law and accounting rules, characterized as share capital. As of March 31, 2017, there were 1,089 owners of record of the Common Shares and 903 owners of record of the Investment Shares.
B. Plan of Distribution
Not applicable.
C. Markets
The Common Shares and ADSs representing the Common Shares (each ADS representing one Common Share) have been listed and traded on the New York Stock Exchange under the symbol “BVN.” In addition, the Common Shares and Investment Shares are listed and traded on the Lima Stock Exchange.
D. Selling Shareholders
Not applicable.
E. Dilution
Not applicable.
F. Expenses of the Issue
Not applicable.
| ITEM 10. | Additional Information |
A. Share Capital
Not applicable.
B. Memorandum and Articles of Association
Organization and Register
We were formed on September 7, 1953 by public deed as a Peruvian sociedad anónima. However, in May of 1998, our By-laws were changed to conform with the new Peruvian Companies Law. The term of existence is indefinite and our principal place of business is Lima, Peru. We are registered under file number 02136988 at the Companies Registry of Lima.
We are managed by the General Meeting, the Board and the management.
Objectives and Purposes
Our legal purpose, as set forth in our Articles of Association and By-laws, is to engage in mining operations and related activities either directly or through majority-owned subsidiaries and controlled companies. Likewise, we may hold shares of companies performing mining operations.
Directors
The Board, which must be composed of seven members, is elected at the Annual Obligatory Meeting. Any changes in the Board require the approval of the shareholders. The removal of the Board must be approved at a shareholders’ meeting, attended by holders of 75% of the Common Shares in the first summons and 70% of the Common Shares in the second summons, by resolution approved by at least two thirds of the total number of Common Shares outstanding. In the case of resignation of directors, the Board may appoint substitute directors who will serve until the next shareholders’ meeting.
| 122 |
Members of the Board (“Directors”) are elected as a group for a term of three years and may be reelected indefinitely. Pursuant to Article 29 of our By-laws, Directors are not required to be shareholders. The Board, in its first meeting after the Annual Obligatory Meeting during which elections are held, must choose from among its members a Chairman and a Vice Chairman. The Peruvian Companies Law requires that all companies ( sociedades anónimas ) provide for the representation of non-controlling shareholders on their Boards of Directors. To that effect, each of our Common Shares gives the holder the right to as many votes as there are directors to be elected. Each holder may pool his votes in favor of one person or distribute them among various persons. Those candidates for the Board who receive the most votes are elected directors.
The Board of Directors meets when called by the Chairman of the Board, who is appointed by the Board. The Board of Directors is validly convened when all Directors are present and unanimously agree to carry out the meeting for the purpose of transacting the business that has been proposed. Pursuant to Article 177 of the Peruvian Companies Law, Directors may be jointly and severally liable to us, the shareholders and third parties for their actions if they act with willful misconduct, gross negligence or abuse their powers. In addition, Article 3 of Law No. 29720, which has been in force since June 26, 2011, as amended by Law No. 30050 in force since June 27, 2013, provides that directors and managers are liable for economic damages or any other kind of damages caused to us by any transaction they have approved that favors such director’s, or a related party’s, interest instead of the company’s, when: (i) one of the parties involved in the transaction is a company whose shares are listed in the local stock exchange, as in our case; (ii) the shareholder controlling such listed company also controls the other party involved in the transaction; and (iii) the transaction is not made under arm’s-length conditions and represents at least 10% of such company’s assets.
Our By-laws do not contain any provisions related to a director’s power to vote on matters in which the director is materially interested. However, Article 180 of the Peruvian Companies Law requires a director with an interest that conflicts with an interest of ours on a specific matter to disclose such interest to us and abstain from participating in the deliberation and decision of the said matter. A director that contravenes such requirement is liable for the damages suffered by us and can be removed by the Board or a shareholders’ meeting upon the request of any shareholder or any member of the Board.
Our By-laws also do not contain any provisions with respect to the power of the directors to vote upon matters relating to their own compensation. Nevertheless, Article 30 of the By-laws requires that the Board receive compensation of no more than 4% of the profits of each fiscal year after making deductions for workers’ profit sharing, taxes, reinvestment of profits for tax benefits and legal reserves. This amount will be submitted for ratification by the General Meeting during the annual obligatory meeting, at which time it approves the statement of financial position, taxes, reinvestment of profits for tax benefits and legal reserves.
Our By-laws contain no provision relating to the directors’ power to borrow from us. However, Article 179 of the Peruvian Companies Law provides that directors of a company may enter into an agreement with such company only if the agreement relates to operations the company performs in the regular course of business and in an arms-length transaction. Furthermore, a company may provide a loan to a director or grant securities in his favor only in connection with operations that the company usually performs with third parties. Agreements, credits, loans or guarantees that do not meet the requirements set forth above require prior approval from at least two thirds of the members of the company’s Board. Directors are jointly liable to the company and the company’s creditors for contracts, credit, loans or securities executed or granted without complying with Article 179 of the Peruvian Companies Law. In addition, as mentioned above, Article 3 of Law No. 29720, as amended, provides that directors and managers are liable for economic or other damages that they may cause because of the approval of resolutions that favor such director’s, or a related party’s, interest instead of the company’s, when: (i) one of the parties involved in the transaction is a company whose shares are listed in the local stock exchange, as in our case; (ii) the shareholder controlling such listed company also controls the other party involved in the transaction; and (iii) the transaction is not made under arm’s-length conditions and represents at least 10% of such Company’s assets.
Neither our By-laws nor the Peruvian Companies Law contain age limit requirements for the retirement or non-retirement of directors.
| 123 |
Shares and Voting Rights
We have two classes of shares, the Common Shares and the Investment Shares. The Common Shares represent 100% of our outstanding share capital. The Investment Shares have no voting rights and are not, under Peruvian law and accounting rules, characterized as share capital. The Common Shares and the Investment Shares may be either physical share certificates in registered form or book-entry securities in the CAVALI ICLV S.A. book-entry settlement system, also in registered form.
Holders of Common Shares are entitled to one vote per share, with the exception of the election of the Board, where each such holder is entitled to one vote per share per nominee. Each holder’s votes may be cast all for a single nominee or distributed among the nominees at the holder’s discretion. Holders of Common Shares may attend and vote at shareholders’ meetings either in person or through a proxy. Additionally, holders of Common Shares have the right to participate in the distribution of dividends and shareholder equity resulting from liquidation. Our By-laws do not establish a maximum time limit for the payment of the dividends. However, according to Article 232 of the Peruvian Companies Law, the right to collect past-due dividends in the case of public companies that are sociedades anónimas abiertas , as we are, expires at 10 years from the date on which the payment was due in accordance with the dividend declaration.
Our share capital may be increased by holders of Common Shares at a shareholders’ meeting. Capital reductions may be voluntary or mandatory and must be approved by holders of Common Shares at a shareholders’ meeting. Capital reductions are mandatory when accumulated losses exceed 50% of capital to the extent such accumulated losses are not offset by accumulated earnings and capital increases within the following fiscal year. Capital increases and reductions must be communicated to the SMV, the Lima Stock Exchange and the SUNAT and published in the official gazette El Peruano and in a widely circulated newspaper in the city in which we are located.
The Investment Shares do not represent our stock obligations. Holders of Investment Shares are neither entitled to exercise voting rights nor to participate in shareholders’ meetings. However, Investment Shares confer upon the holders thereof the right to participate in the dividends distributed according to their nominal value, in the same manner as Common Shares.
Changes in the Rights of Shareholders
Our By-laws do not contain special provisions relating to actions necessary to change the rights of holders of the classes of shares. However, Article 88 of the Peruvian Companies Law establishes that all shares of a same class must have the same rights and obligations, and that if we decide to establish different rights and obligations we must create a different class of shares, which creation will be agreed upon by the General Meeting in accordance with the requirements for modification of the By-laws. The Common Shares are the only class of shares representing 100% of our share capital, and, therefore, each Common Share has the same rights and obligations of each other Common Share. These requirements are described under “—Shares and Voting Rights” above.
The rights of any class of shares may not be reduced except in accordance with the Peruvian Companies Law.
Shareholders’ Meetings
Pursuant to Peruvian law and our By-laws, the Annual Obligatory Meeting must be held during the three-month period after the end of each fiscal year. Additional General Meetings may be held during the year. Because we are a sociedad anónima abierta , we are subject to the special control of the SMV, as provided in Article 253 of the Peruvian Companies Law. Shareholders’ meetings are convened by the Board when deemed convenient for us or when it is requested by the holders of at least 5% of the Common Shares, provided that such Common Shares do not have their voting rights suspended. If, at the request of holders of at least 5% of the Common Shares, the shareholders’ meeting is not convened by the Board within 15 business days of the receipt of such request, such holders of at least 5% of the Common Shares may request a notary public or a judge to convene the meeting. The Board is deemed to have implicitly refused to convene the meeting if the Board (a) does not convene a shareholders’ meeting within 15 business days of receipt of the request, (b) suspends or amends the terms of the agenda or in any other way amend the terms of the summons already made upon the request of at least 5% of the Common Shares or (c) schedules the shareholders’ meeting more than 40 days after the date on which the summons is published. The notary public or the judge of the domicile of the company shall call for the shareholders meeting. Resolución CONASEV No. 111-2003-EF-94.10, as amended by Resolución CONASEV No. 078-2010-EF/94.01.1, approved provisions related to the right of the non-controlling shareholders to obtain information regarding a sociedad anónima abierta such as ourselves. Notwithstanding the notice requirements as described in the preceding two sentences, any shareholders’ meeting will be deemed called and legally commenced, provided that the shareholders representing all of the voting shares are present, and provided that every present shareholder, whether or not such shareholder has paid the full price of such shareholder’s shares, agrees to hold the shareholders’ meeting and accepts the business to be discussed therein. Holders of Investment Shares have no right to request the Board to convene shareholders’ meetings.
| 124 |
Since we are a sociedad anónima abierta , notice of shareholders’ meetings must be given by publication of a notice, with the publication occurring at least 25 days before any shareholders’ meeting, in El Peruano and in a widely circulated newspaper in the city in which we are located. The notice requirement may be waived at the shareholders’ meeting by holders of 100% of the outstanding Common Shares. According to Article 25 of our By-laws and Article 257 of the Peruvian Companies Law, shareholders’ meetings called for the purpose of considering a capital increase or decrease, the issuance of obligations, a change in our By-laws, the sale in a single act of assets with an accounting value that exceeds 50% of our capital stock, a merger, division, reorganization, transformation or dissolution, are subject to a first, second and third quorum call, each of the second and third quorum to occur upon the failure of the preceding one. A quorum for the first call requires the presence of shareholders holding 50% of our total voting shares. For the second call, the presence of shareholders holding at least 25% of our total voting shares constitutes a quorum, and for the third call there is no quorum requirement. These decisions require the approval of the majority of the voting shares represented at the shareholders’ meeting. General Meetings convened to consider all other matters are subject to a first and second quorum call, the second quorum call to occur upon the failure of the first quorum.
In the case of shareholders’ meetings called for the purpose of considering the removal of members of the Board, at least 75% and 70% of the total number of Common Shares outstanding are required to be represented at the shareholders’ meeting on the first quorum call and second quorum call. Provided such quorum is attained, the affirmative vote of no less than two thirds of the total number of Common Shares outstanding is required to effect the removal of members of the Board. The special quorum and voting requirements described above cannot be modified at a shareholders’ meeting called for the purpose of considering the removal of members of the Board.
Under our By-laws, the following actions are to be taken at the annual obligatory shareholders’ meetings: approval of our statements of financial position, profit and loss statements and annual reports; the approval of management performance; the allocation of profits; the election of external auditors; the election of the members of the Board; and any other matters submitted by the Board. The following actions are to be taken at the same annual shareholders’ meetings if the quorum and majority requirements are met or at any other shareholders’ meeting: any amendment of our By-laws; any decision to increase or reduce capital; any decision to issue debt; initiating investigations or requesting auditor’s reports; liquidating, spinning-off, merging, consolidating, dissolving, or changing our business form or structure.
In accordance with Article 21 of the By-laws, only those holders of Common Shares whose names are inscribed in the Share Register not less than 10 days in advance of a meeting will be entitled to attend shareholders’ meetings and to exercise their rights.
Limitations on the Rights of Nonresident or Foreign Shareholders
There are no limitations in our By-laws or the Peruvian Companies Law on the rights of nonresident or foreign shareholders to own securities or exercise voting rights on our securities.
Change in Control
There are no provisions in our By-laws that would have the effect of delaying, deferring or preventing a change in control.
| 125 |
Disclosure of Share Holdings
There are no provisions in our By-laws governing the ownership threshold above which share ownership must be disclosed. However, according to Regulation No. 009-2006-EF.94.10 of the SMV, which became effective on May 3, 2006, as amended by Regulation No. 020-2006-EF.94.10 and Regulation No. 05-2009-EF-94.01.1 of the SMV, when an individual or financial group acquires, in one act or various successive acts, a significant percentage (more than 25%) of the voting shares of a company, as well as upon any person or group increasing its ownership above the 50% and 60% thresholds, a procedure known as Oferta Pública de Adquisición , or a “Takeover Bid,” must be followed. This has the effect of alerting other shareholders and the market that an individual or financial group has acquired a significant percentage of a company’s voting shares, and gives other shareholders the opportunity to sell their shares at the price offered by the purchaser. The purchaser is obliged to launch a Takeover Bid unless it is exempt pursuant to Regulation No. 009-2006-EF.94.10 of the SMV, as amended. The purchase of ADRs is exempted from the Takeover Bid unless the holders: (i) exercises the voting rights of the Common Shares underlying the ADSs evidenced by such ADRs, or (ii) requests the delivery of such underlying Common Shares. In addition, the SMV and the Lima Stock Exchange must be notified of any transfer of more than 5% of our paid-in capital.
Changes in Capital
Our By-laws do not establish special conditions for increases or reductions of capital that are more stringent than is required by the Peruvian Companies Law. Furthermore, the Peruvian Companies Law forbids sociedades anónimas abiertas , such as us, from including in their By-laws stipulations limiting the transfer of their shares or restraining their trading in other ways. We cannot recognize a shareholders’ agreement that contemplates limitations, restrictions or preferential rights on the transfer of shares, even if such agreement is recorded in our Share Register ( matrícula de acciones ) or in CAVALI ICLV S.A.
| 126 |
Economic Group
On January 1, 2017 new Regulations on Indirect Property, Relation and Economic Groups ( Reglamento de Propiedad Indirecta, Vinculación y Grupos Económicos ) (the “Regulations”) approved by Regulation No. 019-2015-SMV-01 became effective, replacing the prior Regulations that were in effect since 2006. The new Regulations define more precisely who are considered independent directors, increase the standards of information we are required to provide, require us to identify the individuals that control our economic group, require us to report related individuals and entities; reduce the number of shareholders required to determine that there exists a “representative participation” from 10% of the total capital stock to 4% of voting shares and extend the definition of control. The “representative participation” definition is mainly used by listed companies such as us to determine the existence of indirect property. Regulation No. 083-2016-SMV-01 approved the new forms to be used to provide the SMV all the information about our Economic Group.
Criminal liability of companies
On April 2016, Law N° 30424 was enacted to establish the administrative liability of legal entities such as us in connection to different types of bribery, transnational active bribery-asset laundering, illegal mining and organized crime. The law has been amended by Legislative Decree N° 1352 published on January 7, 2017 and will become effective on January 1, 2018. Regulations to this law are pending. The law provides rules to be followed in case of a merger or spin-off and states that the legal entities are administratively liable for the above crimes when they have been committed in their name or for their benefit by their shareholders, directors or managers. Several sanctions can be imposed on a company as result of such crimes, including fines, prohibitions on performing certain activities, cancellation of permits and even dissolution. The company will be exempted from any liability for such crimes if it adopts within its organization, and before the crime is committed, a so-called prevention model consistent with the company’s nature, risks, necessities and characteristics, consisting in control, monitoring and surveillance measures suitable to prevent such crimes. Such model includes the appointment by the Board of a person in charge of prevention that must perform autonomously. In order to file a criminal accusation against the company, a technical report from the SMV that analyzes the prevention model is required. During this year we will prepare, in addition to all other compliance measures and policies, the prevention model required under Law N° 30424, as amended.
C. Material Contracts
Not Applicable.
D. Exchange Controls
Since August 1990, there have been no exchange controls in Peru and all foreign exchange transactions are based on free market exchange rates. Before August 1990, the Peruvian foreign exchange market consisted of several alternative exchange rates. Additionally, during the 1990s, the Peruvian currency has experienced a significant number of large devaluations, and Peru has consequently adopted, and operated under, various exchange rate control practices and exchange rate determination policies, ranging from strict control over exchange rates to market determination of rates. Current Peruvian regulations on foreign investment allow the foreign holders of equity shares of Peruvian companies to receive and repatriate 100% of the cash dividends distributed by such companies. Such investors are allowed to purchase foreign exchange at free market currency rates through any member of the Peruvian banking system and transfer such foreign currency outside Peru without restriction.
E. Taxation
The following summarizes the material Peruvian and U.S. tax consequences under present law of the purchase, ownership and disposition of ADSs or Common Shares. The discussion is not a full description of all tax considerations that may be relevant to a decision to purchase ADSs or Common Shares. In particular, this discussion deals only with holders that hold ADSs or Common Shares as capital assets and that have the U.S. Dollar as their functional currency. The summary does not address the tax treatment of certain investors that may be subject to special tax rules, such as banks, securities dealers, insurance companies, tax-exempt entities, persons that will hold ADSs or Common Shares as a position in a “straddle” or “conversion transaction” for tax purposes and holders of 10% or more of our voting shares. This discussion does not address any U.S. state or local taxes, the U.S. federal alternative minimum tax or the U.S. Medicare tax on net investment income. There is no tax treaty currently in effect between Peru and the U.S., except for a treaty to exchange tax information. The information to be exchanged is defined in such treaty as any data or declaration that may be relevant or essential to the administration and application of taxes. Accordingly, the discussions below of Peruvian and U.S. tax considerations are based on the domestic law of each of Peru and the U.S. which are subject to change and possibly with retroactive effect.
| 127 |
“U.S. Holder” means a beneficial owner of ADSs or Common Shares that is (i) a U.S. citizen or resident, (ii) a domestic corporation or partnership, (iii) a trust subject to the control of a U.S. fiduciary and the primary supervision of a U.S. court or (iv) estate the income of which is subject to U.S. federal income taxation regardless of its source.
Peruvian Tax Considerations
Cash Dividends and Other Distributions
Cash dividends paid with respect to Common Shares and amounts distributed with respect to ADSs are subject to Peruvian withholding income tax, at a rate of 5% for dividends paid or to be paid beginning January 1, 2017, when the dividend originated from profits earned on or after January 1, 2017. If the dividend originated from profits earned as of December 31, 2014, the withholding income tax rate for dividends is 4.1%. If the dividend originated from profits earned between January 1, 2015 and December 31, 2016, the withholding income tax rate for the dividend is 6.8%. This regime is applicable on dividends that are paid to shareholders that are: (i) individuals, whether resident or nonresident in Peru or (ii) nonresident entities. As a general rule, the distribution of additional Common Shares representing profits, distribution of shares which differ from the distribution of earnings or profits, as well as the distribution of preemptive rights with respect to Common Shares, which are carried out as part of a pro rata distribution to all shareholders, will not be subject to Peruvian Income Tax or withholding taxes.
Capital Gains
Pursuant to Article 6 of the Income Tax Law (the “ITL”), individuals and entities resident in Peru are subject to Peruvian Income Tax on their worldwide income while non-resident individuals or entities are subject to Peruvian Income Tax on their Peruvian source income only.
Furthermore, the ITL states that income deriving from the disposal of securities issued by Peruvian entities is considered Peruvian source income subject to the Income Tax.
With respect to this matter, Article 2 of the ITL, as amended by Legislative Decree 945, defines: (i) capital gains as any revenue deriving from the disposal of capital goods; and (ii) capital goods as those whose purpose is not to be traded in the regular course of a business. Moreover, Article 2 of the ITL states that income deriving from the disposal of shares and similar securities is considered a capital gain.
Accordingly, capital gains deriving from the disposal of securities issued by legal entities incorporated in Peru are considered Peruvian source income subject to Peruvian Income Tax.
Currently, regardless of whether or not the transferor is domiciled in Peru, the ITL establishes that taxable income resulting from the disposal of securities is determined by the difference between the sale price of the securities and its tax basis. However, before December 31, 2009, capital gains resulting from the disposal of ADSs or Common Shares issued by legal entities incorporated in Peru were exempt from Peruvian Income Tax if: (i) in the case of non-regular individuals (i.e., individuals who do not frequently trade securities), the transaction was carried out before December 31, 2009; and (ii) in the case of shareholders other than individuals, the transaction was carried out on the Lima Stock Exchange (floor session) before December 31, 2009.
Effective January 1, 2010, the exemption was repealed and, as such, capital gains resulting from the disposal of ADSs or Common Shares issued by legal entities incorporated in Peru became subject to Peruvian Income Tax, or the “Income Tax.” For non-resident entities or individuals, capital gains will be subject to an Income Tax rate of either 5% or 30%, depending where the transaction takes place. If the transaction is consummated within Peru, the Income Tax rate is 5%; if the transaction is consummated outside of Peru, capital gains are taxed at a rate of 30%.
| 128 |
The ITL Regulations have defined transactions consummated within Peru to mean that the securities at issue are transferred through the Lima Stock Exchange. In contrast, the transaction is considered to have been consummated abroad when (i) the securities at issue are not registered on the Lima Stock Exchange or (ii) registered securities are not transferred through the Lima Stock Exchange.
Before December 31, 2012, for nonresident individuals, the first five Tax Units (approximately US$6,800) of capital gains deriving from the transfer of securities were exempted from the Income Tax. Effective January 1, 2013, this exemption was repealed. If the transferor is a resident entity, capital gains deriving from the disposal of securities will be treated as any other taxable income subject to the 30% corporate Income Tax rate.
Furthermore, before December 31, 2012, if the transferor was a resident individual, the first five Tax Units (approximately US$6,800) of capital gains deriving from the transfer of securities were exempted from the Income Tax. Effective January 1, 2013, such exemption was repealed. Any capital gain earned by a resident individual is subject to the 5% annual Income Tax rate regardless of whether or not the transaction is carried out on the Lima Stock Exchange and regardless of how many transactions are carried out by such individual. In this case, the 5% Income Tax rate will be applicable over the annual net capital gain, which is calculated by deducting from the annual gross capital gain of the annual losses resulting from the disposal of shares during the same fiscal year.
Moreover, if the transferor, either a resident or nonresident individual or entity, acquired the ADSs or Common Shares that were exempt from the Income Tax before January 1, 2010, pursuant to a special provision of the ITL, the tax basis is the higher of: (i) the acquisition cost; (ii) the face or nominal value of the shares; or (iii) the stock market value at closing on December 31, 2009.
If the transferor, whether resident or nonresident in Peru, acquires the ADSs or Common Shares on or after January 1, 2010, the tax basis is: (i) for shares purchased by the transferor, the acquisition price paid for the shares; (ii) for shares received by the transferor as a result of a capital stock increase because of a capitalization of net profits, the face or nominal value of such shares; (iii) for other shares received free of any payment, the stock market value of such shares if listed on the Lima Stock Exchange or, if not, the face or nominal value of such shares; and (iv) for shares of the same type acquired at different opportunities and at different values, the tax basis will be the weighted average cost.
The aforementioned rules are also applicable to ADSs or Common Shares acquired before January 1, 2010 that were not exempt from the Income Tax as of December 31, 2009.
On December 31, 2010, Law No. 29645 was promulgated and took effect from January 1, 2011. This law states that in any transaction of Peruvian securities through the Lima Stock Exchange, CAVALI ICLV S.A. (the Peruvian clearing house) will act as withholding agent. As a result of this amendment, the nonresident will no longer have to self-assess and pay its Income Tax liability directly to the Peruvian Tax Administration.
Law No. 29645 has technically been in force since January 1, 2011. Implementing regulations were enacted in July 2011, and CAVALI ICLV S.A. began acting as a withholding agent on November 1, 2011. As a result, with regard to securities transferred through the Lima Stock Exchange by a nonresident transferor after November 1, 2011, such nonresident transferor is no longer obliged to self-assess and pay its Income Tax liability directly to Peruvian tax authorities within the first 12 working days following the month in which Peruvian source income was earned.
If the purchaser is resident in Peru and the sale is not performed through the Lima Stock Exchange, the purchaser will act as withholding agent, except in cases in which the transferor is a resident individual.
However, if the transferor is a resident entity, such transferor is solely responsible for its Peruvian Income Tax on capital gains resulting from the disposal of ADSs or Common Shares, regardless of whether such securities are listed on the Lima Stock Exchange or elsewhere.
| 129 |
On September 12, 2015 Law No. 30341 was published. This law entered into effect on January 1, 2016 and states that capital gains from the disposal of ADSs or Common Shares through December 31, 2018 issued by legal entities incorporated in Peru, executed through the Lima Stock Exchange, are exempt from Peruvian Income Tax if: (i) within a period of twelve (12) months the holder and its related parties do not transfer 10% or more of the issued shares of the legal entity in one or more transactions; and (ii) the Common Shares issued by such legal entity shall have been continuously traded in the stock market (the rules to determine if such shares are continuously traded are set forth in Law N° 30341, as amended). Law No. 30341 was amended by Legislative Decree No. 1262, published on December 10, 2016 and effective since January 1, 2017, which introduced minor amendments related to capital gains deriving from the disposal of ADSs and Common Shares and extended this income tax exemption through December 31, 2019.
Other Considerations
No Peruvian estate or gift taxes are imposed on the gratuitous transfer of ADSs or Common Shares. No stamp, transfer or similar tax applies to any transfer of Common Shares, except for commissions payable by seller and buyer to the Lima Stock Exchange (0.15% of value sold), fees payable to the SMV (0.05% of value sold), brokers’ fees (about 0.05% to 1% of value sold) and VAT (at the rate of 18%) on commissions and fees. Any investor who sells its Common Shares on the Lima Stock Exchange will incur these fees and taxes upon purchase and sale of the Common Shares.
U.S. Federal Income Tax Considerations
Assuming the obligations contemplated by the Amended and Restated Deposit Agreement are being performed in accordance with its terms, holders of ADSs (or ADRs evidencing ADSs) generally will be treated for U.S. federal income tax purposes as the owners of the Common Shares represented by those ADSs.
Cash Dividends and Other Distributions
Cash dividends paid with respect to Common Shares or Common Shares represented by ADSs generally are includible in the gross income of a U.S. Holder as ordinary income. Dividends generally are treated as foreign source income. Dividends paid to a U.S. Holder that is a corporation are not eligible for the dividends received deduction available to corporations. Under current law, a maximum 20% U.S. tax rate is imposed on the dividend income of an individual U.S. Holder with respect to dividends paid by a domestic corporation or “qualified foreign corporation” if certain holding period requirements are met. A qualified foreign corporation generally includes a foreign corporation if (i) its shares are readily tradable on an established securities market in the U.S. or (ii) it is eligible for benefits under a comprehensive U.S. income tax treaty. Clause (i) will apply with respect to ADSs if such ADSs are readily tradable on an established securities market in the U.S. The ADSs are traded on the New York Stock Exchange. As a result, we believe that we should be treated as a qualified foreign corporation and, therefore, dividends paid to an individual U.S. Holder with respect to ADSs for which the minimum holding period requirement is met should be taxed at a maximum rate of 20%. Dividends paid in Soles are includible in a U.S. dollar amount based on the exchange rate in effect on the date of receipt (which, in the case of ADSs, will be the date of receipt by the Depositary) whether or not the payment is converted into U.S. Dollars at that time. Any gain or loss recognized upon a subsequent sale or conversion of the Soles for a different amount of U.S. Dollars will be U.S. source ordinary income or loss. Distributions to U.S. Holders of additional Common Shares or preemptive rights with respect to Common Shares that are made as part of a pro rata distribution to all of our shareholders generally will not be subject to U.S. federal income tax but in other circumstances may constitute a taxable dividend.
A U.S. Holder will be entitled to a foreign tax credit for Peruvian taxes imposed by withholding or otherwise, subject to generally applicable limitations and restrictions. In the case of U.S. individuals for whom the reduced rate of tax on dividends applies, such limitations and restrictions will appropriately take into account the rate differential under rules similar to section 904(b)(2)(B) of the Internal Revenue Code. The rules governing foreign tax credits are complex and U.S. Holders should consult their tax advisors regarding their application to the particular circumstances of such holder.
A non-U.S. Holder generally is not subject to U.S. federal income or withholding tax on dividends paid with respect to Common Shares or Common Shares represented by ADSs, unless such income is effectively connected with the conduct by the non-U.S. Holder of a trade or business within the U.S.
| 130 |
Capital Gains
U.S. Holders will recognize capital gain or loss on the sale or other disposition of ADSs or Common Shares (or preemptive rights with respect to such shares) held by the U.S. Holder or by the Depositary. U.S. Holders will not recognize gain or loss on deposits or withdrawals of Common Shares in exchange for ADSs or on the exercise of preemptive rights. Any gain recognized by a U.S. Holder generally will be treated as U.S. source income. Consequently, in the case of a disposition of Common Shares or ADSs in a transaction subject to Peruvian tax, the U.S. Holder may not be able to claim the foreign tax credit for any Peruvian tax imposed on the gain unless it has sufficient foreign source income from other sources against which it can apply the credit. Generally, gain or loss will be a long-term capital gain or loss if the U.S. Holder’s holding period for such Common Shares or ADSs exceeds one year. Long-term capital gain for an individual U.S. Holder is generally subject to a reduced rate of tax.
A non-U.S. Holder of ADSs or Common Shares will not be subject to U.S. income or withholding tax on gain from the sale or other disposition of ADSs or Common Shares unless (i) such gain is effectively connected with the conduct of a trade or business within the U.S. or (ii) the non-U.S. Holder is an individual who is present in the U.S. for at least 183 days during the taxable year of the disposition and certain other conditions are met.
Passive Foreign Investment Company
We believe that we are not and will not become a passive foreign investment company for U.S. federal income tax purposes. A foreign corporation is a passive foreign investment company (“PFIC”) in any taxable year in which, after taking into account the income and assets of certain subsidiaries pursuant to the applicable look-through rules, either (i) at least 75% of its gross income is passive income or (ii) at least 50% of the average value of its assets is attributable to assets that produce passive income or are held for the production of passive income.
If we were a PFIC in any year during which a U.S. Holder owned ADSs or Common Shares, we would not be treated as a “qualified foreign corporation” for purposes of qualifying dividends paid to a U.S. Holder for the preferential 20% maximum U.S. tax rate noted above and the U.S. Holder would be subject to additional taxes on any excess distributions received from us and any gain realized from the sale or other disposition of ADSs or Common Shares (regardless of whether we continued to be a PFIC). A U.S. Holder has an excess distribution to the extent that distributions on ADSs or Common Shares during a taxable year exceed 125% of the average amount received during the three preceding taxable years (or, if shorter, the U.S. Holder’s holding period for the ADSs or Common Shares). To compute the tax on an excess distribution or any gain, (i) the excess distribution or the gain is allocated ratably over the U.S. Holder’s holding period for the ADSs or Common Shares, (ii) the amount allocated to the current taxable year is taxed as ordinary income and (iii) the amount allocated to other taxable years is taxed at the highest applicable marginal rate in effect for each year and an interest charge is imposed to recover the deemed benefit from the deferred payment of the tax attributable to each year.
If we were a PFIC, U.S. Holders of interests in a holder of ADSs or Common Shares may be treated as indirect holders of their proportionate share of the ADSs or Common Shares and may be taxed on their proportionate share of any excess distribution or gain attributable to the ADSs or Common Shares. An indirect holder also must treat an appropriate portion of its gain on the sale or disposition of its interest in the actual holder as gain on the sale of the ADSs or Common Shares.
Information Reporting and Backup Withholding
Dividends in respect of the ADSs or Common Shares and the proceeds from the sale, exchange, or redemption of the ADSs or Common Shares may be reported to the U.S. Internal Revenue Service and a backup withholding tax may apply to such amounts unless the holder (i) is a domestic corporation (which may be required to establish its exemption by carrying its status on U.S. Internal Revenue Service Form W-9), (ii) in the case of a U.S. Holder other than a corporation, provides an accurate taxpayer identification number in the manner required by applicable law, (iii) in the case of a non-U.S. Holder, provides a properly executed U.S. Internal Revenue Service Form W-8BEN, or other successor Form, or (iv) otherwise establishes a basis for exemption. The amount of any backup withholding from a payment to a U.S. Holder generally will be allowed as a credit against the U.S. Holder’s U.S. federal income tax liability.
| 131 |
F. Dividends and Paying Agents
Not applicable.
G. Statement by Experts
Not applicable.
H. Documents on Display
We are subject to the informational requirements of Exchange Act. In accordance with these requirements, we file annual reports and other information to the SEC. These materials, including this Annual Report on Form 20-F and the exhibits hereto, may be inspected and copied at the SEC’s Public Reference Room at 100 F Street, N.E., Washington, D.C. 20549 and at the SEC’s regional offices at 175 W. Jackson Boulevard, Suite 900, Chicago, Illinois 60604, and 3 World Financial Center, Suite 400, New York, New York 10281-1022. Copies of the materials may be obtained from the Public Reference Room of the SEC at 100 F Street, N.E., Washington, D.C. 20549 at prescribed rates. The public may obtain information on the operation of the SEC’s Public Reference Room by calling the SEC in the U.S. at 1-800-SEC-0330. The SEC also maintains a web site at http://www.sec.gov that contains reports, proxy statements and other information regarding registrants that file electronically with the SEC. Form 20-F reports and some of the other information submitted by us to the SEC may be accessed through this web site.
I. Subsidiary Information
Not applicable.
| ITEM 11. | Quantitative and Qualitative Disclosures About Market Risk |
The following discussion contains forward-looking statements that are subject to risks and uncertainties, many of which are outside of our control. Our primary market risks are related to fluctuations in the prices of gold, silver, zinc and lead. To a lesser extent, we are subject to market risk related to fluctuations in US$/ Sol exchange rates and to market risk related to interest rate fluctuation on our cash balances.
Commodity Contracts
Gold, silver, lead and copper hedging and sensitivity to market price
Our revenues and earnings are to a great extent influenced by world market prices for gold, copper, silver, zinc and lead that fluctuate widely and over which we have no control. We and our wholly-owned subsidiaries are completely unhedged as to the price at which our gold and silver will be sold. See “Item 3. Key Information—D. Risk Factors—Factors Relating to the Company—Our financial performance is highly dependent on the prices of gold, silver, copper and other metals.”
As of March 31, 2017, we had no silver derivative contracts or gold convertible put option contracts in place.
Between January 2017 and December 2017, El Brocal had outstanding hedging commitments amounting to 16,107 metric tons of copper at an average fixed price of US$5,395 per ton.
Yanacocha and Cerro Verde have informed us that they have generally not engaged in, and are currently not engaged in, gold or copper price hedging activities, such as forward sales or option contracts, to minimize their exposure to fluctuations in the prices of gold or copper.
Normal Sales
We had no normal sales contracts with fixed or capped prices outstanding as of March 31, 2017.
| 132 |
Foreign currency risk
We buy and sell our products and obtain capital facilities and investment in U.S. Dollars. The assets and liabilities in different currencies from the U.S. Dollar (Soles) are not significant. We estimate that the future exchange rate fluctuations of Peruvian currency versus the U.S. Dollar will not significantly affect the results of our future operations.
Interest Rate Sensitivity
We reduce our exposure to the risks due to variations in interest rates by engaging in financial obligations and capital leasing with fixed interest rates. See Note 33 to the Financial Statements. Consequently, we do not use derivative instruments to manage this risk and we do not expect to incur significant losses based on interest risks.
| ITEM 12. | Description of Securities Other Than Equity Securities |
A. Debt Securities
Not applicable.
B. Warrants and Rights
Not applicable.
C. Other Securities
Not applicable.
D. American Depositary Shares
The Depositary collects its fees for delivery and surrender of ADSs directly from investors depositing shares or surrendering ADSs for the purpose of withdrawal or from intermediaries acting for them. The Depositary collects fees for making distributions to investors by deducting those fees from the amounts distributed or by selling a portion of distributable property to pay the fees. The Depositary may collect its annual fee for depositary services by deductions from cash distributions or by directly billing investors or by charging the book-entry system accounts of participants acting for them. The Depositary may generally refuse to provide fee-attracting services until its fees for those services are paid. The following table summarizes the fees and expenses payable by holders of ADSs:
| Persons depositing or withdrawing shares must pay: | For: | ||
| US$5.00 (or less) per 100 ADSs (or portion of 100 ADSs) | • | Issuance of ADSs, including issuances resulting from a distribution of shares or rights or other property | |
| • | Cancellation of ADSs for the purpose of withdrawal, including if the deposit agreement terminates | ||
| A fee equivalent to the fee that would be payable if securities distributed to you had been shares and the shares had been deposited for issuance of ADSs | • | Distribution of securities distributed to holders of deposited securities which are distributed by the depositary to ADS registered holders | |
| Registration or transfer fees | • | Transfer and registration of shares on our share register to or from the name of the Depositary or its agent when you deposit or withdraw shares | |
| Expenses of the Depositary | • | Cable, telex and facsimile transmissions (when expressly provided in the deposit agreement) | |
| • | Converting foreign currency to U.S. Dollars | ||
| 133 |
| Taxes and other governmental charges the Depositary or the custodian have to pay on any ADS or share underlying an ADS, for example, stock transfer taxes, stamp duty or withholding taxes | • | As necessary | |
| Any charges incurred by the Depositary or its agents for servicing the deposited securities | • | As necessary |
Fees Incurred in Past Annual Period
From January 1, 2017 to April 30, 2017, we received no fees from the Depositary related to our ADR facility, including continuing annual stock exchange listing fees, standard out-of-pocket maintenance costs for the ADRs (consisting of the expenses of postage and envelopes for mailing annual and interim financial reports, printing and distributing dividend checks, electronic filing of U.S. federal tax information, mailing required tax forms, stationery, postage, facsimile, and telephone calls), any applicable performance indicators relating to the ADR facility, underwriting fees and legal fees.
Fees to be Paid in the Future
The Depositary has agreed to reimburse us for expenses we incur that are related to establishment and maintenance expenses of the ADS program. The Depositary has agreed to reimburse us for our continuing annual stock exchange listing fees. The Depositary has also agreed to pay the standard out-of-pocket maintenance costs for the ADRs, which consist of the expenses of postage and envelopes for mailing annual and interim financial reports, printing and distributing dividend checks, electronic filing of U.S. federal tax information, mailing required tax forms, stationery, postage, facsimile and telephone calls. It has also agreed to reimburse us annually for certain investor relationship programs or special investor relations promotional activities. In certain instances, the Depositary has agreed to provide additional payments to us based on any applicable performance indicators relating to the ADR facility. There are limits on the amount of expenses for which the Depositary will reimburse us, but the amount of reimbursement available to us is not necessarily tied to the amount of fees the Depositary collects from investors.
The Depositary collects its fees for delivery and surrender of ADSs directly from investors depositing shares or surrendering ADSs for the purpose of withdrawal or from intermediaries acting for them. The Depositary collects fees for making distributions to investors by deducting those fees from the amounts distributed or by selling a portion of distributable property to pay the fees. The Depositary may collect its annual fee for depositary services by deduction from cash distributions or by directly billing investors or by charging the book-entry system accounts of participants acting for them. The Depositary may generally refuse to provide fee-attracting services until its fees for those services are paid.
| 134 |
| ITEM 13. | Defaults, Dividend Arrearages and Delinquencies |
Not applicable.
| ITEM 14. | Material Modifications to the Rights of Security Holders and Use of Proceeds |
Not applicable.
| ITEM 15. | Controls and Procedures |
Evaluation of Disclosure Controls and Procedures
As of December 31, 2016, we carried out an evaluation under the supervision and with the participation of our management, including our Chief Executive Officer and Chief Financial Officer, of the effectiveness of the design and operation of our disclosure controls and procedures. There are inherent limitations to the effectiveness of any system of disclosure controls and procedures, including the possibility of human error and the circumvention or overriding of the controls and procedures. Accordingly, even effective disclosure controls and procedures can only provide reasonable assurance of achieving their control objectives. Based upon and as of the date of our evaluation, our Chief Executive Officer and Chief Financial Officer concluded that the disclosure controls and procedures are effective to provide reasonable assurance that information required to be disclosed in the reports we file and submit under the Exchange Act is recorded, processed, summarized and reported as and when required.
Management’s Annual Report on Internal Control over Financial Reporting
Our management is responsible for establishing and maintaining adequate internal control over financial reporting. Internal control over financial reporting is a process designed to provide reasonable assurance regarding the reliability of financial reporting and the preparation of financial statements for external reporting purposes in accordance with generally accepted accounting principles. Because of its inherent limitations, internal control over financial reporting may not prevent or detect misstatements. Our management has assessed the effectiveness of our internal control over financial reporting as of December 31, 2016. In making its assessment, management has utilized the criteria set forth by the Committee of Sponsoring Organizations of the Treadway Commission (2013 framework) in Internal Control—Integrated Framework. Our management concluded that based on its assessment, our internal control over financial reporting was effective as of December 31, 2016.
Our independent registered public accounting firm Paredes, Burga & Asociados S. Civil de R.L., has issued an attestation report on our internal control over financial reporting, which is included below.
Report of Independent Registered Public Accounting Firm
To the Board of Directors and Shareholders of Compañía de Minas Buenaventura S.A.A. and Subsidiaries
We have audited Compañía de Minas Buenaventura S.A.A. and Subsidiaries’ internal control over financial reporting as of December 31, 2016, based on criteria established in Internal Control - Integrated Framework issued by the Committee of Sponsoring Organizations of the Treadway Commission (2013 framework) (the COSO criteria). Compañía de Minas Buenaventura S.A.A. and Subsidiaries’ management is responsible for maintaining effective internal control over financial reporting, and for its assessment of the effectiveness of internal control over financial reporting included in the accompanying Management’s Annual Report on Internal Control Over Financial Reporting. Our responsibility is to express an opinion on the company’s internal control over financial reporting based on our audit.
| 135 |
We conducted our audit in accordance with the standards of the Public Company Accounting Oversight Board (United States). Those standards require that we plan and perform the audit to obtain reasonable assurance about whether effective internal control over financial reporting was maintained in all material respects. Our audit included obtaining an understanding of internal control over financial reporting, assessing the risk that a material weakness exists, testing and evaluating the design and operating effectiveness of internal control based on the assessed risk, and performing such other procedures as we considered necessary in the circumstances. We believe that our audit provides a reasonable basis for our opinion.
A company’s internal control over financial reporting is a process designed to provide reasonable assurance regarding the reliability of financial reporting and the preparation of financial statements for external purposes in accordance with generally accepted accounting principles. A company’s internal control over financial reporting includes those policies and procedures that (1) pertain to the maintenance of records that, in reasonable detail, accurately and fairly reflect the transactions and dispositions of the assets of the company; (2) provide reasonable assurance that transactions are recorded as necessary to permit preparation of financial statements in accordance with generally accepted accounting principles, and that receipts and expenditures of the company are being made only in accordance with authorizations of management and directors of the company; and (3) provide reasonable assurance regarding prevention or timely detection of unauthorized acquisition, use, or disposition of the company’s assets that could have a material effect on the financial statements.
Because of its inherent limitations, internal control over financial reporting may not prevent or detect misstatements. Also, projections of any evaluation of effectiveness to future periods are subject to the risk that controls may become inadequate because of changes in conditions, or that the degree of compliance with the policies or procedures may deteriorate.
In our opinion, Compañía de Minas Buenaventura S.A.A. and Subsidiaries maintained, in all material respects, effective internal control over financial reporting as of December 31, 2016, based on the COSO criteria.
We also have audited, in accordance with the standards of the Public Company Accounting Oversight Board (United States), the consolidated statements of financial position of Compañía de Minas Buenaventura S.A.A. and Subsidiaries as of December 31, 2016 and 2015 and the related consolidated statements of profit or loss, other comprehensive income, changes in equity and cash flows for the three years ended December 31, 2016 of Compañía de Minas Buenaventura S.A.A. and Subsidiaries and our report dated February 28, 2017 expressed an unqualified opinion thereon.
Lima, Peru
February 28, 2017
Countersigned by:
Paredes, Burga & Asociados S. Civil de R.L.
/s/ Victor Burga
Victor Burga
C.P.C.C. Register No.14859
| 136 |
Changes in Internal Control Over Financial Reporting
There has been no change in our internal control over financial reporting during 2016 that has materially affected, or is reasonably likely to materially affect, our internal control over financial reporting.
| ITEM 16A. | Audit Committee Financial Expert |
The Board of Directors has determined that Mr. German Suárez is the Audit Committee financial expert as defined in Item 16A of Form 20-F. The Board of Directors has also determined that Mr. Suárez and each of the other members of the Audit Committee are “independent directors” as defined in Section 303A.02 of the New York Stock Exchange’s, (“NYSE”), Listed Company Manual.
| ITEM 16B. | Code of Ethics |
We have adopted a written code of business conduct and ethics that applies to our principal executive officer, principal financial officer, principal accounting officer and controller, or persons performing similar functions, as well as all other employees. Our code of business conduct and ethics is posted on, and within five days following the date of any amendment or waiver we intend to disclose any amendments to or waivers from our code of business conduct and ethics on, our website, which is located at http://www.buenaventura.com . The information on our website is not a part of, nor incorporated into, this document.
| ITEM 16C. | Principal Accountant Fees and Services |
The Audit Committee proposed at the General Meeting that Paredes, Burga & Asociados S. Civil de R.L., a member firm of EY Global, be elected as the independent auditor for 2016. Paredes, Burga & Asociados S. Civil de R.L. has served as our independent public accountant for each of the fiscal years in the two-year period ended December 31, 2015 and 2016, for which audited financial statements appear in this annual report on Form 20-F.
The following table presents the aggregate fees for professional services and other services rendered by Paredes, Burga & Asociados S. Civil de R.L. for 2015 and 2016.
| Year ended December 31, | ||||||||
| 2015 | 2016 | |||||||
| Audit Fees | US$ | 1,314,910 | US$ | 1,081,358 | ||||
| Tax Fees | US$ | 292,589 | US$ | 262,183 | ||||
| All other fees | US$ | 21,845 | US$ | 4,272 | ||||
| Total | US$ | 1,629,344 | US$ | 1,347,813 | ||||
Audit Fees . Audit fees in the above table are the aggregate fees billed by Paredes, Burga & Asociados S. Civil de R.L. in connection with the audit of our annual financial statements, the review of our quarterly financial statements and statutory and regulatory audits. In addition, the amounts in the above table includes fees that were incurred in connection with the audit of internal control over financial reporting in 2015 and 2016.
Tax Fees . Tax fees in the above table are fees billed by Paredes, Burga & Asociados S. Civil de R.L. in connection with review of income tax filings, transfer pricing studies and tax consultations.
Audit Committee Pre-approval Policies and Procedures
Our Audit Committee is responsible for the oversight of the independent auditor. The Audit Committee has adopted a policy regarding pre-approval of audit services provided by our independent auditors, or the “Policy.” In accordance with the Policy, the Audit Committee must pre-approve the provision of services by our independent auditor for all audit and non-audit services before commencement of the specified service. The requests for pre-approval are submitted to the Audit Committee by the Chief Financial Officer and following approval by audit committee members an engagement letter is executed. The Audit Committee approved all audit and tax fees in 2015 and 2016.
| 137 |
| ITEM 16D. | Exemptions from the Listing Standards for Audit Committees |
Not applicable.
| ITEM 16E. | Purchases of Equity Securities by the Issuer and Affiliated Purchasers |
For the year ended December 31, 2016, neither we nor any person acting on our behalf made any purchase of our Common Shares.
| ITEM 16F. | Change in Registrant’s Certifying Accountant |
None.
| ITEM 16G. | Corporate Governance |
There are significant differences in the corporate governance practices followed by us as compared to those followed by U.S. domestic companies under the NYSE, listing standards. The NYSE listing standards provide that the board of directors of a U.S. domestic listed company must consist of a majority of independent directors and that certain committees must consist solely of independent directors. Under Peruvian corporate governance practices, a Peruvian company is not required to have a majority of the members of the board of directors be independent.
The listing standards for the NYSE also require that U.S. domestic companies have an audit committee, a nominating/corporate governance committee and a compensation committee. Each of these committees must consist solely of independent directors and must have a written charter that addresses certain matters specified in the listing standards. Peruvian corporate governance practices permit the board of directors of a Peruvian company to form special governance bodies in accordance with the needs of such company and do not require that these special governance bodies be composed partially or entirely of independent directors. We maintain three committees, which include the Audit Committee, the Compensation Committee and the Nominating/Corporate Governance Committee. Our Board has determined that our Audit Committee is composed entirely of independent directors, as defined in the NYSE’s Listed Company Manual.
The NYSE’s listing standards also require U.S. domestic companies to adopt and disclose corporate governance guidelines. In July 2002, the SMV and a committee composed of regulatory agencies and associations prepared and published a list of suggested corporate governance guidelines called “Principles of Good Governance for Peruvian Companies.” These principles are disclosed on the SMV’s website at http://www.smv.gob.pe . Our code of business conduct and ethics establishes our principles of good corporate governance and, as indicated in “Item 16B. Code of Ethics,” is posted on our website.
| ITEM 16H. | Mine Safety Disclosure |
Not applicable.
| 138 |
| ITEM 17. | Financial Statements |
Not applicable.
| ITEM 18. | Financial Statements |
Please refer to Item 19.
| ITEM 19. | Exhibits |
| (a) | Index to Financial Statements and Schedules |
| Page | |
| COMPAÑÍA DE MINAS BUENAVENTURA S.A.A. AND SUBSIDIARIES | F-1 |
| MINERA YANACOCHA S.R.L. | F-102 |
| SOCIEDAD MINERA CERRO VERDE S.A.A. | F-157 |
| (b) | Index to Exhibits |
| 1.1 | By-laws ( Estatutos ) of Compañía de Minas Buenaventura S.A.A., as amended April 30, 2002 (incorporated by reference from Compañía de Minas Buenaventura S.A.A. Annual Report on Form 20-F for the year ended December 31, 2002, filed on June 25, 2003). |
| 1.2 | By-laws ( Estatutos ) of Minera Yanacocha S.R.L., as amended October 18, 1999 (incorporated by reference from Compañía de Minas Buenaventura S.A.A. Annual Report on Form 20-F for the year ended December 31, 2002, filed on June 25, 2003). |
| 2.1 | Credit and Guaranty Agreement, dated as of June 27, 2016 among Compañía de Minas Buenaventura S.A.A., as Borrower, Banco de Crédito del Perú, as Administrative Agent, Compañía Minera Condesa S.A., Inversiones Colquijirca S.A. and Consorcio Energético de Huancavelica S.A., as Guarantors, and BBVA Banco Continental, Banco de Crédito del Perú, Corpbanca New York Branch, Banco Internacional del Perú S.A.A. – Interbank, Industrial and Commercial Bank of China, Dubai (DIFC) Branch, Banco Latinoamericano de Comercio Exterior, S.A. and Banco de Sabadell, Miami Branch, as Lenders.† |
| 4.1 | Shareholders Agreement among SMM Cerro Verde Netherlands B.V., Sumitomo Metal Mining Co., Ltd., Sumitomo Corporation, Summit Global Management B.V., Compañía de Minas Buenaventura S.A.A., Cyprus Climax Metals Company, Phelps Dodge Corporation and Sociedad Minera Cerro Verde S.A.A., dated June 1, 2005 (incorporated by reference from Compañía de Minas Buenaventura S.A.A. Annual Report on Form 20-F for the year ended December 31, 2005, filed on June 6, 2006). |
| 11 | Code of Conduct and Ethics (incorporated by reference from Compañía de Minas Buenaventura S.A.A. Annual Report on Form 20-F for the year ended December 31, 2013, filed on April 30, 2014). |
| 12.1 | Certification of Chief Executive Officer of Compañía de Minas Buenaventura S.A.A. pursuant to Section 302 of the Sarbanes-Oxley Act of 2002.† |
| 12.2 | Certification of Chief Financial Officer of Compañía de Minas Buenaventura S.A.A. pursuant to Section 302 of the Sarbanes-Oxley Act of 2002.† |
| 13.1 | Certification of Chief Executive Officer of Compañía de Minas Buenaventura S.A.A. pursuant to Section 906 of the Sarbanes-Oxley Act of 2002.† |
| 139 |
| 13.2 | Certification of Chief Financial Officer of Compañía de Minas Buenaventura S.A.A. pursuant to Section 906 of the Sarbanes-Oxley Act of 2002.† |
† Filed herewith.
| 140 |
SIGNATURE
The registrant hereby certifies that it meets all of the requirements for filing on Form 20-F and that it has duly caused and authorized the undersigned to sign this annual report on its behalf.
| COMPAÑÍA DE MINAS BUENAVENTURA S.A.A. | ||
| By: | /s/ Carlos E. Gálvez Pinillos | |
| Carlos E. Gálvez Pinillos | ||
| Chief Financial Officer | ||
| Dated: April 28, 2017 | ||
| 141 |
Exhibit Index
| Exhibit No. | Document Description | |
| 1.1 | By-laws ( Estatutos ) of Compañía de Minas Buenaventura S.A.A., as amended April 30, 2002 (incorporated by reference from Compañía de Minas Buenaventura S.A.A. Annual Report on Form 20-F for the year ended December 31, 2002, filed on June 25, 2003). | |
| 1.2 | By-laws ( Estatutos ) of Minera Yanacocha S.R.L., as amended October 18, 1999 (incorporated by reference from Compañía de Minas Buenaventura S.A.A. Annual Report on Form 20-F for the year ended December 31, 2002, filed on June 25, 2003). | |
| 2.1 | Credit and Guaranty Agreement, dated as of June 27, 2016 among Compañía de Minas Buenaventura S.A.A., as Borrower, Banco de Crédito del Perú, as Administrative Agent, Compañía Minera Condesa S.A., Inversiones Colquijirca S.A. and Consorcio Energético de Huancavelica S.A., as Guarantors, and BBVA Banco Continental, Banco de Crédito del Perú, Corpbanca New York Branch, Banco Internacional del Perú S.A.A. – Interbank, Industrial and Commercial Bank of China, Dubai (DIFC) Branch, Banco Latinoamericano de Comercio Exterior, S.A. and Banco de Sabadell, Miami Branch, as Lenders.† | |
| 4.1 | Shareholders Agreement among SMM Cerro Verde Netherlands B.V., Sumitomo Metal Mining Co., Ltd., Sumitomo Corporation, Summit Global Management B.V., Compañía de Minas Buenaventura S.A.A., Cyprus Climax Metals Company, Phelps Dodge Corporation and Sociedad Minera Cerro Verde S.A.A. dated June 1, 2005 (incorporated by reference from Compañía de Minas Buenaventura S.A.A. Annual Report on Form 20-F for the year ended December 31, 2005, filed on June 6, 2006). | |
| 11 | Code of Conduct and Ethics. (incorporated by reference from Compañía de Minas Buenaventura S.A.A. Annual Report on Form 20-F for the year ended December 31, 2013, filed on April 30, 2014). | |
| 12.1 | Certification of Chief Executive Officer of Compañía de Minas Buenaventura S.A.A. pursuant to Section 302 of the Sarbanes-Oxley Act of 2002.† | |
| 12.2 | Certification of Chief Financial Officer of Compañía de Minas Buenaventura S.A.A. pursuant to Section 302 of the Sarbanes-Oxley Act of 2002.† | |
| 13.1 | Certification of Chief Executive Officer of Compañía de Minas Buenaventura S.A.A. pursuant to Section 906 of the Sarbanes-Oxley Act of 2002.† | |
| 13.2 | Certification of Chief Financial Officer of Compañía de Minas Buenaventura S.A.A. pursuant to Section 906 of the Sarbanes-Oxley Act of 2002.† |
† Filed herewith.
Exhibits
Compañía de Minas Buenaventura S.A.A. and Subsidiaries
Consolidated Financial Statements for the years 2016, 2015 and 2014, together with the Report of Independent Registered Public Accounting Firm
| F- 1 |
Report of Independent Registered Public Accounting Firm
Compañía de Minas Buenaventura S.A.A. and Subsidiaries
Consolidated Financial Statements for the years 2016, 2015 and 2014, together with the Report of Independent Registered Public Accounting Firm.
| F- 2 |
Report of Independent Registered Public Accounting Firm
To the Board of Directors and Shareholders of Compañía de Minas Buenaventura S.A.A. and Subsidiaries.
We have audited the accompanying consolidated financial statements of Compañía de Minas Buenaventura S.A.A. (a Peruvian public corporation) and Subsidiaries (together the “Group”), which comprise the consolidated statements of financial position as of December 31, 2016 and 2015, and the related consolidated statements of profit or loss, statements of other comprehensive income, statements of changes in equity and statements of cash flows for each of the three years in the period ended December 31, 2016. These consolidated financial statements are the responsibility of the Group's Management. Our responsibility is to express an opinion on these consolidated financial statements based on our audits. We did not audit the financial statements of Minera Yanacocha S.R.L (an associate in which the Company has a 43.65% interest through its subsidiary, Compañía Minera Condesa S.A.) as of December 31, 2014 and for the year then ended. In the consolidated statement of profit or loss for 2014, the Group’s equity in the results of Minera Yanacocha S.R.L. is stated at a loss of US$175 million. The financial statements of Minera Yanacocha S.R.L. were audited by other auditors whose report has been furnished to us, and our opinion, insofar as it relates to the amounts included for Minera Yanacocha S.R.L., is based solely on the report of the other auditors.
We conducted our audits in accordance with the standards of the Public Company Accounting Oversight Board (United States). Those standards require that we plan and perform the audit to obtain reasonable assurance about whether the consolidated financial statements are free of material misstatement. An audit includes examining, on a test basis, evidence supporting the amounts and disclosures in the financial statements. An audit also includes assessing the accounting principles used and significant estimates made by management, as well as evaluating the overall financial statement presentation. We believe that our audits and the report of other auditors provide a reasonable basis for our opinion.
| F- 3 |
Report of Independent Registered Public Accounting Firm (continue)
In our opinion, based on our audits and the report of other auditors, the consolidated financial statements referred to above present fairly, in all material respects, the consolidated financial position of Compañía de Minas Buenaventura S.A.A. and Subsidiaries´ as of December 31, 2016 and 2015, and the consolidated results of operations and cash flows for each of the three years in the period ended December 31, 2016, in conformity with International Financial Reporting Standards as issued by the International Accounting Standards Board (IASB).
We also have audited, in accordance with the standards of the Public Company Accounting Oversight Board (United States), Compañía de Minas Buenaventura S.A.A. and Subsidiaries´ internal control over financial reporting as of December 31, 2016, based on criteria established in Internal Control - Integrated Framework issued by the Committee of Sponsoring Organizations of the Treadway Commission (2013 framework) and our report dated February 28, 2017 expressed an unqualified opinion thereon.
Lima, Peru,
February 28, 2017
Countersigned by:
Paredes, Burga & Asociados S. Civil de R.L.
| /s/ Victor Burga |
Victor Burga
C.P.C.C. Register No. 14859
| F- 4 |
Compañía de Minas Buenaventura S.A.A. and Subsidiaries
Consolidated statements of financial position
As of December 31, 2016 and 2015
| Note | 2016 | 2015 | ||||||||
| US$(000) | US$(000) | |||||||||
| Asset | ||||||||||
| Current asset | ||||||||||
| Cash and cash equivalents | 7 | 80,544 | 78,519 | |||||||
| Trade and other receivables, net | 8(a) | 269,089 | 219,862 | |||||||
| Inventories, net | 9(a) | 120,947 | 101,473 | |||||||
| Income tax credit | 19,956 | 45,919 | ||||||||
| Prepaid expenses | 10 | 11,392 | 8,231 | |||||||
| 501,928 | 454,004 | |||||||||
| Assets held for sale | 1(e) | - | 15,592 | |||||||
| 501,928 | 469,596 | |||||||||
| Non-current asset | ||||||||||
| Trade and other receivables, net | 8(a) | 166,048 | 162,567 | |||||||
| Inventories, net | 9(a) | 14,027 | 26,029 | |||||||
| Income tax credit | 3,660 | - | ||||||||
| Investments in associates | 11(a) | 1,536,607 | 2,043,983 | |||||||
| Mining concessions, development costs, property, plant and equipment, net | 12 | 1,960,025 | 1,747,624 | |||||||
| Investment properties, net | 13 | 10,089 | 10,719 | |||||||
| Deferred income tax asset, net | 28(b) | 25,881 | 41,574 | |||||||
| Prepaid expenses | 10 | 30,431 | 29,235 | |||||||
| Other assets | 17,719 | 15,854 | ||||||||
| 3,764,487 | 4,077,585 | |||||||||
| Total assets | 4,266,415 | 4,547,181 | ||||||||
| Liabilities and shareholders’ equity, net | ||||||||||
| Current liabilities | ||||||||||
| Bank loans | 14 | 55,000 | 285,302 | |||||||
| Trade and other payables | 15(a) | 273,440 | 247,114 | |||||||
| Provisions | 16(a) | 62,502 | 49,829 | |||||||
| Income tax payable | 8,686 | 2,444 | ||||||||
| Embedded derivatives for sale of concentrate, net | 32(b) | 1,524 | 1,694 | |||||||
| Financial obligations | 17(a) | 40,110 | 33,394 | |||||||
| Hedge derivative financial instruments | 32(a) | 3,863 | 10,643 | |||||||
| 445,125 | 630,420 | |||||||||
| Liabilities directly associated with the assets held for sale | 1(e) | - | 20,611 | |||||||
| 445,125 | 651,031 | |||||||||
| Non-current liabilities | ||||||||||
| Trade and other payables | 15(a) | 15,982 | 15,057 | |||||||
| Provisions | 16(a) | 174,190 | 141,885 | |||||||
| Financial obligations | 17(a) | 552,232 | 320,316 | |||||||
| Contingent consideration liability | 5 | 19,343 | 16,994 | |||||||
| Deferred income tax liabilities, net | 28(b) | 12,330 | 12,662 | |||||||
| 774,077 | 506,914 | |||||||||
| Total liabilities | 1,219,202 | 1,157,945 | ||||||||
| Shareholders ‘equity, net | 18 | |||||||||
| Capital stock | 750,497 | 750,497 | ||||||||
| Investment shares | 791 | 1,396 | ||||||||
| Additional paid-in capital | 218,450 | 219,055 | ||||||||
| Legal reserve | 162,744 | 162,714 | ||||||||
| Other reserves | 269 | 269 | ||||||||
| Retained earnings | 1,690,123 | 2,024,895 | ||||||||
| Other reserves of equity | (1,783 | ) | 2,240 | |||||||
| Shareholders ‘equity, net attributable to owners of the parent | 2,821,091 | 3,161,066 | ||||||||
| Non-controlling interest | 19(a) | 226,122 | 228,170 | |||||||
| Total shareholders’ equity, net | 3,047,213 | 3,389,236 | ||||||||
| Total liabilities and shareholders’ equity, net | 4,266,415 | 4,547,181 | ||||||||
| F- 5 |
Compañía de Minas Buenaventura S.A.A. and Subsidiaries
Consolidated statements of profit or loss
For the years ended December 31, 2016, 2015 and 2014
| Note | 2016 | 2015 | 2014 | |||||||||||
| US$(000) | US$(000) | US$(000) | ||||||||||||
| Continuing operations | ||||||||||||||
| Operating income | ||||||||||||||
| Net sales of goods | 21(a) | 1,015,670 | 846,269 | 959,286 | ||||||||||
| Net sales of services | 21(a) | 28,782 | 50,839 | 71,159 | ||||||||||
| Royalty income | 30(a) | 24,339 | 32,414 | 36,867 | ||||||||||
| Total operating income | 1,068,791 | 929,522 | 1,067,312 | |||||||||||
| Operating costs | ||||||||||||||
| Cost of sales of goods, excluding depreciation and amortization | 22(a) | (497,812 | ) | (513,490 | ) | (498,714 | ) | |||||||
| Cost of services, excluding depreciation and amortization | 22(b) | (10,754 | ) | (59,612 | ) | (77,927 | ) | |||||||
| Exploration in operating units | 23 | (96,149 | ) | (89,699 | ) | (97,357 | ) | |||||||
| Depreciation and amortization | (192,647 | ) | (232,583 | ) | (172,999 | ) | ||||||||
| Mining royalties | 24 | (27,611 | ) | (27,188 | ) | (27,428 | ) | |||||||
| Total operating costs | (824,973 | ) | (922,572 | ) | (874,425 | ) | ||||||||
| Gross profit | 243,818 | 6,950 | 192,887 | |||||||||||
| Operating expenses, net | ||||||||||||||
| Administrative expenses | 25 | (81,692 | ) | (84,372 | ) | (93,753 | ) | |||||||
| Exploration in non-operating areas | 26 | (26,589 | ) | (30,610 | ) | (50,007 | ) | |||||||
| Selling expenses | (21,733 | ) | (19,365 | ) | (16,212 | ) | ||||||||
| Impairment loss of long-lived assets | 12(b) | - | (3,803 | ) | - | |||||||||
| Other, net | 18,392 | (5,735 | ) | 3,169 | ||||||||||
| Total operating expenses, net | (111,622 | ) | (143,885 | ) | (156,803 | ) | ||||||||
| Operating profit (loss) | 132,196 | (136,935 | ) | 36,084 | ||||||||||
| Other income (expense), net | ||||||||||||||
| Share in the results of associates under equity method | 11(b) | (365,321 | ) | (173,375 | ) | (74,600 | ) | |||||||
| Finance costs | 27 | (31,580 | ) | (27,572 | ) | (11,276 | ) | |||||||
| Net gain (loss) from currency exchange difference | 2,638 | (13,693 | ) | (8,457 | ) | |||||||||
| Gain on business combination | 5 | - | - | 59,852 | ||||||||||
| Finance income | 27 | 6,830 | 11,026 | 8,408 | ||||||||||
| Total other income (expenses), net | (387,433 | ) | (203,614 | ) | (26,073 | ) | ||||||||
| Profit (loss) before income tax | (255,237 | ) | (340,549 | ) | 10,011 | |||||||||
| Income tax | ||||||||||||||
| Current | 28(c) | (39,444 | ) | (14,222 | ) | (18,815 | ) | |||||||
| Deferred | 28(c) | (14,060 | ) | (541 | ) | (47,006 | ) | |||||||
| Loss from continuing operations | (308,741 | ) | (355,312 | ) | (55,810 | ) | ||||||||
| Discontinued operations | ||||||||||||||
| Loss from discontinued operations | 1(e) | (19,073 | ) | (20,233 | ) | (5,830 | ) | |||||||
| Loss for the year | (327,814 | ) | (375,545 | ) | (61,640 | ) | ||||||||
| Attributable to: | ||||||||||||||
| Owners of the parent | (323,492 | ) | (317,210 | ) | (76,065 | ) | ||||||||
| Non-controlling interest | 19(a) | (4,322 | ) | (58,335 | ) | 14,425 | ||||||||
| (327,814 | ) | (375,545 | ) | (61,640 | ) | |||||||||
| Basic and diluted loss per share attributable to equity holders of the parent, stated in U.S. dollars | 18(e) | (1.27 | ) | (1.25 | ) | (0.30 | ) | |||||||
| Loss for continuing operations, basic and diluted per share attributable to equity holders of the parent, expressed in US dollars | 18(e) | (1.20 | ) | (1.17 | ) | (0.28 | ) | |||||||
| F- 6 |
Compañía de Minas Buenaventura S.A.A. and Subsidiaries
Consolidated statements of other comprehensive income
For the years ended December 31, 2016, 2015 and 2014
| 2016 | 2015 | 2014 | ||||||||||
| US$(000) | US$(000) | US$(000) | ||||||||||
| Net loss | (327,814 | ) | (375,545 | ) | (61,640 | ) | ||||||
| Other comprehensive profit (loss): | ||||||||||||
| Other comprehensive income to be reclassified to profit or loss in subsequent periods | ||||||||||||
| Net change in unrealized gain (loss) on cash flow hedges | (4,368 | ) | (3,368 | ) | 4,781 | |||||||
| Reclassification in other investments | 279 | (546 | ) | (80 | ) | |||||||
| Income tax effect | (1,301 | ) | 3,372 | (1,581 | ) | |||||||
| (5,390 | ) | (542 | ) | 3,120 | ||||||||
| Total other comprehensive loss | (333,204 | ) | (376,087 | ) | (58,520 | ) | ||||||
| Attributable to: | ||||||||||||
| Equity holders of the parent | (327,515 | ) | (316,725 | ) | (74,414 | ) | ||||||
| Non-controlling interests | (5,689 | ) | (59,362 | ) | 15,894 | |||||||
| (333,204 | ) | (376,087 | ) | (58,520 | ) | |||||||
| F- 7 |
Compañía de Minas Buenaventura S.A.A. and Subsidiaries
Consolidated statements of changes in equity
For the years ended December 31, 2016, 2015 and 2014
| Attributable to equity holders of the parent | ||||||||||||||||||||||||||||||||||||||||||||
|
Capital
stock, net of
treasury shares |
||||||||||||||||||||||||||||||||||||||||||||
|
Number of
shares outstanding |
Common
shares |
Investment
shares |
Additional
paid-in capital |
Legal
reserve |
Other
reserves |
Retained
earnings |
Other
reserves of equity |
Total |
Non-
controlling interest |
Total
equity |
||||||||||||||||||||||||||||||||||
| US$(000) | US$(000) | US$(000) | US$(000) | US$(000) | US$(000) | US$(000) | US$(000) | US$(000) | US$(000) | |||||||||||||||||||||||||||||||||||
| As of January 1, 2014 | 253,715,190 | 750,497 | 1,396 | 219,055 | 162,663 | 269 | 2,413,130 | 104 | 3,547,114 | 277,307 | 3,824,421 | |||||||||||||||||||||||||||||||||
| Net profit (loss) | - | - | - | - | - | - | (76,065 | ) | - | (76,065 | ) | 14,425 | (61,640 | ) | ||||||||||||||||||||||||||||||
| Other comprehensive profit | - | - | - | - | - | - | - | 1,651 | 1,651 | 1,469 | 3,120 | |||||||||||||||||||||||||||||||||
| Total other comprehensive profit (loss) | - | - | - | - | - | - | (76,065 | ) | 1,651 | (74,414 | ) | 15,894 | (58,520 | ) | ||||||||||||||||||||||||||||||
| Dividends declared and paid, notes 18(d) and 19(d) | - | - | - | - | - | - | (8,642 | ) | - | (8,642 | ) | (8,880 | ) | (17,522 | ) | |||||||||||||||||||||||||||||
| Expired dividends | - | - | - | - | 47 | - | - | - | 47 | - | 47 | |||||||||||||||||||||||||||||||||
| Increases in non-controlling interest | - | - | - | - | - | - | - | - | - | 13,699 | 13,699 | |||||||||||||||||||||||||||||||||
| As of December 31, 2014 | 253,715,190 | 750,497 | 1,396 | 219,055 | 162,710 | 269 | 2,328,423 | 1,755 | 3,464,105 | 298,020 | 3,762,125 | |||||||||||||||||||||||||||||||||
| Net loss | - | - | - | - | - | - | (317,210 | ) | - | (317,210 | ) | (58,335 | ) | (375,545 | ) | |||||||||||||||||||||||||||||
| Other comprehensive profit (loss) | - | - | - | - | - | - | - | 485 | 485 | (1,027 | ) | (542 | ) | |||||||||||||||||||||||||||||||
| Total other comprehensive profit (loss) | - | - | - | - | - | - | (317,210 | ) | 485 | (316,725 | ) | (59,362 | ) | (376,087 | ) | |||||||||||||||||||||||||||||
| Dividends declared and paid, note 18(d) | - | - | - | - | - | - | - | - | - | (10,488 | ) | (10,488 | ) | |||||||||||||||||||||||||||||||
| Expired dividends | - | - | - | - | 4 | - | - | - | 4 | - | 4 | |||||||||||||||||||||||||||||||||
| Other items | - | - | - | - | - | - | 13,682 | - | 13,682 | - | 13,682 | |||||||||||||||||||||||||||||||||
| As of December 31, 2015 | 253,715,190 | 750,497 | 1,396 | 219,055 | 162,714 | 269 | 2,024,895 | 2,240 | 3,161,066 | 228,170 | 3,389,236 | |||||||||||||||||||||||||||||||||
| Net loss | - | - | - | - | - | - | (323,492 | ) | - | (323,492 | ) | (4,322 | ) | (327,814 | ) | |||||||||||||||||||||||||||||
| Other comprehensive loss | - | - | - | - | - | - | - | (4,023 | ) | (4,023 | ) | (1,367 | ) | (5,390 | ) | |||||||||||||||||||||||||||||
| Total other comprehensive loss | - | - | - | - | - | - | (323,492 | ) | (4,023 | ) | (327,515 | ) | (5,689 | ) | (333,204 | ) | ||||||||||||||||||||||||||||
| Change in non-controlling interest, note 19(a) | - | - | - | - | - | - | (3,659 | ) | - | (3,659 | ) | 11,041 | 7,382 | |||||||||||||||||||||||||||||||
| Expired dividends | - | - | - | - | 30 | - | - | - | 30 | - | 30 | |||||||||||||||||||||||||||||||||
| Treasury shares, note 18(b) | - | - | (605 | ) | (605 | ) | - | - | - | - | (1,210 | ) | - | (1,210 | ) | |||||||||||||||||||||||||||||
| Dividends declared and paid, note 18(d) | - | - | - | - | - | - | (7,621 | ) | - | (7,621 | ) | (7,400 | ) | (15,021 | ) | |||||||||||||||||||||||||||||
| As of December 31, 2016 | 253,715,190 | 750,497 | 791 | 218,450 | 162,744 | 269 | 1,690,123 | (1,783 | ) | 2,821,091 | 226,122 | 3,047,213 | ||||||||||||||||||||||||||||||||
| F- 8 |
Compañía de Minas Buenaventura S.A.A. and Subsidiaries
Consolidated statements of cash flows
For the years ended December 31, 2016, 2015 and 2014
| Note | 2016 | 2015 | 2014 | |||||||||||
| US$(000) | US$(000) | US$(000) | ||||||||||||
| Operating activities | ||||||||||||||
| Proceeds from sales | 1,003,422 | 965,273 | 1,144,394 | |||||||||||
| Dividends received | 30 | 142,340 | 6,691 | 12,938 | ||||||||||
| Value added tax recovered | 117,661 | 81,692 | 39,685 | |||||||||||
| Royalty received | 25,961 | 38,983 | 31,252 | |||||||||||
| Interest received | 2,140 | 3,650 | 8,333 | |||||||||||
| Payments to suppliers and third parties | (672,419 | ) | (727,017 | ) | (805,413 | ) | ||||||||
| Payments to employees | (138,113 | ) | (175,329 | ) | (203,496 | ) | ||||||||
| Interest paid | (34,138 | ) | (21,518 | ) | (9,405 | ) | ||||||||
| Payments of mining royalties | (20,052 | ) | (22,836 | ) | (22,631 | ) | ||||||||
| Income tax paid | (35,401 | ) | (22,330 | ) | (33,161 | ) | ||||||||
| Net cash and cash equivalents provided by operating activities | 391,401 | 127,259 | 162,496 | |||||||||||
| Investing activities | ||||||||||||||
| Proceeds from collection of loan to an associate | 30 | - | - | 15,553 | ||||||||||
| Proceeds from sale of mining concessions, development costs, property, plant and equipment | 7,180 | 5,481 | 1,681 | |||||||||||
| Additions to mining concessions, development costs, property, plant and equipment | 12 | (366,834 | ) | (211,286 | ) | (227,564 | ) | |||||||
| Loans to associates | 30(d) | - | (124,800 | ) | - | |||||||||
| Loans to third parties | 8 | - | (829 | ) | ||||||||||
| Payments for acquisition of other assets | (5,222 | ) | (10,238 | ) | - | |||||||||
| Payments for acquisition of shares in associate, net of cash acquired | - | - | (80,316 | ) | ||||||||||
| Contributions in associates | - | - | (2,012 | ) | ||||||||||
| Net cash and cash equivalents used in investing activities | (364,876 | ) | (341,672 | ) | (292,658 | ) | ||||||||
| Financing activities | ||||||||||||||
| Proceeds from financial obligations | 17 | 275,210 | 296 | 177,125 | ||||||||||
| Proceeds from bank loans | 14 | 200,500 | 344,503 | 40,000 | ||||||||||
| Payments of bank loans | 14 | (442,957 | ) | (90,000 | ) | - | ||||||||
| Payments of financial obligations | 17 | (33,476 | ) | (29,891 | ) | (42,205 | ) | |||||||
| Dividends paid to controlling shareholders | 18(d) | (7,621 | ) | - | (8,642 | ) | ||||||||
| Dividends paid to non-controlling shareholders | 19(a) | (7,400 | ) | (10,488 | ) | (8,880 | ) | |||||||
| Acquisition of non-controlling interest | 19(a) | (5,459 | ) | - | - | |||||||||
| Increase of restricted bank accounts | 8(e) | (2,087 | ) | - | - | |||||||||
| Purchase of treasury shares | 18(b) | (1,210 | ) | - | - | |||||||||
| Net cash and cash equivalents provided by (used in) financing activities | (24,500 | ) | 214,420 | 157,398 | ||||||||||
| Increase (decrease) in cash and cash equivalents for the year, net | 2,025 | 7 | 27,236 | |||||||||||
| Cash and cash equivalents at beginning of year | 78,519 | 78,512 | 51,276 | |||||||||||
| Cash and cash equivalents at year-end | 80,544 | 78,519 | 78,512 | |||||||||||
| Financing and investing activities not affecting cash flows: | ||||||||||||||
| Changes in mine closures plans | 34,532 | 74,907 | 398 | |||||||||||
| Contingent consideration liability | 2,349 | - | 23,026 | |||||||||||
| Accounts receivable from sale of assets | 5,204 | - | - | |||||||||||
| F- 9 |
Compañía de Minas Buenaventura S.A.A. and Subsidiaries
Notes to the consolidated financial statements
For the years 2016, 2015 and 2014
| 1. | Identification and business activity |
| (a) | Identification - |
Compañía de Minas Buenaventura S.A.A. (hereafter “the Company” or “Buenaventura”) is a publicly traded corporation incorporated in 1953. The Company stock is traded on the Lima and New York Stock Exchanges through American Depositary Receipts (ADRs), which represent the Company’s shares deposited in the Bank of New York. The Company’s legal domicile is at Las Begonias Street N°415, San Isidro, Lima, Peru.
| (b) | Business activity - |
The Company and its subsidiaries (hereinafter “the Group") are principally engaged in the exploration, mining, concentration, smelting and marketing of polymetallic ores and metals.
The Group operates directly four operating mining units in Peru (Uchucchacua, Orcopampa, Julcani and Mallay), four discontinued mining units (Poracota, Recuperada, Shila-Paula and Breapampa), and two mining units under development stage (Tambomayo and San Gabriel). In addition, the Group has a controlling interest in Sociedad Minera El Brocal S.A.A. (hereinafter “El Brocal”), which operates the Colquijirca mining unit; Minera La Zanja S.R.L. (hereinafter “La Zanja”), which operates La Zanja mining unit; El Molle Verde S.A.C. (hereinafter “Molle Verde”) which operates Trapiche, a mining unit at the development stage; and other entities dedicated to energy generation and transmission services, construction and engineering services and other activities. All these activities are developed in Peru.
During December 2016, the Company successfully completed the commissioning of the processing plant of the Tambomayo project located in the district of Tapay, province of Caylloma (Arequipa) obtaining the first doré bar on December 30.
The construction of the new Tambomayo mining unit took 36 months and required an investment of approximately US$362 million. In January 2017 the ramp-up started and it is estimated that the commercial operation at full capacity will begin between March and April of 2017.
| (c) | Approval of consolidated financial statements - |
The consolidated financial statements as of December 31, 2016 were approved by the Board of Directors on February 28, 2017 and, in its opinion, will be approved without modifications in the Shareholders’ Meeting to be held within the term established by Law.
The consolidated financial statements as of December 31, 2015 were approved by the Board of Directors on February 25, 2016.
| F- 10 |
Notes to the consolidated financial statements (continued)
| (d) | The consolidated financial statements include the financial statements of the following subsidiaries: |
| Ownership | ||||||||||||||||||
|
Country of
incorporation and business |
December 31, 2016 | December 31, 2015 | ||||||||||||||||
| Direct | Indirect | Direct | Indirect | |||||||||||||||
| % | % | % | % | |||||||||||||||
| Mining activities: | ||||||||||||||||||
| Compañía Minera Condesa S.A. | Peru | 100.00 | - | 100.00 | - | |||||||||||||
| Compañía Minera Colquirrumi S.A. | Peru | 100.00 | - | 100.00 | - | |||||||||||||
| Sociedad Minera El Brocal S.A.A. (*) | Peru | 3.08 | 58.24 | 2.71 | 51.36 | |||||||||||||
| Inversiones Colquijirca S.A. (*) | Peru | 89.76 | 10.24 | 89.76 | 10.24 | |||||||||||||
| S.M.R.L. Chaupiloma Dos de Cajamarca | Peru | 20.00 | 40.00 | 20.00 | 40.00 | |||||||||||||
| Minera La Zanja S.R.L. | Peru | 53.06 | - | 53.06 | - | |||||||||||||
| Minera Julcani S.A. de C.V. | Mexico | 99.80 | 0.20 | 99.80 | 0.20 | |||||||||||||
| Compañía de Minas Buenaventura Chile Ltda. | Chile | 90.00 | 10.00 | 90.00 | 10.00 | |||||||||||||
| El Molle Verde S.A.C. | Peru | 99.98 | 0.02 | 99.98 | 0.02 | |||||||||||||
| Apu Coropuna S.R.L. | Peru | 70.00 | - | 70.00 | - | |||||||||||||
| Metalúrgica Los Volcanes S.A. (**) | Peru | - | - | 99.99 | - | |||||||||||||
| Cerro Hablador S.A.C. | Peru | 99.00 | 1.00 | 99.00 | 1.00 | |||||||||||||
| Minera Azola S.A.C. | Peru | 99.00 | 1.00 | 99.00 | 1.00 | |||||||||||||
| Compañía Minera Nueva Italia S.A. | Peru | - | 93.36 | - | 93.36 | |||||||||||||
| Energy generation and transmission services: | ||||||||||||||||||
| Consorcio Energético de Huancavelica S.A. | Peru | 100.00 | - | 100.00 | - | |||||||||||||
| Empresa de Generación Huanza S.A. | Peru | - | 100.00 | - | 100.00 | |||||||||||||
| Empresa de Generación Huaura S.A.C. (***) | Peru | - | - | 0.01 | 99.99 | |||||||||||||
| Construction, engineering services and insurance brokerage: | ||||||||||||||||||
| Buenaventura Ingenieros S.A. | Peru | 100.00 | - | 100.00 | - | |||||||||||||
| Contacto Corredores de Seguros S.A. | Peru | 99.98 | 0.02 | 99.98 | 0.02 | |||||||||||||
| BISA Argentina S.A. (before Minera San Francisco S.A.) | Argentina | 56.42 | 43.58 | 56.42 | 43.58 | |||||||||||||
| Contacto Risk Consulting S.A. | Peru | - | 98.00 | - | 98.00 | |||||||||||||
| Industrial activities: | ||||||||||||||||||
| Procesadora Industrial Río Seco S.A. | Peru | 100.00 | - | 100.00 | - | |||||||||||||
| (*) | As of December 31, 2016 and 2015, the participation of the Company in the voting rights of El Brocal is 61.32 and 54.07 percent, respectively. Inversiones Colquijirca S.A. (hereafter “Colquijirca”), a Group’s subsidiary (99.99 percent as of December 31, 2015 and 2014), has an interest in El Brocal’s capital stock, through which the Group holds an indirect participation in El Brocal of 58.25 and 51.36 percent as of December 31, 2016 and 2015, respectively. |
| F- 11 |
Notes to the consolidated financial statements (continued)
| (**) | On November 2016, the Board of Directors’ and Shareholders’ Meetings of Metalúrgica Los Volcanes S.A., approved its liquidation. |
| (***) | On December 29, 2016, the Board of Directors’ and Shareholders’ Meetings of Consorcio Energético de Huancavelica S.A. and Empresa de Generación Huaura S.A.C. approved the merger between these subsidiaries whereby Consorcio Energético de Huancavelica S.A. absorbed Empresa de Generación Huaura S.A.C. This merger had not effects in the consolidated financial statements. |
| (e) | Discontinued operations |
As of December 31, 2015, the Group held four mining units classified as discontinued operations (Recuperada, Poracota, Antapite and Shila-Paula). During 2016, the Company decided to cease the classification of three mining units as mining units held for sale (Poracota, Recuperada and Shila-Paula), starting their final closing.
According to IFRS 5 “Non-current Assets Held for Sale and Discontinued Operations”, the Company made the following as a result of the cease of the classification of mining units previously held for sale (Recuperada, Poracota and Shila-Paula): (i) recorded in 2016 the total unrecorded depreciation since the beginning of the classification as units held for sale, which is presented in the “Discontinued operations” caption; and (ii) reclassified in 2016 the assets and liabilities held for sale as of December 31, 2015 into their respective captions, which will be held until the final closing.
On December 2016, the Company sold the mining unit of Antapite for US$1,003,000, resulting in a loss of US$3,014,000 in the consolidated statement of profit or loss.
Since 2016, the Company´s Management decided to initiate the closing of the Breapampa mining unit. As a result, revenues and expenses related to this mining unit were reclassified to the discontinued operations caption for the years 2015 and 2014. On January 2017, the mining unit of Breapampa was sold.
| F- 12 |
Notes to the consolidated financial statements (continued)
The assets and liabilities of the mining units held for sale as of December 31, 2016 and 2015 are presented below:
| 2016 | 2015 | |||||||
| US$(000) | US$(000) | |||||||
| Asset | ||||||||
| Cash | - | 4 | ||||||
| Trade and other receivables, net | - | 172 | ||||||
| Inventories, net | - | 1,940 | ||||||
| Prepaid expenses | - | 170 | ||||||
| Mining concessions, development costs, property, plant and equipment, net | - | 13,306 | ||||||
| Assets classified as held for sale | - | 15,592 | ||||||
| Liabilities | ||||||||
| Trade and other payables | - | (2,862 | ) | |||||
| Provisions | - | (17,749 | ) | |||||
| Liabilities directly associated with the assets held for sale | - | (20,611 | ) | |||||
| F- 13 |
Notes to the consolidated financial statements (continued)
The results of the discontinued operations mining units for the years 2016, 2015 and 2014 are presented below:
| 2016 | 2015 | 2014 | ||||||||||
| US$(000) | US$(000) | US$(000) | ||||||||||
| Operating income | ||||||||||||
| Net sales | 1,149 | 22,740 | 113,585 | |||||||||
| Total income | 1,149 | 22,740 | 113,585 | |||||||||
| Operating costs | ||||||||||||
| Cost of sales, excluding depreciation and amortization | (4,842 | ) | (19,540 | ) | (66,464 | ) | ||||||
| Exploration | (3,777 | ) | (1,847 | ) | (3,349 | ) | ||||||
| Depreciation and amortization | (5,049 | ) | (9,882 | ) | (36,522 | ) | ||||||
| Mining royalties | (11 | ) | (223 | ) | (1,044 | ) | ||||||
| Total operating costs | (13,679 | ) | (31,492 | ) | (107,379 | ) | ||||||
| Gross profit (loss) | (12,530 | ) | (8,752 | ) | 6,206 | |||||||
| Operating expenses, net | ||||||||||||
| Changes in the asset for closure of mining units, note 16(b) | (3,365 | ) | (45 | ) | (840 | ) | ||||||
| Loss for sale of mining unit, note 1(e) | (3,014 | ) | - | - | ||||||||
| Impairment loss of long–lived assets, note 12(b) | (2,043 | ) | (7,452 | ) | (794 | ) | ||||||
| Impairment loss of inventories, note 9(b) | (706 | ) | (1,474 | ) | 1,522 | |||||||
| Administrative expenses | (111 | ) | (2,234 | ) | (7,872 | ) | ||||||
| Selling expenses | (31 | ) | (119 | ) | (594 | ) | ||||||
| Income from sale of assets | 3,200 | - | - | |||||||||
| Reversal (provision) for contingencies | 901 | (381 | ) | - | ||||||||
| Other, net | (350 | ) | 988 | (2,555 | ) | |||||||
| Total operating expenses, net | (5,519 | ) | (10,717 | ) | (11,133 | ) | ||||||
| Operating loss | (18,049 | ) | (19,469 | ) | (4,927 | ) | ||||||
| Other income (expense), net | ||||||||||||
| Finance income | - | - | 1 | |||||||||
| Finance costs | (970 | ) | (890 | ) | (842 | ) | ||||||
| Net gain (loss) from currency exchange difference | (50 | ) | 129 | 150 | ||||||||
| Total other expenses, net | (1,020 | ) | (761 | ) | (691 | ) | ||||||
| Loss before income tax | (19,069 | ) | (20,230 | ) | (5,618 | ) | ||||||
| Income tax | (4 | ) | (3 | ) | (212 | ) | ||||||
| Loss from discontinued operations | (19,073 | ) | (20,233 | ) | (5,830 | ) | ||||||
| Loss from the discontinued operations, per basic and diluted share, express in U. S. dollars | (0.07 | ) | (0.08 | ) | (0.02 | ) | ||||||
| F- 14 |
Notes to the consolidated financial statements (continued)
The net cash flows used by the mining units with discontinued operations for the years 2016, 2015 and 2014, are presented below:
| 2016 | 2015 | 2014 | ||||||||||
| US$(000) | US$(000) | US$(000) | ||||||||||
| Operating activities | (7 | ) | (8 | ) | 2,663 | |||||||
| Investing activities | - | (6 | ) | (2,698 | ) | |||||||
| Financing activities | - | - | - | |||||||||
| Net decrease in cash and cash equivalents during the year | (7 | ) | (14 | ) | (35 | ) | ||||||
| 2. | Basis for preparation, consolidation and accounting policies |
| 2.1. | Basis of preparation - |
The consolidated financial statements of the Group have been prepared in accordance with International Financial Reporting Standards (IFRS), as issued by the International Accounting Standards Board (IASB).
The consolidated financial statements have been prepared on a historical cost basis, based on the records of the Company, except for the derivative financial instruments that have been measured at fair value.
The consolidated financial statements are presented in U.S. dollars and all values are rounded to the nearest thousands, except when otherwise indicated.
The preparation of consolidated financial statements require that Management use judgments, estimates and assumptions, as detailed on the following note 3.
These consolidated financial statements provide comparative information in respect of prior periods.
| 2.2. | Basis of consolidation - |
The consolidated financial statements comprise the financial statements of the Company and its subsidiaries to the date of the statements of financial position.
Control is achieved when the Group is exposed, or has rights, to variable returns from its involvement with the investee and has the ability to affect those returns through its power over the investee. Specifically, the Group controls an investee if, and only if, the Group has:
| - | Power over the investee (i.e., existing rights that give it the current ability to direct the relevant activities of the investee). |
| - | Exposure, or rights, to variable returns from its involvement with the investee. |
| - | The ability to use its power over the investee to affect its returns. |
| F- 15 |
Notes to the consolidated financial statements (continued)
Generally, there is a presumption that a majority of voting rights result in control. To support this presumption and when the Group has less than a majority of the voting or similar rights of an investee, the Group considers all relevant facts and circumstances in assessing whether it has power over an investee, including:
| - | The contractual arrangement with the other vote holders of the investee. |
| - | Rights arising from other contractual arrangements. |
| - | The Group’s voting rights and potential voting rights or a combination of rights. |
The Group re-assesses whether or not it controls an investee if facts and circumstances indicate that there are changes to one or more of the three elements of control. Consolidation of a subsidiary begins when the Group obtains control over the subsidiary and ceases when the Group loses control of the subsidiary. Assets, liabilities, income and expenses of a subsidiary acquired or disposed of during the year are included in the consolidated financial statements from the date the Group gains control until the date the Group ceases to control the subsidiary.
Profit or loss and each component of other comprehensive income are attributed to the equity holders of the Parent of the Group and to the non-controlling interests, even if this results in the non-controlling interests having a deficit balance. When necessary, adjustments are made to the financial statements of subsidiaries to bring their accounting policies into line with the Group’s accounting policies.
All intra-group assets and liabilities, equity, income, expenses and cash flows relating to transactions between members of the Group are eliminated in full on consolidation. A change in the ownership interest of a subsidiary, without a loss of control, is accounted for as an equity transaction.
| 2.3. | Changes in accounting policies and disclosures - |
Certain standards and amendments applied for the first time in 2016; however, they did not have material impact on the annual consolidated financial statements of the Group and therefore, have not been disclosed. The Group has not early adopted any other standard, interpretation or amendment that has been issued but is not yet effective.
| 2.4. | Summary of significant accounting policies - |
| (a) | Foreign currencies - |
The consolidated financial statements are presented in US dollars, which is also the Group’s functional currency.
For each entity, the Group determines the functional currency and the items included in the financial statements of each entity are measured using that functional currency.
Transactions and balances
Transactions in foreign currency (a currency other than the functional currency) are initially recorded by the Group at the exchange rates prevailing at the dates of the transactions, published by the Superintendence of Banking and Insurance and Pension Fund Administrators (AFP for its acronym in Spanish).
| F- 16 |
Notes to the consolidated financial statements (continued)
Monetary assets and liabilities denominated in foreign currencies are translated at the functional currency spot rates of exchange at the reporting date. Gains or losses from exchange differences arising from the settlement or translation of monetary assets and liabilities are recognized in the consolidated statements of profit or loss.
Non-monetary assets and liabilities recognized in terms of historical cost are translated using the exchange rates prevailing at the dates of the initial transactions.
| (b) | Financial instruments - Initial recognition and subsequent measurement - |
A financial instrument is any contract that gives rise to a financial asset of one entity and a financial liability or equity instrument of another entity.
| (i) | Financial assets - |
Initial recognition and measurement -
Financial assets are classified, at initial recognition, as financial assets at fair value through profit or loss, loans and receivables, held-to-maturity investments, available-for-sale financial assets, or derivatives designated as hedging instruments in an effective hedge, as appropriate. All financial assets are recognized initially at fair value plus, in the case of financial assets not recorded at fair value through profit or loss, transaction costs that are attributable to the acquisition of the financial asset.
Subsequent measurement -
For purposes of subsequent measurement, financial assets are classified in four categories:
| - | Financial assets at fair value through profit or loss. |
| - | Loans and receivables. |
| - | Held-to-maturity investments. |
| - | Available-for-sale financial investments. |
Financial assets at fair value through profit or loss -
Financial assets at fair value through profit or loss include financial assets held for trading and financial assets designated upon initial recognition at fair value through profit or loss. Financial assets are classified as held for trading if they are acquired for the purpose of selling or repurchasing in the near term. Derivatives, including separated embedded derivatives, are also classified as held for trading unless they are designated as effective hedging instruments as defined by IAS 39.
Financial assets at fair value through profit or loss are carried in the consolidated statements of financial position at fair value with net changes in fair value presented as finance costs (negative changes) or finance revenue (positive changes) in the consolidated statements of profit or loss.
| F- 17 |
Notes to the consolidated financial statements (continued)
Derivatives embedded in host contracts are accounted for as separate derivatives and recorded at fair value if their economic characteristics and risks are not closely related to those of the host contracts and the host contracts are not held for trading or designated at fair value though profit or loss. These embedded derivatives are measured at fair value, with changes in fair value recognized in profit or loss.
Loans and receivables -
Loans and receivables are non-derivative financial assets with fixed or determinable payments that are not quoted in an active market. After initial measurement, such financial assets are subsequently measured at amortized cost using the effective interest rate method, less impairment. The losses arising from impairment are recognized in the consolidated statements of profit or loss.
This category generally applies to trade and other receivables, net.
Held-to-maturity investments -
Non-derivative financial assets with fixed or determinable payments and fixed maturities are classified as held to maturity when the Group has the positive intention and ability to hold them to maturity. The Group did not have any held-to-maturity investment as of December 31, 2016 and 2015.
Available-for-sale financial assets -
The available-for-sale financial assets include equity investments and debt securities. Equity investments classified as available for sale are those that are neither classified as held for trading nor designated at fair value through profit or loss. Debt securities in this category are those that are intended to be held for an indefinite period of time and may be sold in response to needs for liquidity or in response to changes in the market conditions. The Group did not have these financial assets as of December 31, 2016 and 2015.
Derecognition -
A financial asset (or, where applicable a part of a financial asset or part of a group of similar financial assets) is primarily derecognized when:
| - | The rights to receive cash flows from the asset have expired. |
| - | The Group has transferred its rights to receive cash flows from the asset or has assumed an obligation to pay the received cash flows in full without material delay to a third party under a pass-through arrangement; and either (a) the Group has transferred substantially all the risks and rewards of the asset or, (b) the Group has neither transferred nor retained substantially all the risks and rewards of the asset, but has transferred control of the asset. |
| F- 18 |
Notes to the consolidated financial statements (continued)
When the Group has transferred its rights to receive cash flows from an asset or has entered into a pass-through arrangement, it evaluates if and to what extent, it has retained the risk and rewards of ownership. When it has neither transferred nor retained substantially all of the risks and rewards of the asset, nor transferred control of the asset, the Group continues to recognize the transferred asset to the extent of the Group´s continuing involvement. In that case, the Group also recognizes an associated liability. The transferred asset and the associated liability are measured on a basis that reflects the rights and obligations that the Group has retained.
Impairment of financial assets -
The Group assesses, at each reporting date, whether there is objective evidence that a financial asset or group of financial assets is impaired. An impairment exists if one or more events that has occurred since the initial recognition of the asset (an incurred "loss event"), has an impact on the estimated future cash flows of the financial asset or the group of financial assets that can be reliably estimated.
Evidence of impairment may include indications that the debtors or a group of debtors is experiencing significant financial difficulty, default or delinquency in interest or principal payments, the probability that they will enter bankruptcy or other financial reorganization and observable data indicating that there is a measurable decrease in the estimated future cash flows, such as changes in economic conditions that correlate with defaults.
For financial assets carried at amortized cost, the Group first assesses whether impairment exists for financial assets that are individually significant, or collectively for financial assets that are individually insignificant.
The amount of any impairment loss in the impairment identified is measured as the difference between the asset’s carrying amount and the present value of estimated future cash flows. The present value of the estimated future cash flows is discount at the financial asset’s original effective interest rate.
The carrying amount of the asset is reduced through the use of an allowance account and the loss is recognized in the consolidated statements of profit or loss. Interest income (recorded as revenue in the statements of profit or loss) continues to be accrued on the reduced carrying amount and is accrued using the interest rate used to discount the future cash flows for the purpose of measuring the impairment loss. Loans together with the associated allowance are written off when there is no realistic prospect of a future recovery and all collateral has been realized or has been transferred to the Group. If, in a subsequent year, the amount of the estimated impairment loss increases or decreases because of an event occurring after the impairment was recognized, the previously recognized impairment loss is increased or reduced by adjusting the allowance account. If a write-off is later recovered, the recovery is credited to finance costs in the consolidated statements of profit or loss.
| F- 19 |
Notes to the consolidated financial statements (continued)
| (ii) | Financial liabilities - |
Initial recognition and measurement -
Financial liabilities are classified, at initial recognition, as financial liabilities at fair value through profit or loss, accounts payable, financial obligations, or as derivatives designated as hedging instruments in an effective hedge, as appropriate.
All financial liabilities are recognized initially at fair value and, in the case of interest-bearing loans and borrowings and payables, net of directly attributable transaction costs.
The Group’s financial liabilities include trade and other payables, financial obligations, derivatives financial instruments and embedded derivatives.
Subsequent measurement -
The measurement of financial liabilities depends on their classification, as described below:
Financial liabilities at fair value through profit or loss -
Financial liabilities at fair value through profit or loss include financial liabilities held for trading and financial liabilities designated upon initial recognition as at fair value through profit or loss.
Financial liabilities are classified as held for trading if they are incurred for the purpose of repurchasing in the near term. This category also includes derivative financial instruments entered into by the Group that are not designated as hedging instruments in hedge relationships as defined by IAS 39. Separated embedded derivatives are also classified as held for trading unless they are designated as effective hedging instruments.
Gains or losses on liabilities held for trading are recognized in the consolidated statements of profit or loss.
Except for the embedded derivative for concentrate sales, the Group has not designated any financial liability in this category.
Loans and borrowings -
After initial recognition, interest-bearing loans and borrowing are subsequently measured at amortized cost using the effective interest rate method. Gains and losses are recognized in the consolidated statements of profit and cost when the liabilities are derecognized as well as through the amortization process.
Amortized cost is calculated taking into account any discount or premium on acquisition and fees or costs that are an integral part of the effective interest rate. Amortization under the effective interest rate method is included as financial costs in the consolidated statements of profit or loss.
| F- 20 |
Notes to the consolidated financial statements (continued)
Derecognition -
A financial liability is derecognized when the obligation under the liability is discharged or cancelled, or expires.
When an existing financial liability is replaced by another from the same lender on substantially different terms, or the terms of an existing liability are substantially modified, such an exchange or modification is treated as the derecognition of the original liability and the recognition of a new liability. The difference in the respective carrying amounts is recognized in the consolidated statements of profit or loss.
| (iii) | Offsetting of financial instruments - |
Financial assets and financial liabilities are offset and the net amount is reported in the consolidated statements of financial position if there is a currently enforceable legal right to offset the recognized amounts and there is an intention to settle on a net basis, to realize the assets and settle the liabilities simultaneously.
| (c) | Cash and cash equivalents - |
Cash and cash equivalents in the consolidated statements of financial position comprise cash at banks and on hand.
For the purpose of the consolidated statements of cash flows, cash and cash equivalents consist of cash and short term deposits with a maturity of three months or less, which are subject to an insignificant risk of changes in value.
| (d) | Inventories - |
Materials and supplies are valued at the lower of cost or net realizable value.
Cost is determined using the average method. In the case of finished goods and work in progress, cost includes the cost of materials and direct labor and a portion of indirect manufacturing expenses, excluding borrowing costs.
The current portion of the inventories is determined based on the expected amounts to be processed within the next twelve months. Inventories not expected to be processed within the next twelve months are classified as long-term.
Net realizable value is the estimated selling price in the ordinary course of business, less estimated costs of completion and the estimated costs to make the sale.
Provision (reversal) for losses on the net realizable value are calculated based on a specific analysis conducted annually by the Management and is charged to income in the period in which it determines the need for the provision (reversal).
| F- 21 |
Notes to the consolidated financial statements (continued)
| (e) | Business combinations and goodwill - |
Business combinations are accounted for using the acquisition method. The cost of an acquisition is measured as the aggregate of the consideration transferred measured at acquisition date fair value and the amount of any non-controlling interest in the acquiree. For each business combination, the Group elects whether to measure the non-controlling interests in the acquiree at fair value or at the proportionate share of the acquiree’s identifiable net assets. Acquisition-related costs are expensed as incurred and included in administrative expenses.
When the Group acquires a business, it assesses the financial assets and liabilities assumed for appropriate classification and designation in accordance with the contractual terms, economic circumstances and pertinent conditions as at the acquisition date. This includes the separation of embedded derivatives in host contracts by the acquiree.
If the business combination is achieved in stages, any previously held equity interest is re-measured at its acquisition date fair value and any resulting gain or loss is recognized in profit or loss.
Any contingent consideration to be transferred by the acquirer will be recognized at fair value at the acquisition date. Contingent consideration classified as an asset or liability that is a financial instrument and within the scope of IAS 39 Financial Instruments: Classification and Measurement, is measured at fair value, with changes in fair value recognized in either profit or loss or as a change to other comprehensive income. If the contingent consideration is not within the scope of IAS 39, it is measured in accordance with the appropriate IFRS. Contingent consideration that is classified as equity is not re-measured and subsequent settlement is accounted for within equity.
Goodwill is initially measured at cost, being the excess of the aggregate of the consideration transferred and the amount recognized for non-controlling interests, and any previous interests held, over the net identifiable assets acquired and liabilities assumed. If the fair value of the net assets acquired is in excess of the aggregate consideration transferred, the Group re-assesses whether it has correctly identified again all of the assets acquired and all of the liabilities assumed and reviews the procedures used to measure the amounts to be recognized at the acquisition date. If the re-assessment still results in an excess of the fair value of net assets acquired over the aggregate consideration transferred, then the gain is recognized in profit of loss.
After initial recognition, goodwill is measured at cost less any accumulated impairment losses. For the purpose of impairment testing, this difference is allocate to each of the Group’s cash-generating units that are expected to benefit from the combination, irrespective of whether other assets or liabilities, of the acquiree, are assigned to those units.
| F- 22 |
Notes to the consolidated financial statements (continued)
Where goodwill has been allocated to a cash-generating unit and part of the operation within that unit is disposed of, the goodwill associated with the disposed operation is included in the carrying amount of the operation when determining the gain or loss on disposal. Goodwill disposed of in these circumstances is measured based on the relative values of the disposed operation and the portion of the cash-generating unit retained.
| (f) | Investments in associates - |
An associate is an entity over which the Group has significant influence. Significant influence is the power to participate in the financial and operating policy decisions of the investee, but is not control over those policies. The Group's investments in associates are accounted for using the equity method. Under this method, the investment in an associate is initially recognized at cost.
The carrying amount of the investment is adjusted to recognize changes in the Group's share of net assets of the associate since the acquisition date. Goodwill relating to the associate is included in the carrying amount of the investment and is not tested for impairment individually.
The consolidated statement of profit or loss reflects the Group’s share of the results of operations of the associate.
Any change in other comprehensive income of those investees is presented as part of the Group’s other comprehensive income. In addition, when there has been a change recognized directly in the equity of the associate, the Group recognizes its share of any changes, when applicable, in the consolidated statements of changes in shareholders’ equity. Unrealized gains and losses resulting from transactions between the Group and the associate are eliminated to the extent of the interest in the associate.
The aggregate of the Group´s share of profit or loss of an associate is shown on the face of the consolidated statements of profit or loss outside operating profit and represents profit or loss after tax and non-controlling interests in the subsidiaries of the associates.
The financial statements of the associate are prepared for the same reporting period as the Group. When necessary, adjustments are made to bring the accounting policies in line with those of the Group.
After the application of the equity method, the Group determines whether it is necessary to recognize an impairment loss of its investment in associates. At each reporting date, the Group determines whether there is objective evidence that the investment in the associate is impaired. If there is such evidence, the Group calculates the amount of impairment as the difference between the recoverable amount of the associate and its carrying value, and then recognizes the loss in the consolidated statements of profit or loss.
| F- 23 |
Notes to the consolidated financial statements (continued)
Upon loss of significant influence over the associate, the Group measures and recognizes any retained investment at its fair value. Any difference between the carrying amount of the associate upon loss of significant influence and the fair value of the retained investment and proceeds from disposal is recognized in consolidated statements of profit or loss.
| (g) | Prepaid expenses - |
Non-monetary assets which represent an entity’s right to receive goods or services are presented as prepaid expenses. The asset is subsequently derecognized when the goods are received and the services are rendered.
| (h) | Property, plant and equipment - |
Property, plant and equipment is stated at cost, net of accumulated depreciation and accumulated impairment losses, if any.
The initial cost of an asset comprises its purchase price or construction cost, any costs directly attributable to bringing the asset into operation, the initial estimate of the obligation for mine closing and for qualifying assets, borrowing costs. The capitalized value of a finance lease is also included in this caption.
When significant parts of property, plant and equipment are required to be replaced at intervals, the Group depreciates them separately based on their specific useful lives. Also, when a major inspection is performed, its cost is recognized in the carrying amount of plant and equipment as a replacement if the recognition criteria are satisfied. All other maintenance and repair costs are recognized in the consolidated statement of profit or loss as incurred.
Depreciation -
Unit-of-production method:
In mining units with a long-term useful life, depreciation of assets directly related to the operation of the mine, is calculated using the units-of-production method, which is based on economically recoverable reserves of the mining unit. Other assets related to these mining units are depreciated using the straight-line method with the lives detailed in the next paragraph.
Straight-line method:
Depreciation of assets in mining units with short useful lives or used for administrative purposes, is calculated using the straight-line method of accounting. The useful lives are the following:
| Years | ||||
| Buildings, construction and other | Between 6 and 20 | |||
| Machinery and equipment | Between 5 and 10 | |||
| Transportation units | 5 | |||
| Furniture and fixtures | 10 | |||
| Computer equipment | 4 | |||
| F- 24 |
Notes to the consolidated financial statements (continued)
The residual values, useful lives and methods of depreciation of property, plant and equipment are reviewed at each financial year end, and adjusted prospectively, if appropriate.
Disposal of assets -
An item of property, plant and equipment and any significant part initially recognized is derecognized upon disposal or when no future economic benefits are expected from its use or disposal. Any gain or loss arising on derecognition of the asset (calculated as the difference between the net disposal proceeds and the carrying amount of the asset) is included in the consolidated statements of profit or loss when the asset is derecognized.
| (i) | Leases - |
The determination of whether an arrangement is, or contains, a lease is based on the substance of the arrangement at the inception of the lease. The arrangement is, or contains, a lease if fulfilment of the arrangement is dependent on the use of a specific asset or assets and the arrangement conveys a right to use the asset or assets, even if that right is not explicitly specified in an arrangement.
Group as a lessee -
A lease is classified at the inception date as a finance lease or an operating lease. A lease that transfers substantially all the risk and rewards incidental to ownership to the Group is classified as a finance lease. Finance leases are capitalized at the commencement of the lease at the fair value of the leased property or, if lower, at the present value of the minimum lease payments. Lease payments are apportioned between finance charges and reduction of the lease liability so as to achieve a constant rate of interest on the remaining balance of the liability. Finance charges are recognized in finance costs in the consolidated statements of profit or loss.
A leased asset is depreciated over the useful life of the asset. However, if there is no reasonable certainty that the Group will obtain ownership by the end of the lease term, the asset is depreciated over the shorter of the estimated useful life of the asset and the lease term.
Operating lease payments are recognized as operating expenses in the statements of profit or loss on a straight-line basis over the lease term.
Group as a lessor -
Leases in which the Group does not transfer substantially all the risk and rewards of ownership of an asset are classified as operating leases.
Initial direct cost incurred in negotiating and arranging an operating lease are added to the carrying amount of the leased asset and recognized over the lease term on the same basis as rental income. Contingent rents are recognized as revenue in the period in which they are earned.
| F- 25 |
Notes to the consolidated financial statements (continued)
| (j) | Mining concessions - |
Mining concessions represent ownership of the right of exploration and exploitation to the Group on mining properties contains ore reserves acquired. Mining concessions are stated at cost and are amortized on units of production method, using as the basis of proven and probable reserves. If the Group leaves these concessions, the costs associated are written off in the consolidated statements of profit or loss.
Cost includes the fair value attributable to mineral reserves and the portion of mineral resources considered to be probable of economic extraction at the time of an acquisition.
At end of each year, the Group evaluates if there is any indicator. If any impairment indicator exists, the Group estimates the asset’s recoverable amount.
Mining concessions are presented in the caption of mining concessions, development costs, property, plant and equipment, net.
| (k) | Exploration and mine development costs – |
Exploration expenditure -
Exploration costs are expensed as incurred. These costs primarily include materials and fuels used, surveying costs, drilling costs and payments made to the contractors.
Exploration and evaluation activity includes:
| - | Researching and analyzing historical exploration data. |
| - | Gathering exploration data through geophysical studies. |
| - | Exploratory drilling and sampling. |
| - | Determining and examining the volume and grade of the resource. |
| - | Surveying transportation and infrastructure requirements. |
| - | Conducting market and finance studies. |
Development costs -
When the Group’s Management approves the feasibility of the conceptual study of a project, the costs incurred to develop such property, including additional costs to delineate the ore body and remove impurities it contains, are capitalized as development costs under the caption mining concessions, development costs and property, plant and equipment, net. These costs are amortized when production begins, on the units-of-production basis over the proven and probable reserves.
The development costs include:
| - | Metallurgical and engineering studies. |
| - | Drilling and other costs necessary to delineate ore body. |
| - | Removal of the initial clearing related to an ore body. |
| F- 26 |
Notes to the consolidated financial statements (continued)
Development costs necessary to maintain production are expensed as incurred.
| (l) | Stripping (waste removal) costs - |
As part of its mining operations, the Group incurs waste removal costs (stripping costs) during the development and production phases of its mining operations. Stripping costs incurred in the development phase of a mine, before the production phase commences (development stripping), are capitalized as part of the cost of constructing the mine and subsequently amortized over its useful life using units of production method. The capitalization of development stripping costs ceases when the mine starts production.
Stripping costs incurred during the production phase (production stripping costs) are generally considered to create two benefits, being either the production of inventory or improved access to the ore to be mined in the future. Where the benefits are realized in the form of inventory produced in the period, the production stripping costs are accounted for as part of the cost of producing those inventories. Where the benefits are realized in the form of improved access to ore to be mined in the future, the costs are recognized as a non-current asset, referred to as a stripping activity asset, if the following criteria are met:
| - | Future economic benefits are probable. |
| - | The component of the ore body for which access will be improved can be accurately identified. |
| - | The costs associated with the improved access can be reliably measured. |
To identify components of deposit, the Group works closely with the operating personnel to analyze the mine plans. Mostly, an ore body can have several components. The mine plans, and therefore, the identification of components, will vary among mines for a number of reasons.
The stripping activity asset is initially measured at cost, which surges from an accumulation of costs directly incurred during the stripping activity. The production stripping cost related to access to new resources is presented within mining concessions, development costs, property, plant and equipment, net in the consolidated statements of financial position.
The production stripping cost is subsequently depreciated using the units of production method over the expected useful life of the component identified of the ore body that has been made more accessible by the activity. This cost is stated at cost less accumulated depreciation and accumulated impairment losses, if any.
| (m) | Investment properties - |
Investment properties are measured at cost, net of accumulated depreciation and impairment loss, if any.
Depreciation of the investment properties is determined using the straight-line method with useful life of 20 years.
| F- 27 |
Notes to the consolidated financial statements (continued)
Investment properties are derecognized either when they have been disposed of or when they are permanently withdrawn from use and no future economic benefit is expected from their disposal. The difference between the net disposal proceeds and the carrying amount of the asset is recognized in profit or loss in the period of derecognition.
Transfers are made to (or from) investment property only when there is a change in use.
For a transfer from investment property to an item of property, plant and equipment, the deemed cost for subsequent accounting is the fair value at the date of change in use. If an item of property, plant and equipment becomes an investment property, the Group accounts for such property in accordance with the policy stated under property, plant and equipment up to the date of change in use.
| (n) | Impairment of non-financial assets - |
The Group assesses, at each reporting date, whether there is an indication that an asset may be impaired. If any indication exists, or when annual impairment testing for an asset is required, the Group estimates the asset’s recoverable amount. An asset’s recoverable amount is the higher of an asset’s or cash-generating unit' (CGU) fair value less costs of disposal and its value in use. Recoverable amount is determined for an individual asset, unless the asset does not generate cash inflows that are largely independent of those from other assets or groups of assets. When the carrying amount of an asset or CGU exceeds its recoverable amount, the asset is considered impaired and is written down to its recoverable amount.
In assessing value in use, the estimated future cash flows are discounted to their present value using a pre-tax discount rate that reflects current market assessments of the time value of money and the risks specific to the asset. In determining fair value less cost of disposal, recent market transactions are taken into account. If no such transactions can be identified, an appropriate valuation model is used.
Impairment losses of continuing operations, including impairment of inventories, are recognized in the consolidated statements of profit or loss in expense categories consistent with the function of the impaired asset.
For assets in general, an assessment is made at each reporting date to determine whether there is an indication that previously recognized impairment losses may no longer exist or have decreased. If such indication exists, the Group estimates the asset’s or CGU’s recoverable amount. A previously recognized impairment loss is reversed only if there has been a change in the assumptions used to determine the asset or CGU’s recoverable amount since the last impairment loss was recognized. The reversal is limited so that the carrying amount of the asset does not exceed its recoverable amount, nor exceed the carrying amount that would have been determined, net of depreciation, had no impairment loss been recognized for the asset in prior years. Such reversal is recognized in the consolidated statements of profit or loss.
| F- 28 |
Notes to the consolidated financial statements (continued)
| (o) | Provisions - |
General -
Provisions are recognized when the Group has a present obligation (legal or constructive) as a result of a past event, it is probable that an outflow of resources embodying economic benefits will be required to settle the obligation and a reliable estimate can be made of the amount of the obligation. If the effect of the time value of money is material, provisions are discounted using a current pre-tax rate that reflects, when appropriate, the risks specific to the liability. When discounting is used, the increase in the provision due to the passage of time is recognized as a finance cost.
Provision for closure of mining units -
When the liability is initially recognized, the present value of the estimated costs is capitalized by increasing the carrying amount of the related mining assets (property, plant and equipment). Over time, the discounted liability is increased for the change in present value based on discounted rates that reflects current market assessments and the risks specify to the liability, in addition, the capitalized cost is depreciated and/or amortized based on the useful life of the asset. Any gain or loss resulting from the settlement of the obligation is recorded in the current results.
Changes in the estimated timing of rehabilitation or changes to the estimated future costs are dealt with prospectively by recognizing an adjustment to the rehabilitation liability and a corresponding adjustment to the related asset. Any reduction in the rehabilitation liability and, therefore, any deduction from the asset to which it relates, may not exceed the carrying amount of the asset. If it does, any excess over the carrying amount is taken immediately to the consolidated statements of profit or loss.
If the change in estimate results in an increase in the rehabilitation liability and, therefore, an addition to the carrying value of the asset, the Group considers whether this is an indication of impairment of the asset as a whole, and if so, tests for impairment, in accordance with IAS 36 "Impairment of Assets".
For closed mines, changes to estimated costs are recognized immediately in the consolidated statements of profit or loss.
| (p) | Treasury shares - |
Own equity instruments that are reacquired (treasury shares) are recognized at cost and deducted from equity. No gain or loss is recognized in profit or loss on the purchase, sale, issue or cancellation of the Group’s own equity instruments. Any difference between the carrying amount and the consideration, if reissued, is recognized as additional capital in equity. The voting rights related to treasury shares are cancelled for the Group and no dividends on such shares are allocated.
| F- 29 |
Notes to the consolidated financial statements (continued)
| (q) | Revenue recognition - |
Revenue is recognized to the extent that it is probable that the economic benefits will flow to the Group and the revenue can be reliably measured, regardless of when the payment is being made. Revenue is measured at the fair value of the consideration received or receivable, taking into account contractually defined terms of payment and excluding taxes or duty. The specific recognition criteria described below must also be met before revenue is recognized:
Sales of concentrates and metals -
Revenue from sale of concentrates and metals is recognized when the significant risks and rewards of ownership of the goods have passed to the buyer, usually on delivery of the goods.
Contract terms for the Company’s sale of metal in concentrate to customers allow for a price adjustment based on final assay results of the metal in concentrate by the customer to determine the final content. These are referred to as provisional pricing arrangements and are such that the selling price for metal in concentrate is based on prevailing spot prices on a specified future date after shipment to the customer (the quotation period). Adjustments to the sales price occurs based on movements in quoted market prices up to the date of final settlement. The period between provisional invoicing and final settlement can be between one and six months.
Sales contracts for metal in concentrate that have provisional pricing features are considered to contain an embedded derivative, which is required to be separated from the host contract for accounting purposes. The host contract is the sale of metals in concentrate, and the embedded derivative is the forward contract for which the provisional sale is subsequently adjusted with final liquidations. The embedded derivative is originated by the metals prices since the date of issuance of issuance of the provisional liquidation until the date of issuance of the final liquidation.
The embedded derivative, which does not qualify for hedge accounting, is initially recognized at fair value with subsequent changes in the fair value recognized in the consolidated statements of profit or loss until final settlement, and presented as part of net sales. Changes in fair value over the quotation period and up until final settlement are estimated by reference to forward market prices.
Interest income -
For all financial instruments measured at amortized cost, interest income is recorded using the effective interest rate (EIR). EIR is the rate that exactly discounts the estimated future cash payments or receipts over the expected life of the financial instrument or a shorter period, where appropriate, to the net carrying amount of the financial asset or liability. Interest income is included in finance income in the consolidated statements of profit or loss.
| F- 30 |
Notes to the consolidated financial statements (continued)
Royalty income -
The royalty income is recognized in accordance with the accrual method considering the substance of the relevant agreements.
Dividends -
Revenue is recognized when the Group's right to receive the payment is established, which is generally when shareholders approve the dividend.
Revenue from engineering and construction services -
Revenue is recognized based on the stage of completion of contracts for existing services. The stage of completion is measured by reference to services performed to date as a percentage of total services to be performed by each contract.
Rental income -
Rental income arising from operating leases on investment properties is accounted for on a straight-line basis over the lease term and is included in revenue in the consolidated statement of profit or loss due to its operating nature.
| (r) | Benefits to employees - |
Salaries and wages, bonuses, post-employment benefits and vacations are calculated in accordance with IAS 19, "Employee Benefits" and are calculated in accordance with current Peruvian legislation based on the accrual basis.
Workers’ profit sharing
The Group recognizes workers’ profit sharing in accordance with IAS 19, “Employees Benefits". Workers' profit sharing is calculated in accordance with the Peruvian law (Legislative Decree No. 892), and the applicable rate is 8% over the taxable net base of current year. According to Peruvian law, the limit in the workers' profit sharing that an employee can receive is equivalent to 18 months of wages, and any excess above such limit has be transferred to the Regional Government and “National Fund for Employment’s Promotion and Training” (“FONDOEMPLEO”).
| (s) | Borrowing costs - |
Costs directly attributable to the acquisition, construction or production of a qualifying asset are capitalized as finance part of the cost of an asset. A qualifying asset is one whose value is greater than US$5 million and requires a longer period to 12 months to get ready for its intended use. All other borrowing costs are expensed in the period in which they occur. Borrowing costs consist of interest and other costs that the Group incurs in connection with the borrowing of funds.
| F- 31 |
Notes to the consolidated financial statements (continued)
| (t) | Taxes - |
Current income tax -
Current income tax assets and liabilities are measured at the amount expected to be recovered from or paid or the tax authority. The tax rates and tax laws used to compute the amount are those that are enacted or substantively enacted, at the reporting period.
Current income tax relating to items recognized directly in equity is recognized in equity and not in the consolidated statements of profit or loss. Management periodically evaluates positions taken in the tax returns with respect to situations in which applicable tax regulations are subject to interpretation and establishes provisions where appropriate.
Deferred income tax -
Deferred income tax is provided using the liability method on temporary differences between the tax bases of assets and liabilities and their carrying amounts for financial reporting purposes at the reporting date.
Deferred income tax liabilities are recognized for all taxable temporary differences, except for taxable temporary differences associated with investments in associates, when the timing of the reversal of the temporary differences can be controlled and it is probable that the temporary differences will not reverse in the foreseeable future.
Deferred income tax assets are recognized for all deductible temporary differences, the carry forward of unused tax credits and any unused tax losses. Deferred tax assets are recognized to the extent that is probable that taxable profit will be available against which the deductible temporary differences, and the carry forward of unused tax credits and unused tax losses can be utilized.
The carrying amount of deferred tax assets is reviewed at each reporting date and reduced to the extent that it is no longer probable that sufficient taxable profit will be available to allow all or part of the deferred tax asset to be utilized. Unrecognized deferred tax assets are re-assessed at each reporting date and are recognized to the extent that it has become probable that future taxable profits will allow the deferred tax asset to be recovered.
Deferred tax assets and liabilities are measured at the tax rates that are expected to apply in the year when the asset is realized or the liability is settled, based on tax rates and tax laws that have been enacted or substantively enacted at the reporting date.
Deferred tax items are recognized in correlation to the underlying transaction either in profit or loss, other comprehensive income or directly in equity.
Deferred tax assets and deferred tax liabilities are offset if a legally enforceable right to compensate current tax assets against current income tax liabilities and the deferred taxes relate to the same taxable entity and the same taxation authority.
| F- 32 |
Notes to the consolidated financial statements (continued)
Peruvian mining royalties and special mining tax -
Mining royalties and special mining tax are accounted for in accordance with IAS 12 “Income Tax” because they have the characteristics of an income tax. This is considered to be the case when they are imposed under government authority and the amount payable is based on taxable income-rather than physical quantities produced or as a percentage of revenue-after adjustment for temporary differences. Legal rules and rates used to calculate the amounts payable are those in effect on the date of the consolidated statements of financial position.
Therefore, obligations arising from Mining Royalties and Special Mining Tax are recognized as income tax under the scope of IAS 12. Both, Mining Royalties and Special Mining Tax generated deferred assets and liabilities which must be measured using the average rates expected to apply to operating profit in the quarter in which the Group expects to reverse temporary differences.
Sales tax -
Expenses and assets are recognized net of the amount of sales tax, except:
| (i) | When the sales tax incurred on a purchase of assets or services is not recoverable from the taxation authority, in which case, the sales tax is recognized as part of the cost of acquisition of the asset or as part of the expense item, as applicable; |
| (ii) | When receivables and payables are stated with the amount of sales tax included. |
The net amount of sales tax recoverable from, or payable to, the taxation authority is included as part of receivables or payables in the consolidated statements of financial position.
| (u) | Fair value measurement |
The Group measures its financial instruments, such as, derivatives and embedded derivatives, at fair value at the date of the consolidated statements of financial position.
Fair value is the price that would be received to sell an asset or paid to transfer a liability in an orderly transaction between market participants at the measurement date. The fair value measurement is based on the presumption that the transaction to sell the asset or transfer the liability takes place either:
| - | In the principal market for the asset or liability, or |
| - | In the absence of a principal market, in the most advantageous market for the asset or liability. |
The Group uses valuation techniques that are appropriate in the circumstances and for which sufficient data are available to measure fair value, maximizing the use of relevant observable inputs and minimizing the use of unobservable inputs.
| F- 33 |
Notes to the consolidated financial statements (continued)
All assets and liabilities for which fair value is measured or disclosed in the consolidated financial statements are categorized within the fair value hierarchy, described, as follows, based on the lowest level input that is significant to the fair value measurement as a whole:
| - | Level 1 - Quoted (unadjusted) market prices in active markets for identical assets or liabilities. |
| - | Level 2 - Valuation techniques for which the lowest level input that is significant to the fair value measurement is directly or indirectly observable. |
| - | Level 3 - Valuation techniques for which the lowest level input that is significant to the fair value measurement is unobservable. |
For assets and liabilities that are recognized in the consolidated financial statements on a recurring basis, the Group determines whether transfers have occurred between levels in the hierarchy by reassessing categorization (based on the lowest-level input that is significant to the fair value measurement as a whole) at the end of each reporting period.
The Group's Management determines the policies and procedures for both recurring fair value measurement and non-recurring measurement. At each reporting date, the Group's Management analyzes the movements in the values of assets and liabilities which are required to be re-measured or re-assessed as per the Group’s accounting policies.
For the purpose of fair value disclosures, the Group has determined classes of assets and liabilities based on the nature, characteristics and risks of the asset or liability and the level of the fair value hierarchy as explained above.
| (v) | Derivative financial instruments and hedge accounting - |
Initial recognition and subsequent measurement -
The Group uses derivative instruments to hedge its commodity price risk (forward commodity contracts) and its foreign exchange risk (forward exchange rate contracts). Such derivative financial instruments are initially recognized at fair value on the date on which a derivative contract is entered into and are subsequently re-measured at fair value. Derivatives are carried as financial assets when the fair value is positive and as financial liabilities when the fair value is negative.
At the inception of the hedge relationship, the Group formally designates and documents the hedge relationship to which it wishes to apply hedge accounting and the risk management objective and strategy for undertaking the hedge.
The documentation includes identification of the hedging instrument, the hedge item or transaction, the nature of the risk being hedged and how the entity will assess the effectiveness of changes in the hedging instrument’s fair value in offsetting the exposure to changes in cash flows attributable to the hedged risk. Such hedges are expected to be highly effective in achieving offsetting changes in cash flows and are assessed on an ongoing basis to determine that they actually have been highly effective throughout the financial reporting periods for which they were designated.
| F- 34 |
Notes to the consolidated financial statements (continued)
The Group’s hedge is classified as cash flow hedge. The effective portion of gain or loss on the hedging instrument is initially recognized in the consolidated statements of Other Comprehensive Income, while the ineffective portion is recognized immediately in the consolidated statements of profit or loss in the finance costs caption.
| (w) | Discontinued operations - |
The Group classifies disposal groups as held for sale if their carrying amounts will be recovered principally through sale rather than through continuing use. Such disposal groups classified as held for sale are measured at the lower of their carrying amount and fair value less costs to sell.
The criteria for held for sale classification is regarded as met only when the sale is highly probable and the disposal group is available for immediate sale in its present condition. Actions required to complete the sale should indicate that it is unlikely that significant changes to the plan will be made or that the sale will be withdrawn. Management must be committed to the sale expected within one year from the date of the classification.
An extension of the period required to complete a sale does not preclude an asset (or disposal group) from being classified as held for sale if the delay is caused by events or circumstances beyond the entity’s control and there is sufficient evidence that the entity remains committed to its plan to sell the asset.
Property, plant and equipment are not depreciated or amortized once classified as held for sale.
Assets and liabilities classified as held for sale are presented separately as current items in the consolidated statement of financial position.
A disposal group qualifies as discontinued operation if it is a component of an entity that either has been disposed of, or is classified as held for sale, and:
| - | Represents a separate major line of business or geographical area of operations |
| - | It is part of a single coordinated plan to dispose of a separate major line of business or geographical area of operations, or |
| - | It is a subsidiary acquired exclusively with a view to re sale. |
Discontinued operations are excluded from the results of continuing operations and are presented as a single amount as profit or loss after tax from discontinued operations in the consolidated statement of profit or loss.
Additional disclosures are provided in note 1(e). All other notes to the consolidated financial statements include amounts for continuing operations, unless otherwise mentioned.
| F- 35 |
Notes to the consolidated financial statements (continued)
| 3. | Significant judgments, estimates and assumptions |
The preparation of the Group’s consolidated financial statements requires Management to make judgments, estimates and assumptions that affect the reported amounts of revenues, expenses, assets and liabilities, and the accompanying disclosures, and the disclosure of contingent liabilities. The estimates and assumptions are continuously evaluated and based on Management´s experience and other facts, including the expectations about future events which are reasonable under current situation. Uncertainty about these estimates and assumptions could result in outcomes that require material adjustment to the carrying amount of assets and liabilities affected in future periods. Further information on each of these areas and how they impact the various accounting policies are described below and also in the relevant notes to the consolidated financial statements.
| 3.1. | Judgments |
In the process of applying the Group’s accounting policies, Management has made the following judgments, which have the most significant effect on the amounts recognized in the consolidated financial statements:
| (a) | Contingencies - |
By their nature, contingencies will be resolved only when one or more uncertain future events occur or fail to occur. The assessment of the existence and potential quantum of contingencies inherently involves the exercise of significant judgment and the use of estimates regarding the outcome of future events.
| (b) | Development start date - |
The Group assesses the status of each exploration project of its mining units to determine when the development phase begins. One of the criteria used to evaluate the development start date is when the Group determines that the property can be economically developed.
| (c) | Production start date - |
The Group assesses the stage of each mine under development to determine when a mine moves into the production phase. The criteria used to assess the start date are determined based on the unique nature of each mining project, such as the complexity of the project and its location. The Group considers various relevant criteria to assess when the production phase is considered to have commenced. Some of the criteria used to identify the production start date include, but are not limited to:
| - | Level of capital expenditure incurred compared to the original construction cost estimates. |
| - | Completion of a reasonable period of testing of the mine plant and equipment. |
| - | Ability to produce metal in saleable form (within specifications). |
| - | Ability to sustain ongoing production of metal. |
When a mine development /construction project moves into the production phase, the capitalization of certain mine development costs ceases and costs are either regarded as forming part of the cost of inventory or expensed, except for costs that qualify for capitalization relating to mining asset additions or improvements. It is also at this point that depreciation or amortization commences.
| F- 36 |
Notes to the consolidated financial statements (continued)
| 3.2. | Estimates and assumptions |
The key assumptions concerning the future and other key sources of estimation uncertainty at the reporting date that have a significant risk of causing a material adjustment to the carrying amounts of assets and liabilities within the next financial year, are described below. The Group based its assumptions and estimates on parameters available when the consolidated financial statements were prepared. Existing circumstances and assumptions about future developments, however, may change due to market change or circumstances arising beyond the control of the Group. Such changes are reflected in the assumptions when they occur.
| (a) | Determination of mineral reserves and resources - |
The Group calculates its reserves using methods generally applied by mining and industry according to international guidelines. All estimated reserves represent estimated quantities of mineral proven and probable that under current conditions can be economically and legally processed.
The process of estimating quantities of reserves is complex and requires making subjective decisions when evaluating all geological, geophysical, engineering and economic information available choices. Reviews could occur on reserve estimates due to, among others, revisions to the data or geological assumptions, changes in prices, production costs and results of exploration activities. Changes in estimated reserves could mainly affect the carrying value of mining concessions, development costs and property, plant and equipment; the charges in result for depreciation and amortization; and the carrying amount of the provision for closure of mining units.
| (b) | Units of production depreciation - |
Estimated economically recoverable reserves are used in determining the depreciation and/or amortization of mine-specific assets.
This results in a depreciation/amortization charge proportional to the depletion of the anticipated remaining life-of-mine production. The life of each item, which is assessed at least annually, has regard to both its physical life limitations and present assessments of economically recoverable reserves of the mine property at which the asset is located. These calculations require the use of estimates and assumptions, including the amount of recoverable reserves. Changes in estimates are accounted for prospectively.
| (c) | Mine rehabilitation provision - |
The Group assesses its mine rehabilitation provision at each reporting date. The ultimate rehabilitation costs are uncertain, and cost estimates can vary in response to many factors, including estimates of the extent and costs of rehabilitation activities, technological changes, regulatory changes, cost increases as compared to the inflation rates, and changes in discount rates. These uncertainties may result in future actual expenditure differing from the amounts currently provided. The provision at reporting date represents Management’s best estimate of the present value of the future rehabilitation costs required.
| F- 37 |
Notes to the consolidated financial statements (continued)
| (d) | Inventories, net - |
Inventories are classified in short and long term in accordance with the time that Management estimates will start the production of the concentrate extracted from the mining unit.
Net realizable value tests are performed at each reporting date and represent the estimated future sales price of the product the entity expects to realize when the product is processed and sold, less estimated costs to complete production and bring the product to sale.
| (e) | Impairment of non-financial assets - |
The Group assesses each asset or cash generating unit in each reporting period to determine whether any indication of impairment exists. Where an indicator of impairment exists, a formal estimate of the recoverable amount is made, which is considered to be the higher of the fair value less costs of disposal and value in use. The assessments require the use of estimates and assumptions such as long-term commodity prices, discount rates, operating costs, among others. These estimates and assumptions are subject to risk and uncertainty.
The fair value of mining assets is generally calculated by the present value of future cash flows arising from the continued use of the asset, which include some estimates, such as the cost of future expansion plans, using assumptions that a third party might consider. The future cash flows are discounted to their present value using a discount rate that reflects current market assessment of the value of money over time, as well as specific risks of the asset or cash-generating unit under evaluation. The Group has determined the operations of each mining unit as a single cash generating unit.
| (f) | Taxes - |
Deferred tax assets are recognized for unused tax losses to the extent that it is probable that taxable profit will be available against which the losses can be utilized. Significant Management judgment is required to determine the amount of deferred tax assets that can be recognized, based upon the likely timing and the level of future taxable profits together with future tax planning strategies.
| (g) | Fair value of contingent consideration - |
The contingent consideration arising from a business combination is measured at fair value at the date of acquisition, as part of the business combination. If the contingent consideration is eligible to be recognized as a financial liability the fair value is subsequently re-measured at each date of the consolidated financial statements. Determining the fair value of the contingent consideration is based on a model of discounted future cash flows. The key assumptions take into account the likelihood of achieving each goal of financial performance as well as the discount factor.
| F- 38 |
Notes to the consolidated financial statements (continued)
| 4. | Standards issued but not effective |
The relevant standards and interpretations that are issued, but not yet effective, up to the date of issuance of the Group’s financial statements are disclosed below. The Group intends to adopt these standards, if applicable, when they become effective.
IFRS 9 Financial Instruments
In July 2014, the IASB issued the final version of IFRS 9 Financial Instruments which reflects all phases of the financial instruments project and replaces IAS 39 and all previous versions of IFRS 9. IFRS 9 brings together all three aspects of the accounting for financial instruments project: classification and measurement, impairment and hedge accounting. IFRS 9 is effective for annual periods beginning on or after January 1, 2018, with early application permitted. Except for hedge accounting, retrospective application is required, but the provision of comparative information is not compulsory. For hedge accounting, the requirements are generally applied prospectively, with some limited exceptions.
The Group is evaluating the impact of the adoption of this standard.
IFRS 15 Revenue from Contracts with Customers
IFRS 15 was issued in May 2014 and establishes a new five-step model that will apply to revenue arising from contracts with customers. Under IFRS 15, revenue is recognized at an amount that reflects the consideration to which an entity expects to be entitled in exchange for transferring goods or services to a customer. The new revenue standard is applicable to all entities and will supersede all current revenue recognition requirements under IFRS. Either a full retrospective application or a modified retrospective application is required for annual periods beginning on or after January 1, 2018. Early adoption is permitted.
The Company expects to adopt this new standard on the required date of its entry into force. For this purpose, the Management has prepared a detailed plan of adoption that contemplates diverse tasks (systems review, internal control and policies and procedures), deadlines and responsible, which will begin in May 2017 and will end during the fourth quarter of 2017.
More than 90 percent of the Company's revenues came from the sales of metals and polymetallic concentrates, all of which are formalized through contracts. Based on a preliminary analysis, the Company's Management does not expect to identify significant situations that may require a different accounting treatment under IFRS 15. To date, it is not possible to effect a quantitative disclosure as a result of the subsequent adoption of this standard.
If any material effect arise, the Company plans to use the modified retrospective method in the process of adopting IFRS 15, according to which the cumulative effect resulting from applying this new standard will be presented by adjusting the initial balance of retained earnings (January 1, 2018).
In addition, IFRS 15 establishes presentation and disclosure requirements that represent a significant change in current practice and significantly increases the volume of disclosures required in the Group's financial statements, many of which will be completely new.
| F- 39 |
Notes to the consolidated financial statements (continued)
IFRS 16 “Leases”
IFRS 16 sets out the principles for the recognition, measurement, presentation and disclosure of leases and requires lessees to account for all leases under a single on-balance sheet model similar to the accounting for finance leases under IAS 17. The standard includes two recognition exemptions for lessees: leases of ’low-value’ assets and short-term leases. It is effective for annual periods beginning on or after January 1, 2019, with early application permitted. The Group is currently evaluating the impact of the IFRS 16 in its consolidated financial statements and expects to adopt this new standard at the date required by the effective date.
IAS 7 Disclosure Initiative – Amendments to IAS 7
The amendments to IAS 7, Statement of Cash Flows, are part of the IASB’s Disclosure Initiative and require an entity to provide disclosures that enable users of financial statements to evaluate changes in liabilities arising from financing activities, including both changes arising from cash flows and non-cash changes. On initial application of the amendment, entities are not required to provide comparative information for preceding periods. These amendments are effective for annual periods beginning on or after 1 January 2017, with early application permitted. Application of the amendments will result in additional disclosures provided by the Group.
IAS 12 Recognition of Deferred Tax Assets for Unrealized Losses - Amendments to IAS 12
The amendments clarify that an entity needs to consider whether tax law restricts the sources of taxable profits against which it may make deductions on the reversal of that deductible temporary difference. Furthermore, the amendments provide guidance on how an entity should determine future taxable profits and explain the circumstances in which taxable profit may include the recovery of some assets for more than their carrying amount.
Entities are required to apply the amendments retrospectively. However, on initial application of the amendments, the change in the opening equity of the earliest comparative period may be recognized in the opening retained earnings (or in another component of equity, as appropriate), without allocating the change between opening retained earnings and other components of equity. Entities applying this relief must disclose that fact.
These amendments are effective for annual periods beginning on or after 1 January 2017 with early application permitted. If an entity applies the amendments for an earlier period, it must disclose that fact. These amendments are not expected to have any impact on the Group.
| 5. | Business combination |
Acquisition of controlling interest in Canteras del Hallazgo S.A.C. -
On August 18, 2014, Buenaventura acquired from Minera Gold Fields Peru S.A. (“Gold Fields”) 51 percent of the voting shares of Canteras del Hallazgo S.A.C., which represent the whole interest of Gold Fields in the equity of such entity.
Canteras del Hallazgo is a privately-held entity incorporated in 2009 and owner of the Chucapaca project, which is located in the Ichuña district, in the General Sanchez Cerro province, in the Moquegua department, Peru. According to previously performed studies, there is evidence of the existence of gold, silver, copper and antimony in the area, specifically in the Canahuire deposit.
| F- 40 |
Notes to the consolidated financial statements (continued)
The purchase consideration amounted to:
| US$(000) | ||||
| Cash paid | 81,000 | |||
| Contingent consideration liability | 23,026 | |||
| As of December 31, 2014 | 104,026 | |||
Moreover, the Group recognized a gain of US$59,852,000 in the 2014 consolidated statement of profit or loss as a result of re-measuring the previously held equity interest (US$40,094,000) at its acquisition date fair value (US$99,946,000) in accordance with IFRS 3.
Assets acquired and liabilities assumed -
The fair values of the identifiable assets and liabilities assumed of Canteras del Hallazgo S.A.C. as at the date of acquisition were:
| US$(000) | ||||
| Assets | ||||
| Cash and cash equivalents | 684 | |||
| Income tax credit | 29 | |||
| Value added tax credit | 10,599 | |||
| Mining concessions, property, plant and equipment, net | 202,658 | |||
| 213,970 | ||||
| Liabilities | ||||
| Deferred income tax liabilities, net | 9,235 | |||
| Trade and other payables and provisions | 724 | |||
| 9,959 | ||||
| Total identifiable net assets at fair value | 204,011 | |||
Contingent consideration -
The purchase and sale agreement considered a contingent consideration of US$23,026,000, which corresponds to the present value of the future royalty payments equivalent to 1.5 percent over the future sales of the minerals arising from the mining properties acquired. The fair value has been determined using the income approach.
Significant increase (decrease) in the future sales of mineral would result in higher (lower) fair value of the contingent consideration liability, while significant increase (decrease) in the discount rate would result in lower (higher) fair value of the liability. Changes in the fair value of this contingent consideration have been recognized through profit or loss in the consolidated statement of profit or loss.
As of December 31, 2016, it is highly probable that the Group reaches the projected future sales. The fair value of the contingent consideration determined as of December 31, 2016 reflects this assumption and changes in metal prices.
| F- 41 |
Notes to the consolidated financial statements (continued)
A reconciliation of fair value measurement of the contingent consideration liability is provided below:
| US$(000) | ||||
| As of January 1, 2015 | 23,026 | |||
| Unrealized fair value changes recognized in profit or loss, note 27 | (6,032 | ) | ||
| As of December 31, 2015 | 16,994 | |||
| Unrealized fair value changes recognized in profit or loss, note 27 | 2,349 | |||
| As of December 31, 2016 | 19,343 | |||
Significant unobservable valuation inputs are provided below:
| 2016 | 2015 | |||||||
| Annual average of future sales of mineral (US$000) | 233,278 | 208,574 | ||||||
| Useful life of mining properties | 13 | 12 | ||||||
| Discount rate (%) | 10 | 10 | ||||||
The Group has the preferential right of acquisition of the royalty in case Gold Fields decides to sell it.
Merger -
On September 22, 2014, the General Shareholders’ meeting of the Group approved the merger of the Company (absorbing entity) and its subsidiary Canteras del Hallazgo S.A.C. (absorbed entity) effective December 3, 2014.
The statement of profit or loss of Canteras del Hallazgo S.A.C. for the eleven-month period ended December 3, 2014 was as follows:
| US$(000) | ||||
| Administrative expenses | (2,344 | ) | ||
| Net loss from currency exchange difference | (2,319 | ) | ||
| Net loss | (4,663 | ) | ||
| 6. | Transactions in Soles |
Transactions in Soles are completed using exchange rates published by the Superintendent of Banks, Insurance and AFP. As of December 31, 2016, the exchange rates for U.S. dollars published by this Institution were US$0.2983 for buying and US$0.2976 for selling (US$0.2934 for buying and US$0.2930 for selling as of December 31, 2015), and have been applied by the Group for the assets and liabilities accounts, respectively.
| F- 42 |
Notes to the consolidated financial statements (continued)
As of December 31, 2016 and 2015, the Group had the following assets and liabilities denominated in Soles:
| 2016 | 2015 | |||||||
| S/(000) | S/(000) | |||||||
| Asset | ||||||||
| Cash and cash equivalents | 21,212 | 53,218 | ||||||
| Trade and other receivables | 498,839 | 474,442 | ||||||
| Income tax credit | 83,623 | 155,014 | ||||||
| Prepaid expenses | 309 | 36,984 | ||||||
| 603,983 | 719,658 | |||||||
| Liabilities | ||||||||
| Trade and other payables | (438,087 | ) | (414,385 | ) | ||||
| Income tax payable | (24,329 | ) | - | |||||
| Provisions | (37,528 | ) | (71,264 | ) | ||||
| Bank loans | - | (769,360 | ) | |||||
| (499,944 | ) | (1,255,009 | ) | |||||
| Net asset (liability) position | 104,039 | (535,351 | ) | |||||
| 7. | Cash and cash equivalents |
| (a) | This caption is made up as follows: |
| 2016 | 2015 | |||||||
| US$(000) | US$(000) | |||||||
| Cash | 290 | 417 | ||||||
| Bank accounts (b) | 48,754 | 38,102 | ||||||
| Time deposits (c) | 31,500 | 40,000 | ||||||
| 80,544 | 78,519 | |||||||
| (b) | Bank accounts earn interest at floating rates based on market rates. |
| (c) | As of December 31, 2016 and 2015, time deposits were kept in prime financial institutions, which generated interest at annual market rates and had original maturities of less than 90 days, according to the immediate cash needs of the Group. |
| F- 43 |
Notes to the consolidated financial statements (continued)
| 8. | Trade and other receivables, net |
| (a) | This caption is made up as follows: |
| 2016 | 2015 | |||||||
| US$(000) | US$(000) | |||||||
| Trade receivables, net (b) | ||||||||
| Domestic clients | 89,811 | 76,078 | ||||||
| Foreign clients | 77,254 | 45,162 | ||||||
| Related entities, note 30(b) | 7,760 | 9,426 | ||||||
| 174,825 | 130,666 | |||||||
| Allowance for doubtful accounts (f) | (22,644 | ) | (21,741 | ) | ||||
| 152,181 | 108,925 | |||||||
| Other receivables | ||||||||
| Related entities, note 30(b) | 126,669 | 125,487 | ||||||
| Value added tax credit | 96,204 | 73,145 | ||||||
| Claims to third parties | 26,705 | 15,649 | ||||||
| Refund application of value added tax (c) | 17,037 | 40,421 | ||||||
| Tax deposits (d) | 13,479 | 12,055 | ||||||
| Restricted bank accounts (e) | 2,087 | - | ||||||
| Other minors | 9,738 | 11,526 | ||||||
| 291,919 | 278,283 | |||||||
| Allowance for doubtful accounts (f) | (8,963 | ) | (4,779 | ) | ||||
| Total trade and other receivables, net | 435,137 | 382,429 | ||||||
| Classification by maturity: | ||||||||
| Current portion | 269,089 | 219,862 | ||||||
| Non-current portion | 166,048 | 162,567 | ||||||
| Total trade and other receivables, net | 435,137 | 382,429 | ||||||
| Classification by nature: | ||||||||
| Financial receivables | 319,454 | 268,863 | ||||||
| Non-financial receivables | 115,683 | 113,566 | ||||||
| Total trade and other receivables, net | 435,137 | 382,429 | ||||||
| (b) | Trade accounts receivable are denominated in U.S. dollars, are neither due nor impaired, do not yield interest and have no specific guarantees. |
| (c) | This item mainly corresponds to value added tax pending to be refunded as of December 31, 2016. In November 2013, Buenaventura filed claims procedures by S/19,500,000 (equivalent to US$5,817,000), in connection with undue offsets made by the Tax Authorities against tax debts of prior years. As of December 31, 2016, the resolution of the appeal process related to the S/19,500,000 claim is pending for Buenaventura. |
| F- 44 |
Notes to the consolidated financial statements (continued)
| In the opinion of the Management and Group’s legal advisors, the tax offset made by the Tax Authorities have no legal support, so there are enough arguments to obtain a favorable outcome in the claim process initiated by Buenaventura. |
| (d) | Corresponds to deposits held in the Peruvian State bank which only can be used to offset tax obligations that companies have with the Tax Authorities. |
| (e) | These balances correspond to restricted bank accounts for payment of financial obligations held by the subsidiary Empresa de Generación Huanza S.A. (hereafter “Huanza”), according to the finance lease signed with Banco de Crédito del Perú in 2009. |
| (f) | During the year 2016, the Group recorded US$4.9 million for provision of the doubtful accounts. In the opinion of the Group’s Management, the balance of the provision for doubtful accounts is sufficient to cover adequately the risks of failure to date of the consolidated statement of financial position. |
| 9. | Inventory, net |
| (a) | This caption is made up as follows: |
| 2016 | 2015 | |||||||
| US$(000) | US$(000) | |||||||
| Finished goods | 12,763 | 12,787 | ||||||
| Products in process | 66,651 | 87,275 | ||||||
| Spare parts and supplies | 63,946 | 47,912 | ||||||
| 143,360 | 147,974 | |||||||
| Provision for impairment of value of inventory (b) | (8,386 | ) | (20,472 | ) | ||||
| 134,974 | 127,502 | |||||||
| Classification by use: | ||||||||
| Current portion | 120,947 | 101,473 | ||||||
| Non-current portion | 14,027 | 26,029 | ||||||
| 134,974 | 127,502 | |||||||
| F- 45 |
Notes to the consolidated financial statements (continued)
Products in process include mineral deposits located in the Tajo Norte mining unit (El Brocal). The detail of this mineral as of December 31, 2016 and 2015 is presented below:
| 2016 | 2015 | |||||||||||||||
| US$(000) | DMT | US$(000) | DMT | |||||||||||||
| Type III (lead/zinc) | 18,041 | 1,159,956 | 31,004 | 1,848,414 | ||||||||||||
| Mining Minerals | 203 | 24,629 | - | - | ||||||||||||
| Type I and II (copper) | - | - | 73 | 6,923 | ||||||||||||
| 18,244 | 1,184,585 | 31,077 | 1,855,337 | |||||||||||||
| Provision for impairment of value in mineral classified in process | (123 | ) | - | (2,563 | ) | - | ||||||||||
| 18,121 | 1,184,585 | 28,514 | 1,855,337 | |||||||||||||
| Classification by use: | ||||||||||||||||
| Current portion | 5,586 | 2,485 | ||||||||||||||
| Non-current portion | 12,535 | 26,029 | ||||||||||||||
| 18,121 | 28,514 | |||||||||||||||
As part of the preparation of the mining unit to extract and process ore at a volume of 18,000 DMT/ day, Management of El Brocal decided to accumulate mineral with metal content in the proximity of the Tajo Norte mine, which has been treated since the first quarter of 2015.
| (b) | The provision for impairment of value of inventory had the following movement during the years 2016, 2015 and 2014: |
| 2016 | 2015 | 2014 | ||||||||||
| US$(000) | US$(000) | US$(000) | ||||||||||
| Beginning balance | 20,472 | 7,735 | 6,647 | |||||||||
| Transfer from available for sale units | 1,448 | - | - | |||||||||
|
Changes in provision for impairment of finished goods,
note 22(a) |
(7,581 | ) | 13,096 | 3,262 | ||||||||
| Changes in provision for impairment of finished goods (discontinued operations), note 1(e) | (706 | ) | (1,474 | ) | 1,522 | |||||||
| Changes in provision for impairment of spare parts and supplies | (110 | ) | 1,115 | (3,696 | ) | |||||||
| Reversal in provision for impairment of inventories | (5,137 | ) | - | - | ||||||||
| Final balance | 8,386 | 20,472 | 7,735 | |||||||||
In the opinion of Group’s Management, the provision for impairment of value of inventory adequately covers this risk as of the date of the consolidated statements of financial position.
| F- 46 |
Notes to the consolidated financial statements (continued)
| 10. | Prepaid expenses |
| (a) | This caption is made up as follows: |
| 2016 | 2015 | |||||||
| US$(000) | US$(000) | |||||||
| Prepaid rentals (b) | 29,879 | 29,235 | ||||||
| Prepaid insurances | 6,055 | 3,471 | ||||||
| Deferred royalties and rentals of mining concessions | 2,377 | 463 | ||||||
| Deferred costs of works for taxes | 1,801 | 1,801 | ||||||
| Other prepaid expenses | 1,711 | 2,496 | ||||||
| 41,823 | 37,466 | |||||||
| Classification by maturity: | ||||||||
| Current portion | 11,392 | 8,231 | ||||||
| Non-current portion | 30,431 | 29,235 | ||||||
| 41,823 | 37,466 | |||||||
| (b) | This item corresponds to the balance of an original prepayment of US$31 million for the lease of hydraulic installations by the subsidiary Empresa de Generacion Huanza S.A. This prepayment is being charged to results during the life of the underlying assets (35 years). |
| 11. | Investments in associates |
| (a) | This caption is made up as follows: |
| Share in equity | ||||||||||||
| 2016 - 2015 | 2016 | 2015 | ||||||||||
| % | US$(000) | US$(000) | ||||||||||
| Sociedad Minera Cerro Verde S.A.A. | 19.584 | 1,055,488 | 988,725 | |||||||||
| Minera Yanacocha S.R.L. | 43.65 | 402,866 | 989,130 | |||||||||
| Compañía Minera Coimolache S.A. | 40.095 | 74,734 | 62,609 | |||||||||
| Other minor investments | 3,519 | 3,519 | ||||||||||
| 1,536,607 | 2,043,983 | |||||||||||
| (b) | The table below presents the net share in profit (loss) of associates: |
| 2016 | 2015 | 2014 | ||||||||||
| US$(000) | US$(000) | US$(000) | ||||||||||
| Sociedad Minera Cerro Verde S.A.A. | 66,763 | 6,518 | 77,891 | |||||||||
| Compañía Minera Coimolache S.A. | 23,514 | 16,617 | 22,256 | |||||||||
| Minera Yanacocha S.R.L. | (455,598 | ) | (196,510 | ) | (174,747 | ) | ||||||
| (365,321 | ) | (173,375 | ) | (74,600 | ) | |||||||
| F- 47 |
Notes to the consolidated financial statements (continued)
Investments held by the Group in its associates Minera Yanacocha S.R.L. (through its subsidiary Compañía Minera Condesa S.A.) and Sociedad Minera Cerro Verde S.A.A., represent the most significant investments of the Group. Its operations are strategic to the Group's activities and participation in their results has been important in relation to profits (losses) of the Group in the years 2016, 2015 and 2014. The following relevant information on these investments is as follows:
Investment in Minera Yanacocha S.R.L.-
The Company, through its subsidiary Compañía Minera Condesa S.A., has an interest of 43.65 percent of Minera Yanacocha S.R.L. (hereinafter “Yanacocha”). Yanacocha is engaged in gold production and exploration and development of gold and copper in their own concessions or owned by S.R.M.L. Chaupiloma Dos de Cajamarca (subsidiary of the Group), with which signed a contract of use of mineral rights.
During the last several years, Yanacocha has been developing the Conga project, which consists in two deposits of gold and porphyry of copper located at northeast of the Yanacocha operating area in the provinces of Celendín, Cajamarca and Hualgayoc (Peru).
Because of local communities and political protests for potential water impacts of the project development activities and construction the projects are suspended since November 2011. To date, Yanacocha’s management has been making only water support activities recommended by independent experts, mainly the construction of water reservoirs, before carrying out any development project.
The table below presents key financial data from the financial statements of Yanacocha under IFRS:
| 2016 | 2015 | |||||||
| US$(000) | US$(000) | |||||||
| Statements of financial position as of December 31: | ||||||||
| Current assets | 1,107,893 | 1,345,682 | ||||||
| Non-current assets | 937,992 | 1,619,748 | ||||||
| Current liabilities | (135,136 | ) | (132,557 | ) | ||||
| Non-current liabilities | (1,025,025 | ) | (604,048 | ) | ||||
| Shareholders’ equity, reported | 885,724 | 2,228,825 | ||||||
| Groups’ interest (43.65%) | 386,618 | 972,882 | ||||||
| Goodwill | 16,248 | 16,248 | ||||||
| 402,866 | 989,130 | |||||||
| F- 48 |
Notes to the consolidated financial statements (continued)
| 2016 | 2015 | 2014 | ||||||||||
| US$(000) | US$(000) | US$(000) | ||||||||||
| Statements of profit or loss as of December 31, | ||||||||||||
| Net sales | 761,193 | 1,031,174 | 1,165,299 | |||||||||
| Other operating income | 17,713 | 10,625 | 30,300 | |||||||||
| Costs of sales | (776,394 | ) | (751,736 | ) | (920,300 | ) | ||||||
| Cost of other operating income | (2,951 | ) | (2,524 | ) | (22,422 | ) | ||||||
| Operating expenses | (71,496 | ) | (82,846 | ) | (77,781 | ) | ||||||
| Administrative expenses | (8,780 | ) | (26,325 | ) | (38,262 | ) | ||||||
| Selling expenses | (3,695 | ) | (3,534 | ) | (4,458 | ) | ||||||
| Impairment loss of long-lived assets | (889,499 | ) | - | (541,141 | ) | |||||||
| Finance income (costs) | (12,975 | ) | (22,061 | ) | (23,206 | ) | ||||||
| Gain (loss) from currency exchange difference | (13,741 | ) | (251 | ) | 1,142 | |||||||
| Income (loss) before income tax | (1,000,625 | ) | 152,522 | (430,829 | ) | |||||||
| Income tax | (43,127 | ) | (602,717 | ) | 30,491 | |||||||
| Net loss reported | (1,043,752 | ) | (450,195 | ) | (400,338 | ) | ||||||
| Group’s interest (43.65%) | (455,598 | ) | (196,510 | ) | (174,748 | ) | ||||||
During the year 2016, Yanacocha identified impairment indicators as a result of the increase in the asset retirement obligations of US$352 million as a result of the update of its related obligation. Due to this, Yanacocha evaluated the recoverability of long lived assets and determine an impairment loss, net of taxes, of US$889.5 million, which reduced Yanacocha´s net equity and therefore, the equity participation of the Group in this associate in 2016. During 2015, there was no impairment losses, but in 2014 Yanacocha recorded impairment charges of its long-lived assets, net of tax, of US$378.8 million.
In December 2015, Yanacocha recorded charges for deferred income tax recoverability by US$510 million since Management considers that is not probable that taxable profit will be available to compensate against the deductible temporary differences.
During 2016, Yanacocha agreed unanimously the distribution to the partners, in proportion to its social share, of US$300 million, which correspond to the portion of the retained earnings as of December 31, 2014, originated in 2011.
Investment in Sociedad Minera Cerro Verde S.A.A. (Cerro Verde) -
Cerro Verde is engaged in the extraction, production and marketing of cathodes and copper concentrate from its mining unit that is located in Uchumayo, Arequipa, Peru.
| F- 49 |
Notes to the consolidated financial statements (continued)
The table below presents the key financial data from the financial statements of Cerro Verde under IFRS:
| 2016 | 2015 | |||||||
| US$(000) | US$(000) | |||||||
| Statements of financial position as of December 31: | ||||||||
| Current assets | 1,218,508 | 1,056,525 | ||||||
| Non-current assets | 6,417,115 | 6,796,167 | ||||||
| Current liabilities | (293,631 | ) | (548,517 | ) | ||||
| Non-current liabilities | (2,502,711 | ) | (2,805,801 | ) | ||||
| Shareholders’ equity, reported | 4,839,281 | 4,498,374 | ||||||
| Group’s interest (19.584%) | 947,725 | 880,962 | ||||||
| Goodwill | 107,763 | 107,763 | ||||||
| 1,055,488 | 988,725 | |||||||
| 2016 | 2015 | 2014 | ||||||||||
| US$(000) | US$(000) | US$(000) | ||||||||||
| Statements of profit or loss for the years ended December 31: | ||||||||||||
| Revenue | 2,384,154 | 1,115,617 | 1,467,097 | |||||||||
| Cost of sales | (1,553,040 | ) | (862,004 | ) | (797,481 | ) | ||||||
| Sales expenses | (131,391 | ) | (56,215 | ) | (54,210 | ) | ||||||
| Other operating income (expenses) | (24,107 | ) | (26,600 | ) | (3,629 | ) | ||||||
| Finance costs | (80,438 | ) | (16,010 | ) | (369 | ) | ||||||
| Finance income | 954 | 512 | 2,443 | |||||||||
| Net gain (loss) of exchange difference | 7,857 | (75,770 | ) | 2,284 | ||||||||
| Profit before income taxes | 603,989 | 79,530 | 616,135 | |||||||||
| Income tax | (263,082 | ) | (46,246 | ) | (238,529 | ) | ||||||
| Net profit, reported | 340,907 | 33,284 | 377,606 | |||||||||
| Adjustments to conform to the accounting policies of the Group | - | - | 20,124 | |||||||||
| Net profit, adjusted | 340,907 | 33,284 | 397,730 | |||||||||
| Group’s interest (19.584%) | 66,763 | 6,518 | 77,891 | |||||||||
Market capitalization:
As of December 31, 2016 and 2015, total market capitalization of shares maintained by the Group in Cerro Verde was US$1,311.3 million and US$994.0 million, respectively (market capitalization value by each share of US$19.11 and US$14.50, respectively).
| F- 50 |
Notes to the consolidated financial statements (continued)
Investment in Compañía Minera Coimolache S.A. (Coimolache) -
Coimolache is involved in the production and the sales of gold and silver from its open-pit mining unit located in Cajamarca, Peru.
The table below presents the key financial data from the financial statements of Coimolache under IFRS:
| 2016 | 2015 | |||||||
| US$(000) | US$(000) | |||||||
| Statements of financial position as of December 31: | ||||||||
| Current assets | 73,480 | 62,727 | ||||||
| Non-current assets | 261,075 | 185,665 | ||||||
| Current liabilities | (28,532 | ) | (26,775 | ) | ||||
| Non-current liabilities | (102,519 | ) | (46,562 | ) | ||||
| Shareholders’ equity, reported | 203,504 | 175,055 | ||||||
| Adjustments to conform to the accounting policies of the Group | (17,111 | ) | (18,900 | ) | ||||
| Shareholders’ equity, adjusted | 186,393 | 156,155 | ||||||
| Group’s interest (40.095%) | 74,734 | 62,610 | ||||||
| 2016 | 2015 | 2014 | ||||||||||
| US$(000) | US$(000) | US$(000) | ||||||||||
| Statements of profit or loss for the years ended December 31: | ||||||||||||
| Revenue | 198,873 | 177,347 | 192,369 | |||||||||
| Cost of sales | (107,913 | ) | (104,549 | ) | (100,649 | ) | ||||||
| Administrative expenses | (4,144 | ) | (2,185 | ) | (2,073 | ) | ||||||
| Sales expenses | (1,128 | ) | (1,111 | ) | (1,077 | ) | ||||||
| Other operating income (expenses) | 755 | 765 | 929 | |||||||||
| Finance income | 38 | 23 | 47 | |||||||||
| Finance costs | (1,614 | ) | (723 | ) | (583 | ) | ||||||
| Exchange difference | (117 | ) | (1,300 | ) | (1,465 | ) | ||||||
| Profit before income taxes | 84,750 | 68,267 | 87,498 | |||||||||
| Income tax | (27,894 | ) | (29,861 | ) | (36,090 | ) | ||||||
| Net profit, reported | 56,856 | 38,406 | 51,408 | |||||||||
| Adjustments to conform to the accounting policies of the Group | 1,790 | 3,039 | 4,099 | |||||||||
| Net profit, adjusted | 58,646 | 41,445 | 55,507 | |||||||||
| Group’s interest (40.095%) | 23,514 | 16,617 | 22,256 | |||||||||
| F- 51 |
Notes to the consolidated financial statements (continued)
| 12. | Mining concessions, development costs, property, plant and equipment, net |
| (a) | Below is presented the movement in cost: |
|
Balance as of
January 1, 2015 |
Additions | Disposals | Sales | Transfers |
Balance as of
December 31, 2015 |
Additions | Disposals | Sales |
Reclassifications
of assets available for sale |
Reclassifications
and transfers |
Balance as of
December 31, 2016 |
|||||||||||||||||||||||||||||||||||||
| US$(000) | US$(000) | US$(000) | US$(000) | US$(000) | US$(000) | US$(000) | US$(000) | US$(000) | US$(000) | US$(000) | US$(000) | |||||||||||||||||||||||||||||||||||||
| Cost | ||||||||||||||||||||||||||||||||||||||||||||||||
| Lands | 22,001 | 2,293 | (1,892 | ) | - | 52 | 22,454 | 162 | - | (6 | ) | 78 | 270 | 22,958 | ||||||||||||||||||||||||||||||||||
| Mining concessions | 198,009 | - | - | - | - | 198,009 | - | - | - | - | - | 198,009 | ||||||||||||||||||||||||||||||||||||
| Development costs | 531,457 | 62,765 | - | - | (52,459 | ) | 541,763 | 82,865 | - | - | 31,192 | (3,428 | ) | 652,392 | ||||||||||||||||||||||||||||||||||
| Buildings, constructions and other | 998,191 | 1,715 | (1,690 | ) | (168 | ) | 20,908 | 1,018,956 | 581 | - | (20 | ) | 10,458 | 79,192 | 1,109,167 | |||||||||||||||||||||||||||||||||
| Machinery and equipment | 750,083 | 29,550 | (887 | ) | (3,799 | ) | 52,278 | 827,225 | 46,152 | (6,569 | ) | (2,844 | ) | 9,425 | 112,643 | 986,032 | ||||||||||||||||||||||||||||||||
| Transportation units | 10,950 | 491 | (245 | ) | (990 | ) | 443 | 10,649 | 174 | (341 | ) | (396 | ) | 357 | (27 | ) | 10,416 | |||||||||||||||||||||||||||||||
| Furniture and fixtures | 13,025 | 137 | (25 | ) | (84 | ) | 376 | 13,429 | 89 | (61 | ) | (88 | ) | 359 | 319 | 14,047 | ||||||||||||||||||||||||||||||||
| Units in transit | 11,836 | 15,212 | (113 | ) | - | (644 | ) | 26,291 | 15,797 | - | - | - | (12,037 | ) | 30,051 | |||||||||||||||||||||||||||||||||
| Work in progress | 57,920 | 81,333 | - | - | (71,130 | ) | 68,123 | 210,915 | (352 | ) | - | 1,037 | (173,935 | ) | 105,788 | |||||||||||||||||||||||||||||||||
| Stripping activity asset | 85,721 | 17,790 | - | - | 3,327 | 106,838 | 17,631 | - | - | - | (2 | ) | 124,467 | |||||||||||||||||||||||||||||||||||
| Mine closure costs | 64,086 | 76,799 | (2,414 | ) | - | 49,132 | 187,603 | 34,532 | - | - | 25,754 | - | 247,889 | |||||||||||||||||||||||||||||||||||
| 2,743,279 | 288,085 | (7,266 | ) | (5,041 | ) | 2,283 | 3,021,340 | 408,898 | (7,323 | ) | (3,354 | ) | 78,660 | 2,995 | 3,501,216 | |||||||||||||||||||||||||||||||||
| Accumulated depreciation and amortization: | ||||||||||||||||||||||||||||||||||||||||||||||||
| Mining lands | - | - | - | - | - | - | - | - | - | - | - | - | ||||||||||||||||||||||||||||||||||||
| Mining concessions | 77,396 | 54 | - | - | - | 77,450 | 16 | - | - | - | - | 77,466 | ||||||||||||||||||||||||||||||||||||
| Development costs | 184,278 | 49,771 | - | - | (34,838 | ) | 199,211 | 18,225 | - | - | 25,596 | (1,396 | ) | 241,636 | ||||||||||||||||||||||||||||||||||
| Buildings, construction and other | 314,045 | 69,353 | (1,915 | ) | (81 | ) | 39 | 381,441 | 65,050 | - | (9 | ) | 8,598 | 598 | 455,678 | |||||||||||||||||||||||||||||||||
| Machinery and equipment | 399,761 | 77,546 | (277 | ) | (1,941 | ) | 852 | 475,941 | 81,753 | (5,378 | ) | (827 | ) | 6,640 | (68 | ) | 558,061 | |||||||||||||||||||||||||||||||
| Transportation units | 7,276 | 1,385 | (221 | ) | (916 | ) | 408 | 7,932 | 1,103 | (250 | ) | (365 | ) | 358 | 14 | 8,792 | ||||||||||||||||||||||||||||||||
| Furniture and fixtures | 6,321 | 1,252 | (87 | ) | (66 | ) | 157 | 7,577 | 1,156 | (60 | ) | (22 | ) | 319 | 202 | 9,172 | ||||||||||||||||||||||||||||||||
| Stripping activity asset | 6,482 | 6,434 | - | - | - | 12,916 | 5,813 | - | - | - | - | 18,729 | ||||||||||||||||||||||||||||||||||||
| Mine closure costs | 32,268 | 33,381 | (491 | ) | - | 34,835 | 99,993 | 22,417 | - | - | 19,335 | (470 | ) | 141,275 | ||||||||||||||||||||||||||||||||||
| 1,027,827 | 239,176 | (2,991 | ) | (3,004 | ) | 1,453 | 1,262,461 | 195,533 | (5,688 | ) | (1,223 | ) | 60,846 | (1,120 | ) | 1,510,809 | ||||||||||||||||||||||||||||||||
| Provision for impairment of long-lived assets | ||||||||||||||||||||||||||||||||||||||||||||||||
| Mining concessions | - | 3,345 | - | - | - | 3,345 | - | - | - | - | - | 3,345 | ||||||||||||||||||||||||||||||||||||
| Property, plant and equipment | - | 27 | - | - | - | 27 | - | - | - | 6,533 | - | 6,560 | ||||||||||||||||||||||||||||||||||||
| Development costs | - | 3,803 | - | - | - | 3,803 | - | - | - | 5,684 | - | 9,487 | ||||||||||||||||||||||||||||||||||||
| Mine closure costs | - | 4,080 | - | - | - | 4,080 | - | - | - | 6,910 | - | 10,990 | ||||||||||||||||||||||||||||||||||||
| - | 11,255 | - | - | - | 11,255 | - | - | - | 19,127 | - | 30,382 | |||||||||||||||||||||||||||||||||||||
| Net cost | 1,715,452 | 1,747,624 | 1,960,025 | |||||||||||||||||||||||||||||||||||||||||||||
| F- 52 |
Notes to the consolidated financial statements (continued)
| (b) | Impairment of long-lived assets |
I n accordance with its accounting policies and processes, each asset or CGU is evaluated annually at year end, to determine whether there are any indications of impairment. If any such indications of impairment exist, a formal estimate of the recoverable amount is performed.
In assessing whether impairment is required, the carrying value of the asset or CGU is compared with its recoverable amount. The recoverable amount is the higher of the CGU’s fair value less costs of disposal (FVLCD) and value in use (VIU). Given the nature of the Group’s activities, information on the fair value of an asset is usually difficult to obtain unless negotiations with potential purchasers or similar transactions are taking place. Consequently, the recoverable amount for each CGU is estimated based on discounted future estimated cash flows expected to be generated from the continued use of the CGUs using market based commodity price and exchange assumptions, estimated quantities of recoverable minerals, production levels, operating costs and capital requirements, and its eventual disposal, based on the latest life of mine (LOM) plans. These cash flows were discounted using a real pre-tax discount rate that reflected current market assessments of the time value of money and the risks specific to the CGU.
The estimates of quantities of recoverable minerals, production levels, operating costs and capital requirements are obtained from the planning process, including the LOM plans, one-year budgets and CGU-specific studies.
As a result of the recoverable amount analysis performed as of December 31, 2015, the Group recognized impairment losses related to mine properties for the mining operating unit of La Zanja for US$3,803,000 and Breapampa for US$7,452,000 (US$794,000 as of December 31, 2014). During 2016, the Group recorded an impairment loss related to Shila-Paula mining unit for US$2,043,000.
Key assumptions
The determination of value in use is most sensitive to the following key assumptions:
| - | Production volumes |
| - | Commodity prices |
| - | Discount rate |
Production volumes: Estimated production volumes are based on detailed life-of-mine plans and take into account development plans for the mines agreed by management as part of planning process. Production volumes are dependent on a number of variables, such as: the recoverable quantities; the production profile; the cost of the development of the infrastructure necessary to extract the reserves; the production costs; the contractual duration of mining rights; and the selling price of the commodities extracted.
| F- 53 |
Notes to the consolidated financial statements (continued)
As each producing mining unit has specific reserve characteristics and economic circumstances, the cash flows of the mines are computed using appropriate individual economic models and key assumptions established by management. The production profiles used were consistent with the reserves and resource volumes approved as part of the Group’s process for the estimation of proved and probable reserves and resource estimates.
Commodity prices: Forecast commodity prices are based on management’s estimates and are derived from forward price curves and long-term views of global supply and demand, building on past experience of the industry and consistent with external sources. These prices were adjusted to arrive at appropriate consistent price assumptions for the different qualities and type of commodities, or, where appropriate, contracted prices were applied. These prices are reviewed at least annually.
Estimates prices for the current and long-term periods that have been used to estimate future revenues are as follows:
| 2017 | 2018 | 2019 | 2020 | |||||||||||||
| US$ | US$ | US$ | US$ | |||||||||||||
| Gold | 1,288.00 | /Oz | 1,313.00 | /Oz | 1,291.00 | /Oz | 1,291.00 | /Oz | ||||||||
| Silver | 18.50 | /Oz | 19.50 | /Oz | 19.40 | /Oz | 19.40 | /Oz | ||||||||
| Copper | 5,200.00 | /MT | 5,633.00 | /MT | 6,000.00 | /MT | 6,000.00 | /MT | ||||||||
| Lead | 2,000.00 | /MT | 2,134.00 | /MT | 2,150.00 | /MT | 2,150.00 | /MT | ||||||||
| Zinc | 2,360.00 | /MT | 2,500.00 | /MT | 2,444.00 | /MT | 2,444.00 | /MT | ||||||||
Discount rate: In calculating the value in use, a pre-tax discount rate of 8.3% was applied to the pre-tax cash flows. This discount rate is derived from the Group’s post-tax weighted average cost of capital (WACC), with appropriate adjustments made to reflect the risks specific to the CGU. The WACC takes into account both debt and equity. The cost of equity is derived from the expected return on investment by the Group’s investors. The cost of debt is based on its interest bearing borrowings the Group is obliged to service. The beta factors are evaluated annually based on publicly available market data.
| (c) | The book value of assets held under finance leases amounted to US$218,558,000 as of December 31, 2016 (US$226,429,000 as of December 31, 2015) and is presented in various items of property, plant and equipment. No additions occurred during 2016 (US$262,000 during 2015). Leased assets are pledged as security for the related finance lease liabilities. |
| (d) | The amount of capitalized finance costs during the year 2016 was US$7,531,000 (US$1,307,000 during the year 2015) and is presented under investing activities in the consolidated statements of cash flows . The average rate used to determine the financial cost to be capitalized was 3.52 percent during the year 2016. |
| F- 54 |
Notes to the consolidated financial statements (continued)
| 13. | Investment properties, net |
The movement of cost and accumulated depreciation for the years 2016 and 2015 is presented below:
|
Balance as of
January 1, 2015 |
Addition
(reversal) |
Balance as of
December 31, 2015 |
Addition
(reversal) |
Balance as of
December 31, 2016 |
||||||||||||||||
| US$(000) | US$(000) | US$(000) | US$(000) | US$(000) | ||||||||||||||||
| Cost: | ||||||||||||||||||||
| Administrative offices | 12,103 | - | 12,103 | (92 | ) | 12,011 | ||||||||||||||
| Accumulated depreciation: | ||||||||||||||||||||
| Administrative offices | (903 | ) | (481 | ) | (1,384 | ) | (538 | ) | (1,922 | ) | ||||||||||
| Net cost | 11,200 | 10,719 | 10,089 | |||||||||||||||||
The Group does not have restrictions in the realization of its investment properties.
During 2016 and 2015, the fair value of the investment property amounted to S/76,495,466 and S/102,330,233, respectively (approximately US$22.8 million and US$30.4 million, respectively).
| 14. | Bank loans |
As of December 31, 2016, the Group maintains bank loans amounting to US$55 million which were obtained for working capital purposes, have current maturity and accrue interest at market annual rates ranging from 1.92% to 4.14%.
As of December 31, 2015, the Group maintains bank loans amounting to US$285.3 million, which accrue interest at market annual rates ranging from 1.32% to 5.61%. A portion of the loans held as of December 31, 2015 were repaid with the financial obligations detailed in note 17(b).
| F- 55 |
Notes to the consolidated financial statements (continued)
| 15. | Trade and other payables |
| (a) | This caption is made up as follows: |
| 2016 | 2015 | |||||||
| US$(000) | US$(000) | |||||||
| Trade payables (b) | ||||||||
| Domestic suppliers | 232,745 | 209,107 | ||||||
| Related entities, note 30(b) | 1,372 | 1,175 | ||||||
| 234,117 | 210,282 | |||||||
| Other payables | ||||||||
| Taxes payable | 16,708 | 9,320 | ||||||
| Accounts payable to non-controlling interests | 15,661 | 15,403 | ||||||
| Remuneration and similar benefits payable | 9,796 | 10,409 | ||||||
| Royalties payable to the Peruvian State | 3,670 | 2,103 | ||||||
| Dividends payable | 1,018 | 1,044 | ||||||
| Related entities, note 30(b) | 3 | - | ||||||
| Other liabilities | 8,449 | 13,610 | ||||||
| 55,305 | 51,889 | |||||||
| 289,422 | 262,171 | |||||||
| Classification by maturity: | ||||||||
| Current portion | 273,440 | 247,114 | ||||||
| Non-current portion | 15,982 | 15,057 | ||||||
| Total trade and other payables | 289,422 | 262,171 | ||||||
| Classification by nature: | ||||||||
| Financial payables | 269,044 | 250,748 | ||||||
| Non-financial payables | 20,378 | 11,423 | ||||||
| Total trade and other payables | 289,422 | 262,171 | ||||||
| (a) | Trade payables arise mainly from the acquisition of material, supplies and spare parts and services provided by third parties. These obligations have current maturities, accrue no interest and are not secured. |
| F- 56 |
Notes to the consolidated financial statements (continued)
| 16. | Provisions |
| (a) | This caption is made up as follows: |
| 2016 | 2015 | |||||||
| US$(000) | US$(000) | |||||||
| Provision for closure of mining units and exploration projects (b) | 206,462 | 166,403 | ||||||
| Workers’ profit sharing payable | 8,398 | 894 | ||||||
| Provision for environmental liabilities | 7,324 | 8,373 | ||||||
| Provision for obligations with communities | 4,710 | 2,883 | ||||||
| Provision for labor contingencies | 3,395 | 3,611 | ||||||
| Provision for safety contingencies | 2,807 | 6,346 | ||||||
| Board of Directors’ participation | 1,140 | 993 | ||||||
| Provision for environmental contingencies | 753 | 1,259 | ||||||
| Stock appreciation rights | 588 | 330 | ||||||
| Other provisions | 1,115 | 622 | ||||||
| 236,692 | 191,714 | |||||||
| Classification by maturity: | ||||||||
| Current portion | 62,502 | 49,829 | ||||||
| Non-current portion | 174,190 | 141,885 | ||||||
| 236,692 | 191,714 | |||||||
| (b) | Provision for closure of mining units and exploration projects - |
The table below presents the movement of the provision for closure of mining units and exploration projects:
| 2016 | 2015 | |||||||
| US$(000) | US$(000) | |||||||
| Beginning balance | 166,403 | 103,010 | ||||||
| Transfer from available for sale units | 15,851 | - | ||||||
| Changes and additions in estimates (discontinued operations), note 1(e) | 3,365 | - | ||||||
| Accretion expense (discontinued operations), note 1(e) | 970 | 45 | ||||||
| Changes and additions in estimates (continued operations), note 12(a) | 34,532 | 74,907 | ||||||
| Accretion expense (continued operations), note 27 | 4,116 | 3,298 | ||||||
| Disbursements | (18,775 | ) | (14,857 | ) | ||||
| Final balance | 206,462 | 166,403 | ||||||
| Classification by maturity: | ||||||||
| Current portion | 37,405 | 31,196 | ||||||
| Non-current portion | 169,057 | 135,207 | ||||||
| 206,462 | 166,403 | |||||||
| F- 57 |
Notes to the consolidated financial statements (continued)
The provision for closure of mining units and exploration projects represents the present value of the closure costs that are expected to be incurred between the years 2017 and 2039. These estimates are based on studies prepared by independent advisers that meet the environmental regulations in effect.
The provision for closure of mining units and exploration projects corresponds mostly to activities that must be carried out for restoring the mining units and areas affected by operation and production activities. The principal works to be performed correspond to earthworks, re-vegetation efforts and dismantling of the plants. Closure budgets are reviewed regularly to take into account any significant change in the studies conducted. Nevertheless, the closure costs of mining units will depend on the market prices for the closure works required, which would reflect future economic conditions. Also, the time when the disbursements will be made depends on the useful life of the mine, which will be based on future metals prices.
As of December 31, 2016, the future value of the provision for closure of mining units and exploration projects was US$220.0 million, which has been discounted using annual risk-free rates ranging from 0.40 to 4.83 percent in periods of 1 to 23 years , resulting in an updated liability of US$185,163,000 (US$166,403,000 as of December 31, 2015). The Group believes that this liability is sufficient to meet the current environmental protection laws approved by the Ministry of Energy and Mines.
As of December 31, 2016, the Group has constituted letters of credit in favor of the Ministry of Energy and Mines for US$117,664,000 (US$110,403,000 as of December 31, 2015) to secure current mine closure plans of its mining units and exploration projects up to date.
| F- 58 |
Notes to the consolidated financial statements (continued)
| 17. | Financial obligations |
| (a) | This caption is made up as follow: |
| 2016 | 2015 | |||||||
| US$(000) | US$(000) | |||||||
| Compañía de Minas Buenaventura S.A.A. (b) | ||||||||
| BBVA Banco Continental S.A. | 61,667 | - | ||||||
| Banco de Crédito del Perú | 61,667 | - | ||||||
| CorpBanca New York Branch | 61,666 | - | ||||||
| Banco Internacional del Perú | 30,000 | - | ||||||
| ICBC Perú Bank | 25,000 | - | ||||||
| Banco Latinoamericano de Comercio Exterior S.A. | 20,000 | - | ||||||
| Banco de Sabadell, Miami Branch | 15,000 | - | ||||||
| 275,000 | - | |||||||
| Debt issuance costs | (3,119 | ) | - | |||||
| 271,881 | - | |||||||
| Empresa de Generación Huanza S.A. | ||||||||
| Banco de Crédito del Perú – Finance lease (c) | 176,062 | 188,138 | ||||||
| Sociedad Minera El Brocal S.A.A. | ||||||||
| Banco de Crédito del Perú – Finance leaseback (d) | 136,812 | 156,328 | ||||||
| Other obligations | 173 | - | ||||||
| Buenaventura Ingenieros S.A. | ||||||||
| Banco de Crédito del Perú – Finance lease (e) | 7,361 | 9,082 | ||||||
| Other obligations | - | 69 | ||||||
| Contacto Corredores de Seguros S.A. | ||||||||
| BBVA Banco Continental S.A. – Finance lease | 53 | 93 | ||||||
| Total financial obligations | 592,342 | 353,710 | ||||||
| Classification by maturity: | ||||||||
| Current portion | 40,110 | 33,394 | ||||||
| Non-current portion (f) | 552,232 | 320,316 | ||||||
| Total financial obligations | 592,342 | 353,710 | ||||||
| F- 59 |
Notes to the consolidated financial statements (continued)
| (b) | On June 27, 2016, Buenaventura entered into a long-term finance contract with seven Peruvian and foreign banks, with the following terms and conditions: |
| - | Principal: US$275,000,000. |
| - | Annual interest rate: Three-month Libor plus 3%. |
| - | Term: 5 years since June 30, 2016, with final maturity in June 30, 2021. |
| - | Grace Period: Two years. |
| - | Amortization: 6 semiannual installments of US$39,285,714 since July 2018 and a final payment of US$39,285,716 in June 2021. |
| - | Guarantee: None. The subsidiaries Compañía Minera Condesa S.A., Inversiones Colquijirca S.A. and Consorcio Energético de Huancavelica S.A. are the guarantors. |
As part of the commitments, the Group must meet certain consolidated financial ratios. The main ratios are the following:
| (i) | Debt service coverage ratio: Higher than 4. |
| (ii) | Leverage ratio: Less than 4 times since June 30, 2016 until June 30, 2017 and less than 3 times since that date. |
| (iii) | Net consolidated equity value: Higher than US$2,711,388,800. |
For the calculation of (i) and (ii), the financial obligations and EBITDA of Empresa de Generación Huanza S.A. are excluded.
Additionally, there is a requirement related to the distribution of dividends (until December 31, 2018: up to 20% of the available net income for the previous period; since January 1, 2019: up to the total of net income for the previous period), according to the execution of the dividend policy of the Company.
The compliance of the terms described above is overseen by the Company´s Management. As of December 31, 2016, the Company complies with the above financial ratios.
| (c) | On December 2, 2009, Empresa de Generación Huanza S.A. entered into a finance lease contract with Banco de Crédito del Perú, with the following terms and conditions: |
| - | Principal: US$119,000,000. |
| - | Annual interest rate: Three-month Libor plus 4.60 percent (three-month Libor plus 4.00 percent as of December 31, 2015). |
| - | Term: 6 years since August 2014, with final maturity in November 2020. |
| - | Guarantee: Leased equipment. |
| - | Amortization: Through 26 quarterly variable installments and a final payment of US$44,191,000. |
| F- 60 |
Notes to the consolidated financial statements (continued)
On June 30, 2014, Banco de Credito del Perú extended the finance lease contract above mentioned, through the addition of a new tranche with the following terms and conditions:
| - | Principal: US$103,373,000. |
| - | Annual interest rate: Three-month Libor plus 4.70 percent (Three-month Libor plus 4.20 percent as of December 31, 2015) |
| - | Term: 6 years since August 2014, with final maturity in November 2020. |
| - | Guarantee: Leased equipment. |
| - | Amortization: Through an initial installment of US$23,780,000, 26 quarterly variable installments and a final installment of US$68,905,000. |
| (d) | On June 9, 2015, the Board of Directors of El Brocal approved the modification of the debt and new payment schedule of the leaseback through sale contracts through the sale of assets with the same value including equipment, machinery and processing plant located in the Colquijirca mining unit. The contracts have the following terms and conditions: |
| - | Principal: US$166,500,000. |
| - | Annual interest rate: Nine-month Libor plus 4.75 percent. |
| - | Term: 5.5 years since September 23, 2015, with final maturity in year 2020. |
| - | Amortization: Through 22 quarterly variable installments. |
In connection with the above financing, El Brocal complied with the following financial ratios:
| (i) | Debt service coverage ratio: Higher than 1.3 |
| (ii) | Leverage ratio: Less than 1.0 times. |
| (iii) | Debt ratio: |
| a. | Less than 2.50 times as of December 31, 2016; |
| b. | Less than 2.50 times from January 1, 2017 to September 30, 2017; |
| c. | Less than 2.25 times as of December 31, 2017; |
| d. | Less than 2.0 times from January 1, 2018. |
These sales agreements with a subsequent financial lease are guaranteed by a trust agreement related to collection rights, sales contracts, cash flows for sales contracts and one related to the assets indicated in the contract.
The compliance with the financial ratios described above is monitored by El Brocal’s Management. El Brocal’s Management obtained a waiver from the bank for any possible breach of the financial ratios for one year.
| F- 61 |
Notes to the consolidated financial statements (continued)
| (e) | On March 28, 2014, Buenaventura Ingenieros S.A. (hereinafter “BISA”), entered into a finance lease contract with Banco de Credito del Perú, for the construction of administrative offices, with the following terms and conditions: |
| - | Principal: US$14,944,000. |
| - | Annual interest rate: 4.60 percent. |
| - | Term: 5 years and 4 months since April 2014, with final maturity in July 2019. |
| - | Guarantee: Leased property. |
| - | Amortization: Through 64 monthly installments of US$208,000 each. |
The loan is subject to compliance with certain financial ratios. During the years 2016 and 2015, the BISA´s Management obtained from Banco de Crédito a waiver for the compliance of the financial ratios stipulated in the contract, which covers the period of one year. As a consequence, as of December 31, 2016 and 2015, the classification of the debt has been made according to the payment schedule originally agreed with the bank.
| (f) | The long-term portion of the financial obligations held by the Group mature as follows: |
| Year | 2016 | 2015 | ||||||
| US$(000) | US$(000) | |||||||
| Less than 1 year | - | 40,104 | ||||||
| Between 1 and 2 years | 81,057 | 41,708 | ||||||
| Between 2 and 5 years | 474,294 | 238,504 | ||||||
| 555,351 | 320,316 | |||||||
| Debt issuance costs | (3,119 | ) | - | |||||
| 552,232 | 320,316 | |||||||
| 18. | Shareholders’ equity, net |
| (a) | Capital stock - |
The Group’s share capital is stated in Soles and consists of common shares with voting rights, with a nominal amount of S/10.00 per share. The table below presents the composition of the capital stock as of December 31, 2016 and 2015:
|
Number of
shares |
Capital
stock |
Capital
stock |
||||||||||
| S/(000) | US$(000) | |||||||||||
| Common shares | 274,889,924 | 2,748,899 | 813,162 | |||||||||
| Treasury shares | (21,174,734 | ) | (211,747 | ) | (62,665 | ) | ||||||
| 253,715,190 | 2,537,152 | 750,497 | ||||||||||
| F- 62 |
Notes to the consolidated financial statements (continued)
The market value of the common shares amounted to S/34.37 per share as of December 31, 2016 (S/14.35 per share as of December 31, 2015). These shares present trading frequencies of 10 and 15 percent in the years 2016 and 2015, respectively.
| (b) | Investment shares - |
Investment shares have a nominal value of S/10.00 per share. Holders of investment shares are neither entitled neither to exercise voting rights nor to participate in shareholders’ meetings; however, they confer upon the holders thereof the right to participate in the dividends distribution in the same manner as common shares. The table below presents the composition of the investment shares as of December 31, 2016 and 2015:
| As of December 31, 2016 | ||||||||||||
|
Number of
shares |
Investment
shares |
Investment
shares |
||||||||||
| S/(000) | US$(000) | |||||||||||
| Investment shares | 744,640 | 7,447 | 2,161 | |||||||||
| Treasury investment shares | (472,963 | ) | (4,730 | ) | (1,370 | ) | ||||||
| 271,677 | 2,717 | 791 | ||||||||||
| As of December 31, 2015 | ||||||||||||
|
Number of
shares |
Investment
shares |
Investment
shares |
||||||||||
| S/(000) | US$(000) | |||||||||||
| Investment shares | 744,640 | 7,447 | 2,161 | |||||||||
| Treasury investment shares | (272,963 | ) | (2,730 | ) | (765 | ) | ||||||
| 471,677 | 4,717 | 1,396 | ||||||||||
The market value of the investment shares amounted to S/25.00 per share as of December 31, 2015 (S/14.14 per share as of December 31, 2015). These shares did not present a trading frequency in 2016 and 2015.
During 2016, the Group purchased 200,000 treasury shares at a market value of US$1,210,000, recording a purchase loss of US$605,000, presented as part of the additional capital.
| (c) | Legal reserve - |
The Peruvian Corporations Law requires that a minimum of 10 percent of the distributable earnings for each period, after deducting the income tax, be transferred to a legal reserve until the latter is equal to 20 percent of the capital stock. This legal reserve can be used to offset losses or may be capitalized, with the obligation, in both cases, to replenish it.
Although, the balance of the legal reserve exceeded the limit mentioned above, the Group increased its legal reserve by US$30,000 in 2016 (US$4,000 in 2015).
| F- 63 |
Notes to the consolidated financial statements (continued)
| (d) | Dividends declared and paid - |
During 2015, no dividends have been declared or paid. The table below presents the dividends declared and paid in 2016 and 2014:
| Meetings | Date |
Dividends
paid |
Dividend
per share |
|||||||
| US$(000) | US$ | |||||||||
| 2016 Dividends | ||||||||||
| Board of Directors’ Meeting | October 27 | 8,269 | 0.03 | |||||||
| Less - Dividends of treasury shares | (648 | ) | ||||||||
| 7,621 | ||||||||||
| 2014 Dividends | ||||||||||
| Mandatory Annual Shareholders’ Meeting | March 27 | 3,032 | 0.01 | |||||||
| Board of Directors’ Meeting | October 30 | 6,339 | 0.02 | |||||||
| Less - Dividends of treasury shares | (729 | ) | ||||||||
| 8,642 | ||||||||||
According to the current Law, there are no restrictions for the remittance of dividends or repatriation of capital by foreign investors.
Dividends declared by S.M.R.L. Chaupiloma Dos de Cajamarca corresponding to non-controlling interest were US$7,400,000, US$10,488,000 and US$8,880,000 for the years 2016, 2015 and 2014, respectively.
| (e) | Basic and diluted loss per share - |
Loss per share is calculated by dividing net profit for the period by the weighted average number of shares outstanding during the year.
The calculation of loss per share attributable to the equity holders of the parent is presented below:
| 2016 | 2015 | 2014 | ||||||||||
| Loss net (numerator) - US$ | (323,492,000 | ) | (317,210,000 | ) | (76,065,000 | ) | ||||||
| Total common and investment shares (denominator) | 254,111,250 | 254,186,867 | 254,186,867 | |||||||||
| Loss net per basic share and diluted - US$ | (1.27 | ) | (1.25 | ) | (0.30 | ) | ||||||
The calculation of loss per share from continuing operations attributable to the equity holders of the Parent is presented below:
| 2016 | 2015 | 2014 | ||||||||||
| Loss net (numerator) - US$ | (304,419,000 | ) | (296,977,000 | ) | (70,235,000 | ) | ||||||
| Total common and investment shares (denominator) | 254,111,250 | 254,186,867 | 254,186,867 | |||||||||
| Loss net per basic share and diluted - US$ | (1.20 | ) | (1.17 | ) | (0.28 | ) | ||||||
| F- 64 |
Notes to the consolidated financial statements (continued)
The common and investment shares outstanding at the close of 2016, 2015 and 2014 were 253,986,867, 254,186,867 and 254,186,867, respectively.
| 19. | Subsidiaries with material non-controlling interest |
| (a) | Financial information of subsidiaries that have material non-controlling interest are provided below: |
|
Country of
incorporation and operation |
2016 | 2015 | 2014 | |||||||||||
| % | % | % | ||||||||||||
| Equity interest held by non-controlling interests: | ||||||||||||||
| Sociedad Minera El Brocal S.A.A. | Peru | 40.95 | 45.93 | 45.93 | ||||||||||
| S.M.R.L. Chaupiloma Dos de Cajamarca | Peru | 40.00 | 40.00 | 40.00 | ||||||||||
| Minera La Zanja S.R.L. | Peru | 46.94 | 46.94 | 46.94 | ||||||||||
| 2016 | 2015 | 2014 | ||||||||||||
| US$(000) | US$(000) | US$(000) | ||||||||||||
| Accumulated balances of material non-controlling interest: | ||||||||||||||
| Sociedad Minera El Brocal S.A.A. | Peru | 167,986 | 172,542 | 208,664 | ||||||||||
| Minera La Zanja S.R.L. | Peru | 55,613 | 53,271 | 85,756 | ||||||||||
| S.M.R.L. Chaupiloma Dos de Cajamarca | Peru | 1,906 | 2,357 | 3,600 | ||||||||||
| Apu Coropuna S.R.L. | Peru | 678 | - | - | ||||||||||
| Other minor | Chile | (61 | ) | - | - | |||||||||
| 226,122 | 228,170 | 298,020 | ||||||||||||
| Profit (loss) allocated to material non-controlling interest: | ||||||||||||||
| Sociedad Minera El Brocal S.A.A. | Peru | (13,426 | ) | (34,991 | ) | 3,450 | ||||||||
| Apu Coropuna S.R.L. | Peru | (157 | ) | (102 | ) | - | ||||||||
| S.M.R.L. Chaupiloma Dos de Cajamarca | Peru | 6,950 | 9,244 | 10,250 | ||||||||||
| Minera La Zanja S.R.L. | Peru | 2,342 | (32,486 | ) | 725 | |||||||||
| Other minor | Chile | (31 | ) | - | - | |||||||||
| (4,322 | ) | (58,335 | ) | 14,425 | ||||||||||
During 2016, the Group, through the Lima Stock Exchange, made capital contributions to its subsidiary Sociedad Minera El Brocal S.A.A., for S/63.9 million (equivalent to US$18.6 million) and US$45.2 million which resulted in an increase in its shares and a dilution of non-controlling shareholders of 7.26%.
| F- 65 |
Notes to the consolidated financial statements (continued)
| (b) | The summarized financial information of these subsidiaries, before inter-company eliminations, is presented below: |
Statements of financial position as of December 31, 2016:
|
Sociedad
Minera El Brocal S.A.A. |
S.M.R.L.
Chaupiloma Dos de Cajamarca |
Minera
La Zanja S.R.L. |
Apu
Coropuna S.R.L. |
Other
minor |
Total | |||||||||||||||||||
| US$(000) | US$(000) | US$(000) | US$(000) | US$(000) | US$(000) | |||||||||||||||||||
| Current assets | 120,291 | 7,439 | 155,659 | 2,301 | 81 | 285,771 | ||||||||||||||||||
| Non-current assets | 642,790 | - | 90,447 | 88 | 500 | 733,825 | ||||||||||||||||||
| Current liabilities | (184,324 | ) | (2,684 | ) | (40,411 | ) | (129 | ) | - | (227,548 | ) | |||||||||||||
| Non-current liabilities | (168,589 | ) | - | (89,278 | ) | - | (2 | ) | (257,869 | ) | ||||||||||||||
| Total shareholders’ equity, net | 410,168 | 4,755 | 116,417 | 2,260 | 579 | 534,179 | ||||||||||||||||||
| Attributable to: | ||||||||||||||||||||||||
| Shareholders of the parent | 242,182 | 2,849 | 60,804 | 1,582 | 640 | 308,057 | ||||||||||||||||||
| Non-controlling interests | 167,986 | 1,906 | 55,613 | 678 | (61 | ) | 226,122 | |||||||||||||||||
| 410,168 | 4,755 | 116,417 | 2,260 | 579 | 534,179 | |||||||||||||||||||
Statements of financial position as of December 31, 2015:
|
Sociedad
Minera El Brocal S.A.A. |
S.M.R.L.
Chaupiloma Dos de Cajamarca |
Minera La Zanja S.R.L. | Total | |||||||||||||
| US$(000) | US$(000) | US$(000) | US$(000) | |||||||||||||
| Current assets | 87,676 | 9,381 | 103,540 | 200,597 | ||||||||||||
| Non-current assets | 652,197 | 16 | 116,792 | 769,005 | ||||||||||||
| Current liabilities | (166,424 | ) | (3,508 | ) | (37,030 | ) | (206,962 | ) | ||||||||
| Non-current liabilities | (197,763 | ) | - | (69,816 | ) | (267,579 | ) | |||||||||
| Total shareholders’ equity, net | 375,686 | 5,889 | 113,486 | 495,061 | ||||||||||||
| Attributable to: | ||||||||||||||||
| Shareholders of the parent | 203,144 | 3,532 | 60,215 | 266,891 | ||||||||||||
| Non-controlling interests | 172,542 | 2,357 | 53,271 | 228,170 | ||||||||||||
| 375,686 | 5,889 | 113,486 | 495,061 | |||||||||||||
| F- 66 |
Notes to the consolidated financial statements (continued)
Statements of profit or loss for the year ended December 31, 2016:
|
Sociedad
Minera El Brocal S.A.A. |
S.M.R.L.
Chaupiloma Dos de Cajamarca |
Minera
La Zanja S.R.L. |
Apu
Coropuna S.R.L. |
Other
minor |
Total | |||||||||||||||||||
| US$(000) | US$(000) | US$(000) | US$(000) | US$(000) | US$(000) | |||||||||||||||||||
| Revenues | 230,611 | 24,339 | 178,922 | - | - | 433,872 | ||||||||||||||||||
| Cost of sales | (234,594 | ) | (16 | ) | (150,039 | ) | - | - | (384,649 | ) | ||||||||||||||
| Administrative expenses | (11,802 | ) | (112 | ) | (1,980 | ) | (4 | ) | - | (13,898 | ) | |||||||||||||
| Sales expenses | (10,650 | ) | - | (938 | ) | - | - | (11,588 | ) | |||||||||||||||
| Exploration in non-operating areas | (1,939 | ) | - | (4,619 | ) | (524 | ) | - | (7,082 | ) | ||||||||||||||
| Impairment loss of long-lived assets | 309 | 11 | 4,237 | - | (410 | ) | 4,147 | |||||||||||||||||
| Finance income | 256 | - | 87 | - | - | 343 | ||||||||||||||||||
| Finance costs | (12,554 | ) | (2 | ) | (2,614 | ) | - | - | (15,170 | ) | ||||||||||||||
| Net gain (loss) for exchange difference | (270 | ) | (93 | ) | 65 | 5 | - | (293 | ) | |||||||||||||||
| Profit (loss) before income tax | (40,633 | ) | 24,127 | 23,121 | (523 | ) | (410 | ) | 5,682 | |||||||||||||||
| Income tax | 7,851 | (6,761 | ) | (18,256 | ) | - | - | (17,166 | ) | |||||||||||||||
| Net profit (loss) | (32,782 | ) | 17,366 | 4,865 | (523 | ) | (410 | ) | (11,484 | ) | ||||||||||||||
| Attributable to non-controlling interests | (13,426 | ) | 6,950 | 2,342 | (157 | ) | (31 | ) | (4,322 | ) | ||||||||||||||
| Dividends paid to non-controlling interests | - | 7,400 | - | - | - | 7,400 | ||||||||||||||||||
| F- 67 |
Notes to the consolidated financial statements (continued)
Statements of profit or loss for the year ended December 31, 2015:
|
Sociedad
Minera El Brocal S.A.A. |
S.M.R.L.
Chaupiloma Dos de Cajamarca |
Minera
La Zanja S.R.L. |
Total | |||||||||||||
| US$(000) | US$(000) | US$(000) | US$(000) | |||||||||||||
| Revenues | 171,294 | 32,414 | 161,007 | 364,715 | ||||||||||||
| Cost of sales | (204,556 | ) | (54 | ) | (213,372 | ) | (417,982 | ) | ||||||||
| Administrative expenses | (19,168 | ) | (106 | ) | (2,251 | ) | (21,525 | ) | ||||||||
| Sales expenses | (9,056 | ) | - | (1,207 | ) | (10,263 | ) | |||||||||
| Exploration in non-operating areas | (2,366 | ) | - | (8,954 | ) | (11,320 | ) | |||||||||
| Impairment loss of long-lived assets | - | - | (3,803 | ) | (3,803 | ) | ||||||||||
| Other operating expense, net | (2,657 | ) | - | (687 | ) | (3,344 | ) | |||||||||
| Finance income | 154 | - | 16 | 170 | ||||||||||||
| Finance costs | (10,096 | ) | (4 | ) | (3,684 | ) | (13,784 | ) | ||||||||
| Net gain (loss) for exchange difference | (3,847 | ) | 45 | (1,973 | ) | (5,775 | ) | |||||||||
| Profit (loss) before income tax | (80,298 | ) | 32,295 | (74,908 | ) | (122,911 | ) | |||||||||
| Income tax | 4,109 | (9,186 | ) | 5,702 | 625 | |||||||||||
| Net profit (loss) | (76,189 | ) | 23,109 | (69,206 | ) | (122,286 | ) | |||||||||
| Attributable to non-controlling interests | (34,991 | ) | 9,244 | (32,486 | ) | (58,335 | ) | |||||||||
| Dividends paid to non-controlling interests | - | 10,488 | - | 10,488 | ||||||||||||
Statements of profit or loss for the year ended December 31, 2014:
|
Sociedad
Minera El Brocal S.A.A. |
S.M.R.L.
Chaupiloma Dos de Cajamarca |
Minera La
Zanja S.R.L. |
Total | |||||||||||||
| US$(000) | US$(000) | US$(000) | US$(000) | |||||||||||||
| Revenues | 210,002 | 36,867 | 185,286 | 432,155 | ||||||||||||
| Cost of sales | (149,969 | ) | (74 | ) | (137,659 | ) | (287,702 | ) | ||||||||
| Administrative expenses | (17,617 | ) | (113 | ) | (5,920 | ) | (23,650 | ) | ||||||||
| Sales expenses | (7,103 | ) | - | (1,441 | ) | (8,544 | ) | |||||||||
| Exploration in non-operating areas | (5,085 | ) | - | (19,689 | ) | (24,774 | ) | |||||||||
| Other operating income (expense), net | (50 | ) | (1 | ) | (3,389 | ) | (3,440 | ) | ||||||||
| Finance income | - | - | 1 | 1 | ||||||||||||
| Finance costs | (4 | ) | (3 | ) | (1,728 | ) | (1,735 | ) | ||||||||
| Net loss for exchange difference | (1,039 | ) | (50 | ) | (1,525 | ) | (2,614 | ) | ||||||||
| Profit before income tax | 29,135 | 36,626 | 13,936 | 79,697 | ||||||||||||
| Income tax | (21,621 | ) | (10,996 | ) | (12,388 | ) | (45,005 | ) | ||||||||
| Net profit | 7,514 | 25,630 | 1,548 | 34,692 | ||||||||||||
| Attributable to non-controlling interests | 3,450 | 10,250 | 725 | 14,425 | ||||||||||||
| Dividends paid to non-controlling interests | - | 8,880 | - | 8,880 | ||||||||||||
| F- 68 |
Notes to the consolidated financial statements (continued)
Statements of cash flow for the year ended December 31, 2016:
|
Sociedad
Minera El Brocal S.A.A. |
S.M.R.L.
Chaupiloma Dos de Cajamarca |
Minera La
Zanja S.R.L. |
Apu
Coropuna S.R.L. |
Total | ||||||||||||||||
| US$(000) | US$(000) | US$(000) | US$(000) | US$(000) | ||||||||||||||||
| Operating activities | (9,151 | ) | 18,178 | 11,839 | (1,895 | ) | 18,971 | |||||||||||||
| Investing activities | (37,935 | ) | - | (14,994 | ) | - | (52,929 | ) | ||||||||||||
| Financing activities | 48,021 | (18,500 | ) | - | 2,717 | 32,238 | ||||||||||||||
| Increase (decrease) in cash and cash equivalents in the year | 935 | (322 | ) | (3,155 | ) | 822 | (1,720 | ) | ||||||||||||
Statements of cash flow for the year ended December 31, 2015:
|
Sociedad
Minera El Brocal S.A.A. |
S.M.R.L.
Chaupiloma Dos de Cajamarca |
Minera La
Zanja S.R.L. |
Total | |||||||||||||
| US$(000) | US$(000) | US$(000) | US$(000) | |||||||||||||
| Operating activities | (1,523 | ) | 26,474 | 30,743 | 55,694 | |||||||||||
| Investing activities | (28,375 | ) | - | (26,761 | ) | (55,136 | ) | |||||||||
| Financing activities | 31,867 | (26,220 | ) | - | 5,647 | |||||||||||
| Increase (decrease) in cash and cash equivalents in the year | 1,969 | 254 | 3,982 | 6,205 | ||||||||||||
Statements of cash flow for the year ended December 31, 2014:
|
Sociedad
Minera El Brocal S.A.A. |
S.M.R.L.
Chaupiloma Dos de Cajamarca |
Minera La
Zanja S.R.L. |
Total | |||||||||||||
| US$(000) | US$(000) | US$(000) | US$(000) | |||||||||||||
| Operating activities | 71,682 | 22,375 | 17,075 | 111,132 | ||||||||||||
| Investing activities | (131,045 | ) | - | (20,452 | ) | (151,497 | ) | |||||||||
| Financing activities | 54,642 | (22,200 | ) | 7,000 | 39,442 | |||||||||||
| Increase (decrease) in cash and cash equivalents in the year | (4,721 | ) | 175 | 3,623 | (923 | ) | ||||||||||
| F- 69 |
Notes to the consolidated financial statements (continued)
| 20. | Tax situation |
| (a) | Current tax regime - |
The Company and its Peruvian subsidiaries are subject to the Peruvian tax regime.
By means of Law N° 30296 enacted on December 31, 2014, the Peruvian government introduced certain amendments to the Income Tax Law, effective January 1, 2015. The most relevant are listed below:
| - | There will be a gradual reduction of the corporate income tax from 30% to 28% in 2015 and 2016; to 27% in 2017 and 2018; and to 26% in 2019 and thereafter. |
| - | There will be a gradual increase of the withholding income tax to dividends from 4.1% to 6.8% in 2015 and 2016; to 8.0% in 2017 and 2018; and to 9.3% in 2019 and thereafter. These rates will be applicable to the distributed or approved dividends, whichever first occurs, effective January 1, 2015. |
| - | The retained earnings or other items that can generate taxable dividends, obtained until December 31, 2014, will be subject to a rate of 4.1 percent. |
By means of Law N° 1261 enacted on December 10, 2016, the Peruvian government introduced certain amendments to the Income Tax Law, effective January 1, 2017. The most relevant are listed below:
| - | A corporate income tax rate of 29.5% is set. |
| - | A tax of 5% of the income tax is established to the dividends or any other form of distribution of profits. |
| - | The rate applicable to dividends will be considered taking into account the year in which the results or profits that form part of the distribution have been obtained, according to the following: 4.1% with respect to the results obtained until December 31, 2014; 6.8% with respect to the results obtained during the years 2015 and 2016; And 5% with respect to the results obtained from January 1, 2017. |
| - | It has been established that the distribution of dividends to be made corresponds to the oldest retained earnings. |
| (b) | Years open to tax review - |
During the four years following the year of filing the tax return, the tax authorities have the power to review and, as applicable, correct the income tax computed by the Group. The Income Tax and Value Added Tax returns for the following years are open to review by the Tax Authorities:
| F- 70 |
Notes to the consolidated financial statements (continued)
| Entity | Years open to review by the Tax Authorities |
| Compañía de Minas Buenaventura S.A.A. | 2012-2016 |
| Bisa Construcción S.A. (absorbed by Buenaventura Ingenieros S.A. in December 2015) | 2012, 2014-2015 |
| Buenaventura Ingenieros S.A. | 2013-2016 |
| Compañía de Exploraciones, Desarrollo e Inversiones Mineras S.A.C. – CEDIMIN (absorbed by Buenaventura in May 2013) | 2012-2013 |
| Compañía Minera Condesa S.A. | 2012-2016 |
| Compañía Minera Colquirrumi S.A. | 2012-2016 |
| Consorcio Energético de Huancavelica S.A. | 2012-2016 |
| Contacto Corredores de Seguros S.A. | 2012, 2014-2016 |
| El Molle Verde S.A.C. | 2012-2016 |
| Empresa de Generación Huanza S.A. | 2012, 2013, 2015, 2016 |
| Inversiones Colquijirca S.A. | 2012-2016 |
| Minera La Zanja S.R.L. | 2013-2016 |
| Sociedad Minera El Brocal S.A.A. (*) | 2013-2016 |
| S.M.R.L. Chaupiloma Dos de Cajamarca | 2012-2016 |
| Procesadora Industrial Río Seco S. A. | 2012, 2014, 2015, 2016 |
| Apu Coropuna S.R.L. | 2013-2016 |
| Cerro Hablador S. A. C. | 2013-2016 |
| Minera Azola S. R. L. | 2014-2016 |
(*) The value added tax is subject to review for the period from 2012 to 2016.
As of the date of issuance of this report, Compañía de Minas Buenaventura S.A.A. has been notified by the Tax Administration for the start of the audit of the 2014 income tax return.
Due to the possible interpretations that the Tax Authorities may give to legislation in effect, it is not possible to determine whether or not any of the tax audits will result in increased liabilities for the Group. For that reason, any tax or surcharge that could arise from future tax audits would be applied to the income of the period in which it is determined. In management's opinion and its legal advisors, any possible additional payment of taxes in the entities mentioned before would not have a material effect on the consolidated financial statements as of December 31, 2016 and 2015.
The open tax process of the Group and its associates are presented in note 29 (g).
| (c) | Tax-loss carryforwards - |
The tax-loss carryforward determined by the Group amounts to approximately S/1,345,802,000 and S/1,271,245,000, respectively (equivalent to US$400,536,000 and US$201,634,000 respectively). As permitted by the Income Tax Law, the Group has chosen a system that permits to offset these losses with an annual cap equivalent to 50 percent of net future taxable income.
The Group has decided to recognize a deferred income tax asset related to the tax-loss carryforward, due to there it is more likely than not that the tax-loss carryforward can be used to compensate future taxable net income.
| F- 71 |
Notes to the consolidated financial statements (continued)
| (d) | Transfer pricing - |
For purposes of determining the Income Tax, the transfer prices for transactions with related companies and companies domiciled in territories with little or no taxation must be supported with documentation and information on the valuation methods used and the criteria considered for their determination. Tax Administration can request this information based on analysis of the Group's operations. The Group’s Management and its legal advisers believe that, as a result of the application of these standards, no material contingencies will arise for the Group as of December 31, 2016 and 2015.
| 21. | Net sales |
| (a) | The Group’s revenues are mostly from sales of gold and precious metals in the form of concentrates, including silver-lead, silver-gold, zinc and lead-gold-copper concentrates and ounces of gold. The table below presents the net sales to customers by geographic region and product type: |
| 2016 | 2015 | 2014 | ||||||||||
| US$(000) | US$(000) | US$(000) | ||||||||||
| Sales and services by geographic region: | ||||||||||||
| Metal and concentrates sales | ||||||||||||
| America | 410,154 | 419,359 | 430,869 | |||||||||
| Peru | 401,372 | 345,146 | 427,564 | |||||||||
| Europe | 109,788 | 60,549 | 46,585 | |||||||||
| Asia | 94,356 | 21,215 | 54,268 | |||||||||
| 1,015,670 | 846,269 | 959,286 | ||||||||||
| Services rendered | ||||||||||||
| Peru | 28,782 | 50,839 | 71,159 | |||||||||
| 1,044,452 | 897,108 | 1,030,445 | ||||||||||
| Sale by metal: | ||||||||||||
| Gold | 440,603 | 419,541 | 449,404 | |||||||||
| Silver | 385,989 | 313,418 | 348,171 | |||||||||
| Copper | 224,649 | 131,356 | 271,282 | |||||||||
| Zinc | 142,425 | 102,110 | 46,903 | |||||||||
| Lead | 58,690 | 55,445 | 39,185 | |||||||||
| Manganese sulfate | 5,982 | 3,649 | 483 | |||||||||
| 1,258,338 | 1,025,519 | 1,155,428 | ||||||||||
| Commercial deductions | (244,414 | ) | (196,145 | ) | (184,385 | ) | ||||||
| Adjustments to prior period liquidations | 4,611 | 7,467 | (6,073 | ) | ||||||||
| Embedded derivatives from sale of concentrate | 880 | (388 | ) | (9,570 | ) | |||||||
| Hedge operations | (3,745 | ) | 9,816 | 3,886 | ||||||||
| 1,015,670 | 846,269 | 959,286 | ||||||||||
| Services rendered | 28,782 | 50,839 | 71,159 | |||||||||
| 1,044,452 | 897,108 | 1,030,445 | ||||||||||
| F- 72 |
Notes to the consolidated financial statements (continued)
| (b) | Concentration of sales - |
In 2016, the three customers with sales of more than 10 percent of total net sales represented 28, 22 and 22 percent from the total net sales of the Group (two customers in 66 and 22 percent during the year 2015 and; two customers in 62 percent and 17 percent during 2014). As of December 31, 2016, 46 percent of the accounts receivable correspond to these customers (85 percent as of December 31, 2015). These customers are related to the mining business.
The Group's sales of gold and concentrates are delivered to investment banks and national and international well-known companies. Some of these clients have sales contracts that guarantee supplying them the production from the Group’s mines at prices that are based on market quotations.
| 22. | Cost of sales, without considering depreciation and amortization |
| (a) | The cost of sales of goods is made up as follows: |
| 2016 | 2015 | 2014 | ||||||||||
| US$(000) | US$(000) | US$(000) | ||||||||||
| Beginning balance of finished goods and products in process, net of depreciation and amortization | 69,932 | 105,944 | 105,640 | |||||||||
| Cost of production | ||||||||||||
| Services provided by third parties | 211,325 | 230,148 | 252,967 | |||||||||
| Consumption of materials and supplies | 100,401 | 100,241 | 95,503 | |||||||||
| Direct labor | 72,344 | 66,745 | 75,007 | |||||||||
| Electricity and water | 41,989 | 34,972 | 32,802 | |||||||||
| Maintenance and repair | 17,792 | 7,401 | 6,195 | |||||||||
| Transport | 10,880 | 9,502 | 12,148 | |||||||||
| Rentals | 10,852 | 5,783 | 3,948 | |||||||||
| Insurances | 4,347 | 5,247 | 6,400 | |||||||||
| Cost of concentrate purchased to associates | 2,958 | - | - | |||||||||
| Provision for impairment of finished goods and product in progress, note 9(b) | (7,581 | ) | 13,096 | 3,262 | ||||||||
| Other production expenses | 9,789 | 7,078 | 10,786 | |||||||||
| Total cost of production of the period | 475,096 | 480,213 | 499,018 | |||||||||
| Final balance of products in process and finished goods, net of depreciation and amortization | (47,216 | ) | (72,667 | ) | (105,944 | ) | ||||||
| Cost of sales of goods, without considering depreciation and amortization | 497,812 | 513,490 | 498,714 | |||||||||
| F- 73 |
Notes to the consolidated financial statements (continued)
| (b) | The cost of services is made up as follows: |
| 2016 | 2015 | 2014 | ||||||||||
| US$(000) | US$(000) | US$(000) | ||||||||||
| Direct labor | 5,983 | 18,314 | 33,461 | |||||||||
| Services provided by third parties | 1,689 | 16,247 | 13,881 | |||||||||
| Consumption of materials and supplies | 868 | 7,865 | 8,017 | |||||||||
| Electricity and water | 633 | 7,134 | 5,853 | |||||||||
| Maintenance and repair | 217 | 637 | 406 | |||||||||
| Rentals | 480 | 2,544 | 6,285 | |||||||||
| Insurances | 212 | 1,233 | 1,058 | |||||||||
| Transport | 213 | 3,868 | 6,196 | |||||||||
| Other | 459 | 1,770 | 2,770 | |||||||||
| Cost of sales of services, without considering depreciation and amortization | 10,754 | 59,612 | 77,927 | |||||||||
| 23. | Exploration in operating units |
This caption is made up as follows
| 2016 | 2015 | 2014 | ||||||||||
| US$(000) | US$(000) | US$(000) | ||||||||||
| Services provided by third parties | 78,996 | 72,613 | 79,952 | |||||||||
| Consumption of materials and supplies | 12,779 | 10,298 | 10,074 | |||||||||
| Direct labor | 1,989 | 2,287 | 2,720 | |||||||||
| Rentals | 1,603 | 859 | 797 | |||||||||
| Transport | 321 | 238 | 1,194 | |||||||||
| Insurance | 116 | 135 | 157 | |||||||||
| Other minor expenses | 345 | 3,269 | 2,463 | |||||||||
| 96,149 | 89,699 | 97,357 | ||||||||||
| 24. | Mining royalties |
This caption is made up as follows:
| 2016 | 2015 | 2014 | ||||||||||
| US$(000) | US$(000) | US$(000) | ||||||||||
| Sindicato Minero de Orcopampa S.A., note 29(b) | 19,824 | 21,942 | 21,688 | |||||||||
| Royalties paid to the Peruvian State | 7,787 | 5,246 | 5,725 | |||||||||
| Others | - | - | 15 | |||||||||
| 27,611 | 27,188 | 27,428 | ||||||||||
| F- 74 |
Notes to the consolidated financial statements (continued)
| 25. | Administrative expenses |
This caption is made up as follows:
| 2016 | 2015 | 2014 | ||||||||||
| US$(000) | US$(000) | US$(000) | ||||||||||
| Personnel expenses | 29,617 | 33,036 | 32,647 | |||||||||
| Sundry charges | 17,454 | 21,248 | 23,375 | |||||||||
| Professional fees | 11,696 | 10,364 | 13,956 | |||||||||
| Rentals | 4,870 | 4,009 | 5,185 | |||||||||
| Donations | 4,280 | 3,336 | 5,034 | |||||||||
| Insurance | 3,023 | 5,105 | 3,726 | |||||||||
| Allowance for doubtful accounts | 3,164 | 903 | - | |||||||||
| Communications | 1,557 | 1,281 | 1,276 | |||||||||
| Canons and tributes. | 1,460 | 824 | 1,207 | |||||||||
| Maintenance and repairs | 1,076 | 973 | 2,720 | |||||||||
| Board of Directors’ participation | 1,140 | 1,055 | 1,163 | |||||||||
| Travel and mobility | 914 | 787 | 908 | |||||||||
| Subscriptions and quotes | 697 | 540 | 779 | |||||||||
| Consumption of materials and supplies | 416 | 1,032 | 1,688 | |||||||||
| Valuation (reversal) of stock appreciation’s rights | 328 | (121 | ) | 89 | ||||||||
| 81,692 | 84,372 | 93,753 | ||||||||||
| 26. | Exploration in non-operating areas |
This caption is made up as follows
| 2016 | 2015 | 2014 | ||||||||||
| US$(000) | US$(000) | US$(000) | ||||||||||
| Services provided by third parties | 13,629 | 18,852 | 34,582 | |||||||||
| Personnel expenses | 3,908 | 4,713 | 6,053 | |||||||||
| Rights | 3,457 | - | - | |||||||||
| Lands | 1,691 | - | - | |||||||||
| Consumption of materials and supplies | 768 | 1,436 | 3,213 | |||||||||
| Rentals | 578 | 376 | 1,142 | |||||||||
| Maintenance and repairs | 72 | 87 | 139 | |||||||||
| Insurance | 49 | 84 | 75 | |||||||||
| Transport | 26 | 20 | 168 | |||||||||
| Other expenses | 2,411 | 5,042 | 4,635 | |||||||||
| 26,589 | 30,610 | 50,007 | ||||||||||
| F- 75 |
Notes to the consolidated financial statements (continued)
| 27. | Finance costs and finance revenues |
These captions are made up as follows:
| 2016 | 2015 | 2014 | ||||||||||
| US$(000) | US$(000) | US$(000) | ||||||||||
| Finance revenues: | ||||||||||||
| Interests on loans to associates, note 30(a) | 4,164 | 2,286 | 2,887 | |||||||||
| Income from financial instruments | 743 | - | - | |||||||||
| Dividends income | 589 | 500 | 2 | |||||||||
| Interests on third parties loans | 489 | 492 | 5,380 | |||||||||
| Interests on tax claims | 487 | 1,297 | - | |||||||||
| Interest on time deposits | 358 | 419 | 139 | |||||||||
| 6,830 | 4,994 | 8,408 | ||||||||||
| Unrealized variation of the fair value related to contingent consideration liability, note 5 | - | 6,032 | - | |||||||||
| Total finance revenues | 6,830 | 11,026 | 8,408 | |||||||||
| Finance costs: | ||||||||||||
| Interest on borrowings | 18,668 | 17,875 | 7,979 | |||||||||
| Interest on loans | 4,643 | 5,565 | 729 | |||||||||
| Interest on commercial obligations | 496 | 120 | - | |||||||||
| Banking expenses | 319 | 366 | 673 | |||||||||
| Tax on financial transaction | 159 | 312 | 148 | |||||||||
| Other finance costs | 830 | 41 | 94 | |||||||||
| 25,115 | 24,279 | 9,623 | ||||||||||
| Unrealized variation of the fair value related to contingent consideration liability, note 5 | 2,349 | - | - | |||||||||
| Accrual of the present value for mine and exploration project closure, note 16(b) | 4,116 | 3,293 | 1,653 | |||||||||
| Total f inance costs | 31,580 | 27,572 | 11,276 | |||||||||
| F- 76 |
Notes to the consolidated financial statements (continued)
| 28. | Deferred income tax |
| (a) | The Group recognizes the effects of timing differences between the accounting and tax basis. This caption is made up as follows: |
|
As of January 1,
2015 |
Credit (debit) to the
Consolidated statement of profit or loss |
Credit (debit) to
consolidated statements of other comprehensive income |
As of
December 31, 2015 |
Credit (debit)
to the Consolidated statement of profit or loss |
Credit (debit) to
consolidated statements of other comprehensive income |
As of
December 31, 2016 |
||||||||||||||||||||||
| US$(000) | US$(000) | US$(000) | US$(000) | US$(000) | US$(000) | US$(000) | ||||||||||||||||||||||
| Deferred asset for income tax included in results | ||||||||||||||||||||||||||||
| Tax - loss carryforward | 32,486 | 45,923 | - | 78,409 | 14,641 | - | 93,050 | |||||||||||||||||||||
| Difference in depreciation and amortization rates | 58,461 | (6,084 | ) | - | 52,377 | 8,506 | - | 60,883 | ||||||||||||||||||||
| Provision for closure of mining units, net | 19,796 | 12,848 | - | 32,644 | 6,894 | - | 39,538 | |||||||||||||||||||||
| Environmental liability for Santa Barbara mine | 1,239 | 317 | - | 1,556 | 13 | - | 1,569 | |||||||||||||||||||||
| Other minor | 17,744 | 2,307 | - | 20,051 | 622 | - | 20,673 | |||||||||||||||||||||
| 129,726 | 55,311 | - | 185,037 | 30,676 | - | 215,713 | ||||||||||||||||||||||
| Less - Allowance for deferred asset | (4,237 | ) | (13,929 | ) | - | (18,166 | ) | (18,846 | ) | - | (37,012 | ) | ||||||||||||||||
| 125,489 | 41,382 | - | 166,871 | 11,830 | - | 178,701 | ||||||||||||||||||||||
| Deferred asset included in retained earnings | ||||||||||||||||||||||||||||
| Derivative financial instruments | 2,540 | (2,664 | ) | 2,565 | 2,441 | - | (1,301 | ) | 1,140 | |||||||||||||||||||
| 128,029 | 38,718 | 2,565 | 169,312 | 11,830 | (1,301 | ) | 179,841 | |||||||||||||||||||||
| Deferred assets for mining royalties and special mining tax included in results | ||||||||||||||||||||||||||||
| Exploration expenses | 448 | (774 | ) | - | (326 | ) | 364 | - | 38 | |||||||||||||||||||
| Other minors | 366 | (181 | ) | - | 185 | (180 | ) | - | 5 | |||||||||||||||||||
| 814 | (955 | ) | - | (141 | ) | 184 | - | 43 | ||||||||||||||||||||
| Total deferred asset | 128,843 | 37,763 | 2,565 | 169,171 | 12,014 | (1,301 | ) | 179,884 | ||||||||||||||||||||
| Deferred liability for income tax included in results | ||||||||||||||||||||||||||||
| Effect of translation into U.S. dollars | (31,493 | ) | (42,044 | ) | - | (73,537 | ) | 3,012 | - | (70,525 | ) | |||||||||||||||||
| Differences in amortization rates for development costs | (37,849 | ) | 5,545 | (32,304 | ) | (19,484 | ) | - | (51,788 | ) | ||||||||||||||||||
| Other minors | (33,431 | ) | (1,958 | ) | 807 | (34,582 | ) | (9,403 | ) | - | (43,985 | ) | ||||||||||||||||
| (102,773 | ) | (38,457 | ) | 807 | (140,423 | ) | (25,875 | ) | - | (166,298 | ) | |||||||||||||||||
| Deferred liability for mining royalties and special mining tax | ||||||||||||||||||||||||||||
| Deemed cost of property, plant and equipment | (165 | ) | 153 | - | (12 | ) | 12 | - | - | |||||||||||||||||||
| Other minors | 176 | - | - | 176 | (211 | ) | - | (35 | ) | |||||||||||||||||||
| 11 | 153 | - | 164 | (199 | ) | - | (35 | ) | ||||||||||||||||||||
| Total deferred liability | (102,762 | ) | (38,304 | ) | 807 | (140,259 | ) | (26,074 | ) | - | (166,333 | ) | ||||||||||||||||
| Deferred income tax asset, net | 26,081 | (541 | ) | 3,372 | 28,912 | (14,060 | ) | (1,301 | ) | 13,551 | ||||||||||||||||||
| F- 77 |
Notes to the consolidated financial statements (continued)
| (b) | The deferred tax asset is presented in the consolidated statement of financial position: |
| 2016 | 2015 | |||||||
| US$(000) | US$(000) | |||||||
| Deferred income tax asset, net | 25,881 | 41,574 | ||||||
| Deferred income tax liability, net | (12,330 | ) | (12,662 | ) | ||||
| 13,551 | 28,912 | |||||||
| (c) | The following is the composition of the provision for income taxes shown in the consolidated statement of income for the years 2016, 2015 and 2014: |
| 2016 | 2015 | 2014 | ||||||||||
| US$(000) | US$(000) | US$(000) | ||||||||||
| Income tax | ||||||||||||
| Current | (39,444 | ) | (14,222 | ) | (18,815 | ) | ||||||
| Deferred | (14,060 | ) | (541 | ) | (47,006 | ) | ||||||
| (53,504 | ) | (14,763 | ) | (65,821 | ) | |||||||
| (d) | Below is a reconciliation of tax expense and the accounting profit multiplied by the statutory tax rate for the years 2016, 2015 and 2014: |
| 2016 | 2015 | 2014 | ||||||||||
| US$(000) | US$(000) | US$(000) | ||||||||||
| Loss before income tax | (255,237 | ) | (340,549 | ) | 10,011 | |||||||
| Loss before income tax for discontinued operations | (19,073 | ) | (20,230 | ) | (5,618 | ) | ||||||
| Loss before income tax | (274,310 | ) | (360,779 | ) | 4,393 | |||||||
| Theoretical gain for income tax | (76,807 | ) | (101,018 | ) | 1,318 | |||||||
| Permanent items and others: | ||||||||||||
| Share in the results of associates | 102,290 | 48,545 | 22,380 | |||||||||
| Effect of translation into U.S. dollars | (3,012 | ) | 42,044 | 30,520 | ||||||||
| Impairment of deferred tax asset | 18,846 | 13,929 | - | |||||||||
| Effect of change in income tax rate net | (1,431 | ) | 2,347 | 327 | ||||||||
| Mining royalties and special mining tax | 247 | 663 | 418 | |||||||||
| Permanent items | 6,577 | 4,447 | 3,824 | |||||||||
| Income tax expense | 46,710 | 10,957 | 58,787 | |||||||||
| Mining Royalties and Special Mining Tax | 6,794 | 3,806 | 7,034 | |||||||||
| Total income tax | 53,504 | 14,763 | 65,821 | |||||||||
| F- 78 |
Notes to the consolidated financial statements (continued)
| (e) | Related to the investment in associates, the Group has not recognized a deferred income tax asset by US$257.5 million as of December 31, 2016 originated by the difference between the financial and taxable basis of these investments (US$94.5 million as of December 31, 2015). Management believes that the timing differences will be reversed in the future without taxable effects. There is no legal or contractual obligation that would require the Company’s Management to sell its investment in its associates (which event would result in a taxable capital gain based on current tax law). |
| 29. | Commitments and contingencies |
Commitments
| (a) | Environmental - |
The Group’s exploration and exploitation activities are subject to environmental protection standards.
Law No. 28090 regulates the obligations and procedures that must be met by the holders of mining activities for the preparation, filing and implementation of Mine Closure Plans, as well as the establishment of the corresponding environmental guarantees to secure fulfillment of the investments, subject to the principles of protection, preservation and recovery of the environment.
Law No. 28271 regulates environmental liabilities in mining activities. This Law has the objective of ruling the identification of mining activity’s environmental liabilities and financing the remediation of the affected areas. According to this law, environmental liabilities refer to the impact caused to the environment by abandoned or inactive mining operations.
The Group considers that the recorded liability is sufficient to meet the current regulatory environment in Peru.
| (b) | Leased concessions - |
The Group pays 10 percent on the valued production of mineral obtained from the concessions leased by Sindicato Minero Orcopampa S.A. This concession is in force until the year 2043. See note 24.
| (c) | Letter of guarantee granted by Buenaventura - |
Letter of guarantee - Huanza
On December 2, 2009, Banco de Credito del Perú signed a finance lease contract for US$119 million with Consorcio Energético de Huancavelica S.A., Empresa de Generación Huanza S.A. and Buenaventura. This financing is in favor of Empresa de Generación Huanza S.A., and is guaranteed by Buenaventura. On February 8, 2016, the bank released the guarantee granted by Buenaventura.
| F- 79 |
Notes to the consolidated financial statements (continued)
| (d) | Operating lease commitments (the Group as a lessee) - |
The Group has entered into operating leases on its administrative offices in Lima located in Las Begonias Street N°415, San Isidro, Lima, Peru, with a lease term of 10 years. The Group has the option to lease the assets for two additional term of 5 years each.
Future minimum rentals payable as of December 31, 2016 and 2015 are the following:
| 2016 | 2015 | |||||||
| US$(000) | US$(000) | |||||||
| Within one year | 1,543 | 1,543 | ||||||
| After one year but not more than five years | 6,173 | 6,173 | ||||||
| More than five years | 2,701 | 4,244 | ||||||
| 10,417 | 11,960 | |||||||
| (e) | Operating lease commitments (the Group as a lessor) - |
The Group leases for several of its assets. These leases have purchase options. Below is a table showing future minimum lease payments and the present value of these payments:
| 2016 | 2015 | |||||||||||||||
|
Minimum
payments |
Present
value of payments |
Minimum
payments |
Present
value of payments |
|||||||||||||
| US$(000) | US$(000) | US$(000) | US$(000) | |||||||||||||
| Within a year | 57,592 | 40,428 | 47,957 | 31,956 | ||||||||||||
| After one year but not more than five years | 318,643 | 281,192 | 366,637 | 321,685 | ||||||||||||
| Total minimum lease payments | 376,235 | 321,620 | 414,594 | 353,641 | ||||||||||||
| Less - amounts representing finance charges | (54,615 | ) | - | (60,953 | ) | - | ||||||||||
| Present value of minimum lease payments | 321,620 | 321,620 | 353,641 | 353,641 | ||||||||||||
Contingencies
| (f) | Legal procedures - |
Buenaventura -
Buenaventura is a party in legal procedures that have arisen in the normal course of its activities. Nevertheless, in the opinion of Buenaventura’s Management, none of these procedures, individually or as a whole, could result in material contingencies for the consolidated financial statements.
The possible contingencies amount to US$9.9 million and US$2.0 million as of December 31, 2016 and 2015, respectively .
| F- 80 |
Notes to the consolidated financial statements (continued)
Yanacocha -
Mercury spill in Choropampa
In June 2000, a transport contractor of Yanacocha spilled approximately 151 kilograms of elemental mercury near the town of Choropampa, Peru, which is located 53 miles (85 kilometers) southwest of the Yanacocha mine. Elemental mercury is not used in Yanacocha’s operations but is a by-product of gold mining and was sold to a Lima firm for use in medical instruments and industrial applications. A comprehensive health and environmental remediation program was undertaken by Yanacocha in response to the incident.
In August 2000, Yanacocha paid under protest a fine of S/1,740,000 (approximately US$0.5 million) to the Peruvian government. Yanacocha has entered into settlement agreements with a number of individuals impacted by the incident. As compensation for the disruption and inconvenience caused by the incident, Yanacocha entered into agreements with and provided a variety of public works in the three communities impacted by this incident. Yanacocha cannot predict the likelihood of additional expenditures related to this matter.
Additional lawsuits relating to the Choropampa incident were filed against Yanacocha in the local courts of Cajamarca, Peru, in May 2002 by over 900 Peruvian citizens. A significant number of the plaintiffs in these lawsuits entered into settlement agreements with Yanacocha prior to filing such claims. In April 2008, the Peruvian Supreme Court upheld the validity of these settlement agreements, which Yanacocha expects to result in the dismissal of all claims brought by previously settled plaintiffs. Yanacocha has also entered into settlement agreements with approximately 350 additional plaintiffs. The claims asserted by approximately 200 plaintiffs remain.
In 2011, Yanacocha was served with 23 complaints alleging grounds to nullify the settlements entered into between Yanacocha and the plaintiffs. Yanacocha has answered the complaints and the court has dismissed several of the matters and the plaintiffs have filed appeals. All appeals were referred to the Civil Court of Cajamarca, which affirmed the decisions of the lower court judge. The plaintiffs have filed appeals of such orders before the Supreme Court. Some of these appeals were dismissed by the Supreme Court in favor of Yanacocha and others are pending resolution. Yanacocha will continue to vigorously defend its position. Yanacocha cannot reasonably estimate the ultimate loss relating to such claims.
Conga Project Constitutional Claim
On October 18, 2012, Marco Antonio Arana Zegarra (“Marco Arana”) filed a constitutional claim against the Ministry of Energy and Mines and Yanacocha requesting the Court to order the suspension of the Conga project as well as to declare not applicable the October 27, 2010 Directorial Resolution No.351-2010-MEM/AM approving the Conga project Environmental Impact Assessment (“EIA”).
| F- 81 |
Notes to the consolidated financial statements (continued)
On October 23, 2012, a Cajamarca judge dismissed the claims based on formal grounds finding that: (i) plaintiffs had not exhausted previous administrative proceedings; (ii) the Directorial Resolution approving the Conga EIA is valid, and was not challenged when issued in the administrative proceedings; (iii) there was inadequate evidence to conclude that the Conga project is a threat to the constitutional right of living in an adequate environment and; (iv) the Directorial resolution approving the Conga project EIA does not guarantee that the Conga project will proceed, so there was no imminent threat to be addressed by the Court. The plaintiffs appealed the dismissal of the case. The Civil Court of the Superior Court of Cajamarca confirmed the above mentioned Resolution and the plaintiff presented an appeal.
On March 13, 2015, the Constitutional Court published its ruling stating that the case should be sent back to the first court with an order to formally admit the case and start the judicial process in order to review the claim and the proofs presented by the plaintiff. Yanacocha has answered the claim. Yanacocha cannot reasonably predict the outcome of this litigation.
Environmental contingencies
The Peruvian government agency responsible for environmental evaluation and inspection, Organismo Evaluacion y Fiscalizacion Ambiental (“OEFA”), conducts periodic reviews of the Yanacocha site. In 2011, 2012, 2013, the first quarter of 2015, second, third and fourth quarters of 2016 and January 2017, OEFA issued notices of alleged violations of OEFA standards to Yanacocha and Conga relating to past inspections. OEFA has resolved some alleged violations with minimal or no findings. In the first quarter of 2015 and the fourth quarter of 2016, the water authority of Cajamarca issued notices of alleged regulatory violations, and resolved some allegations in early 2017 with no findings. The experience with OEFA and the water authority is that in the case of a finding of violation, remedial action is often the outcome rather than a significant fine.
The alleged OEFA violations currently range from zero to 101,730 units and the water authority alleged violations range from zero to 40,000 units, with each unit having a potential fine equivalent to approximately US$1,200 based on current exchange rates. Yanacocha and Conga are responding to all notices of alleged violations, but cannot reasonably predict the outcome of the agency allegations.
| (g) | Open tax procedures - |
Buenaventura -
| - | During 2012 and 2014, the tax authority (SUNAT) reviewed the income tax for 2007 and 2008. As a result, SUNAT do not recognize tax declared deductions by S/1,056,310,000 (equivalent to US$ 314,375,000 ) in 2007 and S/1,530,985,000 (equivalent to US$ 455,650,000 ) in 2008. The main unrecognized deduction is the payment made for the removal of the price component of its commercial contracts of gold. In the opinion of management and its legal counsel, the objections are unfounded so Buenaventura should get a favorable result in the initiated claim process. |
| F- 82 |
Notes to the consolidated financial statements (continued)
| - | During 2015, SUNAT reviewed the income tax of 2009 and 2010. As a result, they did not recognize Buenaventura declared tax deductions by S/76,023,000 (equivalent to US$ 22,626,000 ). The main unrecognized deductions by Buenaventura are: the non-deductibility of bonuses paid to contractors, a provision of doubtful accounts not accepted as an expense and income unduly deducted. The possible contingencies for the years 2009 and 2010 amount to S/567,794,000 (equivalent to US$168,986,000 ) as of December 31, 2016. In the opinion of Management and its legal counsel, Buenaventura should get a favorable result in the initiated claim process. |
Subsidiaries -
| - | During 2015, the tax authorities reviewed the income tax of the subsidiary Buenaventura Ingenieros S.A (BISA) for the fiscal years 2011 and 2012. The main unrecognized deductions are related to the deduction of bonuses paid to staff for S/12,611,000 (equivalent to US$3,753,000) as well as the omission of income from transfer of fuel to suppliers, amounting to S/8,323,000 (equivalent to US$2,477,000). In addition, SUNAT requires the payment of the value added tax related to allegedly omitted revenues in the transfer of fuel to suppliers for S/8,323,000 (equivalent to US$2,477,000). BISA initiated claim process for the above assessments. |
| - | During 2016 Tax Authorities have resolved the claim process, maintaining the assessment related to the omission of income from transfer of fuel to suppliers. |
The possible contingencies for income tax for the years 2011 and 2012 amount to S/5,230,000 (equivalent to US$1,556,000) and for the value added tax amount to S/3,455,000 (US$1,028,000) as of December 31, 2016. In the opinion of Management of this subsidiary and its legal advisors, BISA should get a favorable result in the initiated claim process initiated in 2016.
On May 30, 2014, the Tax Authority issued tax and fines assessments for the 2011 income tax of the subsidiary Sociedad Minera El Brocal S.A.A. (El Brocal). Within the terms of law, El Brocal filed an appeal that is pending resolution to date. It should be noted that on June 18, 2014, El Brocal decided to pay under protest the income tax assessment by S/8,333,000 (equivalent to US$2,480,000) so it can have access to a discount benefit of the fine. This payment is recorded as an account receivable.
| - | On January 8, 2015, the Tax Administration notified to the subsidiary El Brocal a resolution of determination as a result of the inspection for the 2012 income tax. SUNAT claimed and resolved the nullity of it; In addition, SUNAT notified the resolution and fines for payments on account from January to December 2012, which amount to S/3,996,000 (equivalent to US$1,189,000). El Brocal has filed an appeal to the Tax Court, which is pending resolution. |
El Brocal's legal advisors believe that the outcome of these proceedings will be favorable and, therefore, it is not necessary to recognize a provision for these contingencies.
| F- 83 |
Notes to the consolidated financial statements (continued)
| - | During 2015 the tax authority audited the 2014 income tax of the subsidiary Empresa de Generación Huanza S.A. As a consequence, a portion of the depreciation of its fixed assets is not recognized for S/27,532,000 (equivalent to US$8,194,000). In the opinion of the Management and its legal advisors, this interpretation has no basis and therefore, Huanza would obtain a favorable result in the appeal process that has begun. |
| - | In addition, the Tax Authority has issued tax assessments as a result of the audit of income taxes of other subsidiaries of the Company for S/8,922,000 (equivalent to US$2,655,000). In the opinion of the Management and its legal advisors, the assessments are of possible occurrence; however, the subsidiaries expect to obtain a favorable outcome in the appeal processes initiated. |
Associates -
Cerro Verde -
Mining Royalties
SUNAT, the Peruvian tax authority, has assessed mining royalties on materials processed by Cerro Verde´s concentrator, which commenced operations in late 2006. These assessments cover the period December 2006 to December 2007, and the years 2008 and September 2011. SUNAT issued resolutions declaring the claims of Cerro Verde unfounded for the periods 2006 to 2009 . Cerro Verde appealed those decisions to the Tax Court . In July 23, 2013, the Peruvian Tax Tribunal issued two decisions affirming assessments for the period December 2006 through December 2008. Decisions by the Tax Tribunal ended the administrative stage of the appeal procedures for these assessments.
In September 18, 2013, Cerro Verde filed two administrative contentious claims before the Judiciary against the decisions of the Tax Court that dismiss the appeals presented. In relation to the periods 2006 and 2007, the 20th Administrative Court Specialized in Tax matters dismissed the claim filed. On May 2, 2016, Cerro Verde filed an appeal with the 7th Administrative Court.
In September 2013, Cerro Verde filed judiciary appeals to the Judicial Branch (Civil Court of the Superior Court of Justice of Arequipa), suing SUNAT, the Ministry of Energy and Mines and the Tax Court for requiring Cerro Verde to pay mining royalties during the period of Stability Contract in effect until December 31, 2013. Cerro Verde believes that said Stability Contract entered into with the Peruvian State in 1998 (which was effective as of January 1, 1999 and expires on December 31, 2013), guarantees that all the minerals extracted from its production unit are included in the stabilized tax and administrative regime, which does not include the payment obligation of the mining royalties . On September 15, 2016, Judiciary court dismissed the constitutional claim and on October 25, 2016, Cerro Verde appealed this decision.
With respect to the judiciary appeal related to the assessment for the year 2008, on December 17, 2014, the Eighteenth Contentious Administrative Court rendered its decision upholding the Company’s position and nullifying SUNAT’s assessment and the Tax Tribunal´s resolution (S/106.4 million). In December 2014, SUNAT and the Tax Court appealed this decision. The Court’s position also invalidates all penalties and interest assessed by SUNAT for that period, amounting to S/139.7 million. On January 29, 2016, the Sixth Superior Justice Court nullified the decision of the Eighteenth Contentious Administrative Court. On February 23, 2016, Cerro Verde appealed the decision to the Supreme Court.
| F- 84 |
Notes to the consolidated financial statements (continued)
On October 1, 2013, SUNAT served Cerro Verde a demand for payment totaling S/492 million (approximately US$146 million based on the December 31, 2016 exchange rate, including interest and penalties of US$86 million) based on the Tax Tribunal’s decisions for the period December 2006 to December 2008. As permitted by law, Cerro Verde requested, and was granted, an installment payment program that deferred payment for six months and thereafter satisfies the amount via 66 equal monthly payments. As of December 31, 2016, Cerro Verde has made payments totaling S/323 million (US$104 million based on the date of payment and US$96 million based on December 31, 2016 exchange rates) under the installment program, which are presented in the non-current portion of other non-financial assets in the statements of financial position. Based on the results rendered on December 17, 2014 by the Eighteenth Contentious Administrative Court as is described in the previous paragraph, Cerro Verde requested an injunction that was accepted by the Judiciary and implied a modification of the installment program excluding the 2008 portion through SUNAT´s resolution notified to Cerro Verde on October 29, 2015. On August 18, 2016, the Sixth Superior Justice Court nullified the injunction described above and on September 28, 2016, SUNAT modified the Installment payment program to include the 2008 portion.
| - | In July 2013, a hearing on SUNAT's assessment for 2009 was held, but no decision has been issued by the Tax Tribunal for that year. As of December 31, 2016, the amount of the assessment, including interest and penalties, for the year 2009 was S/268 million (approximately US$80 million based on the December 31, 2016 exchange rate). |
| - | On April 13, 2016, Cerro Verde received assessments from SUNAT for the year 2010 and for January to September 2011. On May 11, 2016, Cerro Verde appealed these assessments. At December 31, 2016, the amount of assessments from SUNAT including interest and penalties for the years 2010 and January to September 2011 is S/543 million (approximately US$162 million based on the December 31, 2016 exchange rate). |
As of December 31, 2016, Cerro Verde estimates that the total exposure associated with mining royalties for the period from December 2006 to December 2013, including interest and penalties, totals US$544 million (based on the December 31, 2016 exchange rate).
As of December 31, 2016, no provisions were recorded for these assessments or for the amounts paid under the installment payment program because management and its external legal advisors believe Cerro Verde’s Stability Agreement exempted it from these royalties and believes that the resolution will be favorable to Cerro Verde and any payments should be recoverable.
| F- 85 |
Notes to the consolidated financial statements (continued)
Other taxes
Cerro Verde has also received assessments from SUNAT for additional taxes (other than the mining royalty), including penalties and interest. Cerro Verde has filed or will file objections to the assessments because it believes it has properly determined and paid its taxes. A summary of these assessments follows:
| Year | Taxes |
Penalty and
interest |
Total | |||||||||
| US$(000) | US$(000) | US$(000) | ||||||||||
| 2002 – 2005 | 15,909 | 51,495 | 67,404 | |||||||||
| 2006 | 6,545 | 49,491 | 56,036 | |||||||||
| 2007 | 12,376 | 17,809 | 30,185 | |||||||||
| 2008 | 20,797 | 12,968 | 33,765 | |||||||||
| 2009 | 56,198 | 47,719 | 103,917 | |||||||||
| 2010 | 65,997 | 98,284 | 164,281 | |||||||||
| 2011 | 6,332 | 2,648 | 8,980 | |||||||||
| 2014 - 2016 | 15,909 | - | 15,909 | |||||||||
| 200,063 | 280,414 | 480,477 | ||||||||||
As of December 31, 2016, Cerro Verde has paid US$180.7 million for these disputed tax assessments, which it believes is collectible. No amounts have been accrued for these assessments.
Yanacocha -
| - | SUNAT challenged the withholding tax rate applied on the technical assistance services provided by non-resident supplier. The services were executed in Peru and also abroad; however, Yanacocha was not able to prove it during the tax audit. Based on that, SUNAT considers that the services were wholly executed in Peru; hence, the withholding tax rate must be 30% instead of 12%. The amount of the contingency involved is S/12.7 million (US$ 3.8 million). |
| - | SUNAT considers that the bonus for closing the collective agreement and the collateral benefits granted to the unionized and non-unionized employees qualify as remunerative concepts; hence, taxed with the contribution to ESSALUD. The contingency amounts to S/10.6 million (US$3.2 million). |
In Management's and its legal counsel’s opinion, that interpretation has no support so Yanacocha should get a favorable outcome in the appeal initiated.
| F- 86 |
Notes to the consolidated financial statements (continued)
| 30. | Transactions with associates companies |
| (a) | The Group has carried out the following transactions with its associates in the years 2016, 2015 and 2014: |
| 2016 | 2015 | 2014 | ||||||||||
| US$(000) | US$(000) | US$(000) | ||||||||||
| Royalties collected to Minera Yanacocha S.R.L.: | ||||||||||||
| S.M.R.L. Chaupiloma Dos de Cajamarca (c) | 24,339 | 32,414 | 36,867 | |||||||||
| Services provided to Minera Yanacocha S.R.L. by: | ||||||||||||
| Consorcio Energético de Huancavelica S.A. (electric power transmission) | 915 | 1,694 | 915 | |||||||||
| Buenaventura Ingenieros S.A (execution of specific work orders) | 177 | 845 | 699 | |||||||||
| Dividends received by: | ||||||||||||
| Minera Yanacocha S.R.L. | 130,950 | - | - | |||||||||
| Compañía Minera Coimolache S.A. | 11,390 | 6,691 | 12,938 | |||||||||
| Loans granted to: | ||||||||||||
| Sociedad Minera Cerro Verde S.A.A. | - | 124,800 | - | |||||||||
| Sales of supplies to Compañía Minera Coimolache S.A. by: | ||||||||||||
| Compañía de Minas Buenaventura S.A.A. | 1 | 56 | 913 | |||||||||
| Minera La Zanja S.R.L. | - | 74 | 10 | |||||||||
| Sales of mineral to Minera Yanacocha S.R.L. by: | ||||||||||||
| Compañía de Minas Buenaventura S.A.A. | 1,271 | 2,114 | 3,258 | |||||||||
| Interest income over loans granted by Compañía Minera Coimolache S.A. to: | ||||||||||||
| Consorcio Energético de Huancavelica S.A.A. | 3 | 19 | 35 | |||||||||
| Supplies purchase to Compañía Minera Coimolache S.A. by: | ||||||||||||
| Minera La Zanja S.R.L. | 12 | 6 | 24 | |||||||||
| Compañía de Minas Buenaventura S.A.A. | 1 | 29 | 6 | |||||||||
| Consorcio Energético de Huancavelica S.A.A. | 10 | 1 | - | |||||||||
| Contributions and investments made to: | ||||||||||||
| Canteras del Hallazgo S.A.C. | - | - | 2,012 | |||||||||
| F- 87 |
Notes to the consolidated financial statements (continued)
| 2016 | 2015 | 2014 | ||||||||||
| US$(000) | US$(000) | US$(000) | ||||||||||
| Interest income over loans granted by associates | 4,164 | 2,286 | 2,887 | |||||||||
| Services provided to Compañía Minera Coimolache S.A. by: | ||||||||||||
| Empresa de Generación Huanza S.A. (sale of energy) | 1,679 | 1,676 | 233 | |||||||||
| Consorcio Energético de Huancavelica S.A. (construction services) | 1,152 | 346 | - | |||||||||
| Buenaventura Ingenieros S.A (execution of specific work orders) | 824 | 471 | 589 | |||||||||
| Consorcio Energético de Huancavelica S.A. (electric power transmission) | 332 | 559 | 542 | |||||||||
| (b) | As a result of the transactions indicated in the paragraph (a), the Group had the following accounts receivable and payable from/to associates: |
| 2016 | 2015 | |||||||
| US$(000) | US$(000) | |||||||
| Trade and other receivables, note 8(a) - | ||||||||
| Trade receivables | ||||||||
| Minera Yanacocha S.R.L. (c) | 7,079 | 8,760 | ||||||
| Compañía Minera Coimolache S.A. | 681 | 666 | ||||||
| 7,760 | 9,426 | |||||||
| Other receivables | ||||||||
| Sociedad Minera Cerro Verde S.A.A. (d) | 126,050 | 124,988 | ||||||
| Minera Yanacocha S.R.L. | 379 | - | ||||||
| Compañía Minera Coimolache S.A. | 240 | 499 | ||||||
| 126,669 | 125,487 | |||||||
| Total trade and other receivables | 134,429 | 134,913 | ||||||
| Classification by maturity: | ||||||||
| Current portion | 8,379 | 9,925 | ||||||
| Non-current portion | 126,050 | 124,988 | ||||||
| Total trade and other receivables | 134,429 | 134,913 | ||||||
| F- 88 |
Notes to the consolidated financial statements (continued)
| 2016 | 2015 | |||||||
| US$(000) | US$(000) | |||||||
| Trade and other payables, note 15(a) - | ||||||||
| Trade payables | ||||||||
| Compañía Minera Coimolache S.A. | 25 | 892 | ||||||
| Minera Yanacocha S.R.L. | 1,347 | 283 | ||||||
| 1,372 | 1,175 | |||||||
| Other payables | ||||||||
| Compañía Minera Coimolache S.A. | 3 | - | ||||||
| Total trade and other payables | 1,375 | 1,175 | ||||||
| (c) | S.M.R.L. Chaupiloma Dos de Cajamarca - |
In accordance with mining lease, amended and effective on January 1, 1994, Minera Yanacocha S.R.L. pays the Group a 3% royalty based on quarterly production sold at current market prices, after deducting refinery and transportation costs. The royalty agreement expires in 2032.
| (d) | Sociedad Minera Cerro Verde S.A. - |
In December 2014, Cerro Verde entered into shareholder loan agreements with, or affiliates of, Freeport Minerals Corporation, Compañía de Minas Buenaventura S.A.A. and SMM Cerro Verde Netherlands B.V., for up to US$800 million. As of December 31, 2016, Cerro Verde had borrowed US$606 million under these loan agreements (US$800 million under these loan agreements as of December 31,2015), US$125 million with Buenaventura as of December 31, 2016. Interest rate is variable (currently 3.08%). The loans mature on December 22, 2019, unless at that time there is senior financing associated with the expansion project that is senior to the loans, in which case the loans mature two years following the maturity of the senior financing.
| (e) | Key officers - |
As of December 31, 2016 and 2015, directors, officers and employees of the Group have been involved, directly and indirectly, in financial transactions with certain subsidiaries. As of December 2016 and 2015, loans to employees, directors and key personnel amounts to US$91,000 and US$61,000, respectively, are paid monthly and earn interest at market rates.
There are no loans to the Group’s directors and key personnel guaranteed with Buenaventura or any of its Subsidiaries’ shares.
| F- 89 |
Notes to the consolidated financial statements (continued)
The Group’s key executives’ compensation (including the related income taxes assumed by the Group) as of December 31, 2016, and 2015 are presented below:
| 2016 | 2015 | |||||||
| US$(000) | US$(000) | |||||||
| Accounts payable: | ||||||||
| Salaries | 1,034 | 3,381 | ||||||
| Directors’ compensations | 1,016 | 1,047 | ||||||
| Share-based compensation plans | 598 | 330 | ||||||
| Total | 2,648 | 4,758 | ||||||
| Disbursements: | ||||||||
| Salaries | 9,922 | 7,864 | ||||||
| Total | 9,922 | 7,864 | ||||||
| 31. | Disclosure of information on segments |
Management has determined its operating segments based on reports that the Group’s Chief Operating Decision Maker (CODM) uses for making decisions. The Group is organized into business units based on its products and services, activities and geographic locations. The broad categories of the Group’s business units are:
| - | Production and sale of minerals |
| - | Exploration and development activities |
| - | Construction and engineering services |
| - | Energy generation and transmission services |
| - | Insurance brokerage |
| - | Rental of mining concessions |
| - | Holding of investment in shares (mainly in the associate company Minera Yanacocha S.R.L. and the Group’s subsidiary S.M.R.L. Chaupiloma Dos de Cajamarca) |
| - | Industrial activities. |
The CODM monitors the operating results of the business units separately for the purpose of making decisions about resource allocation and performance assessment. Segment performance is evaluated based on operating profit or loss and is measured consistently with operating profit or loss in the Group’s consolidated financial statements. Also, the Group’s financing and income taxes are managed at the corporate level and are not allocated to the operating segments, except for those entities which are managed independently.
Corporate information mainly includes the following:
In segment information of profit and loss -
| - | Sales to third parties of gold purchased by the Parent company from La Zanja mining unit and the corresponding cost of sale as well as other intercompany sales. |
| - | Administrative expenses, other income (expenses), exchange gain (loss), finance costs and income and income tax that cannot be directly allocated to the operational mining units owned by the Parent company (Uchucchacua, Orcopampa, Julcani, and Mallay). |
| F- 90 |
Notes to the consolidated financial statements (continued)
| - | Exploration activities in non-operating areas, carried out directly by the Parent company and not by the consolidated separate legal entities. |
| - | Participation in subsidiaries and associate companies of the Parent company, which are accounted for using the equity method. |
| - | Gain on business combination occurred in 2014, see note 5 to the consolidated financial statements. |
In the segment information of assets and liabilities –
| - | Investments in Sociedad Minera Cerro Verde S.A.A. and Compañía Minera Coimolache S.A., associate companies which are directly owned by the Parent company and are accounted for using the equity method; see note 11 to the consolidated financial statements. |
| - | Assets and liabilities of the operational mining units owned directly by the Parent company since this is the way the CODM analyzes the business. Assets and liabilities of other operating segments are allocated based on the assets and liabilities of the legal entities included in those segments. |
Adjustments and eliminations mainly include the following:
In segment information of consolidated statements of profit and loss –
| - | The elimination of any profit or loss of investments accounted for under the equity method and not consolidated by the Group corresponding to the associate companies: Minera Yanacocha S.R.L., Sociedad Minera Cerro Verde S.A.A. and Compañía Minera Coimolache S.A. |
| - | The elimination of intercompany sales and cost of sales. |
| - | The elimination of any equity pickup profit or loss of the subsidiaries of the Parent company. |
In the segment information of assets and liabilities –
| - | The elimination of the assets and liabilities of the investments accounted for under the equity method and not consolidated, corresponding to the associate companies: Minera Yanacocha S.R.L., Sociedad Minera Cerro Verde S.A.A. and Compañía Minera Coimolache S.A. |
| - | The elimination of any equity pickup investments of the subsidiaries of the Parent company. |
| - | The elimination of intercompany receivables and payables. |
Refer to Note 21(a) to the consolidated financial statements where the Group reports revenues from external customers for each product and service, and revenues from external customers attributed to Peru and foreign countries. The revenue information is based on the locations of customers.
Refer to Note 21(b) to the consolidated financial statements for information about major customers (clients representing more than 72 percent of the Group’s revenues).
All non-current assets are located in Peru.
| F- 91 |
Notes to the consolidated financial statements (continued)
| Equity accounted investees | ||||||||||||||||||||||||||||||||||||||||||||||||||||||||||||||||||||||||||||||||
|
Ucchuchacua
(Operation) |
Orcopampa
(Operation) |
Julcani
(Operation) |
Mallay
(Operation) |
Colquijirca
(Operation) |
La Zanja
(Operation) |
Exploration
and development mining projects |
Construction
and engineering |
Energy
generation and transmission |
Insurance
brokerage |
Rental of
mining concessions |
Holding of
investment in shares |
Industrial
activities |
Corporate |
Minera
Yanacocha S.R.L. |
Sociedad
Minera Cerro Verde S.A.A |
Compañía
Minera Coimolache S.A. |
Total
operating segments |
Adjustments and
eliminations |
Total | |||||||||||||||||||||||||||||||||||||||||||||||||||||||||||||
| US$(000) | US$(000) | US$(000) | US$(000) | US$(000) | US$(000) | US$(000) | US$(000) | US$(000) | US$(000) | US$(000) | US$(000) | US$(000) | US$(000) | US$(000) | US$(000) | US$(000) | US$(000) | US$(000) | US$(000) | |||||||||||||||||||||||||||||||||||||||||||||||||||||||||||||
| Year 2016 | ||||||||||||||||||||||||||||||||||||||||||||||||||||||||||||||||||||||||||||||||
| Results: | ||||||||||||||||||||||||||||||||||||||||||||||||||||||||||||||||||||||||||||||||
| Continuing operations | ||||||||||||||||||||||||||||||||||||||||||||||||||||||||||||||||||||||||||||||||
| Operating income | ||||||||||||||||||||||||||||||||||||||||||||||||||||||||||||||||||||||||||||||||
| Net sale of goods | 240,470 | 244,745 | 54,666 | 46,741 | 230,611 | 178,922 | - | - | - | - | - | - | 5,982 | 191,075 | 761,193 | 2,384,154 | 198,873 | 4,537,432 | (3,521,762 | ) | 1,015,670 | |||||||||||||||||||||||||||||||||||||||||||||||||||||||||||
| Net sale of services | - | - | - | - | - | - | - | 12,633 | 57,312 | 12,675 | - | 615 | 19,507 | - | 17,713 | - | - | 120,455 | (91,673 | ) | 28,782 | |||||||||||||||||||||||||||||||||||||||||||||||||||||||||||
| Royalty income | - | - | - | - | - | - | - | - | - | - | 24,339 | - | - | - | - | - | - | 24,339 | - | 24,339 | ||||||||||||||||||||||||||||||||||||||||||||||||||||||||||||
| Total operating income | 240,470 | 244,745 | 54,666 | 46,741 | 230,611 | 178,922 | 12,633 | 57,312 | 12,675 | 24,339 | 615 | 25,489 | 191,075 | 778,906 | 2,384,154 | 198,873 | 4,682,226 | (3,613,435 | ) | 1,068,791 | ||||||||||||||||||||||||||||||||||||||||||||||||||||||||||||
| Operating costs | ||||||||||||||||||||||||||||||||||||||||||||||||||||||||||||||||||||||||||||||||
| Cost of sales of goods | (118,561 | ) | (97,325 | ) | (23,633 | ) | (23,392 | ) | (178,231 | ) | (80,873 | ) | - | - | - | - | - | - | (2,962 | ) | (190,041 | ) | (725,740 | ) | (1,553,040 | ) | (107,913 | ) | (3,101,711 | ) | 2,603,899 | (497,812 | ) | |||||||||||||||||||||||||||||||||||||||||||||||
| Cost of services | - | - | - | - | - | - | - | (9,732 | ) | (25,250 | ) | - | - | - | (8,723 | ) | - | (2,951 | ) | - | - | (46,656 | ) | 35,902 | (10,754 | ) | ||||||||||||||||||||||||||||||||||||||||||||||||||||||
| Exploration in operating units | (31,406 | ) | (45,111 | ) | (11,069 | ) | (7,960 | ) | - | (603 | ) | - | - | - | - | - | - | - | - | - | - | - | (96,149 | ) | - | (96,149 | ) | |||||||||||||||||||||||||||||||||||||||||||||||||||||
| Depreciation and amortization | (18,541 | ) | (11,403 | ) | (6,756 | ) | (11,393 | ) | (53,637 | ) | (67,542 | ) | (27 | ) | (253 | ) | (10,904 | ) | - | (16 | ) | (221 | ) | (10,968 | ) | (986 | ) | - | - | - | (192,647 | ) | - | (192,647 | ) | |||||||||||||||||||||||||||||||||||||||||||||
| Mining royalties | (1,687 | ) | (21,482 | ) | (381 | ) | (314 | ) | (2,726 | ) | (1,021 | ) | - | - | - | - | - | - | - | - | - | - | - | (27,611 | ) | - | (27,611 | ) | ||||||||||||||||||||||||||||||||||||||||||||||||||||
| Total operating costs | (170,195 | ) | (175,321 | ) | (41,839 | ) | (43,059 | ) | (234,594 | ) | (150,039 | ) | (27 | ) | (9,985 | ) | (36,154 | ) | - | (16 | ) | (221 | ) | (22,653 | ) | (191,027 | ) | (728,691 | ) | (1,553,040 | ) | (107,913 | ) | (3,464,774 | ) | 2,639,801 | (824,973 | ) | ||||||||||||||||||||||||||||||||||||||||||
| Gross profit (loss) | 70,275 | 69,424 | 12,827 | 3,682 | (3,983 | ) | 28,883 | (27 | ) | 2,648 | 21,158 | 12,675 | 24,323 | 394 | 2,836 | 48 | 50,215 | 831,114 | 90,960 | 1,217,452 | (973,634 | ) | 243,818 | |||||||||||||||||||||||||||||||||||||||||||||||||||||||||
| Operating expenses, net | ||||||||||||||||||||||||||||||||||||||||||||||||||||||||||||||||||||||||||||||||
| Administrative expenses | (13,265 | ) | (13,810 | ) | (4,582 | ) | (2,708 | ) | (11,802 | ) | (1,980 | ) | (7,024 | ) | (4,492 | ) | (2,450 | ) | (12,245 | ) | (112 | ) | (227 | ) | (635 | ) | (12,083 | ) | (8,780 | ) | - | (4,144 | ) | (100,339 | ) | 18,647 | (81,692 | ) | ||||||||||||||||||||||||||||||||||||||||||
| Exploration in non-operating areas | - | - | - | - | (1,939 | ) | (4,619 | ) | (17,102 | ) | - | - | - | - | - | - | (4,129 | ) | - | - | - | (27,789 | ) | 1,200 | (26,589 | ) | ||||||||||||||||||||||||||||||||||||||||||||||||||||||
| Selling expenses | (4,632 | ) | (1,075 | ) | (845 | ) | (1,549 | ) | (10,650 | ) | (938 | ) | - | - | (1,124 | ) | - | - | - | (1,154 | ) | (115 | ) | (3,695 | ) | (131,391 | ) | (1,128 | ) | (158,296 | ) | 136,563 | (21,733 | ) | ||||||||||||||||||||||||||||||||||||||||||||||
| Impairment loss of long-lived assets | - | - | - | - | - | - | - | - | - | - | - | - | - | - | (889,499 | ) | - | - | (889,499 | ) | 889,499 | - | ||||||||||||||||||||||||||||||||||||||||||||||||||||||||||
| Other, net | 2,265 | 764 | (556 | ) | (323 | ) | 276 | 4,237 | 1,271 | 1,912 | 10,527 | - | 11 | (16 | ) | 546 | 9,169 | (122,151 | ) | (24,107 | ) | 755 | (115,420 | ) | 133,812 | 18,392 | ||||||||||||||||||||||||||||||||||||||||||||||||||||||
| Total operating expenses, net | (15,632 | ) | (14,121 | ) | (5,983 | ) | (4,580 | ) | (24,115 | ) | (3,300 | ) | (22,855 | ) | (2,580 | ) | 6,953 | (12,245 | ) | (101 | ) | (243 | ) | (1,243 | ) | (7,158 | ) | (1,024,125 | ) | (155,498 | ) | (4,517 | ) | (1,291,343 | ) | 1,179,721 | (111,622 | ) | ||||||||||||||||||||||||||||||||||||||||||
| Operating profit (loss) | 54,643 | 55,303 | 6,844 | (898 | ) | (28,098 | ) | 25,583 | (22,882 | ) | 68 | 28,111 | 430 | 24,222 | 151 | 1,593 | (7,110 | ) | (973,910 | ) | 675,616 | 86,443 | (73,891 | ) | 206,087 | 132,196 | ||||||||||||||||||||||||||||||||||||||||||||||||||||||
| Other income (expense),net | ||||||||||||||||||||||||||||||||||||||||||||||||||||||||||||||||||||||||||||||||
| Share in the results of associates under equity method | - | - | - | - | - | - | - | - | 4,579 | (9 | ) | - | (448,017 | ) | - | (370,381 | ) | - | - | - | (813,828 | ) | 448,507 | (365,321 | ) | |||||||||||||||||||||||||||||||||||||||||||||||||||||||
| Finance costs | (379 | ) | (197 | ) | (87 | ) | (41 | ) | (12,554 | ) | (2,614 | ) | (300 | ) | (545 | ) | (10,564 | ) | (10 | ) | (2 | ) | (14 | ) | (962 | ) | (5,156 | ) | (15,107 | ) | (80,438 | ) | (1,614 | ) | (130,584 | ) | 99,004 | (31,580 | ) | |||||||||||||||||||||||||||||||||||||||||
| Net gain (loss) from currency exchange difference | (203 | ) | (59 | ) | (61 | ) | (46 | ) | (270 | ) | 65 | 562 | 5 | (138 | ) | 426 | (93 | ) | 5 | 222 | 2,223 | (13,741 | ) | 7,857 | (117 | ) | (3,363 | ) | 6,001 | 2,638 | ||||||||||||||||||||||||||||||||||||||||||||||||||
| Finance income | 3 | 3 | 1 | - | 256 | 87 | - | 8 | 820 | 12 | - | 4 | 1 | 7,480 | 2,132 | 954 | 38 | 11,799 | (4,969 | ) | 6,830 | |||||||||||||||||||||||||||||||||||||||||||||||||||||||||||
| Total other income (expense), net | (579 | ) | (253 | ) | (147 | ) | (87 | ) | (12,568 | ) | (2,462 | ) | 262 | (532 | ) | (5,303 | ) | 419 | (95 | ) | (448,022 | ) | (739 | ) | (365,834 | ) | (26,716 | ) | (71,627 | ) | (1,693 | ) | (935,976 | ) | 548,543 | (387,433 | ) | |||||||||||||||||||||||||||||||||||||||||||
| Profit (loss) before income tax | 54,064 | 55,050 | 6,697 | (985 | ) | (40,666 | ) | 23,121 | (22,620 | ) | (464 | ) | 22,808 | 849 | 24,127 | (447,871 | ) | 854 | (372,944 | ) | (1,000,626 | ) | 603,989 | 84,750 | (1,009,867 | ) | 754,630 | (255,237 | ) | |||||||||||||||||||||||||||||||||||||||||||||||||||
| Income tax | (1,814 | ) | (1,895 | ) | (424 | ) | (365 | ) | 7,851 | (18,256 | ) | (245 | ) | (178 | ) | (9,224 | ) | (245 | ) | (6,761 | ) | - | 461 | (22,409 | ) | (43,126 | ) | (263,082 | ) | (27,894 | ) | (387,606 | ) | 334,102 | (53,504 | ) | ||||||||||||||||||||||||||||||||||||||||||||
| Profit (loss) from continued operations | 52,250 | 53,155 | 6,273 | (1,350 | ) | (32,815 | ) | 4,865 | (22,865 | ) | (642 | ) | 13,584 | 604 | 17,366 | (447,871 | ) | 1,315 | (395,353 | ) | (1,043,752 | ) | 340,907 | 56,856 | (1,397,473 | ) | 1,088,732 | (308,741 | ) | |||||||||||||||||||||||||||||||||||||||||||||||||||
| Loss from discontinued operations, see note 1(e) | (19,073 | ) | ||||||||||||||||||||||||||||||||||||||||||||||||||||||||||||||||||||||||||||||
| Net loss | (327,814 | ) | ||||||||||||||||||||||||||||||||||||||||||||||||||||||||||||||||||||||||||||||
| Total assets | 105,950 | 46,085 | 25,118 | 16,958 | 763,092 | 246,106 | 745,510 | 22,481 | 379,964 | 6,226 | 7,439 | 427,439 | 120,038 | 2,593,838 | 2,045,825 | 7,635,623 | 334,555 | 15,522,247 | (11,255,832 | ) | 4,266,415 | |||||||||||||||||||||||||||||||||||||||||||||||||||||||||||
| Total liability | 35,148 | 26,536 | 19,733 | 7,302 | 353,184 | 129,689 | 15,413 | 11,647 | 222,324 | 3,102 | 2,684 | 148 | 29,751 | 556,172 | 1,160,102 | 2,796,342 | 131,051 | 5,500,328 | (4,281,126 | ) | 1,219,202 | |||||||||||||||||||||||||||||||||||||||||||||||||||||||||||
| Other segment information | ||||||||||||||||||||||||||||||||||||||||||||||||||||||||||||||||||||||||||||||||
| Investment in associates | - | - | - | - | - | - | - | - | - | - | - | - | - | 1,536,607 | - | - | - | 1,536,607 | - | 1,536,607 | ||||||||||||||||||||||||||||||||||||||||||||||||||||||||||||
| Additions to mining concessions, development costs, property, plant and equipment | 28,899 | 3,452 | 759 | 2,729 | 51,289 | 14,995 | 255,673 | 27 | 4,236 | 39 | - | - | 3,719 | 1,017 | - | - | - | 366,834 | - | 366,834 | ||||||||||||||||||||||||||||||||||||||||||||||||||||||||||||
| F- 92 |
Notes to the consolidated financial statements (continued)
| Equity accounted investees | ||||||||||||||||||||||||||||||||||||||||||||||||||||||||||||||||||||||||||||||||
|
Ucchuchacua
(Operation) |
Orcopampa
(Operation) |
Julcani
(Operation) |
Mallay
(Operation) |
Colquijirca
(Operation) |
La Zanja
(Operation) |
Exploration
and development mining projects |
Construction
and engineering |
Energy
generation and transmission |
Insurance
brokerage |
Rental of
mining concessions |
Holding of
investment in shares |
Industrial
activities |
Corporate |
Minera
Yanacocha S.R.L. |
Sociedad
Minera Cerro Verde S.A.A |
Compañía
Minera Coimolache S.A. |
Total
operating segments |
Adjustments and
eliminations |
Total | |||||||||||||||||||||||||||||||||||||||||||||||||||||||||||||
| US$(000) | US$(000) | US$(000) | US$(000) | US$(000) | US$(000) | US$(000) | US$(000) | US$(000) | US$(000) | US$(000) | US$(000) | US$(000) | US$(000) | US$(000) | US$(000) | US$(000) | US$(000) | US$(000) | US$(000) | |||||||||||||||||||||||||||||||||||||||||||||||||||||||||||||
| Year 2015 | ||||||||||||||||||||||||||||||||||||||||||||||||||||||||||||||||||||||||||||||||
| Results: | ||||||||||||||||||||||||||||||||||||||||||||||||||||||||||||||||||||||||||||||||
| Continuing operations | ||||||||||||||||||||||||||||||||||||||||||||||||||||||||||||||||||||||||||||||||
| Operating income | ||||||||||||||||||||||||||||||||||||||||||||||||||||||||||||||||||||||||||||||||
| Net sale of goods | 166,055 | 254,118 | 50,254 | 32,018 | 171,294 | 161,007 | - | - | - | - | - | - | 3,649 | 168,667 | 1,031,174 | 1,115,617 | 177,347 | 3,331,200 | (2,484,931 | ) | 846,269 | |||||||||||||||||||||||||||||||||||||||||||||||||||||||||||
| Net sale of services | - | - | - | - | - | - | - | 48,758 | 48,339 | 11,929 | - | - | 13,399 | - | 10,625 | - | - | 133,050 | (82,211 | ) | 50,839 | |||||||||||||||||||||||||||||||||||||||||||||||||||||||||||
| Royalty income | - | - | - | - | - | - | - | - | - | - | 32,414 | - | - | - | - | - | - | 32,414 | - | 32,414 | ||||||||||||||||||||||||||||||||||||||||||||||||||||||||||||
| Total operating income | 166,055 | 254,118 | 50,254 | 32,018 | 171,294 | 161,007 | - | 48,758 | 48,339 | 11,929 | 32,414 | - | 17,048 | 168,667 | 1,041,799 | 1,115,617 | 177,347 | 3,496,664 | (2,567,142 | ) | 929,522 | |||||||||||||||||||||||||||||||||||||||||||||||||||||||||||
| Operating costs | ||||||||||||||||||||||||||||||||||||||||||||||||||||||||||||||||||||||||||||||||
| Cost of sales of goods | (126,728 | ) | (112,707 | ) | (26,725 | ) | (20,709 | ) | (158,804 | ) | (106,750 | ) | - | - | - | - | - | - | - | (169,236 | ) | (751,736 | ) | (862,004 | ) | (104,549 | ) | (2,439,948 | ) | 1,926,458 | (513,490 | ) | ||||||||||||||||||||||||||||||||||||||||||||||||
| Cost of services | - | - | - | - | - | - | - | (48,544 | ) | (20,767 | ) | - | - | - | (16,820 | ) | - | (2,524 | ) | - | - | (88,655 | ) | 29,043 | (59,612 | ) | ||||||||||||||||||||||||||||||||||||||||||||||||||||||
| Exploration in operating units | (27,784 | ) | (41,705 | ) | (12,699 | ) | (7,539 | ) | - | (41 | ) | - | - | - | - | - | - | - | - | - | - | - | (89,768 | ) | 69 | (89,699 | ) | |||||||||||||||||||||||||||||||||||||||||||||||||||||
| Depreciation and amortization | (15,767 | ) | (17,313 | ) | (11,349 | ) | (15,439 | ) | (45,752 | ) | (104,984 | ) | (17 | ) | (850 | ) | (10,260 | ) | - | (54 | ) | (226 | ) | (9,545 | ) | (1,027 | ) | - | - | - | (232,583 | ) | - | (232,583 | ) | |||||||||||||||||||||||||||||||||||||||||||||
| Mining royalties | (1,142 | ) | (23,877 | ) | (337 | ) | (234 | ) | - | (1,597 | ) | - | - | - | - | - | - | - | (1 | ) | - | - | - | (27,188 | ) | - | (27,188 | ) | ||||||||||||||||||||||||||||||||||||||||||||||||||||
| Total operating costs | (171,421 | ) | (195,602 | ) | (51,110 | ) | (43,921 | ) | (204,556 | ) | (213,372 | ) | (17 | ) | (49,394 | ) | (31,027 | ) | - | (54 | ) | (226 | ) | (26,365 | ) | (170,264 | ) | (754,260 | ) | (862,004 | ) | (104,549 | ) | (2,878,142 | ) | 1,955,570 | (922,572 | ) | ||||||||||||||||||||||||||||||||||||||||||
| Gross profit (loss) | (5,366 | ) | 58,516 | (856 | ) | (11,903 | ) | (33,262 | ) | (52,365 | ) | (17 | ) | (636 | ) | 17,312 | 11,929 | 32,360 | (226 | ) | (9,317 | ) | (1,597 | ) | 287,539 | 253,613 | 72,798 | 618,522 | (611,572 | ) | 6,950 | |||||||||||||||||||||||||||||||||||||||||||||||||
| Operating expenses, net | ||||||||||||||||||||||||||||||||||||||||||||||||||||||||||||||||||||||||||||||||
| Administrative expenses | (10,739 | ) | (16,698 | ) | (3,623 | ) | (2,080 | ) | (19,181 | ) | (2,251 | ) | (1,444 | ) | (7,859 | ) | (3,422 | ) | (11,296 | ) | (106 | ) | (209 | ) | (654 | ) | (11,370 | ) | (26,325 | ) | - | (2,185 | ) | (119,442 | ) | 35,070 | (84,372 | ) | ||||||||||||||||||||||||||||||||||||||||||
| Exploration in non-operating areas | - | - | - | - | (2,366 | ) | (8,954 | ) | (15,892 | ) | - | - | - | - | - | - | (5,685 | ) | - | - | - | (32,897 | ) | 2,287 | (30,610 | ) | ||||||||||||||||||||||||||||||||||||||||||||||||||||||
| Selling expenses | (3,552 | ) | (851 | ) | (1,055 | ) | (1,424 | ) | (9,056 | ) | (1,207 | ) | - | - | (806 | ) | - | - | - | (1,411 | ) | (3 | ) | (3,534 | ) | (56,215 | ) | (1,111 | ) | (80,225 | ) | 60,860 | (19,365 | ) | ||||||||||||||||||||||||||||||||||||||||||||||
| Impairment loss of long-lived assets | - | - | - | - | - | (3,803 | ) | - | - | - | - | - | - | - | - | - | - | (672 | ) | (4,475 | ) | 672 | (3,803 | ) | ||||||||||||||||||||||||||||||||||||||||||||||||||||||||
| Other, net | 1,836 | (1,182 | ) | (125 | ) | (67 | ) | (2,657 | ) | (687 | ) | (1,095 | ) | 7,417 | (305 | ) | (4 | ) | - | 793 | 98 | 6,329 | (82,846 | ) | (26,600 | ) | 765 | (98,330 | ) | 92,595 | (5,735 | ) | ||||||||||||||||||||||||||||||||||||||||||||||||
| Total operating expenses, net | (12,455 | ) | (18,731 | ) | (4,803 | ) | (3,571 | ) | (33,260 | ) | (16,902 | ) | (18,431 | ) | (442 | ) | (4,533 | ) | (11,300 | ) | (106 | ) | 584 | (1,967 | ) | (10,729 | ) | (112,705 | ) | (82,815 | ) | (3,203 | ) | (335,369 | ) | 191,484 | (143,885 | ) | ||||||||||||||||||||||||||||||||||||||||||
| Operating profit (loss) | (17,821 | ) | 39,785 | (5,659 | ) | (15,474 | ) | (66,522 | ) | (69,267 | ) | (18,448 | ) | (1,078 | ) | 12,779 | 629 | 32,254 | 358 | (11,284 | ) | (12,326 | ) | 174,834 | 170,798 | 69,595 | 283,153 | (420,088 | ) | (136,935 | ) | |||||||||||||||||||||||||||||||||||||||||||||||||
| Other income (expense),net | ||||||||||||||||||||||||||||||||||||||||||||||||||||||||||||||||||||||||||||||||
| Share in the results of associates under equity method | - | - | - | - | - | - | - | 6,561 | 478 | 2 | - | (187,269 | ) | - | (268,463 | ) | - | - | - | (448,691 | ) | 275,316 | (173,375 | ) | ||||||||||||||||||||||||||||||||||||||||||||||||||||||||
| Finance costs | (195 | ) | (235 | ) | (152 | ) | (108 | ) | (10,096 | ) | (3,684 | ) | (215 | ) | (1,413 | ) | (8,817 | ) | (21 | ) | (4 | ) | (1 | ) | (842 | ) | (4,043 | ) | -22,734 | (16,010 | ) | (51 | ) | (68,621 | ) | 41,049 | (27,572 | ) | ||||||||||||||||||||||||||||||||||||||||||
| Net gain (loss) from currency exchange difference | 539 | 461 | 378 | 75 | (3,832 | ) | (1,973 | ) | (1,797 | ) | (1,393 | ) | (1,586 | ) | (165 | ) | 45 | 4 | (2,162 | ) | (2,287 | ) | (251 | ) | (75,770 | ) | (1,300 | ) | (91,014 | ) | 77,321 | (13,693 | ) | |||||||||||||||||||||||||||||||||||||||||||||||
| Finance income | 5 | 5 | 2 | - | 154 | 16 | - | 182 | 23 | 13 | - | - | - | 10,785 | 673 | 512 | 23 | 12,393 | (1,367 | ) | 11,026 | |||||||||||||||||||||||||||||||||||||||||||||||||||||||||||
| Total other income (expense), net | 349 | 231 | 228 | (33 | ) | (13,774 | ) | (5,641 | ) | (2,012 | ) | 3,937 | (9,902 | ) | (171 | ) | 41 | (187,266 | ) | (3,004 | ) | (264,008 | ) | (22,312 | ) | (91,268 | ) | (1,328 | ) | (595,933 | ) | 392,319 | (203,614 | ) | ||||||||||||||||||||||||||||||||||||||||||||||
| Profit (loss) before income tax | (17,472 | ) | 40,016 | (5,431 | ) | (15,507 | ) | (80,296 | ) | (74,908 | ) | (20,460 | ) | 2,859 | 2,877 | 458 | 32,295 | (186,908 | ) | (14,288 | ) | (276,334 | ) | 152,522 | 79,530 | 68,267 | (312,780 | ) | (27,769 | ) | (340,549 | ) | ||||||||||||||||||||||||||||||||||||||||||||||||
| Income tax | (518 | ) | (602 | ) | (140 | ) | (78 | ) | 4,109 | 5,702 | - | (4,386 | ) | (3,887 | ) | (299 | ) | (9,186 | ) | (87 | ) | 584 | (5,975 | ) | (602,717 | ) | (46,246 | ) | (29,861 | ) | (693,587 | ) | 678,824 | (14,763 | ) | |||||||||||||||||||||||||||||||||||||||||||||
| Profit (loss) from continued operations | (17,990 | ) | 39,414 | (5,571 | ) | (15,585 | ) | (76,187 | ) | (69,206 | ) | (20,460 | ) | (1,527 | ) | (1,010 | ) | 159 | 23,109 | (186,995 | ) | (13,704 | ) | (282,309 | ) | (450,195 | ) | 33,284 | 38,406 | (1,006,367 | ) | 651,055 | (355,312 | ) | ||||||||||||||||||||||||||||||||||||||||||||||
| Loss from discontinued operations, see note 1(e) | (20,233 | ) | ||||||||||||||||||||||||||||||||||||||||||||||||||||||||||||||||||||||||||||||
| Net loss | (375,545 | ) | ||||||||||||||||||||||||||||||||||||||||||||||||||||||||||||||||||||||||||||||
| Total assets | - | - | - | - | 739,941 | 220,331 | 53,214 | 31,463 | 393,318 | 5,979 | 9,397 | 997,835 | 118,012 | 3,677,307 | 2,965,430 | 7,852,692 | 238,175 | 17,303,094 | (12,755,913 | ) | 4,547,181 | |||||||||||||||||||||||||||||||||||||||||||||||||||||||||||
| Total liability | - | - | - | - | 364,455 | 106,846 | 3,514 | 29,599 | 235,695 | 3,457 | 3,508 | 2,831 | 31,479 | 516,241 | 736,605 | 3,354,318 | 63,119 | 5,451,667 | (4,293,722 | ) | 1,157,945 | |||||||||||||||||||||||||||||||||||||||||||||||||||||||||||
| Other segment information | ||||||||||||||||||||||||||||||||||||||||||||||||||||||||||||||||||||||||||||||||
| Investment in associates | - | - | - | - | - | - | - | - | - | - | - | - | - | 3,519 | 989,130 | 988,725 | 62,609 | 2,043,983 | - | 2,043,983 | ||||||||||||||||||||||||||||||||||||||||||||||||||||||||||||
| Additions to mining concessions, development costs, property, plant and equipment | 22,669 | 3,151 | 4,795 | 3,234 | 55,073 | 62,968 | 57,173 | 527 | 6,159 | 85 | - | 1,205 | 2,140 | 66,918 | - | - | - | 286,097 | - | 286,097 | ||||||||||||||||||||||||||||||||||||||||||||||||||||||||||||
| F- 93 |
Notes to the consolidated financial statements (continued)
| Equity accounted investees | ||||||||||||||||||||||||||||||||||||||||||||||||||||||||||||||||||||||||||||||||
|
Ucchuchacua
(Operation) |
Orcopampa
(Operation) |
Julcani
(Operation) |
Mallay
(Operation) |
Colquijirca
(Operation) |
La Zanja
(Operation) |
Exploration
and development mining projects |
Construction
and engineering |
Energy
generation and transmission |
Insurance
brokerage |
Rental of
mining concessions |
Holding of
investment in shares |
Industrial
activities |
Corporate |
Minera
Yanacocha S.R.L. |
|
Sociedad
Minera Cerro Verde S.A.A |
Compañía
Minera Coimolache S.A. |
Total
operating segments |
Ucchuchacua
(Operation) |
Orcopampa
(Operation) |
||||||||||||||||||||||||||||||||||||||||||||||||||||||||||||
| US$(000) | US$(000) | US$(000) | US$(000) | US$(000) | US$(000) | US$(000) | US$(000) | US$(000) | US$(000) | US$(000) | US$(000) | US$(000 | US$(000) | US$(000) | US$(000) | US$(000) | US$(000) | US$(000) | US$(000) | |||||||||||||||||||||||||||||||||||||||||||||||||||||||||||||
| Year 2014 | ||||||||||||||||||||||||||||||||||||||||||||||||||||||||||||||||||||||||||||||||
| Results: | ||||||||||||||||||||||||||||||||||||||||||||||||||||||||||||||||||||||||||||||||
| Continuing operations | ||||||||||||||||||||||||||||||||||||||||||||||||||||||||||||||||||||||||||||||||
| Operating income | ||||||||||||||||||||||||||||||||||||||||||||||||||||||||||||||||||||||||||||||||
| Net sale of goods | 202,543 | 264,049 | 49,767 | 42,974 | 210,002 | 185,286 | - | - | - | - | - | - | 483 | 187,503 | 1,165,299 | 1,467,097 | 192,369 | 3,967,372 | (3,008,086 | ) | 959,286 | |||||||||||||||||||||||||||||||||||||||||||||||||||||||||||
| Net sale of services | - | - | - | - | - | - | - | 66,853 | 38,906 | 10,608 | - | - | 13,493 | - | 20,705 | - | - | 150,565 | (79,406 | ) | 71,159 | |||||||||||||||||||||||||||||||||||||||||||||||||||||||||||
| Royalty income | - | - | - | - | - | - | - | - | - | - | 36,867 | - | - | - | - | - | - | 36,867 | - | 36,867 | ||||||||||||||||||||||||||||||||||||||||||||||||||||||||||||
| Total operating income | 202,543 | 264,049 | 49,767 | 42,974 | 210,002 | 185,286 | - | 66,853 | 38,906 | 10,608 | 36,867 | - | 13,976 | 187,503 | 1,186,004 | 1,467,097 | 192,369 | 4,154,804 | (3,087,492 | ) | 1,067,312 | |||||||||||||||||||||||||||||||||||||||||||||||||||||||||||
| Operating costs | ||||||||||||||||||||||||||||||||||||||||||||||||||||||||||||||||||||||||||||||||
| Cost of sales of goods | (149,251 | ) | (113,467 | ) | (26,364 | ) | (22,583 | ) | (122,995 | ) | (84,381 | ) | - | - | - | - | - | - | (2,769 | ) | (186,650 | ) | (910,705 | ) | (797,481 | ) | (100,649 | ) | (2,517,295 | ) | 2,018,581 | (498,714 | ) | |||||||||||||||||||||||||||||||||||||||||||||||
| Cost of services | - | - | - | - | - | - | - | (68,964 | ) | (19,252 | ) | - | - | - | (9,934 | ) | - | (22,422 | ) | - | - | (120,572 | ) | 42,645 | (77,927 | ) | ||||||||||||||||||||||||||||||||||||||||||||||||||||||
| Exploration in operating units | (26,633 | ) | (51,814 | ) | (10,981 | ) | (7,807 | ) | - | (120 | ) | - | - | - | - | - | - | - | (2 | ) | - | - | - | (97,357 | ) | - | (97,357 | ) | ||||||||||||||||||||||||||||||||||||||||||||||||||||
| Depreciation and amortization | (15,293 | ) | (30,560 | ) | (11,769 | ) | (24,742 | ) | (26,974 | ) | (72,847 | ) | - | (717 | ) | (8,683 | ) | - | (74 | ) | (231 | ) | (7,224 | ) | (868 | ) | - | - | - | (199,982 | ) | 26,983 | (172,999 | ) | ||||||||||||||||||||||||||||||||||||||||||||||
| Mining royalties | (1,893 | ) | (24,113 | ) | (466 | ) | (401 | ) | - | (555 | ) | - | - | - | - | - | - | - | - | - | - | - | (27,428 | ) | - | (27,428 | ) | |||||||||||||||||||||||||||||||||||||||||||||||||||||
| Total operating costs | (193,070 | ) | (219,954 | ) | (49,580 | ) | (55,533 | ) | (149,969 | ) | (157,903 | ) | - | (69,681 | ) | (27,935 | ) | - | (74 | ) | (231 | ) | (19,927 | ) | (187,520 | ) | (933,127 | ) | (797,481 | ) | (100,649 | ) | (2,962,634 | ) | 2,088,209 | (874,425 | ) | |||||||||||||||||||||||||||||||||||||||||||
| Gross profit (loss) | 9,473 | 44,095 | 187 | (12,559 | ) | 60,033 | 27,383 | - | (2,828 | ) | 10,971 | 10,608 | 36,793 | (231 | ) | (5,951 | ) | (17 | ) | 252,877 | 669,616 | 91,720 | 1,192,170 | (999,283 | ) | 192,887 | ||||||||||||||||||||||||||||||||||||||||||||||||||||||
| Operating expenses, net | ||||||||||||||||||||||||||||||||||||||||||||||||||||||||||||||||||||||||||||||||
| Administrative expenses | (12,351 | ) | (16,077 | ) | (3,289 | ) | (2,719 | ) | (17,634 | ) | (5,920 | ) | (3,184 | ) | (16,135 | ) | (4,354 | ) | (8,901 | ) | (113 | ) | (208 | ) | (376 | ) | (7,828 | ) | (38,262 | ) | - | (2,073 | ) | (139,424 | ) | 45,671 | (93,753 | ) | ||||||||||||||||||||||||||||||||||||||||||
| Exploration in non-operating areas | - | - | - | - | (5,085 | ) | - | (14,399 | ) | - | - | - | - | - | - | (3,540 | ) | - | - | - | (23,024 | ) | (26,983 | ) | (50,007 | ) | ||||||||||||||||||||||||||||||||||||||||||||||||||||||
| Selling expenses | (3,416 | ) | (955 | ) | (1,067 | ) | (1,755 | ) | (7,103 | ) | (1,441 | ) | - | - | (323 | ) | - | - | - | (147 | ) | (5 | ) | (4,458 | ) | (54,210 | ) | (1,078 | ) | (75,958 | ) | 59,746 | (16,212 | ) | ||||||||||||||||||||||||||||||||||||||||||||||
| Impairment loss of long-lived assets | - | - | - | - | - | - | - | - | - | - | - | - | - | - | (541,141 | ) | - | - | (541,141 | ) | 541,141 | - | ||||||||||||||||||||||||||||||||||||||||||||||||||||||||||
| Other, net | 1,338 | 657 | (4,661 | ) | 921 | 226 | (2,833 | ) | 569 | 8,070 | 7,718 | 109 | (1 | ) | 651 | (77 | ) | 3,930 | (77,781 | ) | (3,629 | ) | 929 | (63,864 | ) | 67,033 | 3,169 | |||||||||||||||||||||||||||||||||||||||||||||||||||||
| Total operating expenses, net | (14,429 | ) | (16,375 | ) | (9,017 | ) | (3,553 | ) | (29,596 | ) | (10,194 | ) | (17,014 | ) | (8,065 | ) | 3,041 | (8,792 | ) | (114 | ) | 443 | (600 | ) | (7,443 | ) | (661,642 | ) | (57,839 | ) | (2,222 | ) | (843,411 | ) | 686,608 | (156,803 | ) | |||||||||||||||||||||||||||||||||||||||||||
| Operating profit (loss) | (4,956 | ) | 27,720 | (8,830 | ) | (16,112 | ) | 30,437 | 17,189 | (17,014 | ) | (10,893 | ) | 14,012 | 1,816 | 36,679 | 212 | (6,551 | ) | (7,460 | ) | (408,765 | ) | 611,777 | 89,498 | 348,759 | (312,675 | ) | 36,084 | |||||||||||||||||||||||||||||||||||||||||||||||||||
| Other income (expense), net | ||||||||||||||||||||||||||||||||||||||||||||||||||||||||||||||||||||||||||||||||
| Share in the results of associates under equity method | - | - | - | - | - | - | - | (6,987 | ) | (2,186 | ) | - | - | (160,379 | ) | - | (91,962 | ) | - | - | - | (261,514 | ) | 186,914 | (74,600 | ) | ||||||||||||||||||||||||||||||||||||||||||||||||||||||
| Finance costs | (294 | ) | (170 | ) | (153 | ) | (67 | ) | (4 | ) | (1,728 | ) | (140 | ) | (1,223 | ) | (8,838 | ) | (15 | ) | (3 | ) | (2 | ) | (722 | ) | (760 | ) | (23,504 | ) | (369 | ) | (583 | ) | (38,575 | ) | 27,299 | (11,276 | ) | |||||||||||||||||||||||||||||||||||||||||
| Net gain (loss) from currency exchange difference | 354 | 332 | 124 | 66 | (1,031 | ) | (1,525 | ) | (446 | ) | (757 | ) | (1,021 | ) | 8 | (50 | ) | (4 | ) | (1,107 | ) | (3,400 | ) | 1,142 | 2,284 | (1,465 | ) | (6,496 | ) | (1,961 | ) | (8,457 | ) | |||||||||||||||||||||||||||||||||||||||||||||||
| Gain on business combination | - | - | - | - | - | - | - | - | - | - | - | - | - | 59,852 | - | - | - | 59,852 | - | 59,852 | ||||||||||||||||||||||||||||||||||||||||||||||||||||||||||||
| Finance income | 10 | 13 | 4 | (278 | ) | - | - | - | - | 8 | - | - | - | 3,951 | 298 | 2,443 | 47 | 6,496 | 1,912 | 8,408 | ||||||||||||||||||||||||||||||||||||||||||||||||||||||||||||
| Total other income (expense), net | 70 | 175 | (25 | ) | (1 | ) | (1,313 | ) | (3,253 | ) | (586 | ) | (8,967 | ) | (12,045 | ) | 1 | (53 | ) | (160,385 | ) | (1,829 | ) | (32,319 | ) | (22,064 | ) | 4,358 | (2,001 | ) | (240,237 | ) | 214,164 | (26,073 | ) | |||||||||||||||||||||||||||||||||||||||||||||
| Profit (loss) before income tax | ||||||||||||||||||||||||||||||||||||||||||||||||||||||||||||||||||||||||||||||||
| Income tax current | (4,886 | ) | 27,895 | (8,855 | ) | (16,113 | ) | 29,124 | 13,936 | (17,600 | ) | (19,860 | ) | 1,967 | 1,817 | 36,626 | (160,173 | ) | (8,380 | ) | (39,779 | ) | (430,829 | ) | 616,135 | 87,497 | 108,522 | (98,511 | ) | 10,011 | ||||||||||||||||||||||||||||||||||||||||||||||||||
| Income tax deferred | - | - | - | - | (21,621 | ) | (12,388 | ) | - | 567 | (4,835 | ) | (368 | ) | (10,996 | ) | (48 | ) | 978 | (17,301 | ) | 30,491 | (238,529 | ) | (36,089 | ) | (310,139 | ) | 244,318 | (65,821 | ) | |||||||||||||||||||||||||||||||||||||||||||||||||
| Profit (loss) from continued operations | (4,886 | ) | 27,895 | (8,855 | ) | (16,113 | ) | 7,503 | 1,548 | (17,600 | ) | (19,293 | ) | (2,868 | ) | 1,449 | 25,630 | (160,221 | ) | (7,402 | ) | (57,080 | ) | (400,338 | ) | 377,606 | 51,408 | (201,617 | ) | 145,807 | (55,810 | ) | ||||||||||||||||||||||||||||||||||||||||||||||||
| Discontinued operations | ||||||||||||||||||||||||||||||||||||||||||||||||||||||||||||||||||||||||||||||||
| Loss from discontinued operations, see note 1(e) | (5,830 | ) | ||||||||||||||||||||||||||||||||||||||||||||||||||||||||||||||||||||||||||||||
| Net loss | (61,640 | ) | ||||||||||||||||||||||||||||||||||||||||||||||||||||||||||||||||||||||||||||||
| Total assets | - | - | - | - | 765,143 | 278,836 | 50,370 | 87,546 | 403,660 | 6,265 | 14,727 | 1,208,772 | 130,803 | 3,778,132 | 3,483,169 | 5,771,984 | 205,059 | 16,184,466 | (11,512,192 | ) | 4,672,274 | |||||||||||||||||||||||||||||||||||||||||||||||||||||||||||
| Total liability | - | - | - | - | 311,001 | 96,147 | 5,726 | 95,466 | 225,409 | 3,109 | 5,727 | 166 | 29,472 | 294,027 | 803,392 | 1,306,894 | 51,720 | 3,228,256 | (2,318,107 | ) | 910,149 | |||||||||||||||||||||||||||||||||||||||||||||||||||||||||||
| Other segment information | ||||||||||||||||||||||||||||||||||||||||||||||||||||||||||||||||||||||||||||||||
| Investment in associates | - | - | - | - | - | - | - | - | - | - | - | - | - | 3,519 | 1,185,971 | 982,206 | 52,685 | 2,224,381 | - | 2,224,381 | ||||||||||||||||||||||||||||||||||||||||||||||||||||||||||||
| Additions to mining concessions, development costs, property, plant and equipment | 12,668 | 8,963 | 699 | 963 | 105,477 | 29,113 | 83,723 | 7,516 | 17,948 | 227 | - | - | - | 15,081 | - | - | - | 282,378 | - | 282,378 | ||||||||||||||||||||||||||||||||||||||||||||||||||||||||||||
| F- 94 |
Notes to the consolidated financial statements (continued)
Reconciliation of segment profit (loss)
The reconciliation of segment profit (loss) to the consolidated profit (loss) from continued operations follows:
| 2016 | 2015 | 2014 | ||||||||||
| US$(000) | US$(000) | US$(000) | ||||||||||
| Segments loss | (1,397,473 | ) | (1,006,367 | ) | (201,617 | ) | ||||||
| Elimination of profit of equity accounted investees, not consolidated (owned by third parties) | 645,989 | 203,912 | (108,861 | ) | ||||||||
| Elimination of intercompany sales | (251,502 | ) | (232,380 | ) | (242,022 | ) | ||||||
| Elimination of intercompany cost of sales | 250,157 | 228,914 | 229,968 | |||||||||
| Elimination of share in the results of subsidiaries and associates | 448,507 | 448,691 | 261,514 | |||||||||
| Others | (4,419 | ) | 1,918 | 5,208 | ||||||||
| Consolidated profit (loss) from continued operations | (308,741 | ) | (355,312 | ) | (55,810 | ) | ||||||
Reconciliation of segment assets
The reconciliation of segment assets to the consolidated assets follows:
| 2016 | 2015 | 2014 | ||||||||||
| US$(000) | US$(000) | US$(000) | ||||||||||
| Segments assets | 15,522,247 | 17,303,094 | 16,184,466 | |||||||||
| Elimination of assets of equity accounted investees, not consolidated (owned by third parties) | (10,016,003 | ) | (8,128,519 | ) | (6,727,205 | ) | ||||||
| Elimination of equity pick up investments of the subsidiaries and associates of the Parent company | (1,047,758 | ) | (4,486,717 | ) | (4,615,191 | ) | ||||||
| Elimination of intercompany receivables | (192,958 | ) | (138,703 | ) | (156,456 | ) | ||||||
| Others | 887 | (1,974 | ) | (13,340 | ) | |||||||
| Consolidated assets | 4,266,415 | 4,547,181 | 4,672,274 | |||||||||
Reconciliation of segment liabilities
The reconciliation of segment liabilities to the consolidated liabilities follows:
| 2016 | 2015 | 2014 | ||||||||||
| US$(000) | US$(000) | US$(000) | ||||||||||
| Segments liabilities | 5,500,328 | 5,451,667 | 3,228,256 | |||||||||
| Elimination of liabilities of equity accounted investees, not consolidated | (4,087,495 | ) | (4,154,042 | ) | (2,162,006 | ) | ||||||
| Elimination of intercompany payables | (192,958 | ) | (138,703 | ) | (156,456 | ) | ||||||
| Others | (673 | ) | (977 | ) | 355 | |||||||
| Consolidated liabilities | 1,219,202 | 1,157,945 | 910,149 | |||||||||
| F- 95 |
Notes to the consolidated financial statements (continued)
| 32. | Derivative financial instruments |
| (a) | Hedge derivative financial instruments - |
The volatility of copper prices during the last years has caused the management of the subsidiary El Brocal to enter into future contracts w hich are recorded under cash flow hedge accounting, see note 2.4(v). These contracts managed during the third quarter of 2016 are intended to reduce the volatility of the cash flows attributable to the fluctuations in the cooper price, according to the risk strategy approved by the Board of Directors of this subsidiary. These contracts are intended to reduce the volatility of the cash flows attributable to the fluctuations in the cooper price from October 2016 to March 2017, i n accordance with existing copper concentrate sales commitments, which are related to 50 percent of the annual production of copper.
As of December 31, 2016, the fair value of open forward contracts amounts to a liability of US$3,863,000. As of December 31, 2015, the fair value of open forward contracts amounts to a liability of US$10,643,000 and t he effectiveness of these contracts has not been observed since no significant element of ineffectiveness has appeared.
| (b) | Embedded derivative of commercial contracts - |
The Group’s sales of concentrates are based on commercial contracts, under which a provisional sales value is determined based on future quotations (forward). The adjustment to sales is considered an embedded derivative, which is required to be separated from the host contract. Commercial contracts are linked to market prices (London Metal Exchange) at the dates of the expected settlements of the open positions as of December 31, 2016 and 2015. The embedded derivative does not qualify for hedge accounting; therefore, changes in the fair value are recorded as an adjustment to net sales.
Embedded derivatives held by the Group as of December 31, 2016 are:
| Quotations | ||||||||||||||||
| Metal | Quantity |
Period of
quotations 2017 |
Provisional | Future | Metal | |||||||||||
| US$ | US$ | US$(000) | ||||||||||||||
| Copper | 29,121 DMT | January – April | 2,985.28 -5,824.00 | 5,535.76 – 5,642.25 | 397 | |||||||||||
| Gold | 15,370 DMT | January – February | 1,139.75 – 1,145.90 | 1,151.00 – 1,179.40 | 481 | |||||||||||
| Silver | 17,124 Oz | January – April | 16.32 – 19.35 | 16.42 – 16.66 | (1,825 | ) | ||||||||||
| Lead | 23,636 DMT | January – April | 1,871.58 – 2,380.60 | 2,017.00 – 2,080.00 | (801 | ) | ||||||||||
| Zinc | 29,407 DMT | January – March | 2,291.08 – 2,732.10 | 2,578.00 – 2,612.50 | (172 | ) | ||||||||||
| Other | 15,082 Oz | 396 | ||||||||||||||
| Total liability, net | (1,524 | ) | ||||||||||||||
| F- 96 |
Notes to the consolidated financial statements (continued)
Embedded derivatives held by the Group as of December 31, 2015 are:
| Quotations | ||||||||||||||||
| Metal | Quantity |
Period of
quotations 2016 |
Provisional | Future |
Fair value,
net |
|||||||||||
| US$ | US$ | US$(000) | ||||||||||||||
| Copper | 41,359 DMT | January - April | 4,629.00 – 5,223.05 | 4,525.50 - 4,796.00 | (1,549 | ) | ||||||||||
| Gold | 16,145 OZ | January | 961.79 – 1,070.10 | 1,086.65 – 1,109.09 | (633 | ) | ||||||||||
| Silver | 3,215,862 OZ | January - March | 12.66 – 15.71 | 14.30 – 14.31 | (244 | ) | ||||||||||
| Lead | 16,990 DMT | January – April | 1,641.40 – 1,732.13 | 1,658.00 – 1,789.00 | 408 | |||||||||||
| Zinc | 12,329 DMT | January – March | 1,510.41 – 1,672.50 | 1,495.75 – 1,609.00 | 316 | |||||||||||
| Gold | 342 OZ | January - April | 1,066.26 – 1,124.53 | 1,109.05 – 1,109.27 | 8 | |||||||||||
| Total asset, net | (1,694 | ) | ||||||||||||||
| 33. | Financial - risk management objectives and policies |
The Group’s principal financial liabilities, other than derivatives, comprise of trade accounts and other payables, and financial obligations. The main purpose of these financial instruments is to finance the Group’s operations. The Group’s principal financial assets include cash and cash equivalents and trade and other receivables that derive directly from its operations.
The Group is exposed to market risk, credit risk and liquidity risk. The Group’s Management oversees the management of these risks. It is supported by a committee that advises on financial risks. This committee provides assurance to management that the Group's financial risk activities are governed by appropriate policies and procedures and that financial risks are identified, measured and managed in accordance with the Group’s policies and risk objectives. All derivative activities for risk management purpose are carried out by internal specialists that have the appropriate skills, experience and supervision.
There were no changes in the objectives, policies or processes during the years ended December 31, 2016, 2015 and 2014.
The Board of Directors reviews and agrees policies for managing each of these risks, which are described below:
| (a) | Market risk - |
Market risk is the risk that the fair value of the future cash flows from financial instruments will fluctuate because of changes in market prices. Market risks that apply to the Group comprise three types of risk: exchange rate risk, commodity risk and interest rate risk. Financial instruments affected by market risks include time deposits, financial obligations, embedded derivatives and derivative financial instruments.
The sensitivity analyses in this section relate to the positions as of December 31, 2016, 2015 and 2014, and have been prepared considering that the proportion of financial instruments in foreign currency are constant.
| F- 97 |
Notes to the consolidated financial statements (continued)
| (a.1) | Exchange rate risk |
The exchange rate risk is the risk that the fair value or future cash flows of a financial instrument will fluctuate because of changes in foreign exchange rates. The Group’s exposure to the risk of changes in foreign exchange relates primarily to the Group´s operating activities in Soles. The Group mitigates the effect of exposure to exchange-rate risk by carrying out almost all of its transactions in its functional currency.
On the other hand, the Group has contracted hedges exchange rate to mitigate this risk on their loans obtained in soles. Excluding loans in soles, Management maintains smaller amounts in Soles in order to cover its needs in this currency (primarily taxes).
A table showing the effect on results of a reasonable change in foreign-currency exchange rates is presented below, with all other variables kept constant:
|
Exchange-rate
increase/decrease |
Effect on loss before
income tax |
|||||||
| US$(000) | ||||||||
| 2016 | ||||||||
| Exchange rate | +10 | % | (924 | ) | ||||
| Exchange rate | -10 | % | 926 | |||||
| 2015 | ||||||||
| Exchange rate | +10 | % | 6,233 | |||||
| Exchange rate | -10 | % | (7,618 | ) | ||||
| 2014 | ||||||||
| Exchange rate | +10 | % | 5,950 | |||||
| Exchange rate | -10 | % | (7,271 | ) | ||||
| (a.2) | Commodity price risk |
The Group is affected by the price volatility of the commodities. The price of mineral sold by the Group has fluctuated historically and is affected by numerous factors beyond its control. The Group manages its commodity price risk primarily through the use of sales commitments in customer contracts and hedge contracts for the metals sold by the subsidiary El Brocal.
The subsidiary El Brocal entered into derivative contracts that qualified as cash flow hedges, with the intention of covering the risk resulting from the fall in the prices of the metals. These derivative contracts are recorded as assets or liabilities in the statements of financial position and are stated at fair value. To the extent that these hedges were effective in offsetting future cash flows from the sale of the related production, changes in fair value are deferred in an equity account. The deferred amounts were reclassified to the appropriate sales when production was sold.
| (a.3) | Interest rate risk - |
Interest rate risk is the risk that the fair value or future cash flows of a financial instrument will fluctuate because of changes in market interest rates. The Group’s exposure to the risk of changes’ in market interest rates relates to the Groups’ long-term financial obligations with floating interest rates.
| F- 98 |
Notes to the consolidated financial statements (continued)
A table showing the effect in profit or loss of the variations of interest rates:
|
Increase/decrease
of Libor rate |
Effect on results | |||||||
| (percentage rates) | US$(000) | |||||||
| 2016 | ||||||||
| Interest rate | +10 | 333 | ||||||
| Interest rate | -10 | (333 | ) | |||||
| 2015 | ||||||||
| Interest rate | +10 | 294 | ||||||
| Interest rate | -10 | (294 | ) | |||||
| 2014 | ||||||||
| Interest rate | +10 | 110 | ||||||
| Interest rate | -10 | (110 | ) | |||||
| (b) | Credit risk - |
Credit risk is the risk that counterparty will not meet its obligations under a financial instrument or customer contract, leading to a financial loss. The Group is exposed to credit risk from its operating activities (primarily trade receivable) and from its financing activities, including deposits with banks and other financial instruments.
The Group invests the excess cash in financial leading institutions, sets conservative credit policies and constantly evaluates the market conditions in which it operates.
Trade accounts receivable are denominated in U.S. dollars. The Group’s sales are made to domestic and foreign customers. See concentration of spot sales in note 21(b). An impairment analysis is performed on an individual basis.
Credit risk is limited to the carrying amount of the financial assets to the date of consolidated statements of financial position which is composed by cash and cash equivalents, trade and other receivables and derivative financial instruments.
| (c) | Liquidity risk - |
Prudent management of liquidity risk implies maintaining sufficient cash and cash equivalents and the possibility of committing or having financing committed through an adequate number of credit sources. The Group maintains suitable levels of cash and cash equivalents and has sufficient credit capacity to get access to lines of credit in leading financial entities.
The Group continually monitors its liquidity risk based on cash flow projections.
| F- 99 |
Notes to the consolidated financial statements (continued)
An analysis of the Group’s financial liabilities classified according to their aging is presented below, based on undiscounted contractual payments:
|
Less than
1 year |
Between 1
and 2 years |
Between 2
and 5 years |
More than 5
years |
Total | ||||||||||||||||
| US$(000) | US$(000) | US$(000) | US$(000) | US$(000) | ||||||||||||||||
| As of December 31,2016 - | ||||||||||||||||||||
| Bank loans | 55,000 | - | - | - | 55,000 | |||||||||||||||
| Trade and other payables | 253,062 | - | - | 15,982 | 269,044 | |||||||||||||||
| Derivative financial instruments | 3,863 | - | - | - | 3,863 | |||||||||||||||
| Embedded derivative for sale of concentrates | 1,524 | - | - | - | 1,524 | |||||||||||||||
| Financial obligation | 70,420 | 113,070 | 503,029 | - | 686,519 | |||||||||||||||
| Contingent consideration liability | - | 3,305 | 6,603 | 32,840 | 42,748 | |||||||||||||||
| Total | 383,869 | 116,375 | 509,632 | 48,822 | 1,058,698 | |||||||||||||||
| As of December 31, 2015 - | ||||||||||||||||||||
| Bank loans | 298,984 | - | - | - | 298,984 | |||||||||||||||
| Trade and other payables | 235,691 | - | - | 15,057 | 250,748 | |||||||||||||||
| Derivative financial instruments | 10,643 | - | - | - | 10,643 | |||||||||||||||
| Embedded derivative for sale of concentrates | 1,694 | - | - | - | 1,694 | |||||||||||||||
| Financial obligation | 62,560 | 92,571 | 238,504 | - | 393,635 | |||||||||||||||
| Contingent consideration liability | - | - | 8,050 | 29,118 | 37,168 | |||||||||||||||
| Total | 609,572 | 92,571 | 246,554 | 44,175 | 992,872 | |||||||||||||||
| (d) | Capital management - |
For purposes of the Group's capital management, capital is based on all equity accounts. The objective of capital management is to maximize shareholder value.
The Group manages its capital structure and makes adjustments to meet the changing economic market conditions. The Group's policy is to fund all projects of short and long term with their own operating resources. To maintain or adjust the capital structure, the Group may change the policy of paying dividends to shareholders, return capital to shareholders or issue new shares.
| F- 100 |
Notes to the consolidated financial statements (continued)
| 34. | Fair value measurement |
Fair value disclosure of assets and liabilities according to its hierarchy -
The following table provides the fair value measurement hierarchy of the Group’s assets and liabilities:
| Fair value measurement using | ||||||||||||||||
| Total |
Quoted prices
in active markets (Level 1) |
Significant
observable inputs (Level 2) |
Significant
non-observable inputs (Level 3) |
|||||||||||||
| US$(000) | US$(000) | US$(000) | US$(000) | |||||||||||||
| As of December 31, 2016 | ||||||||||||||||
| Liabilities measured at fair value: | ||||||||||||||||
| - Embedded derivatives for concentrates sales, net | 1,524 | - | 1,524 | - | ||||||||||||
| - Contingent consideration liability | 19,343 | - | - | 19,343 | ||||||||||||
| - Hedge instruments | 3,863 | - | 3,863 | - | ||||||||||||
| As of December 31, 2015 | ||||||||||||||||
| Liabilities measured at fair value: | ||||||||||||||||
| - Embedded derivatives for concentrates sales, net | 1,694 | - | 1,694 | - | ||||||||||||
| - Contingent consideration liability | 16,994 | - | - | 16,994 | ||||||||||||
| - Hedge instruments | 10,282 | - | 10,282 | - | ||||||||||||
Financial instruments whose fair value is similar to their book value –
For financial assets and liabilities such as cash and cash equivalents, trade and other receivables, trade and other payables that are liquid or have short-term maturities (less than three months), it is estimated that their book value is similar to their fair value. The derivatives are also recorded at the fair value so that differences do not need to be reported.
The fair value of embedded derivatives is determined using valuation techniques with information directly observable in the market (future metal quotations).
Financial instruments at fixed and variable rates -
The fair value of financial assets and liabilities at fixed and variable rates at amortized cost is determined by comparing the market interest rates at the time of their initial recognition to the current market rates with regard to similar financial instruments. The estimated fair value of deposits that accrue interest is determined by means of cash flows discounted using the prevailing market interest rates in the currency with similar maturities and credit risks.
Based on the foregoing, there are no important existing difference between the value in books and the reasonable value of the assets and financial liabilities as of December 31, 2016 and 2015.
| F- 101 |
Minera Yanacocha S.R.L. and Subsidiary
Consolidated Financial Statements for the years 2016, 2015 and 2014, together with the Report of Independent Registered Public Accounting Firm
| F- 102 |
Minera Yanacocha S.R.L. and Subsidiary
Consolidated Financial Statements for the years 2016, 2015 and 2014, together with the Report of Independent Registered Public Accounting Firm
Content
| Report of Independent Registered Public Accounting Firm | F-104 |
| Consolidated Financial Statements | |
| Consolidated statements of financial position | F-106 |
| Consolidated statements of comprehensive income | F-107 |
| Consolidated statements of changes in equity | F-108 |
| Consolidated statements of cash flows | F-109 |
| Notes to the consolidated financial statements | F-110 |
| F- 103 |
Report of Independent Registered Public Accounting Firm
To the Partners of Minera Yanacocha S.R.L. and Subsidiary
We have audited the accompanying consolidated financial statements of Minera Yanacocha S.R.L. (a Peruvian Company) and Subsidiary, which comprise the consolidated statements of financial position as of December 31, 2016 and 2015, and the related consolidated statements of comprehensive income, statements of changes in equity and statements of cash flows for the years ended December 31, 2016 and 2015. These financial statements are the responsibility of the Company's management. Our responsibility is to express an opinion on these financial statements based on our audits.
We conducted our audits in accordance with the standards of the Public Company Accounting Oversight Board (United States). Those standards require that we plan and perform the audit to obtain reasonable assurance about whether the financial statements are free of material misstatement. We were not engaged to perform an audit of the Company´s internal control over financial reporting. Our audits included consideration of internal control over financial reporting as a basis of designing audit procedures that are appropriate in the circumstances, but not for the purpose of expressing an opinion on the effectiveness of the Company´s internal control over financial reporting. Accordingly, we express no such opinion. An audit also includes examining, on a test basis, evidence supporting the amounts and disclosures in the financial statements, assessing the accounting principles used and significant estimates made by management and evaluating the overall financial statements presentation. We believe that our audits provide a reasonable basis for our opinion.
In our opinion, the consolidated financial statements referred to above present fairly, in all material respects, the consolidated financial position of Minera Yanacocha S.R.L and Subsidiary as of December 31, 2016 and 2015, and the results of their operations and their cash flows for the years then ended, in accordance with International Financial Reporting Standards as issued by the International Accounting Standards Board (“IASB”) which differ in certain respects from the accounting principles generally accepted in the United States of America (see notes 23 and 24 to the financial statements).
Lima, Peru,
February 28, 2017
Countersigned by:
Paredes, Burga & Asociados S. Civil de R. L.
| /s/ Victor Burga |
Victor Burga
C.P.C.C. Register No. 14859
| F- 104 |
Report of Independent Registered Public Accounting Firm (continued)
March 30, 2015
To the Partners of
Minera Yanacocha S.R.L.
In our opinion, the accompanying consolidated statements of comprehensive income, changes in equity and cash flows for the year ended December 31, 2014, present fairly, in all material respects, the results of operations and cash flows of Minera Yanacocha S.R.L. and Subsidiary for the year ended December 31, 2014 in conformity with International Financial Reporting Standards, as issued by the International Accounting Standards Board.
These financial statements are the responsibility of the Company’s management. Our responsibility is to express an opinion on these financial statements based on our audit. We conducted our audit of these statements in accordance with the standards of the Public Company Accounting Oversight Board (United States). These standards require that we plan and perform the audit to obtain reasonable assurance about whether the financial statements are free of material misstatements. An audit includes examining, on a test basis, evidence supporting the amounts and disclosures in the financial statements, assessing the accounting principles used and significant estimates made by management, and evaluating the overall financial statements presentation. We believe that our audit provides a reasonable basis for our opinion.
Countersigned by
| Gaveglio, Aparicio y Asociados S. Civil de R.L. | |
| /s/ Francisco Patino (partner) | |
| Peruvian Certified Public Accountant | |
| Registration No. 01-25611 | |
| Lima, Peru |
| F- 105 |
Minera Yanacocha S.R.L. and Subsidiary
Consolidated statements of financial position
As of December 31, 2016 and 2015
| Note | 2016 | 2015 | ||||||||||
| US$(000) | US$(000) | |||||||||||
| Current assets | ||||||||||||
| Cash and cash equivalents | 5 | 677,524 | 943,761 | |||||||||
| Trade and other receivables, net | 6 | 40,975 | 26,389 | |||||||||
| Prepaid income tax | 18,175 | - | ||||||||||
| Value added tax credit | 73,227 | 80,641 | ||||||||||
| Inventories, net | 7 | 71,298 | 56,764 | |||||||||
| Stockpiles and ore on leach pads, net | 8 | 226,357 | 237,610 | |||||||||
| Prepaid expenses | 337 | 517 | ||||||||||
| Total current assets | 1,107,893 | 1,345,682 | ||||||||||
| Non-current assets | ||||||||||||
| Available-for-sale financial assets | 9 | 16,454 | 15,803 | |||||||||
| Stockpiles and ore on leach pads, net | 8 | 111,889 | 208,483 | |||||||||
| Property, plant and equipment, net | 10 | 799,131 | 1,364,610 | |||||||||
| Intangible assets, net | 10,518 | 30,852 | ||||||||||
| Total non-current assets | 937,992 | 1,619,748 | ||||||||||
| Total assets | 2,045,885 | 2,965,430 | ||||||||||
| Current liabilities | ||||||||||||
| Trade and other payables | 11 | 66,474 | 78,430 | |||||||||
| Income tax payable | - | 12,346 | ||||||||||
| Current provisions | 12 | 68,662 | 41,781 | |||||||||
| Total current liabilities | 135,136 | 132,557 | ||||||||||
| Non-current provisions | 12 | 1,025,025 | 604,048 | |||||||||
| Total liabilities | 1,160,161 | 736,605 | ||||||||||
| Partners' equity, net | ||||||||||||
| Partners' contributions | 13 | 398,216 | 398,216 | |||||||||
| Additional paid-in-capital | 226 | 226 | ||||||||||
| Retained earnings | 487,282 | 1,830,383 | ||||||||||
| Total equity | 885,724 | 2,228,825 | ||||||||||
| Total liabilities and partners’ equity, net | 2,045,885 | 2,965,430 | ||||||||||
| F- 106 |
Minera Yanacocha S.R.L. and Subsidiary
Consolidated statements of comprehensive income
For the years ended December 31, 2016, 2015 and 2014
| Note | 2016 | 2015 | 2014 | |||||||||||||
| US$(000) | US$(000) | US$(000) | ||||||||||||||
| Operating income | ||||||||||||||||
| Revenue from sales | 15 | 761,193 | 1,031,174 | 1,165,299 | ||||||||||||
| Other operating income | 17,713 | 10,625 | 30,300 | |||||||||||||
| Total gross income | 778,906 | 1,041,799 | 1,195,599 | |||||||||||||
| Operating costs | ||||||||||||||||
| Costs applicable to sales | 16 | (776,394 | ) | (751,736 | ) | (920,300 | ) | |||||||||
| Other operating costs | (2,951 | ) | (2,524 | ) | (22,422 | ) | ||||||||||
| Total operating costs | (779,345 | ) | (754,260 | ) | (942,722 | ) | ||||||||||
| Gross (loss) profit | (439 | ) | 287,539 | 252,877 | ||||||||||||
| Operating expenses | ||||||||||||||||
| Operating expenses, net | 17 | (71,496 | ) | (82,846 | ) | (77,781 | ) | |||||||||
| Administrative expenses | 18 | (8,780 | ) | (26,325 | ) | (38,262 | ) | |||||||||
| Selling expenses | (3,695 | ) | (3,534 | ) | (4,458 | ) | ||||||||||
| Impairment loss | 10(b) | (889,499 | ) | - | (541,141 | ) | ||||||||||
| Total operating expenses | (973,470 | ) | (112,705 | ) | (661,642 | ) | ||||||||||
| Operating (loss) profit | (973,909 | ) | 174,834 | (408,765 | ) | |||||||||||
| Other expenses, net | ||||||||||||||||
| Finance income | 2,132 | 673 | 298 | |||||||||||||
| Finance costs | 19 | (15,107 | ) | (22,734 | ) | (23,504 | ) | |||||||||
| Net (loss) gain from currency exchange difference | (13,741 | ) | (251 | ) | 1,142 | |||||||||||
| Total other expenses, net | (26,716 | ) | (22,312 | ) | (22,064 | ) | ||||||||||
| (Loss) income before income tax | (1,000,625 | ) | 152,522 | (430,829 | ) | |||||||||||
| Income tax (expense) benefit | 14(c) | (43,127 | ) | (602,717 | ) | 30,491 | ||||||||||
| Loss for the year | (1,043,752 | ) | (450,195 | ) | (400,338 | ) | ||||||||||
| Comprehensive loss: | ||||||||||||||||
| Loss for the year | (1,043,752 | ) | (450,195 | ) | (400,338 | ) | ||||||||||
| Other comprehensive income (loss) to be reclassified as profit or loss in subsequent periods: | ||||||||||||||||
| Changes in the fair value of available-for-sale financial asset, net of tax effect | 9 | 651 | (757 | ) | 65 | |||||||||||
| Total comprehensive loss for the year | (1,043,101 | ) | (450,952 | ) | (400,273 | ) | ||||||||||
| F- 107 |
Minera Yanacocha S.R.L. and Subsidiary
Consolidated statements of changes in equity
For the years ended December 31, 2016, 2015 and 2014
|
Capital
stock |
Adicional Paid-
in-capital |
Retanied
earnings |
Total | |||||||||||||
| US$(000) | US$(000) | US$(000) | US$(000) | |||||||||||||
| As of January 1, 2014 | 398,216 | 226 | 2,681,608 | 3,080,050 | ||||||||||||
| Loss for the year | - | - | (400,338 | ) | (400,338 | ) | ||||||||||
| Other comprehensive income for the year | - | - | 65 | 65 | ||||||||||||
| Total comprehensive loss | - | - | (400,273 | ) | (400,273 | ) | ||||||||||
| As of December 31, 2014 | 398,216 | 226 | 2,281,335 | 2,679,777 | ||||||||||||
| Loss for the year | - | - | (450,195 | ) | (450,195 | ) | ||||||||||
| Other comprehensive loss for the year | - | - | (757 | ) | (757 | ) | ||||||||||
| Total comprehensive loss | - | - | (450,952 | ) | (450,952 | ) | ||||||||||
| As of December 31,2015 | 398,216 | 226 | 1,830,383 | 2,228,825 | ||||||||||||
| Loss for the year | - | - | (1,043,752 | ) | (1,043,752 | ) | ||||||||||
| Other comprehensive income for the year | - | - | 651 | 651 | ||||||||||||
| Total comprehensive loss | - | - | (1,043,101 | ) | (1,043,101 | ) | ||||||||||
| Dividends declared and paid, note 13(c) | - | - | (300,000 | ) | (300,000 | ) | ||||||||||
| As of December 31, 2016 | 398,216 | 226 | 487,282 | 885,724 | ||||||||||||
| F- 108 |
Minera Yanacocha S.R.L. and Subsidiary
Consolidated statement of cash flows
For the years ended December 31, 2016, 2015 and 2014
| Note | 2016 | 2015 | 2014 | |||||||||||||
| US$(000) | US$(000) | US$(000) | ||||||||||||||
| Cash flow from operating activities | ||||||||||||||||
| Loss for the year | (1,043,752 | ) | (450,195 | ) | (400,338 | ) | ||||||||||
| Adjustments to reconcile profit after income tax to net cash flows from operating activities: | ||||||||||||||||
| Impairment loss | 10 | 889,499 | - | 541,141 | ||||||||||||
| Depreciation and amortization | 140,712 | 223,142 | 360,334 | |||||||||||||
| Deferred income tax | - | 483,804 | (168,761 | ) | ||||||||||||
| Unwinding of discount of the provision for reclamation | 12(b) | 14,104 | 22,075 | 22,914 | ||||||||||||
| Write-off of fixed assets | 17 | 14,036 | 2,411 | 3,520 | ||||||||||||
| Loss (gain) for fixed asset sales | (311 | ) | 508 | (1,226 | ) | |||||||||||
| Write-down of ore on leach pads to realizable value | 8(b) | 100,179 | 64,497 | 95,859 | ||||||||||||
| Reversal of the write-down of ore on leach pads to realizable value | 8(b) | (106,103 | ) | (137,293 | ) | (80,107 | ) | |||||||||
| Allowance for obsolescence of materials and supplies | 7(b) | (609 | ) | 1,049 | (736 | ) | ||||||||||
| Working capital adjustments: | ||||||||||||||||
| Net (increase) decrease in operating assets: | ||||||||||||||||
| Trade and other receivables | (14,586 | ) | 41,842 | 28,382 | ||||||||||||
| Prepaid Income Tax | (18,175 | ) | - | - | ||||||||||||
| Value added tax credit | 7,414 | 3,701 | 36,606 | |||||||||||||
| Inventories and Stockpiles and ore on leach pads | 99,237 | 120,113 | 15,252 | |||||||||||||
| Prepaid expenses | 180 | 160 | 1,650 | |||||||||||||
| Available for sale financial assets | 9 | (651 | ) | 1,081 | (93 | ) | ||||||||||
| Net (increase) decrease in operating liabilities: | ||||||||||||||||
| Trade and other payables | (10,654 | ) | (60,569 | ) | 6,910 | |||||||||||
| Income tax payable | (12,346 | ) | (23,090 | ) | (29,264 | ) | ||||||||||
| Provisions | 92,493 | (7,779 | ) | (46,435 | ) | |||||||||||
| Reclamation liabilities paid | 12(b) | (10,467 | ) | (11,007 | ) | (10,419 | ) | |||||||||
| Net cash and cash equivalents provided by operating activities | 140,200 | 274,450 | 375,189 | |||||||||||||
| Cash flow from investing activities | ||||||||||||||||
| Purchase of property, plant and equipment | (106,908 | ) | (118,429 | ) | (216,181 | ) | ||||||||||
| Proceeds from sale of property, plant and equipment | 471 | 1,116 | 40,651 | |||||||||||||
| Net cash and cash equivalents used in investing activities | (106,437 | ) | (117,313 | ) | (175,530 | ) | ||||||||||
| Cash flow from financing activities | ||||||||||||||||
| Dividends declared and paid | 13(c) | (300,000 | ) | - | - | |||||||||||
| Net cash and cash equivalents used in financing activities | (300,000 | ) | - | - | ||||||||||||
| Net (decrease) increase in cash and cash equivalents | (266,237 | ) | 157,137 | 199,659 | ||||||||||||
| Cash and cash equivalents at beginning of year | 943,761 | 786,624 | 586,965 | |||||||||||||
| Cash and cash equivalents at end of year | 677,524 | 943,761 | 786,624 | |||||||||||||
| Transactions with no effects in cash flows: | ||||||||||||||||
| Addition of asset retirement and mine closure | 351,798 | 10,434 | 64,520 | |||||||||||||
| F- 109 |
Minera Yanacocha S.R.L. and Subsidiary
Notes to the consolidated financial statements
For the years 2016, 2015 and 2014
| 1. | Identification and business activities of the Company |
| (a) | Identification - |
Minera Yanacocha S.R.L. hereinafter “the Company”, was incorporated in Peru on January 14, 1992 and commenced operations in 1993. The Company is engaged in the production of gold and exploration and development of gold and copper under the mining concessions it owns or that are owned by S.M.R.L. Chaupiloma Dos de Cajamarca ("Chaupiloma").
The Company is 51.35% owned by Newmont Second Capital Corporation, a 100% indirectly owned subsidiary of Newmont Mining Corporation ("Newmont", the ultimate Parent company), 43.65% owned by Compañia Minera Condesa S.A., which is 100% owned by Compañia de Minas Buenaventura S.A.A. (“Buenaventura”) and 5% owned by the International Finance Corporation.
The majority Partners of the Company (or their affiliates) also own the majority interest in Chaupiloma. In accordance with a mining lease, amended and effective on January 1, 1994, the Company pays Chaupiloma a 3% royalty based on quarterly production soId at current market prices, after deducting refinery and transportation costs. The royalty agreement expires in 2032.
| (b) | Business activities- |
The Company's operations are located near Cajamarca, province of Peru and currently include the following open pit mines: Chaquicocha, Cerro Yanacocha, La Quinua Complex (La Quinua, El Tapado, El Tapado Oeste), Wester Oxide pits (La Quinua Sur and Cerro Negro Oeste), Eastern Oxide pits (Quecher Norte) and Carachugo Alto. Mining activities in Maqui Maqui, Marleny and Cerro Negro Este ceased during 2016. The Company has four leach pads, three processing facilities, and one mill. Gold-bearing ores are transported to one of four leach pads for gold recovery using conventional heap-leaching or milling, followed by Merrill - Crowe zinc precipitation and smelting where a final doré product is poured. The dore is then shipped offsite for refining and is sold on the worldwide gold markets.
Gold mining requires the use of specialized facilities and technology. The Company relies heavily on such facilities and technology to maintain production levels. Also, the cash flows and profitability of the Company's operations are significantly affected by the market price of gold. Gold prices can fluctuate widely and are affected by numerous factors beyond the Company's control. During 2016, 2015 and 2014, the Company produced 0.66 million, 0.92 million and 0.97 million ounces of gold, respectively.
Conga project
The Conga Project consists of two gold-copper porphyry deposits located northeast of the Yanacocha operating area in the provinces of Celendin, Cajamarca and Hualgayoc. There is no exploration and/or development of new reserves as development of the project's development and reserve balances reported for Conga in 2014 were reclassified to mineral resources in 2015.
| F- 110 |
Notes to the consolidated financial statements (continued)
As a result of local political and community protests, construction and development activities at the Conga project were largely suspended in November 2011. The results of the Peruvian Central Government’s initiated Environmental Impact Assessment (“EIA”) independent review were reported on April 20, 2012. The review indicated the project’s EIA met Peruvian and International Standards. The review made recommendations to provide additional water capacity and social funds, which Yanacocha has largely accepted. Yanacocha announced the decision to move the project forward on a “water-first” approach on June 22, 2012. In the first half of 2014, a Conga Restart Study was completed to identify and test alternatives to advancing development of the project. Following this assessment, a new plan was developed to reduce spending to focus on only the most critical work – protecting people and assets, engaging with communities, and maintaining existing project infrastructure – while maintaining optionality. Newmont will not proceed with the full development of Conga without social acceptance, solid project economics and potentially another partner to help defray costs and risk; it is currently difficult to predict when or whether such events may occur. Under the current social and political environment, the Company does not anticipate being able to develop Conga for at least the next five years. Should the Company be unable to develop the Conga Project, the Company may have to consider other alternatives for the project which may result in an impairment. The total assets at Conga as of December 31, 2016 and 2015 were US$502.8 million and US$501.4 million, respectively.
| (c) | Approval of consolidated financial statements - |
The consolidated financial statements as of December 31, 2016 were approved by the Company’s Management on February 28, 2017 and, in its opinion, will be approved without changes at the Partners’ Meeting to be held within the terms established by Law.
The consolidated financial statements as of December 31, 2015 and 2014 were issued with the approval of the Partners’ Meeting held on March 31, 2016 and March 26, 2015, respectively.
| 2. | Basis for preparation, consolidation and accounting policies |
| 2.1. | Basis of preparation - |
The consolidated financial statements of the Company have been prepared in accordance with International Financial Reporting Standards (“IFRS”) issued by the International Accounting Standard Board (“IASB”) and interpretations issued by the IFRS Interpretations Committee (“IFRIC”), in effect at December 31, 2016.
The consolidated financial statements have been prepared under the historical cost basis, except for available-for-sale financial assets which are measured at their fair value.
The consolidated financial statements are presented in U.S. dollars and all values are rounded to the nearest thousands, except when otherwise indicated.
The preparation of consolidated financial statements requires that Management use judgments, estimates and assumptions, as detailed in note 3.
These consolidated financial statements provide comparative information in respect of prior periods.
| 2.2. | Basis of consolidation - |
The consolidated financial statements comprise the financial statements of the Company and its subsidiary (San Jose Reservoir Trust, a separate legal entity created to ensure the continuity of the Company’s operations in the San Jose Reservoir after 2018).
| F- 111 |
Notes to the consolidated financial statements (continued)
Control is achieved when the Company is exposed, or has rights, to variable returns from its involvement with the investee and has the ability to affect those returns through its power over the investee. Specifically, the Company controls an investee if, and only if, the Company has:
| - | Power over the investee (i.e., existing rights that give it the current ability to direct the relevant activities of the investee). |
| - | Exposure, or rights, to variable returns from its involvement with the investee. |
| - | The ability to use its power over the investee to affect its returns. |
Generally, there is a presumption that a majority of voting rights result in control. To support this presumption and when the Company has less than a majority of the voting or similar rights of an investee, the Company considers all relevant facts and circumstances in assessing whether it has power over an investee, including:
| - | The contractual arrangement with the other vote holders of the investee. |
| - | Rights arising from other contractual arrangements. |
| - | The Company’s voting rights and potential voting rights or a combination of rights. |
The Company re-assesses whether or not it controls an investee if facts and circumstances indicate that there are changes to one or more of the three elements of control. Consolidation of a subsidiary begins when the Company obtains control over the subsidiary and ceases when the Company loses control of the subsidiary. Assets, liabilities, income and expenses of a subsidiary acquired or disposed of during the year are included in the consolidated financial statements from the date the Company gains control until the date the Company ceases to control the subsidiary.
When necessary, adjustments are made to the financial statements of the subsidiary to bring its accounting policies into line with the Company’s accounting policies.
All intra-group assets and liabilities, equity, income, expenses and cash flows are eliminated in full on consolidation.
A change in the ownership interest of a subsidiary, without a loss of control, is accounted for as an equity transaction.
| F- 112 |
Notes to the consolidated financial statements (continued)
| 2.3. | Changes in accounting policies and disclosures - |
Certain standards and amendments are effective for annual periods beginning on or after January 1, 2016. However, they do not impact the annual consolidated financial statements of the Company and, hence, have not been disclosed. The Company has not early adopted any standard, interpretation or amendment that has been issued but is not yet effective.
| 2.4. | Summary of significant accounting policies and practices - |
| (a) | Foreign currencies - |
The consolidated financial statements are presented in U.S. dollars, which is also the Company's functional currency.
Transactions and balance
Transactions in foreign currency (a currency other than functional currency) are initially recorded by the Company at the exchange rates prevailing at the time of the transactions.
Monetary assets and liabilities denominated in other currencies are translated into the U.S. dollar at exchange rates prevailing at the statements of financial position dates. Gains or losses from exchange differences arising from the settlement or translation of monetary assets and liabilities are recognized in the consolidated statements of comprehensive income. Non-monetary assets and liabilities recognized in terms of historical cost are translated using the exchange rates prevailing at the dates of the initial transactions.
| (b) | Financial instruments - Initial recognition and subsequent measurement - |
A financial instrument is any contract that gives rise to a financial asset of one entity and a financial liability or equity instrument of another entity.
| (i) | Financial assets - |
Initial recognition and measurement
Financial assets are classified, at initial recognition, as financial assets at fair value through profit or loss, loans and receivables, held-to-maturity investments, available-for-sale financial assets, or derivatives designated as hedging instruments in an effective hedge, as appropriate. All financial assets are recognized initially at fair value plus, in the case of financial assets not recorded at fair value through profit or loss, transaction costs that are attributable to the acquisition of the financial asset.
Financial assets of the Company comprise cash and cash equivalents, trade and other receivables, net and available-for-sale financial assets.
| F- 113 |
Notes to the consolidated financial statements (continued)
Subsequent measurement -
For purposes of subsequent measurement, financial assets are classified in four categories:
| - | Financial assets at fair value through profit or loss. |
| - | Loans and receivables. |
| - | Held-to-maturity investments. |
| - | Available-for-sale financial investments. |
Financial assets at fair value through profit or loss -
Financial assets at fair value through profit or loss include financial assets held for trading and financial assets designated upon initial recognition at fair value through profit or loss. Financial assets are classified as held for trading if they are acquired for the purpose of selling or repurchasing in the near term. Derivatives, including separated embedded derivatives, are also classified as held for trading unless they are designated as effective hedging instruments as defined by IAS 39.
Financial assets at fair value through profit or loss are carried in the consolidated statements of financial position at fair value with net changes in fair value presented as finance costs (negative changes) or finance revenue (positive changes) in the consolidated statements of comprehensive income.
Derivatives embedded in host contracts are accounted for as separate derivatives and recorded at fair value if their economic characteristics and risks are not closely related to those of the host contracts and the host contracts are not held for trading or designated at fair value though profit or loss. These embedded derivatives are measured at fair value, with changes in fair value recognized in profit or loss.
Loans and receivables -
Loans and receivables are non-derivative financial assets with fixed or determinable payments that are not quoted in an active market. After initial measurement, such financial assets are subsequently measured at amortized cost using the effective interest rate method, less impairment. The losses arising from impairment are recognized in the consolidated statements of profit or loss.
This category generally applies to trade and other receivables, net. See note 6 for more information on accounts receivable.
Held-to-maturity investments -
Non-derivative financial assets with fixed or determinable payments and fixed maturities are classified as held to maturity when the Company has the positive intention and ability to hold them to maturity. The Company did not have any held-to-maturity investments as of December 31, 2016 and 2015.
| F- 114 |
Notes to the consolidated financial statements (continued)
Available-for-sale (AFS) financial assets -
The available-for-sale financial assets include equity investments and debt securities. Equity investments classified as available-for-sale are those that are neither classified as held for trading nor designated at fair value through profit or loss. Debt securities in this category are those that are intended to be held for an indefinite period of time and may be sold in response to needs for liquidity, or in response to changes in the market conditions (Note 9).
After initial measurement, AFS financial investments are subsequently measured at fair value with unrealized gains or losses recognized in other comprehensive income and credited in the unrealized gain on available-for-sale investments until investment is derecognized, at which time the cumulative gain or loss is recognized in other operating income, or the investment is determined to be impaired, when the cumulative loss is reclassified from the AFS reserve to the consolidated statement of profit or loss in finance costs. Interest earned whilst holding AFS financial investments is reported as interest income using the effective interest rate method.
Derecognition -
A financial asset (or, where applicable a part of a financial asset or part of a group of similar financial assets) is primarily derecognized when:
| - | The rights to receive cash flows from the asset have expired. |
| - | The Company has transferred its rights to receive cash flows from the asset or has assumed an obligation to pay the received cash flows in full without material delay to a third party under a pass-through arrangement; and either (a) the Company has transferred substantially all the risks and rewards of the asset or, (b) the Company has neither transferred nor retained substantially all the risks and rewards of the asset, but has transferred control of the asset. |
When the Company has transferred its rights to receive cash flows from an asset or has entered into a pass-through arrangement, it evaluates if and to what extent, it has retained the risk and rewards of ownership. When it has neither transferred nor retained substantially all of the risks and rewards of the asset, nor transferred control of the asset, the Company continues to recognize the transferred asset to the extent of the Company´s continuing involvement. In that case, the Company also recognizes an associated liability. The transferred asset and the associated liability are measured on a basis that reflects the rights and obligations that the Company has retained.
Impairment of financial assets -
The Company assesses, at each reporting date, whether there is objective evidence that a financial asset or group of financial assets is impaired. An impairment exists if one or more events that has occurred since the initial recognition of the asset (an incurred "loss event") has an impact on the estimated future cash flows of the financial asset or the group of financial assets that can be reliably estimated.
Evidence of impairment may include indications that the debtors or a group of debtors is experiencing significant financial difficulty, default or delinquency in interest or principal payments, the probability that they will enter bankruptcy or other financial reorganization and observable data indicating that there is a measurable decrease in the estimated future cash flows, such as changes in economic conditions that correlate with defaults.
| F- 115 |
Notes to the consolidated financial statements (continued)
Financial assets carried at amortized cost
For financial assets carried at amortized cost, the Company first assesses whether impairment exists individually for financial assets that are individually significant, or collectively for financial assets that are not individually significant. If the Company determines that no objective evidence of impairment exists for an individually assessed financial asset, whether significant or not, it includes the asset in a group of financial assets with similar credit risk characteristics and collectively assesses them for impairment. Assets that are individually assessed for impairment and for which an impairment loss is, or continues to be, recognized are not included in a collective assessment of impairment. Assets that are individually assessed for impairment and for which an impairment loss is, or continues to be, recognized are not included in a collective assessment of impairment.
The amount of any impairment loss identified is measured as the difference between the assets’ carrying amount and the present value of estimated future cash flows (excluding future expected credit losses that have not yet been incurred). The present value of the estimated future cash flows is discounted at the financial asset’s original effective interest rate. If a loan has a variable interest rate, the discount rate for measuring any impairment loss is the current effective interest rate.
The carrying amount of the asset is reduced through the use of an allowance account and the amount of the loss is recognized in the consolidated statement of profit or loss. Interest income (recorded as finance income in the consolidated statement of profit or loss) continues to be accrued on the reduced carrying amount and is accrued using the rate of interest used to discount the future cash flows for the purpose of measuring the impairment loss. Loans together with the associated allowance are written off when there is no realistic prospect of future recovery and all collateral has been realized or has been transferred to the Company. If, in a subsequent year, the amount of the estimated impairment loss increases or decreases because of an event occurring after the impairment was recognized, the previously recognized impairment loss is increased or reduced by adjusting the allowance account. Any amount that would have been decommissioned and is subsequently recovered is recovery is credited less finance costs in the consolidated statement of profit or loss.
| F- 116 |
Notes to the consolidated financial statements (continued)
Available-for-sale (AFS) financial investments
For AFS financial investments, the Company assesses at each reporting date whether there is objective evidence that an investment or a group of investments is impaired.
In the case of equity investments classified as AFS, objective evidence would include a significant or prolonged decline in the fair value of the investment below its cost. “Significant” is evaluated against the original cost of the investment and “prolonged” against the period in which the fair value has been below its original cost. Where there is evidence of impairment, the cumulative loss measured as the difference between the acquisition cost and the current fair value, less any impairment loss on that investment previously recognized in the consolidated statement of profit or loss is removed from other comprehensive income and recognized in the consolidated statement of profit or loss. Impairment losses on equity investment are not reversed through profit or loss; increases in their fair value after impairment are recognized in other comprehensive income.
| (ii) | Financial liabilities – |
Initial recognition and measurement -
Financial liabilities are classified, at initial recognition, as financial liabilities at fair value through profit or loss, accounts payable, financial obligations, or as derivatives designated as hedging instruments in an effective hedge, as appropriate.
All financial liabilities are recognized initially at fair value and, in the case of interest-bearing loans and borrowings and payables, net of directly attributable transaction costs.
The Company’s financial liabilities include trade and other payables, and embedded derivatives related to mineral sales.
Subsequent measurement -
The measurement of financial liabilities depends on their classification. Trade and other payables are subsequently measured at amortized cost.
Derecognition -
A financial liability is derecognized when the obligation under the liability is discharged, cancelled or expires.
When an existing financial liability is replaced by another from the same lender on substantially different terms, or the terms of an existing liability are substantially modified, such an exchange or modification is treated as the derecognition of the original liability and the recognition of a new liability. The difference in the respective carrying amounts is recognized in the consolidated statements of comprehensive income.
| F- 117 |
Notes to the consolidated financial statements (continued)
| (iii) | Offsetting of financial instruments - |
Financial assets and financial liabilities are offset and the net amount is reported in the consolidated statements of financial position if there is a currently enforceable legal right to offset the recognized amounts and there is an intention to settle on a net basis, to realize the assets and settle the liabilities simultaneously.
| (c) | Cash and cash equivalents - |
Cash and cash equivalents include cash in hand, deposits held at call with banks and other short-term highly liquid investments with original maturities of three months or less. Restricted cash is excluded from cash and cash equivalents and is included in other current assets or long-term assets depending on restrictions.
| (d) | Stockpiles, ore on leach pads and inventories - |
Costs that are incurred in or benefit
the productive process are accumulated as stockpiles, ore on leach pads and inventories. Stockpiles, ore on leach pads and inventories
are carried at the lower of average cost or net realizable value. Net realizable value represents the estimated future sales price
of the product based on current and long-term metals prices, less the estimated costs to complete production and bring the product
to sale. Write-downs of stockpiles, ore on leach pads and inventories to net realizable value are reported as a component of costs
applicable to sales. The current portion of stockpiles, ore on leach pads and inventories is determined based on the expected amounts
to be processed within the next twelve months. Stockpiles, ore on leach pads and inventories not expected to be processed within
the next twelve months are classified as
non-current. The major classifications are as follows:
| (i) | Stockpiles - |
Stockpiles represent ore that has been extracted from the mine and is available for further processing. Stockpiles are measured by estimating the number of tons added and removed from the stockpile, the number of contained ounces (based on assay data) and the estimated metallurgical recovery rates (based on the expected processing method). Stockpile ore tonnages are verified by periodic surveys. Costs are allocated to stockpiles based on relative values of material stockpiled and processed using current mining costs incurred up to the point of stockpiling the ore, including applicable overhead and depreciation and amortization relating to mining operations, and removed at each stockpile's average cost per recoverable unit as material is processed.
| (ii) | Ore on leach pads - |
The recovery of gold from certain gold oxide ores is achieved through the heap leaching process. Under this method, oxide ore is placed on leach pads where it is treated with a chemical solution, which dissolves the gold contained in the ore. The resulting gold-bearing solution is later processed in a plant where the gold is recovered. Costs are added to ore on leach pads based on current mining costs, including applicable overhead and depreciation and amortization relating to mining operations. Costs are removed from ore on leach pads as ounces are recovered based on the average cost per estimated recoverable ounce of gold on the leach pad.
The estimates of recoverable gold on the leach pads are calculated from the quantities of ore placed on the pads (measured tons added to the leach pads), the grade of ore placed on the leach pads (based on assay data) and a recovery percentage (based on ore type). In general, the leach pads recover between 50% and 95% of the ultimate recoverable ounces in the first year of leaching, declining each year thereafter until the leaching process is complete.
| F- 118 |
Notes to the consolidated financial statements (continued)
Although the quantities of recoverable gold placed on the leach pads are reconciled by comparing the grades of ore placed on the pads to the quantities of gold actually recovered (metallurgical balancing), the nature of the leaching process inherently limits the ability to precisely monitor inventory levels. As a result, the metallurgical balancing process is constantly monitored and estimates are refined based on actual results over time. Historically, the Company's operating results have not been materially impacted by variations between the estimated and actual recoverable quantities of gold on its leach pads. Variations between actual and estimated quantities resulting from changes in assumptions and estimates that do not result in write-downs to net realizable value are accounted for on a prospective basis.
| (iii) | In - process inventory - |
In-process inventories represent materials that are currently in the process of being converted to a saleable product. Conversion processes vary depending on the nature of the ore and the specific processing facility, and include mill in-circuit and leach in-circuit. In-process material is measured based on assays of the material fed into the process and the projected recoveries of the respective plants. In-process inventories are valued at the average cost of the material fed into the process attributable to the source material coming from the mines, stockpiles and/or leach pads plus the in- process conversion costs, including applicable amortization relating to the process facilities incurred to that point in the process.
| (iv) | Precious metals inventory - |
Precious metals include gold Dore and/or gold bullion. Precious metals that result from the Company's mining, processing activities are valued at the average cost of the respective in-process inventories incurred prior to the refining process, plus applicable refining costs.
| (v) | Materials and supplies - |
Materials and supplies are valued at the lower of average cost or replacement value. Cost includes applicable taxes and freight.
| F- 119 |
Notes to the consolidated financial statements (continued)
| (e) | Property, plant and equipment - |
The cost of an element of property, plant and equipment comprises the following: the acquisition price or manufacturing cost, including non-reimbursable customs and taxes and any cost necessary to place the asset in operating condition, as anticipated by Management; the initial estimate of the rehabilitation obligation and; in the case of qualified assets, the financing costs.
The purchase price or construction cost corresponds to the total amount paid and fair value of any other consideration provided to acquire the asset. Subsequent costs attributable to property, plant and equipment are capitalized only when it is probable that future economic benefits associated with the item will flow to the Company and the cost of the item can be measured reliably, otherwise the cost is charged to production or expense.
Maintenance and repair expenses are charged to the production cost or expense, as necessary, in the period when incurred.
Expenses incurred to replace a component of an item or element of property, plant and equipment are capitalized separately, writing-off the carrying amount of the component being replaced. In the event the component replaced has not been considered as a separate component of the asset item, the replacement value of the new component is used to estimate the carrying amount of the assets being replaced.
Assets in the construction stage are capitalized as separate components. At their completion, the cost is transferred to the appropriate category. Work in progress is not depreciated.
Depreciation
Land is not depreciated. Other than land, depreciation of property, plant and equipment is calculated using the straight-line method to allocate their cost less their residual value over their estimated useful lives and in the case of assets assigned to the production process of Yanacocha, under the lower of that determined under the units of production method or the useful life of the mine, as follows:
| Land improvements | 25 years |
| Buildings | Between 5 and 25 years |
| Plant and equipment | Between 3 and 15 years |
| Vehicles | Between 3 and 5 years |
| Furniture and fittings | Between 3 and 10 years |
| Other equipment | Between 3 and 10 years |
| Computer equipment | Between 3 and 8 years |
| Assets retirement cost | Useful life of the mine and/or process facilities |
| F- 120 |
Notes to the consolidated financial statements (continued)
The assets' useful lives and residual values are reviewed, and adjusted if appropriate, at each date of the consolidated statement of financial position. Any changes in these estimates are prospectively adjusted.
Disposal of assets
Property, plant and equipment items are written-off at the date they are sold or when no economic benefits are expected from their further use or sale. Gains and losses on disposals of assets are determined by comparing the proceeds with their carrying amounts. These gains or losses are included in the consolidated statements of comprehensive income.
| (f) | Mineral Interests - |
Mineral interests include acquired interests in production, development and exploration stage properties. The mineral interests are capitalized at their fair value at the acquisition date.
The value of such assets is primarily driven by the nature and amount of mineralized material believed to be contained in such properties. Production stage mineral interests represent interests in operating properties that contain proven and probable reserves. Development stage mineral interests represent interests in properties under development that contain proven and probable reserves.
Exploration stage mineral interests represent interests in properties that are believed to potentially contain mineralized material consisting of (i) mineralized material such as inferred material within pits; mineralized material with insufficient drill spacing to qualify as proven and probable reserves; and mineralized material in close proximity to proven and probable reserves; (ii) around-mine exploration potential not immediately adjacent to existing reserves and mineralization, but located within the immediate mine area; (iii) other mine-related exploration potential that is not part of current mineralized material and is comprised mainly of material outside of the immediate mine area; (iv) greenfield exploration potential that is not associated with any other production, development or exploration stage property, as described above; or (v) any acquired right to explore or extract a potential mineral deposit.
Exploration costs are capitalized when reserves at the location are declared in the Reserves and Resource information published annually by Newmont in its form 10-K. At this point, exploration costs are capitalized as mine development or as a component of property, plant and equipment, as appropriate.
The Company's mineral rights generally are enforceable regardless of whether proven and probable reserves have been established. The Company has the ability and intent to renew mineral interests where the existing term is not sufficient to recover all identified and valued proven and probable reserves and/or undeveloped mineralized material.
| F- 121 |
Notes to the consolidated financial statements (continued)
Mineral interests are presented in the caption of property, plant and equipment, net.
| (g) | Mine development - |
Mine development costs include engineering and metallurgical studies, drilling and other related costs to delineate an ore body, and the removal of overburden to initially expose an ore body at open pit surface mines. Costs incurred before mineralization is classified as proven and probable reserves are expensed and classified as Exploration or Advanced projects, research and development expense. Capitalization of mine development project costs, that meet the definition of an asset, begins once mineralization is classified as proven and probable reserves.
Drilling and related costs are capitalized for an ore body where proven and probable reserves exist; and the activities are directed at obtaining additional information on the ore body or converting mineralized material to proven and probable reserves. AII other drilling and related costs are expensed as incurred. Drilling costs incurred during the production phase for operational ore control are allocated to inventory costs and then included as a component of Costs applicable to sales.
The cost of removing overburden and waste materials to access the ore body at an open-pit mine prior to the production phase are referred to as "pre-stripping costs." Pre-stripping costs are capitalized during the development of an open-pit mine. Where multiple open pits exist at a mining complex utilizing common processing facilities, pre-stripping costs are capitalized at each pit. The removal and production of de minimis saleable materials may occur during development and are recorded as Other income, net of incremental mining and processing costs. See (h) below.
The production phase of an open-pit mine commences when saleable minerals, beyond a de minimis amount, are produced. Stripping costs incurred during the production phase of a mine are variable production costs that are included as a component of inventory to be recognized in Costs applicable to sales in the same period as the revenue from the sale of inventory. The Company's definition of a mine and the mine's production phase may differ from that of other companies in the mining industry resulting in incomparable allocations of stripping costs to deferred mine development and production costs.
Mine development costs are amortized using the units-of production ("UOP") method based on estimated recoverable ounces in proven and probable reserves. To the extent that these costs benefit an entire ore body, they are amortized over the estimated life of the ore body. Costs incurred to access specific ore blocks or areas that only provide benefit over the life of that area are amortized over the estimated life of that specific ore block or area.
Mine development costs are presented in the caption of Property, plant and equipment, net.
| F- 122 |
Notes to the consolidated financial statements (continued)
| (h) | Stripping activity asset - |
The Company accounts for stripping costs incurred during the production phase of a surface mining in accordance with IFRIC 20 "Stripping costs in the production phase of as surface mine" whereby a stripping asset is recognized if, and only if, all of the following are met:
| - | It is probable that the future economic benefit (improved access to the ore body) associated with the stripping activity will flow to the entity; |
| - | The entity can identify the component of the ore body for which access has been improved; and |
| - | The costs relating to the stripping activity associated with that component can be measured reliably. |
The primary components of the ore body on a pit by pit basis as well as within major pits are identified. Based on these components, stripping activities are analyzed and costs are assigned based on whether they pertained to current inventory production or improved access to future ore bodies (or components of an ore body).
Based on this analysis, the Company allocated the costs associated with improved access as a “stripping activity asset”. This allocation is based on the volume of waste and ore extracted in the period compared to expected volume life-of-mine per component of ore body.
Costs allocated to the production stripping activity asset are subsequently depreciated. Depreciation of the production stripping asset was calculated on a systematic basis ("waste-to-ore tons ratio") method over the expected useful life of the identified component of the ore body that becomes more accessible as a result of the stripping costs. This depreciation is a production cost.
| (i) | Impairment of non-financial assets - |
The carrying amounts of non-financial assets are reviewed for impairment whenever events or changes in circumstances indicate the carrying value may not be recoverable. If there are indicators of impairment, a review is undertaken to determine whether the carrying values are in excess of the recoverable amount. The recoverable amount is determined as the higher of an asset's fair value, less costs of disposal, and its value in use. Such review is undertaken on an asset by asset basis, except where such assets do not generate cash flows independently from other assets, in which case the review is undertaken at the cash generating unit level. The Company identified two separate cash generating units: Yanacocha and Conga.
Future cash flows are estimated based on quantities of recoverable minerals, expected gold and other commodity prices (considering current and historical prices, trends and related factors), production levels, operating costs, capital requirements and reclamation costs, all based on life-of-mine plans and the appropriate discount rate. These estimates, used in the determination of future cash flows, are based on numerous assumptions and it is possible that actual future cash flows will be significantly different than the estimates, as actual future quantities of recoverable minerals, gold and other commodity prices, production levels, costs and capital and interest rates are each subject to significant risks and uncertainties.
If the carrying amount of an asset exceeds its recoverable amount, an impairment loss is recorded in the statement of comprehensive income to reflect the asset at the lower amount. In assessing the recoverable amount for assets, the relevant future cash flows expected to arise from the fair value less costs of disposal have been discounted to their present value.
| F- 123 |
Notes to the consolidated financial statements (continued)
An impairment loss is reversed in the statement of comprehensive income if there is a change in estimate used to determine recoverable amount since the prior impairment loss was recognized.
The carrying amount of an asset is increased to the recoverable amount but not beyond the carrying amount net of depreciation or amortization which would have arisen if the prior impairment loss had not been recognized. After such a reversal the depreciation charge is adjusted in future periods to allocate the asset's revised carrying amount, less any residual value, on a systematic basis over its remaining useful life.
| (j) | Provisions - |
General -
Provisions are recognized when the Company has a present legal or constructive obligation as a result of past events, it is probable that an outflow of resources will be required to settle the obligation, and the amount has been reliably estimated. If the time value of money is significant, provisions are discounted using pre-tax rates, which reflect, when appropriate, the liabilities' specific risks. The reversal of the discount due to the passage of time originates the increase of the obligation which is recognized with a charge to the statement of comprehensive income as a finance cost.
Provisions are reviewed periodically and are adjusted to reflect the best estimate available as of the date of the consolidation statement of financial position. The expenses related to other provisions are presented in the consolidated statement of comprehensive income.
Disclosure of contingent obligations is provided when their existence will only be confirmed by future events or their amount cannot be reliably measured. Contingent assets are not recognized and are disclosed only if it is probable that the Company will generate future economic benefits.
Asset Retirement Obligation -
Reclamation obligations are recognized when incurred and recorded as liabilities at the best estimate of the expenditure required to settle the obligation. The liability is accreted over time through periodic charges to earnings. In addition, the asset retirement cost is capitalized as part of the asset's carrying value and amortized over the life of the related asset. Reclamation costs are periodically adjusted to reflect changes in the estimated present value resulting from the passage of time and revisions to the estimates of either the timing or amount of the reclamation costs. The estimated reclamation obligation is based on when spending for an existing disturbance is expected to occur. The Company reviews, on an annual basis, unless otherwise deemed necessary, the reclamation obligation at each mine site.
| (k) | Revenue recognition - |
Revenue from the sale of gold is recognized net of treatment and refining charges, when persuasive evidence of an arrangement exists, the price is determinable, the product has been delivered, risk and title has been transferred to the customer and collection of the sales price is reasonably assured.
Sales contracts for copper, silver and carbon incorporate provisional pricing at the date of delivery of the mineral ore. The final price is an average market price for a particular future period. Revenue from provisionally priced sales of copper, silver and carbon fine is recognized when risks and rewards of ownership are transferred to the customer, generally at the date of delivery, and revenue can be measured reliably. At this date, the amount of revenue to be recognized will be estimated based on the forward market price of the commodity being sold.
| F- 124 |
Notes to the consolidated financial statements (continued)
Revenues from silver and copper sales are credited to Costs applicable to sales as a by-product credit. Royalties paid based on revenue are charged to revenue.
| (l) | Taxes - |
Current income tax -
Current income tax assets and liabilities for the current and prior periods are measured at the amount expected to be recovered from, or paid to, the taxation authorities. The tax rates and tax laws used to compute the amount are those that are enacted or substantively enacted at the reporting date in Peru.
Current income tax relating to items recognized directly in other comprehensive income or equity is recognized in other comprehensive income or equity and not in profit or loss. Management periodically evaluates positions taken in the tax returns with respect to situations where applicable tax regulations are subject to interpretation and establishes provisions where appropriate.
Deferred income tax -
The Company accounts for income and mining taxes using the liability method, recognizing certain temporary differences between the financial reporting basis of the Company's liabilities and assets and the related income tax basis for such liabilities and assets. This method generates a net deferred income tax liability or net deferred income tax asset for the Company, as measured by the statutory tax rates in effect as enacted.
The Company derives its deferred income tax charge or benefit by recording the change in the net deferred income tax liability or net deferred income tax asset balance for the year, based on Peruvian income and mining tax laws. Royalty taxes are calculated based on operating profit, as such are shown as income tax.
The Company's deferred income tax assets include certain future tax benefits. The Company determines valuation allowance to any portion of those deferred income tax assets when it believes, based on the weight of available evidence, it is more likely than not that some portion or all of the deferred income tax asset will not be realized (Note 14).
Deferred income tax assets are recognized only to the extent that it is probable that future taxable profit will be available against which the temporary differences can be utilized.
Deferred income tax assets and liabilities are offset when there is a legally enforceable right to offset current tax assets against current tax liabilities and when the deferred income tax assets and liabilities relate to income taxes levied by the same taxation authority on either the same taxable entity or different taxable entities where there is an intention to settle the balances on a net basis.
Sales tax -
Expenses and assets are recognized net of the amount of sales tax, except:
| (i) | When the sales tax incurred on a purchase of assets or services is not recoverable from the taxation authority, in which case, the sales tax is recognized as part of the cost of acquisition of the asset or as part of the expense item, as applicable; |
| (ii) | When receivables and payables are stated with the amount of sales tax included. |
| F- 125 |
Notes to the consolidated financial statements (continued)
The net amount of sales tax recoverable from, or payable to, the taxation authority is included as part of receivables or payables in the consolidated statements of financial position.
| (m) | Fair value measurement - |
The Company measures its financial instruments, such as, derivatives and embedded derivatives, at fair value as of the date of the consolidated statements of financial position.
Fair value is the price that would be received to sell an asset, or paid to transfer a liability, in an orderly transaction between market participants at the measurement date. The fair value measurement is based on the presumption that the transaction to sell the asset or transfer the liability takes place either:
| - | In the principal market for the asset or liability, or |
| - | In the absence of a principal market, in the most advantageous market for the asset or liability. |
The Company uses valuation techniques that are appropriate in the circumstances and for which sufficient data are available to measure fair value, maximizing the use of relevant observable inputs and minimizing the use of unobservable inputs.
All assets and liabilities for which fair value is measured or disclosed in the consolidated financial statements are categorized within the fair value hierarchy, described, as follows, based on the lowest level input that is significant to the fair value measurement as a whole:
| - | Level 1 - Quoted (unadjusted) market prices in active markets for identical assets or liabilities. |
| - | Level 2 - Valuation techniques for which the lowest level input that is significant to the fair value measurement is directly or indirectly observable. |
| - | Level 3 - Valuation techniques for which the lowest level input that is significant to the fair value measurement is unobservable. |
For assets and liabilities that are recognized in the consolidated statements of financial position on a recurring basis, the Company determines whether transfers have occurred between levels in the hierarchy by reassessing categorization (based on the lowest-level input that is significant to the fair value measurement as a whole) at the end of each reporting period.
The Company's Management determines the policies and procedures for both recurring fair value measurement and non-recurring measurement. At each reporting date, the Company's Management analyzes the movements in the values of assets and liabilities which are required to be re-measured or re-assessed as per the Company’s accounting policies.
For the purpose of fair value disclosures, the Company has determined classes of assets and liabilities based on the nature, characteristics and risks of the asset or liability and the level of the fair value hierarchy as explained above.
| 3. | Significant judgments, estimates and assumptions |
The preparation of the Company’s consolidated financial statements requires Management to make judgments, estimates and assumptions that affect the reported amounts of revenues, expenses, assets and liabilities, and the accompanying disclosures, and the disclosure of contingent liabilities. The estimates and assumptions are continuously evaluated and based on Management’s experience and other facts, including the expectations about future events which are reasonable under the current situation. Uncertainty about these estimates and assumptions could result in outcomes that require material adjustment to the carrying amount of assets and liabilities affected in future periods. Further information on each of these areas and how they impact the various accounting policies are described below and also in the relevant notes to the consolidated financial statements.
| F- 126 |
Notes to the consolidated financial statements (continued)
| 3.1. | Judgments |
In the process of applying the Company’s accounting policies, Management has made the following judgments, which have the most significant effect on the amounts recognized in the consolidated financial statements:
| (a) | Contingencies - |
By their nature, contingencies will be resolved only when one or more uncertain future events occur or fail to occur. The assessment of the existence and potential quantum of contingencies inherently involves the exercise of significant judgment and the use of estimates regarding the outcome of future events.
| (b) | Development start date - |
The Company assesses the status of each exploration project to determine when the development phase begins. One of the criteria used to evaluate the development start date is when the Company determines that the property can be economically developed.
| (c) | Production start date - |
The Company assesses the stage of each mine under development to determine when a mine moves into the production phase. The determination of the start date is based on the unique nature of each mining project; such as the complexity of the project and its location. The Company considers various relevant criteria to assess when the production phase is considered to have commenced. Some of the criteria used to identify the production start date include, but are not limited to:
| - | Level of capital expenditure incurred compared to the original construction cost estimates. |
| - | Completion of a reasonable period of testing of the mine plant and equipment. |
| - | Ability to produce metal in saleable form (within specifications). |
| - | Ability to sustain ongoing production of metal. |
When a mine development /construction project moves into the production phase, the capitalization of certain mine development costs ceases and costs are either regarded as forming part of the cost of inventory or expensed, except for costs that qualify for capitalization relating to mining asset additions or improvements. It is also at this point that depreciation or amortization commences.
| 3.2. | Estimates and assumptions |
The key assumptions concerning the future and other key sources of estimation uncertainty at the reporting date that have a significant risk of causing a material adjustment to the carrying amounts of assets and liabilities within the next financial year, are described below. The Company based its assumptions and estimates on parameters available when the consolidated financial statements were prepared. Existing circumstances and assumptions about future developments, however, may change due to market change or circumstances arising beyond the control of the Company. Such changes are reflected in the assumptions when they occur.
| F- 127 |
Notes to the consolidated financial statements (continued)
| (a) | Determination of mineral reserves and resources - |
The Company calculates its reserves using methods generally applied by mining and industry according to international guidelines. All estimated reserves represent estimated quantities of mineral proven and probable that under current conditions can be economically and legally processed.
The process of estimating quantities of reserves is complex and requires making subjective decisions when evaluating all geological, geophysical, engineering and economic information available. Reviews could occur on reserve estimates due to, among others, revisions to the data or geological assumptions, changes in prices, production costs and results of exploration activities. Changes in estimated reserves could affect the carrying value of mining concessions, development costs and property, plant and equipment, the charges in result for depreciation and amortization, and the carrying amount of the provision for closure of mining units.
| (b) | Units of production depreciation - |
Estimated economically recoverable reserves are used in determining the depreciation and/or amortization of mine-specific assets.
This results in a depreciation/amortization charge proportional to the depletion of the anticipated remaining life-of-mine production. The life of each item, which is assessed at least annually, has regard to both its physical life limitations and present assessments of economically recoverable reserves of the mine property at which the asset is located. These calculations require the use of estimates and assumptions, including the amount of recoverable reserves. Changes in estimates are accounted for prospectively.
| (c) | Mine rehabilitation provision - |
The Company assesses its mine rehabilitation provision at each reporting date. The ultimate rehabilitation costs are uncertain, and cost estimates can vary in response to many factors, including estimates of the extent and costs of rehabilitation activities, technological changes, regulatory changes, cost increases as compared to the inflation rates, and changes in discount rates. These uncertainties may result in future actual expenditure differing from the amounts currently provided. The provision at reporting date represents Management’s best estimate of the present value of the future rehabilitation costs required.
| (d) | Inventories, net - |
Net realizable value tests are performed at each reporting date and represent the estimated future sales price of the product the entity expects to realize when the product is processed and sold, less estimated costs to complete production and bring the product to sale.
| F- 128 |
Notes to the consolidated financial statements (continued)
Stockpiles and ore on leach pads are measured by estimating the number of tons added and removed from the stockpile and leach pads, the number of contained gold ounces, assay data, and the estimated recovery percentage based on the expected processing method. Stockpile and ore on leach pad tonnages are verified by periodic surveys.
| (e) | Impairment of non-financial assets - |
The Company assesses each asset or cash generating unit in each reporting period to determine whether any indication of impairment exists. Where an indicator of impairment exists, a formal estimate of the recoverable amount is made, which is considered to be the higher of the fair value less costs of disposal and value in use. The assessments require the use of estimates and assumptions such as long-term commodity prices, discount rates and operating costs, among others. These estimates and assumptions are subject to risk and uncertainty.
The fair value of mining assets is calculated by the present value of future cash flows arising from the continued use of the asset, which include some estimates, such as the cost of future expansion plans, using assumptions that a third party might consider. The future cash flows are discounted to their present value using a discount rate that reflects current market assessment of the value of money over time, as well as specific risks of the asset or cash-generating unit under evaluation.
The Company has determined the operations of Yanacocha and Conga as the cash generating units.
| 4. | Standards issued but not effective |
The standards and interpretations that are issued, but not yet effective, up to the date of issuance of the Company’s financial statements that the Company reasonably expects will have an impact on its disclosures, financial position or performance when applied at a future date are disclosed below. The Company intends to adopt these standards, if applicable, when they become effective. Of the other standards and interpretations that are issued, but not yet effective, as these are not expected to impact the Company, they have not listed.
IFRS 9 Financial Instruments -
In July 2014, the IASB issued the final version of IFRS 9 Financial Instruments that replaces IAS 39 and all previous versions of IFRS 9. IFRS 9 brings together all three aspects of the accounting for financial instruments project: classification and measurement, impairment and hedge accounting. IFRS 9 is effective for annual periods beginning on or after January 1, 2018, with early application permitted. Except for hedge accounting, retrospective application is required, but the provision of comparative information is not compulsory. For hedge accounting, the requirements are generally applied prospectively, with some limited exceptions.
| F- 129 |
Notes to the consolidated financial statements (continued)
IFRS 15 Revenue from Contracts with Customers -
In May 2014, IFRS 15 was issued related to revenue from contracts with customers. The new standard provides a five-step approach to be applied to all contracts with customers and also requires expanded disclosures about revenue recognition. The effective date of IFRS is for annual periods, beginning on or after January 1, 2018. Early adoption is permitted.
The Company is currently performing an assessment of the revised standards and impacts on the Company’s Consolidated Financial Statements and disclosures. Management is still in the process of completing their assessment of the impacts; however, based on a preliminary analysis, the Company does not expect it to have a material impact on the Consolidated Financial Statements. Additionally, the Company continues to assess the potential impacts on insurance payments, variable consideration on concentrate sales, and refining fee classification under the new standard. Based on preliminary findings, the Company does not expect these areas to have a significant impact on revenue recognition. The Company expects to have an update to the impacts of the standard in second quarter of 2017.
The Company anticipates adopting the new standard effective January 1, 2018. Either a full retrospective application or a modified retrospective application, with the cumulative effect of initially applying the guidance recognized at the date of initial application, is required. The Company currently anticipates adopting the standard using the modified retrospective approach with the cumulative effect of initially applying the amended guidance recognized at January 1, 2018.
IFRS 16 Leases
IFRS 16 was issued in January 2016 and it replaces IAS 17 Leases. IFRS 16 sets out the principles for the recognition, measurement, presentation and disclosure of leases and requires lessees to account for all leases under a single on-balance sheet model similar to the accounting for finance leases under IAS 17. The standard includes two recognition exemptions for lessees – leases of ’low-value’ assets (e.g., personal computers) and short-term leases (i.e., leases with a lease term of 12 months or less). IFRS 16 is effective for annual periods beginning on or after 1 January 2019. Early application is permitted, but not before an entity applies IFRS 15.
In 2017, the Company plans to assess the potential effect of IFRS 16 on its consolidated financial statements.
| F- 130 |
Notes to the consolidated financial statements (continued)
| 5. | Cash and cash equivalents |
| (a) | This caption is made up as follows: |
| 2016 | 2015 | |||||||
| US$(000) | US$(000) | |||||||
| Petty cash | 45 | 51 | ||||||
| Bank accounts | 118,853 | 142,725 | ||||||
| Term deposits (b) | 558,626 | 800,985 | ||||||
| 677,524 | 943,761 | |||||||
The term deposits balance is made as follows:
| 2016 | 2015 | |||||||
| US$(000) | US$(000) | |||||||
| Citi Bank | 150,564 | 620,025 | ||||||
| JP Morgan | 408,062 | 180,960 | ||||||
| 558,626 | 800,985 | |||||||
| (b) | The bank accounts and term deposits yield interest at market rates. Because of the short maturity of these balances, less than 90 days, the carrying amounts approximate their fair value. |
| 6. | Trade and other receivables, net |
| (a) | This caption is made up as follows: |
| 2016 | 2015 | |||||||
| US$(000) | US$(000) | |||||||
| Trade receivables, net | ||||||||
| Foreign clients | 9,965 | 5,181 | ||||||
| Other receivables | ||||||||
| Advances to suppliers | 18,024 | 13,052 | ||||||
| Tax claims | 6,955 | 5,273 | ||||||
| Other minors | 6,623 | 4,079 | ||||||
| Related entities, note 21(b) | 815 | 248 | ||||||
| 32,417 | 22,652 | |||||||
| Allowance for doubtful accounts (b) | (1,407 | ) | (1,444 | ) | ||||
| 31,010 | 21,208 | |||||||
| Total trade and other receivables, net | 40,975 | 26,389 | ||||||
The trade and other receivables have current maturities.
| F- 131 |
Notes to the consolidated financial statements (continued)
There are no trade receivables that are due at December 31, 2016 and 2015.
| (b) | The allowance for doubtful accounts had the following movement during the years 2016, 2015 and 2014: |
| 2016 | 2015 | 2014 | ||||||||||
| US$(000) | US$(000) | US$(000) | ||||||||||
| Opening balance | 1,444 | 1,788 | 5,934 | |||||||||
| Additions | - | 88 | 812 | |||||||||
| Deductions | (37 | ) | (432 | ) | (4,958 | ) | ||||||
| Ending balance | 1,407 | 1,444 | 1,788 | |||||||||
In Company’s Management opinion, the allowance for doubtful accounts balance is sufficient to adequately cover the risks of failure as of the date of the consolidated statement of financial position.
| 7. | Inventories, net |
| (a) | This caption is made up as follows: |
| 2016 | 2015 | |||||||
| US$(000) | US$(000) | |||||||
| Precious metals | 15,012 | 404 | ||||||
| Leach in-circuit | 6,378 | 5,950 | ||||||
| Mill in-circuit | 2,493 | 1,580 | ||||||
| Materials and supplies | 52,687 | 54,711 | ||||||
| 76,570 | 62,645 | |||||||
| Allowance for obsolescence of materials and supplies (b) | (5,272 | ) | (5,881 | ) | ||||
| 71,298 | 56,764 | |||||||
| (b) | The allowance for obsolescence of material and supplies had the following movement during the years 2016, 2015 and 2014: |
| 2016 | 2015 | 2014 | ||||||||||
| US$(000) | US$(000) | US$(000) | ||||||||||
| Opening balance | 5,881 | 4,832 | 5,568 | |||||||||
| Provision for impairment of materials and supplies | 3,104 | 5,060 | 2,849 | |||||||||
| Reversal of provision for impairment of materials and supplies | (3,713 | ) | (4,011 | ) | (3,585 | ) | ||||||
| Ending balance | 5,272 | 5,881 | 4,832 | |||||||||
| F- 132 |
Notes to the consolidated financial statements (continued)
| 8. | Stockpiles and ore on leach pads, net |
| (a) | This caption is made up as follows: |
| 2016 | 2015 | |||||||
| US$(000) | US$(000) | |||||||
| Current portion - | ||||||||
| Stockpiles | 92,309 | 91,920 | ||||||
| Ore on leach pads | 209,471 | 210,517 | ||||||
| Provision for net realizable value adjustment (b) | (75,423 | ) | (64,827 | ) | ||||
| 226,357 | 237,610 | |||||||
| Non-current portion - | ||||||||
| Stockpiles | 41,997 | 95,484 | ||||||
| Ore on leach pads | 78,843 | 138,470 | ||||||
| Provision for net realizable value adjustment (b) | (8,951 | ) | (25,471 | ) | ||||
| 111,889 | 208,483 | |||||||
| (b) | The provision for net realizable value adjustment had the following movement during the years 2016, 2015 and 2014: |
| 2016 | 2015 | 2014 | ||||||||||
| US$(000) | US$(000) | US$(000) | ||||||||||
| Opening balance | 90,298 | 163,094 | 147,342 | |||||||||
| Provision, note 16 | 100,179 | 64,497 | 95,859 | |||||||||
| Reversal of provision | (106,103 | ) | (137,293 | ) | (80,107 | ) | ||||||
| Ending balance | 84,374 | 90,298 | 163,094 | |||||||||
| 9. | Available-for-sale financial assets |
In November 2008, the Company funded the San Jose Reservoir Trust for US$13 million to ensure the continuity of the Company's operations in the San Jose Reservoir after 2018. Such trust is irrevocable and is a separate legal entity of the Company. The grantor is the Company, the trustee is the Banco de Credito del Peru and the beneficiary is the Company; therefore, the Company consolidates the trust. As of December 31, 2016, the trust total balance is US$16,454,000 and is presented as Available-for-sale financial assets (trust total balance of US$15,803,000 as of December 31, 2015).
During 2016, these investments, denominated in U.S. dollars, accrued profits net of taxes of US$651,000 (losses of US$757,000 and profits of US$65,000 in 2015 and 2014, respectively) which are included in other comprehensive income (loss).
| F- 133 |
Notes to the consolidated financial statements (continued)
| 10. | Property, plant and equipment, net |
| (a) | Below is presented the movement in cost: |
|
Opening
balance |
Additions | Sales and disposals |
Transfer/Other
changes |
Impairment
loss |
Final
balances |
|||||||||||||||||||
| US$(000) | US$(000) | US$(000) | US$(000) | US$(000) | US$(000) | |||||||||||||||||||
| Year 2016 | ||||||||||||||||||||||||
| Cost- | ||||||||||||||||||||||||
| Land | 15,296 | - | - | 201 | (12,257 | ) | 3,240 | |||||||||||||||||
| Land improvements | 22,730 | - | - | - | (17,978 | ) | 4,752 | |||||||||||||||||
| Building and constructions | 674,480 | - | (26,410 | ) | 26,396 | (153,555 | ) | 520,911 | ||||||||||||||||
| Machinery and equipment | 322,690 | - | (122,618 | ) | 21,360 | (45,468 | ) | 175,964 | ||||||||||||||||
| Leach pads | 571,388 | - | - | 16,781 | (106,747 | ) | 481,422 | |||||||||||||||||
| Vehicles | 8,124 | - | (6,402 | ) | - | (6 | ) | 1,716 | ||||||||||||||||
| Furniture and fixtures | 2,031 | - | - | - | - | 2,031 | ||||||||||||||||||
| Other equipment | 68,983 | 353 | - | 217 | (3,631 | ) | 65,922 | |||||||||||||||||
| Work in progress | 600,355 | 78,609 | - | (70,282 | ) | - | 608,682 | |||||||||||||||||
| Mining rights | 33,800 | - | (3,313 | ) | - | (10,985 | ) | 19,502 | ||||||||||||||||
| Asset retirement and mine closure | 256,337 | 351,798 | - | - | (370,550 | ) | 237,585 | |||||||||||||||||
| Stripping activity asset | 176,517 | 26,148 | - | - | (32,631 | ) | 170,034 | |||||||||||||||||
| Mine development | 485,932 | - | - | 5,079 | (118,421 | ) | 372,590 | |||||||||||||||||
| 3,238,663 | 456,908 | (158,743 | ) | (248 | ) | (872,229 | ) | 2,664,351 | ||||||||||||||||
| Accumulated depreciation and amortization | ||||||||||||||||||||||||
| Land improvements | 10,478 | - | - | (511 | ) | - | 9,967 | |||||||||||||||||
| Building and constructions | 383,710 | 61,530 | (22,705 | ) | - | - | 422,535 | |||||||||||||||||
| Machinery and equipment | 213,062 | 22,694 | (112,175 | ) | - | - | 123,581 | |||||||||||||||||
| Leach pads | 545,921 | 12,501 | - | - | - | 558,422 | ||||||||||||||||||
| Vehicles | 7,775 | 2,735 | (6,352 | ) | - | - | 4,158 | |||||||||||||||||
| Furniture and fixtures | 2,002 | 9 | - | - | - | 2,011 | ||||||||||||||||||
| Other equipment | 57,470 | 1,425 | - | - | - | 58,895 | ||||||||||||||||||
| Mining rights | 19,744 | - | - | - | - | 19,744 | ||||||||||||||||||
| Asset retirement and mine closure | 169,237 | 18,768 | - | - | - | 188,005 | ||||||||||||||||||
| Stripping activity asset | 138,178 | 3,992 | - | - | - | 142,170 | ||||||||||||||||||
| Mine development | 326,476 | 8,745 | - | 511 | - | 335,732 | ||||||||||||||||||
| 1,874,053 | 132,399 | (141,232 | ) | - | - | 1,865,220 | ||||||||||||||||||
| Net cost | 1,364,610 | 799,131 | ||||||||||||||||||||||
| F- 134 |
Notes to the consolidated financial statements (continued)
|
Opening
balance |
Additions | Sales and disposals |
Transfer/Other
changes |
Final
balances |
||||||||||||||||
| US$(000) | US$(000) | US$(000) | US$(000) | US$(000) | ||||||||||||||||
| Year 2015 | ||||||||||||||||||||
| Cost- | ||||||||||||||||||||
| Land | 15,335 | - | (272 | ) | 233 | 15,296 | ||||||||||||||
| Land improvements | 22,730 | - | - | - | 22,730 | |||||||||||||||
| Building and constructions | 622,928 | - | (304 | ) | 51,856 | 674,480 | ||||||||||||||
| Machinery and equipment | 322,441 | - | (25,211 | ) | 25,460 | 322,690 | ||||||||||||||
| Leach pads | 571,388 | - | - | - | 571,388 | |||||||||||||||
| Vehicles | 9,278 | - | (1,186 | ) | 32 | 8,124 | ||||||||||||||
| Furniture and fixtures | 2,031 | - | - | - | 2,031 | |||||||||||||||
| Other equipment | 64,137 | 225 | (58 | ) | 4,679 | 68,983 | ||||||||||||||
| Work in progress | 593,906 | 99,336 | - | (92,887 | ) | 600,355 | ||||||||||||||
| Mining rights | 33,800 | - | - | - | 33,800 | |||||||||||||||
| Asset retirement and mine closure | 245,903 | 10,434 | - | - | 256,337 | |||||||||||||||
| Stripping activity asset | 157,649 | 18,868 | - | - | 176,517 | |||||||||||||||
| Mine development | 475,441 | - | - | 10,491 | 485,932 | |||||||||||||||
| 3,136,967 | 128,863 | (27,031 | ) | (136 | ) | 3,238,663 | ||||||||||||||
| Accumulated depreciation and amortization | ||||||||||||||||||||
| Land improvements | 15,812 | - | - | (5,334 | ) | 10,478 | ||||||||||||||
| Building and constructions | 310,906 | 72,899 | (95 | ) | - | 383,710 | ||||||||||||||
| Machinery and equipment | 213,795 | 20,999 | (21,732 | ) | - | 213,062 | ||||||||||||||
| Leach pads | 519,142 | 26,779 | - | - | 545,921 | |||||||||||||||
| Vehicles | 8,086 | 800 | (1,111 | ) | - | 7,775 | ||||||||||||||
| Furniture and fixtures | 1,991 | 11 | - | - | 2,002 | |||||||||||||||
| Other equipment | 55,928 | 1,600 | (58 | ) | - | 57,470 | ||||||||||||||
| Mining rights | 19,744 | - | - | - | 19,744 | |||||||||||||||
| Asset retirement and mine closure | 121,102 | 48,135 | - | - | 169,237 | |||||||||||||||
| Stripping activity asset | 138,178 | - | - | - | 138,178 | |||||||||||||||
| Mine development | 276,954 | 44,188 | - | 5,334 | 326,476 | |||||||||||||||
| 1,681,638 | 215,411 | (22,996 | ) | - | 1,874,053 | |||||||||||||||
| Net cost | 1,455,329 | 1,364,610 | ||||||||||||||||||
Additions to work in progress in 2016 are primarily related to the Water treatment project and Yanacocha Laybacks Checkpoint 2A and Asset Componetization project.
The depreciation and amortization expense for the year ended December 31, 2016 was recorded as Cost applicable to sales in the statement of comprehensive income.
| F- 135 |
Notes to the consolidated financial statements (continued)
| (b) | Impairment of long-lived assets |
I n accordance with its accounting policies and processes, each asset or Cash Generating Unit “CGU” is evaluated annually at year end, to determine whether there are any indications of impairment. If any such indications of impairment exist, a formal estimate of the recoverable amount is performed. The Company has two CGU: Yanacocha mine and Conga project.
In assessing whether impairment is required, the carrying value of the asset or CGU is compared with its recoverable amount. The recoverable amount is the higher of the CGU’s fair value less costs of disposal (FVLCD) and value in use (VIU). Given the nature of the Company’s activities, information on the fair value of an asset is usually difficult to obtain unless negotiations with potential purchasers or similar transactions are taking place. Consequently, the recoverable amount for each CGU is estimated based on estimated discounted future estimated cash flows expected to be generated from the continued use of the CGUs using market based commodity price and exchange assumptions, estimated quantities of recoverable minerals, production levels, operating costs and capital requirements, and its eventual disposal, based on the latest life of mine (LOM) plans. These cash flows are discounted using a real pre-tax discount rate that reflects current market assessments of the time value of money and the risks specific to the CGU.
Estimates include quantities of recoverable minerals, production levels, operating costs and capital requirements and sourced from out planning process, including the LOM plans, one-year budgets and CGU-specific studies.
As a result of the recoverable amount analysis performed during the year, the Company recorded an impairment loss related to Yanacocha mine of US$889.5 million (US$872.2 million and US$17.3 million related to property, plant and equipment and intangible assets, respectively). In 2015, Company did not recognize impairment loss. In 2014, the Company recorded an impairment loss amounting to US$541.1 million related to Conga project, and no loss was recorded for Yanacocha mine.
Key assumptions used for the impairment testing as of December 31, 2016:
The determination of value in use is most sensitive to the following key assumptions:
| - | Production volumes |
| - | Commodity prices |
| - | Discount rate |
Production volumes: Estimated production volumes are based on detailed life-of-mine plans and take into account development plans for the mines agreed by management as part of planning process. Production volumes are dependent on a number of variables, such as: the recoverable quantities; the production profile; the cost of the development of the infrastructure necessary to extract the reserves; the production costs; the contractual duration of mining rights; and the selling price of the commodities extracted.
| F- 136 |
Notes to the consolidated financial statements (continued)
As each producing mining unit has specific reserve characteristics and economic circumstances, the cash flows of the mines are computed using appropriate individual economic models and key assumptions established by management. The production profiles used were consistent with the reserves and resource volumes approved as part of the Company’s process for the estimation of proved and probable reserves and resource estimates.
Commodity prices: Forecasted commodity prices are based on management’s estimates and are derived from forward price curves and long-term views of global supply and demand, building on past experience of the industry and consistent with external sources. These prices were adjusted to arrive at appropriate consistent price assumptions for the different qualities and type of commodities, or, where appropriate, contracted prices were applied. These prices are reviewed at least annually.
Estimated prices for the current and long-term periods that have been used to estimate future revenues are as follows:
| Current | Long-term | |||||||
| US$ | US$ | |||||||
| Gold (per ounce) | 1,221 | 1,300 | ||||||
Discount rate: In calculating the value in use, a pre-tax discount rate of 7.1% was applied to the pre-tax cash flows. This discount rate is derived from the Company’s post-tax weighted average cost of capital (WACC), with appropriate adjustments made to reflect the risks specific to the CGU.
| 11. | Trade and other payables |
| (a) | This caption is made up as follows: |
| 2016 | 2015 | |||||||
| US$(000) | US$(000) | |||||||
| Trade payables (b) | ||||||||
| Domestic suppliers | 44,634 | 56,447 | ||||||
| Related entities, note 21(b) | 9,052 | 10,972 | ||||||
| 53,686 | 67,419 | |||||||
| Other payables | ||||||||
| Remuneration and similar benefits payable | 8,516 | 8,981 | ||||||
| Royalties payable to the Peruvian State | 1,098 | 1,541 | ||||||
| Taxes payable | 3,174 | 489 | ||||||
| 12,788 | 11,011 | |||||||
| 66,474 | 78,430 | |||||||
| F- 137 |
Notes to the consolidated financial statements (continued)
| (b) | Trade payables arise mainly from the acquisition of materials, supplies and spare parts and services provided by third parties. These obligations, have current maturities, accrue no interest, are not secured and are mostly denominated in U.S. dollars. |
| 12. | Provisions |
| (a) | This caption is made up as follows: |
| 2016 | 2015 | |||||||
| US$(000) | US$(000) | |||||||
| Provision for closure of mining units and exploration projects (b) | 1,012,888 | 578,959 | ||||||
| Provision of social responsability | 24,335 | 29,083 | ||||||
| Workers’ profit sharing payable (c) | 13,005 | 19,526 | ||||||
| Accrual of operating costs | 19,650 | 13,319 | ||||||
| Other provisions | 23,809 | 4,942 | ||||||
| 1,093,687 | 645,829 | |||||||
| Classification by maturity: | ||||||||
| Current portion | 68,662 | 41,781 | ||||||
| Non-current portion | 1,025,025 | 604,048 | ||||||
| 1,093,687 | 645,829 | |||||||
| (b) | Provision for closure of mining units and explorations projects |
The Company's mining and exploration activities are subject to various laws and regulations governing the protection of the environment. These laws and regulations are continually changing and are generally becoming more restrictive. The Company conducts its operations so as to protect the public health and environment and believes its operations are in compliance with all applicable laws and regulations in all material respects. The Company has made, and expects to make in the future, expenditures to comply with such laws and regulations, but cannot predict the amount of such future expenditures. Estimated future reclamation costs are based principally on legal and regulatory requirements.
The liability for reclamation or the Asset retirement obligation (“ARO”) comprises activities carried out by the Company in the restoration of mines and adjacent areas in the completion stage of the gold extraction process. Such activities include the restoration of mining locations, water treatment plant operations, as well as reforestation and land treatments.
| F- 138 |
Notes to the consolidated financial statements (continued)
The movement of the ARO for 2016, 2015 and 2014 is broken down as follows:
| 2016 | 2015 | 2014 | ||||||||||
| US$(000) | US$(000) | US$(000) | ||||||||||
| Opening balance | 578,959 | 557,457 | 460,127 | |||||||||
| Additional provisions | 430,292 | 10,434 | 84,835 | |||||||||
| Payments | (10,467 | ) | (11,007 | ) | (10,419 | ) | ||||||
| Unwinding of discount, note 19 | 14,104 | 22,075 | 22,914 | |||||||||
| Final balance | 1,012,888 | 578,959 | 557,457 | |||||||||
| Classification by maturity | ||||||||||||
| Current portion | 15,636 | 6,698 | 15,112 | |||||||||
| Non-current portion | 997,252 | 572,261 | 542,345 | |||||||||
| 1,012,888 | 578,959 | 557,457 | ||||||||||
The Company is conducting a comprehensive study of the current Yanacocha long-term mining and closure plans as part of the requirement to submit an updated closure plan to Peruvian regulators every five years. The revised closure plan will be submitted to Peruvian regulators in the second half of 2017. The revised closure plan may require the Company to provide additional reclamation bonding for Yanacocha.
On December 7, 2016, the Company presented its current assessment of the Yanacocha closure plan to the Board of Directors after completing its review of preliminary changes to Yanacocha closure plan based on revised long-term mining plans, the study work completed to date and in connection with the Company’s annual process to evaluate and update all asset retirement obligations. As a result, the Company recorded an increase to the reclamation obligation at Yanacocha of US$430 million. The increase to the reclamation obligation resulted in an increase to the recorded asset retirement cost asset of US$352 million related to the producing portions of the mine (note 10) and a non-cash charge to reclamation expense for the year ended December 31, 2016 of US$78 million related to the areas of Yanacocha’s operations no longer in production. The increase to the reclamation obligation is primarily due to higher estimated long-term water management costs, heap leach earthworks and related support activities.
The Company determined that an impairment indicator existed as a result of the updated long-term mining and closure plans and the related increases in estimated future closure costs that resulted in the increase to the asset retirement cost asset. As much, Yanacocha’s long-lived assets were tested for recoverability and an assessment of impairment was performed, which resulted in a non-cash impairment charge of US$889 million. See note 10 for further information regarding the impairment of long-lived assets recorded for Yanacocha as of December 31, 2016.
| F- 139 |
Notes to the consolidated financial statements (continued)
| (c) | Workers' profit sharing |
In accordance with Peruvian legislation, the Company maintains an employee profit sharing plan equal to 8% of annual taxable income. Distributions to employees under the plan are based 50% on the number of days that each employee worked during the preceding year and 50% on proportionate annual salary levels.
| 13. | Partners’ equity, net |
| (a) | Partners’ contributions - |
Partners’ contributions comprise 1,278,451,304 common partnership interests at par value of one Peruvian Sol each , fully subscribed and paid-in. Such partnership interest includes 720,407,310 shares that are owned by foreign investors.
Under current Peruvian regulations, there is no restriction on the remittance of dividends or repatriation of foreign investment, except as discussed in sections below.
The legal structure of the Company is that of a Peruvian limited liability partnership. Major features of such legal structure are: (i) the number of Partners cannot exceed 20, (ii) capital comprises the partnership interests, and (iii) there is no obligation to create a legal reserve.
| (b) | Retained earnings - |
Distribution of earnings to Partners other than legal entities domiciled in Peru is subject to a withholding income tax charged to the partners.
Until December 31, 2016, by Law N° 30296 published on December 31, 2014, for individuals and non-resident legal entities, the applicable tax rate was 6.8% for dividend distributions in cash or non-monetary assets for fiscal year 2016. Pursuant to Legislative Decree N° 1261, published on December 10, 2016 and effective as of January 1, 2017, the applicable tax rate to the distribution of cash dividends and non-monetary assets for the year 2017 onwards will be 5%.
| (c) | Dividends declared and paid - |
On February 15, 2016, the board of Directors unanimously agreed to distribute dividends in the amount of US$300 million, in proportion to its shareholding, which corresponds to a portion of the accumulated results as of December 31, 2014, which have been generated in 2011.
| 14. | Tax Situation |
| (a) | Tax stabilization agreements |
The Company has entered into the following tax stability agreements, each with a term of 15 years:
| Mine | Effective |
Date of the Tax
Agreement |
Tax Regimes in Force | |||
| Cerro Yanacocha | January 1, 2000 | September 16, 1998 | May 22, 1997 | |||
| La Quinua | January 1, 2004 | August 25, 2003 | August 25, 2003 |
| F- 140 |
Notes to the consolidated financial statements (continued)
The Cerro Yanacocha tax stabilization agreement expired on January 1, 2015 and is no longer in effect.
The agreement for La Quinua guarantees the Company's use of the tax regime shown in the table above and permits maintenance of its accounting records in U.S. dollars for tax purposes.
The Company determines taxable income based on its understanding and that of its legal advisors, of applicable tax legislation. Taxable income differs from pre-tax income disclosed within these financial statements by those items that the applicable tax legislation deems to be non-taxable or non-deductible.
The income tax rate at December 31, 2016 and 2015 is 28% on taxable income, after deducting the employee's share that is calculated at a rate of 8 percent on taxable income, except for the rate applied in La Quinua which was 29%.
On December 31, 2014, the Peruvian Government enacted modifications to Income Tax regulations, applicable beginning in 2015. Among the modifications, a progressive income tax rate reduction was approved as follows: 28% for fiscal years 2015 and 2016; 27% for fiscal years 2017 and 2018; and 26% from 2019, onward.
Pursuant to Legislative Decree N° 1261, published on December 10, 2016 and effective as of January 1, 2017, the applicable tax rate on the taxable income will be 29.5 percent.
| (b) | Other mining taxes |
| (i) | Law N°29788, Mining Royalties |
On 28 September 2011, the Peruvian Government enacted new legislation to comprise a new mining tax payable to the Peruvian Government for extracting metallic and non-metallic mineral resources from its mining concessions.
Pursuant to this legislation, the mining royalty is payable quarterly based on sales and operating profit determined in accordance with IFRS. The royalty amount due is 1% of revenue. An additional mining tax due is calculated based on the level of operating profit up to a maximum applicable rate of 12%. This component of the new mining tax only applies to those projects that are not covered by a tax stabilization agreement. During 2016, 2015 and 2014, the amounts included in cost of production related to mining royalties were US$3,742,000, US$8,291,000 and US$7,247,000, respectively and during 2016 and 2015 there were no amounts included in mining tax expense, in 2014 the amount included in mining tax expense was US$1,714,000.
| (ii) | Law N°29789, Special Mining Tax |
The Special Mining Tax ("IEM") applies to mines not covered by a tax stabilization agreement. The IEM is payable on a quarterly basis with rates ranging from 2% to 8.4% of operating profit determined, in accordance with IFRS.
| F- 141 |
Notes to the consolidated financial statements (continued)
The rate varies depending on the level of operating profit. During 2016, 2015 and 2014 the amounts included in income and mining tax expense were US$3,259,000, US$1,838,000 and US$5,479,000, respectively.
| (iii) | Law N°29790, Special Mining Burden |
The Special Mining Burden ("GEM") applies to mines covered by a tax stabilization agreement. The GEM is payable on a quarterly basis with rates ranging from 4% to 13.12% of operating profit, determined in accordance with IFRS. The rate varies depending on the level of operating profit margin. The GEM applied to operations at Cerro Yanacocha and La Quinua in 2016, 2015 and 2014. This resulted in US$6,945,000, US$19,883,000 and US$7,156,000, respectively, of additional Income and mining tax expense.
| (iv) | Law N°29471, Supplementary Fund |
The Supplementary Fund for retirement of mining applies to metallurgical and steel workers, affiliated to the National Pension System (“SNP”) and the Private Pension System (“PPS”); and is applicable since May 11, 2012. This Fund is formed by employee and employer contributions which are distributed according to the following detail:
| - | Employers will contribute 0.5% of the annual income before taxes. |
| - | Employees will contribute 0.5% of their monthly gross salary. |
| - | The employer's contributions are paid before tax; therefore these amounts are deductible expenses for the year. |
The new pension fund tax is calculated based on annual income and is payable quarterly. During 2016 and 2015, the amounts included in Income and mining tax expense amounted to US$141,870 and US$459,000, respectively.
| (c) | Peruvian income tax |
The Company's income tax provision consisted of the following:
| 2016 | 2015 | 2014 | ||||||||||
| US$(000) | US$(000) | US$(000) | ||||||||||
| Current Peruvian tax returns | 41,105 | 98,319 | 123,007 | |||||||||
| Royalties and mining taxes | 10,249 | 21,721 | 14,349 | |||||||||
| Other taxes | 323 | 639 | 914 | |||||||||
| Income tax prior year adjustments | (2,092 | ) | (1,766 | ) | - | |||||||
| Income tax prior years refunds | (6,458 | ) | - | - | ||||||||
| Current income tax expense | 43,127 | 118,913 | 138,270 | |||||||||
| Deferred income tax expense (benefit) | - | 483,804 | (168,761 | ) | ||||||||
| Income tax expense (benefit) | 43,127 | 602,717 | (30,491 | ) | ||||||||
| F- 142 |
Notes to the consolidated financial statements (continued)
| (d) | Deferred income tax asset |
Components of deferred income tax assets (liabilities) are as follows:
| 2016 | 2015 | |||||||
| US$(000) | US$(000) | |||||||
| Deferred income tax assets, net | ||||||||
| Property, plant and mine development | 608,783 | 303,385 | ||||||
| Reclamation | 160,261 | 110,633 | ||||||
| Accounts payable and accrued expenses | 64,703 | 66,261 | ||||||
| Inventories | 60,018 | 24,887 | ||||||
| Other | 3,077 | 4,838 | ||||||
| 896,842 | 510,004 | |||||||
| Allowance of deferred income tax asset | (896,842 | ) | (510,004 | ) | ||||
| Net deferred income tax asset | - | - | ||||||
In December 2016, the Company recorded a valuation allowance on its deferred income tax asset of US$386 million (US$510 million during 2015) to the extent that it is not probable that taxable profit will be available against which the deductible temporary differences can be utilized.
| (e) | Reconciliation of income tax expense (benefit) – |
Below is a reconciliation of tax expense and the accounts profit multiplied by the statutory tax rate for the years 2016, 2015 and 2014:
| 2016 | 2015 | 2014 | ||||||||||
| US$(000) | US$(000) | US$(000) | ||||||||||
| Income (loss) before income tax | (1,000,625 | ) | 152,522 | (430,829 | ) | |||||||
| Peruvian statutory tax rate | 28 | % | 28 | % | 30 | % | ||||||
| Income tax expense (income) | (280,175 | ) | 42,706 | (129,249 | ) | |||||||
| Valuation allowance on deferred tax asset | 403,763 | 510,004 | - | |||||||||
| Effect of change in income tax rate | (83,667 | ) | 16,576 | 65,020 | ||||||||
| Mining taxes | 7,392 | 15,639 | 10,044 | |||||||||
| Non-deductible expenses | 3,296 | 15,288 | 24,832 | |||||||||
| Adjustment due to income tax rate applicable to la Quinua | (1,024 | ) | 2,504 | (1,138 | ) | |||||||
| Income tax prior years refunds | (6,458 | ) | - | - | ||||||||
| Total income tax expense (benefit) | 43,127 | 602,717 | (30,491 | ) | ||||||||
| F- 143 |
Notes to the consolidated financial statements (continued)
| 15. | Revenue from sales |
The Company’s revenues are mainly from sales of gold ounces. The table below presents the net sales to customers by geographic region:
| 2016 | 2015 | 2014 | ||||||||||
| US$(000) | US$(000) | US$(000) | ||||||||||
| Sales and services by geographic region: | ||||||||||||
| Metal sales | ||||||||||||
| Suiza | 558,723 | 754,335 | 851,577 | |||||||||
| America | 233,043 | 315,686 | 358,880 | |||||||||
| 791,766 | 1,070,021 | 1,210,457 | ||||||||||
| Royalties, note 1(a) and 21 | (24,339 | ) | (32,414 | ) | (36,867 | ) | ||||||
| Mining royalties to the government | (6,234 | ) | (6,433 | ) | (8,291 | ) | ||||||
| 761,193 | 1,031,174 | 1,165,299 | ||||||||||
| 16. | Costs applicable to sales |
This caption is made up as follows:
| 2016 | 2015 | 2014 | ||||||||||
| US$(000) | US$(000) | US$(000) | ||||||||||
| Beginning balance of finished goods and in-process | 544,325 | 660,763 | 669,938 | |||||||||
| Beginning balance of provision for net realizable value, note 8(b) | (90,298 | ) | (163,094 | ) | (147,342 | ) | ||||||
| Consumption of supplies | 228,376 | 210,384 | 246,106 | |||||||||
| Personnel expenses | 87,258 | 102,867 | 87,290 | |||||||||
| Other services | 73,779 | 76,490 | 82,805 | |||||||||
| Maintenance | 36,213 | 38,646 | 38,526 | |||||||||
| Power | 27,270 | 27,713 | 24,942 | |||||||||
| Depreciation and amortization | 140,712 | 223,142 | 360,334 | |||||||||
| Workers' profit participation | 12,394 | 28,852 | 35,055 | |||||||||
| Reclamation expenses related to leach pads, note 12(b) | 78,494 | - | 20,315 | |||||||||
| Ending balance of provision for net realizable value, note 8(b) | 84,374 | 90,298 | 163,094 | |||||||||
| Ending balance of finished goods and in-process | (446,503 | ) | (544,325 | ) | (660,763 | ) | ||||||
| 776,394 | 751,736 | 920,300 | ||||||||||
| F- 144 |
Notes to the consolidated financial statements (continued)
| 17. | Operating expenses, net |
This caption is made up as follows:
| 2016 | 2015 | 2014 | ||||||||||
| US$(000) | US$(000) | US$(000) | ||||||||||
| Exploration and advanced projects | 49,580 | 64,230 | 58,880 | |||||||||
| Severance program | 9,659 | 14,904 | 16,438 | |||||||||
| Write-off of fixed assets | 14,036 | 2,411 | 3,520 | |||||||||
| Cost of fixed assets sold | 160 | 1,624 | 39,425 | |||||||||
| Income from fixed asset sales | (471 | ) | (1,116 | ) | (40,651 | ) | ||||||
| Others, net | (1,468 | ) | 793 | 169 | ||||||||
| 71,496 | 82,846 | 77,781 | ||||||||||
| 18. | Administrative expenses |
This caption is made up as follows:
| 2016 | 2015 | 2014 | ||||||||||
| US$(000) | US$(000) | US$(000) | ||||||||||
| Management expenses | 7,191 | 18,108 | 19,938 | |||||||||
| Community development expenses and external affairs | - | 6,297 | 15,653 | |||||||||
| Other | 1,589 | 1,920 | 2,671 | |||||||||
| 8,780 | 26,325 | 38,262 | ||||||||||
| 19. | Finance costs |
Financial costs for the years ended December 31, 2016, 2015 and 2014 are mainly related to the unwinding of the discount of the reclamation and mine closure liability amounting to US$14,104,000, US$22,075,000 and US$22,914,000, respectively. See note 12(b).
| 20. | Commitments and contingencies |
Unitization of properties -
In December 2000, as a result of the unitization plan carried out by the Partners, the Company signed several asset transfer and mining lease agreements with related entities. The main conditions are:
| - | The Company must pay to Chaupiloma, 3% of the quarterly net sales, according to the lease agreement. The mining rights subject to this 3% royalty are those identified in the lease agreement as part of the “Area of Influence of Chaupiloma”. Some of these mining rights are in exploitation and the rest of them in exploration. |
| - | The Company must pay to S.M.R.L. Coshuro (“Coshuro”) and Buenaventura, 3% of the quarterly net sales, according to the transfer agreement. The mining rights subject to this 3% royalty are those identified in the transfer agreement, and are located out of the “Area of Influence of Chaupiloma” and within the “Area of Influence of the Joint Venture”. These mining rights are currently under exploration. |
| F- 145 |
Notes to the consolidated financial statements (continued)
| - | The Company must pay to Los Tapados S.A., 3% of the quarterly net sales proceeds of mineral extracted from the transferred and leased concessions of Los Tapados S.A. The transferred and leased concessions of Los Tapados S.A. are also subject to a previously existing royalty on the minerals. These mining rights are currently under exploration. |
Legal proceedings -
Mercury spill in Choropampa -
In June 2000, a transport contractor of Yanacocha spilled approximately 151 kilograms of elemental mercury near the town of Choropampa, Peru, which is located 53 miles (85 kilometers) southwest of the Yanacocha mine. Elemental mercury is not used in Yanacocha’s operations but is a by-product of gold mining and was sold to a Lima firm for use in medical instruments and industrial applications. A comprehensive health and environmental remediation program was undertaken by Yanacocha in response to the incident. In August 2000, Yanacocha paid under protest a fine of 1,740,000 Peruvian soles (approximately US$0.5 million) to Peruvian government. Yanacocha has entered into settlement agreements with a number of individuals impacted by incident. As compensation for the disruption and inconvenience caused by the incident, Yanacocha entered into agreements with and provided a variety of public works in the three communities impacted by this incident. Yanacocha cannot predict the likelihood of additional expenditures related to this matter.
Additional lawsuits relating to the Choropampa incident were filed against Yanacocha in the local courts of Cajamarca, Peru, in May 2002 by over 900 Peruvian citizens. A significant number of the plaintiffs in these lawsuits entered into settlement agreements with Yanacocha prior to filing such claims. In April 2008, the Peruvian Supreme Court upheld the validity of these settlement agreements, which the Company expects to result in the dismissal of all claims brought by previously settled plaintiffs. Yanacocha also entered into settlement agreements with approximately 350 additional plaintiffs. The claims asserted by approximately 200 plaintiffs remain. In 2011, Yanacocha was served with 23 complaints alleging grounds to nullify the settlements entered into between Yanacocha and the plaintiffs. Yanacocha has answered the complaints and the court has dismissed several of the matters and the plaintiffs have filled appeals. All appeals were referred to the Civil Court of Cajamarca, which affirmed the decisions of the lower court judge. The plaintiffs have filed appeals of such orders before the Supreme Court. Some of these appeals were dismissed by the Supreme Court in favor of Yanacocha and others are pending resolution. Yanacocha will continue to vigorously defend its position. Yanacocha can not reasonably estimate the ultimate loss relating to such claims.
Action for Constitutional Relief against Conga Project Exploitation -
On October 18, 2012, Marco Antonio Arana Zegarra ("Marco Arana") filed a constitutional claim against the Ministry of Energy and Mines and Yanacocha requesting the Court to order to cease any threats of violation to life in an adequate and balanced environment; so that Court declared the suspension of the exploitation of the Conga Project and avoid Directorial Resolution No.351-2010-MEM/AM dated on October 27, 2010 that approved the Conga Environmental Impact Assessment.
| F- 146 |
Notes to the consolidated financial statements (continued)
By Court resolution No.1 dated October 23, 2012, the action was dismissed. On November 5, 2012, resolution No.1 was appealed by plaintiff and the hearing at Superior Court was held on March 4, 2013. The Cajamarca Superior Court confirmed the ruling of the judge that dismissed the claim.
On May 23, 2013, Marco Arana filed for a Constitutional remedy against the Cajamarca Superior Court decision and on June 3, 2013, the Cajamarca Superior Court accepted the Constitutional remedy filed by Marco Arana and the file has been sent to the Constitutional Court. On September 25, 2013, the Constitutional Court heard oral arguments from the parties and we are waiting their decision. To date the case maintains the same status.
On March 13 th , 2015, the Constitutional Court issued a resolution declaring the nullity of all judicial proceedings carried out after the first resolution issued in this case by the first instance judge. The Constitutional Court determined that the claim should be admitted, which means that the validity of the EIA should be reviewed in the judicial process by the first instance judge. Yanacocha was notified of the claim and answered the claim and presented motions to dismiss the claim on November 2015. We are waiting for the first instance judge to declare if he accepts the motions to dismiss or continues with the court case.
A similar claim has been filed against the Conga EIA by Mr. Carlos Raul Rodriguez Ramirez. Its status is the same as the claim filed by Marco Arana.
Environmental -
The Peruvian government agency responsibility agency responsible for environmental evaluation and inspection, Organismo Evaluacion y Fiscalizacion Ambiental (“OEFA”), conducts periodic reviews of the Yanacocha site. In 2011, 2012, 2013, 2015, 2016 and January 2017, OEFA issued notices of alleged violations of OEFA standards to Yanacocha relating to past inspections. OEFA has resolved with minimal or no findings. In 2015 and 2016, the water authority of Cajamarca issued notices of alleged regulatory violations, and resolved some allegations in early 2017 with no findings. The experience with OEFA and the water authority is that in the case of a finding of violation, remedial action is often the outcome rather than a significant fine. The alleged OEFA violations currently range from zero to 101,730 tax units and the water authority alleged violations range from zero to 40,000 tax units, being each tax unit equivalent to approximately US$1,200 based on current exchange rates. Yanacocha is responding to all notices of alleged violations, but cannot reasonably predict the outcome of the agency allegations.
| F- 147 |
Notes to the consolidated financial statements (continued)
Letters of Guarantee -
The Company has signed Letters of Guarantee with various financial institutions in accordance with the Mine Closure Regulation approved by Supreme Decree No.033-2005 of the Ministry of Energy and Mines. The table below sets out the outstanding signed commitments at year ends by financial institution. In general, these letters of guarantee are renewed annually.
| 2016 | 2015 | |||||||
| US$(000) | US$(000) | |||||||
| Banco de Credito del Peru (a) | 188,000 | 156,000 | ||||||
| BBVA Continental | 120,000 | 100,000 | ||||||
| Scotiabank | 120,000 | 100,000 | ||||||
| 428,000 | 356,000 | |||||||
| (a) | Letters of guarantee of Banco de Credito del Peru include US$7,626,000 and US$6,222,000 related to San Jose Reservoir Trust in 2016 and 2015, respectively. |
These three letters of guarantee shall come into force if the Company fails to execute in whole or in part the mine closure plan.
Open tax procedures -
The Tax Authority has the right to examine, and, if necessary, amend the Company’s income tax provision for the last four years. The Company’s income tax filings for the years 2012 through 2016 are open to examination by the tax authorities. For value added tax, the periods open for examination are the years 2013 through 2016. To date, the Tax Authority has concluded its review of the Company’s tax exams through the year 2011. For years 2002 through 2009, the Company is in the claim and appeal process. The tax authority is auditing the value added tax from July 2015 to June 2016.
In Management’s and legal advisors’ opinion, there are sound legal grounds to sustain the Company’s tax positions; as a result, Management expects to obtain favorable results on these processes and any additional tax assessment would not be significant to the consolidated financial statements.
For the periods pending of examination, due to the many possible interpretations of current legislation, it is not possible to determine whether or not future reviews will result in tax liabilities for the Company. In the event that additional taxes are payable, including interest and surcharges, as a result of the Tax Authority reviews, they will be charged to expense in the period assessed. However, in Management’s and legal advisors’ opinion, any additional tax assessment would not be significant to the consolidated financial statements.
| F- 148 |
Notes to the consolidated financial statements (continued)
Tax contingencies -
Withholding income tax for fiscal years 2002 and 2003 -
The Tax Administration challenged the withholding tax rate applied on the technical assistance services provided by a non-resident supplier. The services were executed in Peru and also abroad; however, the Company was not able to prove that during the tax audit. Based on that, the Tax Administration considers that the services were wholly executed in Peru; therefore, the withholding tax rate should be 30% instead of 12%. The amount of the contingency involved is S/16.6 million (US$4.9 million). In Management's and its legal counsel’s opinion, that consideration has no support and the Company should obtain a favorable outcome in the appeal initiated against the tax authorities.
Health Contributions - ESSALUD -
The Tax Administration considers that the bonus for closing the collective agreement and the collateral benefits granted to the unionized and non-unionized employees qualify as remunerative concepts; hence, taxed with the contribution to ESSALUD. The contingency amounts to S/10.6 million (US$3.2 million) for 2011 and 2012. In Management's and its legal counsel’s opinion, that interpretation has no support and the Company should obtain a favorable outcome in the appeal initiated against the tax authorities.
| 21. | Transactions with related parties |
| (a) | The main transactions carried out by the Company with its related parties in the years 2016, 2015 and 2014 were: |
| 2016 | 2015 | 2014 | ||||||||||
| US$(000) | US$(000) | US$(000) | ||||||||||
| Royalties paid: | ||||||||||||
| S.M.R.L. Chaupiloma Dos de Cajamarca, note 15 and 1(a) | 24,339 | 32,414 | 36,867 | |||||||||
| Services rendered by: | ||||||||||||
| Newmont Peru S.R.L. (management services) | 10,420 | 24,644 | 35,974 | |||||||||
| Newmont USA Limited | 6,438 | 9,076 | 6,192 | |||||||||
| (b) | As a result of the transactions indicated in the paragraph (a), the Company had the following accounts receivable and payable from/to associates: |
| 2016 | 2015 | |||||||
| US$(000) | US$(000) | |||||||
| Balance receivable from related parties, note 6 | ||||||||
| Newmont USA Limited | 389 | 80 | ||||||
| Suriname Gold Company LLC. | 281 | - | ||||||
| Newmont Technologies Limited | 120 | 23 | ||||||
| Newmont Peru S.R.L. | 15 | 68 | ||||||
| Newmont Mining Services Pty Ltd. | - | 77 | ||||||
| Others | 10 | - | ||||||
| 815 | 248 | |||||||
| Balance payable for related parties, note 11 | ||||||||
| S.M.R Chaupiloma Dos de Cajamarca | 5,846 | 7,214 | ||||||
| Newmont USA Limited | 1,403 | 1,769 | ||||||
| Newmont Technologies Limited | 1,007 | 715 | ||||||
| Newmont Peru S.R.L. | 742 | 1,183 | ||||||
| Newmont International Service Limited | 26 | 77 | ||||||
| Others | 28 | 14 | ||||||
| 9,052 | 10,972 | |||||||
| F- 149 |
Notes to the consolidated financial statements (continued)
AII the balances above are of current maturity, have no specific guarantees and are not interest bearing.
| 22. | Financial - risk management objectives and policies |
The Company's operations are exposed to certain financial risks: some market risks (foreign exchange risk, interest rate risk and price risk), credit risk and liquidity risk. The Company's overall risk management program focuses on the unpredictability of financial markets and seeks to minimize potential adverse effects on the Company's financial performance. The most important aspects in risk management are the following:
| (a) | Market risks - |
| (i) | Foreign exchange risk - |
Foreign exchange risk exposure arises from exchange rate fluctuations of balances denominated in different currencies than the U.S. dollar. Since transactions and balances denominated in foreign currency are not significant, the current exchange rate risk exposure is limited. Management has decided to assume the exchange risk exposure with the results of the Company's operations; therefore it has not engaged in hedging activities.
| (ii) | Interest rate risk - |
The Company does not maintain significant interest-bearing assets or liabilities; therefore, net income (loss) and cash flows of the Company are substantially independent from the changes in market interest rates.
| (iii) | Price risk- |
The Company's financial instruments exposed to price risk are limited to its trade accounts receivable (exposed to gold price) and its available-for-sale financial assets, none of which show a material balance at the end of year, therefore no significant impact on the consolidated financial statements has arisen due to changes in their price that would need to be disclosed.
| F- 150 |
Notes to the consolidated financial statements (continued)
| (b) | Credit risk- |
Credit risk is managed on a group basis by Newmont according to its policies. Financial instruments exposed to credit risk are cash and cash equivalents, investments in debt and equity instruments, trade accounts receivable and other accounts receivable. For banks and financial institutions, only independently rated parties with a minimum "A" rating are accepted. Regarding trade accounts receivable, according to the practice in the latest years, collections have generally been at full. A credit review of the portfolio is performed quarterly to determine any deterioration in credit quality. The Company does not foresee any significant losses that may arise from this risk.
| (c) | Liquidity risk- |
Management administrates its exposure to liquidity risk through financing from internal operations, Company's partners and maintaining good relationships with local and foreign banks in order to maintain adequate levels of credit available. The Company currently has no existing bank lines of credit.
The following table represents the analysis of the Company's financial liabilities, considering the remaining period to reach such maturity as of the consolidated statement of financial position date (see note 11):
| 2016 | 2015 | |||||||
| Less than 1 year | Less than 1 year | |||||||
| US$(000) | US$(000) | |||||||
| Trade accounts payable | 44,634 | 56,447 | ||||||
| Accounts payable to related parties | 9,052 | 10,972 | ||||||
| Remuneration and similar benefits payable | 8,516 | 8,981 | ||||||
| 62,202 | 76,400 | |||||||
| (d) | Capital risk management - |
The Company's objectives for managing capital are to safeguard the Company's ability to continue as a going concern in order to provide expected returns for partners and benefits for other stakeholders and to maintain an optimal capital structure to reduce the cost of capital.
In order to maintain or adjust the capital structure, the Company may adjust the amount of dividends paid to its partners. No formal dividend policy exists.
| (e) | Fair value estimation - |
Fair value accounting establishes a fair value hierarchy that prioritizes the inputs to valuation techniques used to measure fair value. The hierarchy gives the highest priority to unadjusted quoted prices in active markets for identical assets or liabilities (Level1 measurements) and the lowest priority to unobservable inputs (Level 3 measurements).
As required by accounting guidance, assets and liabilities are classified in their entirety based on the lowest level of input that is significant to the fair value measurement. The Company's assets that are measured at fair value on a recurring basis (at least annually) correspond to the San José Reservoir Trust assets.
The Company's San José Reservoir Trust assets are made up of marketable equity and debt securities that are valued using quoted market prices in active markets and as such are classified within Level 1 of the fair value hierarchy. The fair value of the marketable equity securities is calculated as the quoted market price of the marketable equity security multiplied by the quantity of shares held by the Company.
| F- 151 |
Notes to the consolidated financial statements (continued)
The Company's impairment loss is valued using valuation techniques to determine the WACC rate. These valuation techniques maximize the use of observable market data where it is available and rely as little as possible on entity specific estimates as such is classified within Level 2 of the fair value hierarchy.
| 23. | Summary of significant differences between accounting principles followed by the Company and U.S. Generally Accepted Accounting Principles |
The Company's financial statements have been prepared in accordance with International Financial Reporting Standards which differs in certain respects from U.S. GAAP. The effects of these differences are reflected in note 24 and are principally related to the items discussed in the following paragraphs:
| (a) | Impairment - |
Under IFRS, the Company estimates the recoverable amount of an asset whenever there is an indication that the asset may be impaired. The recoverable amount is the higher of the fair value less costs of disposal and its value in use. Value in use is the present value of the future cash flows expected to be derived from an asset or cash-generating unit.
In 2016, the Company recognize an impairment loss related to Yanacocha of US$889 million. In 2015, the Company did not recognize impairment loss. In 2014, the Company recorded impairment losses amounting to US$541 million related to Conga, and no amount for Yanacocha.
Under US GAAP, the Company uses undiscounted cash flows to perform an impairment evaluation (step 1) an if there is an indicator uses discounted cash flows to determinate the impairment loss (step 2). In 2016, the Company recognized an impairment loss related to Yanacocha of US$933 million. No impairment losses were determined for Yanacocha and Conga cash-generating units in 2015.
For reconciling the net income/loss and net equity from US GAAP to IFRS, the Company eliminates the higher depreciation recorded under US GAAP corresponding to the impaired assets under IFRS.
| (b) | Deferred workers’ profit participation |
Under IFRS, the workers’ profit participation is recorded as an employee benefit that is recorded as cost of production or administrative expense, depending of the function of the workers.
Under US GAAP, the workers’ profit sharing is treated in a similar way as income tax since both are calculated based on the Company’s taxable income. Therefore, the Company calculates a deferred workers’ profit participation resulting from the taxable and deductible temporary differences.
For reconciling the net income/loss and net equity from US GAAP to IFRS, the Company eliminates the deferred workers’ profit participation and its corresponding valuation allowance recorded in the current year.
| (c) | Stripping activity asset - |
Under IFRS, the stripping costs in the production phase of a surface mine are accounted for according to the accounting principles disclosed in note 2.
| F- 152 |
Notes to the consolidated financial statements (continued)
Under U.S. GAAP, the costs of clearing removal (stripping cost of production) incurred during the production stage are recorded as part of the production cost of inventories.
| (d) | Reclamation and mine closure – |
Under IFRS, the liability was measured in accordance with IAS 37 and IFRIC 1. Upward and downward revisions in the amount of undiscounted estimated cash flows are discounted using the current market-based discount rate (this includes changes in the time value of money and the risks specific to the liability), see note 2.4 (j).
Under US GAAP, upward revisions in the amount of undiscounted estimated cash flows are discounted using the current credit-adjusted risk-free rate. Downward revisions in the amount of undiscounted estimated cash flows are discounted using the credit-adjusted risk-free rate that existed when the original liability was recognized.
| (e) | Inventories - |
Under IFRS, the cost of inventory mainly includes less depreciation as a result of the reduced base of property, plant and equipment due to the impairment recorded in prior years.
Under US GAAP, the cost of inventory considers a higher depreciation since the items of property, plant and equipment have not been impaired.
| (f) | Deferred income tax – |
The differences between US GAAP and IFRS are re-measurements that lead to different temporary differences. According to the accounting policies in Note 2.4 (l), the Company has to account for such differences.
During 2015, the Company recorded a valuation allowance of the deferred income tax asset recorded under IFRS which was higher by US$321.6 million compared to the valuation allowance recorded under US GAAP, mainly as a result of the impairment losses of prior years recorded under IFRS.
| F- 153 |
Notes to the consolidated financial statements (continued)
| 24. | Reconciliation between net income and Partners' Equity determined under IFRS and U.S. GAAP |
The following is a summary of the adjustment to net income for the years ended December 31, 2016, 2015 and 2014 and to partners' equity as of December 31, 2016 and 2015 that would be required if U.S. GAAP had been applied instead of IFRS in the consolidated financial statements:
| 2016 | 2015 | 2014 | ||||||||||
| US$(000) | US$(000) | US$(000) | ||||||||||
| Loss under IFRS | (1,043,752 | ) | (450,195 | ) | (400,338 | ) | ||||||
| Items increasing (decreasing) reported net profit: | ||||||||||||
| Impairment loss, note 23(a) and 10(b) | 889,499 | - | 541,141 | |||||||||
| Reversal of depreciation of assets impaired under IFRS, note 23(a) | (101,855 | ) | (125,943 | ) | (79,809 | ) | ||||||
| Elimination of impairment loss recorded under U.S. GAAP, note 23(a) | (933,200 | ) | - | - | ||||||||
| Elimination of the valuation allowance of the deferred workers’ profit participation, note 23(b) | - | (41,909 | ) | - | ||||||||
| Stripping activity asset, note 23(c) | (22,156 | ) | (18,868 | ) | (23,212 | ) | ||||||
| Reclamation and mine closure, note 23(d) | (22,278 | ) | (12,049 | ) | 427 | |||||||
| Inventories, note 23(e) | 36,076 | 20,903 | (17,428 | ) | ||||||||
| Deferred workers' profit participation, note 23(b) | - | 2,790 | 29,003 | |||||||||
| Valuation allowance of deferred income tax, note 23(f) | - | 321,622 | - | |||||||||
| Deferred income tax of reconciliation items, note 23(f) | - | 43,441 | (93,062 | ) | ||||||||
| Others | 6,347 | 8,049 | 11,364 | |||||||||
| Loss under U.S. GAAP | (1,191,319 | ) | (252,159 | ) | (31,914 | ) | ||||||
| 2016 | 2015 | |||||||
| US$(000) | US$(000) | |||||||
| Partners' equity under IFRS | 885,724 | 2,228,825 | ||||||
| Items increasing (decreasing) reported Partners' equity: | ||||||||
| Impairment loss, note 23(a) | 2,469,188 | 1,579,689 | ||||||
| Reversal of depreciation of assets impaired under IFRS, note 23(a) | (379,806 | ) | (277,951 | ) | ||||
| Elimination of impairment loss recorded under U.S. GAAP, note 23(a) | (933,200 | ) | - | |||||
| Elimination of the valuation allowance of the deferred workers’ profit participation, note 23(b) | - | (41,909 | ) | |||||
| Stripping activity asset, note 23(c) | (41,069 | ) | (18,913 | ) | ||||
| Reclamation and mine closure, note 23(d) | (74,402 | ) | (52,124 | ) | ||||
| Inventories, note 23(e) | 30,289 | (5,787 | ) | |||||
| Deferred workers' profit participation, note 23(b) | - | 40,935 | ||||||
| Valuation allowance of deferred income tax, note 23(f) | - | 321,622 | ||||||
| Deferred income tax related to reconciliation items, note 23(f) | - | (310,341 | ) | |||||
| Others | (28,403 | ) | (45,057 | ) | ||||
| Partners' equity under U.S. GAAP | 1,928,321 | 3,418,989 | ||||||
| F- 154 |
Notes to the consolidated financial statements (continued)
| 25. | New U.S. GAAP Accounting Pronouncements |
Recently Issued Accounting Pronouncements -
Restricted Cash -
In November 2016, ASU No. 2016-18 was issued related to the inclusion of restricted cash in the statements of cash flows. This new guidance requires that a statement of cash flows explain the change during the period in the total of cash, cash equivalents and amounts generally described as restricted cash or restricted cash equivalents. This update is effective in fiscal years, including interim periods, beginning after December 15, 2017 and early adoption is permitted. The adoption of this guidance will result in the inclusion of the restricted cash balance within the overall cash balance and removal of the changes in restricted cash activity.
Intra-Entity Transfer –
In October 2016, ASU No. 2016-16 was issued related to the intra-entity transfer of assets other than inventory. This new guidance requires entities to recognize the income tax consequences of an intra-entity transfer of an asset other than inventory when the transfer occurs. This update is effective in fiscal years, including interim periods, beginning after December 15, 2017 an early adoption is permitted. The Company is currently evaluating this guidance and the corresponding impact.
Statements of Cash Flows –
In August 2016, ASU No. 2016-15 was issued related to the statement of cash flows. This new guidance addresses eight specific cash flow issues with the objective of reducing the existing diversity in practice in how certain cash receipts and cash payments are presented and classified in the statement of cash flows. This update is effective in fiscal years, including interim periods, beginning after December 15, 2017 and early adoption is permitted. The Company is currently evaluating this guidance and the corresponding impact.
Leases –
In February 2016, ASU No. 2016-02 was issued related to leases. This new guidance modifies the classification criteria and requires leases to recognize the assets and liabilities arising from most leases on the balance sheet. This update is effective in fiscal years, including interim periods, beginning after December 15, 2018 and early adoption is permitted. The Company is currently evaluating this guidance and the corresponding impact.
Inventory –
In July 2015, ASU No. 2015-11 was issued related to inventory, simplifying the subsequent measurement of inventories by replacing the lower of cost or market test with a lower of cost and net realizable value test. The update is effective in fiscal years, including interim periods, beginning after December 15, 2016 and early adoption is permitted. The Company does not expect the updated guidance to have a material impact.
| F- 155 |
Notes to the consolidated financial statements (continued)
Revenue recognition –
In May 2014, ASU No. 2014-09 was issued related to revenue from contracts with customers. This ASU was further amended in August 2015, March 2016, April 2016, May 2016 and December 2016 by ASU No. 2016-08, No. 2016-10, No. 2016-12 and No. 2016-20, respectively. The new standard provides a five-step approach to be applied to all contracts with customers and also requires expanded disclosures about revenue recognition. In August 2015, the effective date was deferred to reporting periods, including interim periods, beginning after December 15, 2017 and will be applied retrospectively. Early adoption is not permitted.
The Company is currently performing an assessment of the revised standards and impacts on the Company’s Consolidated Financial Statements and disclosures. Management is still in the process of completing their assessment of the impacts; however, based on a preliminary analysis, anticipates the standard having a potential impact to the timing of revenue recognition due to a potential change in timing of when control is transferred to the customer. The Company continues to evaluate the potential impacts due to timing of revenue recognition, but does not expect it to have a material impact on the Consolidated Financial Statements. Additionally, the Company continues to assess the potential impacts on insurance payments, variable consideration on concentrate sales, and refining fee classification under the new standard. Based on preliminary findings, the Company does not expect these areas to have a significant impact on revenue recognition. The Company expects to have an update to the impacts of the standard in second quarter of 2017.
The Company anticipates adopting the new standard effective January 1, 2018. The guidance may be applied retrospectively for all periods presented or retrospectively with the cumulative effect of initially applying the guidance recognized at the date of initial application. The Company currently anticipates adopting the standard retrospectively with the cumulative effect of initially applying the amended guidance recognized at January 1, 2018.
| F- 156 |
Sociedad Minera Cerro Verde S.A.A.
Financial Statements
for the years 2016, 2015 and 2014
together with the Report of Independent Registered Public Accounting Firm
| F- 157 |
Sociedad Minera Cerro Verde S.A.A.
Financial Statements
for the years 2016, 2015 and 2014
together with the Report of Independent Registered Public Accounting Firm
Content
| Report of Independent Registered Public Accounting Firm | F-159 |
| Financial Statements | |
| Statements of financial position | F-160 |
| Statements of comprehensive income | F-161 |
| Statements of changes in equity | F-162 |
| Statements of cash flows | F-163 |
| Notes to the financial statements | F-165 |
| F- 158 |
Report of Independent Registered Public Accounting Firm
To the Board of Directors and Shareholders of Sociedad Minera Cerro Verde S.A.A.
We have audited the accompanying financial statements of Sociedad Minera Cerro Verde S.A.A. (a Peruvian company, subsidiary of Freeport - McMoRan Inc.), which comprise the statements of financial position as of December 31, 2016 and 2015, and the statements of comprehensive income, statements of changes in equity and statements of cash flows for the years ended December 31, 2016, 2015 and 2014. These financial statements are the responsibility of the Company's management. Our responsibility is to express an opinion on these financial statements based on our audits.
We conducted our audits in accordance with the standards of the Public Company Accounting Oversight Board (United States). Those standards require that we plan and perform the audit to obtain reasonable assurance about whether the financial statements are free of material misstatement. We were not engaged to perform an audit of the Company´s internal control over financial reporting. Our audits included consideration of internal control over financial reporting as a basis of designing audit procedures that are appropriate in the circumstances, but not for the purpose of expressing an opinion on the effectiveness of the Company´s internal control over financial reporting. Accordingly, we express no such opinion. An audit also includes examining, on a test basis, evidence supporting the amounts and disclosures in the financial statements, assessing the accounting principles used and significant estimates made by management and evaluating the overall financial statement presentation. We believe that our audits provide a reasonable basis for our opinion.
In our opinion, the financial statements referred to above present fairly, in all material respects, the financial position of Sociedad Minera Cerro Verde S.A.A. as of December 31, 2016 and 2015, and the results of operations and its cash flows for the years ended December 31, 2016, 2015 and 2014, in accordance with International Financial Reporting Standards (IFRS) as issued by the International Accounting Standards Board (“IASB”) which differ in certain respects from the accounting principles generally accepted in the United States of America (see note 24 to the financial statements).
Lima, Peru,
February 28, 2017
Countersigned by:
Paredes, Burga & Asociados S. Civil de R.L.
| /s/ Victor Burga |
Víctor Burga
C.P.C.C. Register No.14859
| F- 159 |
Sociedad Minera Cerro Verde S.A.A.
Statements of financial position
As of December 31, 2016 and 2015
| Note | 2016 | 2015 | ||||||||
| US$(000) | US$(000) | |||||||||
| Assets | ||||||||||
| Current assets | ||||||||||
| Cash and cash equivalents | 2(d), 3 | 29,951 | 5,952 | |||||||
| Trade accounts receivable (net) | 1,162 | 13,948 | ||||||||
| Other accounts receivable (net) | 2(d), 5 | 70,043 | 2,771 | |||||||
| Trade accounts receivable - Related parties | 2(d), 4 | 375,306 | 199,368 | |||||||
| Prepayments | 5,473 | 7,320 | ||||||||
| Inventories | 2(g), 6 | 425,566 | 394,867 | |||||||
| Other non-financial assets | 7 | 311,007 | 432,299 | |||||||
| 1,218,508 | 1,056,525 | |||||||||
| Non - current assets | ||||||||||
| Prepayments | 39 | - | ||||||||
| Property, plant and equipment, net | 2(h), 8 | 5,807,740 | 6,077,289 | |||||||
| Intangible assets | 12,198 | 16,905 | ||||||||
| Other non-financial assets | 7 | 597,138 | 701,973 | |||||||
| 6,417,115 | 6,796,167 | |||||||||
| Total assets | 7,635,623 | 7,852,692 | ||||||||
| Liabilities and equity, net | ||||||||||
| Current liabilities | ||||||||||
| Other financial liabilities | 2(e), 10 | 161 | 43,169 | |||||||
| Accounts payable | 2(e), 9 | 168,357 | 432,418 | |||||||
| Other accounts payable | 3,619 | 2,112 | ||||||||
| Accounts payable - Related parties | 2(e), 4 | 27,134 | 12,042 | |||||||
| Provision related to benefits to employees | 48,039 | 20,536 | ||||||||
| Provisions, short term | 2(k), 11 | 24,458 | 33,509 | |||||||
| Income tax payable | 21,863 | 4,731 | ||||||||
| Total current liabilities | 293,631 | 548,517 | ||||||||
| Non - current liabilities | ||||||||||
| Other financial liabilities | 2(e), 10 | 1,995,843 | 2,381,995 | |||||||
| Accounts payable - Related parties | 2(e), 4 | 7,132 | 6,850 | |||||||
| Long –term provisions | 2(k), 11 | 164,622 | 163,803 | |||||||
| Deferred income tax liability, net | 2(m),13(g) | 335,114 | 253,153 | |||||||
| 2,502,711 | 2,805,801 | |||||||||
| Total liability | 2,796,342 | 3,354,318 | ||||||||
| Shareholder´s Equity | 12 | |||||||||
| Capital Stock | 990,659 | 990,659 | ||||||||
| Other capital reserves | 198,132 | 198,132 | ||||||||
| Retained earnings | 3,650,490 | 3,309,583 | ||||||||
| Total Shareholder´s equity | 4,839,281 | 4,498,374 | ||||||||
| Total liabilities and Shareholder´s equity | 7,635,623 | 7,852,692 | ||||||||
The accompanying notes are an integral part of this financial statement.
| F- 160 |
Sociedad Minera Cerro Verde S.A.A.
Statements of comprehensive income
For the years ended December 31, 2016, 2015 and 2014
| Note | 2016 | 2015 | 2014 | |||||||||||
| US$(000) | US$(000) | US$(000) | ||||||||||||
| Sales of goods | 14 | 2,384,154 | 1,115,617 | 1,467,097 | ||||||||||
| Cost of sales | 15 | (1,553,040 | ) | (862,004 | ) | (797,481 | ) | |||||||
| Gross profit | 831,114 | 253,613 | 669,616 | |||||||||||
| Operating expenses | ||||||||||||||
| Selling expenses | 16 | (131,391 | ) | (56,215 | ) | (54,210 | ) | |||||||
| Other operating expenses | 17 | (24,107 | ) | (26,739 | ) | (5,873 | ) | |||||||
| Other operating income | - | 139 | 2,244 | |||||||||||
| (155,498 | ) | (82,815 | ) | (57,839 | ) | |||||||||
| Operating profit | 675,616 | 170,798 | 611,777 | |||||||||||
| Other income (expenses) | ||||||||||||||
| Financial income | 954 | 512 | 2,443 | |||||||||||
| Financial expenses | 18 | (80,438 | ) | (16,010 | ) | (369 | ) | |||||||
| Exchange differences, net | 7,857 | (75,770 | ) | 2,284 | ||||||||||
| (71,627 | ) | (91,268 | ) | 4,358 | ||||||||||
| Profit before income tax | 603,989 | 79,530 | 616,135 | |||||||||||
| Income tax expense | 13(g) | (263,082 | ) | (46,246 | ) | (238,529 | ) | |||||||
| Profit for the year | 340,907 | 33,284 | 377,606 | |||||||||||
| Basic and diluted earnings per share | 19 | 0.974 | 0.095 | 1.08 | ||||||||||
The accompanying notes are an integral part of this financial statement.
| F- 161 |
Sociedad Minera Cerro Verde S.A.A.
Statements of changes in equity
For the years ended December 31, 2016, 2015 and 2014
| Note |
Capital
stock |
Other capital
reserves |
Retained
earnings |
Total | ||||||||||||||
| US$(000) | US$(000) | US$(000) | US$(000) | |||||||||||||||
| Balance as of January 1, 2014 | 12 | 990,659 | 198,132 | 2,898,693 | 4,087,484 | |||||||||||||
| Profit for the year | - | - | 377,606 | 377,606 | ||||||||||||||
| Balance as of December 31, 2014 | 12 | 990,659 | 198,132 | 3,276,299 | 4,465,090 | |||||||||||||
| Profit for the year | - | - | 33,284 | 33,284 | ||||||||||||||
| Balance as of December 31, 2015 | 12 | 990,659 | 198,132 | 3,309,583 | 4,498,374 | |||||||||||||
| Profit for the year | - | - | 340,907 | 340,907 | ||||||||||||||
| Balance as of December 31, 2016 | 12 | 990,659 | 198,132 | 3,650,490 | 4,839,281 | |||||||||||||
The accompanying notes are an integral part of this financial statement.
| F- 162 |
Sociedad Minera Cerro Verde S.A.A.
Statements of cash flows
For the years ended December 31, 2016, 2015, and 2014
| Note | 2016 | 2015 | 2014 | |||||||||||
| US$(000) | US$(000) | US$(000) | ||||||||||||
| Operating activities | ||||||||||||||
| Profit for the year | 340,907 | 33,284 | 377,606 | |||||||||||
| Adjustments to reconcile with the profit for the period with the cash provided from operating activities for: | ||||||||||||||
| Income tax expense | 13(g) | 263,082 | 46,246 | 238,529 | ||||||||||
| Nonmonetary adjustments | ||||||||||||||
| Depreciation, Amortization and Depletion | 15 | 472,997 | 244,477 | 164,985 | ||||||||||
| Unwinding of discount for remediation and mine closure provision | 11(b) | 4,391 | 3,985 | 2,537 | ||||||||||
| Net loss on sale of Property, Plant and Equipment | 982 | 661 | 4,722 | |||||||||||
| Impairment of property, plant and equipment | - | - | 781 | |||||||||||
| Net changes in assets and liabilities | ||||||||||||||
| Trade accounts receivable and other accounts receivable | (159,110 | ) | (23,111 | ) | 121,435 | |||||||||
| Inventories | (30,699 | ) | (162,325 | ) | (15,542 | ) | ||||||||
| Other non-financial assets | 132,713 | (271,852 | ) | (409,159 | ) | |||||||||
| Trade accounts payable and other accounts payable | 85,939 | 106,685 | 4,430 | |||||||||||
| Provisions related to benefits to employees | 27,503 | (23,876 | ) | (13,717 | ) | |||||||||
| Other provisions | (59,851 | ) | 8,640 | 35,808 | ||||||||||
| Interest paid (not included in the financing Activities) | (64,325 | ) | (36,233 | ) | (10,402 | ) | ||||||||
| Income tax | (68,557 | ) | (121,027 | ) | (315,369 | ) | ||||||||
| Net cash and cash equivalents provided by (used in) operating activities | 945,972 | (194,446 | ) | 186,644 | ||||||||||
| F- 163 |
Statements of cash flows (continued)
| Note | 2016 | 2015 | 2014 | |||||||||||
| US$(000) | US$(000) | US$(000) | ||||||||||||
| Investing activities | ||||||||||||||
| Sales of property, plant and equipment | 235 | 409 | 356 | |||||||||||
| Withdraw of time deposits | - | - | 226,772 | |||||||||||
| Purchase of property, plant and equipment | 8 | (421,610 | ) | (1,663,738 | ) | (1,640,287 | ) | |||||||
| Stripping activity asset | 8 | (61,261 | ) | (111,819 | ) | (49,122 | ) | |||||||
| Purchase of intangibles | - | (9,509 | ) | (7,178 | ) | |||||||||
| Other cash payments related to investing activities | 3,832 | - | - | |||||||||||
| Net cash and cash equivalents used in investing activities | (478,804 | ) | (1,784,657 | ) | (1,469,459 | ) | ||||||||
| Financing activities | ||||||||||||||
| Proceeds from loans | 10 | 350,000 | 1,896,000 | 475,000 | ||||||||||
| Proceeds from shareholders loans | 10(b) | - | 600,000 | - | ||||||||||
| Payments of loans | 10 | (793,000 | ) | (528,000 | ) | - | ||||||||
| Debt issuance costs | - | (2,356 | ) | (27,024 | ) | |||||||||
| Amortization of leasing | (169 | ) | (163 | ) | (157 | ) | ||||||||
| Net cash and cash equivalents provided by (used in) financing activities | (443,169 | ) | 1,965,481 | 447,819 | ||||||||||
| Net increase (net decrease) in cash and cash equivalents | 23,999 | (13,622 | ) | (834,996 | ) | |||||||||
| Cash and cash equivalents at beginning of year | 5,952 | 19,574 | 854,570 | |||||||||||
| Cash and cash equivalents at end of year | 29,951 | 5,952 | 19,574 | |||||||||||
| Transactions with no effects in cash flows : | ||||||||||||||
| Provision for remediation and mine closure | 11 | (16,091 | ) | 33,803 | 68,840 | |||||||||
The accompanying notes are an integral part of this financial statement
| F- 164 |
Sociedad Minera Cerro Verde S.A.A.
Notes to the Financial Statements
As of December 31, 2016, 2015 and 2014
| 1. | Identification and business activity |
| (a) | Identification - |
Sociedad Minera Cerro Verde S.A.A. (the Company) was incorporated in Peru on August 20, 1993 as a result of the privatization process of certain mining units carried out by the Peruvian State in that year. The Company’s shares were listed on the Lima Stock Exchange on November 14, 2000.
Through its subsidiary Cyprus Climax Metals Company, Freeport Minerals Corporation (FMC), a wholly owned subsidiary of Freeport-McMoRan Inc. (Freeport), owns 53.56% of the voting shares of the Company. SMM Cerro Verde Netherlands B.V. (a subsidiary of Sumitomo Metal Mining Company Ltd.) owns 21% of the voting shares of the Company, Compañía de Minas Buenaventura S.A.A. owns 19.58%, and other stakeholders own the remaining 5.86%.
The Company’s legal address is Jacinto Ibañez Street N°315 - Parque Industrial, Arequipa in the city of Arequipa and the ore deposit is located southwest of that city (Asiento Minero Cerro Verde S/N Uchumayo – Arequipa).
| (b) | Business activity - |
The Company’s activities are regulated by the Peruvian General Mining Law and comprise the extraction, production and sale of copper concentrate and cathode.
Expansion of operations -
In September 2015, the expansion project commenced operations and achieved full capacity operating rates during the first quarter of 2016. The project, with a cost of US $5.3 billion, expanded the processing capacity from 120,000 metric tons of ore per day to 360,000 metric tons of ore per day.
This expansion was financed with senior unsecured loans received by several banks led by Citibank N.A. and with shareholders’ loans, currently subordinated to the senior unsecured loans previously mentioned. (See Note 10)
| (c) | Financial statements approval – |
The financial statements for the year ended December 31, 2016, were approved by the Company’s Management on February 28, 2017, and, in Management’s opinion, they will be approved without changes at the Board of Directors and Shareholders’ Meetings to be held in the first quarter of 2017. The financial statements for the year ended December 31, 2015, were approved at the Board of Directors and Shareholders’ Meetings on March 30, 2016.
| F- 165 |
Notes to the Financial Statements (continue)
| 2. | Significant accounting principles and policies |
The significant accounting policies applied in the preparation of the financial statements are summarized below:
| (a) | Basis of presentation - |
The financial statements of the Company have been prepared in accordance with International Financial Reporting Standards (IFRS) issued by the International Accounting Standards Board (IASB). IFRS includes International Accounting Standards (IAS) and pronouncements of the Interpretations Committees (SIC and IFRIC).
The financial statements have been prepared based on historical cost, except for accounts receivable and/or payable related to the embedded derivative, which have been measured at fair value (see Note 2(d)). The financial statements are presented in United States dollars (US$) and include the years ended December 31, 2016, 2015 and 2014. Unless otherwise indicated, all values have been rounded to the nearest thousand.
| (b) | Use of judgments, estimates and assumptions - |
The preparation of financial statements in conformity with IFRS requires management to make estimates and assumptions in order to determine the amounts of the assets and liabilities, and the disclosure of contingent assets and liabilities as of December 31, 2016 and 2015, and the amounts of reported revenues and expenses for the years ended December 31, 2016, 2015 and 2014.
Information about estimations and judgments by Management in the preparation of the financial statements follows:
| (b.1) | Judgments – |
| (i) | Contingencies – |
By their nature, contingencies will be resolved only when one or more uncertain future events occur or fail to occur. The assessment of the existence and potential amount of contingencies inherently involves the exercise of significant judgment and the use of estimates regarding the outcome of future events.
| (ii) | Stripping cost – |
The Company incurs waste removal costs (stripping costs) during the development and production phases of its surface mining operations. During the production phase, stripping costs (production stripping costs) can be incurred both in relation to the production of inventory in that period and the creation of improved access and mining flexibility in relation to ore to be mined in the future. The former are included as part of the costs of inventory, while the latter are capitalized as a stripping activity asset, where certain criteria are met.
Once the Company has identified its production stripping for each surface mining operation, it identifies the separate components of the ore bodies for each of its mining operations. An identifiable component is a specific volume of the ore body that is made more accessible by the stripping activity. Significant judgment is required to identify and define these components, and also to determine the expected volumes (e.g., in tons) of waste to be stripped and ore to be mined in each of these components.
| F- 166 |
Notes to the Financial Statements (continue)
| (b.2) | Estimates and assumptions – |
| (i) | Determination of mineral reserves – |
Mineral reserves are the part of a mineral deposit ore that can be economically and legally extracted from the mine concessions. The Company estimates its mineral reserve based on information compiled by individuals qualified in reference to geological data about the size, depth and form of the ore body, and requires geological judgments in order to interpret the data.
The estimation of recoverable reserves involves numerous uncertainties with respect to the ultimate geology of the ore body, including quantities, grades and recovery rates. Estimating the quantity and grade of mineral reserves requires the Company to determine the size, shape and depth of the ore body by analyzing geological data. In addition to the geology, assumptions are required to determine the economic feasibility of mining the reserves, including estimates of future commodity prices and demand, future requirements of capital and production costs, and estimated exchange rates. Revisions in reserve or resource estimates have an impact on the value of mining properties, property, plant and equipment, provisions for cost of mine closure, recognition of assets for deferred taxes and depreciation and amortization of assets.
| (ii) | Units of production depreciation – |
Estimated mineral reserves are used in determining the depreciation and/or amortization of mine-specific assets. This results in a depreciation/amortization charge proportional to the depletion of the anticipated remaining life-of-mine production. The life of each item, which is assessed at least annually, is impacted by both its physical life limitations and present assessments of economically recoverable reserves of the mine property at which the asset is located. These calculations require the use of estimates and assumptions, including the amount of recoverable reserves.
| (iii) | Provision for remediation and mine closure – |
The Company assesses its provision for remediation and mine closure quarterly. It is necessary to make estimates and assumptions in determining this provision, including cost estimates of activities that are necessary for the rehabilitation of the site, technological and regulatory changes, interest rates and inflation rates. As discussed in note 2(k), estimated changes in the fair value of the provision for remediation and mine closure or the useful life of the related assets are recognized as an increase or decrease in the book value of the provision and related asset retirement cost (ARC) in accordance with IAS 16, “Property, Plant and Equipment”.
According to the Company’s accounting policies, the provision for remediation and mine closure represents the present value of the costs that are expected to be incurred in the closure period of the operating activities of the Company. Closure budgets are reviewed regularly to take into account any significant change in the studies conducted. Nevertheless, the closure costs of mining units will depend on the market prices for the closure work required, which would reflect future economic conditions. Also, the timing of disbursements depends on the useful life of the mine, which is based on estimates of future commodity prices.
If any change in the estimate results in an increase to the provision for remediation and mine closure and related ARC, the Company shall consider whether or not this is an indicator of impairment of the assets and will apply impairment tests in accordance with IAS 36, “Impairments of Assets”.
| F- 167 |
Notes to the Financial Statements (continue)
| (iv) | Inventories - |
Net realizable value tests are performed at least annually and represent the estimated future sales price of the product based on prevailing spot metals prices, less estimated costs to complete production and bring the inventory to sale. Additionally, in calculating the net realizable value of the Company’s long-term stockpiles, Management also considers the time value of money.
Mill and leach stockpiles generally contain lower grade ores that have been extracted from the ore body and are available for copper recovery. Mill stockpiles contain sulfide ores and recovery of metal is through milling and concentrating. Leach stockpiles contain oxide ores and certain secondary sulfide ores and recovery of metal is through exposure to acidic solutions that dissolve contained copper and deliver it in solution to extraction processing facilities.
Because it is generally impracticable to determine copper contained in mill and leach stockpiles by physical count, reasonable estimation method is employed. The quantity of material delivered to mill and leach stockpiles is based on surveyed volumes of mined material and daily production records. Sampling and assaying of blast holes cuttings determine the estimated copper grades of material delivered to mill and leach stockpiles.
Expected copper recovery rates for mill stockpiles are determined by metallurgical testing. The recoverable copper in mill stockpiles, once entered into the production process, can be produced into copper concentrate almost immediately.
| F- 168 |
Notes to the Financial Statements (continue)
Expected copper recovery rates for leach stockpiles are determined using small-scale laboratory tests, historical trends and other factors, including mineralogy of the ore and rock type. Total copper recovery in leach stockpiles can vary significantly depending on several variables, including type of copper recovery, mineralogy and the size of the rock. For newly placed material of active stockpiles, as much as 80 percent of total copper recovery may be extracted during the first year, and the remaining copper may be recovered over many years. Processes and recovery rates are monitored continuously, and recovery rate estimates are adjusted periodically as additional information becomes available and as related technology changes.
| (v) | Asset impairment – |
Management has determined that the Company’s operations consist of one cash generating unit. Therefore, the Company’s operations are evaluated at least annually in order to determine if there are impairment indicators. If any such indication exists, the Company makes an estimate of the recoverable amount, which is the greater of the fair value less costs to sell and the value in use. These assessments require the use of estimates and assumptions, such as long-term commodity prices, discount rates, operating costs, and others.
Fair value is defined as the amount that would be obtained from the sale of the asset in an arm’s length transaction between willing and knowledgeable parties. The fair value of assets is generally determined as the current value of future cash flows derived from the continuous use of the asset, which includes estimates, such as the cost of future expansion plans and eventual disposal, while applying assumptions that an independent market participant may take into account. The cash flows are discounted by applying a discount rate that reflects the current market, the time value of money and the risks specific to the asset.
| (c) | Currency- |
The financial statements are presented in United States (US) dollars which is also the Company’s functional currency.
Foreign currency transactions are considered to be those which are carried out in a currency other than the functional currency. Foreign currency transactions are translated into the functional currency by applying the exchange rate in force on the date the transaction takes place. Monetary assets and liabilities denominated in foreign currencies are converted using the functional currency spot rate in force at the reporting date.
Gains and losses as a result of the difference in the exchange rate when currency items are liquidated or when converting currency items at exchange rates that are different from those used for their initial recognition are recognized in the statements of comprehensive income for the year.
| F- 169 |
Notes to the Financial Statements (continue)
The Company uses Peruvian Sol (S/) exchange rates published by the Superintendent of Banks, Insurance and Pension Fund Administrator. The published exchange rates were S/3.352 for US$1 for buying and S/3.360 for US$1 for selling as of December 31, 2016, and S/3.408 for US$1 buying and S/3.413 for US$1 for selling as of December 31, 2015. These rates have been applied to the appropriate asset and liability accounts.
| (d) | Financial assets - |
The Company determines the classification of its financial assets at initial recognition in accordance with IAS 39, “Financial Instruments: Recognition and Measurement”. Financial assets are recognized initially at fair value plus the direct costs attributable to the transaction. The Company’s financial assets include cash and cash equivalents, accounts receivable and embedded derivatives.
Cash and cash equivalents -
Cash and cash equivalents are financial assets that may be liquidated immediately, such as bank checking accounts, and other liquid investments with original maturities of three months or less.
Accounts Receivables -
The Company’s receivables include current and long-term trade and other accounts receivable. These receivables are stated at their transaction value, net of an allowance for doubtful accounts. Trade accounts receivable are generated primarily from the Company’s concentrate and cathode sales, are denominated in US dollars, have current maturities, do not bear interest and have no specific guarantees.
Receivables are non-derivative financial assets with fixed or determinable payments that are not quoted in an active market. After initial measurement, receivables are subsequently carried at amortized cost using the effective interest method less any provision for impairment (i.e. allowance for doubtful accounts).
The Company assesses whether, as of the date of the financial statements, there is objective evidence of impairment in the value of the receivable. Any resulting impairment is measured as the difference between the book value of the receivable and the present value of the estimated future cash flows, discounted at an original effective interest rate or one applicable to a similar transaction. The carrying amount of the receivable is reduced by means of an allowance account and recognized in the statements of comprehensive income.
Embedded derivatives -
The Company’s copper sales are provisionally priced at the time of shipment. The provisional prices are finalized in a specified future month based on quoted London Metal Exchange (LME) monthly average prices. The Company receives market prices based on prices in the specified future month, which results in price fluctuations recorded through revenues until the date of settlement. The Company records revenues and invoices customers at the time of shipment based on then-current LME prices, which results in an embedded derivative that is required to be separated from the main contract.
The Company’s embedded derivatives from sales are measured at fair value (based on LME spot copper prices) with subsequent changes recognized in the statements of comprehensive income until the month of settlement.
| (e) | Financial liabilities - |
All financial liabilities are recognized initially at fair value and, in the case of accounts payable and other financial liabilities, net of directly attributable transaction costs. The Company´s financial liabilities include loans, trade and other payables, other financial liabilities and embedded derivatives.
| F- 170 |
Notes to the Financial Statements (continue)
Loans-
Loans are initially recognized at their fair value, net of directly attributable transaction costs. After initial recognition, loans are subsequently measured at amortized cost using the effective interest rate method. Gains and losses are recognized in the statement of comprehensive income when the liabilities are derecognized as well as through the amortization process.
Amortized cost is calculated taking into account any discount or premium on acquisition and fees or costs that are an integral part of the effective interest rate. Amortization under the effective interest rate method is included as financial costs in the statements of comprehensive income.
| (f) | Offsetting of financial instruments – |
Financial assets and financial liabilities are offset and the net amount reported in the statements of financial position if, and only if, there is a currently enforceable legal right to offset the recognized amounts and it is management’s intention to settle on a net basis, or to realize the assets and settle the liabilities simultaneously.
| (g) | Inventories - |
Inventories are stated at the lower of cost or net realizable value. Inventory of materials and supplies, as well as saleable products and in-process inventory are determined using the weighted-average cost method. The cost of finished goods and in-process inventory (i.e., stockpiles) includes labor and benefits, supplies, energy and other costs related to the mining and processing of minerals. Net realizable value is the estimated future sales price based on forward metal prices (for the period they are expected to be processed in), less estimated costs to complete production and bring the inventory to sale. The current portion of work in process is determined based on the amount the Company expects to process in the next twelve months. Inventories that are not expected to be processed in the next twelve months are classified as long-term inventories.
No adjustments to inventories were required for the years ended December 31, 2016 and 2015.
| F- 171 |
Notes to the Financial Statements (continue)
Provision for obsolescence -
Obsolescence allowances are established based on an item-by-item analysis by management. Any amount of obsolescence identified is charged to the statements of comprehensive income in the period it is deemed to have occurred.
| (h) | Property, plant and equipment - |
Property, plant and equipment are valued at historical cost, including costs that are directly attributed to the construction or acquisition of the asset, net of accumulated depreciation, amortization and impairment.
Repairs and/or improvements that increase the economic life of an asset and for which it is probable that there will be future economic benefit to the Company, are recorded as assets. All other maintenance costs are charged to expense as incurred.
Land is not depreciated. Depreciation of assets directly related to the useful life of the mine is calculated using the units-of-production (UOP) method based on the mine’s proven and probable reserves. Other assets are depreciated using the straight-line method based on the following estimated useful lives:
| Years | ||
| Buildings and other constructions | Between 5 and 35 | |
| Machinery and equipment | Between 3 and 25 | |
| Transportation units | 7 | |
| Furniture and fixtures | 7 | |
| Other equipment | Between 3 and 25 |
Critical spare parts and other parts which are directly identified with machinery or equipment are included in property, plant and equipment, and the economic life assigned corresponds to the main asset with which they are identified.
An item of property, plant and equipment is retired at the time of its disposal or when no future economic benefits are expected from its use or subsequent disposition. Any gain or loss arising at the time of retirement is calculated as the difference between the proceeds from the sale and the book value of the asset and is included in the statements of comprehensive income in the year the asset is retired.
The residual value and useful economic lives of the Company’s property, plant and equipment are reviewed, and adjusted if appropriate, at each year end.
Impairment-
At each reporting date, the Company evaluates if there is any indication that an asset could be impaired. If such an indication exists, the Company estimates the recoverable amount of the asset. The recoverable amount of an asset is the greater of its fair value less costs to sell or its value in use and is determined for the assets of the mine as a whole, since there are no assets that generate cash revenues independently.
When the book value of an asset exceeds its recoverable amount, the asset is considered impaired and is reduced to its recoverable amount. When evaluating the value in use, the future estimated cash flows are discounted to their present value using an after-tax discount rate that reflects current market evaluations of the time value of money and the specific risks to the asset.
| F- 172 |
Notes to the Financial Statements (continue)
Losses resulting from the impairment of assets are recognized in the statements of comprehensive income under the categories of expenses consistent with the function of the impaired asset. A previously recognized impairment loss is reversed only if there has been a change in the estimates used to determine the asset’s recoverable amount since the last impairment loss was recognized. The revised valuation cannot exceed the book value that would have been determined, net of depreciation, if an impairment loss for the asset had not been recognized in a previous period. Such a reversal is recognized in the statements of comprehensive income.
There was no asset impairment loss for the Company for the years ended December 31, 2016, 2015 and 2014.
| (i) | Intangible Assets – |
Intangible assets are recorded at cost less accumulated amortization. After the initial recognition, the intangible assets are recorded at its cost less accumulated amortization and any accumulated loss for impairment of use, if applicable.
| (j) | Exploration, development and stripping costs - |
Exploration costs -
Mineral exploration costs, as well as drilling and other costs incurred for the purpose of converting mineral resources to proven and probable reserves, or identifying new mineral resources at development or production stage properties, are charged to the statements of comprehensive income as incurred.
Development costs -
Development costs are capitalized when the economic and technological feasibility of the project is confirmed, which is generally when the development or project has reached a milestone in accordance with a model established by management.
Stripping cost -
In accordance with IFRIC 20, “Stripping Cost in the Production Phase of a Surface Mine,” stripping costs incurred in the production phase are capitalized as a component of property, plant and equipment (see Note 8) if the stripping activity improves access to the ore body or enhances an existing asset. The stripping activity asset is subsequently amortized using the UOP method over the life of the mine.
| F- 173 |
Notes to the Financial Statements (continue)
| (k) | Provisions - |
General -
A provision is recognized when the Company has a present obligation (legal or constructive) as a result of a past event, it is probable that resources of the Company will be required to settle the obligation, and an estimate of the amount of the obligation can be calculated. The expense relating to any provision is presented in the statements of comprehensive income, net of any reimbursement, in the period the provision is established.
If the effect of the time value of money is significant, provisions are discounted by applying a discount rate that reflects, where applicable, the risks specific to the liability. When discounting is used, the increase in the provision due to the passage of time is recognized as a financial expense in the statements of comprehensive income.
Mine closure provision -
The Company records a mine closure provision when a contractually or legally enforceable obligation arises. The Company estimates the present value of its future obligation for mine closure and increases the carrying amount of the related asset retirement cost (ARC), which is included in property, plant and equipment in the consolidated statements of financial position. Subsequently, the mine closure provision is accreted to full value over time and recognized as an interest cost considered in the initial fair value estimate. The related ARC is depreciated using the UOP method during the economic life of the mine.
The Company evaluates its mine closure provision on a quarterly basis and makes adjustments to estimates and assumptions, including scope, future costs and discount rates, as applicable. Changes in the fair value of the mine closure provision or the useful life of the related asset are recognized as an increase or decrease in the book value of the provision and the related ARC in accordance with IAS 16, “Property, Plant and Equipment.” Any decrease in the mine closure provision and related ARC cannot exceed the current book value of the asset; amounts over the current book value will be recorded in the statements of comprehensive income.
| (l) | Revenue recognition - |
The Company primarily sells copper concentrate and cathode in accordance with sales contracts entered into with its customers. Revenues comprise the fair value of the sale of goods, net of related general sales taxes. The Company recognizes revenue when the amount can be reliably measured, it is probable that future economic benefits will flow to the Company and all significant risks (including title and insurance risk) and rewards of ownership have transferred to the customer. Revenue is not considered reliably measured until all contingencies relating to the sale have been resolved.
| F- 174 |
Notes to the Financial Statements (continue)
Sales of copper concentrate and copper cathode -
Local sales of copper cathode are recognized when the Company has delivered the goods to the shipping company designated by the customer. Revenue associated with foreign sales of copper concentrate and copper cathode is recognized when all significant risks and rewards of ownership have transferred to the customer, which is typically when the inventory has passed over the vessel’s rail at the port of loading.
As described in Note (d), the Company’s copper sales are provisionally priced at the time of shipment. The provisional prices are finalized in a specified future month in accordance with the terms specified in the related sales contract and based on quoted LME monthly average prices. The Company receives market prices in the specified future month, and these sales result in changes recorded to revenues until the specified future month. The Company records revenues and invoices customers at the time of shipment based on then-current LME prices, which results in an embedded derivative that is bifurcated from the host contract.
Beginning in 2014, the Company’s revenues are subject to OSINERGMIN (Organismo Supervisor de la Inversion en Energía y Minería) and OEFA (Organismo de Evaluación y Fiscalización Ambiental) royalties. The calculation for the OSINERGMIN contribution is 0.16% of invoiced sales for the year 2016 (0.19% for the year 2015 and 0.21% for the year 2014), and the calculation for the OEFA contribution is 0.13% of invoiced sales for the year 2016 (0.15% for the years 2015 and 2014). Those royalties are presented as a reduction of revenues (see Note 14).
| (m) | Income taxes, deferred taxes and other taxes |
Income taxes -
Income tax assets and liabilities are measured at the amounts expected to be paid to or recovered from the tax authorities. The tax rates and tax laws that are applied to compute the amounts are those that are enacted or substantially enacted at the end of the reporting period. The Company calculates the provision for income tax in accordance with the Peruvian tax legislation in force. For the years 2016, 2015 and 2014, the Company was subject to an income tax rate of 32% (see Note 13(b)).
Deferred Taxes -
Deferred taxes are presented using the liability method for differences between the tax basis of assets and liabilities and their book value for financial reporting purposes. Deferred tax liabilities are recognized for all taxable differences. Deferred tax assets are recorded for all deductible differences when there is a probability that there could be taxable earnings against which the deductible difference could be applied.
The book value of deferred tax assets is reviewed at the end of each period and reduced to an amount that is more likely than not to be realized against taxable earnings. Deferred tax assets that are not recognized are reassessed at each period and are recognized when it is more likely than not those future taxable earnings will allow for the deferred tax asset to be recovered.
| F- 175 |
Notes to the Financial Statements (continue)
Deferred tax assets and liabilities are measured at tax rates that are expected to be applicable during the year when the assets are realized or the liabilities are liquidated, based on the tax rates (and tax laws) that have been enacted or substantively enacted at the end of the period. Deferred tax assets and liabilities are offset if there is a legally enforceable right to offset tax assets against tax liabilities and the deferred tax is related to the same entity and the same tax authority.
Mining Taxes -
On September 29, 2011, Law N° 29788 (which amended Law N° 28528) was enacted creating a new mining tax and royalty regime in Peru. Under the new regime, companies that do not have stability agreements are subject to a royalty and a special mining tax. Cerro Verde was not subject to the royalty and special mining tax until its 1998 stability agreement expired on December 31, 2013. Under the terms of its current 15-year stability agreement (see Note 13(a)), which became effective January 1, 2014, the Company is subject to mining royalties and a special mining tax for all of its mining production (see Note 13(d)), the company pays Mining Royalties and Special Mining Tax.
Supplementary Retirement Fund –
On July 9, 2011, Law N° 29741 was enacted and established the creation of a Mining, Metallurgical and Steel Supplementary Retirement Fund (SRF), which is a social security retirement fund for mining, metals and steel industry workers. Under the terms of its current 15-year stability agreement, the Company is subject to SRF, which is calculated as 0.5% of net taxable income.
| (n) | Benefits to employees |
Salaries and wages, bonuses, post-employment benefits and vacations are calculated in accordance with IAS 19, "Employee Benefits" and current Peruvian legislation based on the accrual principle.
Worker’s profit sharing
The Company recognizes worker’s profit sharing in accordance with IAS 19. Worker’s profit sharing is calculated in accordance with Peruvian laws (Legislative Decree No. 892), and the Company's worker’s profit sharing rate is 8% over the taxable net base of the current year. According to Peruvian law, the limit in the worker's profit sharing that an employee could receive is equivalent to 18 months of wages, and any excess above such limit is transferred to the Regional Government and the National Fund for Employment’s Promotion and Training. The Company’s workers profit share is recognized as a liability in the statements of financial position and as operating expenses in the statements of comprehensive income.
| F- 176 |
Notes to the Financial Statements (continue)
| (o) | Borrowing cost - |
Costs directly attributable to the acquisition, construction or production of a qualifying asset are capitalized as finance cost as part of the asset. A qualifying asset is one whose value is greater than US$1 million and requires at least 12 months to be ready for its intended use. All other borrowing costs are expensed in the period in which they occur. Borrowing costs consist of interest and other costs that the Company incurs in connection with the borrowing of funds.
| (p) | Fair value measurement - |
The Company measures its embedded derivatives, at fair value at each date presented in the statement of financial position.
Fair value is the price that would be received to sell an asset or paid to transfer a liability in an orderly transaction between market participants at the measurement date.
The Company uses valuation techniques that are appropriate in the circumstances and for which sufficient data are available to measure fair value, maximizing the use of relevant observable inputs and minimizing the use of unobservable inputs.
All assets and liabilities for which fair value is measured or disclosed in the financial statements are categorized within the fair value hierarchy, described, as follows, based on the lowest level input that is significant to the fair value measurement as a whole:
| - | Level 1 — Quoted (unadjusted) market prices in active markets for identical assets or liabilities |
| - | Level 2 — Valuation techniques for which the lowest-level input that is significant to the fair value measurement is directly or indirectly observable |
| - | Level 3 — Valuation techniques for which the lowest level input that is significant to the fair value measurement is unobservable |
For the purpose of fair value disclosures, the Company has determined classes of assets and liabilities based on the nature, characteristics and risks of the asset or liability and the level of the fair value hierarchy as explained above.
| (q) | Basic and diluted earnings per share |
Basic and diluted earnings per share have been calculated based on the weighted average number of common shares outstanding during the period. When the number of shares is modified as a result of capitalization of retained earnings, the net income per basic and diluted shares is adjusted retroactively for all of the periods reported. For the years 2016 and 2015, the Company did not have any financial instruments with dilutive effects; as a result, the basic and diluted shares are the same in all periods presented.
| F- 177 |
Notes to the Financial Statements (continue)
| (r) | New IFRS - |
Following is a summary of improvements and amendments to IFRS that are not yet effective but will be applicable to the Company.
| - | IFRS 15 “Revenue from Contracts with Customers”, was issued in May 2014 and establishes a five-step model to account for revenue arising from contracts with customers. Under IFRS 15, revenue is recognized at an amount that reflects the consideration to which an entity expects to be entitled in exchange for transferring goods or services to a customer. The new revenue standard will supersede all current revenue recognition requirements under IFRS. The Company will adopt IFRS 15 on January 1, 2018, and currently expects to apply the modified retrospective approach under which any cumulative effect adjustment would be recorded as of the adoption date. The Company is currently assessing the impact of this guidance on its financial reporting and disclosures, but at this time does not expect the adoption of IFRS 15 to have a material impact on its financial statements. |
| - | IFRS 9 “Financial Instruments, revised”, effective January 1, 2018, modifies the treatment and classification of financial assets established by IAS 39. The adoption of IFRS 9 is not expected to have a significant effect on the classification and measurement of the Company’s financial assets and liabilities. |
| - | IFRS 16 “Leases”, effective January 1, 2019, sets out the principles for the recognition, measurement, presentation and disclosure of leases. For lessees, IFRS 16 eliminates the classification of leases as either operating or financing, and introduces a single lessee accounting model that will require the recognition of (a) assets and liabilities for most leases with a term of more than 12 months and (b) depreciation of lease assets separately from interest on lease liabilities in the income statement. Management is currently evaluating the impact IFRS 16 will have on the Company’s financial reporting and disclosures. |
| 3. | Cash and cash equivalents |
This item is made up as follows:
| December 31, 2016 | December 31, 2015 | |||||||
| US$(000) | US$(000) | |||||||
| Cash in banks | 2,990 | 5,604 | ||||||
| Cash equivalents (a) | 26,961 | 348 | ||||||
| 29,951 | 5,952 | |||||||
| F- 178 |
Notes to the Financial Statements (continue)
| (a) | Cash equivalents comprises a portfolio of investments in highly marketable liquid investments, (investments classified as “AAA” by Standard & Poor’s and Moody’s), which yield variable returns, and are classified as cash equivalents because they are readily convertible to known amounts of cash and management plans to use them for its short-term cash needs. Because of the short maturity of these investments (i.e., less than 90 days) the carrying amount of these investments corresponds to their fair value at the date of the financial statements. Changes in the fair value of these investments are insignificant. |
| 4. | Related parties |
Accounts receivable from related parties and accounts payable to related parties are made up as follows:
| December 31, 2016 | December 31, 2015 | |||||||
| US$(000) | US$(000) | |||||||
| Accounts receivable from related parties | ||||||||
| Parent Company | ||||||||
| FMC (a) | 345,609 | 180,024 | ||||||
| Other related parties | ||||||||
| Sumitomo Metal Mining Company, Ltd. (b) | 23,552 | 19,344 | ||||||
| Climax Molybdenum Marketing Corporation (c), (d) | 6,145 | - | ||||||
| 375,306 | 199,368 | |||||||
| Accounts payable to related parties | ||||||||
| Parent Company | ||||||||
| FMC (e) | 30,353 | 14,435 | ||||||
| Other related parties | ||||||||
| Freeport-McMoRan Sales Company Inc. | 3,134 | 1,684 | ||||||
| Minera Freeport-McMoRan South America Ltda | 779 | 901 | ||||||
| Freeport Cobalt OY | - | 141 | ||||||
| Minera Freeport-McMoRan South America S.A.C. | - | 132 | ||||||
| Sociedad Contractual Minera El Abra | - | 535 | ||||||
| Climax Molybdenum Marketing Corporation (d) | - | 1,064 | ||||||
| Total accounts payable to related parties | 34,266 | 18,892 | ||||||
| Less: accounts payable to related parties, long term | (7,132 | ) | (6,850 | ) | ||||
| Total accounts payable, short term | 27,134 | 12,042 | ||||||
| F- 179 |
Notes to the Financial Statements (continue)
| (a) | Accounts receivable from FMC mainly correspond to sales of copper concentrate and cathode. On October 15, 2006, the Company signed a long-term agreement with FMC through which it committed to sell 20% of its annual copper concentrate production. These amounts exclude adjustments for embedded derivatives (see Notes 5 and 11). On October 15, 2015, the Company signed a long-term agreement with FMC through which it committed to sell between 70% and 80% of its annual copper concentrate production from January 1, 2017 to December 31, 2021. Terms of the contracts are reviewed annually. |
| (b) | On June 1, 2005, the Company signed a long-term agreement with Sumitomo Metal Mining Company Ltd., by which it committed to sell 50% of its annual copper concentrate production, through December 31, 2016. These amounts exclude adjustments for embedded derivatives (see Notes 5 and 11). On October 15, 2015, the Company signed a long-term agreement with Sumitomo Metal Mining Company Ltd. through which it committed to sell 21% of its annual copper concentrates production from January 1, 2017 to December 31, 2021. Terms of the contracts are reviewed annually. |
| (c) | In November 2014, the Company renewed a long-term agreement with Climax Molybdenum Marketing Corporation (a wholly owned subsidiary of FMC) by which it committed to sell 100% of its annual molybdenum concentrate production, at a price based on the Metals Week Dealer Oxide price and under a delivery type known as CIF (cost, insurance and freight) from January 1, 2015 through December 31, 2020. These amounts exclude adjustments for embedded derivatives (see Notes 5 and 11). |
| (d) | Climax Molybdenum Marketing Corporation is a subsidiary of the parent company. |
| (e) | Accounts payable to FMC as of December 31, 2016 mainly reflects the purchase of a used shovel (US$22.3 Million). |
Employee benefits -
Short-term and long-term employee benefits are recognized as expenses during the period earned. Benefits received by key management personnel represent 0.53% of total revenues for the year 2016 (1.76% for the year 2015 and 0.66% for the year 2014). For the years 2016, 2015 and 2014, the Company had granted stock option and/or restricted stock unit benefits to certain key management personnel, the amounts of which are not significant at those dates. As of December 31, 2016 and 2015, the Company does not have any other long-term benefits.
Shareholder loans –
The Company has entered into loans with its shareholders. See Note 10(b) for a discussion of these arrangements.
Terms and transactions with related parties –
Transactions with related parties are made at normal market prices. Outstanding balances are unsecured, interest free and settlement occurs in cash. There have been no guarantees provided or received for any accounts receivables from affiliates. As of December 31, 2016 and 2015, the Company had not recorded any impairment of accounts receivable from related parties.
| 5. | Other accounts receivable |
This item is made up as follows:
|
December 31,
2016 |
December 31,
2015 |
|||||||
| US$(000) | US$(000) | |||||||
| Embedded derivatives (Note 21) | 67,449 | - | ||||||
| Other | 2,594 | 2,771 | ||||||
| 70,043 | 2,771 | |||||||
| F- 180 |
Notes to the Financial Statements (continue)
| 6. | Inventories, net |
This item is made up as follows:
|
December 31,
2016 |
December 31,
2015 |
|||||||
| US$(000) | US$(000) | |||||||
| Work-in-process (a) | 448,792 | 445,003 | ||||||
| Materials and supplies | 251,144 | 247,107 | ||||||
| Finished goods: | ||||||||
| Copper cathode | 8,220 | 11,865 | ||||||
| Copper concentrate | 15,073 | 8,948 | ||||||
| Molybdenum concentrate | 2,763 | 1,292 | ||||||
| Materials and supplies in-transit | 491 | 1,315 | ||||||
| Less: Provision for obsolescence of materials and supplies | (303 | ) | (692 | ) | ||||
| Total | 726,180 | 714,838 | ||||||
| Less : Long-term work-in-process inventories (see Note 7) | (300,614 | ) | (319,971 | ) | ||||
| Current inventories | 425,566 | 394,867 | ||||||
| (a) | Work-in-process inventories represent mill and leach stockpiles which contain higher grade ores and medium and lower grade ores that have been extracted from the open pit and are available for copper recovery. Based on the future mine plan production the Company identifies the portion of inventory that is classified as current or long term. For mill stockpiles, recovery is through milling and concentrating. For leach stockpiles, recovery is through exposure to acidic solutions that dissolve copper and deliver it in a solution to extraction processing facilities. |
| F- 181 |
Notes to the Financial Statements (continue)
| 7. | Other non-financial assets |
This item is made up as follows:
|
December 31,
2016 |
December 31,
2015 |
|||||||
| US$(000) | US$(000) | |||||||
| Current | ||||||||
| Value added tax credit (a) | 308,177 | 408,202 | ||||||
| Other taxes to be recovered | 2,830 | 2,379 | ||||||
| Income tax prepayments (b) | - | 21,718 | ||||||
| Total Current | 311,007 | 432,299 | ||||||
| Non-Current | ||||||||
| Long term inventories (See note 6(a)) | 300,614 | 319,971 | ||||||
| Other Receivables (c) | 180,741 | 180,741 | ||||||
| Installment program (mining royalties case) (d) | 96,233 | 64,405 | ||||||
| Income tax prepayments (b) | 19,550 | 91,879 | ||||||
| VAT credit | - | 44,977 | ||||||
| Total Non-Current | 597,138 | 701,973 | ||||||
| TOTAL Non-financial assets | 908,145 | 1,134,272 | ||||||
| (a) | Mainly attributable to purchases related to the expansion of the Company´s production unit (See Note 1(b)). As of December 31, 2016, the Company expects to recover the VAT credits within the next twelve months. |
| (b) | Represents disbursements made by the Company for the prepayment of income tax , which the Company expects to use to offset future tax obligations or will be refunded to the Company by SUNAT (see Note 13(b)). |
| (c) | Represents disbursement made by the Company in connection with disputed tax assessments related to reviews by SUNAT (Superintendencia Nacional de Administración Tributaria) from years 2004 to 2010 (see Note 13(c) and 13(e)). According to current tax procedures and the time frame for resolving these types of claims, the Company and its legal advisors expect resolution of this matter will be favorable to the Company. |
| (d) | Represents payments made under protest by the Company for an installment program approved by SUNAT associated with mining royalties for the period December 2006 to December 2008 (see Note 13(d)). Management and its legal advisors expect that the resolution of this matter will be favorable to the Company. |
| F- 182 |
Notes to the Financial Statements (continue)
| 8. | Property, plant and equipment, net |
The changes in cost and accumulated depreciation accounts as of December 31, 2016 are shown below:
|
January 1,
2015 |
Additions | Disposals |
Adjustments and
reclassifications |
Transfers |
December 31,
2015 |
Additions | Adjustments | Disposals | Transfers |
December 31,
2016 |
||||||||||||||||||||||||||||||||||
| US$(000) | US$(000) | US$(000) | US$(000) | US$(000) | US$(000) | US$(000) | US$(000) | US$(000) | US$(000) | US$(000) | ||||||||||||||||||||||||||||||||||
| Cost | ||||||||||||||||||||||||||||||||||||||||||||
| Land | 15,275 | - | - | - | 5,109 | 20,384 | - | - | - | 3,299 | 23,683 | |||||||||||||||||||||||||||||||||
| Buildings and other constructions | 182,908 | - | (1,099 | ) | 7,571 | 2,012,742 | 2,202,122 | - | (11,114 | ) | (5,633 | ) | 191,586 | 2,376,961 | ||||||||||||||||||||||||||||||
| Machinery and equipment | 2,008,349 | - | (19,537 | ) | (7,571 | ) | 2,222,190 | 4,203,431 | - | 11,114 | (4,427 | ) | 232,062 | 4,442,180 | ||||||||||||||||||||||||||||||
| Transportation units | 17,202 | - | (284 | ) | - | 2,709 | 19,627 | - | - | (730 | ) | 213 | 19,110 | |||||||||||||||||||||||||||||||
| Furniture and fixtures | 790 | - | (3 | ) | - | 163 | 950 | - | - | (1 | ) | - | 949 | |||||||||||||||||||||||||||||||
| Other equipment | 22,261 | - | (984 | ) | - | 3,451 | 24,728 | - | - | (1,065 | ) | 1,008 | 24,671 | |||||||||||||||||||||||||||||||
| Construction in progress and in-transit units | 2,979,151 | 1,629,271 | - | - | (4,246,364 | ) | 362,058 | 154,876 | - | - | (428,168 | ) | 88,766 | (a) | ||||||||||||||||||||||||||||||
| Stripping activity asset (see Note 2(j)) | 151,679 | 111,819 | - | - | - | 263,498 | 61,261 | - | - | - | 324,759 | |||||||||||||||||||||||||||||||||
| Asset retirement costs | 112,387 | 3,534 | - | 33,803 | - | 149,724 | 3,743 | (16,091 | ) | - | 137,376 | |||||||||||||||||||||||||||||||||
| 5,490,002 | 1,744,624 | (21,907 | ) | 33,803 | - | 7,246,522 | 219,880 | (16,091 | ) | (11,856 | ) | - | 7,438,455 | |||||||||||||||||||||||||||||||
| Accumulated depreciation | ||||||||||||||||||||||||||||||||||||||||||||
| Buildings and other constructions | 38,316 | 20,510 | (1,059 | ) | 3,136 | - | 60,903 | 88,925 | (30 | ) | (4,936 | ) | - | 144,862 | ||||||||||||||||||||||||||||||
| Machinery and equipment | 836,725 | 151,460 | (18,524 | ) | (3,136 | ) | - | 966,525 | 275,388 | 30 | (3,964 | ) | - | 1,237,979 | ||||||||||||||||||||||||||||||
| Transportation units | 8,248 | 1,741 | (266 | ) | - | - | 9,723 | 1,828 | - | (686 | ) | - | 10,865 | |||||||||||||||||||||||||||||||
| Furniture and fixtures | 776 | 5 | (4 | ) | - | - | 777 | 26 | - | (1 | ) | - | 802 | |||||||||||||||||||||||||||||||
| Other equipment | 11,512 | 2,054 | (984 | ) | - | - | 12,582 | 2,423 | - | (1,052 | ) | - | 13,953 | |||||||||||||||||||||||||||||||
| Stripping activity asset | 44,901 | 66,651 | - | - | - | 111,552 | 97,513 | - | - | - | 209,065 | |||||||||||||||||||||||||||||||||
| Asset retirement costs | 5,118 | 2,053 | - | - | - | 7,171 | 6,018 | - | - | - | 13,189 | |||||||||||||||||||||||||||||||||
| 945,596 | 244,474 | (20,837 | ) | - | - | 1,169,233 | 472,121 | - | (10,639 | ) | - | 1,630,715 | ||||||||||||||||||||||||||||||||
| Net cost | 4,544,406 | 6,077,289 | 5,807,740 | |||||||||||||||||||||||||||||||||||||||||
| (a) | As of December 31, 2016 construction in progress corresponds to the tailings cyclone relocation and one used shovel (See note 4(e)). |
| F- 183 |
Notes to the Financial Statements (continue)
| 9. | Trade accounts payable |
Trade accounts payable are primarily originated by the acquisition of materials, supplies, services and spare parts. These obligations are primarily denominated in U.S. dollars, have current maturities and do not accrue interest. No guarantees have been granted. The decrease in trade accounts payable during 2016, primarily related to the completion of Cerro Verde’s production unit expansion. As of December 31, 2016, trade accounts payable includes US$12.7 million related to capital projects, compared to US$279.4 million as of December 31, 2015.
| 10. | Other Financial Liabilities (debt) |
This item is made up as follows:
|
December 31,
2016 |
December 31,
2015 |
|||||||
| US$(000) | US$(000) | |||||||
| Current Debt | ||||||||
| Leases | 161 | 169 | ||||||
| Promissory notes | - | 43,000 | ||||||
| Total current debt | 161 | 43,169 | ||||||
| Non-Current Debt | ||||||||
| Senior unsecured credit facility (a) | 1,400,000 | 1,800,000 | ||||||
| Less : Debt issuance cost | (10,171 | ) | (19,072 | ) | ||||
| Senior unsecured credit facility, net | 1,389,829 | 1,780,928 | ||||||
| Shareholder loans (b) | 606,014 | 600,907 | ||||||
| Leases | - | 160 | ||||||
| Total non-current debt | 1,995,843 | 2,381,995 | ||||||
| Total Debt | 1,996,004 | 2,425,164 | ||||||
| (a) | In March 2014, the Company entered into a five-year, US$1.8 billion senior unsecured credit facility with several banks led by Citibank N.A. as the administrative agent. The credit facility allowed for term loan borrowings up to the full amount of the facility, less any amounts issued and outstanding under a US$500 million letter of credit sublimit. Interest on amounts drawn under the term loan is based on London Interbank Offered Rate (LIBOR) plus a spread (currently 1.9%) based on the Company´s total net debt to earnings before interest, taxes, depreciation and amortization (EBITDA) ratio, as defined in the agreement. The disbursements were mainly used to finance a portion of the Company´s expansion project. |
The credit facility amortizes in three installments in amounts necessary for the aggregate borrowings and outstanding letters of credit not to exceed 85% of the US$1.8 billion commitment on September 30, 2017, 70% on March 31, 2018, and 35% on September 30, 2018, with the remaining balance due on the maturity date of March 10, 2019. During the year 2016, the Company repaid US$400 million of the credit facility borrowings and no letters of credit were issued. As of December 31, 2016, there are no guarantees provided for the credit facility.
Restrictive Covenants –
The credit facility contains certain financial ratios that the Company must comply with on a quarterly basis, including a total net debt to EBITDA ratio and an interest coverage ratio, which are defined by the agreement. As of December 31, 2016, the Company was in compliance with all of its covenants.
| F- 184 |
Notes to the Financial Statements (continue)
| (b) | In December 2014, the Company entered into shareholder loan agreements with, or affiliates of, FMC, Compañía de Minas Buenaventura SAA and Sumitomo, that are currently subordinated to the senior unsecured credit facility described in section (a) above. These agreements allow for borrowings up to an amount of US$800 million in aggregate. At December 31, 2016, the Company had borrowed US$606 million under these loan agreements (including US$6 million of interest). The interest rate is currently calculated based on the LIBOR rate plus the average rate of the senior unsecured credit facility, plus 0.5% (currently 3.17%). In the event these loans are no longer subordinated to the senior unsecured credit facility, the rate would be LIBOR plus the current spread on the credit facility. The loans mature on December 22, 2019, unless at that time there is senior financing associated with the expansion project that is senior to the loans, in which case the loans mature two years following the maturity of the senior financing. |
| 11. | Provisions |
This item is made up as follows:
|
December 31,
2016 |
December 31,
2015 |
|||||||
| US$(000) | US$(000) | |||||||
| Current: | ||||||||
| Provision for social commitments (a) | 11,722 | - | ||||||
| Provisions related to services and freight not invoiced | 11,231 | 12,520 | ||||||
| Provision for legal contingencies | 1,505 | - | ||||||
| Provision for remediation and mine closure (b) | - | 2,142 | ||||||
| Embedded derivatives (Note 21) | - | 18,847 | ||||||
| 24,458 | 33,509 | |||||||
| Non – current: | ||||||||
| Provision for remediation and mine closure (b) | 153,313 | 159,128 | ||||||
| Provision for social commitments (a) | 4,060 | - | ||||||
| Other long-term liabilities | 7,249 | 4,675 | ||||||
| 164,622 | 163,803 | |||||||
| (a) | Corresponds to provision for social commitments associated with an irrigation project in La Joya (US$10.3 million) and repaving Alata-Congata Road (US$5.5 million). |
| (b) | The Company’s exploitation activities are subject to environmental protection standards. In order to comply with these standards, the Company has obtained the approval for the Environment Adequacy Program (PAMA) and for the Environmental Impact Studies (EIA), required for the operation of Cerro Verde’s production unit. |
On October 14, 2003, Law N° 28090 was enacted, which regulates the commitments and procedures that entities involved in mining activities must follow in order to prepare, file and implement a mine site closing plan, as well as the respective environmental guarantees that assure compliance with the plan in accordance with protection, conservation and restoration of the environment. On August 15, 2005, the regulations regarding this law were approved.
During 2006, in compliance with the mentioned law, the Company completed the closure plans for its mine site, and presented it to the Ministry of Energy and Mines. On October 5, 2009, the Ministry of Energy and Mines issued Resolution No 302-2009 MEM-AAA, approving the Company’s mine closure plan. As of December 31, 2016, pursuant to legal requirements, the Company has issued letters of credit to the Ministry of Energy and Mines totaling US$28.4 million to secure mine closure plans.
| F- 185 |
Notes to the Financial Statements (continue)
The estimate of remediation and mine closing costs is based on studies prepared by independent consultants and based on current environmental regulations. This provision corresponds mainly to the activities to be performed in order to restore the areas affected by mining activities. The main tasks to be performed include ground removal, soil recovery, and dismantling of plant and equipment.
The table below presents the changes in the provision for remediation and mine closure:
| 2016 | 2015 | |||||||
| US$(000) | US$(000) | |||||||
| Beginning balance | 161,270 | 119,948 | ||||||
| Accretion expense | 4,391 | 3,985 | ||||||
| Changes in estimates, note 8 | (16,091 | ) | 33,803 | |||||
| Additions, note 8 | 3,743 | 3,534 | ||||||
| Final balance | 153,313 | 161,270 | ||||||
As of December 31, 2016, the Company’s provision for remediation and mine closure was US$153.3 million (reflecting the future value of the provision for remediation and mine closure of US$368.8 million, discounted using an annual risk-free rate of 2.97%). As of December 31, 2015, the Company’s provision for remediation and mine closure was US$161.3 million (reflecting the future value of the provision for remediation and mine closure of US$368.8 million, discounted using an annual risk-free rate of 2.81%). The Company considers this liability sufficient to meet the current environmental protection laws approved by the Ministry of Energy and Mines (MEM).
| F- 186 |
Notes to the Financial Statements (continue)
| 12. | Shareholders’ equity, net |
| (a) | Capital stock - |
As of December 31, 2016, the authorized, subscribed and paid-up capital in accordance with the Company’s by-laws and its related modifications was 350,056,012 common shares.
According to the July 11, 2003, Shareholders Agreement, the nominal value of the shares was denominated in US dollars in an amount of US$0.54 per share. As a consequence of the capitalization of restricted earnings associated with tax benefits (reinvestment credits), in December 2009, the nominal value of the shares was increased to US$2.83 per share.
The quoted price of these shares was US$19.11 per share as of December 31, 2016 (US$14.50 per share as of December 31, 2015).
As of December 31, 2016, the Company’s capital stock structure is as follows:
| Percentage of individual interest in capital |
Number of
shareholders |
Total percentage
interest |
||||||
| Up to 1.00 | 2,860 | 4.37 | ||||||
| From 1.01 to 20.00 | 2 | 21.07 | ||||||
| From 20.01 to 30.00 | 1 | 21.00 | ||||||
| From 30.01 to 60.00 | 1 | 53.56 | ||||||
| 2,864 | 100.00 | |||||||
| (b) | Other capital reserves - |
Other capital reserves include the Company’s legal reserve which is in accordance with the Peruvian Companies Act, and is created through the transfer of 10% of the earnings for the year up to a maximum of 20% of the paid-in capital. The legal reserve must be used to compensate for losses in the absence of non-distributed earnings or non-restricted reserves, and transfers made to compensate for losses must be replaced with future earnings. This legal reserve may also be used to increase capital stock but the balance must be restored from future earnings.
| (c) | Dividend Distribution - |
Dividends paid to shareholders, other than domiciled legal entities, are subject to retention of income tax.
On December 31, 2014, Law N° 30296 was enacted increasing the withholding tax rate to 6.8% for the years 2015 and 2016, 8.0% for 2017 and 2018 and 9.3% thereafter. On December 10, 2016, Legislative Decree was enacted reducing the withholding tax rate to 5.0% beginning January 1, 2017. For the years ended December 31, 2016, 2015 and 2014, the Company did not pay dividends.
| F- 187 |
Notes to the Financial Statements (continue)
| 13. | Tax situation |
| (a) | On February 13, 1998, the Company signed an Agreement of Guarantees and Measures to Promote Investments with the Government of Peru, under the Peruvian General Mining Law (the 1998 Stability Agreement). Upon approval of the 1998 Stability Agreement, the Company was subject to the tax regulations in force at May 6, 1996, for a period of 15 years, beginning January 1, 1999, and ending December 31, 2013. |
On July 17, 2012, the Company signed a new Agreement of Guarantees and Measures to Promote Investments with the Government of Peru, under the Peruvian General Mining Law. Upon approval of this stability agreement, the Company became subject to the tax regulations in force at July 17, 2012, for a period of 15 years, beginning January 1, 2014, and ending December 31, 2028.
| (b) | Under its current 15-year tax stability agreement, the Peruvian income tax rate applicable to the Company is 32%. As of December 31, 2016, prepayments of income tax, which the Company expects to be used to offset future income tax provisions or will be refunded by SUNAT was US$19.6 million (see Note 7). |
| (c) | SUNAT has the right to examine, and, if necessary, amend the Company’s income tax provision for the last four years. The Company’s income tax and VAT for the years 2012 through 2016 are open to examination by the tax authorities. The year 2011 is under review by SUNAT for both income tax and VAT. To date, SUNAT has concluded its review of the Company’s income tax and VAT exams through the year 2010, and the Company is in the claim and appeal process for the years 2002 through 2010. |
Due to the many possible interpretations of current legislation, it is not possible to determine whether or not future reviews (including reviews of years pending examination) will result in additional tax liabilities for the Company. If management determines it is probable that additional taxes are payable, these amounts, including any related interest and penalties, will be charged to expense in that period. In management’s and its legal advisors’ opinions, any possible tax settlement is not expected to be significant to the financial statements.
| (d) | Royalties and special mining taxes – |
On June 23, 2004, Law N° 28528 was approved, which requires the holder of a mineral concession to pay a royalty in return for the exploitation of metallic and non-metallic minerals. The royalty is calculated using rates ranging from 1% to 3% of the value of concentrate or its equivalent according to the international price of the commodity published by the Ministry of Energy and Mines. As described in Note 13(a), prior to January 1, 2014, these royalties were not applicable to the Company because it operated under the 1998 Stability Agreement with the Peruvian government. However, beginning January 1, 2014, the Company began paying royalties and a new special mining tax for its entire production base under its current 15-year stability agreement. See Note 13(b) for a summary of amounts recognized by the Company for special mining tax and mining royalties for the years ended December 31, 2016, 2015 and 2014.
| F- 188 |
Notes to the Financial Statements (continue)
SUNAT has assessed mining royalties on materials processed by the Company´s concentrator, which commenced operations in late 2006. These assessments cover the period December 2006 to December 2007 and the years 2008 to September 2011.
SUNAT issued resolutions denying the claims made by the Company from December 2006 through December 2009. The Company appealed this decision to Tax Court. In July 2013, the Peruvian Tax Tribunal issued two decisions reaffirming assessments for the period December 2006 through December 2008. Decisions by the Tax Court ended the administrative stage of the appeal procedures for these assessments.
On September 18, 2013, the Company filed two administrative demands in the court system. In connection with demands for the periods 2006 to 2007 the Eighteenth Contentious Administrative Court dismissed this claim. On May 2, 2016, Cerro Verde appealed this decision.
With respect to the judiciary appeal related to the assessment for the year 2008, on December 17, 2014, the Eighteenth Contentious Administrative Court rendered its decision upholding the Company’s position and nullifying SUNAT’s assessment and the Tax Tribunal´s resolution (S/106.4 million). The Court’s position also invalidates all penalties and interest assessed by SUNAT for that period (S/139.7 million). In December 2014, SUNAT and the Tax Court appealed this decision. On January 29, 2016, the Sixth Superior Justice Court nullified the decision of the Eighteenth Contentious Administrative Court. On February 23, 2016, the Company appealed the decision to the Supreme Court.
In September 2013, the Company filed a Constitutional claim in the court system related to the assessments because the Company believes that its 1998 Stability Agreement exempted all minerals extracted from its mining concessions from royalties, irrespective of the method used for processing those minerals. On September 15, 2016, Judiciary court dismissed the constitutional claim and on October 25, 2016, the Company appealed this decision.
On October 1, 2013, SUNAT served the Company a demand for payment totaling S/492 million (approximately US$146 million based on the December 31, 2016 exchange rate, including interest and penalties of US$86 million) based on the Tax Tribunal’s decisions for the period December 2006 to December 2008. As permitted by law, the Company requested, and was granted, an installment payment program that deferred payment for six months and thereafter satisfies the amount via 66 equal monthly payments. As of December 31, 2016, the Company has made payments totaling S/323 million (US$104 million based on the date of payment and US$96 million based on December 31, 2016 exchange rates) under the installment program, which are presented in the non-current portion of other non-financial assets in the statements of financial position (see Note 7). Based on the results rendered by the Eighteenth Contentious Administrative Court as is described in the previous paragraph, the Company requested an injunction that was accepted by the Judiciary and implied a modification of the installment program excluding the 2008 portion through SUNAT´s resolution notified to the Company on October 29, 2015. On August 18, 2016, the Sixth Superior Justice Court nullified the injunction described above and on September 28, 2016, SUNAT modified the Installment payment program to include the 2008 portion.
| F- 189 |
Notes to the Financial Statements (continue)
In July 2013, a hearing on SUNAT's assessment for 2009 was held, but no decision has been issued by the Tax Tribunal for that year. As of December 31, 2016, the amount of the assessment, including interest and penalties, for the year 2009 was S/268 million (approximately US $80 million based on the December 31, 2016 exchange rate).
In April 2016, the Company received assessments from SUNAT for the year 2010 and for January to September 2011. On May 11, 2016, the Company appealed these assessments. At December 31, 2016, the amount of assessments from SUNAT including interest and penalties for the years 2010 and January to September 2011 is S/543 million (approximately US$162 million based on the December 31, 2016 exchange rate).
As of December 31, 2016, the Company estimates that the total exposure associated with mining royalties for the period from December 2006 to December 2013, including interest and penalties, totals US$544 million (based on the December 31, 2016 exchange rate).
As of December 31, 2016, no provisions were recorded for these assessments or for the amounts paid under the installment payment program because management and its external legal advisors believe the Company’s 1998 Stability Agreement exempted it from these royalties and believes that the resolution will be favorable to the Company and any payments should be recoverable.
| (e) | Assessments received from SUNAT (different than mining royalties) |
The Company has also received assessments from SUNAT for additional taxes (other than the mining royalty explained in (d) above), including penalties and interest. The Company has filed or will file objections to the assessments because it believes it has properly determined and paid its taxes. A summary of these assessments follows:
| Year | Taxes |
Penalty and
interest |
Total | |||||||||
| US$(000) | US$(000) | US$(000) | ||||||||||
| 2002 – 2005 | 15,909 | 51,495 | 67,404 | |||||||||
| 2006 | 6,545 | 49,491 | 56,036 | |||||||||
| 2007 | 12,376 | 17,809 | 30,185 | |||||||||
| 2008 | 20,797 | 12,968 | 33,765 | |||||||||
| 2009 | 56,198 | 47,719 | 103,917 | |||||||||
| 2010 | 65,997 | 98,284 | 164,281 | |||||||||
| 2011 | 6,332 | 2,648 | 8,980 | |||||||||
| 2014 –2016 | 15,909 | - | 15,909 | |||||||||
| 200,063 | 280,414 | 480,477 | ||||||||||
| F- 190 |
Notes to the Financial Statements (continue)
As of December 31, 2016, the Company has paid US$180.7 million (included in “other non–financial assets-non-current” (See Note 7) in the statements of financial position) for these disputed tax assessments, which it believes is collectible. No amounts have been accrued for these assessments.
| (f) | As of December 31, 2016 and 2015, the Company has issued letters of credit to secure tax obligations amounting to S/387.5 million (equivalent to US $115.3 million) and S/383.8 million (equivalent to US$112.5 million), respectively, of which S/372.2 million (equivalent to US$110.8 million) and S/369.3 million (equivalent to US$108.2 million) are related to mining royalties for the years ended December 31, 2016 and 2015, respectively. |
| (g) | The Company recognizes the effect of temporary differences between the accounting base for financial reporting purposes and the tax base. The composition of this item is made up as follows: |
| December 31, 2016 | December 31, 2015 | |||||||
| US$(000) | US$(000) | |||||||
| Income tax | ||||||||
| Asset | ||||||||
| Provision for remediation and mine closure | 9,180 | 5,638 | ||||||
| Unpaid vacations | 4,055 | 2,515 | ||||||
| Provision for mining taxes | 4,003 | 1,505 | ||||||
| Cost of net asset for the construction of the tailing dam | 2,321 | 1,682 | ||||||
| Development costs | 228 | 332 | ||||||
| Price adjustment of copper concentrates and cathode | - | 7,849 | ||||||
| Other provisions | 5,248 | 4,750 | ||||||
| 25,035 | 24,271 | |||||||
| Liability | ||||||||
| Difference in depreciation method | 283,882 | 245,670 | ||||||
| Difference in valuation of inventories | 25,087 | 10,997 | ||||||
| Price adjustment of copper concentrates and cathode | 24,128 | - | ||||||
| Stripping activity asset | 23,594 | 17,820 | ||||||
| 356,691 | 274,487 | |||||||
| Deferred liabilities, net | 331,656 | 250,216 | ||||||
| Supplementary Retirement Fund | ||||||||
| Deferred liability | 3,458 | 2,937 | ||||||
| Total deferred income tax liability, net | 335,114 | 253,153 | ||||||
| F- 191 |
Notes to the Financial Statements (continue)
Reconciliation of the income tax rate -
For the years ended December 31, 2016, 2015 and 2014, the income tax expense recorded differs from the result of applying the legal rate to the Company’s profit before income tax, as detailed below:
| 2016 | 2015 | 2014 | ||||||||||
| US$(000) | US$(000) | US$(000) | ||||||||||
| Profit before income tax | 603,989 | 79,530 | 616,135 | |||||||||
| Income tax rate | 32 | % | 32 | % | 32 | % | ||||||
| Expected income tax expense | 193,276 | 25,450 | 197,163 | |||||||||
| Non - deductible expenses | 27,788 | 19,534 | 7,013 | |||||||||
| Special mining tax and mining royalties | (12,084 | ) | (4,672 | ) | (16,677 | ) | ||||||
| Income tax rate change effect on deferred taxes for change in Peruvian tax law once the current Stability Contract expires (from 26% to 29.5%) | 13,850 | - | - | |||||||||
| Income tax true – ups | 1,677 | (6,082 | ) | (6,985 | ) | |||||||
| Others | (1,913 | ) | (3,047 | ) | 82 | |||||||
| Current and deferred income tax charges to results | 222,594 | 31,183 | 180,596 | |||||||||
| Mining taxes charged to results | 37,763 | 14,599 | 52,116 | |||||||||
| Supplementary retirement fund charged to results | 2,725 | 464 | 5,817 | |||||||||
| 263,082 | 46,246 | 238,529 | ||||||||||
| Effective income tax | 43.56 | % | 58.15 | % | 38,71 | % | ||||||
Income tax -
The income tax expenses (benefit) for the years ended December 31, 2016, 2015 and 2014 is shown below:
| 2016 | 2015 | 2014 | ||||||||||
| US$(000) | US$(000) | US$(000) | ||||||||||
| Income tax | ||||||||||||
| Current | 141,153 | (832 | ) | 220,454 | ||||||||
| Deferred | 81,441 | 32,015 | (39,858 | ) | ||||||||
| 222,594 | 31,183 | 180,596 | ||||||||||
| Mining taxes | ||||||||||||
| Current Mining Royalty and Special Mining Tax | 37,763 | 14,599 | 52,116 | |||||||||
| Supplementary retirement fund | ||||||||||||
| Current | 2,205 | 54 | 3,290 | |||||||||
| Deferred | 520 | 410 | 2,527 | |||||||||
| 2,725 | 464 | 5,817 | ||||||||||
| Income tax expense reported in the statements of comprehensive income | 263,082 | 46,246 | 238,529 | |||||||||
| F- 192 |
Notes to the Financial Statements (continue)
| 14. | Sales of goods |
| (a) | This item is made up of the following: |
|
For the year ended
December 31, 2016 |
For the year ended
December 31, 2015 |
For the year ended
December 31, 2014 |
||||||||||||||||||||||
|
Pounds
(000) |
US$
(000) |
Pounds
(000) |
US$
(000) |
Pounds
(000) |
US$
(000) |
|||||||||||||||||||
| Copper concentrate | 995,386 | 1,967,052 | 440,071 | 794,197 | 375,688 | 949,459 | ||||||||||||||||||
| Copper cathode | 109,128 | 247,431 | 104,279 | 259,830 | 125,647 | 393,112 | ||||||||||||||||||
| Other (primarily silver and molybdenum concentrate) | 176,357 | 65,343 | 130,038 | |||||||||||||||||||||
| Subtotal Sales | 2,390,840 | 1,119,370 | 1,472,609 | |||||||||||||||||||||
| Less: Royalty contributions (see Note 2(l)) | (6,686 | ) | (3,753 | ) | (5,512 | ) | ||||||||||||||||||
| Total Net Sales | 2,384,154 | 1,115,617 | 1,467,097 | |||||||||||||||||||||
Sales to related parties totaled US$2.3 billion for the year ended December 31, 2016 (US$0.9 billion and US $1.1 billion for the years ended December 31, 2015 and 2014, respectively).
As described in Note 2(d), the Company’s copper sales are provisionally priced at shipment. Adjustments to the provisional prices are recognized as gains and losses in sales of goods through the month of settlement. Adjustments to provisional priced copper and molybdenum sales resulted in an increase to net sales of goods totaling US$86.3 million and US$7.9 million for the years ended December 31, 2016 and 2015, respectively and in lower sales for US$42.8 million in the year 2014.
| (b) | The following table shows net sales by geographic region based on the final destination port: |
|
For the year ended
December 31, 2016 |
For the year ended
December 31, 2015 |
For the year ended
December 31, 2014 |
||||||||||
| US$(000) | US$(000) | US$(000) | ||||||||||
| Asia | 1,865,346 | 770,272 | 883,404 | |||||||||
| North America | 213,002 | 79,244 | 113,591 | |||||||||
| Europe | 161,844 | 65,648 | 170,624 | |||||||||
| South America (primarily Peru) | 150,648 | 204,206 | 304,990 | |||||||||
| 2,390,840 | 1,119,370 | 1,472,609 | ||||||||||
| Less: Royalty contributions (see Note 2(l)) | (6,686 | ) | (3,753 | ) | (5,512 | ) | ||||||
| Total Net Sales | 2,384,154 | 1,115,617 | 1,467,097 | |||||||||
| F- 193 |
Notes to the Financial Statements (continue)
| (c) | Concentration of sales – |
For the year ended December 31, 2016, 95% of the Company’s sales were to related entities (FMC, Sumitomo Metal Mining Company and Climax Molybdenum). For 2015 and 2014, the 80% and 77% of the Company's sales were to these related entities, respectively.
| 15. | Cost of sales |
This item is made up of the following:
|
For the year ended
December 31, 2016 |
For the year ended
December 31, 2015 |
For the year ended
December 31, 2014 |
||||||||||
| US$(000) | US$(000) | US$(000) | ||||||||||
| Materials and supplies | 496,918 | 364,234 | 333,521 | |||||||||
| Depreciation and amortization | 472,997 | 244,477 | 164,985 | |||||||||
| Energy | 229,035 | 118,019 | 91,802 | |||||||||
| Labor (a) | 215,839 | 146,395 | 171,646 | |||||||||
| Third parties services | 100,897 | 95,087 | 87,458 | |||||||||
| Management Fees | 2,793 | 3,565 | 4,904 | |||||||||
| Change in work in process inventory | (3,789 | ) | (118,327 | ) | (70,523 | ) | ||||||
| Change in finished goods inventory | (3,951 | ) | 467 | (6,774 | ) | |||||||
| Other costs | 42,301 | 8,087 | 20,462 | |||||||||
| 1,553,040 | 862,004 | 797,481 | ||||||||||
| (a) | Labor includes an expense of US$36.8 million related to profit sharing for the year ended December 31, 2016 (credit of US$1.6 million for the year ended December 31, 2015 and expense of US$45.8 million for the year ended December 31, 2014). |
In compliance with corporate policies, the Company recognizes administrative costs directly to cost of production (approximately US$23.4 million for the year ended December 31, 2016, US$19.5 million for the year ended December 31, 2015 and US$20.4 million for the year ended December 31, 2014). The effect of this policy is immaterial to the financial statements as a whole.
| 16. | Selling Expenses |
This item is made up of the following:
|
For the year ended
December 31, 2016 |
For the year ended
December 31, 2015 |
For the year ended
December 31, 2014 |
||||||||||
| US$(000) | US$(000) | US$(000) | ||||||||||
| Concentrate freight | 122,431 | 51,842 | 50,507 | |||||||||
| Commissions | 5,989 | 2,729 | 2,271 | |||||||||
| Cathode freight | 2,148 | 1,644 | 1,432 | |||||||||
| Other | 823 | - | - | |||||||||
| 131,391 | 56,215 | 54,210 | ||||||||||
| F- 194 |
Notes to the Financial Statements (continue)
| 17. | Other operational expenses |
This item is made up of the following:
|
For the year ended
December 31, 2016 |
For the year ended
December 31, 2015 |
For the year ended
December 31, 2014 |
||||||||||
| US$(000) | US$(000) | US$(000) | ||||||||||
| Provision for Social Commitment (See Note 11) | 15,782 | - | - | |||||||||
| Start-up cost (a) | 2,080 | 19,568 | - | |||||||||
| Other costs, net | 6,245 | 7,171 | 5,873 | |||||||||
| 24,107 | 26,739 | 5,873 | ||||||||||
| (a) | Corresponds to start-up costs related to the new concentrator plant in order to reach full production capacity, which was achieved during the first quarter of 2016. See Note 1(b). |
| 18. | Financial Expenses |
This item is made up of the following:
|
For the year ended
December 31, 2016 |
For the year ended
December 31, 2015 |
For the year ended
December 31, 2014 |
||||||||||
| US$(000) | US$(000) | US$(000) | ||||||||||
| Interest on Senior unsecured credit facility (Note 10(a)) | 51,155 | 35,255 | 11,137 | |||||||||
| Interest shareholder loans (Note 10(b)) | 19,836 | 1,181 | - | |||||||||
| Amortization of debt issuance cost | 8,901 | 5,927 | 4,381 | |||||||||
| Other financial expenses | 1,880 | 7,366 | 1,156 | |||||||||
| Capitalized Interest | (1,334 | ) | (33,719 | ) | (16,305 | ) | ||||||
| 80,438 | 16,010 | 369 | ||||||||||
| 19. | Earnings per share |
Basic and diluted earnings per share are calculated by dividing earnings by the weighted-average number of outstanding shares during the period. Basic and diluted earnings per common share have been determined as follows:
|
For the year ended
December 31, 2016 |
For the year ended
December 31, 2015 |
For the year ended
December 31, 2014 |
||||||||||
| US$(000) | US$(000) | US$(000) | ||||||||||
| Profit for the period (US$) | 340,907,000 | 33,284,000 | 377,606,000 | |||||||||
| Weighted average number of share outstanding | 350,056,012 | 350,056,012 | 350,056,012 | |||||||||
| Basic and diluted earnings per share (US$) | 0.974 | 0.095 | 1.08 | |||||||||
| F- 195 |
Notes to the Financial Statements (continue)
| 20. | Financial risk management |
The Company’s activities are exposed to different financial risks. The main risks that could adversely affect the Company’s financial assets and liabilities or future cash flows are: the risk arising from changes in market prices of minerals, interest rate risk, credit risk and capital risk. The Company’s financial risk management program focuses on mitigating potential adverse effects on its financial performance.
Management knows the conditions prevailing in the market and based on its knowledge and experience, manages the risks that are summarized below. The Company’s Board of Directors reviews and approves the policies to manage each of these risks.
| (a) | Market risk - |
Commodity price risk -
The international price of copper has a significant impact on the Company’s operating results. The price of copper has fluctuated historically and is affected by numerous factors beyond the Company’s control. The Company does not hedge its exposure to price fluctuation.
As described in Note 2(d), the Company has price risk through its provisionally priced sales contracts, which provide final pricing in a specified future month (generally three months from the shipment date) based primarily on quoted LME monthly average prices. The Company records revenues and invoices customers at the time of shipment based on then-current LME prices, which results in an embedded derivative on the provisionally priced contract that is adjusted to fair value through revenues each period, using the period-end forward prices, until the date of final pricing. To the extent that final prices are higher or lower than what was recorded on a provisional basis, an increase or decrease to revenues is recorded each reporting period until the date of final pricing (see Note 21).
The table below summarizes the estimated impact on the Company’s profit before income tax for the year 2017 based on a 10% increase or decrease in future copper price while all other variables are held constant. The 10% increase is based on copper prices ranging from US$/pound 2.757 to US$/pound 2.763, and the 10% decrease is based on copper prices ranging from US$/pound 2.256 to US$/pound 2.261.
|
Effect on profit before
income tax |
||||
| US$(000) | ||||
| December 31, 2016 | ||||
| 10% increase in future copper prices | 88,508 | |||
| 10% decrease in future copper prices | (88,508 | ) | ||
| F- 196 |
Notes to the Financial Statements (continue)
| Exchange rate risk – |
| As described in Note 2(c), the Company’s financial statements are presented in US dollars, which is the functional and presentation currency of the Company. The Company’s exchange-rate risk arises mainly from balances related to tax payments, deposits and other accounts payable in currencies other than the US dollar, principally Soles. The Company mitigates its exposure to exchange-rate risk by carrying out almost all of its transactions in its functional currency and management maintains only small amounts in Soles to cover its immediate needs (i.e., taxes and compensation) in this currency. |
| (b) | Liquidity risk - |
Liquidity risk arises from situations in which cash might not be available to pay obligations at their maturity date and at a reasonable cost. The Company maintains adequate liquidity by properly managing the maturities of assets and liabilities in such a way that allows the Company to maintain a structural liquidity position (cash available) enabling it to meet liquidity requirements. Additionally, the Company has the ability to obtain funds from financial institutions and shareholders to meet its contractual obligations.
| F- 197 |
Notes to the Financial Statements (continue)
The following tables show the expected aging of maturity of the Company’s obligations, excluding taxes and accruals as of December 31, 2016 and 2015:
| On demand | Less than 3 months | 3 to 12 months | 1 to 5 years | Total | ||||||||||||||||
| US$(000) | US$(000) | US$(000) | US$(000) | US$(000) | ||||||||||||||||
| As of December 31, 2016 | ||||||||||||||||||||
| Trade accounts payable | - | 168,244 | 113 | - | 168,357 | |||||||||||||||
| Accounts payable to related parties | - | 27,134 | - | 7,132 | 34,266 | |||||||||||||||
| Other financial liabilities | - | - | 161 | 1,995,843 | 1,996,004 | |||||||||||||||
| Provision related to benefits to employees | - | 3,807 | 44,232 | - | 48,039 | |||||||||||||||
| Other accounts payable | - | 2,402 | 1,217 | - | 3,619 | |||||||||||||||
| Total | - | 201,587 | 45,723 | 2,002,975 | 2,250,285 | |||||||||||||||
| As of December 31, 2015 | ||||||||||||||||||||
| Trade accounts payable | - | 432,418 | - | - | 432,418 | |||||||||||||||
| Accounts payable to related parties | - | 12,042 | - | 6,850 | 18,892 | |||||||||||||||
| Other financial liabilities | - | - | 43,169 | 2,381,995 | 2,425,164 | |||||||||||||||
| Provision related to benefits to employees | - | 14,572 | 5,964 | - | 20,536 | |||||||||||||||
| Other accounts payable | - | 2,112 | - | - | 2,112 | |||||||||||||||
| Total | - | 461,144 | 49,133 | 2,388,845 | 2,899,122 | |||||||||||||||
| F- 198 |
Notes to the Financial Statements (continue)
| (c) | Credit Risk - |
The Company’s exposure to credit risk arises from a customer’s inability to pay amounts in full when they are due and the failure of third parties in cash and cash equivalent transactions. The risk is limited to balances deposited in banks and financial institutions and for trade accounts receivable at the date of the statements of financial position (the Company sells copper concentrate and cathode and molybdenum concentrate to companies widely recognized in the worldwide mining sector). To manage this risk, the Company has established a treasury policy, which only allows the deposit of surplus funds in highly rated institutions, by establishing conservative credit policies and through a constant evaluation of market conditions. Consequently, the Company does not expect to incur losses on accounts involving potential credit risk.
| (d) | Capital management - |
The objective is to safeguard the Company’s ability to continue as a going concern in order to provide returns for shareholders, benefits for stakeholders and maintain an optimal structure that would reduce the cost of capital.
The Company manages its capital structure, and makes adjustments to it, in light of changes in economic conditions. To maintain or adjust the capital structure, the Company controls dividend payments to shareholders, the return of capital to shareholders and the issuance of new shares. No changes were made to the objectives, policies or processes during the year ended December 31, 2016.
| 21. | Embedded derivatives |
As discussed in Note 2(d), the Company’s sales create exposure to changes in the market prices of copper and molybdenum which are considered embedded derivatives. As of December 31, 2016 and 2015, information about the Company’s embedded derivatives is as follows:
| As of December 31, 2016 | ||||||||||||||||
|
Pounds
payable |
Maturity | Provisional pricing | Forward pricing |
Fair value
provision |
||||||||||||
| (000) | US$ | US$ | US$(000) | |||||||||||||
| Copper Concentrate | 344,787 | January 2017 to May 2017 | Between 2.091 and 2.656 | Between 2.507 and 2.512 | 68,130 | |||||||||||
| Copper Cathode | 7,936 | January 2017 | Between 2.488 and 2.678 | 2.507 | (1,000 | ) | ||||||||||
| Molybdenum | 3,455 | January 2017 to February 2017 | Between 5.431 and 5.484 | 5.542 | 319 | |||||||||||
| 67,449 | ||||||||||||||||
| F- 199 |
Notes to the Financial Statements (continue)
| As of December 31, 2015 | ||||||||||||||||
|
Pounds
payable |
Maturity | Provisional pricing | Forward pricing |
Fair value
provision |
||||||||||||
| (000) | US$ | US$ | US$(000) | |||||||||||||
| Copper Concentrate | 221,659 | January 2016 to May 2016 | Between 2.076 and 2.433 | Between 2.134 and 2.138 | (19,696 | ) | ||||||||||
| Copper Cathode | 3,970 | January 2016 | 2.08 | 2.14 | 233 | |||||||||||
| Molybdenum | 1,425 | January 2016 to February 2016 | Between 3.435 and 3.635 | 3.95 | 616 | |||||||||||
| (18,847 | ) | |||||||||||||||
| 22. | Hierarchy and fair value of financial instruments |
Hierarchy:
As of December 31, 2016 and 2015, the only financial asset carried at fair value is the embedded derivative, which is generated by the sale of copper and measured at fair value based on copper prices. The value of this embedded derivative as of December 31, 2016, was an asset of US $67.4 million (liability of US $18.8 million as of December 31, 2015). This embedded derivative is categorized within Level 2 of the hierarchy. The fair value of embedded derivatives is determined using valuation techniques using information directly observable in the market (forward prices of metals).
Fair value:
Financial instruments whose fair value is similar to their book value –
For financial assets and liabilities which are liquid or have short-term maturity (less than three months), such as cash and cash equivalent, accounts receivable, other accounts receivable, accounts payable, other accounts payable, and other current liabilities, it is estimated that their book value is similar to their fair value.
Financial instruments at fixed and variable rates –
Financial assets and liabilities with fixed or variable rates are recorded at amortized cost and fair value is determined by comparing the market interest rates at the time of their initial recognition to the current market rates with regard to similar financial instruments.
Based on the foregoing, there are no significant differences between book value and fair value of financial instruments (assets and liabilities) as of December 31, 2016 and 2015.
| F- 200 |
Notes to the Financial Statements (continue)
| 23. | Summary of significant differences between accounting principles followed by the Company and U.S. generally accepted accounting principles |
The Company’s financial statements have been prepared in accordance with International Financial Reporting Standards which differs in certain respects from U.S. GAAP. The effects of these differences are reflected in note 24 and are principally related to the items discussed in the following paragraphs:
| (a) | Stripping Cost – IFRIC 20 |
Under IFRS, the stripping cost of production that is necessary to produce the inventory is recorded as cost of production, while the one that allows access to additional amounts of reserves to be exploited in future periods are capitalized and amortized based on proved and probable reserves of each ore body (component) identified in the open pit.
Under U.S. GAAP, the costs of clearing removal (stripping cost of production) incurred during the production stage are recorded as part of the production cost of inventories.
| (b) | Inventories |
Under IFRS, the cost inventory includes: the amortization of production-stripping costs and the inventories are determined using theweighted average method.
Under U.S. GAAP, the cost inventory excludes the amortization of production-stripping cost and the inventories are determined using the LIFO method.
| (c) | Deferred workers’ profit sharing |
Under IFRS, the workers’ profit sharing is calculated based on the Company’s taxable income and is recorded as an employee benefit (cost of production or administrative expense, depending on the function of the workers).
Under US GAAP, the workers’ profit sharing is treated in a similar way as income tax since both are calculated based on the Company’s taxable income. Therefore, the Company calculates a deferred workers’ profit sharing resulting from the taxable and deductible temporary differences.
| (d) | Deferred income tax – |
The differences between US GAAP and IFRS are re-measurements that lead to different temporary differences. According to the accounting policies in Note 2.2 (l), the Company has to account for such differences.
| F- 201 |
Notes to the Financial Statements (continue)
| 24. | Reconciliation between net income and shareholders' equity determined under IFRS and U.S. GAAP |
The following is a summary of the main adjustments to net income for the years ended December 31, 2016, 2015 and 2014 and to shareholders' equity as of December 31, 2016, 2015 and 2014 that would be required if U.S. GAAP had been applied instead of IFRS in the financial statements:
| 2016 | 2015 | 2014 | ||||||||||
| US$(000) | US$(000) | US$(000) | ||||||||||
| Net profit under IFRS | 340,907 | 33,284 | 377,606 | |||||||||
| Items increasing (decreasing) reported net profit: | ||||||||||||
| Stripping activity asset, net of amortization | 36,252 | (45,168 | ) | (4,221 | ) | |||||||
| Inventories valuation | (19,242 | ) | 12,573 | (57,744 | ) | |||||||
| Asset retirement obligation | 1,422 | 379 | (796 | ) | ||||||||
| Deferred workers´ profit sharing | (19,007 | ) | (6,225 | ) | 13,512 | |||||||
| Deferred income tax | 5,013 | 9,470 | 13,329 | |||||||||
| Other | 116 | (216 | ) | (69 | ) | |||||||
| Net income under US GAAP | 345,461 | 4,097 | 341,617 | |||||||||
| 2016 | 2015 | 2014 | ||||||||||
| US$(000) | US$(000) | US$(000) | ||||||||||
| Shareholders’ equity under IFRS | 4,839,281 | 4,498,374 | 4,465,090 | |||||||||
| Items increasing (decreasing) reported shareholder’s equity: | ||||||||||||
| Stripping activity asset, net of amortization | (63,074 | ) | (99,326 | ) | (54,158 | ) | ||||||
| Inventories valuation | (49,940 | ) | (30,698 | ) | (43,271 | ) | ||||||
| Asset retirement obligation | (440 | ) | (1,862 | ) | (2,241 | ) | ||||||
| Deferred workers´ profit sharing | (27,133 | ) | (8,126 | ) | (1,901 | ) | ||||||
| Deferred income tax | 43,728 | 38,715 | 29,245 | |||||||||
| Other | (283 | ) | (399 | ) | (183 | ) | ||||||
| Shareholders’ equity under U.S. GAAP | 4,742,139 | 4,396,678 | 4,392,581 | |||||||||
| 25. | New U.S. GAAP Accounting Pronouncements |
In May 2014, the Financial Accounting Standards Board (FASB) issued an Accounting Standard Update (ASU) that provides a single comprehensive revenue recognition model, which will replace most existing revenue recognition guidance, and also requires expanded disclosures. The core principle of the model is that revenue is recognized when control of goods or services has been transferred to customers at an amount that reflects the consideration to which an entity expects to be entitled in exchange for those goods or services. For public entities, this ASU is effective for annual reporting periods beginning after December 15, 2017, and interim reporting periods within that reporting period. Early adoption is permitted for annual reporting periods beginning after December 15, 2016, and interim reporting periods within that reporting period. The Company will adopt this ASU January 1, 2018, and currently expects to apply the modified retrospective approach under which any cumulative effect adjustment would be recorded to retained earnings as of the adoption date. The Company has not yet completed its final review of the impact of this guidance; however, based on the terms of its sales contracts, The Company currently does not anticipate a material impact on its revenue recognition policies or processes. The Company continues to review the impact of the new guidance on its financial reporting and disclosures.
| F- 202 |
Notes to the Financial Statements (continue)
In January 2016, FASB issued an ASU that amends the current guidance on the classification and measurement of financial instruments. This ASU makes limited changes to existing guidance and amends certain disclosure requirements. For public entities, this ASU is effective for interim and annual periods beginning after December 15, 2017. Early adoption is not permitted, except for the provision on recording fair value changes for financial liabilities under the fair value option. The Company is currently evaluating the impact this ASU will have on its financial reporting and disclosures, but at this time does not expect the adoption of this ASU will have a material impact on its financial statements.
In February 2016, FASB issued an ASU that will require lessees to recognize most leases on the balance sheet. This ASU allows lessees to make an accounting policy election to not recognize a lease asset and liability for leases with a term of 12 months or less and do not have a purchase option that is expected to be exercised. For public entities, this ASU is effective for interim and annual reporting periods beginning after December 15, 2018, with early adoption permitted. This ASU must be applied using the modified retrospective approach for leases that exist or are entered into after the beginning of the earliest comparative period in the financial statements. The Company is currently evaluating the impact this guidance will have on its financial statements.
In March 2016, FASB issued an ASU that simplifies various aspects of the accounting for share-based payment transactions, including the income tax consequences, statutory tax withholding requirements, an accounting policy election for forfeitures and the classification on the statement of cash flows. For public entities, this ASU is effective for interim and annual periods beginning after December 15, 2016, with early adoption permitted. Each of the amendments in this ASU provides specific transition requirements. The Company will adopt this ASU effective January 1, 2017, and adoption will not have a material impact on its financial statements. This ASU requires recognition of excess tax benefits and tax deficiencies in the income statement prospectively beginning in the first quarter of 2017.
In June 2016, FASB issued an ASU that changes the impairment model for most financial assets and certain other instruments, and will also require expanded disclosures. For public entities, this ASU is effective for interim and annual reporting periods beginning after December 15, 2019, with early adoption permitted. The provisions of the ASU must be applied as a cumulative-effect adjustment to retained earnings as of the beginning of the first reporting period in which the guidance is effective. The Company is currently evaluating the impact this ASU will have on its financial statements.
| 26. | Subsequent Event |
There have been no subsequent significant financial and accounting events that may affect the interpretation of these financial statements.
| F- 203 |