|
|
|
|
|
|
|
|
|
|
|
|
|
|
|
|
|
|
|
|
|
|
|
|
|
|
|
|
|
|
|
|
|
|
|
|
|
|
|
|
|
|
|
|
|
|
|
|
|
|
|
|
|
|
|
|
Table of Contents
| Delaware | 13-3404508 | |
|
State or other jurisdiction of
Incorporation or organization |
(I.R.S. Employer Identification No.) |
|
Name of each exchange on
|
||
| Title of each class | which registered | |
|
Common Stock, par value $0.01 per share
|
New York Stock Exchange |
| Large accelerated filer þ | Accelerated filer o | Non-accelerated filer o | Smaller reporting company o |
|
Part of Form 10-K
|
||
|
into which
|
||
| Document | incorporated | |
|
Portions of the BorgWarner Inc. Proxy Statement for the 2011
Annual Meeting of Stockholders
|
Part III |
2
Table of Contents
3
Table of Contents
| Item 1. | Business |
| Year Ended December 31, | ||||||||||||||
| Net Sales | 2010 | 2009 | 2008 | |||||||||||
| (Millions of dollars) | ||||||||||||||
|
Engine
|
$ | 4,060.8 | $ | 2,883.2 | $ | 3,861.5 | ||||||||
|
Drivetrain
|
1,611.4 | 1,093.5 | 1,426.4 | |||||||||||
|
Inter-segment eliminations
|
(19.4 | ) | (14.9 | ) | (24.0 | ) | ||||||||
|
Net sales
|
$ | 5,652.8 | $ | 3,961.8 | $ | 5,263.9 | ||||||||
4
Table of Contents
5
Table of Contents
6
Table of Contents
7
Table of Contents
|
Percentage
|
||||||||||||||||||
|
Owned by
|
Location
|
Fiscal 2010
|
||||||||||||||||
|
Year
|
the
|
of
|
Sales (Millions
|
|||||||||||||||
| Joint Venture | Products | Organized | Company (a) | Operation | Joint Venture Partner | of Dollars) (b) | ||||||||||||
|
Unconsolidated:
|
||||||||||||||||||
|
NSK-Warner K.K.
|
Transmission components | 1964 | 50 | % | Japan/China | NSK Ltd. | $ | 634.7 | ||||||||||
|
Turbo Energy Limited(c)
|
Turbochargers | 1987 | 32.6 | % | India | Sundaram Finance Limited; | $ | 137.9 | ||||||||||
| Brakes India Limited | ||||||||||||||||||
|
BERU Diesel Start Systems Pvt. Ltd.
|
Glow Plugs | 1996 | 49 | % | India | Jayant Dave | $ | 6.3 | ||||||||||
|
Consolidated:
|
||||||||||||||||||
|
BorgWarner Transmission Systems Korea, Inc.
|
Transmission components | 1987 | 60 | %(d) | Korea | NSK-Warner K.K. | $ | 148.1 | ||||||||||
|
Divgi-Warner Pvt. Ltd.
|
Transfer cases and
automatic locking hubs |
1995 | 60 | % | India | Divgi Metalwares, Ltd. | $ | 20.8 | ||||||||||
|
Borg-Warner Shenglong (Ningbo) Co. Ltd.
|
Fans and fan drives | 1999 | 70 | % | China | Ningbo Shenglong Group Co., Ltd. | $ | 49.7 | ||||||||||
|
BorgWarner TorqTransfer Systems Beijing Co. Ltd.
|
Transfer cases | 2000 | 80 | % | China | Beijing Automotive Industry Corporation | $ | 63.6 | ||||||||||
|
SeohanWarner Turbo Systems Ltd.
|
Turbochargers | 2003 | 71 | % | Korea | Korea Flange Company | $ | 90.0 | ||||||||||
|
BorgWarner United Transmission Systems Co. Ltd.
|
Transmission components | 2009 | 66 | % | China |
China Automobile Development
United Investment Co., Ltd. |
$ | — | ||||||||||
|
BERU Korea Co. Ltd.
|
Ignition coils and pumps | 2001 | 51 | % | Korea | Mr. K.B. Mo and Mr. D.H. Kim | $ | 45.6 | ||||||||||
|
BorgWarner-Vikas Emissions Systems India Private Limited
|
EGR coolers | 2007 | 60 | % | India | Kenmore Vikas Pvt. Ltd. and Man Mohak Fin. Invest Pvt. Ltd. | $ | 5.1 | ||||||||||
| (a) | In the second quarter of 2008, the Company and BERU completed a Domination and Profit Transfer Agreement (“DPTA”), giving BorgWarner full control of BERU. For the joint ventures in which BERU Systems is a party, the percentage of ownership for each joint venture reflects BERU System’s ownership percentage. | |
| (b) | All sales figures are for the year ended December 31, 2010, except NSK-Warner and Turbo Energy Limited. NSK-Warner’s sales are reported for the 12 months ended November 30, 2010. Turbo Energy Limited’s sales are reported for the 12 months ended September 30, 2010. | |
| (c) | The Company made purchases from Turbo Energy Limited totaling $22.9 million, $24.2 million and $25.4 million for the years ended December 31, 2010, 2009, and 2008, respectively. | |
| (d) | BorgWarner Inc. owns 50% of NSK-Warner, which has a 40% interest in BorgWarner Transmission Systems Korea, Inc. This gives the Company an additional indirect effective ownership percentage of 20%. This results in a total effective ownership interest of 80%. |
8
Table of Contents
| Customer | 2010 | 2009 | 2008 | |||||||||
|
Volkswagen
|
19 | % | 22 | % | 19 | % | ||||||
|
Ford
|
11 | % | 12 | % | 9 | % | ||||||
9
Table of Contents
| Year Ended December 31, | ||||||||||||
| 2010 | 2009 | 2008 | ||||||||||
| (Millions of dollars) | ||||||||||||
|
Gross R&D expenditures
|
$ | 233.2 | $ | 219.0 | $ | 273.4 | ||||||
|
Customer reimbursements
|
(48.2 | ) | (63.8 | ) | (67.7 | ) | ||||||
|
Net R&D expenditures
|
$ | 185.0 | $ | 155.2 | $ | 205.7 | ||||||
| Product Type: Engine | Name of Competitor | |||||
|
Turbochargers:
|
Holset (Cummins Inc.)
Honeywell IHI Mitsubishi Heavy Industries (MHI) |
|||||
|
Timing devices and chains:
|
Denso
Iwis Schaeffler Group Tsubaki Group |
|||||
|
Emissions systems:
|
Behr
Pierburg Valeo |
|||||
|
Thermal systems:
|
Behr
Horton/Sachs Usui |
|||||
|
Diesel cold start, gasoline ignition technology and cabin
heaters:
|
Bosch
NGK |
|||||
10
Table of Contents
| Product Type: Drivetrain | Name of Competitor | |||||
|
Torque transfer:
|
GKN Driveline
JTEKT Magna Powertrain |
|||||
|
Transmission:
|
Bosch
Denso Dynax Schaeffler Group |
|||||
11
Table of Contents
| Name | Age | Position With Company | ||||
|
Timothy M. Manganello
|
60 | Chairman and Chief Executive Officer | ||||
|
Robin J. Adams
|
57 | Executive Vice President, Chief Financial Officer and Chief Administrative Officer | ||||
|
John Sanderson
|
58 | Executive Vice President | ||||
|
Roger J. Wood
|
48 | Executive Vice President | ||||
|
Jan Bertsch
|
54 | Vice President and Treasurer | ||||
|
Daniel CasaSanta
|
56 | Vice President | ||||
|
John J. Gasparovic
|
53 | Vice President, General Counsel & Secretary | ||||
|
Ronald T. Hundzinski
|
52 | Vice President and Controller | ||||
|
Janice K. McAdams
|
52 | Vice President, Human Resources | ||||
|
James R. Verrier
|
48 | Vice President | ||||
|
Thomas Waldhier
|
48 | Vice President | ||||
12
Table of Contents
| Item 1A. | Risk Factors |
13
Table of Contents
14
Table of Contents
15
Table of Contents
16
Table of Contents
17
Table of Contents
| Item 1B. | Unresolved Staff Comments |
18
Table of Contents
| Item 2. | Properties |
| Americas: | Europe: | Asia: | ||
|
Asheville, North Carolina
|
Arcore, Italy | Aoyama, Japan | ||
|
Auburn Hills, Michigan
|
Bradford, England | Changwon, South Korea(b) | ||
|
Cadillac, Michigan
|
Bretten, Germany | Chennai, India | ||
|
Campinas, Brazil
|
Chazelles, France | Chungju-City, South Korea | ||
|
Cortland, New York
|
Diss, England | Faridabad, India | ||
|
Dixon, Illinois
|
Kirchheimbolanden, Germany | Kakkalur, India | ||
|
El Salto Jalisco, Mexico
|
Ludwigsburg, Germany | Nabari City, Japan | ||
|
Fletcher, North Carolina
|
Markdorf, Germany | Ningbo, China(b) | ||
|
Ithaca, New York
|
Muggendorf, Germany | Pyongtaek, South Korea(b) | ||
|
Juitepec Morelos, Mexico(b)
|
Neuhaus, Germany | |||
|
Marshall, Michigan
|
Oroszlany, Hungary | |||
|
Ramos, Mexico
|
Rzeszow, Poland | |||
| Tralee, Ireland | ||||
| Valenca, Portugal (b) | ||||
| Vigo, Spain | ||||
| Vitoria, Spain |
| Americas: | Europe: | Asia: | ||
|
Addison, Illinois(b)
|
Arnstadt, Germany | Beijing, China(b) | ||
|
Auburn Hills, Michigan
|
Heidelberg, Germany | Eumsung, South Korea | ||
|
Bellwood, Illinois
|
Ketsch, Germany | Fukuroi City, Japan | ||
|
Frankfort, Illinois
|
Monte Carlo, Monaco | Ochang, South Korea(b) | ||
|
Livonia, Michigan
|
Tulle, France | Pune, India | ||
|
Longview, Texas(b)
|
Shanghai, China(b) | |||
|
Ramos, Mexico
|
Sirsi, India | |||
|
Seneca, South Carolina
|
||||
|
Water Valley, Mississippi
|
| (a) | The table excludes joint ventures owned less than 50% and administrative offices. | |
| (b) | Indicates leased land rights or a leased facility. |
19
Table of Contents
| Item 3. | Legal Proceedings |
| Item 4. | (Removed and Reserved by the SEC) |
| Item 5. | Market for the Registrant’s Common Equity, Related Stockholder Matters and Issuer Purchases of Equity Securities |
| 2010 | 2009 | 2008 | 2007 | 2006 | 2005 | |||||||||||||||||||
|
Dividend Amount
|
— | $ | 0.12 | $ | 0.44 | $ | 0.34 | $ | 0.32 | $ | 0.28 | |||||||||||||
20
Table of Contents
| Quarter Ended | High | Low | ||||||||||
|
March 31, 2009
|
$ | 25.65 | $ | 14.62 | ||||||||
|
June 30, 2009
|
$ | 36.78 | $ | 19.40 | ||||||||
|
September 30, 2009
|
$ | 36.07 | $ | 28.42 | ||||||||
|
December 31, 2009
|
$ | 34.73 | $ | 27.62 | ||||||||
|
March 31, 2010
|
$ | 39.21 | $ | 33.43 | ||||||||
|
June 30, 2010
|
$ | 44.55 | $ | 33.93 | ||||||||
|
September 30, 2010
|
$ | 53.42 | $ | 35.68 | ||||||||
|
December 31, 2010
|
$ | 73.43 | $ | 51.06 | ||||||||
Among BorgWarner Inc., the S&P 500 Index,
SIC 3714 Motor Vehicle Parts and a Peer Group
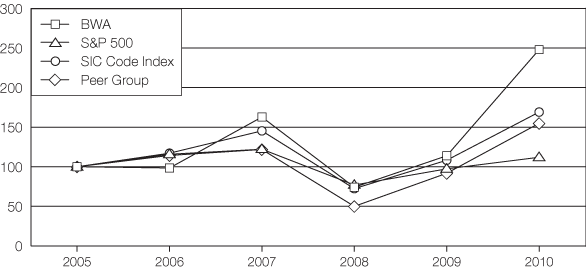
Fiscal year ending December 31.
| 2005 | 2006 | 2007 | 2008 | 2009 | 2010 | |||||||||||||||||||||||||
|
BorgWarner Inc.(1)
|
100.00 | 98.41 | 162.78 | 74.12 | 113.86 | 248.00 | ||||||||||||||||||||||||
|
S&P 500(2)
|
100.00 | 115.80 | 122.16 | 76.96 | 97.33 | 111.99 | ||||||||||||||||||||||||
|
SIC Code Index(3)
|
100.00 | 117.13 | 145.32 | 72.35 | 108.22 | 169.08 | ||||||||||||||||||||||||
|
Peer Group(4)
|
100.00 | 114.27 | 121.81 | 49.96 | 91.74 | 154.87 | ||||||||||||||||||||||||
| (1) | BorgWarner Inc. | |
| (2) | S&P 500 — Standard & Poor’s 500 Total Return Index | |
| (3) | Standard Industrial Code (“SIC”) 3714-Motor Vehicle Parts | |
| (4) | Peer Group Companies — Consists of the following companies: American Axle & Manufacturing Holdings, Inc., Arvin Meritor Inc., Autoliv Inc., Gentex Corp., Johnson Controls Inc., Lear Corporation (pre-2009 bankruptcy), Magna International, Inc., Modine Manufacturing Co., Tenneco Automotive, Inc., TRW Automotive Holdings Corp. and Visteon Corporation (pre-2009 bankruptcy) |
21
Table of Contents
|
Total Number
|
||||||||||||||||||||
|
of Shares
|
||||||||||||||||||||
|
Total
|
Purchased as
|
Maximum
|
||||||||||||||||||
|
Number of
|
Average
|
Part of Publicly
|
Number of
|
|||||||||||||||||
|
Shares
|
Price Paid
|
Announced
|
Shares that May
|
|||||||||||||||||
| Period | Purchased | per Share | Plans or Programs | Yet be Purchased | ||||||||||||||||
|
Month Ended October 31, 2010
|
214,300 | 53.85 | 214,300 | 4,143,872 | ||||||||||||||||
|
Month Ended November 30, 2010
|
1,032,400 | 58.92 | 1,032,400 | 3,111,472 | ||||||||||||||||
|
Month Ended December 31, 2010
|
875,000 | 68.40 | 875,000 | 2,236,472 | ||||||||||||||||
|
Total
|
2,121,700 | $ | 62.32 | 2,121,700 | 2,236,472 | |||||||||||||||
|
Number of Securities
|
||||||||||||
|
Number of Securities
|
Remaining Available
|
|||||||||||
|
to be Issued Upon
|
Weighted-Average
|
for Future Issuance
|
||||||||||
|
Exercise of
|
Exercise Price of
|
Under Equity
|
||||||||||
|
Outstanding Options,
|
Outstanding Options,
|
Compensation Plans
|
||||||||||
|
Restricted Common Stock
|
Restricted Common Stock
|
(excluding securities
|
||||||||||
|
Warrants and Rights
|
Warrants and Rights
|
Reflected in column (a))
|
||||||||||
| Plan Category | (a) | (b) | (c) | |||||||||
|
Equity compensation plans approved by security holders
|
5,123,804 | $ | 29.34 | 2,234,723 | ||||||||
|
Equity compensation plans not approved by security holders
|
— | — | — | |||||||||
|
Total
|
5,123,804 | $ | 29.34 | 2,234,723 | ||||||||
22
Table of Contents
| Item 6. | Selected Financial Data |
For the Year Ended December 31,
| Statement of Operations Data | 2010* | 2009 | 2008** | 2007 | 2006*** | |||||||||||||||
|
Net sales
|
$ | 5,652.8 | $ | 3,961.8 | $ | 5,263.9 | $ | 5,328.6 | $ | 4,585.4 | ||||||||||
|
Cost of sales
|
4,559.5 | 3,401.0 | 4,425.4 | 4,378.7 | 3,735.5 | |||||||||||||||
|
Gross profit
|
1,093.3 | 560.8 | 838.5 | 949.9 | 849.9 | |||||||||||||||
|
Selling, general and administrative expenses
|
566.6 | 459.8 | 542.9 | 531.9 | 498.1 | |||||||||||||||
|
Restructuring expense
|
— | 50.3 | 127.5 | — | 84.7 | |||||||||||||||
|
Goodwill impairment charge
|
— | — | 156.8 | — | — | |||||||||||||||
|
Other (income) expense
|
22.4 | (0.1 | ) | 4.0 | (0.1 | ) | (4.3 | ) | ||||||||||||
|
Operating income
|
504.3 | 50.8 | 7.3 | 418.1 | 271.4 | |||||||||||||||
|
Equity in affiliates’ earnings, net of tax
|
(39.6 | ) | (21.8 | ) | (38.4 | ) | (40.3 | ) | (35.9 | ) | ||||||||||
|
Interest income
|
(2.8 | ) | (2.5 | ) | (7.1 | ) | (6.7 | ) | (3.2 | ) | ||||||||||
|
Interest expense and finance charges
|
68.8 | 57.2 | 38.8 | 34.7 | 40.2 | |||||||||||||||
|
Earnings before income taxes and noncontrolling interest
|
477.9 | 17.9 | 14.0 | 430.4 | 270.3 | |||||||||||||||
|
Provision (benefit) for income taxes
|
81.7 | (18.5 | ) | 33.3 | 113.9 | 32.4 | ||||||||||||||
|
Net earnings (loss)
|
396.2 | 36.4 | (19.3 | ) | 316.5 | 237.9 | ||||||||||||||
|
Net earnings attributable to the noncontrolling interest, net of
tax
|
18.8 | 9.4 | 16.3 | 28.0 | 26.3 | |||||||||||||||
|
Net earnings (loss) attributable to BorgWarner Inc.
|
$ | 377.4 | $ | 27.0 | $ | (35.6 | ) | $ | 288.5 | $ | 211.6 | |||||||||
|
Earnings (loss) per share — basic
|
$ | 3.31 | $ | 0.23 | $ | (0.31 | ) | $ | 2.49 | $ | 1.84 | |||||||||
|
Average shares outstanding (thousands) — basic
|
114,155 | 116,522 | 116,007 | 116,002 | 114,806 | |||||||||||||||
|
Earnings (loss) per share — diluted
|
$ | 3.07 | $ | 0.23 | $ | (0.31 | ) | $ | 2.45 | $ | 1.83 | |||||||||
|
Average shares outstanding (thousands) — diluted
|
129,575 | 116,939 | 116,007 | 117,840 | 115,942 | |||||||||||||||
|
Cash dividend declared and paid per share
|
$ | 0.00 | $ | 0.12 | $ | 0.44 | $ | 0.34 | $ | 0.32 | ||||||||||
|
Balance Sheet Data
|
||||||||||||||||||||
|
Cash
|
$ | 449.9 | $ | 357.4 | $ | 103.4 | $ | 188.5 | $ | 123.3 | ||||||||||
|
Total assets
|
5,555.0 | 4,811.4 | 4,644.0 | 4,958.5 | 4,584.0 | |||||||||||||||
|
Total debt
|
1,180.4 | 842.3 | 780.3 | 636.3 | 721.1 | |||||||||||||||
| * | The Company’s diluted earnings per share for the year ended December 31, 2010 includes the impact of the Company’s 3.50% convertible notes and associated warrants. | |
| ** | The Company had a loss for the year ended December 31, 2008. As a result, diluted loss per share is the same as basic loss per share in the period, as any dilutive securities would reduce the loss per share. | |
| *** | On November 14, 2007, the Company’s Board of Directors approved a two-for-one stock split effected in the form of a stock dividend on its common stock. To implement this stock split, shares of common stock were issued on December 17, 2007 to stockholders of record as of the close of business on December 6, 2007. All prior year share and per share amounts disclosed in this document have been restated to reflect the two-for-one stock split. |
23
Table of Contents
| Item 7. | Management’s Discussion and Analysis of Financial Condition and Results of Operations |
|
(millions of dollars, except per share data)
|
||||||||||||||
| Year Ended December 31, | 2010 | 2009 | 2008 | |||||||||||
|
Net sales
|
$ | 5,652.8 | $ | 3,961.8 | $ | 5,263.9 | ||||||||
|
Cost of sales
|
4,559.5 | 3,401.0 | 4,425.4 | |||||||||||
|
Gross profit
|
1,093.3 | 560.8 | 838.5 | |||||||||||
|
Selling, general and administrative expenses
|
566.6 | 459.8 | 542.9 | |||||||||||
|
Restructuring expense
|
— | 50.3 | 127.5 | |||||||||||
|
Goodwill impairment charge
|
— | — | 156.8 | |||||||||||
|
Other (income) expense
|
22.4 | (0.1 | ) | 4.0 | ||||||||||
|
Operating income
|
504.3 | 50.8 | 7.3 | |||||||||||
|
Equity in affiliates’ earnings, net of tax
|
(39.6 | ) | (21.8 | ) | (38.4 | ) | ||||||||
|
Interest income
|
(2.8 | ) | (2.5 | ) | (7.1 | ) | ||||||||
|
Interest expense and finance charges
|
68.8 | 57.2 | 38.8 | |||||||||||
|
Earnings before income taxes and noncontrolling interest
|
477.9 | 17.9 | 14.0 | |||||||||||
|
Provision (benefit) for income taxes
|
81.7 | (18.5 | ) | 33.3 | ||||||||||
|
Net earnings (loss)
|
396.2 | 36.4 | (19.3 | ) | ||||||||||
|
Net earnings attributable to the noncontrolling interest, net of
tax
|
18.8 | 9.4 | 16.3 | |||||||||||
|
Net earnings (loss) attributable to BorgWarner Inc.
|
$ | 377.4 | $ | 27.0 | $ | (35.6 | ) | |||||||
|
Earnings (loss) per share — diluted
|
$ | 3.07 | $ | 0.23 | $ | (0.31 | ) | |||||||
24
Table of Contents
| • | Global financial market and economic recovery in 2010 significantly impacted consumer demand for light vehicles and positively increased our sales and operating margins. | |
| • | Global financial market and economic crisis in the second half of 2008 and full year of 2009 significantly impacted consumer demand for light vehicles and negatively impacted our sales. | |
| • | Continued benefits from our cost reduction programs, including containment of raw material and energy cost increases, and health care cost inflation in 2010, 2009, and 2008. | |
| • | A $28.0 million charge in 2010 for alleged personal injury relating to environmental contamination. | |
| • | The reversal of a valuation allowance on U.S. based foreign tax credit carryforwards in 2010 of $21.2 million. | |
| • | An $8.0 million gain in 2010 on the acquisition of BERU-Eichenauer GmbH related to adjusting the Company’s fifty percent investment to fair value under ASC Topic 805. | |
| • | Adjustments to tax accounts in 2010, 2009 and 2008 upon conclusion of certain tax audits and changes in circumstances, including changes in tax laws. | |
| • | Restructuring expenses in the third and fourth quarters of 2008 and second quarter of 2009 to adjust headcount and capacity levels, in North America, Europe and Asia. | |
| • | $27.9 million net pre-tax gain in 2009 related to retiree obligations resulting from the closure of the Muncie, Indiana, Drivetrain facility. | |
| • | The establishment of a valuation allowance for foreign tax credit carryforwards in 2009 and 2008 of $7.7 million and $13.5 million, respectively. | |
| • | $4.8 million charge in 2009 upon the adoption of ASC Topic 805, Business Combinations. | |
| • | $3.0 million net loss in 2009 from interest rate derivative agreements. | |
| • | An €111.5 million $(156.8 million) impairment charge in 2008 to adjust BERU’s goodwill to its estimated fair value. | |
| • | An approximate $23.5 million warranty-related charge in 2008 associated with a company’s transmission product sold in Europe, limited to mid-2007 through May 2008 production. | |
| • | The write-offs of the excess purchase price allocated to in-process research and development (“IPR&D”), order backlog and beginning inventory related to the 2007 acquisition of approximately 12.8% of BERU stock and the 2008 completion of a Domination and Profit Transfer Agreement (“DPTA”) between the Company and BERU. | |
| • | Recognition in 2008 of a $4.0 million charge related to an untimely change in the level of medical benefits provided to DTP. |
25
Table of Contents
| Year Ended December 31, | 2010 | 2009 | 2008 | |||||||||||
|
Non-recurring or non-comparable items:
|
||||||||||||||
|
Environmental litigation settlement
|
$ | (0.14 | ) | $ | — | $ | — | |||||||
|
Medicare Part D tax law change
|
(0.02 | ) | — | — | ||||||||||
|
Reversal of foreign tax credit valuation allowance
|
0.17 | — | — | |||||||||||
|
BERU-Eichenauer equity investment gain
|
0.04 | — | — | |||||||||||
|
Restructuring expense
|
— | (0.29 | ) | (0.72 | ) | |||||||||
|
Interest rate derivative agreements
|
— | (0.03 | ) | — | ||||||||||
|
Topic 805 adoption
|
— | (0.03 | ) | — | ||||||||||
|
Goodwill impairment charge
|
— | — | (1.35 | ) | ||||||||||
|
Transmission product related warranty charge
|
— | — | (0.14 | ) | ||||||||||
|
Tax valuation allowance
|
— | — | (0.12 | ) | ||||||||||
|
Write-off of the excess purchase price allocated to IPR&D,
order backlog and beginning inventory associated with
acquisitions
|
— | — | (0.04 | ) | ||||||||||
|
Retiree healthcare litigation outcome
|
— | — | (0.03 | ) | ||||||||||
|
Change in retiree obligation related to Muncie closure
|
— | 0.15 | — | |||||||||||
|
Adjustments to tax accounts
|
— | 0.03 | 0.02 | |||||||||||
|
Total impact to earnings per share — diluted:
|
$ | 0.05 | $ | (0.17 | ) | $ | (2.38 | ) | ||||||
| 2010 | 2009 | |||||||
|
North America*
|
38.8 | % | (32.4 | )% | ||||
|
Europe*
|
13.7 | % | (20.5 | )% | ||||
|
Asia*
|
26.5 | % | (2.1 | )% | ||||
|
Total Worldwide*
|
23.5 | % | (13.7 | )% | ||||
|
BorgWarner year over year net sales change
|
42.7 | % | (24.7 | )% | ||||
|
BorgWarner year over year net sales change excluding currency
|
45.0 | % | (21.5 | )% | ||||
| * | Data provided by CSM Worldwide. |
26
Table of Contents
|
(millions of dollars)
|
||||||||||||||
| Year Ended December 31, | 2010 | 2009 | 2008 | |||||||||||
|
Engine
|
$ | 4,060.8 | $ | 2,883.2 | $ | 3,861.5 | ||||||||
|
Drivetrain
|
1,611.4 | 1,093.5 | 1,426.4 | |||||||||||
|
Inter-segment eliminations
|
(19.4 | ) | (14.9 | ) | (24.0 | ) | ||||||||
|
Net sales
|
$ | 5,652.8 | $ | 3,961.8 | $ | 5,263.9 | ||||||||
27
Table of Contents
|
(millions of dollars)
|
||||||||||||||
| Year Ended December 31, | 2010 | 2009 | 2008 | |||||||||||
|
Engine
|
$ | 537.9 | $ | 219.8 | $ | 394.9 | ||||||||
|
Drivetrain
|
137.0 | (13.5 | ) | (4.9 | ) | |||||||||
|
Adjusted EBIT
|
674.9 | 206.3 | 390.0 | |||||||||||
|
Muncie closure retiree obligation net gain
|
— | (27.9 | ) | — | ||||||||||
|
Environmental litigation settlement
|
28.0 | — | — | |||||||||||
|
BERU-Eichenauer equity investment gain
|
(8.0 | ) | — | — | ||||||||||
|
Corporate, including equity in affiliates’ earnings and
stock-based compensation
|
111.0 | 111.3 | 60.0 | |||||||||||
|
Restructuring expense
|
— | 50.3 | 127.5 | |||||||||||
|
Goodwill impairment charge
|
— | — | 156.8 | |||||||||||
|
Interest income
|
(2.8 | ) | (2.5 | ) | (7.1 | ) | ||||||||
|
Interest expense and finance charges
|
68.8 | 57.2 | 38.8 | |||||||||||
|
Earnings before income taxes and noncontrolling interest
|
477.9 | 17.9 | 14.0 | |||||||||||
|
Provision (benefit) for income taxes
|
81.7 | (18.5 | ) | 33.3 | ||||||||||
|
Net earnings (loss)
|
396.2 | 36.4 | (19.3 | ) | ||||||||||
|
Net earnings attributable to the noncontrolling interest, net of
tax
|
18.8 | 9.4 | 16.3 | |||||||||||
|
Net earnings (loss) attributable to BorgWarner Inc.
|
$ | 377.4 | $ | 27.0 | $ | (35.6 | ) | |||||||
28
Table of Contents
| Year Ended December 31, | 2010 | 2009 | 2008 | |||||||||||
|
Net sales
|
100.0 | % | 100.0 | % | 100.0 | % | ||||||||
|
Cost of sales
|
80.7 | 85.8 | 84.1 | |||||||||||
|
Gross profit
|
19.3 | 14.2 | 15.9 | |||||||||||
|
Selling, general and administrative expenses
|
10.0 | 11.6 | 10.3 | |||||||||||
|
Restructuring expense
|
— | 1.3 | 2.4 | |||||||||||
|
Goodwill impairment charge
|
— | — | 3.0 | |||||||||||
|
Other (income) expense
|
0.4 | — | — | |||||||||||
|
Operating income
|
8.9 | 1.3 | 0.2 | |||||||||||
|
Equity in affiliates’ earnings, net of tax
|
(0.7 | ) | (0.6 | ) | (0.7 | ) | ||||||||
|
Interest income
|
— | — | (0.1 | ) | ||||||||||
|
Interest expense and finance charges
|
1.2 | 1.4 | 0.7 | |||||||||||
|
Earnings before income taxes and noncontrolling interest
|
8.4 | 0.5 | 0.3 | |||||||||||
|
Provision (benefit) for income taxes
|
1.4 | (0.4 | ) | 0.7 | ||||||||||
|
Net earnings (loss)
|
7.0 | 0.9 | (0.4 | ) | ||||||||||
|
Net earnings attributable to the noncontrolling interest, net of
tax
|
0.3 | 0.2 | 0.3 | |||||||||||
|
Net earnings (loss) attributable to BorgWarner Inc.
|
6.7 | % | 0.7 | % | (0.7 | )% | ||||||||
29
Table of Contents
30
Table of Contents
| (millions of dollars) | 2010 | 2009 | % Change | |||||||||||
|
Notes payable and other short-term debt
|
$ | 128.5 | $ | 69.1 | ||||||||||
|
Long-term debt
|
1,051.9 | 773.2 | ||||||||||||
|
Total debt
|
1,180.4 | 842.3 | 40.1 | % | ||||||||||
|
Total equity
|
2,309.8 | 2,222.7 | 3.9 | % | ||||||||||
|
Total capitalization
|
$ | 3,490.2 | $ | 3,065.0 | 13.9 | % | ||||||||
|
Total debt to capital ratio
|
33.8 | % | 27.5 | % | ||||||||||
| The $338.1 million increase in debt primarily relates to the January 1, 2010 adoption of ASC Topic 860, which required the Company to reflect its receivable securitization facility in its financial statements, as well as the Company’s September 16, 2010 issuance of $250 million in 4.625% senior notes. The impact of the adoption of ASC Topic 860 is an increase in receivables, net of $80 million and an increase in notes payable and other short-term debt of $80 million in the Company’s 2010 Consolidated Balance Sheet. The Company’s debt to capital increase also relates to the Company’s second quarter 2010 $147.6 million acquisition of Dytech as well as the repurchasing of 7,066,100 shares of common stock for $325.7 million. |
| (millions of dollars) | ||||||
|
Balance, January 1, 2010
|
$ | 2,222.7 | ||||
|
Net earnings
|
377.4 | |||||
|
Stock compensation
|
66.3 | |||||
|
Reissuance of treasury stock
|
34.1 | |||||
|
Defined benefit post employment plans
|
7.8 | |||||
|
Purchases of treasury stock
|
(325.7 | ) | ||||
|
Currency translation and hedged instruments, net
|
(77.1 | ) | ||||
|
All other, net
|
4.3 | |||||
|
Balance, December 31, 2010
|
$ | 2,309.8 | ||||
31
Table of Contents
32
Table of Contents
| (millions of dollars) | Total | 2011 | 2012-2013 | 2014-2015 | After 2015 | |||||||||||||||
|
Other post employment benefits excluding pensions(a)
|
$ | 401.0 | $ | 27.1 | $ | 52.1 | $ | 48.5 | $ | 273.3 | ||||||||||
|
Defined benefit pension plans(b)
|
129.9 | 23.2 | 43.8 | 15.8 | 47.1 | |||||||||||||||
|
Notes payable and long-term debt
|
1,210.2 | 128.5 | 389.1 | 10.2 | 682.4 | |||||||||||||||
|
Projected interest payments(c)
|
436.9 | 74.9 | 85.3 | 72.8 | 203.9 | |||||||||||||||
|
Non-cancelable operating leases
|
43.0 | 9.3 | 14.3 | 11.4 | 8.0 | |||||||||||||||
|
Capital spending obligations
|
28.9 | 28.9 | — | — | — | |||||||||||||||
|
Inventory purchase obligations
|
76.9 | 40.1 | 25.3 | 11.5 | — | |||||||||||||||
|
Income tax payments(d)
|
134.2 | 134.2 | — | — | — | |||||||||||||||
|
Environmental(e)
|
29.2 | 21.0 | 2.6 | 0.8 | 4.8 | |||||||||||||||
|
Total
|
$ | 2,490.2 | $ | 487.2 | $ | 612.5 | $ | 171.0 | $ | 1,219.5 | ||||||||||
| (a) | Other post employment benefits excluding pensions include anticipated future payments to cover retiree medical and life insurance benefits. See Note 11 to the Consolidated Financial Statements for disclosures related to the Company’s pension and other post employment benefits. | |
| (b) | Since the timing and amount of payments for funded defined benefit pension plans are usually not certain for future years such potential payments are not shown in this table, except for the Company’s proposed settlement agreement with the Pension Benefit Guaranty Corporation to make payments of $15 million per year in 2011, 2012 and 2013. Amount contained in “After 2015” column are for unfunded plans and includes estimated payments through 2020. See Note 11 to the Consolidated Financial Statements for disclosures related to the Company’s pension and other post employment benefits. | |
| (c) | Projection is based upon actual fixed rates where appropriate, and a projected floating rate for the variable rate portion of the total debt portfolio. The floating rate projection is based upon current market conditions and rounded to the nearest 50th basis point (0.50%), which is 4.5% for this purpose. Projection is also based upon debt being redeemed upon maturity. | |
| (d) | See Note 4 to the Consolidated Financial Statements for disclosures related to the Company’s income taxes. | |
| (e) | See Note 14 to the Consolidated Financial Statements for disclosures related to the Company’s environmental liability. |
33
Table of Contents
34
Table of Contents
35
Table of Contents
36
Table of Contents
37
Table of Contents
| (millions of dollars) | 2010 | 2009 | ||||||||
|
Assets:
|
||||||||||
|
Prepayments and other current assets
|
$ | 25.8 | $ | 24.9 | ||||||
|
Other non-current assets
|
24.8 | 25.0 | ||||||||
|
Total insurance assets
|
$ | 50.6 | $ | 49.9 | ||||||
|
Liabilities:
|
||||||||||
|
Accounts payable and accrued expenses
|
$ | 25.8 | $ | 24.9 | ||||||
|
Other non-current liabilities
|
24.8 | 25.0 | ||||||||
|
Total accrued liability
|
$ | 50.6 | $ | 49.9 | ||||||
38
Table of Contents
| 2010 | ||||||||||||||||||||||
| (millions of dollars) | Q1 | Q2 | Q3 | Q4 | Full Year | |||||||||||||||||
|
Operating income increase
|
$ | 4.8 | $ | 4.7 | $ | 4.6 | $ | 4.7 | $ | 18.8 | ||||||||||||
|
Net earnings increase attributable to BorgWarner Inc.
|
3.7 | 3.6 | 3.6 | 3.6 | 14.5 | |||||||||||||||||
|
Earnings per share increase — Basic
|
$ | 0.03 | $ | 0.03 | $ | 0.03 | $ | 0.03 | $ | 0.13 | ||||||||||||
|
Earnings per share increase — Diluted
|
$ | 0.03 | $ | 0.03 | $ | 0.03 | $ | 0.03 | $ | 0.11 | ||||||||||||
| 2009 | ||||||||||||||||||||||
| (millions of dollars) | Q1 | Q2 | Q3 | Q4 | Full Year | |||||||||||||||||
|
Operating income increase
|
$ | 4.6 | $ | 4.6 | $ | 4.6 | $ | 4.6 | $ | 18.4 | ||||||||||||
|
Net earnings increase attributable to BorgWarner Inc.
|
3.5 | 3.5 | 3.5 | 3.5 | 14.0 | |||||||||||||||||
|
Earnings per share increase — Basic
|
$ | 0.03 | $ | 0.03 | $ | 0.03 | $ | 0.03 | $ | 0.12 | ||||||||||||
|
Earnings per share increase — Diluted
|
$ | 0.03 | $ | 0.03 | $ | 0.03 | $ | 0.03 | $ | 0.12 | ||||||||||||
39
Table of Contents
| (millions of dollars) | 2009 | 2008 | ||||||||
|
Drivetrain Group
|
$ | 13.7 | $ | 22.1 | ||||||
|
Engine Group
|
22.6 | 50.8 | ||||||||
|
Total
|
$ | 36.3 | $ | 72.9 | ||||||
| • | Discount Rate: The Company used a 10% weighted average cost of capital (“WACC”) as the discount rate for future cash flows. The WACC is intended to represent a rate of return that would be expected by a market participant. | |
| • | Operating Income Margin: The Company utilized historical and expected operating income margins, which varied based on the projections of each reporting unit being evaluated. |
| • | Our industry is cyclical and our results of operations will be adversely affected by industry downturns. | |
| • | We are dependent on market segments that use our key products and would be affected by decreasing demand in those segments. | |
| • | We are subject to risks related to our international operations. |
40
Table of Contents
|
2010
|
||||||
| millions of dollars | Impact | |||||
|
1 percentage point increase in discount rate
|
$ | 15.5 | ||||
|
1 percentage point decrease in operating margin
|
$ | 11.7 | ||||
| (millions of dollars) | 2010 | 2009 | 2008 | |||||||||||
|
Net Sales
|
$ | 5,652.8 | $ | 3,961.8 | $ | 5,263.9 | ||||||||
|
Warranty Provision
|
$ | 39.3 | $ | 46.0 | $ | 66.1 | ||||||||
|
Warranty Provision as a Percentage of Net Sales
|
0.70% | 1.2% | 1.3% | |||||||||||
41
Table of Contents
| (Income)/Expense | ||||||||||||||
| (millions of dollars) | 2010 | 2009 | 2008 | |||||||||||
|
25 basis point decrease
|
$ | (14.1 | ) | $ | (9.9 | ) | $ | (13.2 | ) | |||||
|
25 basis point increase
|
$ | 14.1 | $ | 9.9 | $ | 13.2 | ||||||||
| • | Expected long-term rate of return on plan assets: The expected long-term rate of return is used in the calculation of net periodic benefit cost. The required use of the expected long-term rate of return on plan assets may result in recognized returns that are greater or less than the actual returns on those plan assets in any given year. Over time, however, the expected long-term rate of return on plan assets is designed to approximate actual earned long-term returns. The expected long-term rate of return for pension assets has been determined based on various inputs. These inputs include historical returns for the different asset classes held by the Company’s trusts and its asset allocation, as well as inputs from internal and external sources regarding expected capital market return, inflation and other variables. The Company also considers the impact of active management of the plans’ invested assets. In determining its pension expense for 2010, the Company used long-term rates of return on plan assets ranging from 2.00% to 9.25% outside of the U.S. and 7.50% in the U.S. |
42
Table of Contents
| • | Discount rate: The discount rate is used to calculate pension and postretirement employee benefit obligations (“OPEB”). The discount rate assumption is based on a constant effective yield from matching projected plan cash flows to high quality (Aa) bond yields of corresponding maturities as of the measurement date. The Company used discount rates ranging from 1.75% to 7.75% to determine its pension and other benefit obligations as of December 31, 2010, including weighted average discount rates of 5.17% for U.S. pension plans, 5.37% for non-U.S. pension plans, and 4.75% for U.S. other post employment health care plans. The U.S. discount rate reflects the fact that our U.S. pension plan has been closed for new participants since 1989 (1999 for our U.S. health care plan), and with the closing of our Muncie facility in 2009, there will be negligible service cost going forward. | |
| • | Health care cost trend: For postretirement employee health care plan accounting, the Company reviews external data and Company specific historical trends for health care cost to determine the health care cost trend rate assumptions. In determining the projected benefit obligation for postretirement employee health care plans as of December 31, 2010, the Company used health care cost trend rates of 7.40%, declining to an ultimate trend rate of 5% by the year 2019. |
|
Impact on
|
Impact on
|
|||||||||
|
U.S. 2011
|
Non-U.S. 2011
|
|||||||||
|
Pre-Tax Pension
|
Pre-Tax Pension
|
|||||||||
| (millions of dollars) | (Expense)/Income | (Expense)/Income | ||||||||
|
1 percentage point decrease in discount rate
|
— | * | $ | (3.2 | ) | |||||
|
1 percentage point increase in discount rate
|
— | * | $ | 3.2 | ||||||
|
1 percentage point decrease in expected return on assets
|
$ | (2.2 | ) | $ | (1.5 | ) | ||||
|
1 percentage point increase in expected return on assets
|
$ | 2.2 | $ | 1.5 | ||||||
| * | Impact of 1 percentage point increase or decrease in the discount rate will have a negligible impact on the Company’s 2011 pre-tax pension expense. |
|
Impact on 2011
|
||||||
|
Pre-Tax OPEB
|
||||||
|
Interest
|
||||||
| (millions of dollars) | (Expense)/Income | |||||
|
1 percentage point decrease in discount rate
|
$ | (1.6 | ) | |||
|
1 percentage point increase in discount rate
|
$ | 1.6 | ||||
43
Table of Contents
| One Percentage Point | ||||||||||
| (millions of dollars) | Increase | Decrease | ||||||||
|
Effect on other post employment benefit obligation
|
$ | 18.0 | $ | (16.0 | ) | |||||
|
Effect on total service and interest cost components
|
$ | 0.9 | $ | (0.8 | ) | |||||
44
Table of Contents
|
(millions of dollars)
|
||||||
| Balance Sheet | December 31, 2008 | |||||
|
Total equity, as previously reported
|
$ | 2,006.0 | ||||
|
Increase for Topic 810 reclass of noncontrolling interest
|
31.5 | |||||
|
Total equity, as adjusted
|
$ | 2,037.5 | ||||
|
(millions of dollars)
|
Year Ended
|
|||||
| Consolidated Statement of Operations | December 31, 2008 | |||||
|
Net loss, as previously reported
|
$ | (35.6 | ) | |||
|
Topic 810 reclass of noncontrolling interest
|
(16.3 | ) | ||||
|
Net loss, as adjusted
|
$ | (19.3 | ) | |||
|
Less: Net earnings attributable to noncontrolling interest
|
16.3 | |||||
|
Net loss attributable to BorgWarner Inc.
|
$ | (35.6 | ) | |||
45
Table of Contents
|
(millions of dollars)
|
Year Ended
|
|||||
| Statement of Cash Flows | December 31, 2008 | |||||
|
Net loss, as previously reported
|
$ | (35.6 | ) | |||
|
Topic 810 reclass of noncontrolling interest
|
(16.3 | ) | ||||
|
Net loss, as adjusted
|
$ | (19.3 | ) | |||
|
(millions of dollars)
|
Year Ended
|
|||||
| Statement of Cash Flows | December 31, 2008 | |||||
|
Equity in affiliates’ earnings, net of dividends received,
minority interest and other, as previously reported
|
$ | 28.3 | ||||
|
Less: Topic 810 reclass of noncontrolling interest
|
(16.3 | ) | ||||
|
Equity in affiliates’ earnings, net of dividends received
and other
|
$ | 12.0 | ||||
| (millions of dollars) | December 31, 2008 | |||||
|
Net foreign currency translation and hedge instruments
adjustment, as previously reported
|
$ | (136.9 | ) | |||
|
Topic 810 reclass of noncontrolling interest
|
(10.8 | ) | ||||
|
Net foreign currency translation and hedge instruments
adjustment, as adjusted
|
$ | (126.1 | ) | |||
|
(millions of dollars)
|
Year Ended
|
|||||
| Statement of Cash Flows | December 31, 2008 | |||||
|
Payments for businesses acquired, net of cash acquired, as
previously reported
|
$ | (141.2 | ) | |||
|
Less: Topic 805 reclass of noncontrolling interest
|
141.2 | |||||
|
Payments for businesses acquired, net of cash acquired
|
$ | — | ||||
|
(millions of dollars)
|
Year Ended
|
|||||
| Statement of Cash Flows | December 31, 2008 | |||||
|
Net cash used in investing activities, as previously reported
|
$ | (485.1 | ) | |||
|
Less: Topic 805 reclass of noncontrolling interest
|
141.2 | |||||
|
Net cash used in investing activities
|
$ | (343.9 | ) | |||
|
(millions of dollars)
|
Year Ended
|
|||||
| Statement of Cash Flows | December 31, 2008 | |||||
|
Net cash provided by financing activities, as previously reported
|
$ | 5.1 | ||||
|
Less: Topic 805 reclass of noncontrolling interest
|
(141.2 | ) | ||||
|
Net cash used in financing activities
|
$ | (136.1 | ) | |||
46
Table of Contents
47
Table of Contents
48
Table of Contents
49
Table of Contents
| • | Pertain to the maintenance of records that, in reasonable detail, accurately and fairly reflect the transactions and dispositions of the assets of the Company; | |
| • | Provide reasonable assurance that transactions are recorded as necessary to permit preparation of financial statements in accordance with generally accepted accounting principles, and that receipts and expenditures of the Company are being made only in accordance with authorizations of management and directors of the Company; and | |
| • | Provide reasonable assurance regarding prevention or timely detection of unauthorized acquisition, use or disposition of the Company’s assets that could have a material effect on the financial statements. |
50
Table of Contents
| Item 7A. | Quantitative and Qualitative Disclosures About Market Risk |
| Item 8. | Financial Statements and Supplementary Data |
51
Table of Contents
52
Table of Contents
53
Table of Contents
|
(millions of dollars, except share and per share amounts)
|
||||||||||||||
| For the Year Ended December 31, | 2010 | 2009 | 2008 | |||||||||||
|
Net sales
|
$ | 5,652.8 | $ | 3,961.8 | $ | 5,263.9 | ||||||||
|
Cost of sales
|
4,559.5 | 3,401.0 | 4,425.4 | |||||||||||
|
Gross profit
|
1,093.3 | 560.8 | 838.5 | |||||||||||
|
Selling, general and administrative expenses
|
566.6 | 459.8 | 542.9 | |||||||||||
|
Restructuring expense
|
— | 50.3 | 127.5 | |||||||||||
|
Goodwill impairment charge
|
— | — | 156.8 | |||||||||||
|
Other (income) expense
|
22.4 | (0.1 | ) | 4.0 | ||||||||||
|
Operating income
|
504.3 | 50.8 | 7.3 | |||||||||||
|
Equity in affiliates’ earnings, net of tax
|
(39.6 | ) | (21.8 | ) | (38.4 | ) | ||||||||
|
Interest income
|
(2.8 | ) | (2.5 | ) | (7.1 | ) | ||||||||
|
Interest expense and finance charges
|
68.8 | 57.2 | 38.8 | |||||||||||
|
Earnings before income taxes and noncontrolling interest
|
477.9 | 17.9 | 14.0 | |||||||||||
|
Provision (benefit) for income taxes
|
81.7 | (18.5 | ) | 33.3 | ||||||||||
|
Net earnings (loss)
|
396.2 | 36.4 | (19.3 | ) | ||||||||||
|
Net earnings attributable to the noncontrolling interest, net of
tax
|
18.8 | 9.4 | 16.3 | |||||||||||
|
Net earnings (loss) attributable to BorgWarner Inc.
|
$ | 377.4 | $ | 27.0 | $ | (35.6 | ) | |||||||
|
Earnings (loss) per share — basic
|
$ | 3.31 | $ | 0.23 | $ | (0.31 | )** | |||||||
|
Earnings (loss) per share — diluted
|
$ | 3.07 | * | $ | 0.23 | $ | (0.31 | )** | ||||||
|
Average shares outstanding (thousands):
|
||||||||||||||
|
Basic
|
114,155 | 116,522 | 116,007 | |||||||||||
|
Diluted
|
129,575 | 116,939 | 116,007 | |||||||||||
| * | The Company’s diluted earnings per share for the year ended December 31, 2010 includes the impact of the Company’s 3.50% convertible notes and associated warrants. Refer to Note 16, “Earnings (Loss) Per Share”, for further information on our diluted earnings calculation. | |
| ** | The Company had a loss for the year ended December 31, 2008. As a result, diluted loss per share is the same as basic loss per share in the period, as any dilutive securities would reduce the loss per share. |
54
Table of Contents
|
(millions of dollars)
|
||||||||||
| December 31, | 2010 | 2009 | ||||||||
|
ASSETS
|
||||||||||
|
Cash
|
$ | 449.9 | $ | 357.4 | ||||||
|
Receivables, net
|
1,023.9 | 732.0 | ||||||||
|
Inventories, net
|
430.6 | 314.3 | ||||||||
|
Deferred income taxes
|
75.8 | 60.2 | ||||||||
|
Prepayments and other current assets
|
79.7 | 87.9 | ||||||||
|
Total current assets
|
2,059.9 | 1,551.8 | ||||||||
|
Property, plant and equipment, net
|
1,542.6 | 1,490.3 | ||||||||
|
Investments and advances
|
307.9 | 257.4 | ||||||||
|
Goodwill
|
1,113.5 | 1,061.4 | ||||||||
|
Other non-current assets
|
531.1 | 450.5 | ||||||||
|
Total assets
|
$ | 5,555.0 | $ | 4,811.4 | ||||||
| LIABILITIES AND EQUITY | ||||||||||
|
Notes payable and other short-term debt
|
$ | 128.5 | $ | 69.1 | ||||||
|
Accounts payable and accrued expenses
|
1,224.1 | 977.1 | ||||||||
|
Income taxes payable
|
39.7 | — | ||||||||
|
Total current liabilities
|
1,392.3 | 1,046.2 | ||||||||
|
Long-term debt
|
1,051.9 | 773.2 | ||||||||
|
Other non-current liabilities:
|
||||||||||
|
Retirement-related liabilities
|
438.1 | 473.7 | ||||||||
|
Other
|
362.9 | 295.6 | ||||||||
|
Total other non-current liabilities
|
$ | 801.0 | 769.3 | |||||||
|
Capital stock:
|
||||||||||
|
Preferred stock, $0.01 par value; authorized shares:
5,000,000; none issued
|
— | — | ||||||||
|
Common stock, $0.01 par value; authorized shares:
150,000,000; issued shares: 2010, 120,086,206 and 2009,
118,336,410; outstanding shares: 2010, 112,316,444 and 2009,
116,837,555
|
1.2 | 1.2 | ||||||||
|
Non-voting common stock, $0.01 par value; authorized
shares: 25,000,000; none issued and outstanding
|
— | — | ||||||||
|
Capital in excess of par value
|
1,100.4 | 1,034.1 | ||||||||
|
Retained earnings
|
1,560.2 | 1,193.4 | ||||||||
|
Accumulated other comprehensive income (loss)
|
(53.7 | ) | 14.5 | |||||||
|
Common stock held in treasury, at cost: 7,769,762 shares in
2010 and
|
||||||||||
|
1,498,855 shares in 2009
|
(349.5 | ) | (57.9 | ) | ||||||
|
Total BorgWarner Inc. stockholders’ equity
|
2,258.6 | 2,185.3 | ||||||||
|
Noncontrolling interest
|
51.2 | 37.4 | ||||||||
|
Total equity
|
2,309.8 | 2,222.7 | ||||||||
|
Total liabilities and equity
|
$ | 5,555.0 | $ | 4,811.4 | ||||||
55
Table of Contents
|
(millions of dollars)
|
||||||||||||||
| For the Year Ended December 31, | 2010 | 2009 | 2008 | |||||||||||
|
OPERATING
|
||||||||||||||
|
Net earnings (loss)
|
$ | 396.2 | $ | 36.4 | $ | (19.3 | ) | |||||||
|
Adjustments to reconcile net earnings (loss) to net cash flows
from operations:
|
||||||||||||||
|
Non-cash charges (credits) to operations:
|
||||||||||||||
|
Depreciation and tooling amortization
|
224.5 | 234.6 | 259.7 | |||||||||||
|
Amortization of intangible assets and other
|
28.4 | 26.3 | 27.1 | |||||||||||
|
Environmental litigation settlement, net of cash paid
|
14.0 | — | — | |||||||||||
|
Restructuring expense, net of cash paid
|
— | 38.4 | 115.9 | |||||||||||
|
Goodwill impairment charge
|
— | — | 156.8 | |||||||||||
|
Stock based compensation expense
|
22.8 | 22.0 | 21.2 | |||||||||||
|
Deferred income tax benefit
|
(52.2 | ) | (57.7 | ) | (78.3 | ) | ||||||||
|
Bond amortization
|
18.3 | 12.7 | — | |||||||||||
|
BERU-Eichenauer equity investment gain
|
(8.0 | ) | — | — | ||||||||||
|
Equity in affiliates’ earnings, net of dividends received,
and other
|
1.7 | 21.3 | 12.0 | |||||||||||
|
Net earnings (loss) adjusted for non-cash charges to operations
|
645.7 | 334.0 | 495.1 | |||||||||||
|
Changes in assets and liabilities:
|
||||||||||||||
|
Receivables
|
(239.0 | ) | (106.6 | ) | 163.9 | |||||||||
|
Inventories
|
(79.0 | ) | 143.0 | (26.3 | ) | |||||||||
|
Prepayments and other current assets
|
0.6 | 1.2 | 16.0 | |||||||||||
|
Accounts payable and accrued expenses
|
169.4 | 98.9 | (195.6 | ) | ||||||||||
|
Income taxes payable
|
37.3 | (6.9 | ) | (23.0 | ) | |||||||||
|
Other non-current assets and liabilities
|
3.9 | (112.6 | ) | (29.3 | ) | |||||||||
|
Net cash provided by operating activities
|
538.9 | 351.0 | 400.8 | |||||||||||
|
INVESTING
|
||||||||||||||
|
Capital expenditures, including tooling outlays
|
(276.6 | ) | (172.0 | ) | (369.7 | ) | ||||||||
|
Net proceeds from asset disposals
|
6.8 | 23.1 | 5.7 | |||||||||||
|
Payments for businesses acquired, net of cash acquired
|
(164.7 | ) | (7.5 | ) | — | |||||||||
|
Net proceeds from sale of business
|
5.0 | 1.6 | 5.5 | |||||||||||
|
Proceeds from sales of marketable securities
|
— | — | 14.6 | |||||||||||
|
Net cash used in investing activities
|
(429.5 | ) | (154.8 | ) | (343.9 | ) | ||||||||
|
FINANCING
|
||||||||||||||
|
Net increase (decrease) in notes payable
|
(29.8 | ) | (114.7 | ) | 114.8 | |||||||||
|
Additions to long-term debt, net of debt issuance costs
|
372.2 | 381.6 | — | |||||||||||
|
Repayments of long-term debt, including current portion
|
(116.1 | ) | (164.5 | ) | (7.3 | ) | ||||||||
|
Payments for noncontrolling interest acquired
|
— | (48.5 | ) | (141.2 | ) | |||||||||
|
Payment for purchase of bond hedge
|
— | (56.4 | ) | — | ||||||||||
|
Proceeds from warrant issuance
|
— | 31.2 | — | |||||||||||
|
Reduction in accounts receivable securitization facility
|
— | (50.0 | ) | — | ||||||||||
|
Proceeds from accounts receivable securitization facility
|
30.0 | 50.0 | — | |||||||||||
|
Payments for purchase of treasury stock
|
(325.7 | ) | — | (55.9 | ) | |||||||||
|
Proceeds from interest rate swap termination
|
— | 30.0 | — | |||||||||||
|
Proceeds from stock options exercised, including the tax benefit
|
67.1 | 8.7 | 17.1 | |||||||||||
|
Dividends paid to BorgWarner stockholders
|
— | (13.8 | ) | (51.1 | ) | |||||||||
|
Dividends paid to noncontrolling stockholders
|
(10.9 | ) | (8.8 | ) | (12.5 | ) | ||||||||
|
Net cash provided by (used in) financing activities
|
(13.2 | ) | 44.8 | (136.1 | ) | |||||||||
|
Effect of exchange rate changes on cash
|
(3.7 | ) | 13.0 | (5.9 | ) | |||||||||
|
Net increase (decrease) in cash
|
92.5 | 254.0 | (85.1 | ) | ||||||||||
|
Cash at beginning of year
|
357.4 | 103.4 | 188.5 | |||||||||||
|
Cash at end of year
|
$ | 449.9 | $ | 357.4 | $ | 103.4 | ||||||||
|
SUPPLEMENTAL CASH FLOW INFORMATION
|
||||||||||||||
|
Net cash paid during the year for:
|
||||||||||||||
|
Interest
|
$ | 53.4 | $ | 68.8 | $ | 44.4 | ||||||||
|
Income taxes
|
83.1 | 60.3 | 122.0 | |||||||||||
|
Non-cash investing transactions:
|
||||||||||||||
|
Domination and Profit Transfer Agreement
|
— | — | 44.0 | |||||||||||
|
Non-cash financing transactions:
|
||||||||||||||
|
Stock performance plans
|
3.8 | 6.0 | 5.0 | |||||||||||
|
Restricted common stock for employees
|
18.1 | 14.1 | 9.0 | |||||||||||
|
Restricted common stock for non-employee directors
|
0.8 | 0.7 | 0.7 | |||||||||||
56
Table of Contents
| (millions of dollars) | ||||||||||||||||||||||||||||||||||||
| Number of shares | BorgWarner Inc. Stockholders’ equity | |||||||||||||||||||||||||||||||||||
|
Accumulated
|
Equity
|
|||||||||||||||||||||||||||||||||||
|
Issued
|
Common
|
Issued
|
Capital in
|
Other
|
Attributable to
|
|||||||||||||||||||||||||||||||
|
Common
|
Stock in
|
Common
|
Excess of
|
Treasury
|
Retained
|
Comprehensive
|
Noncontrolling
|
Comprehensive
|
||||||||||||||||||||||||||||
| Stock | Treasury | Stock | par Value | Stock | Earnings | Income (Loss) | Interests | Income (Loss) | ||||||||||||||||||||||||||||
|
Balance, January 1, 2008
|
117,206,709 | (1,078,137 | ) | $ | 1.2 | $ | 943.4 | $ | (46.5 | ) | $ | 1,295.9 | $ | 127.1 | $ | 117.9 | ||||||||||||||||||||
|
Dividends declared
|
— | — | — | — | — | (51.1 | ) | — | (12.5 | ) | — | |||||||||||||||||||||||||
|
Stock option expense
|
— | — | — | 12.2 | — | — | — | — | — | |||||||||||||||||||||||||||
|
Stock incentive plans
|
— | 375,075 | — | 10.8 | 15.0 | (8.7 | ) | — | — | — | ||||||||||||||||||||||||||
|
Executive stock plan
|
197,052 | — | — | 1.5 | — | — | — | — | — | |||||||||||||||||||||||||||
|
Net issuance of restricted stock,less amortization
|
295,781 | — | — | 9.7 | — | — | — | — | — | |||||||||||||||||||||||||||
|
Purchases of treasury stock
|
— | (1,464,108 | ) | — | — | (55.9 | ) | — | — | — | — | |||||||||||||||||||||||||
|
Net earnings (loss)
|
— | — | — | — | — | (19.3 | ) | — | 16.2 | $ | (19.3 | ) | ||||||||||||||||||||||||
|
Net earnings attributable to the noncontrolling interest, net of
tax
|
— | — | — | — | — | (16.3 | ) | — | — | (16.3 | ) | |||||||||||||||||||||||||
|
Defined benefit post employment plans, net of tax
|
— | — | — | — | — | — | (74.7 | ) | — | (74.7 | ) | |||||||||||||||||||||||||
|
Net unrealized loss on
available-for-sale
securities
|
— | — | — | — | — | — | (1.4 | ) | — | (1.4 | ) | |||||||||||||||||||||||||
|
Currency translation and hedge instruments, net
|
— | — | — | — | — | — | (126.1 | ) | (0.5 | ) | (126.1 | ) | ||||||||||||||||||||||||
|
Comprehensive loss attributable to the noncontrolling interest
|
— | — | — | — | — | — | (10.8 | ) | — | (10.8 | ) | |||||||||||||||||||||||||
|
Purchase of subsidiary shares from noncontrolling interest
|
— | — | — | — | — | — | — | (1.9 | ) | — | ||||||||||||||||||||||||||
|
Domination and Profit Transfer
|
||||||||||||||||||||||||||||||||||||
|
Agreement (See Note 18)
|
— | — | — | — | — | — | — | (87.7 | ) | — | ||||||||||||||||||||||||||
|
Balance, December 31, 2008
|
117,699,542 | (2,167,170 | ) | $ | 1.2 | $ | 977.6 | $ | (87.4 | ) | $ | 1,200.5 | $ | (85.9 | ) | $ | 31.5 | $ | (248.6 | ) | ||||||||||||||||
|
Dividends declared
|
— | — | — | — | — | (13.8 | ) | — | (8.8 | ) | — | |||||||||||||||||||||||||
|
Stock option expense
|
— | — | — | 7.2 | — | — | — | — | — | |||||||||||||||||||||||||||
|
Stock incentive plans
|
— | 380,499 | — | (0.7 | ) | 16.2 | (7.0 | ) | — | — | — | |||||||||||||||||||||||||
|
Executive stock plan
|
— | 287,816 | — | 6.0 | 13.3 | (13.3 | ) | — | — | — | ||||||||||||||||||||||||||
|
Net issuance of restricted stock, less amortization
|
636,868 | — | — | 14.8 | — | — | — | — | — | |||||||||||||||||||||||||||
|
Convertible bond issuance
|
— | — | — | 34.7 | — | — | — | — | — | |||||||||||||||||||||||||||
|
Convertible bond — Hedge
|
— | — | — | (36.7 | ) | — | — | — | — | — | ||||||||||||||||||||||||||
|
Convertible bond — Warrant
|
— | — | — | 31.2 | — | — | — | — | — | |||||||||||||||||||||||||||
|
Net earnings
|
— | — | — | — | — | 36.4 | — | 9.4 | $ | 36.4 | ||||||||||||||||||||||||||
|
Net earnings attributable to the noncontrolling interest, net of
tax
|
— | — | — | — | — | (9.4 | ) | — | — | (9.4 | ) | |||||||||||||||||||||||||
|
Defined benefit post employment plans, net of tax
|
— | — | — | — | — | — | (3.4 | ) | — | (3.4 | ) | |||||||||||||||||||||||||
|
Currency translation and hedge instruments, net
|
— | — | — | — | — | — | 99.9 | 1.9 | 99.9 | |||||||||||||||||||||||||||
|
Comprehensive income attributable to the noncontrolling interest
|
— | — | — | — | — | — | 3.9 | — | 3.9 | |||||||||||||||||||||||||||
|
Dalian joint venture
|
— | — | — | — | — | — | — | 3.4 | — | |||||||||||||||||||||||||||
|
Balance, December 31, 2009
|
118,336,410 | (1,498,855 | ) | $ | 1.2 | $ | 1,034.1 | $ | (57.9 | ) | $ | 1,193.4 | $ | 14.5 | $ | 37.4 | $ | 127.4 | ||||||||||||||||||
|
Dividends declared
|
— | — | — | — | — | — | — | (9.5 | ) | — | ||||||||||||||||||||||||||
|
Stock option expense
|
— | — | — | 0.1 | — | — | — | — | — | |||||||||||||||||||||||||||
|
Stock incentive plans
|
— | 525,297 | — | 43.5 | 22.6 | (10.6 | ) | — | — | — | ||||||||||||||||||||||||||
|
Executive stock plan
|
— | 269,896 | — | 3.8 | 11.5 | — | — | — | — | |||||||||||||||||||||||||||
|
Net issuance of restricted stock, less amortization
|
1,749,796 | — | — | 18.9 | — | — | — | — | — | |||||||||||||||||||||||||||
|
Purchases of treasury stock
|
— | (7,066,100 | ) | — | — | (325.7 | ) | — | — | — | ||||||||||||||||||||||||||
|
Net earnings
|
— | — | — | — | — | 396.2 | — | 18.8 | $ | 396.2 | ||||||||||||||||||||||||||
|
Net earnings attributable to the noncontrolling interest, net of
tax
|
— | — | — | — | — | (18.8 | ) | — | — | (18.8 | ) | |||||||||||||||||||||||||
|
Defined benefit post employment plans, net of tax
|
— | — | — | — | — | — | 7.8 | — | 7.8 | |||||||||||||||||||||||||||
|
Net unrealized gain on
available-for-sale
securities
|
— | — | — | — | — | — | 1.2 | — | 1.2 | |||||||||||||||||||||||||||
|
Currency translation and hedge instruments, net of tax
|
— | — | — | — | — | — | (77.1 | ) | 2.5 | (77.1 | ) | |||||||||||||||||||||||||
|
Comprehensive loss attributable to the noncontrolling interest
|
— | — | — | — | — | — | (0.1 | ) | — | (0.1 | ) | |||||||||||||||||||||||||
|
Dytech ENSA S.L. acquisition
|
— | — | — | — | — | — | — | 2.0 | — | |||||||||||||||||||||||||||
|
Balance, December 31, 2010
|
120,086,206 | (7,769,762 | ) | $ | 1.2 | $ | 1,100.4 | $ | (349.5 | ) | $ | 1,560.2 | $ | (53.7 | ) | $ | 51.2 | $ | 309.2 | |||||||||||||||||
57
Table of Contents
| NOTE 1 | SUMMARY OF SIGNIFICANT ACCOUNTING POLICIES |
58
Table of Contents
59
Table of Contents
60
Table of Contents
61
Table of Contents
62
Table of Contents
|
(millions of dollars)
|
December 31,
|
|||||
| Balance Sheet | 2008 | |||||
|
Total equity, as previously reported
|
$ | 2,006.0 | ||||
|
Increase for Topic 810 reclass of noncontrolling interest
|
31.5 | |||||
|
Total equity, as adjusted
|
$ | 2,037.5 | ||||
|
Year Ended
|
||||||
|
(millions of dollars)
|
December 31,
|
|||||
| Consolidated Statement of Operations | 2008 | |||||
|
Net loss, as previously reported
|
$ | (35.6 | ) | |||
|
Topic 810 reclass of noncontrolling interest
|
(16.3 | ) | ||||
|
Net loss, as adjusted
|
$ | (19.3 | ) | |||
|
Less: Net earnings attributable to noncontrolling interest
|
16.3 | |||||
|
Net loss attributable to BorgWarner Inc.
|
$ | (35.6 | ) | |||
63
Table of Contents
|
Year Ended
|
||||||
|
(millions of dollars)
|
December 31,
|
|||||
| Statement of Cash Flows | 2008 | |||||
|
Net loss, as previously reported
|
$ | (35.6 | ) | |||
|
Topic 810 reclass of noncontrolling interest
|
(16.3 | ) | ||||
|
Net loss, as adjusted
|
$ | (19.3 | ) | |||
|
Year Ended
|
||||||
|
(millions of dollars)
|
December 31,
|
|||||
| Statement of Cash Flows | 2008 | |||||
|
Equity in affiliates’ earnings, net of dividends received,
minority interest and other, as previously reported
|
$ | 28.3 | ||||
|
Less: Topic 810 reclass of noncontrolling interest
|
(16.3 | ) | ||||
|
Equity in affiliates’ earnings, net of dividends received
and other
|
$ | 12.0 | ||||
|
December 31,
|
||||
| (millions of dollars) | 2008 | |||
|
Net foreign currency translation and hedge instruments
adjustment, as previously reported
|
$ | (136.9 | ) | |
|
Topic 810 reclass of noncontrolling interest
|
(10.8 | ) | ||
|
Net foreign currency translation and hedge instruments
adjustment, as adjusted
|
$ | (126.1 | ) | |
|
Year Ended
|
||||||
|
(millions of dollars)
|
December 31,
|
|||||
| Statement of Cash Flows | 2008 | |||||
|
Payments for businesses acquired, net of cash acquired, as
previously reported
|
$ | (141.2 | ) | |||
|
Less: Topic 805 reclass of noncontrolling interest
|
141.2 | |||||
|
Payments for businesses acquired, net of cash acquired
|
$ | — | ||||
|
Year Ended
|
||||||
|
(millions of dollars)
|
December 31,
|
|||||
| Statement of Cash Flows | 2008 | |||||
|
Net cash used in investing activities, as previously reported
|
$ | (485.1 | ) | |||
|
Less: Topic 805 reclass of noncontrolling interest
|
141.2 | |||||
|
Net cash used in investing activities
|
$ | (343.9 | ) | |||
64
Table of Contents
|
Year Ended
|
||||||
|
(millions of dollars)
|
December 31,
|
|||||
| Statement of Cash Flows | 2008 | |||||
|
Net cash provided by financing activities, as previously reported
|
$ | 5.1 | ||||
|
Less: Topic 805 reclass of noncontrolling interest
|
(141.2 | ) | ||||
|
Net cash used in financing activities
|
$ | (136.1 | ) | |||
65
Table of Contents
| NOTE 2 | RESEARCH AND DEVELOPMENT COSTS |
|
(millions of dollars)
|
||||||||||||||
| Year Ended December 31, | 2010 | 2009 | 2008 | |||||||||||
|
Gross R&D expenditures
|
$ | 233.2 | $ | 219.0 | $ | 273.4 | ||||||||
|
Customer reimbursements
|
(48.2 | ) | (63.8 | ) | (67.7 | ) | ||||||||
|
Net R&D expenditures
|
$ | 185.0 | $ | 155.2 | $ | 205.7 | ||||||||
| NOTE 3 | OTHER EXPENSE (INCOME) |
|
(millions of dollars)
|
||||||||||||||
| Year Ended December 31, | 2010 | 2009 | 2008 | |||||||||||
|
Environmental litigation settlement
|
$ | 28.0 | $ | — | $ | — | ||||||||
|
BERU-Eichenauer equity investment gain
|
(8.0 | ) | — | — | ||||||||||
|
Loss on the sale of a product line
|
1.5 | — | 2.2 | |||||||||||
|
Net loss (gain) on asset disposals
|
1.8 | (0.1 | ) | 2.0 | ||||||||||
|
Other
|
(0.9 | ) | — | (0.2 | ) | |||||||||
|
Total other expense (income)
|
$ | 22.4 | $ | (0.1 | ) | $ | 4.0 | |||||||
66
Table of Contents
| NOTE 4 | INCOME TAXES |
|
(millions of dollars)
|
2010 | 2009 | 2008 | |||||||||||||||||||||||||||||||||||
| Year Ended December 31, | U.S. | Non-U.S. | Total | U.S. | Non-U.S. | Total | U.S. | Non-U.S. | Total | |||||||||||||||||||||||||||||
|
Earnings (loss) before taxes
|
$ | (26.7 | ) | $ | 504.6 | $ | 477.9 | $ | (138.5 | ) | $ | 156.4 | $ | 17.9 | $ | (123.8 | ) | $ | 137.8 | $ | 14.0 | |||||||||||||||||
|
Provision for income taxes:
|
||||||||||||||||||||||||||||||||||||||
|
Current:
|
||||||||||||||||||||||||||||||||||||||
|
Federal/foreign
|
14.0 | 117.7 | 131.7 | (2.7 | ) | 42.7 | 40.0 | 7.7 | 99.5 | 107.2 | ||||||||||||||||||||||||||||
|
State
|
2.2 | — | 2.2 | 1.5 | — | 1.5 | 1.0 | — | 1.0 | |||||||||||||||||||||||||||||
|
Total current
|
16.2 | 117.7 | 133.9 | (1.2 | ) | 42.7 | 41.5 | 8.7 | 99.5 | 108.2 | ||||||||||||||||||||||||||||
|
Deferred
|
(48.9 | ) | (3.3 | ) | (52.2 | ) | (51.6 | ) | (8.4 | ) | (60.0 | ) | (44.7 | ) | (30.2 | ) | (74.9 | ) | ||||||||||||||||||||
|
Total provision for income taxes
|
$ | (32.7 | ) | $ | 114.4 | $ | 81.7 | $ | (52.8 | ) | $ | 34.3 | $ | (18.5 | ) | $ | (36.0 | ) | $ | 69.3 | $ | 33.3 | ||||||||||||||||
|
Effective tax rate
|
(122.5 | )% | 22.7 | % | 17.1 | % | (38.1 | )% | 21.9 | % | (103.4 | )% | (29.1 | )% | 50.3 | % | 237.9 | % | ||||||||||||||||||||
67
Table of Contents
| millions of dollars | 2010 | 2009 | ||||||||
|
Balance, January 1
|
$ | 34.8 | $ | 61.1 | ||||||
|
Additions based on tax positions related to current year
|
1.1 | 16.4 | ||||||||
|
Additions (Reductions) for tax positions of prior years
|
0.3 | (16.5 | ) | |||||||
|
Reductions for lapse in statute of limitations
|
(1.3 | ) | (17.0 | ) | ||||||
|
Settlements
|
(6.6 | ) | (9.9 | ) | ||||||
|
Translation adjustment
|
(0.7 | ) | 0.7 | |||||||
|
Balance, December 31
|
$ | 27.6 | $ | 34.8 | ||||||
|
Years No Longer
|
||||
| Tax Jurisdiction | Subject to Audit | |||
|
U.S. Federal
|
2006 and prior | |||
|
Brazil
|
2003 and prior | |||
|
France
|
2006 and prior | |||
|
Germany
|
2003 and prior | |||
|
Hungary
|
2007 and prior | |||
|
Italy
|
2005 and prior | |||
|
Japan
|
2008 and prior | |||
|
South Korea
|
2005 and prior | |||
|
United Kingdom
|
2008 and prior | |||
68
Table of Contents
| (millions of dollars) | 2010 | 2009 | 2008 | |||||||||||
|
Income taxes at U.S. statutory rate of 35%
|
$ | 167.3 | $ | 6.2 | $ | 4.9 | ||||||||
|
Increases (decreases) resulting from:
|
||||||||||||||
|
Income from
non-U.S.
sources including withholding taxes
|
(55.8 | ) | (17.1 | ) | (26.5 | ) | ||||||||
|
State taxes, net of federal benefit
|
1.4 | 4.7 | 0.9 | |||||||||||
|
Business tax credits
|
0.2 | (1.9 | ) | (9.8 | ) | |||||||||
|
Affiliates’ earnings
|
(13.8 | ) | (7.5 | ) | (13.2 | ) | ||||||||
|
Accrual adjustment and settlement of prior year tax matters
|
0.4 | (6.3 | ) | 6.0 | ||||||||||
|
Medicare prescription drug benefit
|
2.9 | 1.7 | 1.1 | |||||||||||
|
Goodwill impairment
|
— | — | 54.9 | |||||||||||
|
Restructuring
|
— | — | 0.6 | |||||||||||
|
Valuation allowance
|
(21.2 | ) | 7.7 | 13.1 | ||||||||||
|
Non-temporary differences and other
|
0.3 | (6.0 | ) | 1.3 | ||||||||||
|
Provision for income taxes as reported
|
$ | 81.7 | $ | (18.5 | ) | $ | 33.3 | |||||||
69
Table of Contents
| (millions of dollars) | 2010 | 2009 | ||||||||
|
Current deferred tax assets:
|
||||||||||
|
Employee related
|
$ | 26.2 | $ | 23.9 | ||||||
|
Net operating loss carryforwards
|
9.8 | 4.7 | ||||||||
|
Inventory
|
8.6 | 9.3 | ||||||||
|
Warranties
|
6.3 | 4.5 | ||||||||
|
Litigation & environmental
|
5.8 | 6.9 | ||||||||
|
Customer claims
|
2.0 | 2.9 | ||||||||
|
Derivatives
|
1.2 | 1.9 | ||||||||
|
Other
|
6.8 | 6.4 | ||||||||
|
Total current deferred tax assets
|
$ | 66.7 | $ | 60.5 | ||||||
|
Current deferred tax liabilities:
|
||||||||||
|
Derivatives
|
$ | — | $ | (1.0 | ) | |||||
|
Other
|
(7.6 | ) | (3.8 | ) | ||||||
|
Total current deferred tax liabilities
|
$ | (7.6 | ) | $ | (4.8 | ) | ||||
|
Non-current deferred tax assets:
|
||||||||||
|
Foreign tax credits
|
$ | 183.4 | $ | 138.3 | ||||||
|
Other comprehensive income
|
98.0 | 103.7 | ||||||||
|
Research and Development Capitalization
|
49.3 | — | ||||||||
|
Pension and other post employment benefits
|
44.6 | 52.5 | ||||||||
|
Employee related
|
20.0 | 13.4 | ||||||||
|
Net operating loss carryforwards
|
15.0 | 87.5 | ||||||||
|
Research and development credits
|
6.3 | 5.9 | ||||||||
|
Warranties
|
4.4 | 4.5 | ||||||||
|
Litigation and environmental
|
2.6 | 2.5 | ||||||||
|
Capital loss carryforwards
|
— | 3.5 | ||||||||
|
Other
|
8.1 | 4.1 | ||||||||
|
Total non-current deferred tax assets
|
$ | 431.7 | $ | 415.9 | ||||||
|
Non-current deferred tax liabilities:
|
||||||||||
|
Goodwill & intangibles
|
$ | (130.3 | ) | $ | (103.5 | ) | ||||
|
Fixed assets
|
(84.8 | ) | (101.7 | ) | ||||||
|
Dividends accrued
|
(2.8 | ) | — | |||||||
|
Other comprehensive income
|
(3.0 | ) | (3.5 | ) | ||||||
|
Lease obligation — production equipment
|
— | (1.9 | ) | |||||||
|
Other
|
(7.7 | ) | (4.5 | ) | ||||||
|
Total non-current deferred tax liabilities
|
$ | (228.6 | ) | $ | (215.1 | ) | ||||
|
Total deferred tax items
|
$ | 262.2 | $ | 256.5 | ||||||
|
Valuation allowances
|
(13.0 | ) | (43.8 | ) | ||||||
|
Net deferred tax asset
|
$ | 249.2 | $ | 212.7 | ||||||
70
Table of Contents
| (millions of dollars) | 2010 | 2009 | ||||||||
|
Deferred income taxes — current assets
|
$ | 75.8 | $ | 60.2 | ||||||
|
Deferred income taxes — current liabilities
|
(18.4 | ) | (4.8 | ) | ||||||
|
Other non-current assets
|
305.5 | 247.1 | ||||||||
|
Other non-current liabilities
|
(113.7 | ) | (89.8 | ) | ||||||
|
Net deferred tax asset (current and non-current)
|
$ | 249.2 | $ | 212.7 | ||||||
71
Table of Contents
| NOTE 5 | BALANCE SHEET INFORMATION |
|
(millions of dollars)
|
||||||||||
| December 31, | 2010 | 2009 | ||||||||
|
Receivables:
|
||||||||||
|
Customers
|
$ | 859.5 | $ | 634.5 | ||||||
|
Other
|
168.4 | 101.8 | ||||||||
|
Gross receivables
|
1,027.9 | 736.3 | ||||||||
|
Bad debt allowance(a)
|
(4.0 | ) | (4.3 | ) | ||||||
|
Net receivables
|
$ | 1,023.9 | $ | 732.0 | ||||||
|
Inventories:
|
||||||||||
|
Raw material and supplies
|
$ | 244.0 | $ | 187.3 | ||||||
|
Work in progress
|
88.1 | 69.8 | ||||||||
|
Finished goods
|
111.7 | 68.8 | ||||||||
|
FIFO inventories
|
443.8 | 325.9 | ||||||||
|
LIFO reserve
|
(13.2 | ) | (11.6 | ) | ||||||
|
Net inventories
|
$ | 430.6 | $ | 314.3 | ||||||
|
Other current assets:
|
||||||||||
|
Prepaid tooling
|
$ | 21.8 | $ | 25.6 | ||||||
|
Product liability insurance asset
|
25.8 | 24.9 | ||||||||
|
Derivatives
|
2.7 | 12.0 | ||||||||
|
Prepaid tax
|
5.8 | 2.2 | ||||||||
|
Other
|
23.6 | 23.2 | ||||||||
|
Total other current assets
|
$ | 79.7 | $ | 87.9 | ||||||
|
Property, plant and equipment:
|
||||||||||
|
Land
|
$ | 67.9 | $ | 56.3 | ||||||
|
Buildings
|
601.4 | 570.0 | ||||||||
|
Machinery and equipment
|
1,961.2 | 1,866.5 | ||||||||
|
Capital leases
|
2.3 | 2.4 | ||||||||
|
Construction in progress
|
128.2 | 126.4 | ||||||||
|
Total property, plant and equipment
|
2,761.0 | 2,621.6 | ||||||||
|
Accumulated depreciation
|
(1,308.0 | ) | (1,211.6 | ) | ||||||
| 1,453.0 | 1,410.0 | |||||||||
|
Tooling, net of amortization
|
89.6 | 80.3 | ||||||||
|
Property, plant & equipment, net
|
$ | 1,542.6 | $ | 1,490.3 | ||||||
|
Investments and advances:
|
||||||||||
|
Investment in equity affiliates
|
$ | 205.2 | $ | 194.8 | ||||||
|
Other investments and advances
|
102.7 | 62.6 | ||||||||
|
Total investments and advances
|
$ | 307.9 | $ | 257.4 | ||||||
|
Other non-current assets:
|
||||||||||
|
Product liability insurance asset
|
$ | 24.8 | $ | 25.0 | ||||||
|
Deferred income taxes
|
305.5 | 247.1 | ||||||||
|
Other intangible assets
|
168.8 | 148.6 | ||||||||
|
Other
|
32.0 | 29.8 | ||||||||
|
Total other non-current assets
|
$ | 531.1 | $ | 450.5 | ||||||
72
Table of Contents
|
(millions of dollars)
|
||||||||||
| December 31, | 2010 | 2009 | ||||||||
|
Accounts payable and accrued expenses:
|
||||||||||
|
Trade payables
|
$ | 737.7 | $ | 539.2 | ||||||
|
Trade payables for capital expenditures
|
28.9 | 28.6 | ||||||||
|
Payroll and employee related
|
190.2 | 136.7 | ||||||||
|
Retirement related
|
34.7 | 34.8 | ||||||||
|
Product warranties
|
37.0 | 32.5 | ||||||||
|
Customer related
|
32.5 | 31.4 | ||||||||
|
Product liability
|
25.8 | 24.9 | ||||||||
|
Severance
|
4.6 | 17.5 | ||||||||
|
Insurance
|
11.9 | 16.2 | ||||||||
|
Derivatives
|
3.3 | 14.6 | ||||||||
|
Environmental
|
21.0 | 12.2 | ||||||||
|
Interest
|
14.3 | 11.2 | ||||||||
|
Legal and professional fees
|
8.6 | 9.1 | ||||||||
|
Dividends payable to non-controlling shareholders
|
4.2 | 5.4 | ||||||||
|
Current deferred income taxes
|
18.4 | 4.8 | ||||||||
|
Other
|
51.0 | 58.0 | ||||||||
|
Total accounts payable and accrued expenses
|
$ | 1,224.1 | $ | 977.1 | ||||||
|
Other non-current liabilities:
|
||||||||||
|
Deferred income taxes
|
$ | 113.7 | $ | 89.8 | ||||||
|
Cross currency swaps and derivatives
|
78.8 | 54.2 | ||||||||
|
Product warranties
|
29.8 | 29.2 | ||||||||
|
Product liability accrual
|
24.8 | 25.0 | ||||||||
|
Deferred revenue
|
23.4 | 22.7 | ||||||||
|
Environmental
|
8.2 | 10.1 | ||||||||
|
Other
|
84.2 | 64.6 | ||||||||
|
Total other non-current liabilities
|
$ | 362.9 | $ | 295.6 | ||||||
| (a) | Bad debt allowance: |
| 2010 | 2009 | 2008 | ||||||||||
|
Beginning balance
|
$ | (4.3 | ) | $ | (5.7 | ) | $ | (5.2 | ) | |||
|
Provision
|
(1.1 | ) | 0.1 | (2.4 | ) | |||||||
|
Write-offs
|
2.5 | 1.4 | 1.6 | |||||||||
|
Translation adjustment and other
|
(1.1 | ) | (0.1 | ) | 0.3 | |||||||
|
Ending balance
|
$ | (4.0 | ) | $ | (4.3 | ) | $ | (5.7 | ) | |||
73
Table of Contents
| 2010 | ||||||||||||||||||||||
| (millions of dollars) | Q1 | Q2 | Q3 | Q4 | Full Year | |||||||||||||||||
|
Operating income increase
|
$ | 4.8 | $ | 4.7 | $ | 4.6 | $ | 4.7 | $ | 18.8 | ||||||||||||
|
Net earnings increase attributable to BorgWarner Inc.
|
3.7 | 3.6 | 3.6 | 3.6 | 14.5 | |||||||||||||||||
|
Earnings per share increase — Basic
|
$ | 0.03 | $ | 0.03 | $ | 0.03 | $ | 0.03 | $ | 0.13 | ||||||||||||
|
Earnings per share increase — Diluted
|
$ | 0.03 | $ | 0.03 | $ | 0.03 | $ | 0.03 | $ | 0.11 | ||||||||||||
| 2009 | ||||||||||||||||||||||
| (millions of dollars) | Q1 | Q2 | Q3 | Q4 | Full Year | |||||||||||||||||
|
Operating income increase
|
$ | 4.6 | $ | 4.6 | $ | 4.6 | $ | 4.6 | $ | 18.4 | ||||||||||||
|
Net earnings increase attributable to BorgWarner Inc.
|
3.5 | 3.5 | 3.5 | 3.5 | 14.0 | |||||||||||||||||
|
Earnings per share increase — Basic
|
$ | 0.03 | $ | 0.03 | $ | 0.03 | $ | 0.03 | $ | 0.12 | ||||||||||||
|
Earnings per share increase — Diluted
|
$ | 0.03 | $ | 0.03 | $ | 0.03 | $ | 0.03 | $ | 0.12 | ||||||||||||
| (millions of dollars) | 2010 | 2009 | ||||||||
|
Balance sheets:
|
||||||||||
|
Cash and securities
|
$ | 109.1 | $ | 83.0 | ||||||
|
Current assets
|
310.2 | 279.1 | ||||||||
|
Non-current assets
|
174.9 | 182.6 | ||||||||
|
Current liabilities
|
151.4 | 137.9 | ||||||||
|
Non-current liabilities
|
41.9 | 45.0 | ||||||||
|
Total equity
|
291.8 | 278.8 | ||||||||
74
Table of Contents
| 2010 | 2009 | 2008 | ||||||||||
|
Statements of operations:
|
||||||||||||
|
Net sales
|
$ | 634.7 | $ | 494.5 | $ | 637.9 | ||||||
|
Gross profit
|
131.9 | 89.2 | 140.0 | |||||||||
|
Net income
|
68.3 | 35.8 | 67.6 | |||||||||
| NOTE 6 | GOODWILL AND OTHER INTANGIBLES |
| • | Discount Rate: The Company used a 10% weighted average cost of capital (“WACC”) as the discount rate for future cash flows. The WACC is intended to represent a rate of return that would be expected by a market participant. | |
| • | Operating Income Margin: The Company utilized historical and expected operating income margins, which varied based on the projections of each reporting unit being evaluated. |
| • | Our industry is cyclical and our results of operations will be adversely affected by industry downturns. | |
| • | We are dependent on market segments that use our key products and would be affected by decreasing demand in those segments. | |
| • | We are subject to risks related to our international operations. |
75
Table of Contents
| Engine | Drivetrain | Engine | Drivetrain | |||||||||||||||
| (millions of dollars) | 2010 | 2009 | ||||||||||||||||
|
Gross goodwill balance as of January 1
|
$ | 1,297.8 | $ | 265.6 | $ | 1,289.6 | $ | 264.8 | ||||||||||
|
Accumulated impairment losses
|
(501.8 | ) | (0.2 | ) | (501.8 | ) | (0.2 | ) | ||||||||||
|
Net goodwill balance as of January 1
|
$ | 796.0 | $ | 265.4 | $ | 787.8 | $ | 264.6 | ||||||||||
|
Goodwill during the year:
|
||||||||||||||||||
|
Acquired
|
74.1 | — | — | |||||||||||||||
|
Divested
|
(1.4 | ) | — | (1.1 | ) | — | ||||||||||||
|
Translation adjustment
|
(18.6 | ) | (2.0 | ) | 9.3 | 0.8 | ||||||||||||
|
Balance as of December 31
|
$ | 850.1 | $ | 263.4 | $ | 796.0 | $ | 265.4 | ||||||||||
| December 31, 2010 | December 31, 2009 | |||||||||||||||||||||||||
|
Gross
|
Net
|
Gross
|
Net
|
|||||||||||||||||||||||
|
Carrying
|
Accumulated
|
Carrying
|
Carrying
|
Accumulated
|
Carrying
|
|||||||||||||||||||||
| (millions of dollars) | Amount | Amortization | Amount | Amount | Amortization | Amount | ||||||||||||||||||||
|
Amortized intangible assets
|
||||||||||||||||||||||||||
|
Patented technology
|
$ | 47.0 | $ | 13.8 | $ | 33.2 | $ | 32.8 | $ | 11.6 | $ | 21.2 | ||||||||||||||
|
Unpatented technology
|
22.4 | 4.2 | 18.2 | 6.7 | 3.2 | 3.5 | ||||||||||||||||||||
|
Customer relationships
|
127.3 | 57.5 | 69.8 | 119.1 | 46.2 | 72.9 | ||||||||||||||||||||
|
Distribution network
|
50.8 | 50.8 | — | 54.4 | 43.6 | 10.8 | ||||||||||||||||||||
|
Miscellaneous
|
14.7 | 11.9 | 2.8 | 14.7 | 11.9 | 2.8 | ||||||||||||||||||||
|
Total amortized intangible assets
|
262.2 | 138.2 | 124.0 | 227.7 | 116.5 | 111.2 | ||||||||||||||||||||
|
In-process R&D
|
13.1 | — | 13.1 | 13.1 | — | 13.1 | ||||||||||||||||||||
|
Unamortized trade names
|
31.7 | — | 31.7 | 24.3 | — | 24.3 | ||||||||||||||||||||
|
Total intangible assets
|
$ | 307.0 | $ | 138.2 | $ | 168.8 | $ | 265.1 | $ | 116.5 | $ | 148.6 | ||||||||||||||
76
Table of Contents
| (millions of dollars) | 2010 | 2009 | ||||||||
|
Beginning balance
|
$ | 265.1 | $ | 231.2 | ||||||
|
Acquisitions
|
55.0 | 27.7 | ||||||||
|
Translation adjustment
|
(13.1 | ) | 6.2 | |||||||
|
Ending balance
|
$ | 307.0 | $ | 265.1 | ||||||
| (millions of dollars) | 2010 | 2009 | ||||||||
|
Beginning balance
|
$ | 116.5 | $ | 82.8 | ||||||
|
Provisions
|
28.4 | 26.3 | ||||||||
|
Non-recurring charges (write-offs)
|
— | 4.6 | ||||||||
|
Translation adjustment
|
(6.7 | ) | 2.8 | |||||||
|
Ending balance
|
$ | 138.2 | $ | 116.5 | ||||||
77
Table of Contents
| NOTE 7 | PRODUCT WARRANTY |
| (millions of dollars) | 2010 | 2009 | ||||||||
|
Beginning balance
|
$ | 61.7 | $ | 82.1 | ||||||
|
Acquisition
|
3.0 | — | ||||||||
|
Provisions
|
39.3 | 46.0 | ||||||||
|
Payments
|
(35.5 | ) | (68.3 | ) | ||||||
|
Translation adjustment
|
(1.7 | ) | 1.9 | |||||||
|
Ending balance
|
$ | 66.8 | $ | 61.7 | ||||||
| (millions of dollars) | 2010 | 2009 | ||||||||
|
Accounts payable and accrued expenses
|
$ | 37.0 | $ | 32.5 | ||||||
|
Other non-current liabilities
|
29.8 | 29.2 | ||||||||
|
Total product warranty liability
|
$ | 66.8 | $ | 61.7 | ||||||
| NOTE 8 |
|
| (millions of dollars) | 2010 | 2009 | ||||||||
|
Short-term debt
|
||||||||||
|
Short-term borrowings
|
$ | 42.4 | $ | 64.0 | ||||||
|
Receivables securitization(a)
|
80.0 | — | ||||||||
|
Total short-term debt
|
$ | 122.4 | $ | 64.0 | ||||||
|
Long-term debt
|
||||||||||
|
3.5% Convertible notes due 4/15/12
|
$ | 348.5 | $ | 330.2 | ||||||
|
5.75% Senior notes due 11/01/16 ($150 million par
value)(b)
|
149.4 | 149.3 | ||||||||
|
8.00% Senior notes due 10/01/19 ($134 million par
value)(b)
|
133.9 | 133.9 | ||||||||
|
4.625% Senior notes due 09/15/20 ($250 million par
value)
|
247.5 | — | ||||||||
|
7.125% Senior notes due 02/15/29 ($121 million par
value)
|
119.3 | 119.3 | ||||||||
|
Term loan facilities & other
|
31.6 | 14.2 | ||||||||
|
Impact of derivates on debt(b)
|
27.8 | 31.4 | ||||||||
|
Total long-term debt
|
$ | 1,058.0 | $ | 778.3 | ||||||
|
Less: current portion
|
6.1 | 5.1 | ||||||||
|
Long-term debt, net of current portion
|
$ | 1,051.9 | $ | 773.2 | ||||||
| (a) | On January 1, 2010, the Company adopted ASC Topic 860. The impact of this adoption is an increase in receivables, net of $80 million and an increase in notes payable and other short-term debt of $80 million in |
78
Table of Contents
| the Company’s December 31, 2010 Consolidated Balance Sheet. See Note 1 in the Consolidated Financial Statements for more information regarding the Company’s first quarter 2010 adoption of ASC Topic 860. | ||
| (b) | In 2006, the Company entered into several interest rate swaps that had the effect of converting $325.0 million of fixed rate notes to variable rates. In the first quarter of 2009, $100 million in interest rate swaps related to the Company’s 2009 fixed rate debt matured, and the Company terminated $150 million in interest rate swap agreements related to the Company’s 2016 fixed rate debt and $75 million of interest rate swap agreements related to the Company’s 2019 fixed rate debt. As a result of the first quarter 2009 swap terminations, a $34.5 million gain remained in debt and is being amortized over the remaining lives of the respective 2016 and 2019 debt. As of December 31, 2010 and 2009, the unamortized portion was $27.8 million and $31.4 million, respectively. |
|
2011
|
$ | 128.5 | ||
|
2012
|
384.1 | |||
|
2013
|
5.0 | |||
|
2014
|
0.2 | |||
|
2015
|
10.0 | |||
|
After 2015
|
682.4 | |||
|
Total Payments
|
$ | 1,210.2 | ||
|
Less: Convertible Note Accretion
|
(25.3 | ) | ||
|
Less: Unamortized Discounts
|
(4.5 | ) | ||
|
Total
|
$ | 1,180.4 | ||
79
Table of Contents
| (millions of dollars) | 2010 | 2009 | ||||||||
|
Interest expense
|
$ | 31.3 | $ | 22.2 | ||||||
|
Non-cash portion
|
$ | 18.3 | $ | 12.7 | ||||||
| NOTE 9 | FAIR VALUE MEASUREMENTS |
| Level 1: | Observable inputs such as quoted prices in active markets; | |
| Level 2: | Inputs, other than quoted prices in active markets, that are observable either directly or indirectly; and |
80
Table of Contents
| Level 3: | Unobservable inputs in which there is little or no market data, which require the reporting entity to develop its own assumptions. |
| A. | Market approach: Prices and other relevant information generated by market transactions involving identical or comparable assets or liabilities. | |
| B. | Cost approach: Amount that would be required to replace the service capacity of an asset (replacement cost). | |
| C. | Income approach: Techniques to convert future amounts to a single present amount based upon market expectations (including present value techniques, option-pricing and excess earnings models). |
| Basis of Fair Value Measurements | ||||||||||||||||||||
|
Quoted
|
||||||||||||||||||||
|
Prices in
|
Significant
|
|||||||||||||||||||
|
Active
|
Other
|
Significant
|
||||||||||||||||||
|
Balance at
|
Markets for
|
Observable
|
Unobservable
|
|||||||||||||||||
|
December 31,
|
Identical
|
Inputs
|
Inputs
|
Valuation
|
||||||||||||||||
| (millions of dollars) | 2010 | (Level 1) | (Level 2) | (Level 3) | Technique | |||||||||||||||
|
Assets:
|
||||||||||||||||||||
|
Foreign exchange contracts
|
$ | 2.7 | $ | — | $ | 2.7 | $ | — | A | |||||||||||
| $ | 2.7 | $ | — | $ | 2.7 | $ | — | |||||||||||||
|
Liabilities:
|
||||||||||||||||||||
|
Foreign exchange contracts
|
$ | 6.4 | $ | — | $ | 6.4 | $ | — | A | |||||||||||
|
Net investment hedge contracts
|
75.7 | — | 75.7 | — | A | |||||||||||||||
| $ | 82.1 | $ | — | $ | 82.1 | $ | — | |||||||||||||
| Basis of Fair Value Measurements | ||||||||||||||||||||
|
Quoted
|
||||||||||||||||||||
|
Prices in
|
Significant
|
|||||||||||||||||||
|
Active
|
Other
|
Significant
|
||||||||||||||||||
|
Balance at
|
Markets for
|
Observable
|
Unobservable
|
|||||||||||||||||
|
December 31,
|
Identical
|
Inputs
|
Inputs
|
Valuation
|
||||||||||||||||
| (millions of dollars) | 2009 | (Level 1) | (Level 2) | (Level 3) | Technique | |||||||||||||||
|
Assets:
|
||||||||||||||||||||
|
Engine segment fixed assets
|
$ | — | $ | — | $ | — | $ | — | B | |||||||||||
|
Commodity contracts
|
8.4 | — | 8.4 | — | A | |||||||||||||||
|
Foreign exchange contracts
|
3.8 | — | 3.8 | — | A | |||||||||||||||
| $ | 12.2 | $ | — | $ | 12.2 | $ | — | |||||||||||||
|
Liabilities:
|
||||||||||||||||||||
|
Commodity contracts
|
$ | 0.1 | $ | — | $ | 0.1 | $ | — | A | |||||||||||
|
Foreign exchange contracts
|
17.5 | — | 17.5 | — | A | |||||||||||||||
|
Net investment hedge contracts
|
51.2 | — | 51.2 | — | A | |||||||||||||||
| $ | 68.8 | $ | — | $ | 68.8 | $ | — | |||||||||||||
81
Table of Contents
|
Fair Value
|
||||||||
|
Measurements
|
||||||||
|
Using Significant
|
||||||||
|
Unobservable Inputs
|
||||||||
| (millions of dollars) | (Level 3) | |||||||
|
Net book value prior to impairment
|
$ | 22.3 | ||||||
|
Fixed asset impairment charge
|
(22.3 | ) | ||||||
|
Net book value after impairment charge
|
$ | — | ||||||
| Basis of Fair Value Measurements | ||||||||||||||||||||||||
|
Quoted
|
||||||||||||||||||||||||
|
Prices in
|
Significant
|
|||||||||||||||||||||||
|
Active
|
Other
|
Significant
|
||||||||||||||||||||||
|
Balance at
|
Markets for
|
Observable
|
Unobservable
|
|||||||||||||||||||||
|
December 31,
|
Identical
|
Inputs
|
Inputs
|
Valuation
|
||||||||||||||||||||
| (millions of dollars) | 2010 | (Level 1) | (Level 2) | (Level 3) | Technique | |||||||||||||||||||
|
U.S. Plans:
|
||||||||||||||||||||||||
|
Fixed income securities
|
$ | 113.7 | $ | — | $ | 113.7 | $ | — | A | |||||||||||||||
|
Equity securities
|
140.5 | 48.5 | 92.0 | — | A | |||||||||||||||||||
|
Cash, real estate and other
|
33.0 | — | 33.0 | — | A | |||||||||||||||||||
| $ | 287.2 | $ | 48.5 | $ | 238.7 | $ | — | |||||||||||||||||
|
Non-U.S.
Plans:
|
||||||||||||||||||||||||
|
Fixed income securities
|
$ | 59.6 | $ | — | $ | 59.6 | $ | — | A | |||||||||||||||
|
Equity securities
|
88.4 | — | 88.4 | — | A | |||||||||||||||||||
|
Cash, real estate and other
|
6.6 | — | 6.6 | — | A | |||||||||||||||||||
| $ | 154.6 | $ | — | $ | 154.6 | $ | — | |||||||||||||||||
82
Table of Contents
| Basis of Fair Value Measurements | ||||||||||||||||||||||||
|
Quoted
|
||||||||||||||||||||||||
|
Prices in
|
Significant
|
|||||||||||||||||||||||
|
Active
|
Other
|
Significant
|
||||||||||||||||||||||
|
Balance at
|
Markets for
|
Observable
|
Unobservable
|
|||||||||||||||||||||
|
December 31,
|
Identical
|
Inputs
|
Inputs
|
Valuation
|
||||||||||||||||||||
| (millions of dollars) | 2009 | (Level 1) | (Level 2) | (Level 3) | Technique | |||||||||||||||||||
|
U.S. Plans:
|
||||||||||||||||||||||||
|
Fixed income securities
|
$ | 122.0 | $ | — | $ | 122.0 | $ | — | A | |||||||||||||||
|
Equity securities
|
124.3 | 43.3 | 81.0 | — | A | |||||||||||||||||||
|
Cash, real estate and other
|
22.8 | — | 22.8 | — | A | |||||||||||||||||||
| $ | 269.1 | $ | 43.3 | $ | 225.8 | $ | — | |||||||||||||||||
|
Non-U.S.
Plans:
|
||||||||||||||||||||||||
|
Fixed income securities
|
$ | 42.1 | $ | — | $ | 42.1 | $ | — | A | |||||||||||||||
|
Equity securities
|
72.7 | — | 72.7 | — | A | |||||||||||||||||||
|
Cash, real estate and other
|
29.2 | — | 29.2 | — | A | |||||||||||||||||||
| $ | 144.0 | $ | — | $ | 144.0 | $ | — | |||||||||||||||||
| NOTE 10 | FINANCIAL INSTRUMENTS |
| Cross-Currency Swaps | ||||||||||||||||
|
Notional
|
Notional
|
|||||||||||||||
| (millions of dollars) | in USD | in Local Currency | Duration | |||||||||||||
|
Floating $ to Floating €
|
$ | 75.0 | € | 58.5 | Oct - 19 | |||||||||||
|
Floating $ to Floating ¥
|
$ | 150.0 | ¥ 17,581.5 | Nov - 16 | ||||||||||||
83
Table of Contents
| Commodity Hedges | ||||||||||||||||||||
|
Volume
|
||||||||||||||||||||
|
Hedged
|
Volume
|
|||||||||||||||||||
|
December 31,
|
Hedged
|
Units of
|
||||||||||||||||||
| Commodity | 2010 | December 31, 2009 | Measure | Duration | ||||||||||||||||
|
Nickel
|
— | 780 | Metric Tons | Dec - 10 | ||||||||||||||||
|
Copper
|
— | 759 | Metric Tons | Dec - 10 | ||||||||||||||||
|
Aluminum
|
— | 330 | Metric Tons | Dec - 10 | ||||||||||||||||
|
Natural Gas
|
258,900 | 392,396 | MMBtu | Dec - 11 | ||||||||||||||||
| Currency Hedges (millions) | ||||||||||||||
|
Notional in
|
Notional in
|
|||||||||||||
|
Functional
|
Traded
|
Traded Currency
|
Traded Currency
|
|||||||||||
| Currency | Currency | December 31, 2010 | December 31, 2009 | Duration | ||||||||||
|
British Pound
|
Euro | 107.3 | 84.3 | Dec - 13 | ||||||||||
|
Euro
|
Hungarian Forint | — | 2,562.6 | Dec - 10 | ||||||||||
|
Euro
|
British Pound | — | 10.5 | Jan - 10 | ||||||||||
|
Euro
|
US Dollar | 20.2 | 0.4 | Dec - 11 | ||||||||||
|
Euro
|
Japanese Yen | — | 16.7 | Mar - 10 | ||||||||||
|
Indian Rupee
|
US Dollar | 1.9 | 7.4 | Dec - 11 | ||||||||||
|
Korean Won
|
Euro | 45.7 | 62.3 | Dec - 12 | ||||||||||
|
Mexican Peso
|
Euro | 13.5 | — | Mar - 11 | ||||||||||
|
US Dollar
|
Indian Rupee | 141.5 | 372.9 | Dec - 11 | ||||||||||
|
US Dollar
|
Euro | 1.7 | — | Mar - 11 | ||||||||||
84
Table of Contents
|
(millions of dollars)
|
||||||||||||||||||||
|
Derivatives designated as
|
Assets | Liabilities | ||||||||||||||||||
|
hedging instruments
|
December 31,
|
December 31,
|
December 31,
|
December 31,
|
||||||||||||||||
| under Topic 815 | Location | 2010 | 2009 | Location | 2010 | 2009 | ||||||||||||||
|
Foreign Exchange Contracts
|
Prepayments and Other Current Assets | $ | 2.7 | $ | 3.6 | Accounts Payable and Accrued Expenses | $ | 3.3 | $ | 14.5 | ||||||||||
| Other Non-Current Assets | — | 0.2 | Other Non-Current Liabilities | 3.1 | 3.0 | |||||||||||||||
|
Commodity Contracts
|
Prepayments and Other Current Assets | — | 8.4 | Accounts Payable and Accrued Expenses | — | 0.1 | ||||||||||||||
|
Net Investment Hedges
|
Other Non-Current Assets | — | — | Other Non-Current Liabilities | 75.7 | 51.2 | ||||||||||||||
|
Gain (Loss) Expected to
|
||||||||||||
|
(millions of dollars)
|
Balance in OCI at |
be Reclassified to Income
|
||||||||||
| Contract Type | December 31, 2010 | December 31, 2009 | in One Year or Less | |||||||||
|
Foreign Exchange
|
$ | (3.7 | ) | $ | (11.4 | ) | $ | (0.6 | ) | |||
|
Commodity
|
1.6 | 7.3 | 1.6 | |||||||||
|
Net Investment Hedges
|
(69.3 | ) | (47.2 | ) | — | |||||||
|
Total
|
$ | (71.4 | ) | $ | (51.3 | ) | $ | 1.0 | ||||
|
Gain (Loss) Reclassified
|
Gain (Loss)
|
|||||||||||||||||||||||
|
from OCI to Income
|
Recognized in Income
|
|||||||||||||||||||||||
| (Effective Portion) | (Ineffective Portion) | |||||||||||||||||||||||
|
(millions of dollars)
|
Year Ended | Year Ended | ||||||||||||||||||||||
| Contract Type | Location | December 31, 2010 | December 31, 2009 | Location | December 31, 2010 | December 31, 2009 | ||||||||||||||||||
|
Cross-Currency Swap
|
Interest Expense | $ | — | $ | — | Interest Expense | $ | (2.5 | ) | $ | 1.1 | |||||||||||||
85
Table of Contents
|
Gain (Loss) Reclassified
|
Gain (Loss)
|
|||||||||||||||||||||
|
from OCI to Income
|
Recognized in Income
|
|||||||||||||||||||||
| (Effective Portion) | (Ineffective Portion) | |||||||||||||||||||||
| Year Ended | Year Ended | |||||||||||||||||||||
| (millions of dollars) |
December 31,
|
December 31,
|
December 31,
|
December 31,
|
||||||||||||||||||
| Contract Type | Location | 2010 | 2009 | Location | 2010 | 2009 | ||||||||||||||||
|
Foreign Exchange
|
Sales | $ | (0.2 | ) | $ | (14.4 | ) | SG&A Expense | $ | 0.9 | $ | (4.5 | ) | |||||||||
|
Foreign Exchange
|
Cost of Goods Sold | (1.2 | ) | 5.2 | SG&A Expense | — | 0.6 | |||||||||||||||
|
Foreign Exchange
|
SG&A Expense | (0.6 | ) | (0.7 | ) | SG&A Expense | — | — | ||||||||||||||
|
Commodity
|
Cost of Goods Sold | 8.2 | (7.2 | ) | Cost of Goods Sold | (0.2 | ) | 0.3 | ||||||||||||||
| NOTE 11 | RETIREMENT BENEFIT PLANS |
86
Table of Contents
| millions of dollars | 2010 | 2009 | 2008 | |||||||||||
|
Defined contribution expense
|
$ | 19.2 | $ | 16.6 | $ | 22.1 | ||||||||
|
Defined benefit pension expense
|
19.8 | 33.1 | 19.2 | |||||||||||
|
Other post employment benefit expense
|
17.5 | (48.4 | ) | 1.3 | ||||||||||
|
Total
|
$ | 56.5 | $ | 1.3 | $ | 42.6 | ||||||||
87
Table of Contents
| Pension Benefits |
Other Post
|
|||||||||||||||||||||||||
| 2010 | 2009 | Employment Benefits | ||||||||||||||||||||||||
| millions of dollars | US | Non-US | US | Non-US | 2010 | 2009 | ||||||||||||||||||||
|
Change in projected benefit obligation:
|
||||||||||||||||||||||||||
|
Projected benefit obligation at beginning of year
|
$ | 316.5 | $ | 326.5 | $ | 317.9 | $ | 280.4 | $ | 278.5 | $ | 328.5 | ||||||||||||||
|
Service cost
|
— | 7.4 | 0.3 | 9.9 | 0.8 | 0.8 | ||||||||||||||||||||
|
Interest cost
|
17.5 | 17.6 | 20.7 | 16.5 | 14.5 | 18.6 | ||||||||||||||||||||
|
Plan participants’ contributions
|
— | 0.6 | — | 0.1 | — | — | ||||||||||||||||||||
|
Plan amendments
|
— | 1.2 | (13.5 | ) | — | — | (22.2 | ) | ||||||||||||||||||
|
Curtailment/settlement gain
|
— | — | — | (4.3 | ) | — | (30.9 | ) | ||||||||||||||||||
|
Actuarial (gain) loss
|
19.2 | (0.4 | ) | 24.9 | 19.2 | (7.2 | ) | 11.7 | ||||||||||||||||||
|
Currency translation
|
— | (12.2 | ) | — | 17.2 | — | — | |||||||||||||||||||
|
Other
|
1.1 | — | — | 3.4 | — | — | ||||||||||||||||||||
|
Benefits paid
|
(28.1 | ) | (14.7 | ) | (33.8 | ) | (15.9 | ) | (24.7 | ) | (28.0 | ) | ||||||||||||||
|
Projected benefit obligation at end of year
|
$ | 326.2 | $ | 326.0 | $ | 316.5 | $ | 326.5 | $ | 261.9 | $ | 278.5 | ||||||||||||||
|
Change in plan assets:
|
||||||||||||||||||||||||||
|
Fair value of plan assets at beginning of year
|
$ | 269.1 | $ | 144.0 | $ | 230.8 | $ | 114.0 | ||||||||||||||||||
|
Actual return on plan assets
|
35.6 | 14.2 | 49.1 | 18.0 | ||||||||||||||||||||||
|
Employer contribution
|
10.6 | 14.5 | 23.0 | 16.3 | ||||||||||||||||||||||
|
Plan participants’ contribution
|
— | 0.5 | — | 0.1 | ||||||||||||||||||||||
|
Currency translation
|
— | (3.9 | ) | — | 11.6 | |||||||||||||||||||||
|
Other
|
— | — | — | (0.1 | ) | |||||||||||||||||||||
|
Benefits paid
|
(28.1 | ) | (14.7 | ) | (33.8 | ) | (15.9 | ) | ||||||||||||||||||
|
Fair value of plan assets at end of year
|
$ | 287.2 | $ | 154.6 | $ | 269.1 | $ | 144.0 | ||||||||||||||||||
|
Funded status
|
$ | (39.0 | ) | $ | (171.4 | ) | $ | (47.4 | ) | $ | (182.5 | ) | $ | (261.9 | ) | $ | (278.5 | ) | ||||||||
|
Amounts recognized in the Consolidated Balance Sheets consist
of:
|
||||||||||||||||||||||||||
|
Non-current assets
|
$ | — | $ | 0.5 | $ | — | $ | 0.1 | $ | — | $ | — | ||||||||||||||
|
Current liabilities
|
(0.1 | ) | (8.1 | ) | — | (6.2 | ) | (26.5 | ) | (28.6 | ) | |||||||||||||||
|
Non-current liabilities
|
(38.9 | ) | (163.8 | ) | (47.4 | ) | (176.4 | ) | (235.4 | ) | (249.9 | ) | ||||||||||||||
|
Net amount recognized
|
$ | (39.0 | ) | $ | (171.4 | ) | $ | (47.4 | ) | $ | (182.5 | ) | $ | (261.9 | ) | $ | (278.5 | ) | ||||||||
|
Amounts recognized in accumulated other comprehensive loss
consist of:
|
||||||||||||||||||||||||||
|
Net actuarial loss
|
$ | 145.7 | $ | 37.4 | $ | 147.9 | $ | 44.2 | $ | 120.0 | $ | 136.3 | ||||||||||||||
|
Net prior service cost (credit)
|
(12.1 | ) | 1.4 | (12.8 | ) | 0.2 | (59.5 | ) | (66.4 | ) | ||||||||||||||||
|
Net amount recognized*
|
$ | 133.6 | $ | 38.8 | $ | 135.1 | $ | 44.4 | $ | 60.5 | $ | 69.9 | ||||||||||||||
|
Total accumulated benefit obligation for all plans
|
$ | 326.2 | $ | 316.8 | $ | 316.5 | $ | 317.1 | ||||||||||||||||||
| * | Accumulated other comprehensive loss (“OCI”) shown above does not include our equity investee, NSK-Warner. NSK-Warner had an OCI loss of $6.1 million in 2010 and $9.4 million in 2009. |
88
Table of Contents
| (millions of dollars) | 2010 | 2009 | ||||||
|
Accumulated benefit obligation
|
$ | (634.9 | ) | $ | (630.5 | ) | ||
|
Plan assets
|
432.2 | 409.1 | ||||||
|
Deficiency
|
$ | (202.7 | ) | $ | (221.4 | ) | ||
|
Pension deficiency by country:
|
||||||||
|
United States
|
$ | (39.0 | ) | $ | (47.4 | ) | ||
|
United Kingdom
|
(7.5 | ) | (19.1 | ) | ||||
|
Germany
|
(128.0 | ) | (131.1 | ) | ||||
|
Other
|
(28.2 | ) | (23.8 | ) | ||||
|
Total pension deficiency
|
$ | (202.7 | ) | $ | (221.4 | ) | ||
|
Target
|
||||||||||||
| 2010 | 2009 | Allocation | ||||||||||
|
U.S. Plans:
|
||||||||||||
|
Cash, real estate and other
|
11 | % | 9 | % | 5-15 | % | ||||||
|
Fixed income securities
|
40 | % | 45 | % | 35-55 | % | ||||||
|
Equity securities
|
49 | % | 46 | % | 35-55 | % | ||||||
| 100 | % | 100 | % | |||||||||
|
Non-U.S.
Plans:
|
||||||||||||
|
Cash, real estate and other
|
9 | % | 10 | % | 7-11 | % | ||||||
|
Fixed income securities
|
36 | % | 31 | % | 31-37 | % | ||||||
|
Equity securities
|
55 | % | 59 | % | 54-60 | % | ||||||
| 100 | % | 100 | % | |||||||||
89
Table of Contents
| Pension Benefits |
Other Post
|
|||||||||||||||||||||||||||||||||||
|
(millions of dollars)
|
2010 | 2009 | 2008 | Employment Benefits | ||||||||||||||||||||||||||||||||
| For the Year Ended December 31, | US | Non-US | US | Non-US | US | Non-US | 2010 | 2009 | 2008 | |||||||||||||||||||||||||||
|
Components of net periodic benefit cost:
|
||||||||||||||||||||||||||||||||||||
|
Service cost
|
$ | — | $ | 7.4 | $ | 0.3 | $ | 9.9 | $ | 2.0 | $ | 10.4 | $ | 0.8 | $ | 0.8 | $ | 2.2 | ||||||||||||||||||
|
Interest cost
|
17.5 | 17.6 | 20.7 | 16.5 | 20.9 | 17.3 | 14.5 | 18.6 | 22.7 | |||||||||||||||||||||||||||
|
Expected return on plan assets
|
(19.7 | ) | (9.7 | ) | (16.2 | ) | (9.6 | ) | (28.2 | ) | (13.1 | ) | — | — | — | |||||||||||||||||||||
|
Settlements, curtailments and other
|
— | — | 3.3 | 0.6 | 7.5 | — | — | (61.9 | )* | (8.7 | ) | |||||||||||||||||||||||||
|
Amortization of unrecognized prior service benefit
|
(0.7 | ) | — | (0.5 | ) | — | — | — | (6.9 | ) | (13.2 | ) | (25.0 | ) | ||||||||||||||||||||||
|
Amortization of unrecognized loss
|
6.6 | 0.8 | 7.3 | 0.8 | 2.3 | 0.1 | 9.1 | 7.3 | 10.1 | |||||||||||||||||||||||||||
|
Net periodic benefit cost (benefit)
|
$ | 3.7 | $ | 16.1 | $ | 14.9 | $ | 18.2 | $ | 4.5 | $ | 14.7 | $ | 17.5 | $ | (48.4 | ) | $ | 1.3 | |||||||||||||||||
| * | Note: In the year ended December 31, 2009, the other post employment benefits settlement/curtailment of $61.9 million, in the table above, was offset by a $34.0 million cost to settle, resulting in a net pre-tax gain of $27.9 million. Excluding the $61.9 million settlement/curtailment gain, the Company’s 2009 other post employment benefit expense was $13.5 million. |
| percent | 2010 | 2009 | ||||||||||
|
U.S. pension plans:
|
||||||||||||
|
Discount rate
|
5.17 | 5.75 | ||||||||||
|
Rate of compensation increase
|
3.50 | 3.50 | ||||||||||
|
U.S. other post employment plans:
|
||||||||||||
|
Discount rate
|
4.75 | 5.50 | ||||||||||
|
Rate of compensation increase
|
N/A | N/A | ||||||||||
|
Non-U.S.
pension plans:
|
||||||||||||
|
Discount rate
|
5.37 | 5.43 | ||||||||||
|
Rate of compensation increase
|
2.80 | 2.57 | ||||||||||
90
Table of Contents
| percent | 2010 | 2009 | 2008 | |||||||||||
|
U.S. pension plans
|
||||||||||||||
|
Discount rate
|
5.75 | 7.09 | 6.50 | |||||||||||
|
Rate of compensation increase
|
3.50 | 3.50 | 3.50 | |||||||||||
|
Expected return on plan assets
|
7.50 | 7.50 | 8.75 | |||||||||||
|
U.S. other post employment plans
|
||||||||||||||
|
Discount rate
|
5.50 | 7.00 | 6.50 | |||||||||||
|
Rate of compensation increase
|
N/A | N/A | N/A | |||||||||||
|
Expected return on plan assets
|
N/A | N/A | N/A | |||||||||||
|
Non-U.S.
pension plans
|
||||||||||||||
|
Discount rate
|
5.47 | 5.72 | 5.42 | |||||||||||
|
Rate of compensation increase
|
2.75 | 2.77 | 3.10 | |||||||||||
|
Expected return on plan assets
|
7.12 | 7.10 | 7.05 | |||||||||||
| Pension Benefits | Other Post Employment Benefits | |||||||||||||||||
|
W/o Medicare
|
With Medicare
|
|||||||||||||||||
|
millions of dollars
|
Part D
|
|
||||||||||||||||
| Year | U.S. | Non-U.S. | Reimbursements | Reimbursements | ||||||||||||||
|
2011
|
$ | 27.1 | $ | 15.4 | $ | 28.0 | $ | 27.1 | ||||||||||
|
2012
|
26.5 | 14.3 | 27.4 | 26.6 | ||||||||||||||
|
2013
|
26.2 | 15.3 | 26.4 | 25.5 | ||||||||||||||
|
2014
|
25.2 | 16.9 | 25.5 | 24.7 | ||||||||||||||
|
2015
|
24.4 | 17.1 | 24.6 | 23.8 | ||||||||||||||
|
2016-2020
|
114.1 | 96.5 | 109.7 | 106.4 | ||||||||||||||
| One Percentage Point | ||||||||||
| millions of dollars | Increase | Decrease | ||||||||
|
Effect on other post employment benefit obligation
|
$ | 18.0 | $ | (16.0 | ) | |||||
|
Effect on total service and interest cost components
|
$ | 0.9 | $ | (0.8 | ) | |||||
91
Table of Contents
| NOTE 12 | STOCK INCENTIVE PLANS |
|
Year Ended
|
||||||||||||
| December 31, | ||||||||||||
| (millions), except per share data | 2010 | 2009 | 2008 | |||||||||
|
Earnings before income taxes and noncontrolling interest
|
$ | 0.1 | $ | 6.6 | $ | 12.2 | ||||||
|
Net earnings
|
$ | — | $ | 5.1 | $ | 9.1 | ||||||
|
Per share — basic
|
$ | — | $ | 0.04 | $ | 0.08 | ||||||
|
Per share — diluted
|
$ | — | $ | 0.04 | $ | 0.08 | ||||||
|
Weighted
|
||||||||||||||||
|
Weighted
|
Average
|
Aggregate
|
||||||||||||||
|
Average
|
Remaining
|
Intrinsic
|
||||||||||||||
|
Shares
|
Exercise
|
Contractual
|
Value
|
|||||||||||||
| (thousands) | Price | Life (in years) | (In millions) | |||||||||||||
|
Outstanding at January 1, 2008
|
6,331 | $ | 27.75 | 7.7 | $ | 130.8 | ||||||||||
|
Exercised
|
(366 | ) | 23.82 | $ | 8.3 | |||||||||||
|
Forfeited
|
(167 | ) | 32.58 | |||||||||||||
|
Outstanding at December 31, 2008
|
5,798 | $ | 27.86 | 6.7 | $ | 6.0 | ||||||||||
|
Exercised
|
(381 | ) | $ | 23.89 | $ | 3.4 | ||||||||||
|
Forfeited
|
(240 | ) | $ | 32.16 | ||||||||||||
|
Outstanding at December 31, 2009
|
5,177 | $ | 27.98 | 5.8 | $ | 29.7 | ||||||||||
|
Exercised
|
(1,888 | ) | $ | 26.73 | $ | 50.3 | ||||||||||
|
Forfeited
|
(36 | ) | $ | 33.95 | ||||||||||||
|
Outstanding at December 31, 2010
|
3,253 | $ | 28.64 | 4.9 | $ | 142.2 | ||||||||||
|
Options exercisable at December 31, 2010
|
3,253 | $ | 28.64 | 4.9 | $ | 142.2 | ||||||||||
92
Table of Contents
| Options Outstanding | ||||||||||||||||||||||
|
Weighted-Average
|
Options Exercisable | |||||||||||||||||||||
|
Number
|
Remaining
|
Number
|
||||||||||||||||||||
|
Outstanding
|
Contractual
|
Weighted-Average
|
Exercisable
|
Weighted-Average
|
||||||||||||||||||
| Range of Exercise Prices | (Thousands) | Life (Years) | Exercise Price | (Thousands) | Exercise Price | |||||||||||||||||
|
$12.07 - 16.52
|
319 | 0.2 | $ | 14.27 | 319 | $ | 14.27 | |||||||||||||||
|
$22.15 - 34.95
|
2,934 | 4.7 | $ | 30.21 | 2,934 | $ | 30.21 | |||||||||||||||
| 3,253 | 4.9 | $ | 28.64 | 3,253 | $ | 28.64 | ||||||||||||||||
|
Year Ended
|
||||||||||||||
| December 31, | ||||||||||||||
| (millions of dollars) | 2010 | 2009 | 2008 | |||||||||||
|
Proceeds from stock options — gross
|
$ | 55.4 | $ | 9.4 | $ | 14.1 | ||||||||
|
Tax benefit (loss)
|
11.7 | (0.7 | ) | 3.0 | ||||||||||
|
Proceeds from stock options — net
|
$ | 67.1 | $ | 8.7 | $ | 17.1 | ||||||||
|
Year Ended
|
||||||||||||||
| December 31, | ||||||||||||||
| (millions), except per share data | 2010 | 2009 | 2008 | |||||||||||
|
Earnings before income taxes and noncontrolling interest
|
$ | 18.9 | $ | 14.8 | $ | 9.6 | ||||||||
|
Net earnings
|
$ | 14.7 | $ | 11.4 | $ | 7.2 | ||||||||
|
Per share — basic
|
$ | 0.13 | $ | 0.10 | $ | 0.06 | ||||||||
|
Per share — diluted
|
$ | 0.11 | $ | 0.10 | $ | 0.06 | ||||||||
93
Table of Contents
|
Shares
|
||||||||
|
Subject to
|
Weighted
|
|||||||
|
Restriction
|
Average
|
|||||||
| (Thousands) | Price | |||||||
|
Nonvested at January 1, 2008
|
280.9 | $ | 42.90 | |||||
|
Granted
|
412.4 | 46.43 | ||||||
|
Vested
|
(14.6 | ) | 30.14 | |||||
|
Forfeited
|
(17.2 | ) | 46.41 | |||||
|
Nonvested at December 31, 2008
|
661.5 | $ | 45.29 | |||||
|
Granted
|
1,044.0 | 20.61 | ||||||
|
Vested
|
(23.5 | ) | 51.03 | |||||
|
Forfeited
|
(134.9 | ) | 29.79 | |||||
|
Nonvested at December 31, 2009
|
1,547.1 | $ | 29.90 | |||||
|
Granted
|
603.0 | 36.16 | ||||||
|
Vested
|
(188.4 | ) | 44.80 | |||||
|
Forfeited
|
(91.1 | ) | 27.10 | |||||
|
Nonvested at December 31, 2010
|
1,870.6 | $ | 30.55 | |||||
| 2010 | 2009 | 2008 | ||||||||||
|
Expense (millions of dollars)
|
$ | 23.9 | $ | 10.7 | $ | 4.3 | ||||||
|
Number of shares*
|
104,205 | 269,896 | 287,816 | |||||||||
| * | Shares are issued in February of the following year. |
94
Table of Contents
| NOTE 13 | OTHER COMPREHENSIVE INCOME (LOSS) |
| (millions of dollars) | 2010 | 2009 | ||||||||
|
Foreign currency translation adjustments
|
$ | 147.1 | $ | 210.6 | ||||||
|
Market value of hedge instruments
|
(44.8 | ) | (31.2 | ) | ||||||
|
Defined benefit post employment plans
|
(158.1 | ) | (165.9 | ) | ||||||
|
Unrealized gain on
available-for-sale
securities
|
1.2 | — | ||||||||
|
Comprehensive loss attributable to the noncontrolling interest
|
0.9 | 1.0 | ||||||||
|
Accumulated other comprehensive income (loss)
|
$ | (53.7 | ) | $ | 14.5 | |||||
| (millions of dollars) | 2010 | 2009 | 2008 | |||||||||||
|
Foreign currency translation adjustments
|
$ | (63.5 | ) | $ | 54.8 | $ | (88.6 | ) | ||||||
|
Market value change of hedge instruments
|
(20.5 | ) | 63.3 | (56.8 | ) | |||||||||
|
Income taxes
|
6.9 | (18.2 | ) | 19.3 | ||||||||||
|
Net foreign currency translation and hedge instruments adjustment
|
(77.1 | ) | 99.9 | (126.1 | ) | |||||||||
|
Unrealized gain (loss) on
available-for-sale
securities
|
1.2 | — | (1.4 | ) | ||||||||||
|
Defined benefit post employment plans
|
23.9 | (13.1 | ) | (104.5 | ) | |||||||||
|
Income taxes
|
(16.1 | ) | 9.7 | 29.8 | ||||||||||
|
Net defined benefit post employment plans
|
7.8 | (3.4 | ) | (74.7 | ) | |||||||||
|
Change in accumulated other comprehensive income (loss)
|
(68.1 | ) | 96.5 | (202.2 | ) | |||||||||
|
Net earnings (loss) attributable to BorgWarner Inc.
|
377.4 | 27.0 | (35.6 | ) | ||||||||||
|
Comprehensive income (loss)
|
309.3 | 123.5 | (237.8 | ) | ||||||||||
|
Comprehensive income (loss) attributable to noncontrolling
interest*
|
(0.1 | ) | 3.9 | (10.8 | ) | |||||||||
|
Comprehensive income (loss) attributable to BorgWarner Inc.
|
$ | 309.2 | $ | 127.4 | $ | (248.6 | ) | |||||||
| * | Refer to Note 1, “Summary of Significant Accounting Policies” for implementation of ASC Topic 810. |
| NOTE 14 | CONTINGENCIES |
95
Table of Contents
96
Table of Contents
97
Table of Contents
98
Table of Contents
| (millions of dollars) | 2010 | 2009 | ||||||||
|
Assets:
|
||||||||||
|
Prepayments and other current assets
|
$ | 25.8 | $ | 24.9 | ||||||
|
Other non-current assets
|
24.8 | 25.0 | ||||||||
|
Total insurance assets
|
$ | 50.6 | $ | 49.9 | ||||||
|
Liabilities:
|
||||||||||
|
Accounts payable and accrued expenses
|
$ | 25.8 | $ | 24.9 | ||||||
|
Other non-current liabilities
|
24.8 | 25.0 | ||||||||
|
Total accrued liability
|
$ | 50.6 | $ | 49.9 | ||||||
| NOTE 15 | LEASES AND COMMITMENTS |
| (millions of dollars) | ||||||
|
2011
|
$ | 9.3 | ||||
|
2012
|
7.6 | |||||
|
2013
|
6.7 | |||||
|
2014
|
5.9 | |||||
|
2015
|
5.5 | |||||
|
After 2015
|
8.0 | |||||
|
Total minimum lease payments
|
$ | 43.0 | ||||
| NOTE 16 | EARNINGS (LOSS) PER SHARE |
99
Table of Contents
100
Table of Contents
| (millions of dollars, except per share amounts) | 2010 | 2009 | 2008* | |||||||||||
|
Basic earnings (loss) per share:
|
||||||||||||||
|
Net earnings (loss) attributable to BorgWarner Inc.
|
$ | 377.4 | $ | 27.0 | $ | (35.6 | ) | |||||||
|
Weighted average shares of common stock outstanding
|
114.155 | 116.522 | 116.007 | |||||||||||
|
Basic earnings (loss) per share of common stock
|
$ | 3.31 | $ | 0.23 | $ | (0.31 | ) | |||||||
|
Diluted earnings (loss) per share:
|
||||||||||||||
|
Net earnings (loss) attributable to BorgWarner Inc.
|
$ | 377.4 | $ | 27.0 | $ | (35.6 | ) | |||||||
|
Adjustment for net interest expense on convertible notes
|
20.4 | — | — | |||||||||||
|
Diluted net earnings (loss) attributable to BorgWarner Inc.
|
$ | 397.8 | $ | 27.0 | $ | (35.6 | ) | |||||||
|
Weighted average shares of common stock outstanding
|
114.155 | 116.522 | 116.007 | |||||||||||
|
Effect of 3.50% convertible notes
|
11.389 | — | — | |||||||||||
|
Effect of warrant
|
1.464 | — | — | |||||||||||
|
Effect of stock-based compensation
|
2.567 | 0.417 | — | |||||||||||
|
Total dilutive effect on weighted average shares of common stock
outstanding
|
15.420 | 0.417 | — | |||||||||||
|
Weighted average shares of common stock outstanding including
dilutive shares
|
129.575 | 116.939 | 116.007 | |||||||||||
|
Diluted earnings (loss) per share of common stock
|
$ | 3.07 | $ | 0.23 | $ | (0.31 | ) | |||||||
|
Total anti-dilutive shares
|
||||||||||||||
|
3.50% convertible notes
|
— | 11.389 | — | |||||||||||
|
Bond hedge
|
2.836 | 0.034 | — | |||||||||||
|
Stock-based compensation
|
— | 2.711 | 1.578 | |||||||||||
|
Total anti-dilutive shares
|
2.836 | 14.134 | 1.578 | |||||||||||
| * | The Company had a loss for the year ended December 31, 2008. As a result, diluted loss per share is the same as basic loss per share in the period, as any dilutive securities would reduce the loss per share. |
| NOTE 17 | RESTRUCTURING |
101
Table of Contents
| Employee Related and Other Costs | ||||||||||||||||||
| (millions of dollars) | Drivetrain | Engine | Corporate | Total | ||||||||||||||
|
Balance at January 1, 2008
|
$ | 9.1 | — | — | $ | 9.1 | ||||||||||||
|
Provision
|
18.8 | 34.5 | 1.3 | 54.6 | ||||||||||||||
|
Cash Payments
|
(6.0 | ) | (4.5 | ) | (0.6 | ) | (11.1 | ) | ||||||||||
|
Translation Adjustment
|
(0.9 | ) | (0.7 | ) | — | (1.6 | ) | |||||||||||
|
Balance at December 31, 2008
|
$ | 21.0 | $ | 29.3 | $ | 0.7 | $ | 51.0 | ||||||||||
|
Provision
|
6.0 | 4.6 | 3.4 | 14.0 | ||||||||||||||
|
Cash Payments
|
(22.8 | ) | (23.4 | ) | (2.0 | ) | (48.2 | ) | ||||||||||
|
Translation Adjustment
|
0.3 | 0.4 | — | 0.7 | ||||||||||||||
|
Balance at December 31, 2009
|
$ | 4.5 | $ | 10.9 | $ | 2.1 | $ | 17.5 | ||||||||||
|
Cash Payments
|
(3.6 | ) | (6.4 | ) | (2.1 | ) | (12.1 | ) | ||||||||||
|
Translation Adjustment
|
(0.1 | ) | (0.7 | ) | — | (0.8 | ) | |||||||||||
|
Balance at December 31, 2010
|
$ | 0.8 | $ | 3.8 | $ | — | $ | 4.6 | ||||||||||
| NOTE 18 | RECENT TRANSACTIONS |
102
Table of Contents
| (millions of dollars) | ||||||
|
Receivables, net
|
$ | 54.3 | ||||
|
Inventories, net
|
44.7 | |||||
|
Property, plant and equipment, net
|
45.0 | |||||
|
Goodwill
|
74.1 | |||||
|
Other intangible assets, net of tax
|
31.1 | |||||
|
Accounts payable and accrued expenses
|
(81.5 | ) | ||||
|
Other assets and liabilities, net
|
(9.3 | ) | ||||
|
Assumed debt
|
(10.8 | ) | ||||
|
Net cash consideration
|
$ | 147.6 | ||||
103
Table of Contents
104
Table of Contents
| (millions of dollars) | ||||||
|
Domination and Profit Transfer Agreement Obligation at
December 31, 2008
|
$ | 44.0 | ||||
|
Shares Purchased During the Year Ended December 31,
2009
|
(46.6 | ) | ||||
|
Share Resolution to €73.39 per Share
|
0.9 | |||||
|
Translation Adjustment
|
1.7 | |||||
|
Domination and Profit Transfer Agreement Obligation at
December 31, 2009
|
$ | — | ||||
|
Percentage
|
Amount
|
|||||||||
| Year | Acquired | Paid | ||||||||
|
2005
|
69.4 | % | $ | 477.2 | (a) | |||||
|
2007
|
12.8 | % | 138.8 | (b) | ||||||
|
2008
|
13.4 | % | 136.8 | (b) | ||||||
|
2009
|
4.4 | % | 46.6 | (b) | ||||||
|
Total
|
100.0 | % | $ | 799.4 | ||||||
| (a) | The Company’s payment of $477.2 million has been reflected as an Investing activity in the Consolidated Statements of Cash Flows for the year ended December 31, 2005. | |
| (b) | The Company’s payments of $46.6 million, $136.8 million and $138.8 million have been reflected as a Financing activity in the Consolidated Statements of Cash Flows for the year ended December 31, 2009, 2008 and 2007, respectively. |
| NOTE 19 | REPORTING SEGMENTS AND RELATED INFORMATION |
105
Table of Contents
| Net Sales |
Long-lived
|
|||||||||||||||||||||||||
|
Inter-
|
Year-End
|
Depr./
|
Asset
|
|||||||||||||||||||||||
| (millions of dollars) | Customers | Segment | Net | Assets | Amort. | Expenditures (b) | ||||||||||||||||||||
|
2010 Segment Information
|
||||||||||||||||||||||||||
|
Engine
|
$ | 4,041.4 | $ | 19.4 | $ | 4,060.8 | $ | 3,277.7 | $ | 184.4 | $ | 181.3 | ||||||||||||||
|
Drivetrain
|
1,611.4 | — | 1,611.4 | 1,230.5 | 63.6 | 83.5 | ||||||||||||||||||||
|
Inter-segment eliminations
|
— | (19.4 | ) | (19.4 | ) | — | — | — | ||||||||||||||||||
|
Total
|
5,652.8 | — | 5,652.8 | 4,508.2 | 248.0 | 264.8 | ||||||||||||||||||||
|
Corporate(a)
|
— | — | — | 1,046.8 | 4.9 | 11.8 | ||||||||||||||||||||
|
Consolidated
|
$ | 5,652.8 | $ | — | $ | 5,652.8 | $ | 5,555.0 | (a) | $ | 252.9 | $ | 276.6 | |||||||||||||
| Net Sales |
Long-lived
|
|||||||||||||||||||||||||
|
Inter-
|
Year-End
|
Depr./
|
Asset
|
|||||||||||||||||||||||
| (millions of dollars) | Customers | Segment | Net | Assets | Amort. | Expenditures (b) | ||||||||||||||||||||
|
2009 Segment Information
|
||||||||||||||||||||||||||
|
Engine
|
$ | 2,868.3 | $ | 14.9 | $ | 2,883.2 | $ | 2,812.8 | $ | 188.7 | $ | 115.6 | ||||||||||||||
|
Drivetrain
|
1,093.5 | — | 1,093.5 | 1,104.1 | 65.9 | 44.6 | ||||||||||||||||||||
|
Inter-segment eliminations
|
— | (14.9 | ) | (14.9 | ) | — | — | — | ||||||||||||||||||
|
Total
|
3,961.8 | — | 3,961.8 | 3,916.9 | 254.6 | 160.2 | ||||||||||||||||||||
|
Corporate(a)
|
— | — | — | 894.5 | 6.3 | 11.8 | ||||||||||||||||||||
|
Consolidated
|
$ | 3,961.8 | $ | — | $ | 3,961.8 | $ | 4,811.4 | (a) | $ | 260.9 | $ | 172.0 | |||||||||||||
| Net Sales |
Long-lived
|
|||||||||||||||||||||||||
|
Inter-
|
Year-End
|
Depr./
|
Asset
|
|||||||||||||||||||||||
| (millions of dollars) | Customers | Segment | Net | Assets | Amort. | Expenditures (b) | ||||||||||||||||||||
|
2008 Segment Information
|
||||||||||||||||||||||||||
|
Engine
|
$ | 3,837.5 | $ | 24.0 | $ | 3,861.5 | $ | 3,065.3 | $ | 199.4 | $ | 231.0 | ||||||||||||||
|
Drivetrain
|
1,426.4 | — | 1,426.4 | 1,211.8 | 78.6 | 112.2 | ||||||||||||||||||||
|
Inter-segment eliminations
|
— | (24.0 | ) | (24.0 | ) | — | — | — | ||||||||||||||||||
|
Total
|
5,263.9 | — | 5,263.9 | 4,277.1 | 278.0 | 343.2 | ||||||||||||||||||||
|
Corporate(a)
|
— | — | — | 366.9 | 8.8 | 26.5 | ||||||||||||||||||||
|
Consolidated
|
$ | 5,263.9 | $ | — | $ | 5,263.9 | $ | 4,644.0 | (a) | $ | 286.8 | $ | 369.7 | |||||||||||||
| (a) | Corporate assets include cash, equity in affiliates’, investments and advances and deferred income taxes. The December 31, 2009 and 2008 assets are net of trade receivables securitized and sold to third parties. | |
| (b) | Long-lived asset expenditures include capital expenditures and tooling outlays. |
106
Table of Contents
| (millions of dollars) | 2010 | 2009 | 2008 | |||||||||||
|
Engine
|
$ | 537.9 | $ | 219.8 | $ | 394.9 | ||||||||
|
Drivetrain
|
137.0 | (13.5 | ) | (4.9 | ) | |||||||||
|
Adjusted EBIT
|
674.9 | 206.3 | 390.0 | |||||||||||
|
Muncie closure retiree obligation net gain
|
— | (27.9 | ) | — | ||||||||||
|
Environmental litigation settlement
|
28.0 | — | — | |||||||||||
|
BERU-Eichenauer equity investment gain
|
(8.0 | ) | — | — | ||||||||||
|
Corporate, including equity in affiliates’ earnings and
stock-based compensation
|
111.0 | 111.3 | 60.0 | |||||||||||
|
Restructuring expense
|
— | 50.3 | 127.5 | |||||||||||
|
Goodwill impairment charge
|
— | — | 156.8 | |||||||||||
|
Interest income
|
(2.8 | ) | (2.5 | ) | (7.1 | ) | ||||||||
|
Interest expense and finance charges
|
68.8 | 57.2 | 38.8 | |||||||||||
|
Earnings before income taxes and noncontrolling interest
|
477.9 | 17.9 | 14.0 | |||||||||||
|
Provision (benefit) for income taxes
|
81.7 | (18.5 | ) | 33.3 | ||||||||||
|
Net earnings (loss)
|
396.2 | 36.4 | (19.3 | ) | ||||||||||
|
Net earnings attributable to the noncontrolling interest, net of
tax
|
18.8 | 9.4 | 16.3 | |||||||||||
|
Net earnings (loss) attributable to BorgWarner Inc.
|
$ | 377.4 | $ | 27.0 | $ | (35.6 | ) | |||||||
| Net sales | Long-Lived Assets | |||||||||||||||||||||||||
| (millions of dollars) | 2010 | 2009 | 2008 | 2010 | 2009 | 2008 | ||||||||||||||||||||
|
United States
|
$ | 1,451.1 | $ | 1,090.4 | $ | 1,499.6 | $ | 466.6 | $ | 469.4 | $ | 529.3 | ||||||||||||||
|
Europe:
|
||||||||||||||||||||||||||
|
Germany
|
1,839.9 | 1,419.9 | 1,948.4 | 447.5 | 500.0 | 546.7 | ||||||||||||||||||||
|
Hungary
|
418.3 | 292.4 | 398.2 | 53.0 | 58.4 | 55.7 | ||||||||||||||||||||
|
France
|
318.7 | 229.5 | 244.3 | 63.0 | 72.9 | 84.2 | ||||||||||||||||||||
|
Other Europe
|
546.1 | 282.9 | 431.8 | 173.7 | 138.1 | 142.9 | ||||||||||||||||||||
|
Total Europe
|
3,123.0 | 2,224.7 | 3,022.7 | 737.2 | 769.4 | 829.5 | ||||||||||||||||||||
|
South Korea
|
358.0 | 212.4 | 251.8 | 94.8 | 69.1 | 63.1 | ||||||||||||||||||||
|
China
|
330.6 | 184.1 | 131.1 | 104.9 | 66.1 | 55.1 | ||||||||||||||||||||
|
Other foreign
|
390.1 | 250.2 | 358.7 | 139.1 | 116.3 | 109.2 | ||||||||||||||||||||
|
Total
|
$ | 5,652.8 | $ | 3,961.8 | $ | 5,263.9 | $ | 1,542.6 | $ | 1,490.3 | $ | 1,586.2 | ||||||||||||||
107
Table of Contents
| 2010 | 2009 | |||||||||||||||||||||||||||||||||||||||||
| Quarter Ended | Mar-31 | Jun-30 | Sep-30 | Dec-31 | Year | Mar-31 | Jun-30 | Sep-30 | Dec-31 | Year | ||||||||||||||||||||||||||||||||
|
Net sales
|
$ | 1,286.8 | $ | 1,421.7 | $ | 1,410.9 | $ | 1,533.4 | $ | 5,652.8 | $ | 819.5 | $ | 916.2 | $ | 1,027.8 | $ | 1,198.3 | $ | 3,961.8 | ||||||||||||||||||||||
|
Cost of sales
|
1,048.3 | 1,146.3 | 1,137.6 | 1,227.3 | 4,559.5 | 739.9 | 800.0 | 876.0 | 985.1 | 3,401.0 | ||||||||||||||||||||||||||||||||
|
Gross profit
|
238.5 | 275.4 | 273.3 | 306.1 | 1,093.3 | 79.6 | 116.2 | 151.8 | 213.2 | 560.8 | ||||||||||||||||||||||||||||||||
|
Selling, general and administrative expenses
|
130.3 | 137.8 | 150.2 | 148.3 | 566.6 | 74.1 | 115.4 | 125.9 | 144.4 | 459.8 | ||||||||||||||||||||||||||||||||
|
Restructuring expense
|
— | — | — | — | — | — | 50.3 | — | — | 50.3 | ||||||||||||||||||||||||||||||||
|
Other (income) expense
|
1.6 | 20.3 | 0.1 | 0.4 | 22.4 | — | — | (1.6 | ) | 1.5 | (0.1 | ) | ||||||||||||||||||||||||||||||
|
Operating income (loss)
|
106.6 | 117.3 | 123.0 | 157.4 | 504.3 | 5.5 | (49.5 | ) | 27.5 | 67.3 | 50.8 | |||||||||||||||||||||||||||||||
|
Equity in affiliates’ earnings, net of tax
|
(9.3 | ) | (10.0 | ) | (10.5 | ) | (9.8 | ) | (39.6 | ) | (0.2 | ) | (4.8 | ) | (6.5 | ) | (10.3 | ) | (21.8 | ) | ||||||||||||||||||||||
|
Interest income
|
(0.6 | ) | (0.6 | ) | (0.6 | ) | (1.0 | ) | (2.8 | ) | (0.5 | ) | (0.7 | ) | (0.5 | ) | (0.8 | ) | (2.5 | ) | ||||||||||||||||||||||
|
Interest expense and finance charges
|
14.2 | 14.2 | 18.4 | 22.0 | 68.8 | 19.1 | 9.0 | 13.0 | 16.1 | 57.2 | ||||||||||||||||||||||||||||||||
|
Earnings (loss) before income taxes and noncontrolling interest
|
102.3 | 113.7 | 115.7 | 146.2 | 477.9 | (12.9 | ) | (53.0 | ) | 21.5 | 62.3 | 17.9 | ||||||||||||||||||||||||||||||
|
Provision (benefit) for income taxes
|
20.9 | 26.0 | 4.2 | 30.6 | 81.7 | (6.6 | ) | (19.1 | ) | 1.5 | 5.7 | (18.5 | ) | |||||||||||||||||||||||||||||
|
Net earnings (loss)
|
81.4 | 87.7 | 111.5 | 115.6 | 396.2 | (6.3 | ) | (33.9 | ) | 20.0 | 56.6 | 36.4 | ||||||||||||||||||||||||||||||
|
Net earnings attributable to the noncontrolling interest, net of
tax
|
5.2 | 4.9 | 4.8 | 3.9 | 18.8 | 0.7 | 2.0 | 2.8 | 3.9 | 9.4 | ||||||||||||||||||||||||||||||||
|
Net earnings (loss) attributable of BorgWarner Inc.
|
76.2 | (1) | 82.8 | (2) | 106.7 | (3) | $ | 111.7 | $ | 377.4 | $ | (7.0 | )(4) | $ | (35.9 | )(5) | $ | 17.2 | $ | 52.7 | (6) | $ | 27.0 | |||||||||||||||||||
|
Earnings (loss) per share — basic
|
$ | 0.65 | $ | 0.72 | $ | 0.95 | $ | 1.00 | $ | 3.31 | $ | (0.06 | )* | $ | (0.31 | )* | $ | 0.15 | $ | 0.45 | $ | 0.23 | ||||||||||||||||||||
|
Earnings (loss) per share — diluted
|
$ | 0.63 | ** | $ | 0.68 | ** | $ | 0.87 | ** | $ | 0.89 | ** | $ | 3.07 | ** | $ | (0.06 | )* | $ | (0.31 | )* | $ | 0.15 | $ | 0.45 | $ | 0.23 | |||||||||||||||
108
Table of Contents
| * | The Company had a loss for the quarters ended March 31, 2009 and June 30, 2009. As a result, diluted loss per share is the same as basic loss per share in each period, as any dilutive securities would reduce the loss per share. |
| ** | The Company’s diluted earnings per share for each quarter in 2010 and the year ended December 31, 2010 includes the impact of the Company’s 3.50% convertible notes and associated warrants. Refer to Note 16, “Earnings (Loss) Per Share”, for further information on our diluted earnings calculation. |
| (1) | The Company’s first quarter 2010 results were impacted by the following: |
| • | $2.5 million Medicare Part D tax adjustment |
| (2) | The Company’s second quarter 2010 results were impacted by the following: |
| • | $8.0 million BERU-Eichenauer Equity investment gain. | |
| • | $28.0 million Environmental litigation settlement. |
| (3) | The Company’s third quarter 2010 results were impacted by the following: |
| • | $21.2 million foreign tax credit valuation allowance reversal. |
| (4) | The Company’s first quarter 2009 results were impacted by the following: |
| • | $4.8 million charge related to the adoption of Topic 805. | |
| • | $27.9 million net gain related to retiree obligations resulting from the closure of the Muncie, Indiana, Drivetrain facility. | |
| • | $11.4 million net loss from interest rate derivative agreements. |
| (5) | The Company’s second quarter 2009 results were impacted by the following: |
| • | $50.3 million of restructuring expenses, including $9.0 million for employee termination benefits, $36.3 million of asset impairment and $5.0 million of other charges. | |
| • | $6.6 million net gain from interest rate derivative agreement. |
| (6) | The Company’s fourth quarter 2009 results were impacted by the following: |
| • | $3.1 million tax benefit related to an ASC Topic 740 adjustment. |
109
Table of Contents
| Item 9A. | Controls and Procedures |
110
Table of Contents
| Item 9B. | Other Information |
| Item 10. | Directors, Executive Officers and Corporate Governance |
| Item 11. | Executive Compensation |
| Item 12. | Security Ownership and Certain Beneficial Owners and Management and Related Stockholders Matters |
| Item 13. | Certain Relationships and Related Transactions and Director Independence |
| Item 14. | Principal Accountant Fees and Services |
| Item 15. | Exhibits and Financial Statement Schedules |
111
Table of Contents
| By: |
/s/
Timothy
M. Manganello
|
| Signature | Title | |||
|
/s/
Timothy
M. Manganello
|
Chairman and Chief Executive Officer
(Principal Executive Officer) and Director |
|||
|
/s/
Robin
J. Adams
|
Executive Vice President, Chief Financial
Officer and Chief Administrative Officer (Principal Financial Officer) and Director |
|||
|
/s/
Ronald
T. Hundzinski
|
Vice President and Controller
(Principal Accounting Officer) |
|||
|
/s/
Phyllis
O. Bonanno
|
Director | |||
|
/s/
David
T. Brown
|
Director | |||
|
/s/
Jan
Carlson
|
Director | |||
|
/s/
Dennis
C. Cuneo
|
Director | |||
|
/s/
Jere
A. Drummond
|
Director | |||
|
/s/
John
R. McKernan
|
Director | |||
|
/s/
Alexis
P. Michas
|
Director | |||
|
/s/
Ernest
J. Novak, Jr.
|
Director | |||
|
/s/
Richard
O. Schaum
|
Director | |||
|
/s/
Thomas
T. Stallkamp
|
Director | |||
Table of Contents
|
Exhibit
|
||||
| Number | Description | |||
| 3 | .1/4.1 | Restated Certificate of Incorporation of the Company (incorporated by reference to Exhibit No. 3.1 of the Company’s Quarterly Report on Form 10-Q for the quarter ended March 31, 2008). | ||
| 3 | .2/4.2 | Amended and Restated By-Laws of registrant (incorporated by reference to Exhibit 3.2/4.2 to the Company’s Registration Statement on Form S-3 (no. 333-163928). | ||
| 3 | .3 | Certificate of Designation, Preferences and Rights of Series A Junior Participating Preferred Stock (incorporated by reference to Exhibit 3.3 of the Company’s Annual Report on Form 10-K for the year ended December 31, 1999). | ||
| 3 | .4 | Certificate of Ownership and Merger Merging BorgWarner Inc. into Borg-Warner Automotive, Inc. (incorporated by reference to Exhibit 99.1 of the Company’s Quarterly Report on Form 10-Q for the quarter ended March 31, 2000). | ||
| 4 | .3 | Indenture, dated as of February 15, 1999 between Borg-Warner Automotive, Inc. and The First National Bank of Chicago (incorporated by reference to Exhibit No. 4.1 to Amendment No. 1 to Registration Statement No. 333-66879). | ||
| 4 | .4 | Indenture, dated as of September 23, 1999 between Borg-Warner Automotive, Inc. and Chase Manhattan Trust Company, National Association, as trustee, (incorporated by reference to Exhibit No. 4.1 to the Company’s Current Report on Form 8-K filed September 16, 2010). | ||
| 4 | .5 | Form of First Supplemental Indenture between the registrant and The Bank of New York Trust Company, N.A., as the indenture trustee (incorporated by reference to Exhibit 4.1 to the Company’s Current Report on Form 8-K filed on October 30, 2006). | ||
| 4 | .6 | Second Supplemental Indenture dated April 9, 2009 between the registrant and The Bank of New York Mellon Trust Company, N.A., as the indenture trustee (incorporated by reference to Exhibit 4.1 to the Company’s Current Report on Form 8-K filed April 9, 2009). | ||
| 4 | .7 | Third Supplemental Indenture dated as of September 16, 2010 between the registrant and The Bank of New York Mellon Trust Company, N.A., as the indenture trustee (incorporated by reference to Exhibit 4.2 to the Company’s Current Report on Form 8-K filed September 16, 2010). | ||
| 10 | .1 | Form of Convertible Note Hedge confirmation between BorgWarner Inc. and Bank of America, N.A. (incorporated by reference to Exhibit 10.1 to the Company’s Current Report on Form 8-K filed April 9, 2009). | ||
| 10 | .2 | Form of Warrant confirmation between BorgWarner Inc. and Bank of America, N.A. (incorporated by reference to Exhibit 10.2 to the Company’s Current Report on Form 8-K filed April 9, 2009). | ||
| 10 | .3 | Form of Convertible Note Hedge confirmation between BorgWarner Inc. and Morgan Stanley & Co. International Plc (represented by Morgan Stanley & Co. Incorporated, as its agent) (incorporated by reference to Exhibit 10.3 to the Company’s Current Report on Form 8-K filed April 9, 2009). | ||
| 10 | .4 | Form of Warrant confirmation between BorgWarner Inc. and Morgan Stanley & Co. International Plc (represented by Morgan Stanley & Co. Incorporated, as its agent) (incorporated by reference to Exhibit 10.4 to the Company’s Current Report on Form 8-K filed April 9, 2009). | ||
| 10 | .5 | Credit Agreement dated as of March 31, 2010, among BorgWarner Inc., as borrower, the Administrative Agent named therein, the Co-Syndication Agents named therein, the Documentation Agent named therein and the Lenders that are parties thereto (incorporated by reference to Exhibit 10.1 to the Company’s Current Report on Form 8-K filed April 6, 2010). | ||
| 10 | .6 | Form of Subsidiary Guaranty (incorporated by reference to Exhibit 10.2 to the Company’s Current Report on Form 8-K filed April 6, 2010). | ||
A-1
Table of Contents
|
Exhibit
|
||||
| Number | Description | |||
| 10 | .7 | Receivables Sale Agreement dated as of December 21, 2009 among BorgWarner Emissions Systems Inc., BorgWarner Morse TEC Inc., BorgWarner Powdered Metals Inc., BorgWarner Thermal Systems Inc., BorgWarner TorqTransfer Systems Inc., BorgWarner Transmission Systems Inc., BorgWarner Turbo Systems Inc., and BWA Receivables Corporation (incorporated by reference to Exhibit 10.1 to the Company’s Current Report on Form 8-K filed December 28, 2009). | ||
| 10 | .8 | Receivables Purchase Agreement dated as of December 21, 2009 among BWA Receivables Corporation, as seller, BorgWarner Inc., as the collection agent, the purchasers from time to time party thereto, and Wachovia Bank, National Association, as administrative agent (incorporated by reference to Exhibit 10.2 to the Company’s Current Report on Form 8-K filed December 28, 2009). | ||
| 10 | .9 | Amendment No. 1 to Receivables Purchase Agreement dated as of September 8, 2010, among BWA Receivables Corporation, as seller, BorgWarner Inc., as the collection agent, and Wells Fargo Bank, N.A. (successor by merger to Wachovia Bank, National Association), as administrative agent (incorporated by reference to Exhibit 10.1 to the Company’s Current Report Form 8-K filed October 27, 2010). | ||
| †10 | .10 | BorgWarner Inc. 1993 Stock Incentive Plan, as amended (incorporated by reference to Exhibit No. 10.22 to the Company’s Annual Report on Form 10-K for the year ended December 31, 2008). | ||
| †10 | .11 | BorgWarner Inc. Amended and Restated 2004 Stock Incentive Plan (incorporated by reference to Exhibit 10.1 to the Company’s Quarterly Report on Form 10-Q for the quarter ended March 31, 2009). | ||
| †10 | .12 | First Amendment to the BorgWarner Inc. Amended and Restated 2004 Stock Incentive Plan (as amended and restated effective April 29, 2009) (incorporated by reference to Exhibit 99.2 to the Company’s Current Report on Form 8-K filed November 13, 2009). | ||
| †10 | .13 | Form of BorgWarner Inc. 2004 Stock Incentive Plan Performance Share Award Agreement (incorporated by reference to Exhibit 10.1 of the Company’s Current Report on Form 8-K filed February 7, 2005). | ||
| †10 | .14 | Form of BorgWarner Inc. Amended and Restated 2004 Stock Incentive Plan Performance Units Award Agreement (incorporated by reference to Exhibit 10.1 of the Company’s Current Report on Form 8-K filed March 31, 2009). | ||
| †10 | .15 | Form of BorgWarner Inc. Amended and Restated 2004 Stock Incentive Plan Restricted Stock Agreement for Employees (incorporated by reference to Exhibit 10.1 of the Company’s Current Report on Form 8-K filed February 12, 2008). | ||
| †10 | .16 | Form of First Amendment to Restricted Stock Agreement (incorporated by reference to Exhibit 99.3 to the Company’s Current Report on Form 8-K filed November 13, 2009). | ||
| †10 | .17 | Form of BorgWarner Inc. 2004 Stock Incentive Plan Non-Qualified Stock Option Award Agreement (incorporated by reference to Exhibit No. 99.1 to the Company’s Current Report on Form 8-K filed July 27, 2005). | ||
| †10 | .18 | Borg-Warner Automotive, Inc. Executive Stock Performance Plan, Revised and Re-approved February 2, 2000 (incorporated by reference to Appendix B of the Company’s Proxy Statement dated March 22, 2000 for its 2000 Annual Meeting of Stockholders). | ||
| †10 | .19 | BorgWarner Inc. 2005 Executive Incentive Plan (as amended and restated) (incorporated by reference to Exhibit No. 10.19 to the Company’s Annual Report on Form 10-K for the year ended December 31, 2008). | ||
| †10 | .20 | Borg-Warner Automotive, Inc. Management Incentive Bonus Plan dated January 1, 1994 (as amended and restated) (incorporated by reference to Exhibit No. 10.11 to the Company’s Annual Report on Form 10-K for the year ended December 31, 2008). | ||
| †10 | .21 | Borg-Warner Automotive, Inc. Retirement Savings Excess Benefit Plan dated January 27, 1993 (as amended and restated) (incorporated by reference to Exhibit No. 10.12 to the Company’s Annual Report on Form 10-K for the year ended December 31, 2008). | ||
A-2
Table of Contents
|
Exhibit
|
||||
| Number | Description | |||
| †10 | .22 | Borg-Warner Automotive, Inc. Retirement Savings Plan dated January 27, 1993 as amended and restated (incorporated by reference to Exhibit 10.18 to the Company’s Annual Report on Form 10-K for the year ended December 31, 1995). | ||
| †10 | .23 | BorgWarner Inc. Board of Directors Deferred Compensation Plan dated April 18, 1995 (as amended and restated) (incorporated by reference to Exhibit No. 10.14 to the Company’s Annual Report on Form 10-K for the year ended December 31, 2008). | ||
| †10 | .24 | First Amendment dated as of November 22, 2010 to BorgWarner Inc. Board of Directors Deferred Compensation Plan as filed herewith.* | ||
| †10 | .25 | Form of Amended and Restated Change of Control Employment Agreement for Executive Officers (incorporated by reference to Exhibit No. 10.15 to the Company’s Annual Report on Form 10-K for the year ended December 31, 2008). | ||
| †10 | .26 | Form of Amended and Restated Change of Control Employment Agreement for Executive Officers (incorporated by reference to Exhibit No. 99.1 to the Company’s Current Report on Form 8-K filed November 13, 2009). | ||
| †10 | .27 | BorgWarner Inc. 2004 Deferred Compensation Plan (as amended and restated) (incorporated by reference to Exhibit No. 10.2 to the Company’s Annual Report on Form 10-K for the year ended December 31, 2008). | ||
| 10 | .28 | Distribution and Indemnity Agreement dated January 27, 1993 between Borg-Warner Automotive, Inc. and Borg-Warner Security Corporation (incorporated by reference to Exhibit No. 10.2 to the Company’s Registration Statement on Form S-3 (no. 33-64934)). | ||
| 10 | .29 | Tax Sharing Agreement dated January 27, 1993 between Borg-Warner Automotive, Inc. and Borg-Warner Security Corporation (incorporated by reference to Exhibit No. 10.3 to the Company’s Registration Statement on Form S-3 (no. 33-64934)). | ||
| 10 | .30 | Assignment of Trademarks and License Agreement (incorporated by reference to Exhibit No. 10.0 of the Company’s Quarterly Report on Form 10-Q for the quarter ended September 30, 1994). | ||
| 10 | .31 | Amendment to Assignment of Trademarks and License Agreement (incorporated by reference to Exhibit No. 10.23 of the Company’s Form 10-K for the year ended December 31, 1998). | ||
| 10 | .32 | Domination and Profit Transfer Agreement dated March 7, 2008 between BorgWarner Germany GmbH and BERU AG (incorporated by reference to Exhibit 10.1 to the quarterly report filed on Form 10-Q for the quarter ended June 30, 2008). | ||
| 21 | .1 | Subsidiaries of the Company.* | ||
| 23 | .1 | Independent Registered Public Accounting Firm’s Consent.* | ||
| 31 | .1 | Rule 13a-14(a)/15d-14(a) Certification by Principal Executive Officer.* | ||
| 31 | .2 | Rule 13a-14(a)/15d-14(a) Certification by Principal Financial Officer.* | ||
| 32 | .1 | Section 1350 Certifications.* | ||
| * | Filed herewith. | |
| † | Indicates a management contract or compensatory plan or arrangement required to be filed pursuant to Item 14(c). |
A-3