|
|
|
|
|
|
|
|
|
|
|
|
|
|
|
|
|
|
|
|
|
|
|
|
|
|
|
|
|
|
|
|
|
|
|
|
|
|
|
|
|
|
|
|
|
|
|
|
UNITED STATES
|
|
SECURITIES AND EXCHANGE COMMISSION
|
|
Washington, D.C. 20549
|
|
FORM 10-K
|
|
☒
|
ANNUAL REPORT PURSUANT TO SECTION 13 OR 15(d) OF THE SECURITIES EXCHANGE ACT OF 1934
|
|
For the fiscal year ended
December 31, 2014
|
|
|
☐
|
TRANSITION REPORT PURSUANT TO SECTION 13 OR 15(d) OF THE SECURITIES EXCHANGE ACT OF 1934
|
|
For the transition period from _________to________
|
|
|
Commission File Number:
001-36448
|
|
|
Bankwell Financial Group, Inc.
|
|
|
(Exact Name of Registrant as specified in its Charter)
|
|
|
Connecticut
|
20-8251355
|
|
|
(State or other jurisdiction of
|
(I.R.S. Employer
|
|
|
Incorporation or organization)
|
Identification No.)
|
|
220 Elm Street
|
|
New Canaan, Connecticut 06840
|
|
(203) 652-0166
|
|
(Address, including zip code, and telephone number, including area code, of registrant’s principal executive offices)
|
|
Large
accelerated filer ☐
|
Accelerated filer
þ
|
|
|
Non-accelerated
filer ☐ (Do not check if a smaller reporting company)
|
Smaller
reporting company ☐
|
|
|
1
|
||
|
25
|
||
|
39
|
||
|
39
|
||
|
39
|
||
|
39
|
||
|
39
|
||
|
41
|
||
|
45
|
||
|
79
|
||
|
83
|
||
|
144
|
||
|
144
|
||
|
145
|
||
|
145
|
||
|
145
|
||
|
145
|
||
|
145
|
||
|
145
|
||
|
146
|
||
|
147
|
|
●
|
local, regional and national business or economic conditions may differ from those expected;
|
|
|
●
|
we are subject to credit risk and could incur losses in our loan portfolio;
|
|
|
●
|
our allowance for loan losses may not be adequate to absorb loan losses;
|
|
|
●
|
changes in real estate values could also increase our credit risk;
|
|
|
●
|
we could experience changes in our key management personnel;
|
|
|
●
|
we may not be able to successfully execute our management team’s strategic initiatives;
|
|
|
●
|
our ability to successfully execute our growth initiatives such as branch openings and acquisitions;
|
|
|
●
|
volatility and direction of market interest rates;
|
|
|
●
|
increased competition within our market area may limit our growth and profitability;
|
|
|
●
|
economic, market, operational, liquidity, credit and interest rate risks associated with our business;
|
|
|
●
|
the effects of and changes in trade, monetary and fiscal policies and laws, including the Federal Reserve Board’s interest rate policies;
|
|
|
●
|
changes in accounting policies and practices, as may be adopted by regulatory agencies, the Public Accounting Oversight Board or the Financial Accounting Standards Board;
|
|
|
●
|
changes in law and regulatory requirements (including those concerning taxes, banking, securities and insurance);
|
|
|
●
|
further governmental intervention in the U.S. financial system; and
|
|
|
●
|
difficulties and delays in integrating Quinnipiac Bank and Trust Company.
|
| 1 |
| 2 |
|
●
|
Responsive, Customer-Centric Products and Services and a Community Focus.
We offer a broad array of products and services which we customize to allow us to focus on building long-term relationships with our customers through high-quality, responsive and personal customer service. By focusing on the entire customer relationship, we build the trust of our customers which leads to long-term relationships and generates our organic growth. In addition, we are committed to meeting the needs of the communities that we serve. Our employees are involved in many civic and community organizations which we support through sponsorships. As a result, customers and potential customers within our market know about us and frequently interact with our employees which allows us to develop long-term customer relationships without extensive advertising.
|
|
|
●
|
Strategic Acquisitions.
To complement our organic growth, we focus on strategic acquisitions in or around our existing markets that further our objectives. We believe there are many banking institutions that continue to face credit challenges, capital constraints and liquidity issues and that lack the scale and management expertise to manage the increasing regulatory burden and will likely need to partner with an institution like ours. On March 31, 2014, we entered into a merger agreement with Quinnipiac. Quinnipiac had one branch located in Hamden, Connecticut and a second branch in the neighboring town of North Haven. The transaction closed on October 1, 2014 and Quinnipiac merged with and into Bankwell Bank. As we evaluate potential acquisitions, we will continue to seek acquisitions that provide meaningful financial benefits, long-term organic growth opportunities and expense reductions, without compromising our risk profile.
|
|
|
●
|
Utilization of Efficient and Scalable Infrastructure.
We employ a systematic and calculated approach to increasing our profitability and improving our efficiencies. We recently upgraded our operating infrastructure particularly in the areas of technology, data processing, compliance and personnel. We believe that our scalable infrastructure provides us with an efficient operating platform from which to grow in the near term, and without incurring significant incremental noninterest expenses, while continuing to deliver our high-quality, responsive customer service, which will enhance our ability to grow and increase our returns.
|
|
|
●
|
Disciplined Focus on Risk Management.
Effective risk management is a key component of our strong corporate culture. We use our strong risk management infrastructure to monitor our existing loan and investment securities portfolios, support operational decision-making and improve our ability to generate earning assets with strong credit quality. To maintain our strong credit quality, we use a comprehensive underwriting process and we seek to maintain a diversified loan portfolio and a conservative investment securities portfolio. Board-approved policies contain approval authorities, as appropriate, and are reviewed at least annually. We have a Risk Management Steering Committee comprised of executive officers who oversee new business initiatives and other activities that warrant oversight of risk and related mitigants. Internal review procedures are performed regarding anti-money laundering and consumer compliance requirements. Our Chief Risk Officer reports directly to the Chair of our Audit Committee.
|
| 3 |
|
●
|
Our
Market.
Our current market has been defined as the greater Fairfield County area, which is part of the second most
affluent metropolitan statistical area in the United States, the Bridgeport-Stamford-Norwalk, Connecticut MSA, according to
the U.S. Department of Commerce. In addition, our current market has expanded to New Haven County Connecticut with the
acquisition of Quinnipiac. The Stamford market area includes numerous affluent suburban communities of professionals who work
and commute into New York City, approximately 50 miles from our headquarters, and many small to mid-sized businesses which
support these communities. Fairfield County is the wealthiest county in Connecticut, with a 2009 – 2013 median household
income of $82,283 according to estimates from United States Census Bureau. We believe that this market has economic and
competitive dynamics that are favorable to executing our growth strategy.
|
|
|
●
|
Experienced and Respected Management Team with a Proven and Successful Track Record.
Our executive management team, is comprised of seasoned professionals with significant banking experience, a history of high performance at local financial institutions and success in identifying, acquiring and integrating financial institutions. Our senior management team includes Christopher Gruseke, Chief Executive Officer (since February 2015) Heidi S. DeWyngaert, Executive Vice President, Chief Lending Officer (ten years with us), Ernest J. Verrico, Sr., Executive Vice President, Chief Financial Officer (five years with us), Gail E.D. Brathwaite, Executive Vice President, Chief Operating Officer (two years with us), Diane Knetzger, Senior Vice President, Director of Marketing (ten years with us), Christine A. Chivily, Senior Vice President and Chief Credit Officer (two years with us) and Michele Johnson, Senior Vice President and Chief Risk Officer (six years with us).
|
|
|
●
|
Dedicated Board of Directors with Strong Community Involvement.
Our board of directors is comprised of a group of local business leaders who understand the need for strong community banks that focus on serving the financial needs of their customers. One of our directors, Frederick R. Afragola was instrumental in our organization and growth. Mr. Afragola was the Chief Executive Officer and President of The Bank of New Canaan from its opening in 2002 until his retirement in 2008 and played an integral role in building our foundation and guiding our growth. The interests of our executive management team and directors are aligned with those of our shareholders through common stock ownership. By capitalizing on the close community ties and business relationships of our executive management team and directors, we are positioned to continue taking advantage of the market opportunity present in our primary market.
|
|
|
●
|
Strong Capital Position.
At December 31, 2014, we had a 10.47% tangible common equity ratio, and the Bank had a 11.12% tier 1 leverage ratio and a 12.47% tier 1 risk-based ratio. Our ability to attract capital has facilitated our growth and is an integral component to the execution of our business plan.
|
|
|
●
|
Scalable Operating Platform.
We provide banking technology, including remote deposit capture, internet banking and mobile banking, to provide our customers with maximum flexibility and create a scalable platform to accommodate our future growth aspirations. We believe that our advanced technology combined with responsive and personal service provides our customers with a superior banking experience.
|
| 4 |
| 5 |
|
At December 31,
|
||||||||||||||||||||||||
|
2014
|
2013
|
2012
|
||||||||||||||||||||||
|
Percent of
|
Percent of
|
Percent of
|
||||||||||||||||||||||
|
Loan
|
Loan
|
Loan
|
||||||||||||||||||||||
|
(In thousands)
|
Amount
|
Portfolio
|
Amount
|
Portfolio
|
Amount
|
Portfolio
|
||||||||||||||||||
|
Real estate loans:
|
||||||||||||||||||||||||
|
Residential
|
$ | 175,031 | 18.83 | % | $ | 155,874 | 24.66 | % | $ | 144,288 | 27.22 | % | ||||||||||||
|
Commercial
|
521,181 | 56.06 | 316,533 | 50.08 | 284,763 | 53.72 | ||||||||||||||||||
|
Construction
|
63,229 | 6.80 | 51,545 | 8.16 | 33,148 | 6.26 | ||||||||||||||||||
|
Home equity
|
18,166 | 1.95 | 13,892 | 2.20 | 11,030 | 2.08 | ||||||||||||||||||
| 777,607 | 83.64 | 537,844 | 85.10 | 473,229 | 89.28 | |||||||||||||||||||
|
Commercial business
|
149,259 | 16.05 | 93,566 | 14.80 | 56,764 | 10.71 | ||||||||||||||||||
|
Consumer
|
2,896 | 0.31 | 602 | 0.10 | 57 | 0.01 | ||||||||||||||||||
|
Total loans
|
$ | 929,762 | 100.00 | % | $ | 632,012 | 100.00 | % | $ | 530,050 | 100.00 | % | ||||||||||||
| 6 |
|
At December 31,
|
||||||||||||||||
| 2011 | 2010 | |||||||||||||||
|
Percent of
|
Percent of
|
|||||||||||||||
|
Loan
|
Loan
|
|||||||||||||||
|
(In thousands)
|
Amount
|
Portfolio
|
Amount
|
Portfolio
|
||||||||||||
|
Real estate loans:
|
||||||||||||||||
|
Residential
|
$ | 104,754 | 28.37 | % | $ | 104,053 | 36.08 | % | ||||||||
|
Commercial
|
173,951 | 47.10 | 111,271 | 38.58 | ||||||||||||
|
Construction
|
40,422 | 10.95 | 38,072 | 13.20 | ||||||||||||
|
Home equity
|
14,815 | 4.01 | 16,657 | 5.77 | ||||||||||||
| 333,942 | 90.43 | 270,053 | 93.63 | |||||||||||||
|
Commercial business
|
35,041 | 9.49 | 17,713 | 6.14 | ||||||||||||
|
Consumer
|
311 | 0.08 | 659 | 0.23 | ||||||||||||
|
Total loans
|
$ | 369,294 | 100.00 | % | $ | 288,425 | 100.00 | % | ||||||||
| 7 |
| 8 |
| 9 |
| 10 |
| 11 |
| 12 |
| 13 |
| 14 |
| 15 |
| 16 |
| 17 |
| 18 |
| 19 |
|
|
●
|
Truth-In-Savings Act, requiring certain disclosures for consumer deposit accounts;
|
|
|
●
|
Right to Financial Privacy Act, which imposes a duty to maintain confidentiality of consumer financial records and prescribes procedures for complying with administrative subpoenas of financial records;
|
|
|
●
|
Electronic Funds Transfer Act and Regulation E issued by the Federal Reserve to implement that act, which govern automatic deposits to and withdrawals from deposit accounts and customers’ rights and liabilities arising from the use of automated teller machines and other electronic banking services; and
|
|
|
●
|
Rules and regulations of the various federal banking agencies charged with the responsibility of implementing these federal laws.
|
|
|
●
|
A lending test, to evaluate the bank’s record of making loans in its assessment areas;
|
|
|
●
|
An investment test, to evaluate the bank’s record of investing in community development projects, affordable housing, and programs benefiting low or moderate income individuals and businesses; and
|
|
|
●
|
A service test, to evaluate the bank’s delivery of services through its branches, ATMs, and other offices.
|
| 20 |
|
|
●
|
Federal Truth-In-Lending Act, governing disclosures of credit terms to consumer borrowers;
|
|
|
●
|
Home Mortgage Disclosure Act of 1975, requiring financial institutions to provide information to enable the public and public officials to determine whether a financial institution is fulfilling its obligation to help meet the housing needs of the community it serves;
|
|
|
●
|
Equal Credit Opportunity Act, prohibiting discrimination on the basis of race, creed, or other prohibited factors in extending credit;
|
|
|
●
|
Fair Credit Reporting Act of 1978, governing the use of consumer credit reports and the provision of information to credit reporting agencies;
|
|
|
●
|
Fair Debt Collection Act, governing the manner in which consumer debts may be collected by collection agencies;
|
|
|
●
|
Real Estate Settlement Procedures Act, governing closing costs and settlement procedures and disclosures to consumers related thereto;
|
|
|
●
|
Servicemembers Civil Relief Act of 2004, governing the repayment terms of, and property rights underlying, secured obligations of persons in military service; and
|
|
|
●
|
Rules and regulations of the various federal agencies charged with the responsibility of implementing these federal laws.
|
| 21 |
| 22 |
| 23 |
| 24 |
| 25 |
| 26 |
| 27 |
| 28 |
|
|
●
|
Our ability to build and maintain long-term customer relationships while ensuring high ethical standards and safe and sound banking practices;
|
|
|
●
|
The scope, relevance and pricing of products and services that we offer;
|
|
|
●
|
Customer satisfaction with our products and personalized services;
|
|
|
●
|
Industry and general economic trends; and
|
|
|
●
|
Our ability to keep pace with technological advances and to invest in new technology.
|
| 29 |
|
|
●
|
incurring time and expense associated with identifying and evaluating potential acquisitions and negotiating potential transactions, resulting in our attention being diverted from the operation of our existing business;
|
|
|
●
|
using inaccurate estimates and judgments to evaluate credit, operations, management and market risks with respect to the target institution or assets;
|
| 30 |
|
|
●
|
intense competition from other banking organizations and other inquirers for acquisitions;
|
|
|
●
|
potential exposure to unknown or contingent liabilities of banks and businesses we acquire;
|
|
|
●
|
the time and expense required to integrate the operations and personnel of the combined businesses;
|
|
|
●
|
experiencing higher operating expenses relative to operating income from the new operations;
|
|
|
●
|
creating an adverse short-term effect on our results of operations;
|
|
|
●
|
losing key employees and customers as a result of an acquisition that is poorly received;
|
|
|
●
|
significant problems relating to the conversion of the financial and customer data of the entity;
|
|
|
●
|
inconsistencies in standards, controls, procedures and policies that adversely affect our ability to maintain relationships with clients, customers, depositors and employees or to achieve the anticipated benefits of the acquisition;
|
|
|
●
|
diversion of our management’s attention and resources;
|
|
|
●
|
integration of acquired customers into our financial and customer product systems; or
|
|
|
●
|
risks of impairment to goodwill or other than temporary impairment.
|
| 31 |
| 32 |
| 33 |
| 34 |
| 35 |
| 36 |
| 37 |
| 38 |
| 39 |
|
December 31, 2014
|
December 31, 2013
|
|||||||||||||||||||||||
|
Cash
|
Cash | |||||||||||||||||||||||
|
Sales Price
|
Dividends |
Sales Price
|
Dividends | |||||||||||||||||||||
|
Quarter Ended
|
High
|
Low
|
Declared
|
High
|
Low
|
Declared
|
||||||||||||||||||
|
March 31
|
$ | 22.00 | $ | 18.80 | $ | - | $ | 22.00 | $ | 13.50 | $ | - | ||||||||||||
|
June 30
|
17.40 | 16.55 | - | 23.00 | 20.00 | - | ||||||||||||||||||
|
September 30
|
18.99 | 18.75 | - | 23.00 | 19.00 | - | ||||||||||||||||||
|
December 31
|
21.00 | 20.60 | - | 22.00 | 19.00 | - | ||||||||||||||||||
| 40 |
|
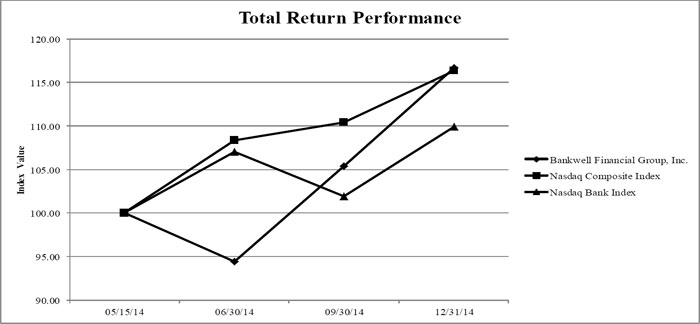
Index
|
05/15/14
|
06/30/14
|
09/30/14
|
12/31/14
|
|
Bankwell Financial Group, Inc.
|
100.00
|
94.44
|
105.39
|
116.67
|
|
Nasdaq Composite Index
|
100.00
|
108.33
|
110.42
|
116.39
|
|
Nasdaq Bank Index
|
100.00
|
107.01
|
101.91
|
109.89
|
| 41 |
| At or For the Years Ended December 31, | ||||||||||||||||||||
|
(Dollars in thousands, except per share data)
|
2014
|
2013
|
2012
|
2011
|
2010
|
|||||||||||||||
|
Statements of Income:
|
||||||||||||||||||||
|
Interest income
|
$ | 35,589 | $ | 28,092 | $ | 24,397 | $ | 20,587 | $ | 16,877 | ||||||||||
|
Interest expense
|
3,929 | 2,765 | 3,192 | 2,870 | 3,209 | |||||||||||||||
|
Net interest income
|
31,660 | 25,327 | 21,205 | 17,717 | 13,668 | |||||||||||||||
|
Provision for loan losses
|
2,152 | 585 | 1,821 | 1,049 | 1,311 | |||||||||||||||
|
Net interest income after provision for loan losses
|
29,508 | 24,742 | 19,384 | 16,668 | 12,357 | |||||||||||||||
|
Noninterest income
|
3,041 | 4,723 | 345 | 1,134 | 1,695 | |||||||||||||||
|
Noninterest expense
|
25,812 | 22,120 | 17,858 | 14,601 | 13,331 | |||||||||||||||
|
Income before income tax
|
6,737 | 7,345 | 1,871 | 3,201 | 721 | |||||||||||||||
|
Income tax expense
|
2,169 | 2,184 | 657 | 997 | 214 | |||||||||||||||
|
Net income
|
4,568 | 5,161 | 1,214 | 2,204 | 507 | |||||||||||||||
|
Net income attributable to common shareholders
|
$ | 4,458 | $ | 5,050 | $ | 1,082 | $ | 1,998 | $ | 246 | ||||||||||
|
Per Share Data:
|
||||||||||||||||||||
|
Basic earnings per share
|
$ | 0.78 | $ | 1.46 | $ | 0.39 | $ | 0.72 | $ | 0.10 | ||||||||||
|
Diluted earnings per share
|
0.78 | 1.44 | 0.38 | 0.71 | 0.09 | |||||||||||||||
|
Book value per share (end of period) (a)
|
16.84 | 15.58 | 14.50 | 13.85 | 12.81 | |||||||||||||||
|
Tangible book value per share (end of period) (a) (b)
|
16.35 | 15.46 | 14.50 | 13.85 | 12.81 | |||||||||||||||
|
Shares outstanding (end of period) (a)
|
7,019,620 | 3,754,253 | 2,797,200 | 2,758,200 | 2,756,200 | |||||||||||||||
|
Weighted average shares outstanding - basic
|
5,577,942 | 3,395,779 | 2,767,850 | 2,757,000 | 2,531,000 | |||||||||||||||
|
Weighted average shares outstanding - diluted
|
5,605,512 | 3,451,393 | 2,864,700 | 2,811,000 | 2,588,000 | |||||||||||||||
|
Performance Ratios:
|
||||||||||||||||||||
|
Return on average assets (c)
|
0.52 | % | 0.77 | % | 0.22 | % | 0.50 | % | 0.14 | % | ||||||||||
|
Return on average common shareholders’ equity
|
5.13 | % | 9.68 | % | 2.73 | % | 6.70 | % | 0.75 | % | ||||||||||
|
Return on average shareholders’ equity (c)
|
4.66 | % | 8.17 | % | 2.40 | % | 5.03 | % | 1.33 | % | ||||||||||
|
Average shareholders’ equity to average assets
|
11.14 | % | 9.32 | % | 9.34 | % | 10.01 | % | 10.37 | % | ||||||||||
|
Net interest margin
|
3.84 | % | 3.94 | % | 4.11 | % | 4.27 | % | 4.12 | % | ||||||||||
|
Efficiency ratio (b)
|
69.09 | % | 75.71 | % | 82.76 | % | 78.50 | % | 84.93 | % | ||||||||||
|
Asset Quality Ratios:
|
||||||||||||||||||||
|
Total past due loans to total loans (d)
|
0.86 | % | 0.73 | % | 0.75 | % | 1.01 | % | 0.79 | % | ||||||||||
|
Nonperforming loans to total loans (d)
|
0.36 | % | 0.16 | % | 0.75 | % | 1.01 | % | 0.79 | % | ||||||||||
|
Nonperforming assets to total assets (e)
|
0.39 | % | 0.23 | % | 0.81 | % | 0.78 | % | 0.57 | % | ||||||||||
|
Allowance for loan losses to nonperforming loans
|
323.02 | % | 835.69 | % | 200.84 | % | 171.88 | % | 239.23 | % | ||||||||||
|
Allowance for loan losses to total loans (d)
|
1.17 | % | 1.33 | % | 1.50 | % | 1.74 | % | 1.87 | % | ||||||||||
|
Net
(recoveries) charge-off’s to average loans (d)
|
(0.05 | ) % | 0.03 | % | 0.07 | % | 0.02 | % | 0.09 | % | ||||||||||
|
Statements of Financial Condition:
|
||||||||||||||||||||
|
Total assets
|
$ | 1,099,531 | $ | 779,618 | $ | 610,016 | $ | 477,355 | $ | 395,708 | ||||||||||
|
Gross portfolio loans (d)
|
929,762 | 632,012 | 530,050 | 369,294 | 288,425 | |||||||||||||||
|
Investment securities
|
76,463 | 42,413 | 46,412 | 94,972 | 58,152 | |||||||||||||||
|
Deposits
|
835,439 | 661,545 | 462,081 | 367,115 | 309,137 | |||||||||||||||
|
Borrowings
|
129,000 | 44,000 | 91,000 | 58,000 | 44,000 | |||||||||||||||
|
Total equity
|
129,210 | 69,485 | 51,534 | 49,188 | 40,354 | |||||||||||||||
|
Capital Ratios:
|
||||||||||||||||||||
|
Tier 1 capital to average assets (f)
|
||||||||||||||||||||
|
Bankwell Bank
|
11.12 | % | 7.91 | % | - | % | - | % | - | % | ||||||||||
|
The Bank of New Canaan
|
- | % | - | % | 7.88 | % | 8.71 | % | 8.15 | % | ||||||||||
|
The Bank of Fairfield
|
- | % | - | % | 8.39 | % | 11.30 | % | 13.25 | % | ||||||||||
|
Tier 1 capital to risk-weighted assets (f)
|
||||||||||||||||||||
|
Bankwell Bank
|
12.47 | % | 9.49 | % | - | % | - | % | - | % | ||||||||||
|
The Bank of New Canaan
|
- | % | - | % | 9.09 | % | 11.07 | % | 11.86 | % | ||||||||||
|
The Bank of Fairfield
|
- | % | - | % | 10.80 | % | 13.66 | % | 16.41 | % | ||||||||||
|
Total capital to risk-weighted assets (f)
|
||||||||||||||||||||
|
Bankwell Bank
|
13.55 | % | 10.74 | % | - | % | - | % | - | % | ||||||||||
|
The Bank of New Canaan
|
- | % | - | % | 10.34 | % | 12.33 | % | 13.12 | % | ||||||||||
|
The Bank of Fairfield
|
- | % | - | % | 12.05 | % | 14.91 | % | 17.10 | % | ||||||||||
|
Total shareholders’ equity to total assets
|
11.75 | % | 8.91 | % | 8.45 | % | 10.30 | % | 10.20 | % | ||||||||||
|
Tangible common equity ratio (b)
|
10.47 | % | 7.45 | % | 6.65 | % | 8.00 | % | 8.93 | % | ||||||||||
| (a) |
Excludes preferred stock and unvested restricted stock awards
|
| (b) |
This measure is not a measure recognized under GAAP and is therefore considered to be a non-GAAP financial measure. See “Non-GAAP Financial M easures” for a description of this measure and a reconciliation of this measure to its most directly comparable GAAP measure.
|
| (c) |
Calculated based on net income before preferred stock dividends
|
| (d) | Calculated using the principal amounts outstanding on loans |
| (e) |
Nonperforming assets consist of nonperforming loans and other real estate owned
|
| (f) |
Represents bank ratios. During 2013, The Bank of New Canaan and The Bank of Fairfield were merged into Bankwell Bank.
|
| 42 |
| 43 |
|
Years Ended December 31,
|
||||||||||||
|
2014
|
2013
|
2012
|
||||||||||
|
Efficiency Ratio
|
||||||||||||
|
Noninterest expense
|
$ | 25,812 | $ | 22,120 | $ | 17,858 | ||||||
|
Less: foreclosed real estate expenses
|
36 | 8 | 9 | |||||||||
|
Less: merger and acquisition expenses
|
1,801 | 908 | - | |||||||||
|
Adjusted noninterest expense (numerator)
|
$ | 23,975 | $ | 21,204 | $ | 17,849 | ||||||
|
Net interest income
|
$ | 31,660 | $ | 25,327 | $ | 21,205 | ||||||
|
Noninterest income
|
3,041 | 4,723 | 345 | |||||||||
|
Less: gains (losses) on sales of securities
|
- | 648 | (18 | ) | ||||||||
|
Less: gains on sale of foreclosed real estate
|
- | 64 | - | |||||||||
|
Less: gain on bargain purchase
|
- | 1,333 | - | |||||||||
|
Adjusted operating revenue (denominator)
|
$ | 34,701 | $ | 28,005 | $ | 21,568 | ||||||
|
Efficiency ratio
|
69.09 | % | 75.71 | % | 82.76 | % | ||||||
|
Tangible Common Equity and
|
||||||||||||
|
Tangible Common Equity/Tangible Assets
|
||||||||||||
|
Total shareholders' equity
|
$ | 129,210 | $ | 69,485 | $ | 51,534 | ||||||
|
Less: preferred stock
|
10,980 | 10,980 | 10,980 | |||||||||
|
Common shareholders' equity
|
118,230 | 58,505 | 40,554 | |||||||||
|
Less: Intangible assets
|
3,437 | 481 | - | |||||||||
|
Tangible Common shareholders' equity
|
$ | 114,793 | $ | 58,024 | $ | 40,554 | ||||||
|
Total assets
|
$ | 1,099,531 | $ | 779,618 | $ | 610,016 | ||||||
|
Less: Intangible assets
|
3,437 | 481 | - | |||||||||
|
Tangible assets
|
$ | 1,096,094 | $ | 779,137 | $ | 610,016 | ||||||
|
Tangible common shareholders' equity to tangible assets
|
10.47 | % | 7.45 | % | 6.65 | % | ||||||
|
Tangible Book Value per Share
|
||||||||||||
|
Total shareholders' equity
|
$ | 129,210 | $ | 69,485 | $ | 51,534 | ||||||
|
Less: preferred stock
|
10,980 | 10,980 | 10,980 | |||||||||
|
Common shareholders' equity
|
118,230 | 58,505 | 40,554 | |||||||||
|
Less: Intangible assets
|
3,437 | 481 | - | |||||||||
|
Tangible common shareholders' equity
|
$ | 114,793 | $ | 58,024 | $ | 40,554 | ||||||
|
Common shares issued
|
7,185,482 | 3,876,393 | 2,846,700 | |||||||||
|
Less: shares of unvested restricted stock
|
165,862 | 122,140 | 49,500 | |||||||||
|
Common shares outstanding
|
7,019,620 | 3,754,253 | 2,797,200 | |||||||||
|
Book value per share
|
$ | 16.84 | $ | 15.58 | $ | 14.50 | ||||||
|
Less: effects of intangible assets
|
0.49 | 0.12 | - | |||||||||
|
Tangible Book Value per Common Share
|
$ | 16.35 | $ | 15.46 | $ | 14.50 | ||||||
|
Total Revenue
|
||||||||||||
|
Net Interest income
|
$ | 31,660 | $ | 25,327 | $ | 21,205 | ||||||
|
Add: noninterest income
|
3,041 | 4,723 | 345 | |||||||||
|
Total Revenue
|
34,701 | 30,050 | 21,550 | |||||||||
|
Noninterest income as a percentage of total revenue
|
8.76 | % | 15.72 | % | 1.60 | % | ||||||
|
Return on Average Common Shareholders' Equity
|
||||||||||||
|
Net Income Attributable to Common Shareholders
|
$ | 4,458 | $ | 5,050 | $ | 1,082 | ||||||
|
Total average shareholders' equity
|
$ | 97,921 | $ | 63,142 | $ | 50,572 | ||||||
|
Less: average preferred stock
|
10,980 | 10,980 | 10,980 | |||||||||
|
Average common shareholders' equity
|
$ | 86,941 | $ | 52,162 | $ | 39,592 | ||||||
|
Return on Average Common Shareholders' Equity
|
5.13 | % | 9.68 | % | 2.73 | % | ||||||
| 44 |
| ● | Responsive, customer-centric products and services and a community focus; | |
| ● | Strategic acquisitions; | |
| ● | Utilization of efficient and scalable infrastructure; | |
| ● | Disciplined focus on risk management; and | |
| ● | Organic growth. |
| 45 |
| 46 |
|
Key Financial Measures (a)
|
||||||||||||
|
At or For the Years Ended December 31,
|
||||||||||||
|
(Dollars in thousands, except per share data)
|
2014
|
2013
|
2012
|
|||||||||
|
Selected balance sheet measures:
|
||||||||||||
|
Total assets
|
$ | 1,099,531 | $ | 779,618 | $ | 610,016 | ||||||
|
Gross portfolio loans (b)
|
929,762 | 632,012 | 530,050 | |||||||||
|
Deposits
|
835,439 | 661,545 | 462,081 | |||||||||
|
Borrowings
|
129,000 | 44,000 | 91,000 | |||||||||
|
Total equity
|
129,210 | 69,485 | 51,534 | |||||||||
|
|
||||||||||||
|
Total revenue (c)
|
34,701 | 30,050 | 21,550 | |||||||||
|
Net interest income before provision for loan losses
|
31,660 | 25,327 | 21,205 | |||||||||
|
Income before income tax
|
6,737 | 7,345 | 1,871 | |||||||||
|
Net income
|
4,568 | 5,161 | 1,214 | |||||||||
|
Basic earnings per share
|
0.78 | 1.46 | 0.39 | |||||||||
|
Diluted earnings per share
|
0.78 | 1.44 | 0.38 | |||||||||
|
Other financial measures and ratios:
|
||||||||||||
|
Return on average assets (d)
|
0.52 | % | 0.77 | % | 0.22 | % | ||||||
|
Return on average common shareholders' equity
|
5.13 | % | 9.68 | % | 2.73 | % | ||||||
|
Net interest margin
|
3.84 | % | 3.94 | % | 4.11 | % | ||||||
|
Efficiency ratio (c)
|
69.09 | % | 75.71 | % | 82.76 | % | ||||||
|
Tangible book value per share (end of period) (c) (e)
|
$ | 16.35 | $ | 15.46 | $ | 14.50 | ||||||
|
Net (recoveries) charge-off's to average loans (b)
|
(0.05 | )% | 0.03 | % | 0.07 | % | ||||||
|
Nonperforming assets to total assets (f)
|
0.39 | % | 0.23 | % | 0.81 | % | ||||||
|
Allowance for loan losses to nonperforming loans
|
323.02 | % | 835.69 | % | 200.84 | % | ||||||
|
Allowance for loan losses to total loans (b)
|
1.17 | % | 1.33 | % | 1.50 | % | ||||||
| (a) | We have derived the selected balance sheet measures as of December 31, 2014 and 2013 and the selected statement of income measures for the years ended December 31, 2014, 2013 and 2012 from our audited consolidated financial statements included elsewhere in this annual report. We have derived the selected balance sheet measures as of December 31, 2012 from our audited consolidated statement of financial condition not included in this annual report. Average balances have been computed using daily averages. Our historical results may not be indicative of our results for any future period. |
| (b) | Calculated using the principal amounts outstanding on loans. |
| (c) | This measure is not a measure recognized under GAAP and is therefore considered to be a non-GAAP financial measure. See "Non-GAAP Financial Measures" for a description of this measure and a reconciliation of this measure to its most directly comparable GAAP measure. |
| (d) | Calculated based on net income before preferred stock dividends. |
| (e) | Excludes preferred stock and unvested restricted stock awards. |
| (f) | Nonperforming assets consist of nonperforming loans and other real estate owned. |
| 47 |
| 48 |
| 49 |
| 50 |
2014 Earnings Overview
| 51 |
| 52 |
| 53 |
| 54 |
| Years Ended December 31, | ||||||||||||||||||||||||||||||||||||
| 2014 | 2013 | 2012 | ||||||||||||||||||||||||||||||||||
|
Average
|
Yield /
|
Average
|
Yield /
|
Average
|
Yield /
|
|||||||||||||||||||||||||||||||
|
(Dollars in thousands)
|
Balance
|
Interest
|
Rate
|
Balance
|
Interest
|
Rate
|
Balance
|
Interest
|
Rate
|
|||||||||||||||||||||||||||
|
Assets:
|
||||||||||||||||||||||||||||||||||||
|
Cash and Fed funds sold
|
$ | 49,152 | $ | 127 | 0.26 | % | $ | 35,599 | $ | 84 | 0.24 | % | $ | 16,933 | $ | 35 | 0.21 | % | ||||||||||||||||||
|
Securities (1)
|
61,398 | 2,424 | 3.95 | 40,932 | 1,766 | 4.31 | 56,321 | 2,366 | 4.20 | |||||||||||||||||||||||||||
|
Loans:
|
||||||||||||||||||||||||||||||||||||
|
Commercial real estate
|
378,345 | 18,515 | 4.83 | 299,142 | 15,124 | 5.06 | 236,934 | 12,919 | 5.45 | |||||||||||||||||||||||||||
|
Residential real estate
|
164,598 | 5,911 | 3.59 | 152,498 | 5,577 | 3.66 | 119,960 | 4,826 | 4.02 | |||||||||||||||||||||||||||
|
Construction (2)
|
49,212 | 2,300 | 4.61 | 38,073 | 1,763 | 4.63 | 34,177 | 1,752 | 5.13 | |||||||||||||||||||||||||||
|
Commercial business
|
109,121 | 5,496 | 4.97 | 69,252 | 3,699 | 5.34 | 44,220 | 2,370 | 5.36 | |||||||||||||||||||||||||||
|
Home equity
|
14,529 | 564 | 3.88 | 11,287 | 423 | 3.74 | 12,789 | 465 | 3.64 | |||||||||||||||||||||||||||
|
Consumer
|
1,270 | 81 | 6.35 | 308 | 18 | 5.98 | 80 | 10 | 12.50 | |||||||||||||||||||||||||||
|
Acquired Loan Portfolio Non accrual loans (net of mark)
|
2,707 | 545 | 20.14 | - | - | - | - | - | - | |||||||||||||||||||||||||||
|
Total loans
|
719,782 | 33,412 | 4.59 | 570,560 | 26,604 | 4.66 | 448,160 | 22,342 | 4.99 | |||||||||||||||||||||||||||
|
Federal Home Loan Bank stock
|
5,078 | 73 | 1.45 | 4,624 | 17 | 0.36 | 3,615 | 18 | 0.49 | |||||||||||||||||||||||||||
|
Total earning assets
|
835,410 | $ | 36,036 | 4.25 | % | 651,715 | $ | 28,471 | 4.37 | % | 525,029 | $ | 24,761 | 4.72 | % | |||||||||||||||||||||
|
Other assets
|
43,535 | 17,782 | 16,297 | |||||||||||||||||||||||||||||||||
|
Total assets
|
$ | 878,945 | $ | 669,497 | $ | 541,326 | ||||||||||||||||||||||||||||||
|
Liabilities and shareholders’ equity:
|
||||||||||||||||||||||||||||||||||||
|
Interest -bearing liabilities:
|
||||||||||||||||||||||||||||||||||||
|
NOW
|
$ | 53,041 | 58 | 0.11 | % | $ | 40,554 | 49 | 0.12 | % | $ | 31,490 | 45 | 0.14 | % | |||||||||||||||||||||
|
Money market
|
182,676 | 836 | 0.46 | 116,323 | 498 | 0.45 | 90,342 | 612 | 0.68 | |||||||||||||||||||||||||||
|
Savings
|
91,058 | 302 | 0.33 | 117,388 | 543 | 0.46 | 102,641 | 846 | 0.82 | |||||||||||||||||||||||||||
|
Time
|
238,710 | 2,099 | 0.88 | 158,996 | 1,143 | 0.72 | 122,350 | 864 | 0.71 | |||||||||||||||||||||||||||
|
Total interest-bearing deposits
|
565,485 | 3,295 | 0.58 | 433,261 | 2,233 | 0.43 | 346,823 | 2,367 | 0.56 | |||||||||||||||||||||||||||
|
Borrowed Money
|
65,953 | 634 | 0.96 | 69,912 | 532 | 0.73 | 61,836 | 825 | 1.33 | |||||||||||||||||||||||||||
|
Total interest bearing liabilities
|
631,438 | $ | 3,929 | 0.62 | % | 503,173 | $ | 2,765 | 0.47 | % | 408,659 | $ | 3,192 | 0.66 | % | |||||||||||||||||||||
|
Noninterest-bearing deposits
|
136,748 | 96,009 | 78,453 | |||||||||||||||||||||||||||||||||
|
Other liabilities
|
12,838 | 7,173 | 3,642 | |||||||||||||||||||||||||||||||||
|
Total Liabilities
|
781,024 | 606,355 | 490,754 | |||||||||||||||||||||||||||||||||
|
Shareholders’ equity
|
97,921 | 63,142 | 50,572 | |||||||||||||||||||||||||||||||||
|
Total liabilities and shareholders’
equity
|
$ | 878,945 | $ | 669,497 | $ | 541,326 | ||||||||||||||||||||||||||||||
|
Net interest income (3)
|
$ | 32,107 | $ | 25,706 | $ | 21,569 | ||||||||||||||||||||||||||||||
|
Interest rate spread
|
3.63 | % | 3.90 | % | 4.06 | % | ||||||||||||||||||||||||||||||
|
Net interest margin (4)
|
3.84 | % | 3.94 | % | 4.11 | % | ||||||||||||||||||||||||||||||
|
(1)
|
Average balances and yields for securities are based on amortized cost
|
|
|
(2)
|
Includes commercial and residential real estate construction loans
|
|
|
(3)
|
The adjustment for securities and loans taxable equivalency was $447 thousand, $379 thousand and $364 thousand, respectively, for the years ended December 31, 2014, 2013 and 2012.
|
|
|
(4)
|
Net interest income as a percentage of total earning assets
|
|
| 55 |
| Year Ended | Year Ended | |||||||||||||||||||||||
|
December 31, 2014 vs 2013
|
December 31, 2013 vs 2012
|
|||||||||||||||||||||||
|
Increase (Decrease)
|
Increase (Decrease)
|
|||||||||||||||||||||||
|
(In thousands)
|
Volume
|
Rate
|
Total
|
Volume
|
Rate
|
Total
|
||||||||||||||||||
|
Interest and dividend income:
|
||||||||||||||||||||||||
|
Cash and Fed funds sold
|
$ | 35 | $ | 9 | $ | 44 | $ | 44 | $ | 5 | $ | 49 | ||||||||||||
|
Securities
|
818 | (161 | ) | 657 | (662 | ) | 62 | (600 | ) | |||||||||||||||
|
Loans:
|
||||||||||||||||||||||||
|
Commercial real estate
|
3,904 | (513 | ) | 3,391 | 3,198 | (993 | ) | 2,205 | ||||||||||||||||
|
Residential real estate
|
436 | (102 | ) | 334 | 1,220 | (469 | ) | 751 | ||||||||||||||||
|
Construction
|
520 | 17 | 537 | 189 | (178 | ) | 11 | |||||||||||||||||
|
Commercial business
|
2,026 | (229 | ) | 1,797 | 1,337 | (8 | ) | 1,329 | ||||||||||||||||
|
Home equity
|
125 | 16 | 141 | (56 | ) | 14 | (42 | ) | ||||||||||||||||
|
Consumer
|
61 | 1 | 62 | 16 | (8 | ) | 8 | |||||||||||||||||
|
Acquired Non accrual loans (net of mark)
|
545 | - | 545 | - | - | - | ||||||||||||||||||
|
Total loans
|
7,617 | (810 | ) | 6,807 | 5,904 | (1,642 | ) | 4,262 | ||||||||||||||||
|
Federal Home Loan Bank stock
|
2 | 55 | 57 | 4 | (5 | ) | (1 | ) | ||||||||||||||||
|
Total change in interest and
dividend income
|
8,472 | (907 | ) | 7,565 | 5,290 | (1,580 | ) | 3,710 | ||||||||||||||||
|
Interest expense:
|
||||||||||||||||||||||||
|
Deposits:
|
||||||||||||||||||||||||
|
NOW
|
14 | (5 | ) | 9 | 12 | (8 | ) | 4 | ||||||||||||||||
|
Money market
|
303 | 35 | 338 | 148 | (262 | ) | (114 | ) | ||||||||||||||||
|
Savings
|
(106 | ) | (135 | ) | (241 | ) | 108 | (411 | ) | (303 | ) | |||||||||||||
|
Time
|
662 | 294 | 956 | 263 | 16 | 279 | ||||||||||||||||||
|
Total deposits
|
873 | 189 | 1,062 | 531 | (665 | ) | (134 | ) | ||||||||||||||||
|
Borrowed Money
|
(30 | ) | 132 | 102 | 97 | (390 | ) | (293 | ) | |||||||||||||||
|
Total change in interest expense
|
843 | 321 | 1,164 | 628 | (1,055 | ) | (427 | ) | ||||||||||||||||
|
Change in net interest income
|
$ | 7,629 | $ | (1,228 | ) | $ | 6,401 | $ | 4,662 | $ | (525 | ) | $ | 4,137 | ||||||||||
| 56 |
| Years Ended | 2014/2013 | 2013/2012 | ||||||||||||||||||||||||||
| December 31, |
Change
|
Change
|
||||||||||||||||||||||||||
|
(Dollars in thousands)
|
2014
|
2013
|
2012
|
$ | % | $ | % | |||||||||||||||||||||
|
Gains and fees from sales of loans
|
$ | 1,313 | $ | 2,020 | $ | 18 | $ | (707 | ) | (35 | ) % | $ | 2,002 | 11,122 | % | |||||||||||||
|
Service charges and fees
|
643 | 416 | 314 | 227 | 55 | 102 | 32 | |||||||||||||||||||||
|
Bank owned life insurance
|
497 | 31 | - | 466 | 1,503 | 31 | 100 | |||||||||||||||||||||
|
Net gain on sale of available for sale securities
|
- | 648 | (18 | ) | (648 | ) | (100 | ) | 666 | 3,700 | ||||||||||||||||||
|
Gain (loss) on sale of foreclosed
real estate, net
|
- | 64 | - | (64 | ) | (100 | ) | 64 | 100 | |||||||||||||||||||
|
Gain on bargain purchase
|
- | 1,333 | - | (1,333 | ) | (100 | ) | 1,333 | 100 | |||||||||||||||||||
|
Other
|
588 | 211 | 31 | 377 | 179 | 180 | 581 | |||||||||||||||||||||
|
Total noninterest income
|
$ | 3,041 | $ | 4,723 | $ | 345 | $ | (1,682 | ) | (36 | ) % | $ | 4,378 | 1,269 | % | |||||||||||||
| 57 |
| 58 |
| Years Ended | 2014/2013 | 2013/2012 | ||||||||||||||||||||||||||
| December 31, |
Change
|
Change
|
||||||||||||||||||||||||||
|
(Dollars in thousands)
|
2014
|
2013
|
2012
|
$ | % | $ | % | |||||||||||||||||||||
|
Salaries and employee benefits
|
$ | 13,534 | $ | 11,578 | $ | 9,451 | $ | 1,956 | 17 | % | $ | 2,127 | 23 | % | ||||||||||||||
|
Occupancy and equipment
|
4,422 | 3,420 | 3,004 | 1,002 | 29 | 416 | 14 | |||||||||||||||||||||
|
Merger and acquisition related expenses
|
1,801 | 908 | - | 893 | 98 | 908 | 100 | |||||||||||||||||||||
|
Data processing
|
1,289 | 1,349 | 1,209 | (60 | ) | (4 | ) | 140 | 12 | |||||||||||||||||||
|
Professional services
|
1,194 | 1,595 | 1,546 | (401 | ) | (25 | ) | 49 | 3 | |||||||||||||||||||
|
Marketing
|
674 | 927 | 333 | (253 | ) | (27 | ) | 594 | 178 | |||||||||||||||||||
|
Director fees
|
650 | 330 | 381 | 320 | 97 | (51 | ) | (13 | ) | |||||||||||||||||||
|
FDIC insurance
|
488 | 333 | 365 | 155 | 47 | (32 | ) | (9 | ) | |||||||||||||||||||
|
Amortization of intangibles
|
133 | 18 | - | 115 | 639 | 18 | 100 | |||||||||||||||||||||
|
Foreclosed real estate
|
36 | 8 | 9 | 28 | 350 | (1 | ) | (11 | ) | |||||||||||||||||||
|
Other
|
1,591 | 1,654 | 1,560 | (63 | ) | (4 | ) | 94 | 6 | |||||||||||||||||||
|
Total noninterest expense
|
$ | 25,812 | $ | 22,120 | $ | 17,858 | $ | 3,692 | 17 | % | $ | 4,262 | 24 | % | ||||||||||||||
| 59 |
| 60 |
| 61 |
|
(In thousands)
|
2014
|
2013
|
Change
|
|||||||||||||||||
|
Total
|
%
|
Total
|
%
|
|||||||||||||||||
|
Real estate loans:
|
||||||||||||||||||||
|
Residential
|
$ | 175,031 | 18.83 | % | $ | 155,874 | 24.66 | % | $ | 19,157 | ||||||||||
|
Commercial
|
521,181 | 56.06 | 316,533 | 50.08 | 204,648 | |||||||||||||||
|
Construction
|
63,229 | 6.80 | 51,545 | 8.16 | 11,684 | |||||||||||||||
|
Home equity
|
18,166 | 1.95 | 13,892 | 2.20 | 4,274 | |||||||||||||||
| 777,607 | 83.64 | 537,844 | 85.10 | 239,763 | ||||||||||||||||
|
Commercial business
|
149,259 | 16.05 | 93,566 | 14.80 | 55,693 | |||||||||||||||
|
Consumer
|
2,896 | 0.31 | 602 | 0.10 | 2,294 | |||||||||||||||
|
Total loans
|
$ | 929,762 | 100.00 | % | $ | 632,012 | 100.00 | % | $ | 297,750 | ||||||||||
| 62 |
| December 31, 2014 | ||||||||||||||||
|
Commercial
|
Commercial |
Commercial
|
||||||||||||||
|
(In thousands)
|
Real Estate
|
Construction
|
Business
|
Total
|
||||||||||||
|
Amounts due:
|
||||||||||||||||
|
One Year or less
|
$ | 15,694 | $ | 13,322 | $ | 25,918 | $ | 54,934 | ||||||||
|
After one year:
|
||||||||||||||||
|
One to five years
|
100,506 | 13,224 | 58,834 | 172,564 | ||||||||||||
|
Over five years
|
404,981 | 22,335 | 64,507 | 491,823 | ||||||||||||
|
Total due after one year
|
505,487 | 35,559 | 123,341 | 664,387 | ||||||||||||
|
Total
|
$ | 521,181 | $ | 48,881 | $ | 149,259 | $ | 719,321 | ||||||||
| 63 |
|
December 31, 2014
|
||||||||||||
|
Adjustable
|
Fixed Interest
|
|||||||||||
|
(In thousands)
|
Interest Rate
|
Rate
|
Total
|
|||||||||
|
Commercial Real Estate
|
$ | 209,905 | $ | 295,582 | $ | 505,487 | ||||||
|
Construction
|
3,359 | 32,200 | 35,559 | |||||||||
|
Commercial Business
|
45,484 | 77,857 | 123,341 | |||||||||
|
Total loans due after one year
|
$ | 258,748 | $ | 405,639 | $ | 664,387 | ||||||
| 64 |
| At December 31, | ||||||||||||||||||||
|
(In thousands)
|
2014
|
2013
|
2012
|
2011
|
2010
|
|||||||||||||||
|
Nonaccrual loans:
|
||||||||||||||||||||
|
Real estate loans:
|
||||||||||||||||||||
|
Residential
|
$ | - | $ | 1,003 | $ | 2,137 | $ | 2,166 | $ | 974 | ||||||||||
|
Commercial
|
3,220 | - | 1,817 | 307 | - | |||||||||||||||
|
Construction
|
- | - | - | 1,175 | 1,300 | |||||||||||||||
|
Home equity
|
- | - | - | 90 | - | |||||||||||||||
|
Commercial business
|
142 | - | - | - | - | |||||||||||||||
|
Total non accrual loans
|
3,362 | 1,003 | 3,954 | 3,738 | 2,274 | |||||||||||||||
|
Property acquired through foreclosure
or repossession, net
|
950 | 829 | 962 | - | - | |||||||||||||||
|
Total nonperforming assets
|
$ | 4,312 | $ | 1,832 | $ | 4,916 | $ | 3,738 | $ | 2,274 | ||||||||||
|
Nonperforming assets to total assets
|
0.39 | % | 0.23 | % | 0.81 | % | 0.78 | % | 0.57 | % | ||||||||||
|
Nonaccrual loans to total loans
|
0.36 | % | 0.16 | % | 0.75 | % | 1.01 | % | 0.79 | % | ||||||||||
|
Total past due loans to total loans
|
0.86 | % | 0.73 | % | 0.75 | % | 1.01 | % | 0.79 | % | ||||||||||
|
Accruing loans 90 days or more past due
|
$ | 1,998 | $ | 3,620 | $ | - | $ | - | $ | - | ||||||||||
| 65 |
| 66 |
|
31-60 Days
|
61-90 Days
|
Greater Than
|
Total Past
|
|||||||||||||
|
(In thousands)
|
Past Due
|
Past Due
|
90 Days
|
Due
|
||||||||||||
|
As of December 31, 2014
|
||||||||||||||||
|
Originated Loans
|
||||||||||||||||
|
Residential real estate
|
$ | - | $ | - | $ | - | $ | - | ||||||||
|
Commercial real estate
|
- | - | 3,436 | 3,436 | ||||||||||||
|
Commercial business
|
- | - | - | - | ||||||||||||
|
Consumer
|
- | - | - | - | ||||||||||||
|
Total originated loans
|
- | - | 3,436 | 3,436 | ||||||||||||
|
Acquired Loans
|
||||||||||||||||
|
Residential real estate
|
339 | - | 294 | 633 | ||||||||||||
|
Commercial real estate
|
685 | 677 | 836 | 2,198 | ||||||||||||
|
Construction
|
- | - | 835 | 835 | ||||||||||||
|
Home Equity
|
- | 40 | - | 40 | ||||||||||||
|
Commercial business
|
178 | 386 | 305 | 869 | ||||||||||||
|
Consumer
|
3 | - | - | 3 | ||||||||||||
|
Total acquired loans
|
1,205 | 1,103 | 2,270 | 4,578 | ||||||||||||
|
Total loans
|
$ | 1,205 | $ | 1,103 | $ | 5,706 | $ | 8,014 | ||||||||
|
As of December 31, 2013
|
||||||||||||||||
|
Originated Loans
|
||||||||||||||||
|
Residential real estate
|
$ | - | $ | - | $ | 1,003 | $ | 1,003 | ||||||||
|
Total originated loans
|
- | - | 1,003 | 1,003 | ||||||||||||
|
Acquired Loans
|
||||||||||||||||
|
Commercial real estate
|
- | - | 797 | 797 | ||||||||||||
|
Construction
|
- | - | 2,508 | 2,508 | ||||||||||||
|
Commercial business
|
- | - | 315 | 315 | ||||||||||||
|
Total acquired loans
|
- | - | 3,620 | 3,620 | ||||||||||||
|
Total loans
|
$ | - | $ | - | $ | 4,623 | $ | 4,623 | ||||||||
| 67 |
| December 31, | ||||||||||||||||||||
|
(In thousands)
|
2014
|
2013
|
2012
|
2011
|
2010
|
|||||||||||||||
|
Accruing troubled debt restructured loans:
|
||||||||||||||||||||
|
Residential real estate
|
$ | 1,965 | $ | 864 | $ | 864 | $ | - | $ | - | ||||||||||
|
Commercial real estate
|
216 | - | 194 | 203 | 2,218 | |||||||||||||||
|
Construction
|
- | - | - | - | 1,415 | |||||||||||||||
|
Home equity
|
92 | 97 | - | - | - | |||||||||||||||
|
Commercial business
|
1,338 | 642 | 794 | 57 | - | |||||||||||||||
|
Accruing troubled debt restructured loans
|
3,611 | 1,603 | 1,852 | 260 | 3,633 | |||||||||||||||
|
Nonaccrual troubled debt restructured loans:
|
||||||||||||||||||||
|
Commercial real estate
|
- | - | - | - | - | |||||||||||||||
|
Nonaccrual troubled debt restructured loans
|
- | - | - | - | - | |||||||||||||||
|
Total troubled debt restructured loans
|
$ | 3,611 | $ | 1,603 | $ | 1,852 | $ | 260 | $ | 3,633 | ||||||||||
| 68 |
| 69 |
| December 31, | ||||||||||||||||||||
|
(Dollars in thousands)
|
2014
|
2013
|
2012
|
2011
|
2010
|
|||||||||||||||
|
Balance at beginning of period
|
$ | 8,382 | $ | 7,941 | $ | 6,425 | $ | 5,440 | $ | 4,380 | ||||||||||
|
Charge-offs:
|
||||||||||||||||||||
|
Residential real estate
|
- | - | (261 | ) | - | - | ||||||||||||||
|
Commercial real estate
|
- | (166 | ) | - | - | - | ||||||||||||||
|
Construction
|
(100 | ) | - | (60 | ) | (84 | ) | (254 | ) | |||||||||||
|
Home equity
|
- | - | - | - | - | |||||||||||||||
|
Consumer
|
(3 | ) | (4 | ) | (5 | ) | - | (6 | ) | |||||||||||
|
Total charge-offs
|
(103 | ) | (170 | ) | (326 | ) | (84 | ) | (260 | ) | ||||||||||
|
Recoveries:
|
||||||||||||||||||||
|
Consumer
|
425 | 26 | 21 | 20 | 9 | |||||||||||||||
|
Commercial Business
|
4 | - | - | - | - | |||||||||||||||
|
Total recoveries
|
429 | 26 | 21 | 20 | 9 | |||||||||||||||
|
Net (recoveries) charge-offs
|
(326 | ) | 144 | 305 | 64 | 251 | ||||||||||||||
|
Provision charged to earnings
|
2,152 | 585 | 1,821 | 1,049 | 1,311 | |||||||||||||||
|
Balance at end of period
|
$ | 10,860 | $ | 8,382 | $ | 7,941 | $ | 6,425 | $ | 5,440 | ||||||||||
|
Net (recoveries) charge-offs to average loans
|
(0.05 | )% | 0.03 | % | 0.07 | % | 0.02 | % | 0.09 | % | ||||||||||
|
Allowance for loan losses to total loans
|
1.17 | % | 1.33 | % | 1.50 | % | 1.74 | % | 1.87 | % | ||||||||||
| 70 |
| At December 31, | ||||||||||||||||||||||||
|
2014
|
2013
|
2012
|
||||||||||||||||||||||
|
Percent of
|
Percent of
|
Percent of
|
||||||||||||||||||||||
|
Loan
|
Loan
|
Loan
|
||||||||||||||||||||||
|
(Dollars in thousands)
|
Amount
|
Portfolio
|
Amount
|
Portfolio
|
Amount
|
Portfolio
|
||||||||||||||||||
|
Residential real estate
|
$ | 1,431 | 18.83 | % | $ | 1,310 | 24.66 | % | $ | 1,230 | 27.22 | % | ||||||||||||
|
Commercial real estate
|
5,480 | 56.06 | 3,616 | 49.96 | 3,842 | 53.73 | ||||||||||||||||||
|
Construction
|
1,102 | 6.80 | 1,032 | 8.15 | 929 | 6.25 | ||||||||||||||||||
|
Home equity
|
205 | 1.95 | 190 | 2.14 | 220 | 2.08 | ||||||||||||||||||
|
Commercial business
|
2,638 | 16.05 | 2,225 | 14.96 | 1,718 | 10.71 | ||||||||||||||||||
|
Consumer
|
4 | 0.31 | 9 | 0.13 | 2 | 0.01 | ||||||||||||||||||
|
Unallocated
|
- | - | - | - | - | - | ||||||||||||||||||
|
Total allowance for loan losses
|
$ | 10,860 | 100.00 | % | $ | 8,382 | 100.00 | % | $ | 7,941 | 100.00 | % | ||||||||||||
| At December 31, | ||||||||||||||||
|
2011
|
2010
|
|||||||||||||||
|
Percent of
|
Percent of
|
|||||||||||||||
|
Loan
|
Loan
|
|||||||||||||||
|
(Dollars in thousands)
|
Amount
|
Portfolio
|
Amount
|
Portfolio
|
||||||||||||
|
Residential real estate
|
$ | 1,290 | 28.37 | % | $ | 1,053 | 36.08 | % | ||||||||
|
Commercial real estate
|
2,519 | 47.10 | 1,806 | 38.58 | ||||||||||||
|
Construction
|
1,007 | 10.95 | 951 | 13.20 | ||||||||||||
|
Home equity
|
274 | 4.01 | 313 | 5.77 | ||||||||||||
|
Commercial business
|
1,317 | 9.49 | 744 | 6.14 | ||||||||||||
|
Consumer
|
11 | 0.08 | 20 | 0.23 | ||||||||||||
|
Unallocated
|
7 | - | 553 | - | ||||||||||||
|
Total allowance for loan losses
|
$ | 6,425 | 100.00 | % | $ | 5,440 | 100.00 | % | ||||||||
| 71 |
| December 31, | ||||||||||||||||||||||||
|
2014
|
2013
|
2012
|
||||||||||||||||||||||
|
Amortized
|
Fair
|
Amortized
|
Fair
|
Amortized
|
Fair
|
|||||||||||||||||||
|
(In thousands)
|
Cost
|
Value
|
Cost
|
Value
|
Cost
|
Value
|
||||||||||||||||||
|
Securities available for sale:
|
||||||||||||||||||||||||
|
U.S Government and agency obligations
|
$ | 24,554 | $ | 24,418 | $ | 5,997 | $ | 5,688 | $ | 5,997 | $ | 6,005 | ||||||||||||
|
State agency and municipal obligations
|
17,797 | 18,584 | 11,605 | 12,132 | 17,036 | 18,531 | ||||||||||||||||||
|
Corporate bonds
|
16,035 | 16,325 | 9,166 | 9,566 | 13,681 | 14,556 | ||||||||||||||||||
|
Government mortgage-backed securities
|
5,567 | 5,682 | 1,133 | 1,211 | 1,872 | 1,966 | ||||||||||||||||||
|
Total securities available for sale
|
$ | 63,953 | $ | 65,009 | $ | 27,901 | $ | 28,597 | $ | 38,586 | $ | 41,058 | ||||||||||||
|
Securities held to maturity:
|
||||||||||||||||||||||||
|
U.S Government and agency obligations
|
$ | 1,010 | $ | 1,010 | $ | 1,021 | $ | 1,019 | $ | - | $ | - | ||||||||||||
|
State agency and municipal obligations
|
9,179 | 9,179 | 11,461 | 11,461 | 3,903 | 3,903 | ||||||||||||||||||
|
Corporate bonds
|
1,000 | 985 | 1,000 | 973 | 1,000 | 904 | ||||||||||||||||||
|
Government mortgage-backed securities
|
265 | 296 | 334 | 362 | 451 | 485 | ||||||||||||||||||
|
Total securities held to maturity
|
$ | 11,454 | $ | 11,470 | $ | 13,816 | $ | 13,815 | $ | 5,354 | $ | 5,292 | ||||||||||||
| 72 |
|
At December 31, 2014
|
Due Within 1 Year
|
Due 1 - 5 Years
|
Due 5 - 10 Years
|
Due After 10 Years
|
||||||||||||||||||||||||||||
|
(In thousands)
|
Amortized Cost
|
Yield
|
Amortized Cost
|
Yield
|
Amortized Cost
|
Yield
|
Amortized Cost
|
Yield
|
||||||||||||||||||||||||
|
Securities available for sale:
|
||||||||||||||||||||||||||||||||
|
U.S Government and agency obligations
|
$ | 497 | 2.24 | % | $ | 3,998 | 1.43 | % | $ | 17,055 | 2.50 | % | $ | 3,004 | 2.56 | % | ||||||||||||||||
|
State agency and municipal obligations
|
- | - | - | - | 9,297 | 3.13 | 8,500 | 3.83 | ||||||||||||||||||||||||
|
Corporate bonds
|
5,764 | 1.77 | 4,150 | 4.26 | 6,121 | 2.38 | - | - | ||||||||||||||||||||||||
|
Government mortgage-backed securities
|
- | - | 99 | 2.64 | - | - | 5,468 | 2.36 | ||||||||||||||||||||||||
|
Total securities available for sale
|
$ | 6,261 | 1.81 | % | $ | 8,247 | 2.87 | % | $ | 32,473 | 2.66 | % | $ | 16,972 | 3.13 | % | ||||||||||||||||
|
Securities held to maturity:
|
||||||||||||||||||||||||||||||||
|
U.S Government and agency obligations
|
$ | 1,010 | 0.27 | % | $ | - | - | % | $ | - | - | % | $ | - | - | % | ||||||||||||||||
|
State agency and municipal obligations
|
- | - | - | - | - | - | 9,179 | 4.50 | ||||||||||||||||||||||||
|
Corporate bonds
|
- | - | - | - | 1,000 | 2.69 | - | - | ||||||||||||||||||||||||
|
Government mortgage-backed securities
|
- | - | - | - | - | - | 265 | 5.06 | ||||||||||||||||||||||||
|
Total securities held to maturity
|
$ | 1,010 | 0.27 | % | $ | - | - | % | $ | 1,000 | 2.69 | % | $ | 9,444 | 4.52 | % | ||||||||||||||||
|
At December 31, 2013
|
Due Within 1 Year
|
Due 1 - 5 Years
|
Due 5 - 10 Years
|
Due After 10 Years
|
||||||||||||||||||||||||||||
|
(In thousands)
|
Amortized Cost
|
Yield
|
Amortized Cost
|
Yield
|
Amortized Cost
|
Yield
|
Amortized Cost
|
Yield
|
||||||||||||||||||||||||
|
Securities available for sale:
|
||||||||||||||||||||||||||||||||
|
U.S Government and agency obligations
|
$ | - | - | % | $ | 1,000 | 1.29 | % | $ | 4,997 | 1.51 | % | $ | - | - | % | ||||||||||||||||
|
State agency and municipal obligations
|
- | - | - | - | 3,125 | 4.07 | 8,480 | 4.20 | ||||||||||||||||||||||||
|
Corporate bonds
|
- | - | 9,166 | 4.28 | - | - | - | - | ||||||||||||||||||||||||
|
Government mortgage-backed securities
|
- | - | - | - | - | - | 1,133 | 5.23 | ||||||||||||||||||||||||
|
Total securities available for sale
|
$ | - | - | % | $ | 10,166 | 3.99 | % | $ | 8,122 | 2.49 | % | $ | 9,613 | 4.32 | % | ||||||||||||||||
|
Securities held to maturity:
|
||||||||||||||||||||||||||||||||
|
U.S Government and agency obligations
|
$ | - | - | % | $ | 1,021 | 1.38 | % | $ | - | - | % | $ | - | - | % | ||||||||||||||||
|
State agency and municipal obligations
|
- | - | - | - | - | - | 11,461 | 4.50 | ||||||||||||||||||||||||
|
Corporate bonds
|
- | - | - | - | 1,000 | 2.90 | - | - | ||||||||||||||||||||||||
|
Government mortgage-backed securities
|
- | - | - | - | - | - | 334 | 5.50 | ||||||||||||||||||||||||
|
Total securities held to maturity
|
$ | - | - | % | $ | 1,021 | 1.38 | % | $ | 1,000 | 2.90 | % | $ | 11,795 | 4.53 | % | ||||||||||||||||
| 73 |
|
At December 31,
|
||||||||||||||||||||||||
|
2014
|
2013
|
|||||||||||||||||||||||
|
Weighted
|
Weighted
|
|||||||||||||||||||||||
|
Average
|
Average
|
|||||||||||||||||||||||
|
(Dollars in thousands)
|
Amount
|
Percent
|
Rate
|
Amount
|
Percent
|
Rate
|
||||||||||||||||||
|
Noninterest-bearing demand
|
$ | 166,030 | 19.87 | % | - | % | $ | 118,618 | 17.93 | % | - | % | ||||||||||||
|
NOW
|
60,321 | 7.22 | 0.11 | 73,652 | 11.13 | 0.12 | ||||||||||||||||||
|
Money Market
|
216,180 | 25.88 | 0.46 | 164,579 | 24.88 | 0.45 | ||||||||||||||||||
|
Savings
|
84,457 | 10.11 | 0.33 | 107,692 | 16.28 | 0.46 | ||||||||||||||||||
|
Time
|
308,451 | 36.92 | 0.88 | 197,004 | 29.78 | 0.72 | ||||||||||||||||||
|
Total Deposits
|
$ | 835,439 | 100.00 | % | 0.58 | % | $ | 661,545 | 100.00 | % | 0.43 | % | ||||||||||||
| 74 |
|
2012
|
||||||||||||
|
Weighted
|
||||||||||||
|
Average
|
||||||||||||
|
(Dollars in thousands)
|
Amount
|
Percent
|
Rate
|
|||||||||
|
Noninterest-bearing demand
|
$ | 78,120 | 16.91 | % | - | % | ||||||
|
NOW
|
33,722 | 7.30 | 0.14 | |||||||||
|
Money Market
|
94,090 | 20.36 | 0.68 | |||||||||
|
Savings
|
136,101 | 29.45 | 0.82 | |||||||||
|
Time
|
120,048 | 25.98 | 0.71 | |||||||||
|
Total Deposits
|
$ | 462,081 | 100.00 | % | 0.56 | % | ||||||
|
December 31,
|
||||||||
|
(Dollars in
thousands)
|
2014
|
2013
|
||||||
|
Maturing:
|
||||||||
|
Within 3
months
|
$ | 47,918 | $ | 71,221 | ||||
|
After 3 but within 6 months
|
49,511 | 22,236 | ||||||
|
After 6
months but within 1 year
|
92,502 | 40,204 | ||||||
|
After 1 year
|
49,885 | 17,152 | ||||||
|
Total
|
$ | 239,816 | $ | 150,813 | ||||
| 75 |
|
(Dollars in
thousands)
|
Year Ended December 31, | |||||||||||
|
As of and for
the period ending:
|
2014
|
2013
|
2012
|
|||||||||
|
Average
amount outstanding during the period
|
$ | 37,129 | $ | 39,167 | $ | 29,250 | ||||||
|
Amount outstanding at end of period
|
107,000 | 12,000 | 51,000 | |||||||||
|
Highest
month end balance during the period
|
107,000 | 60,000 | 51,000 | |||||||||
|
Weighted
average interest rate at end of period
|
0.26 | % | 0.41 | % | 0.21 | % | ||||||
|
Weighted
average interest rate during the period
|
0.23 | % | 0.28 | % | 0.23 | % | ||||||
|
Notional
|
Fair
|
||||||||||||||||
|
(Dollars in thousands)
|
Amount
|
Maturity
|
Received
|
Paid
|
Value
|
||||||||||||
|
Cash flow hedge:
|
|||||||||||||||||
|
Interest rate swap on FHLB advance
|
$ | 25,000 |
4.7 years
|
0.26 | % | 1.62 | % | $ | (73 | ) | |||||||
|
Interest rate swap on forward -starting FHLB advance
|
$ | 25,000 |
5.0 years
|
0.26 | % | 1.83 | % | $ | (113 | ) | |||||||
| 76 |
| 77 |
|
(in thousands)
|
Payments Due by Period
|
|||||||||||||||||||
|
Less Than
|
1-3 | 4-5 |
After
|
|||||||||||||||||
|
Contractual Obligations:
|
Total
|
1 Year
|
Years
|
Years
|
5 Years
|
|||||||||||||||
|
FHLB advances
|
$ | 129,000 | $ | 109,000 | $ | 20,000 | $ | - | $ | - | ||||||||||
|
Operating lease agreements
|
9,286 | 1,788 | 2,926 | 1,636 | 2,936 | |||||||||||||||
|
Time deposits with stated maturity dates
|
308,451 | 244,674 | 44,119 | 19,658 | - | |||||||||||||||
|
Total contractual obligations
|
$ | 446,737 | $ | 355,462 | $ | 67,045 | $ | 21,294 | $ | 2,936 | ||||||||||
| 78 |
|
As of December 31, 2014
|
||||||||||||||||||||
|
(in thousands)
|
Amount of Commitment Expiration per Period | |||||||||||||||||||
|
Less Than
|
1-3 | 4-5 |
After
|
|||||||||||||||||
|
Other Commitments:
|
Total
|
1 Year
|
Years
|
Years
|
5 Years
|
|||||||||||||||
|
Loan Commitments
|
$ | 83,013 | $ | 52,370 | $ | 14,791 | $ | 2,556 | $ | 13,296 | ||||||||||
|
Undisbursed construction loans
|
61,095 | 9,218 | 11,104 | - | 40,773 | |||||||||||||||
|
Unused home equity lines of credit
|
12,340 | 138 | 799 | 781 | 10,622 | |||||||||||||||
|
Total other commitments
|
$ | 156,448 | $ | 61,726 | $ | 26,694 | $ | 3,337 | $ | 64,691 | ||||||||||
|
As of December 31, 2013
|
||||||||||||||||||||
|
(in thousands)
|
Amount of Commitment Expiration per Period | |||||||||||||||||||
|
Less Than
|
1-3 | 4-5 |
After
|
|||||||||||||||||
|
Other Commitments:
|
Total
|
1 Year
|
Years
|
Years
|
5 Years
|
|||||||||||||||
|
Loan Commitments
|
$ | 61,633 | $ | 35,236 | $ | 7,528 | $ | 5,267 | $ | 13,602 | ||||||||||
|
Undisbursed construction loans
|
44,670 | 7,613 | 6,600 | - | 30,457 | |||||||||||||||
|
Unused home equity lines of credit
|
11,575 | 143 | 823 | 1,061 | 9,548 | |||||||||||||||
|
Total other commitments
|
$ | 117,878 | $ | 42,992 | $ | 14,951 | $ | 6,328 | $ | 53,607 | ||||||||||
| 79 |
|
Parallel Ramp
|
Estimated Percent Change
|
|||||||
|
in Net Interest Income
|
||||||||
|
At December 31,
|
||||||||
|
Rate Changes (basis points)
|
2014
|
2013
|
||||||
|
-100
|
(0.95 | )% | (0.73 | )% | ||||
|
+200
|
(4.00 | ) | (3.63 | ) | ||||
|
Parallel Shock
|
Estimated Percent Change
|
|||||||
|
in Net Interest Income
|
||||||||
|
At December 31,
|
||||||||
|
Rate Changes (basis points)
|
2014 | 2013 | ||||||
|
-100
|
(3.26 | )% | (1.97 | )% | ||||
|
+100
|
(3.07 | ) | (3.18 | ) | ||||
|
+200
|
(5.61 | ) | (5.93 | ) | ||||
|
+300
|
(9.00 | ) | (10.20 | ) | ||||
| 80 |
|
Parallel Shock
|
Estimated Percent Change
|
|||||||
|
in Economic Value of Equity
|
||||||||
|
At December 31,
|
||||||||
|
Rate Changes (basis points)
|
2014
|
2013
|
||||||
|
-100
|
(0.50 | )% | (4.30 | )% | ||||
|
+100
|
(8.50 | ) | (9.30 | ) | ||||
|
+200
|
(18.20 | ) | (20.10 | ) | ||||
|
+300
|
(26.90 | ) | (29.20 | ) | ||||
| 81 |
| 82 |
|
The financial statements and supplementary data required by this item are presented in the order shown below:
|
||
|
Report of Independent Registered Public Accounting Firm
|
||
|
Consolidated Balance Sheets as of December 31, 2014 and 2013
|
||
|
Consolidated Statements of Income for the years ended December 31, 2014, 2013 and 2012
|
||
|
Consolidated Statements of Comprehensive Income for the years ended December 31, 2014, 2013 and 2012
|
||
|
Consolidated Statements of Shareholders’ Equity for the years ended December 31, 2014, 2013 and 2012
|
||
|
Consolidated Statements of Cash Flows for the years ended December 31, 2014, 2013 and 2012
|
||
|
Notes to Consolidated Financial Statements
|
| 83 |
March 13, 2015
| 84 |
|
December 31,
|
||||||||
|
2014
|
2013
|
|||||||
|
ASSETS
|
||||||||
|
Cash and due from banks
|
$ | 48,559 | $ | 82,013 | ||||
|
Held to maturity investment securities, at amortized cost
|
11,454 | 13,816 | ||||||
|
Available for sale investment securities, at fair value
|
65,009 | 28,597 | ||||||
|
Loans held for sale
|
586 | 100 | ||||||
|
Loans receivable (net of allowance for loan losses of $10,860 and $8,382 at December 31, 2014 and 2013, respectively)
|
915,981 | 621,830 | ||||||
|
Foreclosed real estate
|
950 | 829 | ||||||
|
Accrued interest receivable
|
3,323 | 2,360 | ||||||
|
Federal Home Loan Bank stock, at cost
|
6,109 | 4,834 | ||||||
|
Premises and equipment, net
|
11,910 | 7,060 | ||||||
|
Bank-owned life insurance
|
23,028 | 10,031 | ||||||
|
Goodwill
|
2,589 | - | ||||||
|
Other intangible assets
|
848 | 481 | ||||||
|
Deferred income taxes, net
|
7,156 | 5,845 | ||||||
|
Other assets
|
2,029 | 1,822 | ||||||
|
Total assets
|
$ | 1,099,531 | $ | 779,618 | ||||
|
LIABILITIES AND SHAREHOLDERS’ EQUITY
|
||||||||
|
Liabilities
|
||||||||
|
Deposits
|
||||||||
|
Noninterest bearing deposits
|
$ | 166,030 | $ | 118,618 | ||||
|
Interest bearing deposits
|
669,409 | 542,927 | ||||||
|
Total deposits
|
835,439 | 661,545 | ||||||
|
Advances from the Federal Home Loan Bank
|
129,000 | 44,000 | ||||||
|
Accrued expenses and other liabilities
|
5,882 | 4,588 | ||||||
|
Total liabilities
|
970,321 | 710,133 | ||||||
|
Commitments and contingencies (Note 11)
|
||||||||
|
Shareholders’ equity
|
||||||||
|
Preferred stock, senior noncumulative perpetual, Series C, no par; 10,980 shares issued at December 31, 2014 and 2013, respectively; liquidation value of $1,000 per share
|
10,980 | 10,980 | ||||||
|
Common stock, no par value; 10,000,000 shares authorized, 7,185,482 and 3,876,393 shares issued at December 31, 2014 and 2013, respectively
|
107,265 | 52,105 | ||||||
|
Retained earnings
|
10,434 | 5,976 | ||||||
|
Accumulated other comprehensive income
|
531 | 424 | ||||||
|
Total shareholders’ equity
|
129,210 | 69,485 | ||||||
|
Total liabilities and shareholders’ equity
|
$ | 1,099,531 | $ | 779,618 | ||||
| 85 |
|
Year Ended December 31,
|
||||||||||||
|
2014
|
2013
|
2012
|
||||||||||
|
Interest and dividend income
|
||||||||||||
|
Interest and fees on loans
|
$ | 33,409 | $ | 26,599 | $ | 22,329 | ||||||
|
Interest and dividends on securities
|
2,052 | 1,409 | 2,033 | |||||||||
|
Interest on cash and cash equivalents
|
128 | 84 | 35 | |||||||||
|
Total interest income
|
35,589 | 28,092 | 24,397 | |||||||||
|
Interest expense
|
||||||||||||
|
Interest expense on deposits
|
3,295 | 2,233 | 2,367 | |||||||||
|
Interest on borrowings
|
634 | 532 | 825 | |||||||||
|
Total interest expense
|
3,929 | 2,765 | 3,192 | |||||||||
|
Net interest income
|
31,660 | 25,327 | 21,205 | |||||||||
|
Provision for loan losses
|
2,152 | 585 | 1,821 | |||||||||
|
Net interest income after provision for loan losses
|
29,508 | 24,742 | 19,384 | |||||||||
|
Noninterest income
|
||||||||||||
|
Gains and fees from sales of loans
|
1,313 | 2,020 | 18 | |||||||||
|
Gain on bargain purchase
|
- | 1,333 | - | |||||||||
|
Net gain (loss) on sale of available for sale securities
|
- | 648 | (18 | ) | ||||||||
|
Service charges and fees
|
643 | 416 | 314 | |||||||||
|
Bank owned life insurance
|
497 | 31 | - | |||||||||
|
Gain on sale of foreclosed real estate, net
|
- | 64 | - | |||||||||
|
Other
|
588 | 211 | 31 | |||||||||
|
Total noninterest income
|
3,041 | 4,723 | 345 | |||||||||
|
Noninterest expense
|
||||||||||||
|
Salaries and employee benefits
|
13,534 | 11,578 | 9,451 | |||||||||
|
Occupancy and equipment
|
4,422 | 3,420 | 3,004 | |||||||||
|
Merger and acquisition related expenses
|
1,801 | 908 | - | |||||||||
|
Data processing
|
1,289 | 1,349 | 1,209 | |||||||||
|
Professional services
|
1,194 | 1,595 | 1,546 | |||||||||
|
Marketing
|
674 | 927 | 333 | |||||||||
|
Director fees
|
650 | 330 | 381 | |||||||||
|
FDIC insurance
|
488 | 333 | 365 | |||||||||
|
Amortization of intangibles
|
133 | 18 | - | |||||||||
|
Foreclosed real estate
|
36 | 8 | 9 | |||||||||
|
Other
|
1,591 | 1,654 | 1,560 | |||||||||
|
Total noninterest expense
|
25,812 | 22,120 | 17,858 | |||||||||
|
Income before income tax expense
|
6,737 | 7,345 | 1,871 | |||||||||
|
Income tax expense
|
2,169 | 2,184 | 657 | |||||||||
|
Net income
|
$ | 4,568 | $ | 5,161 | $ | 1,214 | ||||||
|
Net income attributable to common shareholders
|
$ | 4,458 | $ | 5,050 | $ | 1,082 | ||||||
|
Earnings Per Common Share:
|
||||||||||||
|
Basic
|
$ | 0.78 | $ | 1.46 | $ | 0.39 | ||||||
|
Diluted
|
$ | 0.78 | $ | 1.44 | $ | 0.38 | ||||||
|
Weighted Average Common Shares Outstanding:
|
||||||||||||
|
Basic
|
5,577,942 | 3,395,779 | 2,767,850 | |||||||||
|
Diluted
|
5,605,512 | 3,451,393 | 2,864,700 | |||||||||
| 86 |
|
Year Ended December 31,
|
||||||||||||
|
2014
|
2013
|
2012
|
||||||||||
|
Net income
|
$ | 4,568 | $ | 5,161 | $ | 1,214 | ||||||
|
Other comprehensive income (loss):
|
||||||||||||
|
Unrealized gains (losses) on securities:
|
||||||||||||
|
Unrealized holding gains (losses) on available for sale securities
|
361 | (1,129 | ) | 1,130 | ||||||||
|
Reclassification adjustment for (gain) loss realized in net income
|
- | (648 | ) | 18 | ||||||||
|
Net change in unrealized gain (loss)
|
361 | (1,777 | ) | 1,148 | ||||||||
|
Tax effect - (expense) benefit
|
(141 | ) | 690 | (447 | ) | |||||||
|
Unrealized gains (losses) on securities, net of tax
|
220 | (1,087 | ) | 701 | ||||||||
|
Unrealized losses on interest rate swap:
|
||||||||||||
|
Unrealized losses on interest rate swaps designated as cash flow hedge
|
(186 | ) | - | - | ||||||||
|
Tax effect - benefit
|
73 | - | - | |||||||||
|
Unrealized losses on interest rate swap, net of tax
|
(113 | ) | - | - | ||||||||
|
Total other comprehensive income (loss)
|
107 | (1,087 | ) | 701 | ||||||||
|
Comprehensive income
|
$ | 4,675 | $ | 4,074 | $ | 1,915 | ||||||
| 87 |
|
Retained
|
Accumulated
|
|||||||||||||||||||||||
|
Number of
|
Earnings
|
Other
|
||||||||||||||||||||||
|
Outstanding
|
Preferred
|
Common
|
(Accumulated
|
Comprehensive
|
||||||||||||||||||||
|
Shares
|
Stock
|
Stock
|
Deficit)
|
Income (Loss)
|
Total
|
|||||||||||||||||||
|
Balance at January 1, 2012
|
2,797,200 | $ | 10,980 | $ | 37,554 | $ | (156 | ) | $ | 810 | $ | 49,188 | ||||||||||||
|
Net income
|
- | - | - | 1,214 | - | 1,214 | ||||||||||||||||||
|
Other comprehensive income, net of tax
|
- | - | - | - | 701 | 701 | ||||||||||||||||||
|
preferred stock cash dividends
|
- | - | - | (132 | ) | - | (132 | ) | ||||||||||||||||
|
Stock-based compensation expense
|
- | - | 563 | - | - | 563 | ||||||||||||||||||
|
Issuance of restricted stock
|
49,500 | - | - | - | - | - | ||||||||||||||||||
|
Balance at December 31, 2012
|
2,846,700 | 10,980 | 38,117 | 926 | 1,511 | 51,534 | ||||||||||||||||||
|
Net income
|
- | - | - | 5,161 | - | 5,161 | ||||||||||||||||||
|
Other comprehensive income, net of tax
|
- | - | - | - | (1,087 | ) | (1,087 | ) | ||||||||||||||||
|
Preferred stock cash dividends
|
- | - | - | (111 | ) | - | (111 | ) | ||||||||||||||||
|
Stock-based
compensation expense
|
- | - | 343 | - | - | 343 | ||||||||||||||||||
|
Capital from exercise of stock options
|
- | - | 467 | - | - | 467 | ||||||||||||||||||
|
Capital from private placement
|
- | - | 13,178 | - | - | 13,178 | ||||||||||||||||||
|
Issuance of restricted stock
|
87,456 | - | - | - | - | - | ||||||||||||||||||
|
Forfeitures of restricted stock
|
(1,916 | ) | - | - | - | - | - | |||||||||||||||||
|
Stock options
exercised
|
46,640 | - | - | - | - | - | ||||||||||||||||||
|
Stock issuance from private placement
|
897,513 | - | - | - | - | - | ||||||||||||||||||
|
Balance at December 31, 2013
|
3,876,393 | 10,980 | 52,105 | 5,976 | 424 | 69,485 | ||||||||||||||||||
|
Net income
|
- | - | 4,568 | - | 4,568 | |||||||||||||||||||
|
Other comprehensive income, net of tax
|
- | - | - | 107 | 107 | |||||||||||||||||||
|
Preferred stock cash dividends
|
- | - | (110 | ) | - | (110 | ) | |||||||||||||||||
|
Stock-based
compensation expense
|
- | 573 | - | - | 573 | |||||||||||||||||||
|
Capital from exercise of stock options
|
- | 207 | - | - | 207 | |||||||||||||||||||
|
Issuance of 2,702,703 shares, net of expenses
|
2,702,703 | - | 44,704 | - | - | 44,704 | ||||||||||||||||||
|
Issuance of restricted stock
|
127,610 | - | - | - | - | - | ||||||||||||||||||
|
Forfeitures of restricted stock
|
(51,651 | ) | - | - | - | - | - | |||||||||||||||||
|
Stock
options exercised
|
20,305 | - | - | - | - | - | ||||||||||||||||||
|
Stock issuance from acquisition of Quinnipiac Bank and Trust Company
|
510,122 | - | 9,676 | - | - | 9,676 | ||||||||||||||||||
|
Balance at December 31, 2014
|
7,185,482 | $ | 10,980 | $ | 107,265 | $ | 10,434 | $ | 531 | $ | 129,210 | |||||||||||||
| 88 |
|
Year Ended December 31,
|
||||||||||||
|
2014
|
2013
|
2012
|
||||||||||
|
Cash flows from operating activities
|
||||||||||||
|
Net income
|
$ | 4,568 | $ | 5,161 | $ | 1,214 | ||||||
|
Adjustments to reconcile net income to net cash provided by operating activities:
|
||||||||||||
|
Net amortization of premiums and discounts on investment securities
|
124 | 97 | 130 | |||||||||
|
Provision for loan losses
|
2,152 | 585 | 1,821 | |||||||||
|
Benefit for deferred taxes
|
(696 | ) | (357 | ) | (777 | ) | ||||||
|
Net (gain) loss on sales of available for sale securities
|
- | (648 | ) | 18 | ||||||||
|
Depreciation and amortization
|
1,239 | 666 | 612 | |||||||||
|
Increase in cash surrender value of bank-owned life insurance
|
(497 | ) | - | - | ||||||||
|
Loan principal sold
|
(27,282 | ) | (72,589 | ) | (575 | ) | ||||||
|
Proceeds from sales of loans
|
28,109 | 74,509 | 1,765 | |||||||||
|
Net gain on sales of loans
|
(1,313 | ) | (2,020 | ) | (18 | ) | ||||||
|
Equity-based compensation
|
573 | 343 | 563 | |||||||||
|
Net amortization (accretion) of purchase accounting adjustments
|
656 | (80 | ) | - | ||||||||
|
Gain on sale of foreclosed real estate
|
- | (64 | ) | - | ||||||||
|
Gain on bargain purchase
|
- | (1,333 | ) | - | ||||||||
|
Net change in:
|
||||||||||||
|
Deferred loan fees
|
1,120 | 479 | 539 | |||||||||
|
Accrued interest receivable
|
(619 | ) | (185 | ) | 206 | |||||||
|
Other assets
|
58 | (501 | ) | (1,432 | ) | |||||||
|
Accrued expenses and other liabilities
|
978 | (1,114 | ) | 4,101 | ||||||||
|
Net cash provided by operating activities
|
9,170 | 2,949 | 8,167 | |||||||||
|
Cash flows from investing activities
|
||||||||||||
|
Proceeds from principal repayments on available for sale securities
|
10,189 | 723 | 1,103 | |||||||||
|
Proceeds from principal repayments on held to maturity securities
|
2,353 | 180 | 480 | |||||||||
|
Net proceeds from sales and calls of available for sale securities
|
15,920 | 10,514 | 54,973 | |||||||||
|
Purchases of available for sale securities
|
(53,772 | ) | - | (6,997 | ) | |||||||
|
Purchase of held to maturity securities
|
- | (7,623 | ) | - | ||||||||
|
Purchase of bank-owned life insurance
|
(12,500 | ) | (10,031 | ) | - | |||||||
|
Acquisition, net of cash paid
|
2,546 | 30,883 | - | |||||||||
|
Net increase in loans
|
(200,118 | ) | (77,004 | ) | (162,026 | ) | ||||||
|
Purchases of premises and equipment
|
(2,042 | ) | (908 | ) | (684 | ) | ||||||
|
Purchase of Federal Home Loan Bank stock
|
(1,275 | ) | (134 | ) | (1,034 | ) | ||||||
|
Proceeds from sale of foreclosed real estate
|
- | 1,693 | - | |||||||||
|
Net cash used by investing activities
|
(238,699 | ) | (51,707 | ) | (114,185 | ) | ||||||
| 89 |
|
Year Ended December 31,
|
||||||||||||
|
2014
|
2013
|
2012
|
||||||||||
|
Cash flows from financing activities
|
||||||||||||
|
Net change in time certificates of deposit
|
$ | 111,247 | $ | 66,538 | $ | (230 | ) | |||||
|
Net change in other deposits
|
(37,973 | ) | 68,772 | 95,216 | ||||||||
|
Net proceeds (repayments) from short term FHLB advances
|
85,000 | (47,000 | ) | 33,000 | ||||||||
|
Net repayments from long term FHLB advances
|
(7,000 | ) | - | - | ||||||||
|
Proceeds from issuance of common stock
|
44,704 | 13,178 | - | |||||||||
|
Proceeds from exercise of options
|
207 | 467 | - | |||||||||
|
Dividends paid on preferred stock
|
(110 | ) | (111 | ) | (132 | ) | ||||||
|
Net cash provided by financing activities
|
196,075 | 101,844 | 127,854 | |||||||||
|
Net (decrease) increase in cash and cash equivalents
|
(33,454 | ) | 53,086 | 21,836 | ||||||||
|
Cash and cash equivalents:
|
||||||||||||
|
Beginning of year
|
82,013 | 28,927 | 7,091 | |||||||||
|
End of period
|
$ | 48,559 | $ | 82,013 | $ | 28,927 | ||||||
|
Supplemental disclosures of cash flows information:
|
||||||||||||
|
Cash paid for:
|
||||||||||||
|
Interest
|
3,985 | $ | 2,527 | $ | 3,208 | |||||||
|
Income taxes
|
2,222 | 2,872 | 1,984 | |||||||||
|
Acquisition of noncash assets and liabilities:
|
||||||||||||
|
Assets acquired
|
112,498 | 34,869 | - | |||||||||
|
Liabilities assumed
|
(107,958 | ) | (64,446 | ) | - | |||||||
|
Noncash investing and financing activities
|
||||||||||||
|
Loans transferred to foreclosed real estate
|
- | 52 | 962 | |||||||||
| 90 |
| 91 |
| 92 |
| 93 |
| 94 |
| 95 |
| 96 |
B ankwell F inancial G roup , I nc .
| 97 |
| 98 |
| 99 |
| 100 |
| 101 |
| 102 |
|
Consideration paid:
(In thousands)
|
Amount
|
|||||||||||
|
Cash consideration paid to Wilton shareholders
|
$ | 5,035 | ||||||||||
|
Recognized amounts of identifiable assets acquired
and (liabilities) assumed: (In thousands) |
As Acquired
|
Fair Value
Adjustments
|
As Recorded
at Acquisition
|
|||||||||
|
Cash
|
$ | 35,919 | $ | - | $ | 35,919 | ||||||
|
Held to maturity investments securities
|
1,022 | - | 1,022 | |||||||||
|
Loans
|
27,097 | (2,008 | ) | a | 25,089 | |||||||
|
Premises and equipment
|
4,303 | - | 4,303 | |||||||||
|
Other real estate owned
|
1,895 | (450 | ) | b | 1,445 | |||||||
|
Core deposit intangibles
|
- | 499 | c | 499 | ||||||||
|
Deferred tax assets, net
|
- | 1,997 | d | 1,997 | ||||||||
|
Other assets
|
587 | - | 587 | |||||||||
|
Deposits
|
(64,145 | ) | (12 | ) | e | (64,157 | ) | |||||
|
Other liabilities
|
(336 | ) | - | (336 | ) | |||||||
|
Total identifiable net assets
|
$ | 6,342 | $ | 26 | 6,368 | |||||||
|
Gain on purchase
|
$ | (1,333 | ) | |||||||||
|
a)
|
The adjustment represents the write down of the book value of loans to their estimated fair value based on current interest rates and expected cash flows, which includes an estimate of expected loan loss inherent in the portfolio.
|
|
|
b)
|
The adjustment represents the write down of the book value of foreclosed real estate to their estimated fair value based on current appraisals.
|
|
|
c)
|
Represents the economic value of the acquired core deposit base (total deposits less jumbo time deposits). The core deposit intangible will be amortized over an estimated life of 9.3 years based on the double declining balance method of amortization.
|
|
|
d)
|
Represents net deferred tax assets resulting from the fair value adjustments related to the acquired assets and liabilities, identifiable intangibles and other purchase accounting adjustments.
|
| 103 |
|
e)
|
The adjustment represents the fair value of time deposits, which were valued at a premium of 0.11% as they bore slightly higher rates than the prevailing market.
|
|
November 5,
|
||||
|
(In thousands)
|
2013
|
|||
|
Contractually required principal and interest at acquisition
|
$ | 14,528 | ||
|
Contractual cash flows not expected to be collected (nonaccretable discount)
|
(1,412 | ) | ||
|
Expected cash flows at acquisition
|
13,116 | |||
|
Interest component of expected cash flows (accretable discount)
|
(1,513 | ) | ||
|
Fair value of acquired loans
|
$ | 11,603 | ||
| 104 |
|
Consideration paid:
(In thousands)
|
Amount
|
|||||||||||
|
Cash consideration paid to Quinnipiac shareholders
|
$ | 3,648 | ||||||||||
|
Equity consideration paid to Quinnipiac shareholders
|
9,676 | |||||||||||
|
Total Consideration paid
|
13,324 | |||||||||||
|
Recognized amounts of identifiable assets acquired
and (liabilities) assumed: (In thousands) |
As Acquired
|
Fair Value
Adjustments
|
As Recorded
at Acquisition |
|||||||||
|
Cash
|
$ | 6,195 | $ | - | $ | 6,195 | ||||||
|
Available for sale investments securities
|
8,533 | (29 | ) | a | 8,504 | |||||||
|
Loans
|
97,103 | 748 | b | 97,851 | ||||||||
|
Premises and equipment
|
4,046 | - | 4,046 | |||||||||
|
Other real estate owned
|
129 | - | 129 | |||||||||
|
Core deposit intangibles
|
- | 530 | c | 530 | ||||||||
|
Deferred tax assets, net
|
1,070 | (388 | ) | d | 682 | |||||||
|
Other assets
|
756 | - | 756 | |||||||||
|
Deposits
|
(100,391 | ) | (252 | ) | e | (100,643 | ) | |||||
|
FHLB advances
|
(7,000 | ) | - | (7,000 | ) | |||||||
|
Other liabilities
|
(315 | ) | - | (315 | ) | |||||||
|
Total identifiable net assets
|
$ | 10,126 | $ | 609 | 10,735 | |||||||
|
Goodwill
|
$ | 2,589 | ||||||||||
|
a)
|
The adjustment represents the mark to market adjustment on available for sale investment securities
|
|
|
b)
|
The adjustment represents the adjustment of the book value of loans to their estimated fair value based on current interest rates and expected cash flows, which includes an estimate of expected loan loss inherent in the portfolio.
|
|
|
c)
|
Represents the economic value of the acquired core deposit base (total deposits less jumbo time deposits). The core deposit intangible will be amortized over an estimated life of 8.8 years based on the double declining balance method of amortization.
|
|
|
d)
|
Represents net deferred tax assets resulting from the fair value adjustments related to the acquired assets and liabilities, identifiable intangibles and other purchase accounting adjustments.
|
|
|
e)
|
The adjustment represents the fair value of time deposits, which were valued at a premium of 0.57% as they bore somewhat higher rates than the prevailing market.
|
| 105 |
|
October 1,
|
||||
|
(In thousands)
|
2014
|
|||
|
Contractually required principal and interest at acquisition
|
$ | 1,729 | ||
|
Contractual cash flows not expected to be collected (nonaccretable discount)
|
(6 | ) | ||
|
Expected cash flows at acquisition
|
1,723 | |||
|
Interest component of expected cash flows (accretable discount)
|
(478 | ) | ||
|
Fair value of acquired loans
|
$ | 1,245 | ||
|
Year Ended
|
||||
|
(In thousands)
|
December 31, 2014
|
|||
|
Balance, beginning of the period
|
$ | - | ||
|
Goodwill acquired:
|
||||
|
Quinnipiac Bank and Trust Company
|
2,589 | |||
|
Balance, end of the period
|
$ | 2,589 | ||
| 106 |
|
Gross Intangible
|
Accumulated
|
Net Intangible
|
||||||||||
|
Asset
|
Amortization
|
Asset
|
||||||||||
|
(In thousands)
|
||||||||||||
|
December 31, 2014
|
||||||||||||
|
Core deposit intangible
|
$ | 1,029 | $ | 181 | $ | 848 | ||||||
|
December 31, 2013
|
||||||||||||
|
Core deposit intangible
|
$ | 499 | $ | 18 | $ | 481 | ||||||
| 107 |
| December 31, 2014 | ||||||||||||||||
|
Amortized
|
Gross Unrealized
|
Fair
|
||||||||||||||
|
Cost
|
Gains
|
Losses
|
Value
|
|||||||||||||
| (In thousands) | ||||||||||||||||
|
Available for sale securities:
|
||||||||||||||||
|
U.S. Government and agency obligations
|
||||||||||||||||
|
Due in less than one year
|
$ | 497 | $ | 9 | $ | - | $ | 506 | ||||||||
|
Due from one through five years
|
3,998 | - | (69 | ) | 3,929 | |||||||||||
|
Due from five through ten years
|
17,055 | 27 | (79 | ) | 17,003 | |||||||||||
|
Due after ten years
|
3,004 | 4 | (28 | ) | 2,980 | |||||||||||
| 24,554 | 40 | (176 | ) | 24,418 | ||||||||||||
|
State agency and municipal obligations
|
||||||||||||||||
|
Due from five through ten years
|
9,297 | 295 | (48 | ) | 9,544 | |||||||||||
|
Due after ten years
|
8,500 | 544 | (4 | ) | 9,040 | |||||||||||
| 17,797 | 839 | (52 | ) | 18,584 | ||||||||||||
|
Corporate bonds
|
||||||||||||||||
|
Due in less than one year
|
5,764 | 44 | (6 | ) | 5,802 | |||||||||||
|
Due from one through five years
|
4,150 | 268 | - | 4,418 | ||||||||||||
|
Due from five through ten years
|
6,121 | 8 | (24 | ) | 6,105 | |||||||||||
| 16,035 | 320 | (30 | ) | 16,325 | ||||||||||||
|
Government-sponsored mortgage backed securities
|
||||||||||||||||
|
Due from one through five years
|
99 | 1 | - | 100 | ||||||||||||
|
Due after ten years
|
5,468 | 131 | (17 | ) | 5,582 | |||||||||||
| 5,567 | 132 | (17 | ) | 5,682 | ||||||||||||
|
Total available for sale securities
|
$ | 63,953 | $ | 1,331 | $ | (275 | ) | $ | 65,009 | |||||||
|
Held to maturity securities:
|
||||||||||||||||
|
U.S. Government and agency obligations
|
||||||||||||||||
|
Due in less than one year
|
$ | 1,010 | $ | - | $ | - | $ | 1,010 | ||||||||
|
State agency and municipal obligations
|
||||||||||||||||
|
Due after ten years
|
9,179 | - | - | 9,179 | ||||||||||||
|
Corporate bonds
|
||||||||||||||||
|
Due from five through ten years
|
1,000 | - | (15 | ) | 985 | |||||||||||
|
Government-sponsored mortgage backed securities
|
||||||||||||||||
|
Due after ten years
|
265 | 31 | - | 296 | ||||||||||||
|
Total held to maturity securities
|
$ | 11,454 | $ | 31 | $ | (15 | ) | $ | 11,470 | |||||||
| 108 |
| December 31, 2013 | ||||||||||||||||
|
Amortized
|
Gross Unrealized
|
Fair
|
||||||||||||||
|
Cost
|
Gains
|
Losses
|
Value
|
|||||||||||||
| (In thousands) | ||||||||||||||||
|
Available for sale securities:
|
||||||||||||||||
|
U.S. Government and agency obligations
|
||||||||||||||||
|
Due from one through five years
|
$ | 1,000 | $ | - | $ | (17 | ) | $ | 983 | |||||||
|
Due from five through ten years
|
4,997 | - | (292 | ) | 4,705 | |||||||||||
| 5,997 | - | (309 | ) | 5,688 | ||||||||||||
|
State agency and municipal obligations
|
||||||||||||||||
|
Due from five through ten years
|
3,125 | 152 | - | 3,277 | ||||||||||||
|
Due after ten years
|
8,480 | 375 | - | 8,855 | ||||||||||||
| 11,605 | 527 | - | 12,132 | |||||||||||||
|
Corporate bonds
|
||||||||||||||||
|
Due from one through five years
|
9,166 | 411 | (11 | ) | 9,566 | |||||||||||
|
Government-sponsored mortgage backed securities
|
||||||||||||||||
|
Due after ten years
|
1,133 | 78 | - | 1,211 | ||||||||||||
|
Total available for sale securities
|
$ | 27,901 | $ | 1,016 | $ | (320 | ) | $ | 28,597 | |||||||
|
Held to maturity securities:
|
||||||||||||||||
|
U.S. Government and agency obligations
|
||||||||||||||||
|
Due from one through five years
|
$ | 1,021 | $ | - | $ | (2 | ) | $ | 1,019 | |||||||
|
State agency and municipal obligations
|
||||||||||||||||
|
Due after ten years
|
11,461 | - | - | 11,461 | ||||||||||||
|
Corporate bonds
|
||||||||||||||||
|
Due from five through ten years
|
1,000 | - | (27 | ) | 973 | |||||||||||
|
Government-sponsored mortgage backed securities
|
||||||||||||||||
|
Due after ten years
|
334 | 28 | - | 362 | ||||||||||||
|
Total held to maturity securities
|
$ | 13,816 | $ | 28 | $ | (29 | ) | $ | 13,815 | |||||||
| 109 |
| Bankwell Financial Group, Inc. |
|
NOTES
TO CONSOLIDATED FINANCIAL STATEMENTS
|
|
Length of Time in Continuous Unrealized Loss Position
|
||||||||||||||||||||||||
|
Less Than 12 Months
|
12 Months or More
|
Total | ||||||||||||||||||||||
|
Fair
|
Unrealized
|
Fair
|
Unrealized
|
Fair
|
Unrealized
|
|||||||||||||||||||
|
Value
|
Loss
|
Value
|
Loss
|
Value
|
Loss | |||||||||||||||||||
|
(In thousands)
|
||||||||||||||||||||||||
|
December 31, 2014
|
||||||||||||||||||||||||
|
U.S. Government and agency obligations
|
$ | 4,515 | $ | (56 | ) | $ | 5,878 | $ | (120 | ) | $ | 10,393 | $ | (176 | ) | |||||||||
|
State agency and municipal obligations
|
1,771 | (52 | ) | - | - | 1,771 | (52 | ) | ||||||||||||||||
|
Corporate bonds
|
6,783 | (40 | ) | 995 | (5 | ) | 7,778 | (45 | ) | |||||||||||||||
|
Government-sponsored mortgage backed securities
|
1,406 | (17 | ) | - | - | 1,406 | (17 | ) | ||||||||||||||||
|
Total investment securities
|
$ | 14,475 | $ | (165 | ) | $ | 6,873 | $ | (125 | ) | $ | 21,348 | $ | (290 | ) | |||||||||
|
December 31, 2013
|
||||||||||||||||||||||||
|
U.S. Government and agency obligations
|
$ | 5,797 | $ | (222 | ) | $ | 910 | $ | (89 | ) | $ | 6,707 | $ | (311 | ) | |||||||||
|
Corporate bonds
|
- | - | 1,961 | (38 | ) | 1,961 | (38 | ) | ||||||||||||||||
|
Total investment securities
|
$ | 5,797 | $ | (222 | ) | $ | 2,871 | $ | (127 | ) | $ | 8,668 | $ | (349 | ) | |||||||||
| 110 |
|
Bankwell
Financial Group, Inc.
|
|
NOTES
TO CONSOLIDATED FINANCIAL STATEMENTS
|
| December 31, 2014 | December 31, 2013 | |||||||||||||||||||||||
|
(In thousands)
|
Originated
|
Acquired
|
Total
|
Originated
|
Acquired
|
Total
|
||||||||||||||||||
|
Real estate loans:
|
||||||||||||||||||||||||
|
Residential
|
$ | 169,833 | $ | 5,198 | $ | 175,031 | $ | 155,874 | $ | - | $ | 155,874 | ||||||||||||
|
Commercial
|
458,506 | 62,675 | 521,181 | 305,823 | 10,710 | 316,533 | ||||||||||||||||||
|
Construction
|
62,258 | 971 | 63,229 | 44,187 | 7,358 | 51,545 | ||||||||||||||||||
|
Home equity
|
10,226 | 7,940 | 18,166 | 9,625 | 4,267 | 13,892 | ||||||||||||||||||
| 700,823 | 76,784 | 777,607 | 515,509 | 22,335 | 537,844 | |||||||||||||||||||
|
Commercial business
|
120,360 | 28,899 | 149,259 | 92,173 | 1,393 | 93,566 | ||||||||||||||||||
|
Consumer
|
243 | 2,653 | 2,896 | 225 | 377 | 602 | ||||||||||||||||||
|
Total loans
|
821,426 | 108,336 | 929,762 | 607,907 | 24,105 | 632,012 | ||||||||||||||||||
|
Allowance for loan losses
|
(10,860 | ) | - | (10,860 | ) | (8,382 | ) | - | (8,382 | ) | ||||||||||||||
|
Deferred loan origination fees, net
|
(2,937 | ) | - | (2,937 | ) | (1,785 | ) | (31 | ) | (1,816 | ) | |||||||||||||
|
Unamortized loan premiums
|
16 | - | 16 | 16 | - | 16 | ||||||||||||||||||
|
Loans receivable, net
|
$ | 807,645 | $ | 108,336 | $ | 915,981 | $ | 597,756 | $ | 24,074 | $ | 621,830 | ||||||||||||
|
(In thousands)
|
2014
|
2013
|
||||||
|
Balance at beginning of period
|
$ | 1,418 | $ | - | ||||
|
Acquisition
|
478 | 1,513 | ||||||
|
Accretion
|
(136 | ) | (95 | ) | ||||
|
Other (a)
|
(378 | ) | - | |||||
|
Balance at end of period
|
$ | 1,382 | $ | 1,418 | ||||
| 111 |
|
Bankwell
Financial Group, Inc.
|
|
NOTES
TO CONSOLIDATED FINANCIAL STATEMENTS
|
| 112 |
|
Bankwell
Financial Group, Inc.
|
|
NOTES
TO CONSOLIDATED FINANCIAL STATEMENTS
|
| 113 |
|
Bankwell
Financial Group, Inc.
|
|
NOTES
TO CONSOLIDATED FINANCIAL STATEMENTS
|
|
Residential
|
Commercial
|
Commercial
|
||||||||||||||||||||||||||||||
|
Real Estate
|
Real Estate
|
Construction
|
Home Equity
|
Business
|
Consumer
|
Unallocated
|
Total
|
|||||||||||||||||||||||||
| (In thousands) | ||||||||||||||||||||||||||||||||
|
December 31, 2014 Originated
|
||||||||||||||||||||||||||||||||
|
Beginning balance
|
$ | 1,310 | $ | 3,616 | $ | 1,032 | $ | 190 | $ | 2,225 | $ | 9 | $ | - | $ | 8,382 | ||||||||||||||||
|
Charge-offs
|
- | - | - | - | - | (3 | ) | - | (3 | ) | ||||||||||||||||||||||
|
Recoveries
|
- | - | - | - | 4 | 425 | - | 429 | ||||||||||||||||||||||||
|
Provisions
|
121 | 1,864 | 70 | 15 | 409 | (427 | ) | - | 2,052 | |||||||||||||||||||||||
|
Ending balance
|
$ | 1,431 | $ | 5,480 | $ | 1,102 | $ | 205 | $ | 2,638 | $ | 4 | $ | - | $ | 10,860 | ||||||||||||||||
|
Acquired
|
||||||||||||||||||||||||||||||||
|
Beginning balance
|
$ | - | $ | - | $ | - | $ | - | $ | - | $ | - | $ | - | $ | - | ||||||||||||||||
|
Charge-offs
|
- | - | (100 | ) | - | - | - | - | (100 | ) | ||||||||||||||||||||||
|
Recoveries
|
- | - | - | - | - | - | - | - | ||||||||||||||||||||||||
|
Provisions
|
- | - | 100 | - | - | - | - | 100 | ||||||||||||||||||||||||
|
Ending balance
|
$ | - | $ | - | $ | - | $ | - | $ | - | $ | - | $ | - | $ | - | ||||||||||||||||
|
Total
|
||||||||||||||||||||||||||||||||
|
Beginning balance
|
$ | 1,310 | $ | 3,616 | $ | 1,032 | $ | 190 | $ | 2,225 | $ | 9 | $ | - | $ | 8,382 | ||||||||||||||||
|
Charge-offs
|
- | - | (100 | ) | - | - | (3 | ) | - | (103 | ) | |||||||||||||||||||||
|
Recoveries
|
- | - | - | - | 4 | 425 | - | 429 | ||||||||||||||||||||||||
|
Provisions
|
121 | 1,864 | 170 | 15 | 409 | (427 | ) | - | 2,152 | |||||||||||||||||||||||
|
Ending balance
|
$ | 1,431 | $ | 5,480 | $ | 1,102 | $ | 205 | $ | 2,638 | $ | 4 | $ | - | $ | 10,860 | ||||||||||||||||
| 114 |
|
Bankwell
Financial Group, Inc.
|
|
NOTES
TO CONSOLIDATED FINANCIAL STATEMENTS
|
|
Residential
|
Commercial
|
Commercial
|
||||||||||||||||||||||||||||||
|
Real Estate
|
Real Estate
|
Construction
|
Home Equity
|
Business
|
Consumer
|
Unallocated
|
Total
|
|||||||||||||||||||||||||
| (In thousands) | ||||||||||||||||||||||||||||||||
|
December 31, 2013 Originated
|
||||||||||||||||||||||||||||||||
|
Beginning balance
|
$ | 1,230 | $ | 3,842 | $ | 929 | $ | 220 | $ | 1,718 | $ | 2 | $ | - | $ | 7,941 | ||||||||||||||||
|
Charge-offs
|
- | (166 | ) | - | - | - | (4 | ) | - | (170 | ) | |||||||||||||||||||||
|
Recoveries
|
- | - | - | - | - | 26 | - | 26 | ||||||||||||||||||||||||
|
Provisions
|
80 | (60 | ) | 103 | (30 | ) | 507 | (15 | ) | - | 585 | |||||||||||||||||||||
|
Ending balance
|
$ | 1,310 | $ | 3,616 | $ | 1,032 | $ | 190 | $ | 2,225 | $ | 9 | $ | - | $ | 8,382 | ||||||||||||||||
|
Acquired
|
||||||||||||||||||||||||||||||||
|
Beginning balance
|
$ | - | $ | - | $ | - | $ | - | $ | - | $ | - | $ | - | $ | - | ||||||||||||||||
|
Charge-offs
|
- | - | - | - | - | - | - | - | ||||||||||||||||||||||||
|
Recoveries
|
- | - | - | - | - | - | - | - | ||||||||||||||||||||||||
|
Provisions
|
- | - | - | - | - | - | - | - | ||||||||||||||||||||||||
|
Ending balance
|
$ | - | $ | - | $ | - | $ | - | $ | - | $ | - | $ | - | $ | - | ||||||||||||||||
|
Total
|
||||||||||||||||||||||||||||||||
|
Beginning balance
|
$ | 1,230 | $ | 3,842 | $ | 929 | $ | 220 | $ | 1,718 | $ | 2 | $ | - | $ | 7,941 | ||||||||||||||||
|
Charge-offs
|
- | (166 | ) | - | - | - | (4 | ) | - | (170 | ) | |||||||||||||||||||||
|
Recoveries
|
- | - | - | - | - | 26 | - | 26 | ||||||||||||||||||||||||
|
Provisions
|
80 | (60 | ) | 103 | (30 | ) | 507 | (15 | ) | - | 585 | |||||||||||||||||||||
|
Ending balance
|
$ | 1,310 | $ | 3,616 | $ | 1,032 | $ | 190 | $ | 2,225 | $ | 9 | $ | - | $ | 8,382 | ||||||||||||||||
|
Residential
|
Commercial
|
Commercial
|
||||||||||||||||||||||||||||||
|
Real Estate
|
Real Estate
|
Construction
|
Home Equity
|
Business
|
Consumer
|
Unallocated
|
Total
|
|||||||||||||||||||||||||
| (In thousands) | ||||||||||||||||||||||||||||||||
|
December 31, 2012
|
||||||||||||||||||||||||||||||||
|
Beginning balance
|
$ | 1,290 | $ | 2,519 | $ | 1,007 | $ | 274 | $ | 1,317 | $ | 11 | $ | 7 | $ | 6,425 | ||||||||||||||||
|
Charge-offs
|
(261 | ) | - | (60 | ) | - | - | (5 | ) | - | (326 | ) | ||||||||||||||||||||
|
Recoveries
|
- | - | - | - | - | 21 | - | 21 | ||||||||||||||||||||||||
|
Provisions
|
201 | 1,323 | (18 | ) | (54 | ) | 401 | (25 | ) | (7 | ) | 1,821 | ||||||||||||||||||||
|
Ending balance
|
$ | 1,230 | $ | 3,842 | $ | 929 | $ | 220 | $ | 1,718 | $ | 2 | $ | - | $ | 7,941 | ||||||||||||||||
| 115 |
|
Bankwell
Financial Group, Inc.
|
|
NOTES
TO CONSOLIDATED FINANCIAL STATEMENTS
|
|
Originated Loans
|
Acquired Loans
|
Total
|
||||||||||||||||||||||
|
Portfolio
|
Allowance
|
Portfolio
|
Allowance
|
Portfolio
|
Allowance
|
|||||||||||||||||||
| (In thousands) | ||||||||||||||||||||||||
|
December 31, 2014
|
||||||||||||||||||||||||
|
Loans individually evaluated for impairment:
|
||||||||||||||||||||||||
|
Residential real estate
|
$ | 864 | $ | - | $ | - | $ | - | $ | 864 | $ | - | ||||||||||||
|
Commercial real estate
|
4,996 | 23 | - | - | 4,996 | 23 | ||||||||||||||||||
|
Construction
|
- | - | - | - | - | - | ||||||||||||||||||
|
Home equity
|
91 | - | - | - | 91 | - | ||||||||||||||||||
|
Commercial business
|
1,701 | 10 | 629 | - | 2,330 | 10 | ||||||||||||||||||
|
Consumer
|
- | - | - | - | - | - | ||||||||||||||||||
|
Subtotal
|
$ | 7,652 | $ | 33 | $ | 629 | $ | - | $ | 8,281 | $ | 33 | ||||||||||||
|
Loans collectively evaluated for impairment:
|
||||||||||||||||||||||||
|
Residential real estate
|
$ | 168,969 | $ | 1,431 | $ | 5,198 | $ | - | $ | 174,167 | $ | 1,431 | ||||||||||||
|
Commercial real estate
|
453,510 | 5,457 | 62,675 | - | 516,185 | 5,457 | ||||||||||||||||||
|
Construction
|
62,258 | 1,102 | 971 | - | 63,229 | 1,102 | ||||||||||||||||||
|
Home equity
|
10,135 | 205 | 7,940 | - | 18,075 | 205 | ||||||||||||||||||
|
Commercial business
|
118,659 | 2,628 | 28,270 | - | 146,929 | 2,628 | ||||||||||||||||||
|
Consumer
|
243 | 4 | 2,653 | - | 2,896 | 4 | ||||||||||||||||||
|
Subtotal
|
$ | 813,774 | $ | 10,827 | $ | 107,707 | $ | - | $ | 921,481 | $ | 10,827 | ||||||||||||
|
Total
|
$ | 821,426 | $ | 10,860 | $ | 108,336 | $ | - | $ | 929,762 | $ | 10,860 | ||||||||||||
|
Originated Loans
|
Acquired Loans
|
Total
|
||||||||||||||||||||||
|
Portfolio
|
Allowance
|
Portfolio
|
Allowance
|
Portfolio
|
Allowance
|
|||||||||||||||||||
| (In thousands) | ||||||||||||||||||||||||
|
December 31, 2013
|
||||||||||||||||||||||||
|
Loans individually evaluated for impairment:
|
||||||||||||||||||||||||
|
Residential real estate
|
$ | 1,867 | $ | 73 | $ | - | $ | - | $ | 1,867 | $ | 73 | ||||||||||||
|
Commercial real estate
|
1,117 | 56 | - | - | 1,117 | 56 | ||||||||||||||||||
|
Construction
|
- | - | - | - | - | - | ||||||||||||||||||
|
Home equity
|
97 | 4 | - | - | 97 | 4 | ||||||||||||||||||
|
Commercial business
|
642 | 12 | - | - | 642 | 12 | ||||||||||||||||||
|
Consumer
|
- | - | - | - | - | - | ||||||||||||||||||
|
Subtotal
|
$ | 3,723 | $ | 145 | $ | - | $ | - | $ | 3,723 | $ | 145 | ||||||||||||
|
Loans collectively evaluated for impairment:
|
||||||||||||||||||||||||
|
Residential real estate
|
$ | 154,007 | $ | 1,237 | $ | - | $ | - | $ | 154,007 | $ | 1,237 | ||||||||||||
|
Commercial real estate
|
304,706 | 3,560 | 10,710 | - | 315,416 | 3,560 | ||||||||||||||||||
|
Construction
|
44,187 | 1,032 | 7,358 | - | 51,545 | 1,032 | ||||||||||||||||||
|
Home equity
|
9,528 | 187 | 4,267 | - | 13,795 | 187 | ||||||||||||||||||
|
Commercial business
|
91,531 | 2,212 | 1,393 | - | 92,924 | 2,212 | ||||||||||||||||||
|
Consumer
|
225 | 9 | 377 | - | 602 | 9 | ||||||||||||||||||
|
Subtotal
|
$ | 604,184 | $ | 8,237 | $ | 24,105 | $ | - | $ | 628,289 | $ | 8,237 | ||||||||||||
|
Total
|
$ | 607,907 | $ | 8,382 | $ | 24,105 | $ | - | $ | 632,012 | $ | 8,382 | ||||||||||||
| 116 |
|
Bankwell
Financial Group, Inc.
|
|
NOTES
TO CONSOLIDATED FINANCIAL STATEMENTS
|
| Commercial Credit Quality Indicators | ||||||||||||||||||||||||
|
At December 31, 2014
|
At December 31, 2013 | |||||||||||||||||||||||
|
Commercial
|
Commercial
|
Commercial
|
Commercial
|
|||||||||||||||||||||
|
Real Estate
|
Construction
|
Business
|
Real Estate
|
Construction
|
Business
|
|||||||||||||||||||
| (In thousands) | ||||||||||||||||||||||||
|
Originated loans:
|
||||||||||||||||||||||||
|
Pass
|
$ | 452,974 | $ | 62,258 | $ | 115,323 | $ | 304,469 | $ | 44,187 | $ | 91,093 | ||||||||||||
|
Special mention
|
2,096 | - | 5,037 | 237 | - | 438 | ||||||||||||||||||
|
Substandard
|
3,436 | - | - | 1,117 | - | 642 | ||||||||||||||||||
|
Doubtful
|
- | - | - | - | - | - | ||||||||||||||||||
|
Loss
|
- | - | - | - | - | - | ||||||||||||||||||
|
Total originated loans
|
458,506 | 62,258 | 120,360 | 305,823 | 44,187 | 92,173 | ||||||||||||||||||
|
Acquired loans:
|
||||||||||||||||||||||||
|
Pass
|
61,017 | 136 | 27,074 | 10,351 | 4,689 | 825 | ||||||||||||||||||
|
Special mention
|
- | - | 659 | 24 | 161 | 252 | ||||||||||||||||||
|
Substandard
|
1,658 | 835 | 1,166 | 335 | 2,508 | 316 | ||||||||||||||||||
|
Doubtful
|
- | - | - | - | - | - | ||||||||||||||||||
|
Loss
|
- | - | - | - | - | - | ||||||||||||||||||
|
Total acquired loans
|
62,675 | 971 | 28,899 | 10,710 | 7,358 | 1,393 | ||||||||||||||||||
|
Total
|
$ | 521,181 | $ | 63,229 | $ | 149,259 | $ | 316,533 | $ | 51,545 | $ | 93,566 | ||||||||||||
| 117 |
|
Bankwell
Financial Group, Inc.
|
|
NOTES
TO CONSOLIDATED FINANCIAL STATEMENTS
|
| Residential and Consumer Credit Quality Indicators | ||||||||||||||||||||||||
|
At December 31, 2014
|
At December 31, 2013
|
|||||||||||||||||||||||
|
Residential
|
Residential
|
|||||||||||||||||||||||
|
Real Estate
|
Home Equity
|
Consumer
|
Real Estate
|
Home Equity
|
Consumer
|
|||||||||||||||||||
| (In thousands) | ||||||||||||||||||||||||
|
Originated loans:
|
||||||||||||||||||||||||
|
Pass
|
$ | 168,969 | $ | 10,135 | $ | 243 | $ | 153,443 | $ | 9,447 | $ | 225 | ||||||||||||
|
Special mention
|
864 | 91 | - | 2,431 | 178 | - | ||||||||||||||||||
|
Substandard
|
- | - | - | - | - | - | ||||||||||||||||||
|
Doubtful
|
- | - | - | - | - | - | ||||||||||||||||||
|
Loss
|
- | - | - | - | - | - | ||||||||||||||||||
|
Total originated loans
|
169,833 | 10,226 | 243 | 155,874 | 9,625 | 225 | ||||||||||||||||||
|
Acquired loans:
|
||||||||||||||||||||||||
|
Pass
|
5,022 | 7,925 | 2,653 | - | 4,221 | 234 | ||||||||||||||||||
|
Special mention
|
- | - | - | - | - | 143 | ||||||||||||||||||
|
Substandard
|
176 | 15 | - | - | 46 | - | ||||||||||||||||||
|
Doubtful
|
- | - | - | - | - | - | ||||||||||||||||||
|
Loss
|
- | - | - | - | - | - | ||||||||||||||||||
|
Total acquired loans
|
5,198 | 7,940 | 2,653 | - | 4,267 | 377 | ||||||||||||||||||
|
Total
|
$ | 175,031 | $ | 18,166 | $ | 2,896 | $ | 155,874 | $ | 13,892 | $ | 602 | ||||||||||||
| 118 |
|
Bankwell
Financial Group, Inc.
|
|
NOTES
TO CONSOLIDATED FINANCIAL STATEMENTS
|
|
As of December 31, 2014
|
||||||||||||||||||||||||
|
Carrying
|
||||||||||||||||||||||||
|
Amount > 90
|
||||||||||||||||||||||||
|
31-60 Days
|
61-90 Days
|
Greater Than
|
Total Past
|
Days and
|
||||||||||||||||||||
|
Past Due
|
Past Due
|
90 Days
|
Due
|
Current
|
Accruing
|
|||||||||||||||||||
| (In thousands) | ||||||||||||||||||||||||
|
Originated Loans
|
||||||||||||||||||||||||
|
Real estate loans:
|
||||||||||||||||||||||||
|
Residential real estate
|
$ | - | $ | - | $ | - | $ | - | $ | 169,833 | $ | - | ||||||||||||
|
Commercial real estate
|
- | - | 3,436 | 3,436 | 455,070 | 216 | ||||||||||||||||||
|
Construction
|
- | - | - | - | 62,258 | - | ||||||||||||||||||
|
Home equity
|
- | - | - | - | 10,226 | - | ||||||||||||||||||
|
Commercial business
|
- | - | - | - | 120,360 | - | ||||||||||||||||||
|
Consumer
|
- | - | - | - | 243 | - | ||||||||||||||||||
|
Total originated loans
|
- | - | 3,436 | 3,436 | 817,990 | 216 | ||||||||||||||||||
|
Acquired Loans
|
||||||||||||||||||||||||
|
Real estate loans:
|
||||||||||||||||||||||||
|
Residential real estate
|
339 | - | 294 | 633 | 4,565 | 176 | ||||||||||||||||||
|
Commercial real estate
|
685 | 677 | 836 | 2,198 | 60,477 | 466 | ||||||||||||||||||
|
Construction
|
- | - | 835 | 835 | 136 | 835 | ||||||||||||||||||
|
Home equity
|
- | 40 | - | 40 | 7,900 | - | ||||||||||||||||||
|
Commercial business
|
178 | 386 | 305 | 869 | 28,030 | 305 | ||||||||||||||||||
|
Consumer
|
3 | - | - | 3 | 2,650 | - | ||||||||||||||||||
|
Total acquired loans
|
1,205 | 1,103 | 2,270 | 4,578 | 103,758 | 1,782 | ||||||||||||||||||
|
Total loans
|
$ | 1,205 | $ | 1,103 | $ | 5,706 | $ | 8,014 | $ | 921,748 | $ | 1,998 | ||||||||||||
| As of December 31, 2013 | ||||||||||||||||||||||||
|
Carrying
|
||||||||||||||||||||||||
|
Amount > 90
|
||||||||||||||||||||||||
|
31-60 Days
|
61-90 Days
|
Greater Than
|
Total Past
|
Days and
|
||||||||||||||||||||
|
Past Due
|
Past Due
|
90 Days
|
Due
|
Current
|
Accruing
|
|||||||||||||||||||
| (In thousands) | ||||||||||||||||||||||||
|
Originated Loans
|
||||||||||||||||||||||||
|
Real estate loans:
|
||||||||||||||||||||||||
|
Residential real estate
|
$ | - | $ | - | $ | 1,003 | $ | 1,003 | $ | 154,871 | $ | - | ||||||||||||
|
Commercial real estate
|
- | - | - | - | 305,823 | - | ||||||||||||||||||
|
Construction
|
- | - | - | - | 44,187 | - | ||||||||||||||||||
|
Home equity
|
- | - | - | - | 9,625 | - | ||||||||||||||||||
|
Commercial business
|
- | - | - | - | 92,173 | - | ||||||||||||||||||
|
Consumer
|
- | - | - | - | 225 | - | ||||||||||||||||||
|
Total originated loans
|
- | - | 1,003 | 1,003 | 606,904 | - | ||||||||||||||||||
|
Acquired Loans
|
||||||||||||||||||||||||
|
Real estate loans:
|
||||||||||||||||||||||||
|
Residential real estate
|
- | - | - | - | - | - | ||||||||||||||||||
|
Commercial real estate
|
- | - | 797 | 797 | 9,913 | 797 | ||||||||||||||||||
|
Construction
|
- | - | 2,508 | 2,508 | 4,850 | 2,508 | ||||||||||||||||||
|
Home equity
|
- | - | - | - | 4,267 | - | ||||||||||||||||||
|
Commercial business
|
- | - | 315 | 315 | 1,078 | 315 | ||||||||||||||||||
|
Consumer
|
- | - | - | - | 377 | - | ||||||||||||||||||
|
Total acquired loans
|
- | - | 3,620 | 3,620 | 20,485 | 3,620 | ||||||||||||||||||
|
Total loans
|
$ | - | $ | - | $ | 4,623 | $ | 4,623 | $ | 627,389 | $ | 3,620 | ||||||||||||
| 119 |
|
Bankwell
Financial Group, Inc.
|
|
NOTES
TO CONSOLIDATED FINANCIAL STATEMENTS
|
|
December 31,
|
||||||||
|
2014
|
2013
|
|||||||
|
(In thousands)
|
||||||||
|
Residential real estate
|
$ | - | $ | 1,003 | ||||
|
Commercial real estate
|
3,220 | - | ||||||
|
Commercial business
|
142 | - | ||||||
|
Total
|
$ | 3,362 | $ | 1,003 | ||||
| 120 |
|
As of and for the Year Ended December 31, 2014
|
||||||||||||||||||||
|
Unpaid
|
Average
|
Interest
|
||||||||||||||||||
|
Carrying
|
Principal
|
Associated
|
Carrying
|
Income
|
||||||||||||||||
|
Amount
|
Balance
|
Allowance
|
Amount
|
Recognized
|
||||||||||||||||
|
Originated
|
(In thousands)
|
|||||||||||||||||||
|
Impaired loans without a valuation allowance:
|
||||||||||||||||||||
|
Residential real estate
|
$ | 864 | $ | 864 | $ | - | $ | 864 | $ | 28 | ||||||||||
|
Commercial real estate
|
4,543 | 4,544 | - | 4,034 | 223 | |||||||||||||||
|
Home equity
|
91 | 91 | - | 95 | 3 | |||||||||||||||
|
Commercial business
|
1,145 | 1,153 | - | 1,226 | 52 | |||||||||||||||
|
Total impaired loans without a valuation allowance
|
$ | 6,643 | $ | 6,652 | $ | - | $ | 6,219 | $ | 306 | ||||||||||
|
Impaired loans with a valuation allowance:
|
||||||||||||||||||||
|
Commercial real estate
|
$ | 453 | $ | 453 | $ | 23 | $ | 457 | $ | 29 | ||||||||||
|
Commercial business
|
556 | 556 | 10 | 596 | 32 | |||||||||||||||
|
Total impaired loans with a valuation allowance
|
$ | 1,009 | $ | 1,009 | $ | 33 | $ | 1,053 | $ | 61 | ||||||||||
|
Total originated impaired loans
|
$ | 7,652 | $ | 7,661 | $ | 33 | $ | 7,272 | $ | 367 | ||||||||||
|
Acquired
|
||||||||||||||||||||
|
Impaired loans without a valuation allowance:
|
||||||||||||||||||||
|
Commercial business
|
$ | 629 | $ | 629 | $ | - | $ | 607 | $ | 28 | ||||||||||
|
Total impaired loans without a valuation allowance
|
$ | 629 | $ | 629 | $ | - | $ | 607 | $ | 28 | ||||||||||
|
Impaired loans with a valuation allowance:
|
||||||||||||||||||||
|
Total impaired loans with a valuation allowance
|
$ | - | $ | - | $ | - | $ | - | $ | - | ||||||||||
|
Total acquired impaired loans
|
$ | 629 | $ | 629 | $ | - | $ | 607 | $ | 28 | ||||||||||
|
As of and for the Year Ended December 31, 2013
|
||||||||||||||||||||
|
Unpaid
|
Average
|
Interest
|
||||||||||||||||||
|
Carrying
|
Principal
|
Associated
|
Carrying
|
Income
|
||||||||||||||||
|
Amount
|
Balance
|
Allowance
|
Amount
|
Recognized
|
||||||||||||||||
|
Originated
|
(In thousands)
|
|||||||||||||||||||
|
Impaired loans without a valuation allowance:
|
||||||||||||||||||||
|
Total impaired loans without a valuation allowance
|
$ | - | $ | - | $ | - | $ | - | $ | - | ||||||||||
|
Impaired loans with a valuation allowance:
|
||||||||||||||||||||
|
Residential real estate
|
$ | 1,867 | $ | 1,880 | $ | 73 | $ | 1,896 | $ | 36 | ||||||||||
|
Commercial real estate
|
1,117 | 1,117 | 56 | 1,127 | 56 | |||||||||||||||
|
Home equity
|
97 | 97 | 4 | 221 | 7 | |||||||||||||||
|
Commercial business
|
642 | 642 | 12 | 680 | 37 | |||||||||||||||
|
Total impaired loans with a valuation allowance
|
$ | 3,723 | $ | 3,736 | $ | 145 | $ | 3,924 | $ | 136 | ||||||||||
|
Total originated impaired loans
|
$ | 3,723 | $ | 3,736 | $ | 145 | $ | 3,924 | $ | 136 | ||||||||||
|
Acquired
|
||||||||||||||||||||
|
Impaired loans without a valuation allowance:
|
||||||||||||||||||||
|
Total impaired loans without a valuation allowance
|
$ | - | $ | - | $ | - | $ | - | $ | - | ||||||||||
|
Impaired loans with a valuation allowance:
|
||||||||||||||||||||
|
Total impaired loans with a valuation allowance
|
$ | - | $ | - | $ | - | $ | - | $ | - | ||||||||||
|
Total acquired impaired loans
|
$ | - | $ | - | $ | - | $ | - | $ | - | ||||||||||
| 121 |
|
As of and for the Year Ended December 31, 2012
|
||||||||||||||||||||
|
Unpaid
|
Average
|
Interest
|
||||||||||||||||||
|
Carrying
|
Principal
|
Associated
|
Carrying
|
Income
|
||||||||||||||||
|
Amount
|
Balance
|
Allowance
|
Amount
|
Recognized
|
||||||||||||||||
|
Impaired loans without a valuation allowance:
|
||||||||||||||||||||
|
Residential real estate
|
$ | 2,137 | $ | 2,137 | $ | - | $ | 2,273 | $ | 47 | ||||||||||
|
Impaired loans with a valuation allowance:
|
||||||||||||||||||||
|
Commercial real estate
|
1,817 | 1,817 | 249 | 2,461 | 44 | |||||||||||||||
|
Commercial business
|
194 | 194 | 9 | 198 | 14 | |||||||||||||||
|
Total impaired loans with a valuation allowance
|
$ | 2,011 | $ | 2,011 | $ | 258 | $ | 2,659 | $ | 58 | ||||||||||
|
Total impaired loans
|
$ | 4,148 | $ | 4,148 | $ | 258 | $ | 4,932 | $ | 105 | ||||||||||
|
Outstanding Recorded Investment
|
||||||||||||||||||||||||
|
Number of Loans
|
Pre-Modification
|
Post-Modification
|
||||||||||||||||||||||
|
(Dollars in thousands)
|
2014
|
2013
|
2014
|
2013
|
2014
|
2013
|
||||||||||||||||||
|
Years ended December 31,
|
||||||||||||||||||||||||
|
Commercial real estate
|
2 | - | $ | 1,317 | $ | - | $ | 1,317 | $ | - | ||||||||||||||
|
Home equity
|
- | 1 | - | 97 | - | 97 | ||||||||||||||||||
|
Commercial business
|
4 | - | 782 | - | 782 | - | ||||||||||||||||||
|
Total
|
6 | 1 | $ | 2,099 | $ | 97 | $ | 2,099 | $ | 97 | ||||||||||||||
| 122 |
| December 31, | ||||||||
|
2014
|
2013
|
|||||||
|
(In thousands)
|
||||||||
|
Maturity/amortization concession
|
$ | 946 | $ | 97 | ||||
|
Payment concession
|
1,153 | - | ||||||
|
Total
|
$ | 2,099 | $ | 97 | ||||
| 123 |
|
8.
|
P
remises
and
E
quipment
|
|
December 31,
|
||||||||
|
2014
|
2013
|
|||||||
|
(In thousands)
|
||||||||
|
Land
|
$ | 2,300 | $ | 1,450 | ||||
|
Building
|
6,346 | 3,544 | ||||||
|
Leasehold improvements
|
4,280 | 3,157 | ||||||
|
Furniture and fixtures
|
1,842 | 1,456 | ||||||
|
Equipment
|
3,221 | 2,090 | ||||||
| 17,989 | 11,697 | |||||||
|
Accumulated depreciation and amortization
|
(6,079 | ) | (4,637 | ) | ||||
|
Premises and equipment, net
|
$ | 11,910 | $ | 7,060 | ||||
|
9.
|
D
eposits
|
|
December 31,
|
||||||||
|
2014
|
2013
|
|||||||
|
(In thousands)
|
||||||||
|
Noninterest bearing demand deposit accounts
|
$ | 166,030 | $ | 118,618 | ||||
|
Interest bearing accounts:
|
||||||||
|
NOW and money market
|
276,501 | 238,231 | ||||||
|
Savings
|
84,457 | 107,692 | ||||||
|
Time certificates of deposit
|
308,451 | 197,004 | ||||||
|
Total interest bearing accounts
|
669,409 | 542,927 | ||||||
|
Total deposits
|
$ | 835,439 | $ | 661,545 | ||||
|
December 31,
|
||||||||
|
2014
|
2013
|
|||||||
|
(In thousands)
|
||||||||
|
2014
|
- | 173,265 | ||||||
|
2015
|
244,674 | 12,294 | ||||||
|
2016
|
29,462 | 5,707 | ||||||
|
2017
|
14,657 | 5,738 | ||||||
|
2018
|
9,968 | - | ||||||
|
2019
|
9,690 | - | ||||||
| $ | 308,451 | $ | 197,004 | |||||
| 124 |
|
Years Ended December 31,
|
||||||||||||
|
2014
|
2013
|
2012
|
||||||||||
|
(In thousands)
|
||||||||||||
|
NOW and money market
|
$ | 894 | $ | 547 | $ | 657 | ||||||
|
Savings
|
302 | 543 | 846 | |||||||||
|
Time certificates of deposit
|
2,099 | 1,143 | 864 | |||||||||
|
Total interest expense on deposits
|
$ | 3,295 | $ | 2,233 | $ | 2,367 | ||||||
|
10.
|
F
ederal
H
ome
Loan
B
ank
A
dvances
and
O
ther
B
orrowings
|
| December 31, | ||||||||||||||||
|
2014
|
2013 | |||||||||||||||
|
Weighted
|
Weighted
|
|||||||||||||||
|
Amount
|
Average
|
Amount
|
Average
|
|||||||||||||
|
(Dollars in thousands)
|
Due
|
Rate
|
Due
|
Rate
|
||||||||||||
|
Year of Maturity:
|
||||||||||||||||
|
2014
|
- | - | 22,000 | 0.50 | ||||||||||||
|
2015
|
109,000 | 0.31 | 2,000 | 2.75 | ||||||||||||
|
2017
|
20,000 | 0.99 | 20,000 | 0.99 | ||||||||||||
|
Total advances
|
$ | 129,000 | 0.42 | % | $ | 44,000 | 0.83 | % | ||||||||
| 125 |
|
11.
|
C
ommitments
and
C
ontingencies
|
|
2014
|
2013
|
|||||||
|
Period Ending December 31,
|
(In thousands) | |||||||
|
2014
|
$ | - | $ | 1,718 | ||||
|
2015
|
1,788 | 1,714 | ||||||
|
2016
|
1,767 | 1,196 | ||||||
|
2017
|
1,159 | 1,165 | ||||||
|
2018
|
829 | 914 | ||||||
|
Thereafter
|
3,743 | 4,190 | ||||||
| $ | 9,286 | $ | 10,897 | |||||
| 126 |
| December 31, | ||||||||
|
2014
|
2013
|
|||||||
| (In thousands) | ||||||||
|
Commitments to extend credit:
|
||||||||
|
Loan commitments
|
$ | 83,013 | $ | 61,633 | ||||
|
Undisbursed construction loans
|
61,095 | 44,670 | ||||||
|
Unused home equity lines of credit
|
12,340 | 11,575 | ||||||
| $ | 156,448 | $ | 117,878 | |||||
|
12.
|
I
ncome
T
axes
|
|
2014
|
2013
|
2012
|
||||||||||
| (In thousands) | ||||||||||||
|
Current provision:
|
||||||||||||
|
Federal
|
$ | 2,147 | $ | 1,944 | $ | 1,018 | ||||||
|
State
|
718 | 597 | 416 | |||||||||
|
Total current
|
2,865 | 2,541 | 1,434 | |||||||||
|
Deferred provision:
|
||||||||||||
|
Federal
|
(557 | ) | (385 | ) | (508 | ) | ||||||
|
State
|
(139 | ) | 28 | (269 | ) | |||||||
|
Total deferred
|
(696 | ) | (357 | ) | (777 | ) | ||||||
|
Total income tax expense
|
$ | 2,169 | $ | 2,184 | $ | 657 | ||||||
| 127 |
| December 31, | ||||||||||||
|
2014
|
2013
|
2012
|
||||||||||
| (In thousands) | ||||||||||||
|
Income tax expense at statutory federal rate
|
$ | 2,291 | $ | 2,497 | $ | 636 | ||||||
|
State tax expense, net of federal tax effect
|
259 | 239 | 161 | |||||||||
|
Gain from bargain purchase
|
- | (453 | ) | - | ||||||||
|
Income exempt from tax
|
(523 | ) | (294 | ) | (281 | ) | ||||||
|
Other items, net
|
19 | 21 | 205 | |||||||||
|
Income tax expense before change in valuation allowance
|
2,046 | 2,010 | 721 | |||||||||
|
Change in valuation allowance
|
123 | 174 | (64 | ) | ||||||||
|
Income tax expense
|
$ | 2,169 | $ | 2,184 | $ | 657 | ||||||
|
December
31
,
|
||||||||
|
2014
|
2013
|
|||||||
|
(In thousands)
|
||||||||
|
Deferred tax assets:
|
||||||||
|
Allowance for loan losses
|
$ | 4,314 | $ | 3,348 | ||||
|
Net operating loss carryforwards
|
1,539 | 1,479 | ||||||
|
Purchase accounting adjustments
|
504 | 1,094 | ||||||
|
Deferred fees
|
1,144 | 707 | ||||||
|
Deferred Expenses
|
916 | 271 | ||||||
|
Start-up costs
|
346 | 213 | ||||||
|
Unrealized loss on derivatives
|
73 | - | ||||||
|
Other
|
647 | 512 | ||||||
|
Gross deferred tax assets
|
9,483 | 7,624 | ||||||
|
Valuation allowance
|
(806 | ) | (682 | ) | ||||
|
Deferred tax receivable, net of valuation allowance
|
8,677 | 6,942 | ||||||
|
Deferred tax liabilities:
|
||||||||
|
Tax bad debt reserve
|
740 | 499 | ||||||
|
Depreciation
|
370 | 327 | ||||||
|
Unrealized gain on available for sale securities
|
411 | 271 | ||||||
|
Gross deferred tax liabilities
|
1,521 | 1,097 | ||||||
|
Net deferred tax asset
|
$ | 7,156 | $ | 5,845 | ||||
| 128 |
| 129 |
|
For the Years Ended December 31,
|
||||||||||||
|
2014
|
2013
|
2012
|
||||||||||
|
(In thousands, except per share data)
|
||||||||||||
|
Net income
|
$ | 4,568 | $ | 5,161 | $ | 1,214 | ||||||
|
Preferred stock dividends and net accretion
|
(110 | ) | (111 | ) | (132 | ) | ||||||
|
Dividends and undistributed earnings allocated to participating securities
|
(81 | ) | (89 | ) | - | |||||||
|
Net income for earnings per share calculation
|
$ | 4,377 | $ | 4,961 | $ | 1,082 | ||||||
|
Weighted average shares outstanding, basic
|
5,578 | 3,395 | 2,768 | |||||||||
|
Effect of dilutive equity-based awards
|
28 | 56 | 97 | |||||||||
|
Weighted average shares outstanding, diluted
|
5,606 | 3,451 | 2,865 | |||||||||
|
Net earnings per common share:
|
||||||||||||
|
Basic earnings per common share
|
$ | 0.78 | $ | 1.46 | $ | 0.39 | ||||||
|
Diluted earnings per common share
|
0.78 | 1.44 | 0.38 | |||||||||
|
|
||||
|
Year Ended
December 31, 2012 |
||||
|
Weighted average expected lives, in years
|
7.5 | |||
|
Risk-free interest rate
|
1.81 | % | ||
|
Expected stock price volatility
|
35.00 | % | ||
|
Expected annual forfeiture rate
|
6.00 | % | ||
| 130 |
| December 31, | ||||||||||||||||||||||||
| 2014 | 2013 | 2012 | ||||||||||||||||||||||
|
Number
of Shares |
Weighted
Average Exercise Price |
Number
of Shares |
Weighted
Average Exercise Price |
Number
of Shares |
Weighted
Average Exercise Price |
|||||||||||||||||||
|
Options outstanding at
beginning of period
|
208,568 | $ | 16.67 | 272,358 | $ | 15.23 | 277,558 | $ | 14.60 | |||||||||||||||
|
Granted
|
- | - | - | - | 9,650 | 15.00 | ||||||||||||||||||
|
Issued resulting from Acquisitions
|
61,040 | 17.86 | - | - | - | - | ||||||||||||||||||
|
Forfeited
|
(4,270 | ) | 18.32 | (4,080 | ) | 17.42 | (14,850 | ) | 13.13 | |||||||||||||||
|
Exercised
|
(20,305 | ) | 10.17 | (46,640 | ) | 10.02 | - | - | ||||||||||||||||
|
Expired
|
(40,240 | ) | 17.77 | (13,070 | ) | 10.00 | - | - | ||||||||||||||||
|
Options outstanding at end of period
|
204,793 | 17.42 | 208,568 | 16.67 | 272,358 | 15.23 | ||||||||||||||||||
|
Options exercisable at end of period
|
193,432 | 17.55 | 188,852 | 16.84 | 241,237 | 15.23 | ||||||||||||||||||
|
Weighted-average fair value of options granted during the period
|
N/A | N/A | $ | 6.54 | ||||||||||||||||||||
|
|
||||||||||||||||||||||
| December 31, | ||||||||||||||||||||||
| 2014 | 2013 | 2012 | ||||||||||||||||||||
|
Number
of Shares |
Weighted
Average
|
Number
of Shares |
Weighted
Average
|
Number
of Shares |
Weighted
Average
Fair Value |
|||||||||||||||||
|
Unvested at beginning of
period
|
122,140 | $ | 15.98 | 49,500 | $ | 15.00 | 30,000 | $ | 15.96 | |||||||||||||
|
Granted
|
127,610 | 19.09 | 87,456 | 16.38 | 49,500 | 15.00 | ||||||||||||||||
|
Vested
|
(32,237 | ) | 17.62 | (12,900 | ) | 14.92 | (30,000 | ) | 15.96 | |||||||||||||
|
Forfeited
|
(51,651 | ) | 15.89 | (1,916 | ) | 15.95 | - | - | ||||||||||||||
|
Unvested at end of period
|
165,862 | 18.08 | 122,140 | 15.98 | 49,500 | 15.00 | ||||||||||||||||
| 131 |
|
Net Unrealized Gain
(Loss) on Available
|
Net Unrealized Gain
(Loss) on Interest
|
Total
|
||||||||||
|
(In thousands
)
|
||||||||||||
|
Balance at December 31, 2013
|
$ | 424 | $ | - | $ | 424 | ||||||
|
Other comprehensive income (loss) before reclassifications
|
220 | (113 | ) | 107 | ||||||||
|
Amounts reclassified from accumulated other
comprehensive income
|
- | - | - | |||||||||
|
Net other comprehensive income (loss)
|
220 | (113 | ) | 107 | ||||||||
|
Balance at December 31, 2014
|
$ | 644 | $ | (113 | ) | $ | 531 | |||||
| 132 |
|
|
||||
|
|
||||
|
Net Unrealized Gain
(Loss) on Available
|
||||
|
(In thousands)
|
||||
|
Balance at December 31, 2011
|
$ | 810 | ||
|
Other comprehensive loss before reclassifications
|
701 | |||
|
Amounts reclassified from accumulated other comprehensive income
|
- | |||
|
Net other comprehensive loss
|
701 | |||
|
Balance at December 31, 2012
|
$ | 1,511 | ||
|
Other comprehensive loss before reclassifications
|
(1,087 | ) | ||
|
Amounts reclassified from accumulated other comprehensive income
|
- | |||
|
Net other comprehensive loss
|
(1,087 | ) | ||
|
Balance at December 31, 2013
|
$ | 424 | ||
|
(Dollars in thousands)
|
Notional
Amount
|
Maturity
|
Received
|
Paid
|
Fair
Value
|
||||||||||||
|
Cash flow hedge:
|
|||||||||||||||||
|
Interest rate swap on FHLB advance
|
$ | 25,000 |
4.7 years
|
0.26 | % | 1.62 | % | $ | (73 | ) | |||||||
|
Interest rate swap on forward -starting FHLB advance
|
$ | 25,000 |
5.0 years
|
0.26 | % | 1.83 | % | $ | (113 | ) | |||||||
|
|
|
|
|||||||
|
(Dollars in thousands)
|
Notional
Amount
|
Effective Date of
Hedged Borrowing
|
Duration of
Borrowing
|
Counterparty
|
|||||
|
Type of borrowing:
|
|||||||||
|
FHLB 90-day advance
|
$ | 25,000 |
April 1, 2014
|
4.7 years
|
Bank of Montreal
|
||||
|
FHLB 90-day advance
|
$ | 25,000 |
January 2, 2015
|
5.0 years
|
Bank of Montreal
|
||||
| 133 |
|
(In thousands)
|
December 31, 2014
|
|||
|
Interest rate swap on FHLB advance:
|
||||
|
Unrealized loss recognized in accumulated other
comprehensive income
|
$ | (186 | ) | |
|
Income tax benefit on items recognized in
accumulated other comprehensive income
|
73 | |||
|
Other comprehensive income
|
$ | (113 | ) | |
|
Interest expense recognized on hedged FHLB advance
|
$ | 264 | ||
| 134 |
| December 31, 2014 | ||||||||||||||||||||
|
Carrying
|
Fair
|
|||||||||||||||||||
|
Value
|
Value
|
Level 1
|
Level 2
|
Level 3
|
||||||||||||||||
|
(In thousands)
|
||||||||||||||||||||
|
Financial Assets:
|
||||||||||||||||||||
|
Cash and due from banks
|
$ | 48,559 | $ | 48,559 | $ | 48,559 | $ | - | $ | - | ||||||||||
|
Available for sale securities
|
65,009 | 65,009 | - | 65,009 | - | |||||||||||||||
|
Held to maturity securities
|
11,454 | 11,470 | - | 11,470 | - | |||||||||||||||
|
Loans held for sale
|
586 | 586 | - | 586 | - | |||||||||||||||
|
Loans receivable, net
|
915,981 | 920,031 | - | - | 920,031 | |||||||||||||||
|
Accrued interest receivable
|
3,323 | 3,323 | - | - | 3,323 | |||||||||||||||
|
FHLB stock
|
6,109 | 6,109 | - | - | 6,109 | |||||||||||||||
|
Financial Liabilities:
|
||||||||||||||||||||
|
Demand deposits
|
$ | 166,030 | $ | 166,030 | $ | - | $ | - | $ | 166,030 | ||||||||||
|
NOW and money market
|
276,501 | 276,501 | - | - | 276,501 | |||||||||||||||
|
Savings
|
84,457 | 84,457 | - | - | 84,457 | |||||||||||||||
|
Time deposits
|
308,451 | 310,165 | - | - | 310,165 | |||||||||||||||
|
Advances from the FHLB
|
129,000 | 128,961 | - | - | 128,961 | |||||||||||||||
|
Derivative
liability
|
186 | 186 | - | 186 | - | |||||||||||||||
| December 31, 2013 | ||||||||||||||||||||
|
Carrying
|
Fair
|
|||||||||||||||||||
|
Value
|
Value
|
Level 1
|
Level 2
|
Level 3
|
||||||||||||||||
|
(In thousands)
|
||||||||||||||||||||
|
Financial Assets:
|
||||||||||||||||||||
|
Cash and due from banks
|
$ | 82,013 | $ | 82,013 | $ | 82,013 | $ | - | $ | - | ||||||||||
|
Available for sale securities
|
28,597 | 28,597 | - | 28,597 | - | |||||||||||||||
|
Held to maturity securities
|
13,816 | 13,815 | - | 13,815 | - | |||||||||||||||
|
Loans held for sale
|
100 | 100 | - | 100 | - | |||||||||||||||
|
Loans receivable, net
|
621,830 | 623,876 | - | - | 623,876 | |||||||||||||||
|
Accrued interest receivable
|
2,360 | 2,360 | - | - | 2,360 | |||||||||||||||
|
FHLB stock
|
4,834 | 4,834 | - | - | 4,834 | |||||||||||||||
|
Financial Liabilities:
|
||||||||||||||||||||
|
Demand deposits
|
$ | 118,618 | $ | 118,618 | $ | - | $ | - | $ | 118,618 | ||||||||||
|
NOW and money market
|
238,231 | 238,231 | - | - | 238,231 | |||||||||||||||
|
Savings
|
107,692 | 107,692 | - | - | 107,692 | |||||||||||||||
|
Time deposits
|
197,004 | 197,762 | - | - | 197,762 | |||||||||||||||
|
Advances from the FHLB
|
44,000 | 43,902 | - | - | 43,902 | |||||||||||||||
| 135 |
|
|
Level
1 — Quoted prices (unadjusted) for identical assets or liabilities in active markets that the entity has the ability to access as of the measurement date.
|
|
|
Level 2 — Significant other observable inputs other than Level 1 prices such as quoted prices for similar assets or liabilities; quoted prices in markets that are not active; or other inputs that are observable or can be corroborated by observable market data.
|
|
|
Level 3 — Significant unobservable inputs that reflect a company’s
own assumptions about the assumptions that market participants would use in pricing an asset or liability.
|
| 136 |
|
Fair Value
|
||||||||||||
|
(In thousands)
|
Level 1
|
Level 2
|
Level 3
|
|||||||||
|
December 31, 2014:
|
||||||||||||
|
Available-for-sale investment securities:
|
||||||||||||
|
U.S. Government and agency obligations
|
$ | - | $ | 24,418 | $ | - | ||||||
|
State agency and municipal obligations
|
- | 18,584 | - | |||||||||
|
Corporate bonds
|
- | 16,325 | - | |||||||||
|
Mortgage backed securities
|
- | 5,682 | - | |||||||||
|
Derivative Liability
|
- | (186 | ) | - | ||||||||
|
December 31, 2013:
|
||||||||||||
|
Available-for-sale investment securities:
|
||||||||||||
|
U.S. Government and agency obligations
|
$ | - | $ | 5,688 | $ | - | ||||||
|
State agency and municipal obligations
|
- | 12,132 | - | |||||||||
|
Corporate bonds
|
- | 9,556 | - | |||||||||
|
Mortgage backed securities
|
- | 1,211 | - | |||||||||
| 137 |
| Fair Value | ||||||||||||
|
(In thousands)
|
Level 1
|
Level 2
|
Level 3
|
|||||||||
|
December 31, 2014:
|
||||||||||||
|
Impaired loans
|
$ | - | $ | - | $ | 8,281 | ||||||
|
Foreclosed real estate
|
- | - | 950 | |||||||||
|
December 31, 2013:
|
||||||||||||
|
Impaired loans
|
$ | - | $ | - | $ | 3,723 | ||||||
|
Foreclosed real estate
|
- | - | 829 | |||||||||
| Fair |
Valuation
|
Unobservable
|
Range
|
||||||
|
(Dollars in thousands)
|
Value
|
Methodology
|
Input
|
(Weighted Average)
|
|||||
|
December 31, 2013:
|
|||||||||
|
Impaired loans
|
$
|
8,281
|
Appraisals
|
Discount for dated appraisals
|
-
|
||||
|
Discounted cash flows
|
Discount rate
|
3.25% to 8.25%
|
|||||||
|
Foreclosed real estate
|
$
|
950
|
Appraisals
|
Discount for dated appraisals
|
7.34% to 66.6%
|
||||
|
December 31, 2013:
|
|||||||||
|
Impaired loans
|
$
|
3,723
|
Appraisals
|
Discount for dated appraisals
|
0% to 20.0%
|
||||
|
Discounted cash flows
|
Discount rate
|
6.0%
|
|||||||
|
Foreclosed real estate
|
$
|
829
|
Appraisals
|
Discount for dated appraisals
|
34.8% to 66.6%
|
||||
| 138 |
|
To be Well
|
||||||||||||||||||||||||
| Capitalized Under | ||||||||||||||||||||||||
|
For Capital
|
Prompt Corrective | |||||||||||||||||||||||
|
Actual Capital
|
Adequacy Purposes | Action Provisions | ||||||||||||||||||||||
|
(Dollars in thousands)
|
Amount
|
Ratio
|
Amount
|
Ratio
|
Amount
|
Ratio
|
||||||||||||||||||
|
Bankwell Bank
|
||||||||||||||||||||||||
|
December 31, 2014
|
||||||||||||||||||||||||
|
Total Capital to Risk-Weighted Assets
|
$ | 125,339 | 13.55 | % | $ | 74,003 | 8.00 | % | $ | 92,503 | 10.00 | % | ||||||||||||
|
Tier I Capital to Risk-Weighted Assets
|
115,359 | 12.47 | % | 37,001 | 4.00 | % | 55,502 | 6.00 | % | |||||||||||||||
|
Tier I Capital to Average Assets
|
115,359 | 11.12 | % | 41,485 | 4.00 | % | 51,856 | 5.00 | % | |||||||||||||||
|
Bankwell Financial Group, Inc.
|
||||||||||||||||||||||||
|
December 31, 2014
|
||||||||||||||||||||||||
|
Total Capital to Risk-Weighted Assets
|
$ | 135,223 | 14.59 | % | $ | 74,136 | 8.00 | % | N/A | N/A | ||||||||||||||
|
Tier I Capital to Risk-Weighted Assets
|
125,243 | 13.51 | % | 37,068 | 4.00 | % | N/A | N/A | ||||||||||||||||
|
Tier I Capital to Average Assets
|
125,243 | 11.78 | % | 42,516 | 4.00 | % | N/A | N/A | ||||||||||||||||
| 139 |
|
To be Well
|
||||||||||||||||||||||||
| Capitalized Under | ||||||||||||||||||||||||
|
For Capital
|
Prompt Corrective | |||||||||||||||||||||||
|
Actual Capital
|
Adequacy Purposes | Action Provisions | ||||||||||||||||||||||
|
(Dollars in thousands)
|
Amount
|
Ratio
|
Amount
|
Ratio
|
Amount
|
Ratio
|
||||||||||||||||||
|
Bankwell Bank
|
||||||||||||||||||||||||
|
December 31, 2013
|
||||||||||||||||||||||||
|
Total Capital to Risk-Weighted Assets
|
$ | 66,674 | 10.74 | % | $ | 49,682 | 8.00 | % | $ | 62,103 | 10.00 | % | ||||||||||||
|
Tier I Capital to Risk-Weighted Assets
|
58,908 | 9.49 | % | 24,841 | 4.00 | % | 37,262 | 6.00 | % | |||||||||||||||
|
Tier I Capital to Average Assets
|
58,908 | 7.91 | % | 29,772 | 4.00 | % | 37,215 | 5.00 | % | |||||||||||||||
|
Bankwell Financial Group, Inc.
|
||||||||||||||||||||||||
|
December 31, 2013
|
||||||||||||||||||||||||
|
Total Capital to Risk-Weighted Assets
|
$ | 76,537 | 12.32 | % | $ | 49,683 | 8.00 | % | N/A | N/A | ||||||||||||||
|
Tier I Capital to Risk-Weighted Assets
|
68,766 | 11.07 | % | 24,841 | 4.00 | % | N/A | N/A | ||||||||||||||||
|
Tier I Capital to Average Assets
|
68,766 | 9.15 | % | 30,068 | 4.00 | % | N/A | N/A | ||||||||||||||||
| 140 |
| December 31, | ||||||||||||
|
2014
|
2013
|
2012
|
||||||||||
| (In thousands) | ||||||||||||
|
Balance, beginning of year
|
$ | 7,346 | $ | 5,260 | $ | 5,098 | ||||||
|
Additional loans
|
6,606 | 13,775 | 3,769 | |||||||||
|
Repayments and changes in status
|
(6,443 | ) | (11,689 | ) | (3,607 | ) | ||||||
|
Balance, end of year
|
$ | 7,509 | $ | 7,346 | $ | 5,260 | ||||||
| 141 |
|
December 31,
|
||||||||
|
2014
|
2013
|
|||||||
|
(Dollars in Thousands)
|
||||||||
|
ASSETS
|
||||||||
|
Cash and due from banks
|
$ | 6,640 | $ | 7,962 | ||||
|
Investment in subsidiary
|
119,326 | 59,627 | ||||||
|
Premises and equipment, net
|
204 | 289 | ||||||
|
Deferred income taxes, net
|
3,256 | 2,410 | ||||||
|
Other assets
|
1,644 | 416 | ||||||
|
Total assets
|
$ | 131,070 | $ | 70,704 | ||||
|
LIABILITIES AND SHAREHOLDERS’ EQUITY
|
||||||||
|
Accrued expenses and other liabilities
|
$ | 1,860 | $ | 1,219 | ||||
|
Stockholders’ equity
|
129,210 | 69,485 | ||||||
|
Total liabilities and stockholders’ equity
|
$ | 131,070 | $ | 70,704 | ||||
| Year Ended December 31, | ||||||||||||
|
2014
|
2013
|
2012
|
||||||||||
| (Dollars in Thousands) | ||||||||||||
|
Interest income
|
$ | 45 | $ | 26 | $ | 15 | ||||||
|
Other income
|
- | 4,167 | 2,264 | |||||||||
|
Total
income
|
45 | 4,193 | 2,279 | |||||||||
|
Expenses
|
1,728 | 5,711 | 4,261 | |||||||||
|
Loss
before equity in undistributed earnings of subsidiaries
|
(1,683 | ) | (1,518 | ) | (1,982 | ) | ||||||
|
Equity in undistributed earnings of subsidiaries
|
6,251 | 6,679 | 3,196 | |||||||||
|
Net Income
|
$ | 4,568 | $ | 5,161 | $ | 1,214 | ||||||
| 142 |
| For the Years Ended December 31, | ||||||||||||
|
2014
|
2013
|
2012
|
||||||||||
| (Dollars in Thousands) | ||||||||||||
|
Cash flows from operating activities
|
||||||||||||
|
Net income
|
$ | 4,568 | $ | 5,161 | $ | 1,214 | ||||||
|
Adjustments to reconcile net income to net cash provided by operating activities:
|
||||||||||||
|
Equity in undistributed earnings
|
(6,251 | ) | (6,679 | ) | (3,196 | ) | ||||||
|
Increase
in other assets
|
(1,245 | ) | (97 | ) | (203 | ) | ||||||
|
(Decrease)
Increase in premises and equipment, net
|
85 | 6 | (283 | ) | ||||||||
|
Increase
in deferred income taxes, net
|
(846 | ) | (452 | ) | (1,508 | ) | ||||||
|
Increase
in other liabilities
|
641 | 491 | 234 | |||||||||
|
Stock-based
compensation
|
573 | 259 | 481 | |||||||||
|
Net
cash used by operating activities
|
(2,475 | ) | (1,311 | ) | (3,261 | ) | ||||||
|
Cash flows from investing activities
|
||||||||||||
|
Cash paid for acquisitions
|
(3,648 | ) | (5,035 | ) | - | |||||||
|
Capital contribution to Bankwell Bank
|
(40,000 | ) | - | - | ||||||||
|
Net cash used by investing activities
|
(43,648 | ) | (5,035 | ) | - | |||||||
|
Cash flows from financing activities
|
||||||||||||
|
Proceeds from exercise of options
|
207 | 467 | - | |||||||||
|
Dividends paid on preferred stock
|
(110 | ) | (111 | ) | (132 | ) | ||||||
|
Proceeds from stock offering
|
44,704 | 13,178 | - | |||||||||
|
Net cash provided by financing activities
|
44,801 | 13,534 | (132 | ) | ||||||||
|
Net
(decrease) increase in cash and cash equivalents
|
(1,322 | ) | 7,188 | (3,393 | ) | |||||||
|
Cash and cash equivalents:
|
||||||||||||
|
Beginning of year
|
7,962 | 774 | 4,167 | |||||||||
|
End of period
|
$ | 6,640 | $ | 7,962 | $ | 774 | ||||||
|
Supplemental disclosures of cash flows information:
|
||||||||||||
|
Cash paid for:
|
||||||||||||
|
Interest
|
$ | - | $ | - | $ | - | ||||||
|
Income taxes
|
- | - | - | |||||||||
| 143 |
| 2014 | ||||||||||||||||
|
4th Quarter
|
3rd Quarter
|
2nd Quarter
|
1st Quarter
|
|||||||||||||
|
Total interest income
|
$ | 11,016 | $ | 8,668 | $ | 8,044 | $ | 7,861 | ||||||||
|
Total interest expense
|
1,245 | 1,073 | 896 | 715 | ||||||||||||
|
Net interest income
|
9,771 | 7,595 | 7,148 | 7,146 | ||||||||||||
|
Provision for loan losses
|
1,305 | 566 | 70 | 211 | ||||||||||||
|
Non-interest income
|
833 | 757 | 682 | 769 | ||||||||||||
|
Non-interest expense
|
8,344 | 5,530 | 5,897 | 6,041 | ||||||||||||
|
Income before income taxes
|
955 | 2,256 | 1,863 | 1,663 | ||||||||||||
|
Provision from income taxes
|
228 | 765 | 636 | 540 | ||||||||||||
|
Net income
|
$ | 727 | $ | 1,491 | $ | 1,227 | $ | 1,123 | ||||||||
|
Net income attributable to common stockholders
|
$ | 698 | $ | 1,464 | $ | 1,200 | $ | 1,096 | ||||||||
|
Earnings per share:
|
||||||||||||||||
|
Basic
|
$ | 0.10 | $ | 0.22 | $ | 0.23 | $ | 0.28 | ||||||||
|
Diluted
|
$ | 0.10 | $ | 0.22 | $ | 0.23 | $ | 0.28 | ||||||||
| 2013 | ||||||||||||||||
|
4th Quarter
|
3rd Quarter
|
2nd Quarter
|
1st Quarter
|
|||||||||||||
|
Total interest income
|
$ | 7,394 | $ | 7,121 | $ | 6,901 | $ | 6,676 | ||||||||
|
Total interest expense
|
794 | 727 | 653 | 591 | ||||||||||||
|
Net interest income
|
6,600 | 6,394 | 6,248 | 6,085 | ||||||||||||
|
Provision for loan losses
|
96 | 47 | 252 | 190 | ||||||||||||
|
Non-interest income
|
1,832 | 1,083 | 1,524 | 284 | ||||||||||||
|
Non-interest expense
|
7,060 | 5,331 | 5,131 | 4,598 | ||||||||||||
|
Income before income taxes
|
1,276 | 2,099 | 2,389 | 1,581 | ||||||||||||
|
Provision (benefit) from income taxes
|
(86 | ) | 780 | 921 | 569 | |||||||||||
|
Net income
|
$ | 1,362 | $ | 1,319 | $ | 1,468 | $ | 1,012 | ||||||||
|
Net income attributable to common stockholders
|
$ | 1,334 | $ | 1,290 | $ | 1,441 | $ | 985 | ||||||||
|
Earnings per share:
|
||||||||||||||||
|
Basic
|
$ | 0.34 | $ | 0.38 | $ | 0.43 | $ | 0.31 | ||||||||
|
Diluted
|
$ | 0.34 | $ | 0.37 | $ | 0.42 | $ | 0.30 | ||||||||
| 144 |
| 145 |
|
Number
|
Description
|
|
|
Exhibit 3.1
|
Certificate of Incorporation as amended to date
(1)
|
|
|
Exhibit 3.2
|
Amended and Restated Bylaws
(1)
|
|
|
Exhibit 10.1†
|
Employment Agreement of Christopher Gruseke dated February 25, 2015
|
|
|
Exhibit 10.2†
|
Employment Agreement of Gail E.D. Brathwaite dated April 1, 2013
(1)
|
|
|
Exhibit 10.3†
|
Employment Agreement of Ernest J. Verrico, Sr. dated April 23, 2013
(1)
|
|
|
Exhibit 10.4†
|
Employment Agreement of Heidi S. DeWyngaert dated January 30, 2013
(1)
|
|
|
Exhibit 10.5†
|
2002 Bank Management, Director and Founder Stock Option Plan
(1)
|
|
|
Exhibit 10.6†
|
2006 Bank of New Canaan Stock Option Plan
(1)
|
|
|
Exhibit 10.7†
|
2007 Bank of New Canaan Stock Option and Equity Award Plan
(1)
|
|
|
Exhibit 10.8†
|
2011 BNC Financial Group, Inc. Stock Option and Equity Award Plan
(1)
|
|
|
Exhibit 10.9†
|
2012 BNC Financial Group, Inc. Stock Plan
(1)
|
|
|
Exhibit 10.10†
|
Amendment to the 2012 BNC Financial Group, Inc. Stock Plan
(1)
|
|
|
Exhibit 10.11†
|
BNC Financial Group, Inc. and Affiliates Deferred Compensation Plan for Directors, January 23, 2008
(1)
|
|
|
Exhibit 10.12
|
Small Business Lending Fund Securities Purchase Agreement with the Secretary of the Treasury dated August 4, 2011
(1)
|
|
|
Exhibit 10.13
|
Agreement and Plan of Merger by and among BNC Financial Group, Inc., The Bank of New Canaan and The Wilton Bank dated as of June 14, 2013
(1)
|
|
|
Exhibit 10.14
|
Securities Purchase Agreement dated September 30, 2013
(1)
|
|
|
Exhibit 10.15
|
Agreement and Plan of Merger by and among Bankwell Financial Group, Inc. and Quinnipiac Bank & Trust Company dated March 31, 2014
(1)
|
|
|
Exhibit 10.16
|
Form of Director Indemnification Agreement
(2)
|
|
|
Exhibit 10.17
|
Form of Executive Officer Indemnification Agreement
(2)
|
|
|
Exhibit 21.1
|
Subsidiaries of the Registrant
(1)
|
|
|
Exhibit 23.2
|
Consent of Whittlesey & Hadley, P.C.
|
|
|
Exhibit 31.1
|
Certification of Christopher Gruseke Pursuant to Rule 13a-14(a)
|
|
|
Exhibit 31.2
|
Certification of Ernest J. Verrico, Sr. pursuant to Rule 13a-14(a)
|
|
|
Exhibit 32
|
Certification pursuant to Section 906 of the Sarbanes-Oxley Act of 2002
|
|
|
101
|
The following materials from Bankwell Financial Group, Inc.’s Annual Report on Form 10-K for the period ended December 31, 2014, formatted in eXtensible Business Reporting Language (XBRL): (i) Consolidated Statements of Financial Condition; (ii) Consolidated Statements of Income; (iii) Consolidated statements of Comprehensive Income; (iv) Consolidated Statements of Shareholders’ Equity; (v) Consolidated Statements of Cash Flows; and (vi) Notes to Consolidated Financial Statements.
|
| 146 |
| BANKWELL FINANCIAL GROUP, INC. | |||
|
By:
|
/s/ Christopher Gruseke | ||
|
Christopher Gruseke
|
|||
|
President and Chief Executive Officer
|
|||
|
Signature & Title
|
Date
|
|
| /s/ Christopher Gruseke |
March 16, 2015
|
|
|
Christopher Gruseke
|
||
|
President and Chief Executive Officer
|
||
| /s/ Ernest J. Verrico, Sr. |
March 16, 2015
|
|
|
Ernest J. Verrico, Sr.
|
||
|
Executive Vice President & Chief Financial Officer
|
||
| /s/ Frederick R. Afragola |
March 16, 2015
|
|
|
Frederick R. Afragola
|
||
|
Director
|
||
| /s/ George P. Bauer |
March 16, 2015
|
|
|
George P. Bauer
|
||
|
Director
|
||
| /s/ Michael Brandt |
March 16, 2015
|
|
|
Michael Brandt
|
||
|
Director
|
||
| /s/ Richard Castiglioni |
March 16, 2015
|
|
|
Richard Castiglioni
|
||
|
Director
|
||
| /s/ Eric J. Dale |
March 16, 2015
|
|
|
Eric J. Dale
|
||
|
Director
|
||
| /s/ Blake S. Drexler |
March 16, 2015
|
|
|
Blake S. Drexler
|
||
|
Director
|
||
| /s/ James A. Fieber |
March 16, 2015
|
|
|
James A. Fieber
|
||
|
Director
|
||
| 147 |
| /s/ William J. Fitzpatrick III |
March 16, 2015
|
|
|
William J. Fitzpatrick III
|
||
|
Director
|
||
| /s/ Daniel S. Jones |
March 16, 2015
|
|
|
Daniel S. Jones
|
||
|
Director
|
||
| /s/ Carl R. Kuehner III |
March 16, 2015
|
|
|
Carl R. Kuehner III
|
||
|
Director
|
||
| /s/ Todd Lampert |
March 16, 2015
|
|
|
Todd Lampert
|
||
|
Director
|
||
| /s/ Victor S. Liss |
March 16, 2015
|
|
|
Victor S. Liss
|
||
|
Director
|
||
| /s/ Raymond W. Palumbo |
March 16, 2015
|
|
|
Raymond W. Palumbo
|
||
|
Director
|
| 148 |