BWX TECHNOLOGIES, INC.
10-Ks and 10-Qs
|
|
|
|
|
|
|
|
|
|
|
|
|
|
|
|
|
|
|
|
|
|
|
|
|
|
|
|
|
|
|
|
|
|
|
|
|
|
|
|
|
|
|
|
|
|
|
|
|
|
UNITED STATES
SECURITIES AND EXCHANGE COMMISSION
Washington, D.C. 20549
_____________________________________________________________
FORM 10–K
_____________________________________________________________
(Mark One)
|
ý
|
ANNUAL REPORT PURSUANT TO SECTION 13 OR 15(d) OF THE SECURITIES EXCHANGE ACT OF 1934
|
For the fiscal year ended
December 31, 2017
.
OR
|
¨
|
TRANSITION REPORT PURSUANT TO SECTION 13 OR 15(d) OF THE SECURITIES EXCHANGE ACT OF 1934
|
For the transition period from
to
.
Commission File Number 001-34658
_____________________________________________________________
BWX TECHNOLOGIES, INC.
(Exact name of registrant as specified in its charter)
_____________________________________________________________
|
DELAWARE
|
|
80-0558025
|
|
(State or Other Jurisdiction of
Incorporation or Organization)
|
|
(I.R.S. Employer
Identification No.)
|
|
800 MAIN STREET, 4TH FLOOR
|
|
|
|
LYNCHBURG, VIRGINIA
|
|
24504
|
|
(Address of Principal Executive Offices)
|
|
(Zip Code)
|
Registrant's Telephone Number, Including Area Code: (980) 365-4300
Securities Registered Pursuant to Section 12(b) of the Act:
|
Title of each class
|
|
Name of each Exchange on which registered
|
|
Common Stock, $0.01 par value
|
|
New York Stock Exchange
|
Securities registered pursuant to Section 12(g) of the Act: None
_____________________________________________________________
Indicate by check mark if the registrant is a well-known seasoned issuer, as defined in Rule 405 of the Securities Act. Yes
ý
No
¨
Indicate by check mark if the registrant is not required to file reports pursuant to Section 13 or Section 15(d) of the Exchange Act. Yes
¨
No
ý
Indicate by check mark whether the registrant (1) has filed all reports required to be filed by Section 13 or 15(d) of the Securities Exchange Act of 1934 during the preceding 12 months (or for such shorter period that the registrant was required to file such reports), and (2) has been subject to such filing requirements for the past 90 days. Yes
ý
No
¨
Indicate by check mark whether the registrant has submitted electronically and posted on its corporate Web site, if any, every Interactive Data File required to be submitted and posted pursuant to Rule 405 of Regulation S-T (§232.405 of this chapter) during the preceding 12 months (or for such shorter period that the registrant was required to submit and post such files). Yes
ý
No
¨
Indicate by check mark if disclosure of delinquent filers pursuant to Item 405 of Regulation S-K is not contained herein and will not be contained, to the best of registrant's knowledge, in definitive proxy or information statements incorporated by reference in Part III of this Form 10-K or any amendment to this Form 10-K.
¨
Indicate by check mark whether the registrant is a large accelerated filer, an accelerated filer, a non-accelerated filer, smaller reporting company, or an emerging growth company. See the definitions of "large accelerated filer," "accelerated filer," "smaller reporting company," and "emerging growth company" in Rule 12b-2 of the Exchange Act. (Check one):
|
Large accelerated filer
|
|
ý
|
Accelerated filer
|
|
¨
|
|
|
Non-accelerated filer
|
|
¨
(Do not check if a smaller reporting company)
|
Smaller reporting company
|
|
¨
|
|
|
Emerging growth company
|
|
¨
|
||||
If an emerging growth company, indicate by check mark if the registrant has elected not to use the extended transition period for complying with any new or revised financial accounting standards provided pursuant to Section 13(a) of the Exchange Act.
¨
Indicate by check mark whether the registrant is a shell company (as defined in Rule 12b-2 of the Exchange Act). Yes
¨
No
ý
The aggregate market value of the registrant's common stock held by nonaffiliates of the registrant on the last business day of the registrant's most recently completed second fiscal quarter (based on the closing sales price on the New York Stock Exchange on
June 30, 2017
) was approximately
$4.8 billion
.
The number of shares of the registrant's common stock outstanding at
February 23, 2018
was
99,487,519
.
DOCUMENTS INCORPORATED BY REFERENCE
Portions of the registrant's proxy statement for the
2018
Annual Meeting of Stockholders are incorporated by reference into Part III of this Form 10-K.
BWX TECHNOLOGIES, INC.
INDEX – FORM 10-K
|
|
PAGE
|
|
|
Years Ended December 31, 2017, 2016 and 2015
|
||
|
December 31, 2017 and December 31, 2016
|
||
|
Years Ended December 31, 2017, 2016 and 2015
|
||
i
|
|
PAGE
|
|
|
Years Ended December 31, 2017, 2016 and 2015
|
||
|
Years Ended December 31, 2017, 2016 and 2015
|
||
|
Years Ended December 31, 2017, 2016 and 2015
|
||
ii
Statements we make in this Annual Report on Form 10-K ("Report"), which express a belief, expectation or intention, as well as those that are not historical fact, are forward-looking statements within the meaning of the Private Securities Litigation Reform Act of 1995. These forward-looking statements are subject to various risks, uncertainties and assumptions, including those to which we refer under the headings "Cautionary Statement Concerning Forward-Looking Statements" and "Risk Factors" in Items 1 and 1A of Part I of this Report. In this Report, unless the context otherwise indicates, "we," "us" and "our" mean BWX Technologies, Inc. ("BWXT" or the "Company") and its consolidated subsidiaries.
|
Item 1.
|
BUSINESS
|
General
BWX Technologies, Inc. is a specialty manufacturer of nuclear components, a developer of nuclear technologies and a service provider with an operating history of more than 100 years. Our core businesses focus on the design, engineering and manufacture of precision naval nuclear components, reactors and nuclear fuel for the U.S. Government. We also provide special nuclear materials processing and environmental site restoration services, as well as a variety of products and services to customers in the nuclear power industry. While we provide a wide range of products and services, our business segments are heavily focused on major projects. At any given time, a relatively small number of projects can represent a significant part of our operations.
On June 30, 2015, we completed the spin-off of our former Power Generation business (the "spin-off") into an independent, publicly traded company named Babcock & Wilcox Enterprises, Inc. ("BWE"). The separation was effected through a pro rata distribution of 100% of BWE's common stock to BWXT's stockholders. The distribution consisted of one share of BWE common stock for every two shares of BWXT common stock to holders of our common stock on June 18, 2015. Cash was paid in lieu of any fractional shares of BWE common stock. BWXT did not retain any ownership interest in BWE following the spin-off. Concurrent with the spin-off, we changed our name to BWX Technologies, Inc. Our common stock is listed on the New York Stock Exchange under the trading symbol BWXT.
Prior to June 30, 2015, we completed an internal restructuring that reorganized the subsidiaries involved in our former Power Generation business and established BWE as the direct or indirect parent company of all those subsidiaries. The results of operations of our former Power Generation business are presented as discontinued operations on the consolidated statements of income. We have presented the notes to our consolidated financial statements on the basis of continuing operations, unless otherwise stated.
Business Segments
We operate in
three
reportable segments: Nuclear Operations Group, Nuclear Services Group and Nuclear Power Group. Our reportable segments reflect changes we made during the first quarter of 2017 in the manner for which our segment operating information is reported for purposes of assessing operating performance and allocating resources. Prior to 2017, we reported three segments: Nuclear Operations, Nuclear Energy and Technical Services. The U.S. commercial nuclear services business, a component of our former Nuclear Energy segment, is now reported in our Nuclear Services Group segment along with our former Technical Services segment. The remainder of our former Nuclear Energy segment is now reported in our Nuclear Power Group segment, which comprises our Canadian operations, including BWXT Nuclear Energy Canada Inc., which we acquired in 2016. Our Nuclear Operations Group segment represents our former Nuclear Operations segment. The change in our reportable segments had no impact on our previously reported consolidated results of operations, financial condition or cash flows. We have applied the change in reportable segments to previously reported historical financial information and related disclosures included in this Report.
For financial information regarding each of our segments, financial information regarding geographic areas and additional information regarding the change to our segments, see
Note 16
to our consolidated financial statements included in this Report. For further details regarding each segment's facilities, see Item 2, "Properties." In general, we operate in capital-intensive industries and rely on large contracts for a substantial amount of our revenues. We are currently exploring growth strategies across our segments through strategic investments and acquisitions to expand and complement our existing businesses. We would expect to fund these opportunities with cash on hand or by raising additional capital through debt, equity or some combination thereof.
1
Nuclear Operations Group
Through this segment, we engineer, design and manufacture precision naval nuclear components, reactors and nuclear fuel for the U.S. Department of Energy ("DOE")/National Nuclear Security Administration's ("NNSA") Naval Nuclear Propulsion Program. In addition, we perform development and fabrication activities for missile launch tubes for U.S. Navy submarines.
Our Nuclear Operations Group segment specializes in the design and manufacture of close-tolerance and high-quality equipment for nuclear applications. In addition, we are a leading manufacturer of critical nuclear components, fuels and assemblies for government and limited other uses. We have supplied nuclear components for DOE programs since the 1950s and are the largest domestic supplier of research reactor fuel elements for colleges, universities and national laboratories. We also convert or downblend high-enriched uranium into low-enriched fuel for use in commercial reactors to generate electricity. In addition, we have over 100 years of experience in supplying components for defense applications.
We work closely with the DOE-supported nuclear non-proliferation program. Currently, this program is assisting in the development of a high-density, low-enriched uranium fuel required for high-enriched uranium test reactor conversions. We have also been a leader in the receipt, storage, characterization, dissolution, recovery and purification of a variety of uranium-bearing materials. All phases of uranium downblending and uranium recovery are performed at our Lynchburg, Virginia and Erwin, Tennessee sites.
The demand for nuclear components by the U.S. Government determines a substantial portion of this segment's backlog. We expect that orders for nuclear components will continue to be a significant part of backlog for the foreseeable future. In addition, the U.S. Navy issued its fiscal year 2019 long-range shipbuilding plan in February 2018, which includes recommendations to increase the size of its fleet of ships to include additional submarines and aircraft carriers beyond the number disclosed in previous long-range shipbuilding plan. We are evaluating the impact of the U.S. Navy's new shipbuilding plan and expect that it will require additional capital expenditures and investment in personnel to meet this growth in demand.
Nuclear Services Group
Through this segment, we provide various services to the U.S. Government, including special nuclear materials processing, environmental site restoration services and management and operating services for various U.S. Government-owned facilities. These services are provided primarily to the DOE, including the NNSA, the Office of Nuclear Energy, the Office of Science and the Office of Environmental Management, and NASA.
This segment's principal operations include:
|
•
|
managing and operating environmental management sites;
|
|
•
|
managing spent nuclear fuel and transuranic waste for the DOE;
|
|
•
|
managing and operating nuclear production facilities;
|
|
•
|
providing critical skills and resources for DOE sites; and
|
|
•
|
managing and operating space flight hardware and test facilities for NASA.
|
This segment is also engaged in inspection and maintenance services for the commercial nuclear industry primarily in the U.S. These services include the inspection of steam generators and heat exchangers, high pressure water lancing, non-destructive examination and the development of customized tooling solutions. This segment also develops technology for a variety of applications, including advanced nuclear power sources, and offers complete advanced fuel and reactor engineering, licensing and manufacturing services for new advanced nuclear reactors.
Our Nuclear Services Group segment's overall activity depends on authorized spending levels of the DOE, including the NNSA, the Office of Nuclear Energy, the Office of Science and the Office of Environmental Management, and NASA. We manage and operate complex, high-consequence nuclear and national security operations for the DOE and the NNSA, primarily through our joint ventures, as further discussed under the caption "Joint Ventures" below. In addition, this segment's activities associated with the U.S. commercial nuclear industry depend on the demand and competitiveness of nuclear power in the U.S. and our ability to successfully obtain commercial nuclear contracts.
2
Nuclear Power Group
Through this segment, we design and manufacture commercial nuclear steam generators, heat exchangers, pressure vessels, reactor components and other auxiliary equipment, including containers for the storage of spent nuclear fuel and other high-level nuclear waste. This segment is a leading supplier of nuclear fuel, fuel handling systems, tooling delivery systems and related services for CANDU nuclear power plants. This segment also provides a variety of engineering and in-plant services and is a significant supplier to nuclear power utilities undergoing major refurbishment and plant life extension projects. Our in-depth knowledge comes from over 50 years of experience in the design, manufacturing, commissioning and service of nuclear power generation equipment.
This segment specializes in performing full scope, prototype design work coupled with manufacturing integration. The design, engineering and other capabilities of this segment include:
|
•
|
steam generation and separation equipment design and development;
|
|
•
|
thermal-hydraulic design of reactor plant components;
|
|
•
|
commercial nuclear fuel manufacturing and design;
|
|
•
|
nuclear fuel handling system design, manufacturing, delivery, installation and commissioning;
|
|
•
|
containers for the storage of spent nuclear fuel and other high-level waste;
|
|
•
|
structural and thermal-hydraulic design and vibration analysis for heat exchangers;
|
|
•
|
structural component design for precision manufacturing;
|
|
•
|
materials expertise in high-strength, low-alloy steels and nickel-based materials;
|
|
•
|
material procurement of tubing, forgings and weld wire; and
|
|
•
|
metallographic and chemical analysis.
|
Our Nuclear Power Group segment's overall activity primarily depends on the demand and competitiveness of nuclear energy. A significant portion of our Nuclear Power Group segment's operations depend on the timing of maintenance outages, principally in the Canadian market, and the cyclical nature of capital expenditures and major refurbishments for nuclear utility customers, which could cause variability in our financial results.
Acquisitions
On December 16, 2016, our subsidiary BWXT Canada Ltd. acquired the outstanding stock of the GE Hitachi Nuclear Energy Canada Inc. ("GEH-C") joint venture, which was renamed BWXT Nuclear Energy Canada Inc. ("NEC"). NEC is a leading supplier of nuclear fuel, fuel handling systems, tooling delivery systems and replacement components for CANDU reactors and has approximately 350 employees. NEC operates two facilities licensed by the Canadian Nuclear Safety Commission ("CNSC") to fabricate natural uranium fuel in Peterborough and Toronto, Ontario, Canada as well as a third facility in Arnprior, Ontario, Canada. The acquisition of NEC expanded our existing commercial nuclear products and services portfolio, allowing us to leverage our technology-based competencies in offering new products and services related to plant life extensions as well as the ongoing maintenance of nuclear power generation equipment. NEC is reported within our Nuclear Power Group segment.
See
Note 2
to our consolidated financial statements included in this Report for additional information on the acquisition of NEC.
Special Charges for Restructuring Activities
In 2014, we began initiatives to restructure our mPower program and to improve margins in one of our former segments. During the year ended December 31, 2015, we incurred expenses of
$15.9 million
and
$0.7 million
related to these initiatives, respectively. Included in these expenditures were asset impairment charges and costs related to employee termination benefits and facility consolidation. These activities were substantially complete as of June 30, 2015.
mPower Framework Agreement
On March 2, 2016, we entered into a framework agreement with Bechtel Power Corporation ("Bechtel"), BWXT Modular Reactors, LLC and BDC NexGen Power, LLC, our partner in Generation mPower LLC ("GmP"), for the potential
3
restructuring and restart of our mPower small modular reactor program (the "Framework Agreement"). As a result of entering into the Framework Agreement, we have deconsolidated GmP from our financial statements as of the date of the Framework Agreement. We recorded a gain of approximately $13.6 million in the year ended December 31, 2016 related to the deconsolidation of GmP as a component of Other – net on our consolidated statement of income.
In the year ended December 31, 2016, we also recognized a $30.0 million loss contingency as a result of the Framework Agreement, which was ultimately paid to Bechtel in the first quarter of 2017 following receipt of Bechtel's notice that the mPower program would not be restarted.
Contracts
We execute our contracts through a variety of methods, including fixed-price incentive fee, cost-plus, target price cost incentive, cost-reimbursable, fixed-price or some combination of these methods. We generally recognize our contract revenues and related costs on a percentage-of-completion basis. Accordingly, we review contract price and cost estimates regularly as the work progresses and reflect adjustments in profit proportionate to the percentage of completion in the period when we revise those estimates. To the extent that these adjustments result in a reduction or an elimination of previously reported profits with respect to a project, we would recognize a charge against current earnings, which could be material.
We have contracts that extend beyond one year. Most of our long-term contracts have provisions for progress payments. We attempt to cover anticipated increases in labor, material and service costs of our long-term contracts either through an estimate of such changes, which is reflected in the original price, or through risk-sharing mechanisms, such as escalation or price adjustments for items such as labor and commodity prices.
In the event of a contract deferral or cancellation, we generally would be entitled to recover costs incurred, settlement expenses and profit on work completed prior to deferral or termination. Significant or numerous cancellations could adversely affect our business, financial condition, results of operations and cash flows.
For further specification, see "Risk Factors Related to Our Business – We are subject to risks associated with contractual pricing in our industries, including the risk that, if our actual costs exceed the costs we estimate on our fixed-price contracts, our profitability will decline, and we may suffer losses" as outlined in Item 1A of this Report.
Nuclear Operations Group
The majority of the revenue generated by this segment is from long-term contracts with the DOE/NNSA's Naval Nuclear Propulsion Program. Unless otherwise specified in a contract, allowable and allocable costs are billed to contracts with the U.S. Government in accordance with Federal Acquisition Regulation ("FAR") and the related U.S. Government Cost Accounting Standards ("CAS"). Examples of costs that may be incurred by us and not billable to the U.S. Government in accordance with the requirements of the FAR and CAS regulations include, but are not limited to, unallowable employee compensation and benefit costs, lobbying costs, interest, certain legal costs and charitable donations.
Most of our contracts in this segment are fixed-price incentive fee contracts which provide for reimbursement of allowable costs incurred plus a fee and generally require that we use our best efforts to accomplish the scope of the work within some specified time and stated dollar limitation. Fees can be fixed in terms of dollar value or percentage of costs. Award and incentive fees are determined and earned based on customer evaluation of our performance against negotiated criteria, primarily related to cost, and are intended to provide motivation for excellence in contract performance. Incentive fees that are based on cost provide for an initially negotiated fee to be adjusted later, typically using a formula to measure performance against the associated criteria, based on the relationship of total allowable costs to total target costs. Award and incentive fees that can reasonably be estimated and are deemed reasonably assured are recorded over the performance period of the contract.
Certain of our U.S. Government contracts span one or more base years and multiple option years. The U.S. Government generally has the right not to exercise option periods and may not exercise an option period for various reasons including, but not limited to, annual funding determinations. In addition, contracts between the U.S. Government and its prime contractors usually contain standard provisions for termination at the convenience of the U.S. Government or the prime contractor. As a U.S. Government contractor, we are subject to federal regulations under which our right to receive future awards of new federal contracts would be unilaterally suspended or barred if we were convicted of a crime or indicted based on allegations of a violation of specific federal statutes. In addition, some of our contracts with the U.S. Government require us to provide advance notice in connection with any contemplated sale or shut down of the relevant facility. In each of those situations, the U.S. Government has an exclusive right to negotiate a mutually acceptable purchase of the facility.
4
Nuclear Services Group
This segment's principal operations include the management and operation of nuclear production facilities, environmental management sites and the management of spent nuclear fuel and transuranic waste for the DOE. These activities are primarily accomplished through our participation in joint ventures with other contractors as further discussed under the caption "Joint Ventures" below.
The contracts for the management and operation of U.S. Government facilities are awarded through a complex and protracted procurement process. These contracts are generally structured as five-year contracts with options for up to five additional years, which are exercisable by the customer, or include provisions whereby the contract durations can be extended as a result of the achievement of certain performance metrics. These are cost-reimbursement contracts with a U.S. Government credit line with some corporate-funded working capital required. However, many new contracts currently in the bidding process and recently awarded have a different structure. While these new contracts remain cost-reimbursement contracts, the contractor may be required to supply working capital and be reimbursed by the U.S. Government through regular invoicing. These contracts include a fee that is primarily based on performance, which is typically evaluated annually.
This segment also serves the commercial nuclear industry primarily through the use of fixed-price contracts that are awarded following a competitive bid process. Fixed-price contracts entail more risk to us because the price has been pre-determined and is generally not subject to adjustment, regardless of costs incurred, unless authorized by the customer.
Nuclear Power Group
Contracts in this segment are usually awarded through a competitive bid process. Factors that customers may consider include price, plant or equipment availability, technical capabilities of equipment and personnel, efficiency, safety record and reputation. The majority of these contracts are fixed-price contracts in which the specified scope of work is agreed to for a pre-determined price that is generally not subject to adjustment, regardless of costs incurred by the contractor, unless changes in scope are authorized by the customer. Fixed-price contracts entail more risk to us because they require us to predetermine both the quantities of work to be performed and the costs associated with executing the work.
Our arrangements with customers may require us to provide letters of credit, bid and performance bonds or guarantees to secure bids or performance under contracts, which may involve significant amounts for contract security.
Backlog
Backlog represents the dollar amount of revenue we expect to recognize in the future from contracts awarded and in progress. Not all of our expected revenue from a contract award is recorded in backlog for a variety of reasons, including that some projects are awarded and completed within the same fiscal quarter.
Backlog is not a measure defined by generally accepted accounting principles. It is possible that our methodology for determining backlog may not be comparable to methods used by other companies. Additionally, our backlog, and the expected recognition of revenue, is subject to change upon our adoption of FASB Topic
Revenue from Contracts with Customers
on January 1, 2018.
We are subject to the budgetary and appropriations cycle of the U.S. Government as it relates to our Nuclear Operations Group and Nuclear Services Group segments. Backlog may not be indicative of future operating results, and projects in our backlog may be cancelled, modified or otherwise altered by customers.
We generally include expected revenue from contracts in our backlog when we receive written confirmation from our customers authorizing the performance of work and a commitment from the customer to payment for work performed. Accordingly, we exclude from backlog orders or arrangements that have been awarded but for which we have not been authorized to begin performance.
5
Our backlog at
December 31, 2017
and
2016
was as follows:
|
December 31,
2017 |
December 31,
2016 |
|||||||||||||
|
|
(In approximate millions)
|
|||||||||||||
|
Nuclear Operations Group
|
$
|
3,305
|
|
83
|
%
|
$
|
3,485
|
|
88
|
%
|
||||
|
Nuclear Services Group
|
29
|
|
1
|
%
|
24
|
|
—
|
%
|
||||||
|
Nuclear Power Group
|
637
|
|
16
|
%
|
474
|
|
12
|
%
|
||||||
|
Total Backlog
|
$
|
3,971
|
|
100
|
%
|
$
|
3,983
|
|
100
|
%
|
||||
We do not include the value of our unconsolidated joint venture contracts in backlog. These unconsolidated joint ventures are included in our Nuclear Services Group segment. See
Note 4
to our consolidated financial statements included in this Report for financial information on our equity method investments.
Of the
December 31, 2017
backlog, we expect to recognize revenues as follows:
|
2018
|
2019
|
Thereafter
|
Total
|
|||||||||||||
|
|
(In approximate millions)
|
|||||||||||||||
|
Nuclear Operations Group
|
$
|
1,190
|
|
$
|
772
|
|
$
|
1,343
|
|
$
|
3,305
|
|
||||
|
Nuclear Services Group
|
22
|
|
3
|
|
4
|
|
29
|
|
||||||||
|
Nuclear Power Group
|
230
|
|
111
|
|
296
|
|
637
|
|
||||||||
|
Total Backlog
|
$
|
1,442
|
|
$
|
886
|
|
$
|
1,643
|
|
$
|
3,971
|
|
||||
As of
December 31, 2017
, Nuclear Operations Group backlog with the U.S. Government was
$3,299.2 million
,
$266.6 million
of which had not yet been funded.
As of
December 31, 2017
, Nuclear Services Group backlog with the U.S. Government was
$11.1 million
, all of which was fully funded.
As of
December 31, 2017
, Nuclear Power Group had no backlog with the U.S. Government.
Major new awards from the U.S. Government are typically received following Congressional approval of the budget for the Government's next fiscal year, which starts October 1, and may not be awarded to us before the end of the calendar year. Due to the fact that most contracts awarded by the U.S. Government are subject to these annual funding approvals, the total values of the underlying programs are significantly larger. In April 2016, we were awarded a component and fuel contract, along with a three-year downblending contract by the U.S. Government with a combined value in excess of
$3.0 billion
, inclusive of unexercised options.
As of December 31, 2017, the U.S. Government had awarded us approximately
$2.8 billion
of the April 2016 award. The value of unexercised options excluded from backlog as of December 31, 2017 was approximately
$0.2 billion
, the majority of which is expected to be exercised in 2018, subject to annual Congressional appropriations.
Competition
The competitive environments in which each segment operates are described below.
Nuclear Operations Group.
We have specialized technical capabilities that have allowed us to be a valued supplier of nuclear components and fuel for the U.S. Government's naval nuclear fleet since the 1950s. Because of the technical and regulatory standards required to meet U.S. Government contracting requirements for nuclear components and the barriers to entry present in this type of environment, competition in this segment is limited. The primary bases of limited competition for this segment are price, high capital investment, technical capabilities, high regulatory licensing costs and quality of products and services. In addition, a significant portion of the designs, processing and final product are classified by the U.S. Government, requiring applicable personnel to obtain and maintain U.S. Government security clearances.
Nuclear Services Group.
Through this segment, we are engaged in the management and operation of U.S. Government facilities and the delivery of environmental remediation services (decontamination and decommissioning) associated with U.S. Government-owned nuclear facilities. Many of our government contracts are bid as a joint venture with one or more companies, in which we have a majority or a minority position. The performance of the prime or lead contractor can impact our
6
reputation and our future competitive position with respect to that particular project and customer. Our primary competitors in the delivery of goods and services to the U.S. Government and the operation of U.S. Government facilities include, but are not limited to, Bechtel National, Inc., AECOM, Fluor Corporation, Lockheed Martin Corporation, Jacobs Engineering Group, Inc., Northrop Grumman Corporation, Huntington Ingalls Industries, Inc., Honeywell International, Inc. and Leidos, Inc. The primary bases of competition for this segment are experience, past performance, availability of key personnel and technical capabilities.
The Nuclear Services Group segment is also engaged in the commercial nuclear industry primarily in the U.S. Such activities include steam generator and balance of plant inspection and servicing, test services and component development for research and test reactors and advanced nuclear reactor design and engineering. This portion of the segment competes with a number of companies specializing in commercial nuclear engineering and maintenance services including Framatome, Westinghouse Electric Corporation and other third-tier service suppliers. The primary bases of competition for this segment are price, technical capabilities, quality, timeliness of performance, breadth of products and services and willingness to accept project risks.
Nuclear Power Group.
Our Nuclear Power Group segment supplies commercial nuclear steam generators and components. BWXT has supplied the nuclear industry with more than
1,300
large, heavy components worldwide. This segment is the only commercial heavy nuclear component manufacturer in North America. Our Nuclear Power Group segment fabricates pressure vessels, reactor components, steam generators, heat exchangers and other auxiliary equipment. This segment also provides specialized engineering and maintenance services, including services for plant outages. Through the acquisition of NEC, this segment is also a leading supplier of nuclear fuel, fuel handling systems, tooling delivery systems and replacement components for CANDU reactors. This segment competes with a number of companies specializing in nuclear capabilities including, but not limited to, Framatome, Cameco Corporation, Doosan Heavy Industries & Construction, E.S. Fox Limited, AECON Group Inc., Bechtel National, Inc., Westinghouse Electric Corporation and SNC-Lavalin Group, Inc. The primary bases of competition for this segment are price, technical capabilities, quality, timeliness of performance, breadth of products and services and willingness to accept project risks.
Joint Ventures
We share in the ownership of a variety of entities with third parties, primarily through corporations, limited liability companies and partnerships, which we refer to as "joint ventures." Through several joint venture arrangements, our Nuclear Services Group segment primarily manages and operates nuclear facilities and associated plant infrastructure, constructs large capital facilities, provides safeguards and security for inventory and assets, supports and conducts research and development for advanced energy technology and manages environmental programs for the DOE, the NNSA and NASA. We generally account for our investments in joint ventures under the equity method of accounting. Certain of our Nuclear Services Group segment unconsolidated joint ventures are described below.
|
•
|
Los Alamos National Laboratory
.
Since 2006, Los Alamos National Security, LLC, a limited liability company formed in 2005 with the University of California, Bechtel National, Inc., URS Corporation (an AECOM company) and BWXT Government Group, Inc., has managed and operated the Los Alamos National Laboratory, a premier national security research institution, delivering scientific and engineering solutions for the nation's most crucial and complex problems. Located in Los Alamos, New Mexico, the Los Alamos National Laboratory conducts ongoing research and development on the measures necessary for certifying the safety and reliability of nuclear devices without the use of nuclear testing for the U.S. Government.
|
|
•
|
Los Alamos Legacy Cleanup Contract.
Newport News Nuclear BWXT – Los Alamos, LLC, a limited liability company formed in 2017 with Stoller Newport News Nuclear, Inc., a subsidiary of Huntington Ingalls Industries' Technical Solutions division, and BWXT Technical Services Group, Inc. ("BWXT TSG"), was awarded a contract to perform environmental monitoring and remediation, waste management and disposition, and decontamination and decommissioning at the Los Alamos National Laboratory site and surrounding private and government-owned lands. On January 23, 2018, the DOE issued a notice to proceed into transition for this contract to Newport News Nuclear BWXT – Los Alamos, LLC. The 90-day contract transition period began immediately and will lead into a base period of five years and option periods of three years and two years, respectively, with a total period of performance of up to 10 years and three months.
|
|
•
|
Lawrence Livermore National Laboratory.
Lawrence Livermore National Security, LLC, a limited liability company formed in 2006 with the University of California, Bechtel National, Inc., URS Corporation (an AECOM company) and BWXT Government Group, Inc., manages and operates Lawrence Livermore National Laboratory located in Livermore, California. The laboratory serves as a national resource in science and engineering, focused on national security, energy, the environment and bioscience, with special responsibility for nuclear devices.
|
7
|
•
|
Savannah River Liquid Waste Disposition Program.
In July 2009, Savannah River Remediation LLC, a limited liability company formed by URS Corporation (an AECOM company), Bechtel National, Inc., CH2M Hill Constructors, Inc. and BWXT TSG, became the liquid waste contractor for the DOE's Savannah River Site located in Aiken, South Carolina. The objective of this program is to achieve closure of the Savannah River Site liquid waste tanks in compliance with the Federal Facilities Agreement, utilizing the Defense Waste Processing Facility and Saltstone Facility. In October 2017, Savannah River EcoManagement, LLC, a limited liability formed by BWXT TSG, Bechtel National, Inc. and Honeywell International, Inc., was awarded the liquid waste contract for the DOE's Savannah River Site. Subsequent to this award, a protest was filed by the incumbent, which has postponed our start date.
|
|
•
|
Portsmouth Gaseous Diffusion Plant D&D.
Fluor-BWXT Portsmouth LLC is a limited liability company formed by Fluor Federal Services, Inc. and BWXT TSG to provide nuclear operations, decontamination and decommissioning services at the Portsmouth Gaseous Diffusion Plant in Portsmouth, Ohio.
|
|
•
|
West Valley Demonstration Project Phase I Decommissioning and Facility Disposition.
CH2M Hill-BWXT West Valley, LLC is a limited liability company formed by CH2M Hill Constructors, Inc., BWXT TSG and Environmental Chemical Corporation. Services provided include project management and support services, site operations, maintenance, utilities, high-level waste canister relocation, facility disposition, waste tank farm management, U.S. Nuclear Regulatory Commission ("NRC") licensed disposal area management, waste management and nuclear materials disposition, and safeguards and security.
|
|
•
|
Waste Isolation Pilot Plant.
Nuclear Waste Partnership, LLC is a limited liability company formed by URS Corporation (an AECOM company), BWXT TSG and Areva Federal Services, LLC as the major subcontractor that manages and operates DOE's Waste Isolation Pilot Plant in Carlsbad, New Mexico.
|
|
•
|
Synergy Achieving Consolidated Operations & Maintenance (SACOM).
Syncom Space Services, LLC is a limited liability company formed by PAE Applied Technologies, LLC and BWXT Nuclear Operations Group, Inc. to provide facility operations and maintenance services for institutional and technical facilities, and perform test and manufacturing support services at two NASA facilities – the Stennis Space Center in Hancock County, Mississippi and the Michoud Assembly Facility in New Orleans, Louisiana.
|
|
•
|
Paducah Gaseous Diffusion Plant Deactivation and Remediation Project.
Four Rivers Nuclear Partnership, LLC is a limited liability company formed by BWXT TSG, CH2M Hill Constructors, Inc. and Fluor Federal Services, Inc. to provide nuclear operations, deactivation and remediation services at the Paducah Gaseous Diffusion Plant in Paducah, Kentucky.
|
Foreign Operations
We have Canadian operations primarily in our Nuclear Power Group segment, which serve the North American and global nuclear utility markets. The functional currency of these operations is not the U.S. dollar, and, as a result, we are subject to exchange rate fluctuations that impact our financial position, results of operations and cash flows. Revenue and operating income derived from Canadian operations, as well as the approximate percentages of our total segment revenues and total segment operating income, respectively, for each of the last three years were as follows (dollars in thousands):
|
|
Revenues
|
Operating Income
|
||||||||||||
|
|
Amount
|
Percent
|
Amount
|
Percent
|
||||||||||
|
Year Ended December 31, 2017
|
$
|
285,585
|
|
17
|
%
|
$
|
39,719
|
|
12
|
%
|
||||
|
Year Ended December 31, 2016
|
$
|
160,504
|
|
10
|
%
|
$
|
42,808
|
|
14
|
%
|
||||
|
Year Ended December 31, 2015
|
$
|
119,574
|
|
8
|
%
|
$
|
11,803
|
|
4
|
%
|
||||
See
Note 16
to our consolidated financial statements included in this Report for additional information on the geographic distribution of our revenues.
Customers
We provide our products and services to a diverse customer base, including the U.S. Government, utilities and other power producers. Our largest customer during the years ended
December 31, 2017
,
2016
and
2015
was the U.S. Government; U.S. Government contracts represented approximately
81%
,
87%
and
88%
of our total consolidated revenues, respectively. No individual non-U.S. Government customer accounted for more than 10% of our consolidated revenues in the years ended
December 31, 2017
,
2016
or
2015
.
8
The U.S. Government is the primary customer of our Nuclear Operations Group and Nuclear Services Group segments. Revenues from U.S. Government contracts comprised
99%
of revenues in our Nuclear Operations Group segment for the years ended
December 31, 2017
,
2016
and
2015
. Revenues from U.S. Government contracts comprised
83%
,
76%
and
70%
of revenues in our Nuclear Services Group segment for the years ended
December 31, 2017
,
2016
and
2015
, respectively.
Raw Materials and Suppliers
Our operations use raw materials, such as carbon and alloy steels in various forms and components and accessories for assembly, which are available from numerous sources. We generally purchase these raw materials and components as needed for individual contracts. Our Nuclear Power Group segment does not depend on a single source of supply for materials used in our products. We have limited supply options for certain raw materials used in our Nuclear Power Group segment, however we believe the suppliers of these materials are reliable. Our Nuclear Operations Group segment relies on several single-source suppliers for materials used in its products. We believe these suppliers are reliable, and we and the U.S. Government expend significant effort to monitor and maintain the supplier base for our Nuclear Operations Group segment.
Although shortages of some raw materials have existed occasionally, no serious shortage exists at the present time.
Employees
At
December 31, 2017
, we employed approximately
6,100
persons worldwide. Approximately
1,400
of our employees were members of labor unions at
December 31, 2017
. Many of our operations are subject to union contracts, which we customarily renew periodically. We consider our relationships with our employees to be satisfactory.
Patents and Technology Licenses
We currently hold a large number of U.S. and foreign patents and have patent applications pending. We acquire patents and technology licenses and grant licenses to others when we consider it advantageous for us to do so. Although in the aggregate our patents and technology licenses are important to us, we do not regard any single patent or license or group of related patents or licenses as critical or essential to our business as a whole. In general, we depend on our technological capabilities and the application of know-how, rather than patents and technology licenses, in the conduct of our various businesses.
Research and Development Activities
Our research and development activities are related to the development and improvement of new and existing products and equipment, as well as conceptual and engineering evaluation for translation into practical applications. We charge the costs of research and development unrelated to specific contracts as incurred. Excluding customer-sponsored research and development, the majority of our activities in this area, for the year ended December 31, 2017, related to the development of technologies in the area of medical and industrial radioisotopes. During the years ended December 31, 2016 and 2015, substantially all of these costs related to our mPower program for the development of our BWXT mPower™ reactor and the associated power plant. Contractual arrangements for customer-sponsored research and development can vary on a case-by-case basis and include contracts, cooperative agreements and grants.
Research and development activities totaled
$50.4 million
,
$40.1 million
and
$38.2 million
in the years ended
December 31, 2017
,
2016
and
2015
, respectively. These activities include amounts paid for by our customers of
$43.2 million
,
$33.7 million
and
$27.7 million
, in the years ended
December 2017
,
2016
and
2015
, respectively.
Hazard Risks and Insurance
Our operations present risks of injury to or death of people, loss of or damage to property and damage to the environment. We have created loss control systems to assist us in the identification and treatment of the hazard risks presented by our operations, and we endeavor to make sure these systems are effective.
As loss control measures will not always be successful, we seek to establish various means of funding losses and liability related to incidents or occurrences. We primarily seek to do this through contractual protections, including waivers of consequential damages, indemnities, caps on liability, liquidated damages provisions and access to the insurance of other parties. We also procure insurance, operate our own captive insurance company and/or establish funded or unfunded reserves. However, none of these methods will eliminate all risks.
9
Depending on competitive conditions, the nature of the work, industry custom and other factors, we may not be successful in obtaining adequate contractual protection from our customers and other parties against losses and liabilities arising out of or related to the performance of our work. The scope of the protection may be limited, may be subject to conditions and may not be supported by adequate insurance or other means of financing. In addition, we sometimes have difficulty enforcing our contractual rights with others following a material loss.
Similarly, insurance for certain potential losses or liabilities may not be available or may only be available at a cost or on terms we consider not to be economical. Insurers frequently react to market losses by ceasing to write or severely limiting coverage for certain exposures. Risks that we have frequently found difficult to cost-effectively insure against include, but are not limited to, property losses from wind, flood and earthquake events, nuclear hazards and war, pollution liability, liabilities related to occupational health exposures (including asbestos), liability related to our executives, professional liability/errors and omissions coverage, the failure, misuse or unavailability of our information technology systems, the failure of security measures designed to protect our information technology systems from security breaches and liability related to risk of loss of our work in progress. In cases where we place insurance, we are subject to the credit worthiness of the relevant insurer(s), the available limits of the coverage, our retention under the relevant policy, exclusions in the policy and gaps in coverage.
Our operations in designing, engineering, manufacturing, constructing and servicing nuclear power equipment and components for our commercial nuclear utility customers subject us to various risks, including, without limitation, damage to our customers' property and third-party claims for personal injury, environmental liability, death and property damage. To protect against liability for damage to a customer's property, we endeavor to obtain waivers of liability and subrogation from the customer and its insurer. We also attempt to cap our overall liability in our contracts. To protect against liability from claims brought by third parties, we seek to be insured under the utility customer's nuclear liability policies and have the benefit of the indemnity and limitation of any applicable liability provision of the Price-Anderson Act. The Price-Anderson Act limits the public liability of U.S. manufacturers and operators of licensed nuclear facilities and other parties who may be liable in respect of, and indemnifies them against, all claims in excess of a certain amount. This amount is determined by the sum of commercially available liability insurance plus certain retrospective premium assessments payable by operators of commercial nuclear reactors. For those sites where we provide environmental remediation services, we seek the same protection from our customers as we do for our other nuclear activities. The Price-Anderson Act, as amended, includes a sunset provision and requires renewal each time that it expires. Contracts that were entered into during a period of time that the Price-Anderson Act was in full force and effect continue to receive the benefit of the Price-Anderson Act's nuclear indemnity. The Price-Anderson Act is set to expire on December 31, 2025. We also provide nuclear fabrication and other services to the nuclear power industry in Canada. Canada's Nuclear Liability and Compensation Act generally conforms to international conventions and is conceptually similar to the Price-Anderson Act in the U.S. Accordingly, indemnification protections and the possibility of exclusions under Canada's Nuclear Liability and Compensation Act are similar to those under the Price-Anderson Act in the U.S.
We supply commercial nuclear equipment and services to certain customers in countries other than the U.S. and Canada that are party to international treaties and in countries that are not signatory to international treaties but have their own nuclear liability laws that, in general, have regulations in place whereby nuclear operators are solely liable for nuclear damage claims, which would exclude nuclear suppliers from any such exposure. BWXT does retain some level of risk in the event of future changes to the legal landscape in these countries regarding international third-party nuclear liability.
In 2008, the U.S. ratified the Convention on Supplementary Compensation for Nuclear Damage ("CSC") with the International Atomic Energy Agency. The CSC is an international treaty developed to create a global legal framework for allocating responsibility and assuring prompt and equitable compensation in the unlikely event of certain nuclear incidents. The ratification by the U.S. authorizes the Secretary of Energy to issue regulations establishing a retrospective risk pooling program whereby, in the event that the U.S. must make a contribution to the CSC international fund, U.S. nuclear suppliers, including BWXT, would pay the full cost of this contribution by the U.S.
Although we do not own or operate any nuclear reactors, we have some coverage under commercially available nuclear liability and property insurance for our facilities that are currently licensed to possess special nuclear materials. Substantially all of our Nuclear Operations Group segment contracts involving nuclear materials are covered by and subject to the nuclear indemnity provisions of either the Price-Anderson Act or Public Law 85-804, which, among other things, authorizes the DOE to indemnify certain contractors when such acts would facilitate national defense. However, to the extent the value of the nuclear materials in our care, custody or control exceeds the commercially available limits of our insurance, we potentially have underinsured risk of loss for such nuclear material.
Our Nuclear Services Group segment participates in the management and operation of various U.S. Government facilities. This participation is customarily accomplished through the participation in joint ventures with other contractors for
10
any given facility. These activities involve, among other things, handling nuclear devices and their components. Insurable liabilities arising from these sites are rarely protected by our or our partners' corporate insurance programs. Instead, we rely on government contractual agreements and insurance purchased specifically for a site. The U.S. Government has historically fulfilled its contractual agreement to reimburse its contractors for covered claims, and we expect it to continue this process during our participation in the administration of these facilities. However, in most of these situations in which the U.S. Government is contractually obligated to pay, the payment obligation is subject to the availability of authorized government funds. The reimbursement obligation of the U.S. Government is also conditional, and provisions of the relevant contract or applicable law may preclude reimbursement.
Our wholly owned captive insurance subsidiary provides primary workers' compensation, employer's liability, commercial general liability and automotive liability insurance to support our operations. We may also have business reasons in the future to have our insurance subsidiary accept other risks that we cannot or do not wish to transfer to outside insurance companies. These risks may be considerable in any given year or cumulatively. Our insurance subsidiary has not provided significant amounts of insurance to unrelated parties. Claims as a result of our operations could adversely impact the ability of our insurance subsidiary to respond to all claims presented.
Additionally, upon the February 22, 2006 effectiveness of the settlement relating to the Chapter 11 proceedings involving several of our subsidiaries, most of our subsidiaries contributed substantial insurance rights to the asbestos personal injury trust, including rights to (1) certain pre-1979 primary and excess insurance coverages and (2) certain of our 1979-1986 excess insurance coverage. These insurance rights provided coverage for, among other things, asbestos and other personal injury claims, subject to the terms and conditions of the policies. The contribution of these insurance rights was made in exchange for the agreement on the part of the representatives of the asbestos claimants, including the representative of future claimants, to the entry of a permanent injunction, pursuant to Section 524(g) of the U.S. Bankruptcy Code, to channel to the asbestos trust all asbestos-related general liability claims against our subsidiaries and former subsidiaries arising out of, resulting from or attributable to their operations, and the implementation of related releases and indemnification provisions protecting those subsidiaries and their affiliates from future liability for such claims. Although we are not aware of any significant, unresolved claims against our subsidiaries and former subsidiaries that are not subject to the channeling injunction and that relate to the periods during which such excess insurance coverage related, with the contribution of these insurance rights to the asbestos personal injury trust, it is possible that we could have underinsured or uninsured exposure for non-derivative asbestos claims or other personal injury or other claims that would have been insured under these coverages had the insurance rights not been contributed to the asbestos personal injury trust. In conjunction with the spin-off, claims and liabilities associated with these asbestos personal injury, property damage and indirect property damage claims have been expressly assumed by BWE pursuant to the master separation agreement between us and BWE.
Governmental Regulations and Environmental Matters
General
Many aspects of our operations and properties are affected by political developments and are subject to both domestic and foreign governmental regulations, including those relating to:
|
•
|
possessing and processing special nuclear materials;
|
|
•
|
workplace health and safety;
|
|
•
|
constructing and equipping electric power facilities;
|
|
•
|
currency conversions and repatriation;
|
|
•
|
taxation of earnings; and
|
|
•
|
protecting the environment.
|
We are required by various governmental and quasi-governmental agencies to obtain certain permits, licenses and certificates with respect to our operations. The kinds of permits, licenses and certificates required in our operations depend upon a number of factors.
We cannot determine the extent to which new legislation, new regulations or changes in existing laws or regulations may affect our future operations.
11
Environmental
Our operations and properties are subject to a wide variety of increasingly complex and stringent foreign, federal, state and local environmental laws and regulations, including those governing discharges into the air and water, the handling and disposal of solid and hazardous wastes, the remediation of soil and groundwater contaminated by hazardous substances and the health and safety of employees. Sanctions for non-compliance may include revocation of permits, corrective action orders, administrative or civil penalties and criminal prosecution. Some environmental laws provide for strict, joint and several liability for remediation of spills and other releases of hazardous substances, as well as damage to natural resources. In addition, companies may be subject to claims alleging personal injury or property damage as a result of alleged exposure to hazardous substances. Such laws and regulations may also expose us to liability for the conduct of or conditions caused by others or for our acts that were in compliance with all applicable laws at the time such acts were performed.
These laws and regulations include the Comprehensive Environmental Response, Compensation, and Liability Act of 1980, as amended ("CERCLA"), the Clean Air Act, the Clean Water Act, the Resource Conservation and Recovery Act and similar laws that provide for responses to, and liability for, releases of hazardous substances into the environment. These laws and regulations also include similar foreign, state or local counterparts to these federal laws, which regulate air emissions, water discharges, hazardous substances and waste and require public disclosure related to the use of various hazardous substances. Our operations are also governed by laws and regulations relating to workplace safety and worker health, including the U.S. Occupational Safety and Health Act and regulations promulgated thereunder.
We are currently in the process of investigating and remediating some of our current and former operating sites. Although we have recorded reserves in connection with certain of these environmental matters, due to the uncertainties associated with environmental remediation, there can be no assurance that the actual costs resulting from these remediation matters will not exceed the recorded reserves.
Our compliance with U.S. federal, state and local environmental control and protection regulations resulted in pre-tax charges of approximately
$14.1 million
,
$14.2 million
and
$14.1 million
in the years ended
December 31, 2017
,
2016
and
2015
, respectively. In addition, compliance with existing environmental regulations necessitated capital expenditures of
$0.9 million
,
$1.3 million
and
$0.7 million
in the years ended
December 31, 2017
,
2016
and
2015
, respectively. We expect to spend another
$3.4 million
on such capital expenditures over the next five years. We cannot predict all of the environmental requirements or circumstances that will exist in the future, but we anticipate that environmental control and protection standards will become increasingly stringent and costly. Based on our experience to date, we do not currently anticipate any material adverse effect on our business or consolidated financial condition as a result of future compliance with existing environmental laws and regulations. However, future events, such as changes in existing laws and regulations or their interpretation, more vigorous enforcement policies of regulatory agencies or stricter or different interpretations of existing laws and regulations, may require additional expenditures by us, which may be material. Accordingly, we can provide no assurance that we will not incur significant environmental compliance costs in the future.
We have been identified as a potentially responsible party at various cleanup sites under CERCLA. CERCLA and other environmental laws can impose liability for the entire cost of cleanup on any of the potentially responsible parties, regardless of fault or the lawfulness of the original conduct. Generally, however, where there are multiple responsible parties, a final allocation of costs is made based on the amount and type of wastes disposed of by each party and the number of financially viable parties, although this may not be the case with respect to any particular site. We have not been determined to be a major contributor of wastes to any of these sites. On the basis of our relative contribution of waste to each site, we expect our share of the ultimate liability for the various sites will not have a material adverse effect on our consolidated financial condition, results of operations or cash flows in any given year.
Environmental remediation projects have been and continue to be undertaken at certain of our current and former plant sites. In 2002, Congress directed the U.S. Army Corps of Engineers ("Army Corps") to clean up radioactive waste at the Shallow Land Disposal Area located in Parks Township, Armstrong County, Pennsylvania (the "SLDA"), consistent with the Memorandum of Understanding between the NRC and the Army Corps for Coordination on Cleanup and Decommissioning of the Formerly Utilized Sites Remedial Action Program Sites with NRC-Licensed Facilities, dated July 5, 2001 (the "MOU"). From 1961 to 1970, the SLDA was operated by the Nuclear Materials and Equipment Corporation ("NUMEC") pursuant to Atomic Energy Commission ("AEC") License SNM-145. The AEC was the predecessor to the NRC. The SLDA was used for the disposal of waste from NUMEC's nuclear fuels fabrication facility in Apollo, Pennsylvania. Both radioactive and non-radioactive waste was disposed in a series of trenches at the SLDA. NUMEC, a former subsidiary of Atlantic Richfield Company ("ARCO") was acquired by BWXT in November 1971. Shortly after the Army Corps' contractor commenced cleanup operations in 2011, the Army Corps ceased excavation activities because the contractor deviated from accepted field procedures, and the excavated material was found to be complex and beyond the Army Corps' characterization and
12
management procedures. The MOU was modified in late 2014 to add the DOE and the NNSA as parties to deal with "special nuclear materials." In December 2014, the Army Corps issued a Proposed Record of Decision Amendment, which reflects a revised cost estimate of $350 million, in addition to the $62 million expended through September 2014, to implement the selected remedy. According to the Army Corps, it expects to award a new remediation contract in late 2018 and re-commence cleanup operations pending completion of work plans by the new contractor, subject to funding. The federal legislation directing the Army Corps to clean up the SLDA also directs the Army Corps to seek to recover response costs from appropriate responsible parties in accordance with CERCLA. In connection with BWXT's acquisition of NUMEC from ARCO in November 1971, ARCO assumed and agreed to indemnify and hold harmless BWXT with respect to claims and liabilities arising as a result of transactions or operations of NUMEC prior to the acquisition date. Although this ARCO indemnity would cover claims by the Army Corps to seek recovery from BWXT, no assurance can be given that such indemnity will be available or sufficient in the event liability claims are asserted for SLDA cleanup costs against BWXT. For a description of current legal proceedings related to the SLDA, see "
Note 10
– Commitments and Contingencies" to our consolidated financial statements included in this Report.
We perform significant amounts of work for the U.S. Government under both prime contracts and subcontracts and operate certain facilities that are licensed to possess and process special nuclear materials. As a result of these activities, we are subject to continuing reviews by governmental agencies, including the U.S. Environmental Protection Agency (the "EPA") and the NRC.
The NRC's decommissioning regulations require our Nuclear Operations Group segment to provide financial assurance that it will be able to pay the expected cost of decommissioning its licensed facilities at the end of their service lives. We provided financial assurance totaling
$56.2 million
during the years ended
December 31, 2017
and
2016
with surety bonds and letters of credit for the ultimate decommissioning of these licensed facilities. These two facilities have provisions in their government contracts pursuant to which substantially all of our decommissioning costs and financial assurance obligations are covered by the DOE, including the costs to complete the decommissioning projects underway at the facility in Erwin, Tennessee. These surety bonds and letters of credit are to cover decommissioning required pursuant to work not subject to this DOE obligation.
In Canada, the CNSC's decommissioning regulations require our Nuclear Power Group segment to provide financial assurance that it will be able to pay the expected cost of decommissioning its two CNSC-licensed facilities at the end of their service lives. We provided financial assurance totaling
$41.7 million
and
$39.5 million
during the years ended
December 31, 2017
and
2016
, respectively, with letters of credit for the ultimate decommissioning of these licensed facilities.
At
December 31, 2017
and
2016
, we had total environmental accruals, including provisions for the facilities discussed above, of
$93.3 million
and
$86.3 million
, respectively. Of our total environmental accruals at
December 31, 2017
and
2016
,
$13.5 million
and
$4.6 million
, respectively, were included in current liabilities. Inherent in the estimates of those accruals and recoveries are our expectations regarding the levels of contamination, decommissioning costs and recoverability from other parties, which may vary significantly as decommissioning activities progress. Accordingly, changes in estimates could result in material adjustments to our operating results, and the ultimate loss may differ materially from the amounts we have provided for in our consolidated financial statements.
Cautionary Statement Concerning Forward-Looking Statements
We are including the following discussion to inform our existing and potential security holders generally of some of the risks and uncertainties that can affect our company and to take advantage of the "safe harbor" protection for forward-looking statements that applicable federal securities law affords.
From time to time, our management or persons acting on our behalf make forward-looking statements to inform existing and potential security holders about our Company. Statements and assumptions regarding expectations and projections of specific projects, our future backlog, revenues, income and capital spending, strategic investments, acquisitions or divestitures, return of capital activities or margin improvement initiatives are examples of forward-looking statements. Forward-looking statements are generally accompanied by words such as "estimate," "project," "predict," "believe," "expect," "anticipate," "plan," "seek," "goal," "could," "intend," "may," "should" or other words that convey the uncertainty of future events or outcomes. In addition, sometimes we will specifically describe a statement as being a forward-looking statement and refer to this cautionary statement.
In addition, various statements in this Report, including those that express a belief, expectation or intention, as well as those that are not statements of historical fact, are forward-looking statements. Those forward-looking statements appear in Item 1 – "Business" and Item 3 – "Legal Proceedings" in Part I of this Report, in Item 7 – "Management's Discussion and
13
Analysis of Financial Condition and Results of Operations" and in the notes to our consolidated financial statements in Item 8 of Part II of this Report and elsewhere in this Report.
We have based our forward-looking statements on information currently available to us and our current expectations, estimates and projections about our industries and our Company. We caution that these statements are not guarantees of future performance, and you should not rely unduly on them as they involve risks, uncertainties and assumptions that we cannot predict. In addition, we have based many of these forward-looking statements on assumptions about future events that may prove to be inaccurate. While our management considers these statements and assumptions to be reasonable, they are inherently subject to numerous factors, including potentially the risk factors described in the section labeled Item 1A, "Risk Factors" of this Report, most of which are difficult to predict and many of which are beyond our control. Accordingly, our actual results may differ materially from the future performance that we have expressed or forecast in our forward-looking statements.
We have discussed many of these factors in more detail elsewhere in this Report. These factors are not necessarily all the factors that could affect us. Unpredictable or unanticipated factors we have not discussed in this Report could also have material adverse effects on actual results of matters that are the subject of our forward-looking statements. We do not intend to update or review any forward-looking statement or our description of important factors, whether as a result of new information, future events or otherwise, except as required by applicable laws. We advise our security holders that they should (1) be aware that factors not referred to above could affect the accuracy of our forward-looking statements and (2) use caution and common sense when considering our forward-looking statements.
Available Information
Our website address is
www.bwxt.com
. We make available through the Investors section of this website under "SEC Filings," free of charge, our annual reports on Form 10-K, quarterly reports on Form 10-Q, current reports on Form 8-K, our proxy statement, statements of beneficial ownership of securities on Forms 3, 4 and 5 and amendments to those reports as soon as reasonably practicable after we electronically file those materials with, or furnish those materials to, the Securities and Exchange Commission (the "SEC"). You may read and copy any materials we file with the SEC at the SEC's Public Reference Room at 100 F Street, NE, Washington, DC 20549. You may obtain information regarding the Public Reference Room by calling the SEC at 1-800-SEC-0330. In addition, the SEC maintains a website at
www.sec.gov
that contains reports, proxy and information statements, and other information regarding issuers that file electronically with the SEC. We have also posted on our website our: Corporate Governance Principles; Code of Business Conduct; Code of Ethics for our Chief Executive Officer and Senior Financial Officers; Board of Directors Conflicts of Interest Policies and Procedures; Amended & Restated By-laws; and charters for the Audit & Finance, Governance, Compensation and Safety & Security Committees of our Board of Directors.
|
Item 1A.
|
RISK FACTORS
|
Risk Factors Related to Our Business
We rely on U.S. Government contracts for a substantial percentage of our revenue, and some of those contracts are subject to continued appropriations by Congress and may be terminated or delayed if future funding is not made available. In addition, the U.S. Government may not renew or may seek to modify or terminate our existing contracts.
For the year ended
December 31, 2017
, U.S. Government contracts comprised approximately
81%
of our total consolidated revenues. Government contracts are subject to various uncertainties, restrictions and regulations, including oversight audits, which could result in withholding or delaying payments to us, and termination or modification at the U.S. Government's convenience. In addition, some of our large, multi-year contracts with the U.S. Government are subject to annual funding determinations and the continuing availability of Congressional appropriations. Although multi-year operations may be planned in connection with major procurements, Congress generally appropriates funds on a fiscal-year basis even though a program may continue for several years. Consequently, programs often are only partially funded initially and additional funds are committed only as Congress makes further appropriations. When the U.S. Government does not complete its budget process before the end of its fiscal year on September 30, government operations typically are funded through a continuing resolution that authorizes agencies of the U.S. Government to continue to operate, but does not authorize new spending initiatives. When the U.S. Government operates under a continuing resolution, delays can occur in the procurement of products and services. As a result, we are subject to ongoing uncertainties associated with U.S. Government budget restraints and other factors affecting government funding. The reduction or termination of funding, or changes in the timing of funding, for a U.S. Government program in which we provide products or services would result in a reduction or loss of anticipated future revenues attributable to that program and could have a negative impact on our results of operations.
In addition, our Nuclear Operations Group and Nuclear Services Group segments depend on U.S. Government funding, particularly funding levels at the DOE. Significant changes in the level of funding (for example, the annual budget of the DOE)
14
or specifically mandated levels for individual programs that are important to our business could have an unfavorable impact on us. Any reduction in the level of U.S. Government funding, particularly at the DOE, may result in, among other things, a reduction in the number and scope of projects put out for bid by the U.S. Government or the curtailment of existing U.S. Government programs, either of which may result in a reduction in the number of contract award opportunities available to us, a reduction of activities at DOE sites and an increase in costs, including the costs of obtaining contract awards.
The U.S. Government typically can terminate or modify any of its contracts with us either for its convenience or if we default by failing to perform under the terms of the applicable contract. A termination arising out of our default could expose us to liability and have an adverse effect on our ability to compete for future contracts and orders. If any of our contracts reflected in backlog are terminated by the U.S. Government, our backlog would be reduced by the expected value of the remaining work under such contracts. In addition, on those contracts for which we are teamed with others and are not the prime contractor, the U.S. Government could terminate a prime contract under which we are a subcontractor, irrespective of the quality of our products and services as a subcontractor. Furthermore, certain of our U.S. Government contracts span one or more base years and multiple option years. The U.S. Government generally has the right not to exercise option periods and may not exercise an option period for various reasons.
We also have several significant contracts with the U.S. Government that are subject to periodic renewal and rebidding through a competitive process. If the U.S. Government fails to renew these contracts or modifies key terms, our results of operations and cash flows would be adversely affected.
As a result of these and other factors, the termination of one or more of our significant government contracts, our suspension from government contract work, the failure of the U.S. Government to renew our existing contracts or the disallowance of the payment of our contract costs could have a material adverse effect on our financial condition, results of operations and cash flows.
Federal budget sequestration and other delays or reductions in government spending could adversely impact government spending for the products and services we provide.
In August 2011, Congress enacted the Budget Control Act, which committed the U.S. Government to significantly reducing the federal deficit over ten years. The Budget Control Act established reductions in discretionary spending through 2021. If these spending reductions were not met, it called for substantial automatic spending cuts, or sequestration, split between defense and non-defense programs scheduled to start in March 2013 and continue over a nine-year period.
Federal government spending reductions, including through sequestration, could adversely impact U.S. Government programs for which we provide products or services. Additionally, while we believe many of our programs are well aligned with national defense and other strategic priorities, government spending on these programs can be subject to negative publicity, political factors and public scrutiny. The outcome of efforts underway regarding sequestration is uncertain and it is possible that spending cuts may be applied to U.S. Government programs across the board, regardless of how programs align with those priorities. There are many variables in how budget reductions could be implemented that will determine its specific impact; however, reductions in federal government spending and sequestration, as currently provided for under the Budget Control Act, could adversely impact programs in which we provide products or services. In addition, these cuts could adversely affect the viability of the suppliers and subcontractors under our programs. We may also be required to maintain operations of our joint ventures if the Government can no longer meet its debt obligations.
On February 9, 2018, Congress passed a further Continuing Appropriations resolution for fiscal year 2018 to keep the government operating through March 23, 2018. Included in this measure is a two-year budget agreement to raise the defense and non-defense discretionary spending caps mandated by the Budget Control Act. For fiscal year 2018, defense spending is increased by $80 billion and non-defense caps are increased by $63 billion, allowing Congress additional budget parameters to finalize the fiscal year 2018 appropriations bills by the end of March 2018 to avoid sequestration. Additionally, the spending caps have been increased similarly for fiscal year 2019. Also included in the resolution is debt limit relief, which has been extended through March 2019.
Demand for our products and services is vulnerable to economic downturns, the competitiveness of alternative energy sources and industry conditions.
Demand for our products and services has been, and we expect that demand will continue to be, subject to significant fluctuations due to a variety of factors beyond our control, including economic and industry conditions. These factors include, but are not limited to inflation, geopolitical issues, the availability and cost of credit, the demand for and competitiveness of
15
nuclear power with other energy sources, the cyclical nature of the power generation industry, low business and consumer confidence, high unemployment and energy conservation measures and decisions of utilities that utilize nuclear power.
Unfavorable economic conditions may lead customers to delay, curtail or cancel proposed or existing projects, which may decrease the overall demand for our products and services and adversely affect our results of operations.
Our customers may also find it more difficult to raise capital in the future due to limitations on the availability of credit, increases in interest rates and other factors affecting the federal, municipal and corporate credit markets. Additionally, our customers may demand more favorable pricing terms and find it increasingly difficult to timely pay invoices for our products and services, which would impact our future cash flows and liquidity. Inflation or significant changes in interest rates could reduce the demand for our products and services. Any inability to timely collect our invoices may lead to an increase in our accounts receivables and potentially to increased write-offs of uncollectible invoices. If the economy weakens, or customer spending declines, then our backlog, revenues, net income and overall financial condition could deteriorate.
Our future business prospects in Canada are dependent upon the continued operation of Canadian nuclear plants and refurbishment of the majority of the plants in Ontario in order to extend their life. Unfavorable economic conditions, competition from other forms of power generation, changes in government policy or operational or project execution issues may lead nuclear plant operators in Canada to cease operations or delay, curtail or cancel proposed or existing life-extension projects, which may decrease the overall demand for our products and services in Canada and adversely affect our results of operations.
Our backlog is subject to unexpected adjustments and cancellations and may not be a reliable indicator of future revenues or earnings.
There can be no assurance that the revenues projected in our backlog will be realized or, if realized, will result in profits. Because of project cancellations or changes in project scope and schedule, we cannot predict with certainty when or if backlog will be performed. In addition, even where a project proceeds as scheduled, it is possible that contracted parties may default and fail to pay amounts owed to us or poor project performance could increase the cost associated with a project. Delays, suspensions, cancellations, payment defaults, scope changes and poor project execution could materially reduce or eliminate the revenues and profits that we actually realize from projects in backlog.
Reductions in our backlog due to cancellation or modification by a customer or for other reasons may adversely affect, potentially to a material extent, the revenues and earnings we actually receive from contracts included in our backlog. Many of the contracts in our backlog provide for cancellation fees in the event customers cancel projects. These cancellation fees usually provide for reimbursement of our out-of-pocket costs, revenues for work performed prior to cancellation and a varying percentage of the profits we would have realized had the contract been completed. However, we typically have no contractual right upon cancellation to the total revenues reflected in our backlog. Projects may remain in our backlog for extended periods of time. If we experience significant project terminations, suspensions or scope adjustments to contracts reflected in our backlog, our financial condition, results of operations and cash flows may be adversely impacted.
We are subject to risks associated with contractual pricing in our industries, including the risk that, if our actual costs exceed the costs we estimate on our fixed-price contracts, our profitability will decline and we may suffer losses.
We are engaged in highly competitive industries and we have priced a number of our projects on a fixed-price basis. Our actual costs could exceed our projections. We attempt to cover the increased costs of anticipated changes in labor, material and service costs of long-term contracts, either through estimates of cost increases, which are reflected in the original contract price, or through price escalation clauses. Despite these attempts, the cost and gross profit we realize on a fixed-price contract could vary materially from the estimated amounts because of supplier, contractor and subcontractor performance, changes in job conditions, variations in labor and equipment productivity and increases in the cost of labor and raw materials, particularly steel, over the term of the contract. These variations and the risks generally inherent in our industries may result in actual revenues or costs being different from those we originally estimated and may result in reduced profitability or losses on projects. Some of these risks include:
|
•
|
difficulties encountered on our large-scale projects related to the procurement of materials or due to schedule disruptions, equipment performance failures, unforeseen site conditions, rejection clauses in customer contracts or other factors that may result in additional costs to us, reductions in revenue, claims or disputes;
|
|
•
|
our inability to obtain compensation for additional work we perform or expenses we incur as a result of our customers providing deficient design, engineering information, equipment or materials;
|
16
|
•
|
requirements to pay liquidated damages upon our failure to meet schedule or performance requirements of our contracts; and
|
|
•
|
difficulties in engaging third-party subcontractors, equipment manufacturers or materials suppliers or failures by third-party subcontractors, equipment manufacturers or materials suppliers to perform could result in project delays and cause us to incur additional costs.
|
If we fail to comply with government procurement laws and regulations, we could lose business and be liable for various penalties or sanctions.
We must comply with laws and regulations relating to the formation, administration, and performance of U.S. Government contracts. These laws and regulations include the Federal Acquisition Regulations, Defense Federal Acquisition Regulations, the Truth in Negotiations Act, Cost Accounting Standards, and laws, regulations, and orders restricting the use and dissemination of classified information under the U.S. export control laws and the export of certain products and technical information. Certain government contracts provide audit rights by government agencies, including with respect to performance, costs, internal controls and compliance with applicable laws and regulations. In complying with these laws and regulations, we may incur significant costs, and non-compliance may result in the imposition of fines and penalties, including contractual damages. If we fail to comply with these laws and regulations or if a government audit, review, or investigation uncovers improper or illegal activities, we may be subject to civil penalties, criminal penalties, or administrative sanctions, including suspension or debarment from contracting with the U.S. Government. Our reputation could suffer harm if allegations of impropriety were made or found against us, which could adversely affect our operating performance and may result in additional expenses and possible loss of revenue.
Changes in our effective tax rate and tax positions may vary.
We are subject to income taxes primarily in the U.S. and Canada. A change in tax laws, treaties or regulations, or their interpretation, in any jurisdiction in which we operate could significantly impact our provision for income taxes, which could have a material impact on our earnings, cash flows from operations and value of our deferred tax assets or liabilities.
In addition, significant judgment is required in determining our provision for income taxes. In the ordinary course of our business, there are many transactions and calculations where the ultimate tax determination is uncertain, and we are regularly subject to audit by tax authorities. Although we believe that our tax estimates and tax positions are reasonable, they could be materially affected by many factors including the final outcome of tax audits and related litigation, the introduction of new tax accounting standards, legislation, regulations and related interpretations, the realizability of deferred tax assets and changes in uncertain tax positions. A significant increase in our tax rate could have a material adverse effect on our profitability and liquidity. A significant decrease in our tax rate could have a material adverse effect on our financial results in the implementation year due to the need to revalue our deferred tax assets to adjust for the lower future tax savings expected with the new tax rate and other potential charges. For example, in 2017 we took a charge of $53.0 million primarily due to the reduced value of our deferred tax assets resulting from reduced future tax rates established by H.R. 1, the Tax Cuts and Jobs Act, which was enacted on December 22, 2017. The ultimate impact of H.R. 1 is subject to further regulatory and/or administrative developments, including any regulations or guidance from the Internal Revenue Service.
Our business could be negatively impacted by security threats, including physical and cybersecurity threats, and other disruptions.
We face various security threats, including cyber threats, threats to the physical security of our facilities and infrastructure (including those that we manage and operate for our customers), and threats from terrorist acts, as well as the potential for business disruptions associated with these threats. Although we utilize a combination of tailored and industry standard security measures and technology to monitor and mitigate these threats, we cannot guarantee that these measures and technology will be sufficient to prevent security threats from materializing.
We have been, and will likely continue to be, subject to cyber-based attacks and other attempts to threaten our information technology systems, including attempts to gain unauthorized access to our proprietary or classified information and attacks from computer hackers, viruses, malicious code and other security problems. As a U.S. Government contractor, we may be prone to a greater number of those threats than companies in other industries. From time to time, we experience system interruptions and delays; however, prior cyber-based attacks directed at us have not had a material adverse impact on our results of operations. Due to the evolving nature of these security threats, however, the impact of any future incident cannot be predicted.
17
The costs related to cyber or other security threats or disruptions may not be fully insured or indemnified by other means. Occurrence of any of these events could adversely affect our internal operations, the services we provide to customers, the value of our investment in research and development efforts and other intellectual property, our future financial results, our reputation or our stock price.
In addition, from time to time we may replace and/or upgrade current financial, human resources and other information technology systems. These activities subject us to inherent costs and risks associated with replacing and updating these systems, including potential disruption of our internal control structure, substantial capital expenditures, demands on management time and other risks of delays or difficulties in transitioning to new systems or of integrating new systems into our current systems. Our systems' implementations and upgrades may not result in productivity improvements at the levels anticipated, or at all. In addition, the implementation of new technology systems may cause disruptions in our business operations. Such disruption and any other information technology system disruptions, and our ability to mitigate those disruptions, if not anticipated and appropriately mitigated, could have a material adverse effect on us.
We rely on intellectual property law and confidentiality agreements to protect our intellectual property. We also rely on intellectual property we license from third parties. Our failure to protect our intellectual property rights, or our inability to obtain or renew licenses to use intellectual property of third parties, could adversely affect our business.
Our success depends, in part, on our ability to protect our proprietary information and other intellectual property. Our intellectual property could be stolen, challenged, invalidated, circumvented or rendered unenforceable. In addition, effective intellectual property protection may be limited or unavailable in some foreign countries where we operate.
Our failure to protect our intellectual property rights may result in the loss of valuable technologies or adversely affect our competitive business position. We rely significantly on proprietary technology, information, processes and know-how that are not subject to patent or copyright protection. We seek to protect this information through trade secret or confidentiality agreements with our employees, consultants, subcontractors or other parties, as well as through other security measures. These agreements and security measures may be inadequate to deter or prevent misappropriation of our confidential information. In the event of an infringement of our intellectual property rights, a breach of a confidentiality agreement or divulgence of proprietary information, we may not have adequate legal remedies to protect our intellectual property. Litigation to determine the scope of intellectual property rights, even if ultimately successful, could be costly and could divert management's attention away from other aspects of our business. In addition, our trade secrets may otherwise become known or be independently developed by competitors.
In some instances, we have augmented our technology base by licensing the proprietary intellectual property of third parties. In the future, we may not be able to obtain necessary licenses on commercially reasonable terms, which could have a material adverse effect on our operations.
Our use of the percentage-of-completion method of accounting could result in volatility in our results of operations.
We generally recognize revenues and profits under our long-term contracts on a percentage-of-completion basis. Accordingly, we review contract price and cost estimates regularly as the work progresses and reflect adjustments proportionate to the percentage of completion in income in the period when we revise those estimates. To the extent these adjustments result in a reduction or an elimination of previously reported profits with respect to a project, we would recognize a charge against current earnings, which could be material. Our current estimates of our contract costs and the profitability of our long-term projects, although reasonably reliable when made, could change as a result of the uncertainties associated with these types of contracts, and if adjustments to overall contract costs are significant, the reductions or reversals of previously recorded revenue and profits could be material in future periods.
We are involved in a number of legal proceedings. We cannot predict the outcome of litigation and other contingencies with certainty.
Our business may be adversely affected by the outcome of legal proceeding, disputes and other contingencies that cannot be predicted with certainty. As required by GAAP, we estimate loss contingencies and establish reserves based on our assessment of contingencies where liability is deemed probable and reasonably estimable in light of the facts and circumstances known to us at a particular point in time. Subsequent developments in legal proceedings may affect our assessment and estimates of the loss contingency recorded as a liability or as a reserve against assets in our financial statements. For a description of current legal proceedings, see "
Note 10
– Commitments and Contingencies" to our consolidated financial statements included in this Report.
18
Maintaining adequate bonding and letter of credit capacity is necessary for us to successfully bid on and win various contracts.
In line with industry practice, we are often required to post standby letters of credit and surety bonds to support contractual obligations to customers as well as other obligations. These letters of credit and bonds generally indemnify customers should we fail to perform our obligations under the applicable contracts. If a letter of credit or bond is required for a particular project and we are unable to obtain it due to insufficient liquidity or other reasons, we will not be able to pursue that project. We utilize bonding facilities, but, as is typically the case, the issuance of bonds under each of those facilities is at the surety's sole discretion. In addition, we have capacity limits under our credit facility for letters of credit. Moreover, due to events that affect the insurance and bonding and credit markets generally, bonding and letters of credit may be more difficult to obtain in the future or may only be available at significant additional cost. There can be no assurance that letters of credit or bonds will continue to be available to us on reasonable terms. Our inability to obtain adequate letters of credit and bonding and, as a result, to bid on new work could have a material adverse effect on our business, financial condition and results of operations. As of
December 31, 2017
, we had
$75.9 million
in letters of credit and bank guarantees and
$60.8 million
in surety bonds outstanding.
Our credit facility could restrict our operations.
The terms of our credit agreement impose various restrictions and covenants on us that could have adverse consequences, including:
|
•
|
limiting our ability to react to changing economic, regulatory and industry conditions;
|
|
•
|
limiting our ability to compete and our flexibility in planning for, or reacting to, changes in our business and the industry;
|
|
•
|
limiting our ability to invest in joint ventures or acquire other companies;
|
|
•
|
limiting our ability to pay dividends to our stockholders; and
|
|
•
|
limiting our ability to borrow additional funds.
|
Our failure to comply with these restrictions and covenants could adversely affect our liquidity and operations.
Our business strategy includes acquisitions and strategic investments to support our growth, which can create certain risks and uncertainties.
We intend to pursue growth through the acquisition of, or strategic investments in, businesses or assets that we believe will enable us to strengthen our existing businesses and expand into adjacent industries. We may be unable to execute this growth strategy if we cannot identify suitable businesses or assets, reach agreement on potential strategic acquisitions on acceptable terms or for other reasons.
In December 2016, we completed our acquisition of NEC. Business acquisitions such as NEC involve certain risks, including:
|
•
|
difficulties relating to the assimilation of personnel, services and systems of an acquired business and the assimilation of marketing and other operational capabilities;
|
|
•
|
challenges resulting from unanticipated changes in customer relationships after the acquisition;
|
|
•
|
additional financial and accounting challenges and complexities in areas such as tax planning, treasury management, financial reporting and internal controls;
|
|
•
|
assumption of liabilities of an acquired business, including liabilities that were unknown at the time the acquisition transaction was negotiated;
|
|
•
|
diversion of management's attention from day-to-day operations;
|
|
•
|
failure to realize anticipated benefits, such as cost savings and revenue enhancements;
|
|
•
|
potentially substantial transaction costs associated with business combinations; and
|
|
•
|
potential impairment of goodwill or other intangible assets resulting from the overpayment for an acquisition.
|
19
Acquisitions may be funded by the issuance of additional equity or debt financing, which may not be available on attractive terms. Our ability to secure such financing will depend in part on prevailing capital market conditions, as well as conditions in our business and operating results. Moreover, to the extent an acquisition transaction financed by non-equity consideration results in goodwill, it will reduce our tangible net worth, which might have an adverse effect on potential credit and bonding capacity.
Additionally, an acquisition may bring us into businesses we have not previously conducted and expose us to additional business risks that are different than those we have historically experienced.
Our business strategy also includes development and commercialization of new technologies to support our growth, which requires significant investment and involves various risks and uncertainties. These new technologies may not achieve desired commercial or financial results.
Our future growth will depend on our ability to continue to innovate by developing and commercializing new product and service offerings. Investments in new technologies involve varying degrees of uncertainties and risk. Commercial success depends on many factors, including the levels of innovation, the development costs and the availability of capital resources to fund those costs, the levels of competition from others developing similar or other competing technologies, our ability to obtain or maintain government permits or certifications, the effectiveness of production, distribution and marketing efforts, and the costs to customers to deploy and provide support for the new technologies. We may not achieve significant revenue from new product and service investments for a number of years, if at all. Additionally, there can be no assurance that the current technologies that our businesses rely upon will remain competitive, or that competing technologies will not disrupt our business. Moreover, new products and services may not be profitable, and, even if they are profitable, our operating margins from new products and services may not be as high as the margins we have experienced historically. Lastly, new technologies may not be patentable and, as a result, we may face increased competition.
Among our opportunities involving new technologies, we are currently developing new medical isotope technology. The costs to develop and commercialize this technology require a substantial amount of investment over a period of years, and commercialization of this technology also requires authorizations from government agencies, including the U.S. Food and Drug Administration ("FDA"), Health Canada and the CNSC. There can be no assurance that we will be successful in addressing all of the technological challenges to developing and commercializing this technology or in obtaining the required FDA, Health Canada or CNSC authorizations. The potential also exists for other competitors to emerge with competing technologies. We can provide no assurance that those competitors will not develop and commercialize similar or superior technologies sooner than we can or at a significant cost or price advantage.
Our operations are subject to operating risks, which could expose us to potentially significant professional liability, product liability, warranty and other claims. Our insurance coverage may be inadequate to cover all of our significant risks or our insurers may deny coverage of material losses we incur, which could adversely affect our profitability and overall financial condition.
We operate large manufacturing facilities and perform services in large commercial power plants where accidents or system failures can have significant consequences. Risks inherent in our operations include:
|
•
|
accidents resulting in injury or the loss of life or property;
|
|
•
|
environmental or toxic tort claims, including delayed manifestation claims for personal injury or loss of life;
|
|
•
|
pollution or other environmental mishaps;
|
|
•
|
adverse weather conditions;
|
|
•
|
mechanical or design failures;
|
|
•
|
property losses;
|
|
•
|
business interruption due to political action in foreign countries or other reasons; and
|
|
•
|
labor stoppages.
|
Any accident or failure at a site where we have provided products or services could result in significant professional liability, product liability, warranty and other claims against us, regardless of whether our products or services caused the incident. We have been, and in the future we may be, named as defendants in lawsuits asserting large claims as a result of litigation arising from events such as those listed above.
20
We endeavor to identify and obtain in established markets insurance agreements to cover significant risks and liabilities. Insurance against some of the risks inherent in our operations is either unavailable or available only at rates or on terms that we consider uneconomical. Also, catastrophic events customarily result in decreased coverage limits, more limited coverage, additional exclusions in coverage, increased premium costs and increased deductibles and self-insured retentions. Risks that we have frequently found difficult to cost-effectively insure against include, but are not limited to, business interruption, property losses from wind, flood and earthquake events, nuclear hazards and war, pollution liability, liabilities related to occupational health exposures (including asbestos), professional liability/errors and omissions coverage, the failure, misuse or unavailability of our information systems, the failure of security measures designed to protect our information systems from security breaches, and liability related to risk of loss of our work in progress and customer-owned materials in our care, custody and control. Depending on competitive conditions and other factors, we endeavor to obtain contractual protection against certain uninsured risks from our customers. When obtained, such contractual indemnification protection may not be as broad as we desire or may not be supported by adequate insurance maintained by the customer. Such insurance or contractual indemnity protection may not be sufficient or effective under all circumstances or against all hazards to which we may be subject. A successful claim for which we are not insured or for which we are underinsured could have a material adverse effect on us. Additionally, disputes with insurance carriers over coverage may affect the timing of cash flows and, if litigation with the carrier becomes necessary, an outcome unfavorable to us may have a material adverse effect on our results of operations.
We are also involved in management and operating activities for the U.S. Government. These activities involve, among other things, handling nuclear devices and their components for the U.S. Government. Most insurable liabilities arising from these sites are not protected in our corporate insurance program. Instead, we rely on government contractual agreements, some insurance purchased specifically for the sites and certain specialized self-insurance programs funded by the U.S. Government. The U.S. Government has historically fulfilled its contractual agreement to reimburse for insurable claims, and we expect it to continue this process. However, it should be noted that, in most situations, the U.S. Government is contractually obligated to pay subject to the availability of authorized government funds. The reimbursement obligation of the U.S. Government is also conditional, and provisions of the relevant contract or applicable law may preclude reimbursement.
We have a captive insurance company subsidiary that provides us with various insurance coverages. Claims, as a result of our operations, could adversely impact the ability of our captive insurance company subsidiary to respond to all claims presented.
Additionally, upon the February 22, 2006 effectiveness of the settlement relating to the Chapter 11 proceedings involving several of our former subsidiaries, most of our subsidiaries contributed substantial insurance rights providing coverage for, among other things, asbestos and other personal injury claims, to an asbestos personal injury trust. With the contribution of these insurance rights to the asbestos personal injury trust, we may have underinsured or uninsured exposure for non-derivative asbestos claims or other personal injury or other claims that would have been insured under these coverages had the insurance rights not been contributed to the asbestos personal injury trust. However, in conjunction with the spin-off, claims and liabilities associated with the asbestos personal injury, property damage and indirect property damage claims mentioned above have been expressly assumed by BWE pursuant to the master separation agreement between us and BWE.
Our nuclear operations subject us to various environmental, regulatory, financial and other risks.
Our operations in designing, engineering, manufacturing, supplying, constructing and maintaining nuclear fuel and nuclear power equipment and components subject us to various risks, including:
|
•
|
potential liabilities relating to harmful effects on the environment and human health resulting from nuclear operations and the storage, handling and disposal of radioactive materials;
|
|
•
|
unplanned expenditures relating to maintenance, operation, security, defects, upgrades and repairs required by the NRC and other government agencies;
|
|
•
|
limitations on the amounts and types of insurance commercially available to cover losses that might arise in connection with nuclear operations; and
|
|
•
|
potential liabilities arising out of a nuclear, radiological or criticality incident, whether or not it is within our control.
|
Our nuclear operations are subject to various safety-related requirements imposed by the U.S. Government, the DOE and the NRC. In the event of non-compliance, these agencies might increase regulatory oversight, impose fines or shut down our operations, depending upon the assessment of the severity of the situation. Revised security and safety requirements promulgated by these agencies could necessitate substantial capital and other expenditures. In addition, we must comply with and are affected by laws and regulations relating to the award, administration and performance of U.S. Government contracts.
21
Government contract laws and regulations affect how we do business with our customers and, in some instances, impose added costs on our business. A violation of specific laws and regulations could result in the imposition of fines and penalties or the termination of our contracts or debarment from bidding on contracts.
Limitations or modifications to indemnification regulations of the U.S. or foreign countries could adversely affect our business.
The Price-Anderson Act partially indemnifies the nuclear industry against liability arising from nuclear incidents in the U.S., while ensuring compensation for the general public. The Price-Anderson Act comprehensively regulates the manufacture, use and storage of radioactive materials, while promoting the nuclear industry by offering broad indemnification to commercial nuclear power plant operators and DOE contractors. Because we provide nuclear fabrication and other services to the DOE relating to its nuclear devices, facilities and other programs and the nuclear power industry in the ongoing maintenance and modifications of its nuclear power plants, including the manufacture of equipment and other components for use in such nuclear power plants, we may be entitled to some of the indemnification protections under the Price-Anderson Act against liability arising from nuclear incidents in the U.S. The indemnification authority under the Price-Anderson Act was extended through December 2025 by the Energy Policy Act of 2005. We also provide nuclear fabrication and other services to the nuclear power industry in Canada and other countries. Canada's Nuclear Liability and Compensation Act generally conforms to international conventions and is conceptually similar to the Price-Anderson Act in the U.S. Accordingly, indemnification protections and the possibility of exclusions under Canada's Nuclear Liability and Compensation Act are similar to those under the Price-Anderson Act in the U.S.
The Price-Anderson Act's and Canada's Nuclear Liability and Compensation Act's indemnification provisions may not apply to all liabilities that we might incur while performing services as a contractor for the DOE and the nuclear power industry. If an incident or evacuation is not covered under the Price-Anderson Act's or Canada's Nuclear Liability and Compensation Act's indemnification provisions, we could be held liable for damages, regardless of fault, which could have an adverse effect on our results of operations and financial condition. In connection with the international transportation of toxic, hazardous and radioactive materials, it is possible for a claim to be asserted which may not fall within the indemnification provided by the Price-Anderson Act or Canada's Nuclear Liability and Compensation Act. If such indemnification authority is not applicable in the future, our business could be adversely affected if the owners and operators of nuclear power plants fail to retain our services in the absence of commercially adequate insurance and indemnification.
Moreover, because we manufacture nuclear components for the U.S. Government's defense program, we may be entitled to some of the indemnification protections afforded by Public Law 85-804 for certain of our nuclear operations risks. Public Law 85-804 authorizes certain agencies of the U.S. Government, such as the DOE and the U.S. Department of Defense, to indemnify their contractors against unusually hazardous or nuclear risks when such action would facilitate the national defense. However, because the indemnification protections afforded by Public Law 85-804 are granted on a discretionary basis, situations could arise where the U.S. Government elects not to offer such protections. In such situations, our business could be adversely affected by either our inability to obtain commercially adequate insurance or indemnification or our refusal to pursue such operations in the absence of such protections.
Our operations involve the handling, transportation and disposal of radioactive and hazardous materials, and environmental laws and regulations and civil liability for contamination of the environment or related personal injuries may result in increases in our operating costs and capital expenditures and decreases in our earnings and cash flows.
Our operations involve the handling, transportation and disposal of radioactive and hazardous materials, including nuclear devices and their components. Failure to properly handle these materials could pose a health risk to humans or wildlife and could cause personal injury and property damage (including environmental contamination). If an accident were to occur, its severity could be significantly affected by the volume of the materials and the speed of corrective action taken by emergency response personnel, as well as other factors beyond our control, such as weather and wind conditions. Actions taken in response to an accident could result in significant costs.
Governmental requirements relating to the protection of the environment, including solid waste management, air quality, water quality, the decontamination and decommissioning of nuclear manufacturing and processing facilities and cleanup of contaminated sites, have had a substantial impact on our operations. These requirements are complex and subject to frequent change. In some cases, they can impose liability for the entire cost of cleanup on any responsible party without regard to negligence or fault and impose liability on us for the conduct of others or conditions others have caused, or for our acts that complied with all applicable requirements when we performed them. Our compliance with amended, new or more stringent requirements, stricter interpretations of existing requirements or the future discovery of contamination may require us to make material expenditures or subject us to liabilities that we currently do not anticipate. Such expenditures and liabilities may
22
adversely affect our business, financial condition, results of operations and cash flows. In addition, some of our operations and the operations of predecessor owners of some of our properties have exposed us to civil claims by third parties for liability resulting from alleged contamination of the environment or personal injuries caused by releases of hazardous substances into the environment. See Item 1, "Business - Governmental Regulations and Environmental Matters."
In our contracts, we seek to protect ourselves from liability associated with accidents, but there can be no assurance that such contractual limitations on liability will be effective in all cases or that our or our customers' insurance will cover all the liabilities we have assumed under those contracts. The costs of defending against a claim arising out of a nuclear incident or precautionary evacuation, and any damages awarded as a result of such a claim, could adversely affect our results of operations and financial condition.
We maintain insurance coverage as part of our overall risk management strategy and due to requirements to maintain specific coverage in our financing agreements and in many of our contracts. These policies do not protect us against all liabilities associated with accidents or for unrelated claims. In addition, comparable insurance may not continue to be available to us in the future at acceptable prices, or at all.
We are subject to domestic and international laws and regulations, violations of which may adversely affect our future operations.
Many aspects of our operations and properties are affected by political developments and are subject to both domestic and foreign governmental regulations, including those relating to:
|
•
|
constructing and manufacturing nuclear components;
|
|
•
|
currency conversions and repatriation;
|
|
•
|
environmental protection legislation;
|
|
•
|
export control;
|
|
•
|
taxation of earnings;
|
|
•
|
transactions in or with certain foreign countries or officials, such as those designated by the Office of Foreign Assets Control of the U.S. Department of the Treasury; and
|
|
•
|
use of local employees and suppliers.
|
Failure by us, our sales representatives, or consultants to comply with these laws and regulations could result in administrative, civil, or criminal liabilities and could, in the extreme case, result in suspension or debarment from government contracts or suspension of our export privileges, which could have a material adverse effect on our business.
In addition, a portion of the demand for our products and services is from electric power generating companies and other customers. The demand for power generation products and services can be influenced by state and federal governmental legislation setting requirements for utilities related to operations, emissions and environmental impacts. The legislative process is unpredictable and includes a platform that continuously seeks to increase the restrictions on power producers.
We cannot determine the extent to which our future operations and earnings may be affected by new legislation, new regulations or changes in existing regulations.
Our business requires us to obtain, and to comply with, national, state and local government permits and approvals.
Our business is required to obtain, and to comply with, national, state and local government permits and approvals. Any of these permits or approvals may be subject to denial, revocation or modification under various circumstances. Failure to obtain or comply with the conditions of permits or approvals may adversely affect our operations by temporarily suspending our activities or curtailing our work and may subject us to penalties and other sanctions. Although existing licenses are routinely renewed by various regulators, renewal could be denied or jeopardized by various factors, including:
|
•
|
failure to provide adequate financial assurance for decommissioning or closure;
|
|
•
|
failure to comply with environmental and safety laws and regulations or permit conditions;
|
|
•
|
local community, political or other opposition;
|
23
|
•
|
executive action; and
|
|
•
|
legislative action.
|
In addition, if new environmental legislation or regulations are enacted or implemented, or existing laws or regulations are amended or are interpreted or enforced differently, we may be required to obtain additional operating permits or approvals. Our inability to obtain, and to comply with, the permits and approvals required for our business could have a material adverse effect on us.
Employee, agent or partner misconduct or our overall failure to comply with laws, regulations or government contracts could weaken our ability to win contracts, lead to the suspension of our operations and result in reduced revenues and profits.
Misconduct, fraud, or other improper activities by one or more of our employees, agents or partners as well as our failure to comply with applicable laws and regulations, could have a significant negative impact on our business and reputation. Such misconduct could include the failure to comply with government procurement regulations, regulations regarding the protection of classified information, regulations regarding the pricing of labor and other costs in government contracts, regulations on lobbying or similar activities, regulations pertaining to the internal controls over financial reporting and various other applicable laws or regulations. For example, we regularly provide services that may be highly sensitive or that are related to critical national security matters; if a security breach were to occur, our ability to procure future government contracts could be severely limited. The precautions we take to prevent and detect these activities may not be effective, and we could face unknown risks or losses.
We are routinely audited and reviewed by the U.S. Government and its agencies. These agencies review our performance under our contracts, our cost structure and our compliance with applicable laws, regulations and standards, as well as the adequacy of, and our compliance with, our internal control systems and policies. Systems that are subject to review include our purchasing systems, billing systems, property management and control systems, cost estimating systems, compensation systems and management information systems. Any costs found to be improperly allocated to a specific contract will not be reimbursed or must be refunded if already reimbursed. If an audit or review uncovers improper or illegal activities, we could be subject to civil and criminal penalties and administrative sanctions, including termination of contracts, forfeiture of profits, suspension of payments, fines, loss of security clearance and suspension or debarment from contracting with the U.S. Government. In addition, we could suffer serious reputational harm if allegations of impropriety were made against us.
We conduct a portion of our operations through joint venture entities, over which we may have limited ability to influence.
We currently have equity interests in several joint ventures and may enter into additional joint venture arrangements in the future. Our influence over some of these entities may be limited. Even in those joint ventures over which we do exercise significant influence, we are often required to consider the interests of our joint venture partners in connection with major decisions concerning the operations of the joint ventures. In any case, differences in views among the joint venture participants may result in delayed decisions or disputes. We also cannot control the actions of our joint venture participants. We sometimes have joint and several liabilities with our joint venture partners under the applicable contracts for joint venture projects and we cannot be certain that our partners will be able to satisfy any potential liability that could arise. These factors could potentially harm the business and operations of a joint venture and, in turn, our business and operations.
Operating through joint ventures in which we are minority holders results in us having limited control over many decisions made with respect to projects and internal controls relating to projects. These joint ventures may not be subject to the same requirements regarding internal controls and internal control over financial reporting that we follow. As a result, internal control problems may arise with respect to the joint ventures that could adversely affect our ability to respond to requests or contractual obligations to customers or to meet the internal control requirements to which we are otherwise subject.
In addition, our arrangements involving joint ventures may restrict us from gaining access to the cash flows or assets of these entities. In some cases, our joint ventures have governmentally imposed restrictions on their abilities to transfer funds to us.
24
If our co-venturers fail to perform their contractual obligations on a project or if we fail to coordinate effectively with our co-venturers, we could be exposed to legal liability, loss of reputation and reduced profit on the project.
We often perform projects jointly with third parties. For example, we enter into contractual arrangements to bid for and perform jointly on large projects. Success on these joint projects depends in part on whether our co-venturers fulfill their contractual obligations satisfactorily. If any one or more of these third parties fail to perform their contractual obligations satisfactorily, we may be required to make additional investments and provide added services in order to compensate for that failure. If we are unable to adequately address any such performance issues, then our customer may exercise its right to terminate a joint project, exposing us to legal liability, loss of reputation and reduced profit.
Our collaborative arrangements also involve risks that participating parties may disagree on business decisions and strategies. These disagreements could result in delays, additional costs and risks of litigation. Our inability to successfully maintain existing collaborative relationships or enter into new collaborative arrangements could have a material adverse effect on our results of operations.
The loss of the services of one or more of our key personnel, or our failure to attract, assimilate and retain trained personnel in the future, could disrupt our operations and result in loss of revenues.
Our success depends on the continued active participation of our executive officers and key operating personnel. The unexpected loss of the services of any one of these persons could adversely affect our operations.
Our operations require the services of employees having the technical training and experience necessary to obtain the proper operational results. Certain of our operations also require personnel who are eligible to obtain and maintain U.S. Government security clearances. As such, our operations depend, to a considerable extent, on the continuing availability of such employees and personnel. Additionally, the process of obtaining the requisite security clearances for some of our personnel can be subject to delays and other factors beyond our control. If we should suffer any material loss of personnel to competitors, retirement or other reasons, or experience difficulties employing additional or replacement personnel with the requisite level of training, experience and qualifications to adequately operate our business, our operations could be adversely affected.
While we believe our wage rates are competitive and our relationships with our employees are satisfactory, a significant increase in the wages paid by other employers could result in a reduction in our workforce, increases in wage rates, or both.
Negotiations with labor unions and possible work stoppages and other labor problems could divert management's attention and disrupt operations. In addition, new collective bargaining agreements or amendments to agreements could increase our labor costs and operating expenses.
A significant number of our employees are members of labor unions. If we are unable to negotiate acceptable new contracts with our unions from time to time, we could experience strikes or other work stoppages by the affected employees. If any such strikes or other work stoppages were to occur, we could experience a significant disruption of operations. In addition, negotiations with unions could divert management attention. New union contracts could result in increased operating costs, as a result of higher wages or benefit expenses, for both union and nonunion employees. If nonunion employees were to unionize, we would experience higher ongoing labor costs.
Pension and medical expenses associated with our retirement benefit plans may fluctuate significantly depending on changes in actuarial assumptions, future market performance of plan assets, future trends in health care costs and legislative or other regulatory actions.
A substantial portion of our current and retired employee population is covered by pension and postretirement benefit plans, the costs and funding requirements of which depend on our various assumptions, including estimates of rates of return on benefit-related assets, discount rates for future payment obligations, rates of future cost growth, mortality assumptions and trends for future costs. Service accruals for salaried participants ceased as of December 31, 2015. Variances from these estimates could have a material adverse effect on us. In addition, our policy to recognize these variances annually through mark to market accounting could result in volatility in our results of operations, which could be material. As of
December 31, 2017
, our defined benefit pension and postretirement benefit plans were underfunded by approximately
$(308.3) million
. A substantial portion of our postretirement benefit plan costs are recoverable on our U.S. Government contracts. See
Note 7
to our consolidated financial statements included in this Report for additional information regarding our pension and postretirement benefit plan obligations.
25
Our internal controls over financial reporting may not be sufficient to achieve all stated goals and objectives.
Our internal controls and procedures were developed through a process in which our management applied its judgment in assessing the costs and benefits of such controls and procedures, which, by their nature, can provide only reasonable assurance regarding the control objectives. The design of any system of internal controls and procedures is based in part upon various assumptions about the likelihood of future events, and we cannot provide assurance that any design will succeed in achieving its stated goals under all potential future conditions, regardless of how remote.
Our Nuclear Operations Group segment relies on several single-source suppliers, which could, under certain circumstances, adversely affect our revenues and operating results.
Our Nuclear Operations Group segment relies on several single-source suppliers for materials used in its products. If the supply of a single-sourced material is delayed or ceases, we may not be able to produce the related product in a timely manner or in sufficient quantities, if at all, which could adversely affect our revenues and operating results. In addition, a single-source supplier of a key component could potentially exert significant bargaining power over price, quality, warranty claims, or other terms relating to the single-sourced materials.
We could be adversely affected by violations of the U.S. Foreign Corrupt Practices Act.
The U.S. Foreign Corrupt Practices Act (the "FCPA") generally prohibits companies and their intermediaries from making improper payments to non-U.S. officials. Our training program and policies mandate compliance with the FCPA. We operate in some parts of the world that have experienced governmental corruption to some degree, and, in certain circumstances, strict compliance with anti-bribery laws may conflict with local customs and practices. If we are found to be liable for violations of the FCPA (either due to our own acts or our inadvertence, or due to the acts or inadvertence of others, including employees of our joint ventures), we could suffer from civil and criminal penalties or other sanctions.
We may not be able to compete successfully against current and future competitors.
Some of our competitors or potential competitors have greater financial or other resources than we have and in some cases are government supported. Our operations may be adversely affected if our current competitors or new market entrants introduce new products or services with better features, performance, prices or other characteristics than those of our products and services. Furthermore, we operate in industries where capital investment is critical. We may not be able to obtain as much purchasing and borrowing leverage and access to capital for investment as other public companies, which may impair our ability to compete against competitors or potential competitors.
Our international operations are subject to political, economic and other uncertainties not generally encountered in our domestic operations.
We derive a portion of our revenues from international operations. Operating in international markets requires significant resources and management attention and subjects us to political, economic and regulatory risks that are not generally encountered in our U.S. operations. These include:
|
•
|
renegotiation or nullification of our existing contracts;
|
|
•
|
changing political conditions and changing laws and policies affecting trade and investment; and
|
|
•
|
changes in foreign currency exchange rates.
|
Our international operations sometimes face the additional risks of fluctuating currency values, hard currency shortages and controls of foreign currency exchange.
Natural disasters or other events beyond our control could adversely impact our business.
Natural disasters, such as earthquakes, tsunamis, hurricanes, floods, tornados, or other events could adversely impact demand for or supply of our products. In addition, natural disasters could also cause disruption to our facilities, systems or projects, which could interrupt operational processes and performance on our contracts and adversely impact our ability to manufacture our products and provide services and support to our customers. We operate facilities in areas of the world that are exposed to natural disasters, such as, but not limited to, hurricanes, floods and tornados.
26
War, other armed conflicts or terrorist attacks could have a material adverse effect on our business.
War, terrorist attacks and unrest have caused and may continue to cause instability in the world's financial and commercial markets and have significantly increased political and economic instability in some of the geographic areas in which we operate. Threats of war or other armed conflict may cause further disruption to financial and commercial markets. In addition, continued unrest could lead to acts of terrorism in the U.S. or elsewhere, and acts of terrorism could be directed against companies such as ours. Also, acts of terrorism and threats of armed conflicts in or around various areas in which we operate could limit or disrupt our markets and operations, including disruptions from evacuation of personnel, cancellation of contracts or the loss of personnel or assets. Armed conflicts, terrorism and their effects on us or our markets may significantly affect our business and results of operations in the future.
Risks Relating to the Spin-Off of Our Former Power Generation Business
Potential indemnification liabilities relating to the spin-off could materially adversely affect us.
In connection with the spin-off, we entered into agreements with BWE to provide for, among other things, the principal corporate transactions required to effect the planned spin-off, certain conditions to the spin-off and provisions governing the relationship between us and BWE with respect to and resulting from the spin-off. Among other things, these agreements provided for indemnification obligations designed to make us financially responsible for substantially all liabilities that may exist relating to our business activities, whether incurred prior to or after the spin-off. If we are required to indemnify BWE, we may be subject to substantial liabilities.
BWE agreed to indemnify us for certain liabilities in connection with the spin-off. However, there can be no assurance that the indemnity will be sufficient to insure us against the full amount of such liabilities, or that BWE will be able to satisfy its indemnification obligations.
In connection with the spin-off, BWE agreed to indemnify us for certain liabilities. However, third parties could seek to hold us responsible for any of the liabilities that BWE will agree to retain, and there can be no assurance that the indemnity from BWE will be sufficient to protect us against the full amount of such liabilities, or that BWE will be able to fully satisfy its indemnification obligations. Moreover, even if we ultimately succeed in recovering from BWE any amounts for which we are held liable, we may be temporarily required to bear these losses.
The BWE spin-off could result in substantial tax liability.
Upon completion of the spin-off, we received an opinion of counsel substantially to the effect that, for U.S. federal income tax purposes, the spin-off will qualify under Section 355 of the Code and certain transactions related to the spin-off will qualify under Sections 355 and/or 368 of the Code. The opinion relied on, among other things, various assumptions and representations as to factual matters made by us and BWE, which, if inaccurate or incomplete in any material respect, could jeopardize the conclusions reached by such counsel in its opinion. The opinion is not binding on the IRS or the courts, and there can be no assurance that the IRS or the courts will not challenge the conclusions stated in the opinion or that any such challenge would not prevail.
We are not aware of any facts or circumstances that would cause the assumptions or representations that were relied on in the opinion to be inaccurate or incomplete in any material respect. If, notwithstanding receipt of the opinion, the spin-off were subsequently determined not to qualify under Section 355 of the Code, each U.S. holder of our common stock who received shares of BWE common stock in the spin-off would generally be treated as receiving a taxable distribution of property in an amount equal to the fair market value of the shares of BWE common stock received. That distribution would be taxable to each such stockholder as a dividend to the extent of our current and accumulated earnings and profits. For each such stockholder, any amount that exceeded our earnings and profits would be treated first as a non-taxable return of capital to the extent of such stockholder's tax basis in its shares of our common stock with any remaining amount being taxed as a capital gain. In addition, if certain related preparatory transactions were to fail to qualify for tax-free treatment, they would be treated as taxable sales and/or distributions to the Company.
We entered into a tax sharing agreement with BWE in connection with the spin-off. Pursuant to this agreement, we agreed with BWE on the allocation of spin-off related tax liabilities and the indemnification provisions relating to these liabilities. If we are liable for taxes under the tax sharing agreement, that liability could have a material adverse effect on us. Additionally, there can be no assurance that any indemnities from BWE will be sufficient to protect us against any potential tax liabilities.
27
Risks Relating to Ownership of Our Common Stock
Provisions in our corporate documents and Delaware law could delay or prevent a change in control of our company, even if that change may be considered beneficial by some stockholders.
The existence of some provisions of our certificate of incorporation and bylaws and Delaware law could discourage, delay or prevent a change in control of our company that a stockholder may consider favorable. These include provisions:
|
•
|
providing that our Board of Directors fixes the number of members of the board;
|
|
•
|
providing for the division of our Board of Directors into three classes with staggered terms;
|
|
•
|
limiting who may call special meetings of stockholders;
|
|
•
|
prohibiting stockholder action by written consent, thereby requiring stockholder action to be taken at a meeting of the stockholders;
|
|
•
|
establishing advance notice requirements for nominations of candidates for election to our Board of Directors or for proposing matters that can be acted on by stockholders at stockholder meetings;
|
|
•
|
establishing supermajority vote requirements for certain amendments to our certificate of incorporation and bylaws;
|
|
•
|
limiting the right of stockholders to remove directors;
|
|
•
|
authorizing a large number of shares of common stock that are not yet issued, which would allow our Board of Directors to issue shares to persons friendly to current management, thereby protecting the continuity of our management, or which could be used to dilute the stock ownership of persons seeking to obtain control of us; and
|
|
•
|
authorizing the issuance of "blank check" preferred stock, which could be issued by our Board of Directors to increase the number of outstanding shares and thwart a takeover attempt.
|
In addition, we are subject to Section 203 of the Delaware General Corporation Law, which may have an anti-takeover effect with respect to transactions not approved in advance by our Board of Directors, including discouraging takeover attempts that might result in a premium over the market price for shares of our common stock.
We believe these provisions protect our stockholders from coercive or otherwise unfair takeover tactics by requiring potential acquirers to negotiate with our Board of Directors and by providing our Board of Directors with more time to assess any acquisition proposal, and are not intended to make our company immune from takeovers. However, these provisions apply even if the offer may be considered beneficial by some stockholders and could delay or prevent an acquisition that our Board of Directors determines is not in the best interests of our company and our stockholders.
We may issue preferred stock that could dilute the voting power or reduce the value of our common stock.
Our certificate of incorporation authorizes us to issue, without the approval of our stockholders, one or more classes or series of preferred stock having such designation, powers, preferences and relative, participating, optional and other special rights, including preferences over our common stock respecting dividends and distributions, as our Board of Directors generally may determine. The terms of one or more classes or series of preferred stock could dilute the voting power or reduce the value of our common stock. For example, we could grant holders of preferred stock the right to elect some number of our directors in all events or on the happening of specified events or the right to veto specified transactions. Similarly, the repurchase or redemption rights or liquidation preferences we could assign to holders of preferred stock could affect the residual value of the common stock.
|
Item 1B.
|
UNRESOLVED STAFF COMMENTS
|
None.
28
|
Item 2.
|
PROPERTIES
|
The following table provides the segment name, location and general use of each of our principal properties at
December 31, 2017
that we own or lease:
|
Business Segment and Location
|
Principal Use
|
Owned/Leased
(Lease Expiration)
|
||
|
Nuclear Operations Group
|
||||
|
Lynchburg, Virginia
|
Manufacturing facility
(1)
|
Owned
|
||
|
Barberton, Ohio
|
Manufacturing facility
|
Owned
|
||
|
Euclid, Ohio
|
Manufacturing facility
|
Owned / Leased
(2)
|
||
|
Mount Vernon, Indiana
|
Manufacturing facility
|
Owned
|
||
|
Erwin, Tennessee
|
Manufacturing facility
(3)
|
Owned
|
||
|
Nuclear Services Group
|
||||
|
Lynchburg, Virginia
|
Administrative office
|
Owned
|
||
|
Lynchburg, Virginia
|
Engineering office
|
Leased (2018)
|
||
|
Nuclear Power Group
|
||||
|
Cambridge, Ontario, Canada
|
Manufacturing facility
|
Owned
|
||
|
Peterborough, Ontario, Canada
|
Manufacturing facility
|
Leased (2036)
(4)
|
||
|
Toronto, Ontario, Canada
|
Manufacturing facility
|
Leased (2036)
(4)
|
||
|
Arnprior, Ontario, Canada
|
Manufacturing facility
|
Leased (2022)
|
||
|
Corporate
|
||||
|
Lynchburg, Virginia
|
Administrative office
|
Leased (2018)
|
||
|
Charlotte, North Carolina
|
Administrative office
|
Leased (2022)
|
||
|
Washington, District of Columbia
|
Administrative office
|
Owned
|
||
|
(1)
|
The Lynchburg, Virginia facility is our Nuclear Operations Group segment's primary manufacturing plant and is the nation's largest commercial high-enriched uranium processing facility. The site is subject to review by the NRC for licensee performance. The performance review determines the safe and secure conduct of operations of the facility. The site is also the largest commercial International Atomic Energy Agency certified facility in the U.S.
|
|
(2)
|
We acquired the Euclid facilities through a bond/lease transaction facilitated by the Cleveland Cuyahoga County Port Authority (the "Port"), whereby we acquired a ground parcel and the Port issued bonds, the proceeds of which were used to acquire, improve and equip the facilities, including the acquisition of the larger facility and a 40-year prepaid ground lease for the smaller facility. We are leasing the facilities from the Port with an expiration date of 2019 but subject to certain extension options.
|
|
(3)
|
Nuclear Fuel Services, Inc. ("NFS") operates the Erwin, Tennessee facility, which manufactures fuel for naval nuclear reactors and converts Cold War-era government stockpiles of high-enriched uranium into material suitable for further processing into commercial nuclear reactor fuel. The site is subject to review by the NRC for licensee performance. The performance review determines the safe and secure conduct of operations of the facility. NFS has been the sole manufacturer of fuel for naval reactors since 1964.
|
|
(4)
|
The Peterborough and Toronto leases were entered into as part of the acquisition of NEC. These facilities operate under a Class 1B Nuclear Fuel Facility Operating License renewed by the CNSC to fabricate natural uranium fuel. The sites are subject to review by the CNSC for licensee performance. The performance reviews determine the safe and secure conduct of operations of the facilities. We are leasing the facilities from an affiliate of one of the former owners of GEH-C for a period of 20 years subject to certain extension options.
|
We consider each of our significant properties to be suitable and adequate for its intended use.
For further details regarding our properties, see Item 1, "Business."
|
Item 3.
|
LEGAL PROCEEDINGS
|
The information set forth under the heading "Investigations and Litigation" in
Note 10
to our consolidated financial statements included in this Report is incorporated by reference into this Item 3.
29
|
Item 4.
|
MINE SAFETY DISCLOSURES
|
None.
30
|
Item 5.
|
MARKET FOR REGISTRANT'S COMMON EQUITY, RELATED STOCKHOLDER MATTERS AND ISSUER PURCHASES OF EQUITY SECURITIES
|
Our common stock is traded on the New York Stock Exchange under the symbol BWXT.
High and low common stock prices and dividends paid by quarter in the years ended
December 31, 2017
and
2016
were as follows:
YEAR ENDED
DECEMBER 31, 2017
|
|
SHARE PRICE
|
DIVIDENDS
PER SHARE
|
||||||||||
|
QUARTER ENDED
|
HIGH
|
LOW
|
||||||||||
|
March 31, 2017
|
$
|
49.11
|
|
$
|
39.03
|
|
$
|
0.09
|
|
|||
|
June 30, 2017
|
$
|
51.00
|
|
$
|
45.79
|
|
$
|
0.11
|
|
|||
|
September 30, 2017
|
$
|
57.45
|
|
$
|
48.45
|
|
$
|
0.11
|
|
|||
|
December 31, 2017
|
$
|
62.85
|
|
$
|
56.22
|
|
$
|
0.11
|
|
|||
YEAR ENDED
DECEMBER 31, 2016
|
|
SHARE PRICE
|
DIVIDENDS
PER SHARE
|
||||||||||
|
QUARTER ENDED
|
HIGH
|
LOW
|
||||||||||
|
March 31, 2016
|
$
|
34.61
|
|
$
|
26.89
|
|
$
|
0.09
|
|
|||
|
June 30, 2016
|
$
|
36.43
|
|
$
|
32.24
|
|
$
|
0.09
|
|
|||
|
September 30, 2016
|
$
|
39.70
|
|
$
|
34.69
|
|
$
|
0.09
|
|
|||
|
December 31, 2016
|
$
|
40.66
|
|
$
|
36.16
|
|
$
|
0.09
|
|
|||
On February 23, 2016, our Board of Directors approved a quarterly cash dividend of $0.09 per share. On April 28, 2017, our Board of Directors approved an increase to the quarterly cash dividend to $0.11 per share. Our ability to pay dividends may be limited by certain restrictions in our credit agreement and by applicable law. Our Board of Directors will continue to evaluate our cash dividend policy from time to time.
As of
February 23, 2018
, there were approximately
1,961
record holders of our common stock.
In November 2012, we announced that a share repurchase program was authorized by our Board of Directors. The following table provides information on our purchases of equity securities during the quarter ended
December 31, 2017
. Any shares purchased that were not part of a publicly announced plan or program are related to repurchases of common stock pursuant to the provisions of employee benefit plans that permit the repurchase of shares to satisfy statutory tax withholding obligations.
Issuer Purchases of Equity Securities
|
Period
|
Total number
of shares
purchased
(1)
|
Average price paid per share
|
Total number of shares purchased as part of publicly announced plans or programs
|
Approximate dollar value of shares that may yet be purchased under the plans or programs (in millions)
(2)
|
||||||||||
|
October 1, 2017 – October 31, 2017
|
—
|
|
—
|
|
—
|
|
$
|
193.0
|
|
|||||
|
November 1, 2017 – November 30, 2017
|
4,698
|
|
$
|
60.29
|
|
—
|
|
$
|
193.0
|
|
||||
|
December 1, 2017 – December 31, 2017
|
6,087
|
|
$
|
61.88
|
|
—
|
|
$
|
193.0
|
|
||||
|
Total
|
10,785
|
|
$
|
61.19
|
|
—
|
|
|||||||
|
(1)
|
Includes
4,698
and
6,087
shares repurchased during November and December, respectively, pursuant to the provisions of employee benefit plans that permit the repurchase of shares to satisfy statutory tax withholding obligations.
|
|
(2)
|
On November 4, 2015, we announced that our Board of Directors authorized us to repurchase an indeterminate number of shares of our common stock at an aggregate market value of up to $300 million during a two-year period that began on February 26, 2016 and expires on February 26, 2018. On February 27, 2017, we announced that our Board of
|
31
Directors authorized us to repurchase an indeterminate number of shares of our common stock at an aggregate market value of up to $150 million during a three-year period that expires on February 24, 2020. The February 2017 authorization was in addition to the share repurchase amount authorized in November 2015.
The following graph provides a comparison of our cumulative total shareholder return over five years to the return of the S&P 500 Composite Index ("S&P 500 Index"), the return of the S&P Aerospace and Defense Select Index ("S&P A&D Select Index") and the return of our custom peer group. In the past, we have presented our total shareholder return performance relative to the S&P 500 Index and our custom peer group. However, this year we have also included the S&P A&D Select Index, an independently prepared index that includes more than 30 companies in the aerospace and defense industry. In future years, we intend to replace our custom peer group with the S&P A&D Select Index because we believe it is commonly used within our industry and has less focus on any specific business models or practices of our custom peer group.
The following graph shall not be deemed to be "soliciting material" or "filed" with the SEC or be subject to Regulation 14A or 14C (other than as provided in Item 201 of Regulation S-K) or to the liabilities of Section 18 of the Securities Exchange Act of 1934, as amended (the "Exchange Act"), nor shall such information be incorporated by reference into any future filing under the Securities Act of 1933, as amended, or the Exchange Act, except to the extent that BWXT specifically incorporates it by reference into such filing.
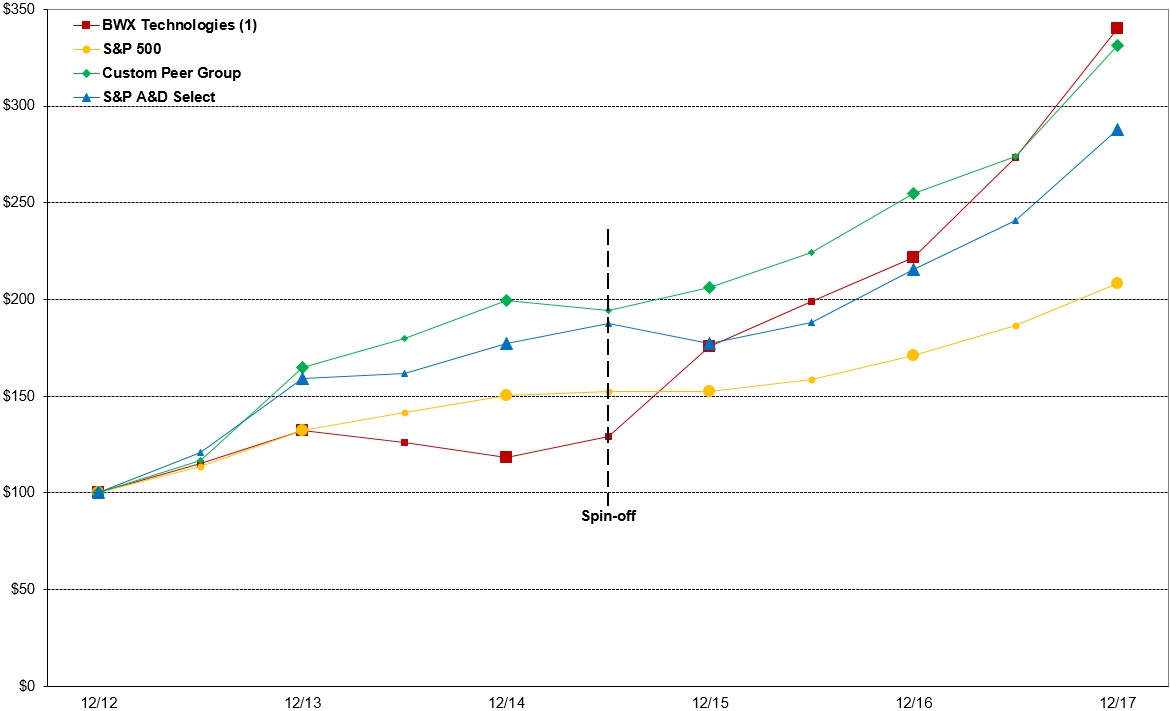
|
(1)
|
Assumes initial investment of $100 on
December 31, 2012
and reinvestment of dividends. The value of the BWE shares distributed in the spin-off is reflected in the cumulative total return as a reinvested dividend.
|
We periodically review and update our peer group to ensure it contains companies that are representative of the industries in which we operate. The custom peer group we used for comparison purposes comprises the following companies:
|
•
Curtiss-Wright Corporation
|
•
Lockheed Martin
|
|
•
Esterline Technologies
|
•
Moog
|
|
•
General Dynamics
|
•
Northrop Grumman
|
|
•
Harris Corporation
|
•
Orbital ATK
|
|
•
Huntington Ingalls
|
•
Rockwell Collins
|
32
|
Item 6.
|
SELECTED FINANCIAL DATA
|
|
|
For the Years Ended December 31,
|
|||||||||||||||||||
|
|
2017
|
2016
|
2015
|
2014
|
2013
|
|||||||||||||||
|
|
(In thousands, except per share amounts)
|
|||||||||||||||||||
|
Statement of Income Data
(1)
:
|
||||||||||||||||||||
|
Revenues
|
$
|
1,687,738
|
|
$
|
1,550,573
|
|
$
|
1,415,529
|
|
$
|
1,450,610
|
|
$
|
1,546,663
|
|
|||||
|
Income from Continuing Operations before Provision for Income Taxes and Noncontrolling Interest
|
$
|
295,780
|
|
$
|
257,268
|
|
$
|
221,065
|
|
$
|
32,135
|
|
$
|
285,512
|
|
|||||
|
Income from Continuing Operations, Net of Tax
|
$
|
147,844
|
|
$
|
183,057
|
|
$
|
140,774
|
|
$
|
38,740
|
|
$
|
198,490
|
|
|||||
|
Income (Loss) from Discontinued Operations, Net of Tax
|
—
|
|
—
|
|
(9,309
|
)
|
(9,352
|
)
|
147,588
|
|
||||||||||
|
Net Income Attributable to BWX Technologies, Inc.
|
$
|
147,844
|
|
$
|
183,057
|
|
$
|
131,465
|
|
$
|
29,388
|
|
$
|
346,078
|
|
|||||
|
Basic Earnings per Common Share:
|
||||||||||||||||||||
|
Income from Continuing Operations
|
$
|
1.49
|
|
$
|
1.79
|
|
$
|
1.32
|
|
$
|
0.36
|
|
$
|
1.77
|
|
|||||
|
Income (Loss) from Discontinued Operations
|
—
|
|
—
|
|
(0.09
|
)
|
(0.09
|
)
|
1.32
|
|
||||||||||
|
Net Income Attributable to BWX Technologies, Inc.
|
$
|
1.49
|
|
$
|
1.79
|
|
$
|
1.23
|
|
$
|
0.27
|
|
$
|
3.09
|
|
|||||
|
Diluted Earnings per Common Share:
|
||||||||||||||||||||
|
Income from Continuing Operations
|
$
|
1.47
|
|
$
|
1.76
|
|
$
|
1.31
|
|
$
|
0.36
|
|
$
|
1.76
|
|
|||||
|
Income (Loss) from Discontinued Operations
|
—
|
|
—
|
|
(0.09
|
)
|
(0.09
|
)
|
1.31
|
|
||||||||||
|
Net Income Attributable to BWX Technologies, Inc.
|
$
|
1.47
|
|
$
|
1.76
|
|
$
|
1.22
|
|
$
|
0.27
|
|
$
|
3.07
|
|
|||||
|
Dividends Declared Per Share
|
$
|
0.42
|
|
$
|
0.36
|
|
$
|
0.32
|
|
$
|
0.40
|
|
0.34
|
|
||||||
|
Balance Sheet Data:
|
||||||||||||||||||||
|
Total Assets
(2)(3)
|
$
|
1,712,339
|
|
$
|
1,579,815
|
|
$
|
1,375,398
|
|
$
|
2,847,015
|
|
$
|
2,609,153
|
|
|||||
|
Current Maturities of Long-Term Debt
|
$
|
27,870
|
|
$
|
27,370
|
|
$
|
15,000
|
|
$
|
15,000
|
|
$
|
—
|
|
|||||
|
Long-Term Debt
(3)
|
$
|
481,059
|
|
$
|
497,724
|
|
$
|
278,259
|
|
$
|
275,079
|
|
$
|
—
|
|
|||||
|
(1)
|
Statement of income data prior to December 31, 2015 has been restated to reflect the June 30, 2015 spin-off, which is presented as income (loss) from discontinued operations.
|
|
(2)
|
Total assets presented for years prior to December 31, 2015 include the historical assets of our former Power Generation business.
|
|
(3)
|
On January 1, 2016, we adopted an update to FASB Topic
Interest – Imputation of Interest,
which resulted in the retrospective reclassification of unamortized debt issuance costs related to the Company's Credit Agreement from other non-current assets to a reduction in long-term debt of $6.7 million and $9.9 million as of December 31, 2015 and 2014, respectively.
|
We immediately recognize actuarial gains (losses) for our pension and postretirement benefit plans into earnings primarily in the fourth quarter each year as a component of net periodic benefit cost. The effect of this adjustment for
2017
,
2016
,
2015
,
2014
and
2013
on pre-tax income was
$(11.1) million
,
$(21.3) million
,
$(54.7) million
,
$(141.5) million
and
$130.8 million
, respectively.
In the year ended December 31, 2017, we recognized $53.0 million of expense in our provision for income taxes related to significant changes to existing U.S. tax laws.
In the year ended December 31, 2016, we recorded a gain of approximately $13.6 million related to the deconsolidation of GmP and we recorded a $30.0 million loss contingency pursuant to the terms of the mPower Framework Agreement. We also
33
recorded a gain of approximately $9.3 million related to the release from performance guarantees for various projects executed by our former Power Generation business. In addition, we reversed a $16.1 million loss contingency resulting from a favorable ruling in a lawsuit involving commercial nuclear contracts.
In the year ended December 31, 2015, we incurred $26.0 million of charges related to the spin-off. We also incurred $16.6 million of charges related to restructuring activities. In addition, we recorded income related to litigation proceeds of $94.8 million, including pre- and post-judgment interest totaling $29.1 million.
In the year ended December 31, 2014, we incurred $0.2 million of charges related to the spin-off. We also incurred $20.9 million of charges related to restructuring activities. In addition, we recorded a gain in other income of $14.2 million for the receipt and related fair value adjustment of the Centrus Energy Corp. ("Centrus") common stock and notes that we received in the bankruptcy settlement in exchange for our investment in USEC Inc. ("USEC").
In the year ended December 31, 2013, we incurred $21.3 million of charges related to restructuring activities. In addition, we recorded an impairment charge totaling $19.1 million associated with our investment in USEC.
|
Item 7.
|
MANAGEMENT'S DISCUSSION AND ANALYSIS OF FINANCIAL CONDITION AND RESULTS OF OPERATIONS
|
Statements we make in the following discussion, which express a belief, expectation or intention, as well as those that are not historical fact, are forward-looking statements that are subject to risks, uncertainties and assumptions. Our actual results, performance or achievements, or industry results, could differ materially from those we express in the following discussion as a result of a variety of factors, including the risks and uncertainties we have referred to under the headings "Cautionary Statement Concerning Forward-Looking Statements" and "Risk Factors" in Items 1 and 1A of Part I of this Report.
GENERAL
We are a leading supplier of nuclear components and fuel to the U.S. Government; provide technical, management and site services to support governments in the operation of complex facilities and environmental remediation activities; supply precision manufactured components, nuclear fuel and services for the commercial nuclear power industry; and develop nuclear technologies for a variety of applications, including medical radioisotopes, advanced nuclear power sources and advanced nuclear reactors. In general, we operate in capital-intensive industries and rely on large contracts for a substantial amount of our revenues. We are currently exploring growth strategies across our segments through strategic investments and acquisitions to expand and complement our existing businesses. We would expect to fund these opportunities with cash on hand or by raising additional capital through debt, equity or some combination thereof.
We operate in three reportable segments: Nuclear Operations Group, Nuclear Services Group and Nuclear Power Group. Our reportable segments reflect changes we made during the first quarter of 2017 in the manner for which our segment operating information is reported for purposes of assessing operating performance and allocating resources. Prior to 2017, we reported three segments: Nuclear Operations, Nuclear Energy and Technical Services. The U.S. commercial nuclear services business, a component of our former Nuclear Energy segment, is now reported in our Nuclear Services Group segment along with our former Technical Services segment. The remainder of our former Nuclear Energy segment is now reported in our Nuclear Power Group segment, which comprises our Canadian operations, including BWXT Nuclear Energy Canada Inc. ("NEC"). Our Nuclear Operations Group segment represents our former Nuclear Operations segment. The change in our reportable segments had no impact on our previously reported consolidated results of operations, financial condition or cash flows. We have applied the change in reportable segments to previously reported historical financial information and related disclosures included in this Report.
The results of operations of BWE are presented as discontinued operations on the consolidated statements of income. We have presented the notes to our consolidated financial statements on the basis of continuing operations, unless otherwise stated.
Spin-off of BWE
On June 30, 2015, we completed the spin-off of BWE to our stockholders through a stock distribution. BWE's assets and business primarily consisted of those that we previously reported as our Power Generation segment. In connection with the spin-off, our stockholders received 100% of the outstanding common stock of BWE. The distribution of BWE common stock occurred by way of a pro rata stock distribution to our stockholders. Our stockholders received one share of BWE common stock for every two shares of our common stock held by such stockholder on June 18, 2015, and cash in lieu of any fractional shares. Prior to the completion of the spin-off, we made a cash payment to BWE totaling $132 million.
34
In order to effect the distribution and govern our relationship with BWE after the distribution, we entered into a master separation agreement with BWE. In addition to the master separation agreement, we entered into other agreements with BWE in connection with the distribution, including a tax sharing agreement and transition services agreements.
We incurred approximately $66.5 million in total costs related to the spin-off, which included approximately $29.8 million for professional services and $23.1 million of retention and severance-related charges. The majority of the remaining costs related to the separation of our facilities and related infrastructure including our information technology systems. Income from discontinued operations for the year ended December 31, 2015 included $34.4 million of these charges, and included in continuing operations were spin-off costs of $26.0 million for the year ended December 31, 2015.
At the spin-off, we had outstanding performance guarantees for various projects executed by BWE in the normal course of business. These guarantees totaled $1,542 million and had expiration dates from 2015 to 2035. In February 2016, BWE notified us that we have been released from substantially all remaining performances guarantees. Accordingly, we reduced the outstanding liability and recorded a gain of approximately $9.3 million during the year ended December 31, 2016 as a component of Other – net on our consolidated statement of income.
Outlook
Nuclear Operations Group
We expect the backlog of our Nuclear Operations Group segment of approximately
$3,305 million
at
December 31, 2017
to produce revenues of approximately
$1,190 million
in
2018
, not including any change orders or new contracts that may be awarded during the year.
The revenues of our Nuclear Operations Group segment are largely a function of defense spending by the U.S. Government. As a supplier of major nuclear components for certain U.S. Government programs, we are a significant participant in the defense industry and have not been negatively impacted by sequestration or federal budget reductions to date. We believe many of our programs are well-aligned with national defense and other strategic priorities as we supply high-end equipment for submarines and aircraft carriers for the U.S. Navy. However, it is possible that reductions in federal government spending and sequestration could have an adverse impact on the operating results and cash flows of our Nuclear Operations Group and Nuclear Services Group segments in the future.
We expect that orders for nuclear components will continue to be a significant part of backlog for the foreseeable future. In addition, the U.S. Navy issued its fiscal year 2019 long-range shipbuilding plan in February 2018, which includes recommendations to increase the size of its fleet of ships to include additional submarines and aircraft carriers beyond the number disclosed in previous long-range shipbuilding plan. We are evaluating the impact of the U.S. Navy's new shipbuilding plan and expect that it will require additional capital expenditures and investment in personnel to meet this growth in demand.
Nuclear Services Group
A significant portion of this segment's operations are conducted through joint ventures, which typically earn fees, and we account for them following the equity method of accounting. See
Note 4
to our consolidated financial statements included in this Report for financial information on our equity method investments. As a result, this segment reports minimal backlog and revenues.
Given our specialized capabilities of full life-cycle management of special materials, facilities and technologies, we believe our Nuclear Services Group segment is well-positioned to participate in the continuing cleanup, operation and management of critical government-owned nuclear sites, laboratories and manufacturing complexes maintained by the DOE, NASA and other federal agencies. Additionally, the Nuclear Services Group segment supports the commercial nuclear industry in the U.S., which depends on the timing of maintenance outages for nuclear utility customers, which could cause variability in our financial results.
Nuclear Power Group
We expect the backlog of our Nuclear Power Group segment of approximately
$637 million
at
December 31, 2017
to produce revenues of approximately
$230 million
in
2018
, not including any change orders or new contracts that may be awarded during the year. The revenues in this segment primarily depend on the demand and competitiveness of nuclear energy. The activity of this segment depends on the timing of maintenance outages primarily in the Canadian market and the cyclical
35
nature of capital expenditures and major refurbishments for nuclear utility customers, which could cause variability in our financial results.
Our acquisition of NEC in December 2016 expanded our Nuclear Power Group segment's product offerings to include nuclear fuel manufacturing and nuclear fuel handling equipment. This acquisition further strengthens the diversity of our service offerings and enhances our ability to support major life extension and refurbishment projects in the commercial nuclear industry.
CRITICAL ACCOUNTING POLICIES AND ESTIMATES
Our financial statements and accompanying notes are prepared in accordance with accounting principles generally accepted in the United States ("GAAP"). Preparing financial statements requires management to make estimates and assumptions that affect the reported amounts of assets, liabilities, revenues and expenses. These estimates and assumptions are affected by management's application of accounting policies. We believe the following are our most critical accounting policies that we apply in the preparation of our financial statements. These policies require our most difficult, subjective and complex judgments, often as a result of the need to make estimates of matters that are inherently uncertain.
Contracts and Revenue Recognition.
We determine the appropriate accounting method for each of our long-term contracts before work on the project begins. We generally recognize contract revenues and related costs on a percentage-of-completion method for individual contracts or combinations of contracts based on work performed, man hours, cost-to-cost or a units-of-delivery method, as applicable to the product or activity involved
.
We recognize estimated contract revenue and resulting income based on the measurement of the extent of progress completion as a percentage of the total project. Certain costs may be excluded from the cost-to-cost method of measuring progress, such as significant costs for materials and major third-party subcontractors, if it appears that such exclusion would result in a more meaningful measurement of actual contract progress and resulting periodic allocation of income. For all contracts, if a current estimate of total contract cost indicates a loss on a contract, the projected loss is recognized in full when determined. It is possible that current estimates could materially change for various reasons, including, but not limited to, fluctuations in forecasted labor productivity or steel and other raw material prices. We routinely review estimates related to our contracts, and revisions to profitability are reflected in the quarterly and annual earnings we report. In the years ended
December 31, 2017
,
2016
and
2015
, we recognized net favorable changes in estimate related to long-term contracts accounted for on the percentage-of-completion basis that increased operating income by approximately
$35.2 million
,
$31.4 million
and
$18.6 million
, respectively.
Although we continually strive to improve our ability to estimate our contract costs and profitability, adjustments to overall contract costs due to unforeseen events could be significant in future periods. We recognize claims for extra work or for changes in scope of work in contract revenues, to the extent of costs incurred, when we believe collection is probable and can be reasonably estimated. We recognize income from contract change orders or claims when formally agreed with the customer. We regularly assess the collectibility of contract revenues and receivables from customers.
Property, Plant and Equipment.
We carry our property, plant and equipment at depreciated cost, reduced by provisions to recognize economic impairment when we determine impairment has occurred. Property, plant and equipment amounts are reviewed for impairment whenever events or changes in circumstances indicate that the carrying amount of an asset, or asset group, may not be recoverable. An impairment loss would be recognized when the carrying amount of an asset exceeds the estimated undiscounted future cash flows expected to result from the use of the asset and its eventual disposition. The amount of the impairment loss to be recorded is calculated by the excess of the asset carrying value over its fair value. Fair value is generally determined using a discounted cash flow analysis. Our estimates of cash flow may differ from actual cash flow due to, among other things, technological changes, economic conditions or changes in operating performance. Any changes in such factors may negatively affect our business segments and result in future asset impairments.
We depreciate our property, plant and equipment using the straight-line method over estimated economic useful lives of
eight
to
33 years
for buildings and
three
to
14 years
for machinery and equipment. We expense the costs of maintenance, repairs and renewals that do not materially prolong the useful life of an asset as we incur them.
Investments in Unconsolidated Affiliates.
We use the equity method of accounting for affiliates in which our investment ownership ranges from 20% to 50% unless significant economic or governance considerations indicate that we are unable to exert significant influence, in which case the cost method is used. The equity method is also used for affiliates in which our investment ownership is greater than 50% but we do not have a controlling interest. Currently, all of our material investments in affiliates that are not included in our consolidated results are recorded using the equity method. Affiliates in which our investment ownership is less than 20% and where we are unable to exert significant influence are carried at cost.
36
Pension Plans and Postretirement Benefits.
We utilize actuarial and other assumptions in calculating the cost and benefit obligations of our pension and postretirement benefits. The assumptions utilized in the determination of our benefit cost and obligations include assumptions regarding discount rates, expected returns on plan assets, mortality and health care cost trends. The assumptions utilized represent our best estimates based on historical experience and other factors.
We calculate the majority of our pension costs under both financial accounting standards ("FAS") in accordance with GAAP and cost accounting standards ("CAS") in accordance with the Federal Acquisition Regulation and the related U.S. Government Cost Accounting Standards. We have prepared our consolidated financial statements and segment reporting disclosures utilizing pension costs calculated under FAS. Pension costs calculated under CAS are utilized as the basis for recovery of pension costs on our U.S. Government contracts. For the years ended
December 31, 2017
,
2016
and
2015
, our CAS pension costs attributed to U.S. Government contracts totaled
$56.1 million
,
$49.6 million
and
$57.7 million
, respectively. Pension costs calculated under CAS are recovered on a percentage-of-completion method on the underlying U.S. Government contracts. As a result, the amount of recoverable CAS pension costs recognized as revenue on an annual basis may differ from the amounts noted above. See further discussion of our accounting for contracts and revenue recognition above and in
Note 1
to our consolidated financial statements included in this Report.
Actual experience that differs from these assumptions or future changes in assumptions will affect our recognized benefit obligations and related costs. We immediately recognize net actuarial gains and losses into earnings in the fourth quarter as a component of net periodic benefit cost. Net actuarial gains and losses occur when actual experience differs from any of the various assumptions used to value our pension and postretirement benefit plans or when assumptions, which are revisited annually through our update of our actuarial valuations, change due to current market conditions or underlying demographic changes. The primary factors contributing to net actuarial gains and losses are changes in the discount rate used to value the obligations as of the measurement date each year, the difference between the actual return on plan assets and the expected return on plan assets and changes in health care cost trends. The effect of changes in the discount rate and expected rate of return on plan assets assumptions in combination with the actual return on plan assets can result in significant changes in our estimated pension and postretirement benefit cost and our consolidated financial condition.
The following sensitivity analysis shows the impact of a 25 basis point change in the assumed discount rate, return on assets and health care cost trend rate on our FAS pension and postretirement benefit plan obligations and expense for the year ended
December 31, 2017
:
|
.25% Increase
|
.25% Decrease
|
|||||||
|
|
(In millions)
|
|||||||
|
Pension Plans
|
||||||||
|
Discount Rate:
|
||||||||
|
Effect on ongoing net periodic benefit cost
(1)
|
$
|
1.3
|
|
$
|
(1.5
|
)
|
||
|
Effect on projected benefit obligation
|
(44.5
|
)
|
46.9
|
|
||||
|
Return on Assets:
|
||||||||
|
Effect on ongoing net periodic benefit cost
|
$
|
(3.0
|
)
|
$
|
3.0
|
|
||
|
Postretirement Plans
|
||||||||
|
Discount Rate:
|
||||||||
|
Effect on ongoing net periodic benefit cost
(1)
|
$
|
0.1
|
|
$
|
(0.1
|
)
|
||
|
Effect on projected benefit obligation
|
(1.7
|
)
|
1.8
|
|
||||
|
Return on Assets:
|
||||||||
|
Effect on ongoing net periodic benefit cost
|
$
|
0.1
|
|
$
|
(0.1
|
)
|
||
|
Health Care Cost Trend Rate:
|
||||||||
|
Effect on ongoing net periodic benefit cost
|
$
|
0.1
|
|
$
|
(0.1
|
)
|
||
|
Effect on projected benefit obligation
|
1.8
|
|
(1.5
|
)
|
||||
|
(1)
|
Excludes effect of annual mark to market adjustment.
|
Beginning in the first quarter of 2016, we changed the method we use to estimate the service and interest cost components of our net periodic benefit cost for our pension and postretirement benefit plans. Previously, we estimated interest and service cost utilizing a single weighted-average discount rate derived from the yield curve data used to measure the benefit obligation. Our new method for estimating service and interest cost is a spot rate approach, which utilizes duration specific spot rates from the yield curve that was utilized to measure the benefit obligation. We made this change to provide a more precise estimate of service and interest cost by improving the relationship of the discount rates utilized to measure our benefit
37
obligation and the rates utilized to estimate service and interest cost. This change reduced service and interest cost for the year ended December 31, 2016 compared to our previous method by approximately $11 million. This change does not affect the measurement of our total pension and postretirement benefit obligations or our total net periodic benefit cost as the change in our service and interest cost is offset by our recognized net actuarial (gain) loss. We accounted for this change as a change in accounting estimate, which did not impact previously reported results.
Loss Contingencies.
We estimate liabilities for loss contingencies when it is probable that a liability has been incurred and the amount of loss is reasonably estimable. We provide disclosure when there is a reasonable possibility that the ultimate loss will exceed the recorded provision or if such probable loss is not reasonably estimable. We are currently involved in some significant litigation, as discussed in
Note 10
to our consolidated financial statements included in this Report. We have accrued our estimates of the probable losses associated with these matters. However, our losses are typically resolved over long periods of time and are often difficult to estimate due to the possibility of multiple actions by third parties. Therefore, it is possible that future earnings could be affected by changes in our estimates related to these matters.
Goodwill and Intangible Assets.
Each year, we evaluate goodwill at each reporting unit to assess recoverability, and impairments, if any, are recognized in earnings. We perform a qualitative analysis when we believe that there is sufficient excess fair value over carrying value based on our most recent quantitative assessment, adjusted for relevant facts and circumstances that could affect fair value. Deterioration in macroeconomic, industry and market conditions, cost factors, overall financial performance, share price decline or entity and reporting unit specific events could cause us to believe a qualitative test is no longer appropriate.
When we determine that it is appropriate to test goodwill for impairment utilizing a quantitative test, the first step of the test compares the fair value of a reporting unit to its carrying amount, including goodwill. We utilize both the income and market valuation approaches to provide inputs into the estimate of the fair value of our reporting units, which would be considered by market participants.
Under the income valuation approach, we employ a discounted cash flow model to estimate the fair value of each reporting unit. This model requires the use of significant estimates and assumptions regarding future revenues, costs, margins, capital expenditures, changes in working capital, terminal year growth rate and cost of capital. Our cash flow models are based on our forecasted results for the applicable reporting units. Actual results could differ materially from our projections. Some assumptions, such as future revenues, costs and changes in working capital are company driven and could be affected by a loss of one or more significant contracts or customers, failure to control costs on certain contracts, a decline in U.S. Government funding or a decline in demand based on changing economic or regulatory conditions. Changes in external market conditions may affect certain other assumptions, such as the cost of capital. Market conditions can be volatile and are outside of our control.
Under the market valuation approach, we employ the guideline publicly traded company method, which indicates the fair value of the equity of each reporting unit by comparing it to publicly traded companies in similar lines of business. After identifying and selecting guideline companies, we analyze their business and financial profiles for relative similarity. Factors such as size, growth, risk and profitability are analyzed and compared to each of our reporting units. Assumptions include the selection of our peer companies and use of market multiples, which could deteriorate or increase based on the profitability of our competitors and performance of their stock, which is often dependent on the performance of the stock market and general economy as a whole.
Adverse changes in these assumptions utilized within the first step of our impairment test could cause a reduction or elimination of excess fair value over carrying value, resulting in potential recognition of impairment. If the carrying amount of a reporting unit exceeds its fair value, the second step of the goodwill impairment test is performed to measure the amount of the impairment loss, if any. The second step compares the implied fair value of the reporting unit's goodwill with the carrying amount of that goodwill.
We completed our annual review of goodwill for each of our reporting units for the year ended
December 31, 2017
, which indicated that we had no impairment of goodwill. The fair value of our reporting units was substantially in excess of carrying value.
Each year, we evaluate indefinite-lived intangible assets to assess recoverability, and impairments, if any, are recognized in earnings. We perform a qualitative assessment when testing indefinite-lived intangible assets for impairment to determine whether events or circumstances that could affect the significant inputs used in determining fair value have occurred that indicate that it is more likely than not that the indefinite-lived intangible asset is impaired. Deterioration in macroeconomic, industry and market conditions, cost factors or overall financial performance could cause us to believe a qualitative test is no
38
longer appropriate. When quantitative assessments are performed, we primarily utilize income-based valuation approaches. Under the income-based valuation approach, we employ a relief from royalty method of valuation. This method requires significant assumptions, including assumed royalty rate, future revenues and cost of capital. Assumptions related to operating performance, such as future revenues, could be affected by loss of a customer contract, a decline in U.S. Government funding or a decline in demand based on changing economic or regulatory conditions. Changes in external market conditions may affect certain other assumptions, such as the cost of capital. Market conditions can be volatile and are outside of our control.
Adverse changes in these assumptions utilized within our indefinite-lived intangible asset impairment test could cause a reduction or elimination of excess fair value over carrying value, resulting in potential recognition of impairment.
We have completed our annual review of our indefinite-lived intangible assets for the year ended
December 31, 2017
, which indicated that we had no impairment. The fair value of our indefinite-lived intangible assets was substantially in excess of carrying value.
Asset Retirement Obligations and Environmental Cleanup Costs.
We accrue for future decommissioning of our nuclear facilities that will permit the release of these facilities to unrestricted use at the end of each facility's life, which is a requirement of our licenses from the NRC and the CNSC. In accordance with the FASB Topic
Asset Retirement and Environmental Obligations
, we record the fair value of a liability for an asset retirement obligation in the period in which it is incurred. In estimating fair value, we use present value of cash flows expected to be incurred in settling our obligations. To the extent possible, we perform a marketplace assessment of the cost and timing of performing the retirement activities. We apply a credit-adjusted risk-free interest rate to our expected cash flows in our determination of fair value. When we initially record such a liability, we capitalize a cost by increasing the carrying amount of the related long-lived asset. Over time, the liability is accreted to its present value each period, and the capitalized cost is depreciated over the useful life of the related asset. Upon settlement of a liability, we will settle the obligation for its recorded amount or incur a gain or loss. This topic applies to environmental liabilities associated with assets that we currently operate and are obligated to remove from service. For environmental liabilities associated with assets that we no longer operate, we have accrued amounts based on the estimated costs of cleanup activities, net of the anticipated effect of any applicable cost-sharing arrangements. We adjust the estimated costs as further information develops or circumstances change. An exception to this accounting treatment relates to the work we perform for two facilities for which the U.S. Government is obligated to pay substantially all the decommissioning costs.
Income Taxes.
Income tax expense for federal, foreign, state and local income taxes are calculated on pre-tax income based on current tax law and includes the cumulative effect of any changes in tax rates from those used previously in determining deferred tax assets and liabilities. We record a valuation allowance to reduce our deferred tax assets to the amount that is more likely than not to be realized. We assess deferred taxes and the adequacy of the valuation allowance on a quarterly basis. In the ordinary course of business, there is inherent uncertainty in quantifying our income tax positions. We assess our income tax positions and record tax benefits for all years subject to examination based upon management's evaluation of the facts, circumstances and information available at the reporting date. For those tax positions where it is more likely than not that a tax benefit will be sustained, we have recorded the largest amount of tax benefit with a greater than 50% likelihood of being realized upon ultimate settlement with a taxing authority that has full knowledge of all relevant information. For those income tax positions where it is not more likely than not that a tax benefit will be sustained, no tax benefit has been recognized in the financial statements. We record interest and penalties (net of any applicable tax benefit) related to income taxes as a component of provision for income taxes on our consolidated statements of income.
We would be subject to withholding taxes if we were to distribute earnings from certain foreign subsidiaries, and these unrecognized deferred income tax liabilities would be payable upon distribution of these earnings. We consider the earnings of our non-U.S. subsidiaries to be permanently reinvested.
Stock-Based Compensation.
We account for stock-based compensation in accordance with FASB Topic
Compensation – Stock Compensation
. Under the fair value recognition provisions of this statement, the cost of employee services received in exchange for an award of equity instruments is measured at the grant date based on the fair value of the award. Stock-based compensation expense is recognized on a straight-line basis over the requisite service periods of the awards, which is generally equivalent to the vesting term. We use the Black-Scholes option pricing model to determine the fair value of certain share-based awards, such as stock options and stock appreciation rights. The determination of the fair value of a share-based payment award using an option-pricing model requires the input of highly subjective assumptions, such as the expected life of the award and stock price volatility. For liability-classified awards, such as cash-settled restricted stock units and performance units, fair values are determined at grant date using the closing price of our common stock and are remeasured at the end of each reporting period through the date of settlement.
39
Business Combinations.
We account for acquisitions in accordance with FASB Topic
Business Combinations.
This topic broadens the fair value measurements and recognition of assets acquired, liabilities assumed and interests transferred as a result of business combinations. It also provides disclosure requirements to assist users of the financial statements in evaluating the nature and financial effects of business combinations.
See
Note 1
to our consolidated financial statements included in this Report for further discussion of recently adopted accounting standards.
RESULTS OF OPERATIONS – YEARS ENDED
DECEMBER 31, 2017
,
2016
and
2015
Selected financial highlights are presented in the table below:
|
|
Year Ended December 31,
|
|||||||||||
|
|
2017
|
2016
|
2015
|
|||||||||
|
|
(In thousands)
|
|||||||||||
|
REVENUES:
|
||||||||||||
|
Nuclear Operations Group
|
$
|
1,271,861
|
|
$
|
1,269,272
|
|
$
|
1,179,896
|
|
|||
|
Nuclear Services Group
|
137,249
|
|
128,021
|
|
121,247
|
|
||||||
|
Nuclear Power Group
|
285,831
|
|
161,572
|
|
121,061
|
|
||||||
|
Adjustments and Eliminations
|
(7,203
|
)
|
(8,292
|
)
|
(6,675
|
)
|
||||||
|
$
|
1,687,738
|
|
$
|
1,550,573
|
|
$
|
1,415,529
|
|
||||
|
OPERATING INCOME:
|
||||||||||||
|
Nuclear Operations Group
|
$
|
289,852
|
|
$
|
268,503
|
|
$
|
257,400
|
|
|||
|
Nuclear Services Group
|
23,118
|
|
12,171
|
|
7,955
|
|
||||||
|
Nuclear Power Group
|
39,978
|
|
42,808
|
|
11,803
|
|
||||||
|
Other
|
(10,688
|
)
|
(6,398
|
)
|
(13,949
|
)
|
||||||
|
$
|
342,260
|
|
$
|
317,084
|
|
$
|
263,209
|
|
||||
|
Unallocated Corporate
|
(22,332
|
)
|
(26,353
|
)
|
(25,747
|
)
|
||||||
|
mPower Framework Agreement
|
—
|
|
(30,000
|
)
|
—
|
|
||||||
|
Income Related to Litigation Proceeds
|
—
|
|
—
|
|
65,728
|
|
||||||
|
Special Charges for Restructuring Activities
|
—
|
|
—
|
|
(16,608
|
)
|
||||||
|
Cost to Spin-off Power Generation Business
|
—
|
|
—
|
|
(25,987
|
)
|
||||||
|
Mark to Market Adjustment
|
(11,043
|
)
|
(21,468
|
)
|
(54,654
|
)
|
||||||
|
Total Operating Income
|
$
|
308,885
|
|
$
|
239,263
|
|
$
|
205,941
|
|
|||
Consolidated Results of Operations
Year Ended
December 31, 2017
vs.
2016
Consolidated revenues
increased
8.8%
, or
$137.2 million
,
to
$1,687.7 million
in the year ended
December 31, 2017
compared
to
$1,550.6 million
for the corresponding period of
2016
, due to increases in revenues from our Nuclear Operations Group, Nuclear Services Group and Nuclear Power Group segments totaling $2.6 million, $9.2 million and $124.3 million, respectively. Nuclear Services Group segment revenues include $7.9 million of fee income associated with the settlement of a contract dispute related to task order work that was completed in 2013. In addition, our Nuclear Power Group segment includes an increase in revenues of $92.8 million associated with the acquisition of NEC that occurred in the fourth quarter of 2016.
Consolidated operating income
increased
$69.6 million
to
$308.9 million
in the year ended
December 31, 2017
compared
to
$239.3 million
for the corresponding period of
2016
. Operating income improved in our Nuclear Operations Group and Nuclear Services Group segments by $21.3 million and $10.9 million, respectively, and unallocated corporate expenses decreased $4.0 million. The Nuclear Services Group segment operating income includes $7.9 million attributable to the settlement of the contract dispute noted above. We also experienced an increase in operating income due to the recognition of a $30.0 million charge related to the mPower Framework Agreement, which we entered into in the year ended December 31, 2016. These increases were offset by lower operating income in our Nuclear Power Group segment of $2.8 million due to the reversal of a $15.0 million loss contingency during the year ended December 31, 2016 that resulted from a favorable ruling in a lawsuit involving commercial nuclear contracts. Operating income also includes net actuarial gains and losses through mark to
40
market charges related to our pension and postretirement plans, which reflected non-cash (losses) of
$(11.0) million
and
$(21.5) million
in
2017
and
2016
, respectively.
Year Ended
December 31, 2016
vs.
2015
Consolidated revenues increased 9.5%, or $135.0 million, to $1,550.6 million in the year ended December 31, 2016 compared to $1,415.5 million for the corresponding period of 2015, due to increases in revenues from our Nuclear Operations Group, Nuclear Services Group and Nuclear Power Group segments totaling $89.4 million, $6.8 million and $40.5 million, respectively.
Consolidated operating income increased $33.3 million to $239.3 million in the year ended December 31, 2016 compared to $205.9 million for the corresponding period of 2015. Operating income in the Nuclear Power Group segment increased $31.0 million due to increased revenue related to our Canadian nuclear service and components businesses and the reversal of a $15.0 million loss contingency that resulted from a favorable ruling in a lawsuit involving commercial nuclear contracts. We also experienced improvements in our Nuclear Operations Group, Nuclear Services Group and Other segments of $11.1 million, $4.2 million and $7.6 million, respectively. These increases were offset by an increase in unallocated corporate expenses of $0.6 million and the recording of a $30.0 million charge related to the mPower Framework Agreement. During the year ended December 31, 2015, we recorded income of $65.7 million related to litigation proceeds, which was partially offset by special charges for restructuring activities totaling $16.6 million and costs to spin-off our former Power Generation business totaling $26.0 million. Operating income also includes net actuarial gains and losses through mark to market charges related to our pension and postretirement plans, which reflected non-cash (losses) of $(21.5) million and $(54.7) million in 2016 and 2015, respectively.
Nuclear Operations Group
|
|
Year Ended December 31,
|
Year Ended December 31,
|
||||||||||||||||||||||
|
|
2017
|
2016
|
$ Change
|
2016
|
2015
|
$ Change
|
||||||||||||||||||
|
(In thousands)
|
||||||||||||||||||||||||
|
Revenues
|
$
|
1,271,861
|
|
$
|
1,269,272
|
|
$
|
2,589
|
|
$
|
1,269,272
|
|
$
|
1,179,896
|
|
$
|
89,376
|
|
||||||
|
Operating Income
|
289,852
|
|
268,503
|
|
21,349
|
|
268,503
|
|
257,400
|
|
11,103
|
|
||||||||||||
|
% of Revenues
|
22.8%
|
|
21.2%
|
|
21.2%
|
|
21.8%
|
|
||||||||||||||||
Year Ended
December 31, 2017
vs.
2016
Revenues
increased
by
0.2%
, or
$2.6 million
,
to
$1,271.9 million
in the year ended
December 31, 2017
compared
to
$1,269.3 million
for the corresponding period of
2016
. The increase was primarily attributable to increased activity in our naval nuclear fuel and downblending operations.
Operating income
increased
$21.3 million
to
$289.9 million
in the year ended
December 31, 2017
compared
to
$268.5 million
for the corresponding period of
2016
. The increase was primarily driven by net favorable changes in estimates related to certain long-term contracts accounted for on the percentage-of-completion basis.
Year Ended
December 31, 2016
vs.
2015
Revenues increased by 7.6%, or $89.4 million, to $1,269.3 million in the year ended December 31, 2016 compared to $1,179.9 million for the corresponding period of 2015. This increase was attributable to increased activity in the manufacturing of nuclear components for U.S. Government programs, as well as our naval nuclear fuel and downblending operations.
Operating income increased $11.1 million to $268.5 million in the year ended December 31, 2016 compared to $257.4 million for the corresponding period of 2015. The operating income associated with the increases in revenue noted above was partially offset by an increase in overhead and selling, general and administrative expenses. We also experienced a benefit of $3.0 million from the settlement of a property-related insurance claim during the year ended December 31, 2015.
41
Nuclear Services Group
|
|
Year Ended December 31,
|
Year Ended December 31,
|
||||||||||||||||||||||
|
|
2017
|
2016
|
$ Change
|
2016
|
2015
|
$ Change
|
||||||||||||||||||
|
(In thousands)
|
||||||||||||||||||||||||
|
Revenues
|
$
|
137,249
|
|
$
|
128,021
|
|
$
|
9,228
|
|
$
|
128,021
|
|
$
|
121,247
|
|
$
|
6,774
|
|
||||||
|
Operating Income
|
23,118
|
|
12,171
|
|
10,947
|
|
12,171
|
|
7,955
|
|
4,216
|
|
||||||||||||
|
% of Revenues
|
16.8%
|
|
9.5%
|
|
9.5%
|
|
6.6%
|
|
||||||||||||||||
Year Ended
December 31, 2017
vs.
2016
Revenues
increased
by
7.2%
, or
$9.2 million
,
to
$137.2 million
in the year ended
December 31, 2017
compared
to
$128.0 million
for the corresponding period of
2016
. This increase was primarily attributable to the settlement of a contract dispute related to task order work that ended in 2013, which resulted in the recovery of $7.9 million of fee income. In addition, we experienced higher activity at our Naval Reactor decommissioning and decontamination project of $7.8 million. These increases were partially offset by fewer maintenance outages in the commercial U.S. nuclear utility market and a reduction in activity related to advanced fuel and reactor engineering, licensing and manufacturing services for new advanced nuclear reactors of $4.4 million.
Operating income
increased
$10.9 million
to
$23.1 million
in the year ended
December 31, 2017
compared
to
$12.2 million
for the corresponding period of
2016
. This was primarily attributable to the settlement of the contract dispute of $7.9 million noted above in addition to lower selling, general and administrative expenses of $5.5 million, primarily related to a decrease in business development activities caused by the timing of proposal activities. These increases were partially offset by the transition of two joint venture projects in 2016 and 2017 that resulted in lower fee income of $4.0 million.
Year Ended
December 31, 2016
vs.
2015
Revenues increased by 5.6%, or $6.8 million, to $128.0 million in the year ended December 31, 2016 compared to $121.2 million for the corresponding period of 2015. This increase was primarily attributable to higher activity at our Naval Reactor decommissioning and decontamination project, which was partially offset by a decline in service projects in the U.S.
Operating income increased $4.2 million to $12.2 million in the year ended December 31, 2016 compared to $8.0 million for the corresponding period of 2015. This was primarily attributable to the operating income impact of the revenue increase noted above as well as an increase in equity income of investees of $1.7 million. These increases were partially offset by higher selling, general and administrative expenses of $0.4 million related to an increase in business development activities caused by the timing of bid and proposal activities, as well as expenses of $0.9 million associated with overhead reduction initiatives.
Nuclear Power Group
|
|
Year Ended December 31,
|
Year Ended December 31,
|
||||||||||||||||||||||
|
|
2017
|
2016
|
$ Change
|
2016
|
2015
|
$ Change
|
||||||||||||||||||
|
(In thousands)
|
||||||||||||||||||||||||
|
Revenues
|
$
|
285,831
|
|
$
|
161,572
|
|
$
|
124,259
|
|
$
|
161,572
|
|
$
|
121,061
|
|
$
|
40,511
|
|
||||||
|
Operating Income
|
39,978
|
|
42,808
|
|
(2,830
|
)
|
42,808
|
|
11,803
|
|
31,005
|
|
||||||||||||
|
% of Revenues
|
14.0%
|
|
26.5%
|
|
26.5%
|
|
9.7%
|
|
||||||||||||||||
Year Ended
December 31, 2017
vs.
2016
Revenues
increased
by
76.9%
, or
$124.3 million
,
to
$285.8 million
in the year ended
December 31, 2017
compared
to
$161.6 million
for the corresponding period of
2016
. This increase was primarily attributable to the acquisition of NEC in the fourth quarter ended December 31, 2016, which produced an increase in revenues of $92.8 million compared to the prior year. Revenue in our nuclear components business increased $51.7 million primarily due to design and manufacturing work associated with major life extension and refurbishment projects for the Canadian nuclear market, which included the fabrication of replacement steam generators, reactor components and containers for the storage of spent nuclear fuel and other high-level waste. In addition, this segment also experienced an increase in activity associated with the China steam generator project. These increases were partially offset by a lower volume of outage projects when compared to the same period of the prior year, resulting in a decrease in revenue of $20.3 million for our legacy services business in Canada.
42
Operating income
decreased
$2.8 million
to
$40.0 million
in the year ended
December 31, 2017
compared
to
$42.8 million
for the corresponding period of
2016
, primarily attributable to the reversal of a $15.0 million loss contingency during the year ended December 31, 2016 that resulted from a favorable ruling in a lawsuit involving commercial nuclear contracts. Higher selling, general and administrative expenses related to the addition of NEC into our existing business also reduced operating income by $9.3 million when compared to the corresponding period of 2016. The decline in volume of outage projects for our legacy services business in Canada, noted above, also contributed to the decrease in operating income. These decreases were partially offset by increases in revenue from the acquisition of NEC and higher volume of activity associated with our legacy components business, which combined to increase operating income by $32.1 million.
Year Ended
December 31, 2016
vs.
2015
Revenues increased by 33.5%, or $40.5 million, to $161.6 million in the year ended December 31, 2016 compared to $121.1 million for the corresponding period of 2015. This increase is attributable, in part, to our services business in Canada, which experienced a higher volume of outage projects, resulting in an increase in revenue of $24.7 million compared to the same period of the prior year. In addition, revenue in our nuclear components business increased $22.3 million, primarily due to steam generator design and manufacturing work associated with major life extension and refurbishment projects for the Canadian nuclear industry, as well as the China steam generator project. These increases were partially offset by a $5.0 million unfavorable impact related to the translation of our Canadian dollar denominated contracts into U.S. dollars when compared to the year ended December 31, 2015.
Operating income increased $31.0 million to $42.8 million in the year ended December 31, 2016 compared to $11.8 million for the corresponding period of 2015. The increase in revenue associated with our Canadian nuclear service and components businesses noted above combined to increase operating income by $16.0 million. Also included in operating income was $15.0 million related to the reversal of a loss contingency that resulted from a favorable ruling in a lawsuit involving commercial nuclear contracts.
Other
|
|
Year Ended December 31,
|
Year Ended December 31,
|
||||||||||||||||
|
|
2017
|
2016
|
$ Change
|
2016
|
2015
|
$ Change
|
||||||||||||
|
(In thousands)
|
||||||||||||||||||
|
Operating Income
|
(10,688
|
)
|
(6,398
|
)
|
(4,290
|
)
|
(6,398
|
)
|
(13,949
|
)
|
7,551
|
|
||||||
Year Ended
December 31, 2017
vs.
2016
Operating income
decreased
$4.3 million
to a loss of
$10.7 million
in the year ended
December 31, 2017
compared
to a loss of
$6.4 million
for the corresponding period of
2016
, primarily due to an increase in research and development activities related to our medical and industrial radioisotope capabilities.
Year Ended
December 31, 2016
vs.
2015
Operating income increased $7.6 million to a loss of $6.4 million in the year ended December 31, 2016 compared to a loss of $13.9 million for the corresponding period of 2015, due to the slowing of the pace of development related to our previously announced plans to restructure the mPower program. Research and development activities decreased $5.2 million and selling, general and administrative expenses also decreased $2.3 million compared to the year ended December 31, 2015.
Unallocated Corporate
Unallocated corporate expenses
decreased
$4.0 million
to
$22.3 million
in the year ended
December 31, 2017
compared to
$26.4 million
for the corresponding period of
2016
, primarily due to lower levels of stock-based compensation and lower healthcare claims. Unallocated corporate expenses for the year ended December 31, 2017 include $2.6 million associated with an executive reorganization, which resulted in the acceleration of previously granted equity awards and other expenses.
Unallocated corporate expenses increased $0.6 million to $26.4 million in the year ended December 31, 2016 compared to $25.7 million for the corresponding period of 2015. Unallocated corporate expenses for the year ended December 31, 2016 include $3.5 million associated with an executive reorganization, which resulted in the acceleration of previously granted equity awards and other expenses. In addition, we also incurred $1.6 million of costs associated with the acquisition of NEC, as well as higher levels of incentive compensation when compared to the year ended December 31, 2015. These additional
43
expenses were more than offset by lower selling, general and administrative expenses resulting from the spin-off, which has allowed the Company to significantly reduce costs that were previously incurred to support a larger organization.
mPower Framework Agreement
On March 2, 2016, as a result of entering into the Framework Agreement, we have deconsolidated GmP from our financial statements as of the date of the Framework Agreement. We recorded a gain of approximately $13.6 million during the year ended December 31, 2016 related to the deconsolidation of GmP as a component of Other – net on our consolidated statement of income.
In the year ended December 31, 2016, we also recognized a
$30.0 million
loss contingency as a result of the Framework Agreement, which was ultimately paid to Bechtel in the first quarter of 2017 following the receipt of Bechtel's notice that the mPower program would not be restarted.
Income Related to Litigation Proceeds
In September 2015, we received a $94.8 million payment, inclusive of pre- and post-judgment interest totaling $29.1 million, in connection with a legal judgment. Operating income includes income related to these litigation proceeds of $65.7 million for the year ended December 31, 2015.
Special Charges for Restructuring Activities
Special charges for restructuring activities were $16.6 million in the year ended December 31, 2015, primarily due to charges associated with our restructuring of our mPower program.
Cost to Spin-off Power Generation Business
We incurred $26.0 million of costs related to the spin-off of our former Power Generation business in 2015. These charges consisted of $21.4 million in retention and severance-related costs, $2.4 million of facility costs and $2.2 million of professional services and other charges. See
Note 3
to our consolidated financial statements included in this Report for further information related to the spin-off.
Mark to Market Adjustment
We immediately recognize net actuarial gains (losses) for our pension and postretirement benefit plans into earnings as a component of net periodic benefit cost. The effect of this adjustment on operating income was
$(11.0) million
,
$(21.5) million
and
$(54.7) million
for the years ended
December 31, 2017
,
2016
and
2015
, respectively. These mark to market losses were primarily due to a change in the weighted-average discount rate for our pension and postretirement benefit plans as well as the difference between actual and estimated participant data and demographic factors, including items such as retirement age and rates of termination, retirement and mortality. In addition, during the year ended December 31, 2015, we also experienced mark to market losses associated with the difference between the actual return on plan assets and the expected return.
Other Income Statement Items
Other – net
decreased
$25.3 million
to a gain of
$0.4 million
in the year ended
December 31, 2017
, as compared
to a gain of
$25.7 million
for the corresponding period of
2016
. During the year ended December 31, 2016, we recorded a gain of $13.6 million related to the deconsolidation of GmP. In addition, we were released from substantially all outstanding performance guarantees for various projects executed by our former Power Generation business prior to the spin-off, which resulted in a gain of $9.3 million. During the year ended December 31, 2017, we also recognized a gain associated with a fair market value adjustment of our investment in Centrus of $0.5 million compared to a gain of $1.6 million in the year ended December 31, 2016.
Other – net increased $30.8 million to a gain of $25.7 million in the year ended December 31, 2016, as compared to a loss of $5.0 million for the corresponding period of 2015. During the year ended December 31, 2016, we recorded a gain of $13.6 million related to the deconsolidation of GmP. In addition, we were released from substantially all outstanding performance guarantees for various projects executed by our former Power Generation business prior to the spin-off, which resulted in a gain of $9.3 million. We also recognized a gain associated with a fair market value adjustment of our investment in Centrus of $1.6 million in the year ended December 31, 2016 compared to a $3.9 million loss on our investment in the year ended December 31, 2015, which included an other-than-temporary impairment of $2.1 million.
44
Provision for Income Taxes
|
|
Year Ended December 31,
|
|||||||||||
|
|
2017
|
2016
|
2015
|
|||||||||
|
(In thousands)
|
||||||||||||
|
Income from continuing operations before provision for income taxes and noncontrolling interest
|
$
|
295,780
|
|
$
|
257,268
|
|
$
|
221,065
|
|
|||
|
Provision for Income Taxes
|
147,415
|
|
73,656
|
|
80,416
|
|
||||||
|
Effective Tax Rate
|
49.8%
|
|
28.6%
|
|
36.4%
|
|
||||||
On December 22, 2017, the Tax Cuts and Jobs Act (the "Act") was enacted, making significant changes to existing U.S. tax laws that impact BWXT, including, but not limited to, a reduction to the U.S. corporate income tax rate from 35% to 21% for tax years beginning after December 31, 2017, a one-time transition tax on certain undistributed foreign earnings and additional deduction limitations on executive compensation. We have recognized the income tax effects of the Act in its 2017 financial statements in accordance with FASB Topic
Income Taxes
. Our Canadian operations continue to be subject to tax at a local statutory rate of approximately 25%.
For the year ended
December 31, 2017
, our provision for income taxes
increased
$73.8 million
to
$147.4 million
, while income before provision for income taxes
increased
$38.5 million
to
$295.8 million
. Our effective tax rate was approximately
49.8%
for
2017
, as compared to
28.6%
for
2016
. Our effective tax rate for 2017 was higher than the statutory rate primarily due to $53.0 million in income tax expense, which consisted of (i) $49.5 million incurred in relation to the revaluation of our U.S. net deferred tax assets required due to the reduction of the U.S. federal tax rate from 35% to 21% for tax years starting on or after January 1, 2018; (ii) $2.0 million incurred in relation to the transitional toll-charge on undistributed foreign earnings and profits; and (iii) $1.5 million incurred in relation to the elimination of the performance-based criteria under I.R.C. §162(m) for our covered executives and the corresponding write off of certain deferred tax assets previously deductible under the performance-based criteria of I.R.C. §162(m).
For the year ended December 31, 2016, our provision for income taxes decreased $6.8 million to $73.7 million, while income before provision for income taxes increased $36.2 million to $257.3 million. Our effective tax rate was approximately 28.6% for 2016, as compared to 36.4% for 2015. Our effective tax rate for 2016 was less than the statutory rate primarily due to the $13.6 million non-taxable gain recognized related to the deconsolidation of GmP, $2.4 million of additional tax benefits related to employee share-based payments due to our early adoption of the FASB update to the Topic
Compensation – Stock Compensation
and a $7.5 million benefit for the change in our assertion regarding the undistributed earnings of our foreign operations. Of the $7.5 million benefit associated with the change in our assertion regarding the undistributed earnings of our foreign operations, approximately $3.9 million related to the foreign rate differential on current year undistributed earnings and approximately $3.6 million related to the reversal of deferred tax liabilities recorded for previously accrued taxes.
See
Note 5
to our consolidated financial statements included in this Report for further information on income taxes including further discussion on the impact of the Act.
EFFECTS OF INFLATION AND CHANGING PRICES
Our financial statements are prepared in accordance with generally accepted accounting principles in the U.S., using historical U.S. dollar accounting ("historical cost"). Statements based on historical cost, however, do not adequately reflect the cumulative effect of increasing costs and changes in the purchasing power of the U.S. dollar, especially during times of significant and continued inflation.
In order to minimize the negative impact of inflation on our operations, we attempt to cover the increased cost of anticipated changes in labor, material and service costs, either through an estimate of those changes, which we reflect in the original price, or through price escalation clauses in our contracts. However, there can be no assurance we will be able to cover all changes in cost using this strategy.
LIQUIDITY AND CAPITAL RESOURCES
Our overall liquidity position, which we generally define as our unrestricted cash and short-term investments plus amounts available for borrowings under our credit facility, improved in 2017. Our liquidity position at December 31, 2017
increased
by approximately
$145.1 million
to
$530.4 million
from
$385.3 million
at December 31, 2016, due to cash generated from operations and a decline in our outstanding letters of credit of $79.0 million, which had a favorable impact on our overall
45
liquidity position. We experienced net cash generated from operations in each of the years ended December 31, 2017, 2016 and 2015. Typically, the fourth quarter has been the period of highest cash flows from operating activities because of the timing of payments received from the U.S. Government on accounts receivable retainages and cash dividends received from our joint ventures.
Credit Facility
On September 2, 2016, we entered into an amendment (the "Amendment") to our Credit Agreement dated May 11, 2015 with Bank of America, N.A., as administrative agent, and certain lenders and letter of credit issuers party thereto (collectively, the "Amended Credit Agreement"). Prior to the Amendment, our Credit Agreement provided for a
five
-year, senior secured revolving credit facility in an aggregate amount of up to
$400 million
, the full amount of which was available for the issuance of letters of credit, and a senior secured term loan facility of
$300 million
, which was drawn on June 30, 2015. The Amendment added a new U.S. dollar term loan facility in an aggregate principal amount of up to
$112.5 million
, which was drawn on September 16, 2016, and a new Canadian dollar term loan facility in an aggregate principal amount of up to the equivalent of
$137.5 million
U.S. dollars, which was drawn on December 12, 2016 (collectively, the "Incremental Term Loans"). All obligations under the Amended Credit Agreement are scheduled to mature on June 30, 2020. The proceeds of loans under the Amended Credit Agreement are available for working capital needs and other general corporate purposes.
The Amended Credit Agreement includes provisions for additional financial institutions to become lenders, or for any existing lender to increase its commitment thereunder, subject to an aggregate maximum of
$250 million
for all additional term loans, revolving credit borrowings and letter of credit commitments.
The Amended Credit Agreement is (1) guaranteed by substantially all of our wholly owned domestic subsidiaries, excluding our captive insurance subsidiary, and (2) secured by first-priority liens on certain assets owned by us and the guarantors (other than our subsidiaries comprising our Nuclear Operations Group and a portion of our Nuclear Services Group segments).
The Amended Credit Agreement requires interest payments on revolving loans on a periodic basis until maturity. We began making quarterly amortization payments on the
$300 million
term loan in an amount equal to
1.25%
of the aggregate principal amount in the first quarter of 2016. We began making quarterly amortization payments on the U.S. dollar term loan facility in an amount equal to
1.25%
of the aggregate principal amount in the fourth quarter of 2016. We began making quarterly amortization payments on the Canadian dollar term loan facility in an amount equal to
1.25%
of the aggregate principal amount in the first quarter of 2017. We may prepay all loans under the Amended Credit Agreement at any time without premium or penalty (other than customary Eurocurrency rate breakage costs), subject to notice requirements.
The Amended Credit Agreement includes financial covenants that are tested on a quarterly basis, based on the rolling four-quarter period that ends on the last day of each fiscal quarter. The maximum permitted leverage ratio is
3.00
to 1.00, which may be increased to
3.25
to 1.00 for up to four consecutive fiscal quarters after a material acquisition. The minimum consolidated interest coverage ratio is
4.00
to 1.00. In addition, the Amended Credit Agreement contains various restrictive covenants, including with respect to debt, liens, investments, mergers, acquisitions, dividends, equity repurchases and asset sales. At
December 31, 2017
, we were in compliance with all covenants set forth in the Amended Credit Agreement.
Outstanding loans under the Amended Credit Agreement bear interest at our option at either the Eurocurrency rate plus a margin ranging from
1.25%
to
1.75%
per year or the base rate (the highest of the Federal Funds rate plus
0.50%
, the one-month Eurocurrency rate plus
1.0%
, or the administrative agent's prime rate) plus a margin ranging from
0.25%
to
0.75%
per year. We are charged a commitment fee on the unused portion of the revolving credit facility, and that fee varies between
0.15%
and
0.25%
per year. Additionally, we are charged a letter of credit fee of between
1.25%
and
1.75%
per year with respect to the amount of each financial letter of credit issued under the Amended Credit Agreement, and a letter of credit fee of between
0.75%
and
1.05%
per year is charged with respect to the amount of each performance letter of credit issued under the Amended Credit Agreement. The applicable margin for loans, the commitment fee and the letter of credit fees set forth above will vary quarterly based on our leverage ratio. Based on the leverage ratio applicable at
December 31, 2017
, the margin for Eurocurrency rate and base rate loans was
1.375%
and
0.375%
, respectively, the letter of credit fee for financial letters of credit and performance letters of credit was
1.375%
and
0.825%
, respectively, and the commitment fee for the unused portion of the revolving credit facility was
0.175%
.
Upon the closing of the Credit Agreement and the subsequent Amendment, we paid certain upfront fees to the lenders thereunder, and paid arrangement and other fees to the arrangers and agents of the Amended Credit Agreement.
46
At
December 31, 2017
, borrowings outstanding totaled
$513.1 million
and
$0.0 million
under our term loans and revolving line of credit, respectively, and letters of credit issued under the Amended Credit Agreement totaled
$75.9 million
. As a result, we had
$324.1 million
available for borrowings or to meet letter of credit requirements as of
December 31, 2017
, excluding the additional
$250 million
available to us for term loan, revolving credit borrowings and letter of credit commitments. As of
December 31, 2017
, the weighted-average interest rate on outstanding borrowings under our Amended Credit Agreement was
2.90%
.
The Amended Credit Agreement generally includes customary events of default for a secured credit facility, some of which allow for an opportunity to cure. If an event of default relating to bankruptcy or other insolvency events occurs under the Amended Credit Agreement, all obligations under the Amended Credit Agreement will immediately become due and payable. If any other event of default exists under the Amended Credit Agreement, the lenders will be permitted to accelerate the maturity of the obligations outstanding under the Amended Credit Agreement. If any event of default occurs under the Amended Credit Agreement, the lenders will be permitted to terminate their commitments thereunder and exercise other rights and remedies, including the commencement of foreclosure or other actions against the collateral.
If any default occurs under the Amended Credit Agreement, or if we are unable to make any of the representations and warranties in the Amended Credit Agreement, we will be unable to borrow funds or have letters of credit issued under the Amended Credit Agreement.
Other Arrangements
We have posted surety bonds to support regulatory and contractual obligations for certain decommissioning responsibilities, projects and legal matters. We utilize bonding facilities to support such obligations, but the issuance of bonds under those facilities is typically at the surety's discretion. Although there can be no assurance that we will maintain our surety bonding capacity, we believe our current capacity is adequate to support our existing requirements for the next twelve months. In addition, these bonds generally indemnify the beneficiaries should we fail to perform our obligations under the applicable agreements. We, and certain of our subsidiaries, have jointly executed general agreements of indemnity in favor of surety underwriters relating to surety bonds those underwriters issue. As of
December 31, 2017
, bonds issued and outstanding under these arrangements totaled approximately
$60.8 million
.
OTHER
Cash, Cash Equivalents, Restricted Cash and Investments
In the aggregate, our cash and cash equivalents, restricted cash and cash equivalents and investments
increased
by approximately
$67.2 million
to
$225.4 million
at
December 31, 2017
from
$158.1 million
at
December 31, 2016
, primarily due to the items discussed below. Our domestic and foreign cash and cash equivalents, restricted cash and cash equivalents and investments as of
December 31, 2017
and
2016
were as follows:
|
|
December 31,
|
|||||||
|
|
2017
|
2016
|
||||||
|
|
(In thousands)
|
|||||||
|
Domestic
|
$
|
211,935
|
|
$
|
92,680
|
|
||
|
Foreign
|
13,443
|
|
65,449
|
|
||||
|
Total
|
$
|
225,378
|
|
$
|
158,129
|
|
||
Our working capital
increased
by
$91.3 million
to
$345.0 million
at
December 31, 2017
from
$253.7 million
at
December 31, 2016
, primarily attributable to increases in cash and cash equivalents and accounts receivable – trade. These increases were partially offset by changes in net contracts in progress and advance billings due to the timing of project cash flows.
Our net cash
provided by
operating activities
decreased
by
$17.7 million
to
$222.2 million
in the year ended
December 31, 2017
, compared to cash
provided by
operating activities of
$239.9 million
in the year ended
December 31, 2016
. This decrease was largely attributable to the working capital changes discussed above as well as increases in pension contributions made during the year ended December 31, 2017 when compared to the prior year.
Our net cash
used in
investing activities
decreased
by
$89.0 million
to
$90.7 million
in the year ended
December 31, 2017
, compared to cash
used in
investing activities of
$179.7 million
in the year ended
December 31, 2016
. The higher cash used in investing activities in 2016 was primarily attributable to the acquisition of NEC.
47
Our net cash
used in
financing activities
decreased
by
$27.7 million
to
$61.2 million
in the year ended
December 31, 2017
, compared to cash
used in
financing activities of
$88.9 million
in the year ended
December 31, 2016
. This decrease in net cash used in financing activities was primarily attributable to repurchases of common stock of $293.0 million in 2016 as well as higher levels of net borrowings under our credit facility of $261.2 during the year ended December 31, 2016.
At
December 31, 2017
, we had restricted cash and cash equivalents totaling
$9.7 million
,
$2.6 million
of which was held for future decommissioning of facilities (which is included in other assets on our consolidated balance sheets) and
$7.1 million
of which was held to meet reinsurance reserve requirements of our captive insurer.
At
December 31, 2017
, we had short-term and long-term investments with a fair value of
$12.2 million
. Our investment portfolio consists primarily of U.S. Government and agency securities, corporate bonds and equities, mutual funds and asset-backed securities.
Based on our liquidity position, we believe we have sufficient cash and letter of credit and borrowing capacity to fund our operating requirements for at least the next 12 months.
CONTRACTUAL OBLIGATIONS
Our cash requirements as of
December 31, 2017
under current contractual obligations were as follows:
|
Total
|
Less than
1 Year
|
1-3
Years
|
3-5
Years
|
After
5 Years
|
||||||||||||||||
|
|
(In thousands)
|
|||||||||||||||||||
|
Long-term debt principal
|
$
|
513,131
|
|
$
|
27,870
|
|
$
|
485,261
|
|
$
|
—
|
|
$
|
—
|
|
|||||
|
Interest payments
|
$
|
43,056
|
|
$
|
17,018
|
|
$
|
26,038
|
|
$
|
—
|
|
$
|
—
|
|
|||||
|
Lease payments
|
$
|
8,229
|
|
$
|
3,525
|
|
$
|
3,382
|
|
$
|
1,322
|
|
$
|
—
|
|
|||||
We expect cash requirements totaling approximately
$35.4 million
for contributions to our pension plans in
2018
. In addition, we anticipate cash requirements totaling approximately
$1.6 million
for contributions to our other postretirement benefit plans in
2018
.
Our contingent commitments under letters of credit, bank guarantees and surety bonds currently outstanding expire as follows:
|
Total
|
Less than
1 Year
|
1-3
Years
|
3-5
Years
|
Thereafter
|
||||
|
(In thousands)
|
||||||||
|
$ 136,635
|
$ 122,831
|
$ 5,100
|
$ 759
|
$ 7,945
|
||||
|
Item 7A.
|
QUANTITATIVE AND QUALITATIVE DISCLOSURES ABOUT MARKET RISK
|
Our exposure to market risk from changes in interest rates relates primarily to our cash equivalents and our investment portfolio, which consists primarily of U.S. Government and agency securities, corporate bonds and equities, mutual funds and asset-backed securities. We are averse to principal loss and seek to ensure the safety and preservation of our invested funds by limiting default risk, market risk and reinvestment risk. Our investments are primarily classified as available-for-sale.
We have exposure to changes in interest rates on the Amended Credit Agreement (see Item 7 – "Management's Discussion and Analysis of Financial Condition and Results of Operations – Liquidity and Capital Resources"). At
December 31, 2017
, we had
$513.1 million
in outstanding borrowings under this facility, which has a capacity of
$913.1 million
. We have no material future earnings or cash flow exposures from changes in interest rates on our other long-term debt obligations.
We have operations in foreign locations, and, as a result, our financial results could be significantly affected by factors such as changes in foreign currency exchange ("FX") rates or weak economic conditions in those foreign markets. In order to manage the risks associated with FX rate fluctuations, we attempt to hedge those risks with FX derivative instruments. Historically, we have hedged those risks with FX forward contracts. We do not enter into speculative derivative positions.
48
Interest Rate Sensitivity
The following tables provide information about our financial instruments that are sensitive to changes in interest rates. The tables present principal cash flows and related weighted-average interest rates by expected maturity dates.
|
Principal Amount by Expected Maturity
(In thousands)
|
||||||||||||||||||||||||||||||
|
At December 31, 2017:
|
|
|
|
|
|
|
|
Fair Value at
|
||||||||||||||||||||||
|
|
Years Ending December 31,
|
|
|
December 31,
|
||||||||||||||||||||||||||
|
|
2018
|
2019
|
2020
|
2021
|
2022
|
Thereafter
|
Total
|
2017
|
||||||||||||||||||||||
|
Investments
|
$
|
2,935
|
|
—
|
|
—
|
|
—
|
|
—
|
|
$
|
6,973
|
|
$
|
9,908
|
|
$
|
12,235
|
|
||||||||||
|
Average Interest Rate
|
1.54%
|
|
—
|
|
—
|
|
—
|
|
—
|
|
2.55%
|
|
||||||||||||||||||
|
Long-term Debt
|
$
|
27,870
|
|
$
|
27,870
|
|
$
|
457,391
|
|
—
|
|
—
|
|
—
|
|
$
|
513,131
|
|
$
|
511,055
|
|
|||||||||
|
Average Interest Rate
|
3.33%
|
|
3.63%
|
|
3.70%
|
|
—
|
|
—
|
|
—
|
|
||||||||||||||||||
|
At December 31, 2016:
|
|
|
|
|
|
|
|
Fair Value at
|
|||||||||||||||||||||||
|
|
Years Ending December 31,
|
|
|
December 31,
|
|||||||||||||||||||||||||||
|
|
2017
|
2018
|
2019
|
2020
|
2021
|
Thereafter
|
Total
|
2016
|
|||||||||||||||||||||||
|
Investments
|
$
|
12,218
|
|
—
|
|
$
|
2,708
|
|
—
|
|
—
|
|
$
|
5,401
|
|
$
|
20,327
|
|
$
|
23,530
|
|
||||||||||
|
Average Interest Rate
|
0.75%
|
|
—
|
|
8.00%
|
|
—
|
|
—
|
|
0.00%
|
|
|||||||||||||||||||
|
Long-term Debt
|
$
|
27,370
|
|
$
|
27,370
|
|
$
|
27,370
|
|
$
|
448,876
|
|
—
|
|
—
|
|
$
|
530,986
|
|
$
|
522,804
|
|
|||||||||
|
Average Interest Rate
|
2.54%
|
|
3.07%
|
|
3.46%
|
|
3.66%
|
|
—
|
|
—
|
|
|||||||||||||||||||
Exchange Rate Sensitivity
The following table provides information about our FX forward contracts outstanding at
December 31, 2017
and presents such information in U.S. dollar equivalents. The table presents notional amounts and related weighted-average FX rates by expected (contractual) maturity dates and constitutes a forward-looking statement. These notional amounts generally are used to calculate the contractual payments to be exchanged under the contract. The average contractual FX rates are expressed using market convention, which is dependent on the currencies being bought and sold under the forward contract.
|
Forward Contracts to Purchase Foreign Currencies in U.S. Dollars (in thousands)
|
|||||||||||
|
|
Year Ending
|
Fair Value at
|
Average Contractual
|
||||||||
|
Foreign Currency
|
December 31, 2018
|
December 31, 2017
|
Exchange Rate
|
||||||||
|
Canadian dollar
|
$
|
3,838
|
|
$
|
54
|
|
1.2711
|
|
|||
|
U.S. dollar (selling Canadian dollar)
|
$
|
5,905
|
|
$
|
(156
|
)
|
1.2892
|
|
|||
|
Euro (selling Canadian dollar)
|
$
|
6,736
|
|
$
|
175
|
|
1.4709
|
|
|||
|
|
Year Ending
|
Fair Value at
|
Average Contractual
|
||||||||
|
Foreign Currency
|
December 31, 2019
|
December 31, 2017
|
Exchange Rate
|
||||||||
|
Canadian dollar
|
$
|
3,828
|
|
$
|
50
|
|
1.2676
|
|
|||
|
U.S. dollar (selling Canadian dollar)
|
$
|
3,555
|
|
$
|
(60
|
)
|
1.2734
|
|
|||
|
Euro (selling Canadian dollar)
|
$
|
3,179
|
|
$
|
223
|
|
1.4598
|
|
|||
|
|
Year Ending
|
Fair Value at
|
Average Contractual
|
||||||||
|
Foreign Currency
|
December 31, 2020
|
December 31, 2017
|
Exchange Rate
|
||||||||
|
Canadian dollar
|
$
|
3,817
|
|
$
|
41
|
|
1.2641
|
|
|||
|
U.S. dollar (selling Canadian dollar)
|
$
|
1,953
|
|
$
|
(33
|
)
|
1.2730
|
|
|||
|
|
Year Ending
|
Fair Value at
|
Average Contractual
|
||||||||
|
Foreign Currency
|
December 31, 2021
|
December 31, 2017
|
Exchange Rate
|
||||||||
|
Canadian dollar
|
$
|
3,807
|
|
$
|
34
|
|
1.2608
|
|
|||
49
|
Item 8.
|
FINANCIAL STATEMENTS AND SUPPLEMENTARY DATA
|
Report of Independent Registered Public Accounting Firm
To the Board of Directors and Stockholders of BWX Technologies, Inc.:
Opinion on the Financial Statements
We have audited the accompanying consolidated balance sheets of BWX Technologies, Inc. and subsidiaries (the "Company") as of December 31, 2017 and 2016, the related consolidated statements of income, comprehensive income, stockholders' equity, and cash flows for each of the three years in the period ended December 31, 2017, and the related notes (collectively referred to as the "financial statements"). In our opinion, the financial statements present fairly, in all material respects, the financial position of the Company as of December 31, 2017 and 2016, and the results of its operations and its cash flows for each of the three years in the period ended December 31, 2017, in conformity with accounting principles generally accepted in the United States of America.
We have also audited, in accordance with the standards of the Public Company Accounting Oversight Board (United States) (PCAOB), the Company's internal control over financial reporting as of December 31, 2017, based on criteria established in
Internal Control - Integrated Framework (2013)
issued by the Committee of Sponsoring Organizations of the Treadway Commission and our report dated February 27, 2018 expressed an unqualified opinion on the Company's internal control over financial reporting.
Basis for Opinion
These financial statements are the responsibility of the Company's management. Our responsibility is to express an opinion on the Company's financial statements based on our audits. We are a public accounting firm registered with the PCAOB and are required to be independent with respect to the Company in accordance with the U.S. federal securities laws and the applicable rules and regulations of the Securities and Exchange Commission and the PCAOB.
We conducted our audits in accordance with the standards of the PCAOB. Those standards require that we plan and perform the audit to obtain reasonable assurance about whether the financial statements are free of material misstatement, whether due to error or fraud. Our audits included performing procedures to assess the risks of material misstatement of the financial statements, whether due to error or fraud, and performing procedures that respond to those risks. Such procedures included examining, on a test basis, evidence regarding the amounts and disclosures in the financial statements. Our audits also included evaluating the accounting principles used and significant estimates made by management, as well as evaluating the overall presentation of the financial statements. We believe that our audits provide a reasonable basis for our opinion.
/S/ DELOITTE & TOUCHE LLP
Charlotte, North Carolina
February 27, 2018
We have served as the Company's auditor since 2009.
50
BWX TECHNOLOGIES, INC.
ASSETS
|
|
December 31,
|
|||||||
|
|
2017
|
2016
|
||||||
|
|
(In thousands)
|
|||||||
|
Current Assets:
|
||||||||
|
Cash and cash equivalents
|
$
|
203,404
|
|
$
|
125,641
|
|
||
|
Restricted cash and cash equivalents
|
7,105
|
|
6,130
|
|
||||
|
Investments
|
2,934
|
|
14,517
|
|
||||
|
Accounts receivable – trade, net
|
189,217
|
|
135,950
|
|
||||
|
Accounts receivable – other
|
19,365
|
|
25,221
|
|
||||
|
Contracts in progress
|
420,628
|
|
356,793
|
|
||||
|
Other current assets
|
30,437
|
|
29,319
|
|
||||
|
Total Current Assets
|
873,090
|
|
693,571
|
|
||||
|
Property, Plant and Equipment
|
1,013,141
|
|
922,641
|
|
||||
|
Less accumulated depreciation
|
664,512
|
|
622,955
|
|
||||
|
Net Property, Plant and Equipment
|
348,629
|
|
299,686
|
|
||||
|
Investments
|
9,301
|
|
9,013
|
|
||||
|
Goodwill
|
218,331
|
|
210,788
|
|
||||
|
Deferred Income Taxes
|
86,740
|
|
194,464
|
|
||||
|
Investments in Unconsolidated Affiliates
|
43,266
|
|
42,854
|
|
||||
|
Intangible Assets
|
110,405
|
|
114,748
|
|
||||
|
Other Assets
|
22,577
|
|
14,691
|
|
||||
|
TOTAL
|
$
|
1,712,339
|
|
$
|
1,579,815
|
|
||
See accompanying notes to consolidated financial statements.
51
BWX TECHNOLOGIES, INC.
CONSOLIDATED BALANCE SHEETS
LIABILITIES AND STOCKHOLDERS' EQUITY
|
|
December 31,
|
|||||||
|
|
2017
|
2016
|
||||||
|
|
(In thousands, except share
and per share amounts)
|
|||||||
|
Current Liabilities:
|
||||||||
|
Current maturities of long-term debt
|
$
|
27,870
|
|
$
|
27,370
|
|
||
|
Accounts payable
|
93,421
|
|
99,983
|
|
||||
|
Accrued employee benefits
|
82,477
|
|
81,793
|
|
||||
|
Accrued liabilities – other
|
64,738
|
|
72,105
|
|
||||
|
Advance billings on contracts
|
246,192
|
|
147,148
|
|
||||
|
Accrued warranty expense
|
13,428
|
|
11,477
|
|
||||
|
Total Current Liabilities
|
528,126
|
|
439,876
|
|
||||
|
Long-Term Debt
|
481,059
|
|
497,724
|
|
||||
|
Accumulated Postretirement Benefit Obligation
|
21,368
|
|
19,059
|
|
||||
|
Environmental Liabilities
|
79,786
|
|
81,711
|
|
||||
|
Pension Liability
|
296,444
|
|
357,049
|
|
||||
|
Other Liabilities
|
19,799
|
|
33,986
|
|
||||
|
Commitments and Contingencies (Note 10)
|
|
|
||||||
|
Stockholders' Equity:
|
||||||||
|
Common stock, par value $0.01 per share, authorized 325,000,000 shares; issued 125,381,591 and 124,149,609 shares at December 31, 2017 and December 31, 2016, respectively
|
1,254
|
|
1,241
|
|
||||
|
Preferred stock, par value $0.01 per share, authorized 75,000,000 shares; no shares issued
|
—
|
|
—
|
|
||||
|
Capital in excess of par value
|
98,843
|
|
22,018
|
|
||||
|
Retained earnings
|
990,652
|
|
885,117
|
|
||||
|
Treasury stock at cost, 25,964,088 and 24,858,809 shares at December 31, 2017 and December 31, 2016, respectively
|
(814,809
|
)
|
(762,169
|
)
|
||||
|
Accumulated other comprehensive income
|
9,454
|
|
3,811
|
|
||||
|
Stockholders' Equity – BWX Technologies, Inc.
|
285,394
|
|
150,018
|
|
||||
|
Noncontrolling interest
|
363
|
|
392
|
|
||||
|
Total Stockholders' Equity
|
285,757
|
|
150,410
|
|
||||
|
TOTAL
|
$
|
1,712,339
|
|
$
|
1,579,815
|
|
||
See accompanying notes to consolidated financial statements.
52
BWX TECHNOLOGIES, INC.
|
|
Year Ended December 31,
|
|||||||||||
|
|
2017
|
2016
|
2015
|
|||||||||
|
|
(In thousands, except share and per share amounts)
|
|||||||||||
|
Revenues
|
$
|
1,687,738
|
|
$
|
1,550,573
|
|
$
|
1,415,529
|
|
|||
|
Costs and Expenses:
|
||||||||||||
|
Cost of operations
|
1,170,862
|
|
1,074,529
|
|
1,027,437
|
|
||||||
|
Research and development costs
|
7,190
|
|
6,407
|
|
10,537
|
|
||||||
|
Losses (gains) on asset disposals and impairments, net
|
(194
|
)
|
(43
|
)
|
382
|
|
||||||
|
Selling, general and administrative expenses
|
214,607
|
|
216,486
|
|
207,761
|
|
||||||
|
mPower framework agreement
|
—
|
|
30,000
|
|
—
|
|
||||||
|
Income related to litigation proceeds
|
—
|
|
—
|
|
(65,728
|
)
|
||||||
|
Special charges for restructuring activities
|
—
|
|
—
|
|
16,608
|
|
||||||
|
Costs to spin-off the Power Generation business
|
—
|
|
—
|
|
25,987
|
|
||||||
|
Total Costs and Expenses
|
1,392,465
|
|
1,327,379
|
|
1,222,984
|
|
||||||
|
Equity in Income of Investees
|
13,612
|
|
16,069
|
|
13,396
|
|
||||||
|
Operating Income
|
308,885
|
|
239,263
|
|
205,941
|
|
||||||
|
Other Income (Expense):
|
||||||||||||
|
Interest income
|
1,405
|
|
651
|
|
30,331
|
|
||||||
|
Interest expense
|
(14,879
|
)
|
(8,393
|
)
|
(10,181
|
)
|
||||||
|
Other – net
|
369
|
|
25,747
|
|
(5,026
|
)
|
||||||
|
Total Other Income (Expense)
|
(13,105
|
)
|
18,005
|
|
15,124
|
|
||||||
|
Income from continuing operations before provision for income taxes and noncontrolling interest
|
295,780
|
|
257,268
|
|
221,065
|
|
||||||
|
Provision for Income Taxes
|
147,415
|
|
73,656
|
|
80,416
|
|
||||||
|
Income from continuing operations before noncontrolling interest
|
148,365
|
|
183,612
|
|
140,649
|
|
||||||
|
Income (loss) from discontinued operations, net of tax
|
—
|
|
—
|
|
(9,203
|
)
|
||||||
|
Net Income
|
$
|
148,365
|
|
$
|
183,612
|
|
$
|
131,446
|
|
|||
|
Net (Income) Loss Attributable to Noncontrolling Interest
|
(521
|
)
|
(555
|
)
|
19
|
|
||||||
|
Net Income Attributable to BWX Technologies, Inc.
|
$
|
147,844
|
|
$
|
183,057
|
|
$
|
131,465
|
|
|||
|
Amounts Attributable to BWX Technologies, Inc.'s Common Shareholders:
|
||||||||||||
|
Income from continuing operations, net of tax
|
$
|
147,844
|
|
$
|
183,057
|
|
$
|
140,774
|
|
|||
|
Income (loss) from discontinued operations, net of tax
|
—
|
|
—
|
|
(9,309
|
)
|
||||||
|
Net Income Attributable to BWX Technologies, Inc.
|
$
|
147,844
|
|
$
|
183,057
|
|
$
|
131,465
|
|
|||
|
Earnings per Common Share:
|
||||||||||||
|
Basic:
|
||||||||||||
|
Income from continuing operations
|
$
|
1.49
|
|
$
|
1.79
|
|
$
|
1.32
|
|
|||
|
Income (loss) from discontinued operations
|
—
|
|
—
|
|
(0.09
|
)
|
||||||
|
Net Income Attributable to BWX Technologies, Inc.
|
$
|
1.49
|
|
$
|
1.79
|
|
$
|
1.23
|
|
|||
|
Diluted:
|
||||||||||||
|
Income from continuing operations
|
$
|
1.47
|
|
$
|
1.76
|
|
$
|
1.31
|
|
|||
|
Income (loss) from discontinued operations
|
—
|
|
—
|
|
(0.09
|
)
|
||||||
|
Net Income Attributable to BWX Technologies, Inc.
|
$
|
1.47
|
|
$
|
1.76
|
|
$
|
1.22
|
|
|||
|
Shares used in the computation of earnings per share (Note 18):
|
||||||||||||
|
Basic
|
99,334,472
|
|
102,471,788
|
|
106,703,145
|
|
||||||
|
Diluted
|
100,369,190
|
|
103,840,738
|
|
107,583,022
|
|
||||||
See accompanying notes to consolidated financial statements.
53
BWX TECHNOLOGIES, INC.
CONSOLIDATED STATEMENTS OF COMPREHENSIVE INCOME
|
|
Year Ended December 31,
|
|||||||||||
|
|
2017
|
2016
|
2015
|
|||||||||
|
|
(In thousands)
|
|||||||||||
|
Net Income
|
$
|
148,365
|
|
$
|
183,612
|
|
$
|
131,446
|
|
|||
|
Other Comprehensive Income (Loss):
|
||||||||||||
|
Currency translation adjustments
|
6,237
|
|
(909
|
)
|
(12,483
|
)
|
||||||
|
Derivative financial instruments:
|
||||||||||||
|
Unrealized gains (losses) arising during the period, net of tax (provision) benefit of $(264), $(209) and $1,786, respectively
|
757
|
|
598
|
|
(5,122
|
)
|
||||||
|
Reclassification adjustment for (gains) losses included in net income, net of tax provision (benefit) of $21, $86 and $(1,487), respectively
|
(64
|
)
|
(250
|
)
|
4,230
|
|
||||||
|
Benefit obligations:
|
||||||||||||
|
Unrecognized losses arising during the period, net of tax benefit of $532, $606 and $381, respectively
|
(987
|
)
|
(1,125
|
)
|
(733
|
)
|
||||||
|
Recognition of benefit plan costs, net of tax benefit of $(618), $(566) and $(581), respectively
|
1,142
|
|
1,064
|
|
1,096
|
|
||||||
|
Investments:
|
||||||||||||
|
Unrealized (losses) gains arising during the period, net of tax provision of $(382), $(62) and $(4), respectively
|
(930
|
)
|
3,788
|
|
7
|
|
||||||
|
Reclassification adjustment for gains included in net income, net of tax provision of $223, $57 and $124, respectively
|
(512
|
)
|
(107
|
)
|
(221
|
)
|
||||||
|
Other Comprehensive Income (Loss)
|
5,643
|
|
3,059
|
|
(13,226
|
)
|
||||||
|
Total Comprehensive Income
|
154,008
|
|
186,671
|
|
118,220
|
|
||||||
|
Comprehensive Income Attributable to Noncontrolling Interest
|
(521
|
)
|
(555
|
)
|
(6
|
)
|
||||||
|
Comprehensive Income Attributable to BWX Technologies, Inc.
|
$
|
153,487
|
|
$
|
186,116
|
|
$
|
118,214
|
|
|||
See accompanying notes to consolidated financial statements.
54
BWX TECHNOLOGIES, INC.
CONSOLIDATED STATEMENTS OF STOCKHOLDERS' EQUITY
|
|
Common Stock
|
Capital In
Excess of
Par Value
|
Retained
Earnings
|
Accumulated
Other
Comprehensive
Income (Loss)
|
Treasury
Stock
|
Stockholders'
Equity |
Noncontrolling
Interest
|
Total
Stockholders' Equity |
|||||||||||||||||||||||||||
|
|
Shares
|
Par
Value
|
|||||||||||||||||||||||||||||||||
|
|
|
(In thousands, except share and per share amounts)
|
|
||||||||||||||||||||||||||||||||
|
Balance December 31, 2014
|
121,604,332
|
|
$
|
1,216
|
|
$
|
775,393
|
|
$
|
642,489
|
|
$
|
3,596
|
|
$
|
(423,990
|
)
|
$
|
998,704
|
|
$
|
15,497
|
|
$
|
1,014,201
|
|
|||||||||
|
Net income
|
—
|
|
—
|
|
—
|
|
131,465
|
|
—
|
|
—
|
|
131,465
|
|
(19
|
)
|
131,446
|
|
|||||||||||||||||
|
Dividends declared ($0.32 per share)
|
—
|
|
—
|
|
—
|
|
(34,604
|
)
|
—
|
|
—
|
|
(34,604
|
)
|
—
|
|
(34,604
|
)
|
|||||||||||||||||
|
Currency translation adjustments
|
—
|
|
—
|
|
—
|
|
—
|
|
(12,508
|
)
|
—
|
|
(12,508
|
)
|
25
|
|
(12,483
|
)
|
|||||||||||||||||
|
Derivative financial instruments
|
—
|
|
—
|
|
—
|
|
—
|
|
(892
|
)
|
—
|
|
(892
|
)
|
—
|
|
(892
|
)
|
|||||||||||||||||
|
Defined benefit obligations
|
—
|
|
—
|
|
—
|
|
—
|
|
363
|
|
—
|
|
363
|
|
—
|
|
363
|
|
|||||||||||||||||
|
Available-for-sale investments
|
—
|
|
—
|
|
—
|
|
—
|
|
(214
|
)
|
—
|
|
(214
|
)
|
—
|
|
(214
|
)
|
|||||||||||||||||
|
Exercise of stock options
|
345,745
|
|
4
|
|
7,711
|
|
—
|
|
—
|
|
—
|
|
7,715
|
|
—
|
|
7,715
|
|
|||||||||||||||||
|
Contributions to thrift plan
|
149,753
|
|
1
|
|
4,530
|
|
—
|
|
—
|
|
—
|
|
4,531
|
|
—
|
|
4,531
|
|
|||||||||||||||||
|
Shares placed in treasury
|
—
|
|
—
|
|
—
|
|
—
|
|
—
|
|
(74,356
|
)
|
(74,356
|
)
|
—
|
|
(74,356
|
)
|
|||||||||||||||||
|
Stock-based compensation charges
|
713,305
|
|
7
|
|
26,340
|
|
—
|
|
—
|
|
—
|
|
26,347
|
|
—
|
|
26,347
|
|
|||||||||||||||||
|
Distributions to noncontrolling interests
|
—
|
|
—
|
|
—
|
|
—
|
|
—
|
|
—
|
|
—
|
|
(464
|
)
|
(464
|
)
|
|||||||||||||||||
|
Spin-off of Power Generation Business
|
—
|
|
—
|
|
(791,242
|
)
|
—
|
|
10,407
|
|
—
|
|
(780,835
|
)
|
(1,120
|
)
|
(781,955
|
)
|
|||||||||||||||||
|
Balance December 31, 2015
|
122,813,135
|
|
$
|
1,228
|
|
$
|
22,732
|
|
$
|
739,350
|
|
$
|
752
|
|
$
|
(498,346
|
)
|
$
|
265,716
|
|
$
|
13,919
|
|
$
|
279,635
|
|
|||||||||
|
Net income
|
—
|
|
—
|
|
—
|
|
183,057
|
|
—
|
|
—
|
|
183,057
|
|
555
|
|
183,612
|
|
|||||||||||||||||
|
Dividends declared ($0.36 per share)
|
—
|
|
—
|
|
—
|
|
(37,290
|
)
|
—
|
|
—
|
|
(37,290
|
)
|
—
|
|
(37,290
|
)
|
|||||||||||||||||
|
Currency translation adjustments
|
—
|
|
—
|
|
—
|
|
—
|
|
(909
|
)
|
—
|
|
(909
|
)
|
—
|
|
(909
|
)
|
|||||||||||||||||
|
Derivative financial instruments
|
—
|
|
—
|
|
—
|
|
—
|
|
348
|
|
—
|
|
348
|
|
—
|
|
348
|
|
|||||||||||||||||
|
Defined benefit obligations
|
—
|
|
—
|
|
—
|
|
—
|
|
(61
|
)
|
—
|
|
(61
|
)
|
—
|
|
(61
|
)
|
|||||||||||||||||
|
Available-for-sale investments
|
—
|
|
—
|
|
—
|
|
—
|
|
3,681
|
|
—
|
|
3,681
|
|
—
|
|
3,681
|
|
|||||||||||||||||
|
Exercise of stock options
|
912,683
|
|
9
|
|
19,978
|
|
—
|
|
—
|
|
—
|
|
19,987
|
|
—
|
|
19,987
|
|
|||||||||||||||||
|
Shares placed in treasury
|
—
|
|
—
|
|
(40,000
|
)
|
—
|
|
—
|
|
(263,823
|
)
|
(303,823
|
)
|
—
|
|
(303,823
|
)
|
|||||||||||||||||
|
Stock-based compensation charges
|
423,791
|
|
4
|
|
15,922
|
|
—
|
|
—
|
|
—
|
|
15,926
|
|
—
|
|
15,926
|
|
|||||||||||||||||
|
Distributions to noncontrolling interests
|
—
|
|
—
|
|
—
|
|
—
|
|
—
|
|
—
|
|
—
|
|
(511
|
)
|
(511
|
)
|
|||||||||||||||||
|
Deconsolidation of Generation mPower LLC
|
—
|
|
—
|
|
—
|
|
—
|
|
—
|
|
—
|
|
—
|
|
(13,571
|
)
|
(13,571
|
)
|
|||||||||||||||||
|
Other
|
—
|
|
—
|
|
3,386
|
|
—
|
|
—
|
|
—
|
|
3,386
|
|
—
|
|
3,386
|
|
|||||||||||||||||
|
Balance December 31, 2016
|
124,149,609
|
|
$
|
1,241
|
|
$
|
22,018
|
|
$
|
885,117
|
|
$
|
3,811
|
|
$
|
(762,169
|
)
|
$
|
150,018
|
|
$
|
392
|
|
$
|
150,410
|
|
|||||||||
|
Net income
|
—
|
|
—
|
|
—
|
|
147,844
|
|
—
|
|
—
|
|
147,844
|
|
521
|
|
148,365
|
|
|||||||||||||||||
|
Dividends declared ($0.42 per share)
|
—
|
|
—
|
|
—
|
|
(42,309
|
)
|
—
|
|
—
|
|
(42,309
|
)
|
—
|
|
(42,309
|
)
|
|||||||||||||||||
|
Currency translation adjustments
|
—
|
|
—
|
|
—
|
|
—
|
|
6,237
|
|
—
|
|
6,237
|
|
—
|
|
6,237
|
|
|||||||||||||||||
|
Derivative financial instruments
|
—
|
|
—
|
|
—
|
|
—
|
|
693
|
|
—
|
|
693
|
|
—
|
|
693
|
|
|||||||||||||||||
|
Defined benefit obligations
|
—
|
|
—
|
|
—
|
|
—
|
|
155
|
|
—
|
|
155
|
|
—
|
|
155
|
|
|||||||||||||||||
|
Available-for-sale investments
|
—
|
|
—
|
|
—
|
|
—
|
|
(1,442
|
)
|
—
|
|
(1,442
|
)
|
—
|
|
(1,442
|
)
|
|||||||||||||||||
|
Exercise of stock options
|
921,040
|
|
10
|
|
21,699
|
|
—
|
|
—
|
|
—
|
|
21,709
|
|
—
|
|
21,709
|
|
|||||||||||||||||
|
Shares placed in treasury
|
—
|
|
—
|
|
39,907
|
|
—
|
|
—
|
|
(52,640
|
)
|
(12,733
|
)
|
—
|
|
(12,733
|
)
|
|||||||||||||||||
|
Stock-based compensation charges
|
310,942
|
|
3
|
|
15,219
|
|
—
|
|
—
|
|
—
|
|
15,222
|
|
—
|
|
15,222
|
|
|||||||||||||||||
|
Distributions to noncontrolling interests
|
—
|
|
—
|
|
—
|
|
—
|
|
—
|
|
—
|
|
—
|
|
(550
|
)
|
(550
|
)
|
|||||||||||||||||
|
Balance December 31, 2017
|
125,381,591
|
|
$
|
1,254
|
|
$
|
98,843
|
|
$
|
990,652
|
|
$
|
9,454
|
|
$
|
(814,809
|
)
|
$
|
285,394
|
|
$
|
363
|
|
$
|
285,757
|
|
|||||||||
See accompanying notes to consolidated financial statements.
55
BWX TECHNOLOGIES, INC.
|
|
Year Ended December 31,
|
|||||||||||
|
|
2017
|
2016
|
2015
|
|||||||||
|
|
(In thousands)
|
|||||||||||
|
CASH FLOWS FROM OPERATING ACTIVITIES:
|
||||||||||||
|
Net Income
|
$
|
148,365
|
|
$
|
183,612
|
|
$
|
131,446
|
|
|||
|
Non-cash items included in net income from continuing operations:
|
||||||||||||
|
Depreciation and amortization
|
56,557
|
|
50,554
|
|
78,621
|
|
||||||
|
Income of investees, net of dividends
|
2,520
|
|
(1,017
|
)
|
1,947
|
|
||||||
|
Losses on asset disposals and impairments
|
(194
|
)
|
(43
|
)
|
26,441
|
|
||||||
|
Gain on deconsolidation of Generation mPower LLC
|
—
|
|
(13,571
|
)
|
—
|
|
||||||
|
Impairment of investments
|
—
|
|
—
|
|
2,140
|
|
||||||
|
Provision for (benefit from) deferred taxes
|
93,461
|
|
(7,231
|
)
|
(38,493
|
)
|
||||||
|
Recognition of (gains) losses for pension and postretirement plans
|
12,823
|
|
22,940
|
|
54,105
|
|
||||||
|
Stock-based compensation and thrift plan expense
|
15,222
|
|
15,371
|
|
31,699
|
|
||||||
|
Changes in assets and liabilities, net of effects from acquisitions:
|
||||||||||||
|
Accounts receivable
|
(42,803
|
)
|
28,570
|
|
40,094
|
|
||||||
|
Accounts payable
|
(7,476
|
)
|
19,549
|
|
(23,985
|
)
|
||||||
|
Contracts in progress and advance billings on contracts
|
35,272
|
|
(60,473
|
)
|
57,174
|
|
||||||
|
Income taxes
|
15,124
|
|
13,216
|
|
(6,991
|
)
|
||||||
|
Accrued and other current liabilities
|
(26,610
|
)
|
18,542
|
|
(5,533
|
)
|
||||||
|
Pension liability, accrued postretirement benefit obligation and employee benefits
|
(79,311
|
)
|
(21,057
|
)
|
(32,877
|
)
|
||||||
|
Other, net
|
(796
|
)
|
(9,112
|
)
|
19,369
|
|
||||||
|
NET CASH PROVIDED BY OPERATING ACTIVITIES
|
222,154
|
|
239,850
|
|
335,157
|
|
||||||
|
CASH FLOWS FROM INVESTING ACTIVITIES:
|
||||||||||||
|
Decrease (increase) in restricted cash and cash equivalents
|
(975
|
)
|
9,234
|
|
3,595
|
|
||||||
|
Purchases of property, plant and equipment
|
(96,880
|
)
|
(52,634
|
)
|
(68,335
|
)
|
||||||
|
Acquisition of businesses, net of cash acquired
|
(715
|
)
|
(117,780
|
)
|
—
|
|
||||||
|
Purchases of securities
|
(3,237
|
)
|
(18,648
|
)
|
(13,466
|
)
|
||||||
|
Sales and maturities of securities
|
12,852
|
|
9,261
|
|
6,456
|
|
||||||
|
Proceeds from asset disposals
|
397
|
|
43
|
|
63
|
|
||||||
|
Investments, net of return of capital, in equity method investees
|
(2,789
|
)
|
(9,165
|
)
|
(200
|
)
|
||||||
|
Other, net
|
691
|
|
—
|
|
—
|
|
||||||
|
NET CASH USED IN INVESTING ACTIVITIES
|
(90,656
|
)
|
(179,689
|
)
|
(71,887
|
)
|
||||||
|
CASH FLOWS FROM FINANCING ACTIVITIES:
|
||||||||||||
|
Borrowings under Credit Agreement
|
109,400
|
|
539,500
|
|
177,350
|
|
||||||
|
Repayments under Credit Agreement
|
(137,053
|
)
|
(305,906
|
)
|
(177,350
|
)
|
||||||
|
Payment of debt issuance costs
|
—
|
|
(682
|
)
|
(4,893
|
)
|
||||||
|
Repurchase of common shares
|
—
|
|
(292,997
|
)
|
(69,747
|
)
|
||||||
|
Dividends paid to common shareholders
|
(42,043
|
)
|
(37,370
|
)
|
(34,479
|
)
|
||||||
|
Exercise of stock options
|
17,117
|
|
18,323
|
|
7,319
|
|
||||||
|
Cash paid for shares withheld to satisfy employee taxes
|
(8,049
|
)
|
(9,254
|
)
|
(4,597
|
)
|
||||||
|
Cash divested in connection with spin-off of Power Generation business
|
—
|
|
—
|
|
(307,562
|
)
|
||||||
|
Other
|
(550
|
)
|
(511
|
)
|
(464
|
)
|
||||||
|
NET CASH USED IN FINANCING ACTIVITIES
|
(61,178
|
)
|
(88,897
|
)
|
(414,423
|
)
|
||||||
|
EFFECTS OF EXCHANGE RATE CHANGES ON CASH
|
7,443
|
|
(352
|
)
|
(7,087
|
)
|
||||||
|
TOTAL INCREASE (DECREASE) IN CASH AND CASH EQUIVALENTS
|
77,763
|
|
(29,088
|
)
|
(158,240
|
)
|
||||||
|
CASH AND CASH EQUIVALENTS AT BEGINNING OF PERIOD
|
125,641
|
|
154,729
|
|
312,969
|
|
||||||
|
CASH AND CASH EQUIVALENTS AT END OF PERIOD
|
$
|
203,404
|
|
$
|
125,641
|
|
$
|
154,729
|
|
|||
|
SUPPLEMENTAL DISCLOSURES OF CASH FLOW INFORMATION:
|
||||||||||||
|
Cash paid during the period for:
|
||||||||||||
|
Interest
|
$
|
14,252
|
|
$
|
6,512
|
|
$
|
6,647
|
|
|||
|
Income taxes (net of refunds)
|
$
|
38,425
|
|
$
|
66,291
|
|
$
|
117,753
|
|
|||
|
SCHEDULE OF NON-CASH INVESTING ACTIVITY:
|
||||||||||||
|
Accrued capital expenditures included in accounts payable
|
$
|
8,454
|
|
$
|
8,724
|
|
$
|
6,741
|
|
|||
See accompanying notes to consolidated financial statements.
56
BWX TECHNOLOGIES, INC.
NOTES TO CONSOLIDATED FINANCIAL STATEMENTS
DECEMBER 31, 2017
NOTE
1
– BASIS OF PRESENTATION AND SIGNIFICANT ACCOUNTING POLICIES
We have presented the consolidated financial statements of BWX Technologies, Inc. ("BWXT") in U.S. dollars in accordance with accounting principles generally accepted in the United States ("GAAP").
We use the equity method to account for investments in entities that we do not control, but over which we have the ability to exercise significant influence. We generally refer to these entities as "joint ventures." We have eliminated all intercompany transactions and accounts. We have reclassified certain amounts previously reported to conform to the presentation at
December 31, 2017
and for the year ended
December 31, 2017
. We present the notes to our consolidated financial statements on the basis of continuing operations, unless otherwise stated.
Unless the context otherwise indicates, "we," "us" and "our" mean BWXT and its consolidated subsidiaries.
Spin-off
On June 30, 2015, we completed the spin-off of our former Power Generation business (the "spin-off") into an independent, publicly traded company named Babcock & Wilcox Enterprises, Inc. ("BWE"). The separation was effected through a pro rata distribution of
100%
of BWE's common stock to BWXT's stockholders. The distribution of BWE common stock consisted of one share of BWE common stock for every two shares of BWXT common stock to holders of our common stock on the record date of June 18, 2015. Cash was paid in lieu of any fractional shares of BWE common stock. Following the spin-off, BWXT did not retain any ownership interest in BWE. Prior to June 30, 2015, we completed an internal restructuring that reorganized the subsidiaries involved in our former Power Generation business and established BWE as the direct or indirect parent company of those subsidiaries. Concurrent with the spin-off, The Babcock & Wilcox Company was renamed BWX Technologies, Inc. The results of operations of our former Power Generation business are presented as discontinued operations on the consolidated statements of income. See
Note 3
for further information regarding the spin-off.
Reportable Segments
We operate in
three
reportable segments: Nuclear Operations Group, Nuclear Services Group and Nuclear Power Group. Our reportable segments reflect changes we made during the first quarter of 2017 in the manner for which our segment operating information is reported for purposes of assessing operating performance and allocating resources. Prior to 2017, we reported
three
segments: Nuclear Operations, Nuclear Energy and Technical Services. The U.S. commercial nuclear services business, a component of our former Nuclear Energy segment, is now reported in our Nuclear Services Group segment along with our former Technical Services segment. The remainder of our former Nuclear Energy segment is now reported in our Nuclear Power Group segment, which comprises our Canadian operations, including BWXT Nuclear Energy Canada Inc. Our Nuclear Operations Group segment represents our former Nuclear Operations segment. The change in our reportable segments had no impact on our previously reported consolidated results of operations, financial condition or cash flows. Our reportable segments are further described as follows:
|
•
|
Our Nuclear Operations Group segment manufactures naval nuclear reactors for the U.S. Department of Energy ("DOE")/National Nuclear Security Administration's ("NNSA") Naval Nuclear Propulsion Program, which in turn supplies them to the U.S. Navy for use in submarines and aircraft carriers. Through this segment, we own and operate manufacturing facilities located in Lynchburg, Virginia; Barberton, Ohio; Mount Vernon, Indiana; Euclid, Ohio; and Erwin, Tennessee. The Lynchburg operations fabricate fuel-bearing precision components that range in weight from a few grams to hundreds of tons. In-house capabilities also include wet chemistry uranium processing, advanced heat treatment to optimize component material properties and a controlled, clean-room environment with the capacity to assemble railcar-size components. The Barberton and Mount Vernon locations specialize in the design and manufacture of heavy components inclusive of development and fabrication activities for submarine missile launch tubes. The Euclid facility fabricates electro-mechanical equipment and performs design, manufacturing, inspection, assembly and testing activities. Fuel for the naval nuclear reactors is provided by Nuclear Fuel Services, Inc. ("NFS"), one of our wholly owned subsidiaries. Located in Erwin, NFS also downblends Cold War-era government stockpiles of high-enriched uranium into material suitable for further processing into commercial nuclear reactor fuel.
|
|
•
|
Our Nuclear Services Group segment provides various services to the U.S. Government and the commercial nuclear industry. Services provided to the U.S. Government include nuclear materials management and operation, environmental management and administrative and operating services for various U.S. Government-owned facilities.
|
57
These services are provided to the DOE, including the NNSA, the Office of Nuclear Energy, the Office of Science and the Office of Environmental Management, and NASA. Through this segment we deliver services and management solutions to nuclear and high-consequence operations. A significant portion of this segment's operations are conducted through joint ventures.
Our Nuclear Services Group segment also provides inspection and maintenance services primarily for the U.S. commercial nuclear industry including steam generator and heat exchanger inspection services, high pressure water lancing, non-destructive examination and customized tooling solutions. This segment also offers complete advanced fuel and reactor engineering, licensing and manufacturing services for new advanced nuclear reactors.
|
•
|
Our Nuclear Power Group segment fabricates steam generators, nuclear fuel, fuel handling systems, pressure vessels, reactor components, heat exchangers, tooling delivery systems and other auxiliary equipment, including containers for the storage of spent nuclear fuel and other high-level waste, for nuclear utility customers. BWXT has supplied the nuclear industry with more than
1,300
large, heavy components worldwide and is the only heavy nuclear component, N-Stamp certified manufacturer in North America. This segment also provides specialized engineering services that include structural component design, 3-D thermal-hydraulic engineering analysis, weld and robotic process development, electrical and controls engineering and metallurgy and materials engineering. In addition, this segment offers in-plant inspection, maintenance and modification services for nuclear steam generators, heat exchangers, reactors, fuel handling systems and balance of plant equipment, as well as specialized non-destructive examination and tooling/repair solutions.
|
On December 16, 2016, our subsidiary BWXT Canada Ltd. acquired the outstanding stock of the GE Hitachi Nuclear Energy Canada Inc. joint venture, which was renamed BWXT Nuclear Energy Canada Inc. ("NEC"). NEC is a leading supplier of nuclear fuel, fuel handling systems, tooling delivery systems and replacement components for CANDU reactors and has approximately
350
employees. NEC operates
two
facilities licensed by the Canadian Nuclear Safety Commission ("CNSC") to fabricate natural uranium fuel in Peterborough and Toronto, Ontario, Canada as well as a third facility in Arnprior, Ontario, Canada. The acquisition of NEC expanded our existing commercial nuclear products and services portfolio, allowing us to leverage our technology-based competencies in offering new products and services related to plant life extensions as well as the ongoing maintenance of nuclear power generation equipment. NEC is reported within our Nuclear Power Group segment. See
Note 2
for additional information on the acquisition of NEC.
See
Note 16
for financial information about our segments.
Deconsolidation of Generation mPower LLC
In 2014, we began initiatives to restructure our mPower program. During the year ended December 31, 2015, we incurred expenses of
$15.9 million
related to asset impairment charges recgnized as Special charges for restructuring activities on our consolidated statement of income. On March 2, 2016, we entered into a framework agreement with Bechtel Power Corporation ("Bechtel"), BWXT Modular Reactors, LLC and BDC NexGen Power, LLC for the potential restructuring and restart of our mPower small modular reactor program (the "Framework Agreement"). As a result of entering into the Framework Agreement, we deconsolidated Generation mPower LLC ("GmP") from our financial statements as of the date of the Framework Agreement and recorded a gain of approximately
$13.6 million
during the year ended December 31, 2016 as a component of Other – net on our consolidated statement of income. In the year ended December 31, 2016, we also recognized a
$30.0 million
loss contingency as a result of the Framework Agreement, which was ultimately paid to Bechtel in the first quarter of 2017 following the receipt of Bechtel's notice that the mPower program would not be restarted.
Use of Estimates
We use estimates and assumptions to prepare our financial statements in conformity with GAAP. Some of our more significant estimates include our estimates of costs to complete long-term construction contracts, estimates of the fair value of acquired intangible assets, estimates of costs to be incurred to satisfy contractual warranty requirements, and estimates we make in selecting assumptions related to the valuations of our pension and postretirement plans, including the selection of our discount rates, mortality and expected rates of return on our pension plan assets. These estimates and assumptions affect the amounts we report in our financial statements and accompanying notes. Our actual results could differ from these estimates. Variances could result in a material effect on our financial condition and results of operations in future periods.
58
Earnings Per Share
We have computed earnings per common share on the basis of the weighted-average number of common shares, and, where dilutive, common share equivalents, outstanding during the indicated periods. We issue a number of forms of stock-based compensation periodically, including incentive and non-qualified stock options, restricted stock, restricted stock units and performance shares and performance units, subject to satisfaction of specific performance goals. We include the shares applicable to these plans in our computation of diluted earnings per share when related performance criteria have been met.
Investments
Our investment portfolio consists primarily of U.S. Government and agency securities, corporate bonds and equities, mutual funds and asset-backed securities. Our investments are carried at fair value and are either classified as trading, with unrealized gains and losses reported in earnings, or as available-for-sale, with the unrealized gains and losses, net of tax, reported as a component of accumulated other comprehensive income. We classify investments available for current operations in the consolidated balance sheets as current assets, while we classify investments held for long-term purposes as non-current assets. We adjust the amortized cost of debt securities for amortization of premiums and accretion of discounts to maturity. That amortization is included in Interest income. We include realized gains and losses on our investments in Other – net. The cost of securities sold is based on the specific identification method. We include interest on securities in Interest income.
Foreign Currency Translation
We translate assets and liabilities of our foreign operations into U.S. dollars at current exchange rates, and we translate income statement items at average exchange rates for the periods presented. We record adjustments resulting from the translation of foreign currency financial statements as a component of accumulated other comprehensive income. We report foreign currency transaction gains and losses in income. We have included in Other – net transaction gains (losses) of
$(0.7) million
,
$0.4 million
and
$(1.7) million
for the years ended
December 31, 2017
,
2016
and
2015
, respectively.
Contracts and Revenue Recognition
We generally recognize contract revenues and related costs on a percentage-of-completion method for individual contracts or combinations of contracts based on work performed, man hours, cost-to-cost or a units of delivery method, as applicable to the product or activity involved. We recognize estimated contract revenue and resulting income based on the measurement of the extent of progress completion as a percentage of the total project. Certain costs may be excluded from the cost-to-cost method of measuring progress, such as significant costs for materials and major third-party subcontractors, if it appears that such exclusion would result in a more meaningful measurement of actual contract progress and resulting periodic allocation of income. We include revenues and related costs so recorded, plus accumulated contract costs that exceed amounts invoiced to customers under the terms of the contracts, in Contracts in progress. We include in Advance billings on contracts billings that exceed accumulated contract costs and revenues and costs recognized under the percentage-of-completion method. Most long-term contracts contain provisions for progress payments. Our unbilled receivables do not contain an allowance for credit losses as we expect to invoice customers and collect all amounts for unbilled revenues. We review contract price and cost estimates periodically as the work progresses and reflect adjustments proportionate to the percentage-of-completion in income in the period when those estimates are revised. For all contracts, if a current estimate of total contract cost indicates a loss on a contract, the projected loss is recognized in full when determined.
For contracts for which we are unable to estimate the final profitability except to assure that no loss will ultimately be incurred, we recognize equal amounts of revenue and cost until the final results can be estimated more precisely. For these deferred profit recognition contracts, we recognize revenue and cost equally and only recognize gross margin when probable and reasonably estimable, which we generally determine to be when the contract is approximately
70%
complete. We treat long-term construction contracts that contain such a level of risk and uncertainty that estimation of the final outcome is impractical, except to assure that no loss will be incurred, as deferred profit recognition contracts.
Our policy is to account for fixed-price contracts under the completed-contract method if we believe that we are unable to reasonably forecast cost to complete at start-up. Under the completed-contract method, income is recognized only when a contract is completed or substantially complete.
59
The following represent the components of our Contracts in progress and Advance billings on contracts included in our consolidated balance sheets:
|
|
December 31,
|
|||||||
|
|
2017
|
2016
|
||||||
|
|
(In thousands)
|
|||||||
|
Included in Contracts in progress:
|
||||||||
|
Costs incurred less costs of revenue recognized
|
$
|
49,740
|
|
$
|
76,763
|
|
||
|
Revenues recognized less billings to customers
|
370,888
|
|
280,030
|
|
||||
|
Contracts in progress
|
$
|
420,628
|
|
$
|
356,793
|
|
||
|
Included in Advance billings on contracts:
|
||||||||
|
Billings to customers less revenues recognized
|
$
|
274,311
|
|
$
|
162,833
|
|
||
|
Costs incurred less costs of revenue recognized
|
(28,119
|
)
|
(15,685
|
)
|
||||
|
Advance billings on contracts
|
$
|
246,192
|
|
$
|
147,148
|
|
||
The following amounts represent retainages on contracts:
|
|
December 31,
|
|||||||
|
|
2017
|
2016
|
||||||
|
|
(In thousands)
|
|||||||
|
Retainages expected to be collected within one year
|
$
|
82,801
|
|
$
|
74,452
|
|
||
|
Retainages expected to be collected after one year
|
1,669
|
|
1,674
|
|
||||
|
Total retainages
|
$
|
84,470
|
|
$
|
76,126
|
|
||
We have included retainages expected to be collected in
2018
in Accounts receivable – trade, net. Retainages expected to be collected after one year are included in Other Assets. Of the long-term retainages at
December 31, 2017
, we anticipate collecting
$0.3 million
in
2019
and
$1.4 million
in
2020
.
Accumulated Other Comprehensive Income
The components of Accumulated other comprehensive income included in Stockholders' Equity are as follows:
|
|
December 31,
|
|||||||
|
|
2017
|
2016
|
||||||
|
|
(In thousands)
|
|||||||
|
Currency translation adjustments
|
$
|
13,148
|
|
$
|
6,911
|
|
||
|
Net unrealized gain (loss) on derivative financial instruments
|
353
|
|
(340
|
)
|
||||
|
Unrecognized prior service cost on benefit obligations
|
(6,237
|
)
|
(6,392
|
)
|
||||
|
Net unrealized gain on available-for-sale investments
|
2,190
|
|
3,632
|
|
||||
|
Accumulated other comprehensive income
|
$
|
9,454
|
|
$
|
3,811
|
|
||
60
The amounts reclassified out of Accumulated other comprehensive income by component and the affected consolidated statements of income line items are as follows:
|
|
Year Ended December 31,
|
|
||||||||||||
|
|
2017
|
2016
|
2015
|
|
||||||||||
|
Accumulated Other Comprehensive Income Component Recognized
|
(In thousands)
|
Line Item Presented
|
||||||||||||
|
Realized (loss) gain on derivative financial instruments
|
$
|
169
|
|
$
|
(30
|
)
|
$
|
455
|
|
Revenues
|
||||
|
(84
|
)
|
366
|
|
(6,259
|
)
|
Cost of operations
|
||||||||
|
85
|
|
336
|
|
(5,804
|
)
|
Total before tax
|
||||||||
|
(21
|
)
|
(86
|
)
|
1,492
|
|
Provision for Income Taxes
|
||||||||
|
$
|
64
|
|
$
|
250
|
|
$
|
(4,312
|
)
|
Net Income
|
|||||
|
Amortization of prior service cost on benefit obligations
|
$
|
(1,760
|
)
|
$
|
(1,601
|
)
|
$
|
(1,508
|
)
|
Cost of operations
|
||||
|
—
|
|
(29
|
)
|
(35
|
)
|
Selling, general and administrative expenses
|
||||||||
|
(1,760
|
)
|
(1,630
|
)
|
(1,543
|
)
|
Total before tax
|
||||||||
|
618
|
|
566
|
|
501
|
|
Provision for Income Taxes
|
||||||||
|
$
|
(1,142
|
)
|
$
|
(1,064
|
)
|
$
|
(1,042
|
)
|
Net Income
|
|||||
|
Realized gains on investments
|
$
|
735
|
|
$
|
164
|
|
$
|
343
|
|
Other – net
|
||||
|
(223
|
)
|
(57
|
)
|
(123
|
)
|
Provision for Income Taxes
|
||||||||
|
$
|
512
|
|
$
|
107
|
|
$
|
220
|
|
Net Income
|
|||||
|
Total reclassification for the period
|
$
|
(566
|
)
|
$
|
(707
|
)
|
$
|
(5,134
|
)
|
|||||
Warranty Expense
We accrue estimated expense, included in Cost of operations on our consolidated statements of income, to satisfy contractual warranty requirements when we recognize the associated revenue on the related contracts. In addition, we record specific provisions or reductions where we expect the actual warranty costs to significantly differ from the accrued estimates. Such changes could have a material effect on our consolidated financial condition, results of operations and cash flows.
The following summarizes the changes in the carrying amount of Accrued warranty expense:
|
|
Year Ended December 31,
|
|||||||||||
|
|
2017
|
2016
|
2015
|
|||||||||
|
|
(In thousands)
|
|||||||||||
|
Balance at beginning of period
|
$
|
11,477
|
|
$
|
13,542
|
|
$
|
15,889
|
|
|||
|
Additions
|
3,783
|
|
1,192
|
|
1,223
|
|
||||||
|
Acquisition of NEC
|
—
|
|
282
|
|
—
|
|
||||||
|
Expirations and other changes
(1)
|
(2,213
|
)
|
(3,631
|
)
|
(2,551
|
)
|
||||||
|
Payments
|
(70
|
)
|
(20
|
)
|
(130
|
)
|
||||||
|
Translation
|
451
|
|
112
|
|
(889
|
)
|
||||||
|
Balance at end of period
|
$
|
13,428
|
|
$
|
11,477
|
|
$
|
13,542
|
|
|||
|
(1)
|
Includes discounts provided to customers in satisfaction of warranty obligations totaling
$1.2 million
in each of the years ended
December 31, 2017
,
2016
and
2015
.
|
Asset Retirement Obligations and Environmental Cleanup Costs
We accrue for future decommissioning of our nuclear facilities that will permit the release of these facilities to unrestricted use at the end of each facility's life, which is a requirement of our licenses from the U.S. Nuclear Regulatory Commission ("NRC") and the CNSC. In accordance with the Financial Accounting Standards Board ("FASB") Topic
Asset Retirement and Environmental Obligations,
we record the fair value of a liability for an asset retirement obligation in the period in which it is incurred. When we initially record such a liability, we capitalize a cost by increasing the carrying amount of the related long-lived asset. Over time, the liability is accreted to its present value each period and the capitalized cost is depreciated over the useful life of the related asset. Upon settlement of a liability, we will settle the obligation for its recorded
61
amount or incur a gain or loss. This topic applies to environmental liabilities associated with assets that we currently operate and are obligated to remove from service. For environmental liabilities associated with assets that we no longer operate, we have accrued amounts based on the estimated costs of cleanup activities for which we are responsible, net of any cost-sharing arrangements. We adjust the estimated costs as further information develops or circumstances change. An exception to this accounting treatment relates to the work we perform for
two
facilities for which the U.S. Government is obligated to pay substantially all of the decommissioning costs.
Substantially all of our asset retirement obligations relate to the remediation of our nuclear analytical laboratory and the NFS facility in our Nuclear Operations Group segment as well as the facilities operated by NEC. The following table reflects our asset retirement obligations:
|
|
Year Ended December 31,
|
|||||||||||
|
|
2017
|
2016
|
2015
|
|||||||||
|
|
(In thousands)
|
|||||||||||
|
Balance at beginning of period
|
$
|
71,899
|
|
$
|
50,514
|
|
$
|
47,811
|
|
|||
|
Costs incurred
|
(2
|
)
|
(141
|
)
|
—
|
|
||||||
|
Additions/adjustments
|
—
|
|
—
|
|
832
|
|
||||||
|
Acquisition of NEC
|
—
|
|
18,505
|
|
—
|
|
||||||
|
Accretion
|
4,728
|
|
3,148
|
|
2,158
|
|
||||||
|
Distributed in connection with the spin-off
|
—
|
|
—
|
|
(287
|
)
|
||||||
|
Translation
|
1,411
|
|
(127
|
)
|
—
|
|
||||||
|
Balance at end of period
|
$
|
78,036
|
|
$
|
71,899
|
|
$
|
50,514
|
|
|||
Research and Development
Our research and development activities are related to the development and improvement of new and existing products and equipment, as well as conceptual and engineering evaluation for translation into practical applications. We charge the costs of research and development unrelated to specific contracts as incurred. Excluding customer-sponsored research and development, the majority of our activities in this area, for the year ended December 31, 2017, related to the development of technologies in the area of medical and industrial radioisotopes. During the years ended December 31, 2016 and 2015, substantially all of these costs related to our mPower program for the development of our BWXT mPower™ reactor and the associated power plant. Contractual arrangements for customer-sponsored research and development can vary on a case-by-case basis and include contracts, cooperative agreements and grants.
Research and development activities totaled
$50.4 million
,
$40.1 million
and
$38.2 million
in the years ended
December 31, 2017
,
2016
and
2015
, respectively. This includes amounts paid for by our customers of
$43.2 million
,
$33.7 million
and
$27.7 million
, in the years ended
December 31, 2017
,
2016
and
2015
, respectively.
Pension Plans and Postretirement Benefits
We sponsor various defined benefit pension and postretirement plans covering certain employees of our U.S. and Canadian subsidiaries. We utilize actuarial valuations to calculate the cost and benefit obligations of our pension and postretirement benefits. The actuarial valuations utilize significant assumptions in the determination of our benefit cost and obligations, including assumptions regarding discount rates, expected returns on plan assets, mortality and health care cost trends. We determine our discount rate based on a yield curve comprised of rates of return on high-quality, fixed-income investments currently available and expected to be available during the period to maturity of our pension and postretirement plan obligations. The expected rate of return on plan assets assumption is based on capital market assumptions of the long-term expected returns for the investment mix of assets currently in the portfolio. The expected rate of return on plan assets is determined to be the weighted-average of the nominal returns based on the weightings of the classes within the total asset portfolio. Expected health care cost trends represent expected annual rates of change in the cost of health care benefits and are estimated based on analysis of health care cost inflation.
The components of benefit cost related to service cost, interest cost, expected return on plan assets and prior service cost amortization are recorded on a quarterly basis based on actuarial assumptions. In the fourth quarter of each year, or as interim remeasurements are required, we immediately recognize net actuarial gains and losses into earnings as a component of net periodic benefit cost. Recognized net actuarial gains and losses consist primarily of our reported actuarial gains and losses and the difference between the actual return on plan assets and the expected return on plan assets.
62
We recognize the funded status of each plan as either an asset or a liability in the consolidated balance sheets. The funded status is the difference between the fair value of plan assets and the present value of its benefit obligation, determined on a plan-by-plan basis. Our pension plan assets can include assets that are difficult to value. See
Note 7
for detailed information regarding our plan assets.
Income Taxes
Income tax expense for federal, foreign, state and local income taxes is calculated on pre-tax income based on current tax law and includes the cumulative effect of any changes in tax rates from those used previously in determining deferred tax assets and liabilities. We record a valuation allowance to reduce our deferred tax assets to the amount that is more likely than not to be realized. We assess deferred taxes and the adequacy of the valuation allowance on a quarterly basis. In the ordinary course of business, there is inherent uncertainty in quantifying our income tax positions. We assess our income tax positions and record tax benefits for all years subject to examination based upon management's evaluation of the facts, circumstances and information available at the reporting date. For those tax positions where it is more likely than not that a tax benefit will be sustained, we have recorded the largest amount of tax benefit with a greater than 50% likelihood of being realized upon ultimate settlement with a taxing authority that has full knowledge of all relevant information. For those income tax positions where it is not more likely than not that a tax benefit will be sustained, no tax benefit has been recognized in the financial statements. We record interest and penalties (net of any applicable tax benefit) related to income taxes as a component of Provision for Income Taxes on our consolidated statements of income.
We would be subject to withholding taxes if we were to distribute earnings from certain foreign subsidiaries, and unrecognized deferred income tax liabilities, including withholding taxes, would be payable upon distribution of these earnings. We consider the earnings of our non-U.S. subsidiaries to be permanently reinvested.
Inventories
We carry our inventory at the lower of cost or net realizable value using either the weighted average or first-in, first-out methods. At
December 31, 2017
and
2016
, we had inventories totaling
$8.6 million
and
$7.7 million
, respectively, consisting entirely of raw materials and supplies.
Property, Plant and Equipment
We carry our property, plant and equipment at depreciated cost, less any impairment provisions. We depreciate our property, plant and equipment using the straight-line method over estimated economic useful lives of
eight
to
33 years
for buildings and
three
to
14 years
for machinery and equipment. Our depreciation expense was
$47.3 million
,
$48.4 million
and
$55.3 million
for the years ended
December 31, 2017
,
2016
and
2015
, respectively. We expense the costs of maintenance, repairs and renewals that do not materially prolong the useful life of an asset as we incur them.
Property, plant and equipment is stated at cost and is set forth below:
|
|
December 31,
|
|||||||
|
|
2017
|
2016
|
||||||
|
|
(In thousands)
|
|||||||
|
Land
|
$
|
8,695
|
|
$
|
8,596
|
|
||
|
Buildings
|
167,917
|
|
156,848
|
|
||||
|
Machinery and equipment
|
728,630
|
|
697,896
|
|
||||
|
Property under construction
|
107,899
|
|
59,301
|
|
||||
|
1,013,141
|
|
922,641
|
|
|||||
|
Less accumulated depreciation
|
664,512
|
|
622,955
|
|
||||
|
Net Property, Plant and Equipment
|
$
|
348,629
|
|
$
|
299,686
|
|
||
Investments in Unconsolidated Affiliates
We use the equity method of accounting for affiliates in which we are able to exert significant influence. Currently, substantially all of our material investments in affiliates that are not consolidated are recorded using the equity method. Affiliates in which our investment ownership is less than
20%
and where we are unable to exert significant influence are carried at cost.
63
Goodwill
Goodwill represents the excess of the cost of our acquired businesses over the fair value of the net assets acquired. We perform testing of goodwill for impairment annually. We may elect to perform a qualitative test when we believe that there is sufficient excess fair value over carrying value based on our most recent quantitative assessment, adjusted for relevant events and circumstances that could affect fair value during the current year. If we conclude based on this assessment that it is more likely than not that the reporting unit is not impaired, we do not perform a quantitative impairment test. In all other circumstances, we utilize a two-step quantitative impairment test to identify potential goodwill impairment and measure the amount of any goodwill impairment. The first step of the test compares the fair value of a reporting unit with its carrying amount, including goodwill. If the carrying amount of a reporting unit exceeds its fair value, the second step of the goodwill impairment test is performed to measure the amount of the impairment loss, if any. The second step compares the implied fair value of the reporting unit's goodwill with the carrying amount of that goodwill.
The following summarizes the changes in the carrying amount of Goodwill:
|
Nuclear
Operations Group
|
Nuclear
Services
Group
|
Nuclear
Power
Group
|
Total
|
|||||||||||||
|
|
(In thousands)
|
|||||||||||||||
|
Balance at December 31, 2015
|
$
|
110,939
|
|
$
|
45,000
|
|
$
|
12,495
|
|
$
|
168,434
|
|
||||
|
Acquisition of NEC (Note 2)
|
—
|
|
—
|
|
42,532
|
|
42,532
|
|
||||||||
|
Translation
|
—
|
|
—
|
|
(178
|
)
|
(178
|
)
|
||||||||
|
Balance at December 31, 2016
|
$
|
110,939
|
|
$
|
45,000
|
|
$
|
54,849
|
|
$
|
210,788
|
|
||||
|
NEC Purchase Price Allocation Adjustment (Note 2)
|
—
|
|
—
|
|
3,792
|
|
3,792
|
|
||||||||
|
Translation
|
—
|
|
—
|
|
3,751
|
|
3,751
|
|
||||||||
|
Balance at December 31, 2017
|
$
|
110,939
|
|
$
|
45,000
|
|
$
|
62,392
|
|
$
|
218,331
|
|
||||
Intangible Assets
Intangible assets are recognized at fair value when acquired. Intangible assets with definite lives are amortized to operating expense using the straight-line method over their estimated useful lives and tested for impairment when events or changes in circumstances indicate that their carrying amounts may not be recoverable. Intangible assets with indefinite lives are not amortized and are subject to annual impairment testing. We may elect to perform a qualitative assessment when testing indefinite-lived intangible assets for impairment to determine whether events or circumstances affecting significant inputs related to the most recent quantitative evaluation have occurred, indicating that it is more likely than not that the indefinite-lived intangible asset is impaired. Otherwise, we test indefinite-lived intangible assets for impairment by quantitatively determining the fair value of the indefinite-lived intangible asset and comparing the fair value of the intangible asset to its carrying amount. If the carrying amount of the intangible asset exceeds its fair value, we recognize impairment for the amount of the difference.
64
Our Intangible Assets are as follows:
|
|
December 31,
|
|||||||||||
|
|
2017
|
2016
|
2015
|
|||||||||
|
|
(In thousands)
|
|||||||||||
|
Amortized intangible assets:
|
||||||||||||
|
Gross cost:
|
||||||||||||
|
Customer relationships
|
$
|
30,339
|
|
$
|
29,679
|
|
$
|
20,790
|
|
|||
|
CNSC class 1B nuclear facility license
|
27,055
|
|
24,444
|
|
—
|
|
||||||
|
Acquired backlog
|
13,527
|
|
12,592
|
|
—
|
|
||||||
|
Favorable operating lease
|
8,832
|
|
8,222
|
|
—
|
|
||||||
|
Unpatented technology
|
8,379
|
|
8,104
|
|
4,400
|
|
||||||
|
Tradename
|
1,500
|
|
1,500
|
|
1,500
|
|
||||||
|
Patented technology
|
796
|
|
741
|
|
—
|
|
||||||
|
All other
|
2,200
|
|
2,200
|
|
2,200
|
|
||||||
|
Total
|
$
|
92,628
|
|
$
|
87,482
|
|
$
|
28,890
|
|
|||
|
Accumulated amortization:
|
||||||||||||
|
Customer relationships
|
$
|
(11,505
|
)
|
$
|
(10,415
|
)
|
$
|
(9,313
|
)
|
|||
|
CNSC class 1B nuclear facility license
|
(938
|
)
|
(34
|
)
|
—
|
|
||||||
|
Acquired backlog
|
(6,113
|
)
|
(209
|
)
|
—
|
|
||||||
|
Favorable operating lease
|
(459
|
)
|
(16
|
)
|
—
|
|
||||||
|
Unpatented technology
|
(4,456
|
)
|
(3,750
|
)
|
(3,312
|
)
|
||||||
|
Tradename
|
(1,425
|
)
|
(1,275
|
)
|
(1,125
|
)
|
||||||
|
Patented technology
|
(75
|
)
|
(3
|
)
|
—
|
|
||||||
|
All other
|
(1,082
|
)
|
(862
|
)
|
(642
|
)
|
||||||
|
Total
|
$
|
(26,053
|
)
|
$
|
(16,564
|
)
|
$
|
(14,392
|
)
|
|||
|
Net amortized intangible assets
|
$
|
66,575
|
|
$
|
70,918
|
|
$
|
14,498
|
|
|||
|
Unamortized intangible assets:
|
||||||||||||
|
NRC category 1 license
|
$
|
43,830
|
|
$
|
43,830
|
|
$
|
43,830
|
|
|||
The following summarizes the changes in the carrying amount of Intangible Assets:
|
|
Year Ended December 31,
|
|||||||||||
|
|
2017
|
2016
|
2015
|
|||||||||
|
|
(In thousands)
|
|||||||||||
|
Balance at beginning of period
|
$
|
114,748
|
|
$
|
58,328
|
|
$
|
60,227
|
|
|||
|
Acquisition of NEC (Note 2)
|
746
|
|
58,999
|
|
—
|
|
||||||
|
Amortization expense
|
(9,210
|
)
|
(2,174
|
)
|
(1,899
|
)
|
||||||
|
Translation
|
4,121
|
|
(405
|
)
|
—
|
|
||||||
|
Balance at end of period
|
$
|
110,405
|
|
$
|
114,748
|
|
$
|
58,328
|
|
|||
Estimated amortization expense for the next five fiscal years is as follows (in thousands):
|
Year Ended December 31,
|
Amount
|
||
|
2018
|
$
|
9,055
|
|
|
2019
|
$
|
5,195
|
|
|
2020
|
$
|
3,573
|
|
|
2021
|
$
|
3,573
|
|
|
2022
|
$
|
3,573
|
|
65
Deferred Debt Issuance Costs
We have included deferred debt issuance costs in the consolidated balance sheets as a direct deduction from the carrying amount of our debt liability. We amortize deferred debt issuance costs as interest expense over the life of the related debt. The following summarizes the changes in the carrying amount of these assets:
|
|
Year Ended December 31,
|
|||||||||||
|
|
2017
|
2016
|
2015
|
|||||||||
|
|
(In thousands)
|
|||||||||||
|
Balance at beginning of period
|
$
|
5,892
|
|
$
|
6,741
|
|
$
|
9,921
|
|
|||
|
Additions
|
—
|
|
712
|
|
4,893
|
|
||||||
|
Interest expense – debt issuance costs
|
(1,690
|
)
|
(1,561
|
)
|
(1,852
|
)
|
||||||
|
Distributed in connection with the spin-off
|
—
|
|
—
|
|
(6,221
|
)
|
||||||
|
Balance at end of period
|
$
|
4,202
|
|
$
|
5,892
|
|
$
|
6,741
|
|
|||
Capitalization of Interest Cost
We capitalize interest in accordance with FASB Topic
Interest
. We incurred total interest of
$16.5 million
,
$9.1 million
and
$10.9 million
in the years ended
December 31, 2017
,
2016
and
2015
, respectively, of which we capitalized
$1.6 million
,
$0.7 million
and
$0.7 million
in the years ended
December 31, 2017
,
2016
and
2015
, respectively.
Cash and Cash Equivalents and Restricted Cash
Our cash equivalents are highly liquid investments with maturities of three months or less when we purchase them.
We record cash and cash equivalents as restricted when we are unable to freely use such cash and cash equivalents for our general operating purposes. At
December 31, 2017
, we had restricted cash and cash equivalents totaling
$9.7 million
,
$2.6 million
of which was held for future decommissioning of facilities (which is included in Other Assets on our consolidated balance sheets) and
$7.1 million
of which was held to meet reinsurance reserve requirements of our captive insurer.
Derivative Financial Instruments
Our Canadian operations give rise to exposure to market risks from changes in foreign currency exchange ("FX") rates. We use derivative financial instruments, primarily FX forward contracts, to reduce the impact of changes in FX rates on our operating results. We use these instruments primarily to hedge our exposure associated with revenues or costs on our long-term contracts that are denominated in currencies other than our operating entities' functional currencies. We do not hold or issue derivative financial instruments for trading or other speculative purposes.
We enter into derivative financial instruments primarily as hedges of certain firm purchase and sale commitments denominated in foreign currencies. We record these contracts at fair value on our consolidated balance sheets and defer the related gains and losses as a component of Accumulated other comprehensive income until the hedged item is recognized in earnings. Any ineffective portion of a derivative's change in fair value and any portion excluded from the assessment of effectiveness is immediately recognized in Other – net on our consolidated statements of income. The gain or loss on a derivative instrument not designated as a hedging instrument is also immediately recognized in earnings. Gains and losses on derivative financial instruments that require immediate recognition are included as a component of Other – net on our consolidated statements of income.
Self-Insurance
We have a wholly owned insurance subsidiary that provides employer's liability, general and automotive liability and primary workers' compensation insurance and, from time to time, builder's risk insurance (within certain limits) to our companies. We may also, in the future, have this insurance subsidiary accept other risks that we cannot or do not wish to transfer to outside insurance companies. Included in Other Liabilities on our consolidated balance sheets are reserves for self-insurance totaling
$6.2 million
and
$7.2 million
at
December 31, 2017
and
2016
, respectively.
66
Loss Contingencies
We estimate liabilities for loss contingencies when it is probable that a liability has been incurred and the amount of loss is reasonably estimable. We provide disclosure when there is a reasonable possibility that the ultimate loss will exceed the recorded provision or if such probable loss is not reasonably estimable. We are currently involved in some significant litigation, as discussed in
Note 10
. Our losses are typically resolved over long periods of time and are often difficult to assess and estimate due to, among other reasons, the possibility of multiple actions by third parties; the attribution of damages, if any, among multiple defendants; plaintiffs, in most cases involving personal injury claims, do not specify the amount of damages claimed; the discovery process may take multiple years to complete; during the litigation process, it is common to have multiple complex unresolved procedural and substantive issues; the potential availability of insurance and indemnity coverages; the wide-ranging outcomes reached in similar cases, including the variety of damages awarded; the likelihood of settlements for
de minimus
amounts prior to trial; the likelihood of success at trial; and the likelihood of success on appeal. Consequently, it is possible future earnings could be affected by changes in our assessments of the probability that a loss has been incurred in a material pending litigation against us and/or changes in our estimates related to such matters.
Stock-Based Compensation
We expense stock-based compensation in accordance with FASB Topic
Compensation – Stock Compensation.
Under this topic, the fair value of equity-classified awards, such as restricted stock, performance shares and stock options, is determined on the date of grant and is not remeasured. The fair value of liability-classified awards, such as cash-settled stock appreciation rights, restricted stock units and performance units, is determined on the date of grant and is remeasured at the end of each reporting period through the date of settlement. Grant date fair values for restricted stock, restricted stock units, performance shares and performance units are determined using the closing price of our common stock on the date of grant. Grant date fair values for stock options and stock appreciation rights are determined using the Black-Scholes option pricing model ("Black-Scholes"). The determination of the fair value of a share-based payment award using an option-pricing model requires the input of significant assumptions, such as the expected life of the award and stock price volatility.
Under the provisions of this FASB topic, we recognize expense for all share-based awards granted on a straight-line basis over the requisite service periods of the awards, which is generally equivalent to the vesting term. This topic requires compensation expense to be recognized such that compensation expense is recorded only for those awards expected to vest. As a result, we periodically review the amount of actual forfeitures and record any adjustments deemed necessary each reporting period. We also recognize excess tax benefits in our provision for income taxes. These excess tax benefits result from tax deductions in excess of the cumulative compensation expense recognized for options exercised and other equity-classified awards.
Additionally, this FASB topic amended FASB Topic
Statement of Cash Flows
to require excess tax benefits to be classified along with other income tax cash flows as an operating activity. In addition, cash flows related to employee taxes paid for withheld shares are classified as a financing activity.
See
Note 9
for a further discussion of stock-based compensation.
Recently Adopted Accounting Standards
In July 2015, the FASB issued an update to the Topic
Inventory
. This update requires reporting entities measuring inventories under the first-in, first-out or average cost methods to measure inventory at the lower of cost or net realizable value, where net realizable value is "estimated selling prices in the ordinary course of business, less reasonably predictable costs of completion, disposal, and transportation." Inventory was previously required to be measured at the lower of cost or market value, where the measurement of market value had several potential outcomes. On January 1, 2017, we adopted this update. The adoption of these provisions did not have an impact on our financial statements.
New Accounting Standards
In May 2014, the FASB issued the Topic
Revenue from Contracts with Customers
, which supersedes the revenue recognition requirements in the Topic
Revenue Recognition
and most industry specific guidance. The core principle of this guidance is that an entity should recognize revenue to depict the transfer of promised goods or services to customers in an amount that reflects the consideration to which the entity expects to be entitled in exchange for those goods and services. The guidance also outlines a five-step model whereby companies must identify contractual performance obligations and determine whether revenue should be recorded at a point in time or over time.
67
In August 2015, the FASB deferred the effective date of this amendment until 2018. The update may be adopted either retrospectively to each prior period or using the modified retrospective method as a cumulative-effect adjustment on the date of adoption.
During 2017, we completed our assessment of the standard and have analyzed the standard's impact on our contract portfolio, comparing current accounting policies and practices to the requirements of the new standard and identifying potential differences from applying the requirements of the new standard to our contracts. We developed processes to ensure adequate analysis of our contracts, and we designed and implemented specific controls over our evaluation of the impact as well as the cumulative effect of adopting the standard.
While the new revenue standard may impact the timing of when we recognize revenue and profit, it will not impact the timing of cash flows associated with our contracts, and the overall revenue and profit recognized on our contracts will not change.
Within our Nuclear Operations Group segment, we will continue to recognize revenue over time, and we will measure progress on performance obligations using a cost-to-cost method. Historically, we utilized man-hours or a cost-to-cost method to measure progress on certain of our units of account within this segment. The performance obligations identified for recognizing revenue will be similar to our historical units of account. As a result of the change to a cost-to-cost method, the timing of revenue recognition on affected contracts will, in the aggregate, result in the recognition of revenue and cost of operations earlier in the process of satisfying performance obligations. The new standard will also result in a reduction in both our contracts in progress and advanced billings on contracts account balances upon adoption as a result of measuring the asset and liability at the contract level and using a cost-to-cost method for measuring progress on performance obligations.
The impact of the adoption of the new revenue standard on our Nuclear Power Group and Nuclear Services Group segments will not have a material impact on our financial statements.
We intend to utilize the modified retrospective method for adopting the new revenue recognition standard. This method requires that we recognize a cumulative catch-up adjustment upon adoption (January 1, 2018) to adjust the contract-to-date revenue and costs to the amounts that would have been recognized under the new revenue recognition standard as illustrated below:
|
|
December 31,
|
January 1,
|
||||||
|
|
2017
|
2018
|
||||||
|
|
(In thousands)
|
|||||||
|
Assets:
|
||||||||
|
Contracts in progress
|
$
|
420,628
|
|
$
|
262,314
|
|
||
|
Deferred Income Taxes
|
$
|
86,740
|
|
$
|
85,193
|
|
||
|
Liabilities:
|
||||||||
|
Accrued liabilities – other
|
$
|
64,738
|
|
$
|
66,699
|
|
||
|
Advance billings on contracts
|
$
|
246,192
|
|
$
|
73,468
|
|
||
|
Equity:
|
||||||||
|
Retained earnings
|
$
|
990,652
|
|
$
|
1,001,554
|
|
||
As a result of the adoption of the new revenue recognition standard in 2018, we will also be required to expand our disclosures to include tabular disaggregation of our revenues. We intend to disclose revenue for each segment by geographical area and customer type, by timing of transfer of goods or services and by contract type. In addition, we intend to disclose the nature, timing and uncertainty of revenue, cash flow and customer contract balances, including how and when we satisfy our performance obligations and the relationship between revenue recognition and changes in contract balances during a reporting period.
In February 2016, the FASB issued an update to the Topic
Leases
, which supersedes the lease reporting requirements in Topic
Leases
(previously "FAS 13"). This update requires that a lessee recognize on its balance sheet the assets and liabilities for all leases with lease terms of more than 12 months, along with additional qualitative and quantitative disclosures. The effect of leases in a consolidated statement of income and a consolidated statement of cash flows is expected to be largely unchanged. Accounting by lessors was not significantly impacted by this update. This update will be effective for us in 2019, with early adoption permitted. We are currently evaluating the impact of the adoption of this standard on our financial statements.
68
In October 2016, the FASB issued an update to the Topic
Statement of Cash Flows.
This update clarifies guidance on the classification and presentation of restricted cash in the statement of cash flows. Restricted cash will now be included in the cash and cash equivalent balances in the statement of cash flows. Reconciliations between the balance sheet and the statement of cash flows, along with additional disclosures if certain criteria are met, are now required as well. This update is applicable to us and will be effective for interim periods beginning in 2018, with early adoption permitted. This update will affect the presentation of restricted cash and cash equivalents on the statement of cash flows, but will otherwise not have a material impact to our financial statements.
In March 2017, the FASB issued an update to the Topic
Compensation – Retirement Benefits
. This update amends the guidance on the consolidated statement of income presentation of the components of net periodic benefit cost related to defined benefit pension and postretirement plans. Under current GAAP, components of net periodic benefit cost are aggregated and reported net in the consolidated statements of income as part of operating income. This update requires entities to disaggregate the service cost component of net periodic benefit cost and present it with other current compensation costs within operating income. Other components of net periodic benefit cost are required to be classified outside of operating income within the consolidated statements of income. These changes to classification within the consolidated statements of income will result in no changes to net income. This update will be effective for us in 2018 with retrospective presentation. The impact of this update on our consolidated statements of income for the years ended December 31, 2017, 2016 and 2015 would be reductions (increases) of Operating Income, along with corresponding increases (reductions) to Other Income (Expense), of
$16.7 million
,
$4.8 million
and
$(30.2) million
, respectively, inclusive of Mark to Market losses of
$11.0 million
,
$21.5 million
and
$54.7 million
, respectively.
NOTE
2
– ACQUISITIONS
GE Hitachi Nuclear Energy Canada Inc. Acquisition
On December 16, 2016, our subsidiary BWXT Canada Ltd. acquired the outstanding stock of the GE Hitachi Nuclear Energy Canada Inc. ("GEH-C") joint venture. Total consideration included CAD
157.9 million
(
$117.8 million
U.S. Dollar equivalent) paid in the fourth quarter of 2016 and a working capital adjustment of CAD 1.0 million ($0.7 million U.S. Dollar equivalent) paid in May 2017. Upon acquisition, GEH-C was renamed BWXT Nuclear Energy Canada Inc. ("NEC"). NEC is a leading supplier of nuclear fuel, fuel handling systems, tooling delivery systems and replacement components for CANDU reactors and has approximately
350
employees. NEC operates
two
facilities licensed by the CNSC to fabricate natural uranium fuel in Peterborough and Toronto, Ontario, Canada as well as a third facility in Arnprior, Ontario, Canada. The acquisition of NEC expanded our existing commercial nuclear products and services portfolio, allowing us to leverage our technology-based competencies in offering new products and services related to plant life extensions as well as the ongoing maintenance of nuclear power generation equipment. NEC is reported within our Nuclear Power Group segment.
69
The purchase price of the acquisition has been allocated among assets acquired and liabilities assumed at fair value, with the excess purchase price recorded as goodwill. During the year ended December 31, 2017, we adjusted our purchase price allocation, which included adjustments to the value of contracts in progress of
$(1.6) million
, property, plant and equipment of
$(3.0) million
, intangible assets of
$0.7 million
and certain other assets and liabilities, with a resulting increase to goodwill of
$3.8 million
. Our purchase price allocation is as follows:
|
NEC
|
||||
|
(In thousands)
|
||||
|
Accounts receivable – trade
|
$
|
15,659
|
|
|
|
Accounts receivable – other
|
1,359
|
|
||
|
Contracts in progress
|
19,956
|
|
||
|
Other current assets
|
84
|
|
||
|
Property, plant and equipment
|
21,356
|
|
||
|
Goodwill
|
46,324
|
|
||
|
Intangible assets
|
59,745
|
|
||
|
Total assets acquired
|
$
|
164,483
|
|
|
|
Accounts payable
|
$
|
3,922
|
|
|
|
Accrued employee benefits
|
1,965
|
|
||
|
Accrued liabilities – other
|
3,184
|
|
||
|
Accrued warranty expense
|
282
|
|
||
|
Accumulated postretirement benefit obligation
|
5,695
|
|
||
|
Environmental liabilities
|
18,505
|
|
||
|
Pension liability
|
1,054
|
|
||
|
Other liabilities
|
11,381
|
|
||
|
Total liabilities assumed
|
$
|
45,988
|
|
|
|
Net assets acquired
|
$
|
118,495
|
|
|
|
Amount of tax deductible goodwill
|
$
|
—
|
|
|
The intangible assets included above consist of the following (dollar amounts in thousands):
|
Amount
|
Amortization Period
|
|||||
|
CNSC class 1B nuclear facility license
|
$
|
25,360
|
|
30 years
|
||
|
Backlog
|
$
|
12,680
|
|
2 years
|
||
|
Customer relationships
|
$
|
8,951
|
|
14 years
|
||
|
Favorable operating lease
|
$
|
8,279
|
|
20 years
|
||
|
Unpatented technology
|
$
|
3,729
|
|
15 years
|
||
|
Patented technology
|
$
|
746
|
|
11 years
|
||
Our consolidated financial statements for the year ended December 31, 2016 include
$2.9 million
of revenues and
$(0.7) million
of net income (loss) related to NEC operations occurring from the acquisition date to December 31, 2016. Additionally, the following unaudited pro forma financial information presents our results of operations for the years ended December 31, 2016 and 2015 had the acquisition of NEC occurred on January 1, 2015. The unaudited pro forma financial information below is not intended to represent or be indicative of our actual consolidated results had we completed the acquisition at January 1, 2015. This information is presented for comparative purposes only and should not be taken as representative of our future consolidated results of operations.
70
|
Year Ended December 31,
|
||||||||
|
2016
|
2015
|
|||||||
|
(In thousands, except per share amounts)
|
||||||||
|
Revenues
|
$
|
1,630,069
|
|
$
|
1,513,768
|
|
||
|
Net Income Attributable to BWX Technologies, Inc.
|
$
|
182,074
|
|
$
|
129,112
|
|
||
|
Basic Earnings per Common Share
|
$
|
1.78
|
|
$
|
1.21
|
|
||
|
Diluted Earnings per Common Share
|
$
|
1.75
|
|
$
|
1.20
|
|
||
The unaudited pro forma results include the following pre-tax adjustments to the historical results presented above:
|
•
|
Increase in amortization expense related to timing of amortization of the fair value of identifiable intangible assets acquired of approximately
$7.7 million
and
$8.3 million
for the years ended December 31, 2016 and 2015, respectively.
|
|
•
|
Elimination of historical interest income of approximately
$0.4 million
and
$0.5 million
for the years ended December 31, 2016 and 2015, respectively.
|
|
•
|
Additional interest expense associated with the incremental borrowings that would have been incurred to acquire NEC as of January 1, 2015 of approximately
$2.1 million
and
$2.5 million
for the years ended December 31, 2016 and 2015, respectively.
|
|
•
|
Additional accretion associated with asset retirement obligations of approximately
$1.5 million
and
$1.6 million
for the years ended December 31, 2016 and 2015, respectively.
|
|
•
|
Additional depreciation expense associated with the fair value adjustment of property, plant and equipment of approximately
$1.0 million
for the years ended December 31, 2016 and 2015.
|
|
•
|
Elimination of
$6.8 million
in acquisition related costs recognized in the year ended December 31, 2016 that are not expected to be recurring.
|
NOTE
3
– DISCONTINUED OPERATIONS
Spin-off of BWE
On June 30, 2015, we completed the spin-off of BWE to our stockholders through a stock distribution. BWE's assets and business primarily consist of those that we previously reported as our Power Generation segment. In connection with the spin-off, our stockholders received
100%
of the outstanding common stock of BWE. Prior to the completion of the spin-off, we made a cash payment to BWE totaling
$132 million
. In order to effect the distribution and govern our relationship with BWE after the distribution, we entered into a master separation agreement with BWE. In addition to the master separation agreement, we entered into other agreements with BWE in connection with the distribution, including a tax sharing agreement and transition services agreements.
Master Separation Agreement
The master separation agreement between us and BWE contains the key provisions relating to the separation of our former Power Generation business from us and the distribution of shares of BWE common stock. The master separation agreement identifies the assets that were transferred, liabilities that were assumed and contracts that were assigned to BWE by us or by BWE to us in the spin-off and describes how these transfers, assumptions and assignments occurred. Under the master separation agreement we also agreed to indemnify BWE against various claims and liabilities related to the past operation of our business (other than BWE's business).
At the spin-off, we had outstanding performance guarantees for various projects executed by BWE in the normal course of business. These guarantees totaled
$1,542 million
and had expiration dates from
2015
to
2035
. In February 2016, BWE notified us that we have been released from substantially all remaining performances guarantees. Accordingly, we reduced the outstanding liability and recorded a gain of approximately
$9.3 million
during the year ended December 31, 2016 as a component of Other – net on our consolidated statement of income.
71
Tax Sharing Agreement
We and BWE have entered into an agreement providing for the sharing of taxes incurred before and after the distribution, various indemnification rights with respect to tax matters and restrictions to preserve the tax-free status of the distribution. Under the terms of the tax sharing agreement we entered into in connection with the spin-off, we will generally be responsible for
60%
of any taxes imposed on us or BWE and its subsidiaries in the event that the spin-off and/or certain related preparatory transactions were to fail to qualify for tax-free treatment. However, if the spin-off and/or certain related preparatory transactions were to fail to qualify for tax-free treatment because of actions or failures to act by BWE, we would not be responsible for the related taxes associated with these actions. Conversely, if the spin-off and/or certain related preparatory transactions were to fail to qualify for tax-free treatment because of actions or failures to act by us, we would be responsible for all related taxes associated with these actions.
Financial Information
The following table presents selected financial information regarding the results of operations of our former Power Generation business through June 30, 2015 with certain tax related adjustments made during the six month period ended December 31, 2015:
|
|
Year Ended December 31,
|
|||
|
|
2015
|
|||
|
|
(In thousands)
|
|||
|
Revenues
|
$
|
830,234
|
|
|
|
Costs and Expenses:
|
||||
|
Cost of operations
|
665,558
|
|
||
|
Research and development costs
|
8,480
|
|
||
|
Losses on asset disposals and impairments
|
8,963
|
|
||
|
Selling, general and administrative expenses
(1)
|
108,911
|
|
||
|
Special charges for restructuring activities
|
7,666
|
|
||
|
Costs to spin-off
|
34,358
|
|
||
|
Total Costs and Expenses
|
833,936
|
|
||
|
Equity in Income (Loss) of Investees
|
(1,104
|
)
|
||
|
Operating Income (Loss)
|
(4,806
|
)
|
||
|
Other Income (Loss)
|
(1,693
|
)
|
||
|
Income (Loss) before Provision for Income Taxes
|
(6,499
|
)
|
||
|
Provision for Income Taxes
|
2,704
|
|
||
|
Net Income (Loss)
|
(9,203
|
)
|
||
|
Net Income Attributable to Noncontrolling Interest
|
(106
|
)
|
||
|
Income (Loss) from Discontinued Operations
|
$
|
(9,309
|
)
|
|
|
(1)
|
Included in selling, general and administrative expenses is an allocation of corporate administrative expenses of
$28.0 million
for the year ended December 31, 2015.
|
We incurred approximately
$66.5 million
in total costs related to the spin-off, which included approximately
$29.8 million
for professional services and
$23.1 million
of retention and severance-related charges. The majority of the remaining costs related to the separation of our facilities and related infrastructure including our information technology systems. Income from discontinued operations for the year ended December 31, 2015 included
$34.4 million
of these charges, and included in continuing operations were spin-off costs of
$26.0 million
for the year ended December 31, 2015.
72
The following table presents selected financial information regarding cash flows of our former Power Generation business that are included in the consolidated statements of cash flows:
|
|
Year Ended December 31,
|
|||
|
|
2015
|
|||
|
|
(In thousands)
|
|||
|
Non-cash items included in net income (loss):
|
||||
|
Depreciation and amortization
|
$
|
21,458
|
|
|
|
Income (loss) of investees, net of dividends
|
$
|
(2,293
|
)
|
|
|
Losses on asset disposals and impairments, net
|
$
|
10,544
|
|
|
|
Purchases of property, plant and equipment
|
$
|
11,494
|
|
|
NOTE
4
– EQUITY METHOD INVESTMENTS
We have investments in entities that we account for using the equity method. Our share of the undistributed earnings of our equity method investees were
$5.9 million
and
$8.1 million
at
December 31, 2017
and
2016
, respectively.
The following tables summarize combined balance sheet and income statement information for investments accounted for under the equity method:
|
|
December 31,
|
|||||||
|
|
2017
|
2016
|
||||||
|
|
(In thousands)
|
|||||||
|
Current assets
|
$
|
261,467
|
|
$
|
233,546
|
|
||
|
Noncurrent assets
|
1,891
|
|
—
|
|
||||
|
Total Assets
|
$
|
263,358
|
|
$
|
233,546
|
|
||
|
Current liabilities
|
$
|
137,623
|
|
$
|
119,633
|
|
||
|
Owners' equity
|
125,735
|
|
113,913
|
|
||||
|
Total Liabilities and Owners' Equity
|
$
|
263,358
|
|
$
|
233,546
|
|
||
|
|
Year Ended December 31,
|
|||||||||||
|
|
2017
|
2016
|
2015
|
|||||||||
|
|
(In thousands)
|
|||||||||||
|
Revenues
|
$
|
678,080
|
|
$
|
693,441
|
|
$
|
624,756
|
|
|||
|
Gross profit
|
$
|
35,081
|
|
$
|
38,858
|
|
$
|
33,397
|
|
|||
|
Net Income
|
$
|
35,081
|
|
$
|
38,862
|
|
$
|
33,406
|
|
|||
Reimbursable costs recorded in revenues by the unconsolidated joint ventures in our Nuclear Services Group segment totaled
$638.4 million
,
$671.0 million
and
$583.5 million
for the years ended
December 31, 2017
,
2016
and
2015
, respectively.
Income taxes for the investees are the responsibility of the respective owners. Accordingly,
no
provision for income taxes has been recorded by the investees.
Reconciliations of net income per combined income statement information of our investees to equity in income of investees per our consolidated statements of income are as follows:
|
|
Year Ended December 31,
|
|||||||||||
|
|
2017
|
2016
|
2015
|
|||||||||
|
|
(In thousands)
|
|||||||||||
|
Equity income based on stated ownership percentages
|
$
|
13,412
|
|
$
|
16,480
|
|
$
|
14,011
|
|
|||
|
Timing of GAAP and other adjustments
|
200
|
|
(411
|
)
|
(615
|
)
|
||||||
|
Equity in income of investees
|
$
|
13,612
|
|
$
|
16,069
|
|
$
|
13,396
|
|
|||
73
Our transactions with unconsolidated affiliates were as follows:
|
|
Year Ended December 31,
|
|||||||||||
|
|
2017
|
2016
|
2015
|
|||||||||
|
|
(In thousands)
|
|||||||||||
|
Sales to
|
$
|
22,259
|
|
$
|
24,870
|
|
$
|
18,458
|
|
|||
|
Dividends received
|
$
|
16,132
|
|
$
|
15,052
|
|
$
|
13,050
|
|
|||
|
Capital contributions, net of returns
|
$
|
2,789
|
|
$
|
9,165
|
|
$
|
200
|
|
|||
NOTE
5
– INCOME TAXES
We are subject to federal income tax in the U.S. and Canada as well as income tax within multiple U.S. state jurisdictions. We provide for income taxes based on the enacted tax laws and rates in the jurisdictions in which we conduct our operations. These jurisdictions may have regimes of taxation that vary with respect to nominal rates and with respect to the basis on which these rates are applied. This variation, along with the changes in our mix of income within these jurisdictions, can contribute to shifts in our effective tax rate from period to period.
On December 22, 2017, H.R. 1, the Tax Cuts and Jobs Act (the "Act") was enacted, making significant changes to existing U.S. tax laws that impact BWXT, including, but not limited to, a reduction to the U.S. corporate income tax rate from 35% to 21% for tax years beginning after December 31, 2017, a one-time transition tax on certain undistributed foreign earnings and additional deduction limitations on executive compensation. We have obtained and analyzed all necessary information to record the effect of the change in tax law resulting from the Act and have recognized the income tax effects in our 2017 financial statements. Upon completion of our 2017 U.S. income tax return in 2018, we may identify additional remeasurement adjustments to our recorded deferred tax assets. Additionally, should the Internal Revenue Service and/or state taxing authorities issue further guidance, interpretations or legislative changes related to certain aspects of the new tax law, we may have future adjustments to record. Our Canadian operations continue to be subject to tax at a local statutory rate of approximately
25%
.
We are currently under audit by various state and international authorities. With few exceptions, we do not have any returns under examination for years prior to 2014.
We apply the provisions of FASB Topic
Income Taxes
regarding the treatment of uncertain tax positions. A reconciliation of unrecognized tax benefits (exclusive of interest and federal and state benefits) is as follows:
|
|
Year Ended December 31,
|
|||||||||||
|
|
2017
|
2016
|
2015
|
|||||||||
|
|
(In thousands)
|
|||||||||||
|
Balance at beginning of period
|
$
|
1,651
|
|
$
|
2,222
|
|
$
|
8,597
|
|
|||
|
Increases based on tax positions taken in the current year
|
—
|
|
—
|
|
185
|
|
||||||
|
Increases based on tax positions taken in the prior years
|
—
|
|
—
|
|
—
|
|
||||||
|
Decreases based on tax positions taken in the prior years
|
—
|
|
—
|
|
(134
|
)
|
||||||
|
Decreases due to settlements with tax authorities
|
—
|
|
(571
|
)
|
(5,934
|
)
|
||||||
|
Decreases due to lapse of applicable statute of limitation
|
—
|
|
—
|
|
(492
|
)
|
||||||
|
Other, net
|
29
|
|
—
|
|
—
|
|
||||||
|
Balance at end of period
|
$
|
1,680
|
|
$
|
1,651
|
|
$
|
2,222
|
|
|||
The unrecognized tax benefits balance of
$1.7 million
at
December 31, 2017
would reduce our effective tax rate if recognized.
We believe that, within the next 12 months, it is reasonably possible that our previously unrecognized tax benefits could decrease by
$1.4 million
.
74
Deferred income taxes reflect the net tax effects of temporary differences between the financial and tax bases of assets and liabilities. Deferred tax assets and liabilities are measured based on the enacted tax rates that will apply in the years in which the temporary differences are expected to be recovered or paid. As such, we have remeasured our U.S. deferred tax assets and liabilities based on the reduction of the U.S. corporate income tax rate from 35% to 21% as a result of the passage of the Act in 2017. This remeasurement resulted in a total decrease in our net deferred tax asset position of
$49.5 million
. Significant components of deferred tax assets and liabilities as of
December 31, 2017
and
2016
were as follows:
|
|
December 31,
|
|||||||
|
|
2017
|
2016
|
||||||
|
|
(In thousands)
|
|||||||
|
Deferred tax assets:
|
||||||||
|
Pension liability
|
$
|
59,229
|
|
$
|
129,603
|
|
||
|
Accrued warranty expense
|
3,482
|
|
3,868
|
|
||||
|
Accrued vacation pay
|
6,557
|
|
9,892
|
|
||||
|
Accrued liabilities for self-insurance (including postretirement health care benefits)
|
6,355
|
|
7,663
|
|
||||
|
Accrued liabilities for executive and employee incentive compensation
|
8,647
|
|
20,670
|
|
||||
|
Environmental and products liabilities
|
17,195
|
|
34,798
|
|
||||
|
Investments in joint ventures and affiliated companies
|
8,343
|
|
15,067
|
|
||||
|
Long-term contracts
|
4,057
|
|
10,039
|
|
||||
|
State tax net operating loss carryforward
|
8,460
|
|
5,573
|
|
||||
|
Tax credit carryforward
|
1,016
|
|
160
|
|
||||
|
Other
|
8,638
|
|
9,373
|
|
||||
|
Total deferred tax assets
|
131,979
|
|
246,706
|
|
||||
|
Valuation allowance for deferred tax assets
|
(15,252
|
)
|
(17,226
|
)
|
||||
|
Deferred tax assets
|
116,727
|
|
229,480
|
|
||||
|
Deferred tax liabilities:
|
||||||||
|
Property, plant and equipment
|
11,573
|
|
10,249
|
|
||||
|
Long-term contracts
|
—
|
|
11,920
|
|
||||
|
Intangibles
|
27,875
|
|
35,920
|
|
||||
|
Other
|
—
|
|
—
|
|
||||
|
Total deferred tax liabilities
|
39,448
|
|
58,089
|
|
||||
|
Net deferred tax assets
|
$
|
77,279
|
|
$
|
171,391
|
|
||
Income from continuing operations before provision for income taxes and noncontrolling interest were as follows:
|
|
Year Ended December 31,
|
|||||||||||
|
|
2017
|
2016
|
2015
|
|||||||||
|
|
(In thousands)
|
|||||||||||
|
U.S.
|
$
|
255,194
|
|
$
|
215,572
|
|
$
|
211,285
|
|
|||
|
Other than U.S.
|
40,586
|
|
41,696
|
|
9,780
|
|
||||||
|
Income before Provision for Income Taxes
|
$
|
295,780
|
|
$
|
257,268
|
|
$
|
221,065
|
|
|||
75
The components of Provision for Income Taxes were as follows:
|
|
Year Ended December 31,
|
|||||||||||
|
|
2017
|
2016
|
2015
|
|||||||||
|
|
(In thousands)
|
|||||||||||
|
Current:
|
||||||||||||
|
U.S. – federal
|
$
|
26,632
|
|
$
|
73,383
|
|
$
|
95,854
|
|
|||
|
U.S. – state and local
|
3,023
|
|
3,068
|
|
3,498
|
|
||||||
|
Other than U.S.
|
24,299
|
|
4,436
|
|
(2,170
|
)
|
||||||
|
Total current
|
53,954
|
|
80,887
|
|
97,182
|
|
||||||
|
Deferred:
|
||||||||||||
|
U.S. – federal
|
107,844
|
|
(12,665
|
)
|
(25,981
|
)
|
||||||
|
U.S. – state and local
|
(158
|
)
|
222
|
|
3,423
|
|
||||||
|
Other than U.S.
|
(14,225
|
)
|
5,212
|
|
5,792
|
|
||||||
|
Total deferred
|
93,461
|
|
(7,231
|
)
|
(16,766
|
)
|
||||||
|
Provision for Income Taxes
|
$
|
147,415
|
|
$
|
73,656
|
|
$
|
80,416
|
|
|||
The following is a reconciliation of our income tax provision related to continuing operations from the U.S. statutory federal tax rate (
35%
) to our consolidated effective tax rate:
|
|
Year Ended December 31,
|
||||||||
|
|
2017
|
2016
|
2015
|
||||||
|
U.S. federal statutory tax rate
|
35.0
|
%
|
35.0
|
%
|
35.0
|
%
|
|||
|
State and local income taxes
|
1.2
|
%
|
0.8
|
%
|
3.3
|
%
|
|||
|
Foreign rate differential
|
(1.4
|
)%
|
(1.5
|
)%
|
(0.4
|
)%
|
|||
|
Foreign operations
|
—
|
%
|
(1.4
|
)%
|
1.7
|
%
|
|||
|
Excess tax deductions on equity compensation
|
(2.0
|
)%
|
(0.9
|
)%
|
—
|
%
|
|||
|
Impact of U.S. Tax Cuts & Jobs Act
|
17.7
|
%
|
—
|
%
|
—
|
%
|
|||
|
Manufacturing deduction
|
(1.4
|
)%
|
(2.6
|
)%
|
(2.9
|
)%
|
|||
|
Minority interest
|
(0.1
|
)%
|
(1.9
|
)%
|
0.3
|
%
|
|||
|
Other
|
0.8
|
%
|
1.1
|
%
|
(0.6
|
)%
|
|||
|
Effective tax rate
|
49.8
|
%
|
28.6
|
%
|
36.4
|
%
|
|||
At
December 31, 2017
, we had a valuation allowance of
$15.3 million
for deferred tax assets, which we expect cannot be realized through carrybacks, future reversals of existing taxable temporary differences and our estimate of future taxable income. We believe that our remaining deferred tax assets are more likely than not realizable through carrybacks, future reversals of existing taxable temporary differences and our estimate of future taxable income. Any changes to our estimated valuation allowance could be material to our consolidated financial statements. As a result of the passage of the Act, we have remeasured our valuation allowances based on the reduction of the U.S. corporate income tax rate from 35% to 21%. This remeasurement resulted in a total decrease in our valuation allowances of
$3.7 million
.
The following is an analysis of our valuation allowance for deferred tax assets:
|
Beginning
Balance
|
Charges To
Costs and
Expenses
|
Charged To
Other
Accounts
|
Ending
Balance
|
|||||||||||
|
|
(In thousands)
|
|||||||||||||
|
Year Ended December 31, 2017
|
$
|
(17,226
|
)
|
2,544
|
|
(570
|
)
|
$
|
(15,252
|
)
|
||||
|
Year Ended December 31, 2016
|
$
|
(17,752
|
)
|
(760
|
)
|
1,286
|
|
$
|
(17,226
|
)
|
||||
|
Year Ended December 31, 2015
|
$
|
(14,239
|
)
|
(3,513
|
)
|
—
|
|
$
|
(17,752
|
)
|
||||
We have state net operating losses of
$10.6 million
(
$8.4 million
net of federal tax benefit) available to offset future taxable income in various states. Our state net operating loss carryforwards begin to expire in the year
2018
. We are carrying a valuation allowance of
$9.4 million
(
$7.4 million
, net of federal tax benefit) against the deferred tax asset related to the state loss carryforwards.
76
We would be subject to withholding taxes if we were to distribute earnings from certain foreign subsidiaries. For the year ended
December 31, 2017
, the undistributed earnings of these subsidiaries were approximately
$89.2 million
. As of
December 31, 2017
, our unrecognized deferred income tax liabilities of approximately
$4.5 million
would be payable upon the distribution of these earnings. All of our foreign earnings are considered indefinitely reinvested.
NOTE
6
– LONG-TERM DEBT
Our Long-Term Debt consists of the following:
|
|
December 31,
|
|||||||
|
|
2017
|
2016
|
||||||
|
|
(In thousands)
|
|||||||
|
Secured Debt:
|
||||||||
|
Revolving Credit Facility
|
$
|
—
|
|
$
|
—
|
|
||
|
Term Loan
|
270,000
|
|
285,000
|
|
||||
|
Incremental Term Loans
|
243,131
|
|
245,986
|
|
||||
|
Less: Amounts due within one year
|
27,870
|
|
27,370
|
|
||||
|
Long-Term Debt, gross
|
485,261
|
|
503,616
|
|
||||
|
Less: Deferred debt issuance costs
|
4,202
|
|
5,892
|
|
||||
|
Long-Term Debt
|
$
|
481,059
|
|
$
|
497,724
|
|
||
Maturities of Long-Term Debt during the five years subsequent to
December 31, 2017
were as follows:
2018
–
$27.9 million
;
2019
–
$27.9 million
;
2020
–
$457.4 million
;
2021
–
$0.0 million
; and
2022
–
$0.0 million
.
Credit Facility
On September 2, 2016, we entered into an amendment (the "Amendment") to our Credit Agreement dated May 11, 2015 with Bank of America, N.A., as administrative agent, and certain lenders and letter of credit issuers party thereto (collectively, the "Amended Credit Agreement"). Prior to the Amendment, our Credit Agreement provided for a
five
-year, senior secured revolving credit facility in an aggregate amount of up to
$400 million
, the full amount of which was available for the issuance of letters of credit, and a senior secured term loan facility of
$300 million
, which was drawn on June 30, 2015. The Amendment added a new U.S. dollar term loan facility in an aggregate principal amount of up to
$112.5 million
, which was drawn on September 16, 2016, and a new Canadian dollar term loan facility in an aggregate principal amount of up to the equivalent of
$137.5 million
U.S. dollars, which was drawn on December 12, 2016 (collectively, the "Incremental Term Loans"). All obligations under the Amended Credit Agreement are scheduled to mature on June 30, 2020. The proceeds of loans under the Amended Credit Agreement are available for working capital needs and other general corporate purposes.
The Amended Credit Agreement includes provisions for additional financial institutions to become lenders, or for any existing lender to increase its commitment thereunder, subject to an aggregate maximum of
$250 million
for all additional term loans, revolving credit borrowings and letter of credit commitments.
The Amended Credit Agreement is (1) guaranteed by substantially all of our wholly owned domestic subsidiaries, excluding our captive insurance subsidiary, and (2) secured by first-priority liens on certain assets owned by us and the guarantors (other than our subsidiaries comprising our Nuclear Operations Group and a portion of our Nuclear Services Group segments).
The Amended Credit Agreement requires interest payments on revolving loans on a periodic basis until maturity. We began making quarterly amortization payments on the
$300 million
term loan in an amount equal to
1.25%
of the aggregate principal amount in the first quarter of 2016. We began making quarterly amortization payments on the U.S. dollar term loan facility in an amount equal to
1.25%
of the aggregate principal amount in the fourth quarter of 2016. We began making quarterly amortization payments on the Canadian dollar term loan facility in an amount equal to
1.25%
of the aggregate principal amount in the first quarter of 2017. We may prepay all loans under the Amended Credit Agreement at any time without premium or penalty (other than customary Eurocurrency rate breakage costs), subject to notice requirements.
The Amended Credit Agreement includes financial covenants that are tested on a quarterly basis, based on the rolling four-quarter period that ends on the last day of each fiscal quarter. The maximum permitted leverage ratio is
3.00
to 1.00, which may be increased to
3.25
to 1.00 for up to four consecutive fiscal quarters after a material acquisition. The minimum
77
consolidated interest coverage ratio is
4.00
to 1.00. In addition, the Amended Credit Agreement contains various restrictive covenants, including with respect to debt, liens, investments, mergers, acquisitions, dividends, equity repurchases and asset sales. At
December 31, 2017
, we were in compliance with all covenants set forth in the Amended Credit Agreement.
Outstanding loans under the Amended Credit Agreement bear interest at our option at either the Eurocurrency rate plus a margin ranging from
1.25%
to
1.75%
per year or the base rate (the highest of the Federal Funds rate plus
0.50%
, the one-month Eurocurrency rate plus
1.0%
, or the administrative agent's prime rate) plus a margin ranging from
0.25%
to
0.75%
per year. We are charged a commitment fee on the unused portion of the revolving credit facility, and that fee varies between
0.15%
and
0.25%
per year. Additionally, we are charged a letter of credit fee of between
1.25%
and
1.75%
per year with respect to the amount of each financial letter of credit issued under the Amended Credit Agreement, and a letter of credit fee of between
0.75%
and
1.05%
per year is charged with respect to the amount of each performance letter of credit issued under the Amended Credit Agreement. The applicable margin for loans, the commitment fee and the letter of credit fees set forth above will vary quarterly based on our leverage ratio. Based on the leverage ratio applicable at
December 31, 2017
, the margin for Eurocurrency rate and base rate loans was
1.375%
and
0.375%
, respectively, the letter of credit fee for financial letters of credit and performance letters of credit was
1.375%
and
0.825%
, respectively, and the commitment fee for the unused portion of the revolving credit facility was
0.175%
.
Upon the closing of the Credit Agreement and the subsequent Amendment, we paid certain upfront fees to the lenders thereunder, and paid arrangement and other fees to the arrangers and agents of the Amended Credit Agreement.
At
December 31, 2017
, borrowings outstanding totaled
$513.1 million
and
$0.0 million
under our term loans and revolving line of credit, respectively, and letters of credit issued under the Amended Credit Agreement totaled
$75.9 million
. As a result, we had
$324.1 million
available for borrowings or to meet letter of credit requirements as of
December 31, 2017
, excluding the additional
$250 million
available to us for term loan, revolving credit borrowings and letter of credit commitments. As of
December 31, 2017
, the weighted-average interest rate on outstanding borrowings under our Amended Credit Agreement was
2.90%
.
The Amended Credit Agreement generally includes customary events of default for a secured credit facility, some of which allow for an opportunity to cure. If an event of default relating to bankruptcy or other insolvency events occurs under the Amended Credit Agreement, all obligations under the Amended Credit Agreement will immediately become due and payable. If any other event of default exists under the Amended Credit Agreement, the lenders will be permitted to accelerate the maturity of the obligations outstanding under the Amended Credit Agreement. If any event of default occurs under the Amended Credit Agreement, the lenders will be permitted to terminate their commitments thereunder and exercise other rights and remedies, including the commencement of foreclosure or other actions against the collateral.
If any default occurs under the Amended Credit Agreement, or if we are unable to make any of the representations and warranties in the Amended Credit Agreement, we will be unable to borrow funds or have letters of credit issued under the Amended Credit Agreement.
Other Arrangements
We have posted surety bonds to support regulatory and contractual obligations for certain decommissioning responsibilities, projects and legal matters. We utilize bonding facilities to support such obligations, but the issuance of bonds under those facilities is typically at the surety's discretion. Although there can be no assurance that we will maintain our surety bonding capacity, we believe our current capacity is adequate to support our existing requirements for the next twelve months. In addition, these bonds generally indemnify the beneficiaries should we fail to perform our obligations under the applicable agreements. We, and certain of our subsidiaries, have jointly executed general agreements of indemnity in favor of surety underwriters relating to surety bonds those underwriters issue. As of
December 31, 2017
, bonds issued and outstanding under these arrangements totaled approximately
$60.8 million
.
78
NOTE
7
– PENSION PLANS AND POSTRETIREMENT BENEFITS
We have historically provided defined benefit retirement benefits, primarily through noncontributory pension plans, for most of our regular employees. As of 2006, our retirement plans for U.S.-based employees were closed to new entrants for our corporate employees and were closed to new salaried plan entrants for our existing plans. The plans have also been closed to new hourly employees at certain locations.
Effective December 31, 2015, benefit accruals for salaried employees covered by and continuing to accrue service and salary adjusted benefits under our major U.S. and Canadian defined benefit qualified pension plans ceased. Furthermore, effective January 1, 2016, we began making service-based, cash contributions to a defined contribution plan for those employees impacted by the plan freeze.
Effective January 1, 2012, a defined contribution component was adopted applicable to BWXT Canada Ltd. (the "Canadian Plans"). Any employee with less than two years of continuous service as of December 31, 2011 was enrolled in the defined contribution component of the Canadian Plans either as of January 1, 2012 or upon the completion of six months of continuous service, whichever is later. These and future employees will not be eligible to enroll in the defined benefit component of the Canadian Plans. Additionally, during the third quarter of 2014, benefit accruals under certain hourly Canadian pension plans ceased effective January 1, 2015.
We do not provide retirement benefits to certain non-resident alien employees of foreign subsidiaries. Retirement benefits for salaried employees who accrue benefits in a defined benefit plan are based on final average compensation and years of service, while benefits for hourly paid employees are based on a flat benefit rate and years of service. Our funding policy is to fund the plans as recommended by the respective plan actuaries and in accordance with the Employee Retirement Income Security Act of 1974, as amended, or other applicable law. The Pension Protection Act of 2006 became effective in 2008. Funding provisions under the Pension Protection Act accelerate funding requirements to ensure full funding of benefits accrued. Assuming we continue as a government contractor, our contractual arrangements with the U.S. Government provide for the recovery of contributions to our pension and other postretirement benefit plans covering employees working primarily in our Nuclear Operations Group segment.
We make other benefits available, which include postretirement health care and life insurance benefits to certain salaried and union retirees based on their union contracts. Certain subsidiaries provide these benefits to unionized and salaried future retirees.
79
Obligations and Funded Status
|
|
Pension Benefits
Year Ended December 31,
|
Other Benefits
Year Ended December 31,
|
||||||||||||||
|
|
2017
|
2016
|
2017
|
2016
|
||||||||||||
|
|
(In thousands)
|
|||||||||||||||
|
Change in benefit obligation:
|
||||||||||||||||
|
Benefit obligation at beginning of period
|
$
|
1,571,586
|
|
$
|
1,565,905
|
|
$
|
62,994
|
|
$
|
62,788
|
|
||||
|
Service cost
|
8,031
|
|
7,358
|
|
567
|
|
575
|
|
||||||||
|
Interest cost
|
54,353
|
|
54,860
|
|
2,182
|
|
2,201
|
|
||||||||
|
Plan participants' contributions
|
68
|
|
75
|
|
585
|
|
606
|
|
||||||||
|
Amendments
|
1,519
|
|
1,731
|
|
—
|
|
—
|
|
||||||||
|
Acquisition
|
—
|
|
1,054
|
|
—
|
|
5,695
|
|
||||||||
|
Settlements
|
(117,354
|
)
|
(2,606
|
)
|
—
|
|
—
|
|
||||||||
|
Actuarial loss (gain)
|
102,807
|
|
28,108
|
|
5,099
|
|
(5,469
|
)
|
||||||||
|
Transfers
|
—
|
|
—
|
|
—
|
|
—
|
|
||||||||
|
Foreign currency exchange rate changes
|
10,344
|
|
3,376
|
|
642
|
|
174
|
|
||||||||
|
Benefits paid
|
(88,011
|
)
|
(88,275
|
)
|
(3,830
|
)
|
(3,576
|
)
|
||||||||
|
Benefit obligation at end of period
|
$
|
1,543,343
|
|
$
|
1,571,586
|
|
$
|
68,239
|
|
$
|
62,994
|
|
||||
|
Change in plan assets:
|
||||||||||||||||
|
Fair value of plan assets at beginning of period
|
$
|
1,217,859
|
|
$
|
1,209,814
|
|
$
|
42,713
|
|
$
|
41,219
|
|
||||
|
Actual return on plan assets
|
182,290
|
|
83,168
|
|
4,630
|
|
3,059
|
|
||||||||
|
Plan participants' contributions
|
68
|
|
75
|
|
585
|
|
606
|
|
||||||||
|
Company contributions
|
56,079
|
|
12,293
|
|
1,504
|
|
1,399
|
|
||||||||
|
Settlements
|
(121,196
|
)
|
(2,606
|
)
|
—
|
|
—
|
|
||||||||
|
Transfers
|
—
|
|
—
|
|
—
|
|
—
|
|
||||||||
|
Foreign currency exchange rate changes
|
10,610
|
|
3,390
|
|
—
|
|
—
|
|
||||||||
|
Benefits paid
|
(88,011
|
)
|
(88,275
|
)
|
(3,830
|
)
|
(3,570
|
)
|
||||||||
|
Fair value of plan assets at the end of period
|
1,257,699
|
|
1,217,859
|
|
45,602
|
|
42,713
|
|
||||||||
|
Funded status
|
$
|
(285,644
|
)
|
$
|
(353,727
|
)
|
$
|
(22,637
|
)
|
$
|
(20,281
|
)
|
||||
|
Amounts recognized in the balance sheet consist of:
|
||||||||||||||||
|
Accrued employee benefits
|
$
|
(3,303
|
)
|
$
|
(3,171
|
)
|
$
|
(1,269
|
)
|
$
|
(1,222
|
)
|
||||
|
Accumulated postretirement benefit obligation
|
—
|
|
—
|
|
(21,368
|
)
|
(19,059
|
)
|
||||||||
|
Pension liability
|
(295,814
|
)
|
(356,380
|
)
|
—
|
|
—
|
|
||||||||
|
Prepaid pension
|
13,473
|
|
5,824
|
|
—
|
|
—
|
|
||||||||
|
Accrued benefit liability, net
|
$
|
(285,644
|
)
|
$
|
(353,727
|
)
|
$
|
(22,637
|
)
|
$
|
(20,281
|
)
|
||||
|
Amount recognized in accumulated comprehensive income (before taxes):
|
||||||||||||||||
|
Prior service cost (credit)
|
$
|
11,227
|
|
$
|
11,782
|
|
$
|
(1,874
|
)
|
$
|
(2,188
|
)
|
||||
|
Supplemental information:
|
||||||||||||||||
|
Plans with accumulated benefit obligation in excess of plan assets:
|
||||||||||||||||
|
Projected benefit obligation
|
$
|
1,393,141
|
|
$
|
1,438,979
|
|
N/A
|
|
N/A
|
|
||||||
|
Accumulated benefit obligation
|
$
|
1,392,662
|
|
$
|
1,438,503
|
|
$
|
68,239
|
|
$
|
62,994
|
|
||||
|
Fair value of plan assets
|
$
|
1,094,023
|
|
$
|
1,079,428
|
|
$
|
45,602
|
|
$
|
42,713
|
|
||||
|
Plans with plan assets in excess of accumulated benefit obligation:
|
||||||||||||||||
|
Projected benefit obligation
|
$
|
150,202
|
|
$
|
132,607
|
|
N/A
|
|
N/A
|
|
||||||
|
Accumulated benefit obligation
|
$
|
150,202
|
|
$
|
132,607
|
|
$
|
—
|
|
$
|
—
|
|
||||
|
Fair value of plan assets
|
$
|
163,676
|
|
$
|
138,431
|
|
$
|
—
|
|
$
|
—
|
|
||||
80
|
|
Pension Benefits
Year Ended December 31,
|
Other Benefits
Year Ended December 31,
|
||||||||||||||||||||||
|
|
2017
|
2016
|
2015
|
2017
|
2016
|
2015
|
||||||||||||||||||
|
|
(In thousands)
|
|||||||||||||||||||||||
|
Components of net periodic benefit cost:
|
||||||||||||||||||||||||
|
Service cost
|
$
|
8,031
|
|
$
|
7,358
|
|
$
|
23,562
|
|
$
|
567
|
|
$
|
575
|
|
$
|
690
|
|
||||||
|
Interest cost
|
54,353
|
|
54,860
|
|
63,867
|
|
2,182
|
|
2,201
|
|
2,600
|
|
||||||||||||
|
Expected return on plan assets
|
(83,617
|
)
|
(82,690
|
)
|
(90,137
|
)
|
(2,383
|
)
|
(2,306
|
)
|
(2,348
|
)
|
||||||||||||
|
Amortization of prior service cost
|
2,074
|
|
1,932
|
|
1,797
|
|
(314
|
)
|
(302
|
)
|
(254
|
)
|
||||||||||||
|
Recognized net actuarial loss (gain)
|
8,322
|
|
27,531
|
|
60,863
|
|
2,741
|
|
(6,221
|
)
|
(6,207
|
)
|
||||||||||||
|
Net periodic benefit cost (income)
|
$
|
(10,837
|
)
|
$
|
8,991
|
|
$
|
59,952
|
|
$
|
2,793
|
|
$
|
(6,053
|
)
|
$
|
(5,519
|
)
|
||||||
Beginning in the first quarter of 2016, we changed the method we use to estimate the service and interest cost components of our net periodic benefit cost (income) for our pension and postretirement benefit plans. Previously, we estimated service and interest cost utilizing a single weighted-average discount rate derived from the yield curve data used to measure the benefit obligation. Our new method for estimating service and interest cost is a spot rate approach, which utilizes duration-specific spot rates from the yield curve that was used to measure the benefit obligation.
Our combined service and interest cost for our pension and postretirement plans decreased
$25.7 million
in the year ended December 31, 2016. The decrease is attributable to the change in the method used to estimate the service and interest cost components of net periodic benefit cost discussed above. While this change in method provides a more precise estimate of service and interest cost by improving the relationship of the discount rates utilized to measure our benefit obligation and the rates utilized to estimate service and interest cost, it will affect neither the measurement of our total pension and postretirement benefit obligations nor our total annual net periodic benefit cost as the change in our service and interest cost will be offset in our recognized net actuarial (gain) loss in the fourth quarter each year. Service cost also decreased due to the December 31, 2015 plan freeze of our major U.S. and Canadian defined benefit qualified pension plans.
Net periodic benefit cost related to our pension plans is calculated in accordance with GAAP. In addition, we calculate pension costs in accordance with U.S. cost accounting standards ("CAS") for purposes of cost recovery on our U.S. Government contracts to the extent applicable. See further discussion of CAS pension costs in our discussion of Critical Accounting Policies and Estimates included in Item 7 of this Annual Report on Form 10-K.
Recognized net actuarial losses (gains) consist primarily of our reported actuarial losses (gains), settlements, and the differences between the actual returns on plan assets and the expected returns on plan assets. In October 2017, the BWXT Retirement Plan completed the purchase of a group annuity contract that transferred pension benefit obligations totaling
$113.6 million
to an insurance company for approximately 2,300 retirees. As a result, we recognized pension settlement-related charges of
$3.8 million
during 2017. As indicated in
Note 16
, we have excluded the recognized net actuarial losses (gains) from our reportable segments and presented such amounts in
Note 16
as the Mark to Market Adjustment line item in the reconciliation of reportable segment income to consolidated operating income. The effects of recognized net actuarial losses (gains) on the consolidated statements of income are as follows:
|
|
Year Ended December 31,
|
|||||||||||
|
|
2017
|
2016
|
2015
|
|||||||||
|
|
(In thousands)
|
|||||||||||
|
Cost of operations
|
$
|
6,787
|
|
$
|
14,729
|
|
$
|
51,588
|
|
|||
|
Selling, general and administrative expenses
|
4,256
|
|
6,739
|
|
3,066
|
|
||||||
|
Other – net
|
20
|
|
(158
|
)
|
2
|
|
||||||
|
Total
|
$
|
11,063
|
|
$
|
21,310
|
|
$
|
54,656
|
|
|||
81
Additional Information
|
|
Pension Benefits
Year Ended December 31,
|
Other Benefits
Year Ended December 31,
|
||||||||||||||
|
|
2017
|
2016
|
2017
|
2016
|
||||||||||||
|
|
(In thousands)
|
|||||||||||||||
|
Increase (decrease) in accumulated other comprehensive income due to actuarial losses – before taxes
|
$
|
(1,519
|
)
|
$
|
(1,731
|
)
|
$
|
—
|
|
$
|
—
|
|
||||
In the current fiscal year, we have recognized expense (income) in other comprehensive income as a component of net periodic benefit cost of approximately
$2.1 million
and
$(0.3) million
for our pension benefits and other benefits, respectively. In the next fiscal year, we expect to recognize expense (income) in other comprehensive income as a component of net periodic benefit cost of approximately
$2.2 million
and
$(0.3) million
for our pension benefits and other benefits, respectively.
Assumptions
|
|
Pension Benefits
|
Other Benefits
|
||||||||||
|
|
2017
|
2016
|
2017
|
2016
|
||||||||
|
Weighted-average assumptions used to determine net periodic benefit obligations at December 31:
|
||||||||||||
|
Discount rate
|
3.68
|
%
|
4.18
|
%
|
3.64
|
%
|
4.12
|
%
|
||||
|
|
Pension Benefits
|
Other Benefits
|
||||||||||||||||
|
|
2017
|
2016
|
2015
|
2017
|
2016
|
2015
|
||||||||||||
|
Weighted-average assumptions used to determine net periodic benefit cost for the years ended December 31:
|
||||||||||||||||||
|
Discount rate to determine service cost
|
3.84
|
%
|
3.66
|
%
|
4.00
|
%
|
4.29
|
%
|
3.96
|
%
|
3.91
|
%
|
||||||
|
Discount rate to determine interest cost
|
3.17
|
%
|
3.17
|
%
|
4.00
|
%
|
3.71
|
%
|
3.55
|
%
|
3.91
|
%
|
||||||
|
Expected return on plan assets
|
7.00
|
%
|
7.03
|
%
|
7.04
|
%
|
5.71
|
%
|
5.71
|
%
|
5.72
|
%
|
||||||
|
Rate of compensation increase
|
—
|
|
—
|
|
2.57
|
%
|
—
|
|
—
|
|
—
|
|
||||||
The expected return on plan assets rate assumptions are based on the long-term expected returns for the investment mix of assets in the portfolio. In setting these rates, we use a building-block approach. Historical real return trends for the various asset classes in the plan's portfolio are combined with anticipated future market conditions to estimate the real rate of return for each class. These rates are then adjusted for anticipated future inflation to estimate nominal rates of return for each class. The expected rate of return on plan assets is then determined to be the weighted-average nominal return based on the weightings of the classes within the total asset portfolio. We are using an expected return on plan assets assumption of
7.2%
for the majority of our existing pension plan assets (approximately
87%
of our total pension assets at
December 31, 2017
).
Our existing other benefit plans are unfunded, with the exception of the NFS postretirement benefit plans. These plans provide health benefits to certain salaried and hourly employees, as well as retired employees, of NFS. All of the assets for these postretirement benefit plans are contributed into a Voluntary Employees' Beneficiary Association trust.
|
2017
|
2016
|
|||||
|
Assumed health care cost trend rates at December 31:
|
||||||
|
Health care cost trend rate assumed for next year
|
7.50
|
%
|
8.00
|
%
|
||
|
Rates to which the cost trend rate is assumed to decline (ultimate trend rate)
|
4.50
|
%
|
4.50
|
%
|
||
|
Year that the rate reaches ultimate trend rate
|
2030
|
|
2024
|
|
||
82
Assumed health care cost trend rates have a significant effect on the amounts we report for our health care plan. A one-percentage-point change in our assumed health care cost trend rates would have the following effects:
|
One-Percentage-
Point Increase |
One-Percentage-
Point Decrease |
|||||||
|
|
(In thousands)
|
|||||||
|
Effect on total of service and interest cost
|
$
|
332
|
|
$
|
(296
|
)
|
||
|
Effect on postretirement benefit obligation
|
$
|
7,390
|
|
$
|
(6,170
|
)
|
||
Investment Goals
General
The overall investment strategy of the pension trusts is to achieve long-term growth of principal, while avoiding excessive risk and to minimize the probability of loss of principal over the long term. The specific investment goals that have been set for the pension trusts, in the aggregate, are (1) to ensure that plan liabilities are met when due and (2) to achieve an investment return on trust assets consistent with a reasonable level of risk.
Allocations to each asset class for both domestic and foreign plans are reviewed periodically and rebalanced, if appropriate, to assure the continued relevance of the goals, objectives and strategies. The pension trusts for both our domestic and foreign plans employ a professional investment advisor and a number of professional investment managers whose individual benchmarks are, in the aggregate, consistent with the plan's overall investment objectives.
The goals of each investment manager are (1) to meet (in the case of passive accounts) or exceed (for actively managed accounts) the benchmark selected and agreed upon by the manager and the pension trust and (2) to display an overall level of risk in its portfolio that is consistent with the risk associated with the agreed upon benchmark.
The investment performance of total portfolios, as well as asset class components, is periodically measured against commonly accepted benchmarks, including the individual investment manager benchmarks. In evaluating investment manager performance, consideration is also given to personnel, strategy, research capabilities, organizational and business matters, adherence to discipline and other qualitative factors that may impact the ability to achieve desired investment results.
Domestic Plans
We sponsor the following domestic defined benefit plans:
|
•
|
BWXT Retirement Plan;
|
|
•
|
Nuclear Fuel Services, Inc. Retirement Plan for Salaried Employees; and
|
|
•
|
Nuclear Fuel Services, Inc. Retirement Plan for Hourly Employees.
|
The assets of the domestic pension plans are commingled for investment purposes and held by the trustee in the BWXT Master Trust (the "Master Trust"). For the years ended
December 31, 2017
and
2016
, the investment returns on domestic plan assets of the Master Trust (net of deductions for management fees) were approximately
17%
and
9%
, respectively.
83
The following is a summary of the asset allocations for the Master Trust at
December 31, 2017
and
2016
by asset category:
|
December 31,
|
||||||
|
2017
|
2016
|
|||||
|
Asset Category:
|
||||||
|
Commingled and Mutual Funds
|
35
|
%
|
31
|
%
|
||
|
Fixed Income (excluding U.S. Government Securities)
|
33
|
%
|
35
|
%
|
||
|
U.S. Government Securities
|
20
|
%
|
16
|
%
|
||
|
Partnerships with Security Holdings
|
6
|
%
|
7
|
%
|
||
|
Real Estate
|
1
|
%
|
1
|
%
|
||
|
Equity Securities
|
—
|
%
|
7
|
%
|
||
|
Other
|
5
|
%
|
3
|
%
|
||
|
Total
|
100
|
%
|
100
|
%
|
||
The target allocation for
2018
for the domestic plans, by asset class, is as follows:
|
Asset Class:
|
|||
|
Fixed Income
|
55
|
%
|
|
|
Equities
|
45
|
%
|
|
Foreign Plans
We sponsor various plans through certain of our Canadian subsidiaries.
The combined weighted-average asset allocations of these plans at
December 31, 2017
and
2016
by asset category were as follows:
|
December 31,
|
||||||
|
2017
|
2016
|
|||||
|
Asset Category:
|
||||||
|
Equity Securities and Commingled Mutual Funds
|
56
|
%
|
55
|
%
|
||
|
Fixed Income
|
42
|
%
|
43
|
%
|
||
|
Other
|
2
|
%
|
2
|
%
|
||
|
Total
|
100
|
%
|
100
|
%
|
||
The target allocation for
2018
for the foreign plans, by asset class, is as follows:
|
|
Canadian
Plans
|
||
|
Asset Class:
|
|||
|
Fixed Income
|
45
|
%
|
|
|
Global Equity
|
30
|
%
|
|
|
U.S. Equity
|
25
|
%
|
|
84
Fair Value
See
Note 15
for a detailed description of fair value measurements and the hierarchy established for valuation inputs. The following is a summary of total investments for our plans measured at fair value at
December 31, 2017
:
|
12/31/2017
|
Level 1
|
Level 2
|
Level 3
|
Unclassified
|
||||||||||||||||
|
|
(In thousands)
|
|||||||||||||||||||
|
Pension and Other Benefits:
|
||||||||||||||||||||
|
Fixed Income
|
$
|
445,080
|
|
$
|
—
|
|
$
|
375,070
|
|
$
|
—
|
|
$
|
70,010
|
|
|||||
|
Commingled and Mutual Funds
|
502,616
|
|
86,515
|
|
—
|
|
—
|
|
416,101
|
|
||||||||||
|
U.S. Government Securities
|
215,310
|
|
211,301
|
|
4,009
|
|
—
|
|
—
|
|
||||||||||
|
Partnerships with Security Holdings
|
79,708
|
|
—
|
|
—
|
|
—
|
|
79,708
|
|
||||||||||
|
Real Estate
|
1,400
|
|
—
|
|
—
|
|
—
|
|
1,400
|
|
||||||||||
|
Cash and Accrued Items
|
59,187
|
|
55,735
|
|
3,452
|
|
—
|
|
—
|
|
||||||||||
|
Total Assets
|
$
|
1,303,301
|
|
$
|
353,551
|
|
$
|
382,531
|
|
$
|
—
|
|
$
|
567,219
|
|
|||||
The following is a summary of total investments for our plans measured at fair value at
December 31, 2016
:
|
12/31/2016
|
Level 1
|
Level 2
|
Level 3
|
Unclassified
|
||||||||||||||||
|
|
(In thousands)
|
|||||||||||||||||||
|
Pension and Other Benefits:
|
||||||||||||||||||||
|
Fixed Income
|
$
|
457,167
|
|
$
|
—
|
|
$
|
397,033
|
|
$
|
—
|
|
$
|
60,134
|
|
|||||
|
Equities
|
70,811
|
|
70,811
|
|
—
|
|
—
|
|
—
|
|
||||||||||
|
Commingled and Mutual Funds
|
433,945
|
|
19,500
|
|
—
|
|
—
|
|
414,445
|
|
||||||||||
|
U.S. Government Securities
|
178,572
|
|
174,492
|
|
4,080
|
|
—
|
|
—
|
|
||||||||||
|
Partnerships with Security Holdings
|
82,502
|
|
—
|
|
—
|
|
—
|
|
82,502
|
|
||||||||||
|
Real Estate
|
1,702
|
|
—
|
|
—
|
|
—
|
|
1,702
|
|
||||||||||
|
Cash and Accrued Items
|
35,873
|
|
32,520
|
|
3,353
|
|
—
|
|
—
|
|
||||||||||
|
Total Assets
|
$
|
1,260,572
|
|
$
|
297,323
|
|
$
|
404,466
|
|
$
|
—
|
|
$
|
558,783
|
|
|||||
In accordance with FASB Topic
Fair Value Measurements
, certain investments that were measured at NAV per share (or its equivalent) have not been classified in the fair value hierarchy. These investments are measured on the fair value of the underlying investments but may not be redeemable at that fair value. When appropriate, we adjust these net asset values for contributions and distributions, if any, made during the period beginning on the latest NAV valuation date and ending on our measurement date. We also consider available market data, relevant index returns, preliminary estimates from our investees and other data obtained through research and consultation with third-party advisors in determining the fair value of these investments.
Cash Flows
|
|
Domestic Plans
|
Foreign Plans
|
||||||||||||||
|
|
Pension
Benefits
|
Other
Benefits
|
Pension
Benefits
|
Other
Benefits
|
||||||||||||
|
|
(In thousands)
|
|||||||||||||||
|
Expected employer contributions to trusts of defined benefit plans:
|
||||||||||||||||
|
2018
|
$
|
25,710
|
|
$
|
392
|
|
$
|
6,387
|
|
N/A
|
|
|||||
|
Expected benefit payments:
|
||||||||||||||||
|
2018
|
$
|
75,750
|
|
$
|
2,795
|
|
$
|
6,810
|
|
$
|
411
|
|
||||
|
2019
|
78,056
|
|
3,038
|
|
6,975
|
|
387
|
|
||||||||
|
2020
|
80,007
|
|
3,213
|
|
7,125
|
|
393
|
|
||||||||
|
2021
|
81,454
|
|
3,363
|
|
7,276
|
|
414
|
|
||||||||
|
2022
|
82,740
|
|
3,514
|
|
7,530
|
|
409
|
|
||||||||
|
2023-2027
|
421,326
|
|
17,906
|
|
39,160
|
|
2,328
|
|
||||||||
85
Defined Contribution Plans
We also provide benefits under the BWXT Thrift Plan (the "Thrift Plan"). The Thrift Plan generally provides for matching employer contributions of
50%
of the first
6%
of compensation, as defined in the Thrift Plan, contributed by participants, and fully vest and are nonforfeitable after three years of service or upon retirement, death, lay-off or approved disability. Starting May 15, 2015, these matching employer contributions are made in cash and invested at the employees' discretion. Previously, matching contributions were provided in the form of Company stock. We also provide service-based cash contributions under the Thrift Plan to employees not accruing benefits under our defined benefit plans. Amounts charged to expense for employer contributions under the Thrift Plan totaled approximately
$26.7 million
,
$26.0 million
and
$17.5 million
in the years ended
December 31, 2017
,
2016
and
2015
, respectively.
Effective January 1, 2012, a defined contribution component was added to those Canadian Plans previously offering defined benefits to salaried employees. As of January 1, 2012, we made cash, service-based contributions under this arrangement. The amounts charged to expense for employer contributions were approximately
$2.4 million
,
$1.1 million
and
$0.7 million
in the years ended
December 31, 2017
,
2016
and
2015
, respectively.
NOTE
8
– CAPITAL STOCK
In May 2013, our Board of Directors authorized us to repurchase an indeterminate number of shares of our common stock at an aggregate market value of up to
$250 million
; this authorization expired on
December 10, 2015
. In February 2014, our Board of Directors authorized an additional share repurchase of up to an aggregate market value of
$250 million
; this authorization expired on
February 26, 2016
. In October 2015, our Board of Directors authorized an additional share repurchase of up to an aggregate market value of
$300 million
; this authorization expires on
February 26, 2018
. On February 24, 2017, our Board of Directors authorized an additional share repurchase of up to an aggregate market value of
$150 million
during a three-year period from February 24, 2017 to February 24, 2020.
On September 15, 2016, we entered into a
$200 million
accelerated share repurchase agreement (the "ASR Agreement") with Wells Fargo Bank, National Association ("Wells Fargo"). Pursuant to the terms of the ASR Agreement, on September 16, 2016, we paid Wells Fargo
$200 million
in cash and received
4,135,435
shares of BWXT common stock. On March 24, 2017, the final settlement of the ASR Agreement was completed, and we received an additional
846,568
shares of BWXT common stock. The total number of shares repurchased under the ASR Agreement was
4,982,003
shares at an average price of
$40.14
per share based on the volume-weighted average stock price of BWXT common stock traded during the term of the ASR Agreement, less a customary discount.
We immediately reduced the outstanding shares used to calculate the weighted-average common shares outstanding for basic and diluted earnings per share as of the dates the initial and final repurchases of shares were physically delivered. The ASR Agreement was accounted for as a treasury stock transaction and forward stock purchase contract. The shares were recorded in treasury stock on our consolidated balance sheets. The forward stock purchase contract was indexed to BWXT's own stock and classified as an equity instrument.
In the year ended
December 31, 2017
, we received
846,568
shares under the final settlement of the ASR Agreement and made
no
other share repurchases. In the year ended
December 31, 2016
, we repurchased
7,025,203
shares of common stock for approximately
$292.9 million
, which includes only the initial shares received under the ASR Agreement. In the year ended
December 31, 2015
, we repurchased
2,429,016
shares of common stock for approximately
$69.7 million
. As of
December 31, 2017
, we had approximately
$193.0 million
available to us for share repurchase under the
$300 million
and
$150 million
authorizations described above.
NOTE
9
– STOCK-BASED COMPENSATION
2010 Long-Term Incentive Plan of BWX Technologies, Inc.
Members of the Board of Directors, executive officers, key employees and consultants are eligible to participate in the 2010 Long-Term Incentive Plan of BWX Technologies, Inc. (the "Plan"). The Compensation Committee of the Board of Directors selects the participants for the Plan. The Plan provides for a number of forms of stock-based compensation, including incentive and non-qualified stock options, restricted stock, restricted stock units, performance shares and performance units, subject to satisfaction of specific performance goals. Shares subject to awards under the Plan that are cancelled, forfeited, terminated or expire unexercised, shall immediately become available for the granting of awards under this Plan. As part of the approval of the Plan,
10,000,000
shares of common stock were initially authorized for issuance through the Plan, with an additional
2,300,000
authorized for issuance in 2014. Options to purchase shares are granted at not less than
100%
of the fair
86
market value closing price on the date of grant, become exercisable at such time or times as determined when granted and expire not more than
ten years
after the date of grant.
At
December 31, 2017
, we had awarded
8,549,474
shares under the Plan and had a total of
3,750,526
shares of our common stock available for future awards. In the event of a change in control of our company, the terms of the awards under the Plan contain provisions that may cause restrictions to lapse and accelerate the vesting of plan awards.
Long-Term Incentive Plan of BWXT Technical Services Group, Inc.
In June 2012, we established the 2012 Long-Term Incentive Plan of BWXT Technical Services Group, Inc., a cash-settled plan for employees of certain subsidiaries and unconsolidated affiliates as selected by the plan committee. The cash-settled plan provides for a number of forms of stock-based compensation, including stock appreciation rights, restricted stock units and performance units, subject to satisfaction of specific performance goals. Stock appreciation rights are granted at not less than
100%
of the fair market value closing price of a share of BWXT common stock on the date of grant, become exercisable at such time or times as determined when granted and expire not more than
ten years
after the date of grant. Stock appreciation rights are cash settled for the excess of the market price of BWXT common stock on the exercise date minus the exercise price. Restricted stock units and performance units are cash settled upon vesting as determined when granted. We will not issue any shares of BWXT common stock under this plan, as all awards are cash settled.
In the event of a change in control of our company, the terms of the awards under the cash-settled plan contain provisions that may cause restrictions to lapse and accelerate the vesting of plan awards.
Impact of the Spin-off on our Equity-Based Compensation Awards
In connection with the spin-off of BWE, in accordance with the provisions of the Plan, conversion adjustments were made to our outstanding non-qualified stock options, performance shares and restricted stock units. The conversion of these awards was designed to preserve the intrinsic value of the original award, which resulted in
no
incremental compensation expense. The awards continue to vest over the original vesting period, and to the extent that the adjusted awards had previously vested, the adjusted awards are also vested.
Each outstanding option or restricted stock unit award that was granted during 2015 to officers or employees who remained officers or employees of BWXT was replaced with an adjusted BWXT award. In addition, each outstanding option or restricted stock unit award that was granted during 2015 to a person who became an officer or employee of BWE immediately after the spin-off was replaced with a substitute BWE award.
Outstanding options or restricted stock units that were granted prior to 2015 were replaced with both an adjusted BWXT award and a substitute BWE award. Outstanding performance share awards granted prior to 2015 were converted into unvested restricted stock units of both BWXT and BWE.
Stock-based compensation expense for all of our plans recognized for the years ended
December 31, 2017
,
2016
and
2015
totaled
$18.5 million
,
$16.8 million
and
$25.9 million
, respectively, with associated tax benefit recognized for the years ended
December 31, 2017
,
2016
and
2015
totaling
$3.7 million
,
$6.0 million
and
$9.0 million
, respectively. Included in stock-based compensation expense for the years ended December 31, 2017 and 2016 is
$2.5 million
and
$3.3 million
, respectively, associated with executive reorganizations that resulted in the acceleration of previously granted equity awards. We recognized
$13.2 million
of stock-based compensation expense during the year ended December 31, 2015 as costs to spin-off our former Power Generation business. This expense related primarily to equity retention awards and expense acceleration associated with employee terminations.
As of
December 31, 2017
, unrecognized estimated compensation expense related to nonvested awards was
$14.1 million
, which is expected to be recognized over a weighted-average period of
1.7 years
.
87
BWXT Stock Options
The fair value of each option grant was estimated at the date of grant using the Black-Scholes option pricing model, with the following weighted-average assumptions:
|
|
Year Ended December 31,
|
||
|
|
2015
|
||
|
Risk-free interest rate
|
1.33
|
%
|
|
|
Expected volatility
|
.29
|
|
|
|
Expected life of the option in years
|
4.04
|
|
|
|
Expected dividend yield
|
1.27
|
%
|
|
The risk-free interest rate is based on the implied yield on a U.S. Treasury zero-coupon issue with a remaining term equal to the expected life of the option. The expected volatility is based on implied volatility from publicly traded options on our common stock, historical volatility of the price of our common stock and other factors. The expected life of the option is based on observed historical patterns. The expected dividend yield is based on the projected annual dividend payment per share divided by the stock price at the date of grant.
The following table summarizes activity for our stock options for the year ended
December 31, 2017
(share data in thousands):
|
Number
of
Shares
|
Weighted-
Average
Exercise
Price
|
Weighted-
Average
Remaining
Contractual
Term
|
Aggregate
Intrinsic
Value
(in millions)
|
||||||||||
|
Outstanding at beginning of period
|
1,723
|
|
$
|
23.56
|
|
||||||||
|
Granted
|
—
|
|
N/A
|
|
|||||||||
|
Exercised
|
(921
|
)
|
23.57
|
|
|||||||||
|
Cancelled/expired/forfeited
|
(20
|
)
|
23.71
|
|
|||||||||
|
Outstanding at end of period
|
782
|
|
$
|
23.54
|
|
4.3 Years
|
$
|
28.9
|
|
||||
|
Exercisable at end of period
|
608
|
|
$
|
23.47
|
|
3.5 Years
|
$
|
22.5
|
|
||||
The aggregate intrinsic value included in the table above represents the total pre-tax intrinsic value that would have been received by the option holders had all option holders exercised their options on
December 31, 2017
. The intrinsic value is calculated as the total number of option shares multiplied by the difference between the closing price of our common stock on the last trading day of the period and the exercise price of the options. This amount changes based on the price of our common stock.
There were
no
stock options granted during 2017 and 2016. The weighted-average fair value of the stock options granted in the year ended December 31, 2015 was
$6.59
.
During the years ended
December 31, 2017
,
2016
and
2015
, the total intrinsic value of stock options exercised was
$22.6 million
,
$12.0 million
and
$3.3 million
, respectively. The actual tax benefits realized related to the stock options exercised during the year ended
December 31, 2017
was
$6.2 million
.
88
BWXT Performance Shares
Nonvested performance shares as of
December 31, 2017
and changes during the year ended
December 31, 2017
were as follows (share data in thousands):
|
Number
of
Shares
|
Weighted-
Average
Grant Date
Fair Value
|
||||||
|
Nonvested at beginning of period
|
350
|
|
$
|
32.88
|
|
||
|
Adjustment to assumed vesting percentage
|
68
|
|
32.96
|
|
|||
|
Granted
|
151
|
|
48.51
|
|
|||
|
Vested
|
—
|
|
N/A
|
|
|||
|
Cancelled/forfeited
|
(8
|
)
|
37.79
|
|
|||
|
Nonvested at end of period
|
561
|
|
$
|
38.06
|
|
||
For performance shares granted during 2017 and 2016, the actual number of shares in which each participant vests is dependent upon achievement of certain Return on Invested Capital and Diluted Earnings Per Share targets over a
three
-year performance period. The number of shares in which participants can vest ranges from
zero
to
200%
of the initial performance shares granted, to be determined upon completion of the
three
-year performance period. The nonvested shares at the end of the period in the table above assumes weighted-average vesting of
158%
.
BWXT Restricted Stock Units
Nonvested restricted stock units as of
December 31, 2017
and changes during the year ended
December 31, 2017
were as follows (share data in thousands):
|
Number
of
Shares
|
Weighted-
Average
Grant Date
Fair Value
|
||||||
|
Nonvested at beginning of period
|
595
|
|
$
|
26.07
|
|
||
|
Granted
|
127
|
|
48.49
|
|
|||
|
Vested
|
(366
|
)
|
25.62
|
|
|||
|
Cancelled/forfeited
|
(20
|
)
|
27.21
|
|
|||
|
Nonvested at end of period
|
336
|
|
$
|
35.17
|
|
||
The actual tax benefits realized related to the restricted stock units vested during the year ended
December 31, 2017
were
$3.6 million
.
Cash-Settled Stock Appreciation Rights
The fair value of each stock appreciation right grant was calculated at the grant date using the Black-Scholes option pricing model and was remeasured at the end of the reporting period with the following weighted-average assumptions:
|
|
Year Ended December 31,
|
||
|
|
2015
|
||
|
Risk-free interest rate
|
1.33
|
%
|
|
|
Expected volatility
|
0.15
|
|
|
|
Expected life of the option in years
|
0.20
|
|
|
|
Expected dividend yield
|
0.72
|
%
|
|
The risk-free interest rate is based on the implied yield on a U.S. Treasury zero-coupon issue with a remaining term equal to the expected life of the stock appreciation right. The expected volatility is based on implied volatility from publicly traded options on our common stock, historical volatility of the price of our common stock and other factors. The expected life of the stock appreciation right is based on observed historical patterns and the length of time each award has been outstanding as of each measurement date. The expected dividend yield is based on the projected annual dividend payment per share divided by the stock price at the date of measurement.
89
The following table summarizes activity for our stock appreciation rights for the year ended
December 31, 2017
(unit data in thousands):
|
Number
of
Units
|
Weighted-
Average
Exercise
Price
|
Weighted-
Average
Remaining
Contractual
Term
|
Aggregate
Intrinsic
Value
(in millions)
|
||||||||||
|
Outstanding at beginning of period
|
99
|
|
$
|
23.14
|
|
||||||||
|
Granted
|
—
|
|
N/A
|
|
|||||||||
|
Exercised
|
(10
|
)
|
23.84
|
|
|||||||||
|
Cancelled/expired/forfeited
|
(3
|
)
|
23.62
|
|
|||||||||
|
Outstanding at end of period
|
86
|
|
$
|
23.05
|
|
4.7 Years
|
$
|
3.2
|
|
||||
|
Exercisable at end of period
|
77
|
|
$
|
22.98
|
|
4.5 Years
|
$
|
2.9
|
|
||||
The aggregate intrinsic value included in the table above represents the total pre-tax intrinsic value that would have been received by the stock appreciation rights holders had all holders exercised their rights on
December 31, 2017
. The intrinsic value is calculated as the total number of stock appreciation rights multiplied by the difference between the closing price of our common stock on the last trading day of the period and the exercise price of the stock appreciation rights. This amount changes based on the price of our common stock.
There were
no
cash-settled stock appreciation rights granted during 2017 and 2016. The weighted-average fair value as of
December 31, 2017
for stock appreciation rights granted in the year ended December 31, 2015 was
$37.40
. The fair value is re-determined at the end of each reporting period for purposes of remeasuring compensation expense associated with these cash-settled awards.
Cash-Settled Performance Units
Nonvested cash-settled performance units as of
December 31, 2017
and changes during the year ended
December 31, 2017
were as follows (unit data in thousands):
|
Number
of
Units
|
Weighted-
Average
Fair Value
|
||||||
|
Nonvested at beginning of period
|
9
|
|
|
|
|||
|
Adjustment to assumed vesting percentage
|
2
|
|
|
|
|||
|
Granted
|
3
|
|
|
|
|||
|
Vested
|
—
|
|
|
|
|||
|
Cancelled/forfeited
|
—
|
|
|
|
|||
|
Nonvested at end of period
|
14
|
|
$
|
60.49
|
|
||
For performance units granted during 2017 and 2016, the actual number of units in which each participant vests is dependent upon achievement of certain Return on Invested Capital and Diluted Earnings Per Share targets over a
three
-year performance period. The number of units in which participants can vest ranges from
zero
to
200%
of the initial performance units granted, to be determined upon completion of the
three
-year performance period. The nonvested shares at the end of the period in the table above assumes weighted-average vesting of
165%
.
The weighted-average fair value for these cash-settled awards is based on our closing stock price as of December 31, 2017. The fair value is re-determined at the end of each reporting period for purposes of remeasuring compensation expense associated with these cash-settled awards.
90
Cash-Settled Restricted Stock Units
Nonvested restricted stock units as of
December 31, 2017
and changes during the year ended
December 31, 2017
were as follows (unit data in thousands):
|
Number
of
Units
|
Weighted-
Average
Fair Value
|
||||||
|
Nonvested at beginning of period
|
32
|
|
|
|
|||
|
Granted
|
2
|
|
|
|
|||
|
Vested
|
(21
|
)
|
|
|
|||
|
Cancelled/forfeited
|
(2
|
)
|
|
|
|||
|
Nonvested at end of period
|
11
|
|
$
|
60.49
|
|
||
The weighted-average fair value for these cash-settled awards is based on our closing stock price as of
December 31, 2017
. The fair value is re-determined at the end of each reporting period for purposes of remeasuring compensation expense associated with these cash-settled awards.
NOTE
10
– COMMITMENTS AND CONTINGENCIES
Investigations and Litigation
Apollo and Parks Township
In January 2010, Michelle McMunn, Cara D. Steele and Yvonne Sue Robinson filed suit against Babcock & Wilcox Power Generation Group, Inc. ("B&W PGG"), Babcock & Wilcox Technical Services Group, Inc., formerly known as B&W Nuclear Environmental Services, Inc. and now known as BWXT Technical Services Group, Inc. (the "BWXT Parties") and Atlantic Richfield Company ("ARCO") in the U.S. District Court for the Western District of Pennsylvania. Since January 2010, additional suits were filed by additional plaintiffs and there are currently
17
lawsuits pending in the U.S. District Court for the Western District of Pennsylvania (the "Trial Court") against the BWXT Parties and ARCO, including the most recent lawsuits filed in June and October 2015. In total, the suits involve approximately
107
primary claimants. The primary claimants allege, among other things, personal injuries and property damage as a result of alleged releases of radioactive material relating to the operation, remediation and/or decommissioning of
two
former nuclear fuel processing facilities located in the Borough of Apollo and Parks Township, Pennsylvania (collectively, the "Apollo and Parks Litigation"). Those facilities previously were owned by Nuclear Materials and Equipment Company, a former subsidiary of ARCO ("NUMEC"), which was acquired by B&W PGG. The plaintiffs in the Apollo and Parks Litigation seek compensatory and punitive damages, and in November 2014 delivered a demand of
$125.0 million
for the settlement of all then-filed actions. While we consider the likelihood of the plaintiffs' recovery to be remote, solely on the basis of this demand we estimate the range of a possible loss at between
$0.0 million
and
$125.0 million
. In connection with the spin-off, we agreed to indemnify B&W PGG and its affiliates for any losses arising from the Apollo and Parks Litigation pursuant to the Master Separation Agreement.
Between May 2015 and March 2016, the presiding judge in the Apollo and Parks Litigation granted the BWXT Parties' motions to dismiss or motions for summary judgment in all
17
of the existing lawsuits. Accordingly, all current claims in the Apollo and Parks Litigation have been dismissed by the Trial Court. All plaintiffs filed notices of appeal, and the appeals were consolidated in the U.S. Court of Appeals for the Third Circuit (the "Court of Appeals"). On August 23, 2017, the Court of Appeals affirmed the rulings of the Trial Court, dismissing all claims against the BWXT Parties and other defendants in the cases. Plaintiffs filed a notice of petition for rehearing, which was denied by the Court of Appeals on September 21, 2017. The plaintiffs filed a writ of certiorari for review by the U.S. Supreme Court on December 20, 2017. On February 20, 2018, the U.S. Supreme Court denied plaintiffs' petition for writ of certiorari making the Court of Appeals decision affirming the dismissal of all
17
lawsuits final.
At the time of ARCO's sale of NUMEC stock to B&W PGG, B&W PGG received an indemnity and hold harmless agreement from ARCO, which has been assigned to BWXT and its affiliates, with respect to claims and liabilities arising prior to or as a result of conduct or events predating the acquisition.
Insurance coverage and/or the ARCO indemnity currently provides coverage for the claims alleged in the Apollo and Parks Litigation, although no assurance can be given that insurance and/or the indemnity will be available or sufficient in the event of liability, if any.
91
Other Litigation and Settlements
Due to the nature of our business, we are, from time to time, involved in routine litigation or subject to disputes or claims related to our business activities, including, among other things:
|
•
|
performance- or warranty-related matters under our customer and supplier contracts and other business arrangements; and
|
|
•
|
workers' compensation, employment, premises liability and other claims.
|
Based upon our prior experience, we do not expect that any of these other litigation proceedings, disputes and claims will have a material adverse effect on our consolidated financial condition, results of operations or cash flows.
Environmental Matters
We have been identified as a potentially responsible party at various cleanup sites under the Comprehensive Environmental Response, Compensation, and Liability Act, as amended ("CERCLA"). CERCLA and other environmental laws can impose liability for the entire cost of cleanup on any of the potentially responsible parties, regardless of fault or the lawfulness of the original conduct. Generally, however, where there are multiple responsible parties, a final allocation of costs is made based on the amount and type of wastes disposed of by each party and the number of financially viable parties, although this may not be the case with respect to any particular site. We have not been determined to be a major contributor of wastes to any of these sites. On the basis of our relative contribution of waste to each site, we expect our share of the ultimate liability for the various sites will not have a material adverse effect on our consolidated financial condition, results of operations or cash flows in any given year.
The Department of Environmental Protection of the Commonwealth of Pennsylvania ("PADEP") advised us in March 1994 that it would seek monetary sanctions and remedial and monitoring relief related to the former production facility located in Parks Township, Pennsylvania (the "Parks Facility"). The relief sought was related to potential groundwater contamination resulting from previous operations at the facility. The Parks Facility was decommissioned in the 1990s, including facilities dismantlement and soil restoration. The NRC terminated the Parks Facility license in 2004 and released the facility for unrestricted use. What remains of the Parks Facility is currently owned by a subsidiary in our Nuclear Operations Group segment. Based on favorable results from groundwater sampling completed by our Nuclear Operations Group segment, we have sought approval by PADEP for release of the property, subject to limitations on future use, under Pennsylvania's voluntary cleanup program. In 2017, PADEP approved release of the Parks Facility under Pennsylvania's voluntary cleanup program. In connection with completion of this matter, BWXT has agreed with PADEP to restrict future use and activity restrictions for the property.
We perform significant amounts of work for the U.S. Government under both prime contracts and subcontracts and operate certain facilities that are licensed to possess and process special nuclear materials. As a result of these activities, we are subject to continuing reviews by governmental agencies, including the U.S. Environmental Protection Agency and the NRC. We are also involved in the design and manufacture of commercial nuclear fuel at
two
licensed facilities in Canada that are also subject to continuing reviews by governmental agencies in Canada, including the CNSC.
The NRC's decommissioning regulations require our Nuclear Operations Group segment to provide financial assurance that it will be able to pay the expected cost of decommissioning its licensed facilities at the end of their service lives. We provided financial assurance totaling
$56.2 million
during the years ended
December 31, 2017
and
2016
with surety bonds and letters of credit for the ultimate decommissioning of these licensed facilities. These
two
facilities have provisions in their government contracts pursuant to which substantially all of our decommissioning costs and financial assurance obligations are covered by the DOE, including the costs to complete the decommissioning projects underway at the facility in Erwin, Tennessee. These surety bonds and letters of credit are to cover decommissioning required pursuant to work not subject to this DOE obligation.
In Canada, the CNSC's decommissioning regulations require our Nuclear Power Group segment to provide financial assurance that it will be able to pay the expected cost of decommissioning its
two
CNSC-licensed facilities at the end of their service lives. We provided financial assurance totaling
$41.7 million
and
$39.5 million
during the years ended
December 31, 2017
and
2016
, respectively, with letters of credit for the ultimate decommissioning of these licensed facilities.
Our compliance with U.S. federal, state and local environmental control and protection regulations resulted in pre-tax charges of approximately
$14.1 million
,
$14.2 million
and
$14.1 million
in the years ended
December 31, 2017
,
2016
and
2015
, respectively. In addition, compliance with existing environmental regulations necessitated capital expenditures of
$0.9
92
million
,
$1.3 million
and
$0.7 million
in the years ended
December 31, 2017
,
2016
and
2015
, respectively. At
December 31, 2017
and
2016
, we had total environmental accruals (including provisions for the facilities discussed above) of
$93.3 million
and
$86.3 million
, respectively. Of our total environmental accruals at
December 31, 2017
and
2016
,
$13.5 million
and
$4.6 million
, respectively, were included in current liabilities. Inherent in the estimates of those accruals and recoveries are our expectations regarding the levels of contamination, decommissioning costs and recoverability from other parties, which may vary significantly as decommissioning activities progress. Accordingly, changes in estimates could result in material adjustments to our operating results, and the ultimate loss may differ materially from the amounts that we have provided for in our consolidated financial statements.
Operating Leases
Future minimum payments required under operating leases that have initial or remaining noncancellable lease terms in excess of one year at
December 31, 2017
were as follows (in thousands):
|
Year Ending December 31,
|
Amount
|
|||
|
2018
|
$
|
3,525
|
|
|
|
2019
|
$
|
2,565
|
|
|
|
2020
|
$
|
817
|
|
|
|
2021
|
$
|
749
|
|
|
|
2022
|
$
|
573
|
|
|
|
Thereafter
|
$
|
—
|
|
|
Total rental expenses for the years ended
December 31, 2017
,
2016
and
2015
were
$5.1 million
,
$4.6 million
and
$4.9 million
, respectively.
NOTE
11
– RISKS AND UNCERTAINTIES
Percentage-of-Completion Accounting
As of
December 31, 2017
, in accordance with the percentage-of-completion method of accounting, we have provided for our estimated costs to complete all of our ongoing contracts. However, it is possible that current estimates could change due to unforeseen events, which could result in adjustments to overall contract costs. The risk on fixed-priced contracts is that revenue from the customer does not cover increases in our costs. It is possible that current estimates could materially change for various reasons, including, but not limited to, fluctuations in forecasted labor productivity or steel and other raw material prices. Increases in costs on our fixed-price contracts could have a material adverse impact on our consolidated financial condition, results of operations and cash flows. Alternatively, reductions in overall contract costs at completion could materially improve our consolidated financial condition, results of operations and cash flows.
Insurance
Upon the February 22, 2006 effectiveness of the settlement relating to the Chapter 11 proceedings involving several of our subsidiaries, most of our subsidiaries contributed substantial insurance rights to the asbestos personal injury trust, including rights to (1) certain pre-1979 primary and excess insurance coverages and (2) certain of our 1979-1986 excess insurance coverage. These insurance rights provided coverage for, among other things, asbestos and other personal injury claims, subject to the terms and conditions of the policies. The contribution of these insurance rights was made in exchange for the agreement on the part of the representatives of the asbestos claimants, including the representative of future claimants, to the entry of a permanent injunction, pursuant to Section 524(g) of the U.S. Bankruptcy Code, to channel to the asbestos trust all asbestos-related claims against our subsidiaries and former subsidiaries arising out of, resulting from or attributable to their operations, and the implementation of related releases and indemnification provisions protecting those subsidiaries and their affiliates from future liability for such claims. Although we are not aware of any significant, unresolved claims against our subsidiaries and former subsidiaries that are not subject to the channeling injunction and that relate to the periods during which such excess insurance coverage related, with the contribution of these insurance rights to the asbestos personal injury trust, it is possible that we could have underinsured or uninsured exposure for non-derivative asbestos claims or other personal injury or other claims that would have been insured under these coverages had the insurance rights not been contributed to the asbestos personal injury trust. In conjunction with the spin-off, claims and liabilities associated with these asbestos personal injury, property damage and indirect property damage claims have been expressly assumed by BWE pursuant to the master separation agreement between us and BWE.
93
NOTE
12
– FINANCIAL INSTRUMENTS WITH CONCENTRATIONS OF CREDIT RISK
The primary customer of our Nuclear Operations Group and Nuclear Services Group segments is the U.S. Government, including some of its contractors. Our Nuclear Power Group segment's major customers are large utilities. These concentrations of customers may impact our overall exposure to credit risk, either positively or negatively, in that our customers may be similarly affected by changes in economic or other conditions. In the years ended
December 31, 2017
,
2016
and
2015
, U.S. Government contracts accounted for approximately
81%
,
87%
and
88%
of our total consolidated revenues, respectively. Accounts receivable due directly or indirectly from the U.S. Government represented
65%
and
82%
of net receivables at
December 31, 2017
and
December 31, 2016
, respectively. See
Note 16
for additional information about our operations in different geographic areas.
We believe that our provision for possible losses on uncollectible accounts receivable is adequate for our credit loss exposure. At
December 31, 2017
and
2016
, the allowances for possible losses that we deducted from Accounts receivable – trade, net on our consolidated balance sheets were
$0.1 million
and
$0.0 million
, respectively.
NOTE
13
– INVESTMENTS
The following is a summary of our investments at
December 31, 2017
:
|
Amortized
Cost
|
Gross
Unrealized
Gains
|
Gross
Unrealized
Losses
|
Estimated
Fair
Value
|
|||||||||||||
|
|
(In thousands)
|
|||||||||||||||
|
Available-for-sale securities
|
||||||||||||||||
|
U.S. Government and agency securities
|
$
|
1,300
|
|
$
|
—
|
|
$
|
(1
|
)
|
$
|
1,299
|
|
||||
|
Corporate bonds
|
3,114
|
|
55
|
|
—
|
|
3,169
|
|
||||||||
|
Equities
|
908
|
|
1,851
|
|
—
|
|
2,759
|
|
||||||||
|
Mutual funds
|
4,382
|
|
465
|
|
—
|
|
4,847
|
|
||||||||
|
Asset-backed securities and collateralized mortgage obligations
|
204
|
|
—
|
|
(43
|
)
|
161
|
|
||||||||
|
Total
|
$
|
9,908
|
|
$
|
2,371
|
|
$
|
(44
|
)
|
$
|
12,235
|
|
||||
The following is a summary of our investments at
December 31, 2016
:
|
Amortized
Cost
|
Gross
Unrealized
Gains
|
Gross
Unrealized
Losses
|
Estimated
Fair
Value
|
|||||||||||||
|
|
(In thousands)
|
|||||||||||||||
|
Trading securities
|
||||||||||||||||
|
Corporate bonds
|
$
|
2,708
|
|
$
|
—
|
|
$
|
(406
|
)
|
$
|
2,302
|
|
||||
|
Equities
|
39
|
|
—
|
|
(1
|
)
|
38
|
|
||||||||
|
Available-for-sale securities
|
||||||||||||||||
|
U.S. Government and agency securities
|
8,405
|
|
—
|
|
(1
|
)
|
8,404
|
|
||||||||
|
Corporate bonds
|
3,313
|
|
—
|
|
(1
|
)
|
3,312
|
|
||||||||
|
Equities
|
948
|
|
3,634
|
|
—
|
|
4,582
|
|
||||||||
|
Mutual funds
|
4,156
|
|
27
|
|
—
|
|
4,183
|
|
||||||||
|
Asset-backed securities and collateralized mortgage obligations
|
258
|
|
—
|
|
(49
|
)
|
209
|
|
||||||||
|
Commercial paper
|
500
|
|
—
|
|
—
|
|
500
|
|
||||||||
|
Total
|
$
|
20,327
|
|
$
|
3,661
|
|
$
|
(458
|
)
|
$
|
23,530
|
|
||||
94
Proceeds, gross realized gains and gross realized losses on sales of available-for-sale securities were as follows:
|
Proceeds
|
Gross
Realized
Gains
|
Gross
Realized
Losses
|
||||||||||
|
|
(In thousands)
|
|||||||||||
|
Year Ended December 31, 2017
|
$
|
148
|
|
$
|
108
|
|
$
|
—
|
|
|||
|
Year Ended December 31, 2016
|
$
|
9,261
|
|
$
|
337
|
|
$
|
—
|
|
|||
|
Year Ended December 31, 2015
|
$
|
6,456
|
|
$
|
343
|
|
$
|
—
|
|
|||
NOTE
14
– DERIVATIVE FINANCIAL INSTRUMENTS
We have designated all of our FX forward contracts that qualify for hedge accounting as cash flow hedges. The hedged risk is the risk of changes in functional-currency-equivalent cash flows attributable to changes in FX spot rates of forecasted transactions related to long-term contracts. We exclude from our assessment of effectiveness the portion of the fair value of the FX forward contracts attributable to the difference between FX spot rates and FX forward rates. At
December 31, 2017
, we had deferred approximately
$0.4 million
of net
gains
on these derivative financial instruments in Accumulated other comprehensive income. Assuming market conditions continue, we expect to recognize substantially all of this amount in the next twelve months.
At
December 31, 2017
, our derivative financial instruments consisted of FX forward contracts. The notional value of our FX forward contracts totaled
$36.6 million
at
December 31, 2017
, with maturities extending to
December 2021
. These instruments consist primarily of contracts to purchase or sell Canadian Dollars. We are exposed to credit-related losses in the event of nonperformance by counterparties to derivative financial instruments. We attempt to mitigate this risk by using major financial institutions with high credit ratings. The counterparties to all of our FX forward contracts are financial institutions included in our credit facility. Our hedge counterparties have the benefit of the same collateral arrangements and covenants as described under our credit facility.
The following tables summarize our derivative financial instruments at
December 31, 2017
and
2016
:
|
|
Asset and Liability Derivatives
December 31,
|
|||||||
|
|
2017
|
2016
|
||||||
|
|
(In thousands)
|
|||||||
|
Derivatives Designated as Hedges:
|
||||||||
|
Foreign Exchange Contracts:
|
||||||||
|
Location
|
||||||||
|
Accounts receivable – other
|
$
|
250
|
|
$
|
70
|
|
||
|
Other Assets
|
$
|
348
|
|
$
|
—
|
|
||
|
Accounts payable
|
$
|
177
|
|
$
|
462
|
|
||
|
Other Liabilities
|
$
|
93
|
|
$
|
—
|
|
||
The effects of derivatives on our financial statements are outlined below:
|
|
Year Ended December 31,
|
|||||||||||
|
|
2017
|
2016
|
2015
|
|||||||||
|
|
(In thousands)
|
|||||||||||
|
Derivatives Designated as Hedges:
|
||||||||||||
|
Cash Flow Hedges:
|
||||||||||||
|
Foreign Exchange Contracts:
|
||||||||||||
|
Amount of gain (loss) recognized in other comprehensive income
|
$
|
1,021
|
|
$
|
807
|
|
$
|
(6,550
|
)
|
|||
|
Gain (loss) reclassified from accumulated other comprehensive income into earnings: effective portion
|
||||||||||||
|
Location
|
||||||||||||
|
Revenues
|
$
|
169
|
|
$
|
(30
|
)
|
$
|
455
|
|
|||
|
Cost of operations
|
$
|
(84
|
)
|
$
|
366
|
|
$
|
(6,259
|
)
|
|||
95
NOTE
15
– FAIR VALUE MEASUREMENTS
FASB Topic
Fair Value Measurements and Disclosures
defines fair value as the price that would be received to sell an asset or paid to transfer a liability (an exit price) in an orderly transaction between market participants at the measurement date. This topic also sets forth the disclosure requirements regarding fair value and establishes a hierarchy for valuation inputs that emphasizes the use of observable inputs when measuring fair value. A financial instrument's categorization within the fair value hierarchy is based upon the lowest level of input that is significant to the fair value measurement. The fair value hierarchy established by this topic is as follows:
|
•
|
Level 1 – inputs are based upon quoted prices for identical instruments traded in active markets.
|
|
•
|
Level 2 – inputs are based upon quoted prices for similar instruments in active markets, quoted prices for similar or identical instruments in inactive markets and model-based valuation techniques for which all significant assumptions are observable in the market or can be corroborated by observable market data for substantially the full term of the assets and liabilities.
|
|
•
|
Level 3 – inputs are generally unobservable and typically reflect management's estimates of assumptions that market participants would use in pricing the asset or liability. The fair values are therefore determined using model-based techniques that include option pricing models, discounted cash flow models and similar valuation techniques.
|
The following sections describe the valuation methodologies we use to measure the fair values of our investments, derivatives and nonrecurring fair value measurements.
Investments
Investments primarily include U.S. Government and agency securities, money-market funds, mortgage-backed securities, corporate bonds and equities.
In general, and where applicable, we principally use a composite of observable prices and quoted prices in active markets for identical assets or liabilities to determine fair value. This pricing methodology applies to our Level 1 and Level 2 investments.
Fair Value Measurements
The following is a summary of our investments measured at fair value at
December 31, 2017
:
|
12/31/2017
|
Level 1
|
Level 2
|
Level 3
|
|||||||||||||
|
|
(In thousands)
|
|||||||||||||||
|
Available-for-sale securities
|
||||||||||||||||
|
U.S. Government and agency securities
|
$
|
1,299
|
|
$
|
1,299
|
|
$
|
—
|
|
$
|
—
|
|
||||
|
Corporate bonds
|
3,169
|
|
1,534
|
|
1,635
|
|
—
|
|
||||||||
|
Equities
|
2,759
|
|
—
|
|
2,759
|
|
—
|
|
||||||||
|
Mutual funds
|
4,847
|
|
—
|
|
4,847
|
|
—
|
|
||||||||
|
Asset-backed securities and collateralized mortgage obligations
|
161
|
|
—
|
|
161
|
|
—
|
|
||||||||
|
Total
|
$
|
12,235
|
|
$
|
2,833
|
|
$
|
9,402
|
|
$
|
—
|
|
||||
96
The following is a summary of our investments measured at fair value at
December 31, 2016
:
|
12/31/2016
|
Level 1
|
Level 2
|
Level 3
|
|||||||||||||
|
|
(In thousands)
|
|||||||||||||||
|
Trading securities
|
||||||||||||||||
|
Corporate bonds
|
$
|
2,302
|
|
$
|
2,302
|
|
$
|
—
|
|
$
|
—
|
|
||||
|
Equities
|
38
|
|
38
|
|
—
|
|
—
|
|
||||||||
|
Available-for-sale securities
|
||||||||||||||||
|
U.S. Government and agency securities
|
8,404
|
|
8,404
|
|
—
|
|
—
|
|
||||||||
|
Corporate bonds
|
3,312
|
|
—
|
|
3,312
|
|
—
|
|
||||||||
|
Equities
|
4,582
|
|
—
|
|
4,582
|
|
—
|
|
||||||||
|
Mutual funds
|
4,183
|
|
—
|
|
4,183
|
|
—
|
|
||||||||
|
Asset-backed securities and collateralized mortgage obligations
|
209
|
|
—
|
|
209
|
|
—
|
|
||||||||
|
Commercial paper
|
500
|
|
—
|
|
500
|
|
—
|
|
||||||||
|
Total
|
$
|
23,530
|
|
$
|
10,744
|
|
$
|
12,786
|
|
$
|
—
|
|
||||
Derivatives
Level 2 derivative assets and liabilities currently consist of FX forward contracts. Where applicable, the value of these derivative assets and liabilities is computed by discounting the projected future cash flow amounts to present value using market-based observable inputs, including FX forward and spot rates, interest rates and counterparty performance risk adjustments. At
December 31, 2017
and
2016
, we had forward contracts outstanding to purchase or sell foreign currencies, primarily Canadian Dollars, with a total fair value of
$0.3 million
and
$(0.4) million
, respectively.
Other Financial Instruments
We used the following methods and assumptions in estimating our fair value disclosures for our other financial instruments, as follows:
Cash and cash equivalents and restricted cash and cash equivalents
. The carrying amounts that we have reported in the accompanying consolidated balance sheets for cash and cash equivalents and restricted cash and cash equivalents approximate their fair values due to their highly liquid nature.
Long-term and short-term debt
. We base the fair values of debt instruments on quoted market prices. Where quoted prices are not available, we base the fair values on the present value of future cash flows discounted at estimated borrowing rates for similar debt instruments or on estimated prices based on current yields for debt issues of similar quality and terms. The fair value of our debt instruments approximated their carrying value at
December 31, 2017
and
December 31, 2016
.
NOTE
16
– SEGMENT REPORTING
As described in
Note 1
, our operations are assessed based on three reportable segments. In connection with our segment reporting change, we have revised historical amounts to conform to current segment presentation.
The operations of our segments are managed separately, and each segment has unique technology, services and customer classes. We account for intersegment sales at prices that we generally establish by reference to similar transactions with unaffiliated customers. Reportable segments are measured based on operating income exclusive of general corporate expenses, the mPower Framework Agreement, income related to litigation proceeds, gains (losses) on sales of corporate assets, special charges for restructuring activities, mark to market charges related to our pension and postretirement benefit plans and the costs incurred to spin-off our former Power Generation business.
97
1. Information about Operations in our Different Industry Segments:
|
|
Year Ended December 31,
|
|||||||||||
|
|
2017
|
2016
|
2015
|
|||||||||
|
|
(In thousands)
|
|||||||||||
|
REVENUES
(1)
:
|
||||||||||||
|
Nuclear Operations Group
|
$
|
1,271,861
|
|
$
|
1,269,272
|
|
$
|
1,179,896
|
|
|||
|
Nuclear Services Group
|
137,249
|
|
128,021
|
|
121,247
|
|
||||||
|
Nuclear Power Group
|
285,831
|
|
161,572
|
|
121,061
|
|
||||||
|
Adjustments and Eliminations
|
(7,203
|
)
|
(8,292
|
)
|
(6,675
|
)
|
||||||
|
$
|
1,687,738
|
|
$
|
1,550,573
|
|
$
|
1,415,529
|
|
||||
|
(1)
|
Segment revenues are net of the following intersegment transfers and other adjustments:
|
|
Nuclear Operations Group Transfers
|
$
|
(1,322
|
)
|
$
|
(208
|
)
|
$
|
(3,087
|
)
|
|||
|
Nuclear Services Group Transfers
|
(5,635
|
)
|
(7,016
|
)
|
(2,101
|
)
|
||||||
|
Nuclear Power Group Transfers
|
(246
|
)
|
(1,068
|
)
|
(1,487
|
)
|
||||||
|
$
|
(7,203
|
)
|
$
|
(8,292
|
)
|
$
|
(6,675
|
)
|
||||
|
OPERATING INCOME:
|
||||||||||||
|
Nuclear Operations Group
|
$
|
289,852
|
|
$
|
268,503
|
|
$
|
257,400
|
|
|||
|
Nuclear Services Group
|
23,118
|
|
12,171
|
|
7,955
|
|
||||||
|
Nuclear Power Group
|
39,978
|
|
42,808
|
|
11,803
|
|
||||||
|
Other
|
(10,688
|
)
|
(6,398
|
)
|
(13,949
|
)
|
||||||
|
$
|
342,260
|
|
$
|
317,084
|
|
$
|
263,209
|
|
||||
|
Unallocated Corporate
(1)
|
(22,332
|
)
|
(26,353
|
)
|
(25,747
|
)
|
||||||
|
mPower Framework Agreement
|
—
|
|
(30,000
|
)
|
—
|
|
||||||
|
Income Related to Litigation Proceeds
|
—
|
|
—
|
|
65,728
|
|
||||||
|
Special Charges for Restructuring Activities
|
—
|
|
—
|
|
(16,608
|
)
|
||||||
|
Cost to spin-off Power Generation business
|
—
|
|
—
|
|
(25,987
|
)
|
||||||
|
Mark to Market Adjustment
|
(11,043
|
)
|
(21,468
|
)
|
(54,654
|
)
|
||||||
|
Total Operating Income
(2)
|
$
|
308,885
|
|
$
|
239,263
|
|
$
|
205,941
|
|
|||
|
Other Income (Expense)
:
|
||||||||||||
|
Interest income
|
1,405
|
|
651
|
|
30,331
|
|
||||||
|
Interest expense
|
(14,879
|
)
|
(8,393
|
)
|
(10,181
|
)
|
||||||
|
Other – net
|
369
|
|
25,747
|
|
(5,026
|
)
|
||||||
|
Total Other Income (Expense)
|
(13,105
|
)
|
18,005
|
|
15,124
|
|
||||||
|
Income before Provision for Income Taxes
|
$
|
295,780
|
|
$
|
257,268
|
|
$
|
221,065
|
|
|||
|
(1)
|
Unallocated corporate includes general corporate overhead not allocated to segments
|
|
(2)
|
Included in operating income is the following:
|
|
Losses (Gains) on Asset Disposals and Impairments, Net:
|
||||||||||||
|
Nuclear Operations Group
|
$
|
(65
|
)
|
$
|
—
|
|
$
|
—
|
|
|||
|
Nuclear Services Group
|
—
|
|
—
|
|
—
|
|
||||||
|
Nuclear Power Group
|
(129
|
)
|
(43
|
)
|
4
|
|
||||||
|
Unallocated Corporate
|
—
|
|
—
|
|
378
|
|
||||||
|
$
|
(194
|
)
|
$
|
(43
|
)
|
$
|
382
|
|
||||
|
Equity in Income of Investees
:
|
||||||||||||
|
Nuclear Operations Group
|
$
|
—
|
|
$
|
—
|
|
$
|
—
|
|
|||
|
Nuclear Services Group
|
13,612
|
|
15,099
|
|
13,396
|
|
||||||
|
Nuclear Power Group
|
—
|
|
—
|
|
—
|
|
||||||
|
Other
|
—
|
|
970
|
|
—
|
|
||||||
|
$
|
13,612
|
|
$
|
16,069
|
|
$
|
13,396
|
|
||||
98
|
|
Year Ended December 31,
|
|||||||||||
|
|
2017
|
2016
|
2015
|
|||||||||
|
|
(In thousands)
|
|||||||||||
|
CAPITAL EXPENDITURES:
|
||||||||||||
|
Nuclear Operations Group
|
$
|
86,323
|
|
$
|
43,546
|
|
$
|
35,658
|
|
|||
|
Nuclear Services Group
|
1,514
|
|
528
|
|
3,853
|
|
||||||
|
Nuclear Power Group
|
3,856
|
|
3,102
|
|
2,629
|
|
||||||
|
Other
|
628
|
|
—
|
|
—
|
|
||||||
|
Segment Capital Expenditures
|
92,321
|
|
47,176
|
|
42,140
|
|
||||||
|
Corporate Capital Expenditures
|
4,559
|
|
5,458
|
|
14,701
|
|
||||||
|
Total Capital Expenditures
|
$
|
96,880
|
|
$
|
52,634
|
|
$
|
56,841
|
|
|||
|
DEPRECIATION AND AMORTIZATION:
|
||||||||||||
|
Nuclear Operations Group
|
$
|
31,289
|
|
$
|
34,364
|
|
$
|
38,836
|
|
|||
|
Nuclear Services Group
|
3,702
|
|
3,754
|
|
3,485
|
|
||||||
|
Nuclear Power Group
|
13,751
|
|
3,459
|
|
3,081
|
|
||||||
|
Other
|
—
|
|
—
|
|
550
|
|
||||||
|
Segment Depreciation and Amortization
|
48,742
|
|
41,577
|
|
45,952
|
|
||||||
|
Corporate Depreciation and Amortization
|
7,815
|
|
8,977
|
|
11,211
|
|
||||||
|
Total Depreciation and Amortization
|
$
|
56,557
|
|
$
|
50,554
|
|
$
|
57,163
|
|
|||
|
December 31,
|
||||||||||||
|
2017
|
2016
|
2015
|
||||||||||
|
(In thousands)
|
||||||||||||
|
SEGMENT ASSETS:
|
||||||||||||
|
Nuclear Operations Group
|
$
|
947,055
|
|
$
|
854,310
|
|
$
|
777,885
|
|
|||
|
Nuclear Services Group
|
161,948
|
|
169,850
|
|
163,810
|
|
||||||
|
Nuclear Power Group
|
313,959
|
|
315,687
|
|
127,549
|
|
||||||
|
Other
|
2,511
|
|
3,156
|
|
2,430
|
|
||||||
|
Total Segment Assets
|
1,425,473
|
|
1,343,003
|
|
1,071,674
|
|
||||||
|
Corporate Assets
|
286,866
|
|
236,812
|
|
303,724
|
|
||||||
|
Total Assets
|
$
|
1,712,339
|
|
$
|
1,579,815
|
|
$
|
1,375,398
|
|
|||
|
INVESTMENT IN UNCONSOLIDATED AFFILIATES:
|
||||||||||||
|
Nuclear Operations Group
|
$
|
—
|
|
$
|
—
|
|
$
|
—
|
|
|||
|
Nuclear Services Group
|
43,266
|
|
41,491
|
|
32,088
|
|
||||||
|
Nuclear Power Group
|
—
|
|
—
|
|
—
|
|
||||||
|
Other
|
—
|
|
1,363
|
|
—
|
|
||||||
|
Total Investment in Unconsolidated Affiliates
|
$
|
43,266
|
|
$
|
42,854
|
|
$
|
32,088
|
|
|||
99
2. Information about our Product and Service Lines:
|
|
Year Ended December 31,
|
|||||||||||
|
|
2017
|
2016
|
2015
|
|||||||||
|
|
(In thousands)
|
|||||||||||
|
REVENUES:
|
||||||||||||
|
Nuclear Operations Group:
|
||||||||||||
|
Nuclear Component Program
|
$
|
1,262,792
|
|
$
|
1,259,336
|
|
$
|
1,179,662
|
|
|||
|
Commercial Operations
|
8,932
|
|
9,813
|
|
51
|
|
||||||
|
Eliminations/Other
|
137
|
|
123
|
|
183
|
|
||||||
|
1,271,861
|
|
1,269,272
|
|
1,179,896
|
|
|||||||
|
Nuclear Services Group:
|
||||||||||||
|
Nuclear Environmental Services
|
101,056
|
|
86,425
|
|
75,218
|
|
||||||
|
Management & Operation Contracts of U.S. Government Facilities
|
9,746
|
|
10,794
|
|
8,589
|
|
||||||
|
Nuclear Services and Advanced Reactor Design and Engineering
|
26,447
|
|
30,814
|
|
37,474
|
|
||||||
|
Eliminations/Other
|
—
|
|
(12
|
)
|
(34
|
)
|
||||||
|
137,249
|
|
128,021
|
|
121,247
|
|
|||||||
|
Nuclear Power Group:
|
||||||||||||
|
Nuclear Services and Engineering
|
126,900
|
|
96,529
|
|
76,557
|
|
||||||
|
Nuclear Components
|
158,931
|
|
65,043
|
|
44,504
|
|
||||||
|
Eliminations/Other
|
—
|
|
—
|
|
—
|
|
||||||
|
285,831
|
|
161,572
|
|
121,061
|
|
|||||||
|
Other:
|
—
|
|
—
|
|
—
|
|
||||||
|
Eliminations
|
(7,203
|
)
|
(8,292
|
)
|
(6,675
|
)
|
||||||
|
$
|
1,687,738
|
|
$
|
1,550,573
|
|
$
|
1,415,529
|
|
||||
3. Information about our Consolidated Operations in Different Geographic Areas:
|
|
Year Ended December 31,
|
|||||||||||
|
|
2017
|
2016
|
2015
|
|||||||||
|
|
(In thousands)
|
|||||||||||
|
REVENUES
(1)
:
|
||||||||||||
|
U.S.
|
$
|
1,408,817
|
|
$
|
1,397,505
|
|
$
|
1,306,811
|
|
|||
|
Canada
|
245,073
|
|
124,964
|
|
88,380
|
|
||||||
|
China
|
26,228
|
|
13,033
|
|
10,657
|
|
||||||
|
Romania
|
2,781
|
|
10,743
|
|
6,106
|
|
||||||
|
All Other Countries
|
4,839
|
|
4,328
|
|
3,575
|
|
||||||
|
$
|
1,687,738
|
|
$
|
1,550,573
|
|
$
|
1,415,529
|
|
||||
|
(1)
|
We allocate geographic revenues based on the location of the customers' operations.
|
|
December 31,
|
||||||||||||
|
2017
|
2016
|
2015
|
||||||||||
|
(In thousands)
|
||||||||||||
|
NET PROPERTY, PLANT AND EQUIPMENT:
|
||||||||||||
|
U.S.
|
$
|
308,561
|
|
$
|
256,672
|
|
$
|
250,867
|
|
|||
|
Canada
|
40,068
|
|
43,014
|
|
17,977
|
|
||||||
|
$
|
348,629
|
|
$
|
299,686
|
|
$
|
268,844
|
|
||||
4. Information about our Major Customers:
In the years ended
December 31, 2017
,
2016
and
2015
, U.S. Government contracts accounted for approximately
81%
,
87%
and
88%
of our total consolidated revenues, respectively. Substantially all of these revenues are included in our Nuclear Operations Group and Nuclear Services Group segments.
100
NOTE
17
– QUARTERLY FINANCIAL DATA (UNAUDITED)
The following tables set forth selected unaudited quarterly financial information for the years ended
December 31, 2017
and
2016
:
|
|
Year Ended December 31, 2017
Quarter Ended |
|||||||||||||||
|
|
March 31,
2017 |
June 30,
2017 |
September 30,
2017 |
December 31,
2017 |
||||||||||||
|
|
(In thousands, except per share amounts)
|
|||||||||||||||
|
Revenues
|
$
|
428,229
|
|
$
|
410,011
|
|
$
|
419,360
|
|
$
|
430,138
|
|
||||
|
Operating income
(1)
|
$
|
83,205
|
|
$
|
92,347
|
|
$
|
73,681
|
|
$
|
59,652
|
|
||||
|
Equity in income of investees
|
$
|
3,875
|
|
$
|
3,327
|
|
$
|
3,630
|
|
$
|
2,780
|
|
||||
|
Net income attributable to BWX Technologies, Inc.
|
$
|
55,719
|
|
$
|
61,263
|
|
$
|
46,553
|
|
$
|
(15,691
|
)
|
||||
|
Earnings per common share:
|
||||||||||||||||
|
Basic:
|
||||||||||||||||
|
Net income attributable to BWX Technologies, Inc.
|
$
|
0.56
|
|
$
|
0.62
|
|
$
|
0.47
|
|
$
|
(0.16
|
)
|
||||
|
Diluted:
|
||||||||||||||||
|
Net income attributable to BWX Technologies, Inc.
|
$
|
0.55
|
|
$
|
0.61
|
|
$
|
0.46
|
|
$
|
(0.16
|
)
|
||||
|
(1)
|
Includes equity in income of investees.
|
|
|
Year Ended December 31, 2016
Quarter Ended |
|||||||||||||||
|
|
March 31,
2016 |
June 30,
2016 |
September 30,
2016 |
December 31,
2016 |
||||||||||||
|
|
(In thousands, except per share amounts)
|
|||||||||||||||
|
Revenues
|
$
|
364,826
|
|
$
|
402,382
|
|
$
|
379,505
|
|
$
|
403,860
|
|
||||
|
Operating income
(1)
|
$
|
42,609
|
|
$
|
88,458
|
|
$
|
62,373
|
|
$
|
45,823
|
|
||||
|
Equity in income of investees
|
$
|
3,533
|
|
$
|
4,708
|
|
$
|
5,008
|
|
$
|
2,820
|
|
||||
|
Net income attributable to BWX Technologies, Inc.
|
$
|
49,631
|
|
$
|
58,372
|
|
$
|
41,062
|
|
$
|
33,992
|
|
||||
|
Earnings per common share:
|
||||||||||||||||
|
Basic:
|
||||||||||||||||
|
Net income attributable to BWX Technologies, Inc.
|
$
|
0.48
|
|
$
|
0.56
|
|
$
|
0.40
|
|
$
|
0.34
|
|
||||
|
Diluted:
|
||||||||||||||||
|
Net income attributable to BWX Technologies, Inc.
|
$
|
0.47
|
|
$
|
0.56
|
|
$
|
0.39
|
|
$
|
0.34
|
|
||||
|
(1)
|
Includes equity in income of investees.
|
In the quarter ended June 30, 2017, we settled a contract dispute related to task order work that ended in 2013, which resulted in the recovery of
$7.9 million
of revenue. In the quarter ended December 31, 2017, we recognized
$53.0 million
of expense in our provision for income taxes related to significant changes to existing U.S. tax laws.
In the quarter ended March 31, 2016, we recorded a gain of approximately
$13.6 million
related to the deconsolidation of GmP and we recorded a
$30.0 million
loss contingency pursuant to the terms of the mPower Framework Agreement. We also recorded a gain of approximately
$9.3 million
related to the release from performance guarantees for various projects executed by our former Power Generation business. In the quarter ended June 30, 2016, we reversed a
$16.1 million
loss contingency resulting from a favorable ruling in a lawsuit involving commercial nuclear contracts.
We immediately recognize actuarial gains (losses) for our pension and postretirement benefit plans into earnings in the fourth quarter of each year as a component of net periodic benefit cost. Recorded in the quarters ended
December 31, 2017
and
2016
, the effects of these adjustments on pre-tax income were
$(11.1) million
and
$(21.3) million
, respectively.
101
NOTE
18
– EARNINGS PER SHARE
The following table sets forth the computation of basic and diluted earnings per share:
|
|
Year Ended December 31,
|
|||||||||||
|
|
2017
|
2016
|
2015
|
|||||||||
|
|
(In thousands, except shares and
per share amounts) |
|||||||||||
|
Basic:
|
||||||||||||
|
Income from continuing operations
|
$
|
147,844
|
|
$
|
183,057
|
|
$
|
140,774
|
|
|||
|
Income (loss) from discontinued operations
|
—
|
|
—
|
|
(9,309
|
)
|
||||||
|
Net income attributable to BWX Technologies, Inc.
|
$
|
147,844
|
|
$
|
183,057
|
|
$
|
131,465
|
|
|||
|
Weighted-average common shares
|
99,334,472
|
|
102,471,788
|
|
106,703,145
|
|
||||||
|
Basic earnings per common share:
|
||||||||||||
|
Income from continuing operations
|
$
|
1.49
|
|
$
|
1.79
|
|
$
|
1.32
|
|
|||
|
Income (loss) from discontinued operations
|
—
|
|
—
|
|
(0.09
|
)
|
||||||
|
Net income attributable to BWX Technologies, Inc.
|
$
|
1.49
|
|
$
|
1.79
|
|
$
|
1.23
|
|
|||
|
Diluted:
|
||||||||||||
|
Income from continuing operations
|
$
|
147,844
|
|
$
|
183,057
|
|
$
|
140,774
|
|
|||
|
Income (loss) from discontinued operations
|
—
|
|
—
|
|
(9,309
|
)
|
||||||
|
Net income attributable to BWX Technologies, Inc.
|
$
|
147,844
|
|
$
|
183,057
|
|
$
|
131,465
|
|
|||
|
Weighted-average common shares (basic)
|
99,334,472
|
|
102,471,788
|
|
106,703,145
|
|
||||||
|
Effect of dilutive securities:
|
||||||||||||
|
Stock options, restricted stock units and performance shares
(1)
|
1,034,718
|
|
1,368,950
|
|
879,877
|
|
||||||
|
Adjusted weighted-average common shares
|
100,369,190
|
|
103,840,738
|
|
107,583,022
|
|
||||||
|
Diluted earnings per common share:
|
||||||||||||
|
Income from continuing operations
|
$
|
1.47
|
|
$
|
1.76
|
|
$
|
1.31
|
|
|||
|
Income (loss) from discontinued operations
|
—
|
|
—
|
|
(0.09
|
)
|
||||||
|
Net income attributable to BWX Technologies, Inc.
|
$
|
1.47
|
|
$
|
1.76
|
|
$
|
1.22
|
|
|||
|
(1)
|
At
December 31, 2017
,
2016
and
2015
, we excluded
41,854
,
0
and
20,148
shares, respectively, from our diluted share calculation as their effect would have been antidilutive.
|
102
|
Item 9.
|
CHANGES IN AND DISAGREEMENTS WITH ACCOUNTANTS ON ACCOUNTING AND FINANCIAL DISCLOSURE
|
None.
|
Item 9A.
|
CONTROLS AND PROCEDURES
|
Disclosure Controls and Procedures
As of the end of the period covered by this Report, we carried out an evaluation, under the supervision and with the participation of our management, including our Chief Executive Officer and Chief Financial Officer, of the effectiveness of the design and operation of our disclosure controls and procedures (as that term is defined in Rules 13a-15(e) and 15d-15(e) adopted by the SEC under the Securities Exchange Act of 1934, as amended (the "Exchange Act")). Our disclosure controls and procedures were developed through a process in which our management applied its judgment in assessing the costs and benefits of such controls and procedures, which, by their nature, can provide only reasonable assurance regarding the control objectives. It should be noted that the design of any system of disclosure controls and procedures is based in part upon various assumptions about the likelihood of future events, and we cannot assure that any design will succeed in achieving its stated goals under all potential future conditions, regardless of how remote. Based on the evaluation referred to above, our Chief Executive Officer and Chief Financial Officer concluded that our disclosure controls and procedures are effective as of
December 31, 2017
to provide reasonable assurance that information required to be disclosed by us in the reports that we file or submit under the Exchange Act is recorded, processed, summarized and reported within the time periods specified in the rules and forms of the SEC and such information is accumulated and communicated to management, including its principal executives and principal financial officers or persons performing similar functions, as appropriate to allow timely decisions regarding required disclosure.
Management's Report on Internal Control Over Financial Reporting
Our management is responsible for establishing and maintaining adequate internal control over financial reporting (as that term is defined in Rules 13a-15(f) and 15d-15(f) under the Exchange Act) and for our assessment of the effectiveness of internal control over financial reporting.
Our internal control over financial reporting includes policies and procedures that (1) pertain to the maintenance of records that, in reasonable detail, accurately and fairly reflect the transactions and dispositions of our assets; (2) provide reasonable assurance that transactions are recorded as necessary to permit preparation of our consolidated financial statements in accordance with generally accepted accounting principles, and that receipts and expenditures are being made only in accordance with authorizations of our management and Board of Directors; and (3) provide reasonable assurance regarding prevention or timely detection of unauthorized acquisition, use or disposition of our assets that could have a material effect on the consolidated financial statements.
Because of its inherent limitations, internal control over financial reporting may not prevent or detect misstatements. Also, projections of any evaluation of effectiveness to future periods are subject to the risk that controls may become inadequate because of changes in conditions, or that the degree of compliance with the policies or procedures may deteriorate.
Our management, including our Chief Executive Officer and Chief Financial Officer, has conducted an assessment of the effectiveness of our internal control over financial reporting as of
December 31, 2017
, based on the framework established in
Internal Control – Integrated Framework (2013)
issued by the Committee of Sponsoring Organizations of the Treadway Commission. This assessment included an evaluation of the design of our internal control over financial reporting and testing of the operational effectiveness of those controls. Based on our assessment under the criteria described above, management has concluded that our internal control over financial reporting was effective as of
December 31, 2017
. Deloitte & Touche LLP has issued an attestation report on our internal control over financial reporting as of
December 31, 2017
, and their report is included in Item 9A.
Changes in Internal Control Over Financial Reporting
There has been no change in our internal control over financial reporting during the quarter ended
December 31, 2017
that has materially affected, or is reasonably likely to materially affect, our internal control over financial reporting.
103
Report of Independent Registered Public Accounting Firm
To the Board of Directors and Stockholders of BWX Technologies, Inc.:
Opinion on Internal Control over Financial Reporting
We have audited the internal control over financial reporting of BWX Technologies, Inc. and subsidiaries (the "Company") as of December 31, 2017, based on criteria established in Internal Control - Integrated Framework (2013) issued by the Committee of Sponsoring Organizations of the Treadway Commission (COSO). In our opinion, the Company maintained, in all material respects, effective internal control over financial reporting as of December 31, 2017, based on criteria established in Internal Control - Integrated Framework (2013) issued by COSO.
We have also audited, in accordance with the standards of the Public Company Accounting Oversight Board (United States) (PCAOB), the consolidated financial statements as of and for the year ended December 31, 2017 of the Company and our report dated February 27, 2018 expressed an unqualified opinion on those financial statements.
Basis for Opinion
The Company’s management is responsible for maintaining effective internal control over financial reporting and for its assessment of the effectiveness of internal control over financial reporting, included in the accompanying
Management's Report on Internal Control over Financial Reporting
. Our responsibility is to express an opinion on the Company's internal control over financial reporting based on our audit. We are a public accounting firm registered with the PCAOB and are required to be independent with respect to the Company in accordance with the U.S. federal securities laws and the applicable rules and regulations of the Securities and Exchange Commission and the PCAOB.
We conducted our audit in accordance with the standards of the PCAOB. Those standards require that we plan and perform the audit to obtain reasonable assurance about whether effective internal control over financial reporting was maintained in all material respects. Our audit included obtaining an understanding of internal control over financial reporting, assessing the risk that a material weakness exists, testing and evaluating the design and operating effectiveness of internal control based on the assessed risk, and performing such other procedures as we considered necessary in the circumstances. We believe that our audit provides a reasonable basis for our opinion.
Definition and Limitations of Internal Control over Financial Reporting
A company's internal control over financial reporting is a process designed to provide reasonable assurance regarding the reliability of financial reporting and the preparation of financial statements for external purposes in accordance with generally accepted accounting principles. A company's internal control over financial reporting includes those policies and procedures that (1) pertain to the maintenance of records that, in reasonable detail, accurately and fairly reflect the transactions and dispositions of the assets of the company; (2) provide reasonable assurance that transactions are recorded as necessary to permit preparation of financial statements in accordance with generally accepted accounting principles, and that receipts and expenditures of the company are being made only in accordance with authorizations of management and directors of the company; and (3) provide reasonable assurance regarding prevention or timely detection of unauthorized acquisition, use, or disposition of the company's assets that could have a material effect on the financial statements.
Because of its inherent limitations, internal control over financial reporting may not prevent or detect misstatements. Also, projections of any evaluation of effectiveness to future periods are subject to the risk that controls may become inadequate because of changes in conditions, or that the degree of compliance with the policies or procedures may deteriorate.
/S/ DELOITTE & TOUCHE LLP
Charlotte, North Carolina
February 27, 2018
|
Item 9B.
|
OTHER INFORMATION
|
None.
104
|
Item 10.
|
DIRECTORS, EXECUTIVE OFFICERS AND CORPORATE GOVERNANCE
|
The information required by this item with respect to directors and executive officers is incorporated by reference to the material appearing under the headings "Election of Directors," "Named Executive Profiles," and "Executive Officer Profiles" in the Proxy Statement for our
2018
Annual Meeting of Stockholders. The information required by this item with respect to compliance with section 16(a) of the Securities and Exchange Act of 1934, as amended, is incorporated by reference to the material appearing under the heading "Section 16(a) Beneficial Ownership Compliance" in the Proxy Statement for our
2018
Annual Meeting of Stockholders. The information required by this item with respect to the Audit Committee and Audit and Finance Committee financial experts is incorporated by reference to the material appearing in "Director Independence" and "Audit and Finance Committee" under the heading "Corporate Governance – Board of Directors and Its Committees" in the Proxy Statement for our
2018
Annual Meeting of Stockholders.
We have adopted a Code of Business Conduct for our employees and directors, including, specifically, our chief executive officer, our chief financial officer, our chief accounting officer and our other executive officers. Our code satisfies the requirements for a "code of ethics" within the meaning of SEC rules. A copy of the code is posted on our web site,
www.bwxt.com
under "Investor Relations – Corporate Governance – Highlights."
|
Item 11.
|
EXECUTIVE COMPENSATION
|
The information required by this item is incorporated by reference to the material appearing under the headings "Compensation Discussion and Analysis," "Compensation of Directors," "Compensation of Executive Officers," "Compensation Committee Interlocks and Insider Participation" section under the heading "Corporate Governance – Board of Directors and Its Committees," and "Compensation Committee Report" in the Proxy Statement for our
2018
Annual Meeting of Stockholders.
|
Item 12.
|
SECURITY OWNERSHIP OF CERTAIN BENEFICIAL OWNERS AND MANAGEMENT AND RELATED STOCKHOLDER MATTERS
|
The information required by this item is incorporated by reference to the material appearing under the headings "Equity Compensation Plan Information" and "Security Ownership of Certain Beneficial Owners" in the Proxy Statement for our
2018
Annual Meeting of Stockholders.
|
Item 13.
|
CERTAIN RELATIONSHIPS AND RELATED TRANSACTIONS, AND DIRECTOR INDEPENDENCE
|
Information required by this item is incorporated by reference to the material appearing under the headings "Corporate Governance – Director Independence" and "Certain Relationships and Related Transactions" in the Proxy Statement for our
2018
Annual Meeting of Stockholders.
|
Item 14.
|
PRINCIPAL ACCOUNTING FEES AND SERVICES
|
The information required by this item is incorporated by reference to the material appearing under the heading "Ratification of Appointment of Independent Registered Public Accounting Firm for Year Ending December 31,
2018
" in the Proxy Statement for our
2018
Annual Meeting of Stockholders.
105
|
Item 15.
|
EXHIBITS, FINANCIAL STATEMENT SCHEDULES
|
The following documents are filed as part of this Report or incorporated by reference:
|
1.
|
CONSOLIDATED FINANCIAL STATEMENTS
|
Report of Independent Registered Public Accounting Firm
Consolidated Balance Sheets as of December 31,
2017
and
2016
Consolidated Statements of Income for the Years Ended December 31,
2017
,
2016
and
2015
Consolidated Statements of Comprehensive Income for the Years Ended December 31,
2017
,
2016
and
2015
Consolidated Statements of Stockholders' Equity for the Years Ended December 31,
2017
,
2016
and
2015
Consolidated Statements of Cash Flows for the Years Ended December 31,
2017
,
2016
and
2015
Notes to Consolidated Financial Statements for the Years Ended December 31,
2017
,
2016
and
2015
|
2.
|
CONSOLIDATED FINANCIAL STATEMENT SCHEDULES
|
All schedules for which provision is made of the applicable regulations of the SEC have been omitted because they are not required under the relevant instructions or because the required information is included in the financial statements or the related footnotes contained in this Report.
|
3.
|
EXHIBITS
|
|
Exhibit Number
|
Description
|
|
|
2.1
|
||
|
2.2
|
||
|
3.1
|
||
|
3.2
|
||
|
3.3
|
||
|
3.4
|
||
|
4.1
|
||
|
4.2
|
||
|
4.3
|
||
106
|
Exhibit Number
|
Description
|
|
|
4.4
|
||
|
10.1
|
||
|
10.2
|
||
|
10.3
|
||
|
10.4*
|
||
|
10.5*
|
||
|
10.6*
|
||
|
10.7*
|
||
|
10.8*
|
||
|
10.9*
|
||
|
10.10*
|
||
|
10.11*
|
||
|
10.12*
|
||
|
10.13*
|
||
|
10.14*
|
||
|
10.15*
|
||
|
10.16*
|
||
107
|
Exhibit Number
|
Description
|
|
|
10.17*
|
||
|
10.18*
|
||
|
10.19*
|
||
|
10.20*
|
||
|
10.21*
|
||
|
10.22*
|
||
|
10.23*
|
||
|
10.24*
|
||
|
10.25*
|
||
|
10.26*
|
||
|
10.27*
|
||
|
10.28*
|
||
|
10.29*
|
||
|
10.30*
|
||
|
10.31*
|
||
|
10.32*
|
||
|
10.33*
|
||
108
|
Exhibit Number
|
Description
|
|
|
10.34*
|
||
|
10.35*
|
||
|
10.36*
|
||
|
10.37
|
||
|
10.38*
|
||
|
10.39*
|
||
|
10.40*
|
||
|
10.41*
|
||
|
10.42*
|
||
|
10.43*
|
||
|
10.44*
|
||
|
10.45*
|
||
|
10.46*
|
||
|
10.47
|
||
|
10.48
|
||
|
10.49
|
||
109
|
Exhibit Number
|
Description
|
|
|
10.50
|
||
|
10.51
|
||
|
10.52*
|
||
|
10.53
|
||
|
10.54
|
||
|
10.55*
|
||
|
10.56*
|
||
|
21.1
|
||
|
23.1
|
||
|
31.1
|
||
|
31.2
|
||
|
32.1
|
||
|
32.2
|
||
|
101.INS
|
XBRL Instance Document
|
|
|
101.SCH
|
XBRL Taxonomy Extension Schema Document
|
|
|
101.CAL
|
XBRL Taxonomy Extension Calculation Linkbase Document
|
|
|
101.LAB
|
XBRL Taxonomy Extension Label Linkbase Document
|
|
|
101.PRE
|
XBRL Taxonomy Extension Presentation Linkbase Document
|
|
|
101.DEF
|
XBRL Taxonomy Extension Definition Linkbase Document
|
|
|
*
|
Management contract or compensatory plan or arrangement.
|
|
Item 16.
|
FORM 10-K SUMMARY
|
None.
110
SIGNATURES
Pursuant to the requirements of Section 13 or 15(d) of the Securities Exchange Act of 1934, the registrant has duly caused this Report to be signed on its behalf by the undersigned, thereunto duly authorized.
|
|
BWX TECHNOLOGIES, INC.
|
||
|
|
/s/ Rex D. Geveden
|
||
|
February 27, 2018
|
By:
|
|
Rex D. Geveden
|
|
|
President and Chief Executive Officer
|
||
Pursuant to the requirements of the Securities Exchange Act of 1934, this Report has been signed below by the following persons on behalf of the registrant and in the capacities indicated and on the date indicated.
|
Signature
|
Title
|
|
|
/s/ Rex D. Geveden
|
President and Chief Executive Officer
|
|
|
Rex D. Geveden
|
(Principal Executive Officer)
|
|
|
/s/ David S. Black
|
Senior Vice President and Chief Financial Officer
|
|
|
David S. Black
|
(Principal Financial Officer and Duly Authorized Representative)
|
|
|
/s/ Jason S. Kerr
|
Vice President and Chief Accounting Officer
|
|
|
Jason S. Kerr
|
(Principal Accounting Officer and Duly Authorized Representative)
|
|
|
/s/ John A. Fees
|
Executive Chairman
|
|
|
John A. Fees
|
||
|
/s/ Jan A. Bertsch
|
Director
|
|
|
Jan A. Bertsch
|
||
|
/s/ Robb A. LeMasters
|
Director
|
|
|
Robb A. LeMasters
|
||
|
/s/ Charles W. Pryor
|
Director
|
|
|
Charles W. Pryor
|
||
|
/s/ Richard W. Mies
|
Director
|
|
|
Richard W. Mies
|
||
|
/s/ Robert L. Nardelli
|
Director
|
|
|
Robert L. Nardelli
|
||
|
/s/ Robert W. Goldman
|
Director
|
|
|
Robert W. Goldman
|
||
|
/s/ James M. Jaska
|
Director
|
|
|
James M. Jaska
|
||
|
/s/ Kenneth J. Krieg
|
Director
|
|
|
Kenneth J. Krieg
|
||
|
/s/ Barbara A. Niland
|
Director
|
|
|
Barbara A. Niland
|
||
February 27, 2018
111
TABLE OF CONTENTS
Part IItem 1. BusinessItem 1A. Risk FactorsItem 1B. Unresolved Staff CommentsItem 2. PropertiesItem 3. Legal ProceedingsItem 4. Mine Safety DisclosuresPart IIItem 5. Market For Registrant's Common Equity, Related Stockholder Matters and Issuer Purchases Of Equity SecuritiesItem 6. Selected Financial DataItem 7. Management's Discussion and Analysis Of Financial Condition and Results Of OperationsItem 7A. Quantitative and Qualitative Disclosures About Market RiskItem 8. Financial Statements and Supplementary DataNote 1 Basis Of Presentation and Significant Accounting PoliciesNote 2 AcquisitionsNote 3 Discontinued OperationsNote 4 Equity Method InvestmentsNote 5 Income TaxesNote 6 Long-term DebtNote 7 Pension Plans and Postretirement BenefitsNote 8 Capital StockNote 9 Stock-based CompensationNote 10 Commitments and ContingenciesNote 11 Risks and UncertaintiesNote 12 Financial Instruments with Concentrations Of Credit RiskNote 13 InvestmentsNote 14 Derivative Financial InstrumentsNote 15 Fair Value MeasurementsNote 16 Segment ReportingNote 17 Quarterly Financial Data (unaudited)Note 18 Earnings Per ShareItem 9. Changes in and Disagreements with Accountants on Accounting and Financial DisclosureItem 9A. Controls and ProceduresItem 9B. Other InformationPart IIIItem 10. Directors, Executive Officers and Corporate GovernanceItem 11. Executive CompensationItem 12. Security Ownership Of Certain Beneficial Owners and Management and Related Stockholder MattersItem 13. Certain Relationships and Related Transactions, and Director IndependenceItem 14. Principal Accounting Fees and ServicesPart IVItem 15. Exhibits, Financial Statement SchedulesItem 16. Form 10-k Summary