BLACKSTONE GROUP INC
10-Ks and 10-Qs
UNITED STATES
SECURITIES AND EXCHANGE COMMISSION
WASHINGTON, D.C. 20549
FORM
10-K
(Mark One)
|
|
ANNUAL REPORT PURSUANT TO SECTION 13 OR 15(d) OF THE SECURITIES EXCHANGE ACT OF 1934 FOR THE FISCAL YEAR ENDED
|
OR
|
|
TRANSITION REPORT PURSUANT TO SECTION 13 OR 15(d) OF THE SECURITIES EXCHANGE ACT OF 1934 FOR THE TRANSITION PERIOD FROM TO
|
Commission File Number:
001-33551

(Exact name of registrant as specified in its charter)
|
|
|
|
|
(State or other jurisdiction of
incorporation or organization)
|
(I.R.S. Employer
Identification No.)
|
(Address of principal executive offices)(Zip Code)
(
212
)
583-5000
(Registrant’s telephone number, including area code)
Securities registered pursuant to Section 12(b) of the Act:
|
Title of each class
|
Trading Symbol(s)
|
Name of each exchange on which registered
|
||
|
|
|
|
Securities registered pursuant to Section 12(g) of the Act: None
Indicate by check mark if the registrant is a well-known seasoned issuer, as defined in Rule 405 of the Securities Act.
Yes
☒
No
☐
Indicate by check mark if the registrant is not required to file reports pursuant to Section 13 or Section 15(d) of the Act. Yes
No
☐
☒
Indicate by check mark whether the registrant (1) has filed all reports required to be filed by Section 13 or 15(d) of the Securities Exchange Act of 1934 during the preceding 12 months (or for such shorter period that the registrant was required to file such reports), and (2) has been subject to such filing requirements for the past 90 days.
Yes
☒
No
☐
Indicate by check mark whether the registrant has submitted electronically every Interactive Data File required to be submitted pursuant to Rule 405 of Regulation S-T (§232.405 of this chapter) during the preceding 12 months (or for such shorter period that the registrant was required to submit such files).
Yes
☒
No
☐
Indicate by check mark whether the registrant is a large accelerated filer, an accelerated filer, a non-accelerated filer, smaller reporting company, or an emerging growth company. See the definitions of “large accelerated filer,” “accelerated filer,” “smaller reporting company,” and “emerging growth company” in Rule 12b-2 of the Exchange Act.
|
☒
|
Accelerated filer
☐
|
|
|
Non-accelerated
filer
☐
|
Smaller reporting company
|
|
|
Emerging growth company
|
If an emerging growth company, indicate by check mark if the registrant has elected not to use the extended transition period for complying with any new or revised financial accounting standards provided pursuant to Section 13(a) of the Exchange Act.
☐
Indicate by check mark whether the registrant has filed a report on and attestation to its management’s assessment of the effectiveness of its internal control over financial reporting under Section 404(b) of the Sarbanes-Oxley Act (15 U.S.C. 7262(b)) by the registered public accounting firm that prepared or issued its audit report.
☒
If securities are registered pursuant to Section 12(b) of the Act, indicate by check mark whether the financial statements of the registrant included in the filing reflect the correction of an error to previously issued financial statements.
☐
Indicate by check mark whether any of those error corrections are restatements that required a recovery analysis of incentive-based compensation received by any of the registrant’s executive officers during the relevant recovery period pursuant to §240.10D-1(b).
☐
Indicate by check mark whether the registrant is a shell company (as defined in Rule 12b-2 of the Act). Yes
☒
☐
No
As of June 30, 2023, the aggregate market value of the shares of common stock held by non-affiliates of the registrant was $
65.5
billion.
As of February 16, 2024, there were
714,644,445
shares of common stock of the registrant outstanding.
DOCUMENTS INCORPORATED BY REFERENCE
None
Table of Contents
|
Page
|
||||||
|
Item 1.
|
|
7
|
|
|||
|
Item 1A.
|
|
24
|
|
|||
|
Item 1B.
|
|
81
|
|
|||
|
Item 1C.
|
|
81
|
|
|||
|
Item 2.
|
|
83
|
|
|||
|
Item 3.
|
|
83
|
|
|||
|
Item 4.
|
|
83
|
|
|||
|
Item 5.
|
|
84
|
|
|||
|
Item 6.
|
|
86
|
|
|||
|
Item 7.
|
|
86
|
|
|||
|
Item 7A.
|
|
149
|
|
|||
|
Item 8.
|
|
153
|
|
|||
|
Item 8A.
|
|
228
|
|
|||
|
Item 9.
|
|
231
|
|
|||
|
Item 9A.
|
|
231
|
|
|||
|
Item 9B.
|
|
232
|
|
|||
|
Item 9C.
|
|
232
|
|
|||
|
Item 10.
|
|
233
|
|
|||
|
Item 11.
|
|
240
|
|
|||
|
Item 12.
|
|
260
|
|
|||
|
Item 13.
|
|
264
|
|
|||
|
Item 14.
|
|
270
|
|
|||
|
Item 15.
|
|
271
|
|
|||
|
Item 16.
|
|
287
|
|
|||
|
|
288
|
|
||||
1
Forward-Looking Statements
This report may contain forward-looking statements within the meaning of Section 27A of the U.S. Securities Act of 1933, as amended, and Section 21E of the U.S. Securities Exchange Act of 1934, as amended, which reflect our current views with respect to, among other things, our operations, taxes, earnings and financial performance, share repurchases and dividends. You can identify these forward-looking statements by the use of words such as “outlook,” “indicator,” “believes,” “expects,” “potential,” “continues,” “may,” “will,” “should,” “seeks,” “approximately,” “predicts,” “intends,” “plans,” “scheduled,” “estimates,” “anticipates,” “opportunity,” “leads,” “forecast” or the negative version of these words or other comparable words. Such forward-looking statements are subject to various risks and uncertainties. Accordingly, there are or will be important factors that could cause actual outcomes or results to differ materially from those indicated in these statements. We believe these factors include but are not limited to those described under the section entitled “Risk Factors” in this report, as such factors may be updated from time to time in our periodic filings with the United States Securities and Exchange Commission (“SEC”), which are accessible on the SEC’s website at www.sec.gov. These factors should not be construed as exhaustive and should be read in conjunction with the other cautionary statements that are included in this report and in our other periodic filings. The forward-looking statements speak only as of the date of this report, and we undertake no obligation to publicly update or review any forward-looking statement, whether as a result of new information, future developments or otherwise.
Risk Factor Summary
The following is only a summary of the principal risks that may materially adversely affect our business, financial condition, results of operations and cash flows. The following should be read in conjunction with the more complete discussion of the risk factors we face, which are set forth more fully in “Part I. Item 1A. Risk Factors.”
Risks Related to Our Business
|
•
|
Our business could be adversely affected by difficult market and economic conditions, including an economic slowdown, as well as geopolitical conditions or other global events, such as a pandemic or global health crisis, each of which could materially reduce our revenue, earnings and cash flow and adversely affect our operating results and financial prospects and condition.
|
|
•
|
An increase in interest rates and other changes in the financial markets could negatively impact the values of certain assets or investments and the ability of our funds and their portfolio companies to access the capital markets on attractive terms, which could adversely affect investment and realization opportunities.
|
|
•
|
A decline in the pace or size of investments made by, or poor performance of, our funds may adversely affect our revenues and obligate us to repay Performance Allocations previously paid to us, and could adversely affect our ability to raise capital.
|
|
•
|
Our revenue, earnings, net income and cash flow can all vary materially, which may make it difficult for us to achieve steady earnings growth on a quarterly basis.
|
|
•
|
The asset management business depends in large part on our ability to raise capital from third party investors and is intensely competitive.
|
|
•
|
Our business could be adversely affected by the loss of services from our co-founder and other key senior managing directors and personnel or future difficulty in recruiting and retaining professionals.
|
|
•
|
Changes in U.S. and foreign taxation of businesses and other tax laws, regulations or treaties could adversely affect us, including by adversely impacting our effective tax rate and tax liability.
|
|
•
|
Cybersecurity or other operational risks could result in the loss of data, interruptions in our business and damage to our reputation, and subject us to regulatory actions, increased costs and financial losses.
|
2
|
•
|
Technological developments in artificial intelligence could disrupt the markets in which we operate and subject us to increased competition, legal and regulatory risks and compliance costs.
|
|
•
|
Extensive regulation of our businesses affects our activities, creates the potential for significant liabilities and penalties, may make it more difficult for us to deploy capital in certain jurisdictions or sell assets to certain buyers, and could result in additional burdens on our business.
|
|
•
|
We are subject to increasing scrutiny from regulators and certain investors with respect to the environmental, social and governance impacts of investments made by our funds.
|
|
•
|
Climate change, climate change-related regulation and sustainability concerns could adversely affect our businesses and the operations of our portfolio companies, and any actions we take or fail to take in response to such matters could damage our reputation.
|
|
•
|
Employee misconduct could impair our ability to attract and retain clients and subject us to legal liability and reputational harm. Fraud, deceptive practices or other misconduct at portfolio companies or service providers could similarly subject us to liability and reputational damage and harm performance.
|
|
•
|
We are subject to substantial litigation risks and may face significant liabilities and damage to our reputation as a result of allegations of improper conduct and negative publicity.
|
|
•
|
Certain policies and procedures implemented to mitigate potential conflicts of interest and other risk management activities may reduce the synergies across our various businesses, and failure to deal appropriately with conflicts of interest could damage our reputation and adversely affect our businesses.
|
|
•
|
Valuation methodologies can be subject to a significant degree of subjectivity and judgment, and the expected fair value of assets may never be realized.
|
|
•
|
We may be unable to consummate or successfully integrate development opportunities or increase the number and type of investment products, including those offered to retail investors and insurance companies.
|
|
•
|
Dependence on significant leverage in investments by our funds could adversely affect our ability to achieve attractive rates of return on those investments.
|
|
•
|
Investors may have certain redemption, termination or dissolution rights or may not satisfy their contractual obligation to fund capital calls when requested by us.
|
|
•
|
Certain of our investment funds may invest in securities of companies that are experiencing significant financial or business difficulties.
|
|
•
|
Investments in certain assets and industries, such as energy, infrastructure and real estate, may expose us to risks inherent to those assets and industries, including environmental liabilities and increased operational, construction, regulatory and market risks.
|
|
•
|
Our funds’ and our performance may be adversely affected by inaccurate financial projections of our funds’ portfolio companies, contingent liabilities, counterparty defaults or forced disposal of investments at a disadvantageous time.
|
Risks Related to Our Organizational Structure
|
•
|
The significant voting power of holders of our Series I preferred stock and Series II preferred stock may limit the ability of holders of our common stock to influence our business.
|
|
•
|
We are not required to comply with certain provisions of U.S. securities laws relating to proxy statements and, as a controlled company, certain requirements of the New York Stock Exchange.
|
|
•
|
Our certificate of incorporation provides the Series II Preferred Stockholder with certain rights that may affect or conflict with the interests of the other stockholders and could materially alter our operations.
|
3
|
•
|
We are required to pay our senior managing directors for most of the benefits relating to certain additional tax depreciation or amortization deductions we may claim.
|
|
•
|
If Blackstone Inc. were deemed an “investment company” under the 1940 Act, applicable restrictions could make it impractical for us to continue our business as contemplated.
|
Risks Related to Our Common Stock
|
•
|
The price of our common stock may decline due to the large number of shares of common stock eligible for future sale and exchange.
|
|
•
|
Our certificate of incorporation provides us with a right to acquire all of the then outstanding shares of common stock under specified circumstances.
|
|
•
|
Our bylaws designate the Court of Chancery of the State of Delaware or U.S. federal district courts, as applicable, as the sole and exclusive forum for certain types of actions and proceedings.
|
In this report, references to “Blackstone,” the “Company,” “we,” “us” or “our” refer to Blackstone Inc. and its consolidated subsidiaries.
“Series I Preferred Stockholder” refers to Blackstone Partners L.L.C., the holder of the sole outstanding share of our Series I preferred stock.
“Series II Preferred Stockholder” refers to Blackstone Group Management L.L.C., the holder of the sole outstanding share of our Series II preferred stock.
“Blackstone Funds,” “our funds” and “our investment funds” refer to the funds and other vehicles that are managed by Blackstone. “Our carry funds” refers to funds managed by Blackstone that have commitment-based multi-year drawdown structures that pay carry on the realization of an investment.
“Our hedge funds” refers to our funds of hedge funds, hedge funds, certain of our real estate debt investment funds and certain other credit-focused funds which are managed by Blackstone.
We refer to our separately managed accounts as “SMAs.”
“Total Assets Under Management” refers to the assets we manage. Our Total Assets Under Management equals the sum of:
|
(a)
|
the fair value of the investments held by our carry funds and our side-by-side and co-investment entities managed by us plus the capital that we are entitled to call from investors in those funds and entities pursuant to the terms of their respective capital commitments, including capital commitments to funds that have yet to commence their investment periods,
|
|
(b)
|
the net asset value of (1) our hedge funds, real estate debt carry funds, Blackstone Property Partners (“BPP”) funds, certain co-investments managed by us, certain credit-focused funds and our Hedge Fund Solutions drawdown funds (plus, in each case, the capital that we are entitled to call from investors in those funds, including commitments yet to commence their investment periods) and (2) our funds of hedge funds, our Hedge Fund Solutions registered investment companies, Blackstone Real Estate Income Trust, Inc. (“BREIT”) and Blackstone European Property Income (“BEPIF”) funds,
|
|
(c)
|
the invested capital, fair value or net asset value of assets we manage pursuant to separately managed accounts,
|
|
(d)
|
the amount of debt and equity outstanding for our collateralized loan obligations (“CLO”) during the reinvestment period,
|
4
|
(e)
|
the aggregate par amount of collateral assets, including principal cash, for our CLOs after the reinvestment period,
|
|
(f)
|
the gross or net amount of assets (including leverage where applicable) for our credit-focused registered investment companies and business development companies (“BDCs”),
|
|
(g)
|
the fair value of common stock, preferred stock, convertible debt, term loans or similar instruments issued by Blackstone Mortgage Trust, Inc. (“BXMT”) and
|
|
(h)
|
borrowings under and any amounts available to be borrowed under certain credit facilities of our funds.
|
Our carry funds are commitment-based drawdown structured funds that do not permit investors to redeem their interests at their election. Our funds of hedge funds, hedge funds, funds structured like hedge funds and other open-ended funds in our Real Estate, Credit & Insurance and Hedge Fund Solutions segments generally have structures that afford an investor the right to withdraw or redeem their interests on a periodic basis (for example, annually, quarterly or monthly), typically with 2 to 95 days’ notice, depending on the fund and the liquidity profile of the underlying assets. In our Perpetual Capital vehicles where redemption rights exist, Blackstone has the ability to fulfill redemption requests only (a) in Blackstone’s or the vehicles’ board’s discretion, as applicable, or (b) to the extent there is sufficient new capital. Investment advisory agreements related to certain separately managed accounts in our Credit & Insurance and Hedge Fund Solutions segments, excluding our separately managed accounts in our insurance platform, may generally be terminated by an investor on 30 to 90 days’ notice. Separately managed accounts in our insurance platform can generally only be terminated for long-term underperformance, cause and certain other limited circumstances, in each case subject to Blackstone’s right to cure.
“Fee-Earning Assets Under Management” refers to the assets we manage on which we derive management fees and/or performance revenues. Our Fee-Earning Assets Under Management equals the sum of:
|
(a)
|
for our Private Equity segment funds, Real Estate segment carry funds including certain Blackstone Real Estate Debt Strategies (“BREDS”) funds and certain Hedge Fund Solutions funds, the amount of capital commitments, remaining invested capital, fair value, net asset value or par value of assets held, depending on the fee terms of the fund,
|
|
(b)
|
for our credit-focused carry funds, the amount of remaining invested capital (which may include leverage) or net asset value, depending on the fee terms of the fund,
|
|
(c)
|
the remaining invested capital or fair value of assets held in co-investment vehicles managed by us on which we receive fees,
|
|
(d)
|
the net asset value of our funds of hedge funds, hedge funds, BPP, certain co-investments managed by us, certain registered investment companies, BREIT, BEPIF and certain of our Hedge Fund Solutions drawdown funds,
|
|
(e)
|
the invested capital, fair value of assets or the net asset value we manage pursuant to separately managed accounts,
|
|
(f)
|
the net proceeds received from equity offerings and accumulated distributable earnings of BXMT, subject to certain adjustments,
|
|
(g)
|
the aggregate par amount of collateral assets, including principal cash, of our CLOs and
|
|
(h)
|
the gross amount of assets (including leverage) or the net assets (plus leverage where applicable) for certain of our credit-focused registered investment companies and BDCs.
|
Each of our segments may include certain Fee-Earning Assets Under Management on which we earn performance revenues but not management fees.
5
Our calculations of Total Assets Under Management and Fee-Earning Assets Under Management may differ from the calculations of other asset managers, and as a result this measure may not be comparable to similar measures presented by other asset managers. In addition, our calculation of Total Assets Under Management includes commitments to, and the fair value of, invested capital in our funds from Blackstone and our personnel, regardless of whether such commitments or invested capital are subject to fees. Our definitions of Total Assets Under Management and Fee-Earning Assets Under Management are not based on any definition of Total Assets Under Management and Fee-Earning Assets Under Management that is set forth in the agreements governing the investment funds that we manage.
For our carry funds, Total Assets Under Management includes the fair value of the investments held and uncalled capital commitments, whereas Fee-Earning Assets Under Management may include the total amount of capital commitments or the remaining amount of invested capital at cost, depending on whether the investment period has expired or as specified by the fee terms of the fund. As such, in certain carry funds Fee-Earning Assets Under Management may be greater than Total Assets Under Management when the aggregate fair value of the remaining investments is less than the cost of those investments.
“Perpetual Capital” refers to the component of assets under management with an indefinite term, that is not in liquidation, and for which there is no requirement to return capital to investors through redemption requests in the ordinary course of business, except where funded by new capital inflows. Perpetual Capital includes co-investment capital with an investor right to convert into Perpetual Capital.
This report does not constitute an offer of any Blackstone Fund.
6
Part I.
|
Item 1.
|
Business
|
Overview
Blackstone is the world’s largest alternative asset manager. We seek to deliver compelling returns for institutional and individual investors by strengthening the companies and assets in which we invest. Our more than $1.0 trillion in Total Assets Under Management as of December 31, 2023 include global investment strategies focused on real estate, private equity, infrastructure, life sciences, growth equity, credit, real assets, secondaries and hedge funds.
Our businesses use a solutions-oriented approach to drive better performance. We believe our scale, diversified business, long record of investment performance, rigorous investment process and strong client relationships position us to continue to perform well in a variety of market conditions, expand our assets under management, and innovate.
We invest across asset classes on behalf of our investors, including pension funds, insurance companies and individual investors. Our mission is to fulfill our fiduciary duty by creating long-term value for our investors. We aim to do this by strengthening the companies, real estate assets and other investments in our portfolio, equipping them to thrive in the global economy. To the extent our funds perform well, we can support a better retirement for tens of millions of pensioners, including teachers, nurses and firefighters.
As of December 31, 2023, we employed approximately 4,735 people, including our 239 senior managing directors, at our headquarters in New York and around the world. Our employees are integral to Blackstone’s culture of integrity, professionalism and excellence. We believe hiring, training and retaining talented individuals, coupled with our rigorous investment process, has supported our excellent investment record over many years. This record, in turn, has enabled us to innovate into new strategies, drive growth and better serve our investors.
Business Segments
Our four business segments are: (a) Real Estate, (b) Private Equity, (c) Credit & Insurance and (d) Hedge Fund Solutions.
Information about our business segments should be read together with “Part II. Item 7. Management’s Discussion and Analysis of Financial Condition and Results of Operations.”
For more information concerning the revenues and fees we derive from our business segments, see “— Fee Structure/Incentive Arrangements.”
Real Estate
Our Real Estate business is a global leader in real estate investing, with $336.9 billion of Total Assets Under Management as of December 31, 2023. Our Real Estate segment operates as one globally integrated business with approximately 870 employees and has investments across the globe, including in the Americas, Europe and Asia. Our real estate investment teams seek to utilize our global expertise and presence to generate attractive risk-adjusted returns for our investors.
7
Our Blackstone Real Estate Partners (“BREP”) business is geographically diversified and targets a broad range of opportunistic real estate and real estate-related investments. The BREP platform includes global funds as well as funds focused specifically on Europe or Asia investments. BREP seeks to invest thematically in high-quality assets, focusing where we see outsized growth potential driven by global economic and demographic trends. BREP has made significant investments in logistics, rental housing, hospitality, office and retail properties around the world, as well as in a variety of real estate operating companies.
Our Core+ real estate strategy invests in substantially stabilized real estate globally primarily through perpetual capital vehicles. Our Core+ real estate strategy includes our (a) Blackstone Property Partners (“BPP”) funds, which is focused on high-quality assets in the Americas, Europe and Asia and (b) our non-listed REIT, Blackstone Real Estate Income Trust, Inc. (“BREIT”) and our Blackstone European Property Income (“BEPIF”) vehicles, which provide income-focused individual investors access to institutional quality real estate primarily in the Americas and Europe, respectively.
Our Blackstone Real Estate Debt Strategies (“BREDS”) platform primarily targets real estate-related debt investment opportunities. BREDS invests in both public and private markets, primarily in the U.S. and Europe. BREDS’ scale and investment mandates enable it to provide a variety of lending options for our borrowers and investment options for our investors, including commercial real estate and mezzanine loans, residential mortgage loan pools and liquid real estate-related debt securities. The BREDS platform includes high-yield real estate debt funds, liquid real estate debt funds and Blackstone Mortgage Trust, Inc. (“BXMT”), a NYSE-listed real estate investment trust (“REIT”).
Private Equity
Our Private Equity segment encompasses global businesses with a total of approximately 625 employees managing $304.0 billion of Total Assets Under Management as of December 31, 2023. Our Private Equity segment includes our Corporate Private Equity business, which consists of: (a) our global private equity funds, Blackstone Capital Partners (“BCP”), (b) our sector-focused funds, including our energy- and energy transition-focused funds, Blackstone Energy Transition Partners (“BETP”), (c) our Asia-focused private equity funds, Blackstone Capital Partners Asia and (d) our core private equity funds, Blackstone Core Equity Partners (“BCEP”). Our Private Equity segment also includes (a) our opportunistic investment platform that invests flexibly across asset classes, industries and geographies, Blackstone Tactical Opportunities (“Tactical Opportunities”), (b) our secondary fund business, Strategic Partners Fund Solutions (“Strategic Partners”), (c) our infrastructure-focused funds, Blackstone Infrastructure Partners (“BIP”), (d) our life sciences investment platform, Blackstone Life Sciences (“BXLS”), (e) our growth equity investment platform, Blackstone Growth (“BXG”), (f) our investment platform offering eligible individual investors access to Blackstone’s private equity capabilities, Blackstone Private Equity Strategies Fund (“BXPE”), (g) our multi-asset investment program for eligible high-net-worth investors offering exposure to certain of Blackstone’s key illiquid investment strategies through a single commitment, Blackstone Total Alternatives Solution (“BTAS”) and (h) our capital markets services business, Blackstone Capital Markets (“BXCM”).
We are a global leader in private equity investing. Our Corporate Private Equity business pursues transactions across industries on a global basis. It strives to create value by investing in great businesses where our capital, strategic insight, global relationships and operational support can drive transformation. Corporate Private Equity’s investment strategies and core themes continually evolve in anticipation of, or in response to, changes in the global economy, local markets, regulation, capital flows and geopolitical trends. We seek to construct a differentiated portfolio of investments with a well-defined, post-acquisition value creation strategy. Similarly, we seek investments that can generate strong unlevered returns regardless of entry or exit cycle timing.
BCEP pursues control-oriented investments in high-quality companies with durable businesses and seeks to offer a lower level of risk and a longer hold period than traditional private equity.
8
Tactical Opportunities pursues a thematically driven, opportunistic investment strategy. Our flexible, global mandate enables us to find differentiated opportunities across asset classes, industries and geographies and invest behind them with the frequent use of structure to generate attractive risk-adjusted returns. Tactical Opportunities’ ability to dynamically shift focus to the most compelling opportunities in any market environment, combined with the business’ expertise in structuring complex transactions, enables Tactical Opportunities to invest in attractive market areas, often with securities that provide downside protection and maintain upside return.
Strategic Partners is a total fund solutions provider. As a secondary investor, it acquires interests in high-quality private funds from original holders seeking liquidity. Strategic Partners focuses on a range of opportunities in underlying funds such as private equity, real estate, infrastructure, venture and growth capital, credit and other types of funds, as well as general partner-led transactions and primary investments and co-investments with financial sponsors. Strategic Partners also provides investment advisory services to separately managed account clients investing in primary and secondary investments in private funds and co-investments.
BIP targets a diversified mix of core+, core and public-private partnership investments across all infrastructure sectors, including energy infrastructure, transportation, digital infrastructure and water and waste, with a primary focus in the U.S. BIP applies a disciplined, operationally intensive investment approach to investments, seeking to apply a long-term buy-and-hold strategy to large-scale infrastructure assets with a focus on delivering stable, long-term capital appreciation together with a predictable annual cash flow yield.
BXLS invests across the life cycle of companies and products within the life sciences sector. BXLS primarily focuses on investments in life sciences products in late-stage clinical development within the pharmaceutical, biotechnology and medical technology sectors.
BXG seeks to deliver attractive risk-adjusted returns by investing in dynamic, growth-stage businesses, with a focus on the consumer, consumer technology, enterprise solutions, financial services and healthcare sectors.
BXPE invests primarily in privately negotiated, equity-oriented investments, leveraging Blackstone’s private equity talent and investment capabilities to create an attractive portfolio of alternative investments diversified across geographies and sectors.
Credit & Insurance
Our Credit & Insurance segment has approximately 640 employees and manages $318.9 billion of Total Assets Under Management as of December 31, 2023. Effective January 1, 2024, our corporate credit (formerly Blackstone Credit or BXC), asset based finance and insurance (“insurance platform” and formerly Blackstone Insurance Solutions or BIS) groups were integrated into a single new unit, Blackstone Credit & Insurance (“BXCI”). BXCI offers its clients and borrowers a comprehensive solution across corporate and asset based, as well as investment grade and non-investment grade, private credit. BXCI is one of the largest credit-oriented managers and CLO managers in the world. The investment portfolios of the funds BXCI’s credit platform manages or sub-advises consist primarily of loans and securities of non-investment and investment grade companies spread across the capital structure including senior debt, subordinated debt, preferred stock and common equity.
BXCI is organized into three overarching credit investing strategies: private corporate credit, liquid corporate credit and infrastructure and asset based credit. The private corporate credit strategies include mezzanine and direct lending funds, private placement strategies and stressed/distressed strategies. The direct lending funds include Blackstone Private Credit Fund (“BCRED”) and Blackstone Secured Lending Fund (“BXSL”), both of which are business development companies (“BDCs”). The liquid corporate credit strategies consist of CLOs, closed-ended funds, open-ended funds, systematic strategies and separately managed accounts. The infrastructure and asset based credit strategies include our energy strategies (including our sustainable resources platform) and asset based finance strategies focused on privately originated, income-oriented credit assets secured by physical or financial collateral.
9
Our insurance platform focuses on providing full investment management services for insurers’ general accounts, seeking to deliver customized and diversified portfolios that include allocations to Blackstone managed products and strategies across asset classes and Blackstone’s private credit origination capabilities. Through this platform, we provide our clients tailored portfolio construction and strategic asset allocation, seeking to generate risk-managed, capital-efficient returns, diversification and capital preservation that meets clients’ objectives. We also provide similar services to clients through separately managed accounts or by sub-managing assets for certain insurance-dedicated funds and special purpose vehicles. Through the insurance platform, we currently manage assets for clients that include Corebridge Financial Inc., Everlake Life Insurance Company, Fidelity & Guaranty Life Insurance Company and Resolution Life Group, among others.
In addition, as reflected in this Annual Report on Form 10-K, our Credit & Insurance segment also includes a platform managed by Harvest Fund Advisors LLC (“Harvest”), which primarily invests in publicly traded energy infrastructure, renewables and master limited partnerships holding midstream energy assets in North America. Effective the second quarter of 2024, Harvest will be included in the Hedge Fund Solutions segment.
Hedge Fund Solutions
Working with our clients for more than 30 years, our Hedge Fund Solutions group is a leading manager of institutional funds with approximately 255 employees managing $80.3 billion of Total Assets Under Management as of December 31, 2023. The principal component of our Hedge Fund Solutions segment is Blackstone Alternative Asset Management (“BAAM”). BAAM is the world’s largest discretionary allocator to hedge funds, managing a broad range of commingled and customized fund solutions since its inception in 1990. The Hedge Fund Solutions segment also includes (a) investment platforms that invest directly, including our Blackstone Strategic Opportunity Fund, which seeks to produce long term, risk-adjusted returns by investing in a wide variety of securities, assets and instruments, often sourced and/or managed by third party subadvisors or affiliated Blackstone managers, (b) our hedge fund seeding business and (c) registered funds that provide alternative asset solutions through daily liquidity products. In addition, as reflected in this Annual Report on Form 10-K, our Hedge Fund Solutions segment also includes our GP stakes business (“GP Stakes”), which targets minority investments in the general partners of private equity and other private market alternative asset management firms globally, with a focus on delivering a combination of recurring annual cash flow yield and long-term capital appreciation. Effective the second quarter of 2024, GP Stakes will be included in the Private Equity segment. In addition, effective the first quarter of 2024, the Hedge Fund Solutions segment will be renamed “Multi-Asset Investing.” Hedge Fund Solutions seeks to grow investors’ assets through both commingled and custom-tailored investment strategies designed to deliver compelling risk-adjusted returns. Diversification, risk management and due diligence are key tenets of that approach.
Perpetual Capital
Each of our business segments currently includes Perpetual Capital assets under management, which refers to assets under management with an indefinite term, that are not in liquidation and for which there is no requirement to return capital to investors through redemption requests in the ordinary course of business, except where funded by new capital inflows. In recent years, we have continued to meaningfully increase our assets under management in such vehicles. Perpetual Capital strategies represent a significant and growing portion of our overall business, and the management fees and performance revenues we receive. Among the strategies in each of our segments, Perpetual Capital strategies include, without limitation, (a) in our Real Estate segment, Core+ real estate (including BREIT and BEPIF) and BXMT, (b) in our Private Equity segment, BIP and BXPE, (c) in our Credit & Insurance segment, BXSL and BCRED and (d) in our Hedge Fund Solutions segment, GP Stakes. In addition, assets managed for certain of our insurance clients are Perpetual Capital assets under management.
10
Private Wealth Strategy
Blackstone’s business historically focused on the provision of investment products, such as traditional drawdown funds, to institutional investors. In recent years, we have considerably expanded the number and type of investment products we offer through various distribution channels to certain high-net-worth and mass affluent individual investors in the U.S. and other jurisdictions around the world. Our Private Wealth Solutions business is dedicated to building out our distribution capabilities in the private wealth channel to provide certain individual investors with access to Blackstone products across a broad array of alternative investment strategies. In recent years, capital from the private wealth channel has represented an increasing portion of our Total Assets Under Management, and we expect this trend to continue as we continue to undertake initiatives focused on this market segment.
Investment Process and Risk Management
We maintain a rigorous investment process across all of our investment vehicles. Each investment vehicle has investment policies and procedures that generally contain requirements, guidelines and limitations for investments, such as limitations relating to the amount that will be invested in any one investment and the types of assets, industries or geographic regions in which the vehicle will invest, as well as limitations required by law.
Our investment professionals are responsible for identifying, evaluating, underwriting, diligencing, negotiating, executing, managing and exiting investments. For those of our businesses with review committees and/or investment committees, such committees review and evaluate investment opportunities in a framework that includes a qualitative and quantitative assessment of the key risks of investments. In such businesses, investment professionals generally submit investment opportunities for review and approval by a review committee and/or investment committee, subject to delineated exceptions set forth in the funds’ investment committee charters or resolutions. Review and investment committees are generally comprised of senior leaders and other senior professionals of the applicable investment business, and in many cases, other senior leaders of Blackstone and its businesses. Considerations that review and investment committees take into account when evaluating an investment may include, without limitation and depending on the nature of the investing business and its strategy, the quality of the business or asset in which the fund proposes to invest, the quality of the management team, likely exit strategies and factors that could reduce the value of the business or asset at exit, the ability of the business in which the investment is made to service debt in a range of economic and interest rate environments, macroeconomic trends in the relevant geographic region or industry and the quality of the businesses’ operations. In addition, the majority of our businesses have ESG policies that address, among other things, the review of ESG risks in the respective business’s investment process. Existing investments are reviewed and monitored on a regular basis by investment and asset management professionals. In addition, our investment professionals, Portfolio Operations professionals work with our portfolio company senior executives to identify opportunities to drive operational efficiencies and growth.
In addition, before deciding to invest in an investment fund or an alternative asset manager, as applicable, our Hedge Fund Solutions and Strategic Partners teams conduct diligence in a number of areas, which, depending on the nature of the investment, may include, among others, the fund’s/manager’s performance, investment terms, investment strategy and investment personnel, as well as its operations, processes, risk management and internal controls. With respect to liquid credit clients and other clients whose portfolios are actively traded in our Credit & Insurance segment, our industry-focused research analysts provide the review and/or investment committee with a formal and comprehensive review of new investment recommendations and portfolio managers and trading professionals discuss, among other things, risks associated with overall portfolio composition. Our Credit & Insurance segment’s research team monitors the operating performance of underlying issuers, while portfolio managers, together with our traders, focus on optimizing asset composition to maximize value for our investors. This investment process is assisted by a variety of proprietary and non-proprietary research models and methods.
11
Structure and Operation of Our Investment Vehicles
Our asset management businesses include private investment funds, registered funds, BDCs, REITs, CLOs, SMAs and other vehicles focused on real estate, private equity, infrastructure, life sciences, growth equity, credit, real assets and secondary funds, all on a global basis. Many of our private investment funds and other vehicles are targeted at institutional investors. We also have several products, such as BREIT, BCRED and BXPE, among others, that are targeted at individual investors, including high-net-worth investors (“Private Wealth Products”).
Our private investment funds are generally organized as limited partnerships with respect to U.S. domiciled vehicles and limited partnerships or other similar limited liability entities with respect to non-U.S. domiciled vehicles. These funds accept commitments and/or subscriptions for investment from institutional investors and/or high-net-worth individuals. Our Private Wealth Products are organized using a variety of structures, including corporations, statutory trusts, limited partnerships or other vehicles, and accept subscriptions for investment from high-net-worth individuals and/or other individual investors. Our private investment funds are generally either commitment-structured funds, where commitments are generally drawn down from investors on an as-needed basis to fund investments (or for other permitted purposes) over a specified term, or open-ended funds, where the investor’s capital may be fully funded on or shortly after the investor’s subscription date and cash proceeds resulting from the disposition of investments can be reinvested, subject to certain limitations and limited investor withdrawal rights. In most of our Private Wealth Products, the investor’s capital is fully funded on the subscription date. Our BXCI insurance platform is generally structured around separately managed accounts and our BXCI CLO vehicles are generally private companies with limited liability.
Our investment funds, separately managed accounts and other vehicles not domiciled in the European Economic Area (the “EEA”) are each generally advised by a Blackstone entity serving as investment adviser that is registered under the U.S. Investment Advisers Act of 1940, as amended (the “Advisers Act”). For our investment funds, separately managed accounts and other vehicles domiciled in the EEA, a Blackstone entity domiciled in the EEA generally serves as external alternative investment fund manager (“AIFM”), and the AIFM typically delegates its portfolio management function to a Blackstone-affiliated investment adviser registered under the Advisers Act. The Blackstone entity serving as investment adviser or AIFM, as applicable, typically carries out substantially all of the day-to-day operations of each investment vehicle pursuant to an investment advisory, investment management, AIFM or other similar agreement. Generally, the material terms of our investment advisory and AIFM agreements, as applicable, relate to the scope of services to be rendered by the investment adviser or the AIFM to the applicable vehicle, the calculation of management fees to be borne by investors in our investment vehicles, the calculation of and the manner and extent to which other fees received by the investment adviser or the AIFM, as applicable, from funds or fund portfolio companies serve to offset or reduce the management fees payable by investors in our investment vehicles and certain rights of termination with respect to our investment advisory and AIFM agreements.
Our private investment funds do not generally register as investment companies under the U.S. Investment Company Act of 1940, as amended (the “1940 Act”), in reliance on the statutory exemptions provided by Section 3(c)(7), Section 3(c)(5)(C) or Section 3(c)(1) thereof. Section 3(c)(7) of the 1940 Act exempts from its registration requirements investment vehicles privately placed in the United States whose securities are beneficially owned exclusively by persons who, at the time of acquisition of such securities, are “qualified purchasers” as defined under the 1940 Act. In addition, under current interpretations of the SEC, Section 3(c)(7) of the 1940 Act exempts from registration any non-U.S. investment vehicle all of whose outstanding securities are beneficially owned either by non-U.S. residents or by U.S. residents that are qualified purchasers. Section 3(c)(5)(C)
12
of the 1940 Act exempts from its registration requirements certain companies engaged primarily in investment in mortgages and other liens or investments in real estate. Section 3(c)(1) of the 1940 Act exempts from its registration requirements privately placed investment vehicles whose securities are beneficially owned by not more than 100 persons. Additionally, under current interpretations of the SEC, Section 3(c)(1) of the 1940 Act exempts from registration any non-U.S. investment vehicle not publicly offered in the U.S. all of whose outstanding securities are beneficially owned by not more than 100 U.S. residents. In addition, each of BXMT and BREIT conducts its operations in a manner that allows it to maintain its REIT qualification and avail itself of the statutory exemption provided by Section 3(c)(5)(C) of the 1940 Act and our U.S. BXPE vehicle relies on Section 3(c)(7) of the 1940 Act. Our Private Wealth Products include funds that are registered, or regulated as a BDC, under the 1940 Act. In addition, certain of our investment advisers or AIFMs advise or sub-advise funds domiciled in, and subject to registration and regulatory requirements of, the EEA.
In addition to having an investment adviser, each investment fund that is a limited partnership, or “partnership” fund, also has a general partner that, apart from partnership funds domiciled in the EEA, generally makes all operational and investment decisions, including the making, monitoring and disposing of investments. Investment vehicles in our Private Wealth Products typically have a board that includes independent directors. In the case of our separately managed accounts, the investor, rather than we, generally holds or has custody of the investments. The investors in our investment funds generally take no part in the conduct or control of the business of the investment funds, have no right or authority to act for or bind the investment funds and have no influence over the voting or disposition of the securities or other assets held by the investment funds. Third party investors in some of our partnership funds have the right to remove the general partner of the fund or to accelerate the termination of the fund without cause by a majority or supermajority vote. In addition, the governing agreements of many of our partnership funds provide that in the event certain “key persons” in our partnership funds do not meet specified time commitments with regard to managing the fund, then (a) investors in such funds have the right to vote to terminate the investment period by a specified percentage (including, in certain cases a simple majority) vote in accordance with specified procedures, or accelerate the withdrawal of their capital on an investor-by-investor basis, or (b) the fund’s investment period will automatically terminate and a specified percentage (including, in certain cases a simple majority) in accordance with specified procedures is required to restart it. In addition, the governing agreements of some of our partnership funds provide that investors have the right to terminate the investment period for any reason by a supermajority vote of the investors in such fund.
Fee Structure/Incentive Arrangements
Management Fees
The following is a general description of the management fees earned by Blackstone. Management fees are generally based on an annual rate but payable on a regular basis (typically monthly or quarterly). Management fees received are not subject to clawback.
|
•
|
In our carry funds, the investment adviser or AIFM (depending on the domicile of the fund) receives a management fee based on a percentage of the fund’s capital commitments, invested capital and/or undeployed capital during the investment period and the fund’s invested capital, investment fair value or capital commitments after the investment period. Management fees are generally payable over either the term or life of the fund. Depending on the fee basis, negative performance of one or more investments in the fund may reduce the total management fee paid for the relevant period, but not the fee rate.
|
|
•
|
In our other fund structures, unless outlined differently below, the investment adviser or AIFM (depending on the domicile of the fund) receives a management fee based on a percentage of the fund’s net asset value over the term or life of the fund. These funds may permit investors to withdraw or redeem their interests periodically, in some cases following the expiration of a specified period of time when capital may not be withdrawn. Decreases in net asset value reduce the total management fee paid for the relevant period, but not the fee rate.
|
13
|
•
|
In our CLOs, the investment adviser typically receives a base management fee and a subordinated management fee, which are calculated as a percentage of the CLO’s assets. Although varying from deal to deal, a CLO will typically be wound down within eight to eleven years of being launched. The amount of fees will decrease as the CLO deleverages toward the end of its term.
|
|
•
|
In our separately managed accounts, the investment adviser generally receives a management fee based on a percentage of each account’s net asset value or invested capital. Such management fees are generally subject to contractual rights the investor has to terminate our management on generally as short as 30 days’ notice.
|
|
•
|
In our credit-focused registered investment companies and our BDCs, the investment adviser typically receives a management fee based on a percentage of net asset value or total managed assets. Such management fees are generally subject to contractual rights of the company’s board of directors to terminate our management of an account on as short as 30 days’ notice.
|
|
•
|
For BXMT, the investment adviser receives a management fee based on a percentage of BXMT’s net proceeds received from equity offerings and accumulated “distributable earnings” (which is generally equal to its net income, calculated under GAAP, excluding certain non-cash and other items), subject to certain adjustments.
|
For additional information regarding the management fee rates we receive, see “Part II. Item 7. Management’s Discussion and Analysis of Financial Condition and Results of Operations — Critical Accounting Policies — Revenue Recognition — Management and Advisory Fees, Net.”
Incentive Arrangements
Our incentive arrangements are composed of (a) contractual incentive fees received from certain investment vehicles upon achieving specified cumulative investment returns (“Incentive Fees”), and (b) a disproportionate allocation of the income generated by investment vehicles otherwise allocable to investors upon achieving certain investment returns (“Performance Allocations”, and, together with Incentive Fees, “Performance Revenues”).
In our carry funds, our Performance Revenues consist of the Performance Allocations to which the general partner or an affiliate thereof is entitled, commonly referred to as carried interest. Our ability to generate and realize carried interest is an important element of our business and has historically accounted for a very significant portion of our income.
Carried interest is typically structured as a net profits interest in the applicable fund. In the case of our carry funds, carried interest is generally calculated on a “realized gain” basis, and each general partner (or affiliate) is generally entitled to an allocation of up to 20% of the net realized income and gains (generally taking into account realized and unrealized or net unrealized losses) generated by such fund. Net realized income or loss is not generally netted between or among funds, and in some cases our carry funds provide for allocations to be made on current income distributions (subject to certain conditions).
For most carry funds, the carried interest is subject to a preferred limited partner return generally ranging from 5% to 8% per year, subject to a catch-up allocation to the general partner. Some of our carry funds do not provide for a preferred return, and generally the terms of our carry funds vary in certain respects across our business units and vintages. If, at the end of the life of a carry fund (or earlier with respect to certain of our carry funds), as a result of diminished performance of later investments in a carry fund’s life, (a) the general partner receives in excess of the relevant carried interest percentage(s) applicable to the fund as applied to the fund’s
14
cumulative net profits over the life of the fund, or (in certain cases) (b) the carry fund has not achieved investment returns that exceed the preferred return threshold (if applicable), then we will be obligated to repay an amount equal to the carried interest that was previously distributed to us that exceeds the amounts to which we were ultimately entitled, up to the amount of carried interest received on an after-tax basis. This is known as a “clawback” obligation and is an obligation of any person who received such carried interest, including us and other participants in our carried interest plans.
Although a portion of any dividends paid to our stockholder may include any carried interest received by us, we do not intend to seek fulfillment of any clawback obligation by seeking to have our stockholders return any portion of such dividends attributable to carried interest associated with any clawback obligation. To the extent we are required to fulfill a clawback obligation, however, we may determine to decrease the amount of our dividends to our stockholders. The clawback obligation operates with respect to a given carry fund’s own net investment performance only and carried interest of other funds is not netted for determining this contingent obligation. Moreover, although a clawback obligation is several, the governing agreements of most of our funds provide that to the extent another recipient of carried interest (such as a current or former employee) does not fund his or her respective share of the clawback obligation then due, then we and our employees who participate in such carried interest plans may have to fund additional amounts (generally an additional 50% to 70% beyond our pro-rata share of such obligation) although we retain the right to pursue any remedies that we have under such governing agreements against those carried interest recipients who fail to fund their obligations. We have recorded a contingent repayment obligation equal to the amount that would be due on December 31, 2023, if the various carry funds were liquidated at their current carrying value. For additional information concerning the clawback obligations we could face, see “— Item 1A. Risk Factors — Risks Related to Our Business — We may not have sufficient cash to pay back “clawback” obligations if and when they are triggered under the governing agreements with our investors.”
In our structures other than carry funds, our Performance Revenues generally consist of performance-based allocations of a vehicle’s net capital appreciation during a measurement period, typically a year, subject to the achievement of minimum return levels, high water marks, loss carry forwards and/or other hurdle provisions, in accordance with the respective terms set out in each vehicle’s governing agreements. Such allocations are typically realized at the end of the measurement period and, once realized, are typically not subject to clawback or reversal. In particular, our ability to generate and realize these amounts is an important element of our business. Such allocations in certain of our Perpetual Capital strategies contribute a significant and growing portion to our overall revenues.
The following is a general description of the Performance Revenues earned by Blackstone in structures other than carry funds:
|
•
|
In our Hedge Fund Solutions segment, the investment adviser of certain of our funds of hedge funds, hedge funds, separately managed accounts that invest in hedge funds and certain non-U.S. registered investment companies, is entitled to an incentive fee generally between 0% to 20%, as applicable, of the applicable investment vehicle’s net appreciation, subject to “high water mark” provisions and in some cases a preferred return.
|
|
•
|
The general partners or similar entities of each of our real estate and credit hedge fund structures receive incentive fees of generally up to 20% of the applicable fund’s net capital appreciation per annum.
|
|
•
|
The investment adviser of our BDCs receives (a) income incentive fees of 12.5% or 17.5%, as applicable, subject to, in certain cases, certain hurdles, catch-ups and caps, payable quarterly, and (b) capital gains incentive fees (net of realized and unrealized losses) of 12.5% or 17.5%, as applicable, payable annually.
|
15
|
•
|
The investment manager of BXMT receives an incentive fee generally equal to 20% of BXMT’s distributable earnings in excess of a 7% per annum return on stockholders’ equity (excluding stock appreciation or depreciation), provided that BXMT’s distributable earnings over the prior three years is greater than zero.
|
|
•
|
The general partner or special limited partner of each of BREIT, BEPIF and BXPE receives a performance participation allocation of 12.5% of total return, subject to a 5% hurdle amount with a catch-up and recouping any loss carry forward amounts, measured annually and payable quarterly.
|
|
•
|
The general partners of certain open-ended BPP and BIP funds are entitled to an incentive fee allocation generally between 7% and 12.5% of net profit, subject to a hurdle amount generally of between 5.5% and 7%, a loss recovery amount and a catch-up. Incentive allocations for these funds are generally realized every three years from when a limited partner makes its initial investment, or upon a limited partner’s redemption from the fund.
|
Advisory and Transaction Fees
Some of our investment advisers or their affiliates receive customary fees (for example, acquisition, origination and other transaction fees) upon consummation of their funds’ transactions, and may from time to time receive advisory, monitoring and other fees in connection with their activities. For most of the funds where we receive such fees, we are required to reduce the management fees charged to the funds’ investors by 50% to 100% of such limited partner’s share of such fees.
Capital Invested In and Alongside Our Investment Funds
To further align our interests with those of investors in our investment funds, we have invested the firm’s capital and that of our personnel in the investment funds we sponsor and manage. Minimum general partner capital commitments to our investment funds are determined separately with respect to each of our investment funds and, generally, are less than 5% of the limited partner commitments of any particular fund. See “Part II. Item 7. Management’s Discussion and Analysis of Financial Condition and Results of Operations — Liquidity and Capital Resources” for more information regarding our minimum general partner capital commitments to our funds. We determine whether to make general partner capital commitments to our funds in excess of the minimum required commitments based on, among other things, our anticipated liquidity, working capital and other capital needs. In many cases, we require our senior managing directors and other professionals to fund a portion of the general partner capital commitments to our funds. In other cases, we may from time to time offer to our senior managing directors and employees a part of the funded or unfunded general partner commitments to our investment funds. Our general partner capital commitments are funded with cash and not with carried interest or deferral of management fees.
Investors in many of our funds also receive the opportunity to make additional “co-investments” with the investment funds. Our personnel, as well as Blackstone itself and certain Blackstone relationships, also have the opportunity to make investments, in or alongside our funds and other vehicles we manage, in some instances without being subject to management fees, carried interest or incentive fees. In certain cases, limited partner investors may pay additional management fees or carried interest in connection with such co-investments.
Competition
The asset management industry is intensely competitive, and we expect it to remain so. We compete both globally and on a regional, industry and sector basis. We compete on the basis of a number of factors, including investment performance, transaction execution skills, access to capital, access to and retention of qualified personnel, reputation, range of products and services, innovation and price.
16
We face competition in the pursuit of institutional and individual investors for our investment funds. Although over time many institutional and individual investors have increased the amount of capital they commit to alternative investment funds, such increases may create increased competition with respect to fees charged by our funds. Certain institutional investors have demonstrated a preference to in-source their own investment professionals and to make direct investments in alternative assets without the assistance of private equity advisers like us. We compete for investments with such institutional investors and such institutional investors could cease to be our clients. With respect to the private wealth channel and insurance sector, the market for capital is highly competitive, requires significant investment and is highly regulated, which could create competitive challenges for us.
We also face competition in the pursuit of attractive investment opportunities for our funds. Depending on the investment, we face competition primarily from sponsors managing other funds, investment vehicles and other pools of capital, other financial institutions and institutional investors (including sovereign wealth and pension funds), corporate buyers and other parties. Several of these competitors have significant amounts of capital and many of them have investment objectives similar to ours, which may create additional competition for investment opportunities. Some of these competitors may also have a lower cost of capital and access to funding sources or other resources that are not available to us, which may create competitive disadvantages for us with respect to investment opportunities. In addition, some of these competitors may have higher risk tolerances, different risk assessments or lower return thresholds, which could allow them to consider a wider variety of investments and to bid more aggressively than us for investments. Corporate buyers may be able to achieve synergistic cost savings with regard to an investment or be perceived by sellers as otherwise being more desirable bidders, which may provide them with a competitive advantage in bidding for an investment.
In all of our businesses, competition is also intense for the attraction and retention of qualified employees. Our ability to continue to compete effectively in our businesses will depend upon our ability to attract new employees and retain and motivate our existing employees.
For additional information concerning the competitive risks that we face, see “— Item 1A. Risk Factors — Risks Related to Our Business — The asset management business is intensely competitive.”
Environmental, Social and Governance
Our investors have relied on our relentless commitment to excellence for nearly 40 years. Our ESG efforts are anchored in our goal of generating strong returns for investors to fulfil our fiduciary duty. Our integrated team includes dedicated coverage at the firm level and at individual business units. Senior management reports quarterly to our board of directors, which is responsible for reviewing our ESG strategy, including on the basis of periodic reports from management addressing relevant matters and practices.
Our strategy prioritizes (a) reinforcing strong governance, a foundation of resilient companies, (b) accelerating decarbonization by investing in the energy transition and driving value-accretive emissions reduction in our portfolio and (c) building workplaces by expanding talent pools. We have pursued attractive investments in companies and assets that support the global energy transition. We are also focused on helping select portfolio companies capture cost savings through greenhouse gas emission reduction efforts as part of our Emissions Reduction Program. This program aims to reduce Scope 1 and Scope 2 carbon emissions by 15% on average across certain new investments where we control energy usage during the first three full calendar years of ownership. At a corporate level, we seek to advance corporate sustainability, energy efficiency and environmental performance at out global office locations.
17
At Blackstone, our people are our most valuable asset. We seek to attract, develop and retain outstanding talent across a wide spectrum of disciplines. We believe building inclusive workplaces positions us and our portfolio companies to access a broad pool of qualified talent, including from historically under-tapped talent pools, and foster inclusive cultures that generate lasting value for our investors. See “— Human Capital Management.”
Human Capital Management
Blackstone’s employees are integral to our culture of integrity, professionalism, excellence and cooperation. The intellectual capital collectively possessed by our employees is our most important asset. We hire qualified people, train them and encourage them to work together to provide their best thinking to the firm for the benefit of the investors in the funds we manage. As of December 31, 2023, we employed approximately 4,735 people. During 2023, our total number of employees increased by approximately 40.
Our board of directors plays an active role in overseeing our human capital management efforts. To that end, senior management reviews with our board of directors management succession planning and development and other key aspects of our talent management strategy.
We believe a workforce reflecting a breadth of backgrounds and experiences makes us better investors and a better firm. Our diversity, equity and inclusion strategy leverages a people-driven framework based on four key pillars: recruiting, talent development, community and inclusion and accountability. We believe that by focusing on each of these pillars and investing in our people and our culture, we will create an inclusive environment that helps expand our access to the best available talent and drives retention and advancement opportunities for our employees.
To that end, our employee affinity networks, which are open to all employees, serve as a platform for our professionals to expand cultural awareness and connect to other employees, including through speaker series, professional development panels and social events. We also seek to enable ourselves and our portfolio companies to access a broad pool of qualified talent, including through firm programs aimed at introducing talented undergraduate students to financial services and Blackstone and portfolio programs aimed at helping our portfolio companies access historically under-tapped talent pools.
Employee and Community Engagement
Blackstone is committed to ensuring our employees are engaged with their work and with their local communities. Blackstone regularly gathers feedback from our employees via internal and/or external surveys to assess employee engagement and satisfaction and develop targeted solutions. Blackstone also supports its employee affinity networks in their efforts to expand cultural awareness and connection across the firm.
In addition, the Blackstone Charitable Foundation (“BXCF”) was established in 2007 and is committed to supporting Blackstone’s goal of helping foster economic opportunity and career mobility for historically underrepresented groups. This includes, among other initiatives, its signature Blackstone LaunchPad network, which seeks to close the opportunity gap by equipping college and university students with the entrepreneurial skills they need to build lasting careers, and BX Connects, a global program that provides Blackstone employees with the opportunity to support their local communities through volunteering and giving. BX Connects uses the firm’s scale, talent and resources to make grants, develop nonprofit partnerships and create employee engagement opportunities. Nearly 90% of our employees engaged globally with BXCF’s charitable initiatives in 2023.
18
Talent Acquisition, Development and Retention
We believe the talent of our employees, coupled with our rigorous investment process, has supported our excellent investment record over many years. We are therefore focused on hiring, training, motivating and retaining talented individuals. Across all our businesses, we face intense competition for qualified personnel.
We seek to attract and retain the brightest minds across a wide spectrum of disciplines and from varied backgrounds and experiences. We believe our reputation, talent development opportunities and compensation make us an attractive employer. We encourage independent thinking and reward initiative while providing training and development opportunities to help our employees grow professionally. In addition, our Respect at Work programs and trainings help maintain an inclusive work environment in which all individuals are treated with respect and dignity. Employee education and training are also critical to maintaining a culture of compliance.
Blackstone offers a wide range of learning and professional development opportunities, both formally and informally, to help employees advance their careers and maximize the value they can add to the global firm. Incoming analyst classes are provided with training that spans their first few years. In addition, our new hires are provided with training and other opportunities to help them thrive in our culture, including through our Culture Program and our Leadership Speaker Series. Blackstone employees are trained or enrolled in compliance training when they start at the firm, and we retrain employees globally at least once annually. Over the course of their careers at Blackstone, employees are offered learning opportunities in a number of areas including leadership and management development and communication skills, among others. We offer a global development curriculum on key capabilities required to succeed at Blackstone, and we partner with external organizations to deliver training programs for our employees. We consistently seek to create visibility and opportunities for talent to take on roles beyond their current positions, and for managers to connect regularly to discuss and match talent with critical roles. These efforts result in cross-pollination of talent that we believe engages our people and generates stronger outcomes for the firm.
As discussed below, we seek to retain and incentivize the performance of our employees through our compensation structure. We also enter into non-competition and non-solicitation agreements with certain employees. See “Part III. Item 11. Executive Compensation — Non-Competition and Non-Solicitation Agreements” for a description of the material terms of such agreements.
Compensation, Benefits and Wellness
Our compensation is designed to motivate and retain employees and align their interests with those of the investors in our funds. In particular, incentive compensation for our senior managing directors and employees involves a combination of annual cash bonus payments and performance interests or deferred equity awards, which we believe encourages them to focus on the performance of our investment funds and the overall performance of the firm. The proportion of compensation that is “at risk” generally increases as an employee’s level of responsibility rises. Employees at higher total compensation levels are generally targeted to receive a greater percentage of their total compensation payable in annual cash bonuses, participation in performance interests and deferred equity awards and a lesser percentage in the form of base salary compared to employees at lower total compensation levels. To further align their interests with those of investors in our funds, we provide employees with the opportunity to make investments in or alongside certain of the funds and other vehicles we manage. We also provide our employees robust health and retirement offerings, as well as a variety of quality of life benefits, including time-off options and well-being and family planning resources.
19
We believe our current compensation and benefit allocations for senior professionals are best in class and are consistent with companies in the alternative asset management industry. Our senior management periodically reviews the effectiveness and competitiveness of our compensation program. Most of our current senior managing directors and other senior personnel have equity interests in our business that entitle such personnel to cash distributions. See “Part III. Item 11. Executive Compensation – Compensation Discussion and Analysis – Overview of Compensation Philosophy and Program” for more information on compensation of our senior managing directors and certain other employees.
We care greatly about the health, safety and wellbeing of our employees. Blackstone also offers comprehensive and competitive benefits to its full-time employees, including primary and secondary caregiver leave, adoption leave, phased back to work, fertility coverage, back up childcare and more. We continually evaluate and enhance our offerings to meet the needs of our employees. For example, we offer additional family planning benefits for U.S. employees such as enhancing infertility benefits to include cryopreservation and primary caregiver leave up to 21 weeks. We offer employee well-being programs, including an online therapy program and access to an education platform with coaching to support working parents and caretakers caring for children who have behavioral problems, autism or developmental disabilities. We also provide access to programs to further assist our employees in managing their lives outside of work, such as group legal services to help with estate planning and surrogacy agreements.
Data Privacy and Security
Blackstone is committed to data privacy. These topics are included in routine training received at least once annually by employees. Data privacy is typically addressed in the Global Head of Compliance’s annual update to our board of directors. Blackstone’s approach to data protection is set out in our Online Privacy Notice and its Investor Data Privacy Notice. Senior management oversees privacy, data protection and information risk management efforts, leading the privacy and data protection function, which conducts privacy impact assessments, implements privacy-by-design initiatives and reconciles global privacy programs with local privacy requirements. Our privacy function also supports the Data Protection Operating Committee, Blackstone’s global privacy compliance steering committee. Please see “— Part I, Item 1C. Cybersecurity” for a discussion of our cybersecurity risk management, strategy and governance.
Regulatory and Compliance Matters
Our businesses, as well as the financial services industry generally, are subject to extensive regulation in the United States and in many of the markets in which we operate.
Many of our businesses are subject to compliance with laws and regulations of U.S. federal and state governments, non-U.S. governments, their respective agencies and/or various self-regulatory organizations or exchanges. The SEC and various self-regulatory organizations, state securities regulators and international securities regulators have in recent years increased their regulatory activities, including regulation, examination and enforcement in respect of asset management firms, including Blackstone. Any failure to comply with these regulations could expose us to liability and/or damage our reputation. Our businesses have operated for many years within a legal framework that requires us to monitor and comply with a broad range of legal and regulatory developments that affect our activities. However, additional legislation, changes in rules promulgated by financial regulatory authorities or self-regulatory organizations or changes in the interpretation or enforcement of existing laws and rules, either in the United States or abroad, may directly affect our mode of operation and profitability.
20
All of the investment advisers of our investment funds operating in the U.S. are registered as investment advisers with the SEC under the Advisers Act (other investment advisers may be registered in non-U.S. jurisdictions). Registered investment advisers are subject to the requirements and regulations of the Advisers Act. Such requirements relate to, among other things, fiduciary duties to advisory clients, maintaining an effective compliance program and code of ethics, investment advisory contracts, solicitation agreements, conflicts of interest, recordkeeping and reporting requirements, disclosure, advertising and custody requirements, political contributions, limitations on agency cross and principal transactions between an adviser and advisory clients, and general anti-fraud prohibitions. Certain investment advisers are also registered with international regulators in connection with their management of products that are locally distributed and/or regulated.
Blackstone Securities Partners L.P. (“BSP”), a subsidiary through which we conduct our capital markets business and certain of our fund marketing and distribution, is registered as a broker-dealer with the SEC and is subject to regulation and oversight by the SEC, is a member of the Financial Industry Regulatory Authority, or “FINRA,” and is registered as a broker-dealer in 50 states, the District of Columbia, the Commonwealth of Puerto Rico and the Virgin Islands. In addition, FINRA, a self-regulatory organization subject to oversight by the SEC, adopts and enforces rules governing the conduct, and examines the activities, of its member firms, including BSP. State securities regulators also have regulatory oversight authority over BSP.
Broker-dealers are subject to regulations that cover all aspects of the securities business, including, among others, the implementation of a supervisory control system over the securities business, advertising and sales practices, conduct of and compensation in connection with public securities offerings, maintenance of adequate net capital, record keeping and the conduct and qualifications of employees. In particular, as a registered broker-dealer and member of FINRA, BSP is subject to the SEC’s uniform net capital rule, Rule 15c3-1. Rule
15c3-1
specifies the minimum level of net capital a broker-dealer must maintain and also requires that a significant part of a broker-dealer’s assets be kept in relatively liquid form. The SEC and various self-regulatory organizations impose rules that require notification when net capital of a broker-dealer falls below certain predefined criteria, limit the ratio of subordinated debt to equity in the capital structure of a broker-dealer and constrain the ability of a broker-dealer to expand its business under certain circumstances. Additionally, the SEC’s uniform net capital rule imposes certain requirements that may have the effect of prohibiting a broker-dealer from distributing or withdrawing capital and requiring prior notice to the SEC for certain withdrawals of capital.
In addition, certain of the closed-end and open-end investment companies we manage, advise or sub-advise are registered, or regulated as a BDC, under the 1940 Act. The 1940 Act and the rules thereunder govern, among other things, the relationship between us and such investment vehicles and limit such investment vehicles’ ability to enter into certain transactions with us or our affiliates, including other funds managed, advised or sub-advised by us.
Pursuant to the U.K. Financial Services and Markets Act 2000, or “FSMA,” certain of our subsidiaries are subject to regulations promulgated and administered by the Financial Conduct Authority (“FCA”). The FSMA and rules promulgated thereunder form the cornerstone of legislation which governs all aspects of our investment business in the United Kingdom, including sales, provision of investment advice, use and safekeeping of client funds and securities, regulatory capital, recordkeeping, approval standards for individuals, anti-money laundering, periodic reporting and settlement procedures. Blackstone Europe LLP (formerly known as Blackstone Group International Partners LLP) (“BELL”) acts as a sub-advisor to its Blackstone U.S. affiliates in relation to the investment and re-investment of Europe, Middle East and Africa (“EMEA”) based assets of Blackstone Funds, arranging transactions to be entered into by or on behalf of Blackstone Funds, and providing certain related services. Until December 31, 2020, BGIP had a MiFID II (as defined herein) cross-border passport to provide investment services into the European Economic Area (“EEA”). As of January 1, 2021, as a result of the U.K.’s withdrawal from the European Union, BGIP no longer has a MiFID II passport. Consequently, BELL can only provide investment services in certain EEA jurisdictions where it has obtained a domestic license on a cross-border services basis (currently, Belgium, Denmark, Finland and Italy), or can operate pursuant to an exemption or relief (currently Ireland, Lichtenstein and Norway), although in certain cases with limitations. BELL’s principal place of business is in London, and it has a branch in Abu Dhabi Global Market.
21
Blackstone Ireland Limited (formerly known as Blackstone / GSO Debt Funds Management Europe Limited) (“BIL”) is authorized and regulated by the Central Bank of Ireland (“CBI”) as an Investment Firm under the (Irish) European Union (Markets in Financial Instruments) Regulations 2017, which largely implements MiFID II in Ireland. BIL’s principal activity is the provision of management and advisory services to certain CLO and sub-advisory services to certain affiliates. Blackstone Ireland Fund Management Limited (formerly known as Blackstone / GSO Debt Funds Management Europe II Limited) (“BIFM”) is authorized and regulated by the CBI as an Alternative Investment Fund Manager under the (Irish) European Union (Alternative Investment Fund Managers Regulations) 2013 (“AIFMRs”), which largely implements the EU Alternative Investment Fund Managers Directive (“AIFMD”) in Ireland. BIFM acts as AIFM and provides investment management functions including portfolio management, risk management, administration, marketing and related activities to its alternative investment funds in accordance with AIFMRs and the conditions imposed by the CBI as set out in the CBI’s alternative investment fund rulebook.
Blackstone Europe Fund Management S.à r.l. (“BEFM”) is an authorized Alternative Investment Fund Manager under the Luxembourg Law of 12 July 2013 on alternative investment fund managers (as amended, the “AIFM Law”), which largely implements AIFMD in Luxembourg. BEFM may also provide discretionary portfolio management services, investment advice and reception and transmission of orders in accordance with article 5(4) of the AIFM Law. BEFM provides investment management functions including portfolio management, risk management, administration, marketing and related activities to the assets of its alternative investment funds, in accordance with the AIFM Law and the regulatory provisions imposed by the
in Luxembourg. BEFM may also manage undertakings for collective investment in transferable securities (UCITS). As of January 1, 2021, BEFM promotes Blackstone products and services in European countries where BELL is not otherwise licensed to do so. BEFM has branches in Paris, Milan and Frankfurt which provide marketing services and where distribution and deal sourcing individuals are based.
Commission de Surveillance du Secteur Financier
Certain Blackstone operating entities are licensed and subject to regulation by financial regulatory authorities in Japan, Hong Kong, Australia and Singapore: The Blackstone Group Japan K.K., a financial instruments firm, is registered with Kanto Local Finance Bureau and regulated by the Japan Financial Services Agency; The Blackstone Group (HK) Limited is regulated by the Hong Kong Securities and Futures Commission; The Blackstone Group (Australia) Pty Limited and Blackstone Real Estate Australia Pty Limited each holds an Australian financial services license authorizing it to provide financial services in Australia and is regulated by the Australian Securities and Investments Commission; and Blackstone Singapore Pte. Ltd. is regulated by the Monetary Authority of Singapore.
Rigorous legal and compliance analysis of our businesses and investments is endemic to our culture and risk management. Our Chief Legal Officer and Global Head of Compliance, together with the Chief Compliance Officers of each of our businesses, supervise our compliance personnel, who are responsible for addressing the regulatory and compliance matters that affect our activities. We strive to maintain a culture of compliance through the use of policies and procedures including a code of ethics, electronic compliance systems, testing and monitoring, communication of compliance guidance and employee education and training. Our compliance policies and procedures address regulatory and compliance matters such as the handling of material non-public information, personal securities trading, marketing practices, gifts and entertainment, anti-money laundering, anti-bribery and sanctions, valuation of investments on a fund-specific basis, recordkeeping, potential conflicts of interest, the allocation of investment and co-investment opportunities, collection of fees and expense allocation.
Our compliance group also monitors the information barriers that we maintain between Blackstone’s businesses. We believe that our various businesses’ access to the intellectual knowledge and contacts and relationships that reside throughout our firm benefits all of our businesses. To maximize that access and related synergies without compromising compliance with our legal and contractual obligations, our compliance group oversees and monitors the communications between groups that are on the private side of our information barrier and groups that are on the public side, as well as between different public side groups. Our compliance group also monitors contractual obligations that may be impacted and potential conflicts that may arise in connection with these inter-group discussions.
22
In addition, disclosure controls and procedures and internal controls over financial reporting are documented, tested and assessed for design and operating effectiveness in accordance with the U.S. Sarbanes-Oxley Act of 2002. Internal Audit, which independently reports to the audit committee of our board of directors, operates with a global mandate and is responsible for the examination and evaluation of the adequacy and effectiveness of the organization’s governance and risk management processes and internal controls, as well as the quality of performance in carrying out assigned responsibilities to achieve the organization’s stated goals and objectives.
Our enterprise risk management framework is designed to manage non-investment risk areas across the firm, such as financial, human capital, legal, operational, regulatory, legislative, reputational and technology risks. Our enterprise risk committee assists Blackstone management to identify, assess, monitor and mitigate such key enterprise risks at the corporate, business unit and fund level. The enterprise risk committee is chaired by our Chief Financial Officer and is comprised of senior management across business units, corporate functions and regional locations. Senior management reports to the audit committee of the board of directors on the agenda of risk topics evaluated by the enterprise risk committee and provides periodic risk reports, a summary of its view on key risks to the firm and detailed assessments of selected risks, as applicable. Our firmwide valuation committee reviews the valuation process for investments held by us and our investment vehicles, including the application of appropriate valuation standards on a consistent basis. The firmwide valuation committee is chaired by our Chief Financial Officer and is comprised of senior heads of Blackstone’s businesses and representatives from legal and finance. The review committees and/or investment committees of our businesses review and evaluate investment opportunities in a framework that includes a qualitative and quantitative assessment of the key risks of investments. See “— Investment Process and Risk Management.”
There are a number of pending or recently enacted legislative and regulatory initiatives that could significantly affect our business. Please see “— Item 1A. Risk Factors — Risks Related to Our Business — Financial regulatory changes in the United States could adversely affect our business” and “— Complex regulatory regimes and potential regulatory changes in jurisdictions outside the United States could adversely affect our business.”
Available Information, Website and Social Media Disclosure
We file annual, quarterly and current reports and other information with the SEC. These filings are available to the public over the internet at the SEC’s website at www.sec.gov.
Our principal internet address is www.blackstone.com. We make available free of charge on or through www.blackstone.com our annual reports on Form 10-K, quarterly reports on Form 10-Q, current reports on
Form 8-K
and amendments to those reports, as soon as reasonably practicable after we electronically file such material with, or furnish it to, the SEC.
In addition, use our website (www.blackstone.com), Facebook page (www.facebook.com/blackstone), X (Twitter) (www.x.com/blackstone), LinkedIn (www.linkedin.com/company/blackstonegroup), Instagram (www.instagram.com/blackstone), SoundCloud (www.soundcloud.com/blackstone-300250613), PodBean (www.blackstone.podbean.com), Spotify (https://spoti.fi/2LJ1tHG), YouTube (www.youtube.com/user/blackstonegroup) and Apple Podcast (https://apple.co/31Pe1Gg) accounts as channels of distribution of company information. The information we post through these channels may be deemed material. Accordingly, investors should monitor these channels, in addition to following our press releases, SEC filings and public conference calls and webcasts. In addition, you may automatically receive email alerts and other information about Blackstone when you enroll your email address by visiting the “Contact Us/Email Alerts” section of our website at http://ir.blackstone.com. The contents of our website, any alerts and social media channels are not, however, a part of this report.
23
|
Item 1A.
|
Risk Factors
|
Risks Related to Our Business
Difficult market, economic and geopolitical conditions can adversely affect our business in many ways, each of which could materially reduce our revenue, earnings and cash flow and adversely affect our financial prospects and condition.
Our business is materially affected by financial market and economic conditions and events throughout the world that are outside our control. We may not be able to or may choose not to manage our exposure to these conditions and/or events. Such conditions and/or events can adversely affect our business in many ways, including reducing the ability of our funds to raise or deploy capital, reducing the value or performance of our funds’ investments and making it more difficult for our funds to exit and realize value from existing investment. This could in turn materially reduce our revenue, earnings and cash flow and adversely affect our financial prospects and condition. In addition, in the face of a difficult market or economic environment, we may need to reduce our fixed costs and other expenses in order to maintain profitability, including cutting back or eliminating the use of certain services or service providers, or terminating the employment of a significant number of our personnel that, in each case, could be important to our business and without which our operating results could be adversely affected. A failure to manage or reduce our costs and other expenses within a time frame sufficient to match any decrease in profitability would adversely affect our operating performance.
Turmoil in the global financial markets can provoke significant volatility of equity and debt securities prices. This can have a material and rapid impact on our mark-to-market valuations, particularly with respect to our public holdings and credit investments. While inflation in the U.S. has decreased significantly in recent months, 2023 was characterized by elevated inflation and high interest rates, which contributed to significant volatility in debt and equity markets. The valuations of our funds’ real estate assets, and fundraising in certain of our real estate strategies targeting high-net-worth investors, have been adversely impacted by elevated interest rates and a high cost of capital. An extended period of high interest rates would continue to present a challenge to real estate valuations. Such factors could be even more challenging for traditional office properties and those properties with long-term leases that do not provide for short-term rent increases. In addition, should inflation begin to increase again, some of our funds’ portfolio companies’ profit margins may be pressured, particularly against a backdrop of economic slowdown or contraction.
As publicly traded equity securities have in recent years represented meaningful proportion of the assets of many of our funds, stock market volatility, including a sharp decline in the stock market, may adversely affect our results, including our revenues and net income. Moreover, our public equity holdings have at times been concentrated in a few large positions, thereby making our unrealized mark-to-market valuations particularly sensitive to sharp changes in the price of any of these positions. Further, although the equity markets are not the only means by which we exit investments, should we experience a period of challenging equity markets, our funds may experience continued difficulty in realizing value from investments. In China, after a period of measures instituted to control the rate of economic growth in the country, the China growth rate has been slowing, and further slowing could have a systemic impact on the global economy and on equity and debt markets.
24
Geopolitical concerns and other global events outside of our control have contributed and may continue to contribute to volatile global equity and debt markets. These concerns and events include, without limitation, trade conflict, civil unrest, threats to national security, national and international political circumstances (including war, terrorist acts or security operations) and pandemics or other severe public health events. Geopolitical instability has in recent years become more prevalent. For example, the ongoing war between Russia and Ukraine, and Israel’s war against Hamas, and the global responses thereto, have contributed to volatility in the global financial markets, which may adversely impact our performance and the performance of our funds and their respective portfolio companies.
In addition to the factors described above, other market, economic and geopolitical factors described herein that may adversely affect our business include, without limitation:
|
•
|
higher prices for commodities or other goods,
|
|
•
|
economic slowdown or recession in the U.S. and internationally,
|
|
•
|
changes in interest rates and/or a lack of availability of credit in the U.S. and internationally and
|
|
•
|
changes in law and/or regulation, and uncertainty regarding government and regulatory policy.
|
A period of economic slowdown, which may occur across one or more industries, sectors or geographies, creates operating performance challenges for certain of our funds’ investments, which could adversely affect our operating results and cash flows.
Despite overall resilience in some geographies, many global economies have in recent years experienced periods of deceleration. Further economic deceleration or contraction in the rate of growth in certain industries, sectors or geographies may contribute to poor financial results for our funds’ portfolio companies or assets, which may result in lower investment returns for our funds. For example, periods of economic weakness have contributed and may in the future contribute to a decline in commodity prices and decreased consumer demand for certain goods and services (including energy), and/or volatility in the oil and natural gas markets, each of which would have an adverse effect on our energy and consumer investments. In addition, slowing growth in certain real estate sectors with excess near-term supply, such as life sciences office and U.S. multifamily, has negatively impacted and may continue to negatively impact the valuations of assets in such sectors in the near-term.
In addition, in recent years elevated inflation globally contributed to heightened costs of labor, energy and materials, which put profit margin pressure on certain of our funds’ portfolio companies and negatively impacted the performance of certain of such companies. Should inflation, which recently has decreased significantly, begin to increase again, our funds’ portfolio companies profit margins may be pressured, particularly if such companies lack pricing power against a backdrop of economic slowdown or contraction. For example, high rates of inflation and significant interest rate increases contributed to significant market volatility in 2022 and 2023, which disproportionately negatively impacted the value of future cash flows of technology and growth companies. These companies may be subject to continued depressed, or even further declines in, values in a challenging market environment. To the extent the performance of our funds’ investments in such companies, as well as valuation
25
multiples, do not ultimately improve, our funds may sell those assets at values that are less than we projected or even at a loss, thereby significantly affecting those investment funds’ performance. In addition, as the governing agreements of our funds contain only limited requirements regarding diversification of fund investments (by, for example, sector or geographic region), during periods of economic slowdown in certain sectors or regions, the impact on our funds may be exacerbated by concentration of investments in such sectors or regions. Such concentration may increase the risk that events affecting specific sectors, geographic regions or asset types could have an adverse or disparate impact on such funds, as compared to funds that invest more broadly. As a result, our ability to raise new funds, as well as our operating results and cash flows, could be adversely affected.
Moreover, during periods of weakness, our funds’ portfolio companies may also have difficulty expanding their businesses and operations or meeting their debt service obligations or other expenses as they become due, including expenses payable to us. Furthermore, negative market conditions could potentially result in a portfolio company entering bankruptcy proceedings, thereby potentially resulting in a complete loss of the fund’s investment in such portfolio company and a significant negative impact to the fund’s performance and consequently to our operating results and cash flow, as well as to our reputation. In addition, negative market conditions would also increase the risk of default with respect to investments held by our funds that have significant debt investments, such as our credit-focused funds.
High interest rates and challenging debt market conditions have negatively impacted and could continue to negatively impact the values of certain assets or investments and the ability of our funds and their portfolio companies to access the capital markets, which could adversely affect investment and realization opportunities, lead to lower-yielding investments and potentially decrease our net income.
In light of elevated inflation, the U.S. Federal Reserve increased interest rates eleven times over the course of 2022 and 2023. High interest rates create downward pressure on the value of certain assets owned by our funds, including, among others, real estate and fixed-rate debt. An extended period of high interest rates would continue to present a challenge for the valuations of such assets, as well as for fundraising in certain of our real estate strategies targeting high-net-worth investors. Relatedly, opportunities to realize value from certain of our investments are likely to continue to be more limited if interest rates remain at high levels for an extended period, such as, in certain real estate sectors and operating companies given the potential adverse impact on equity prices and caution on the part of potential acquirers. Further, our funds have faced, and could continue to face, difficulty in realizing value from investments due to sustained declines in equity market values as a result of concerns regarding interest rates.
In recent years, high interest rates have increased the cost of debt financing for the transactions our funds pursue. In addition, during 2023, financing markets experienced challenges amid the failure of multiple U.S. regional banks. A significant contraction or weakening in the market for debt financing or other adverse change relating to the terms of debt financing (such as, for example, higher equity requirements and/or more restrictive covenants), particularly in the area of acquisition financings for private equity and real estate transactions, could have a material adverse effect on our business. For example, a portion of the indebtedness used to finance certain fund investments often includes high-yield debt securities issued in the capital markets. Availability of capital from the high-yield debt markets is subject to significant volatility, and there may be times when we might not be able to access those markets at attractive rates, or at all, when completing an investment. Further, the financing of acquisitions or the operations of our funds’ portfolio companies with debt may become less attractive due to limitations on the deductibility of corporate interest expense. See “— Changes in U.S. and foreign taxation of businesses and other tax laws, regulations or treaties or an adverse interpretation of these items by tax authorities could adversely affect us, including by adversely impacting our effective tax rate and tax liability.”
If our funds are unable to obtain committed debt financing for potential acquisitions, can only obtain debt financing at an increased interest rate or on unfavorable terms or the ability to deduct corporate interest expense is substantially limited, our funds may face increased competition from strategic buyers of assets who may have an overall lower cost of capital or the ability to benefit from a higher amount of cost savings following an acquisition,
26
or may have difficulty completing otherwise profitable acquisitions or may generate profits that are lower than would otherwise be the case, each of which could lead to a decrease in our funds’ performance and therefore our revenues. In addition, rising interest rates, coupled with periods of significant equity and credit market volatility may potentially make it more difficult for us to find attractive opportunities for our funds to exit and realize value from their existing investments.
Our funds’ portfolio companies also regularly utilize the corporate debt markets to obtain financing for their operations. To the extent monetary policy, tax or other regulatory changes or difficult credit markets render such financing difficult to obtain, more expensive or otherwise less attractive, this may also negatively impact the financial results of those portfolio companies and, therefore, the investment returns on our funds and our revenues. In addition, to the extent that market conditions, and/or tax or other regulatory changes make it difficult or not possible to refinance debt that is maturing in the near term, or to the extent that such refinancing would result in a rating agency viewing a portfolio company as having incurred an excessive amount of debt, some of our funds’ portfolio companies may be unable to repay such debt at maturity and may be forced to sell assets, undergo a recapitalization or seek bankruptcy protection.
A decline in the pace or size of investments made by our funds may adversely affect our revenues.
The revenues that we earn are driven in part by the pace at which our funds make investments and the size of those investments, and a decline in the pace or the size of such investments may reduce our revenues. In particular, in recent years we have meaningfully increased the number of perpetual capital vehicles we offer and the assets under management in such vehicles. The fees we earn from our perpetual capital vehicles, including our Core+ real estate strategy, represent a significant and growing portion of our overall revenues. If our funds, including our perpetual capital vehicles, are unable to deploy capital at a sufficient pace, our revenues would be adversely impacted. Many factors could cause a decline in the pace of investment, including a market environment characterized by high prices, the inability of our investment professionals to identify attractive investment opportunities, competition for such opportunities among other potential acquirers, decreased availability of financing on attractive terms or at all or decreased availability of investor capital, including as a result of a challenging fundraising environment or heightened investor requests for repurchases in certain vehicles. A number of our funds, including our real estate and private equity funds, have invested and intend to continue to invest in large transactions or transactions that otherwise have substantial business, regulatory or legal complexity and may be more difficult to execute successfully than smaller or less complex investments. In addition, realizing value from such investments may be more difficult as a result of, among other things, a limited universe of potential acquirers.
We may also fail to consummate identified investment opportunities because of regulatory or legal complexities or uncertainty and adverse developments in the U.S. or global economy, financial markets or geopolitical conditions, and our ability to deploy capital in certain countries may be adversely impacted by U.S. and foreign government policy changes and regulations. For example, the ability to deploy capital in China has been adversely impacted by policies and regulations in China and the U.S., which may be exacerbated prospectively. For example, the President signed an Executive Order in August 2023 that established an outbound investment screening regime intended to regulate or prohibit certain investments by U.S. persons in advanced technology sectors in China and other jurisdictions that may be designated as a “country of concern.” See “— Laws and regulations on foreign direct investment applicable to us and our funds’ portfolio companies, both within and outside the U.S, may make it more difficult for us to deploy capital in certain jurisdictions or to sell assets to certain buyers.”
27
Our revenue, earnings, net income and cash flow can all vary materially, which may make it difficult for us to achieve steady earnings growth on a quarterly basis and may cause the price of our common stock to decline.
Our revenue, earnings, net income and cash flow can all vary materially due to our reliance on Performance Revenues. We may experience fluctuations in our results, including our revenue and net income, from quarter to quarter due to a number of other factors, including timing of realizations, changes in the valuations of our funds’ investments, changes in the amount of distributions, dividends or interest paid in respect of investments, changes in our operating expenses and the degree to which we encounter competition, each of which may be impacted by economic and market conditions. Achieving steady growth in net income and cash flow on a quarterly basis may be difficult, which could in turn lead to large adverse movements or general increased volatility in the price of our common stock. We do not provide guidance regarding our expected quarterly and annual operating results. The lack of guidance may affect the expectations of public market analysts and could cause increased volatility in our common stock price.
For certain of our vehicles, including our Core+ real estate and infrastructure funds and BCRED and other of our perpetual capital vehicles, which have in recent years become increasingly large contributors to our earnings, our incentive income is paid between quarterly and every five years. The varying frequency of these payments will contribute to the volatility of our cash flow. Furthermore, we earn this incentive income only if the net asset value of a vehicle has increased or, in the case of certain vehicles, increased beyond a particular return threshold, or if the vehicle has earned a net profit. Certain of these vehicles also have “high water marks” whereby we do not earn incentive income during a particular period even though the vehicle had positive returns in such period as a result of losses in prior periods. If one of these vehicles experiences losses, we will not earn incentive income from it until it surpasses the previous high-water mark. The incentive income we earn is therefore dependent on the net asset value or the net profit of the vehicle, which could lead to significant volatility in our results.
Our cash flow may fluctuate significantly because we receive Performance Allocations from our carry funds only when investments are realized and achieve a certain preferred return. Performance Allocations depend on our carry funds’ performance and opportunities for realizing gains, which may be limited. It takes a substantial period of time to realize the cash value (or other proceeds) of an investment. Even if an investment proves to be profitable, it may be a number of years before any profits can be realized, particularly if market conditions were unaccomodating. We cannot predict when, or if, any realization of investments will occur. In addition, the valuations of, and realization opportunities for, investments made by our funds, could also be subject to high volatility as a result of uncertainty or potential changes to governmental policy with respect to, among other things, tax, trade, immigration, healthcare, labor, infrastructure and energy.
Prior to our receiving any Performance Allocations in respect of realization of a profitable investment, 100% of the proceeds of that investment must generally be paid to the investors in that carry fund until they have recovered certain fees and expenses and achieved a certain return on all realized investments by that carry fund as well as a recovery of any unrealized losses. A particular realization event may have a significant impact on our results for that particular quarter that may not be replicated in subsequent quarters. We recognize revenue on investments in our investment funds based on our allocable share of realized and unrealized gains (or losses) reported by such investment funds, and a decline in realized or unrealized gains, or an increase in realized or unrealized losses, would adversely affect our revenue and possibly cash flow, which could further increase the volatility of our quarterly results. Because our carry funds have preferred return thresholds to investors that need to be met prior to our receiving any Performance Allocations, substantial declines in the carrying value of the investment portfolios of a carry fund can significantly delay or eliminate any Performance Allocations paid to us in respect of that fund because the value of the assets in the fund would need to recover to their aggregate cost basis plus the preferred return over time before we would be entitled to receive any Performance Allocations from that fund.
The timing and receipt of Performance Allocations also varies with the life cycle of our carry funds. During periods in which a relatively large portion of our assets under management is attributable to carry funds and investments in their “harvesting” period, our carry funds would make larger distributions than in the fundraising or investment periods that precede harvesting. During periods in which a significant portion of our assets under management is attributable to carry funds that are not in their harvesting periods, we may receive substantially lower Performance Allocations.
28
Adverse economic and market conditions may adversely affect the amount of cash generated by our businesses, the value of our principal investments, and in turn, our ability to pay dividends to our stockholders.
We primarily use cash to, without limitation (a) provide capital to facilitate the growth of our existing businesses, which principally includes funding our general partner and co-investment commitments to our funds, (b) provide capital for business expansion, (c) pay operating expenses, including cash compensation to our employees, and other obligations as they arise, including servicing our debt and (d) pay dividends to our stockholders, make distributions to the holders of Blackstone Holdings Partnership Units and make repurchases under our share repurchase program. Our principal sources of cash are: (a) cash we received in connection with our prior bond offerings, (b) management fees, (c) realized incentive fees and (d) realized performance allocations, which is the sum of Realized Principal Investment Income and Realized Performance Revenues less Realized Performance Compensation. We have also entered into a $4.325 billion revolving credit facility with a final maturity date of December 15, 2028. Our long-term debt totaled $10.7 billion in borrowings from our prior bond issuances. As of December 31, 2023, we had no borrowings outstanding under our revolving credit facility. As of December 31, 2023, we had $3.0 billion in Cash and Cash Equivalents, $803.9 million invested in Corporate Treasury Investments and $4.3 billion in Other Investments.
If growth of the global economy continues to decelerate, or conditions in the financing markets were challenged, the investment performance of our funds could suffer, resulting in, for example, the payment of decreased or no Performance Allocations to us. This could materially and adversely affect the amount of cash we have on hand, which could in turn require us to rely on other sources of cash, such as the capital markets, which may not be available to us on acceptable terms or at all for the above purposes. A decrease in the amount of cash we have on hand could also materially and adversely affect our ability to pay dividends to our stockholders and make repurchases under our share repurchase program. Furthermore, during adverse economic and market conditions, we might not be able to renew all or part of our existing revolving credit facility or find alternate financing on commercially reasonable terms or at all. As a result, our uses of cash may exceed our sources of cash, thereby potentially affecting our liquidity position. In addition, we have made and expect to continue to make significant principal investments in our current and future investment funds. Contributing capital to these investment funds is risky, and we may lose some or the entire principal amount of our investments, including, without limitation, as a result of poor investment performance in a challenging economic and market environment.
Our business depends in large part on our ability to raise capital from third-party investors. A failure to raise capital from third-party investors on attractive fee terms or at all, would impact our ability to collect management fees or deploy such capital into investments and potentially collect Performance Revenues, which would materially reduce our revenue and cash flow and adversely affect our financial condition.
Our ability to raise capital from third-party investors depends on a number of factors, including certain factors that are outside our control. Certain factors, such as economic and market conditions (including the level of interest rates and stock market performance) and the asset allocation rules or investment policies to which such third-party investors are subject, could inhibit or restrict the ability of third-party investors to make investments in our investment funds or the asset classes in which our investment funds invest. For example, lawmakers across a number of states, including Pennsylvania and Florida, have put forth proposals or expressed intent to take steps to reduce or minimize the ability of their state pension funds to invest in alternative asset classes, including by proposing to increase the reporting or other obligations applicable to their state pension funds that invest in such asset classes. Such proposals or actions would potentially discourage investment by such state pension funds in alternative asset classes by imposing meaningful compliance burdens and costs on them, which could adversely affect our ability to raise capital from such state pension funds. Other states could potentially take similar actions, which may further impair our access to capital from an investor base that has historically represented a significant portion of our fundraising.
29
In addition, volatility in the valuations of investments, has in the past and may in the future affect our ability to raise capital from third-party investors. To the extent periods of volatility are coupled with a lack of realizations from investors’ existing portfolios, such investors may be left with disproportionately outsized remaining commitments to a number of investment funds, which significantly limits such investors’ ability to make new commitments to third-party managed investment funds such as those managed by us. Further, during periods of market volatility, investor subscription requests may be reduced and investor redemption or repurchase requests may be elevated in products that permit redemption or repurchase of investor interests. See “ —Investors in a number of our vehicles may withdraw their investments, and investors in certain of our vehicles may have a right to terminate our management of, or cause the dissolution of, such vehicles, which would lead to a decrease in our revenues.” In addition, certain of our investment vehicles that are available to individual investors are subject to state registration requirements that impose limits on the proportion of such investors’ net worth that can be invested in our products. These restrictions may limit such investors’ ability or willingness to allocate capital to such products and adversely affect our fundraising in the retail channel.
Our ability to raise new funds could similarly be hampered if the general appeal of alternative investments were to decline. An investment in a limited partner interest in an alternative investment fund is generally more illiquid and the returns on such investment may be more volatile than an investment in securities for which there is a more active and transparent market. In periods of positive markets and low volatility, for example, investors may favor passive investment strategies such as index funds over our actively managed investment vehicles. Similarly, during periods of high interest rates, investors may favor investments that are generally viewed as producing a risk-free return, such as treasury bonds, over investments in our products, particularly if the spread between the products declines. Alternative investments could also fall into disfavor as a result of concerns about liquidity and short-term performance. Such concerns could be exhibited, in particular, by public pension funds, which have historically been among the largest investors in alternative assets. Many public pension funds are significantly underfunded and their funding problems have been, and may in the future be, exacerbated by economic downturn. Concerns with liquidity could cause such public pension funds to reevaluate the appropriateness of alternative investments. In addition, our ability to raise capital from third parties outside of the United States could be limited to the extent the other countries, such as China, impose restrictions or limitations on outbound foreign investment.
Moreover, certain institutional investors are demonstrating a preference to in-source their own investment professionals and to make direct investments in alternative assets without the assistance of alternative asset advisers like us. Such institutional investors may become our competitors and could cease to be our clients. As some existing investors cease or significantly curtail making commitments to alternative investment funds, we may need to identify and attract new investors in order to maintain or increase the size of our investment funds. We may be unable to find or secure commitments from those new investors or that the fee terms of the commitments from such new investors will be consistent with the fees historically paid to us by our investors. If economic conditions were to deteriorate or if we are unable to find new investors, we might raise less than our desired amount for a given fund. Further, as we seek to expand into other asset classes, we may be unable to raise a sufficient amount of capital to adequately support such businesses. A failure to successfully raise capital could materially reduce our revenue and cash flow and adversely affect our financial condition.
In connection with raising new funds or making further investments in existing funds, we negotiate terms for such funds and investments with existing and potential investors. The outcome of such negotiations could result in our agreement to terms that are materially less favorable to us than for prior funds we have managed or funds managed by our competitors, including with respect to management fees, incentive fees and/or carried interest, which could have an adverse impact on our revenues. Such terms could also restrict our ability to raise investment funds with investment objectives or strategies that compete with existing funds, add additional expenses and obligations for us in managing the fund or increase our potential liabilities, all of which could ultimately reduce our revenues. In addition, certain institutional investors, including sovereign wealth funds and public pension funds, have demonstrated an increased preference for alternatives to the traditional investment fund structure, such as managed accounts, smaller funds and co-investment vehicles. There can be no assurance that such alternatives will be as profitable for us as the traditional investment fund structure, or as to the impact such a trend could have on the cost of our operations or profitability if we were to implement these alternative investment structures. Although we have no obligation to modify any of our fees with respect to our existing funds, we may experience pressure to do so in our funds, including in response to regulatory focus by the SEC on the quantum and types of fees and expenses charged by private funds. We have confronted and expect to continue to confront requests from a variety of investors and groups representing investors to decrease fees, which could result in a reduction in the fees and Performance Revenues we earn.
30
The asset management business is intensely competitive.
The asset management business is intensely competitive, with competition based on a variety of factors, including investment performance, the quality of client service, investor availability of capital and willingness to invest, fund terms (including fees and liquidity terms), brand recognition and business reputation. Our asset management business competes with a number of private funds, specialized investment funds, funds structured for individual investors, hedge funds, funds of hedge funds and other sponsors managing pools of capital, as well as corporate buyers, traditional asset managers, commercial banks, investment banks and other financial institutions (including sovereign wealth funds), and we expect that competition will continue to increase. For example, certain traditional asset managers have developed their own private equity and retail platforms and are marketing other asset allocation strategies as alternatives to hedge fund investments. A number of factors serve to increase our competitive risks:
|
•
|
a number of our competitors in some of our businesses have greater financial, technical, research, marketing and other resources and more personnel than we do,
|
|
•
|
some of our funds may not perform as well as competitors’ funds or other available investment products,
|
|
•
|
several of our competitors have significant amounts of capital, and many of them have similar investment objectives to ours, which may create additional competition for investment opportunities and may reduce the size and duration of pricing inefficiencies that many alternative investment strategies seek to exploit,
|
|
•
|
some of our competitors, particularly strategic competitors, may have a lower cost of capital, which may be exacerbated by limits on the deductibility of interest expense,
|
|
•
|
some of our competitors may have access to funding sources that are not available to us, which may create competitive disadvantages for us with respect to investment opportunities,
|
|
•
|
some of our competitors may be subject to less regulation and accordingly may have more flexibility to undertake and execute certain businesses or investments than we can and/or bear less compliance expense than we do,
|
|
•
|
some of our competitors may have more flexibility than us in raising certain types of investment funds under the investment management contracts they have negotiated with their investors,
|
|
•
|
some of our competitors may have higher risk tolerances, different risk assessments or lower return thresholds, which could allow them to consider a wider variety of investments and to bid more aggressively than us for investments that we want to make or to seek exit opportunities through different channels, such as special purpose acquisition vehicles,
|
|
•
|
some of our competitors may be more successful than we are in the development of new products to address investor demand for new or different investment strategies and/or regulatory changes, including with respect to products with mandates that incorporate environmental, social and governance considerations, or products that developed for individual investors or that target insurance capital,
|
|
•
|
there are relatively few barriers to entry impeding new alternative asset fund management firms, and the successful efforts of new entrants into our various businesses, including former “star” portfolio managers at large diversified financial institutions as well as such institutions themselves, is expected to continue to result in increased competition,
|
|
•
|
some of our competitors may have better expertise or be regarded by investors as having better expertise in a specific asset class or geographic region than we do,
|
|
•
|
our competitors that are corporate buyers may be able to achieve synergistic cost savings in respect of an investment, which may provide them with a competitive advantage in bidding for an investment,
|
|
•
|
some investors may prefer to invest with an investment manager that is not publicly traded or is smaller, with a more limited number of investment products that it manages and
|
|
•
|
other industry participants will from time to time seek to recruit our investment professionals and other employees away from us.
|
Additionally, technological innovation, including the use of artificial intelligence and data science, has the potential to disrupt the financial industry and change the way financial institutions, including asset managers, do business. Some of our competitors may be more successful than us in the development and implementation of new technologies, including services and platforms based on artificial intelligence, to address investor demand or improve operations. If we are unable to adequately advance our capabilities in these areas, or do so at a slower pace than others in our industry, we may be at a competitive disadvantage.
We may lose investment opportunities if we do not match investment prices, structures and terms offered by competitors. Alternatively, we may experience decreased rates of return and increased risks of loss if we match investment prices, structures and terms offered by competitors. Moreover, if we are forced to compete with other alternative asset managers on the basis of price, we may
31
not be able to maintain our current fund fee and carried interest terms. We have historically competed primarily on the performance of our funds, and not on the level of our fees or carried interest relative to those of our competitors. However, there is a risk that fees and carried interest in the alternative investment management industry will decline, without regard to the historical performance of a manager. Further, some of our competitors may be willing to pay higher placement fees in order to gain distribution of their private wealth products. Fee or carried interest income reductions, or placement fee increases, on existing or future products, without corresponding decreases in our cost structure, would adversely affect our revenues and profitability.
In addition, the attractiveness of our investment funds relative to investments in other investment products could decrease depending on economic conditions. Furthermore, any new or incremental regulatory measures for the U.S. financial services industry may increase costs and create regulatory uncertainty and additional competition for many of our funds. See “— Financial regulatory changes in the United States could adversely affect our business.”
These competitive pressures could adversely affect our ability to make successful investments and limit our ability to raise future investment funds, either of which would adversely impact our business, revenue, results of operations and cash flow.
We have increasingly undertaken business initiatives to increase the number and type of investment products we offer to individual investors, which could expose us to new and greater levels of risk.
Although individual investors have been part of our historic distribution efforts, we have increasingly undertaken business initiatives to increase the number and type of investment products we offer to high-net-worth individuals, family offices and mass affluent investors in the U.S. and other jurisdictions around the world. Specifically, we create investment products designed for investment by individual investors in the U.S., some of whom are not accredited investors, or similar investors in non-U.S. jurisdictions, including in Europe. In some cases, our funds are distributed to such investors indirectly through third-party managed vehicles sponsored by brokerage firms, private banks or third-party feeder providers, and in other cases directly to the clients of private banks, independent investment advisors and brokers.
Accessing individual investors and offering products directed at such investors exposes us to new and greater levels of risk, including heightened litigation and regulatory enforcement, an increased compliance burden, and more complex administration and accounting operations. We may be subject to claims related to matters such as the adequacy of disclosures, appropriateness of fees, suitability and board of directors oversight, each which could result in civil lawsuits, regulatory penalties and enforcement actions. Our registered investment advisers could also be subject to direct or derivative claims from a fund’s investors or board of directors for alleged mismanagement of the fund. In addition, regulatory requirements imposing limitations on the ability of affiliates of certain of our vehicles to engage in certain transactions may limit our funds’ ability to engage in otherwise attractive investment opportunities.
To the extent distribution of such products is through new channels and markets, including through an increasing number of distributors with whom we engage, we may not be able to effectively monitor or control the manner of their distribution, which could result in litigation or regulatory action against us, including with respect to, among other things, claims that products distributed through such channels are distributed to investors for whom they are unsuitable, claims related to conflicts of interest or the adequacy of disclosure to investors or claims that the products are distributed in a manner inconsistent with our regulations requirements or otherwise inappropriate manner. In addition, regulation applicable to our arrangements with such distributors and channels increases the compliance burden associated with onboarding new distributors or pursuing new distribution channels, resulting in increased cost and complexity. Although we engage in due diligence and onboarding procedures that seek to uncover issues relating to the third-party channels through which individual investors access our investment products, we do not control and have limited information regarding many of these third-party channels and thus we are exposed to the risks of reputational damage, regulatory scrutiny and legal liability to the extent such third parties improperly sell our products to investors. This risk is heightened by the continuing increase in the number of third parties through whom we distribute our investment products around the world and who we do not control. For example, in certain cases, we may be viewed by a regulator as responsible for the content of materials prepared by third parties.
Similarly, there is a risk that Blackstone employees involved in the direct distribution of our products, or employees who oversee independent advisors, brokerage firms and other third parties around the world involved in distributing our products, do not follow our compliance and supervisory procedures. In addition, the distribution of such products, including through new channels whether directly or through market intermediaries, could expose us to allegations of improper conduct and/or actions by state and federal regulators in the U.S. and regulators in jurisdictions outside of the United States with respect to, among other things, product
32
suitability, distributor eligibility, investor classification, compliance with securities laws, conflicts of interest and the adequacy of disclosure to investors to whom our products are distributed through those channels.
As we expand the distribution of products to individual investors outside of the United States, we are increasingly exposed to risks in non-U.S. jurisdictions. While many of the risks we face in non-U.S. jurisdictions are similar to those that we face in the distribution of products to individual investors in the U.S., securities laws and other applicable regulatory regimes can be extensive, complex and vary by jurisdiction. In addition, the distribution of products to individual investors out of the U.S. may involve complex structures (such as distributor-sponsored feeder funds or nominee/omnibus investors) and market practices that vary by local jurisdiction. As a result, this expansion subjects us to additional complexity, litigation and regulatory risk.
Furthermore, our initiatives to expand our individual investor base, including outside of the United States, requires the investment of significant time, effort and resources, including the potential hiring of additional personnel, the implementation of new operational, compliance and other systems and processes and the development or implementation of new technology. Our efforts to continue to grow the assets we manage on behalf of individual investors may not be successful.
We depend on our co-founder and other key senior managing directors and personnel, and the loss of their services would have a material adverse effect on our business, results and financial condition.
We depend on the efforts, skill, reputations and business contacts of our co-founder, Stephen A. Schwarzman, our President, Jonathan D. Gray, and other key senior managing directors and personnel, the information and deal flow they generate during the normal course of their activities and the synergies among the diverse fields of expertise and knowledge held by our professionals. Accordingly, our success will depend on the continued service of these individuals, who are not obligated to remain employed with us. Several key personnel have left the firm in the past and others may do so in the future, and we cannot predict the impact that the departure of any key personnel will have on our ability to achieve our investment objectives. For example, the governing agreements of many of our funds generally provide investors with the ability to terminate the investment period in the event that certain “key persons” in the fund do not meet the specified time commitment to the fund or our firm ceases to control the general partner. The loss of the services of any key personnel could have a material adverse effect on our revenues, net income and cash flows and could harm our ability to maintain or grow assets under management in existing funds or raise additional funds in the future. Our senior managing directors and other key personnel possess substantial experience and expertise and have strong business relationships with our investors and other members of the business community. As a result, the loss of these personnel could jeopardize our relationships with such parties and result in the reduction of assets under management or fewer investment opportunities.
We have historically relied in part on the interests of these professionals in the investment funds’ carried interest and incentive fees to discourage them from leaving the firm. However, to the extent our investment funds perform poorly, thereby reducing the potential for carried interest and incentive fees, their interests in carried interest and incentive fees become less valuable to them and become less effective as incentives for them to continue to be employed at Blackstone. We might not be able to provide future key personnel with interests in our business to the same extent or with the same tax consequences from which our existing personnel previously benefited. For example, U.S. federal income tax law currently imposes a three-year holding period requirement for carried interest to be treated as long-term capital gains. The holding period requirement may result in some of the carried interest received by such individuals being treated as ordinary income, which would materially increase the amount of taxes that such key personnel would be required to pay. Moreover, the tax treatment of carried interest continues to be an area of focus for policymakers and government officials, which could result in further regulatory action by federal or state governments. See “—Changes in U.S. and foreign taxation of businesses and other tax laws, regulations or treaties or an adverse interpretation of these items by tax authorities could adversely affect us, including by adversely impacting our effective tax rate and tax liability.” Moreover, possible increases in state tax rates or changes to the tax treatment of, or the levying of additional taxes on, carried interest, along with changing opinions regarding living in some geographies where we have offices, may adversely affect our ability to recruit, retain and motivate our current and future professionals.
There is no guarantee that the non-competition and non-solicitation agreements to which our senior managing directors and other key personnel are subject, together with our other arrangements with them, will prevent them from leaving, joining our competitors or otherwise competing with us. Such agreements also expire after a certain period of time, at which point such personnel would be free to compete against us and solicit our clients and employees. In addition, such agreements may not be
33
enforceable in all cases, particularly as U.S. states and/or federal agencies enact legislation or adopt rules aimed at effectively prohibiting non-competition agreements. For example, the U.S. Federal Trade Commission (the “FTC”) published a proposed rule in January 2023 that, if issued in its current form, would generally prohibit post-employment non-competition provisions in agreements between employers and their employees. Further, in 2023, legislation that would ban post-employment non-competition agreements was introduced in New York, but subsequently vetoed by the Governor. Similar legislation is likely to be reintroduced in 2024 and if enacted, would generally prohibit some or all post-employment non-competition provisions in employment agreements.
We strive to maintain a work environment that reinforces our culture of collaboration, motivation and alignment of interests with investors. If we do not continue to develop and implement the right processes and tools to maintain this culture, particularly in light of rapid and significant growth in our scale, global presence and employee population, our ability to compete successfully and achieve our business objectives could be impaired, which could negatively impact our business, financial condition and results of operations.
Changes in U.S. and foreign taxation of businesses and other tax laws, regulations or treaties or an adverse interpretation of these items by tax authorities could adversely affect us, including by adversely impacting our effective tax rate and tax liability.
Our effective tax rate and tax liability is based on the application of current income tax laws, regulations and treaties. These laws, regulations and treaties are complex, and the manner which they apply to us and our funds is sometimes open to interpretation. Significant management judgment is required in determining our provision for income taxes, our deferred tax assets and liabilities and any valuation allowance recorded against our net deferred tax assets. Although management believes its application of current laws, regulations and treaties to be correct and sustainable upon examination by the tax authorities, the tax authorities could challenge our interpretation resulting in additional tax liability or adjustment to our income tax provision that could increase our effective tax rate.
In addition, past and future changes to tax laws and regulations may have an adverse impact on us. For example, the Inflation Reduction Act of 2022 imposes, among other things, a minimum “book” tax on certain large corporations and creates a new excise tax on net stock repurchases made by certain publicly traded corporations. These and other changes could materially change the amount and/or timing of tax we and our portfolio companies may be required to pay and may increase tax-related regulatory and compliance costs.
The U.S. Congress, the Organization for Economic Co-operation and Development (“OECD”) and other government agencies in jurisdictions in which we and our affiliates invest or do business have maintained a focus on issues related to the taxation of multinational companies. The OECD, which represents a coalition of member countries, is contemplating changes to numerous long-standing tax principles through its base erosion and profit shifting (“BEPS”) project, which is focused on a number of issues, including the shifting of profits between affiliated entities in different tax jurisdictions, interest deductibility and eligibility for the benefits of double tax treaties. Several of the proposed measures are potentially relevant to some of our structures and could have an adverse tax impact on our funds, investors and/or our funds’ portfolio companies. Some member countries have been moving forward on the BEPS agenda but, because timing of implementation and the specific measures adopted will vary among participating member countries, significant uncertainty remains regarding the impact of BEPS proposals. If implemented, these proposals could result in a loss of tax treaty benefits and increased taxes on income from our investments.
The OECD is also working on a two-pillar initiative, which is aimed at (a) shifting taxing rights to the jurisdiction of the consumer (“Pillar One”) and (b) ensuring all companies pay a global minimum tax (“Pillar Two”). Under Pillar Two, certain entities within a multinational group will be subject to top-up taxes where the overall tax paid on the group’s profit in any jurisdiction falls below the minimum 15% effective tax rate. The EU, among other regions implementing or intending to implement these rules, adopted Pillar Two and required that all EU member states adopt local legislation to implement such rules beginning December 31, 2023. If implemented in any of the countries in which our business, our portfolio companies, or our investment structures are located, these rules could result in increased effective tax rates, possible denial of deductions, withholding taxes and/or profits being allocated differently and increased complexity, burden and cost of tax compliance. Given the ongoing design, implementation and administration of Pillar One and Pillar Two, the timing, scope and impact of any relevant domestic legislation or multilateral conventions remain uncertain.
34
Cybersecurity and data protection risks could result in the loss of data, interruptions in our business, and damage to our reputation, and subject us to regulatory actions, increased costs and financial losses, each of which could have a material adverse effect on our business and results of operations.
Our operations are highly dependent on our technology platforms and we rely heavily on our analytical, financial, accounting, communications and other data processing systems. Our systems face ongoing cybersecurity threats and attacks, which could result in the loss of confidentiality, integrity or availability of such systems and the data held by such systems. Attacks on our systems could involve, and in some instances have in the past involved, attempts intended to obtain unauthorized access to our proprietary information, destroy data or disable, degrade or sabotage our systems, or divert or otherwise steal funds, including through the introduction of computer viruses, “phishing” attempts and other forms of social engineering. Attacks on our systems could also involve ransomware or other forms of cyber extortion. Cyberattacks and other data security threats could originate from a wide variety of external sources, including cyber criminals, nation state hackers, hacktivists and other outside parties. Cyberattacks and other security threats could also originate from the malicious or accidental acts of insiders, such as employees, consultants, independent contractors or other service providers.
There has been an increase in the frequency and sophistication of the cyber and data security threats we face, with attacks ranging from those common to businesses generally to those that are more advanced and persistent, which may target us because, as an alternative asset management firm, we hold a significant amount of confidential and sensitive information about our investors, our funds’ portfolio companies and potential investments. As a result, we may face a heightened risk of a security breach or disruption with respect to this information. Measures we take to ensure the integrity of our systems may not provide adequate protection, especially because cyberattack techniques are continually evolving, may persist undetected over extended periods of time, and may not be mitigated in a timely manner to prevent or minimize the impact of an attack on Blackstone, our investors, our portfolio companies or potential investments. If our systems or those of third-party serve providers are compromised either as a result of malicious activity or through inadvertent transmittal or other loss of data, do not operate properly or are disabled, or we fail to provide the appropriate regulatory or other notifications in a timely manner, we could suffer financial loss, increased costs, a disruption of our businesses, liability to our counterparties, investment funds or fund investors, regulatory intervention or reputational damage. The costs related to cyber or other data security threats or disruptions may not be fully insured or indemnified by other means.
In addition, we could also suffer losses in connection with updates to, or the failure to timely update, the technology platforms on which we rely. We are reliant on third-party service providers for certain aspects of our business, including for the administration of certain funds, as well as for certain technology platforms, including cloud-based services. These third-party service providers could also face ongoing cybersecurity threats and compromises of their systems and as a result, unauthorized individuals could gain, and in some past instances have gained, access to certain confidential data.
Cybersecurity and data protection have become top priorities for regulators around the world. Many jurisdictions in which we operate have laws and regulations relating to privacy, data protection and cybersecurity, including, as examples, the General Data Protection Regulation (“GDPR”) in the European Union, the U.K. Data Protection Act, and the California Privacy Rights Act (“CPRA”). For example, in February 2022, the SEC proposed rules regarding registered investment advisers’ and funds’ cybersecurity risk management requiring the adoption and implementation of cybersecurity policies and procedures, enhanced disclosure in regulatory filings and prompt reporting of incidents to the SEC, which, if adopted, could increase our compliance costs and potential regulatory liability related to cybersecurity. Some jurisdictions have also enacted or proposed laws requiring companies to notify individuals and government agencies of data security breaches involving certain types of personal data.
35
Breaches in our security or in the security of third-party service providers, whether malicious in nature or through inadvertent transmittal or other loss of data, could potentially jeopardize our, our employees’ or our fund investors’ or counterparties’ confidential, proprietary and other information processed and stored in, and transmitted through, our computer systems and networks, or otherwise cause interruptions or malfunctions in our, our employees’, our fund investors’, our counterparties’ or third parties’ business and operations, which could result in significant financial losses, increased costs, liability to our fund investors and other counterparties, regulatory intervention and reputational damage. Furthermore, if we fail to comply with the relevant laws and regulations or fail to provide the appropriate regulatory or other notifications of breach in a timely matter, it could result in regulatory investigations and penalties, which could lead to negative publicity and reputational harm and may cause our fund investors and clients to lose confidence in the effectiveness of our security measures and Blackstone more generally.
Our funds’ portfolio companies also rely on data processing systems and the secure processing, storage and transmission of information, including payment and health information, which in some instances are provided by third parties. A disruption or compromise of these systems could have a material adverse effect on the value of these businesses. Our funds may invest in strategic assets having a national or regional profile or in infrastructure, the nature of which could expose them to a greater risk of being subject to a terrorist attack or a security breach than other assets or businesses. Such an event may have material adverse consequences on our investment or assets of the same type or may require portfolio companies to increase preventative security measures or expand insurance coverage.
Finally, our and our funds’ portfolio companies’ technology platforms, data and intellectual property are also subject to a heightened risk of theft or compromise to the extent we or our funds’ portfolio companies engage in operations outside the United States, in particular in those jurisdictions that do not have comparable levels of protection of proprietary information and assets such as intellectual property, trademarks, trade secrets, know-how and customer information and records. In addition, we and our funds’ portfolio companies may be required to compromise protections or forego rights to technology, data and intellectual property in order to operate in or access markets in a foreign jurisdiction. Any such direct or indirect compromise of these assets could have a material adverse impact on us and our funds’ portfolio companies.
Rapidly developing and changing global data security and privacy laws and regulations could increase compliance costs and subject us to enforcement risks and reputational damage.
We and our funds’ portfolio companies are subject to various risks and costs associated with the collection, storage, transmission and other processing of personally identifiable information (“PII”) and other sensitive and confidential information. This data is wide ranging and relates to our investors, employees, contractors and other counterparties and third parties. Any inability, or perceived inability, by us to adequately address privacy concerns, or comply with applicable privacy laws, regulations, policies, industry standards, or related contractual obligations, even if unfounded, could result in regulatory and third-party liability, increased costs, disruption business and operations, and reputational damage. Furthermore, any such inability or perceived inability of our funds’ portfolio companies, even if unfounded, could result in reputational damage to us.
Data security and privacy compliance obligations to which we are subject impose compliance costs on us, which could increase significantly as laws and regulations evolve globally. Our compliance obligations include those relating to U.S. laws and regulations, including, without limitation, state regulations such as the CPRA, which provides for enhanced consumer protections for California residents, a private right of action for data breaches and statutory fines and damages for data breaches or other California Consumer Privacy Act (“CCPA”) violations, as well as a requirement of “reasonable” cybersecurity. At the U.S. federal level, the SEC has proposed changes to Regulation S-P, which would require, among other things, that investment companies, broker-dealers, and SEC-registered investment advisers notify affected individuals of a breach involving their personal financial information within 30 days of becoming aware that it occurred.
36
Our compliance obligations also include those relating to foreign data collection and privacy laws, including, for example, the GDPR and U.K. Data Protection Act, as well as laws in many other jurisdictions globally, including Switzerland, Japan, Hong Kong, Singapore, India, China, Australia, Canada and Brazil. Global laws in this area are rapidly increasing in the scale and depth of their requirements, and are also often extra-territorial in nature. In addition, a wide range of regulators and private actors are seeking to enforce these laws across regions and borders. Furthermore, we frequently have privacy compliance requirements as a result of our contractual obligations with counterparties. These legal, regulatory and contractual obligations heighten our data protection and privacy obligations in the ordinary course of conducting our business in the U.S. and internationally.
Any inability, or perceived inability, by us or our funds’ portfolio companies to adequately address data protection or privacy concerns, or comply with applicable laws, regulations, policies, industry standards and guidance, contractual obligations, or other legal obligations, even if unfounded, could result in significant legal, regulatory and third-party liability, increased costs, disruption of our and our funds’ portfolio companies’ business and operations, and a loss of client (including investor) confidence and other reputational damage. Many regulators have indicated an intention to take more aggressive enforcement actions regarding data privacy matters, and private litigation resulting from such matters is increasing and resulting in progressively larger judgments and settlements. Furthermore, as new data protection and privacy-related laws and regulations are implemented, the time and resources needed for us and our funds’ portfolio companies to comply with such laws and regulations continues to increase and become a significant compliance workstream.
Technological developments in artificial intelligence could disrupt the markets in which we operate and subject us to increased competition, legal and regulatory risks and compliance costs.
Technological developments in artificial intelligence, including machine learning technology and generative artificial intelligence (collectively, “AI Technologies”) and their current and potential future applications, including in the private investment and financial sectors, as well as the legal and regulatory frameworks within which they operate, are rapidly evolving. The full extent of current or future risks related thereto is not possible to predict. AI Technologies could significantly disrupt the markets in which we operate and subject us to increased competition, legal and regulatory risks and compliance costs, which could have a material adverse effect on our business, financial condition and results of operations.
We intend to seek to avail ourselves of the potential benefits, insights and efficiencies that are available through the use of AI Technologies, which presents a number of potential risks that cannot be fully mitigated. Data in models that AI Technologies utilize are likely to contain a degree of inaccuracy and error, which could result in flawed algorithms. This could reduce the effectiveness of AI Technologies and adversely impact us and our operations to the extent we rely on the work product of such AI Technologies in such operations. There is also a risk that AI Technologies may be misused or misappropriated by our employees and/or third parties engaged by us. For example, a user may input confidential information, including material non-public information or personal identifiable information, into AI Technology applications, resulting in such information becoming part of a dataset that is accessible by third-party AI Technology applications and users, including our competitors. Such actions could subject us to legal and regulatory investigations and/or actions. Further, we may not be able to control how third-party AI Technologies that we choose to use are developed or maintained, or how data we input is used or disclosed, even where we have sought contractual protections with respect to these matters. The misuse or misappropriation of our data could have an adverse impact on our reputation and could subject us to legal and regulatory investigations and/or actions. In addition, we may communicate externally regarding AI Technology-related initiatives, including our development and use of AI Technologies, which subjects us to the risk of being accused of making inaccurate or misleading statements regarding our ability to avail ourselves of the potential benefits of AI Technology.
37
Regulations related to AI Technologies may also impose on us certain obligations and costs related to monitoring and compliance. For example, in April 2023, the Federal Trade Commission, U.S. Department of Justice, Consumer Financial Protection Bureau, and U.S. Equal Employment Opportunity Commission released a joint statement on artificial intelligence demonstrating interest in monitoring the development and use of automated systems and enforcement of their respective laws and regulations. In October 2023, the Presidential Administration signed an executive order that establishes new standards for AI safety and security. In addition to the U.S. regulatory framework, the EU is in the process of introducing a new regulation applicable to certain AI Technologies and the data used to train, test and deploy them, which if enacted, could impose significant requirements on both the providers and deployers of AI Technologies.
Extensive regulation of our businesses affects our activities and creates the potential for significant liabilities and penalties. The possibility of increased regulatory focus, particularly given the current administration, could result in additional burdens on our business.
Our business is subject to extensive regulation, including periodic examinations, inquiries and investigations, by governmental agencies and self-regulatory organizations in the jurisdictions in which we operate around the world. These authorities have regulatory powers dealing with many aspects of financial services, including the authority to grant, and in specific circumstances to cancel, permissions to carry on particular activities. Many of these regulators, including U.S. and foreign government agencies and self-regulatory organizations, as well as state securities commissions in the United States, are also empowered to conduct examinations, inquiries, investigations and administrative proceedings that can result in fines, suspensions of personnel, changes in policies, procedures or disclosure or other sanctions, including censure, the issuance of cease-and-desist orders, the suspension or expulsion of a broker-dealer or investment adviser from registration or memberships or the commencement of a civil or criminal lawsuit against us or our personnel.
The financial services industry in recent years has been the subject of heightened scrutiny, which is expected to continue to increase, and the SEC has specifically focused on private equity and the private funds industry. In that connection, in recent years the SEC’s stated examination priorities and published observations from examinations have included, among other things, private equity firms’ collection of fees and allocation of expenses, their marketing and valuation practices, allocation of investment opportunities, investor side letter terms, consistency of firms’ practices with disclosures, handling of material non-public information and insider trading, disclosures of investment risk, conflicts of interest, adherence to notice, consent and other contractual requirements regarding limited partnership advisory committees and compliance policies and procedures with respect to conflicts of interest. The SEC’s stated examination priorities also include investment advisers’ and funds’ compliance with recently adopted rules, including those referenced herein. Statements by SEC staff in 2023 and the SEC’s enforcement and rulemaking activities reflected a focus on certain of these topics and on bolstering transparency in the private funds industry, including with respect to fees earned and expenses charged by advisers.
In recent years, the SEC has proposed, and in some instances, adopted, a number of rules related to private funds and private fund advisors that impact our business and operations. Most significantly, in August 2023, the SEC adopted new rules and amendments to existing rules under the Advisers Act (collectively, the “Private Fund Adviser Rules”). The Private Fund Adviser Rules require registered investment advisers to distribute quarterly statements containing detailed information about, among other things, compensation, fees and expenses, investments, and performance; obtain an annual audit for private funds; and obtain a fairness or valuation opinion and make certain disclosures in connection with adviser-led secondary transactions. In addition, the rules restrict all investment advisers from engaging in certain practices unless they satisfy specified disclosure, and in some cases, consent requirements. The Private Fund Adviser Rules also prohibit providing preferential liquidity and information rights to investors unless certain conditions are met.
Although there is a pending legal challenge to the Private Fund Adviser Rules, whether such legal challenge will succeed is uncertain. While the full extent of the Private Funds Adviser Rules’ impact cannot yet be determined, the general anticipation is that they will increase regulatory and compliance costs, place burdens on our resources, including the time and attention of our personnel, and heighten the risk of regulatory action.
38
The Private Fund Adviser Rules are complemented by amended rules that require enhanced record retention and documentation. Furthermore, the SEC (in May 2023) and the SEC and CFTC jointly (in February 2024) adopted changes to Form PF, a confidential form relating to reporting by private fund advisers and intended to be used by the Financial Stability Oversight Counsel (“FSOC”) for systemic risk oversight purposes, that expand existing reporting obligations. Such increased obligations may increase our costs, including if we are required to spend more time, hire additional personnel, or buy new technology to comply effectively.
The SEC has also proposed several other rules that may impact our operations. For example, an October 2022 SEC proposal would, if adopted, impose substantial obligations on registered investment advisers to conduct initial due diligence and ongoing monitoring of a broad universe of service providers that we may use in our investment advisory business. If adopted, these new rules could significantly increase compliance burdens and associated regulatory costs and complexity for us and enhance the risk of regulatory action, which could adversely impact our reputation and our fundraising efforts, including as a result of regulatory sanctions. Moreover, in February 2023, the SEC proposed extensive amendments to the custody rule for SEC-registered investment advisers which would apply to all assets of an advisory client, including real estate and other assets that generally are not considered securities under the federal securities laws. If adopted, the amendments would require, among other things, that qualified custodians maintain possession of and control of assets of advisory clients and participate in or effectuate any changes of such assets’ beneficial ownership. There is a lack of clarity as to whether all assets held by Blackstone’s advisory clients can be custodied in a manner that satisfies the proposed rule or whether existing qualified custodians will provide custodial services for such assets at a reasonable cost or at all. If adopted, these amendments could expose our registered investment advisers to additional regulatory liability, increase compliance costs and impose limitations on our investing activities.
We regularly are subject to requests for information, inquiries and informal or formal investigations by the SEC and other regulatory authorities, with which we routinely cooperate, and which have included review of historical practices that were previously examined. Such investigations have previously and may in the future result in penalties and other sanctions. SEC actions and initiatives can have an adverse effect on our financial results, including as a result of the imposition of a sanction, a limitation on our or our personnel’s activities, or changing our historic practices. Even if an investigation or proceeding did not result in a sanction, or the sanction imposed against us or our personnel by a regulator were small in monetary amount, the adverse publicity relating to the investigation, proceeding or imposition of these sanctions could harm our reputation and cause us to lose existing clients or fail to gain new clients.
In addition, certain states and other regulatory authorities have required investment managers to register as lobbyists, and we have registered as such in a number of jurisdictions. Other states or municipalities may consider similar legislation or adopt regulations or procedures with similar effect. These registration requirements impose significant compliance obligations on registered lobbyists and their employers, which may include annual registration fees, periodic disclosure reports and internal recordkeeping.
We are subject to increasing scrutiny from regulators, elected officials, stockholders, investors and other stakeholders with respect to environmental, social and governance matters, which may adversely impact our ability to raise capital from certain investors, constrain capital deployment opportunities for our funds and harm our brand and reputation.
We, our funds and their portfolio companies are subject to increasing scrutiny from regulators, elected officials, stockholders, investors and other stakeholders with respect to ESG matters. With respect to the alternative asset management industry, in recent years, certain investors, including public pension funds, have placed increasing importance on the impacts of investments made by the private funds to which they commit capital, including with respect to climate change, among other aspects of ESG. Conversely, certain investors have raised concerns as to whether the incorporation of ESG factors in the investment and portfolio management process may be inconsistent with the fiduciary duty to maximize return for investors.
39
Certain investors have demonstrated increased concern with respect to asset managers taking certain actions that could adversely impact the value of, or, refraining from taking certain actions that could improve the value of, an existing or potential investment. At times, investors, including public pension funds, have limited participation in certain investment opportunities, such as hydrocarbons, and/or conditioned future capital commitments to certain funds on the implementation of screens or other sector-specific investment guidelines. Other investors have voiced concern with respect to asset managers’ policies that may result in such managers subordinating the interests of investors based solely or in part on ESG considerations. We may be subject to competing demands from different investors and other stakeholder groups with divergent views on ESG matters, including the role of ESG in the investment process. Investors, including public pension funds, which represent a significant portion of our funds’ investor bases, may decide to withdraw previously committed capital (where such withdrawal is permitted) or not commit capital to future fundraises based on their assessment of how we approach and consider the ESG cost of investments and whether the return-driven objectives of our funds align with their ESG priorities. This divergence increases the risk that any action or lack thereof with respect to ESG matters will be perceived negatively by at least some stakeholders and adversely impact our reputation and business. If we do not successfully manage ESG-related expectations across the varied interests of our stakeholders, including existing or potential investors, our ability to access and deploy capital may be adversely impacted. In addition, a failure to successfully manage ESG-related expectations may negatively impact our reputation and erode stakeholder trust.
Certain investors also have begun to request or require data from their asset managers and/or use third-party benchmarks and ratings to allow them to monitor the ESG impact of their investments. Regulatory initiatives to require investors to make disclosures to their stakeholders regarding ESG matters are becoming increasingly common, which may further increase the number and type of investors who place importance on these issues and who demand certain types of reporting from us or our funds. In addition, government authorities of certain U.S. states have requested information from and scrutinized certain asset managers with respect to whether such managers have adopted ESG policies that would restrict such asset managers from investing in certain industries or sectors, such as conventional energy. These authorities have indicated that such asset managers may lose opportunities to manage money belonging to these states and their pension funds to the extent the asset managers boycott certain industries. This may impair our ability to access capital from certain investors, and we may in turn not be able to maintain or increase the size of our funds or raise sufficient capital for new funds, which may adversely impact our revenues.
There has been increased regulatory focus on ESG-related practices by investment managers, particularly with respect to the accuracy of statements made regarding ESG practices, initiatives and investment strategies. The SEC maintains an enforcement task force to examine ESG practices and disclosures by public companies and investment managers and identify inaccurate or misleading statements, often referred to as “greenwashing.” The SEC has commenced enforcement actions against at least three investment advisers relating to ESG disclosures and policies and procedures failures, and we expect that there will continue to be significant enforcement activity in this area. The SEC has also proposed or adopted two ESG-related rules for investment advisers and for 1940 Act funds that address, among other things, enhanced ESG-related disclosure requirements concerning the use of ESG themes in their investing practices. This could increase the risk that we are perceived as, or accused of, greenwashing. Such perception or accusation could damage our reputation, result in litigation or regulatory actions, and adversely impact our ability to raise capital and attract new investors. Outside of the United States, the European regulatory environment for alternative investment fund managers and financial services firms continues to evolve and increase in complexity, making compliance more costly and time-consuming. See “— Climate change, climate and sustainability-related regulation and sustainability concerns could adversely affect our business and the operations of our funds’ portfolio companies, and any actions we take or fail to take in response to such matters could damage our reputation.”
40
We may also communicate certain initiatives, commitments and goals regarding environmental, human capital management, and other ESG-related matters in our SEC filings or in other disclosures by us or our funds. These initiatives, commitments and goals could be difficult and expensive to implement, the personnel, processes and technologies needed to implement them may not be cost effective and may not advance at a sufficient pace, and we may not be able to accomplish them within the timelines we announce or at all. We could, for example, determine that it is not feasible or practical to implement or complete certain of such initiatives, commitments or goals based on cost, timing or other consideration. Furthermore, we could be criticized for the accuracy, adequacy or completeness of the disclosure related to our or our funds’ ESG-related policies, practices, initiatives, commitments and goals, and progress against those goals, which disclosure may be based on frameworks and standards for measuring progress that are still developing, internal controls and processes that continue to evolve, and assumptions that are subject to change in the future. In addition, we could be criticized for the scope or nature of such initiatives or goals, or for any revisions to these goals. Further, as part of our ESG practices, we rely from time to time on third-party data, services and methodologies and such services, data and methodologies could prove to be incomplete or inaccurate. If our or such third parties’ ESG-related data, processes or reporting are incomplete or inaccurate, or if we fail to achieve progress with respect to our goals within the scope of ESG on a timely basis, or at all, we may be subject to enforcement action and our reputation could be adversely affected, particularly if in connection with such matters we were to be accused of greenwashing.
Climate change, climate and sustainability-related regulation and sustainability concerns could adversely affect our businesses and the operations of our funds’ portfolio companies, and any actions we take or fail to take in response to such matters could damage our reputation.
We, our funds and our funds’ portfolio companies face risks associated with climate change including risks related to the impact of climate-and ESG-related legislation and regulation (both domestically and internationally), risks related to business trends related to climate change and technology (such as the process of transitioning to a lower-carbon economy), and risks stemming from the physical impacts of climate change.
Climate and sustainability-related regulations or interpretations of existing laws may result in enhanced disclosure obligations, which could negatively affect us, our funds and our funds’ portfolio companies and materially increase the regulatory burden and cost of compliance. For example, SEC proposed rules, if enacted, would require certain climate-related disclosures by us, including disclosure of financed emissions, an extensive and complex category of emissions that is difficult to calculate accurately and for which there is currently no agreed measurement standard or methodology. Further, in October 2023, California enacted climate disclosure laws that could require us and/or certain of our portfolio companies to report on greenhouse gas emissions, climate-related financial risks and other climate-related matters. In addition, beginning in 2024, our U.K. entity is expected to be required to disclose certain climate-related financial information in line with the Task Force on Climate-Related Financial Disclosure’s recommendations. Further, in January 2023, the Corporate Sustainability Reporting Directive (“CSRD”) came into effect. CSRD will require a much broader range of companies, including non-EU companies with significant turnover and a legal presence in EU markets, to produce detailed and prescriptive reports on sustainability-related matters within their financial statements. Also in the EU, the Sustainable Finance Disclosure Regulation (“SFDR”) currently imposes disclosure requirements on certain of our funds and the EU Taxonomy Regulation supplements SFDR’s disclosure requirements for certain entities and sets out a framework for classifying economic activities as “environmentally sustainable.” Certain requirements under SFDR and the EU Taxonomy Regulation, such as those requiring us to make certain public disclosures regarding our private funds, may conflict with certain of our other regulatory obligations, such as limitations on general solicitation for private funds. As a consequence, we may be unable to fully comply with some requirements of these new regimes, which could result in regulatory actions against us. The European Commission is currently consulting on making changes to the SFDR and certain SFDR-related regulations are likely to be amended or new guidance may be issued. Furthermore, the
41
U.K. is implementing its own regulation and a new “U.K. Green Taxonomy” that imposes substantial data collection and disclosure obligations on us. Collecting, measuring and reporting the information and metrics required under various existing regulations has imposed administrative burden and increased cost on us, and such burden and cost are likely to increase as new or proposed regulations are enacted, particularly if the requirements imposed on us by various regulations lack harmonization on a global basis. We may also communicate certain climate-related initiatives, commitments and goals in our SEC filings or in other disclosures, which subjects us to additional risks, including the risk of being accused of greenwashing.
Certain of our funds’ portfolio companies operate in sectors that could face transition risk if carbon-related regulations or taxes are implemented. For certain of our funds’ portfolio companies, business trends related to climate change may require capital expenditures, product or service redesigns, and changes to operations and supply chains to meet changing customer expectations. While this can create opportunities, not addressing these changed expectations could create business risks for portfolio companies, which could negatively impact the value of such companies and the returns in our funds. Further, advances in climate science may change society’s understanding of sources and magnitudes of negative effects on climate, which could also negatively impact portfolio company financial performance. Further, significant chronic or acute physical effects of climate change, including extreme weather events such as hurricanes or floods, can also have an adverse impact on certain of our funds’ portfolio companies and investments, especially our real asset investments and portfolio companies that rely on physical factories, plants, stores or other assets located in the affected areas, or that focus on tourism or recreational travel. As the effects of climate change increase, we expect the frequency and impact of weather- and climate-related events and conditions to increase as well.
In addition, our reputation and fundraising may be harmed if certain stakeholders, such as our limited partners or stockholders, believe that we are not adequately or appropriately responding to climate change, including through the way in which we operate our business, the composition of our funds’ existing portfolios, the new investments made by our funds, or the decisions we make to continue to conduct or change our activities in response to climate change considerations. Moreover, we face business trends related to climate change risks, such as, for example, the increased attention to ESG considerations by our fund investors, including in connection with their determination of whether to invest in our funds. See “— We are subject to increasing scrutiny from regulators, elected officials, stockholders, investors and other stakeholders with respect to environmental, social and governance matters, which may adversely impact our ability to raise capital from certain investors, constrain capital deployment opportunities for our funds and harm our brand and reputation.”
Financial regulatory changes in the United States could adversely affect our business.
The financial services industry continues to be the subject of heightened regulatory scrutiny in the United States. There has been active debate over the appropriate extent of regulation and oversight of private investment funds and their managers. Our business may be adversely affected by new or revised regulations imposed by the SEC or other U.S. governmental regulatory authorities or self-regulatory organizations that supervise the financial markets. Our business also may be adversely affected by changes in the interpretation or enforcement of existing laws and regulations by these governmental authorities and self-regulatory organizations. Further, new regulations or interpretations of existing laws may result in enhanced disclosure obligations, including with respect to climate matters, which could materially increase the regulatory burden imposed on us, our funds or our funds’ portfolio companies.
The Dodd-Frank Wall Street Reform and Consumer Protection Act (the “Dodd-Frank Act”), enacted in July 2010, imposed significant changes on almost every aspect of the U.S. financial services industry, including aspects of our business. The Dodd-Frank Act created the FSOC, an interagency body charged with identifying and monitoring systemic risk to financial markets. The FSOC can designate certain financial companies as nonbank financial companies subject to supervision by the Board of Governors of the Federal Reserve System (the “Federal Reserve Board”). If we were to be designated as such by the FSOC, or if any of our business activities were to be identified by the FSOC as warranting enhanced regulation or supervision by certain regulators, we could be subject to a materially greater regulatory burden, which could adversely impact our compliance and other costs, the implementation of certain of our investment strategies and our profitability.
42
Under the Dodd-Frank Act, whistleblowers who voluntarily provide original information to the SEC can receive compensation and protection, including payment equal to between 10% and 30% of certain monetary sanctions imposed in a successful government action resulting from the information provided by the whistleblower. Whistleblower claims have increased significantly since the enactment of these provisions and in the 2023 fiscal year the SEC awarded approximately $600 million to 68 individuals. Addressing such claims could generate significant expenses and take up significant management time for us and our funds’ portfolio companies, even if such claims are frivolous or without merit.
Rule 206(4)-5 under the Advisers Act prohibits investment advisers from providing advisory services for compensation to a government plan investor for two years, subject to limited exceptions, after the investment adviser, its senior executives or its personnel involved in soliciting investments from government entities make political contributions to certain candidates and officials in position to influence the hiring of an investment adviser by such government client. Advisers are required to implement compliance policies designed, among other matters, to comply with this rule. In addition, there have been similar rules on a state level regarding “pay to play” practices by investment advisers. Additionally, the SEC has instituted and settled multiple actions against investment advisers for violating its 2022 amended marketing rule, which imposed more prescriptive requirements on fund marketing. Any failure on our part to comply with such rules could expose us to significant penalties and reputational damage.
The SEC has adopted “Regulation Best Interest,” which imposes a “best interest” standard of care for broker-dealers when recommending certain securities transactions to a customer. Regulation Best Interest requires such broker-dealers to evaluate available alternatives, including those that may have lower expenses and/or lower investment risk than our investment funds. The continued regulatory focus on Regulation Best Interest may negatively impact whether certain broker-dealers and their associated persons are willing to recommend investment products, including certain of our funds, to retail customers, which may adversely impact our ability to distribute our products to certain investors. Furthermore, the U.S. Department of Labor as well as several states have proposed regulations or taken other actions pertaining to conduct standards for investment advisers and broker-dealers that may result in additional requirements related to our business.
The potential for governmental policy and/or legislative changes and regulatory reform by the current administration may create regulatory uncertainty for our investment strategies, may make it more difficult to operate our business, and may adversely affect the profitability of our funds’ portfolio companies.
Governmental policy and/or legislative changes and regulatory reform could make it more difficult for us to operate our business, including by impeding fundraising or making certain investments or investment strategies unattractive or less profitable. In addition, our ability to identify business and other risks associated with new investments depends in part on our ability to anticipate and accurately assess regulatory, legislative and other changes that may have a material impact on our investments. Anticipating policy changes and reforms may be particularly difficult during periods of heightened partisanship at the federal, state and local levels, including due to the divisiveness surrounding populist movements, political disputes and socioeconomic issues. The failure to accurately anticipate the possible outcome of such changes and/or reforms could have a material adverse effect on the returns generated from our funds’ investments and our revenues.
43
In recent years, there has been increased regulatory enforcement activity and rulemaking impacting the financial services industry. Given the breadth of initiatives by the current administration and at the SEC and certain other regulatory bodies, policy changes could impose additional costs on us or our investments, require significant attention of senior management or result in limitations on the manner in which we or the companies in which we invest conduct business. Such changes or reforms may include, without limitation:
|
•
|
There has been recurring consideration amongst regulators and intergovernmental institutions regarding the role of nonbank institutions in providing credit and, particularly, so-called “shadow banking,” a term generally taken to refer to financial intermediation involving entities and activities outside the regulated banking system. Federal regulatory bodies, such as the FSOC, and international organizations, such as the Financial Stability Board, are assessing financial stability-related risks associated with, among other things, nonbank lending and certain types of open-end funds. At this time, whether any rules or regulations related thereto will be proposed is unclear. If nonbank financial intermediation became subject to regulations or oversight standards similar to those applicable to traditional banks, certain of our business activities, including nonbank lending, would be adversely affected and the regulatory burden on us would materially increase, which could adversely impact the implementation of our investment strategy and our returns.
|
|
•
|
In the United States, FSOC has the authority to designate nonbank financial companies as systemically important financial institutions (“SIFIs”) subject to supervision by the Federal Reserve Board. Currently, there are no nonbank financial companies with a nonbank SIFI designation. The FSOC has, however, designated certain nonbank financial companies as SIFIs in the past, and additional nonbank financial companies, which may include large asset management companies such as us, may be designated as SIFIs in the future. In November 2023, FSOC adopted amendments to its guidance regarding procedures for designating nonbank financial companies as SIFIs which eliminated the prior guidance’s prioritization of an “activities-based” approach for identifying, assessing and addressing potential risks to financial stability. Under the previous guidance’s “activities-based” approach, FSOC indicated that it would primarily focus on regulating
activities
individual firm-specific
|
|
•
|
In addition, future reviews by the FSOC of nonbank financial companies for designation as SIFIs may focus on other types of products and activities, such as nonbank lending activities conducted by certain of our businesses. If any of our activities were identified by the FSOC as posing potential risks to U.S. financial stability, such activities could be subject to modified or enhanced regulation or supervision by U.S. regulators with jurisdiction over such activities, although no proposals have been made indicating how such measures would be applied to any such identified activities.
|
Trade negotiations and related government actions may create regulatory uncertainty for our funds’ portfolio companies and our investment strategies and adversely affect the profitability of our funds’ portfolio companies.
In recent years, the U.S. government has indicated its intent to alter its approach to international trade policy and in some cases to renegotiate, or potentially terminate, certain existing bilateral or multi-lateral trade agreements and treaties with foreign countries, and has made proposals and taken actions related thereto. For example, the U.S. government has imposed tariffs on certain foreign goods, including from China, such as steel and aluminum. Some foreign governments, including China, have instituted retaliatory tariffs on certain U.S. goods.
44
Furthermore, the U.S. has implemented a number of economic sanctions programs and export controls that specifically target Chinese entities and nationals on national security grounds, including, for example, with respect to China’s response to political demonstrations in Hong Kong and China’s conduct concerning the treatment of Uyghurs and other ethnic minorities in its Xinjiang province. Moreover, the U.S. has implemented additional sanctions against entities participating in China’s military industrial complex and providing support to the country’s military, intelligence, and surveillance apparatuses. These sanctions impose certain restrictions on U.S. persons and entities buying or selling publicly traded securities of these designated entities. Further escalation of the “trade war” between the U.S. and China, the countries’ inability to reach further trade agreements, or the continued use of reciprocal sanctions by each country, may negatively impact opportunities for investment as well as the rate of global growth, particularly in China, which has and continues to exhibit signs of slowing growth. Such slowing growth could adversely affect the revenues and profitability of our funds’ portfolio companies.
There is uncertainty as to the actions that may be taken under the current administration with respect to U.S. trade policy, including with China. Further governmental actions related to the imposition of tariffs or other trade barriers or changes to international trade agreements or policies, could further increase costs, decrease margins, reduce the competitiveness of products and services offered by current and future portfolio companies and adversely affect the revenues and profitability of companies whose businesses rely on goods imported from outside of the United States. See “— Laws and regulations on foreign direct investment applicable to us and our funds’ portfolio companies, both within and outside the U.S, may make it more difficult for us to deploy capital in certain jurisdictions or to sell assets to certain buyers.”
Our provision of products and services to insurance companies subjects us to a variety of risks and uncertainties.
We have increasingly undertaken initiatives to deliver to insurance companies customizable and diversified portfolios of Blackstone products and strategies across asset classes, as well as the option for partial or full management of insurance companies’ general account assets. This strategy has in recent years contributed to meaningful growth in our Assets Under Management, including in Perpetual Capital Assets Under Management. BXCI’s insurance platform currently manages assets for a number of insurance companies and certain of their respective affiliates pursuant to several investment management agreements. Our insurance platform also manages or sub-manages assets for certain insurance-dedicated funds and special purpose vehicles, and has developed, and may continue to develop, other capital-efficient products for insurance companies.
The continued success of our insurance platform will depend in large part on further developing investment partnerships with insurance company clients and maintaining existing asset management arrangements, including those described above. If we fail to deliver high-quality, high-performing products and strategies that help our insurance company clients meet long-term policyholder obligations, we may not be successful in retaining existing investment partnerships, developing new investment partnerships or originating or selling capital-efficient assets or products and such failure may have a material adverse effect on our business, results and financial condition.
The U.S. and non-U.S. insurance industries are subject to significant regulatory oversight. Regulatory authorities in many relevant jurisdictions have broad regulatory (including through certain regulatory support organizations), administrative, and in some cases discretionary, authority with respect to insurance companies and/or their investment advisors, which may include, among other things, the investments insurance companies may acquire and hold, marketing practices, affiliate transactions, reserve requirements and capital adequacy. These requirements are primarily concerned with the protection of policyholders, and regulatory authorities often have wide discretion in applying the relevant restrictions and regulations to insurance companies, which may indirectly affect us. We may be the target or subject of, or may have indemnification obligations related to, litigation (including class action litigation by policyholders), enforcement investigations or regulatory scrutiny. Regulators and other authorities generally have the power to bring administrative or judicial proceedings against insurance companies, which could result in, among other things, suspension or revocation of licenses, cease-and-desist orders, fines, civil penalties, criminal penalties or other disciplinary action. To the extent we are involved in such regulatory actions, our reputation could be harmed, we may become liable for indemnification obligations and we could potentially be subject to enforcement actions, fines and penalties.
45
Recently, insurance regulatory authorities and regulatory support organizations have increased scrutiny of alternative asset managers’ involvement in the insurance industry, including with respect to the ownership by such managers or their affiliated funds of, and the management of assets on behalf of, insurance companies. For example, insurance regulators, including the National Association of Insurance Commissioners (“NAIC”) — the U.S. standard-setting and regulatory support organization for the insurance industry — have increasingly focused on the terms and structure of investment management agreements, including whether they are at arms’ length, establish a control relationship with the insurance company, grant the asset manager excessive authority or oversight over the investment strategy of the insurance company or provide for management fees that are not fair and reasonable or termination provisions that make it difficult or costly for the insurer to terminate the agreement. Regulators have also increasingly focused on the risk profile of certain investments held by insurance companies (including, without limitation, all or certain tranches of collateralized loan obligations and other structured securities), appropriateness of investment ratings and potential conflicts of interest, including affiliated investments, and potential misalignment of incentives and any potential risks from these and other aspects of an insurance company’s relationship with alternative asset managers that may impact the insurance company’s risk profile. This enhanced scrutiny may increase the risk of regulatory actions against us and could result in new or amended regulations that limit our ability, or make it more burdensome or costly, to enter into new investment management agreements with insurance companies and thereby grow our insurance strategy. Some of the arrangements we have or will develop with insurance companies involve complex U.S. and non-U.S. tax structures for which no clear precedent or authority may be available. Such structures may be subject to potential regulatory, legislative, judicial or administrative change or scrutiny and differing interpretations and any adverse regulatory, legislative, judicial or administrative changes, scrutiny or interpretations may result in substantial costs to insurance companies or us. In some cases we may agree to indemnify insurance companies for their losses resulting from any such adverse changes or interpretations.
Insurance company investment portfolios are often subject to internal and regulatory requirements governing the categories and ratings of investment products and assets they may acquire and hold. Many of the investment products and strategies we originate or develop for, or other assets or investments we include in, insurance company portfolios will be rated and a ratings downgrade or any other negative action by a rating agency or the NAIC’s Securities Valuation Office (“SVO”), as applicable, with respect to such products, assets or investments could make them less attractive and limit our ability to offer such products to, or invest or deploy capital on behalf of, insurers. Furthermore, insurance companies are subject to certain minimum capital and surplus requirements that vary by the jurisdiction where the insurance company is domiciled and are generally subject to change over time (as discussed in more detail below). In the United States, our insurance company clients are subject to risk-based capital (“RBC”) standards and other minimum capital and surplus requirements imposed by state laws. The RBC standards are based upon the Risk-Based Capital for Insurers Model Act promulgated by the NAIC, as adopted by applicable clients’ insurance regulators. Our Bermuda insurance company clients are subject to Bermuda Solvency Capital Requirements standards and other minimum capital and surplus requirements imposed by the Bermuda Monetary Authority.
New statutory accounting guidance or changes or clarifications in interpretations of existing guidance may adversely impact our ability to originate, or invest in, such assets on behalf of our insurance company clients or cause our clients to increase their required capital in respect of such assets, thus making such assets less attractive to insurers, which may adversely affect our business. Certain proposals or exposure drafts released by insurance regulatory authorities, including the NAIC or the SVO, may result in changes to the risk-based capital treatment and/or ratings or re-ratings processes of certain assets or investments that are, or may be, held by our insurance company clients. In particular, the NAIC is considering revisions to the capital charges for asset-backed securities with a focus on increasing the capital charge on the mezzanine and/or residual tranches (i.e., equity securities) of
46
these securitizations. Recent proposals would increase the applicable capital charge of such residual tranches or equity securities of asset-based securitizations from 30% to 45% as of year-end 2024. This potential 50% increase in the applicable RBC charge of such assets could potentially make such assets or investments less attractive to insurers and limit our ability to originate, or invest in, such assets on behalf of insurers.
We rely on complex exemptions from statutes in conducting our asset management activities.
We regularly rely on exemptions from various requirements of the U.S. Securities Act of 1933, as amended (the “Securities Act”), the Exchange Act, the 1940 Act, the Commodity Exchange Act and the U.S. Employee Retirement Income Security Act of 1974, as amended, in conducting our asset management activities. These exemptions are sometimes highly complex and may in certain circumstances depend on compliance by third parties whom we do not control. If for any reason these exemptions were to become unavailable to us, we could become subject to regulatory action or third-party claims and our business could be materially and adversely affected. For example, the “bad actor” disqualification provisions of Rule 506 of Regulation D under the Securities Act ban an issuer from offering or selling securities pursuant to the safe harbor rule in Rule 506 if the issuer or any other “covered person” is the subject of a criminal, regulatory or court order or other “disqualifying event” under the rule which has not been waived. The definition of “covered person” includes an issuer’s directors, general partners, managing members and executive officers; affiliates who are also issuing securities in the offering; beneficial owners of 20% or more of the issuer’s outstanding equity securities; and promoters and persons compensated for soliciting investors in the offering. Accordingly, our ability to rely on Rule 506 to offer or sell securities would be impaired if we or any “covered person” is the subject of a disqualifying event under the rule and we are unable to obtain a waiver. These regulations often serve to limit our activities and impose burdensome compliance requirements.
Complex regulatory regimes and potential regulatory changes in jurisdictions outside the United States could adversely affect our business.
Similar to the United States, the jurisdictions outside the United States in which we operate, in particular Europe, have become subject to further regulation. Governmental regulators and other authorities in Europe have proposed or implemented a number of initiatives, rules and regulations that could adversely affect our business, including by imposing additional compliance and administrative burdens and increasing the costs of doing business in such jurisdictions. Increasingly, the rules and regulations in the financial sector in Europe are becoming more prescriptive. Rules and regulations in other jurisdictions are often informed by key features of U.S. and European rules and regulations and, as a result, our businesses in all jurisdictions, including across Asia, may become subject to increased regulation in the future.
In Europe, the EU Alternative Investment Fund Managers Directive (“AIFMD”) establishes a regulatory regime for alternative investment fund managers (“AIFMs”), including our AIFMs in Luxembourg and Ireland. The U.K. has “on-shored” AIFMD and therefore similar requirements continue to apply to funds marketed to U.K. investors notwithstanding Brexit. Changes to AIFMD have been adopted and are expected to come into force in late-2025. These changes increase the compliance burdens on certain of our funds and require them to make changes to their operations, including, among other things, in respect of their use of leverage, which could impact the returns of such funds.
In addition, on August 2, 2021, Directive (EU) 2019/1160 (the “CBDF Directive”) and Regulation (EU) 2019/1156 (the “CBDF Regulation”) came into effect, which in part amended AIFMD. The CBDF Regulation contains standardized requirements for cross-border fund distribution in the EU. CBDF Directive has been implemented in most EU member states, which may make it more complex and costly for us to raise capital from EEA investors.
47
The EU Securitization Regulation (the “Securitization Regulation”), which became effective on January 1, 2019, imposes due diligence and risk retention requirements on “institutional investors” (which includes managers of alternative investment funds assets) which must be satisfied prior to holding a securitization position. These requirements may apply to AIFs managed by not only EEA AIFMs but also non-EEA AIFMs where those AIFs have been registered for marketing in the EU under national private placement regimes. Similar requirements continue to apply in the U.K. notwithstanding Brexit. The FCA is looking at amending the regime in the U.K. in the coming years which could result in divergence between the EU and U.K. requirements, thereby increasing the cost and complexity of compliance. The Securitization Regulation may impact or limit our funds’ ability to make certain investments that constitute “securitizations” under the regulation. The Securitization Regulation may also constrain certain of our funds’ ability to invest in securitization positions that do not comply with, among other things, the risk retention requirements. Failure to comply with these requirements could result in various penalties.
The EU regulation on over-the-counter (“OTC”) derivative transactions, central counterparties and trade repositories ( “EMIR”) requires mandatory clearing of certain OTC derivatives through central counterparties, creates additional risk mitigation requirements (including, in particular, margining requirements) in respect of certain OTC derivative transactions that are not cleared by a central counterparty, and imposes reporting and recordkeeping requirements in respect of most derivative transactions. The U.K. has on-shored EMIR in similar, but not identical form. In addition, the EU regulation on transparency of securities financing transactions (“SFTR”) requires certain mandatory reporting and disclosure in connection with certain securities financing transactions and total return swaps. Furthermore, the EU Central Securities Depositories Regulation (“CSDR”) provides for an EU-wide framework with respect to securities settlement and central securities depository and settlement services. The effectiveness of certain requirements under this framework has been postponed until November 2025. The U.K. has on-shored SFTR and CSDR, in similar, but not identical, forms. Each of the aforementioned regulations is likely to increase the operational burden and costs associated with certain of our and our funds’ operations.
In December 2023, the European Commission reached a provisional agreement on previously proposed regulations to strengthen the regulatory and supervisory framework over money laundering and financing of terrorism, which includes the establishment of a new regulatory authority. Additionally, in the U.K., amendments to the anti-money laundering and financing of terrorism regime are expected to be finalized in 2024. These proposals, if adopted, could increase the risk of regulatory actions against us.
Further, in the EU, the Markets in Financial Instruments Directive 2014 (2014/65/EU) (“MiFID II”), which has also been on-shored in the U.K., requires us to comply with disclosure, transparency, reporting and record keeping obligations and enhanced obligations in relation to the receipt of investment research, best execution, product governance and marketing communications. Compliance with MiFID II has resulted in greater overall complexity, higher compliance and administration and operational costs and less overall flexibility for us. Certain aspects of MiFID II are subject to review and amendment in the EU and the U.K. Associated changes to the prudential regulation of EEA and U.K. MiFID investment firms have increased the regulatory capital and liquidity adequacy requirements for certain of our entities licensed under MiFID, as well as required us to make changes to the way in which we remunerate certain senior staff. Additional regulation around remuneration may make it harder for us to attract and retain talent, compared to competitors not subject to the same rules. Enhanced internal governance, disclosure and reporting requirements increase the costs of compliance.
Certain regulatory requirements in the EU and U.K. intended to enhance protection for retail investors and impose additional obligations on the distribution of certain products to retail investors may lead to increased costs and limit our ability to access capital from retail investors in certain jurisdictions. These include EU and U.K. rules requiring that retail investors in packaged retail investment and insurance products receive key information documents and U.K rules enhancing duties related to distribution of financial products to retail investors. Furthermore, in May 2023, the European Commission announced its Retail Investment Strategy, which could result in new regulation that could impact our ability to offer our funds to retail investors in the EU.
We are required to comply with the Regulation (EU) 2016/679 (General Data Protection Regulation) (the “EU GDPR”) because, among other things, we process European Union data subjects’ personal data in the U.S. via our global technology systems. Following Brexit, the U.K. implemented its own version of EU GDPR (the “U.K. GDPR”).
48
The EU GDPR and U.K. GDPR impose a range of obligations on processors of personal data, including obligations that apply in respect of the transfer of personal data to other countries, including potential limitations on transfer or requirements to implement further protections for personal data. Data protection authorities have significant audit and investigatory powers to probe how personal data is being used and processed and breaches of these regulations can lead to significant fines, regulatory action and reputational risk. See “— Rapidly developing and changing global data security and privacy laws and regulations could increase compliance costs and subject us to enforcement risks and reputational damage.” European regulators, including the U.K. FCA are increasing their attention on greenwashing and rapidly developing and implementing regimes focused on ESG and sustainability within the financial services sector, which could adversely affect our business and the operations of our funds’ portfolio companies in various ways. See “— Climate change, climate and sustainability-related regulation and sustainability concerns could adversely affect our business and the operations of our funds’ portfolio companies, and any actions we take or fail to take in response to such matters could damage our reputation.”
Laws and regulations on foreign direct investment applicable to us and our funds’ portfolio companies, both within and outside the U.S., may make it more difficult for us to deploy capital in certain jurisdictions or to sell assets to certain buyers.
A number of jurisdictions, including the U.S., have restrictions on foreign direct investment pursuant to which their respective heads of state and/or regulatory bodies have the authority to block or impose conditions with respect to certain transactions, such as investments, acquisitions and divestitures, if such transaction threatens to impair national security. In addition, many jurisdictions restrict foreign investment in assets important to national security by taking steps including, but not limited to, placing limitations on foreign equity investment, implementing investment screening or approval mechanisms, and restricting the employment of foreigners as key personnel. These U.S. and foreign laws could limit our funds’ ability to invest in certain businesses or entities or impose burdensome notification requirements, operational restrictions or delays in pursuing and consummating transactions. For example, the Committee on Foreign Investment in the United States (“CFIUS”) has the authority to review transactions that could result in potential control of, or certain types of non-controlling investments in, a U.S. business or U.S. real estate by a foreign person. In recent years, legislation has expanded the scope of CFIUS’ jurisdiction to cover more types of transactions and empower CFIUS to scrutinize more closely investments in certain transactions. CFIUS may recommend that the President block, unwind or impose conditions or terms on such transactions, certain of which may adversely affect the ability of the fund to execute on its investment strategy with respect to such transaction as well as limit our flexibility in structuring or financing certain transactions. Additionally, CFIUS or any non-U.S. equivalents thereof may seek to impose limitations on one or more such investments that may prevent us from maintaining or pursuing investment opportunities that we otherwise would have maintained or pursued, which could make it more difficult for us to deploy capital in certain of our funds.
In August 2023, the President signed an Executive Order establishing an outbound investment screening regime that is intended to regulate or prohibit certain investments by U.S. persons in advanced technology sectors in China and other jurisdictions that may be designated as a “country of concern.” While the details of this new regime remain subject to a rulemaking process, the forthcoming requirements could further negatively impact our ability to deploy capital in such countries. Further, state regulatory agencies may impose restrictions on private funds’ investments in certain types of assets, which could affect our funds’ ability to find attractive and diversified investments and to complete such investments in a timely manner. For example, California adopted regulations that are scheduled to take effect in April 2024 and would subject certain potential investments in the healthcare sector that transfer a material amount of a healthcare portfolio company’s assets or governance to review by a state regulatory agency. In addition, a number of U.S. states are passing and implementing state laws prohibiting or otherwise restricting the acquisition of interests in real property located in the state by foreign persons. These laws may impact the ability of non-U.S. limited partners to participate in certain of our investment strategies.
49
Our investments outside of the United States may also face delays, limitations, or restrictions as a result of notifications made under and/or compliance with these legal regimes and rapidly changing agency practices. Other countries continue to establish and/or strengthen their own national security investment clearance regimes, which could have a corresponding effect of limiting our ability to make investments in such countries. Heightened scrutiny of foreign direct investment worldwide may also make it more difficult for us to identify suitable buyers for investments upon exit and may constrain the universe of exit opportunities for an investment in a portfolio company. As a result of such regimes, we may incur significant delays and costs, be altogether prohibited from making a particular investment or impede or restrict syndication or sale of certain assets to certain buyers, all of which could adversely affect the performance of our funds and in turn, materially reduce our revenues and cash flow. Complying with these laws imposes potentially significant costs and complex additional burdens, and any failure by us or our funds’ portfolio companies to comply with them could expose us to significant penalties, sanctions, loss of future investment opportunities, additional regulatory scrutiny, and reputational harm.
We are subject to substantial risk of litigation and regulatory proceedings and may face significant liabilities and damage to our reputation as a result of allegations of improper conduct and negative publicity.
From time to time we, our funds and our funds’ portfolio companies have been and may be subject to litigation, including securities class action lawsuits by stockholders, as well as class action lawsuits that challenge our acquisition transactions and/or attempt to enjoin them. For a discussion of certain legal proceedings to which we are a party, see “Part II. Item 8. Financial Statements and Supplementary Data — Notes to Consolidated Financial Statements — Note 19. Commitments and Contingencies — Contingencies — Litigation.” Any private lawsuits or regulatory actions brought against us and resulting in a finding of substantial legal liability could materially adversely affect our business, financial condition or results of operations. In addition, such actions, even if resulting in a favorable outcome to us, could result in significant reputational harm, which could seriously harm our business.
In recent years, the volume of claims and amount of damages claimed in litigation and regulatory proceedings against the financial services industry in general have been increasing. The investment decisions we make in our asset management business and the activities of our investment professionals (including in connection with portfolio companies and investment advisory activities) may subject us, our funds and our funds’ portfolio companies to the risk of third-party litigation or regulatory proceedings arising from investor dissatisfaction with the performance of those investment funds, alleged conflicts of interest, the suitability or manner of distribution of our products, including to retail investors, the activities of our funds’ portfolio companies and a variety of other claims.
In addition, to the extent investors in our investment funds suffer losses resulting from fraud, gross negligence, willful misconduct or other similar misconduct, investors may have remedies against us, our investment funds, our senior managing directors or our affiliates under the federal securities law and/or state law. While the general partners and investment advisers to our investment funds, including their directors, officers, other employees and affiliates, are generally indemnified to the fullest extent permitted by law with respect to their conduct in connection with the management of the business and affairs of our investment funds, such indemnity does not extend to actions determined to have involved fraud, gross negligence, willful misconduct or other similar misconduct. The activities of our capital markets services business may also subject us to the risk of liabilities to our clients and third parties, including our clients’ stockholders, under securities or other laws in connection with transactions in which we participate. See “— Underwriting activities by our capital markets services business expose us to risks.”
We depend to a large extent on our business relationships and our reputation for integrity and high-caliber professional services to attract and retain investors and to pursue investment opportunities for our funds. As a result, allegations by private actors, regulators, or employees of improper conduct by us, even if unfounded, as well as negative publicity and press speculation about us, may harm our reputation. This could adversely impact our relationships with clients and our fundraising. In recent years, there has been increased activity on the part of certain activist and other organized groups, with respect to investments made by private funds. Such groups have at times contacted and otherwise sought to engage with government and regulatory bodies and fund investors, including public pension funds, on our funds’ investments, which has led to negative publicity that could harm our reputation. The pervasiveness of social media and public focus on the externalities of business activities could lead to wider dissemination of adverse or inaccurate information about us, making remediation more difficult and magnifying reputational risk.
50
Employee misconduct could harm us by impairing our ability to attract and retain clients and subjecting us to significant legal liability and reputational harm. Fraud, deceptive practices or other misconduct at portfolio companies or service providers could similarly subject us to liability and reputational damage and also harm performance.
Our employees could engage in misconduct that adversely affects our business. We are subject to a number of obligations and standards arising from our asset management business and our authority over the assets managed by our asset management business. The violation of these obligations and standards by any of our employees would adversely affect our clients and us. Our business often requires that we deal with confidential matters of great significance to companies in which we may invest. If our employees were to improperly use or disclose confidential information, we could suffer serious harm to our reputation, financial position and current and future business relationships. Detecting or deterring employee misconduct is not always possible, and the extensive precautions we take to detect and prevent this activity may not be effective in all cases. In addition, a prolonged period of remote work, such as the one experienced during the COVID-19 pandemic, may require us to develop and implement additional precautions in order to detect and prevent employee misconduct. Such additional precautions, which may include the implementation of security and other restrictions, may make our systems more difficult and costly to operate and may not be effective in preventing employee misconduct in a remote work environment. If one of our employees were to engage in misconduct or were to be accused of such misconduct, our business and our reputation could be adversely affected.
We are subject to U.S. and foreign anti-corruption and anti-bribery laws, including the U.S. Foreign Corrupt Practices Act, as amended (“FCPA”), as well as anti-money laundering laws. In recent years, the U.S. Department of Justice and the SEC have devoted greater resources to enforcement of the FCPA. In addition, the U.K. has also significantly expanded the reach of its anti-bribery laws. While we have policies and procedures designed to ensure strict compliance by us and our personnel with the FCPA and other applicable laws, such policies and procedures may not be effective in all instances to prevent violations. Any determination that we have violated the FCPA, the U.K. anti-bribery laws or other applicable anti-corruption, anti-bribery, or anti-money laundering laws could subject us to, among other things, civil and criminal penalties or material fines, profit disgorgement, injunctions on future conduct, securities litigation and a general loss of investor confidence, any one of which could adversely affect our business prospects, financial position or the price of our common stock.
Furthermore, we may also be adversely affected if there is misconduct by personnel of our funds’ portfolio companies or by such companies’ service providers. For example, financial fraud or other deceptive practices at our funds’ portfolio companies, or failures by personnel at our funds’ portfolio companies to comply with anti-corruption, anti-bribery, anti-money laundering, trade and economic sanctions, export controls, anti-harassment, anti-discrimination or other legal and regulatory requirements, could subject us to, among other things, civil and criminal penalties or material fines, profit disgorgement, injunctions on future conduct and securities litigation, and could also cause significant reputational and business harm to us. Such misconduct may undermine our due diligence efforts with respect to such portfolio companies and could negatively affect the valuations of the investments by our funds in such portfolio companies. Losses to our funds and us could also result from misconduct or other actions by service providers, such as administrators, consultants or other advisors, if such service providers improperly use or disclose confidential information, misappropriate funds, or violate legal or regulatory obligations. Moreover, we may face an increased risk of such misconduct to the extent our investment in non-U.S. markets, particularly emerging markets, increases.
51
Another pandemic or global health crisis like the COVID-19 pandemic may adversely impact our performance and results of operations.
From 2020 to 2022, in response to the COVID-19 pandemic, many countries instituted quarantine restrictions and took other measures to limit the spread of the virus. This resulted in labor shortages and disruption of supply chains and contributed to prolonged disruption of the global economy. A widespread reoccurrence of another pandemic or global health crisis could increase the possibility of periods of increased restrictions on business operations, which may adversely impact our business, financial condition, results of operations, liquidity and prospects materially and exacerbate many of the other risks discussed in this “Risk Factors” section.
In the event of another pandemic or global health crisis like the COVID-19 pandemic, our funds’ portfolio companies may experience decreased revenues and earnings, which may adversely impact our ability to realize value from such investments and in turn reduce our performance revenues. Investments in certain sectors, including hospitality, location-based entertainment, retail, travel, leisure and events, and in certain geographies, office and residential, could be particularly negatively impacted, as was the case during the COVID-19 pandemic. Our funds’ portfolio companies may also face increased credit and liquidity risk due to volatility in financial markets, reduced revenue streams and limited access or higher cost of financing, which may result in potential impairment of our or our funds’ investments. In addition, borrowers of loans, notes and other credit instruments in our credit funds’ portfolios may be unable to meet their principal or interest payment obligations or satisfy financial covenants, and tenants leasing real estate properties owned by our funds may not be able to pay rents in a timely manner or at all, resulting in a decrease in value of our funds’ credit and real estate investments. In the event of significant credit market contraction as a result of a pandemic or similar global health crisis, certain of our funds may be limited in their ability to sell assets at attractive prices or in a timely manner in order to avoid losses and margin calls from credit providers. In our liquid and semi-liquid vehicles, such a contraction could cause investors to seek liquidity in the form of redemptions or repurchase of interests from our funds, adversely impacting management fees. Our management fees may also be negatively impacted if we experience a decline in the pace of capital deployment or fundraising.
A pandemic or global health crisis may also pose enhanced operational risks. For example, our employees may become sick or otherwise unable to perform their duties for an extended period, and extended public health restrictions and remote working arrangements may impact employee morale, integration of new employees and preservation of our culture. Remote working environments may also be less secure and more susceptible to hacking attacks, including phishing and social engineering attempts. Moreover, our third-party service providers could be impacted by an inability to perform due to pandemic-related restrictions or by failures of, or attacks on, their technology platforms.
Poor performance of our investment funds would cause a decline in our revenue, income and cash flow, may obligate us to repay Performance Allocations previously paid to us, and could adversely affect our ability to raise capital for future investment funds.
In the event that any of our investment funds were to perform poorly, our revenue, income and cash flow would decline because the value of our assets under management would decrease, which would result in a reduction in management fees, and our investment returns would decrease, resulting in a reduction in the Performance Revenues we earn. Moreover, we could experience losses on our investments of our own principal as a result of poor investment performance by our investment funds. Furthermore, if, as a result of poor performance of later investments in a carry fund’s life, the fund does not achieve certain investment returns for the fund over its life, we will be obligated to repay the amount by which Performance Allocations that were previously distributed to us exceed the amount to which the relevant general partner is ultimately entitled. Similarly, certain of our vehicles’ terms require an offset of Performance Revenues related to past performance, often referred to as a “recoupment of loss carryforward.” If a recoupment of loss carryforward is triggered, including as a result of a meaningful decline in the vehicles’ revenues following a period of strong performance, such offset would serve to reduce the amount of future Performance Revenues to which we would be entitled in such vehicle. In the event that the offset is insufficient for the vehicle to fully recoup such loss carryforward, we may be required to make a cash payment after a certain period.
52
In addition, in most cases, the companies in which our investment funds invest will have indebtedness or equity securities, or may be permitted to incur indebtedness or to issue equity securities, that rank senior to our investment, which may limit the ability of our investment funds to influence a company’s affairs and to take actions to protect their investments during periods of financial distress or following an insolvency.
Poor performance of our investment funds could make it more difficult for us to raise new capital. Investors in funds might decline to invest in future investment funds we raise and investors in hedge funds or other investment funds might withdraw their investments as a result of poor performance of the investment funds in which they are invested. Investors and potential investors in our funds continually assess our investment funds’ performance, and our ability to raise capital for existing and future investment funds and avoid excessive redemption levels will depend on our investment funds’ continued satisfactory performance. Accordingly, poor fund performance may deter future investment in our funds and thereby decrease the capital invested in our funds and ultimately, our management fee revenue. Alternatively, in the face of poor fund performance, investors could demand lower fees or fee concessions for existing or future funds which would likewise decrease our revenue.
Furthermore, from time to time, we may pursue new or different investment strategies and expand into geographic markets and businesses that may not perform as expected and result in poor performance by us and our investment funds. In addition to the risk of poor performance, such activity may subject us to a number of risks and uncertainties, including risks associated with (a) the possibility that we have insufficient expertise to engage in such activities profitably or without incurring inappropriate amounts of risk, (b) the diversion of management’s attention from our core businesses, (c) known or unknown contingent liabilities, which could result in unforeseen losses for us and our funds, (d) the disruption of ongoing businesses and (e) compliance with additional regulatory requirements.
The historical returns attributable to our funds should not be considered as indicative of the future results of our funds or of our future results or of any returns expected on an investment in common stock.
The historical and potential future returns of the investment funds that we manage are not directly linked to returns on our common stock. Therefore, any continued positive performance of the investment funds that we manage will not necessarily result in positive returns on an investment in our common stock. However, poor performance of the investment funds that we manage would cause a decline in our revenue from such investment funds, and would therefore have a negative effect on our performance and in all likelihood the returns on an investment in our common stock. Moreover, with respect to the historical returns of our investment funds:
|
•
|
we may create new funds in the future that reflect a different asset mix and different investment strategies (including funds whose management fees represent a more significant proportion of the fees than has historically been the case), as well as a varied geographic and industry exposure as compared to our present funds, and any such new funds could have different returns from our existing or previous funds,
|
|
•
|
the rates of returns of our carry funds reflect unrealized gains as of the applicable measurement date that may never be realized, which may adversely affect the ultimate value realized from those funds’ investments,
|
|
•
|
competition for investment opportunities resulting from, among other things, the increased amount of capital invested in alternative investment funds continues to increase,
|
|
•
|
our investment funds’ returns in some years benefited from investment opportunities and general market conditions that may not repeat themselves, our current or future investment funds might not be able to avail themselves of comparable investment opportunities or market conditions, and the circumstances under which our current or future funds may make future investments may differ significantly from those conditions prevailing in the past,
|
53
|
•
|
newly established funds may generate lower returns during the period in which they initially deploy their capital and
|
|
•
|
the rates of return reflect our historical cost structure, which may vary in the future due to various factors enumerated elsewhere in this report and other factors beyond our control, including changes in laws.
|
The future internal rate of return for any current or future fund may vary considerably from the historical internal rate of return generated by any particular fund, or for our funds as a whole. In addition, future returns will be affected by the applicable risks described elsewhere in this Annual Report on Form 10-K, including risks of the industries and businesses in which a particular fund invests.
Certain policies and procedures implemented to mitigate potential conflicts of interest and address certain regulatory requirements may reduce the synergies across our various businesses.
Because of our various asset management businesses and our capital markets services business, we will be subject to a number of actual and potential conflicts of interest and subject to greater regulatory oversight and more legal and contractual restrictions than that to which we would otherwise be subject if we had just one line of business. To mitigate these conflicts and address regulatory, legal and contractual requirements across our various businesses, we have implemented certain policies and procedures (for example, information walls) that may reduce the positive synergies that we cultivate across these businesses for purposes of identifying and managing attractive investments. For example, certain regulatory requirements require us to restrict access by certain personnel in our funds to information about certain transactions or investments being considered or made by those funds. In addition, we may come into possession of confidential or material non-public information with respect to issuers in which we may be considering making an investment or issuers in which our affiliates may hold an interest. As a consequence of such policies and procedures, we may be precluded from providing such information or other ideas to our other businesses even where it might be of benefit to them.
Our failure to deal appropriately with conflicts of interest in our investment business could damage our reputation and adversely affect our businesses.
As we have expanded, and continue to expand, the number and scope of our businesses, we increasingly confront potential conflicts of interest relating to our funds’ investment activities. Investment manager conflicts of interest continue to be a significant area of focus for regulators and the media. Because of our size and the variety of businesses and investment strategies that we pursue, we may face a higher degree of scrutiny compared with investment managers that are smaller or focus on fewer asset classes. Certain of our funds may have overlapping investment objectives, including funds that have different fee structures and/or investment strategies that are more narrowly focused. Potential conflicts may arise with respect to allocation of investment opportunities among us, our funds and our affiliates, including to the extent that the fund documents do not mandate a specific investment allocation. For example, we may allocate an investment opportunity that is appropriate for two or more investment funds in a manner that excludes one or more funds or results in a disproportionate allocation based on factors or criteria that we determine, such as sourcing of the transaction, specific nature of the investment or size and type of the investment, among other factors. We may also decide to provide a co-investment opportunity to certain investors in lieu of allocating more of that investment to our funds. Moreover, the challenge of allocating investment opportunities to certain funds may be exacerbated as we expand our business to include more lines of business, including more public vehicles. Allocating investment opportunities appropriately frequently involves significant and subjective judgments. The risk that fund investors or regulators could challenge allocation decisions as inconsistent with our obligations under applicable law, governing fund agreements or our own policies cannot be eliminated. In addition, the perception of non-compliance with such requirements or policies could harm our reputation with fund investors.
54
We may also cause different funds to invest in a single portfolio company, for example where the fund that made an initial investment no longer has capital available to invest. We may also cause different funds that we manage to purchase different classes of securities in the same portfolio company. For example, one of our CLO funds could acquire a debt security issued by the same company in which one of our private equity funds owns common equity securities. A direct conflict of interest could arise between the debt holders and the equity holders if such a company were to develop insolvency concerns, and we would have to carefully manage that conflict. A decision to acquire material non-public information about a company while pursuing an investment opportunity for a particular fund gives rise to a potential conflict of interest when it results in our having to restrict the ability of other funds to take any action with respect to that company. Our affiliates or portfolio companies may be service providers or counterparties to our funds or portfolio companies and receive fees or other compensation for services that are not shared with our fund investors. In such instances, we may be incentivized to cause our funds or portfolio companies to purchase such services from our affiliates or portfolio companies rather than an unaffiliated service provider despite the fact that a third-party service provider could potentially provide higher quality services or offer them at a lower cost. In addition, conflicts of interest may exist in the valuation of our investments, as well as the personal trading of employees and the allocation of fees and expenses among us, our funds and their portfolio companies, and our affiliates. Lastly, in certain, infrequent instances we may purchase an investment alongside one of our investment funds or sell an investment to one of our investment funds and conflicts may arise in respect of the allocation, pricing and timing of such investments and the ultimate disposition of such investments. A failure to appropriately deal with these, among other, conflicts, could negatively impact our reputation and ability to raise additional funds or result in potential litigation or regulatory action against us. Further, rules recently issued by the SEC and other measures it takes to preclude or limit certain conflicts of interest may make it more difficult for our funds to pursue transactions that may otherwise be attractive to the fund and its investors, which may adversely impact fund performance.
Conflicts of interest may arise in our allocation of co-investment opportunities.
Potential conflicts will arise with respect to our decisions regarding how to allocate co-investment opportunities among investors and the terms of any such co-investments. As a general matter, our allocation of co-investment opportunities is within our discretion and there can be no assurance that co-investment opportunities of any particular type or amount will become available to any of our investors. We may take into account a variety of factors and considerations we deem relevant in allocating co-investment opportunities, including, without limitation, whether a potential co-investor has expressed an interest in evaluating co-investment opportunities, our assessment of a potential co-investor’s ability to invest an amount of capital that fits the needs of the investment and our assessment of a potential co-investor’s ability to commit to a co-investment opportunity within the required timeframe of the particular transaction.
Our fund documents typically do not mandate specific allocations with respect to co-investments. The investment advisers of our funds may have an incentive to provide potential co-investment opportunities to certain investors in lieu of others and/or in lieu of an allocation to our funds, including, for example, as part of an investor’s overall strategic relationship with us, or if such allocations are expected to generate relatively greater fees or Performance Allocations to us than would arise if such co-investment opportunities were allocated otherwise. Co-investment arrangements may be structured through one or more of our investment vehicles, and in such circumstances co-investors will generally bear the costs and expenses thereof (which may lead to conflicts of interest regarding the allocation of costs and expenses between such co-investors and investors in our funds). The terms of any such existing and future co-investment vehicles may differ materially, and in some instances may be more favorable to us, than the terms of certain of our funds or prior co-investment vehicles, and such different terms may create an incentive for us to allocate a greater or lesser percentage of an investment opportunity to such co-investment vehicles. There can be no assurance that any conflicts of interest will be resolved in favor of any particular investment funds or investors (including any applicable co-investors). As with our investment allocation decisions generally, there is a risk that regulators and/or investors could challenge our allocations of co-investment opportunities or fees and expenses.
55
Valuation methodologies for certain assets in our funds can be subject to a significant degree of subjectivity and judgment, and the fair value of assets established pursuant to such methodologies may never be realized, which could result in significant losses for our funds and the reduction of Management Fees and/or Performance Revenues.
Our investment funds make investments in illiquid investments or financial instruments for which there is little, if any, market activity. We determine the value of such investments and financial instruments on at least a quarterly basis based on the fair value of such investments as determined in accordance with GAAP. The fair value of such investments and financial instruments is generally determined using a primary methodology and corroborated by a secondary methodology. Methodologies are used on a consistent basis and described in Blackstone’s and the investment funds’ valuation policies and governing agreements.
The determination of fair value using these methodologies takes into consideration a range of factors including, but not limited to, the price at which the investment was acquired, the nature of the investment, local market conditions, trading values on public exchanges for comparable securities, current and projected operating performance and financing transactions subsequent to the acquisition of the investment. These valuation methodologies involve a significant degree of subjective management judgment. For example, as to investments that we share with another sponsor, we may apply a different valuation methodology or factors or derive a different value than such other sponsor on the same investment. In addition, the valuations of our private investments may at times differ significantly from the valuations of publicly traded companies in similar sectors or with similar business models.
For example, valuations of our private investments do not have an observable market price and may take into account certain long-term financial projections or estimates, including those prepared by the management of a portfolio company or other investment. Such projections or estimates may not materialize and are based on significant judgments and assumptions at the time they are developed and may not be available to the public. Valuations of publicly traded companies, on the other hand, are based on the observable price in the reference market which are generally subject to a higher degree of market volatility. These differences, and the potential exercise of our subjective judgment, might cause some investors and/or regulators to question our valuations or methodologies. There can be no assurance that our policies will address all necessary valuation factors or completely eliminate potential conflicts of interest in such determinations. The SEC continues to focus on issues related to valuation of private funds, including consistent application of the methodology, disclosure, and conflicts of interest, in its enforcement, examination, and rulemaking activities. Further, variation in the underlying assumptions, estimates, methodologies and/or judgments we use in the determination of the value of certain investments and financial instruments could potentially produce materially different results. Valuation methodologies may also change from time to time. See “Part II. Item 7. Management’s Discussion and Analysis of Financial Condition and Results of Operation — Critical Accounting Policies” for an overview of our fair value policy and the significant judgment required in the application thereof.
Because there is significant uncertainty in the valuation of, or in the stability of the value of illiquid investments, the fair values of such investments as reflected in an investment fund’s net asset value do not necessarily reflect the prices that would actually be obtained by us on behalf of the investment fund when such investments are realized. Realizations at values lower than the values at which investments have been reflected in prior fund net asset values would result in reduced gains or losses for the applicable fund, a decline in certain asset management fees and the reduction in potential Performance Revenues. Changes in values of investments from quarter to quarter may result in volatility in our investment funds’ net asset value, our investment in, or fees from, those funds and the results of operations and cash flow that we report from period to period. Further, a situation where asset values turn out to be materially different than values reflected in prior fund net asset values could cause investors to lose confidence in us, which would in turn result in difficulty in raising additional funds or redemptions from funds where investors hold redemption rights.
56
Our use of borrowings to finance our business exposes us to risks.
We use borrowings to finance our business operations as a public company. We have numerous outstanding notes with various maturity dates as well as a revolving credit facility that matures on December 15, 2028. See “Part II. Item 7. Management’s Discussion and Analysis of Financial Condition and Results of Operations — Liquidity and Capital Resources — Sources and Uses of Liquidity” for further information regarding our outstanding borrowings. As borrowings under the credit facility and our outstanding notes mature, we will be required to refinance or repay such borrowings. In order to do so, we may enter into a new facility or issue new notes, each of which could result in higher borrowing costs. We may also issue equity, which would dilute existing stockholders. Further, we may choose to repay such borrowings using cash on hand, cash provided by our continuing operations or cash from the sale of our assets, each of which could reduce the amount of cash available to facilitate the growth and expansion of our businesses, make repurchases under our share repurchase program and pay dividends to our stockholders, operating expenses and other obligations as they arise. In order to obtain new borrowings, or to extend or refinance existing borrowings, we are dependent on the willingness and ability of financial institutions such as global banks to extend credit to us on favorable terms or at all, and on our ability to access the debt and equity capital markets, which can be volatile. There is no guarantee that such financial institutions will continue to extend credit to us or that we will be able to access the capital markets to obtain new borrowings or refinance existing borrowings when they mature. In addition, the use of leverage to finance our business exposes us to the types of risk described in “— Dependence on significant leverage in investments by our funds could adversely affect our ability to achieve attractive rates of return on those investments.”
57
Dependence on significant leverage in investments by our funds could adversely affect our ability to achieve attractive rates of return on those investments.
Many of our funds’ investments rely heavily on the use of leverage, and our ability to achieve attractive rates of return on investments will depend on our ability to access sufficient sources of indebtedness at attractive rates. For example, in many private equity and real estate investments, indebtedness may constitute as much as 70% or more of a portfolio company’s or real estate asset’s total debt and equity capitalization, including debt that may be incurred in connection with the investment. The absence of available sources of sufficient senior debt financing for extended periods of time could therefore materially and adversely affect our private equity and real estate businesses. Furthermore, limits on the deductibility of corporate interest expense could make it more costly to use debt financing for our acquisitions or otherwise have an adverse impact on the cost structure of our transactions, and could therefore adversely affect the returns on our funds’ investments. See “— Changes in U.S. and foreign taxation of businesses and other tax laws, regulations or treaties or an adverse interpretation of these items by tax authorities could adversely affect us, including by adversely impacting our effective tax rate and tax liability.”
In addition, an increase in either the general levels of interest rates or in the risk spread demanded by sources of indebtedness would make it more expensive to finance those businesses’ investments. See “— High interest rates and challenging debt market conditions have negatively impacted and could continue to negatively impact the values of certain assets or investments and the ability of our funds and their portfolio companies to access the capital markets, which could adversely affect investment and realization opportunities, lead to lower-yielding investments and potentially decrease our net income.”
Investments in highly leveraged entities are inherently more sensitive to declines in revenues, increases in expenses and interest rates and adverse economic, market and industry developments. The incurrence of a significant amount of indebtedness by an entity could, among other things:
|
•
|
give rise to an obligation to make mandatory pre-payments of debt using excess cash flow, which might limit the entity’s ability to respond to changing industry conditions to the extent additional cash is needed for the response, to make unplanned but necessary capital expenditures or to take advantage of growth opportunities,
|
|
•
|
limit the entity’s ability to adjust to changing market conditions, thereby placing it at a competitive disadvantage compared to its competitors who have relatively less debt,
|
|
•
|
allow even moderate reductions in operating cash flow to render it unable to service its indebtedness, leading to a bankruptcy or other reorganization of the entity and a loss of part or all of the equity investment in it,
|
|
•
|
limit the entity’s ability to engage in strategic acquisitions that might be necessary to generate attractive returns or further growth and
|
|
•
|
limit the entity’s ability to obtain additional financing or increase the cost of obtaining such financing, including for capital expenditures, working capital or general corporate purposes.
|
As a result, the risk of loss associated with a leveraged entity is generally greater than for companies with comparatively less debt.
When our funds’ existing portfolio investments reach the point when debt incurred to finance those investments matures in significant amounts and must be either repaid or refinanced, those investments may materially suffer if they have generated insufficient cash flow to repay maturing debt and there is insufficient capacity and availability in the financing markets to permit them to refinance maturing debt on satisfactory terms, or at all. If a limited availability of financing for such purposes were to persist for an extended period of time, when significant amounts of the debt incurred to finance our private equity and real estate funds’ existing portfolio investments came due, these funds could be materially and adversely affected.
58
Many of the hedge funds in which our funds of hedge funds invest, our credit-focused funds and or CLOs, may choose to use leverage as part of their respective investment programs and regularly borrow a substantial amount of their capital. The use of leverage poses a significant degree of risk and enhances the possibility of a significant loss in the value of the investment portfolio. A fund may borrow money from time to time to purchase or carry securities or may enter into derivative transactions (such as total return swaps) with counterparties that have embedded leverage. The interest expense and other costs incurred in connection with such borrowing may not be recovered by appreciation in the securities purchased or carried and will be lost — and the timing and magnitude of such losses may be accelerated or exacerbated — in the event of a decline in the market value of such securities. Gains realized with borrowed funds may cause the fund’s net asset value to increase at a faster rate than would be the case without borrowings. However, if investment results fail to cover the cost of borrowings, the fund’s net asset value could also decrease faster than if there had been no borrowings.
Any of the foregoing circumstances could have a material adverse effect on our financial condition, results of operations and cash flow.
The due diligence process that we undertake in connection with investments by our investment funds may not reveal all facts and issues that may be relevant in connection with an investment.
When evaluating a potential business or asset for investment, we conduct due diligence that we deem reasonable and appropriate based on the facts and circumstances applicable to such investment. When conducting due diligence, we may be required to evaluate important and complex issues, including but not limited to those related to business, financial, credit risk, tax, accounting, ESG, legal and regulatory and macroeconomic trends. With respect to ESG, the nature and scope of our diligence will vary based on the investment, but may include a review of, among other things: energy management, air and water pollution, land contamination, human capital management, human rights, employee health and safety, accounting standards and bribery and corruption. Selecting and evaluating such factors is subjective by nature, and there is no guarantee that the criteria utilized or judgment exercised by Blackstone or a third-party specialist (if any) will reflect the policies or preferred practices of any particular investor or align with the practices of other asset managers or with market trends. The materiality of various risks and impact of such risks on an individual potential investment or portfolio as a whole depend on many factors, including the relevant industry, geography and asset class and the nature of the investment. Outside consultants, legal advisers, accountants and investment banks may be involved in the due diligence process in varying degrees depending on the type of investment. The due diligence investigation that we will carry out with respect to any investment opportunity may not reveal or highlight all relevant facts (including fraud) or risks that may be necessary or helpful in evaluating such investment opportunity and we may not identify or foresee future developments that could have a material adverse effect on an investment, including, for example, potential factors, such as technological disruption of a specific company or asset, or an entire industry.
Further, some matters covered by our diligence, such as ESG, are continuously evolving and we may not accurately or fully anticipate such evolution. The framework we may use to evaluate certain diligence considerations may not represent a universally recognized standard for assessing such considerations. For example, AIFMD requires us to identify, measure, manage and monitor sustainability risks relevant to the funds managed by our EU AIFMs and take into account sustainability risks when performing investment due diligence. Such requirements may make our funds less attractive to investors, and any non-compliance with such requirements may subject us to regulatory action. In addition, when conducting due diligence on investments, including with respect to investments made by our funds of hedge funds in third-party hedge funds, we rely on the resources available to us and information supplied by third parties, including information provided by the target of the investment (or, in the case of investments in a third-party hedge fund, information provided by such hedge fund or its service providers). The information we receive from third parties may not be accurate or complete and therefore we may not have all the relevant facts and information necessary to properly assess and monitor our funds’ investment.
59
We may be unable to consummate or successfully integrate development opportunities, acquisitions or joint ventures that we pursue.
We may from time to time seek to engage in selective development or acquisition of asset management businesses or other businesses complementary to our business where we think we can add substantial value or generate substantial returns. We may not be able to identify or consummate such opportunities, including due to competition for such opportunities, our ability to accurately value such opportunities and the need to negotiate acceptable terms, and obtain requisite approvals and licenses from the relevant governmental authorities, for such opportunities. Moreover, even if we are able to identify and successfully complete an acquisition, we may encounter unexpected difficulties or incur unexpected costs associated with integrating and overseeing the operations of the new businesses.
We and our affiliates from time to time are required to report specified dealings or transactions involving Iran or other sanctioned individuals or entities.
The Iran Threat Reduction and Syria Human Rights Act of 2012 (“ITRA”) requires companies subject to SEC reporting obligations under Section 13 of the Exchange Act to disclose in their periodic reports specified dealings or transactions involving Iran or other individuals and entities targeted by certain OFAC sanctions, including, by way of example, the Russian Federal Security Service, engaged in by the reporting company or any of its affiliates during the period covered by the relevant periodic report. In some cases, ITRA requires companies to disclose these types of transactions even if they were permissible under U.S. law. Companies that currently may be or may have been at the time considered our affiliates have from time to time publicly filed and/or provided to us the disclosures reproduced on Exhibit 99.1 of our Quarterly Reports as well as Exhibit 99.1 of this annual report, which disclosure is hereby incorporated by reference herein. We do not independently verify or participate in the preparation of these disclosures. We are required to separately file with the SEC a notice when such activities have been disclosed in this report, and the SEC is required to post such notice of disclosure on its website and send the report to the President and certain U.S. Congressional committees. The President thereafter is required to initiate an investigation and, within 180 days of initiating such an investigation, determine whether sanctions should be imposed. Disclosure of such activity, even if such activity is not subject to sanctions under applicable law, and any sanctions actually imposed on us or our affiliates as a result of these activities, could harm our reputation and have a negative impact on our business, and any failure to disclose any such activities as required could additionally result in fines or penalties.
Our asset management activities involve investments in relatively illiquid assets, and we may fail to realize any profits from these activities for a considerable period of time.
Many of our investment funds invest in securities that are not publicly traded. In many cases, our investment funds may be prohibited by contract or by applicable securities laws from selling such securities for a period of time. Our investment funds will generally not be able to sell these securities publicly unless their sale is registered under applicable securities laws, or unless an exemption from such registration is available. The ability of many of our investment funds, particularly our private equity funds, to dispose of investments is heavily dependent on the public equity markets. For example, the ability to realize any value from an investment may depend upon the ability to complete an initial public offering of the portfolio company in which such investment is held. Even if the securities are publicly traded, large holdings of securities can often be disposed of only over a substantial length of time, exposing the investment returns to risks of downward movement in market prices during the intended disposition period. Moreover, because the investment strategy of many of our funds, particularly our private equity and real estate funds, often entails our having representation on our funds’ public portfolio company boards, our
60
funds may be restricted in their ability to effect such sales during certain time periods. Accordingly, under certain conditions, our investment funds may be forced to either sell securities at lower prices than they had expected to realize or defer — potentially for a considerable period of time — sales that they had planned to make.
We make investments in companies that are based outside of the United States, which may expose us to additional risks not typically associated with investing in companies that are based in the United States.
Many of our investment funds invest a significant portion of their assets in the equity, debt, loans or other securities of issuers located outside the United States. International investments have increased and we expect will continue to increase as a proportion of certain of our funds’ portfolios in the future. Investments in non-U.S. securities involve certain factors not typically associated with investing in U.S. securities, including risks relating to:
|
•
|
currency exchange matters, including fluctuations in currency exchange rates and costs associated with conversion of investment principal and income from one currency into another,
|
|
•
|
less developed or efficient financial markets than in the United States, which may lead to potential price volatility and relative illiquidity,
|
|
•
|
the absence of uniform accounting, auditing and financial reporting standards, practices and disclosure requirements and less government supervision and regulation,
|
|
•
|
changes in laws or clarifications to existing laws that could impact our tax treaty positions, which could adversely impact the returns on our investments,
|
|
•
|
a less developed legal or regulatory environment, differences in the legal and regulatory environment or enhanced legal and regulatory compliance,
|
|
•
|
heightened exposure to corruption risk in certain non-U.S. markets,
|
|
•
|
political hostility to investments by foreign or private equity investors,
|
|
•
|
reliance on a more limited number of commodity inputs, service providers and/or distribution mechanisms,
|
|
•
|
more volatile or challenging market or economic conditions, including higher rates of inflation,
|
|
•
|
higher transaction costs,
|
|
•
|
difficulty in enforcing contractual obligations,
|
|
•
|
fewer investor protections and less publicly available information about companies,
|
|
•
|
certain economic and political risks, including potential exchange control regulations and restrictions on our non-U.S. investments and repatriation of profits on investments or of capital invested, the risks of war, terrorist attacks, political, economic or social instability, the possibility of expropriation or confiscatory taxation and adverse economic and political developments and
|
|
•
|
the possible imposition of non-U.S. taxes or withholding on income and gains recognized with respect to such securities.
|
In addition, investments in companies that are based outside of the United States may be negatively impacted by restrictions on international trade or the recent or potential further imposition of tariffs. See “— Trade negotiations and related government actions may create regulatory uncertainty for our funds’ portfolio companies and our investment strategies and adversely affect the profitability of our funds’ portfolio companies.”
61
We may not have sufficient cash to pay back “clawback” obligations if and when they are triggered under the governing agreements with our investors.
In certain circumstances, at the end of the life of a carry fund (and earlier with respect to certain of our funds), we may be obligated to repay the amount by which Performance Allocations that were previously distributed to us exceed the amounts to which the relevant general partner is ultimately entitled on an after-tax basis. This includes situations in which the general partner receives in excess of the relevant Performance Allocations applicable to the fund as applied to the fund’s cumulative net profits over the life of the fund or, in some cases, the fund has not achieved investment returns that exceed the preferred return threshold. This obligation is known as a “clawback” obligation and is an obligation of any person who received such Performance Allocations, including us and other participants in our Performance Allocations plans. Although a portion of any dividends by us to our stockholders may include any Performance Allocations received by us, we do not intend to seek fulfillment of any clawback obligation by seeking to have our stockholders return any portion of such dividends attributable to Performance Allocations associated with any clawback obligation. To the extent we are required to fulfill a clawback obligation, however, our board of directors may determine to decrease the amount of our dividends to our stockholders. The clawback obligation operates with respect to a given carry fund’s own net investment performance only and performance of other funds are not netted for determining this contingent obligation.
Adverse economic conditions may increase the likelihood that one or more of our carry funds may be subject to clawback obligations. To the extent one or more clawback obligations were to occur for any one or more carry funds, we might not have available cash at the time such clawback obligation is triggered to repay the Performance Allocations and satisfy such obligation. If we were unable to repay such Performance Allocations, we would be in breach of the governing agreements with our investors and could be subject to liability. Moreover, although a clawback obligation is several, the governing agreements of most of our funds provide that to the extent another recipient of Performance Allocations (such as a current or former employee) does not fund his or her respective share, then we and our employees who participate in such Performance Allocations plans may have to fund additional amounts (generally an additional 50-70% beyond our pro-rata share of such obligations) beyond what we actually received in Performance Allocations. Although we retain the right to pursue any remedies that we have under such governing agreements against those Performance Allocations recipients who fail to fund their obligations, we may not be successful in recovering such amounts.
Investors in a number of our vehicles may withdraw their investments, and investors in certain of our vehicles may have a right to terminate our management of, or cause the dissolution of, such vehicles, which would lead to a decrease in our revenues.
We have a number of vehicles that permit investors in such vehicles to withdraw their investments and/or terminate our management of such capital, as applicable and in certain cases, subject to certain limitations. Investors in our hedge funds may generally redeem their investments on a periodic basis following, in certain cases, the expiration of a specified period of time when capital may not be withdrawn, subject to the applicable fund’s specific redemption provisions. In addition, in certain other open-ended and/or perpetual capital vehicles, including certain of our investment vehicles that are available to individual investors, such as BREIT, BCRED and BXPE, investors may request redemptions or repurchases of their interests on a periodic basis, subject to certain limitations. During periods of market volatility, investor subscriptions to such vehicles are likely to be reduced, and investor redemption or repurchase requests are likely to be elevated, which may negatively impact the fees we earn from such vehicles. In a declining market, our liquid or semi-liquid vehicles have and may continue to
62
experience declines in value, which may be provoked and/or exacerbated by margin calls and forced selling of assets. Investors may also seek to redeem their interests due to changes in interest rates that make other investments more attractive, rebalancing of their asset allocations, changes in investor perception of us and our reputation, unhappiness with a fund’s performance or investment strategy, departures or changes in responsibilities of key investment professionals, and liquidity needs.
To the extent appropriate and permissible under a vehicle’s constituent documents, we have previously and may in the future limit or prorate redemptions or repurchases in such vehicle for a period of time. This may subject us to reputational harm, make such vehicles less attractive to investors in the future and negatively impact future subscriptions to such vehicles. This could have a material adverse effect on the revenues we derive from such vehicles. For example, market volatility drove a material increase in BREIT repurchase requests beginning in late 2022, and pursuant to the terms of the vehicle, BREIT began to prorate such requests beginning in November 2022. BREIT inflows also materially declined after proration was announced, which led to net outflows in BREIT. The inclusion of redemption features in investment vehicles creates heightened risk of operational error, including with respect to the calculation of net asset values, which could expose us to increased risk of litigation, regulatory action and reputational damage.
In addition, we currently manage a significant portion of investor assets through separately managed accounts whereby we earn management and/or incentive fees, and we intend to continue to seek additional separately managed account mandates. The investment management agreements we enter into in connection with managing separately managed accounts on behalf of certain clients may be terminated by such clients on as little as 30 days’ prior written notice. In addition, the boards of directors of the investment management companies we manage could terminate our advisory engagement of those companies, on as little as 30 days’ prior written notice. In the case of any such terminations, the management and incentive fees we earn in connection with managing such account or company would immediately cease, which could result in a significant adverse impact on our revenues.
The governing agreements of many of our investment funds provide that, subject to certain conditions, third-party investors in those funds have the right to remove the general partner of the fund or to accelerate the termination date of the investment fund without cause by a majority or supermajority vote, resulting in a reduction in management fees we would earn from such investment funds and a significant reduction in the amounts of Performance Revenues from those funds. Performance Revenues could be significantly reduced as a result of our inability to maximize the value of investments by an investment fund during the liquidation process or in the event of the triggering of a “clawback” obligation or a recoupment of loss carry forward amounts. In addition, the governing agreements of our investment funds provide that in the event certain “key persons” in our investment funds do not meet specified time commitments with regard to managing the fund, then investors in certain funds have the right to vote to terminate the investment period by a specified percentage (including, in certain cases, a simple majority) vote in accordance with specified procedures, accelerate the withdrawal of their capital on an investor-by-investor basis, or the fund’s investment period will automatically terminate and a specified percentage (including, in certain cases, a simple majority) vote of investors is required to restart it. In addition, the governing agreements of some of our investment funds provide that investors have the right to terminate, for any reason, the investment period by a vote of 75% of the investors in such fund. In addition to having a significant negative impact on our revenue, net income and cash flow, the occurrence of such an event with respect to any of our investment funds would likely result in significant reputational damage to us.
In addition, because our investment funds have advisers that are registered under the Advisers Act, an “assignment” of the management agreements of our investment funds (which may be deemed to occur in the event these advisers were to experience a change of control) would generally be prohibited without consent of the
63
investment fund, which may require investor consent. We cannot be certain that consents required for assignments of our investment management agreements will be obtained if a change of control occurs, which could result in the termination of such agreements and the corresponding loss of revenue. In addition, with respect to our 1940 Act registered funds, the continuance of each investment fund’s investment management agreement generally must be approved annually by the fund’s board of directors, including independent members of such fund’s board of directors and, in certain cases, by its stockholders, as required by law. Termination of these agreements would cause us to lose the fees we earn from such investment funds.
Third-party investors in our investment funds with commitment-based structures may not satisfy their contractual obligation to fund capital calls when requested by us, which could adversely affect a fund’s operations and performance.
Investors in all of our carry funds (and certain of our hedge funds) make capital commitments to those funds that we are entitled to call from those investors at any time during prescribed periods. We depend on investors fulfilling their commitments when we call capital from them in order for those funds to consummate investments and otherwise pay their obligations (for example, management fees) when due. A default by an investor may also limit a fund’s availability to incur borrowings and avail itself of what would otherwise have been available credit. We have not had investors default on capital calls to any meaningful extent. Any investor that did not fund a capital call would generally be subject to several possible penalties, including having a significant amount of its existing investment forfeited in that fund. However, the impact of the forfeiture penalty is directly correlated to the amount of capital previously invested by the investor in the fund and if an investor has invested little or no capital, for instance early in the life of the fund, then the forfeiture penalty may not be as meaningful. Third-party investors in carry funds typically use distributions from prior investments to meet future capital calls. In cases where valuations of investors’ existing investments fall and the pace of distributions slows, investors may be unable to make new commitments to third-party managed investment funds such as those advised by us. If investors were to fail to satisfy a significant amount of capital calls for any particular fund or funds, the operation and performance of those funds could be materially and adversely affected.
Risk management activities may adversely affect the return on our funds’ investments.
When managing our exposure to market risks, we may (on our own behalf or on behalf of our funds) from time to time use forward contracts, options, swaps, caps, collars and floors or pursue other strategies or use other forms of derivative instruments to limit our exposure to changes in the relative values of investments that may result from market developments, including changes in prevailing interest rates, currency exchange rates and commodity prices. The use of derivative financial instruments and other risk management strategies may not be properly designed to hedge, manage or otherwise reduce the risks we have identified. In addition, we may not be able to identify, or may not have fully identified, all applicable material market risks to which we are exposed. We may also choose not to hedge, in whole or in part, any of the risks that have been identified. The success of any hedging or other derivatives transactions generally will depend on our ability to correctly predict market changes, the degree of correlation between price movements of a derivative instrument, the position being hedged, the creditworthiness of the counterparty and other factors, some of which may be beyond our ability to hedge. As a result, while we may enter into a transaction in order to reduce our exposure to market risks, the unintended market changes may result in poorer overall investment performance than if it had not been executed. Such transactions may also limit the opportunity for gain if the value of a hedged position increases.
While such hedging arrangements may reduce certain risks, such arrangements themselves may entail certain other risks. These arrangements may require the posting of cash collateral at a time when a fund has insufficient cash or illiquid assets such that the posting of the cash is either impossible or requires the sale of assets at prices that do not reflect their underlying value. In addition, if our derivative counterparties or clearinghouses fail to meet their obligations with respect to the posting of cash collateral, our efforts to mitigate certain risks may be ineffective. Moreover, these hedging arrangements may generate significant transaction costs, including potential tax costs, that reduce the returns generated by a fund.
64
Finally, the regulation of derivatives and commodity interest transactions in the United States and other countries is a rapidly changing area of law and is subject to ongoing modification by governmental and judicial action. Newly instituted and amended regulations could significantly increase the cost of entering into derivative contracts (including through requirements to post collateral, which could negatively impact available liquidity), materially alter the terms of derivative contracts, reduce the availability of derivatives to protect against risks, reduce our ability to restructure our existing derivative contracts and increase our exposure to less creditworthy counterparties. Furthermore, the CFTC may in the future require certain foreign exchange products to be subject to mandatory clearing, which could increase the cost of entering into currency hedges.
Our real estate funds are subject to the risks inherent in the ownership and operation of real estate and the construction and development of real estate.
Investments by our real estate funds will be subject to the risks inherent in the ownership and operation of real estate and real estate-related businesses and assets. Such investments are subject to the potential for deterioration of real estate fundamentals and the risk of adverse changes in local market and economic conditions, which may include changes in supply of and demand for competing properties in an area, increases in interest rates and borrowing costs, fluctuations in the average occupancy and room rates for hotel properties, changes in demand for commercial office properties (including as a result of an increased prevalence of remote work), changes in the financial resources of tenants, defaults by borrowers or tenants, depressed travel activity, and the lack of availability of mortgage funds, which may render the sale or refinancing of properties difficult or impracticable. In addition, investments in real estate and real estate-related businesses and assets may be subject to the risk of environmental liabilities, contingent liabilities upon disposition of assets, casualty or condemnations losses, energy and supply shortages, natural disasters, climate change related risks (including climate- related transition risks and acute and chronic physical risks), acts of god, terrorist attacks, war and other events that are beyond our control, and various uninsured or uninsurable risks. Further, investments in real estate and real estate-related businesses and assets are subject to changes in law and regulation, including in respect of building, environmental and zoning laws, rent control and other regulations impacting our residential real estate investments and changes to tax laws and regulations, including real property and income tax rates and the taxation of business entities and the deductibility of corporate interest expense. For example, we have seen an increasing focus toward rent regulation as a means to address residential affordability caused by undersupply of housing in certain markets in the U.S. and Europe, which may contribute to adverse operating performance in certain parts of our residential real estate portfolio, including by moderating rent growth in certain geographies and markets. In addition, if our real estate funds acquire direct or indirect interests in undeveloped land or underdeveloped real property, which may often be non-income producing, they will be subject to the risks normally associated with such assets and development activities, including risks relating to the availability and timely receipt of zoning and other regulatory or environmental approvals, the cost and timely completion of construction (including risks beyond the control of our fund, such as weather or labor conditions or material shortages) and the availability of both construction and permanent financing on favorable terms.
Certain of our investment funds may invest in securities of companies that are experiencing significant financial or business difficulties, including companies involved in bankruptcy or other reorganization and liquidation proceedings. Such investments are subject to a greater risk of poor performance or loss.
Certain of our investment funds, especially our credit-focused funds, may invest in business enterprises involved in work-outs, liquidations, spin-offs, reorganizations, bankruptcies and similar transactions and may purchase high-risk receivables. An investment in such business enterprises entails the risk that the transaction in which such business enterprise is involved either will be unsuccessful, will take considerable time or will result in a distribution of cash or a new security the value of which will be less than the purchase price to the fund of the
65
security or other financial instrument in respect of which such distribution is received. In addition, if an anticipated transaction does not in fact occur, the fund may be required to sell its investment at a loss. Investments in troubled companies may also be adversely affected by U.S. federal and state laws relating to, among other things, fraudulent conveyances, voidable preferences, lender liability and a bankruptcy court’s discretionary power to disallow, subordinate or disenfranchise particular claims. Investments in securities and private claims of troubled companies made in connection with an attempt to influence a restructuring proposal or plan of reorganization in a bankruptcy case may also involve substantial litigation. Because there is substantial uncertainty concerning the outcome of transactions involving financially troubled companies, there is a potential risk of loss by a fund of its entire investment in such company. Moreover, a major economic recession could have a materially adverse impact on the value of such securities. Adverse publicity and investor perceptions, whether or not based on fundamental analysis, may also decrease the value and liquidity of securities rated below investment grade or otherwise adversely affect our reputation.
In addition, at least one federal Circuit Court has determined that an investment fund could be liable for ERISA Title IV pension obligations (including withdrawal liability incurred with respect to union multiemployer plans) of its portfolio companies, if such fund is a “trade or business” and the fund’s ownership interest in the portfolio company is significant enough to bring the investment fund within the portfolio company’s “controlled group.” While a number of cases have held that managing investments is not a “trade or business” for tax purposes, the Circuit Court in this case concluded the investment fund could be a “trade or business” for ERISA purposes based on certain factors, including the fund’s level of involvement in the management of its portfolio companies and the nature of its management fee arrangements. Litigation related to the Circuit Court’s decision suggests that additional factors may be relevant for purposes of determining whether an investment fund could face “controlled group” liability under ERISA, including the structure of the investment and the nature of the fund’s relationship with other affiliated investors and co-investors in the portfolio company. Moreover, regardless of whether an investment fund is determined to be a “trade or business” for purposes of ERISA, a court might hold that one of the fund’s portfolio companies could become jointly and severally liable for another portfolio company’s unfunded pension liabilities pursuant to the ERISA “controlled group” rules, depending upon the relevant investment structures and ownership interests as noted above.
Investments in energy, manufacturing, infrastructure, real estate and certain other assets may expose us to increased environmental liabilities that are inherent in the ownership of real assets.
Ownership of real assets in our funds or vehicles may increase our risk of direct and/or indirect liability under environmental laws that impose, regardless of fault, joint and several liability for the cost of remediating contamination and compensation for damages. In addition, changes in environmental laws or regulations (including climate change initiatives) or the environmental condition of an investment may create liabilities that did not exist at the time of acquisition. Even in cases where we are indemnified by a seller against liabilities arising out of violations of environmental laws and regulations, there can be no assurance as to the financial viability of the seller to satisfy such indemnities or our ability to achieve enforcement of such indemnities. See “— Climate change, climate and sustainability-related regulation and sustainability concerns could adversely affect our businesses and the operations of our funds’ portfolio companies, and any actions we take or fail to take in response to such matters could damage our reputation.”
Investments by our funds in the power and energy industries involve various operational, construction, regulatory and market risks.
The development, operation and maintenance of power and energy generation facilities involves many risks, including, as applicable, labor issues, start-up risks, breakdown or failure of facilities, lack of sufficient capital to maintain the facilities and the dependence on a specific fuel source. Power and energy generation facilities in which our funds invest are also subject to risks associated with volatility in the price of fuel sources and the impact of unusual or adverse weather conditions or other natural events, such as droughts or wildfires, as well as the risk
66
of performance below expected levels of output, efficiency or reliability. The occurrence of any such items could result in lost revenues and/or increased expenses. In turn, such developments could impair a portfolio company’s ability to repay its debt or conduct its operations. We may also choose or be required to decommission a power generation facility or other asset. The decommissioning process could be protracted and result in the incurrence of significant financial and/or regulatory obligations or other uncertainties.
Our power and energy sector portfolio companies may also face construction risks typical for power generation and related infrastructure businesses. Such developments could result in substantial unanticipated delays or expenses and, under certain circumstances, could prevent completion of construction activities once undertaken. Delays in the completion of any power project may result in lost revenues or increased expenses, including higher operation and maintenance costs related to such portfolio company.
The power and energy sectors are the subject of substantial and complex laws, rules and regulation by various federal and state regulatory agencies. Failure to comply with applicable laws, rules and regulations could result in the prevention of operation of certain facilities or the prevention of the sale of such a facility to a third party, as well as the loss of certain rate authority, refund liability, penalties and other remedies, all of which could result in additional costs to a portfolio company and adversely affect the investment results. In addition, the increased scrutiny placed by regulators, elected officials and certain investors with respect to the incorporation of ESG factors in the investment process and the impact of certain investments made by our energy funds has negatively impacted and is likely to continue to negatively impact our ability to exit certain of our conventional energy investments on favorable terms. The current administration has focused on climate change policies and has re-joined the Paris Agreement, which includes commitments from countries to reduce their greenhouse gas emissions, among other commitments. Legislative efforts by the administration or the U.S. Congress to place additional limitations on coal and gas electric generation, mining and/or exploration could adversely affect our conventional energy investments. Conversely, certain investors have raised concerns as to whether the incorporation of ESG factors in the investment and portfolio management process may be inconsistent with the fiduciary duty to maximize returns for investors, which may result in such investors calling into question certain non-conventional energy investments made by our energy funds.
In addition, the performance of the investments made by our credit and equity funds in the energy and natural resources markets are also subject to a high degree of market risk, as such investments are likely to be directly or indirectly substantially dependent upon prevailing prices of oil, natural gas and other commodities. Oil and natural gas prices are subject to wide fluctuation in response to factors beyond the control of us or our funds’ portfolio companies, including relatively minor changes in the supply and demand for oil and natural gas, market uncertainty, the level of consumer product demand, weather conditions, climate change initiatives, governmental regulation (including with respect to trade and economic sanctions), the price and availability of alternative fuels, political and economic conditions in oil producing countries, foreign supply of such commodities and overall domestic and foreign economic conditions. These factors make it difficult to predict future commodity price movements with any certainty.
Our investments in infrastructure assets may expose us to increased risks that are inherent in the ownership of real assets.
Investments in infrastructure assets may expose us to increased risks that are inherent in the ownership of real assets. For example,
|
•
|
Ownership of infrastructure assets may present risk of liability for personal and property injury or impose significant operating challenges and costs with respect to, for example, compliance with zoning, environmental or other applicable laws.
|
67
|
•
|
Infrastructure asset investments may face construction risks including, without limitation: (a) labor disputes, shortages of material and skilled labor, or work stoppages, (b) slower than projected construction progress and the unavailability or late delivery of necessary equipment, (c) less than optimal coordination with public utilities in the relocation of their facilities, (d) adverse weather conditions and unexpected construction conditions, (e) accidents or the breakdown or failure of construction equipment or processes, and (f) catastrophic events such as explosions, fires, terrorist attacks and other similar events. These risks could result in substantial unanticipated delays or expenses (which may exceed expected or forecasted budgets) and, under certain circumstances, could prevent completion of construction activities once undertaken. Certain infrastructure asset investments may remain in construction phases for a prolonged period and, accordingly, may not be cash generative for a prolonged period. Recourse against the contractor may be subject to liability caps or may be subject to default or insolvency on the part of the contractor.
|
|
•
|
The operation of infrastructure assets is exposed to potential unplanned interruptions caused by significant catastrophic or force majeure events. These risks could, among other effects, adversely impact the cash flows available from investments in infrastructure assets, cause personal injury or loss of life, damage property, or instigate disruptions of service. In addition, the cost of repairing or replacing damaged assets could be considerable. Repeated or prolonged service interruptions may result in permanent loss of customers, litigation, or penalties for regulatory or contractual non-compliance. Force majeure events that are incapable of, or too costly to, cure may also have a permanent adverse effect on an investment.
|
|
•
|
The management of the business or operations of an infrastructure asset may be contracted to a third-party management company unaffiliated with us. Although it would be possible to replace any such operator, the failure of such an operator to adequately perform its duties or to act in ways that are in our best interest, or the breach by an operator of applicable agreements or laws, rules and regulations, could have an adverse effect on the investment’s financial condition or results of operations. Infrastructure investments may involve the subcontracting of design and construction activities in respect of projects, and as a result our investments are subject to the risks that contractual provisions passing liabilities to a subcontractor could be ineffective, the subcontractor fails to perform services which it has agreed to perform and the subcontractor becomes insolvent.
|
Infrastructure investments often involve an ongoing commitment to a municipal, state, federal or foreign government or regulatory agencies. The nature of these obligations exposes us to a higher level of regulatory control than typically imposed on other businesses and may require us to rely on complex government licenses, concessions, leases or contracts, which may be difficult to obtain or maintain. Infrastructure investments may require operators to manage such investments and such operators’ failure to comply with laws, including prohibitions against bribing of government officials, may adversely affect the value of such investments and cause us serious reputational and legal harm. Revenues for such investments may rely on contractual agreements for the provision of services with a limited number of counterparties, and are consequently subject to counterparty default risk. The operations and cash flow of infrastructure investments are also more sensitive to inflation and, in certain cases, commodity price risk. Furthermore, services provided by infrastructure investments may be subject to rate regulations by government entities that determine or limit prices that may be charged. Similarly, users of applicable services or government entities in response to such users may react negatively to any adjustments in rates and thus reduce the profitability of such infrastructure investments.
Our investments in the life sciences industry may expose us to increased risks.
Investments by BXLS may expose us to increased risks. For example,
|
•
|
BXLS’s strategies include, among others, investments that are referred to as “corporate partnership” transactions. Corporate partnership transactions are risk-sharing collaborations with biopharmaceutical and medical device partners on drug and medical device development programs and investments in royalty streams of pre-commercial biopharmaceutical products. BXLS’s ability to source corporate
|
68
partnership transactions has been, and will continue to be, in part dependent on the ability of special purpose development companies to identify, diligence, negotiate and in many cases, take the lead in executing the agreed development plans with respect to, a corporate partnership transaction. Moreover, as such special purpose development companies are jointly owned by us or our affiliates and unaffiliated life sciences investors, we (and our funds) are not the sole beneficiaries of such sourcing strategies and capabilities of such special purpose development companies. In addition, payments to BXLS under such corporate partnerships (which can include future royalty or other milestone-based payments) are often contingent upon the achievement of certain milestones, including approvals of the applicable product candidate and/or product sales thresholds, over which BXLS may not have the ability to exercise meaningful control.
|
•
|
Life sciences and healthcare companies are subject to extensive regulation by the U.S. Food and Drug Administration, similar foreign regulatory authorities and, to a lesser extent, other federal and state agencies. These companies are subject to the expense, delay and uncertainty of the product approval process, and there can be no guarantee that a particular product candidate will obtain regulatory approval. In addition, the current regulatory framework may change or additional regulations may arise at any stage during the product development phase of an investment, which may delay or prevent regulatory approval or impact applicable exclusivity periods. If a company in which our funds are invested is unable to obtain regulatory approval for a product candidate, or a product candidate in which our funds are invested does not obtain regulatory approval, in a timely fashion or at all, the value of our investment would be adversely impacted. In addition, in connection with certain corporate partnership transactions, our special purpose development companies will be contractually obligated to run clinical trials. Further, a clinical trial (including enrollment therein) or regulatory approval process for pharmaceuticals has and may in the future be delayed, otherwise hindered or abandoned as a result of epidemics (including COVID-19), which could have a negative impact on the ability of the investment to engage in trials or receive approvals, and thereby could adversely affect the performance of the investment. In the event such clinical trials do not comply with the complicated regulatory requirements applicable thereto, such special purpose development companies may be subject to regulatory actions.
|
|
•
|
Intellectual property often constitutes an important part of a life sciences company’s assets and competitive strengths, particularly for royalty monetization transactions. To the extent such companies’ intellectual property positions with respect to products in which BXLS invests, whether through a royalty monetization or otherwise, are challenged, invalidated or circumvented, the value of BXLS’s investment may be impaired. The success of a life sciences investment depends in part on the ability of the biopharmaceutical or medical device companies in whose products BXLS invests to obtain and defend patent rights and other intellectual property rights that are important to the commercialization of such products. The patent positions of such companies can be highly uncertain and often involve complex legal, scientific and factual questions.
|
|
•
|
The commercial success of products could be compromised if governmental or third-party payers do not provide coverage and reimbursement, breach, rescind or modify their contracts or reimbursement policies or delay payments for such products. In both the U.S. and foreign markets, the successful sale of a life sciences company’s product depends on the ability to obtain and maintain adequate coverage and reimbursement from third-party payers, including government healthcare programs and private insurance plans. Governments and third-party payers continue to pursue aggressive initiatives to contain costs and manage drug utilization and are increasingly focused on the effectiveness, benefits and costs of similar treatments, which could result in lower reimbursement rates and narrower populations for whom the products in which BXLS invests will be reimbursed by third-party payers. For example, in the U.S., Federal legislation has passed that modifies coverage, reimbursement and pricing policies for certain products. Regulatory agencies have provided guidance on how they intend to implement certain components of the legislation. In general, as regulatory agencies and others continue to define and implement the legislation, such legislation may result in lower product prices, altered market dynamics, or the unavailability of adequate third-party payer reimbursement to enable BXLS to realize an appropriate return on its investment.
|
69
Our funds may be forced to dispose of investments at a disadvantageous time.
Our funds may make investments of which they do not advantageously dispose of prior to the date the applicable fund is dissolved, either by expiration of such fund’s term or otherwise. Although we generally expect that our funds will dispose of investments prior to dissolution or that investments will be suitable for in-kind distribution at dissolution, we may not be able to do so. The general partners of our funds have only a limited ability to extend the term of the fund with the consent of fund investors or the advisory board of the fund, as applicable, and therefore, we may be required to sell, distribute or otherwise dispose of investments at a disadvantageous time prior to dissolution. This would result in a lower than expected return on the investments and, perhaps, on the fund itself.
Hedge fund investments are subject to numerous additional risks.
Investments by our funds of hedge funds in other hedge funds, as well as investments by our credit-focused, real estate debt and other hedge funds and similar products, are subject to numerous additional risks, including the following:
|
•
|
Certain of the funds in which we invest are newly established funds without any operating history or are managed by management companies or general partners who may not have as significant track records as a more established manager.
|
|
•
|
Generally, the execution of third-party hedge funds’ investment strategies is subject to the sole discretion of the management company or the general partner of such funds. As a result, we do not have the ability to control the investment activities of such funds, including with respect to the selection of investment opportunities, any deviation from stated or expected investment strategy, the liquidation of positions and the use of leverage to finance the purchase of investments, each of which may impact our ability to generate a successful return on our investment in such underlying fund.
|
|
•
|
Hedge funds may engage in speculative trading strategies, including short selling, which is subject to the theoretically unlimited risk of loss because there is no limit on how much the price of a security may appreciate before the short position is closed out. A fund may be subject to losses if a security lender demands return of the lent securities and an alternative lending source cannot be found or if the fund is otherwise unable to borrow securities that are necessary to hedge or cover its positions.
|
|
•
|
Hedge funds are exposed to the risk that a counterparty will not settle a transaction in accordance with its terms and conditions because of a dispute over the terms of the contract (whether or not bona fide) or because of a credit or liquidity problem or otherwise, thus causing the fund to suffer a loss. Counterparty risk is accentuated for contracts with longer maturities where events may intervene to prevent settlement, or where the fund has concentrated its transactions with a single or small group of counterparties. Generally, hedge funds are not restricted from dealing with any particular counterparty or from concentrating any or all of their transactions with one counterparty. Moreover, the funds’ internal consideration of the creditworthiness of their counterparties may prove insufficient. The absence of a regulated market to facilitate settlement may increase the potential for losses.
|
|
•
|
Credit risk may arise through a default by one of several large institutions that are dependent on one another to meet their liquidity or operational needs, so that a default by one institution causes a series of defaults by the other institutions. This “systemic risk” may adversely affect the financial intermediaries (such as clearing agencies, clearing houses, banks, securities firms and exchanges) with which the hedge funds interact on a daily basis.
|
70
|
•
|
The efficacy of investment and trading strategies depends largely on the ability to establish and maintain an overall market position in a combination of financial instruments. A hedge fund’s trading orders may not be executed in a timely and efficient manner due to various circumstances, including systems failures or human error. In such event, the funds might only be able to acquire some but not all of the components of the position, or if the overall position were to need adjustment, the funds might not be able to make such adjustment. As a result, the funds would not be able to achieve the market position selected by the management company or general partner of such funds, and might incur a loss in liquidating their position.
|
|
•
|
Hedge funds are subject to risks due to potential illiquidity of assets. Hedge funds may make investments or hold trading positions in markets that are volatile and which may become illiquid. Timely divestiture or sale of trading positions can be impaired by decreased trading volume, increased price volatility, concentrated trading positions, limitations on the ability to transfer positions in highly specialized or structured transactions to which they may be a party, and changes in industry and government regulations. It may be impossible or costly for hedge funds to liquidate positions rapidly in order to meet margin calls, withdrawal requests or otherwise, particularly if there are other market participants seeking to dispose of similar assets at the same time or the relevant market is otherwise moving against a position or in the event of trading halts or daily price movement limits on the market or otherwise. Any “gate” or similar limitation on withdrawals with respect to hedge funds may not be effective in mitigating such risk. Moreover, these risks may be exacerbated for our funds of hedge funds. For example, if one of our funds of hedge funds were to invest a significant portion of its assets in two or more hedge funds that each had illiquid positions in the same issuer, the illiquidity risk for our funds of hedge funds would be compounded. For example, in 2008 many hedge funds, including some of our hedge funds, experienced significant declines in value. In many cases, these declines in value were both provoked and exacerbated by margin calls and forced selling of assets. Moreover, certain of our funds of hedge funds were invested in third-party hedge funds that halted redemptions in the face of illiquidity and other issues, which precluded those funds of hedge funds from receiving their capital back on request.
|
|
•
|
Hedge fund investments are subject to risks relating to investments in commodities, futures, options and other derivatives, the prices of which are highly volatile and may be subject to the theoretically unlimited risk of loss in certain circumstances, including if the fund writes a call option. Price movements of commodities, futures and options contracts and payments pursuant to swap agreements are influenced by, among other things, interest rates, changing supply and demand relationships, trade, fiscal, monetary and exchange control programs and policies of governments and national and international political and economic events and policies. The value of futures, options and swap agreements also depends upon the price of the commodities underlying them and prevailing exchange rates. In addition, hedge funds’ assets are subject to the risk of the failure of any of the exchanges on which their positions trade or of their clearinghouses or counterparties. Most U.S. commodities exchanges limit fluctuations in certain commodity interest prices during a single day by imposing “daily price fluctuation limits” or “daily limits,” the existence of which may reduce liquidity or effectively curtail trading in particular markets.
|
As a result of their affiliation with us, our hedge funds may from time to time be restricted from trading in certain securities (e.g., publicly traded securities issued by our current or potential portfolio companies). This may limit their ability to acquire and/or subsequently dispose of investments in connection with transactions that would otherwise generally be permitted in the absence of such affiliation. In addition, the use of leverage by the hedge funds in which our funds of hedge funds invest poses additional risks, including those described in “— Dependence on significant leverage in investments by our funds could adversely affect our ability to achieve attractive rates of return on those investments.”
71
We are reliant on third-party service providers for certain aspects of our business, and are subject to risks in using prime brokers, custodians, counterparties, administrators and other agents.
We are reliant on other third-party service providers for certain technology platforms that facilitate the continued operation of our business, including cloud-based services. We generally have less control over the delivery of such third-party services, and as a result, may face disruptions to our ability to operate our business as a result of interruptions of such services. A prolonged global failure of cloud services provided to us could result in cascading systems failures. In addition, we may not be able to adapt our information systems and technology to accommodate our growth, or the cost of maintaining such systems may increase materially from its current level, which could have a material adverse effect on us.
Many of our funds depend on the services of prime brokers, custodians, counterparties, administrators and other agents, including to carry out certain securities and derivatives transactions. The terms of these contracts are often customized and complex, and many of these arrangements occur in markets or relate to products that are subject to limited or no regulatory oversight. Some of our funds utilize prime brokerage arrangements with a relatively limited number of counterparties, which has the effect of concentrating the transaction volume (and related counterparty default risk) of these funds with these counterparties. Our funds are subject to the risk that the counterparty to one or more of these contracts defaults, either voluntarily or involuntarily, on its performance under the contract. Any such default may occur suddenly and without notice to us. Moreover, if a counterparty defaults, we may be unable to take action to cover our exposure, either because we lack contractual recourse or because market conditions make it difficult to take effective action. This inability could occur in times of market stress, which is when defaults are most likely to occur.
In addition, our risk management process may not accurately anticipate the impact of market stress or counterparty financial condition, and as a result, we may not have taken sufficient action to reduce our risks effectively. Default risk may arise from events or circumstances that are difficult to detect, foresee or evaluate. In addition, concerns about, or a default by, one large participant could lead to significant liquidity problems for other participants, which may in turn expose us to significant losses. Although we have risk management processes to ensure that we are not exposed to a single counterparty for significant periods of time, given the large number and size of our funds, we often have large positions with a single counterparty. For example, most of our funds have credit lines. If the lender under one or more of those credit lines were to become insolvent, we may have difficulty replacing the credit line and one or more of our funds may face liquidity problems.
In the event of a counterparty default, particularly a default by a major investment bank or a default by a counterparty to a significant number of our contracts, one or more of our funds may have outstanding trades that they cannot settle or are delayed in settling. As a result, these funds could incur material losses and the resulting market impact of a major counterparty default could harm our businesses, results of operation and financial condition. In addition, under certain local clearing and settlement regimes in Europe, we or our funds could be subject to settlement discipline fines. See “— Complex regulatory regimes and potential regulatory changes in jurisdictions outside the United States could adversely affect our business.”
In the event of the insolvency of a prime broker, custodian, counterparty or any other party that is holding assets of our funds as collateral, our funds might not be able to recover equivalent assets in full as they will rank among the prime broker’s, custodian’s or counterparty’s unsecured creditors in relation to the assets held as collateral. In addition, our funds’ cash held with a prime broker, custodian or counterparty generally will not be segregated from the prime broker’s, custodian’s or counterparty’s own cash, and our funds may therefore rank as unsecured creditors in relation thereto. If our derivatives transactions are cleared through a derivatives clearing organization, the CFTC has issued final rules regulating the segregation and protection of collateral posted by customers of cleared and uncleared swaps. The CFTC is also working to provide new guidance regarding prime broker arrangements and intermediation generally with regard to trading on swap execution facilities.
72
The counterparty risks that we face have increased in complexity and magnitude over time. For example, in certain areas the number of counterparties we face has increased and may continue to increase, which may result in increased complexity and monitoring costs. Conversely, in certain other areas, the consolidation and elimination of counterparties has increased our concentration of counterparty risk and decreased the universe of potential counterparties, and our funds are generally not restricted from dealing with any particular counterparty or from concentrating any or all of their transactions with one counterparty. In addition, counterparties have in the past and may in the future react to market volatility by tightening underwriting standards and increasing margin requirements for all categories of financing, which may decrease the overall amount of leverage available and increase the costs of borrowing.
Underwriting activities by our capital markets services business expose us to risks.
Blackstone Securities Partners L.P. may act as an underwriter, syndicator or placement agent in securities offerings and, through affiliated entities, loan syndications. We may incur losses and be subject to reputational harm to the extent that, for any reason, we are unable to sell securities or indebtedness we purchased or placed as an underwriter, syndicator or placement agent at the anticipated price levels or at all. As an underwriter, syndicator or placement agent, we also may be subject to liability for material misstatements or omissions in prospectuses and other offering documents relating to offerings we underwrite, syndicate or place.
Risks Related to Our Organizational Structure
The significant voting power of holders of our Series I preferred stock and Series II preferred stock may limit the ability of holders of our common stock to influence our business.
Holders of our common stock are entitled to vote pursuant to Delaware law with respect to:
|
•
|
A conversion of the legal entity form of Blackstone,
|
|
•
|
A transfer, domestication or continuance of Blackstone to a foreign jurisdiction,
|
|
•
|
Any amendment of our certificate of incorporation to change the par value of our common stock or the powers, preferences or special rights of our common stock in a way that would affect our common stock adversely,
|
|
•
|
Any amendment of our certificate of incorporation that requires for action the vote of a greater number or portion of the holders of common stock than is required by any section of Delaware law, and
|
|
•
|
Any amendment of our certificate of incorporation to elect to become a close corporation under Delaware law.
|
In addition, our certificate of incorporation provides voting rights to holders of our common stock on the following additional matters:
|
•
|
A sale, exchange or disposition of all or substantially all of our assets,
|
|
•
|
A merger, consolidation or other business combination,
|
|
•
|
Any amendment of our certificate of incorporation or bylaws enlarging the obligations of the common stockholders,
|
|
•
|
Any amendment of our certificate of incorporation requiring the vote of the holders of a percentage of the voting power of the outstanding common stock and Series I preferred stock, voting together as a single class, to take any action in a manner that would have the effect of reducing such voting percentage and
|
|
•
|
Any amendments of our certificate of incorporation that are not included in the specified set of amendments that the Series II Preferred Stockholder has the sole right to vote on.
|
73
Furthermore, our certificate of incorporation provides that the holders of at least 66 2/3% of the voting power of the outstanding shares of common stock and Series I preferred stock may vote to require the Series II Preferred Stockholder to transfer its shares of Series II preferred stock to a successor Series II Preferred Stockholder designated by the holders of at least a majority of the voting power of the outstanding shares of common stock and Series I preferred stock.
Other matters that are required to be submitted to a vote of the holders of our common stock generally require the approval of a majority of the voting power of our outstanding shares of common stock and Series I preferred stock, voting together as a single class, including certain sales, exchanges or other dispositions of all or substantially all of our assets, a merger, consolidation or other business combination, certain amendments to our certificate of incorporation and the designation of a successor Series II Preferred Stockholder. Holders of our Series I preferred stock, as such, will collectively be entitled to a number of votes equal to the aggregate number of Blackstone Holdings Partnership Units held by the limited partners of the Blackstone Holdings Partnerships on the relevant record date and will vote together with holders of our common stock as a single class. As of February 16, 2024, Blackstone Partners L.L.C., an entity owned by the senior managing directors of Blackstone and controlled by Mr. Schwarzman, owned the only share of Series I preferred stock outstanding, representing approximately 39.2% of the total combined voting power of the common stock and Series I preferred stock, taken together.
Our certificate of incorporation and bylaws contain additional provisions affecting the holders of our common stock, including certain limits on the ability of the holders of our common stock to call meetings, to acquire information about our operations and to influence the manner or direction of our management. In addition, any person that beneficially owns 20% or more of the common stock then outstanding (other than the Series II Preferred Stockholder or its affiliates, a direct or subsequently approved transferee of the Series II Preferred Stockholder or its affiliates or a person or group that has acquired such stock with the prior approval of our board of directors) is unable to vote such stock on any matter submitted to such stockholders.
We are not required to comply with certain provisions of U.S. securities laws relating to proxy statements and certain related matters.
We are not required to file proxy statements or information statements under Section 14 of the Exchange Act except in circumstances where a vote of holders of our common stock is required under our certificate of incorporation or Delaware law, such as a merger, business combination or sale of all or substantially all of our assets. In addition, we will generally not be subject to the “say-on-pay” and “say-on-frequency” provisions of the Dodd-Frank Act. As a result, our common stockholders do not have an opportunity to provide a non-binding vote on the compensation of our named executive officers. Moreover, holders of our common stock are not able to bring matters before our annual meeting of stockholders or nominate directors at such meeting, nor are they generally able to submit stockholder proposals under Rule 14a-8 of the Exchange Act.
We are a controlled company and as a result qualify for some exceptions from certain corporate governance and other requirements of the New York Stock Exchange.
Because the Series II Preferred Stockholder holds more than 50% of the voting power for the election of directors, we are a “controlled company” and fall within exceptions from certain corporate governance and other requirements of the rules of the New York Stock Exchange. Pursuant to these exceptions, controlled companies may elect not to comply with certain corporate governance requirements of the New York Stock Exchange, including the requirements (a) that a majority of our board of directors consist of independent directors, (b) that we have a nominating and corporate governance committee that is composed entirely of independent directors, (c) that we have a compensation committee that is composed entirely of independent directors and (d) that the compensation committee be required to consider certain independence factors when engaging compensation consultants, legal counsel and other committee advisers. While we currently have a majority independent board of directors, we have elected to avail ourselves of the other exceptions. Accordingly, our common stockholders generally do not have the same protections afforded to stockholders of companies that are subject to all of the corporate governance requirements of the NYSE.
74
Potential conflicts of interest may arise among the Series II Preferred Stockholder and the holders of our common stock.
Blackstone Group Management L.L.C., an entity owned by senior managing directors of Blackstone and controlled by Mr. Schwarzman, is the sole holder of the Series II Preferred stock. As a result, conflicts of interest may arise among the Series II Preferred Stockholder, on the one hand, and us and our holders of our common stock, on the other hand. The Series II Preferred Stockholder has the ability to influence our business and affairs through its ownership of Series II Preferred stock, the Series II Preferred Stockholder’s general ability to appoint our board of directors, and provisions under our certificate of incorporation requiring Series II Preferred Stockholder approval for certain corporate actions (in addition to approval by our board of directors). If the holders of our common stock are dissatisfied with the performance of our board of directors, they have no ability to remove any of our directors, with or without cause.
Further, through its ability to elect our board of directors, the Series II Preferred Stockholder has the ability to indirectly influence the determination of the amount and timing of our investments and dispositions, cash expenditures, indebtedness, issuances of additional partnership interests, tax liabilities and amounts of reserves, each of which can affect the amount of cash that is available for distribution to holders of Blackstone Holdings Partnership Units.
In addition, conflicts may arise relating to the selection, structuring and disposition of investments and other transactions, declaring dividends and other distributions and other matters due to the fact that our senior managing directors hold their Blackstone Holdings Partnership Units directly or through pass-through entities that are not subject to corporate income taxation. See “Part III. Item 13. Certain Relationships and Related Transactions, and Director Independence” and “Part III. Item 10. Directors, Executive Officers and Corporate Governance.”
Our certificate of incorporation states that the Series II Preferred Stockholder is under no obligation to consider the separate interests of the other stockholders and contains provisions limiting the liability of the Series II Preferred Stockholder.
Subject to applicable law, our certificate of incorporation contains provisions limiting the duties owed by the holder of our Series II preferred stock and contains provisions allowing the Series II Preferred Stockholder to favor its own interests and the interests of its controlling persons over us and the holders of our common stock. Our certificate of incorporation contains provisions stating that the Series II Preferred Stockholder is under no obligation to consider the separate interests of the other stockholders (including, without limitation, the tax consequences to such stockholders) in deciding whether or not to authorize us to take (or decline to authorize us to take) any action as well as provisions stating that the Series II Preferred Stockholder shall not be liable to the other stockholders for damages for any losses, liabilities or benefits not derived by such stockholders in connection with such decisions. See “— Potential conflicts of interest may arise among the Series II Preferred Stockholder and the holders of our common stock.”
The Series II Preferred Stockholder will not be liable to Blackstone or holders of our common stock for any acts or omissions unless there has been a final and non-appealable judgment determining that the Series II Preferred Stockholder acted in bad faith or engaged in fraud or willful misconduct and we have also agreed to indemnify the Series II Preferred Stockholder to a similar extent.
Even if there is deemed to be a breach of the obligations set forth in our certificate of incorporation, our certificate of incorporation provides that the Series II Preferred Stockholder will not be liable to us or the holders of our common stock for any acts or omissions unless there has been a final and non-appealable judgment by a court of competent jurisdiction determining that the Series II Preferred Stockholder or its officers and directors acted in bad faith or engaged in fraud or willful misconduct. These provisions are detrimental to the holders of our common stock because they restrict the remedies available to stockholders for actions of the Series II Preferred Stockholder.
75
In addition, we have agreed to indemnify the Series II Preferred Stockholder and our former general partner and its controlling affiliates and any current or former officer or director of any of Blackstone or its subsidiaries, the Series II Preferred Stockholder or former general partner and certain other specified persons (collectively, the “Indemnitees”), to the fullest extent permitted by law, against any and all losses, claims, damages, liabilities, joint or several, expenses (including legal fees and expenses), judgments, fines, penalties, interest, settlements or other amounts incurred by any Indemnitee. We have agreed to provide this indemnification if the Indemnitee acted in good faith and in a manner the Indemnitee reasonably believed to be in or not opposed to the best interests of Blackstone, and with respect to any alleged conduct resulting in a criminal proceeding against the Indemnitee, such person had no reasonable cause to believe that such person’s conduct was unlawful. We have also agreed to provide this indemnification for criminal proceedings.
The Series II Preferred Stockholder may transfer its interest in the sole share of Series II preferred stock which could materially alter our operations.
Without the approval of any other stockholder, the Series II Preferred Stockholder may transfer the sole outstanding share of our Series II preferred stock held by it to a third party upon receipt of approval to do so by our board of directors and satisfaction of certain other requirements. Further, the members or other interest holders of the Series II Preferred Stockholder may sell or transfer all or part of their outstanding equity or other interests in the Series II Preferred Stockholder at any time without our approval. A new holder of our Series II preferred stock or new controlling members of the Series II Preferred Stockholder may appoint directors to our board of directors who have a different philosophy and/or investment objectives from those of our current directors. A new holder of our Series II Preferred stock, new controlling members of the Series II Preferred Stockholder and/or the directors they appoint to our board of directors could also have a different philosophy for the management of our business, including the hiring and compensation of our investment professionals. If any of the foregoing were to occur, we could experience difficulty in forming new funds and other investment vehicles and in making new investments, and the value of our existing investments, our business, our results of operations and our financial condition could materially suffer.
We intend to pay regular dividends to holders of our common stock, but our ability to do so may be limited by cash flow from operations and available liquidity, our holding company structure, applicable provisions of Delaware law and contractual restrictions.
Our intention to pay to holders of common stock a quarterly dividend representing approximately 85% of Blackstone Inc.’s share of Distributable Earnings, subject to adjustment by amounts determined by Blackstone’s board of directors to be necessary or appropriate to provide for the conduct of its business, to make appropriate investments in its business and our funds, to comply with applicable law, any of its debt instruments or other agreements, or to provide for future cash requirements such as tax-related payments, clawback obligations and dividends to stockholders for any ensuing quarter. All of the foregoing is subject to the qualification that the declaration and payment of any dividends are at the sole discretion of our board of directors, and may change at any time, including, without limitation, to reduce such quarterly dividends or to eliminate such dividends entirely.
Blackstone Inc. is a holding company and has no material assets other than the ownership of the partnership units in Blackstone Holdings held through wholly owned subsidiaries. Blackstone Inc. has no independent means of generating revenue. Accordingly, we intend to cause Blackstone Holdings to make distributions to its partners, including Blackstone Inc.’s wholly owned subsidiaries, to fund any dividends Blackstone Inc. may declare on our common stock.
76
Our ability to make dividends to our stockholders will depend on a number of factors, including among others general economic and business conditions, our strategic plans and prospects, our business and investment opportunities, our financial condition and operating results, including the timing and extent of our realizations, working capital requirements and anticipated cash needs, contractual restrictions and obligations including fulfilling our current and future capital commitments, legal, tax and regulatory restrictions, restrictions and other implications on the payment of dividends by us to holders of our common stock or payment of distributions by our subsidiaries to us and such other factors as our board of directors may deem relevant. Our ability to pay dividends is also subject to the availability of lawful funds therefor as determined in accordance with the Delaware General Corporation Law.
The amortization of finite-lived intangible assets and non-cash equity-based compensation results in expenses that may increase the net loss we record in certain periods or cause us to record a net loss in periods during which we would otherwise have recorded net income.
As of December 31, 2023, we have $201.2 million of finite-lived intangible assets (in addition to $1.9 billion of goodwill), net of accumulated amortization. These finite-lived intangible assets are from our initial public offering (“IPO”) and subsequent business acquisitions. We are amortizing these finite-lived intangibles over their estimated useful lives, which range from three to twenty years, using the straight-line method, with a weighted-average remaining amortization period of 6.2 years as of December 31, 2023. We also record non-cash equity-based compensation from grants made in the ordinary course of business and in connection with other business acquisitions. The amortization of these finite-lived intangible assets and of this non-cash equity-based compensation will increase our expenses during the relevant periods. These expenses may increase the net loss we record in certain periods or cause us to record a net loss in periods during which we would otherwise have recorded net income. A substantial and sustained decline in our share price could result in an impairment of intangible assets or goodwill leading to a further reduction in net income or increase to net loss in the relevant period.
We are required to pay our senior managing directors for most of the benefits relating to any additional tax depreciation or amortization deductions we may claim as a result of the tax basis step-up we received as part of the reorganization we implemented in connection with our IPO or receive in connection with future exchanges of our common stock and related transactions.
As part of the reorganization we implemented in connection with our IPO, we purchased interests in our business from our pre-IPO owners. In addition, holders of partnership units in Blackstone Holdings (other than Blackstone Inc.’s wholly owned subsidiaries), subject to the vesting and minimum retained ownership requirements and transfer restrictions set forth in the partnership agreements of the Blackstone Holdings Partnerships, may up to four times each year (subject to the terms of the exchange agreement) exchange their Blackstone Holdings Partnership Units for shares of Blackstone Inc.’s common stock on a one-for-one basis. A Blackstone Holdings limited partner must exchange one partnership unit in each of the Blackstone Holdings Partnerships to effect an exchange for a share of common stock. The purchase and subsequent exchanges are expected to result in increases in the tax basis of the tangible and intangible assets of Blackstone Holdings that otherwise would not have been available. These increases in tax basis may increase (for tax purposes) depreciation and amortization and therefore reduce the amount of tax that we would otherwise be required to pay in the future, although the IRS may challenge all or part of that tax basis increase, and a court could sustain such a challenge.
We have entered into a tax receivable agreements with our senior managing directors and other pre-IPO owners that provides for the payment by us to the counterparties of 85% of the amount of cash savings, if any, in U.S. federal, state and local income tax or franchise tax that we actually realize as a result of these increases in tax basis and of certain other tax benefits related to entering into the tax receivable agreement, including tax benefits attributable to payments under the tax receivable agreement. This payment obligation is an obligation of Blackstone Inc. and/or its wholly owned subsidiaries and not of Blackstone Holdings. As such, the cash distributions
77
to public stockholders may vary from holders of Blackstone Holdings Partnership Units (held by Blackstone personnel and others) to the extent payments are made under the tax receivable agreements to selling holders of Blackstone Holdings Partnership Units. As the payments reflect actual tax savings received by Blackstone entities, there may be a timing difference between the tax savings received by Blackstone entities and the cash payments to selling holders of Blackstone Holdings Partnership Units. While the actual increase in tax basis, as well as the amount and timing of any payments under this agreement, will vary depending upon a number of factors, including the timing of exchanges, the price of our common stock at the time of the exchange, the extent to which such exchanges are taxable and the amount and timing of our income, we expect that as a result of the size of the increases in the tax basis of the tangible and intangible assets of Blackstone Holdings, the payments that we may make under the tax receivable agreements will be substantial. The payments under a tax receivable agreement are not conditioned upon a tax receivable agreement counterparty’s continued ownership of us. We may need to incur debt to finance payments under the tax receivable agreement to the extent our cash resources are insufficient to meet our obligations under the tax receivable agreements as a result of timing discrepancies or otherwise.
Although we are not aware of any issue that would cause the IRS to challenge a tax basis increase, the tax receivable agreement counterparties will not reimburse us for any payments previously made under the tax receivable agreement. As a result, in certain circumstances payments to the counterparties under the tax receivable agreement could be in excess of our actual cash tax savings. Our ability to achieve benefits from any tax basis increase, and the payments to be made under the tax receivable agreements, will depend upon a number of factors, as discussed above, including the timing and amount of our future income.
If Blackstone Inc. were deemed an “investment company” under the 1940 Act, applicable restrictions could make it impractical for us to continue our business as contemplated and could have a material adverse effect on our business.
An entity will generally be deemed to be an “investment company” for purposes of the 1940 Act if: (a) it is or holds itself out as being engaged primarily, or proposes to engage primarily, in the business of investing, reinvesting or trading in securities, or (b) absent an applicable exemption, it owns or proposes to acquire investment securities having a value exceeding 40% of the value of its total assets (exclusive of U.S. government securities and cash items) on an unconsolidated basis. We believe that we are engaged primarily in the business of providing asset management and capital markets services and not in the business of investing, reinvesting or trading in securities. We also believe that the primary source of income from each of our businesses is properly characterized as income earned in exchange for the provision of services. We hold ourselves out as an asset management and capital markets firm and do not propose to engage primarily in the business of investing, reinvesting or trading in securities. Accordingly, we do not believe that Blackstone Inc. is an “orthodox” investment company as defined in section 3(a)(1)(A) of the 1940 Act and described in clause (a) in the first sentence of this paragraph. Furthermore, Blackstone Inc. does not have any material assets other than its equity interests in certain wholly owned subsidiaries, which in turn will have no material assets (other than intercompany debt) other than general partner interests in the Blackstone Holdings Partnerships. These wholly owned subsidiaries are the sole general partners of the Blackstone Holdings Partnerships and are vested with all management and control over the Blackstone Holdings Partnerships. We do not believe the equity interests of Blackstone Inc. in its wholly owned subsidiaries or the general partner interests of these wholly owned subsidiaries in the Blackstone Holdings Partnerships are investment securities. Moreover, because we believe that the capital interests of the general partners of our funds in their respective funds are neither securities nor investment securities, we believe that less than 40% of Blackstone Inc.’s total assets (exclusive of U.S. government securities and cash items) on an unconsolidated basis are comprised of assets that could be considered investment securities. Accordingly, we do not believe Blackstone Inc. is an inadvertent investment company by virtue of the 40% test in section 3(a)(1)(C) of the 1940 Act as described in clause (b) in the first sentence of this paragraph. In addition, we believe Blackstone Inc. is not an investment company under section 3(b)(1) of the 1940 Act because it is primarily engaged in a non-investment company business.
78
The 1940 Act and the rules thereunder contain detailed parameters for the organization and operation of investment companies. Among other things, the 1940 Act and the rules thereunder limit or prohibit transactions with affiliates, impose limitations on the issuance of debt and equity securities, generally prohibit the issuance of options and impose certain governance requirements. We intend to conduct our operations so that Blackstone Inc. will not be deemed to be an investment company under the 1940 Act. If anything were to happen which would cause Blackstone Inc. to be deemed to be an investment company under the 1940 Act, requirements imposed by the 1940 Act, including limitations on our capital structure, ability to transact business with affiliates (including us) and ability to compensate key employees, could make it impractical for us to continue our business as currently conducted, impair the agreements and arrangements between and among Blackstone Inc., Blackstone Holdings and our senior managing directors, or any combination thereof, and materially adversely affect our business, financial condition and results of operations. In addition, we may be required to limit the amount of investments that we make as a principal or otherwise conduct our business in a manner that does not subject us to the registration and other requirements of the 1940 Act.
Other anti-takeover provisions in our charter documents could delay or prevent a change in control.
In addition to the provisions described elsewhere relating to the Series II Preferred Stockholder’s control, other provisions in our certificate of incorporation and bylaws may discourage, delay or prevent a merger or acquisition that a stockholder may consider favorable by, for example:
|
•
|
permitting our board of directors to issue one or more series of preferred stock,
|
|
•
|
providing for the loss of voting rights for the common stock,
|
|
•
|
requiring advance notice for stockholder proposals and nominations if they are ever permitted by applicable law,
|
|
•
|
placing limitations on convening stockholder meetings,
|
|
•
|
prohibiting stockholder action by written consent unless such action is consent to by the Series II Preferred Stockholder and
|
|
•
|
imposing super-majority voting requirements for certain amendments to our certificate of incorporation.
|
These provisions may also discourage acquisition proposals or delay or prevent a change in control.
Risks Related to Our Common Stock
The price of our common stock may decline due to the large number of shares of common stock eligible for future sale and for exchange.
The market price of our common stock could decline as a result of sales of a large number of shares of common stock in the market in the future or the perception that such sales could occur. These sales, or the possibility that these sales may occur, also might make it more difficult for us to sell shares of common stock in the future at a time and at a price that we deem appropriate. We had a total of 714,644,445 shares of common stock outstanding as of February 16, 2024. Subject to the lock-up restrictions described below, we may issue and sell in the future additional shares of common stock. Limited partners of Blackstone Holdings owned an aggregate of 444,290,894 Blackstone Holdings Partnership Units outstanding as of February 16, 2024. In connection with our initial public offering, we entered into an exchange agreement with holders of Blackstone Holdings Partnership Units (other than Blackstone Inc.’s wholly owned subsidiaries) so that these holders, subject to the vesting and minimum retained ownership requirements and transfer restrictions set forth in the partnership agreements of the Blackstone Holdings Partnerships, may up to four times each year (subject to the terms of the exchange agreement) exchange their Blackstone Holdings Partnership Units for shares of Blackstone Inc. common stock on a one-for-one basis, subject to customary conversion rate adjustments for splits, unit distributions and reclassifications. A Blackstone Holdings limited partner must exchange one partnership unit in each of the
79
Blackstone Holdings Partnerships to effect an exchange for a share of common stock. The common stock we issue upon such exchanges would be “restricted securities,” as defined in Rule 144 under the Securities Act, unless we register such issuances. However, we have entered into a registration rights agreement with the limited partners of the Blackstone Holdings Partnerships that requires us to register these shares of common stock under the Securities Act and we have filed registration statements that cover the delivery of common stock issued upon exchange of Blackstone Holdings Partnership Units. See “Part III. Item 13. Certain Relationships and Related Transactions, and Director Independence — Transactions with Related Persons — Registration Rights Agreement.” While the partnership agreements of the Blackstone Holdings Partnerships and related agreements contractually restrict the ability of Blackstone personnel to transfer the Blackstone Holdings Partnership Units or Blackstone Inc. common stock they hold and require that they maintain a minimum amount of equity ownership during their employ by us, these contractual provisions may lapse over time or be waived, modified or amended at any time.
As of February 16, 2024, we had granted 45,460,914 outstanding deferred restricted shares of common stock and 13,235,560 outstanding deferred restricted Blackstone Holdings Partnership Units to our non-senior managing director professionals and senior managing directors under the Blackstone Inc. Amended and Restated 2007 Equity Incentive Plan (“2007 Equity Incentive Plan”). The aggregate number of shares of common stock and Blackstone Holdings Partnership Units (together, “Shares”) covered by our 2007 Equity Incentive Plan is increased on the first day of each fiscal year during its term by a number of Shares equal to the positive difference, if any, of (a) 15% of the aggregate number of Shares outstanding on the last day of the immediately preceding fiscal year (excluding Blackstone Holdings Partnership Units held by Blackstone Inc. or its wholly owned subsidiaries) minus (b) the aggregate number of Shares covered by our 2007 Equity Incentive Plan as of such date (unless the administrator of the 2007 Equity Incentive Plan should decide to increase the number of Shares covered by the plan by a lesser amount). An aggregate of 171,729,750 additional Shares were available for grant under our 2007 Equity Incentive Plan as of February 16, 2024. We have filed a registration statement and intend to file additional registration statements on Form S-8 under the Securities Act to register common stock covered by the 2007 Equity Incentive Plan (including pursuant to automatic annual increases). Any such Form S-8 registration statement will automatically become effective upon filing. Accordingly, common stock registered under such registration statement will be available for sale in the open market.
In addition, the Blackstone Holdings partnership agreements authorize the wholly owned subsidiaries of Blackstone Inc. which are the general partners of those partnerships to issue an unlimited number of additional partnership securities of the Blackstone Holdings Partnerships with such designations, preferences, rights, powers and duties that are different from, and may be senior to, those applicable to the Blackstone Holdings Partnership Units, and which may be exchangeable for our shares of common stock.
Our certificate of incorporation also provides us with a right to acquire all of the then outstanding shares of common stock under specified circumstances, which may adversely affect the price of our shares of common stock and the ability of holders of shares of common stock to participate in further growth in our stock price.
Our certificate of incorporation provides that, if at any time, less than 10% of the total shares of any class of our stock then outstanding (other than Series I preferred stock and Series II preferred stock) is held by persons other than the Series II Preferred Stockholder and its affiliates, we may exercise our right to call and purchase all of the then outstanding shares of common stock held by persons other than the Series II Preferred Stockholder or its affiliates or assign this right to the Series II Preferred Stockholder or any of its affiliates. As a result, a stockholder may have his or her shares of common stock purchased from him or her at an undesirable time or price and in a manner which adversely affects the ability of a stockholder to participate in further growth in our stock price.
80
Our amended and restated bylaws designate the Court of Chancery of the State of Delaware or the federal district courts of the United States of America, as applicable, as the sole and exclusive forum for certain types of actions and proceedings that may be initiated by our stockholders, which could limit our stockholders’ ability to obtain a favorable judicial forum for disputes with Blackstone or our directors, officers or other employees.
Our amended and restated bylaws provide that, unless we consent in writing to the selection of an alternative forum, the Court of Chancery of the State of Delaware will, to the fullest extent permitted by law, be the sole and exclusive forum for: (a) any derivative action or proceeding brought on our behalf, (b) any action asserting a breach of fiduciary duty owed by any of our current or former directors, officers, stockholders or employees to us or our stockholders, (c) any action asserting a claim against us arising under the Delaware General Corporation Law (the “DGCL”), our certificate of incorporation or our amended and restated bylaws or as to which the DGCL confers jurisdiction on the Court of Chancery of the State of Delaware, or (d) any action asserting a claim against us that is governed by the internal affairs doctrine.
Our amended and restated bylaws further provide that, unless we consent in writing to the selection of an alternative forum, to the fullest extent permitted by law, the federal district courts of the United States of America will be the exclusive forum for the resolution of any complaint asserting a cause of action arising under the federal securities laws of the United States, including, in each case, the applicable rules and regulations promulgated thereunder.
Any person or entity purchasing or otherwise acquiring any interest in any shares of our capital stock shall be deemed to have notice of and to have consented to the forum provision in our amended and restated bylaws. This choice-of-forum provision may limit a stockholder’s ability to bring a claim in a different judicial forum, including one that it may find favorable or convenient for a specified class of disputes with Blackstone or our directors, officers, other stockholders or employees, which may discourage such lawsuits. Alternatively, if a court were to find this provision of our amended and restated bylaws inapplicable or unenforceable with respect to one or more of the specified types of actions or proceedings, we may incur additional costs associated with resolving such matters in other jurisdictions, which could materially adversely affect our business, financial condition and results of operations and result in a diversion of the time and resources of our management and board of directors.
|
Item 1B.
|
Unresolved Staff Comments
|
None.
|
Item 1C.
|
Cybersecurity
|
Cybersecurity Risk Management and Strategy
Blackstone maintains a comprehensive cybersecurity program, including policies and procedures designed to protect our systems, operations and the data entrusted to us by our investors, employees, portfolio companies and business partners from anticipated threats or hazards. Blackstone utilizes a variety of protective measures as a part of its cybersecurity program. These measures include, where appropriate, physical and digital access controls, patch management, identity verification and mobile device management software, annual employee cybersecurity awareness and best practices training programs, security baselines and tools to report anomalous activity, and monitoring of data usage, hardware and software.
We test our cybersecurity defenses regularly through automated and manual vulnerability scanning, to identify and remediate critical vulnerabilities. In addition, we conduct annual “white hat” penetration tests to validate our security posture. We examine our cybersecurity program every two to three years with third parties, evaluating its effectiveness in part by considering industry standards and established frameworks, such as the National Institute of Standards and Technology and Center for Internet Security, as guidelines. Further, we engage in cyber incident tabletop exercises and scenario planning exercises involving hypothetical cybersecurity incidents
81
to test our cyber incident response processes. Our Chief Security Officer (the “CSO”) and members of senior management, Legal and Compliance, Technology and Innovations (“BXTI”) and Global Corporate Affairs participate in these exercises. Learnings from these tabletop exercises and any events we experience are reviewed, discussed and incorporated into our cybersecurity framework as appropriate.
In addition to our internal exercises to test aspects of our cybersecurity program, we periodically engage independent third parties to analyze data on the interactions of users of our information technology resources, including employees, and conduct penetration tests and scanning exercises to assess the performance of our cybersecurity systems and processes.
We have a comprehensive Security Incident Response Plan (the “IRP”) designed to inform the proper escalation of non-routine suspected or confirmed information security or cybersecurity events based on the expected risk an event presents. As appropriate, a Security Incident Response Team composed of individuals from several internal technical and managerial functions may be formed to investigate and remediate the event and determine the extent of external advisor support required, including from external counsel, forensic investigators, and/or law enforcement. The IRP sets out ongoing monitoring or remediating actions to be taken after resolution of an incident. The IRP is reviewed at least annually by our CSO and members of BXTI and Legal and Compliance.
Blackstone maintains a formal cybersecurity risk management process and cybersecurity risk register, designed to track cybersecurity risks at the firm, and integrates these processes into the firm’s overall risk management practices described above. Our CSO periodically discusses and reviews cybersecurity risks and related mitigants with our enterprise risk committee and incorporates relevant cybersecurity risk updates and metrics in the semi-annual enterprise-wide risk management report.
Blackstone has a process designed to assess, the cybersecurity risks associated with the engagement of third-party vendors. This assessment is conducted on the basis of, among other factors, the types of services provided and the extent and type of Blackstone data accessed or processed by a third-party vendor. On the basis of its preliminary risk assessment of a third-party vendor, Blackstone may conduct further cybersecurity reviews or request remediation of, or contractual protections related to, any actual or potential identified cybersecurity risks. In addition, where appropriate, Blackstone seeks to include in its contractual arrangements with certain of its third-party vendors provisions addressing best practices with respect to data and cybersecurity, as well as the right to assess, monitor, audit and test such vendors’ cybersecurity programs and practices. Blackstone also utilizes a number of digital controls, which are reviewed at least annually, to monitor and manage third-party access to its internal systems and data.
For a discussion of how risks from cybersecurity threats affect our business, see “Part 1. Item 1A. Risk Factors — Risk Related to our Business — Cybersecurity and data protection risks could result in the loss of data, interruptions in our business, and damage to our reputation, and subject us to regulatory actions, increased costs and financial losses, each of which could have a material adverse effect on our business and results of operations.” in this Annual Report on Form 10-K.
Cybersecurity Governance
Blackstone has a dedicated cybersecurity team, led by our CSO, who works closely with our senior management, including our Chief Technology Officer (“CTO”), to develop and advance the firm’s cybersecurity strategy.
Our CSO and CTO have extensive experience in cybersecurity and technology, respectively. Our CSO, Adam Fletcher, is a Senior Managing Director in BXTI and is responsible for all aspects of cyber and physical security across Blackstone. Prior to his appointment as CSO in 2017, Mr. Fletcher was Blackstone’s Deputy CSO. Before joining Blackstone in 2014, Mr. Fletcher led the International Security organization for Equifax from 2012 to 2014. Mr. Fletcher received a B.S. in Operations Research and Industrial Engineering from Cornell University.
82
Our CTO, John Stecher is a Senior Managing Director and head of BXTI. Mr. Stecher is responsible for all aspects of technology across Blackstone. Mr. Stecher also advises our investment teams and acts as a resource to portfolio companies on technology-related matters. Before joining Blackstone in 2020, Mr. Stecher was a Managing Director and the Chief Technology Officer and Chief Innovation Officer at Barclays. He was also a member of the Barclays Technology Management Committee. Prior to joining Barclays in 2017, Mr. Stecher held a variety of senior management and engineering roles across Goldman Sachs’ capital markets and technology divisions. Mr. Stecher received a B.S. in Computer Science from the University of Wisconsin — Madison and a M.S. in Computer Science from the University of Minnesota.
BXTI conducts periodic cybersecurity risk assessments, including assessments or audits of third-party vendors, and assists with the management and mitigation of identified cybersecurity risks. The CSO and CTO review Blackstone’s cybersecurity framework annually as well as on an event-driven basis as necessary. The CSO and CTO also review the scope of our cybersecurity measures periodically, including in the event of a change in business practices that may implicate the security or integrity of our information and systems.
Blackstone’s board of directors is responsible for understanding the primary risks to our business. The audit committee of our board of directors is responsible for reviewing with management the areas of material risk to our operations and financial results (including, without limitation, applicable major financial and cybersecurity risks and exposures) and our guidelines and policies with respect to risk assessment and risk management. Blackstone’s CSO reports to the board of directors and the audit committee of the board of directors at least annually on cybersecurity matters, including risks. These reports also include, as applicable, an overview of cybersecurity incidents. Additionally, the CSO provides quarterly updates to management on Blackstone’s cybersecurity risks and program developments.
|
Item 2.
|
Properties
|
Our principal executive offices are located in leased office space at 345 Park Avenue, New York, New York. As of December 31, 2023, in addition to our offices in New York, we also leased offices in Hong Kong, London, Miami, San Francisco, Singapore, Tokyo and other cities around the world. We consider these facilities to be suitable and adequate for the management and operations of our business.
|
Item 3.
|
Legal Proceedings
|
We may from time to time be involved in litigation and claims incidental to the conduct of our business. Our businesses are also subject to extensive regulation, which may result in regulatory proceedings against us. See “— Item 1A. Risk Factors” above. We are not currently subject to any pending legal (including judicial, regulatory, administrative or arbitration) proceedings that we expect to have a material impact on our consolidated financial statements. However, given the inherent unpredictability of these types of proceedings and the potentially large and/or indeterminate amounts that could be sought, an adverse outcome in certain matters could have a material effect on Blackstone’s financial results in any particular period. See “Part II. Item 8. Financial Statements and Supplementary Data — Notes to Consolidated Financial Statements — Note 19. Commitments and Contingencies — Contingencies — Litigation.”
|
Item 4.
|
Mine Safety Disclosures
|
Not applicable.
83
Part II.
|
Item 5.
|
Market for Registrant’s Common Equity, Related Stockholder Matters and Issuer Purchases of Equity Securities
|
Our common stock is traded on the New York Stock Exchange (“NYSE”) under the symbol “BX.”
The number of holders of record of our common stock as of February 16, 2024 was 65. This does not include the number of stockholders that hold shares in “street name” through banks or broker-dealers. Blackstone Partners L.L.C. is the sole holder of the single share of Series I preferred stock outstanding and Blackstone Group Management L.L.C. is the sole holder of the single share of Series II preferred stock outstanding.
The following table sets forth the quarterly per share dividends earned for the periods indicated. Each quarter’s dividends are declared and paid in the following quarter.
|
2023
|
2022
|
|||||||
|
First Quarter
|
$
|
0.82
|
|
$
|
1.32
|
|
||
|
Second Quarter
|
|
0.79
|
|
|
1.27
|
|
||
|
Third Quarter
|
|
0.80
|
|
|
0.90
|
|
||
|
Fourth Quarter
|
|
0.94
|
|
|
0.91
|
|
||
|
|
|
|
|
|||||
|
$
|
3.35
|
|
$
|
4.40
|
|
|||
|
|
|
|
|
|||||
Dividend Policy
Our intention is to pay to holders of common stock a quarterly dividend representing approximately 85% of Blackstone Inc.’s share of Distributable Earnings, subject to adjustment by amounts determined by our board of directors to be necessary or appropriate to provide for the conduct of our business, to make appropriate investments in our business and funds, to comply with applicable law, any of our debt instruments or other agreements, or to provide for future cash requirements such as tax-related payments, clawback obligations and dividends to stockholders for any ensuing quarter. The dividend amount could also be adjusted upward in any one quarter.
For Blackstone’s definition of Distributable Earnings, see “— Item 7. Management’s Discussion and Analysis of Financial Condition and Results of Operations — Key Financial Measures and Indicators.”
All of the foregoing is subject to the qualification that the declaration and payment of any dividends are at the sole discretion of our board of directors and our board of directors may change our dividend policy at any time, including, without limitation, to reduce such quarterly dividends or even to eliminate such dividends entirely.
Because Blackstone Inc. is a holding company and has no material assets, other than its ownership of partnership units in Blackstone Holdings (held through wholly owned subsidiaries), intercompany loans receivable and deferred tax assets, we fund any dividends by Blackstone Inc. by causing Blackstone Holdings to make distributions to its partners, including Blackstone Inc. (through its wholly owned subsidiaries). If Blackstone Holdings makes such distributions, the limited partners of Blackstone Holdings will be entitled to receive equivalent distributions pro-rata based on their partnership interests in Blackstone Holdings. Blackstone Inc. then dividends its share of such distributions, net of taxes and amounts payable under the tax receivable agreements, to our stockholders on a pro-rata basis.
Because the publicly traded entity and/or its wholly owned subsidiaries must pay taxes and make payments under the tax receivable agreements described in “— Item 8. Financial Statements and Supplementary Data — Notes to Consolidated Financial Statements — Note 18. Related Party Transactions,” the amounts ultimately paid as dividends by Blackstone Inc. to common stockholders in respect of each fiscal year are generally expected to be
84
less, on a per share or per unit basis, than the amounts distributed by the Blackstone Holdings Partnerships to the Blackstone personnel and others who are limited partners of the Blackstone Holdings Partnerships in respect of their Blackstone Holdings Partnership Units. Following Blackstone’s conversion from a limited partnership to a corporation, we expect to pay more corporate income taxes than we would have as a limited partnership, which will increase this difference between the per share dividend and per unit distribution amounts.
Dividends are treated as qualified dividends to the extent of Blackstone’s current and accumulated earnings and profits, with any excess dividends treated as a return of capital to the extent of the stockholder’s basis.
In addition, the partnership agreements of the Blackstone Holdings Partnerships provide for cash distributions, which we refer to as “tax distributions,” to the partners of such partnerships if the wholly owned subsidiaries of Blackstone Inc. which are the general partners of the Blackstone Holdings Partnerships determine that the taxable income of the relevant partnership will give rise to taxable income for its partners. Generally, these tax distributions will be computed based on our estimate of the net taxable income of the relevant partnership allocable to a partner multiplied by an assumed tax rate equal to the highest effective marginal combined U.S. federal, state and local income tax rate prescribed for an individual or corporate resident in New York, New York (taking into account the non-deductibility of certain expenses and the character of our income). The Blackstone Holdings Partnerships will make tax distributions only to the extent distributions from such partnerships for the relevant year were otherwise insufficient to cover such estimated assumed tax liabilities.
Share Repurchases in the Fourth Quarter of 2023
The following table sets forth information regarding repurchases of shares of our common stock during the quarter ended December 31, 2023:
|
Period
|
Total Number
of Shares
Purchased
|
Average
Price Paid
per Share
|
Total Number of Shares
Purchased as Part of
Publicly Announced
Plans or Programs (a)
|
Approximate Dollar
Value of Shares that
May Yet Be Purchased
Under the Program
(Dollars in Thousands) (a)
|
||||||||||||
|
Oct. 1 - Oct. 31, 2023
|
|
—
|
|
$
|
—
|
|
|
—
|
|
$
|
797,628
|
|
||||
|
Nov. 1 - Nov. 30, 2023
|
|
399,994
|
|
$
|
102.15
|
|
|
399,994
|
|
$
|
756,769
|
|
||||
|
Dec. 1 - Dec. 31, 2023
|
|
—
|
|
$
|
—
|
|
|
—
|
|
$
|
756,769
|
|
||||
|
|
|
|
|
|
|
|||||||||||
|
|
399,994
|
|
|
399,994
|
|
|||||||||||
|
|
|
|
|
|
|
|||||||||||
|
(a)
|
On December 7, 2021, Blackstone’s board of directors authorized the repurchase of up to $2.0 billion of common stock and Blackstone Holdings Partnership Units. Under the repurchase program, repurchases may be made from time to time in open market transactions, in privately negotiated transactions or otherwise. The timing and the actual numbers repurchased will depend on a variety of factors, including legal requirements, price and economic and market conditions. The repurchase program may be changed, suspended or discontinued at any time and does not have a specified expiration date. See “— Item 8. Financial Statements and Supplementary Data — Notes to Consolidated Financial Statements — Note 16. Earnings Per Share and Stockholders’ Equity — Share Repurchase Program” and “— Item 7. Management’s Discussion and Analysis of Financial Condition and Results of Operations — Liquidity and Capital Resources — Share Repurchase Program” for further information regarding this repurchase program.
|
As permitted by our policies and procedures governing transactions in our securities by our directors, executive officers and other employees, from time to time some of these persons may establish plans or arrangements complying with Rule 10b5-1 under the Exchange Act, and similar plans and arrangements relating to our shares and Blackstone Holdings Partnership Units.
85
|
Item 6.
|
(Reserved)
|
|
Item 7.
|
Management’s Discussion and Analysis of Financial Condition and Results of Operations
|
The following discussion and analysis should be read in conjunction with Blackstone Inc.’s consolidated financial statements and the related notes included within this Annual Report on Form 10-K.
This section of this Form 10-K generally discusses 2023 and 2022 items and year to year comparisons between 2023 and 2022.
For the discussion of 2022 compared to 2021
see “Part II. Item 7. Management’s Discussion and Analysis of Financial Condition and Results of Operations” of Blackstone’s Annual Report on Form 10-K for the year ended December 31, 2022, which specific discussion is incorporated herein by reference.
Our Business
Blackstone is the world’s largest alternative asset manager. Our business is organized into four segments: Real Estate, Private Equity, Credit & Insurance and Hedge Fund Solutions. For more information about our business segments, see “Part I. Item 1. Business — Business Segments.”
We generate revenue primarily from fees earned pursuant to contractual arrangements with funds and investors, and capital markets services. We also invest in the funds we manage and we are entitled to a pro-rata share of the income of the fund (a “pro-rata allocation”). In addition to a pro-rata allocation, and assuming certain investment returns are achieved, we are entitled to a disproportionate allocation of the income otherwise allocable to the limited partners, commonly referred to as carried interest (“Performance Allocations”). In certain structures, we receive a contractual incentive fee from an investment fund based on achieving certain investment returns (an “Incentive Fee,” and together with Performance Allocations, “Performance Revenues”). The composition of our revenues will vary based on market conditions and the cyclicality of the different businesses in which we operate. Net investment gains and investment income generated by the Blackstone Funds are driven by the performance of the underlying investments as well as overall market conditions. Fair values are affected by changes in the fundamentals of our investments, the industries in which they operate, the overall economy and other market conditions.
Business Environment
Blackstone’s businesses are materially affected by conditions in the financial markets and economic conditions in the U.S., Europe, Asia and, to a lesser extent, elsewhere in the world.
2023 was a volatile year for global markets, driven by historic movements in U.S. Treasury bond yields, geopolitical instability, including in the Middle East and economic uncertainty. Major central banks globally continued monetary policy tightening in the context of historically elevated inflation. In the U.S., the Federal Reserve increased the federal funds target range four times over the course of 2023, which reached 5.25%-5.50% in July — the highest level in 22 years. Accordingly, inflation in the U.S. decelerated throughout the year, with the U.S. consumer price index decreasing from 6.4% annual growth in January 2023 to 3.4% in December 2023, at which time the Federal Reserve signaled that a reduction in the federal funds target range could be appropriate in 2024. Similarly, in the Eurozone economy, the European Central bank raised its deposit facility rate by 200 basis points in 2023. Consequently, Eurozone inflation slowed from 8.6% annual growth in January 2023 to 2.9% at year end.
Nevertheless, the U.S. economy continued to show resiliency in 2023, underpinned by a strong labor market. The Bureau of Economic Analysis’ advance estimate of U.S. real GDP indicated growth of 2.5% year-over-year in 2023, up from 1.9% in 2022. The U.S. unemployment rate remained largely stable with pre-pandemic levels at 3.7% in both December 2023 and subsequent to year end in January 2024. U.S. retail sales increased 3.2% year-over-year in 2023, driven in part by higher prices. In manufacturing, however, the Institute for Supply Management
86
Purchasing Managers’ Index decreased moderately to 47.4 in December 2023, compared to 48.4 in December 2022, signaling a continued contraction in the U.S. manufacturing sector. Growth in major economies outside of the U.S. was mixed in 2023. In Europe, Eurozone real GDP growth contracted to 0.1% year-over-year in the fourth quarter from 1.8% in the fourth quarter of 2022. In China, real GDP growth increased to 5.2% year over year in 2023, up from 3% in 2022, but below the yearly average of 6% over the last ten years.
In the fourth quarter of 2023, major equity markets rallied sharply on increasing expectations that the current cycle of monetary policy tightening was at or nearing its end. The S&P 500 rose 12% in the fourth quarter and increased 26% for the full year. Most sectors gained during the year, led by information technology, which rose 58%. Oil prices declined during the year, with the price of West Texas Intermediate crude oil down 11% in 2023 to $72 per barrel. The Henry Hub Natural Gas spot price decreased 44% in 2023 to $2.51. Capital markets activity declined, with global initial public offering volumes down 31% and global announced merger and acquisition volumes down 16% compared to 2022.
In credit markets, the S&P leveraged loan index increased 13% in 2023, while the Credit Suisse high yield bond index rose 14%. High yield spreads tightened 135 basis points in 2023, while issuance increased 64% year-over-year. Base rates were highly volatile during the year, with the ten-year Treasury yield increasing 114 basis points from the beginning of 2023 to an intraday high of 5.02% in October — representing a 16-year high — but ended the year lower at 3.88%. Short-term rates, however, increased in 2023 with three-month SOFR up 74 basis points to 5.33% at year end.
Moderating inflation and economic resiliency in the U.S. have led to an increase in investor confidence in recent months. However, the potential for sustained high interest rates and decelerating economic growth may contribute to continued market volatility in the U.S. and globally.
Notable Transactions
On December 15, 2023, Blackstone entered into an amended and restated $4.325 billion revolving credit facility. The amendment and restatement, among other things, increased the amount of available borrowings and extended the maturity date to December 15, 2028.
For additional information see Note 13. “Borrowings” in the “Notes to Consolidated Financial Statements” in “— Item 8. Financial Statements and Supplementary Data.”
87
Organizational Structure
The simplified diagram below depicts our current organizational structure. The diagram does not depict all of our subsidiaries, including intermediate holding companies through which certain of the subsidiaries depicted are held.

Key Financial Measures and Indicators
We manage our business using certain financial measures and key operating metrics since we believe these metrics measure the productivity of our investment activities. We prepare our Consolidated Financial Statements in accordance with accounting principles generally accepted in the United States of America (“GAAP”). See “— Item 8. Financial Statements and Supplementary Data — Notes to Consolidated Financial Statements — Note 2. Summary of Significant Accounting Policies” and “— Critical Accounting Policies.” Our key non-GAAP financial measures and operating indicators and metrics are discussed below.
Distributable Earnings
Distributable Earnings is derived from Blackstone’s segment reported results. Distributable Earnings is used to assess performance and amounts available for dividends to Blackstone stockholders, including Blackstone personnel and others who are limited partners of the Blackstone Holdings Partnerships. Distributable Earnings is the sum of Segment Distributable Earnings plus Net Interest and Dividend Income (Loss) less Taxes and Related Payables. Distributable Earnings excludes unrealized activity and is derived from and reconciled to, but not equivalent to, its most directly comparable GAAP measure of Income (Loss) Before Provision (Benefit) for Taxes. See “— Non-GAAP Financial Measures” for our reconciliation of Distributable Earnings.
88
Net Interest and Dividend Income (Loss) is presented on a segment basis and is equal to Interest and Dividend Revenue less Interest Expense, adjusted for the impact of consolidation of Blackstone Funds, and interest expense associated with the Tax Receivable Agreement.
Taxes and Related Payables represent the total GAAP tax provision adjusted to include only the current tax provision (benefit) calculated on Income (Loss) Before Provision (Benefit) for Taxes and including the Payable under the Tax Receivable Agreement. Further, the current tax provision utilized when calculating Taxes and Related Payables and Distributable Earnings reflects the benefit of deductions available to the company on certain expense items that are excluded from the underlying calculation of Segment Distributable Earnings and Total Segment Distributable Earnings, such as equity-based compensation charges and certain Transaction-Related and Non-Recurring Items where there is a current tax provision or benefit. The economic assumptions and methodologies that impact the implied income tax provision are the same as those methodologies and assumptions used in calculating the current income tax provision for Blackstone’s Consolidated Statements of Operations under GAAP, excluding the impact of divestitures and accrued tax contingencies and refunds which are reflected when paid or received. Management believes that including the amount payable under the Tax Receivable Agreement and utilizing the current income tax provision adjusted as described above when calculating Distributable Earnings is meaningful as it increases comparability between periods and more accurately reflects earnings that are available for distribution to stockholders.
Segment Distributable Earnings
Segment Distributable Earnings is Blackstone’s segment profitability measure used to make operating decisions and assess performance across Blackstone’s four segments. Blackstone believes it is useful to stockholders to review the measure that management uses in assessing segment performance. Segment Distributable Earnings represents the net realized earnings of Blackstone’s segments and is the sum of Fee Related Earnings and Net Realizations for each segment. Blackstone’s segments are presented on a basis that deconsolidates Blackstone Funds, eliminates non-controlling ownership interests in Blackstone’s consolidated operating partnerships, removes the amortization of intangible assets and removes Transaction-Related and Non-Recurring Items. Transaction-Related and Non-Recurring Items arise from corporate actions including acquisitions, divestitures, Blackstone’s initial public offering and non-recurring gains, losses, or other charges, if any. They consist primarily of equity-based compensation charges, gains and losses on contingent consideration arrangements, changes in the balance of the Tax Receivable Agreement resulting from a change in tax law or similar event, transaction costs, gains or losses associated with these corporate actions and non-recurring gains, losses or other charges that affect period-to-period comparability and are not reflective of Blackstone’s operational performance. Segment Distributable Earnings excludes unrealized activity and is derived from and reconciled to, but not equivalent to, its most directly comparable GAAP measure of Income (Loss) Before Provision (Benefit) for Taxes. See “— Non-GAAP Financial Measures” for our reconciliation of Segment Distributable Earnings.
Effective September 30, 2023, Blackstone redefined Segment Distributable Earnings to exclude the impact of non-recurring gains, losses or other charges that affect period-to-period comparability and are not reflective of Blackstone’s operational performance. Blackstone believes the exclusion of such amounts is useful to investors as it assists in the comparison of Blackstone’s operational performance across different periods. The updated definition had no impact to the current or any previously reported period.
Net Realizations is presented on a segment basis and is the sum of Realized Principal Investment Income and Realized Performance Revenues (which refers to Realized Performance Revenues excluding Fee Related Performance Revenues), less Realized Performance Compensation (which refers to Realized Performance Compensation excluding Fee Related Performance Compensation and Equity-Based Performance Compensation).
89
Realized Performance Compensation reflects an increase in the aggregate Realized Performance Compensation paid to certain of our professionals above the amounts allocable to them based upon the percentage participation in the relevant performance plans previously awarded to them. In the year ended December 31, 2023, Realized Performance Compensation was increased by an aggregate of $65.0 million and Fee Related Compensation was decreased by a corresponding amount. In the year ended December 31, 2022, Realized Performance Compensation was increased by an aggregate of $77.0 million and Fee Related Compensation decreased by a corresponding amount. These changes to Realized Performance Compensation and Fee Related Compensation reduced Net Realizations, increased Fee Related Earnings and had a neutral impact to Income Before Provision (Benefit) for Taxes and Distributable Earnings in the years ended December 31, 2023 and December 31, 2022.
Fee Related Earnings
Fee Related Earnings is a performance measure used to assess Blackstone’s ability to generate profits from revenues that are measured and received on a recurring basis and not subject to future realization events. Blackstone believes Fee Related Earnings is useful to stockholders as it provides insight into the profitability of the portion of Blackstone’s business that is not dependent on realization activity. Fee Related Earnings equals management and advisory fees (net of management fee reductions and offsets) plus Fee Related Performance Revenues, less (a) Fee Related Compensation on a segment basis and (b) Other Operating Expenses. Fee Related Earnings is derived from and reconciled to, but not equivalent to, its most directly comparable GAAP measure of Income (Loss) Before Provision (Benefit) for Taxes. See “— Non-GAAP Financial Measures” for our reconciliation of Fee Related Earnings.
Fee Related Compensation is presented on a segment basis and refers to the compensation expense, excluding Equity-Based Compensation, directly related to (a) Management and Advisory Fees, Net and (b) Fee Related Performance Revenues, referred to as Fee Related Performance Compensation.
Fee Related Performance Revenues refers to the realized portion of Performance Revenues from Perpetual Capital that are (a) measured and received on a recurring basis and (b) not dependent on realization events from the underlying investments.
Other Operating Expenses is presented on a segment basis and is equal to General, Administrative and Other Expenses, adjusted to (a) remove the amortization of transaction-related intangibles, (b) remove certain expenses reimbursed by the Blackstone Funds which are netted against Management and Advisory Fees, Net in Blackstone’s segment presentation and (c) give effect to an administrative fee collected on a quarterly basis from certain holders of Blackstone Holdings Partnership Units. The administrative fee is accounted for as a capital contribution under GAAP, but is reflected as a reduction of Other Operating Expenses in Blackstone’s segment presentation.
Adjusted Earnings Before Interest, Taxes and Depreciation and Amortization
Adjusted Earnings Before Interest, Taxes and Depreciation and Amortization (“Adjusted EBITDA”), is a supplemental measure used to assess performance derived from Blackstone’s segment results and may be used to assess its ability to service its borrowings. Adjusted EBITDA represents Distributable Earnings plus the addition of (a) Interest Expense on a segment basis, (b) Taxes and Related Payables and (c) Depreciation and Amortization. Adjusted EBITDA is derived from and reconciled to, but not equivalent to, its most directly comparable GAAP measure of Income (Loss) Before Provision (Benefit) for Taxes. See “— Non-GAAP Financial Measures” for our reconciliation of Adjusted EBITDA.
90
Net Accrued Performance Revenues
Net Accrued Performance Revenues is a non-GAAP financial measure Blackstone believes is useful to stockholders as an indicator of potential future realized performance revenues based on the current investment portfolio of the funds and vehicles we manage. Net Accrued Performance Revenues represents the accrued performance revenues receivable by Blackstone, net of the related accrued performance compensation payable by Blackstone, excluding performance revenues that have been realized but not yet distributed as of the reporting date and clawback amounts, if any. Net Accrued Performance Revenues is derived from and reconciled to, but not equivalent to, its most directly comparable GAAP measure of Investments. See “— Non-GAAP Financial Measures” for our reconciliation of Net Accrued Performance Revenues and Note 2 “Summary of Significant Accounting Policies — Equity Method Investments” in the “Notes to Consolidated Financial Statements” in “— Item 8. Financial Statements and Supplementary Data” for additional information on the calculation of Investments — Accrued Performance Allocations.
Operating Metrics
The alternative asset management business is primarily based on managing third party capital and does not require substantial capital investment to support rapid growth. Since our inception, we have developed and used various key operating metrics to assess and monitor the operating performance of our various alternative asset management businesses in order to monitor the effectiveness of our value creating strategies.
Total and Fee-Earning Assets Under Management
Total Assets Under Management refers to the assets we manage. We believe this measure is useful to stockholders as it represents the total capital for which we provide investment management services. Our Total Assets Under Management equals the sum of:
|
(a)
|
the fair value of the investments held by our carry funds and our side-by-side and co-investment entities managed by us plus the capital that we are entitled to call from investors in those funds and entities pursuant to the terms of their respective capital commitments, including capital commitments to funds that have yet to commence their investment periods,
|
|
(b)
|
the net asset value of (1) our hedge funds, real estate debt carry funds, BPP, certain co-investments managed by us, certain credit-focused funds and our Hedge Fund Solutions drawdown funds (plus, in each case, the capital that we are entitled to call from investors in those funds, including commitments yet to commence their investment periods) and (2) our funds of hedge funds, our Hedge Fund Solutions registered investment companies, BREIT and BEPIF,
|
|
(c)
|
the invested capital, fair value or net asset value of assets we manage pursuant to separately managed accounts,
|
|
(d)
|
the amount of debt and equity outstanding for our CLOs during the reinvestment period,
|
|
(e)
|
the aggregate par amount of collateral assets, including principal cash, for our CLOs after the reinvestment period,
|
|
(f)
|
the gross or net amount of assets (including leverage where applicable) for our credit-focused registered investment companies and BDCs,
|
|
(g)
|
the fair value of common stock, preferred stock, convertible debt, term loans or similar instruments issued by BXMT and
|
|
(h)
|
borrowings under and any amounts available to be borrowed under certain credit facilities of our funds.
|
Our carry funds are commitment-based drawdown structured funds that do not permit investors to redeem their interests at their election. Our funds of hedge funds, hedge funds, funds structured like hedge funds and other open-ended funds in our Real Estate, Credit & Insurance and Hedge Fund Solutions segments generally have structures that afford an investor the right to withdraw or redeem their interests on a periodic basis (for example, annually, quarterly or monthly), typically with 2 to 95 days’ notice, depending on the fund and the liquidity profile of the underlying assets. In our Perpetual Capital vehicles where redemption rights exist, Blackstone has the ability
91
to fulfill redemption requests only (a) in Blackstone’s or the vehicles’ board’s discretion, as applicable, or (b) to the extent there is sufficient new capital. Investment advisory agreements related to certain separately managed accounts in our Credit & Insurance and Hedge Fund Solutions segments, excluding our separately managed accounts in our insurance platform, may generally be terminated by an investor on 30 to 90 days’ notice. Separately managed accounts in our insurance platform can generally only be terminated for long-term underperformance, cause and certain other limited circumstances, in each case subject to Blackstone’s right to cure.
Fee-Earning Assets Under Management refers to the assets we manage on which we derive management fees and/or performance revenues. We believe this measure is useful to stockholders as it provides insight into the capital base upon which we can earn management fees and/or performance revenues. Our Fee-Earning Assets Under Management equals the sum of:
|
(a)
|
for our Private Equity segment funds, Real Estate segment carry funds including certain BREDS funds and certain Hedge Fund Solutions funds, the amount of capital commitments, remaining invested capital, fair value, net asset value or par value of assets held, depending on the fee terms of the fund,
|
|
(b)
|
for our credit-focused carry funds, the amount of remaining invested capital (which may include leverage) or net asset value, depending on the fee terms of the fund,
|
|
(c)
|
the remaining invested capital or fair value of assets held in co-investment vehicles managed by us on which we receive fees,
|
|
(d)
|
the net asset value of our funds of hedge funds, hedge funds, BPP, certain co-investments managed by us, certain registered investment companies, BREIT, BEPIF and certain of our Hedge Fund Solutions drawdown funds,
|
|
(e)
|
the invested capital, fair value of assets or the net asset value we manage pursuant to separately managed accounts,
|
|
(f)
|
the net proceeds received from equity offerings and accumulated distributable earnings of BXMT, subject to certain adjustments,
|
|
(g)
|
the aggregate par amount of collateral assets, including principal cash, of our CLOs and
|
|
(h)
|
the gross amount of assets (including leverage) or the net assets (plus leverage where applicable) for certain of our credit-focused registered investment companies and BDCs.
|
Each of our segments may include certain Fee-Earning Assets Under Management on which we earn performance revenues but not management fees.
Our calculations of Total Assets Under Management and Fee-Earning Assets Under Management may differ from the calculations of other asset managers, and as a result this measure may not be comparable to similar measures presented by other asset managers. In addition, our calculation of Total Assets Under Management includes commitments to, and the fair value of, invested capital in our funds from Blackstone and our personnel, regardless of whether such commitments or invested capital are subject to fees. Our definitions of Total Assets Under Management and Fee-Earning Assets Under Management are not based on any definition of Total Assets Under Management and Fee-Earning Assets Under Management that is set forth in the agreements governing the investment funds that we manage.
For our carry funds, Total Assets Under Management includes the fair value of the investments held and uncalled capital commitments, whereas Fee-Earning Assets Under Management may include the total amount of capital commitments or the remaining amount of invested capital at cost depending on whether the investment period has expired or as specified by the fee terms of the fund. As such, in certain carry funds Fee-Earning Assets Under Management may be greater than Total Assets Under Management when the aggregate fair value of the remaining investments is less than the cost of those investments.
92
Perpetual Capital
Perpetual Capital refers to the component of assets under management with an indefinite term, that is not in liquidation, and for which there is no requirement to return capital to investors through redemption requests in the ordinary course of business, except where funded by new capital inflows. Perpetual Capital includes co-investment capital with an investor right to convert into Perpetual Capital. We believe this measure is useful to stockholders as it represents capital we manage that has a longer duration and the ability to generate recurring revenues in a different manner than traditional fund structures.
Dry Powder
Dry Powder represents the amount of capital available for investment or reinvestment, including general partner and employee capital, and is an indicator of the capital we have available for future investments. We believe this measure is useful to stockholders as it provides insight into the extent to which capital is available for Blackstone to deploy capital into investment opportunities as they arise.
Invested Performance Eligible Assets Under Management
Invested Performance Eligible Assets Under Management represents invested capital at fair value, including capital closed for funds whose investment period has not yet commenced, on which performance revenues could be earned if certain hurdles are met. We believe Invested Performance Eligible Assets Under Management is useful to stockholders as it provides insight into the capital deployed that has the potential to generate performance revenues.
Recent Tax Developments
On October 8, 2021, the OECD and Group of 20 (“G20”) announced the OECD/G20 Inclusive Framework on Base Erosion and Profit Shifting (“Framework”), which agreed to a two-pillar solution to address tax challenges arising from digitalization of the economy. On December 20, 2021, the OECD released Pillar Two Model Rules, which contemplate a global 15% minimum tax rate. The OECD continues to release additional guidance, including administrative guidance on interpretation and application of Pillar Two, and many countries are passing legislation to comply with Pillar Two. The Framework calls for law enactment by OECD and G20 members to take effect in 2024 and 2025. The changes contemplated by Pillar Two, when enacted by various countries in which we do business, may increase our taxes in such countries. Based on available guidance, currently we do not believe the impact of Pillar Two to our business would be material. For further discussion of potential consequences of changes in tax regulations, please see “— Item 1A. Risk Factors — Risks Related to our Business — Changes in U.S. and foreign taxation of businesses and other tax laws, regulations or treaties or an adverse interpretation of these items by tax authorities could adversely affect us, including by adversely impacting our effective tax rate and tax liability.”
Consolidated Results of Operations
Following is a discussion of our consolidated results of operations. For a more detailed discussion of the factors that affected the results of our four business segments (which are presented on a basis that deconsolidates the investment funds, eliminates non-controlling ownership interests in Blackstone’s consolidated operating partnerships and removes the amortization of intangibles assets and Transaction-Related and Non-Recurring Items) in these periods, see “— Segment Analysis” below.
93
The following table sets forth information regarding our consolidated results of operations and certain key operating metrics for the years ended December 31, 2023, 2022 and 2021:
|
Year Ended December 31,
|
2023 vs. 2022
|
2022 vs. 2021
|
||||||||||||||||||||||||||
|
2023
|
2022
|
2021
|
$
|
%
|
$
|
%
|
||||||||||||||||||||||
|
(Dollars in Thousands)
|
||||||||||||||||||||||||||||
|
Revenues
|
||||||||||||||||||||||||||||
|
Management and Advisory Fees, Net
|
$
|
6,671,260
|
|
$
|
6,303,315
|
|
$
|
5,170,707
|
|
$
|
367,945
|
|
|
6%
|
|
$
|
1,132,608
|
|
|
22%
|
|
|||||||
|
|
|
|
|
|
|
|
|
|
|
|
|
|
|
|
|
|
|
|
|
|
||||||||
|
Incentive Fees
|
|
695,171
|
|
|
525,127
|
|
|
253,991
|
|
|
170,044
|
|
|
32%
|
|
|
271,136
|
|
|
107%
|
|
|||||||
|
|
|
|
|
|
|
|
|
|
|
|
|
|
|
|
|
|
|
|
|
|
||||||||
|
Investment Income (Loss)
|
||||||||||||||||||||||||||||
|
Performance Allocations
|
||||||||||||||||||||||||||||
|
Realized
|
|
2,223,841
|
|
|
5,381,640
|
|
|
5,653,452
|
|
|
(3,157,799
|
)
|
|
-59%
|
|
|
(271,812
|
)
|
|
-5%
|
|
|||||||
|
Unrealized
|
|
(1,691,668
|
)
|
|
(3,435,056
|
)
|
|
8,675,246
|
|
|
1,743,388
|
|
|
-51%
|
|
|
(12,110,302
|
)
|
|
n/m
|
|
|||||||
|
Principal Investments
|
||||||||||||||||||||||||||||
|
Realized
|
|
303,823
|
|
|
850,327
|
|
|
1,003,822
|
|
|
(546,504
|
)
|
|
-64%
|
|
|
(153,495
|
)
|
|
-15%
|
|
|||||||
|
Unrealized
|
|
(603,154
|
)
|
|
(1,563,849
|
)
|
|
1,456,201
|
|
|
960,695
|
|
|
-61%
|
|
|
(3,020,050
|
)
|
|
n/m
|
|
|||||||
|
|
|
|
|
|
|
|
|
|
|
|
|
|
|
|
|
|
|
|
|
|
||||||||
|
Total Investment Income
|
|
232,842
|
|
|
1,233,062
|
|
|
16,788,721
|
|
|
(1,000,220
|
)
|
|
-81%
|
|
|
(15,555,659
|
)
|
|
-93%
|
|
|||||||
|
|
|
|
|
|
|
|
|
|
|
|
|
|
|
|
|
|
|
|
|
|
||||||||
|
Interest and Dividend Revenue
|
|
516,497
|
|
|
271,612
|
|
|
160,643
|
|
|
244,885
|
|
|
90%
|
|
|
110,969
|
|
|
69%
|
|
|||||||
|
Other
|
|
(92,929
|
)
|
|
184,557
|
|
|
203,086
|
|
|
(277,486
|
)
|
|
n/m
|
|
|
(18,529
|
)
|
|
-9%
|
|
|||||||
|
|
|
|
|
|
|
|
|
|
|
|
|
|
|
|
|
|
|
|
|
|
||||||||
|
Total Revenues
|
|
8,022,841
|
|
|
8,517,673
|
|
|
22,577,148
|
|
|
(494,832
|
)
|
|
-6%
|
|
|
(14,059,475
|
)
|
|
-62%
|
|
|||||||
|
|
|
|
|
|
|
|
|
|
|
|
|
|
|
|
|
|
|
|
|
|
||||||||
|
Expenses
|
||||||||||||||||||||||||||||
|
Compensation and Benefits
|
||||||||||||||||||||||||||||
|
Compensation
|
|
2,785,447
|
|
|
2,569,780
|
|
|
2,161,973
|
|
|
215,667
|
|
|
8%
|
|
|
407,807
|
|
|
19%
|
|
|||||||
|
Incentive Fee Compensation
|
|
281,067
|
|
|
207,998
|
|
|
98,112
|
|
|
73,069
|
|
|
35%
|
|
|
109,886
|
|
|
112%
|
|
|||||||
|
Performance Allocations Compensation
|
||||||||||||||||||||||||||||
|
Realized
|
|
900,859
|
|
|
2,225,264
|
|
|
2,311,993
|
|
|
(1,324,405
|
)
|
|
-60%
|
|
|
(86,729
|
)
|
|
-4%
|
|
|||||||
|
Unrealized
|
|
(654,403
|
)
|
|
(1,470,588
|
)
|
|
3,778,048
|
|
|
816,185
|
|
|
-56%
|
|
|
(5,248,636
|
)
|
|
n/m
|
|
|||||||
|
|
|
|
|
|
|
|
|
|
|
|
|
|
|
|
|
|
|
|
|
|
||||||||
|
Total Compensation and Benefits
|
|
3,312,970
|
|
|
3,532,454
|
|
|
8,350,126
|
|
|
(219,484
|
)
|
|
-6%
|
|
|
(4,817,672
|
)
|
|
-58%
|
|
|||||||
|
General, Administrative and Other
|
|
1,117,305
|
|
|
1,092,671
|
|
|
917,847
|
|
|
24,634
|
|
|
2%
|
|
|
174,824
|
|
|
19%
|
|
|||||||
|
Interest Expense
|
|
431,868
|
|
|
317,225
|
|
|
198,268
|
|
|
114,643
|
|
|
36%
|
|
|
118,957
|
|
|
60%
|
|
|||||||
|
Fund Expenses
|
|
118,987
|
|
|
30,675
|
|
|
10,376
|
|
|
88,312
|
|
|
288%
|
|
|
20,299
|
|
|
196%
|
|
|||||||
|
|
|
|
|
|
|
|
|
|
|
|
|
|
|
|
|
|
|
|
|
|
||||||||
|
Total Expenses
|
|
4,981,130
|
|
|
4,973,025
|
|
|
9,476,617
|
|
|
8,105
|
|
|
-
|
|
|
(4,503,592
|
)
|
|
-48%
|
|
|||||||
|
|
|
|
|
|
|
|
|
|
|
|
|
|
|
|
|
|
|
|
|
|
||||||||
|
Other Income (Loss)
|
||||||||||||||||||||||||||||
|
Change in Tax Receivable Agreement Liability
|
|
(27,196
|
)
|
|
22,283
|
|
|
(2,759
|
)
|
|
(49,479
|
)
|
|
n/m
|
|
|
25,042
|
|
|
n/m
|
|
|||||||
|
Net Gains (Losses) from Fund Investment Activities
|
|
(56,801
|
)
|
|
(105,142
|
)
|
|
461,624
|
|
|
48,341
|
|
|
-46%
|
|
|
(566,766
|
)
|
|
n/m
|
|
|||||||
|
|
|
|
|
|
|
|
|
|
|
|
|
|
|
|
|
|
|
|
|
|
||||||||
|
Total Other Income (Loss)
|
|
(83,997
|
)
|
|
(82,859
|
)
|
|
458,865
|
|
|
(1,138
|
)
|
|
1%
|
|
|
(541,724
|
)
|
|
n/m
|
|
|||||||
|
|
|
|
|
|
|
|
|
|
|
|
|
|
|
|
|
|
|
|
|
|
||||||||
|
Income Before Provision for Taxes
|
|
2,957,714
|
|
|
3,461,789
|
|
|
13,559,396
|
|
|
(504,075
|
)
|
|
-15%
|
|
|
(10,097,607
|
)
|
|
-74%
|
|
|||||||
|
Provision for Taxes
|
|
513,461
|
|
|
472,880
|
|
|
1,184,401
|
|
|
40,581
|
|
|
9%
|
|
|
(711,521
|
)
|
|
-60%
|
|
|||||||
|
|
|
|
|
|
|
|
|
|
|
|
|
|
|
|
|
|
|
|
|
|
||||||||
|
Net Income
|
|
2,444,253
|
|
|
2,988,909
|
|
|
12,374,995
|
|
|
(544,656
|
)
|
|
-18%
|
|
|
(9,386,086
|
)
|
|
-76%
|
|
|||||||
|
Net Income (Loss) Attributable to Redeemable Non-Controlling Interests in Consolidated Entities
|
|
(245,518
|
)
|
|
(142,890
|
)
|
|
5,740
|
|
|
(102,628
|
)
|
|
72%
|
|
|
(148,630
|
)
|
|
n/m
|
|
|||||||
|
Net Income Attributable to Non-Controlling Interests in Consolidated Entities
|
|
224,155
|
|
|
107,766
|
|
|
1,625,306
|
|
|
116,389
|
|
|
108%
|
|
|
(1,517,540
|
)
|
|
-93%
|
|
|||||||
|
Net Income Attributable to Non-Controlling Interests in Blackstone Holdings
|
|
1,074,736
|
|
|
1,276,402
|
|
|
4,886,552
|
|
|
(201,666
|
)
|
|
-16%
|
|
|
(3,610,150
|
)
|
|
-74%
|
|
|||||||
|
|
|
|
|
|
|
|
|
|
|
|
|
|
|
|
|
|
|
|
|
|
||||||||
|
Net Income Attributable to Blackstone Inc.
|
$
|
1,390,880
|
|
$
|
1,747,631
|
|
$
|
5,857,397
|
|
$
|
(356,751
|
)
|
|
-20%
|
|
$
|
(4,109,766
|
)
|
|
-70%
|
|
|||||||
|
|
|
|
|
|
|
|
|
|
|
|
|
|
|
|
|
|
|
|
|
|
||||||||
n/m Not meaningful.
94
Year Ended December 31, 2023 Compared to Year Ended December 31, 2022
Revenues
Revenues were $8.0 billion for the year ended December 31, 2023, a decrease of $494.8 million, compared to $8.5 billion for the year ended December 31, 2022. The decrease in Revenues was primarily attributable to a decrease of $1.0 billion in Investment Income, which was composed of a decrease of $3.7 billion in Realized Investment Income and an increase of $2.7 billion in Unrealized Investment Income, partially offset by an increase of $367.9 million in Management and Advisory Fees, Net.
The $3.7 billion decrease in Realized Investment Income was primarily attributable to lower realized gains in our Real Estate segment.
The $2.7 billion increase in Unrealized Investment Income was primarily attributable to lower net unrealized depreciation of investments in the year ended December 31, 2023 compared to the year ended December 31, 2022. Principal drivers were:
|
•
|
An increase of $1.8 billion in our Private Equity segment, primarily attributable to net unrealized appreciation of investments in Corporate Private Equity in the year ended December 31, 2023 compared to net unrealized depreciation of investments in the year ended December 31, 2022. The carrying value of Corporate Private Equity increased 12.1% in the year ended December 31, 2023 compared to a decrease of 0.6% in the year ended December 31, 2022.
|
|
•
|
An increase of $1.1 billion in our Credit & Insurance segment, primarily attributable to lower net unrealized depreciation of investments in our insurance platform in the year ended December 31, 2023 compared to the year ended December 31, 2022.
|
|
•
|
A decrease of $524.1 million in our Real Estate segment, primarily attributable to lower appreciation in BREP and Core+ real estate in the year ended December 31, 2023 compared to the year ended December 31, 2022 and an unrealized loss on the liability related to the strategic ventures with UC Investments (defined herein). The carrying values of BREP and Core+ real estate decreased 6.3% and 4.3%, respectively, in the year ended December 31, 2023 compared to an increase of 7.1% and 10.3%, respectively, in the year ended December 31, 2022.
|
The $367.9 million increase in Management and Advisory Fees, Net was primarily due to increases in our Real Estate and Credit & Insurance segments of $220.3 million and $116.2 million, respectively. The increase in our Real Estate segment was primarily due to Fee-Earning Assets Under Management growth in BREP. The increase in our Credit & Insurance segment was primarily due to inflows from Fee-Earning Assets Under Management in direct lending.
Expenses
Expenses were $5.0 billion for the year ended December 31, 2023, an increase of $8.1 million, compared to the year ended December 31, 2022. The increase was primarily attributable to increases of $114.6 million in Interest Expense and $88.3 million in Fund Expenses, partially offset by a decrease of $219.5 million in Total Compensation and Benefits, which is primarily composed of a decrease of $508.2 million in Performance Allocations Compensation and an increase of $215.7 million in Compensation. The increase in Interest Expense was primarily due to an increase in borrowings. The increase in Fund Expenses was primarily due to an increase in interest expense in a consolidated private equity fund. The decrease in Performance Allocations Compensation was primarily due to the decrease in Investment Income, on which a portion of compensation is based. The increase in Compensation was primarily due to the increase in Management and Advisory Fees, Net, on which a portion of compensation is based.
95
Other Income (Loss)
Other Income (Loss) was $(84.0) million for the year ended December 31, 2023, a decrease of $1.1 million, compared to $(82.9) million for the year ended December 31, 2022. The decrease in Other Income (Loss) was due to a decrease of $49.5 million in Change in Tax Receivable Agreement Liability, partially offset by an increase of $48.3 million in Net Gains (Losses) from Fund Investment Activities.
Changes to the Tax Receivable Agreement Liability are driven by the required remeasurement of the liability as a result of changes in expected future tax rates.
The increase in Net Gains (Losses) from Fund Investment Activities was principally driven by increases of $203.7 million and $121.7 million in our Private Equity and Hedge Fund Solutions segments, respectively, partially offset by a decrease of $300.2 million in our Real Estate segment. The increases in our Private Equity and Hedge Fund Solutions segments were primarily due to unrealized appreciation of investments in our consolidated Private Equity and Hedge Fund Solutions funds. The decrease in our Real Estate segment was primarily due to realized losses and unrealized depreciation of investments in our consolidated funds.
Provision (Benefit) for Taxes
Blackstone’s Provision for Taxes for the year ended December 31, 2023 was $513.5 million, an increase of $40.6 million, compared to $472.9 million for the year ended December 31, 2022. This resulted in an effective tax rate of 17.4% and 13.7% based on our Income Before Provision for Taxes of $3.0 billion and $3.5 billion for the years ended December 31, 2023 and 2022, respectively.
The increase in Blackstone’s effective tax rate for the year ended December 31, 2023, compared to the year ended December 31, 2022, resulted primarily from an out-of-period adjustment recorded in December 31, 2022 to revise the book investment basis used to calculate deferred tax assets and the deferred tax provision.
Blackstone had a corporate alternative minimum tax (“CAMT”) liability for the year ended December 31, 2023 as calculated pursuant to the Inflation Reduction Act. Blackstone will continue to assess the overall impact to its Provision for Income Tax upon the issuance of applicable additional guidance by the U.S. Treasury Department related to interpretations of CAMT. For the year ended December 31, 2023 there is no meaningful CAMT impact reflected in the Provision for Income Taxes given current year tax payments made under CAMT are permitted to be carried forward and used as credits in future years resulting in a deferred tax benefit.
On December 27, 2023, New York State finalized regulations with respect to various areas of its tax reform. The impact of the legislation has been considered and incorporated in the computation of the tax provision for the year ended December 31, 2023.
Additional information regarding our income taxes can be found in “— Item 8. Financial Statements and Supplementary Data — Notes to Consolidated Financial Statements — Note 15. Income Taxes” of this filing.
Non-Controlling Interests in Consolidated Entities
The Net Income Attributable to Redeemable Non-Controlling Interests in Consolidated Entities and Net Income Attributable to Non-Controlling Interests in Consolidated Entities is attributable to the consolidated Blackstone Funds. The amounts of these items vary directly with the performance of the consolidated Blackstone Funds and largely eliminate the amount of Other Income (Loss) — Net Gains (Losses) from Fund Investment Activities from the Net Income (Loss) Attributable to Blackstone Inc.
Net Income Attributable to Non-Controlling Interests in Blackstone Holdings is derived from the Income Before Provision (Benefit) for Taxes at the Blackstone Holdings level, excluding the Net Gains (Losses) from Fund Investment Activities and the percentage allocation of the income between Blackstone personnel and others who are limited partners of Blackstone Holdings and Blackstone after considering any contractual arrangements that govern the allocation of income such as fees allocable to Blackstone.
96
For the years ended December 31, 2023 and 2022, the Net Income Before Taxes allocated to Blackstone personnel and others who are limited partners of Blackstone Holdings was 39.2% and 39.7%, respectively. The decrease of 0.5% was primarily due to the conversion of Blackstone Holdings Partnership Units to shares of common stock and the vesting of shares of common stock.
The Other Income (Loss) — Change in Tax Receivable Agreement Liability was entirely allocated to Blackstone Inc.
Operating Metrics
Total and Fee-Earning Assets Under Management
The following graphs and tables summarize the Fee-Earning Assets Under Management by Segment and Total Assets Under Management by Segment, followed by a rollforward of activity for the years ended December 31, 2023, 2022 and 2021. For a description of how Assets Under Management and Fee-Earning Assets Under Management are determined, please see “— Key Financial Measures and Indicators — Operating Metrics — Total and Fee-Earning Assets Under Management.”
97
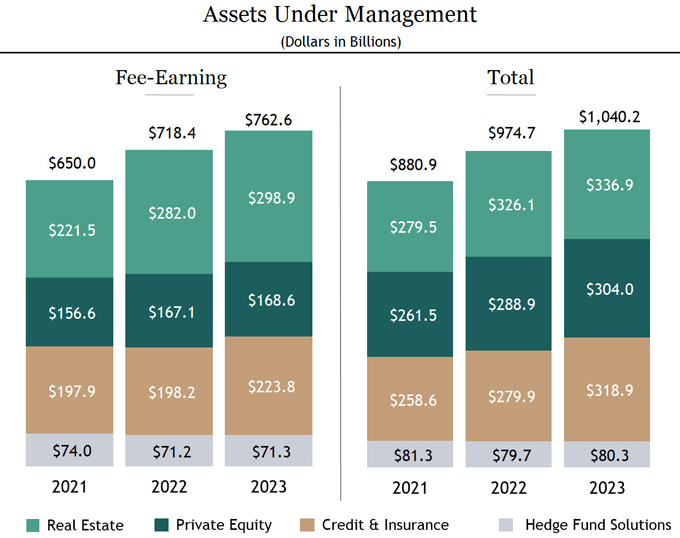
Note: Totals may not add due to rounding.
98
|
Year Ended December 31,
|
||||||||||||||||||||||||||||||||||||||||
|
2023
|
2022
|
|||||||||||||||||||||||||||||||||||||||
|
Real Estate
|
Private
Equity
|
Credit &
Insurance
|
Hedge Fund
Solutions |
Total
|
Real Estate
|
Private
Equity
|
Credit &
Insurance |
Hedge Fund
Solutions |
Total
|
|||||||||||||||||||||||||||||||
|
(Dollars in Thousands)
|
||||||||||||||||||||||||||||||||||||||||
|
Fee-Earning Assets Under Management
|
||||||||||||||||||||||||||||||||||||||||
|
Balance, Beginning of Period
|
$
|
281,967,153
|
|
$
|
167,082,852
|
|
$
|
198,162,931
|
|
$
|
71,173,952
|
|
$
|
718,386,888
|
|
$
|
221,476,699
|
|
$
|
156,556,959
|
|
$
|
197,900,832
|
|
$
|
74,034,568
|
|
$
|
649,969,058
|
|
||||||||||
|
Inflows (a)
|
|
60,404,380
|
|
|
8,354,796
|
|
|
43,049,516
|
|
|
7,543,408
|
|
|
119,352,100
|
|
|
98,569,361
|
|
|
20,408,720
|
|
|
43,116,181
|
|
|
10,175,526
|
|
|
172,269,788
|
|
||||||||||
|
Outflows (b)
|
|
(18,176,929
|
)
|
|
(737,831
|
)
|
|
(13,525,080
|
)
|
|
(9,422,647
|
)
|
|
(41,862,487
|
)
|
|
(20,168,572
|
)
|
|
(3,799,650
|
)
|
|
(22,426,317
|
)
|
|
(11,698,834
|
)
|
|
(58,093,373
|
)
|
||||||||||
|
|
|
|
|
|
|
|
|
|
|
|
|
|
|
|
|
|
|
|
|
|
|
|
|
|
|
|
|
|
|
|||||||||||
|
Net Inflows (Outflows)
|
|
42,227,451
|
|
|
7,616,965
|
|
|
29,524,436
|
|
|
(1,879,239
|
)
|
|
77,489,613
|
|
|
78,400,789
|
|
|
16,609,070
|
|
|
20,689,864
|
|
|
(1,523,308
|
)
|
|
114,176,415
|
|
||||||||||
|
Realizations (c)
|
|
(20,266,342
|
)
|
|
(8,693,829
|
)
|
|
(13,454,682
|
)
|
|
(3,186,119
|
)
|
|
(45,600,972
|
)
|
|
(22,661,825
|
)
|
|
(9,111,472
|
)
|
|
(8,644,654
|
)
|
|
(1,988,241
|
)
|
|
(42,406,192
|
)
|
||||||||||
|
Market Activity (d)(g)
|
|
(5,038,787
|
)
|
|
2,614,557
|
|
|
9,611,399
|
|
|
5,145,204
|
|
|
12,332,373
|
|
|
4,751,490
|
|
|
3,028,295
|
|
|
(11,783,111
|
)
|
|
650,933
|
|
|
(3,352,393
|
)
|
||||||||||
|
|
|
|
|
|
|
|
|
|
|
|
|
|
|
|
|
|
|
|
|
|
|
|
|
|
|
|
|
|
|
|||||||||||
|
Balance, End of Period (e)
|
$
|
298,889,475
|
|
$
|
168,620,545
|
|
$
|
223,844,084
|
|
$
|
71,253,798
|
|
$
|
762,607,902
|
|
$
|
281,967,153
|
|
$
|
167,082,852
|
|
$
|
198,162,931
|
|
$
|
71,173,952
|
|
$
|
718,386,888
|
|
||||||||||
|
|
|
|
|
|
|
|
|
|
|
|
|
|
|
|
|
|
|
|
|
|
|
|
|
|
|
|
|
|
|
|||||||||||
|
Increase (Decrease)
|
$
|
16,922,322
|
|
$
|
1,537,693
|
|
$
|
25,681,153
|
|
$
|
79,846
|
|
$
|
44,221,014
|
|
$
|
60,490,454
|
|
$
|
10,525,893
|
|
$
|
262,099
|
|
$
|
(2,860,616
|
)
|
$
|
68,417,830
|
|
||||||||||
|
Increase (Decrease)
|
|
6
|
%
|
|
1
|
%
|
|
13
|
%
|
|
—
|
|
|
6
|
%
|
|
27
|
%
|
|
7
|
%
|
|
—
|
|
|
-4
|
%
|
|
11
|
%
|
||||||||||
|
Annualized Base Management Fee Rate (f)
|
|
0.97
|
%
|
|
1.08
|
%
|
|
0.64
|
%
|
|
0.74
|
%
|
|
0.88
|
%
|
|
0.97
|
%
|
|
1.10
|
%
|
|
0.62
|
%
|
|
0.77
|
%
|
|
0.88
|
%
|
||||||||||
|
Year Ended December 31,
|
||||||||||||||||||||||||||||||||||||||||
|
2021
|
||||||||||||||||||||||||||||||||||||||||
|
Real Estate
|
Private
Equity
|
Credit &
Insurance
|
Hedge Fund
Solutions |
Total
|
||||||||||||||||||||||||||||||||||||
|
(Dollars in Thousands)
|
||||||||||||||||||||||||||||||||||||||||
|
Fee-Earning Assets Under Management
|
||||||||||||||||||||||||||||||||||||||||
|
Balance, Beginning of Period
|
$
|
149,121,461
|
|
$
|
129,539,630
|
|
$
|
116,645,413
|
|
$
|
74,126,610
|
|
$
|
469,433,114
|
|
|||||||||||||||||||||||||
|
Inflows (a)
|
|
73,051,751
|
|
|
37,527,024
|
|
|
103,311,869
|
|
|
10,656,310
|
|
|
224,546,954
|
|
|||||||||||||||||||||||||
|
Outflows (b)
|
|
(3,092,934
|
)
|
|
(3,693,890
|
)
|
|
(11,948,060
|
)
|
|
(14,704,010
|
)
|
|
(33,438,894
|
)
|
|||||||||||||||||||||||||
|
|
|
|
|
|
|
|
|
|
|
|
|
|
|
|
||||||||||||||||||||||||||
|
Net Inflows (Outflows)
|
|
69,958,817
|
|
|
33,833,134
|
|
|
91,363,809
|
|
|
(4,047,700
|
)
|
|
191,108,060
|
|
|||||||||||||||||||||||||
|
Realizations (c)
|
|
(14,210,387
|
)
|
|
(13,187,981
|
)
|
|
(12,775,234
|
)
|
|
(1,569,057
|
)
|
|
(41,742,659
|
)
|
|||||||||||||||||||||||||
|
Market Activity (d)(g)
|
|
16,606,808
|
|
|
6,372,176
|
|
|
2,666,844
|
|
|
5,524,715
|
|
|
31,170,543
|
|
|
|
|
|
|
|
|
|
|
|
|
|
|
|
|
||||||||||
|
|
|
|
|
|
|
|
|
|
|
|
|
|
|
|
||||||||||||||||||||||||||
|
Balance, End of Period (e)
|
$
|
221,476,699
|
|
$
|
156,556,959
|
|
$
|
197,900,832
|
|
$
|
74,034,568
|
|
$
|
649,969,058
|
|
|||||||||||||||||||||||||
|
|
|
|
|
|
|
|
|
|
|
|
|
|
|
|
||||||||||||||||||||||||||
|
Increase (Decrease)
|
$
|
72,355,238
|
|
$
|
27,017,329
|
|
$
|
81,255,419
|
|
$
|
(92,042
|
)
|
$
|
180,535,944
|
|
|||||||||||||||||||||||||
|
Increase
|
|
49
|
%
|
|
21
|
%
|
|
70
|
%
|
|
—
|
|
|
38
|
%
|
|||||||||||||||||||||||||
|
Annualized Base Management Fee Rate (f)
|
|
1.09
|
%
|
|
1.10
|
%
|
|
0.55
|
%
|
|
0.86
|
%
|
|
0.92
|
%
|
|||||||||||||||||||||||||
99
|
Year Ended December 31,
|
||||||||||||||||||||||||||||||||||||||||
|
2023
|
2022
|
|||||||||||||||||||||||||||||||||||||||
|
Real Estate
|
Private
Equity
|
Credit &
Insurance
|
Hedge Fund
Solutions |
Total
|
Real Estate
|
Private
Equity
|
Credit &
Insurance
|
Hedge Fund
Solutions |
Total
|
|||||||||||||||||||||||||||||||
|
(Dollars in Thousands)
|
||||||||||||||||||||||||||||||||||||||||
|
Total Assets Under Management
|
||||||||||||||||||||||||||||||||||||||||
|
Balance, Beginning of Period
|
$
|
326,146,904
|
|
$
|
288,902,142
|
|
$
|
279,908,030
|
|
$
|
79,716,001
|
|
$
|
974,673,077
|
|
$
|
279,474,105
|
|
$
|
261,471,007
|
|
$
|
258,622,467
|
|
$
|
81,334,141
|
|
$
|
880,901,720
|
|
||||||||||
|
Inflows (a)
|
|
53,922,506
|
|
|
23,797,324
|
|
|
62,498,168
|
|
|
8,300,415
|
|
|
148,518,413
|
|
|
90,199,877
|
|
|
52,706,725
|
|
|
72,038,472
|
|
|
11,094,365
|
|
|
226,039,439
|
|
||||||||||
|
Outflows (b)
|
|
(15,642,086
|
)
|
|
(3,085,260
|
)
|
|
(17,213,852
|
)
|
|
(9,776,780
|
)
|
|
(45,717,978
|
)
|
|
(13,577,103
|
)
|
|
(3,989,728
|
)
|
|
(22,995,061
|
)
|
|
(11,499,687
|
)
|
|
(52,061,579
|
)
|
||||||||||
|
|
|
|
|
|
|
|
|
|
|
|
|
|
|
|
|
|
|
|
|
|
|
|
|
|
|
|
|
|
|
|||||||||||
|
Net Inflows (Outflows)
|
|
38,280,420
|
|
|
20,712,064
|
|
|
45,284,316
|
|
|
(1,476,365
|
)
|
|
102,800,435
|
|
|
76,622,774
|
|
|
48,716,997
|
|
|
49,043,411
|
|
|
(405,322
|
)
|
|
173,977,860
|
|
||||||||||
|
Realizations (c)
|
|
(18,744,078
|
)
|
|
(23,228,649
|
)
|
|
(20,368,540
|
)
|
|
(3,349,572
|
)
|
|
(65,690,839
|
)
|
|
(37,061,836
|
)
|
|
(24,235,386
|
)
|
|
(18,352,741
|
)
|
|
(2,117,677
|
)
|
|
(81,767,640
|
)
|
||||||||||
|
Market Activity (d)(h)
|
|
(8,743,150
|
)
|
|
17,652,664
|
|
|
14,091,870
|
|
|
5,408,390
|
|
|
28,409,774
|
|
|
7,111,861
|
|
|
2,949,524
|
|
|
(9,405,107
|
)
|
|
904,859
|
|
|
1,561,137
|
|
||||||||||
|
|
|
|
|
|
|
|
|
|
|
|
|
|
|
|
|
|
|
|
|
|
|
|
|
|
|
|
|
|
|
|||||||||||
|
Balance, End of Period (e)
|
$
|
336,940,096
|
|
$
|
304,038,221
|
|
$
|
318,915,676
|
|
$
|
80,298,454
|
|
$
|
1,040,192,447
|
|
$
|
326,146,904
|
|
$
|
288,902,142
|
|
$
|
279,908,030
|
|
$
|
79,716,001
|
|
$
|
974,673,077
|
|
||||||||||
|
|
|
|
|
|
|
|
|
|
|
|
|
|
|
|
|
|
|
|
|
|
|
|
|
|
|
|
|
|
|
|||||||||||
|
Increase (Decrease)
|
$
|
10,793,192
|
|
$
|
15,136,079
|
|
$
|
39,007,646
|
|
$
|
582,453
|
|
$
|
65,519,370
|
|
$
|
46,672,799
|
|
$
|
27,431,135
|
|
$
|
21,285,563
|
|
$
|
(1,618,140
|
)
|
$
|
93,771,357
|
|
||||||||||
|
Increase (Decrease)
|
|
3
|
%
|
|
5
|
%
|
|
14
|
%
|
|
1
|
%
|
|
7
|
%
|
|
17
|
%
|
|
10
|
%
|
|
8
|
%
|
|
-2
|
%
|
|
11
|
%
|
||||||||||
|
Year Ended December 31,
|
||||||||||||||||||||||||||||||||||||||||
|
2021
|
||||||||||||||||||||||||||||||||||||||||
|
Real Estate
|
Private
Equity
|
Credit &
Insurance |
Hedge Fund
Solutions |
Total
|
||||||||||||||||||||||||||||||||||||
|
(Dollars in Thousands)
|
||||||||||||||||||||||||||||||||||||||||
|
Total Assets Under Management
|
||||||||||||||||||||||||||||||||||||||||
|
Balance, Beginning of Period
|
$
|
187,191,247
|
|
$
|
197,549,222
|
|
$
|
154,393,590
|
|
$
|
79,422,869
|
|
$
|
618,556,928
|
|
|||||||||||||||||||||||||
|
Inflows (a)
|
|
75,257,777
|
|
|
53,858,227
|
|
|
129,433,685
|
|
|
11,921,965
|
|
|
270,471,654
|
|
|||||||||||||||||||||||||
|
Outflows (b)
|
|
(5,145,881
|
)
|
|
(2,969,032
|
)
|
|
(13,411,898
|
)
|
|
(14,562,917
|
)
|
|
(36,089,728
|
)
|
|
|
|
|
|
|
|
|
|
|
|
|
|
|
|
||||||||||
|
|
|
|
|
|
|
|
|
|
|
|
|
|
|
|
||||||||||||||||||||||||||
|
Net Inflows (Outflows)
|
|
70,111,896
|
|
|
50,889,195
|
|
|
116,021,787
|
|
|
(2,640,952
|
)
|
|
234,381,926
|
|
|||||||||||||||||||||||||
|
Realizations (c)
|
|
(19,490,016
|
)
|
|
(36,616,307
|
)
|
|
(19,475,414
|
)
|
|
(1,627,766
|
)
|
|
(77,209,503
|
)
|
|||||||||||||||||||||||||
|
Market Activity (d)(h)
|
|
41,660,978
|
|
|
49,648,897
|
|
|
7,682,504
|
|
|
6,179,990
|
|
|
105,172,369
|
|
|||||||||||||||||||||||||
|
|
|
|
|
|
|
|
|
|
|
|
|
|
|
|
||||||||||||||||||||||||||
|
Balance, End of Period (e)
|
$
|
279,474,105
|
|
$
|
261,471,007
|
|
$
|
258,622,467
|
|
$
|
81,334,141
|
|
$
|
880,901,720
|
|
|||||||||||||||||||||||||
|
|
|
|
|
|
|
|
|
|
|
|
|
|
|
|
||||||||||||||||||||||||||
|
Increase
|
$
|
92,282,858
|
|
$
|
63,921,785
|
|
$
|
104,228,877
|
|
$
|
1,911,272
|
|
$
|
262,344,792
|
|
|||||||||||||||||||||||||
|
Increase
|
|
49
|
%
|
|
32
|
%
|
|
68
|
%
|
|
2
|
%
|
|
42
|
%
|
|||||||||||||||||||||||||
100
|
(a)
|
Inflows include contributions, capital raised, other increases in available capital (recallable capital and increased side-by-side commitments), purchases, inter-segment allocations and acquisitions.
|
|
(b)
|
Outflows represent redemptions, client withdrawals and decreases in available capital (expired capital, expense drawdowns and decreased side-by-side commitments).
|
|
(c)
|
Realizations represent realization proceeds from the disposition or other monetization of assets, current income or capital returned to investors from CLOs.
|
|
(d)
|
Market activity includes realized and unrealized gains (losses) on portfolio investments and the impact of foreign exchange rate fluctuations.
|
|
(e)
|
Total and Fee-Earning Assets Under Management are reported in the segment where the assets are managed.
|
|
(f)
|
Annualized Base Management Fee Rate represents annualized year to date Base Management Fee divided by the average of the beginning of year and each quarter end’s Fee-Earning Assets Under Management in the reporting period.
|
|
(g)
|
For the year ended December 31, 2023, the impact to Fee-Earning Assets Under Management from foreign exchange rate fluctuations was $1.6 billion, $102.4 million, $1.0 billion, $231.2 million, and $3.0 billion for the Real Estate, Private Equity, Credit & Insurance, Hedge Fund Solutions and Total segments, respectively. For the year ended December 31, 2022, the impact to Fee-Earning Assets Under Management from foreign exchange rate fluctuations was $(3.5) billion, $(123.5) million, $(1.7) billion, $(573.2) million and $(5.9) billion for the Real Estate, Private Equity, Credit & Insurance, Hedge Fund Solutions and Total segments, respectively. For the year ended December 31, 2021, such impact was $(2.1) billion, $(1.1) billion and $(3.2) billion for the Real Estate, Credit & Insurance and Total segments, respectively.
|
|
(h)
|
For the year ended December 31, 2023, the impact to Total Assets Under Management from foreign exchange rate fluctuations was $2.2 billion, $1.1 billion, $1.1 billion, $241.2 million, and $4.6 billion for the Real Estate, Private Equity, Credit & Insurance, Hedge Fund Solutions and Total segments, respectively. For the year ended December 31, 2022, the impact to Total Assets Under Management from foreign exchange rate fluctuations was $(6.6) billion, $(1.5) billion, $(2.1) billion, $(571.4) million and $(10.8) billion for the Real Estate, Private Equity, Credit & Insurance, Hedge Fund Solutions and Total segments, respectively. For the year ended December 31, 2021, such impact was $(3.2) billion, $(1.2) billion, $(1.2) billion and $(5.6) billion for the Real Estate, Private Equity, Credit & Insurance and Total segments, respectively.
|
Fee-Earning Assets Under Management
Fee-Earning Assets Under Management were $762.6 billion at December 31, 2023, an increase of $44.2 billion compared to $718.4 billion at December 31, 2022. The net increase was due to:
|
•
|
In our Real Estate segment, an increase of $16.9 billion from $282.0 billion at December 31, 2022 to $298.9 billion at December 31, 2023. The net increase was due to inflows of $60.4 billion, offset by realizations of $20.3 billion, outflows of $18.2 billion and market depreciation of $5.0 billion.
|
|
o
|
Inflows were driven by $33.0 billion from BREDS, $15.8 billion from BREIT and $9.1 billion from BREP and co-investment. BREDS inflows primarily related to $17.3 billion from a fee-paying joint venture with the Federal Deposit Insurance Corporation to acquire the Signature Bank commercial senior mortgage loan portfolio (the “Signature transaction”) and $12.5 billion from allocations of insurance capital. BREIT inflows included $4.5 billion from the Regents of the University of California (“UC Investments”) in the first quarter of 2023. BREP and co-investment inflows were primarily driven by the commencement of the investment period for the seventh European opportunistic fund.
|
|
o
|
Realizations were driven by $9.9 billion from BREIT, $4.8 billion from BREDS, $3.5 billion from BREP and co-investment and $2.0 billion from BPP and co-investment.
|
101
|
o
|
Outflows were driven by $13.3 billion from BREIT, reflecting repurchases, and $3.6 billion from BREP and co-investment, due to remaining uninvested reserves at the end of BREP Europe VI’s investment period.
|
|
o
|
Market depreciation was driven by depreciation of $5.0 billion primarily from BPP and co-investment (which reflected $1.1 billion of foreign exchange appreciation).
|
Fee-Earning Assets Under Management inflows and outflows in BREP exceeds the Total Assets Under Management inflows and outflows due to the commencement of the investment period for the seventh European opportunistic fund and the termination of the investment period for BREP Europe VI in September 2023. Fee-Earning Assets Under Management inflows are reported when a fund’s investment period commences, whereas Total Assets Under Management inflows are reported at each fund closing. Fee-Earning Assets Under Management outflows include the change in fee base within BREP Europe VI from committed capital to invested capital.
Fee-Earning Assets Under Management inflows in BREDS exceeds the Total Assets Under Management inflows due to the impact of the Signature transaction. Fee-Earning Assets Under Management inflows include the gross outstanding principal balance of the investments in the Signature transaction, whereas Total Assets Under Management inflows include each joint venture partner’s ownership interest at fair value.
|
•
|
In our Private Equity segment, an increase of $1.5 billion from $167.1 billion at December 31, 2022 to $168.6 billion at December 31, 2023. The net increase was due to inflows of $8.4 billion and market appreciation of $2.6 billion, offset by realizations of $8.7 billion and outflows of $737.8 million.
|
|
o
|
Inflows were driven by $3.6 billion from BIP, $2.6 billion from Tactical Opportunities and $2.0 billion from Strategic Partners.
|
|
o
|
Market appreciation was driven by appreciation of $2.5 billion from BIP (which reflected $111.1 million of foreign exchange appreciation).
|
|
o
|
Realizations were driven by $3.6 billion from Corporate Private Equity, $2.0 billion from Tactical Opportunities and $1.9 billion from Strategic Partners.
|
|
o
|
Outflows were driven by $441.5 million from BTAS and $259.0 million from Tactical Opportunities.
|
|
•
|
In our Credit & Insurance segment, an increase of $25.7 billion from $198.2 billion at December 31, 2022 to $223.8 billion at December 31, 2023. The net increase was due to inflows of $43.0 billion and market appreciation of $9.6 billion, offset by outflows of $13.5 billion and realizations of $13.5 billion.
|
|
o
|
Inflows were driven by $15.1 billion from liquid credit strategies, $15.1 billion from direct lending and $4.2 billion from asset based finance.
|
|
o
|
Market appreciation was driven by appreciation of $4.6 billion from liquid credit strategies (which reflected $814.2 million of foreign exchange appreciation) and $4.2 billion from direct lending (which reflected $227.7 million of foreign exchange appreciation).
|
|
o
|
Outflows were driven by $7.0 billion from liquid credit strategies and $4.2 billion from direct lending.
|
|
o
|
Realizations were driven by $5.3 billion from direct lending, $3.4 billion from liquid credit strategies and $1.9 billion from mezzanine funds.
|
102
|
•
|
In our Hedge Fund Solutions segment, a increase of $79.8 million from $71.2 billion at December 31, 2022 to $71.3 billion at December 31, 2023. The net increase was due to inflows of $7.5 billion and market appreciation of $5.1 billion, offset by outflows of $9.4 billion and realizations of $3.2 billion.
|
|
o
|
Inflows were driven by $4.3 billion from liquid and specialized solutions, $2.8 billion from customized solutions and $468.8 million from commingled products.
|
|
o
|
Market appreciation was driven by appreciation of $2.4 billion from customized solutions (which reflected $41.4 million of foreign exchange depreciation), $1.9 billion from liquid and specialized solutions (which reflected $7.1 million of foreign exchange appreciation) and $889.9 million from commingled products (which reflected $265.5 million of foreign exchange appreciation).
|
|
o
|
Outflows were driven by $3.6 billion from customized solutions, $3.0 billion from commingled products and $2.7 billion from liquid and specialized solutions.
|
|
o
|
Realizations were driven by $3.1 billion from liquid and specialized solutions.
|
Total Assets Under Management
Total Assets Under Management were $1,040.2 billion at December 31, 2023, an increase of $65.5 billion compared to $974.7 billion at December 31, 2022. The net increase was due to:
|
•
|
In our Real Estate segment, an increase of $10.8 billion from $326.1 billion at December 31, 2022 to $336.9 billion at December 31, 2023. The net increase was due to inflows of $53.9 billion, offset by realizations of $18.7 billion, outflows of $15.6 billion and market depreciation of $8.7 billion.
|
|
o
|
Inflows were driven by $28.3 billion from BREDS, $15.8 billion from BREIT and $8.5 billion from BREP and co-investment. BREDS inflows were primarily related to $10.5 billion from the Signature transaction and $13.1 billion from allocations of insurance capital. BREIT inflows included $4.5 billion from UC Investments. BREP and co-investment inflows were driven by fundraising for the seventh European opportunistic fund and BREP X.
|
|
o
|
Realizations were driven by $9.9 billion from BREIT, $3.4 billion from BREDS, $3.3 billion from BREP and co-investment and $2.0 billion from BPP and co-investment.
|
|
o
|
Outflows were driven by $13.3 billion from BREIT, reflecting repurchases.
|
|
o
|
Market depreciation was driven by depreciation of $5.3 billion from BPP and co-investment (which reflected $1.2 billion of foreign exchange appreciation) and depreciation of $3.8 billion from BREP and co-investment (which reflected $759.0 million of foreign exchange appreciation), partially offset by appreciation of $983.5 million from BREDS (which reflected $66.1 million of foreign exchange appreciation).
|
|
•
|
In our Private Equity segment, an increase of $15.1 billion from $288.9 billion at December 31, 2022 to $304.0 billion at December 31, 2023. The net increase was due to inflows of $23.8 billion and market appreciation of $17.7 billion, offset by realizations of $23.2 billion and outflows of $3.1 billion.
|
|
o
|
Inflows were driven by $9.2 billion from Corporate Private Equity, $5.8 billion from Strategic Partners, $3.8 billion from Tactical Opportunities and $3.4 billion from BIP.
|
|
o
|
Market appreciation was driven by appreciation of $10.6 billion from Corporate Private Equity (which reflected $750.2 million of foreign exchange appreciation) and $3.2 billion from BIP (which reflected $116.1 million of foreign exchange appreciation).
|
|
o
|
Realizations were driven by $12.4 billion from Corporate Private Equity and $5.3 billion from Strategic Partners.
|
|
o
|
Outflows were driven by $1.7 billion from Strategic Partners, $558.8 million from Corporate Private Equity and $417.1 million from Tactical Opportunities.
|
103
|
•
|
In our Credit & Insurance segment, an increase of $39.0 billion from $279.9 billion at December 31, 2022 to $318.9 billion at December 31, 2023. The net increase was due to inflows of $62.5 billion and market appreciation of $14.1 billion, offset by realizations of $20.4 billion and outflows of $17.2 billion.
|
|
o
|
Inflows were driven by $24.6 billion from direct lending, $15.2 billion from liquid credit strategies, $9.6 billion from our insurance platform and $6.1 billion from asset based finance.
|
|
o
|
Market appreciation was driven by appreciation of $5.5 billion from direct lending (which reflected $228.4 million of foreign exchange appreciation), $4.8 billion from liquid credit strategies (which reflected $829.2 million of foreign exchange appreciation) and $1.1 billion from MLP strategies.
|
|
o
|
Realizations were driven by $8.7 billion from direct lending, $3.4 billion from mezzanine funds and $3.4 billion from liquid credit strategies.
|
|
o
|
Outflows were driven by $7.8 billion from liquid credit strategies and $5.5 billion from direct lending.
|
|
•
|
In our Hedge Fund Solutions segment, an increase of $582.5 million from $79.7 billion at December 31, 2022 to $80.3 billion at December 31, 2023. The net increase was due to inflows of $8.3 billion and market appreciation of $5.4 billion, offset by outflows of $9.8 billion and realizations of $3.3 billion.
|
|
o
|
Inflows were driven by $4.8 billion from liquid and specialized solutions, $2.9 billion from customized solutions and $546.2 million from commingled products.
|
|
o
|
Market appreciation was driven by appreciation of $2.3 billion from customized solutions (which reflected $42.7 million of foreign exchange depreciation), $2.0 billion from liquid and specialized solutions (which reflected $8.7 million of foreign exchange appreciation) and $1.1 billion from commingled products (which reflected $275.3 million of foreign exchange appreciation).
|
|
o
|
Outflows were driven by $3.7 billion from customized solutions, $3.2 billion from commingled products and $2.9 billion from liquid and specialized solutions.
|
|
o
|
Realizations were driven by $3.2 billion from liquid and specialized solutions.
|
Total Assets Under Management inflows in Corporate Private Equity exceed the Fee-Earning Assets Under Management inflows primarily due to the closings of BCP IX and BETP IV and capital raised in co-investments in the year ended December 31, 2023. Fee-Earning Assets Under Management inflows are reported when a fund’s investment period commences or fee-earning co-investment capital is raised, whereas Total Assets Under Management activity is reported at each fund closing or when co-investment capital is raised.
Total Assets Under Management realizations in our BREP and co-investment funds and our Private Equity segment generally represents the total proceeds and typically exceeds the Fee-Earning Assets Under Management realizations. Fee-Earning Assets Under Management generally represents only the invested capital.
Fee-Earning Assets Under Management in Corporate Private Equity is reported based on committed or remaining invested capital, whereas Total Assets Under Management is reported based on fair value and remaining available capital. Total Assets Under Management market activity therefore exceeds Fee-Earning Assets Under Management market activity.
Total Assets Under Management inflows in our Credit & Insurance segment direct lending funds exceed the Fee-Earning Assets Under Management inflows because Total Assets Under Management inflows are reported at their gross value while, for certain funds, Fee-Earning Assets Under Management are reported as net assets, which is the basis on which fees are charged.
104
Dry Powder
The following presents our Dry Powder as of December 31 of each year:
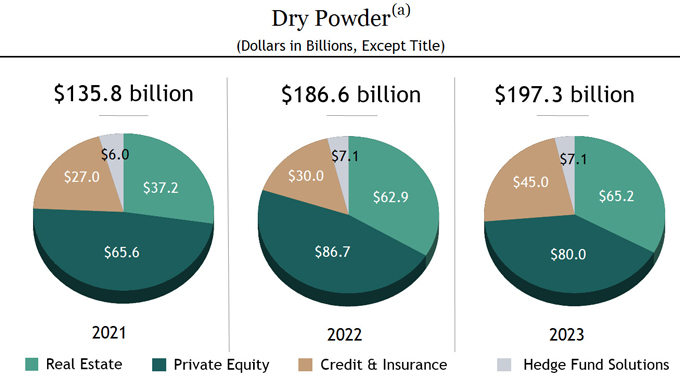
Note: Totals may not add due to rounding.
|
(a)
|
Represents illiquid drawdown funds, a component of Perpetual Capital and fee-paying co-investments; includes fee-paying third party capital as well as general partner and employee capital that does not earn fees. Amounts are reduced by outstanding capital commitments, for which capital has not yet been invested.
|
Net Accrued Performance Revenues
The following table presents the Accrued Performance Revenues, net of performance compensation, of the Blackstone Funds as of December 31, 2023 and 2022. Net Accrued Performance Revenues presented do not include clawback amounts, if any, which are disclosed in Note 19. “Commitments and Contingencies — Contingencies — Contingent Obligations (Clawback)” in the “Notes to Consolidated Financial Statements” in “— Item 8. Financial Statements and Supplementary Data” of this filing. See “— Non-GAAP Financial Measures” for our reconciliation of Net Accrued Performance Revenues.
105
|
December 31,
|
||||||||
|
2023
|
2022
|
|||||||
|
(Dollars in Millions)
|
||||||||
|
Real Estate
|
||||||||
|
BREP IV
|
$
|
2
|
|
$
|
6
|
|
||
|
BREP V
|
|
4
|
|
|
4
|
|
||
|
BREP VI
|
|
1
|
|
|
21
|
|
||
|
BREP VII
|
|
—
|
|
|
115
|
|
||
|
BREP VIII
|
|
572
|
|
|
749
|
|
||
|
BREP IX
|
|
744
|
|
|
1,011
|
|
||
|
BREP Europe IV
|
|
5
|
|
|
48
|
|
||
|
BREP Europe V
|
|
—
|
|
|
44
|
|
||
|
BREP Europe VI
|
|
104
|
|
|
49
|
|
||
|
BREP Asia I
|
|
92
|
|
|
108
|
|
||
|
BREP Asia II
|
|
—
|
|
|
119
|
|
||
|
BPP
|
|
129
|
|
|
633
|
|
||
|
BREDS
|
|
32
|
|
|
11
|
|
||
|
BTAS
|
|
2
|
|
|
25
|
|
||
|
|
|
|
|
|
|
|||
|
Total Real Estate (a)
|
|
1,687
|
|
|
2,944
|
|
||
|
|
|
|
|
|
|
|||
|
Private Equity
|
||||||||
|
BCP IV
|
|
—
|
|
|
6
|
|
||
|
BCP V
|
|
17
|
|
|
20
|
|
||
|
BCP VI
|
|
340
|
|
|
459
|
|
||
|
BCP VII
|
|
839
|
|
|
870
|
|
||
|
BCP VIII
|
|
366
|
|
|
256
|
|
||
|
BCP Asia I
|
|
149
|
|
|
144
|
|
||
|
BCP Asia II
|
|
32
|
|
|
—
|
|
||
|
BEP I
|
|
25
|
|
|
37
|
|
||
|
BEP II
|
|
78
|
|
|
27
|
|
||
|
BEP III
|
|
203
|
|
|
136
|
|
||
|
BCEP I
|
|
234
|
|
|
205
|
|
||
|
Tactical Opportunities
|
|
229
|
|
|
234
|
|
||
|
Strategic Partners
|
|
478
|
|
|
512
|
|
||
|
BIP
|
|
333
|
|
|
193
|
|
||
|
BXLS
|
|
82
|
|
|
25
|
|
||
|
BTAS/Other
|
|
173
|
|
|
174
|
|
||
|
|
|
|
|
|
|
|||
|
Total Private Equity (a)
|
|
3,581
|
|
|
3,298
|
|
||
|
|
|
|
|
|
|
|||
|
Credit & Insurance
|
|
286
|
|
|
312
|
|
||
|
|
|
|
|
|
|
|||
|
Hedge Fund Solutions
|
|
281
|
|
|
282
|
|
||
|
|
|
|
|
|
|
|||
|
Total Blackstone Net Accrued Performance Revenues
|
$
|
5,835
|
|
$
|
6,835
|
|
||
|
|
|
|
|
|
|
|||
Note: Totals may not add due to rounding.
|
(a)
|
Real Estate and Private Equity include co-investments, as applicable
|
For the year ended December 31, 2023, Net Accrued Performance Revenues receivable decreased due to net realized distributions of $1.8 billion, partially offset by Net Performance Revenues of $765.7 million.
106
Invested Performance Eligible Assets Under Management
The following presents our Invested Performance Eligible Assets Under Management as of December 31 of each year:

Note: Totals may not add due to rounding.
107
Perpetual Capital
The following presents our Perpetual Capital Total Assets Under Management as of December 31 of each year:
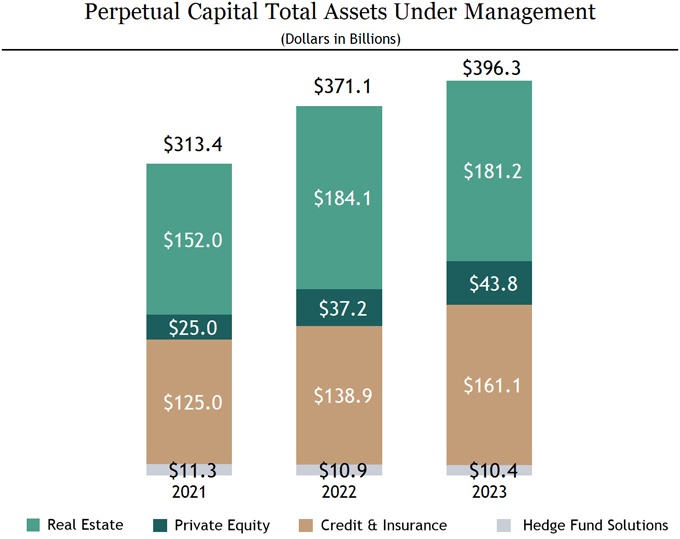
Note: Totals may not add due to rounding.
Perpetual Capital Total Assets Under Management were $396.3 billion as of December 31, 2023, an increase of $25.2 billion, compared to $371.1 billion as of December 31, 2022. Perpetual Capital Total Assets Under Management in our Credit & Insurance and Private Equity segments increased $22.2 billion and $6.6 billion, respectively. Principal drivers of these increases were:
|
•
|
In our Credit & Insurance segment, growth in insurance capital and BCRED resulted in increases of $14.8 billion and $5.9 billion, respectively.
|
|
•
|
In our Private Equity segment, growth in BIP resulted in an increase of $5.6 billion.
|
108
Investment Records
Fund returns information for our significant funds is included throughout this discussion and analysis to facilitate an understanding of our results of operations for the periods presented. The fund returns information reflected in this discussion and analysis is not indicative of the financial performance of Blackstone and is also not necessarily indicative of the future performance of any particular fund. An investment in Blackstone is not an investment in any of our funds. There can be no assurance that any of our funds or our other existing and future funds will achieve similar returns.
The following tables present the investment record of our significant carry/drawdown funds and selected perpetual capital strategies from inception through December 31, 2023:
109
Carry/Drawdown Funds
|
Fund (Investment Period
|
Committed
|
Available
|
Unrealized Investments
|
Realized Investments
|
Total Investments
|
Net IRRs (d)
|
||||||||||||||||||||||||||||||||||||||
|
Beginning Date / Ending Date) (a)
|
Capital
|
Capital (b)
|
Value
|
MOIC (c)
|
% Public
|
Value
|
MOIC (c)
|
Value
|
MOIC (c)
|
Realized
|
Total
|
|||||||||||||||||||||||||||||||||
|
(Dollars/Euros in Thousands, Except Where Noted)
|
||||||||||||||||||||||||||||||||||||||||||||
|
Real Estate
|
|
|||||||||||||||||||||||||||||||||||||||||||
|
Pre-BREP
|
$
|
140,714
|
|
$
|
—
|
|
$
|
—
|
|
|
n/a
|
|
|
—
|
|
$
|
345,190
|
|
|
2.5x
|
|
$
|
345,190
|
|
|
2.5x
|
|
|
33
|
%
|
|
33
|
%
|
|||||||||||
|
BREP I (Sep 1994 / Oct 1996)
|
|
380,708
|
|
|
—
|
|
|
—
|
|
|
n/a
|
|
|
—
|
|
|
1,327,708
|
|
|
2.8x
|
|
|
1,327,708
|
|
|
2.8x
|
|
|
40
|
%
|
|
40
|
%
|
|||||||||||
|
BREP II (Oct 1996 / Mar 1999)
|
|
1,198,339
|
|
|
—
|
|
|
—
|
|
|
n/a
|
|
|
—
|
|
|
2,531,614
|
|
|
2.1x
|
|
|
2,531,614
|
|
|
2.1x
|
|
|
19
|
%
|
|
19
|
%
|
|||||||||||
|
BREP III (Apr 1999 / Apr 2003)
|
|
1,522,708
|
|
|
—
|
|
|
—
|
|
|
n/a
|
|
|
—
|
|
|
3,330,406
|
|
|
2.4x
|
|
|
3,330,406
|
|
|
2.4x
|
|
|
21
|
%
|
|
21
|
%
|
|||||||||||
|
BREP IV (Apr 2003 / Dec 2005)
|
|
2,198,694
|
|
|
—
|
|
|
1,983
|
|
|
n/a
|
|
|
—
|
|
|
4,666,129
|
|
|
1.7x
|
|
|
4,668,112
|
|
|
1.7x
|
|
|
12
|
%
|
|
12
|
%
|
|||||||||||
|
BREP V (Dec 2005 / Feb 2007)
|
|
5,539,418
|
|
|
—
|
|
|
6,226
|
|
|
n/a
|
|
|
—
|
|
|
13,463,448
|
|
|
2.3x
|
|
|
13,469,674
|
|
|
2.3x
|
|
|
11
|
%
|
|
11
|
%
|
|||||||||||
|
BREP VI (Feb 2007 / Aug 2011)
|
|
11,060,122
|
|
|
—
|
|
|
5,797
|
|
|
n/a
|
|
|
—
|
|
|
27,758,980
|
|
|
2.5x
|
|
|
27,764,777
|
|
|
2.5x
|
|
|
13
|
%
|
|
13
|
%
|
|||||||||||
|
BREP VII (Aug 2011 / Apr 2015)
|
|
13,502,690
|
|
|
1,284,421
|
|
|
2,000,250
|
|
|
0.6x
|
|
|
—
|
|
|
28,399,471
|
|
|
2.3x
|
|
|
30,399,721
|
|
|
1.9x
|
|
|
20
|
%
|
|
14
|
%
|
|||||||||||
|
BREP VIII (Apr 2015 / Jun 2019)
|
|
16,601,896
|
|
|
2,126,652
|
|
|
12,577,721
|
|
|
1.5x
|
|
|
1
|
%
|
|
21,833,202
|
|
|
2.4x
|
|
|
34,410,923
|
|
|
1.9x
|
|
|
25
|
%
|
|
14
|
%
|
|||||||||||
|
BREP IX (Jun 2019 / Aug 2022)
|
|
21,346,598
|
|
|
3,379,621
|
|
|
24,992,884
|
|
|
1.4x
|
|
|
1
|
%
|
|
8,549,345
|
|
|
2.2x
|
|
|
33,542,229
|
|
|
1.5x
|
|
|
59
|
%
|
|
17
|
%
|
|||||||||||
|
*BREP X (Aug 2022 / Feb 2028)
|
|
30,498,731
|
|
|
28,234,499
|
|
|
2,477,931
|
|
|
1.1x
|
|
|
32
|
%
|
|
—
|
|
|
n/a
|
|
|
2,477,931
|
|
|
1.1x
|
|
|
n/
|
m
|
|
n/
|
m
|
|||||||||||
|
|
|
|
|
|
|
|
|
|
|
|
|
|
|
|
|
|
|
|
|
|
|
|
|
|
|
|
|
|
|
|
|
|
||||||||||||
|
Total Global BREP
|
$
|
103,990,618
|
|
$
|
35,025,193
|
|
$
|
42,062,792
|
|
|
1.3x
|
|
|
3
|
%
|
$
|
112,205,493
|
|
|
2.3x
|
|
$
|
154,268,285
|
|
|
1.9x
|
|
|
17
|
%
|
|
15
|
%
|
|||||||||||
|
|
|
|
|
|
|
|
|
|
|
|
|
|
|
|
|
|
|
|
|
|
|
|
|
|
|
|
|
|
|
|
|
|
||||||||||||
|
BREP Int’l (Jan 2001 / Sep 2005)
|
€
|
824,172
|
|
€
|
—
|
|
€
|
—
|
|
|
n/a
|
|
|
—
|
|
€
|
1,373,170
|
|
|
2.1x
|
|
€
|
1,373,170
|
|
|
2.1x
|
|
|
23
|
%
|
|
23
|
%
|
|||||||||||
|
BREP Int’l II (Sep 2005 / Jun 2008) (e)
|
|
1,629,748
|
|
|
—
|
|
|
—
|
|
|
n/a
|
|
|
—
|
|
|
2,583,032
|
|
|
1.8x
|
|
|
2,583,032
|
|
|
1.8x
|
|
|
8
|
%
|
|
8
|
%
|
|||||||||||
|
BREP Europe III (Jun 2008 / Sep 2013)
|
|
3,205,420
|
|
|
393,185
|
|
|
159,016
|
|
|
0.3x
|
|
|
—
|
|
|
5,856,192
|
|
|
2.4x
|
|
|
6,015,208
|
|
|
2.0x
|
|
|
18
|
%
|
|
13
|
%
|
|||||||||||
|
BREP Europe IV (Sep 2013 / Dec 2016)
|
|
6,674,949
|
|
|
1,280,424
|
|
|
1,084,235
|
|
|
0.8x
|
|
|
—
|
|
|
9,982,474
|
|
|
1.9x
|
|
|
11,066,709
|
|
|
1.7x
|
|
|
19
|
%
|
|
12
|
%
|
|||||||||||
|
BREP Europe V (Dec 2016 / Oct 2019)
|
|
7,979,853
|
|
|
1,121,512
|
|
|
4,589,558
|
|
|
0.9x
|
|
|
—
|
|
|
6,696,771
|
|
|
3.9x
|
|
|
11,286,329
|
|
|
1.6x
|
|
|
41
|
%
|
|
9
|
%
|
|||||||||||
|
BREP Europe VI (Oct 2019 / Sep 2023)
|
|
10,033,576
|
|
|
3,387,193
|
|
|
7,974,065
|
|
|
1.2x
|
|
|
—
|
|
|
3,427,886
|
|
|
2.6x
|
|
|
11,401,951
|
|
|
1.4x
|
|
|
72
|
%
|
|
16
|
%
|
|||||||||||
|
*BREP Europe VII (Sep 2023 / Mar 2029)
|
|
5,097,875
|
|
|
4,730,274
|
|
|
367,601
|
|
|
1.0x
|
|
|
—
|
|
|
—
|
|
|
n/a
|
|
|
367,601
|
|
|
1.0x
|
|
|
n/
|
a
|
|
n/
|
a
|
|||||||||||
|
|
|
|
|
|
|
|
|
|
|
|
|
|
|
|
|
|
|
|
|
|
|
|
|
|
|
|
|
|
|
|
|
|
||||||||||||
|
Total BREP Europe
|
€
|
35,445,593
|
|
€
|
10,912,588
|
|
€
|
14,174,475
|
|
|
1.0x
|
|
|
—
|
|
€
|
29,919,525
|
|
|
2.3x
|
|
€
|
44,094,000
|
|
|
1.6x
|
|
|
17
|
%
|
|
11
|
%
|
|||||||||||
|
|
|
|
|
|
|
|
|
|
|
|
|
|
|
|
|
|
|
|
|
|
|
|
|
|
|
|
|
|
|
|
|
|
||||||||||||
continued...
110
|
Fund (Investment Period
|
Committed
|
Available
|
Unrealized Investments
|
Realized Investments
|
Total Investments
|
Net IRRs (d)
|
||||||||||||||||||||||||||||||||||||||
|
Beginning Date / Ending Date) (a)
|
Capital
|
Capital (b)
|
Value
|
MOIC (c)
|
% Public
|
Value
|
MOIC (c)
|
Value
|
MOIC (c)
|
Realized
|
Total
|
|||||||||||||||||||||||||||||||||
|
(Dollars/Euros in Thousands, Except Where Noted)
|
||||||||||||||||||||||||||||||||||||||||||||
|
Real Estate (continued)
|
||||||||||||||||||||||||||||||||||||||||||||
|
BREP Asia I (Jun 2013 / Dec 2017)
|
$
|
4,262,075
|
|
$
|
898,228
|
|
$
|
1,640,959
|
|
|
1.6x
|
|
|
24
|
%
|
$
|
7,018,318
|
|
|
1.9x
|
|
$
|
8,659,277
|
|
|
1.9x
|
|
|
16
|
%
|
|
12
|
%
|
|||||||||||
|
BREP Asia II (Dec 2017 / Mar 2022)
|
|
7,354,782
|
|
|
1,310,674
|
|
|
6,783,639
|
|
|
1.2x
|
|
|
4
|
%
|
|
1,670,209
|
|
|
1.9x
|
|
|
8,453,848
|
|
|
1.3x
|
|
|
32
|
%
|
|
6
|
%
|
|||||||||||
|
*BREP Asia III (Mar 2022 / Sep 2027)
|
|
8,225,044
|
|
|
6,877,915
|
|
|
1,241,164
|
|
|
1.0x
|
|
|
—
|
|
|
—
|
|
|
n/a
|
|
|
1,241,164
|
|
|
1.0x
|
|
|
n/
|
a
|
|
-21
|
%
|
|||||||||||
|
|
|
|
|
|
|
|
|
|
|
|
|
|
|
|
|
|
|
|
|
|
|
|
|
|
|
|
|
|
|
|
|
|
||||||||||||
|
Total BREP Asia
|
|
19,841,901
|
|
|
9,086,817
|
|
|
9,665,762
|
|
|
1.2x
|
|
|
7
|
%
|
|
8,688,527
|
|
|
1.9x
|
|
|
18,354,289
|
|
|
1.5x
|
|
|
17
|
%
|
|
9
|
%
|
|||||||||||
|
|
|
|
|
|
|
|
|
|
|
|
|
|
|
|
|
|
|
|
|
|
|
|
|
|
|
|
|
|
|
|
|
|
||||||||||||
|
BREP Co-Investment (f)
|
|
7,308,836
|
|
|
40,457
|
|
|
918,951
|
|
|
2.0x
|
|
|
—
|
|
|
15,219,149
|
|
|
2.2x
|
|
|
16,138,100
|
|
|
2.2x
|
|
|
16
|
%
|
|
16
|
%
|
|||||||||||
|
|
|
|
|
|
|
|
|
|
|
|
|
|
|
|
|
|
|
|
|
|
|
|
|
|
|
|
|
|
|
|
|
|
||||||||||||
|
Total BREP
|
$
|
172,853,680
|
|
$
|
56,150,637
|
|
$
|
68,646,642
|
|
|
1.2x
|
|
|
3
|
%
|
$
|
172,689,772
|
|
|
2.3x
|
|
$
|
241,336,414
|
|
|
1.8x
|
|
|
17
|
%
|
|
14
|
%
|
|||||||||||
|
|
|
|
|
|
|
|
|
|
|
|
|
|
|
|
|
|
|
|
|
|
|
|
|
|
|
|
|
|
|
|
|
|
||||||||||||
|
*BREDS High-Yield (Various) (g)
|
|
24,060,116
|
|
|
8,065,536
|
|
|
5,916,743
|
|
|
1.0x
|
|
|
—
|
|
|
18,862,743
|
|
|
1.4x
|
|
|
24,779,486
|
|
|
1.2x
|
|
|
10
|
%
|
|
9
|
%
|
|||||||||||
|
Private Equity
|
||||||||||||||||||||||||||||||||||||||||||||
|
Corporate Private Equity
|
||||||||||||||||||||||||||||||||||||||||||||
|
BCP I (Oct 1987 / Oct 1993)
|
$
|
859,081
|
|
$
|
—
|
|
$
|
—
|
|
|
n/a
|
|
|
—
|
|
$
|
1,741,738
|
|
|
2.6x
|
|
$
|
1,741,738
|
|
|
2.6x
|
|
|
19
|
%
|
|
19
|
%
|
|||||||||||
|
BCP II (Oct 1993 / Aug 1997)
|
|
1,361,100
|
|
|
—
|
|
|
—
|
|
|
n/a
|
|
|
—
|
|
|
3,268,627
|
|
|
2.5x
|
|
|
3,268,627
|
|
|
2.5x
|
|
|
32
|
%
|
|
32
|
%
|
|||||||||||
|
BCP III (Aug 1997 / Nov 2002)
|
|
3,967,422
|
|
|
—
|
|
|
—
|
|
|
n/a
|
|
|
—
|
|
|
9,228,707
|
|
|
2.3x
|
|
|
9,228,707
|
|
|
2.3x
|
|
|
14
|
%
|
|
14
|
%
|
|||||||||||
|
BCOM (Jun 2000 / Jun 2006)
|
|
2,137,330
|
|
|
24,575
|
|
|
113
|
|
|
n/a
|
|
|
—
|
|
|
2,995,106
|
|
|
1.4x
|
|
|
2,995,219
|
|
|
1.4x
|
|
|
6
|
%
|
|
6
|
%
|
|||||||||||
|
BCP IV (Nov 2002 / Dec 2005)
|
|
6,773,182
|
|
|
195,824
|
|
|
231
|
|
|
n/a
|
|
|
—
|
|
|
21,720,334
|
|
|
2.9x
|
|
|
21,720,565
|
|
|
2.9x
|
|
|
36
|
%
|
|
36
|
%
|
|||||||||||
|
BCP V (Dec 2005 / Jan 2011)
|
|
21,009,112
|
|
|
1,035,259
|
|
|
69,929
|
|
|
n/a
|
|
|
100
|
%
|
|
38,790,444
|
|
|
1.9x
|
|
|
38,860,373
|
|
|
1.9x
|
|
|
8
|
%
|
|
8
|
%
|
|||||||||||
|
BCP VI (Jan 2011 / May 2016)
|
|
15,195,265
|
|
|
1,341,048
|
|
|
4,731,061
|
|
|
2.1x
|
|
|
21
|
%
|
|
28,090,440
|
|
|
2.2x
|
|
|
32,821,501
|
|
|
2.2x
|
|
|
14
|
%
|
|
12
|
%
|
|||||||||||
|
BCP VII (May 2016 / Feb 2020)
|
|
18,857,164
|
|
|
1,693,962
|
|
|
18,921,082
|
|
|
1.6x
|
|
|
21
|
%
|
|
15,928,343
|
|
|
2.5x
|
|
|
34,849,425
|
|
|
1.9x
|
|
|
29
|
%
|
|
13
|
%
|
|||||||||||
|
*BCP VIII (Feb 2020 / Feb 2026)
|
|
25,658,729
|
|
|
11,117,449
|
|
|
19,868,056
|
|
|
1.4x
|
|
|
7
|
%
|
|
1,506,944
|
|
|
2.5x
|
|
|
21,375,000
|
|
|
1.4x
|
|
|
n/
|
m
|
|
11
|
%
|
|||||||||||
|
BCP IX (TBD)
|
|
17,852,339
|
|
|
17,852,339
|
|
|
—
|
|
|
n/a
|
|
|
—
|
|
|
—
|
|
|
n/a
|
|
|
—
|
|
|
n/a
|
|
|
n/
|
a
|
|
n/
|
a
|
|||||||||||
|
Energy I (Aug 2011 / Feb 2015)
|
|
2,441,558
|
|
|
174,492
|
|
|
479,698
|
|
|
1.5x
|
|
|
55
|
%
|
|
4,174,235
|
|
|
2.0x
|
|
|
4,653,933
|
|
|
1.9x
|
|
|
14
|
%
|
|
11
|
%
|
|||||||||||
|
Energy II (Feb 2015 / Feb 2020)
|
|
4,917,864
|
|
|
864,501
|
|
|
3,829,333
|
|
|
1.7x
|
|
|
62
|
%
|
|
3,937,288
|
|
|
1.7x
|
|
|
7,766,621
|
|
|
1.7x
|
|
|
11
|
%
|
|
8
|
%
|
|||||||||||
|
*Energy III (Feb 2020 / Feb 2026)
|
|
4,371,917
|
|
|
1,579,382
|
|
|
4,867,811
|
|
|
1.8x
|
|
|
16
|
%
|
|
1,307,128
|
|
|
2.4x
|
|
|
6,174,939
|
|
|
1.9x
|
|
|
55
|
%
|
|
34
|
%
|
|||||||||||
|
Energy Transition IV (TBD)
|
|
2,642,347
|
|
|
2,642,347
|
|
|
—
|
|
|
n/a
|
|
|
—
|
|
|
—
|
|
|
n/a
|
|
|
—
|
|
|
n/a
|
|
|
n/
|
a
|
|
n/
|
a
|
|||||||||||
|
BCP Asia I (Dec 2017 / Sep 2021)
|
|
2,438,028
|
|
|
418,459
|
|
|
3,317,476
|
|
|
1.8x
|
|
|
31
|
%
|
|
1,787,587
|
|
|
4.9x
|
|
|
5,105,063
|
|
|
2.3x
|
|
|
96
|
%
|
|
28
|
%
|
|||||||||||
|
*BCP Asia II (Sep 2021 / Sep 2027)
|
|
6,656,718
|
|
|
4,910,184
|
|
|
2,208,855
|
|
|
1.5x
|
|
|
10
|
%
|
|
25
|
|
|
n/a
|
|
|
2,208,880
|
|
|
1.5x
|
|
|
n/
|
a
|
|
22
|
%
|
|||||||||||
|
Core Private Equity I (Jan 2017 / Mar 2021) (h)
|
|
4,761,597
|
|
|
1,167,697
|
|
|
7,426,538
|
|
|
2.0x
|
|
|
—
|
|
|
2,482,074
|
|
|
4.5x
|
|
|
9,908,612
|
|
|
2.3x
|
|
|
57
|
%
|
|
18
|
%
|
|||||||||||
|
*Core Private Equity II (Mar 2021 / Mar 2026) (h)
|
|
8,205,237
|
|
|
5,690,657
|
|
|
3,469,156
|
|
|
1.4x
|
|
|
—
|
|
|
68,770
|
|
|
n/a
|
|
|
3,537,926
|
|
|
1.5x
|
|
|
n/
|
a
|
|
16
|
%
|
|||||||||||
|
|
|
|
|
|
|
|
|
|
|
|
|
|
|
|
|
|
|
|
|
|
|
|
|
|
|
|
|
|
|
|
|
|
||||||||||||
|
Total Corporate Private Equity
|
$
|
150,105,990
|
|
$
|
50,708,175
|
|
$
|
69,189,339
|
|
|
1.6x
|
|
|
16
|
%
|
$
|
137,027,790
|
|
|
2.2x
|
|
$
|
206,217,129
|
|
|
2.0x
|
|
|
16
|
%
|
|
15
|
%
|
|||||||||||
|
|
|
|
|
|
|
|
|
|
|
|
|
|
|
|
|
|
|
|
|
|
|
|
|
|
|
|
|
|
|
|
|
|
||||||||||||
continued...
111
|
Fund (Investment Period
|
Committed
|
Available
|
Unrealized Investments
|
Realized Investments
|
Total Investments
|
Net IRRs (d)
|
||||||||||||||||||||||||||||||||||||||
|
Beginning Date / Ending Date) (a)
|
Capital
|
Capital (b)
|
Value
|
MOIC (c)
|
% Public
|
Value
|
MOIC (c)
|
Value
|
MOIC (c)
|
Realized
|
Total
|
|||||||||||||||||||||||||||||||||
|
(Dollars/Euros in Thousands, Except Where Noted)
|
||||||||||||||||||||||||||||||||||||||||||||
|
Private Equity (continued)
|
||||||||||||||||||||||||||||||||||||||||||||
|
Tactical Opportunities
|
||||||||||||||||||||||||||||||||||||||||||||
|
*Tactical Opportunities (Various)
|
$
|
30,971,115
|
|
$
|
15,765,172
|
|
$
|
12,385,194
|
|
|
1.2x
|
|
|
9
|
%
|
$
|
23,023,393
|
|
|
1.8x
|
|
$
|
35,408,587
|
|
|
1.6x
|
|
|
15
|
%
|
|
11
|
%
|
|||||||||||
|
*Tactical Opportunities Co-Investment and Other (Various)
|
|
10,043,477
|
|
|
1,427,711
|
|
|
4,690,499
|
|
|
1.6x
|
|
|
7
|
%
|
|
9,205,600
|
|
|
1.6x
|
|
|
13,896,099
|
|
|
1.6x
|
|
|
19
|
%
|
|
16
|
%
|
|||||||||||
|
|
|
|
|
|
|
|
|
|
|
|
|
|
|
|
|
|
|
|
|
|
|
|
|
|
|
|
|
|
|
|
|
|
||||||||||||
|
Total Tactical Opportunities
|
$
|
41,014,592
|
|
$
|
17,192,883
|
|
$
|
17,075,693
|
|
|
1.3x
|
|
|
8
|
%
|
$
|
32,228,993
|
|
|
1.8x
|
|
$
|
49,304,686
|
|
|
1.6x
|
|
|
16
|
%
|
|
12
|
%
|
|||||||||||
|
|
|
|
|
|
|
|
|
|
|
|
|
|
|
|
|
|
|
|
|
|
|
|
|
|
|
|
|
|
|
|
|
|
||||||||||||
|
Growth
|
||||||||||||||||||||||||||||||||||||||||||||
|
*BXG I (Jul 2020 / Jul 2025)
|
$
|
5,056,267
|
|
$
|
1,222,437
|
|
$
|
3,503,415
|
|
|
1.0x
|
|
|
2
|
%
|
$
|
497,131
|
|
|
2.7x
|
|
$
|
4,000,546
|
|
|
1.0x
|
|
|
n/
|
m
|
|
-2
|
%
|
|||||||||||
|
BXG II (TBD)
|
|
4,093,732
|
|
|
4,093,732
|
|
|
—
|
|
|
n/a
|
|
|
—
|
|
|
—
|
|
|
n/a
|
|
|
—
|
|
|
n/a
|
|
|
n
|
/a
|
|
n/
|
a
|
|||||||||||
|
|
|
|
|
|
|
|
|
|
|
|
|
|
|
|
|
|
|
|
|
|
|
|
|
|
|
|
|
|
|
|
|
|
||||||||||||
|
Total Growth
|
$
|
9,149,999
|
|
$
|
5,316,169
|
|
$
|
3,503,415
|
|
|
1.0x
|
|
|
2
|
%
|
$
|
497,131
|
|
|
2.7x
|
|
$
|
4,000,546
|
|
|
1.0x
|
|
|
n/
|
m
|
|
-2
|
%
|
|||||||||||
|
|
|
|
|
|
|
|
|
|
|
|
|
|
|
|
|
|
|
|
|
|
|
|
|
|
|
|
|
|
|
|
|
|
||||||||||||
|
Strategic Partners (Secondaries)
|
||||||||||||||||||||||||||||||||||||||||||||
|
Strategic Partners I-V (Various) (i)
|
|
11,035,527
|
|
|
139,647
|
|
|
15,736
|
|
|
n/a
|
|
|
—
|
|
|
16,776,139
|
|
|
n/a
|
|
|
16,791,875
|
|
|
1.7x
|
|
|
n
|
/a
|
|
13
|
%
|
|||||||||||
|
Strategic Partners VI (Apr 2014 / Apr 2016) (i)
|
|
4,362,772
|
|
|
611,267
|
|
|
816,248
|
|
|
n/a
|
|
|
—
|
|
|
4,237,948
|
|
|
n/a
|
|
|
5,054,196
|
|
|
1.7x
|
|
|
n
|
/a
|
|
14
|
%
|
|||||||||||
|
Strategic Partners VII (May 2016 / Mar 2019) (i)
|
|
7,489,970
|
|
|
1,570,496
|
|
|
4,164,820
|
|
|
n/a
|
|
|
—
|
|
|
6,551,800
|
|
|
n/a
|
|
|
10,716,620
|
|
|
1.9x
|
|
|
n
|
/a
|
|
17
|
%
|
|||||||||||
|
Strategic Partners Real Assets II (May 2017 / Jun 2020) (i)
|
|
1,749,807
|
|
|
471,876
|
|
|
1,204,611
|
|
|
n/a
|
|
|
—
|
|
|
1,113,866
|
|
|
n/a
|
|
|
2,318,477
|
|
|
1.7x
|
|
|
n
|
/a
|
|
16
|
%
|
|||||||||||
|
Strategic Partners VIII (Mar 2019 / Oct 2021) (i)
|
|
10,763,600
|
|
|
4,348,349
|
|
|
8,023,258
|
|
|
n/a
|
|
|
—
|
|
|
6,060,532
|
|
|
n/a
|
|
|
14,083,790
|
|
|
1.8x
|
|
|
n
|
/a
|
|
29
|
%
|
|||||||||||
|
*Strategic Partners Real Estate, SMA and Other (Various) (i)
|
|
7,055,590
|
|
|
2,436,365
|
|
|
1,994,397
|
|
|
n/a
|
|
|
—
|
|
|
2,001,796
|
|
|
n/a
|
|
|
3,996,193
|
|
|
1.6x
|
|
|
n
|
/a
|
|
14
|
%
|
|||||||||||
|
*Strategic Partners Infrastructure III (Jun 2020 / Jul 2024) (i)
|
|
3,250,100
|
|
|
870,479
|
|
|
1,961,697
|
|
|
n/a
|
|
|
—
|
|
|
249,542
|
|
|
n/a
|
|
|
2,211,239
|
|
|
1.4x
|
|
|
n
|
/a
|
|
32
|
%
|
|||||||||||
|
*Strategic Partners IX (Oct 2021 / Jan 2027) (i)
|
|
19,492,126
|
|
|
11,482,287
|
|
|
5,386,344
|
|
|
n/a
|
|
|
—
|
|
|
662,344
|
|
|
n/a
|
|
|
6,048,688
|
|
|
1.3x
|
|
|
n
|
/a
|
|
18
|
%
|
|||||||||||
|
*Strategic Partners GP Solutions (Jun 2021 / Dec 2026) (i)
|
|
2,045,211
|
|
|
850,868
|
|
|
714,059
|
|
|
n/a
|
|
|
—
|
|
|
—
|
|
|
n/a
|
|
|
714,059
|
|
|
1.0x
|
|
|
n
|
/a
|
|
-3
|
%
|
|||||||||||
|
|
|
|
|
|
|
|
|
|
|
|
|
|
|
|
|
|
|
|
|
|
|
|
|
|
|
|
|
|
|
|
|
|
||||||||||||
|
Total Strategic Partners (Secondaries)
|
$
|
67,244,703
|
|
$
|
22,781,634
|
|
$
|
24,281,170
|
|
|
n/a
|
|
|
—
|
|
$
|
37,653,967
|
|
|
n/a
|
|
$
|
61,935,137
|
|
|
1.7x
|
|
|
n
|
/a
|
|
15
|
%
|
|||||||||||
|
|
|
|
|
|
|
|
|
|
|
|
|
|
|
|
|
|
|
|
|
|
|
|
|
|
|
|
|
|
|
|
|
|
||||||||||||
|
Life Sciences
|
||||||||||||||||||||||||||||||||||||||||||||
|
Clarus IV (Jan 2018 / Jan 2020)
|
|
910,000
|
|
|
81,728
|
|
|
773,667
|
|
|
1.9x
|
|
|
—
|
|
|
369,363
|
|
|
1.1x
|
|
|
1,143,030
|
|
|
1.5x
|
|
|
-4
|
%
|
|
9
|
%
|
|||||||||||
|
*BXLS V (Jan 2020 / Jan 2025)
|
|
4,948,559
|
|
|
2,989,827
|
|
|
2,654,776
|
|
|
1.6x
|
|
|
5
|
%
|
|
361,841
|
|
|
1.1x
|
|
|
3,016,617
|
|
|
1.5x
|
|
|
n/
|
m
|
|
13
|
%
|
|||||||||||
continued...
112
|
Fund (Investment Period
|
Committed
|
Available
|
Unrealized Investments
|
Realized Investments
|
Total Investments
|
Net IRRs (d)
|
||||||||||||||||||||||||||||||||||||
|
Beginning Date / Ending Date) (a)
|
Capital
|
Capital (b)
|
Value
|
MOIC (c)
|
% Public
|
Value
|
MOIC (c)
|
Value
|
MOIC (c)
|
Realized
|
Total
|
|||||||||||||||||||||||||||||||
|
(Dollars/Euros in Thousands, Except Where Noted)
|
||||||||||||||||||||||||||||||||||||||||||
|
Credit
|
||||||||||||||||||||||||||||||||||||||||||
|
Mezzanine / Opportunistic I (Jul 2007 / Oct 2011)
|
$
|
2,000,000
|
|
$
|
97,114
|
|
$
|
—
|
|
|
n/a
|
|
|
—
|
|
$
|
4,809,113
|
|
|
1.6x
|
|
$
|
4,809,113
|
|
|
1.6x
|
|
|
n/a
|
|
17%
|
|||||||||||
|
Mezzanine / Opportunistic II (Nov 2011 / Nov 2016)
|
|
4,120,000
|
|
|
993,179
|
|
|
179,941
|
|
|
0.2x
|
|
|
—
|
|
|
6,591,362
|
|
|
1.6x
|
|
|
6,771,303
|
|
|
1.4x
|
|
|
n/a
|
|
10%
|
|||||||||||
|
Mezzanine / Opportunistic III (Sep 2016 / Jan 2021)
|
|
6,639,133
|
|
|
1,106,840
|
|
|
2,309,594
|
|
|
1.0x
|
|
|
—
|
|
|
7,572,576
|
|
|
1.6x
|
|
|
9,882,170
|
|
|
1.4x
|
|
|
n/a
|
|
10%
|
|||||||||||
|
*Mezzanine / Opportunistic IV (Jan 2021 / Jan 2026)
|
|
5,016,771
|
|
|
2,381,115
|
|
|
3,613,613
|
|
|
1.1x
|
|
|
—
|
|
|
792,732
|
|
|
1.8x
|
|
|
4,406,345
|
|
|
1.2x
|
|
|
n/a
|
|
13%
|
|||||||||||
|
Stressed / Distressed I (Sep 2009 / May 2013)
|
|
3,253,143
|
|
|
—
|
|
|
—
|
|
|
n/a
|
|
|
—
|
|
|
5,777,098
|
|
|
1.3x
|
|
|
5,777,098
|
|
|
1.3x
|
|
|
n/a
|
|
9%
|
|||||||||||
|
Stressed / Distressed II (Jun 2013 / Jun 2018)
|
|
5,125,000
|
|
|
547,430
|
|
|
196,970
|
|
|
0.3x
|
|
|
—
|
|
|
5,387,034
|
|
|
1.2x
|
|
|
5,584,004
|
|
|
1.1x
|
|
|
n/a
|
|
1%
|
|||||||||||
|
Stressed / Distressed III (Dec 2017 / Dec 2022)
|
|
7,356,380
|
|
|
1,279,457
|
|
|
3,052,396
|
|
|
1.2x
|
|
|
—
|
|
|
3,243,803
|
|
|
1.2x
|
|
|
6,296,199
|
|
|
1.2x
|
|
|
n/a
|
|
9%
|
|||||||||||
|
Energy I (Nov 2015 / Nov 2018)
|
|
2,856,867
|
|
|
1,154,846
|
|
|
331,416
|
|
|
0.8x
|
|
|
—
|
|
|
3,206,611
|
|
|
1.6x
|
|
|
3,538,027
|
|
|
1.5x
|
|
|
n/a
|
|
10%
|
|||||||||||
|
Energy II (Feb 2019 / Jun 2023)
|
|
3,616,081
|
|
|
1,547,033
|
|
|
1,815,358
|
|
|
1.1x
|
|
|
—
|
|
|
1,792,881
|
|
|
1.6x
|
|
|
3,608,239
|
|
|
1.3x
|
|
|
n/a
|
|
17%
|
|||||||||||
|
*Green Energy III (May 2023 / May 2028)
|
|
6,477,000
|
|
|
5,813,477
|
|
|
670,209
|
|
|
1.0x
|
|
|
—
|
|
|
14,159
|
|
|
n/a
|
|
|
684,368
|
|
|
1.0x
|
|
|
n/a
|
|
n/m
|
|||||||||||
|
European Senior Debt I (Feb 2015 / Feb 2019)
|
€
|
1,964,689
|
|
€
|
140,688
|
|
€
|
511,139
|
|
|
0.7x
|
|
|
—
|
|
€
|
2,673,875
|
|
|
1.3x
|
|
€
|
3,185,014
|
|
|
1.2x
|
|
|
n/a
|
|
2%
|
|||||||||||
|
European Senior Debt II (Jun 2019 / Jun 2023) (j)
|
€
|
4,088,344
|
|
€
|
969,353
|
|
€
|
4,391,907
|
|
|
1.0x
|
|
|
—
|
|
€
|
1,992,593
|
|
|
2.2x
|
|
€
|
6,384,500
|
|
|
1.2x
|
|
|
n/a
|
|
10%
|
|||||||||||
|
|
|
|
|
|
|
|
|
|
|
|
|
|
|
|
|
|
|
|
|
|
|
|
|
|
|
|
|
|
|
|
||||||||||||
|
Total Credit Drawdown Funds (k)
|
$
|
53,366,033
|
|
$
|
16,146,706
|
|
$
|
17,573,818
|
|
|
1.0x
|
|
|
—
|
|
$
|
44,574,003
|
|
|
1.5x
|
|
$
|
62,147,821
|
|
|
1.3x
|
|
|
n/a
|
|
10%
|
|||||||||||
|
|
|
|
|
|
|
|
|
|
|
|
|
|
|
|
|
|
|
|
|
|
|
|
|
|
|
|
|
|
|
|
||||||||||||
113
Selected Perpetual Capital Strategies (l)
|
Strategy (Inception Year) (a)
|
Investment Strategy
|
Total Assets
Under Management |
Total Net
Return (m) |
|||||||||
|
(Dollars in Thousands, Except Where Noted)
|
||||||||||||
|
Real Estate
|
||||||||||||
|
BPP—Blackstone Property Partners Platform (2013) (n)
|
|
Core+ Real Estate
|
|
$
|
65,917,602
|
|
|
7
|
%
|
|||
|
BREIT—Blackstone Real Estate Income Trust (2017) (o)
|
|
Core+ Real Estate
|
|
|
60,728,619
|
|
|
10
|
%
|
|||
|
BREIT—Class I (p)
|
|
Core+ Real Estate
|
|
|
11
|
%
|
||||||
|
BXMT—Blackstone Mortgage Trust (2013) (q)
|
|
Real Estate Debt
|
|
|
6,385,586
|
|
|
7
|
%
|
|||
|
Private Equity
|
||||||||||||
|
BIP—Blackstone Infrastructure Partners (2019) (r)
|
|
Infrastructure
|
|
|
31,835,343
|
|
|
15
|
%
|
|||
|
Credit
|
||||||||||||
|
BXSL—Blackstone Secured Lending Fund (2018) (s)
|
|
U.S. Direct Lending
|
|
|
11,250,141
|
|
|
11
|
%
|
|||
|
BCRED—Blackstone Private Credit Fund (2021) (t)
|
|
U.S. Direct Lending
|
|
|
64,469,210
|
|
|
10
|
%
|
|||
|
BCRED—Class I (u)
|
|
U.S. Direct Lending
|
|
|
10
|
%
|
||||||
|
Hedge Fund Solutions
|
||||||||||||
|
BSCH—Blackstone Strategic Capital Holdings (2014) (v)
|
|
GP Stakes
|
|
|
9,396,234
|
|
|
11
|
%
|
|||
The returns presented herein represent those of the applicable Blackstone Funds and not those of Blackstone.
|
n/m
|
Not meaningful generally due to the limited time since initial investment.
|
|
n/a
|
Not applicable.
|
|
SMA
|
Separately managed account.
|
|
*
|
Represents funds that are currently in their investment period.
|
|
(a)
|
Excludes investment vehicles where Blackstone does not earn fees.
|
|
(b)
|
Available Capital represents total investable capital commitments, including side-by-side, adjusted for certain expenses and expired or recallable capital and may include leverage, less invested capital. This amount is not reduced by outstanding commitments to investments.
|
|
(c)
|
Multiple of Invested Capital (“MOIC”) represents carrying value, before management fees, expenses and Performance Revenues, divided by invested capital.
|
|
(d)
|
Unless otherwise indicated, Net Internal Rate of Return (“IRR”) represents the annualized inception to December 31, 2023 IRR on total invested capital based on realized proceeds and unrealized value, as applicable, after management fees, expenses and Performance Revenues. IRRs are calculated using actual timing of limited partner cash flows. Initial inception date of cash flows may differ from the Investment Period Beginning Date.
|
|
(e)
|
The 8% Realized Net IRR and 8% Total Net IRR exclude investors that opted out of the Hilton investment opportunity. Overall BREP International II performance reflects a 7% Realized Net IRR and a 7% Total Net IRR.
|
|
(f)
|
BREP Co-Investment represents co-investment capital raised for various BREP investments. The Net IRR reflected is calculated by aggregating each co-investment’s realized proceeds and unrealized value, as applicable, after management fees, expenses and Performance Revenues.
|
|
(g)
|
BREDS High-Yield represents the flagship real estate debt drawdown funds only.
|
|
(h)
|
Blackstone Core Equity Partners is a core private equity strategy which invests with a more modest risk profile and longer hold period than traditional private equity.
|
|
(i)
|
Strategic Partners’ Unrealized Investment Value, Realized Investment Value, Total Investment Value, Total MOIC and Total Net IRRs are reported on a three-month lag and therefore do not include the impact of economic and market activities in the current quarter. Prior to June 30, 2023, the calculation of such metrics also incorporated investor cash flow information from the current quarter to the extent available.
|
114
|
Effective June 30, 2023, such current quarter cash flow information is no longer incorporated. Committed Capital and Available Capital continue to be presented as of the current quarter. We believe the updated presentation is more reflective of the Strategic Partners’ investor experience. Realizations are treated as returns of capital until fully recovered and therefore Unrealized and Realized MOICs and Realized Net IRRs are not applicable. Effective June 30, 2023, Strategic Partners I-V and Strategic Partners Real Estate, SMA and Other exclude investment vehicles where Blackstone does not earn fees, which were previously included.
|
|
(j)
|
European Senior Debt II Levered has a net return of 16%, European Senior Debt II Unlevered has a net return of 8%.
|
|
(k)
|
Funds presented represent the flagship credit drawdown funds only. The Total Credit Net IRR is the combined IRR of the credit drawdown funds presented.
|
|
(l)
|
Represents the performance for select Perpetual Capital Strategies; strategies excluded consist primarily of (1) investment strategies that have been investing for less than one year, (2) perpetual capital assets managed for certain insurance clients, and (3) investment vehicles where Blackstone does not earn fees.
|
|
(m)
|
Unless otherwise indicated, Total Net Return represents the annualized inception to December 31, 2023 IRR on total invested capital based on realized proceeds and unrealized value, as applicable, after management fees, expenses and Performance Revenues. IRRs are calculated using actual timing of investor cash flows. Initial inception date of cash flows occurred during the Inception Year.
|
|
(n)
|
BPP represents the aggregate Total Assets Under Management and Total Net Return of the BPP Platform, which comprises over 30 funds, co-investment and separately managed account vehicles. It includes certain vehicles managed as part of the BPP Platform but not classified as Perpetual Capital. As of December 31, 2023, these vehicles represented $2.7 billion of Total Assets Under Management.
|
|
(o)
|
The BREIT Total Net Return reflects a per share blended return, assuming BREIT had a single share class, reinvestment of all dividends received during the period, and no upfront selling commission, net of all fees and expenses incurred by BREIT. This return is not representative of the return experienced by any particular investor or share class. Total Net Return is presented on an annualized basis and is from January 1, 2017.
|
|
(p)
|
Represents the Total Net Return for BREIT’s Class I shares, its largest share class. Performance varies by share class. Class I Total Net Return assumes reinvestment of all dividends received during the period, and no upfront selling commission, net of all fees and expenses incurred by BREIT, Class I Total Net Return is presented on an annualized basis and is from January 1, 2017.
|
|
(q)
|
The BXMT Total Net Return reflects annualized market return of a shareholder invested in BXMT since inception, May 22, 2013, assuming reinvestment of all dividends received during the period.
|
|
(r)
|
Including co-investment vehicles, BIP Total Assets Under Management is $40.8 billion.
|
|
(s)
|
The BXSL Total Assets Under Management and Total Net Return are presented as of September 30, 2023. Refer to BXSL public filings for current quarter results. BXSL Total Net Return reflects the change in Net Asset Value (“NAV”) per share, plus distributions per share (assuming dividends and distributions are reinvested in accordance with BXSL’s dividend reinvestment plan) divided by the beginning NAV per share. Total Net Returns are presented on an annualized basis and are from November 20, 2018.
|
|
(t)
|
The BCRED Total Net Return reflects a per share blended return, assuming BCRED had a single share class, reinvestment of all dividends received during the period, and no upfront selling commission, net of all fees and expenses incurred by BCRED. This return is not representative of the return experienced by any particular investor or share class. Total Net Return is presented on an annualized basis and is from January 7, 2021. Total Assets Under Management reflects gross asset value plus amounts borrowed or available to be borrowed under certain credit facilities. BCRED net asset value as of December 31, 2023 was $28.5 billion.
|
|
(u)
|
Represents the Total Net Return for BCRED’s Class I shares, its largest share class. Performance varies by share class. Class I Total Net Return assumes reinvestment of all dividends received during the period, and no upfront selling commission, net of all fees and expenses incurred by BCRED. Class I Total Net Return is presented on an annualized basis and is from January 7, 2021.
|
115
|
(v)
|
BSCH represents the aggregate Total Assets Under Management and Total Net Return of BSCH I and BSCH II funds that invest as part of the GP Stakes strategy, which targets minority investments in the general partners of private equity and other private-market alternative asset management firms globally. Including co-investment vehicles that do not pay fees, BSCH Total Assets Under Management is $10.4 billion.
|
Segment Analysis
Discussed below is our Segment Distributable Earnings for each of our segments. This information is reflected in the manner utilized by our senior management to make operating decisions, assess performance and allocate resources. References to “our” sectors or investments may also refer to portfolio companies and investments of the underlying funds that we manage.
Real Estate
The following table presents the results of operations for our Real Estate segment:
|
Year Ended December 31,
|
2023 vs. 2022
|
2022 vs. 2021
|
||||||||||||||||||||||||||
|
2023
|
2022
|
2021
|
$
|
%
|
$
|
%
|
||||||||||||||||||||||
|
(Dollars in Thousands)
|
||||||||||||||||||||||||||||
|
Management Fees, Net
|
||||||||||||||||||||||||||||
|
Base Management Fees
|
$
|
2,794,232
|
|
$
|
2,462,179
|
|
$
|
1,895,412
|
|
$
|
332,053
|
|
|
13
|
%
|
$
|
566,767
|
|
|
30
|
%
|
|||||||
|
Transaction and Other Fees, Net
|
|
78,483
|
|
|
171,424
|
|
|
160,395
|
|
|
(92,941
|
)
|
|
-54
|
%
|
|
11,029
|
|
|
7
|
%
|
|||||||
|
Management Fee Offsets
|
|
(29,357
|
)
|
|
(10,538
|
)
|
|
(3,499
|
)
|
|
(18,819
|
)
|
|
179
|
%
|
|
(7,039
|
)
|
|
201
|
%
|
|||||||
|
|
|
|
|
|
|
|
|
|
|
|
|
|
|
|
|
|
|
|
|
|
||||||||
|
Total Management Fees, Net
|
|
2,843,358
|
|
|
2,623,065
|
|
|
2,052,308
|
|
|
220,293
|
|
|
8
|
%
|
|
570,757
|
|
|
28
|
%
|
|||||||
|
Fee Related Performance Revenues
|
|
294,240
|
|
|
1,075,424
|
|
|
1,695,019
|
|
|
(781,184
|
)
|
|
-73
|
%
|
|
(619,595
|
)
|
|
-37
|
%
|
|||||||
|
Fee Related Compensation
|
|
(675,880
|
)
|
|
(1,039,125
|
)
|
|
(1,161,349
|
)
|
|
363,245
|
|
|
-35
|
%
|
|
122,224
|
|
|
-11
|
%
|
|||||||
|
Other Operating Expenses
|
|
(325,050
|
)
|
|
(315,331
|
)
|
|
(234,505
|
)
|
|
(9,719
|
)
|
|
3
|
%
|
|
(80,826
|
)
|
|
34
|
%
|
|||||||
|
|
|
|
|
|
|
|
|
|
|
|
|
|
|
|
|
|
|
|
|
|
||||||||
|
Fee Related Earnings
|
|
2,136,668
|
|
|
2,344,033
|
|
|
2,351,473
|
|
|
(207,365
|
)
|
|
-9
|
%
|
|
(7,440
|
)
|
|
—
|
|
|||||||
|
|
|
|
|
|
|
|
|
|
|
|
|
|
|
|
|
|
|
|
|
|
||||||||
|
Realized Performance Revenues
|
|
244,358
|
|
|
2,985,713
|
|
|
1,119,612
|
|
|
(2,741,355
|
)
|
|
-92
|
%
|
|
1,866,101
|
|
|
167
|
%
|
|||||||
|
Realized Performance Compensation
|
|
(123,299
|
)
|
|
(1,168,045
|
)
|
|
(443,220
|
)
|
|
1,044,746
|
|
|
-89
|
%
|
|
(724,825
|
)
|
|
164
|
%
|
|||||||
|
Realized Principal Investment Income
|
|
7,628
|
|
|
150,790
|
|
|
196,869
|
|
|
(143,162
|
)
|
|
-95
|
%
|
|
(46,079
|
)
|
|
-23
|
%
|
|||||||
|
|
|
|
|
|
|
|
|
|
|
|
|
|
|
|
|
|
|
|
|
|
||||||||
|
Net Realizations
|
|
128,687
|
|
|
1,968,458
|
|
|
873,261
|
|
|
(1,839,771
|
)
|
|
-93
|
%
|
|
1,095,197
|
|
|
125
|
%
|
|||||||
|
|
|
|
|
|
|
|
|
|
|
|
|
|
|
|
|
|
|
|
|
|
||||||||
|
Segment Distributable Earnings
|
$
|
2,265,355
|
|
$
|
4,312,491
|
|
$
|
3,224,734
|
|
$
|
(2,047,136
|
)
|
|
-47
|
%
|
$
|
1,087,757
|
|
|
34
|
%
|
|||||||
|
|
|
|
|
|
|
|
|
|
|
|
|
|
|
|
|
|
|
|
|
|
||||||||
|
n/m
|
Not meaningful.
|
Year Ended December 31, 2023 Compared to Year Ended December 31, 2022
Segment Distributable Earnings were $2.3 billion for the year ended December 31, 2023, a decrease of $2.0 billion, compared to $4.3 billion for the year ended December 31, 2022. The decrease in Segment Distributable Earnings was attributable to decreases of $207.4 million in Fee Related Earnings and $1.8 billion in Net Realizations.
Our global opportunistic and Core+ real estate portfolios’ concentration in high-conviction sectors where we see favorable long-term fundamentals helped support performance in a challenging market environment in 2023. Notably, strong demand drove operating performance in key sectors, including digital infrastructure, logistics and student housing. Notwithstanding this strength, the real estate market has been characterized by divergent performance across sectors. Growth has slowed and may moderate further in certain sectors with elevated near-term supply, including U.S. multifamily and life sciences office, which has negatively impacted valuations of such assets. Weak fundamentals persisted in the U.S. office market, where traditional office buildings remained
116
particularly challenged. Traditional U.S. office, however, represents less than 2% of the aggregate net asset value of our global opportunistic and Core+ real estate portfolios. Additionally, in 2023, higher interest rates negatively impacted real estate valuations, which would continue to be challenged if interest rates remain at high levels for an extended period. Coupled with a more constrained financing market, the high interest rate environment has also contributed to lower realizations, which are likely to remain muted until market conditions improve. The steep decline in future new supply in certain sectors and the anticipated moderation of cost of capital in 2024, however, should be positive for real estate valuations over time. We also believe we are entering a supportive environment for deployment activity and that our real estate segment funds are well positioned to capitalize on opportunities that arise.
Fundraising in our real estate segment in 2023 remained positive overall despite a challenging market backdrop. In our perpetual capital strategies, BREIT repurchase requests were elevated, but decreased over the course of 2023, down 76% in January 2024 from their peak in January 2023. While a worsening of the current environment could adversely affect net inflows in perpetual capital strategies, we believe the long-term growth trajectory remains positive and that strong investment performance and investor under-allocation to such strategies should drive flows over the long-term.
Fee Related Earnings
Fee Related Earnings were $2.1 billion for the year ended December 31, 2023, a decrease of $207.4 million, compared to $2.3 billion for the year ended December 31, 2022. The decrease in Fee Related Earnings was primarily attributable to a decrease of $781.2 million in Fee Related Performance Revenues, partially offset by a decrease of $363.2 million in Fee Related Compensation and an increase of $220.3 million in Management Fees, Net.
Fee Related Performance Revenues were $294.2 million for the year ended December 31, 2023, a decrease of $781.2 million, compared to $1.1 billion for the year ended December 31, 2022. The decrease was primarily due to lower Fee Related Performance Revenues in BREIT.
Fee Related Compensation was $675.9 million for the year ended December 31, 2023, a decrease of $363.2 million, compared to $1.0 billion for the year ended December 31, 2022. The decrease was primarily due to a decrease in Fee Related Performance Revenues, partially offset by an increase in Management Fees, Net, both of which impact Fee Related Compensation.
Management Fees, Net were $2.8 billion for the year ended December 31, 2023, an increase of $220.3 million, compared to $2.6 billion for the year ended December 31, 2022, primarily driven by an increase in Base Management Fees, partially offset by a decrease in Transaction and Other Fees, Net. Base Management Fees increased $332.1 million primarily due to Fee-Earning Assets Under Management growth in in BREP. Transaction and Other Fees, Net decreased $92.9 million primarily due to a decrease in acquisition fees paid to the advisor of certain funds.
Net Realizations
Net Realizations were $128.7 million for the year ended December 31, 2023, a decrease of $1.8 billion, compared to $2.0 billion for the year ended December 31, 2022. The decrease in Net Realizations was primarily attributable to a decrease of $2.7 billion in Realized Performance Revenues, partially offset by a decrease of $1.0 billion in Realized Performance Compensation.
Realized Performance Revenues were $244.4 million for the year ended December 31, 2023, a decrease of $2.7 billion, compared to $3.0 billion for the year ended December 31, 2022. The decrease was primarily due to lower Realized Performance Revenues in BREP.
117
Realized Performance Compensation was $123.3 million for the year ended December 31, 2023, a decrease of $1.0 billion, compared to $1.2 billion for the year ended December 31, 2022. The decrease was primarily due to the decrease in Realized Performance Revenues.
Fund Returns
Fund return information for our significant funds is included throughout this discussion and analysis to facilitate an understanding of our results of operations for the periods presented. The fund returns information reflected in this discussion and analysis is not indicative of the financial performance of Blackstone and is also not necessarily indicative of the future performance of any particular fund. An investment in Blackstone is not an investment in any of our funds. There can be no assurance that any of our funds or our other existing and future funds will achieve similar returns.
The following table presents the internal rates of return, except where noted, of our significant real estate funds:
|
Year Ended December 31,
|
December 31, 2023
Inception to Date
|
|||||||||||||||||||||||||||||||||||||||
|
2023
|
2022
|
2021
|
Realized
|
Total
|
||||||||||||||||||||||||||||||||||||
|
Fund (a)
|
Gross
|
Net
|
Gross
|
Net
|
Gross
|
Net
|
Gross
|
Net
|
Gross
|
Net
|
||||||||||||||||||||||||||||||
|
BREP VII
|
|
-32%
|
|
|
-27%
|
|
|
4%
|
|
|
2%
|
|
|
44%
|
|
|
36%
|
|
|
27%
|
|
|
20%
|
|
|
21%
|
|
|
14%
|
|
||||||||||
|
BREP VIII
|
|
-10%
|
|
|
-9%
|
|
|
8%
|
|
|
6%
|
|
|
57%
|
|
|
46%
|
|
|
32%
|
|
|
25%
|
|
|
20%
|
|
|
14%
|
|
||||||||||
|
BREP IX
|
|
-6%
|
|
|
-6%
|
|
|
18%
|
|
|
13%
|
|
|
84%
|
|
|
63%
|
|
|
87%
|
|
|
59%
|
|
|
24%
|
|
|
17%
|
|
||||||||||
|
BREP Europe IV (b)
|
|
-22%
|
|
|
-20%
|
|
|
-14%
|
|
|
-13%
|
|
|
2%
|
|
|
—
|
|
|
26%
|
|
|
19%
|
|
|
18%
|
|
|
12%
|
|
||||||||||
|
BREP Europe V (b)
|
|
-14%
|
|
|
-13%
|
|
|
-1%
|
|
|
-2%
|
|
|
37%
|
|
|
29%
|
|
|
51%
|
|
|
41%
|
|
|
14%
|
|
|
9%
|
|
||||||||||
|
BREP Europe VI (b)
|
|
10%
|
|
|
6%
|
|
|
10%
|
|
|
6%
|
|
|
71%
|
|
|
51%
|
|
|
97%
|
|
|
72%
|
|
|
26%
|
|
|
16%
|
|
||||||||||
|
BREP Asia I
|
|
5%
|
|
|
3%
|
|
|
-1%
|
|
|
-2%
|
|
|
37%
|
|
|
29%
|
|
|
23%
|
|
|
16%
|
|
|
18%
|
|
|
12%
|
|
||||||||||
|
BREP Asia II
|
|
-2%
|
|
|
-1%
|
|
|
2%
|
|
|
1%
|
|
|
31%
|
|
|
21%
|
|
|
47%
|
|
|
32%
|
|
|
10%
|
|
|
6%
|
|
||||||||||
|
BREP Asia III
|
|
-4%
|
|
|
-19%
|
|
|
n/m
|
|
|
n/m
|
|
|
n/a
|
|
|
n/a
|
|
|
n/a
|
|
|
n/a
|
|
|
-5%
|
|
|
-21%
|
|
||||||||||
|
BREP Co-Investment (c)
|
|
1%
|
|
|
1%
|
|
|
26%
|
|
|
25%
|
|
|
77%
|
|
|
70%
|
|
|
18%
|
|
|
16%
|
|
|
18%
|
|
|
16%
|
|
||||||||||
|
BPP (d)
|
|
-8%
|
|
|
-8%
|
|
|
11%
|
|
|
9%
|
|
|
20%
|
|
|
17%
|
|
|
n/a
|
|
|
n/a
|
|
|
8%
|
|
|
7%
|
|
||||||||||
|
BREIT (e)
|
|
n/a
|
|
|
-1%
|
|
|
n/a
|
|
|
8%
|
|
|
n/a
|
|
|
30%
|
|
|
n/a
|
|
|
n/a
|
|
|
n/a
|
|
|
10%
|
|
||||||||||
|
BREIT - Class I (f)
|
|
n/a
|
|
|
-1%
|
|
|
n/a
|
|
|
8%
|
|
|
n/a
|
|
|
30%
|
|
|
n/a
|
|
|
n/a
|
|
|
n/a
|
|
|
11%
|
|
||||||||||
|
BREDS High-Yield (g)
|
|
12%
|
|
|
8%
|
|
|
3%
|
|
|
—
|
|
|
18%
|
|
|
13%
|
|
|
14%
|
|
|
10%
|
|
|
13%
|
|
|
9%
|
|
||||||||||
|
BXMT (h)
|
|
n/a
|
|
|
13%
|
|
|
n/a
|
|
|
-24%
|
|
|
n/a
|
|
|
20%
|
|
|
n/a
|
|
|
n/a
|
|
|
n/a
|
|
|
7%
|
|
||||||||||
The returns presented herein represent those of the applicable Blackstone Funds and not those of Blackstone.
|
n/m
|
Not meaningful generally due to the limited time since initial investment.
|
|
n/a
|
Not applicable.
|
|
(a)
|
Net returns are based on the change in carrying value (realized and unrealized) after management fees, expenses and Performance Revenues. Excludes investment vehicles where Blackstone does not earn fees.
|
|
(b)
|
Euro-based internal rates of return.
|
|
(c)
|
BREP Co-Investment represents co-investment capital raised for various BREP investments. The Net IRR reflected is calculated by aggregating each co-investment’s realized proceeds and unrealized value, as applicable, after management fees, expenses and Performance Revenues.
|
|
(d)
|
The BPP platform, which comprises over 30 funds, co-investment and separately managed account vehicles, represents the Core+ real estate funds which invest with a more modest risk profile and lower leverage.
|
118
|
(e)
|
Reflects a per share blended return for each respective period, assuming BREIT had a single share class, reinvestment of all dividends received during the period, and no upfront selling commission, net of all fees and expenses incurred by BREIT. These returns are not representative of the returns experienced by any particular investor or share class. Inception to date returns are presented on an annualized basis and are from January 1, 2017.
|
|
(f)
|
Represents the Total Net Return for BREIT’s Class I shares, its largest share class. Performance varies by share class. Class I Total Net Return assumes reinvestment of all dividends received during the period, and no upfront selling commission, net of all fees and expenses incurred by BREIT. Inception to date return is from January 1, 2017.
|
|
(g)
|
BREDS High-Yield represents the flagship real estate debt drawdown funds only. Inception to date returns are from July 1, 2009.
|
|
(h)
|
Reflects annualized return of a shareholder invested in BXMT as of the beginning of each period presented, assuming reinvestment of all dividends received during the period, and net of all fees and expenses incurred by BXMT. Return incorporates the closing NYSE stock price as of each period end. Inception to date returns are from May 22, 2013.
|
Funds With Closed Investment Periods
The Real Estate segment has fourteen funds with closed investment periods as of December 31, 2023: BREP IX, BREP VIII, BREP VII, BREP VI, BREP V, BREP IV, BREP Europe VI, BREP Europe V, BREP Europe IV, BREP Europe III, BREP Asia II, BREP Asia I, BREDS IV and BREDS III. As of December 31, 2023, BREP VII, BREP VI, BREP V, BREP IV, BREP Europe IV, BREP Europe III and BREP Asia I were above their carried interest thresholds (i.e., the preferred return payable to its limited partners before the general partner is eligible to receive carried interest) and would have been above their carried interest thresholds even if all remaining investments were valued at zero. BREP IX, BREP VIII, BREP Europe VI, BREP Europe V, BREDS IV and BREDS III were above their carried interest thresholds as of December 31, 2023, and BREP Asia II was below its carried interest threshold. Funds are considered above their carried interest thresholds based on the aggregate fund position, although individual limited partners may be below their respective carried interest thresholds in certain funds.
119
Private Equity
The following table presents the results of operations for our Private Equity segment:
|
Year Ended December 31,
|
2023 vs. 2022
|
2022 vs. 2021
|
||||||||||||||||||||||||||
|
2023
|
2022
|
2021
|
$
|
%
|
$
|
%
|
||||||||||||||||||||||
|
(Dollars in Thousands)
|
||||||||||||||||||||||||||||
|
Management and Advisory Fees, Net
|
||||||||||||||||||||||||||||
|
Base Management Fees
|
$
|
1,807,906
|
|
$
|
1,786,923
|
|
$
|
1,521,273
|
|
$
|
20,983
|
|
|
1%
|
|
$
|
265,650
|
|
|
17%
|
|
|||||||
|
Transaction, Advisory and Other Fees, Net
|
|
105,640
|
|
|
97,876
|
|
|
174,905
|
|
|
7,764
|
|
|
8%
|
|
|
(77,029
|
)
|
|
-44%
|
|
|||||||
|
Management Fee Offsets
|
|
(5,182
|
)
|
|
(56,062
|
)
|
|
(33,247
|
)
|
|
50,880
|
|
|
-91%
|
|
|
(22,815
|
)
|
|
69%
|
|
|||||||
|
|
|
|
|
|
|
|
|
|
|
|
|
|
|
|
|
|
|
|
|
|
||||||||
|
Total Management and Advisory Fees, Net
|
|
1,908,364
|
|
|
1,828,737
|
|
|
1,662,931
|
|
|
79,627
|
|
|
4%
|
|
|
165,806
|
|
|
10%
|
|
|||||||
|
Fee Related Performance Revenues
|
|
—
|
|
|
(648
|
)
|
|
212,128
|
|
|
648
|
|
|
-100%
|
|
|
(212,776
|
)
|
|
n/m
|
|
|||||||
|
Fee Related Compensation
|
|
(595,669
|
)
|
|
(575,194
|
)
|
|
(662,824
|
)
|
|
(20,475
|
)
|
|
4%
|
|
|
87,630
|
|
|
-13%
|
|
|||||||
|
Other Operating Expenses
|
|
(316,741
|
)
|
|
(304,177
|
)
|
|
(264,468
|
)
|
|
(12,564
|
)
|
|
4%
|
|
|
(39,709
|
)
|
|
15%
|
|
|||||||
|
|
|
|
|
|
|
|
|
|
|
|
|
|
|
|
|
|
|
|
|
|
||||||||
|
Fee Related Earnings
|
|
995,954
|
|
|
948,718
|
|
|
947,767
|
|
|
47,236
|
|
|
5%
|
|
|
951
|
|
|
—
|
|
|||||||
|
|
|
|
|
|
|
|
|
|
|
|
|
|
|
|
|
|
|
|
|
|
||||||||
|
Realized Performance Revenues
|
|
1,268,483
|
|
|
1,191,028
|
|
|
2,263,099
|
|
|
77,455
|
|
|
7%
|
|
|
(1,072,071
|
)
|
|
-47%
|
|
|||||||
|
Realized Performance Compensation
|
|
(558,645
|
)
|
|
(544,229
|
)
|
|
(943,199
|
)
|
|
(14,416
|
)
|
|
3%
|
|
|
398,970
|
|
|
-42%
|
|
|||||||
|
Realized Principal Investment Income
|
|
67,133
|
|
|
139,767
|
|
|
263,368
|
|
|
(72,634
|
)
|
|
-52%
|
|
|
(123,601
|
)
|
|
-47%
|
|
|||||||
|
|
|
|
|
|
|
|
|
|
|
|
|
|
|
|
|
|
|
|
|
|
||||||||
|
Net Realizations
|
|
776,971
|
|
|
786,566
|
|
|
1,583,268
|
|
|
(9,595
|
)
|
|
-1%
|
|
|
(796,702
|
)
|
|
-50%
|
|
|||||||
|
|
|
|
|
|
|
|
|
|
|
|
|
|
|
|
|
|
|
|
|
|
||||||||
|
Segment Distributable Earnings
|
$
|
1,772,925
|
|
$
|
1,735,284
|
|
$
|
2,531,035
|
|
$
|
37,641
|
|
|
2%
|
|
$
|
(795,751
|
)
|
|
-31%
|
|
|||||||
|
|
|
|
|
|
|
|
|
|
|
|
|
|
|
|
|
|
|
|
|
|
||||||||
|
n/m
|
Not meaningful.
|
Year Ended December 31, 2023 Compared to Year Ended December 31, 2022
Segment Distributable Earnings were $1.8 billion for the year ended December 31, 2023, an increase of $37.6 million, compared to $1.7 billion for the year ended December 31, 2022. The increase in Segment Distributable Earnings was attributable to an increase of $47.2 million in Fee Related Earnings, partially offset by a decrease of $9.6 million in Net Realizations.
Despite a challenging market environment, our Private Equity segment demonstrated resilient performance across nearly all of its strategies in 2023. Our thematic investments, including those in digital infrastructure, life sciences, and energy transition, were substantial drivers of appreciation in the segment in 2023. In Corporate Private Equity, our operating companies saw resilient revenue growth overall in 2023, along with margin strength in the overall portfolio as input and wage costs continued to abate. Nonetheless, economic uncertainty, negative market sentiment and a volatile backdrop for asset values throughout a significant portion of 2023 contributed to muted realizations, which are likely to remain muted until market conditions improve. Investors’ ability to allocate to private equity strategies amidst difficult market conditions and lower realizations have contributed to an already demanding fundraising environment, and these near-term headwinds have made fundraising for our flagship corporate private equity fund more difficult. Nevertheless, we believe that the long-term fundraising trajectory in our Private Equity segment remains positive.
120
Fee Related Earnings
Fee Related Earnings were $996.0 million for the year ended December 31, 2023, an increase of $47.2 million, compared to $948.7 million for the year ended December 31, 2022. The increase in Fee Related Earnings was primarily attributable to an increase of $79.6 million in Management and Advisory Fees, Net, partially offset by an increase of $20.5 million in Fee Related Compensation.
Management and Advisory Fees, Net were $1.9 billion for the year ended December 31, 2023, an increase of $79.6 million, compared to $1.8 billion for the year ended December 31, 2022, primarily driven by a decrease in Management Fee Offsets and an increase in Base Management Fees. Management Fee Offsets decreased $50.9 million primarily due to a reduction in Management Fee Offsets in Strategic Partners IX. Base Management Fees increased $21.0 million primarily due to Fee-Earning Assets Under Management Growth in BIP.
Fee Related Compensation was $595.7 million for the year ended December 31, 2023, an increase of $20.5 million, compared to $575.2 million for the year ended December 31, 2022. The increase was primarily due to an increase in Management Fees, Net, on which a portion of Fee Related Compensation is based.
Net Realizations
Net Realizations were $777.0 million for the year ended December 31, 2023, a decrease of $9.6 million, compared to $786.6 million for the year ended December 31, 2022. The decrease in Net Realizations was attributable to a decrease of $72.6 million in Realized Principal Investment Income and an increase of $14.4 million in Realized Performance Compensation, partially offset by an increase of $77.5 million in Realized Performance Revenues.
Realized Principal Investment Income was $67.1 million for the year ended December 31, 2023, a decrease of $72.6 million, compared to $139.8 million for the year ended December 31, 2022. The decrease was primarily due to the segment’s allocation of the gain recognized in connection with sales of interests in Pátria Investments Limited and Pátria Investimentos Ltda. (collectively, “Pátria”) in the third quarter of 2022, partially offset by higher Realized Principal Investment Income in Corporate Private Equity.
Realized Performance Compensation was $558.6 million for the year ended December 31, 2023, an increase of $14.4 million, compared to $544.2 million for the year ended December 31, 2022. The increase was primarily due to higher Realized Performance Revenues in Corporate Private Equity, partially offset by lower Realized Performance Revenues in Tactical Opportunities and Strategic Partners.
Realized Performance Revenues were $1.3 billion for the year ended December 31, 2023, an increase of $77.5 million, compared to $1.2 billion for the year ended December 31, 2022. The increase was primarily due to higher Realized Performance Revenues in Corporate Private Equity, partially offset by lower Realized Performance Revenues in Tactical Opportunities and Strategic Partners.
Fund Returns
Fund returns information for our significant funds is included throughout this discussion and analysis to facilitate an understanding of our results of operations for the periods presented. The fund returns information reflected in this discussion and analysis is not indicative of the financial performance of Blackstone and is also not necessarily indicative of the future performance of any particular fund. An investment in Blackstone is not an investment in any of our funds. There can be no assurance that any of our funds or our other existing and future funds will achieve similar returns.
121
The following table presents the internal rates of return of our significant private equity funds:
|
Year Ended December 31,
|
December 31, 2023
Inception to Date
|
|||||||||||||||||||||||||||||||||||||||
|
2023
|
2022
|
2021
|
Realized
|
Total
|
||||||||||||||||||||||||||||||||||||
|
Fund (a)
|
Gross
|
Net
|
Gross
|
Net
|
Gross
|
Net
|
Gross
|
Net
|
Gross
|
Net
|
||||||||||||||||||||||||||||||
|
BCP VI
|
|
7%
|
|
|
6%
|
|
|
12%
|
|
|
11%
|
|
|
19%
|
|
|
16%
|
|
|
19%
|
|
|
14%
|
|
|
17%
|
|
|
12%
|
|
||||||||||
|
BCP VII
|
|
13%
|
|
|
10%
|
|
|
-12%
|
|
|
-11%
|
|
|
44%
|
|
|
36%
|
|
|
38%
|
|
|
29%
|
|
|
19%
|
|
|
13%
|
|
||||||||||
|
BCP VIII
|
|
12%
|
|
|
6%
|
|
|
4%
|
|
|
—
|
|
|
n/a
|
|
|
n/a
|
|
|
n/m
|
|
|
n/m
|
|
|
21%
|
|
|
11%
|
|
||||||||||
|
BEP I
|
|
-15%
|
|
|
-13%
|
|
|
57%
|
|
|
46%
|
|
|
78%
|
|
|
59%
|
|
|
18%
|
|
|
14%
|
|
|
15%
|
|
|
11%
|
|
||||||||||
|
BEP II
|
|
12%
|
|
|
8%
|
|
|
36%
|
|
|
33%
|
|
|
56%
|
|
|
53%
|
|
|
14%
|
|
|
11%
|
|
|
12%
|
|
|
8%
|
|
||||||||||
|
BEP III
|
|
28%
|
|
|
20%
|
|
|
42%
|
|
|
31%
|
|
|
86%
|
|
|
56%
|
|
|
77%
|
|
|
55%
|
|
|
52%
|
|
|
34%
|
|
||||||||||
|
BCP Asia I
|
|
16%
|
|
|
13%
|
|
|
-38%
|
|
|
-35%
|
|
|
193%
|
|
|
158%
|
|
|
128%
|
|
|
96%
|
|
|
40%
|
|
|
28%
|
|
||||||||||
|
BCP Asia II
|
|
62%
|
|
|
23%
|
|
|
n/m
|
|
|
n/m
|
|
|
n/a
|
|
|
n/a
|
|
|
n/a
|
|
|
n/a
|
|
|
67%
|
|
|
22%
|
|
||||||||||
|
BCEP I (b)
|
|
2%
|
|
|
2%
|
|
|
—
|
|
|
—
|
|
|
55%
|
|
|
50%
|
|
|
62%
|
|
|
57%
|
|
|
21%
|
|
|
18%
|
|
||||||||||
|
BCEP II (b)
|
|
31%
|
|
|
24%
|
|
|
14%
|
|
|
9%
|
|
|
n/a
|
|
|
n/a
|
|
|
n/a
|
|
|
n/a
|
|
|
22%
|
|
|
16%
|
|
||||||||||
|
Tactical Opportunities
|
|
9%
|
|
|
5%
|
|
|
-2%
|
|
|
-4%
|
|
|
37%
|
|
|
28%
|
|
|
19%
|
|
|
15%
|
|
|
15%
|
|
|
11%
|
|
||||||||||
|
Tactical Opportunities Co-Investment and Other
|
|
7%
|
|
|
7%
|
|
|
—
|
|
|
4%
|
|
|
67%
|
|
|
57%
|
|
|
20%
|
|
|
19%
|
|
|
19%
|
|
|
16%
|
|
||||||||||
|
BXG I
|
|
-2%
|
|
|
-5%
|
|
|
-13%
|
|
|
-13%
|
|
|
50%
|
|
|
29%
|
|
|
n/m
|
|
|
n/m
|
|
|
2%
|
|
|
-2%
|
|
||||||||||
|
Strategic Partners VI (c)
|
|
-2%
|
|
|
-3%
|
|
|
-10%
|
|
|
-11%
|
|
|
53%
|
|
|
49%
|
|
|
n/a
|
|
|
n/a
|
|
|
18%
|
|
|
14%
|
|
||||||||||
|
Strategic Partners VII (c)
|
|
1%
|
|
|
—
|
|
|
-4%
|
|
|
-5%
|
|
|
68%
|
|
|
61%
|
|
|
n/a
|
|
|
n/a
|
|
|
22%
|
|
|
17%
|
|
||||||||||
|
Strategic Partners Real Assets II (c)
|
|
19%
|
|
|
16%
|
|
|
13%
|
|
|
12%
|
|
|
26%
|
|
|
22%
|
|
|
n/a
|
|
|
n/a
|
|
|
20%
|
|
|
16%
|
|
||||||||||
|
Strategic Partners VIII (c)
|
|
-1%
|
|
|
-3%
|
|
|
3%
|
|
|
2%
|
|
|
144%
|
|
|
128%
|
|
|
n/a
|
|
|
n/a
|
|
|
37%
|
|
|
29%
|
|
||||||||||
|
Strategic Partners Real Estate, SMA and Other (c)
|
|
-6%
|
|
|
-7%
|
|
|
35%
|
|
|
32%
|
|
|
30%
|
|
|
20%
|
|
|
n/a
|
|
|
n/a
|
|
|
15%
|
|
|
14%
|
|
||||||||||
|
Strategic Partners Infrastructure III (c)
|
|
15%
|
|
|
11%
|
|
|
58%
|
|
|
45%
|
|
|
134%
|
|
|
85%
|
|
|
n/a
|
|
|
n/a
|
|
|
48%
|
|
|
32%
|
|
||||||||||
|
Strategic Partners IX (c)
|
|
15%
|
|
|
7%
|
|
|
n/m
|
|
|
n/m
|
|
|
n/a
|
|
|
n/a
|
|
|
n/a
|
|
|
n/a
|
|
|
32%
|
|
|
18%
|
|
||||||||||
|
Strategic Partners GP Solutions (c)
|
|
-16%
|
|
|
-11%
|
|
|
39%
|
|
|
29%
|
|
|
n/m
|
|
|
n/m
|
|
|
n/a
|
|
|
n/a
|
|
|
2%
|
|
|
-3%
|
|
||||||||||
|
BIP
|
|
13%
|
|
|
10%
|
|
|
26%
|
|
|
20%
|
|
|
41%
|
|
|
33%
|
|
|
n/a
|
|
|
n/a
|
|
|
20%
|
|
|
15%
|
|
||||||||||
|
Clarus IV
|
|
-3%
|
|
|
-4%
|
|
|
4%
|
|
|
2%
|
|
|
34%
|
|
|
26%
|
|
|
6%
|
|
|
-4%
|
|
|
15%
|
|
|
9%
|
|
||||||||||
|
BXLS V
|
|
43%
|
|
|
27%
|
|
|
10%
|
|
|
2%
|
|
|
13%
|
|
|
-4%
|
|
|
n/m
|
|
|
n/m
|
|
|
26%
|
|
|
13%
|
|
||||||||||
The returns presented herein represent those of the applicable Blackstone Funds and not those of Blackstone.
|
n/m
|
Not meaningful generally due to the limited time since initial investment.
|
|
n/a
|
Not applicable.
|
|
SMA
|
Separately managed account.
|
|
(a)
|
Net returns are based on the change in carrying value (realized and unrealized) after management fees, expenses and Performance Revenues. Excludes investment vehicles where Blackstone does not earn fees.
|
|
(b)
|
BCEP is a core private equity strategy which invests with a more modest risk profile and longer hold period than traditional private equity.
|
|
(c)
|
Gross and net returns are reported on a three-month lag and therefore do not include the impact of economic and market activities in the current quarter. Prior to June 30, 2023, the calculation of such metrics also incorporated investor cash flow information from the current quarter to the extent available. Effective June 30, 2023, such current quarter cash flow information is no longer incorporated. We believe the updated presentation is more reflective of the Strategic Partners’ investor experience. Prior periods have been recast. Realizations are treated as returns of capital until fully recovered and therefore Realized IRRs are not applicable. Effective June 30, 2023, Strategic Partners Real Estate, SMA and Other exclude investment vehicles where Blackstone does not earn fees, which were previously included.
|
122
Funds With Closed Investment Periods
The Corporate Private Equity funds within the Private Equity segment have nine funds with closed investment periods: BCP IV, BCP V, BCP VI, BCP VII, BCOM, BEP I, BEP II, BCEP I and BCP Asia I. As of December 31, 2023, BCP IV was above its carried interest threshold (i.e., the preferred return payable to its limited partners before the general partner is eligible to receive carried interest) and would still be above its carried interest threshold even if all remaining investments were valued at zero. BCP V is comprised of two fund classes, the BCP V “main fund” and BCP V-AC fund. Within these fund classes, the general partner is subject to equalization such that (a) the general partner accrues carried interest when the respective carried interest for either fund class is positive and (b) the general partner realizes carried interest so long as clawback obligations, if any, for either of the respective fund classes are fully satisfied. BCP V, BCP VI, BCP VII, BCOM, BEP I, BEP II, BCEP I and BCP Asia I were above their respective carried interest thresholds. Funds are considered above their carried interest thresholds based on the aggregate fund position, although individual limited partners may be below their respective carried interest thresholds in certain funds.
The Tactical Opportunities funds within the Private Equity segment have various funds with closed investment periods, including but not limited to: BTOF-POOL, BTOF-POOL II, and BTOF-POOL III, which are each above their carried interest thresholds based on aggregate fund position. Strategic Partners funds within the Private Equity segment have various funds with closed investment periods, including but not limited to: Strategic Partners Real Assets II, Strategic Partners VIII and Strategic Partners Real Estate VII, which are above their respective carried interest thresholds based on aggregate fund position. Certain Strategic Partners funds with closed investment periods do not generate carried interest for Blackstone as agreed to at the time the Strategic Partners business was acquired. The Blackstone Life Sciences funds within the Private Equity segment has one fund with a closed investment period: Clarus IV, which was above its carried interest threshold.
123
Credit & Insurance
The following table presents the results of operations for our Credit & Insurance segment:
|
Year Ended December 31,
|
2023 vs. 2022
|
2022 vs. 2021
|
||||||||||||||||||||||||||
|
2023
|
2022
|
2021
|
$
|
%
|
$
|
%
|
||||||||||||||||||||||
|
(Dollars in Thousands)
|
||||||||||||||||||||||||||||
|
Management Fees, Net
|
||||||||||||||||||||||||||||
|
Base Management Fees
|
$
|
1,335,408
|
|
$
|
1,230,710
|
|
$
|
765,905
|
|
$
|
104,698
|
|
|
9%
|
|
$
|
464,805
|
|
|
61%
|
|
|||||||
|
Transaction and Other Fees, Net
|
|
44,560
|
|
|
34,624
|
|
|
44,868
|
|
|
9,936
|
|
|
29%
|
|
|
(10,244
|
)
|
|
-23%
|
|
|||||||
|
Management Fee Offsets
|
|
(3,907
|
)
|
|
(5,432
|
)
|
|
(6,653
|
)
|
|
1,525
|
|
|
-28%
|
|
|
1,221
|
|
|
-18%
|
|
|||||||
|
|
|
|
|
|
|
|
|
|
|
|
|
|
|
|
|
|
|
|
|
|
||||||||
|
Total Management Fees, Net
|
|
1,376,061
|
|
|
1,259,902
|
|
|
804,120
|
|
|
116,159
|
|
|
9%
|
|
|
455,782
|
|
|
57%
|
|
|||||||
|
Fee Related Performance Revenues
|
|
564,287
|
|
|
374,721
|
|
|
118,097
|
|
|
189,566
|
|
|
51%
|
|
|
256,624
|
|
|
217%
|
|
|||||||
|
Fee Related Compensation
|
|
(640,190
|
)
|
|
(529,784
|
)
|
|
(367,322
|
)
|
|
(110,406
|
)
|
|
21%
|
|
|
(162,462
|
)
|
|
44%
|
|
|||||||
|
Other Operating Expenses
|
|
(327,734
|
)
|
|
(264,181
|
)
|
|
(199,912
|
)
|
|
(63,553
|
)
|
|
24%
|
|
|
(64,269
|
)
|
|
32%
|
|
|||||||
|
|
|
|
|
|
|
|
|
|
|
|
|
|
|
|
|
|
|
|
|
|
||||||||
|
Fee Related Earnings
|
|
972,424
|
|
|
840,658
|
|
|
354,983
|
|
|
131,766
|
|
|
16%
|
|
|
485,675
|
|
|
137%
|
|
|||||||
|
|
|
|
|
|
|
|
|
|
|
|
|
|
|
|
|
|
|
|
|
|
||||||||
|
Realized Performance Revenues
|
|
317,760
|
|
|
147,413
|
|
|
209,421
|
|
|
170,347
|
|
|
116%
|
|
|
(62,008
|
)
|
|
-30%
|
|
|||||||
|
Realized Performance Compensation
|
|
(140,490
|
)
|
|
(63,846
|
)
|
|
(94,450
|
)
|
|
(76,644
|
)
|
|
120%
|
|
|
30,604
|
|
|
-32%
|
|
|||||||
|
Realized Principal Investment Income
|
|
21,897
|
|
|
80,993
|
|
|
70,796
|
|
|
(59,096
|
)
|
|
-73%
|
|
|
10,197
|
|
|
14%
|
|
|||||||
|
|
|
|
|
|
|
|
|
|
|
|
|
|
|
|
|
|
|
|
|
|
||||||||
|
Net Realizations
|
|
199,167
|
|
|
164,560
|
|
|
185,767
|
|
|
34,607
|
|
|
21%
|
|
|
(21,207
|
)
|
|
-11%
|
|
|||||||
|
|
|
|
|
|
|
|
|
|
|
|
|
|
|
|
|
|
|
|
|
|
||||||||
|
Segment Distributable Earnings
|
$
|
1,171,591
|
|
$
|
1,005,218
|
|
$
|
540,750
|
|
$
|
166,373
|
|
|
17%
|
|
$
|
464,468
|
|
|
86%
|
|
|||||||
|
|
|
|
|
|
|
|
|
|
|
|
|
|
|
|
|
|
|
|
|
|
||||||||
|
n/m
|
Not meaningful.
|
Year Ended December 31, 2023 Compared to Year Ended December 31, 2022
Segment Distributable Earnings were $1.2 billion for the year ended December 31, 2023, an increase of $166.4 million, compared to $1.0 billion for the year ended December 31, 2022. The increase in Segment Distributable Earnings was attributable to increases of $131.8 million in Fee Related Earnings and $34.6 million in Net Realizations.
Our credit funds demonstrated strong performance in 2023, driven by a higher interest rate environment and the concentration of our portfolios in floating rate debt. Longer-term structural shifts in the lending market, combined with a more constrained financing market, have contributed and are likely to continue to contribute to attractive and sizeable deployment opportunities for our credit funds as banks and other originators seek to preserve liquidity and meet capital requirements and borrowers seek alternative financing sources. Additionally, we continue to see opportunities for growth in our insurance and energy transition strategies. In the broader market, a higher cost of capital as a result of historically high interest rates has negatively impacted the free cash flow and credit quality of certain borrowers. Nevertheless, default rates across corporate issuers in our credit funds’ portfolios remained low in 2023 relative to our historical levels. A sustained period of high interest rates, however, increases the potential for defaults. Conversely, a material decline in interest rates and/or widening of credit spreads would make it more difficult for our credit funds to replicate their 2023 performance. In addition, a period of significant market dislocation could limit the liquidity of certain assets traded in the credit markets. This would impact our funds’ ability to sell such assets at attractive prices or in a timely manner.
Fundraising in our Credit & Insurance segment, including in our perpetual capital strategies, has been positively impacted by the long-term structural shifts in the lending market and a more constraining financing market. In our perpetual capital strategies, compelling private credit fundamentals contributed to a significant increase in BCRED inflows in 2023. We believe the long-term growth trajectory remains positive and that strong investment performance and investor under-allocation to such private wealth strategies should continue to drive flows over the long-term.
124
Fee Related Earnings
Fee Related Earnings were $972.4 million for the year ended December 31, 2023, an increase of $131.8 million, compared to $840.7 million for the year ended December 31, 2022. The increase in Fee Related Earnings was attributable to increases of $189.6 million in Fee Related Performance Revenues and $116.2 million in Management Fees, Net, partially offset by increases of $110.4 million in Fee Related Compensation and $63.6 million in Other Operating Expenses.
Fee Related Performance Revenues were $564.3 million for the year ended December 31, 2023, an increase of $189.6 million, compared to $374.7 million for the year ended December 31, 2022. The increase was primarily due to performance and higher Fee-Earning Assets Under Management in BCRED.
Management Fees, Net were $1.4 billion for the year ended December 31, 2023, an increase of $116.2 million, compared to $1.3 billion for the year ended December 31, 2022, primarily driven by an increase in Base Management Fees. Base Management Fees increased $104.7 million primarily due to inflows from Fee-Earning Assets Under Management in direct lending.
Fee Related Compensation was $640.2 million for the year ended December 31, 2023, an increase of $110.4 million, compared to $529.8 million for the year ended December 31, 2022. The increase was primarily due to increases in Fee Related Performance Revenues and Management Fees, Net, both of which impact Fee Related Compensation.
Other Operating Expenses were $327.7 million for the year ended December 31, 2023, an increase of $63.6 million, compared to $264.2 million for the year ended December 31, 2022. The increase was primarily due to occupancy costs, market data and technology-related expenses and professional fees.
Net Realizations
Net Realizations were $199.2 million for the year ended December 31, 2023, an increase of $34.6 million, compared to $164.6 million for the year ended December 31, 2022. The increase in Net Realizations was attributable to increases of $170.3 million in Realized Performance Revenues, partially offset by an increase of $76.6 million in Realized Performance Compensation and a decrease of $59.1 million in Realized Principal Investment Income.
Realized Performance Revenues were $317.8 million for the year ended December 31, 2023, an increase of $170.3 million, compared to $147.4 million for the year ended December 31, 2022. The increase was primarily due to higher Realized Performance Revenues in our direct lending and mezzanine funds.
Realized Performance Compensation was $140.5 million for the year ended December 31, 2023, an increase of $76.6 million, compared to $63.8 million for the year ended December 31, 2022. The increase was primarily due to the increase in Realized Performance Revenues.
Realized Principal Investment Income was $21.9 million for the year ended December 31, 2023, a decrease of $59.1 million, compared to $81.0 million for the year ended December 31, 2022. The decrease was primarily due to the segment’s allocation of the gain recognized in connection with sales of interests in Pátria in the first and third quarters of 2022 and a realized loss related to insurance platform investments during the year ended December 31, 2023.
125
Composite Returns
Composite returns information is included throughout this discussion and analysis to facilitate an understanding of our results of operations for the periods presented. The composite returns information reflected in this discussion and analysis is not indicative of the financial performance of Blackstone and is also not necessarily indicative of the future results of any particular fund or composite. An investment in Blackstone is not an investment in any of our funds or composites. There can be no assurance that any of our funds or composites or our other existing and future funds or composites will achieve similar returns.
The following table presents the return information for the Private Credit and Liquid Credit composites:
|
Year Ended December 31,
|
Inception to
December 31, 2023
|
|||||||||||||||||||||||||||||||
|
2023
|
2022
|
2021
|
Total
|
|||||||||||||||||||||||||||||
|
Composite (a)
|
Gross
|
Net
|
Gross
|
Net
|
Gross
|
Net
|
Gross
|
Net
|
||||||||||||||||||||||||
|
Private Credit (b)
|
|
16
|
%
|
|
12
|
%
|
|
7
|
%
|
|
4
|
%
|
|
22
|
%
|
|
16
|
%
|
|
12
|
%
|
|
8
|
%
|
||||||||
|
Liquid Credit (b)
|
|
13
|
%
|
|
12
|
%
|
|
-3
|
%
|
|
-3
|
%
|
|
5
|
%
|
|
5
|
%
|
|
5
|
%
|
|
5
|
%
|
||||||||
The returns presented herein represent those of the applicable Blackstone Funds and not those of Blackstone.
|
(a)
|
Net returns are based on the change in carrying value (realized and unrealized) after management fees, expenses and Performance Allocations, net of tax advances.
|
|
(b)
|
Private Credit returns include mezzanine lending funds and middle market direct lending funds (including BXSL and BCRED), stressed/distressed strategies (including stressed/distressed funds and credit alpha strategies) and energy strategies. Liquid Credit returns include CLOs, closed-ended funds, open-ended funds and separately managed accounts. Only fee-earning funds exceeding $100 million of fair value at the beginning of each respective quarter-end are included. Funds in liquidation, funds investing primarily in investment grade corporate credit and asset based finance funds are excluded. Blackstone Funds that were contributed to BXC as part of Blackstone’s acquisition of BXC in March 2008 and the pre-acquisition date performance for funds and vehicles acquired by BXC subsequent to March 2008, are also excluded. Private Credit and Liquid Credit’s inception to date returns are from December 31, 2005.
|
Operating Metrics
The following table presents information regarding our Invested Performance Eligible Assets Under Management:
|
Invested Performance
Eligible Assets Under
Management
|
Estimated % Above
High Water Mark/Hurdle (a) |
|||||||||||||||||||||||
|
December 31,
|
December 31,
|
|||||||||||||||||||||||
|
2023
|
2022
|
2021
|
2023
|
2022
|
2021
|
|||||||||||||||||||
|
(Dollars in Thousands)
|
||||||||||||||||||||||||
|
Credit & Insurance (b)
|
$
|
89,508,377
|
|
$
|
87,175,669
|
|
$
|
66,350,185
|
|
|
97
|
%
|
|
93
|
%
|
|
94
|
%
|
||||||
|
(a)
|
Estimated % Above High Water Mark/Hurdle represents the percentage of Invested Performance Eligible Assets Under Management that as of the dates presented would earn performance fees when the applicable Credit & Insurance managed fund has positive investment performance relative to a hurdle, where applicable. Incremental positive performance in the applicable Blackstone Funds may cause additional assets to reach their respective High Water Mark or clear a hurdle return, thereby resulting in an increase in Estimated % Above High Water Mark/Hurdle.
|
126
|
(b)
|
For the Credit & Insurance managed funds, at December 31, 2023, the incremental appreciation needed for the 3% of Invested Performance Eligible Assets Under Management below their respective High Water Marks/Hurdles to reach their respective High Water Marks/Hurdles was $2.1 billion, an increase of $122.9 million, compared to $2.0 billion at December 31, 2022. Of the Invested Performance Eligible Assets Under Management below their respective High Water Marks/Hurdles as of December 31, 2023, 13% were within 5% of reaching their respective High Water Mark.
|
Hedge Fund Solutions
The following table presents the results of operations for our Hedge Fund Solutions segment:
|
Year Ended December 31,
|
2023 vs. 2022
|
2022 vs. 2021
|
||||||||||||||||||||||||||
|
2023
|
2022
|
2021
|
$
|
%
|
$
|
%
|
||||||||||||||||||||||
|
(Dollars in Thousands)
|
||||||||||||||||||||||||||||
|
Management Fees, Net
|
||||||||||||||||||||||||||||
|
Base Management Fees
|
$
|
528,301
|
|
$
|
565,226
|
|
$
|
636,685
|
|
$
|
(36,925
|
)
|
|
-7%
|
|
$
|
(71,459
|
)
|
|
-11%
|
|
|||||||
|
Transaction and Other Fees, Net
|
|
7,209
|
|
|
6,193
|
|
|
11,770
|
|
|
1,016
|
|
|
16%
|
|
|
(5,577
|
)
|
|
-47%
|
|
|||||||
|
Management Fee Offsets
|
|
(49
|
)
|
|
(177
|
)
|
|
(572
|
)
|
|
128
|
|
|
-72%
|
|
|
395
|
|
|
-69%
|
|
|||||||
|
|
|
|
|
|
|
|
|
|
|
|
|
|
|
|
|
|
|
|
|
|
||||||||
|
Total Management Fees, Net
|
|
535,461
|
|
|
571,242
|
|
|
647,883
|
|
|
(35,781
|
)
|
|
-6%
|
|
|
(76,641
|
)
|
|
-12%
|
|
|||||||
|
Fee Related Compensation
|
|
(176,371
|
)
|
|
(186,672
|
)
|
|
(156,515
|
)
|
|
10,301
|
|
|
-6%
|
|
|
(30,157
|
)
|
|
19%
|
|
|||||||
|
Other Operating Expenses
|
|
(114,808
|
)
|
|
(105,334
|
)
|
|
(94,792
|
)
|
|
(9,474
|
)
|
|
9%
|
|
|
(10,542
|
)
|
|
11%
|
|
|||||||
|
|
|
|
|
|
|
|
|
|
|
|
|
|
|
|
|
|
|
|
|
|
||||||||
|
Fee Related Earnings
|
|
244,282
|
|
|
279,236
|
|
|
396,576
|
|
|
(34,954
|
)
|
|
-13%
|
|
|
(117,340
|
)
|
|
-30%
|
|
|||||||
|
|
|
|
|
|
|
|
|
|
|
|
|
|
|
|
|
|
|
|
|
|
||||||||
|
Realized Performance Revenues
|
|
230,501
|
|
|
137,184
|
|
|
290,980
|
|
|
93,317
|
|
|
68%
|
|
|
(153,796
|
)
|
|
-53%
|
|
|||||||
|
Realized Performance Compensation
|
|
(73,583
|
)
|
|
(37,977
|
)
|
|
(76,701
|
)
|
|
(35,606
|
)
|
|
94%
|
|
|
38,724
|
|
|
-50%
|
|
|||||||
|
Realized Principal Investment Income
|
|
14,274
|
|
|
24,706
|
|
|
56,733
|
|
|
(10,432
|
)
|
|
-42%
|
|
|
(32,027
|
)
|
|
-56%
|
|
|||||||
|
|
|
|
|
|
|
|
|
|
|
|
|
|
|
|
|
|
|
|
|
|
||||||||
|
Net Realizations
|
|
171,192
|
|
|
123,913
|
|
|
271,012
|
|
|
47,279
|
|
|
38%
|
|
|
(147,099
|
)
|
|
-54%
|
|
|||||||
|
|
|
|
|
|
|
|
|
|
|
|
|
|
|
|
|
|
|
|
|
|
||||||||
|
Segment Distributable Earnings
|
$
|
415,474
|
|
$
|
403,149
|
|
$
|
667,588
|
|
$
|
12,325
|
|
|
3%
|
|
$
|
(264,439
|
)
|
|
-40%
|
|
|||||||
|
|
|
|
|
|
|
|
|
|
|
|
|
|
|
|
|
|
|
|
|
|
||||||||
n/m Not meaningful.
Year Ended December 31, 2023 Compared to Year Ended December 31, 2022
Segment Distributable Earnings were $415.5 million for the year ended December 31, 2023, an increase of $12.3 million, compared to $403.1 million for the year ended December 31, 2022. The increase in Segment Distributable Earnings was attributable to an increase of $47.3 million in Net Realizations, partially offset by a decrease of $35.0 million in Fee Related Earnings.
Strategies across our Hedge Fund Solutions segment produced resilient performance in a year of market volatility. The majority of such strategies exhibited positive performance in 2023, with significantly less volatility than the broader markets. Segment Distributable Earnings in the Hedge Fund Solutions segment would likely be negatively impacted, however, by a significant or sustained weak market environment or decline in asset prices, including as a result of concerns over macroeconomic factors. In addition, while certain of our strategies are designed to benefit from a high interest rate environment, a period of sustained high interest rates combined with weak equity markets would make it difficult for funds in certain of our strategies to exceed interest rate-based performance hurdles to which such funds are subject. This would negatively impact our Segment Distributable Earnings. In addition, if interest rates remain at sustained high levels for an extended period, certain investors may seek to reallocate capital away from traditional hedge fund strategies in favor of fixed income investments. Conversely, outperformance by our Hedge Fund Solutions strategies in a weak market environment has in some cases resulted in such strategies representing an increasing portion of the value of certain investors’ portfolios, which may limit such investors’ ability to allocate additional capital to certain funds in the segment, or result in
127
such investors seeking to withdraw capital from such funds. The segment operates multiple business lines, manages strategies that are both long and short asset classes and generates a majority of its revenue through management fees. In that regard, the segment’s revenues depend in part on our ability to successfully grow such existing, diverse business lines and strategies and to identify and scale new ones to meet evolving investor appetites. In recent years, however, we have shifted the mix of our product offerings to include more products whose performance-based fees represent a more significant proportion of the fees earned from such products than has historically been the case.
Fee Related Earnings
Fee Related Earnings were $244.3 million for the year ended December 31, 2023, a decrease of $35.0 million, compared to $279.2 million for the year ended December 31, 2022. The decrease in Fee Related Earnings was primarily attributable to a decrease of $35.8 million in Management Fees, Net, partially offset by a decrease of $10.3 million in Fee Related Compensation.
Management Fees, Net were $535.5 million for the year ended December 31, 2023, a decrease of $35.8 million, compared to $571.2 million for the year ended December 31, 2022, primarily driven by a decrease in Base Management Fees. Base Management Fees decreased $36.9 million primarily due to a decrease in Fee-Earning Assets Under Management in commingled products.
Fee Related Compensation was $176.4 million for the year ended December 31, 2023, a decrease of $10.3 million, compared to $186.7 million for the year ended December 31, 2022. The decrease was primarily due to a decrease in Management Fees, Net, on which a portion of Fee Related Compensation is based.
Net Realizations
Net Realizations were $171.2 million for the year ended December 31, 2023, an increase of $47.3 million, compared to $123.9 million for the year ended December 31, 2022. The increase in Net Realizations was primarily attributable to an increase of $93.3 million in Realized Performance Revenues, partially offset by an increase of $35.6 million in Realized Performance Compensation.
Realized Performance Revenues were $230.5 million for the year ended December 31, 2023, an increase of $93.3 million, compared to $137.2 million for the year ended December 31, 2022. The increase was primarily due to increased Realized Performance Revenues in liquid and specialized solutions, offset by a decrease in customized solutions.
Realized Performance Compensation was $73.6 million for the year ended December 31, 2023, an increase of $35.6 million, compared to $38.0 million for the year ended December 31, 2022. The increase was primarily due to the increase in Realized Performance Revenues.
Composite Returns
Composite returns information is included throughout this discussion and analysis to facilitate an understanding of our results of operations for the periods presented. The composite returns information reflected in this discussion and analysis is not indicative of the financial performance of Blackstone and is also not necessarily indicative of the future results of any particular fund or composite. An investment in Blackstone is not an investment in any of our funds or composites. There can be no assurance that any of our funds or composites or our other existing and future funds or composites will achieve similar returns.
128
The following table presents the return information of the BAAM Principal Solutions Composite:
|
Average Annual Returns (a)
|
||||||||||||||||||||||||||||||||
|
Periods Ended December 31, 2023
|
||||||||||||||||||||||||||||||||
|
One Year
|
Three Year
|
Five Year
|
Historical
|
|||||||||||||||||||||||||||||
|
Composite
|
Gross
|
Net
|
Gross
|
Net
|
Gross
|
Net
|
Gross
|
Net
|
||||||||||||||||||||||||
|
BAAM Principal Solutions Composite (b)
|
|
8
|
%
|
|
7
|
%
|
|
7
|
%
|
|
6
|
%
|
|
7
|
%
|
|
6
|
%
|
|
7
|
%
|
|
6
|
%
|
||||||||
The returns presented herein represent those of the applicable Blackstone Funds and not those of Blackstone.
|
(a)
|
Composite returns present a summarized asset-weighted return measure to evaluate the overall performance of the applicable class of Blackstone Funds.
|
|
(b)
|
BAAM’s Principal Solutions (“BPS”) Composite covers the period from January 2000 to present, although BAAM’s inception date is September 1990. The BPS Composite includes only BAAM-managed commingled and customized multi-manager funds and accounts and does not include BAAM’s individual investor solutions (liquid alternatives), strategic capital (seeding and GP minority stakes), strategic opportunities (co-invests), and advisory (non-discretionary) platforms, except for investments by BPS funds directly into those platforms. BAAM-managed funds in liquidation and, in the case of net returns, non-fee-paying assets are also excluded. The funds/accounts that comprise the BPS Composite are not managed within a single fund or account and are managed with different mandates. There is no guarantee that BAAM would have made the same mix of investments in a stand-alone fund/account. The BPS Composite is not an investible product and, as such, the performance of the BPS Composite does not represent the performance of an actual fund or account. The historical return is from January 1, 2000.
|
Operating Metrics
The following table presents information regarding our Invested Performance Eligible Assets Under Management:
|
Invested Performance
Eligible Assets Under
Management
|
Estimated % Above
High Water
Mark/Benchmark (a)
|
|||||||||||||||||||||||
|
December 31,
|
December 31,
|
|||||||||||||||||||||||
|
2023
|
2022
|
2021
|
2023
|
2022
|
2021
|
|||||||||||||||||||
|
(Dollars in Thousands)
|
||||||||||||||||||||||||
|
Hedge Fund Solutions Managed Funds (b)
|
$
|
52,912,929
|
|
$
|
50,664,202
|
|
$
|
47,639,865
|
|
|
95
|
%
|
|
85
|
%
|
|
91
|
%
|
||||||
|
(a)
|
Estimated % Above High Water Mark/Benchmark represents the percentage of Invested Performance Eligible Assets Under Management that as of the dates presented would earn performance fees when the applicable Hedge Fund Solutions managed fund has positive investment performance relative to a benchmark, where applicable. Incremental positive performance in the applicable Blackstone Funds may cause additional assets to reach their respective High Water Mark or clear a benchmark return, thereby resulting in an increase in Estimated % Above High Water Mark/Benchmark.
|
|
(b)
|
For the Hedge Fund Solutions managed funds, at December 31, 2023, the incremental appreciation needed for the 5% of Invested Performance Eligible Assets Under Management below their respective High Water Marks/Benchmarks to reach their respective High Water Marks/Benchmarks was $578.3 million, a decrease of $(179.3) million, compared to $757.7 million at December 31, 2022. Of the Invested Performance Eligible Assets Under Management below their respective High Water Marks/ Benchmarks as of December 31, 2023, 9% were within 5% of reaching their respective High Water Mark.
|
129
Non-GAAP Financial Measures
These non-GAAP financial measures are presented without the consolidation of any Blackstone Funds that are consolidated into the Consolidated Financial Statements. Consequently, all non-GAAP financial measures exclude the assets, liabilities and operating results related to the Blackstone Funds. See “— Key Financial Measures and Indicators” for our definitions of Distributable Earnings, Segment Distributable Earnings, Fee Related Earnings and Adjusted EBITDA.
130
The following table is a reconciliation of Net Income Attributable to Blackstone Inc. to Distributable Earnings, Total Segment Distributable Earnings, Fee Related Earnings and Adjusted EBITDA:
|
Year Ended December 31,
|
||||||||||||
|
2023
|
2022
|
2021
|
||||||||||
|
(Dollars in Thousands)
|
||||||||||||
|
Net Income Attributable to Blackstone Inc.
|
$
|
1,390,880
|
|
$
|
1,747,631
|
|
$
|
5,857,397
|
|
|||
|
Net Income Attributable to Non-Controlling Interests in Blackstone Holdings
|
|
1,074,736
|
|
|
1,276,402
|
|
|
4,886,552
|
|
|||
|
Net Income Attributable to Non-Controlling Interests in Consolidated Entities
|
|
224,155
|
|
|
107,766
|
|
|
1,625,306
|
|
|||
|
Net Income (Loss) Attributable to Redeemable Non-Controlling Interests in Consolidated Entities
|
|
(245,518
|
)
|
|
(142,890
|
)
|
|
5,740
|
|
|||
|
|
|
|
|
|
|
|
|
|
||||
|
Net Income
|
|
2,444,253
|
|
|
2,988,909
|
|
|
12,374,995
|
|
|||
|
Provision for Taxes
|
|
513,461
|
|
|
472,880
|
|
|
1,184,401
|
|
|||
|
|
|
|
|
|
|
|
|
|
||||
|
Net Income Before Provision for Taxes
|
|
2,957,714
|
|
|
3,461,789
|
|
|
13,559,396
|
|
|||
|
Transaction-Related and Non-Recurring Items (a)
|
|
25,981
|
|
|
57,133
|
|
|
144,038
|
|
|||
|
Amortization of Intangibles (b)
|
|
33,457
|
|
|
60,481
|
|
|
68,256
|
|
|||
|
Impact of Consolidation (c)
|
|
21,363
|
|
|
35,124
|
|
|
(1,631,046
|
)
|
|||
|
Unrealized Performance Revenues (d)
|
|
1,691,788
|
|
|
3,436,978
|
|
|
(8,675,246
|
)
|
|||
|
Unrealized Performance Allocations Compensation (e)
|
|
(654,403
|
)
|
|
(1,470,588
|
)
|
|
3,778,048
|
|
|||
|
Unrealized Principal Investment (Income) Loss (f)
|
|
593,301
|
|
|
1,235,529
|
|
|
(679,767
|
)
|
|||
|
Other Revenues (g)
|
|
93,083
|
|
|
(183,754
|
)
|
|
(202,885
|
)
|
|||
|
Equity-Based Compensation (h)
|
|
959,474
|
|
|
782,090
|
|
|
559,537
|
|
|||
|
Administrative Fee Adjustment (i)
|
|
9,707
|
|
|
9,866
|
|
|
10,188
|
|
|||
|
Taxes and Related Payables (j)
|
|
(670,510
|
)
|
|
(791,868
|
)
|
|
(759,682
|
)
|
|||
|
|
|
|
|
|
|
|
|
|
||||
|
Distributable Earnings
|
|
5,060,955
|
|
|
6,632,780
|
|
|
6,170,837
|
|
|||
|
Taxes and Related Payables (j)
|
|
670,510
|
|
|
791,868
|
|
|
759,682
|
|
|||
|
Net Interest and Dividend (Income) Loss (k)
|
|
(106,120
|
)
|
|
31,494
|
|
|
33,588
|
|
|||
|
|
|
|
|
|
|
|
|
|
||||
|
Total Segment Distributable Earnings
|
|
5,625,345
|
|
|
7,456,142
|
|
|
6,964,107
|
|
|||
|
Realized Performance Revenues (l)
|
|
(2,061,102
|
)
|
|
(4,461,338
|
)
|
|
(3,883,112
|
)
|
|||
|
Realized Performance Compensation (m)
|
|
896,017
|
|
|
1,814,097
|
|
|
1,557,570
|
|
|||
|
Realized Principal Investment Income (n)
|
|
(110,932
|
)
|
|
(396,256
|
)
|
|
(587,766
|
)
|
|||
|
|
|
|
|
|
|
|
|
|
||||
|
Fee Related Earnings
|
$
|
4,349,328
|
|
$
|
4,412,645
|
|
$
|
4,050,799
|
|
|||
|
|
|
|
|
|
|
|
|
|
||||
|
Adjusted EBITDA Reconciliation
|
||||||||||||
|
Distributable Earnings
|
$
|
5,060,955
|
|
$
|
6,632,780
|
|
$
|
6,170,837
|
|
|||
|
Interest Expense (o)
|
|
429,521
|
|
|
316,569
|
|
|
196,632
|
|
|||
|
Taxes and Related Payables (j)
|
|
670,510
|
|
|
791,868
|
|
|
759,682
|
|
|||
|
Depreciation and Amortization (p)
|
|
94,124
|
|
|
69,219
|
|
|
52,187
|
|
|||
|
|
|
|
|
|
|
|
|
|
||||
|
Adjusted EBITDA
|
$
|
6,255,110
|
|
$
|
7,810,436
|
|
$
|
7,179,338
|
|
|||
|
|
|
|
|
|
|
|
|
|
||||
|
(a)
|
This adjustment removes Transaction-Related and Non-Recurring Items, which are excluded from Blackstone’s segment presentation. Transaction-Related and Non-Recurring Items arise from corporate actions including acquisitions, divestitures, Blackstone’s initial public offering and non-recurring gains, losses, or other charges, if any. They consist primarily of equity-based compensation charges, gains and losses on contingent consideration arrangements, changes in the balance of the Tax Receivable Agreement resulting from a change in tax law or similar event, transaction costs, gains or losses associated with these corporate actions and non-recurring gains, losses or other charges that affect period-to-period comparability and are not reflective of Blackstone’s operational performance.
|
131
|
(b)
|
This adjustment removes the amortization of transaction-related intangibles, which are excluded from Blackstone’s segment presentation.
|
|
(c)
|
This adjustment reverses the effect of consolidating Blackstone Funds, which are excluded from Blackstone’s segment presentation. This adjustment includes the elimination of Blackstone’s interest in these funds and the removal of amounts associated with the ownership of Blackstone consolidated operating partnerships held by non-controlling interests.
|
|
(d)
|
This adjustment removes Unrealized Performance Revenues on a segment basis. The Segment Adjustment represents the add back of performance revenues earned from consolidated Blackstone Funds which have been eliminated in consolidation.
|
|
Year Ended December 31,
|
||||||||||||
|
2023
|
2022
|
2021
|
||||||||||
|
(Dollars in Thousands)
|
||||||||||||
|
GAAP Unrealized Performance Allocations
|
$
|
(1,691,668
|
)
|
$
|
(3,435,056
|
)
|
$
|
8,675,246
|
|
|||
|
Segment Adjustment
|
|
(120
|
)
|
|
(1,922
|
)
|
|
—
|
|
|||
|
|
|
|
|
|
|
|
|
|
||||
|
Unrealized Performance Revenues
|
$
|
(1,691,788
|
)
|
$
|
(3,436,978
|
)
|
$
|
8,675,246
|
|
|||
|
|
|
|
|
|
|
|
|
|
||||
|
(e)
|
This adjustment removes Unrealized Performance Allocations Compensation.
|
|
(f)
|
This adjustment removes Unrealized Principal Investment Income on a segment basis. The Segment Adjustment represents (1) the add back of Principal Investment Income, including general partner income, earned from consolidated Blackstone Funds which have been eliminated in consolidation, and (2) the removal of amounts associated with the ownership of Blackstone consolidated operating partnerships held by non-controlling interests.
|
|
Year Ended December 31,
|
||||||||||||
|
2023
|
2022
|
2021
|
||||||||||
|
(Dollars in Thousands)
|
||||||||||||
|
GAAP Unrealized Principal Investment Income (Loss)
|
$
|
(603,154
|
)
|
$
|
(1,563,849
|
)
|
$
|
1,456,201
|
|
|||
|
Segment Adjustment
|
|
9,853
|
|
|
328,320
|
|
|
(776,434
|
)
|
|||
|
|
|
|
|
|
|
|
|
|
||||
|
Unrealized Principal Investment Income (Loss)
|
$
|
(593,301
|
)
|
$
|
(1,235,529
|
)
|
$
|
679,767
|
|
|||
|
|
|
|
|
|
|
|
|
|
||||
|
(g)
|
This adjustment removes Other Revenues on a segment basis. The Segment Adjustment represents (1) the add back of Other Revenues earned from consolidated Blackstone Funds which have been eliminated in consolidation, and (2) the removal of certain Transaction-Related and Non-Recurring Items.
|
|
Year Ended December 31,
|
||||||||||||
|
2023
|
2022
|
2021
|
||||||||||
|
(Dollars in Thousands)
|
||||||||||||
|
GAAP Other Revenue
|
$
|
(92,929
|
)
|
$
|
184,557
|
|
$
|
203,086
|
|
|||
|
Segment Adjustment
|
|
(154
|
)
|
|
(803
|
)
|
|
(201
|
)
|
|||
|
|
|
|
|
|
|
|
|
|
||||
|
Other Revenues
|
$
|
(93,083
|
)
|
$
|
183,754
|
|
$
|
202,885
|
|
|||
|
|
|
|
|
|
|
|
|
|
||||
|
(h)
|
This adjustment removes Equity-Based Compensation on a segment basis.
|
|
(i)
|
This adjustment adds an amount equal to an administrative fee collected on a quarterly basis from certain holders of Blackstone Holdings Partnership Units. The administrative fee is accounted for as a capital contribution under GAAP, but is reflected as a reduction of Other Operating Expenses in Blackstone’s segment presentation.
|
132
|
(j)
|
Taxes represent the total GAAP tax provision adjusted to include only the current tax provision (benefit) calculated on Income (Loss) Before Provision (Benefit) for Taxes and adjusted to exclude the tax impact of any divestitures. Related Payables represent tax-related payables including the amount payable under the Tax Receivable Agreement. See “— Key Financial Measures and Indicators — Distributable Earnings” for the full definition of Taxes and Related Payables.
|
|
Year Ended December 31,
|
||||||||||||
|
2023
|
2022
|
2021
|
||||||||||
|
(Dollars in Thousands)
|
||||||||||||
|
Taxes
|
$
|
580,925
|
|
$
|
693,443
|
|
$
|
703,075
|
|
|||
|
Related Payables
|
|
89,585
|
|
|
98,425
|
|
|
56,607
|
|
|||
|
|
|
|
|
|
|
|
|
|
||||
|
Taxes and Related Payables
|
$
|
670,510
|
|
$
|
791,868
|
|
$
|
759,682
|
|
|||
|
|
|
|
|
|
|
|
|
|
||||
|
(k)
|
This adjustment removes Interest and Dividend Revenue less Interest Expense on a segment basis. The Segment Adjustment represents (1) the add back of Interest and Dividend Revenue earned from consolidated Blackstone Funds which have been eliminated in consolidation, and (2) the removal of interest expense associated with the Tax Receivable Agreement.
|
|
Year Ended December 31,
|
||||||||||||
|
2023
|
2022
|
2021
|
||||||||||
|
(Dollars in Thousands)
|
||||||||||||
|
GAAP Interest and Dividend Revenue
|
$
|
516,497
|
|
$
|
271,612
|
|
$
|
160,643
|
|
|||
|
Segment Adjustment
|
|
19,144
|
|
|
13,463
|
|
|
2,401
|
|
|||
|
|
|
|
|
|
|
|
|
|
||||
|
Interest and Dividend Revenue
|
|
535,641
|
|
|
285,075
|
|
|
163,044
|
|
|||
|
|
|
|
|
|
|
|
|
|
||||
|
GAAP Interest Expense
|
|
431,868
|
|
|
317,225
|
|
|
198,268
|
|
|||
|
Segment Adjustment
|
|
(2,347
|
)
|
|
(656
|
)
|
|
(1,636
|
)
|
|||
|
|
|
|
|
|
|
|
|
|
||||
|
Interest Expense
|
|
429,521
|
|
|
316,569
|
|
|
196,632
|
|
|||
|
|
|
|
|
|
|
|
|
|
||||
|
Net Interest and Dividend Income (Loss)
|
$
|
106,120
|
|
$
|
(31,494
|
)
|
$
|
(33,588
|
)
|
|||
|
|
|
|
|
|
|
|
|
|
||||
|
(l)
|
This adjustment removes the total segment amount of Realized Performance Revenues.
|
|
(m)
|
This adjustment removes the total segment amount of Realized Performance Compensation.
|
|
(n)
|
This adjustment removes the total segment amount of Realized Principal Investment Income.
|
|
(o)
|
This adjustment adds back Interest Expense on a segment basis, excluding interest expense related to the Tax Receivable Agreement.
|
|
(p)
|
This adjustment adds back Depreciation and Amortization on a segment basis.
|
133
The following tables are a reconciliation of Total GAAP Investments to Net Accrued Performance Revenues. Total GAAP Investments and Net Accrued Performance Revenues consist of the following:
|
December 31,
|
||||||||
|
2023
|
2022
|
|||||||
|
(Dollars in Thousands)
|
||||||||
|
Investments of Consolidated Blackstone Funds
|
$
|
4,319,483
|
|
$
|
5,136,966
|
|
||
|
Equity Method Investments
|
||||||||
|
Partnership Investments
|
|
5,924,275
|
|
|
5,530,419
|
|
||
|
Accrued Performance Allocations
|
|
10,775,355
|
|
|
12,360,684
|
|
||
|
Corporate Treasury Investments
|
|
803,870
|
|
|
1,053,540
|
|
||
|
Other Investments
|
|
4,323,639
|
|
|
3,471,642
|
|
||
|
|
|
|
|
|
|
|||
|
Total GAAP Investments
|
$
|
26,146,622
|
|
$
|
27,553,251
|
|
||
|
|
|
|
|
|
|
|||
|
Accrued Performance Allocations - GAAP
|
$
|
10,775,355
|
|
$
|
12,360,684
|
|
||
|
Due from Affiliates - GAAP (a)
|
|
313,838
|
|
|
269,987
|
|
||
|
Less: Net Realized Performance Revenues (b)
|
|
(552,249
|
)
|
|
(282,730
|
)
|
||
|
Less: Accrued Performance Compensation - GAAP (c)
|
|
(4,702,363
|
)
|
|
(5,512,796
|
)
|
||
|
|
|
|
|
|
|
|||
|
Net Accrued Performance Revenues
|
$
|
5,834,581
|
|
$
|
6,835,145
|
|
||
|
|
|
|
|
|
|
|||
|
(a)
|
Represents GAAP accrued performance revenue recorded within Due from Affiliates.
|
|
(b)
|
Represents Performance Revenues realized but not yet distributed as of the reporting date and are included in Distributable Earnings in the period they are realized.
|
|
(c)
|
Represents GAAP accrued performance compensation associated with Accrued Performance Allocations and is recorded within Accrued Compensation and Benefits and Due to Affiliates.
|
Liquidity and Capital Resources
General
Blackstone’s business model derives revenue primarily from third party Assets Under Management. Blackstone is not a capital or balance sheet intensive business and targets operating expense levels such that total management and advisory fees exceed total operating expenses each period. As a result, we require limited capital resources to support the working capital or operating needs of our businesses. We draw primarily on the long-term committed or invested capital of investors in our investment vehicles to fund the investment requirements of the Blackstone Funds and use our own realizations and cash flows to invest in growth initiatives, make commitments to our own funds, where our minimum general partner commitments are generally less than 5% of the limited partner commitments of a fund, and pay dividends to stockholders and distributions to holders of Holdings Units.
Fluctuations in our statement of financial condition result primarily from activities of the Blackstone Funds that are consolidated as well as business transactions, such as the issuance of senior notes. The majority economic ownership interests of such consolidated Blackstone Funds are reflected as Redeemable Non-Controlling Interests in Consolidated Entities, and Non-Controlling Interests in Consolidated Entities in the Consolidated Financial Statements. The consolidation of these Blackstone Funds has no net effect on Blackstone’s Net Income or Equity. Additionally, fluctuations in our statement of financial condition also include appreciation or depreciation in Blackstone investments in the non-consolidated Blackstone Funds, additional investments and redemptions of such interests in the non-consolidated Blackstone Funds and the collection of receivables related to management and advisory fees.
134
Total Assets were $40.3 billion as of December 31, 2023, a decrease of $2.2 billion from December 31, 2022. The decrease in Total Assets was principally due to a decrease of $1.5 billion in total assets attributable to consolidated operating partnerships. The decrease in total assets attributable to consolidated operating partnerships was primarily due to decreases of $1.3 billion in Cash and Cash Equivalents and $641.4 million in Investments, partially offset by an increase of $312.3 million in Due from Affiliates. The decrease in Cash and Cash Equivalents was primarily due to ongoing operating activities, including the payoff at maturity of Blackstone’s 4.750% senior note due February 15, 2023. The decrease in Investments was primarily due to unrealized depreciation across our Real Estate segment and net sales of investments within Corporate Treasury Investments, partially offset by unrealized appreciation in our Private Equity segment. The increase in Due from Affiliates was primarily due to an increase in management fees, performance revenues and reimbursable expenses due from non-consolidated Blackstone Funds.
Total Liabilities were $22.2 billion as of December 31, 2023, a decrease of $630.8 million, from December 31, 2022. The decrease in Total Liabilities was principally due to decreases of $305.5 million and $274.8 million in total liabilities attributable to consolidated Blackstone Funds and total liabilities attributable to consolidated operating partnerships, respectively. The decrease in total liabilities attributable to consolidated Blackstone Funds was primarily due to a decrease of $762.9 million in Loans Payable, partially offset by an increase of $365.3 million in Accounts Payable, Accrued Expenses and Other Liabilities. The decrease in Loans Payable was primarily due to the deconsolidation of one fund, including its borrowings, during the year ended December 31, 2023, partially offset by the consolidation of three CLOs during the year ended December 31, 2023. The increase in Accounts Payable, Accrued Expenses and Other Liabilities was primarily due to the consolidation of two CLOs, including their unsettled trade liabilities during the year ended December 31, 2023. The decrease in total liabilities attributable to consolidated operating partnerships was primarily due to a decrease of $854.0 million in Accrued Compensation and Benefits, partially offset by an increase of $660.1 million in Accounts Payable, Accrued Expenses and Other Liabilities. The decrease in Accrued Compensation and Benefits was primarily due to a decrease in performance compensation. The increase in Accounts Payable, Accrued Expenses and Other Liabilities was primarily due to an increase in derivative liabilities.
Sources and Uses of Liquidity
We have multiple sources of liquidity to meet our capital needs, including annual cash flows, accumulated earnings in our businesses, the proceeds from our issuances of senior notes, liquid investments we hold on our balance sheet and access to our committed revolving credit facility. On December 15, 2023, Blackstone amended and restated its revolving credit facility to, among other things, increase available borrowings from $4.135 billion to $4.325 billion and to extend the maturity date from June 3, 2027 to December 15, 2028. As of December 31, 2023, Blackstone had $3.0 billion in Cash and Cash Equivalents, $803.9 million invested in Corporate Treasury Investments and $4.3 billion in Other Investments (which included $4.0 billion of liquid investments), against $10.7 billion in borrowings from our bond issuances, and no borrowings outstanding under our revolving credit facility.
In addition to the cash we receive from our notes offerings and availability under our revolving credit facility, we expect to receive (a) cash generated from operating activities, (b) Performance Revenue realizations, and (c) realizations on the fund investments that we make. The amounts received from these three sources in particular may vary substantially from year to year and quarter to quarter depending on the frequency and size of realization events or net returns experienced by our investment funds. Our available capital could be adversely affected if there are prolonged periods of few substantial realizations from our investment funds accompanied by substantial capital calls for new investments from those investment funds. Therefore, Blackstone’s commitments to our funds are taken into consideration when managing our overall liquidity and cash position.
135
We expect that our primary liquidity needs will be cash to (a) provide capital to facilitate the growth of our existing businesses, which principally includes funding our general partner and co-investment commitments to our funds, (b) provide capital for business expansion, (c) pay operating expenses, including cash compensation to our employees, and other obligations as they arise, (d) fund modest capital expenditures, (e) repay borrowings and related interest costs, (f) pay income taxes, (g) repurchase shares of our common stock and Blackstone Holdings Partnership Units pursuant to our repurchase program and (h) pay dividends to our stockholders and distributions to the holders of Blackstone Holdings Partnership Units. For a tabular presentation of Blackstone’s contractual obligations and the expected timing of such see “— Contractual Obligations.”
Capital Commitments
Our own capital commitments to our funds, the funds we invest in and our investment strategies as of December 31, 2023 consisted of the following:
|
Blackstone and
General Partner (a)
|
Senior Managing Directors
and Certain Other Professionals (b) |
|||||||||||||||
|
Fund
|
Original
Commitment |
Remaining
Commitment |
Original
Commitment |
Remaining
Commitment |
||||||||||||
|
(Dollars in Thousands)
|
||||||||||||||||
|
Real Estate
|
||||||||||||||||
|
BREP VII
|
|
300,000
|
|
|
28,469
|
|
|
100,000
|
|
|
9,490
|
|
||||
|
BREP VIII
|
|
300,000
|
|
|
39,823
|
|
|
100,000
|
|
|
13,274
|
|
||||
|
BREP IX
|
|
300,000
|
|
|
47,296
|
|
|
100,000
|
|
|
15,765
|
|
||||
|
BREP X
|
|
300,000
|
|
|
279,054
|
|
|
100,000
|
|
|
93,018
|
|
||||
|
BREP Europe III
|
|
100,000
|
|
|
11,257
|
|
|
35,000
|
|
|
3,752
|
|
||||
|
BREP Europe IV
|
|
130,000
|
|
|
22,477
|
|
|
43,333
|
|
|
7,492
|
|
||||
|
BREP Europe V
|
|
150,000
|
|
|
22,292
|
|
|
43,333
|
|
|
6,440
|
|
||||
|
BREP Europe VI
|
|
130,000
|
|
|
44,690
|
|
|
43,333
|
|
|
14,897
|
|
||||
|
BREP Europe VII
|
|
130,000
|
|
|
109,910
|
|
|
43,333
|
|
|
36,637
|
|
||||
|
BREP Asia I
|
|
50,392
|
|
|
10,342
|
|
|
16,797
|
|
|
3,447
|
|
||||
|
BREP Asia II
|
|
70,707
|
|
|
12,877
|
|
|
23,569
|
|
|
4,292
|
|
||||
|
BREP Asia III
|
|
81,078
|
|
|
66,892
|
|
|
27,026
|
|
|
22,297
|
|
||||
|
BREDS III
|
|
50,000
|
|
|
13,499
|
|
|
16,667
|
|
|
4,500
|
|
||||
|
BREDS IV
|
|
50,000
|
|
|
15,919
|
|
|
49,113
|
|
|
15,636
|
|
||||
|
BREDS V
|
|
50,000
|
|
|
50,000
|
|
|
48,070
|
|
|
48,070
|
|
||||
|
BPP
|
|
312,773
|
|
|
28,682
|
|
|
—
|
|
|
—
|
|
||||
|
Other (c)
|
|
30,636
|
|
|
9,767
|
|
|
—
|
|
|
—
|
|
||||
|
|
|
|
|
|
|
|
|
|
|
|
|
|||||
|
Total Real Estate
|
|
2,535,586
|
|
|
813,246
|
|
|
789,574
|
|
|
299,007
|
|
||||
|
|
|
|
|
|
|
|
|
|
|
|
|
|||||
continued...
136
|
Blackstone and
General Partner (a)
|
Senior Managing Directors
and Certain Other Professionals (b) |
|||||||||||||||
|
Fund
|
Original
Commitment |
Remaining
Commitment |
Original
Commitment |
Remaining
Commitment |
||||||||||||
|
(Dollars in Thousands)
|
||||||||||||||||
|
Private Equity
|
||||||||||||||||
|
BCP V
|
|
629,356
|
|
|
30,642
|
|
|
—
|
|
|
—
|
|
||||
|
BCP VI
|
|
719,718
|
|
|
81,400
|
|
|
250,000
|
|
|
28,275
|
|
||||
|
BCP VII
|
|
500,000
|
|
|
36,635
|
|
|
225,000
|
|
|
16,486
|
|
||||
|
BCP VIII
|
|
500,000
|
|
|
211,102
|
|
|
225,000
|
|
|
94,996
|
|
||||
|
BCP IX
|
|
500,000
|
|
|
500,000
|
|
|
225,000
|
|
|
225,000
|
|
||||
|
BEP I
|
|
50,000
|
|
|
4,728
|
|
|
—
|
|
|
—
|
|
||||
|
BEP II
|
|
80,000
|
|
|
12,018
|
|
|
26,667
|
|
|
4,006
|
|
||||
|
BEP III
|
|
80,000
|
|
|
27,907
|
|
|
26,667
|
|
|
9,302
|
|
||||
|
BETP IV
|
|
52,847
|
|
|
52,847
|
|
|
17,616
|
|
|
17,616
|
|
||||
|
BCEP I
|
|
117,747
|
|
|
27,016
|
|
|
18,992
|
|
|
4,358
|
|
||||
|
BCEP II
|
|
160,000
|
|
|
112,965
|
|
|
32,640
|
|
|
23,045
|
|
||||
|
BCP Asia I
|
|
40,000
|
|
|
5,869
|
|
|
13,333
|
|
|
1,956
|
|
||||
|
BCP Asia II
|
|
100,000
|
|
|
74,993
|
|
|
33,333
|
|
|
24,998
|
|
||||
|
Tactical Opportunities
|
|
491,315
|
|
|
228,369
|
|
|
163,772
|
|
|
76,123
|
|
||||
|
Strategic Partners
|
|
1,266,162
|
|
|
728,425
|
|
|
1,181,976
|
|
|
683,061
|
|
||||
|
BIP
|
|
338,785
|
|
|
70,891
|
|
|
—
|
|
|
—
|
|
||||
|
BXLS
|
|
142,057
|
|
|
85,065
|
|
|
37,353
|
|
|
26,477
|
|
||||
|
BXG
|
|
162,381
|
|
|
106,641
|
|
|
53,959
|
|
|
35,536
|
|
||||
|
Other (c)
|
|
290,209
|
|
|
39,547
|
|
|
—
|
|
|
—
|
|
||||
|
|
|
|
|
|
|
|
|
|
|
|
|
|||||
|
Total Private Equity
|
|
6,220,577
|
|
|
2,437,060
|
|
|
2,531,308
|
|
|
1,271,235
|
|
||||
|
|
|
|
|
|
|
|
|
|
|
|
|
|||||
|
Credit & Insurance
|
||||||||||||||||
|
Mezzanine / Opportunistic II
|
|
120,000
|
|
|
29,182
|
|
|
110,101
|
|
|
26,774
|
|
||||
|
Mezzanine / Opportunistic III
|
|
130,783
|
|
|
38,258
|
|
|
96,614
|
|
|
28,262
|
|
||||
|
Mezzanine / Opportunistic IV
|
|
122,000
|
|
|
67,933
|
|
|
115,602
|
|
|
64,370
|
|
||||
|
European Senior Debt I
|
|
63,000
|
|
|
5,084
|
|
|
56,882
|
|
|
4,590
|
|
||||
|
European Senior Debt II
|
|
92,661
|
|
|
34,805
|
|
|
89,599
|
|
|
33,679
|
|
||||
|
European Senior Debt III
|
|
21,838
|
|
|
21,834
|
|
|
7,279
|
|
|
7,278
|
|
||||
|
Stressed / Distressed II
|
|
125,000
|
|
|
51,612
|
|
|
119,878
|
|
|
49,497
|
|
||||
|
Stressed / Distressed III
|
|
151,000
|
|
|
93,835
|
|
|
146,682
|
|
|
91,152
|
|
||||
|
Energy I
|
|
80,000
|
|
|
36,785
|
|
|
75,445
|
|
|
34,691
|
|
||||
|
Energy II
|
|
150,000
|
|
|
104,262
|
|
|
148,577
|
|
|
103,273
|
|
||||
|
Energy III
|
|
127,000
|
|
|
123,190
|
|
|
117,935
|
|
|
114,397
|
|
||||
|
Credit Alpha Fund
|
|
52,102
|
|
|
19,752
|
|
|
50,670
|
|
|
19,209
|
|
||||
|
Credit Alpha Fund II
|
|
25,500
|
|
|
12,550
|
|
|
24,385
|
|
|
12,001
|
|
||||
|
Other (c)
|
|
178,823
|
|
|
82,366
|
|
|
47,229
|
|
|
12,810
|
|
||||
|
|
|
|
|
|
|
|
|
|
|
|
|
|||||
|
Total Credit & Insurance
|
|
1,439,707
|
|
|
721,448
|
|
|
1,206,878
|
|
|
601,983
|
|
||||
|
|
|
|
|
|
|
|
|
|
|
|
|
|||||
continued...
137
|
Blackstone and
General Partner (a)
|
Senior Managing Directors
and Certain Other Professionals (b) |
|||||||||||||||
|
Fund
|
Original
Commitment |
Remaining
Commitment |
Original
Commitment |
Remaining
Commitment |
||||||||||||
|
(Dollars in Thousands)
|
||||||||||||||||
|
Hedge Fund Solutions
|
||||||||||||||||
|
Strategic Alliance II
|
|
50,000
|
|
|
1,482
|
|
|
—
|
|
|
—
|
|
||||
|
Strategic Alliance III
|
|
22,000
|
|
|
17,283
|
|
|
—
|
|
|
—
|
|
||||
|
Strategic Alliance IV
|
|
15,000
|
|
|
13,548
|
|
|
—
|
|
|
—
|
|
||||
|
Strategic Holdings I
|
|
154,610
|
|
|
21,924
|
|
|
—
|
|
|
—
|
|
||||
|
Strategic Holdings II
|
|
50,000
|
|
|
21,316
|
|
|
—
|
|
|
—
|
|
||||
|
Horizon
|
|
100,000
|
|
|
27,765
|
|
|
—
|
|
|
—
|
|
||||
|
Dislocation
|
|
20,000
|
|
|
12,274
|
|
|
—
|
|
|
—
|
|
||||
|
Other (c)
|
|
7,481
|
|
|
2,397
|
|
|
—
|
|
|
—
|
|
||||
|
|
|
|
|
|
|
|
|
|
|
|
|
|||||
|
Total Hedge Fund Solutions
|
|
419,091
|
|
|
117,989
|
|
|
—
|
|
|
—
|
|
||||
|
|
|
|
|
|
|
|
|
|
|
|
|
|||||
|
Other
|
||||||||||||||||
|
Treasury (d)
|
|
1,110,932
|
|
|
874,955
|
|
|
—
|
|
|
—
|
|
||||
|
|
|
|
|
|
|
|
|
|
|
|
|
|||||
|
$
|
11,725,893
|
|
$
|
4,964,698
|
|
$
|
4,527,760
|
|
$
|
2,172,225
|
|
|||||
|
|
|
|
|
|
|
|
|
|
|
|
|
|||||
|
(a)
|
We expect our commitments to be drawn down over time and to be funded by available cash and cash generated from operations and realizations. Taking into account prevailing market conditions and both the liquidity and cash or liquid investment balances, we believe that the sources of liquidity described above will be more than sufficient to fund our working capital requirements. Additionally, for some of the general partner commitments shown in the table above, we require our senior managing directors and certain other professionals to fund a portion of the commitment even though the ultimate obligation to fund the aggregate commitment is ours pursuant to the governing agreements of the respective funds. The amounts of the aggregate applicable general partner original and remaining commitment are shown in the table above.
|
|
(b)
|
Includes the full portion of our commitments (i) required to be funded by senior managing directors and certain other professionals and (ii) that are elected by such individuals to be funded for the life of a fund, where such fund permits such election. Excludes amounts that are elected by such individuals to be funded on an annual basis and certain de minimis commitments funded by such individuals in certain carry funds.
|
|
(c)
|
Represents capital commitments to a number of other funds in each respective segment.
|
|
(d)
|
Represents loan origination commitments, revolver commitments and capital market commitments.
|
For a tabular presentation of the timing of Blackstone’s remaining capital commitments to our funds, the funds we invest in and our investment strategies see “— Contractual Obligations”.
138
Borrowings
As of December 31, 2023, Blackstone Holdings Finance Co. L.L.C. (the “Issuer”), an indirect subsidiary of Blackstone, had issued and outstanding the following senior notes (collectively the “Notes”):
|
Senior Notes (a)
|
Aggregate
Principal Amount (Dollars/Euros in Thousands) |
|||
|
2.000%, Due 5/19/2025
|
€
|
300,000
|
|
|
|
1.000%, Due 10/5/2026
|
€
|
600,000
|
|
|
|
3.150%, Due 10/2/2027
|
$
|
300,000
|
|
|
|
5.900%, Due 11/3/2027
|
$
|
600,000
|
|
|
|
1.625%, Due 8/5/2028
|
$
|
650,000
|
|
|
|
1.500%, Due 4/10/2029
|
€
|
600,000
|
|
|
|
2.500%, Due 1/10/2030
|
$
|
500,000
|
|
|
|
1.600%, Due 3/30/2031
|
$
|
500,000
|
|
|
|
2.000%, Due 1/30/2032
|
$
|
800,000
|
|
|
|
2.550%, Due 3/30/2032
|
$
|
500,000
|
|
|
|
6.200%, Due 4/22/2033
|
$
|
900,000
|
|
|
|
3.500%, Due 6/1/2034
|
€
|
500,000
|
|
|
|
6.250%, Due 8/15/2042
|
$
|
250,000
|
|
|
|
5.000%, Due 6/15/2044
|
$
|
500,000
|
|
|
|
4.450%, Due 7/15/2045
|
$
|
350,000
|
|
|
|
4.000%, Due 10/2/2047
|
$
|
300,000
|
|
|
|
3.500%, Due 9/10/2049
|
$
|
400,000
|
|
|
|
2.800%, Due 9/30/2050
|
$
|
400,000
|
|
|
|
2.850%, Due 8/5/2051
|
$
|
550,000
|
|
|
|
3.200%, Due 1/30/2052
|
$
|
1,000,000
|
|
|
|
|
|
|
||
|
$
|
10,707,800
|
|
||
|
|
|
|
||
|
(a)
|
The Notes are unsecured and unsubordinated obligations of the Issuer and are fully and unconditionally guaranteed, jointly and severally, by Blackstone Inc. and each of the Blackstone Holdings Partnerships. The Notes contain customary covenants and financial restrictions that, among other things, limit the Issuer and the guarantors’ ability, subject to certain exceptions, to incur indebtedness secured by liens on voting stock or profit participating equity interests of their subsidiaries or merge, consolidate or sell, transfer or lease assets. The Notes also contain customary events of default. All or a portion of the Notes may be redeemed at our option, in whole or in part, at any time and from time to time, prior to their stated maturity, at the make-whole redemption price set forth in the Notes. If a change of control repurchase event occurs, the Notes are subject to repurchase at the repurchase price as set forth in the Notes.
|
Blackstone, through the Issuer, has a $4.325 billion unsecured revolving credit facility (the “Credit Facility”) with Citibank, N.A., as administrative agent with a maturity date of December 15, 2028. Borrowings may also be made in U.K. sterling, euros, Swiss francs, Japanese yen or Canadian dollars, in each case subject to certain sub-limits. The Credit Facility contains customary representations, covenants and events of default. Financial covenants consist of a maximum net leverage ratio and a requirement to keep a minimum amount of fee-earning assets under management, each tested quarterly.
139
For a tabular presentation of the payment timing of principal and interest due on Blackstone’s issued notes and the Credit Facility see “— Contractual Obligations”.
Contractual Obligations
The following table sets forth information relating to our contractual obligations as of December 31, 2023 on a consolidated basis and on a basis deconsolidating the Blackstone Funds:
|
Contractual Obligations
|
2024
|
2025-2026
|
2027-2028
|
Thereafter
|
Total
|
|||||||||||||||
|
(Dollars in Thousands)
|
||||||||||||||||||||
|
Operating Lease Obligations (a)
|
$
|
161,106
|
|
$
|
339,275
|
|
$
|
327,978
|
|
$
|
577,044
|
|
$
|
1,405,403
|
|
|||||
|
Purchase Obligations
|
|
128,176
|
|
|
130,592
|
|
|
33,120
|
|
|
1,890
|
|
|
293,778
|
|
|||||
|
Blackstone Operating Borrowings (b)
|
|
17
|
|
|
1,007,780
|
|
|
1,575,662
|
|
|
8,164,290
|
|
|
10,747,749
|
|
|||||
|
Interest on Blackstone Operating Borrowings (c)
|
|
348,391
|
|
|
689,955
|
|
|
623,548
|
|
|
3,268,270
|
|
|
4,930,164
|
|
|||||
|
Borrowings of Consolidated Blackstone Funds
|
|
—
|
|
|
—
|
|
|
—
|
|
|
858,133
|
|
|
858,133
|
|
|||||
|
Interest on Borrowings of Consolidated Blackstone Funds
|
|
—
|
|
|
101,005
|
|
|
101,005
|
|
|
97,819
|
|
|
299,829
|
|
|||||
|
Blackstone Funds Capital Commitments to Investee
Funds (d) |
|
364,357
|
|
|
—
|
|
|
—
|
|
|
—
|
|
|
364,357
|
|
|||||
|
Due to Certain Non-Controlling Interest Holders in Connection with Tax Receivable Agreements (e)
|
|
87,508
|
|
|
191,701
|
|
|
233,349
|
|
|
1,169,085
|
|
|
1,681,643
|
|
|||||
|
Unrecognized Tax Benefits, Including Interest and Penalties (f)
|
|
—
|
|
|
—
|
|
|
—
|
|
|
—
|
|
|
—
|
|
|||||
|
Blackstone Operating Entities Capital Commitments to Blackstone Funds and Other (g)
|
|
4,964,698
|
|
|
—
|
|
|
—
|
|
|
—
|
|
|
4,964,698
|
|
|||||
|
|
|
|
|
|
|
|
|
|
|
|
|
|
|
|
||||||
|
Consolidated Contractual Obligations
|
|
6,054,253
|
|
|
2,460,308
|
|
|
2,894,662
|
|
|
14,136,531
|
|
|
25,545,754
|
|
|||||
|
Borrowings of Consolidated Blackstone Funds
|
|
—
|
|
|
—
|
|
|
—
|
|
|
(858,133
|
)
|
|
(858,133
|
)
|
|||||
|
Interest on Borrowings of Consolidated Blackstone Funds
|
|
—
|
|
|
(101,005
|
)
|
|
(101,005
|
)
|
|
(97,819
|
)
|
|
(299,829
|
)
|
|||||
|
Blackstone Funds Capital Commitments to Investee
Funds (d) |
|
(364,357
|
)
|
|
—
|
|
|
—
|
|
|
—
|
|
|
(364,357
|
)
|
|||||
|
|
|
|
|
|
|
|
|
|
|
|
|
|
|
|
||||||
|
Blackstone Operating Entities Contractual Obligations
|
$
|
5,689,896
|
|
$
|
2,359,303
|
|
$
|
2,793,657
|
|
$
|
13,180,579
|
|
$
|
24,023,435
|
|
|||||
|
|
|
|
|
|
|
|
|
|
|
|
|
|
|
|
||||||
|
(a)
|
We lease our primary office space and certain office equipment under agreements that expire through 2043. Occupancy lease agreements, in addition to contractual rent payments, generally include additional payments for certain costs incurred by the landlord, such as building expenses and utilities. To the extent these are fixed or determinable they are included in the table above. The table above includes operating leases that are recognized as Operating Lease Liabilities, short-term leases that are not recorded as Operating Lease Liabilities and leases that have been signed but not yet commenced which are not recorded as Operating Lease Liabilities. The amounts in this table are presented net of contractual sublease commitments.
|
|
(b)
|
Represents the principal amounts due on our senior notes and secured borrowings. For our senior notes, we assume no pre-payments and the borrowings are held until their final maturity. For our secured borrowings we project prepayments based on the performance of the underlying assets and principal may be paid down in full prior to their stated maturity. As of December 31, 2023, we had no borrowings outstanding under our revolver.
|
140
|
(c)
|
Represents interest to be paid over the maturity of our senior notes and secured borrowings. For our senior notes, we assume no pre-payments and the borrowings are held until their final maturity. For our secured borrowings, we project pre-payments based on the performance of the underlying assets with interest payments based on the estimated principal outstanding, inclusive of projected pre-payments. These amounts include commitment fees for unutilized borrowings under our revolver.
|
|
(d)
|
These obligations represent commitments of the consolidated Blackstone Funds to make capital contributions to investee funds and portfolio companies. These amounts are generally due on demand and are therefore presented in the less than one year category.
|
|
(e)
|
Represents obligations by Blackstone’s corporate subsidiary to make payments under the Tax Receivable Agreements to certain non-controlling interest holders for the tax savings realized from the taxable purchases of their interests in connection with the reorganization at the time of Blackstone’s IPO in 2007 and subsequent purchases. The obligation represents the amount of the payments currently expected to be made, which are dependent on the tax savings actually realized as determined annually without discounting for the timing of the payments. As required by GAAP, the amount of the obligation included in the Consolidated Financial Statements and shown in Note 18. “Related Party Transactions” (see “— Item 8. Financial Statements and Supplementary Data”) differs to reflect the net present value of the payments due to certain non-controlling interest holders.
|
|
(f)
|
Blackstone is not able to make a reasonably reliable estimate of the timing of payments in individual years in connection with gross unrecognized benefits of $210.8 million and interest of $60.8 million as of December 31, 2023; therefore, such amounts are not included in the above contractual obligations table.
|
|
(g)
|
These obligations represent commitments by us to provide general partner capital funding to the Blackstone Funds, limited partner capital funding to other funds and Blackstone principal investment commitments. These amounts are generally due on demand and are therefore presented in the less than one year category; however, a substantial amount of the capital commitments are expected to be called over the next three years. We expect to continue to make these general partner capital commitments as we raise additional amounts for our investment funds over time.
|
Guarantees
Blackstone and certain of its consolidated funds provide financial guarantees. The amounts and nature of these guarantees are described in Note 19. “Commitments and Contingencies — Contingencies — Guarantees” in the “Notes to Consolidated Financial Statements” in “— Item 8. Financial Statements and Supplementary Data” of this filing.
Indemnifications
In many of its service contracts, Blackstone agrees to indemnify the third party service provider under certain circumstances. The terms of the indemnities vary from contract to contract and the amount of indemnification liability, if any, cannot be determined and has not been included in the above contractual obligations table or recorded in our Consolidated Financial Statements as of December 31, 2023.
Clawback Obligations
Performance Allocations are subject to clawback to the extent that the Performance Allocations received to date with respect to a fund exceed the amount due to Blackstone based on cumulative results of that fund. The amounts and nature of Blackstone’s clawback obligations are described in Note 19. “Commitments and Contingencies — Contingencies — Contingent Obligations (Clawback)” in the “Notes to Consolidated Financial Statements” in “— Item 8. Financial Statements and Supplementary Data” of this filing.
141
Share Repurchase Program
On December 7, 2021, Blackstone’s board of directors authorized the repurchase of up to $2.0 billion of common stock and Blackstone Holdings Partnership Units. Under the repurchase program, repurchases may be made from time to time in open market transactions, in privately negotiated transactions or otherwise. The timing and the actual number repurchased will depend on a variety of factors, including legal requirements, price and economic and market conditions. The repurchase program may be changed, suspended or discontinued at any time and does not have a specified expiration date.
During the year ended December 31, 2023, Blackstone repurchased 3.7 million shares of common stock at a total cost of $351.3 million. As of December 31, 2023, the amount remaining available for repurchases under the program was $756.8 million.
Dividends
Our intention is to pay to holders of common stock a quarterly dividend representing approximately 85% of Blackstone Inc.’s share of Distributable Earnings, subject to adjustment by amounts determined by our board of directors to be necessary or appropriate to provide for the conduct of our business, to make appropriate investments in our business and funds, to comply with applicable law, any of our debt instruments or other agreements, or to provide for future cash requirements such as tax-related payments, clawback obligations and dividends to stockholders for any ensuing quarter. The dividend amount could also be adjusted upward in any one quarter.
For Blackstone’s definition of Distributable Earnings, see “— Key Financial Measures and Indicators.”
All of the foregoing is subject to the qualification that the declaration and payment of any dividends are at the sole discretion of our board of directors, and our board of directors may change our dividend policy at any time, including, without limitation, to reduce such quarterly dividends or even to eliminate such dividends entirely.
Because the publicly traded entity and/or its wholly owned subsidiaries must pay taxes and make payments under the tax receivable agreements, the amounts ultimately paid as dividends by Blackstone to common stockholders in respect of each fiscal year are generally expected to be less, on a per share or per unit basis, than the amounts distributed by the Blackstone Holdings Partnerships to the Blackstone personnel and others who are limited partners of the Blackstone Holdings Partnerships in respect of their Blackstone Holdings Partnership Units. Following Blackstone’s conversion from a limited partnership to a corporation, we expect to pay more corporate income taxes than we would have as a limited partnership, which will increase this difference between the per share dividend and per unit distribution amounts.
Dividends are treated as qualified dividends to the extent of Blackstone’s current and accumulated earnings and profits, with any excess dividends treated as a return of capital to the extent of the stockholder’s basis.
The following graph shows fiscal quarterly and annual per common stockholder dividends for 2023, 2022 and 2021. Dividends are declared and paid in the quarter subsequent to the quarter in which they are earned.
142
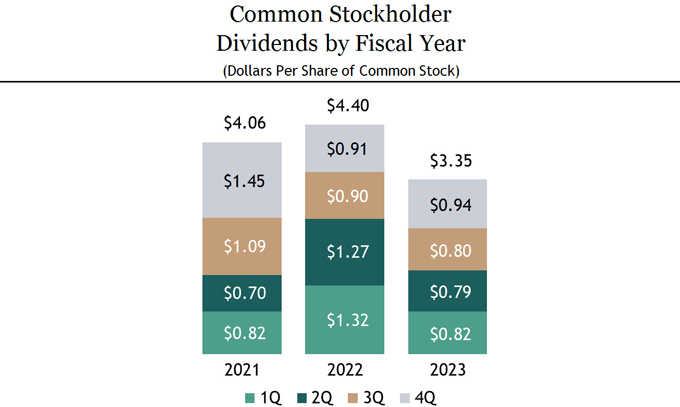
With respect to fiscal year 2023, we paid to stockholders of our common stock a dividend of $0.82, $0.79, $0.80 and $0.94 per share in respect of the first, second, third and fourth quarters, respectively, aggregating to $3.35 per share of common stock. With respect to fiscal years 2022 and 2021, we paid stockholders of our common stock aggregate dividends of $4.40 per share and $4.06 per share, respectively.
Leverage
We may under certain circumstances use leverage opportunistically and over time to create the most efficient capital structure for Blackstone and our stockholders. In addition to the borrowings from our notes issuances and our revolving credit facility, we may use reverse repurchase agreements, repurchase agreements and securities sold, not yet purchased. Reverse repurchase agreements are entered into primarily to take advantage of opportunistic yields otherwise absent in the overnight markets and also to use the collateral received to cover securities sold, not yet purchased. Repurchase agreements are entered into primarily to opportunistically yield higher spreads on purchased securities. The balances held in these financial instruments fluctuate based on Blackstone’s liquidity needs, market conditions and investment risk profiles.
143
The following table presents information regarding these financial instruments which are included in Accounts Payable, Accrued Expenses and Other Liabilities in our Consolidated Statements of Financial Condition:
|
Repurchase
Agreements |
Securities
Sold, Not Yet Purchased |
|||||||
|
(Dollars in Millions)
|
||||||||
|
Balance, December 31, 2023
|
$
|
—
|
|
$
|
3.9
|
|
||
|
Balance, December 31, 2022
|
$
|
89.9
|
|
$
|
3.8
|
|
||
|
Year Ended December 31, 2023
|
||||||||
|
Average Daily Balance
|
$
|
24.7
|
|
$
|
3.8
|
|
||
|
Maximum Daily Balance
|
$
|
90.1
|
|
$
|
4.0
|
|
||
Critical Accounting Policies
We prepare our Consolidated Financial Statements in accordance with GAAP. In applying many of these accounting principles, we need to make assumptions, estimates and/or judgments that affect the reported amounts of assets, liabilities, revenues and expenses in our Consolidated Financial Statements. We base our estimates and judgments on historical experience and other assumptions that we believe are reasonable under the circumstances. These assumptions, estimates and/or judgments, however, are often subjective. Actual results may be affected negatively based on changing circumstances. If actual amounts are ultimately different from our estimates, the revisions are included in our results of operations for the period in which the actual amounts become known. We believe the following critical accounting policies could potentially produce materially different results if we were to change underlying assumptions, estimates and/or judgments. For a description of our accounting policies, see Note 2. “Summary of Significant Accounting Policies” in the “Notes to Consolidated Financial Statements” in “— Item 8. Financial Statements and Supplementary Data” of this filing.
Principles of Consolidation
For a description of our accounting policy on consolidation, see Note 2. “Summary of Significant Accounting Policies — Consolidation” and Note 9. “Variable Interest Entities” in the “Notes to Consolidated Financial Statements” in “— Item 8. Financial Statements and Supplementary Data” for detailed information on Blackstone’s involvement with VIEs. The following discussion is intended to provide supplemental information about how the application of consolidation principles impact our financial results, and management’s process for implementing those principles including areas of significant judgment.
The determination that Blackstone holds a controlling financial interest in a Blackstone Fund or investment vehicle significantly changes the presentation of our consolidated financial statements. In our Consolidated Statements of Financial Position included in this filing, we present 100% of the assets and liabilities of consolidated VIEs along with a non-controlling interest which represents the portion of the consolidated vehicle’s interests held by third parties. However, assets of our consolidated VIEs can only be used to settle obligations of the consolidated VIE and are not available for general use by Blackstone. Further, the liabilities of our consolidated VIEs do not have recourse to the general credit of Blackstone. In the Consolidated Statements of Operations, we eliminate any management fees, Incentive Fees, or Performance Allocations received or accrued from consolidated VIEs as they are considered intercompany transactions. We recognize 100% of the consolidated VIE’s investment income (loss) and allocate the portion of that income (loss) attributable to third party ownership to non-controlling interests in arriving at Net Income Attributable to Blackstone Inc.
The assessment of whether we consolidate a Blackstone Fund or investment vehicle we manage requires the application of significant judgment. These judgments are applied both at the time we become involved with the VIE and on an ongoing basis and include, but are not limited to:
144
|
•
|
Determining whether our management fees, Incentive Fees or Performance Allocations represent variable interests — We make judgments as to whether the fees we earn are commensurate with the level of effort required for those fees and at market rates. In making this judgment, we consider, among other things, the extent of third party investment in the entity and the terms of any other interests we hold in the VIE.
|
|
•
|
Determining whether kick-out rights are substantive — We make judgments as to whether the third party investors in a partnership entity have the ability to remove the general partner, the investment manager or its equivalent, or to dissolve (liquidate) the partnership entity, through a simple majority vote. This includes an evaluation of whether barriers to exercise these rights exist.
|
|
•
|
Concluding whether Blackstone has an obligation to absorb losses or the right to receive benefits that could potentially be significant to the VIE — As there is no explicit threshold in GAAP to define “potentially significant,” management must apply judgment and evaluate both quantitative and qualitative factors to conclude whether this threshold is met.
|
Revenue Recognition
For a description of our accounting policy on revenue recognition, see Note 2. “Summary of Significant Accounting Policies — Revenue Recognition” in the “Notes to Consolidated Financial Statements” in “— Item 8. Financial Statements and Supplementary Data.” For an additional description of the nature of our revenue arrangements, including how management fees, Incentive Fees, and Performance Allocations are generated, please refer to “Part I. Item 1. Business — Fee Structure/Incentive Arrangements.” The following discussion is intended to provide supplemental information about how the application of revenue recognition principles impact our financial results, and management’s process for implementing those principles including areas of significant judgment.
Management and Advisory Fees, Net
On private equity, real estate, and certain of our hedge fund solutions and credit-focused funds:
|
•
|
0.25% to 1.75% of committed capital or invested capital during the investment period,
|
|
•
|
0.25% to 1.50% of invested capital, committed capital or investment fair value subsequent to the investment period for private equity and real estate funds, and
|
|
•
|
1.00% to 1.75% of invested capital or net asset value subsequent to the investment period for certain of our hedge fund solutions and
credit-focused
funds.
|
On real estate and credit-focused funds structured like hedge funds:
|
•
|
0.50% to 1.00% of net asset value.
|
On credit separately managed accounts:
|
•
|
0.20% to 1.35% of net asset value or total assets.
|
On real estate separately managed accounts:
|
•
|
0.35% to 2.00% of invested capital, net operating income or net asset value.
|
145
On insurance separately managed accounts and investment vehicles:
|
•
|
0.25% to 1.00% of net asset value.
|
On funds of hedge funds, certain hedge funds and separately managed accounts invested in hedge funds:
|
•
|
0.20% to 1.50% of net asset value.
|
On CLO vehicles:
|
•
|
0.20% to 0.50% of the aggregate par amount of collateral assets, including principal cash.
|
On credit-focused registered and non-registered investment companies:
|
•
|
0.25% to 1.25% of total assets or net asset value.
|
The investment adviser of BXMT receives annual management fees based on 1.50% of BXMT’s net proceeds received from equity offerings and accumulated “distributable earnings” (which is generally equal to its GAAP net income excluding certain non-cash and other items), subject to certain adjustments. The investment advisers of BREIT and BEPIF receive a management fee of 1.25% per annum of net asset value, payable monthly.
Management fee calculations based on committed capital or invested capital are mechanical in nature and therefore do not require the use of significant estimates or judgments. Management fee calculations based on net asset value, total assets, or investment fair value depend on the fair value of the underlying investments within the funds. Estimates and assumptions are made when determining the fair value of the underlying investments within the funds and could vary depending on the valuation methodology that is used as well as economic conditions. See “— Fair Value” below for further discussion of the judgment required for determining the fair value of the underlying investments.
Investment Income (Loss)
The change in the fair value of the investments held by certain Blackstone Funds is a significant input into the accrued Performance Allocation calculation and accrual for potential repayment of previously received Performance Allocations. Estimates and assumptions are made when determining the fair value of the underlying investments within the funds. See “— Fair Value” below for further discussion related to significant estimates and assumptions used for determining fair value of the underlying investments.
Fair Value
Blackstone uses fair value throughout the reporting process. For a description of our accounting policies related to valuation, see Note 2. “Summary of Significant Accounting Policies — Fair Value of Financial Instruments” and “Summary of Significant Accounting Policies — Investments at Fair Value” in the “Notes to Consolidated Financial Statements” in “— Item 8. Financial Statements and Supplementary Data” of this filing. The following discussion is intended to provide supplemental information about how the application of fair value principles impact our financial results, and management’s process for implementing those principles including areas of significant judgment.
146
The fair value of the investments held by Blackstone Funds is the primary input to the calculation of certain of our management fees, Incentive Fees, Performance Allocations and the related Compensation we recognize. Generally, Blackstone Funds are accounted for as investment companies under the American Institute of Certified Public Accountants Audit and Accounting Guide,
, and in accordance with the GAAP guidance on investment companies and reflect their investments, including majority-owned and controlled investments (the “Portfolio Companies”), at fair value. In the absence of observable market prices, we utilize valuation methodologies applied on a consistent basis and assumptions that we believe market participants would use to determine the fair value of the investments. For investments where little market activity exists management’s determination of fair value is based on the best information available in the circumstances, which may incorporate management’s own assumptions and involves a significant degree of judgment, and the consideration of a combination of internal and external factors, including the appropriate risk adjustments for non-performance and liquidity risks.
Investment Companies
Blackstone has also elected the fair value option for certain instruments it owns directly, including loans and receivables, investments in private debt securities and other proprietary investments. Blackstone is required to measure certain financial instruments at fair value, including debt instruments, equity securities and freestanding derivatives.
Fair Value of Investments or Instruments that are Publicly Traded
Securities that are publicly traded and for which a quoted market exists will be valued at the closing price of such securities in the principal market in which the security trades, or in the absence of a principal market, in the most advantageous market on the valuation date. When a quoted price in an active market exists, no block discounts or control premiums are permitted regardless of the size of the public security held. In some cases, securities will include legal and contractual restrictions limiting their purchase and sale for a period of time. A discount to publicly traded price may be appropriate in instances where a legal restriction is a characteristic of the security, such as may be required under SEC Rule 144. The amount of the discount, if taken, shall be determined based on the time period that must pass before the restricted security becomes unrestricted or otherwise available for sale.
Fair Value of Investments or Instruments that are not Publicly Traded
Investments for which market prices are not observable include private investments in the equity or debt of operating companies or real estate properties. Our primary methodology for determining the fair values of such investments is generally the income approach which provides an indication of fair value based on the present value of cash flows that a business, security, or property is expected to generate in the future. The most widely used methodology under the income approach is the discounted cash flow method which includes significant assumptions about the underlying investment’s projected net earnings or cash flows, discount rate, capitalization rate and exit multiple. Our secondary methodology, generally used to corroborate the results of the income approach, is typically the market approach. The most widely used methodology under the market approach relies upon valuations for comparable public companies, transactions, or assets, and includes making judgments about which companies, transactions, or assets are comparable. Depending on the facts and circumstances associated with the investment, different primary and secondary methodologies may be used including option value, contingent claims or scenario analysis, yield analysis, projected cash flow through maturity or expiration, discount to sale, probability weighted methods or recent round of financing.
147
In certain cases debt and equity securities are valued on the basis of prices from an orderly transaction between market participants provided by reputable dealers or pricing services. In determining the value of a particular investment, pricing services may use certain information with respect to transactions in such investments, quotations from dealers, pricing matrices and market transactions in comparable investments and various relationships between investments.
Management Process on Fair Value
Due to the importance of fair value throughout the consolidated financial statements and the significant judgment required to be applied in arriving at those fair values, we have developed a process around valuation that incorporates several levels of approval and review from both internal and external sources. Investments held by Blackstone Funds and investment vehicles are valued on at least a quarterly basis by our internal valuation or asset management teams, which are independent from our investment teams. For investments held by vehicles managed by more than one business unit, Blackstone has developed a process designed to facilitate coordination and alignment, as appropriate, of the fair value of in-scope investments across business units.
For investments valued utilizing the income method and where Blackstone has information rights, we generally have a direct line of communication with each of the Portfolio Companies’ and underlying assets’ finance teams and collect financial data used to support projections used in a discounted cash flow analysis. The valuation team then analyzes the data received and updates the valuation models reflecting any changes in the underlying cash flow projections, weighted-average cost of capital, exit multiple or capitalization rate, and any other valuation input relevant to economic conditions.
The results of all valuations of investments held by Blackstone Funds and investment vehicles are reviewed by the relevant business unit’s valuation sub-committee, which is comprised of key personnel from the business unit, typically the chief investment officer, chief operating officer, chief financial officer, chief compliance officer (or their respective equivalents where applicable) and other senior managing directors in the business. To further corroborate results, each business unit also generally obtains either a positive assurance opinion or a range of value from an independent valuation party, at least annually for internally prepared valuations for investments that have been held by Blackstone Funds and investment vehicles for greater than a year and quarterly for certain investments. Our firmwide valuation committee, chaired by our Chief Financial Officer and comprised of senior members of our businesses and representatives from corporate functions, including legal and finance, reviews the valuation process for investments held by us and our investment vehicles, including the application of appropriate valuation standards on a consistent basis. Each quarter, the valuation process is also reviewed by the audit committee of our board of directors, which is comprised of our non-employee directors.
Income Tax
For a description of our accounting policy on taxes and additional information on taxes see Note 2. “Summary of Significant Accounting Policies” and Note 15. “Income Taxes,” in the “Notes to Consolidated Financial Statements” in “— Item 8. Financial Statements and Supplementary Data” of this filing.
Our provision for income taxes is composed of current and deferred taxes. Current income taxes approximate taxes to be paid or refunded for the current period. Deferred income taxes reflect the net tax effects of temporary differences between the financial reporting and tax bases of assets and liabilities and are measured using the applicable enacted tax rates and laws that will be in effect when such differences are expected to reverse.
Additionally, significant judgment is required in estimating the provision for (benefit from) income taxes, current and deferred tax balances (including valuation allowance), accrued interest or penalties and uncertain tax positions. In evaluating these judgments, we consider, among other items, projections of taxable income (including the character of such income), beginning with historic results and incorporating assumptions of the amount of future pretax operating income. These assumptions about future taxable income require significant judgment and are consistent with the plans and estimates that Blackstone uses to manage its business. To the extent any portion of the deferred tax assets are not considered to be more likely than not to be realized, a valuation allowance is recorded.
148
Revisions in estimates and/or actual costs of a tax assessment may ultimately be materially different from the recorded accruals and unrecognized tax benefits, if any.
Recent Accounting Developments
Information regarding recent accounting developments and their impact on Blackstone, if any, can be found in Note 2. “Summary of Significant Accounting Policies” in the “Notes to Consolidated Financial Statements” in “— Item 8. Financial Statements and Supplementary Data” of this filing.
Interbank Offered Rates Transition
Certain jurisdictions are currently reforming or phasing out their benchmark interest rates, most notably LIBOR across multiple currencies. Most such reforms and phase outs, including all tenors of U.S. dollar LIBOR, became effective on or prior to June 30, 2023, though some rates may persist on a synthetic basis through September 2024. Blackstone has taken steps to prepare for and mitigate the impact of changing base rates and continues to manage transition efforts and evaluate the impact of prospective changes on existing transactions and contractual arrangements. See “Part I. Item 1A. Risk Factors — Risks Related to Our Business — Interest rates on our and our funds’ portfolio companies’ outstanding financial instruments have been and might in the future be subject to change based on regulatory developments, which could adversely affect our investment returns and our and our portfolio companies’ borrowing costs.”
|
Item 7A.
|
Quantitative and Qualitative Disclosures About Market Risk
|
Our predominant exposure to market risk is related to our role as general partner or investment adviser to the Blackstone Funds and the sensitivities to movements in the fair value of their investments, including the effect on management fees, performance revenues and investment income. See “Part I. — Item 1. Business — Investment Process and Risk Management.”
Effect on Fund Management Fees
Our management fees are based on (a) third parties’ capital commitments to a Blackstone Fund, (b) third parties’ capital invested in a Blackstone Fund or (c) the net asset value (“NAV”) or gross asset value (“GAV”) of a Blackstone Fund, vehicle or separately managed account, as described in our Consolidated Financial Statements. Management fees will only be directly affected by short-term changes in market conditions to the extent they are based on NAV, GAV or represent permanent impairments of value. These management fees will be increased (or reduced) in direct proportion to the effect of changes in the fair value of our investments in the related funds. The proportion of our management fees that are based on NAV or GAV is dependent on the number and types of Blackstone Funds, vehicles, or separately managed accounts in existence and the current stage of each fund’s life cycle. For the years ended December 31, 2023 and December 31, 2022, the percentages of our fund management fees based on the NAV or GAV of the applicable funds or separately managed accounts, were as follows:
|
Year Ended December 31,
|
||||||||
|
2023
|
2022
|
|||||||
|
Fund Management Fees Based on the NAV or GAV of the Applicable Funds or Separately Managed Accounts
|
|
47
|
%
|
|
49
|
%
|
||
149
Market Risk
The Blackstone Funds hold investments which are reported at fair value and Blackstone invests directly in securities measured at fair value. Based on the fair value as of December 31, 2023 and December 31, 2022, we estimate that a 10% decline in the fair value of investments, excluding equity securities without a readily determinable fair value measured in accordance with the measurement alternative, and certain freestanding derivative instruments would result in the following declines in Management and Advisory Fees, Net, Unrealized Performance Allocations, Net and Unrealized Principal Investment Income:
|
December 31,
|
||||||||||||||||||||||||
|
2023
|
2022
|
|||||||||||||||||||||||
|
Management
and Advisory Fees, Net (a) |
Unrealized
Performance Allocations, Net (b) |
Unrealized
Principal Investment Income (c) |
Management
and Advisory Fees, Net (a) |
Unrealized
Performance Allocations, Net (b) |
Unrealized
Principal Investment Income (c) |
|||||||||||||||||||
|
(Dollars in Thousands)
|
||||||||||||||||||||||||
|
10% Decline in Fair Value of the Investments
|
$
|
392,340
|
|
$
|
2,172,376
|
|
$
|
835,037
|
|
$
|
319,183
|
|
$
|
2,249,535
|
|
$
|
549,836
|
|
||||||
|
(a)
|
Represents the annualized effect of the 10% decline.
|
|
(b)
|
Represents the reporting date effect of the 10% decline. Presented net of Unrealized Performance Allocations Compensation.
|
|
(c)
|
Represents the reporting date effect of the 10% decline. Also includes the net effect of consolidated funds, which reflects the change on Net Gains from Fund Investment Activities, net of Non-Controlling Interests.
|
The fair value of the investments, derivatives and securities subject to the market risk sensitivities can vary significantly based on a number of factors, including the diversity of the Blackstone Funds’ investment portfolio, market conditions, trading values, similar transactions, financial metrics, and industry comparatives. See “Part I. Item 1A. Risk Factors” above. Also see “— Item 7. Management’s Discussion and Analysis of Financial Condition and Results of Operations — Critical Accounting Policies — Fair Value.” We believe these fair value amounts should be utilized with caution as our intent and strategy is to hold investments and securities until prevailing market conditions are beneficial for investment sales.
Exchange Rate Risk
Blackstone and the Blackstone Funds hold investments that are denominated in non-U.S. dollar currencies that may be affected by movements in the rate of exchange between the U.S. dollar and non-U.S. dollar currencies. Additionally, a portion of our management fees are denominated in non-U.S. dollar currencies. We estimate that as of December 31, 2023 and December 31, 2022, a 10% decline in the rate of exchange of all foreign currencies against the U.S. dollar would result in the following declines in Management and Advisory Fees, Net, Unrealized Performance Allocations, Net and Unrealized Principal Investment Income:
|
December 31,
|
||||||||||||||||||||||||
|
2023
|
2022
|
|||||||||||||||||||||||
|
Management
and Advisory Fees, Net (a) |
Unrealized
Performance Allocations, Net (b)(c) |
Unrealized
Principal Investment Income (b) |
Management
and Advisory Fees, Net (a) |
Unrealized
Performance Allocations, Net (b)(c) |
Unrealized
Principal Investment Income (b) |
|||||||||||||||||||
|
(Dollars in Thousands)
|
||||||||||||||||||||||||
|
10% Decline in the Rate of Exchange of All Foreign Currencies Against the U.S. Dollar
|
$
|
40,373
|
|
$
|
596,201
|
|
$
|
74,707
|
|
$
|
38,466
|
|
$
|
850,109
|
|
$
|
79,333
|
|
||||||
|
(a)
|
Represents the annualized effect of the 10% decline.
|
|
(b)
|
Represents the reporting date effect of the 10% decline.
|
|
(c)
|
Presented net of Unrealized Performance Allocations Compensation.
|
150
Interest Rate Risk
Blackstone may have debt obligations payable that accrue interest at variable rates. Interest rate changes may therefore affect the amount of our interest payments, future earnings and cash flows. As of December 31, 2023, Blackstone had $39.9 million outstanding under the Secured Borrowings that is subject to interest at a variable rate. The annualized increase in interest expense due to a 1% increase in interest rates would be $0.4 million as a result of these borrowings. Blackstone did not have variable interest based debt obligations payable as of December 31, 2022 and therefore, interest expense was not impacted by changes in interest rates for the year ended December 31, 2022.
Blackstone has a diversified portfolio of liquid assets to meet the liquidity needs of various businesses. This portfolio includes cash, open-ended money market mutual funds, open-ended bond mutual funds, marketable investment securities, freestanding derivative contracts, repurchase and reverse repurchase agreements and other investments. If interest rates were to increase by one percentage point, we estimate that our annualized investment income would decrease, offset by an estimated increase in interest income on an annual basis from interest on floating rate assets, as follows:
|
December 31,
|
||||||||||||||||
|
2023
|
2022
|
|||||||||||||||
|
Annualized
Decrease in Investment Income |
Annualized
Increase in Interest Income from Floating Rate Assets |
Annualized
Decrease in Investment Income |
Annualized
Increase in Interest Income from Floating Rate Assets |
|||||||||||||
|
(Dollars in Thousands)
|
||||||||||||||||
|
One Percentage Point Increase in Interest Rates
|
$
|
6,504
|
(a)
|
$
|
12,881
|
|
$
|
9,295
|
(a)
|
$
|
28,676
|
|
||||
|
(a)
|
As of December 31, 2023 and 2022, this represents 0.1% and 0.2% of our portfolio of liquid assets, respectively.
|
151
Blackstone has U.S. dollar and non-U.S. dollar based interest rate derivatives whose future cash flows and present value may be affected by movement in their respective underlying yield curves. We estimate that as of December 31, 2023 and December 31, 2022, a one percentage point increase parallel shift in global yield curves would result in the following impact on Other Revenue:
|
December 31,
|
||||||||
|
2023
|
2022
|
|||||||
|
(Dollars in Thousands)
|
||||||||
|
Annualized Increase (Decrease) in Other Revenue Due to a One Percentage Point Increase in Interest Rates
|
$
|
1,352
|
|
$
|
(4,373
|
)
|
||
Credit Risk
Certain Blackstone Funds and the Investee Funds are subject to certain inherent risks through their investments.
Our portfolio of liquid assets contains certain credit risks including, but not limited to, exposure to uninsured deposits with financial institutions, unsecured corporate bonds and mortgage-backed securities. These exposures are actively monitored on a continuous basis and positions are reallocated based on changes in risk profile, market or economic conditions.
We estimate that our annualized investment income would decrease, if credit spreads were to increase by one percentage point, as follows:
|
December 31,
|
||||||||
|
2023
|
2022
|
|||||||
|
(Dollars in Thousands)
|
||||||||
|
Decrease in Annualized Investment Income Due to a One Percentage Point Increase in Credit
Spreads (a) |
$
|
5,343
|
|
$
|
12,605
|
|
||
|
(a)
|
As of December 31, 2023 and 2022, this represents 0.1% and 0.3% of our portfolio of liquid assets, respectively.
|
Certain of our entities hold derivative instruments that contain an element of risk in the event that the counterparties may be unable to meet the terms of such agreements. We minimize our risk exposure by limiting the counterparties with which we enter into contracts to banks and investment banks that meet established credit and capital guidelines. We do not expect any counterparty to default on its obligations and therefore do not expect to incur any loss due to counterparty default.
152
|
Item 8.
|
Financial Statements and Supplementary Data
|
Index to Consolidated Financial
Statements
|
|
15
4
|
|
||
|
|
15
7
|
|
||
|
|
1
59
|
|
||
|
|
16
0
|
|
||
|
|
16
1
|
|
||
|
|
16
4
|
|
||
|
|
16
6
|
|
15
3
Report of Independent Registered Public Accounting Firm
To the Stockholders and the Board of Directors of Blackstone Inc.:
Opinions on the Financial Statements and Internal Control over Financial Reporting
We have audited the accompanying consolidated statements of financial condition of Blackstone Inc. and subsidiaries (“Blackstone”) as of December 31, 2023 and 2022, the related consolidated statements of operations, comprehensive income, changes in equity, and cash flows for each of the three years in the period ended December 31, 2023, and the related notes (collectively referred to as the “financial statements”). We also have audited Blackstone’s internal control over financial reporting as of December 31, 2023, based on criteria established in
issued by the Committee of Sponsoring Organizations of the Treadway Commission (COSO).
Internal Control — Integrated Framework (2013)
In our opinion, the financial statements referred to above present fairly, in all material respects, the financial position of Blackstone as of December 31, 2023 and 2022, and the results of its operations and its cash flows for each of the three years in the period ended December 31, 2023, in conformity with accounting principles generally accepted in the United States of America. Also, in our opinion, Blackstone maintained, in all material respects, effective internal control over financial reporting as of December 31, 2023, based on criteria established in
issued by COSO.
Internal Control — Integrated Framework (2013)
Basis for Opinions
Blackstone’s management is responsible for these financial statements, for maintaining effective internal control over financial reporting, and for its assessment of the effectiveness of internal control over financial reporting, included in the accompanying management’s report on internal control over financial reporting. Our responsibility is to express an opinion on these financial statements and an opinion on Blackstone’s internal control over financial reporting based on our audits. We are a public accounting firm registered with the Public Company Accounting Oversight Board (United States) (“PCAOB”) and are required to be independent with respect to Blackstone in accordance with the U.S. federal securities laws and the applicable rules and regulations of the Securities and Exchange Commission and the PCAOB.
We conducted our audits in accordance with the standards of the PCAOB. Those standards require that we plan and perform the audits to obtain reasonable assurance about whether the financial statements are free of material misstatement, whether due to error or fraud, and whether effective internal control over financial reporting was maintained in all material respects.
Our audits of the financial statements included performing procedures to assess the risks of material misstatement of the financial statements, whether due to error or fraud, and performing procedures to respond to those risks. Such procedures included examining, on a test basis, evidence regarding the amounts and disclosures in the financial statements. Our audits also included evaluating the accounting principles used and significant estimates made by management, as well as evaluating the overall presentation of the financial statements. Our audit of internal control over financial reporting included obtaining an understanding of internal control over financial reporting, assessing the risk that a material weakness exists, and testing and evaluating the design and operating effectiveness of internal control based on the assessed risk. Our audits also included performing such other procedures as we considered necessary in the circumstances. We believe that our audits provide a reasonable basis for our opinions.
15
4
Definition and Limitations of Internal Control over Financial Reporting
A company’s internal control over financial reporting is a process designed to provide reasonable assurance regarding the reliability of financial reporting and the preparation of financial statements for external purposes in accordance with generally accepted accounting principles. A company’s internal control over financial reporting includes those policies and procedures that (a) pertain to the maintenance of records that, in reasonable detail, accurately and fairly reflect the transactions and dispositions of the assets of the company, (b) provide reasonable assurance that transactions are recorded as necessary to permit preparation of financial statements in accordance with generally accepted accounting principles, and that receipts and expenditures of the company are being made only in accordance with authorizations of management and directors of the company, and (c) provide reasonable assurance regarding prevention or timely detection of unauthorized acquisition, use, or disposition of the company’s assets that could have a material effect on the financial statements.
Because of its inherent limitations, internal control over financial reporting may not prevent or detect misstatements. Also, projections of any evaluation of effectiveness to future periods are subject to the risk that controls may become inadequate because of changes in conditions, or that the degree of compliance with the policies or procedures may deteriorate.
Critical Audit Matter
The critical audit matter communicated below is a matter arising from the current-period audit of the financial statements that was communicated or required to be communicated to the audit committee and that (a) relates to accounts or disclosures that are material to the financial statements and (b) involved our especially challenging, subjective, or complex judgments. The communication of critical audit matters does not alter in any way our opinion on the financial statements, taken as a whole, and we are not, by communicating the critical audit matter below, providing a separate opinion on the critical audit matter or on the accounts or disclosures to which it relates.
Fair Value of Certain Underlying Investments to determine Performance Allocations and Accrued Performance Allocations — Refer to Notes 2 and 4 to the financial statements
Critical Audit Matter Description
Blackstone, as a general partner, is entitled to an allocation of income from certain carry fund and open-ended structures (“Blackstone Funds”) assuming certain investment returns are achieved, referred to as “Performance Allocations”. Performance Allocations in carry fund structures are made based on cumulative fund performance to date, subject to a preferred return to limited partners. Performance Allocations in open-ended structures are based on fund or vehicle performance over a period of time, subject to a high water mark and preferred return to limited partners or investors. The change in the fair value of the underlying investments held by the Blackstone Funds is the significant input into this calculation.
As the fair value of underlying investments varies between reporting periods, adjustments are made to amounts recorded as Accrued Performance Allocations to reflect either (a) positive performance resulting in an increase in the Accrued Performance Allocation or (b) negative performance that would cause the amount due to the general partner to be less than the amount previously recognized as revenue, resulting in a negative adjustment to the Accrued Performance Allocation to the general partner.
We considered the valuation of certain investments without readily determinable fair values used in the calculation of Performance Allocations and Accrued Performance Allocations as a critical audit matter because of the valuation techniques, assumptions, market impacts and the degree of subjectivity of certain unobservable inputs used in the valuation. Auditing the fair value of these investments required a high degree of auditor judgment and increased effort, including the involvement of our internal fair value specialists as needed, who possess significant fair value methodology and modeling expertise.
15
5
How the Critical Audit Matter Was Addressed in the Audit
Our audit procedures related to testing the fair values of certain investments without readily determinable fair values included the following, among others:
|
|
•
|
|
We assessed the design and tested the operating effectiveness of controls, including those related to management’s review of the techniques and assumptions used in the determination of fair value.
|
|
|
•
|
|
We evaluate the appropriateness of management’s assumptions through independent analysis and comparison to external sources.
|
|
|
•
|
|
We utilized more experienced audit team members and, as needed, our internal fair value specialists, to assist in the evaluation of management’s valuation methodologies and assumptions (or “inputs”).
|
|
|
•
|
|
We altered the nature, timing and extent of our procedures to focus our test on evaluating relevant inputs that required a higher degree of management judgment (e.g., cash flow projections, guideline public companies, certain components of the discount rates, yields, capitalization rates and exit multiples used in the calculation of the terminal value). Our procedures included testing the underlying source information of the assumptions, as well as developing a range of independent estimates and comparing those to the inputs used by management.
|
|
|
•
|
|
We evaluated management’s valuation methodologies and modeling techniques for consistency with the expected methodologies of market participants in developing an estimate of fair value.
|
|
|
•
|
|
We evaluated the impact of current market events and conditions, as well as relevant comparable transactions, on the valuation techniques and assumptions used by management (e.g., industry, sector and geographic location performance, cash flow projections, other market fundamentals, and interest rates).
|
|
|
•
|
|
When applicable, we inspected industry reports to evaluate the consistency of current valuations with expected industry performance and inclusion of significant economic or industry events.
|
|
|
•
|
|
We evaluated management’s ability to accurately estimate fair value by comparing previous estimates of fair value to investment transactions with third parties.
|
|
/s/
|
|
New York,
|
|
February 23, 2024
|
We have served as Blackstone’s auditor since 2006.
1
5
6
Blackstone Inc.
Consolidated Statements of Financial Condition
(Dollars in Thousands, Except Share Data)
|
December 31,
2023
|
December 31,
2022
|
|||||||
|
Assets
|
||||||||
|
Cash and Cash Equivalents
|
$
|
|
|
$
|
|
|
||
|
Cash Held by Blackstone Funds and Other
|
|
|
|
|
|
|
||
|
Investments
|
|
|
|
|
|
|
||
|
Accounts Receivable
|
|
|
|
|
|
|
||
|
|
|
|
|
|
|
|
||
|
Intangible Assets, Net
|
|
|
|
|
|
|
||
|
Goodwill
|
|
|
|
|
|
|
||
|
Other Assets
|
|
|
|
|
|
|
||
|
Right-of-Use Assets
|
|
|
|
|
|
|
||
|
Deferred Tax Assets
|
|
|
|
|
|
|
||
|
|
|
|
|
|
|
|||
|
Total Assets
|
$
|
|
|
$
|
|
|
||
|
|
|
|
|
|
|
|||
|
Liabilities and Equity
|
||||||||
|
Loans Payable
|
$
|
|
|
$
|
|
|
||
|
|
|
|
|
|
|
|
||
|
Accrued Compensation and Benefits
|
|
|
|
|
|
|
||
|
Operating Lease Liabilities
|
|
|
|
|
|
|
||
|
Accounts Payable, Accrued Expenses and Other Liabilities
|
|
|
|
|
|
|
||
|
|
|
|
|
|
|
|||
|
Total Liabilities
|
|
|
|
|
|
|
||
|
|
|
|
|
|
|
|||
|
Commitments and Contingencies
|
|
|
||||||
|
Redeemable Non-Controlling Interests in Consolidated Entities
|
|
|
|
|
|
|
||
|
|
|
|
|
|
|
|||
|
Equity
|
||||||||
|
Stockholders’ Equity of Blackstone Inc.
|
||||||||
|
Common Stock, $
|
|
|
|
|
|
|
||
|
Series I Preferred Stock, $
|
|
|
|
|
|
|
||
|
Series II Preferred Stock, $
|
|
|
|
|
|
|
||
|
Additional Paid-in-Capital
|
|
|
|
|
|
|
||
|
Retained Earnings
|
|
|
|
|
|
|
||
|
Accumulated Other Comprehensive Loss
|
|
(
|
)
|
|
(
|
)
|
||
|
|
|
|
|
|
|
|||
|
Total Stockholders’ Equity of Blackstone Inc.
|
|
|
|
|
|
|
||
|
Non-Controlling Interests in Consolidated Entities
|
|
|
|
|
|
|
||
|
Non-Controlling Interests in Blackstone Holdings
|
|
|
|
|
|
|
||
|
|
|
|
|
|
|
|||
|
Total Equity
|
|
|
|
|
|
|
||
|
|
|
|
|
|
|
|||
|
Total Liabilities and Equity
|
$
|
|
|
$
|
|
|
||
|
|
|
|
|
|
|
|||
continued…
See notes to consolidated financial statements.
15
7
Blackstone Inc.
Consolidated Statements of Financial Condition
(Dollars in Thousands)
The following presents the asset and liability portion of the consolidated balances presented in the Consolidated Statements of Financial Condition attributable to consolidated Blackstone Funds which are variable interest entities. The following assets may only be used to settle obligations of these consolidated Blackstone Funds and these liabilities are only the obligations of these consolidated Blackstone Funds and they do not have recourse to the general credit of Blackstone.
|
December 31,
2023
|
December 31,
2022
|
|||||||
|
Assets
|
||||||||
|
Cash Held by Blackstone Funds and Other
|
$
|
|
|
$
|
|
|
||
|
Investments
|
|
|
|
|
|
|
||
|
Accounts Receivable
|
|
|
|
|
|
|
||
|
Due from Affiliates
|
|
|
|
|
|
|
||
|
Other Assets
|
|
|
|
|
|
|
||
|
|
|
|
|
|
|
|||
|
Total Assets
|
$
|
|
|
$
|
|
|
||
|
|
|
|
|
|
|
|||
|
Liabilities
|
||||||||
|
Loans Payable
|
$
|
|
|
$
|
|
|
||
|
Due to Affiliates
|
|
|
|
|
|
|
||
|
Accounts Payable, Accrued Expenses and Other Liabilities
|
|
|
|
|
|
|
||
|
|
|
|
|
|
|
|||
|
Total Liabilities
|
$
|
|
|
$
|
|
|
||
|
|
|
|
|
|
|
|||
See notes to consolidated financial statements.
1
5
8
Blackstone Inc.
Consolidated Statements of Operations
(Dollars in Thousands, Except Share and Per Share Data)
|
Year Ended December 31,
|
||||||||||||
|
2023
|
2022
|
2021
|
||||||||||
|
Revenues
|
||||||||||||
|
Management and Advisory Fees, Net
|
$
|
|
|
$
|
|
|
$
|
|
|
|||
|
|
|
|
|
|
|
|
|
|
||||
|
Incentive Fees
|
|
|
|
|
|
|
|
|
|
|||
|
|
|
|
|
|
|
|
|
|
||||
|
Investment Income (Loss)
|
||||||||||||
|
Performance Allocations
|
||||||||||||
|
Realized
|
|
|
|
|
|
|
|
|
|
|||
|
Unrealized
|
|
(
|
)
|
|
(
|
)
|
|
|
|
|||
|
Principal Investments
|
||||||||||||
|
Realized
|
|
|
|
|
|
|
|
|
|
|||
|
Unrealized
|
|
(
|
)
|
|
(
|
)
|
|
|
|
|||
|
|
|
|
|
|
|
|
|
|
||||
|
Total Investment Income
|
|
|
|
|
|
|
|
|
|
|||
|
|
|
|
|
|
|
|
|
|
||||
|
Interest and Dividend Revenue
|
|
|
|
|
|
|
|
|
|
|||
|
Other
|
|
(
|
)
|
|
|
|
|
|
|
|||
|
|
|
|
|
|
|
|
|
|
||||
|
Total Revenues
|
|
|
|
|
|
|
|
|
|
|||
|
|
|
|
|
|
|
|
|
|
||||
|
Expenses
|
||||||||||||
|
Compensation and Benefits
|
||||||||||||
|
Compensation
|
|
|
|
|
|
|
|
|
|
|||
|
Incentive Fee Compensation
|
|
|
|
|
|
|
|
|
|
|||
|
Performance Allocations Compensation
|
||||||||||||
|
Realized
|
|
|
|
|
|
|
|
|
|
|||
|
Unrealized
|
|
(
|
)
|
|
(
|
)
|
|
|
|
|||
|
|
|
|
|
|
|
|
|
|
||||
|
Total Compensation and Benefits
|
|
|
|
|
|
|
|
|
|
|||
|
General, Administrative and Other
|
|
|
|
|
|
|
|
|
|
|||
|
Interest Expense
|
|
|
|
|
|
|
|
|
|
|||
|
Fund Expenses
|
|
|
|
|
|
|
|
|
|
|||
|
|
|
|
|
|
|
|
|
|
||||
|
Total Expenses
|
|
|
|
|
|
|
|
|
|
|||
|
|
|
|
|
|
|
|
|
|
||||
|
Other Income (Loss)
|
||||||||||||
|
Change in Tax Receivable Agreement Liability
|
|
(
|
)
|
|
|
|
|
(
|
)
|
|||
|
Net Gains (Losses) from Fund Investment Activities
|
|
(
|
)
|
|
(
|
)
|
|
|
|
|||
|
|
|
|
|
|
|
|
|
|
||||
|
Total Other Income (Loss)
|
|
(
|
)
|
|
(
|
)
|
|
|
|
|||
|
|
|
|
|
|
|
|
|
|
||||
|
Income Before Provision for Taxes
|
|
|
|
|
|
|
|
|
|
|||
|
Provision for Taxes
|
|
|
|
|
|
|
|
|
|
|||
|
|
|
|
|
|
|
|
|
|
||||
|
Net Income
|
|
|
|
|
|
|
|
|
|
|||
|
Net Income (Loss) Attributable to Redeemable Non-Controlling Interests in Consolidated Entities
|
|
(
|
)
|
|
(
|
)
|
|
|
|
|||
|
Net Income Attributable to Non-Controlling Interests in Consolidated Entities
|
|
|
|
|
|
|
|
|
|
|||
|
Net Income Attributable to Non-Controlling Interests in Blackstone Holdings
|
|
|
|
|
|
|
|
|
|
|||
|
|
|
|
|
|
|
|
|
|
||||
|
Net Income Attributable to Blackstone Inc.
|
$
|
|
|
$
|
|
|
$
|
|
|
|||
|
|
|
|
|
|
|
|
|
|
||||
|
Net Income Per Share of Common Stock
|
||||||||||||
|
Basic
|
$
|
|
|
$
|
|
|
$
|
|
|
|||
|
|
|
|
|
|
|
|
|
|
||||
|
Diluted
|
$
|
|
|
$
|
|
|
$
|
|
|
|||
|
|
|
|
|
|
|
|
|
|
||||
|
Weighted-Average Shares of Common Stock Outstanding
|
||||||||||||
|
Basic
|
|
|
|
|
|
|
|
|
|
|||
|
|
|
|
|
|
|
|
|
|
||||
|
Diluted
|
|
|
|
|
|
|
|
|
|
|||
|
|
|
|
|
|
|
|
|
|
||||
See notes to consolidated financial statements.
1
59
Blackstone Inc.
Consolidated Statements of Comprehensive Income
(Dollars in Thousands)
|
Year Ended December 31,
|
||||||||||||
|
2023
|
2022
|
2021
|
||||||||||
|
Net Income
|
$
|
|
|
$
|
|
|
$
|
|
|
|||
|
Other Comprehensive Income (Loss) - Currency Translation Adjustment
|
|
|
|
|
(
|
)
|
|
(
|
)
|
|||
|
|
|
|
|
|
|
|
|
|
||||
|
Comprehensive Income
|
|
|
|
|
|
|
|
|
|
|||
|
|
|
|
|
|
|
|
|
|
||||
|
Less:
|
||||||||||||
|
Comprehensive Income (Loss) Attributable to Redeemable Non-Controlling Interests in Consolidated Entities
|
|
(
|
)
|
|
(
|
)
|
|
|
|
|||
|
Comprehensive Income Attributable to Non-Controlling Interests in Consolidated Entities
|
|
|
|
|
|
|
|
|
|
|||
|
Comprehensive Income Attributable to Non-Controlling Interests in Blackstone Holdings
|
|
|
|
|
|
|
|
|
|
|||
|
|
|
|
|
|
|
|
|
|
||||
|
Comprehensive Income Attributable to Non-Controlling Interests
|
|
|
|
|
|
|
|
|
|
|||
|
|
|
|
|
|
|
|
|
|
||||
|
Comprehensive Income Attributable to Blackstone Inc.
|
$
|
|
|
$
|
|
|
$
|
|
|
|||
|
|
|
|
|
|
|
|
|
|
||||
See notes to consolidated financial statements.
16
0
Blackstone Inc.
Consolidated Statement of Changes in Equity
(Dollars in Thousands, Except Share Data)
|
Shares of
Blackstone
Inc. (a)
|
Blackstone Inc. (a)
|
|||||||||||||||||||||||||||||||||||||||
|
Common
Stock
|
Common
Stock |
Additional
Paid-in-
Capital
|
Retained
Earnings
(Deficit)
|
Accumulated
Other Compre- hensive Income (Loss) |
Total
Stockholders’ Equity |
Non-
Controlling
Interests in Consolidated Entities |
Non-
Controlling
Interests in Blackstone Holdings |
Total
Equity
|
Redeemable
Non- Controlling Interests in Consolidated Entities |
|||||||||||||||||||||||||||||||
|
Balance at December 31, 2020
|
|
|
|
$
|
|
|
$
|
|
|
$
|
|
|
$
|
(
|
)
|
$
|
|
|
$
|
|
|
$
|
|
|
$
|
|
|
$
|
|
|
||||||||||
|
Net Income
|
|
—
|
|
|
—
|
|
|
—
|
|
|
|
|
|
—
|
|
|
|
|
|
|
|
|
|
|
|
|
|
|
|
|
||||||||||
|
Currency Translation Adjustment
|
|
—
|
|
|
—
|
|
|
—
|
|
|
—
|
|
|
(
|
)
|
|
(
|
)
|
|
—
|
|
|
(
|
)
|
|
(
|
)
|
|
—
|
|
||||||||||
|
Capital Contributions
|
|
—
|
|
|
—
|
|
|
—
|
|
|
—
|
|
|
—
|
|
|
—
|
|
|
|
|
|
|
|
|
|
|
|
—
|
|
||||||||||
|
Capital Distributions
|
|
—
|
|
|
—
|
|
|
—
|
|
|
(
|
)
|
|
—
|
|
|
(
|
)
|
|
(
|
)
|
|
(
|
)
|
|
(
|
)
|
|
(
|
)
|
||||||||||
|
Transfer of Non-Controlling Interests in Consolidated Entities
|
|
—
|
|
|
—
|
|
|
—
|
|
|
—
|
|
|
—
|
|
|
—
|
|
|
(
|
)
|
|
—
|
|
|
(
|
)
|
|
—
|
|
||||||||||
|
Deferred Tax Effects Resulting from Acquisition of Ownership Interests from
Non-Controlling
Interest Holders
|
|
—
|
|
|
—
|
|
|
|
|
|
—
|
|
|
—
|
|
|
|
|
|
—
|
|
|
—
|
|
|
|
|
|
—
|
|
||||||||||
|
Equity-Based Compensation
|
|
—
|
|
|
—
|
|
|
|
|
|
—
|
|
|
—
|
|
|
|
|
|
—
|
|
|
|
|
|
|
|
|
—
|
|
||||||||||
|
Net Delivery of Vested Blackstone Holdings Partnership Units and Shares of Common Stock
|
|
|
|
|
—
|
|
|
(
|
)
|
|
—
|
|
|
—
|
|
|
(
|
)
|
|
—
|
|
|
|
|
|
(
|
)
|
|
—
|
|
||||||||||
|
Repurchase of Shares of Common Stock and Blackstone Holdings Partnership Units
|
|
(
|
)
|
|
—
|
|
|
(
|
)
|
|
—
|
|
|
—
|
|
|
(
|
)
|
|
—
|
|
|
—
|
|
|
(
|
)
|
|
—
|
|
||||||||||
|
Change in Blackstone Inc.’s Ownership Interest
|
|
—
|
|
|
—
|
|
|
|
|
|
—
|
|
|
—
|
|
|
|
|
|
—
|
|
|
(
|
)
|
|
—
|
|
|
—
|
|
||||||||||
|
Conversion of Blackstone Holdings Partnership Units to Shares of Common Stock
|
|
|
|
|
—
|
|
|
|
|
|
—
|
|
|
—
|
|
|
|
|
|
—
|
|
|
(
|
)
|
|
—
|
|
|
—
|
|
||||||||||
|
|
|
|
|
|
|
|
|
|
|
|
|
|
|
|
|
|
|
|
|
|
|
|
|
|
|
|
|
|
|
|||||||||||
|
Balance at December 31, 2021
|
|
|
|
$
|
|
|
$
|
|
|
$
|
|
|
$
|
(
|
)
|
$
|
|
|
$
|
|
|
$
|
|
|
$
|
|
|
$
|
|
|
||||||||||
|
|
|
|
|
|
|
|
|
|
|
|
|
|
|
|
|
|
|
|
|
|
|
|
|
|
|
|
|
|
|
|||||||||||
|
(a)
|
During the period presented, Blackstone also had
|
continued…
See notes to consolidated financial statements.
16
1
Blackstone Inc.
Consolidated Statement of Changes in Equity
(Dollars in Thousands, Except Share Data)
|
Shares of
Blackstone
Inc. (a)
|
Blackstone Inc. (a)
|
|||||||||||||||||||||||||||||||||||||||
|
Common
Stock
|
Common
Stock |
Additional
Paid-in-
Capital
|
Retained
Earnings (Deficit) |
Accumulated
Other Compre- hensive Income (Loss) |
Total
Stockholders’ Equity |
Non-
Controlling
Interests in Consolidated Entities |
Non-
Controlling
Interests in Blackstone Holdings |
Total
Equity
|
Redeemable
Non- Controlling Interests in Consolidated Entities |
|||||||||||||||||||||||||||||||
|
Balance at December 31, 2021
|
|
|
|
$
|
|
|
$
|
|
|
$
|
|
|
$
|
(
|
)
|
$
|
|
|
$
|
|
|
$
|
|
|
$
|
|
|
$
|
|
|
||||||||||
|
Transfer In Due to Consolidation of Fund Entities
|
|
—
|
|
|
—
|
|
|
—
|
|
|
—
|
|
|
—
|
|
|
—
|
|
|
—
|
|
|
—
|
|
|
—
|
|
|
|
|
||||||||||
|
Net Income (Loss)
|
|
—
|
|
|
—
|
|
|
—
|
|
|
|
|
|
—
|
|
|
|
|
|
|
|
|
|
|
|
|
|
|
(
|
)
|
||||||||||
|
Currency Translation Adjustment
|
|
—
|
|
|
—
|
|
|
—
|
|
|
—
|
|
|
(
|
)
|
|
(
|
)
|
|
—
|
|
|
(
|
)
|
|
(
|
)
|
|
(
|
)
|
||||||||||
|
Capital Contributions
|
|
—
|
|
|
—
|
|
|
—
|
|
|
—
|
|
|
—
|
|
|
—
|
|
|
|
|
|
|
|
|
|
|
|
|
|
||||||||||
|
Capital Distributions
|
|
—
|
|
|
—
|
|
|
—
|
|
|
(
|
)
|
|
—
|
|
|
(
|
)
|
|
(
|
)
|
|
(
|
)
|
|
(
|
)
|
|
(
|
)
|
||||||||||
|
Transfer of Non-Controlling Interests in Consolidated Entities
|
|
—
|
|
|
—
|
|
|
—
|
|
|
—
|
|
|
—
|
|
|
—
|
|
|
(
|
)
|
|
—
|
|
|
(
|
)
|
|
|
|
||||||||||
|
Deferred Tax Effects Resulting from Acquisition of Ownership Interests from Non-Controlling Interest Holders
|
|
—
|
|
|
—
|
|
|
|
|
|
—
|
|
|
—
|
|
|
|
|
|
—
|
|
|
—
|
|
|
|
|
|
—
|
|
||||||||||
|
Equity-Based Compensation
|
|
—
|
|
|
—
|
|
|
|
|
|
—
|
|
|
—
|
|
|
|
|
|
—
|
|
|
|
|
|
|
|
|
—
|
|
||||||||||
|
Net Delivery of Vested Blackstone Holdings Partnership Units and Shares of Common Stock
|
|
|
|
|
—
|
|
|
(
|
)
|
|
—
|
|
|
—
|
|
|
(
|
)
|
|
—
|
|
|
|
|
|
(
|
)
|
|
—
|
|
||||||||||
|
Repurchase of Shares of Common Stock and Blackstone Holdings Partnership Units
|
|
(
|
)
|
|
—
|
|
|
(
|
)
|
|
—
|
|
|
—
|
|
|
(
|
)
|
|
—
|
|
|
—
|
|
|
(
|
)
|
|
—
|
|
||||||||||
|
Change in Blackstone Inc.’s Ownership Interest
|
|
—
|
|
|
—
|
|
|
|
|
|
—
|
|
|
—
|
|
|
|
|
|
—
|
|
|
(
|
)
|
|
—
|
|
|
—
|
|
||||||||||
|
Conversion of Blackstone Holdings Partnership Units to Shares of Common Stock
|
|
|
|
|
—
|
|
|
|
|
|
—
|
|
|
—
|
|
|
|
|
|
—
|
|
|
(
|
)
|
|
—
|
|
|
—
|
|
||||||||||
|
|
|
|
|
|
|
|
|
|
|
|
|
|
|
|
|
|
|
|
|
|
|
|
|
|
|
|
|
|
|
|||||||||||
|
Balance at December 31, 2022
|
|
|
|
$
|
|
|
$
|
|
|
$
|
|
|
$
|
(
|
)
|
$
|
|
|
$
|
|
|
$
|
|
|
$
|
|
|
$
|
|
|
||||||||||
|
|
|
|
|
|
|
|
|
|
|
|
|
|
|
|
|
|
|
|
|
|
|
|
|
|
|
|
|
|
|
|||||||||||
|
(a)
|
During the period presented, Blackstone also had
|
continued…
See notes to consolidated financial statements.
16
2
Blackstone Inc.
Consolidated Statement of Changes in Equity
(Dollars in Thousands, Except Share Data)
|
Shares of
Blackstone Inc. (a) |
Blackstone Inc. (a)
|
|||||||||||||||||||||||||||||||||||||||
|
Common
Stock |
Common
Stock |
Additional
Paid-in- Capital |
Retained
Earnings (Deficit) |
Accumulated
Other Compre- hensive Income (Loss) |
Total
Stockholders' Equity |
Non-
Controlling Interests in Consolidated Entities |
Non-
Controlling Interests in Blackstone Holdings |
Total
Equity |
Redeemable
Non- Controlling Interests in Consolidated Entities |
|||||||||||||||||||||||||||||||
|
Balance at December 31, 2022
|
|
|
|
$
|
|
|
$
|
|
|
$
|
|
|
$
|
(
|
)
|
$
|
|
|
$
|
|
|
$
|
|
|
$
|
|
|
$
|
|
|
||||||||||
|
Transfer Out Due to Deconsolidation of Fund Entities
|
|
—
|
|
|
—
|
|
|
—
|
|
|
—
|
|
|
—
|
|
|
—
|
|
|
—
|
|
|
—
|
|
|
—
|
|
|
(
|
)
|
||||||||||
|
Net Income (Loss)
|
|
—
|
|
|
—
|
|
|
—
|
|
|
|
|
|
—
|
|
|
|
|
|
|
|
|
|
|
|
|
|
|
(
|
)
|
||||||||||
|
Currency Translation Adjustment
|
|
—
|
|
|
—
|
|
|
—
|
|
|
—
|
|
|
|
|
|
|
|
|
—
|
|
|
|
|
|
|
|
|
|
|
||||||||||
|
Capital Contributions
|
|
—
|
|
|
—
|
|
|
—
|
|
|
—
|
|
|
—
|
|
|
—
|
|
|
|
|
|
|
|
|
|
|
|
|
|
||||||||||
|
Capital Distributions
|
|
—
|
|
|
—
|
|
|
—
|
|
|
(
|
)
|
|
—
|
|
|
(
|
)
|
|
(
|
)
|
|
(
|
)
|
|
(
|
)
|
|
(
|
)
|
||||||||||
|
Transfer and Repurchase of Non-Controlling Interests in Consolidated Entities
|
|
—
|
|
|
—
|
|
|
|
|
|
—
|
|
|
—
|
|
|
|
|
|
(
|
)
|
|
—
|
|
|
(
|
)
|
|
—
|
|
||||||||||
|
Deferred Tax Effects Resulting from Acquisition of Ownership Interests from
Non-Controlling
Interest Holders
|
|
—
|
|
|
—
|
|
|
|
|
|
—
|
|
|
—
|
|
|
|
|
|
—
|
|
|
—
|
|
|
|
|
|
—
|
|
||||||||||
|
Equity-Based Compensation
|
|
—
|
|
|
—
|
|
|
|
|
|
—
|
|
|
—
|
|
|
|
|
|
—
|
|
|
|
|
|
|
|
|
—
|
|
||||||||||
|
Net Delivery of Vested Blackstone Holdings Partnership Units and Shares of Common Stock
|
|
|
|
|
—
|
|
|
(
|
)
|
|
—
|
|
|
—
|
|
|
(
|
)
|
|
—
|
|
|
|
|
|
(
|
)
|
|
—
|
|
||||||||||
|
Repurchase of Shares of Common Stock and Blackstone Holdings Partnership Units
|
|
(
|
)
|
|
—
|
|
|
(
|
)
|
|
—
|
|
|
—
|
|
|
(
|
)
|
|
—
|
|
|
—
|
|
|
(
|
)
|
|
—
|
|
||||||||||
|
Change in Blackstone Inc.’s Ownership Interest
|
|
—
|
|
|
—
|
|
|
(
|
)
|
|
—
|
|
|
—
|
|
|
(
|
)
|
|
—
|
|
|
|
|
|
—
|
|
|
—
|
|
||||||||||
|
Conversion of Blackstone Holdings Partnership Units to Shares of Common Stock
|
|
|
|
|
—
|
|
|
|
|
|
—
|
|
|
—
|
|
|
|
|
|
—
|
|
|
(
|
)
|
|
—
|
|
|
—
|
|
||||||||||
|
|
|
|
|
|
|
|
|
|
|
|
|
|
|
|
|
|
|
|
|
|
|
|
|
|
|
|
|
|
|
|||||||||||
|
Balance at December 31, 2023
|
|
|
|
$
|
|
|
$
|
|
|
$
|
|
|
$
|
(
|
)
|
$
|
|
|
$
|
|
|
$
|
|
|
$
|
|
|
$
|
|
|
||||||||||
|
|
|
|
|
|
|
|
|
|
|
|
|
|
|
|
|
|
|
|
|
|
|
|
|
|
|
|
|
|
|
|||||||||||
|
(a)
|
During the period presented, Blackstone also had
|
See notes to consolidated financial statements.
16
3
Blackstone Inc.
Consolidated Statements of Cash Flows
(Dollars in Thousands)
|
Year Ended December 31,
|
||||||||||||
|
2023
|
2022
|
2021
|
||||||||||
|
Operating Activities
|
||||||||||||
|
Net Income
|
$
|
|
|
$
|
|
|
$
|
|
|
|||
|
Adjustments to Reconcile Net Income to Net Cash Provided by Operating Activities
|
||||||||||||
|
Blackstone Funds Related
|
||||||||||||
|
Net Realized Gains on Investments
|
|
(
|
)
|
|
(
|
)
|
|
(
|
)
|
|||
|
Changes in Unrealized (Gains) Losses on Investments
|
|
|
|
|
|
|
|
(
|
)
|
|||
|
Non-Cash Performance Allocations
|
|
|
|
|
|
|
|
(
|
)
|
|||
|
Non-Cash Performance Allocations and Incentive Fee Compensation
|
|
|
|
|
|
|
|
|
|
|||
|
Equity-Based Compensation Expense
|
|
|
|
|
|
|
|
|
|
|||
|
Amortization of Intangibles
|
|
|
|
|
|
|
|
|
|
|||
|
Other Non-Cash Amounts Included in Net Income
|
|
(
|
)
|
|
(
|
)
|
|
(
|
)
|
|||
|
Cash Flows Due to Changes in Operating Assets and Liabilities
|
||||||||||||
|
Cash Acquired with Consolidation of Fund Entity
|
|
|
|
|
|
|
|
|
|
|||
|
Cash Relinquished with Deconsolidation of Fund Entities
|
|
(
|
)
|
|
|
|
|
|
|
|||
|
Accounts Receivable
|
|
|
|
|
|
|
|
|
|
|||
|
Due from Affiliates
|
|
|
|
|
|
|
|
(
|
)
|
|||
|
Other Assets
|
|
(
|
)
|
|
(
|
)
|
|
(
|
)
|
|||
|
Accrued Compensation and Benefits
|
|
(
|
)
|
|
(
|
)
|
|
(
|
)
|
|||
|
Accounts Payable, Accrued Expenses and Other Liabilities
|
|
(
|
)
|
|
|
|
|
|
|
|||
|
Due to Affiliates
|
|
|
|
|
|
|
|
|
|
|||
|
Investments Purchased
|
|
(
|
)
|
|
(
|
)
|
|
(
|
)
|
|||
|
Cash Proceeds from Sale of Investments
|
|
|
|
|
|
|
|
|
|
|||
|
|
|
|
|
|
|
|
|
|
||||
|
Net Cash Provided by Operating Activities
|
|
|
|
|
|
|
|
|
|
|||
|
|
|
|
|
|
|
|
|
|
||||
|
Investing Activities
|
||||||||||||
|
Purchase of Furniture, Equipment and Leasehold Improvements
|
|
(
|
)
|
|
(
|
)
|
|
(
|
)
|
|||
|
Net Cash Paid for Acquisitions, Net of Cash Acquired
|
|
(
|
)
|
|
|
|
|
|
|
|||
|
|
|
|
|
|
|
|
|
|
||||
|
Net Cash Used in Investing Activities
|
|
(
|
)
|
|
(
|
)
|
|
(
|
)
|
|||
|
|
|
|
|
|
|
|
|
|
||||
|
Financing Activities
|
||||||||||||
|
Distributions to Non-Controlling Interest Holders in Consolidated Entities
|
|
(
|
)
|
|
(
|
)
|
|
(
|
)
|
|||
|
Contributions from Non-Controlling Interest Holders in Consolidated Entities
|
|
|
|
|
|
|
|
|
|
|||
|
Payments Under Tax Receivable Agreement
|
|
(
|
)
|
|
(
|
)
|
|
(
|
)
|
|||
|
Net Settlement of Vested Common Stock and Repurchase of Common Stock and Blackstone Holdings Partnership Units
|
|
(
|
)
|
|
(
|
)
|
|
(
|
)
|
|||
continued…
See notes to consolidated financial statements.
16
4
Blackstone Inc.
Consolidated Statements of Cash Flows
(Dollars in Thousands)
|
Year Ended December 31,
|
||||||||||||
|
2023
|
2022
|
2021
|
||||||||||
|
Financing Activities (Continued)
|
||||||||||||
|
Proceeds from Loans Payable
|
$
|
|
|
$
|
|
|
$
|
|
|
|||
|
Repayment and Repurchase of Loans Payable
|
|
(
|
)
|
|
(
|
)
|
|
|
|
|||
|
Dividends/Distributions to Stockholders and Unitholders
|
|
(
|
)
|
|
(
|
)
|
|
(
|
)
|
|||
|
|
|
|
|
|
|
|
|
|
||||
|
Net Cash Used in Financing Activities
|
|
(
|
)
|
|
(
|
)
|
|
(
|
)
|
|||
|
|
|
|
|
|
|
|
|
|
||||
|
Effect of Exchange Rate Changes on Cash and Cash Equivalents and Cash Held by Blackstone Funds and Other
|
|
|
|
|
(
|
)
|
|
(
|
)
|
|||
|
|
|
|
|
|
|
|
|
|
||||
|
Cash and Cash Equivalents and Cash Held by Blackstone Funds and Other
|
||||||||||||
|
Net Increase (Decrease)
|
|
(
|
)
|
|
|
|
|
|
|
|||
|
Beginning of Period
|
|
|
|
|
|
|
|
|
|
|||
|
|
|
|
|
|
|
|
|
|
||||
|
End of Period
|
$
|
|
|
$
|
|
|
$
|
|
|
|||
|
|
|
|
|
|
|
|
|
|
||||
|
Supplemental Disclosure of Cash Flows Information
|
||||||||||||
|
Payments for Interest
|
$
|
|
|
$
|
|
|
$
|
|
|
|||
|
|
|
|
|
|
|
|
|
|
||||
|
Payments for Income Taxes
|
$
|
|
|
$
|
|
|
$
|
|
|
|||
|
|
|
|
|
|
|
|
|
|
||||
|
Supplemental Disclosure of Non-Cash Investing and Financing Activities
|
||||||||||||
|
Non-Cash Contributions from Non-Controlling Interest Holders
|
$
|
|
|
$
|
|
|
$
|
|
|
|||
|
|
|
|
|
|
|
|
|
|
||||
|
Non-Cash Distributions to Non-Controlling Interest Holders
|
$
|
(
|
)
|
$
|
|
|
$
|
|
|
|||
|
|
|
|
|
|
|
|
|
|
||||
|
Notes Issuance Costs
|
$
|
|
|
$
|
|
|
$
|
|
|
|||
|
|
|
|
|
|
|
|
|
|
||||
|
Transfer of Interests to Non-Controlling Interest Holders
|
$
|
(
|
)
|
$
|
(
|
)
|
$
|
(
|
)
|
|||
|
|
|
|
|
|
|
|
|
|
||||
|
Change in Blackstone Inc.’s Ownership Interest
|
$
|
(
|
)
|
$
|
|
|
$
|
|
|
|||
|
|
|
|
|
|
|
|
|
|
||||
|
Net Settlement of Vested Common Stock
|
$
|
|
|
$
|
|
|
$
|
|
|
|||
|
|
|
|
|
|
|
|
|
|
||||
|
Conversion of Blackstone Holdings Units to Common Stock
|
$
|
|
|
$
|
|
|
$
|
|
|
|||
|
|
|
|
|
|
|
|
|
|
||||
|
Acquisition of Ownership Interests from Non-Controlling Interest Holders
|
||||||||||||
|
Deferred Tax Asset
|
$
|
(
|
)
|
$
|
(
|
)
|
$
|
(
|
)
|
|||
|
|
|
|
|
|
|
|
|
|
||||
|
Due to Affiliates
|
$
|
|
|
$
|
|
|
$
|
|
|
|||
|
|
|
|
|
|
|
|
|
|
||||
|
Equity
|
$
|
|
|
$
|
|
|
$
|
|
|
|||
|
|
|
|
|
|
|
|
|
|
||||
The following table provides a reconciliation of Cash and Cash Equivalents and Cash Held by Blackstone Funds and Other reported within the Consolidated Statements of Financial Condition:
|
December 31,
2023 |
December 31,
2022 |
|||||||
|
Cash and Cash Equivalents
|
$
|
|
|
$
|
|
|
||
|
Cash Held by Blackstone Funds and Other
|
|
|
|
|
|
|
||
|
|
|
|
|
|
|
|||
|
$
|
|
|
$
|
|
|
|||
|
|
|
|
|
|
|
|||
See notes to consolidated financial statements.
16
5
Blackstone Inc.
Notes to Consolidated Financial Statements
(All Dollars are in Thousands, Except Share and Per Share Data, Except Where Noted)
1. Organization
Blackstone Inc., together with its consolidated subsidiaries (“Blackstone” or the “Company”), is the world’s largest alternative asset manager. Blackstone’s asset management business includes global investment strategies focused on real estate, private equity, infrastructure, life sciences, growth equity, credit, real assets, secondaries and hedge funds. “Blackstone Funds” refers to the funds and other vehicles that are managed by Blackstone. Blackstone’s business is organized into
Blackstone Inc. was initially formed as The Blackstone Group L.P., a Delaware limited partnership, on March 12, 2007. Prior to its conversion on July 1, 2019 to a Delaware corporation, Blackstone Inc. was managed and operated by Blackstone Group Management L.L.C., which is wholly owned by Blackstone’s senior managing directors and controlled by
The activities of Blackstone are conducted through its holding partnerships: Blackstone Holdings I L.P., Blackstone Holdings AI L.P., Blackstone Holdings II L.P., Blackstone Holdings III L.P. and Blackstone Holdings IV L.P. (collectively, “Blackstone Holdings,” “Blackstone Holdings Partnerships” or the “Holding Partnerships”). Blackstone, through its wholly owned subsidiaries, is the sole general partner of each of the Holding Partnerships. Generally, holders of the limited partner interests in the Holding Partnerships may, four times each year, exchange their limited partnership interests (“Partnership Units”) for Blackstone common stock, on a one-to-one basis, exchanging one Partnership Unit from each of the Holding Partnerships for one share of Blackstone common stock.
2. Summary of Significant Accounting Policies
Basis of Presentation
The accompanying consolidated financial statements of Blackstone have been prepared in accordance with accounting principles generally accepted in the United States of America (“GAAP”).
The consolidated financial statements include the accounts of Blackstone, its wholly owned or majority-owned subsidiaries, the consolidated entities which are considered to be variable interest entities and for which Blackstone is considered the primary beneficiary, and certain partnerships or similar entities which are not considered variable interest entities but in which the general partner is determined to have control.
All intercompany balances and transactions have been eliminated in consolidation.
Use of Estimates
The preparation of the consolidated financial statements in accordance with GAAP requires management to make estimates that affect the amounts reported in the consolidated financial statements and accompanying notes. Management believes that estimates utilized in the preparation of the consolidated financial statements are prudent and reasonable. Such estimates include those used in the valuation of investments and financial instruments, the measurement of deferred tax balances (including valuation allowances) and the accounting for Goodwill and equity-based compensation. Actual results could differ from those estimates and such differences could be material.
Consolidation
Blackstone consolidates all entities that it controls through a majority voting interest or otherwise, including those Blackstone Funds in which the general partner has a controlling financial interest. Blackstone has a controlling financial interest in Blackstone Holdings because the limited partners do not have the right to dissolve the partnerships or have substantive kick-out rights or participating rights that would overcome the control held by Blackstone. Accordingly, Blackstone consolidates Blackstone Holdings and records non-controlling interests to reflect the economic interests of the limited partners of Blackstone Holdings.
6
6
B
lackstone Inc.
Notes to Consolidated Financial Statements—Continued
(All Dollars are in Thousands, Except Share and Per Share Data, Except Where Noted)
In addition, Blackstone consolidates all variable interest entities (“VIE”) for which it is the primary beneficiary. An enterprise is determined to be the primary beneficiary if it holds a controlling financial interest. A controlling financial interest is defined as (a) the power to direct the activities of a VIE that most significantly impact the entity’s economic performance and (b) the obligation to absorb losses of the entity or the right to receive benefits from the entity that could potentially be significant to the VIE. The consolidation guidance requires an analysis to determine (a) whether an entity in which Blackstone holds a variable interest is a VIE and (b) whether Blackstone’s involvement, through holding interests directly or indirectly in the entity or contractually through other variable interests, would give it a controlling financial interest. Performance of that analysis requires the exercise of judgment.
Blackstone determines whether it is the primary beneficiary of a VIE at the time it becomes involved with a variable interest entity and continuously reconsiders that conclusion. In determining whether Blackstone is the primary beneficiary, Blackstone evaluates its control rights as well as economic interests in the entity held either directly or indirectly by Blackstone. The consolidation analysis can generally be performed qualitatively; however, if it is not readily apparent that Blackstone is not the primary beneficiary, a quantitative analysis may also be performed. Investments and redemptions (either by Blackstone, affiliates of Blackstone or third parties) or amendments to the governing documents of the respective Blackstone Funds could affect an entity’s status as a VIE or the determination of the primary beneficiary. At each reporting date, Blackstone assesses whether it is the primary beneficiary and will consolidate or deconsolidate accordingly.
Assets of consolidated VIEs that can only be used to settle obligations of the consolidated VIE and liabilities of a consolidated VIE for which creditors (or beneficial interest holders) do not have recourse to the general credit of Blackstone are presented in a separate section in the Consolidated Statements of Financial Condition.
Blackstone’s other disclosures regarding VIEs are discussed in Note 9. “Variable Interest Entities.”
Revenue Recognition
Revenues primarily consist of management and advisory fees, incentive fees, investment income, interest and dividend revenue and other.
Management and advisory fees and incentive fees are accounted for as contracts with customers. Under the guidance for contracts with customers, an entity is required to (a) identify the contract(s) with a customer, (b) identify the performance obligations in the contract, (c) determine the transaction price, (d) allocate the transaction price to the performance obligations in the contract, and (e) recognize revenue when (or as) the entity satisfies a performance obligation. In determining the transaction price, an entity may include variable consideration only to the extent that it is probable that a significant reversal in the amount of cumulative revenue recognized would not occur when the uncertainty associated with the variable consideration is resolved. See Note 20. “Segment Reporting” for a disaggregated presentation of revenues from contracts with customers.
Management and Advisory Fees, Net
Blackstone earns base management fees from its customers at a fixed percentage of a calculation base which is typically assets under management, net asset value, gross asset value, total assets, committed capital or invested capital. Blackstone identifies its customers on a fund by fund basis in accordance with the terms and
6
7
Blackstone Inc.
Notes to Consolidated Financial Statements—Continued
(All Dollars are in Thousands, Except Share and Per Share Data, Except Where Noted)
circumstances of the individual fund. Generally the customer is identified as the investors in its managed funds and investment vehicles, but for certain widely held funds or vehicles, the fund or vehicle itself may be identified as the customer. These customer contracts require Blackstone to provide investment management services, which represents a performance obligation that Blackstone satisfies over time. Management fees are a form of variable consideration because the fees Blackstone is entitled to vary based on fluctuations in the basis for the management fee. The amount recorded as revenue is generally determined at the end of the period because these management fees are payable on a regular basis (typically quarterly) and are not subject to clawback once paid.
Transaction, advisory and other fees are principally fees charged to the investors of funds indirectly through the managed funds and portfolio companies. The investment advisory agreements generally require that the investment adviser reduce the amount of management fees payable by the investors to Blackstone (“management fee reductions”) by an amount equal to a portion of the transaction and other fees paid to Blackstone by the portfolio companies. The amount of the reduction varies by fund, the type of fee paid by the portfolio company and the previously incurred expenses of the fund. These fees and associated management fee reductions are a component of the transaction price for Blackstone’s performance obligation to provide investment management services to the investors of funds and are recognized as changes to the transaction price in the period in which they are charged and the services are performed.
Management fee offsets are reductions to management fees payable by the investors of the Blackstone Funds, which are based on the amount such investors reimburse the Blackstone Funds or Blackstone primarily for placement fees. Providing investment management services requires Blackstone to arrange for services on behalf of its customers. In those situations where Blackstone is acting as an agent on behalf of the investors of funds, it presents the cost of services as net against management fee revenue. In all other situations, Blackstone is primarily responsible for fulfilling the services and is therefore acting as a principal for those arrangements. As a result, the cost of those services is presented as Compensation or General, Administrative and Other expense, as appropriate, with any reimbursement from the investors of the funds recorded as Management and Advisory Fees, Net. In cases where the investors of the funds are determined to be the customer in an arrangement, placement fees may be capitalized as a cost to acquire a customer contract. Capitalized placement fees are amortized over the life of the customer contract, are recorded within Other Assets in the Consolidated Statements of Financial Condition and amortization is recorded within General, Administrative and Other within the Consolidated Statements of Operations.
Accrued but unpaid Management and Advisory Fees, net of management fee reductions and management fee offsets, as of the reporting date are included in Due from Affiliates in the Consolidated Statements of Financial Condition.
Incentive Fees —
Investment Income (Loss)
6
8
Blackstone Inc.
Notes to Consolidated Financial Statements—Continued
(All Dollars are in Thousands, Except Share and Per Share Data, Except Where Noted)
In carry fund structures and certain open-ended structures, Blackstone, through its subsidiaries, invests alongside its limited partners in a partnership and is entitled to its pro-rata share of the results of the fund vehicle (a “pro-rata allocation”). In addition to a pro-rata allocation, and assuming certain investment returns are achieved, Blackstone is entitled to a disproportionate allocation of the income otherwise allocable to the limited partners, commonly referred to as carried interest (“Performance Allocations”).
Performance Allocations in carry fund structures are made to the general partner based on cumulative fund performance to date, subject to a preferred return to limited partners. Performance Allocations in open-ended structures are based on vehicle performance over a period of time, subject to a high water mark and preferred return to investors. At the end of each reporting period, Blackstone calculates the balance of accrued Performance Allocations (“Accrued Performance Allocations”) that would be due to Blackstone for each fund, pursuant to the fund agreements, as if the fair value of the underlying investments were realized as of such date, irrespective of whether such amounts have been realized. As the fair value of underlying investments varies between reporting periods, it is necessary to make adjustments to amounts recorded as Accrued Performance Allocations to reflect either (a) positive performance resulting in an increase in the Accrued Performance Allocation to the general partner or (b) negative performance that would cause the amount due to Blackstone to be less than the amount previously recognized as revenue, resulting in a negative adjustment to the Accrued Performance Allocation to the general partner. In each scenario, it is necessary to calculate the Accrued Performance Allocation on cumulative results compared to the Accrued Performance Allocation recorded to date and make the required positive or negative adjustments. Blackstone ceases to record negative Performance Allocations once previously Accrued Performance Allocations for such fund have been fully reversed. Blackstone is not obligated to pay guaranteed returns or hurdles, and therefore, cannot have negative Performance Allocations over the life of a fund. Accrued Performance Allocations as of the reporting date are reflected in Investments in the Consolidated Statements of Financial Condition.
Performance Allocations in carry fund structures are realized when an underlying investment is profitably disposed of and the fund’s cumulative returns are in excess of the preferred return or, in limited instances, after certain thresholds for return of capital are met. Performance Allocations in carry fund structures are subject to clawback to the extent that the Performance Allocation received to date exceeds the amount due to Blackstone based on cumulative results. As such, the accrual for potential repayment of previously received Performance Allocations, which is a component of Due to Affiliates, represents all amounts previously distributed to Blackstone Holdings and non-controlling interest holders that would need to be repaid to the Blackstone carry funds if the Blackstone carry funds were to be liquidated based on the current fair value of the underlying funds’ investments as of the reporting date. The actual clawback liability, however, generally does not become realized until the end of a fund’s life except for certain funds, which may have an interim clawback liability. Performance Allocations in open-ended structures are realized based on the stated time period in the agreements and are generally not subject to clawback once paid.
Principal Investments include the unrealized and realized gains and losses on Blackstone’s principal investments, including its investments in Blackstone Funds that are not consolidated and receive pro-rata allocations, its equity method investments, and other principal investments. Income (Loss) on Principal Investments is realized when Blackstone redeems all or a portion of its investment or when Blackstone receives cash income, such as dividends or distributions. Unrealized Income (Loss) on Principal Investments results from changes in the fair value of the underlying investment as well as the reversal of unrealized gain (loss) at the time an investment is realized.
Interest and Dividend Revenue
69
Blackstone Inc.
Notes to Consolidated Financial Statements—Continued
(All Dollars are in Thousands, Except Share and Per Share Data, Except Where Noted)
Other Revenue
Fair Value of Financial Instruments
GAAP establishes a hierarchical disclosure framework which prioritizes and ranks the level of market price observability used in measuring financial instruments at fair value. Market price observability is affected by a number of factors, including the type of financial instrument, the characteristics specific to the financial instrument and the state of the marketplace, including the existence and transparency of transactions between market participants. Financial instruments with readily available quoted prices in active markets generally will have a higher degree of market price observability and a lesser degree of judgment used in measuring fair value.
Financial instruments measured and reported at fair value are classified and disclosed based on the observability of inputs used in the determination of fair values, as follows:
|
•
|
Level I — Quoted prices are available in active markets for identical financial instruments as of the reporting date. The types of financial instruments in Level I include listed equities, listed derivatives and mutual funds with quoted prices. Blackstone does not adjust the quoted price for these investments, even in situations where Blackstone holds a large position and a sale could reasonably impact the quoted price.
|
|
•
|
Level II — Pricing inputs are other than quoted prices in active markets, which are either directly or indirectly observable a
s of the report
ing date, and fair value is determined through the use of models or other valuation methodologies. Financial instruments which are generally included in this category include corporate bonds and loans, including corporate bonds and loans held within consolidated collateralized loan obligations (“CLO”) vehicles, government and agency securities, less liquid and restricted equity securities, and certain over-the-counter derivatives where the fair value is based on observable inputs. Notes issued by consolidated CLO vehicles are classified within Level II of the fair value hierarchy.
|
|
•
|
Level III — Pricing inputs are unobservable for the financial instruments and includes situations where there is little, if any, market activity for the financial instrument. The inputs into the determination of fair value require significant management judgment or estimation. Financial instruments that are included in this category generally include general and limited partnership interests in private equity, real estate funds and credit-focused funds, distressed debt and non-investment grade residual interests in securitizations, investments in non-consolidated CLOs and certain over-the-counter derivatives where the fair value is based on unobservable inputs.
|
In certain cases, the inputs used to measure fair value may fall into different levels of the fair value hierarchy. In such cases, the determination of which category within the fair value hierarchy is appropriate for any given financial instrument is based on the lowest level of input that is significant to the fair value measurement. Blackstone’s assessment of the significance of a particular input to the fair value measurement in its entirety requires judgment and considers factors specific to the financial instrument.
Level II Valuation Techniques
Financial instruments classified within Level II of the fair value hierarchy comprise debt instruments, debt securities sold, not yet purchased and certain equity securities and derivative instruments valued using observable inputs.
7
0
Blackstone Inc.
Notes to Consolidated Financial Statements—Continued
(All Dollars are in Thousands, Except Share and Per Share Data, Except Where Noted)
The valuation techniques used to value financial instruments classified within Level II of the fair value hierarchy are as follows:
|
•
|
Debt Instruments and Equity Securities are valued on the basis of prices from an orderly transaction between market participants including those provided by reputable dealers or pricing services. In determining the value of a particular investment, pricing services may use certain information with respect to transactions in such investments, quotations from dealers, pricing matrices and market transactions in comparable investments and various relationships between investments. The valuation of certain equity securities is based on an observable price for an identical security adjusted for the effect of a restriction.
|
|
•
|
Freestanding Derivatives are valued using contractual cash flows and observable inputs comprising yield curves, foreign currency rates and credit spreads.
|
|
•
|
Notes issued by consolidated CLO vehicles are measured based on the more observable fair value of CLO assets less (a) the fair value of any beneficial interests held by Blackstone, and (b) the carrying value of any beneficial interests that represent compensation for services.
|
Level III Valuation Techniques
In the absence of observable market prices, Blackstone values its investments using valuation methodologies applied on a consistent basis. For some investments little market activity may exist; management’s determination of fair value is then based on the best information available in the circumstances, and may incorporate management’s own assumptions and involves a significant degree of judgment, taking into consideration a combination of internal and external factors, including the appropriate risk adjustments for non-performance and liquidity risks. Investments for which market prices are not observable include private investments in the equity of operating companies, real estate properties, investments in non-consolidated CLO vehicles, certain funds of hedge funds and credit-focused investments.
Real Estate Investments
Private Equity Investments
Credit-Focused Investments
17
1
Blackstone Inc.
Notes to Consolidated Financial Statements—Continued
(All Dollars are in Thousands, Except Share and Per Share Data, Except Where Noted)
other valuation techniques, including the discounted cash flow method or a market approach. The discounted cash flow method projects the expected cash flows of the debt instrument based on contractual terms, and discounts such cash flows back to the valuation date using a market-based yield. The market-based yield is generally estimated using yields of publicly traded debt instruments issued by companies operating in similar industries as the subject investment or based on changes in credit spreads of a broader benchmark index applicable to a subject investment.
The market approach is generally used to determine the enterprise value of the issuer of a credit investment, and considers valuation multiples of comparable companies or transactions. The resulting enterprise value will dictate whether or not such credit investment has adequate enterprise value coverage. In cases of distressed credit instruments, the market approach may be used to estimate a recovery value in the event of a restructuring.
Investments, at Fair Value
Generally, the Blackstone Funds are accounted for as investment companies under the American Institute of Certified Public Accountants Audit and Accounting Guide,
, and in accordance with the GAAP guidance on investment companies and reflect their investments, including majority-owned and controlled investments (the “Portfolio Companies”), at fair value. Such consolidated funds’ investments are reflected in Investments on the Consolidated Statements of Financial Condition at fair value, with unrealized gains and losses resulting from changes in fair value reflected as a component of Net Gains (Losses) from Fund Investment Activities in the Consolidated Statements of Operations. Fair value is the amount that would be received to sell an asset or paid to transfer a liability, in an orderly transaction between market participants at the measurement date, at current market conditions (i.e., the exit price).
Investment Companies
Blackstone’s principal investments are presented at fair value with unrealized appreciation or depreciation and realized gains and losses recognized in the Consolidated Statements of Operations within Investment Income (Loss).
For certain instruments, Blackstone has elected the fair value option. Such election is irrevocable and is applied on an investment by investment basis at initial recognition or other eligible election dates. Blackstone has applied the fair value option for certain loans and receivables, unfunded loan commitments and certain investments that otherwise would not have been carried at fair value with gains and losses recorded in net income. The methodology for measuring the fair value of such investments is consistent with the methodology applied to private equity, real estate, credit-focused and funds of hedge funds investments. Changes in the fair value of such instruments are recognized in Investment Income (Loss) in the Consolidated Statements of Operations. Interest income on interest bearing loans and receivables and debt securities on which the fair value option has been elected is based on stated coupon rates adjusted for the accretion of purchase discounts and the amortization of purchase premiums. This interest income is recorded within Interest and Dividend Revenue.
Blackstone has elected the fair value option for the assets of consolidated CLO vehicles. As permitted under GAAP, Blackstone measures notes issued by consolidated CLO vehicles as (a) the sum of the fair value of the consolidated CLO assets and the carrying value of any non-financial assets held temporarily, less (b) the sum of the fair value of any beneficial interests retained by Blackstone (other than those that represent compensation for services) and Blackstone’s carrying value of any beneficial interests that represent compensation for services. As a result of this measurement alternative, there is no attribution of amounts to Non-Controlling Interests for consolidated CLO vehicles. Assets of the consolidated CLOs are presented within Investments within the Consolidated Statements of Financial Condition and notes payable within Loans Payable for the amounts due to unaffiliated third parties. Changes in the fair value of consolidated CLO assets and liabilities and related interest, dividend and other income are presented within Net Gains (Losses) from Fund Investment Activities. Expenses of consolidated CLO vehicles are presented in Fund Expenses.
17
2
Blackstone Inc.
Notes to Consolidated Financial Statements—Continued
(All Dollars are in Thousands, Except Share and Per Share Data, Except Where Noted)
Blackstone has elected the fair value option for certain proprietary investments that would otherwise have been accounted for using the equity method of accounting. The fair value of such investments is based on quoted prices in an active market, quoted prices that are published on a regular basis and are the basis for current transactions or using the discounted cash flow method. Changes in fair value are recognized in Investment Income (Loss) in the Consolidated Statements of Operations.
Further disclosure on instruments for which the fair value option has been elected is presented in Note 7. “Fair Value Option.”
Blackstone may elect to measure certain proprietary investments in equity securities without readily determinable fair values under the measurement alternative, which reflects cost less impairment, with adjustments in value resulting from observable price changes arising from orderly transactions of the same or a similar security from the same issuer. If the measurement alternative election is not made, the equity security is measured at fair value. The measurement alternative election is made on an instrument by instrument basis. The election is reassessed each reporting period to determine whether investments under the measurement alternative have readily determinable fair values, in which case they would no longer be eligible for this election.
The investments of consolidated Blackstone Funds in funds of hedge funds (“Investee Funds”) are valued at net asset value (“NAV”) per share of the Investee Fund. In limited circumstances, Blackstone may determine, based on its own due diligence and investment procedures, that NAV per share does not represent fair value. In such circumstances, Blackstone will estimate the fair value in good faith and in a manner that it reasonably chooses, in accordance with the requirements of GAAP.
Certain investments of Blackstone and of the consolidated Blackstone funds of hedge funds and credit-focused funds measure their investments in underlying funds at fair value using NAV per share without adjustment. The terms of the investee’s investment generally provide for minimum holding periods or lock-ups, the institution of gates on redemptions or the suspension of redemptions or an ability to side pocket investments, at the discretion of the investee’s fund manager, and as a result, investments may not be redeemable at, or within three months of, the reporting date. A side-pocket is used by hedge funds and funds of hedge funds to separate investments that may lack a readily ascertainable value, are illiquid or are subject to liquidity restriction. Redemptions are generally not permitted until the investments within a side-pocket are liquidated or it is deemed that the conditions existing at the time that required the investment to be included in the side-pocket no longer exist. As the timing of either of these events is uncertain, the timing at which Blackstone may redeem an investment held in a side-pocket cannot be estimated. Further disclosure on instruments for which fair value is measured using NAV per share is presented in Note 5. “Net Asset Value as Fair Value.”
Security and loan transactions are recorded on a trade date basis.
Equity Method Investments
Investments in which Blackstone is deemed to exert significant influence, but not control, are accounted for using the equity method of accounting except in cases where the fair value option has been elected. Blackstone has significant influence over all Blackstone Funds in which it invests but does not consolidate. Therefore, its investments in such Blackstone Funds, which generally include both a proportionate and disproportionate allocation of the profits and losses (as is the case with carry funds that include a Performance Allocation), are accounted for under the equity method. Under the equity method of accounting, Blackstone’s share of earnings (losses) from equity method investments is included in Investment Income (Loss) in the Consolidated Statements of Operations.
17
3
Blackstone Inc.
Notes to Consolidated Financial Statements—Continued
(All Dollars are in Thousands, Except Share and Per Share Data, Except Where Noted)
In cases where Blackstone’s equity method investments provide for a disproportionate allocation of the profits and losses (as is the case with funds that include a Performance Allocation), Blackstone’s share of earnings (losses) from equity method investments is determined using a balance sheet approach referred to as the hypothetical liquidation at book value (“HLBV”) method. Under the HLBV method, at the end of each reporting period Blackstone calculates the Accrued Performance Allocations that would be due to Blackstone for each fund pursuant to the fund agreements as if the fair value of the underlying investments were realized as of such date, irrespective of whether such amounts have been realized. As the fair value of underlying investments varies between reporting periods, it is necessary to make adjustments to amounts recorded as Accrued Performance Allocations to reflect either (a) positive performance resulting in an increase in the Accrued Performance Allocation to the general partner, or (b) negative performance that would cause the amount due to Blackstone to be less than the amount previously recognized as revenue, resulting in a negative adjustment to the Accrued Performance Allocation to the general partner. In each scenario, it is necessary to calculate the Accrued Performance Allocation on cumulative results compared to the Accrued Performance Allocation recorded to date and make the required positive or negative adjustments. Blackstone ceases to record negative Performance Allocations once previously Accrued Performance Allocations for such fund have been fully reversed. Blackstone is not obligated to pay guaranteed returns or hurdles, and therefore, cannot have negative Performance Allocations over the life of a fund. The carrying amounts of equity method investments are reflected in Investments in the Consolidated Statements of Financial Condition.
Strategic Partners’ results presented in Blackstone’s consolidated financial statements are reported on a three-month lag from Strategic Partners’ fund financial statements, which report the performance of underlying investments generally on a same quarter basis, if available. Therefore, Strategic Partners’ results presented herein do not reflect the impact of economic and market activity in the current quarter. Current quarter market activity of Strategic Partners’ underlying investments is expected to affect Blackstone’s reported results in upcoming periods.
Cash and Cash Equivalents
Cash and Cash Equivalents represents cash on hand, cash held in banks, money market funds and liquid investments with original maturities of three months or less. Interest income from cash and cash equivalents is recorded in Interest and Dividend Revenue in the Consolidated Statements of Operations.
Cash Held by Blackstone Funds and Other
Cash Held by Blackstone Funds and Other represents cash and cash equivalents held by consolidated Blackstone Funds and other consolidated entities. Such amounts are not available to fund the general liquidity needs of Blackstone.
Accounts Receivable and Due from Affiliates
Accounts Receivable and Due from Affiliates is comprised of management and incentive fees receivable from limited partners, receivables from managed investment vehicles and portfolio companies, placement and advisory fees receivables, receivables relating to unsettled sale transactions and loans extended to affiliates and to unaffiliated third parties. Accounts Receivable, excluding those for which the fair value option has been elected, are assessed periodically for collectability. Amounts determined to be uncollectible are charged directly to General, Administrative and Other Expenses in the Consolidated Statements of Operations.
Intangibles and Goodwill
Blackstone’s intangible assets consist of contractual rights to earn future fee income, including management and advisory fees, Incentive Fees and Performance Allocations. Identifiable finite-lived intangible assets are amortized on a straight-line basis over their estimated useful lives, ranging from
to
twenty years
, reflecting the contractual lives of such assets. Amortization expense is included within General, Administrative and Other in the Consolidated Statements of Operations. Intangible assets are reviewed for impairment when events or changes in circumstances indicate that the carrying amount may not be recoverable.
17
4
Blackstone Inc.
Notes to Consolidated Financial Statements—Continued
(All Dollars are in Thousands, Except Share and Per Share Data, Except Where Noted)
Goodwill
comprises goodwill arising from the contribution and reorganization of Blackstone’s predecessor entities in 2007 immediately prior to its initial public offering (“IPO”) and the acquisitions of GSO Capital Partners LP in 2008, Strategic Partners in 2013, Harvest Fund Advisors LLC (“Harvest”) in 2017, Clarus Ventures LLC (“Clarus”) in 2018 and DCI LLC (“DCI”) in 2020. Goodwill is reviewed for impairment at least annually utilizing a qualitative or quantitative approach, and more frequently if circumstances indicate impairment may have occurred. The impairment testing for goodwill under the qualitative approach is based first on a qualitative assessment to determine if it is more likely than not that the fair value of Blackstone’s operating segments is less than their respective carrying values. The operating segments are considered the reporting units for testing the impairment of goodwill. If it is determined that it is more likely than not that an operating segment’s fair value is less than its carrying value or when the quantitative approach is used, an impairment loss is recognized to the extent by which the carrying value exceeds the fair value, not to exceed the total amount of goodwill allocated to that reporting unit.
Furniture, Equipment and Leasehold Improvements
Furniture, equipment and leasehold improvements consist primarily of leasehold improvements, furniture, fixtures and equipment, computer hardware and software and are recorded at cost less accumulated depreciation and amortization. Depreciation and amortization are calculated using the straight-line method over the assets’ estimated useful economic lives, which for leasehold improvements, furniture and fittings and other fixed assets were the lesser of the lease term or the life of the asset, the lesser of
seven years
or the lease term, or
to
five years
, respectively. Blackstone evaluates long-lived assets for impairment whenever events or changes in circumstances indicate that the carrying amount may not be recoverable.
Foreign Currency
In the normal course of business, Blackstone may enter into transactions denominated in currencies other than United States dollars. Foreign exchange gains and losses arising on such transactions are recorded as Other Revenue in the Consolidated Statements of Operations. Foreign currency transaction gains and losses arising within consolidated Blackstone Funds are recorded in Net Gains (Losses) from Fund Investment Activities. In addition, Blackstone consolidates a number of entities that have a non-U.S. dollar functional currency. Non-U.S. dollar denominated assets and liabilities are translated to U.S. dollars at the exchange rate prevailing at the reporting date and income, expenses, gains and losses are translated at the prevailing exchange rate on the dates that they were recorded. Cumulative translation adjustments arising from the translation of non-U.S. dollar denominated operations are recorded in Other Comprehensive Income and allocated to Non-Controlling Interests in Consolidated Entities and Non-Controlling Interests in Blackstone Holdings, as applicable.
Comprehensive Income
Comprehensive Income consists of Net Income and Other Comprehensive Income. Blackstone’s Other Comprehensive Income is comprised of foreign currency cumulative translation adjustments.
Compensation and Benefits
Compensation and Benefits
Compensation
17
5
Blackstone Inc.
Notes to Consolidated Financial Statements—Continued
(All Dollars are in Thousands, Except Share and Per Share Data, Except Where Noted)
except in the case of (a) equity-based awards that do not require future service, which are expensed immediately, and (b) certain awards to recipients that meet criteria making them eligible for retirement (allowing such recipient to keep a percentage of those awards upon departure from Blackstone after becoming eligible for retirement), for which the expense for the portion of the award that would be retained in the event of retirement is either expensed immediately or amortized to the retirement date. Cash settled equity-based awards and awards settled in a variable number of shares are classified as liabilities and are remeasured at the end of each reporting period.
Compensation and Benefits — Incentive Fee Compensation —
Compensation and Benefits — Performance Allocations Compensation —
Non-Controlling Interests in Consolidated Entities
Non-Controlling Interests in Consolidated Entities represent the component of Equity in general partner entities and consolidated Blackstone Funds held by third party investors and employees. The percentage interests in consolidated Blackstone Funds held by third parties and employees is adjusted for general partner allocations and by subscriptions and redemptions in funds of hedge funds and certain credit-focused funds which occur during the reporting period. Income (Loss) and other comprehensive income, if applicable, arising from the respective entities is allocated to non-controlling interests in consolidated entities based on the relative ownership interests of third party investors and employees after considering any contractual arrangements that govern the allocation of income (loss) such as fees allocable to Blackstone Inc.
Redeemable Non-Controlling Interests in Consolidated Entities
Investors in certain consolidated vehicles may be granted redemption rights that allow for quarterly or monthly redemption, as outlined in the relevant governing documents. Such redemption rights may be subject to certain limitations, including limits on the aggregate amount of interests that may be redeemed in a given period, may only allow for redemption following the expiration of a specified period of time, or may be withdrawn subject to a redemption fee during the period when capital may not be withdrawn. As a result, amounts relating to third party interests in such consolidated vehicles are presented as Redeemable Non-Controlling Interests in Consolidated Entities within the Consolidated Statements of Financial Condition. When redeemable amounts become legally payable to investors, they are classified as a liability and included in Accounts Payable, Accrued Expenses and Other Liabilities in the Consolidated Statements of Financial Condition. For all consolidated vehicles in which redemption rights have not been granted, non-controlling interests are presented within Equity in the Consolidated Statements of Financial Condition as Non-Controlling Interests in Consolidated Entities.
Non-Controlling Interests in Blackstone Holdings
Non-Controlling Interests in Blackstone Holdings represent the component of Equity in the consolidated Blackstone Holdings Partnerships held by Blackstone personnel and others who are limited partners of the Blackstone Holdings Partnerships.
17
6
Blackstone Inc.
Notes to Consolidated Financial Statements—Continued
(All Dollars are in Thousands, Except Share and Per Share Data, Except Where Noted)
Certain costs and expenses are borne directly by the Holdings Partnerships. Income (Loss), excluding those costs directly borne by and attributable to the Holdings Partnerships, is attributable to Non-Controlling Interests in Blackstone Holdings. This residual attribution is based on the year to date average percentage of Blackstone Holdings Partnership Units and unvested participating Holdings Partnership Units held by Blackstone personnel and others who are limited partners of the Blackstone Holdings Partnerships. Unvested participating Holdings Partnership Units are excluded from the attribution in periods of loss as they are not contractually obligated to share in losses of the Holdings Partnerships.
Other Income
Net Gains (Losses) from Fund Investment Activities in the Consolidated Statements of Operations include net realized gains (losses) from realizations and sales
of
investments, the net change in unrealized gains (losses) resulting from changes in the fair value of investments and interest income and expense and dividends attributable to the consolidated Blackstone Funds’ investments.
Expenses incurred by consolidated Blackstone funds are separately presented within Fund Expenses in the Consolidated Statements
of
Operations.
Other Income also includes amounts attributable to the Reduction of the Tax Receivable Agreement Liability. See Note 15. “Income Taxes — Other Income — Change in the Tax Receivable Agreement Liability” for additional information.
Income Taxes
Blackstone Inc. is a corporation for U.S. federal income tax purposes and thus is subject to U.S. federal, state and local income taxes on Blackstone’s share of taxable income. The Blackstone Holdings Partnerships and certain of their subsidiaries operate in the U.S. as partnerships for U.S. federal income tax purposes and generally as corporate entities in non-U.S. jurisdictions. Accordingly, these entities in some cases are subject to New York City unincorporated business taxes or non-U.S. income taxes. In addition, certain of the wholly owned subsidiaries of Blackstone and the Blackstone Holdings Partnerships will be subject to federal, state and local corporate income taxes at the entity level and the related tax provision attributable to Blackstone’s share of this income tax is reflected in the consolidated financial statements. Cash paid for transferrable tax credits is reflected in Payments for Income Taxes in the Consolidated Statements of Cash Flows.
Provision for Income Taxes
Income taxes are provided for using the asset and liability method under which deferred tax assets and liabilities are recognized for temporary differences between the financial reporting and tax bases of assets and liabilities, resulting in all pretax amounts being appropriately tax effected in the period, irrespective of which tax return year items will be reflected. Blackstone reports interest expense and tax penalties related to income tax matters in provision for income taxes.
Deferred Income Taxes
Deferred income taxes reflect the net tax effects of temporary differences between the financial reporting and tax bases of assets and liabilities. These temporary differences result in taxable or deductible amounts in future years and are measured using the tax rates and laws that will be in effect when such differences are expected to reverse. Valuation allowances are established to reduce the deferred tax assets to the amount that is more likely than not to be realized. Deferred tax assets are separately stated, and deferred tax liabilities are included in Accounts Payable, Accrued Expenses, and Other Liabilities in the consolidated financial statements.
17
7
Blackstone Inc.
Notes to Consolidated Financial Statements—Continued
(All Dollars are in Thousands, Except Share and Per Share Data, Except Where Noted)
Unrecognized Tax Benefits
Blackstone recognizes tax positions in the consolidated financial statements when it is more likely than not that the position will be sustained on examination by the relevant taxing authority based on the technical merits of the position. A position that meets this standard is measured at the largest amount of benefit that will more likely than not be realized on settlement. A liability is established for differences between positions taken in the return and amounts recognized in the consolidated financial statements. Accrued interest and penalties related to unrecognized tax benefits are reported on the related liability line in the consolidated financial statements.
Net Income (Loss) Per Share of Common Stock
Basic Income (Loss) Per Share of Common Stock is calculated by dividing Net Income (Loss) Attributable to Blackstone Inc. by the weighted-average shares of common stock, unvested participating shares of common stock outstanding for the period and vested deferred restricted shares of common stock that have been earned for which issuance of the related shares of common stock is deferred until future periods. Diluted Income (Loss) Per Share of Common Stock reflects the impact of all dilutive securities. Unvested participating shares of common stock are excluded from the computation in periods of loss as they are not contractually obligated to share in losses.
Blackstone applies the treasury stock method to determine the dilutive weighted-average common shares outstanding for certain equity-based compensation awards. Blackstone applies the “if-converted” method to the Blackstone Holdings Partnership Units to determine the dilutive impact, if any, of the exchange right included in the Blackstone Holdings Partnership Units. Blackstone applies the contingently issuable share model to contracts that may require the issuance of shares.
Reverse Repurchase and Repurchase Agreements
Securities purchased under agreements to resell (“reverse repurchase agreements”) and securities sold under agreements to repurchase (“repurchase agreements”), comprised primarily of U.S. and non-U.S. government and agency securities, asset-backed securities and corporate debt, represent collateralized financing transactions. Such transactions are recorded within Accounts Payable, Accrued Expenses and Other Liabilities in the Consolidated Statements of Financial Condition at their contractual amounts and include accrued interest. The carrying value of reverse repurchase and repurchase agreements approximates fair value.
Blackstone manages credit exposure arising from reverse repurchase agreements and repurchase agreements by, in appropriate circumstances, entering into master netting agreements and collateral arrangements with counterparties that provide Blackstone, in the event of a counterparty default, the right to liquidate collateral and the right to offset a counterparty’s rights and obligations.
Blackstone takes possession of securities purchased under reverse repurchase agreements and is permitted to repledge, deliver or otherwise use such securities. Blackstone also pledges its financial instruments to counterparties to collateralize repurchase agreements. Financial instruments pledged that can be repledged, delivered or otherwise used by the counterparty are recorded in Investments in the Consolidated Statements of Financial Condition. Additional disclosures relating to repurchase agreements are discussed in Note 10. “Repurchase Agreements.”
Blackstone does not offset assets and liabilities relating to reverse repurchase agreements and repurchase agreements in its Consolidated Statements of Financial Condition. Additional disclosures relating to offsetting are discussed in Note 12. “Offsetting of Assets and Liabilities.”
1
7
8
Blackstone Inc.
Notes to Consolidated Financial Statements—Continued
(All Dollars are in Thousands, Except Share and Per Share Data, Except Where Noted)
Securities Sold, Not Yet Purchased
Securities Sold, Not Yet Purchased consist of equity and debt securities that Blackstone has borrowed and sold. Blackstone is required to “cover” its short sale in the future by purchasing the security at prevailing market prices and delivering it to the counterparty from which it borrowed the security. Blackstone is exposed to loss in the event that the price at which a security may have to be purchased to cover a short sale exceeds the price at which the borrowed security was sold short.
Securities Sold, Not Yet Purchased are recorded at fair value within Accounts Payable, Accrued Expenses and Other Liabilities in the Consolidated Statements of Financial Condition.
Derivative Instruments
Blackstone recognizes all derivatives as assets or liabilities on its Consolidated Statements of Financial Condition at fair value. On the date Blackstone enters into a derivative contract, it designates and documents each derivative contract as one of the following: (a) a hedge of a recognized asset or liability (“fair value hedge”), (b) a hedge of a forecasted transaction or of the variability of cash flows to be received or paid related to a recognized asset or liability (“cash flow hedge”), (c) a hedge of a net investment in a foreign operation, or (d) a derivative instrument not designated as a hedging instrument (“freestanding derivative”).
For freestanding derivative contracts, Blackstone presents changes in fair value in current period earnings. Changes in the fair value of derivative instruments held by consolidated Blackstone Funds are reflected in Net Gains (Losses) from Fund Investment Activities or, where derivative instruments are held by Blackstone, within Investment Income (Loss) in the Consolidated Statements of Operations. The fair value of freestanding derivative assets of the consolidated Blackstone Funds are recorded within Investments, the fair value of freestanding derivative assets that are not part of the consolidated Blackstone Funds are recorded within Other Assets and the fair value of freestanding derivative liabilities are recorded within Accounts Payable, Accrued Expenses and Other Liabilities in the Consolidated Statements of Financial Condition.
Blackstone has elected to not offset derivative assets and liabilities or financial assets in its Consolidated Statements of Financial Condition, including cash, that may be received or paid as part of collateral arrangements, even when an enforceable master netting agreement is in place that provides Blackstone, in the event of counterparty default, the right to liquidate collateral and the right to offset a counterparty’s rights and obligations.
Blackstone’s other disclosures regarding derivative financial instruments are discussed in Note 6. “Derivative Financial Instruments.”
Blackstone’s disclosures regarding offsetting are discussed in Note 12. “Offsetting of Assets and Liabilities.”
Leases
Blackstone determines if an arrangement is a lease at inception of the arrangement. Blackstone primarily enters into operating leases, as the lessee, for office space. Operating leases are included in Right-of-Use (“ROU”) Assets and Operating Lease Liabilities in the Consolidated Statement of Financial Condition. ROU Assets and Operating Lease Liabilities are recognized based on the present value of the future minimum lease payments over the lease term at the commencement date. Blackstone determines the present value of the lease payments using an incremental borrowing rate based on information available at the inception date. Leases may include options to extend or terminate the lease which are included in the ROU Assets and Operating Lease Liability when they are reasonably certain of exercise.
1
79
Blackstone Inc.
Notes to Consolidated Financial Statements—Continued
(All Dollars are in Thousands, Except Share and Per Share Data, Except Where Noted)
Certain leases include lease and nonlease components, which are accounted for as one single lease component. Occupancy lease agreements, in addition to contractual rent payments, generally include additional payments for certain costs incurred by the landlord, such as building expenses and utilities. To the extent these are fixed or determinable, they are included as part of the minimum lease payments used to measure the Operating Lease Liability. Operating lease expense associated with minimum lease payments is recognized on a straight-line basis over the lease term. When additional payments are based on usage or vary based on other factors, they are expensed when incurred as variable lease expense.
Minimum lease payments for leases with an initial term of twelve months or less are not recorded on the Consolidated Statement of Financial Condition. Blackstone recognizes lease expense for these leases on a straight-line basis over the lease term.
Additional disclosures relating to leases are discussed in Note 14. “Leases.”
Affiliates
Blackstone considers its Founder, senior managing directors, employees, the Blackstone Funds and the Portfolio Companies to be affiliates.
Dividends
Dividends are reflected in the consolidated financial statements when declared.
Recent Accounting Developments
In June 2022, the Financial Accounting Standards Board issued amended guidance addressing certain sale restrictions on equity securities measured at fair value. The guidance requires that reporting entities not consider contractual sale restrictions that prohibit the sale of equity securities when measuring fair value and introduces new disclosure requirements for equity securities subject to contractual sale restrictions. The guidance is effective January 1, 2024 and adoption will be on a prospective basis. Upon adoption, Blackstone does not expect a material impact on the consolidated financial statements or any measurement impacts, but will update disclosures to comply with the new requirements.
|
3.
|
Goodwill and Intangible Assets
|
The carrying value of Goodwill was $
1.9
billion as of December 31, 2023 and 2022. At December 31, 2023 and 2022, Blackstone determined there was no evidence of Goodwill impairment.
At December 31, 2023 and 2022, Goodwill has been allocated to each of Blackstone’s
four
segments as follows: Real Estate ($
421.7
million), Private Equity ($
870.0
million), Credit & Insurance ($
426.4
million) and Hedge Fund Solutions ($
172.1
million).
Intangible Assets, Net consists of the following:
|
December 31,
|
||||||||
|
2023
|
2022
|
|||||||
|
Finite-Lived Intangible Assets/Contractual Rights
|
$
|
|
|
$
|
|
|
||
|
Accumulated Amortization
|
|
(
|
)
|
|
(
|
)
|
||
|
|
|
|
|
|
|
|||
|
Intangible Assets, Net
|
$
|
|
|
$
|
|
|
||
|
|
|
|
|
|
|
|||
18
0
Blackstone Inc.
Notes to Consolidated Financial Statements—Continued
(All Dollars are in Thousands, Except Share and Per Share Data, Except Where Noted)
Changes in Blackstone’s Intangible Assets, Net consists of the following:
|
Year Ended December 31,
|
||||||||||||
|
2023
|
2022
|
2021
|
||||||||||
|
Balance, Beginning of Year
|
$
|
|
|
$
|
|
|
$
|
|
|
|||
|
Amortization Expense
|
|
(
|
)
|
|
(
|
)
|
|
(
|
)
|
|||
|
Acquisitions
|
|
|
|
|
|
|
|
|
|
|||
|
|
|
|
|
|
|
|
|
|
||||
|
Balance, End of Year
|
$
|
|
|
$
|
|
|
$
|
|
|
|||
|
|
|
|
|
|
|
|
|
|
||||
Amortization of Intangible Assets held at December 31, 2023 is expected to be $
35.9
million, $
35.9
million, $
35.7
million, $
34.6
million and $
17.8
million for each of the years ending December 31, 2024, 2025, 2026, 2027 and 2028, respectively. Blackstone’s Intangible Assets as of December 31, 2023 are expected to amortize over a weighted-average period of
6.2
years.
|
4.
|
Investments
|
Investments consist of the following:
|
December 31,
|
||||||||
|
2023
|
2022
|
|||||||
|
Investments of Consolidated Blackstone Funds
|
$
|
|
|
$
|
|
|
||
|
Equity Method Investments
|
||||||||
|
Partnership Investments
|
|
|
|
|
|
|
||
|
Accrued Performance Allocations
|
|
|
|
|
|
|
||
|
Corporate Treasury Investments
|
|
|
|
|
|
|
||
|
Other Investments
|
|
|
|
|
|
|
||
|
|
|
|
|
|
|
|||
|
$
|
|
|
$
|
|
|
|||
|
|
|
|
|
|
|
|||
Blackstone’s share of Investments of Consolidated Blackstone Funds totaled $
1.0
billion and $
393.9
million at December 31, 2023 and December 31, 2022, respectively.
Where appropriate, the accounting for Blackstone’s investments incorporates the changes in fair value of those investments as determined under GAAP. The significant inputs and assumptions required to determine the change in fair value of the investments of Consolidated Blackstone Funds, Corporate Treasury Investments and Other Investments are
discus
sed in more detail in Note 8. “Fair Value Measurements of Financial Instruments.”
18
1
Blackstone Inc.
Notes to Consolidated Financial Statements—Continued
(All Dollars are in Thousands, Except Share and Per Share Data, Except Where Noted)
Investments of Consolidated Blackstone Funds
The following table presents the Realized and Net Change in Unrealized Gains (Losses) on investments held by the consolidated Blackstone Funds and a reconciliation to Other Income (Loss) — Net Gains (Losses) from Fund Investment Activities in the Consolidated Statements of Operations:
|
Year Ended December 31,
|
||||||||||||
|
2023
|
2022
|
2021
|
||||||||||
|
Realized Gains (Losses)
|
$
|
(
|
)
|
$
|
|
|
$
|
|
|
|||
|
Net Change in Unrealized Gains (Losses)
|
|
(
|
)
|
|
(
|
)
|
|
|
|
|||
|
|
|
|
|
|
|
|
|
|
||||
|
Realized and Net Change in Unrealized Gains (Losses) from Consolidated Blackstone Funds
|
|
(
|
)
|
|
(
|
)
|
|
|
|
|||
|
Interest and Dividend Revenue and Foreign Exchange Gains Attributable to Consolidated Blackstone Funds
|
|
|
|
|
|
|
|
|
|
|||
|
|
|
|
|
|
|
|
|
|
||||
|
Other Income (Loss) — Net Gains (Losses) from Fund Investment Activities
|
$
|
(
|
)
|
$
|
(
|
)
|
$
|
|
|
|||
|
|
|
|
|
|
|
|
|
|
||||
Equity Method Investments
Blackstone’s equity method investments include Partnership Investments, which represent the pro-rata investments, and any associated Accrued Performance Allocations, in Blackstone Funds, excluding any equity method investments for which the fair value option has been elected. Blackstone evaluates each of its equity method investments, excluding Accrued Performance Allocations, to determine if any were significant as defined by guidance from the United States Securities and Exchange Commission. As of and for the years ended December 31, 2023, 2022 and 2021, no individual equity method investment held by Blackstone met the significance criteria.
Partnership Investments
Blackstone recognized net gains related to its Partnership Investments accounted for under the equity method of $
245.8
million, $
292.1
million and $
1.9
billion for the years ended December 31, 2023, 2022 and 2021, respectively.
18
2
Blackstone Inc.
Notes to Consolidated Financial Statements—Continued
(All Dollars are in Thousands, Except Share and Per Share Data, Except Where Noted)
The summarized financial information of Blackstone’s equity method investments for December 31, 2023 are as follows:
|
December 31, 2023 and the Year Then Ended
|
||||||||||||||||||||
|
Real
Estate |
Private
Equity |
Credit &
Insurance |
Hedge Fund
Solutions |
Total
|
||||||||||||||||
|
Statement of Financial Condition
|
||||||||||||||||||||
|
Assets
|
||||||||||||||||||||
|
Investments
|
$
|
|
|
$
|
|
|
$
|
|
|
$
|
|
|
$
|
|
|
|||||
|
Other Assets
|
|
|
|
|
|
|
|
|
|
|
|
|
|
|
|
|||||
|
|
|
|
|
|
|
|
|
|
|
|
|
|
|
|
||||||
|
Total Assets
|
$
|
|
|
$
|
|
|
$
|
|
|
$
|
|
|
$
|
|
|
|||||
|
|
|
|
|
|
|
|
|
|
|
|
|
|
|
|
||||||
|
Liabilities and Equity
|
||||||||||||||||||||
|
Debt
|
$
|
|
|
$
|
|
|
$
|
|
|
$
|
|
|
$
|
|
|
|||||
|
Other Liabilities
|
|
|
|
|
|
|
|
|
|
|
|
|
|
|
|
|||||
|
|
|
|
|
|
|
|
|
|
|
|
|
|
|
|
||||||
|
Total Liabilities
|
|
|
|
|
|
|
|
|
|
|
|
|
|
|
|
|||||
|
|
|
|
|
|
|
|
|
|
|
|
|
|
|
|
||||||
|
Equity
|
|
|
|
|
|
|
|
|
|
|
|
|
|
|
|
|||||
|
|
|
|
|
|
|
|
|
|
|
|
|
|
|
|
||||||
|
Total Liabilities and Equity
|
$
|
|
|
$
|
|
|
$
|
|
|
$
|
|
|
$
|
|
|
|||||
|
|
|
|
|
|
|
|
|
|
|
|
|
|
|
|
||||||
|
Statement of Operations
|
||||||||||||||||||||
|
Interest Income
|
$
|
|
|
$
|
|
|
$
|
|
|
$
|
|
|
$
|
|
|
|||||
|
Other Income
|
|
|
|
|
|
|
|
|
|
|
|
|
|
|
|
|||||
|
Interest Expense
|
|
(
|
)
|
|
(
|
)
|
|
(
|
)
|
|
|
(
|
)
|
|
(
|
)
|
||||
|
Other Expenses
|
|
(
|
)
|
|
(
|
)
|
|
(
|
)
|
|
(
|
)
|
|
(
|
)
|
|||||
|
Net Realized and Unrealized Gain (Loss) from Investments
|
|
(
|
)
|
|
|
|
|
|
|
|
|
|
|
|
|
|||||
|
|
|
|
|
|
|
|
|
|
|
|
|
|
|
|
||||||
|
Net Income
|
$
|
(
|
)
|
$
|
|
|
$
|
|
|
$
|
|
|
$
|
|
|
|||||
|
|
|
|
|
|
|
|
|
|
|
|
|
|
|
|
||||||
18
3
Blackstone Inc.
Notes to Consolidated Financial Statements—Continued
(All Dollars are in Thousands, Except Share and Per Share Data, Except Where Noted)
The summarized financial information of Blackstone’s equity method investments for December 31, 2022 are as follows:
|
December 31, 2022 and the Year Then Ended
|
||||||||||||||||||||
|
Real
Estate |
Private
Equity |
Credit &
Insurance |
Hedge Fund
Solutions |
Total
|
||||||||||||||||
|
Statement of Financial Condition
|
||||||||||||||||||||
|
Assets
|
||||||||||||||||||||
|
Investments
|
$
|
|
|
$
|
|
|
$
|
|
|
$
|
|
|
$
|
|
|
|||||
|
Other Assets
|
|
|
|
|
|
|
|
|
|
|
|
|
|
|
|
|||||
|
|
|
|
|
|
|
|
|
|
|
|
|
|
|
|
||||||
|
Total Assets
|
$
|
|
|
$
|
|
|
$
|
|
|
$
|
|
|
$
|
|
|
|||||
|
|
|
|
|
|
|
|
|
|
|
|
|
|
|
|
||||||
|
Liabilities and Equity
|
||||||||||||||||||||
|
Debt
|
$
|
|
|
$
|
|
|
$
|
|
|
$
|
|
|
$
|
|
|
|||||
|
Other Liabilities
|
|
|
|
|
|
|
|
|
|
|
|
|
|
|
|
|||||
|
|
|
|
|
|
|
|
|
|
|
|
|
|
|
|
||||||
|
Total Liabilities
|
|
|
|
|
|
|
|
|
|
|
|
|
|
|
|
|||||
|
|
|
|
|
|
|
|
|
|
|
|
|
|
|
|
||||||
|
Equity
|
|
|
|
|
|
|
|
|
|
|
|
|
|
|
|
|||||
|
|
|
|
|
|
|
|
|
|
|
|
|
|
|
|
||||||
|
Total Liabilities and Equity
|
$
|
|
|
$
|
|
|
$
|
|
|
$
|
|
|
$
|
|
|
|||||
|
|
|
|
|
|
|
|
|
|
|
|
|
|
|
|
||||||
|
Statement of Operations
|
||||||||||||||||||||
|
Interest Income
|
$
|
|
|
$
|
|
|
$
|
|
|
$
|
|
|
$
|
|
|
|||||
|
Other Income
|
|
|
|
|
|
|
|
|
|
|
|
|
|
|
|
|||||
|
Interest Expense
|
|
(
|
)
|
|
(
|
)
|
|
(
|
)
|
|
(
|
)
|
|
(
|
)
|
|||||
|
Other Expenses
|
|
(
|
)
|
|
(
|
)
|
|
(
|
)
|
|
(
|
)
|
|
(
|
)
|
|||||
|
Net Realized and Unrealized Gain (Losses) from Investments
|
|
|
|
|
|
|
|
(
|
)
|
|
|
|
|
|
|
|||||
|
|
|
|
|
|
|
|
|
|
|
|
|
|
|
|
||||||
|
Net Income
|
$
|
|
|
$
|
|
|
$
|
|
|
$
|
|
|
$
|
|
|
|||||
|
|
|
|
|
|
|
|
|
|
|
|
|
|
|
|
||||||
Blackstone Inc.
Notes to Consolidated Financial Statements—Continued
(All Dollars are in Thousands, Except Share and Per Share Data, Except Where Noted)
The summarized financial information of Blackstone’s equity method investments for December 31, 2021 are as follows:
|
December 31, 2021 and the Year Then Ended
|
||||||||||||||||||||
|
Real
Estate |
Private
Equity |
Credit &
Insurance |
Hedge Fund
Solutions |
Total
|
||||||||||||||||
|
Statement of Financial Condition
|
||||||||||||||||||||
|
Assets
|
||||||||||||||||||||
|
Investments
|
$
|
|
|
$
|
|
|
$
|
|
|
$
|
|
|
$
|
|
|
|||||
|
Other Assets
|
|
|
|
|
|
|
|
|
|
|
|
|
|
|
|
|||||
|
|
|
|
|
|
|
|
|
|
|
|
|
|
|
|
||||||
|
Total Assets
|
$
|
|
|
$
|
|
|
$
|
|
|
$
|
|
|
$
|
|
|
|||||
|
|
|
|
|
|
|
|
|
|
|
|
|
|
|
|
||||||
|
Liabilities and Equity
|
||||||||||||||||||||
|
Debt
|
$
|
|
|
$
|
|
|
$
|
|
|
$
|
|
|
$
|
|
|
|||||
|
Other Liabilities
|
|
|
|
|
|
|
|
|
|
|
|
|
|
|
|
|||||
|
|
|
|
|
|
|
|
|
|
|
|
|
|
|
|
||||||
|
Total Liabilities
|
|
|
|
|
|
|
|
|
|
|
|
|
|
|
|
|||||
|
|
|
|
|
|
|
|
|
|
|
|
|
|
|
|
||||||
|
Equity
|
|
|
|
|
|
|
|
|
|
|
|
|
|
|
|
|||||
|
|
|
|
|
|
|
|
|
|
|
|
|
|
|
|
||||||
|
Total Liabilities and Equity
|
$
|
|
|
$
|
|
|
$
|
|
|
$
|
|
|
$
|
|
|
|||||
|
|
|
|
|
|
|
|
|
|
|
|
|
|
|
|
||||||
|
Statement of Operations
|
||||||||||||||||||||
|
Interest Income
|
$
|
|
|
$
|
|
|
$
|
|
|
$
|
|
|
$
|
|
|
|||||
|
Other Income
|
|
|
|
|
|
|
|
|
|
|
|
|
|
|
|
|||||
|
Interest Expense
|
|
(
|
)
|
|
(
|
)
|
|
(
|
)
|
|
(
|
)
|
|
(
|
)
|
|||||
|
Other Expenses
|
|
(
|
)
|
|
(
|
)
|
|
(
|
)
|
|
(
|
)
|
|
(
|
)
|
|||||
|
Net Realized and Unrealized Gain from Investments
|
|
|
|
|
|
|
|
|
|
|
|
|
|
|
|
|||||
|
|
|
|
|
|
|
|
|
|
|
|
|
|
|
|
||||||
|
Net Income (Loss)
|
$
|
|
|
$
|
|
|
$
|
|
|
$
|
|
|
$
|
|
|
|||||
|
|
|
|
|
|
|
|
|
|
|
|
|
|
|
|
||||||
Accrued Performance Allocations
Accrued Performance Allocations to Blackstone were as follows:
|
Real
Estate
|
Private
Equity
|
Credit &
Insurance |
Hedge Fund
Solutions |
Total
|
||||||||||||||||
|
Accrued Performance Allocations, December 31, 2022
|
$
|
|
|
$
|
|
|
$
|
|
|
$
|
|
|
$
|
|
|
|||||
|
Performance Allocations as a Result of Changes in Fund Fair Values
|
|
(
|
)
|
|
|
|
|
|
|
|
|
|
|
|
|
|||||
|
Foreign Exchange Gain
|
|
|
|
|
—
|
|
|
—
|
|
|
—
|
|
|
|
|
|||||
|
Fund Distributions
|
|
(
|
)
|
|
(
|
)
|
|
(
|
)
|
|
(
|
)
|
|
(
|
)
|
|||||
|
|
|
|
|
|
|
|
|
|
|
|
|
|
|
|
||||||
|
Accrued Performance Allocations, December 31, 2023
|
$
|
|
|
$
|
|
|
$
|
|
|
$
|
|
|
$
|
|
|
|||||
|
|
|
|
|
|
|
|
|
|
|
|
|
|
|
|
||||||
18
5
Blackstone Inc.
Notes to Consolidated Financial Statements—Continued
(All Dollars are in Thousands, Except Share and Per Share Data, Except Where Noted)
Corporate Treasury Investments
The portion of corporate treasury investments included in Investments represents Blackstone’s investments into primarily fixed income securities, mutual fund interests, and other fund interests. These strategies are managed by a combination of Blackstone personnel and third party advisors.
The following table presents the Realized and Net Change in Unrealized Gains (Losses) on these investments:
|
|
|
Year Ended December 31,
|
||||||||||
|
|
|
2023
|
|
2022
|
|
2021
|
||||||
|
Realized Gains (Losses)
|
$
|
(
|
)
|
$
|
(
|
)
|
$
|
|
|
|||
|
Net Change in Unrealized Gains (Losses)
|
|
|
|
|
(
|
)
|
|
|
|
|||
|
|
|
|
|
|
|
|
|
|
||||
|
$
|
|
|
$
|
(
|
)
|
$
|
|
|
||||
|
|
|
|
|
|
|
|
|
|
||||
Other Investments
Other Investments consist of equity method investments where Blackstone has elected the fair value option and other proprietary investment securities held by Blackstone, including equity securities carried at fair value, equity investments without readily determinable fair values, and senior secured and subordinated notes in non-consolidated CLO vehicles. Equity securities carried at fair value include the ownership of common stock of Corebridge Financial, Inc., formerly known as American International Group, Inc.’s Life and Retirement business (“Corebridge”). Such common stock is subject to certain phased lock-up restrictions that expire over time through
five years
after the initial public offering (“IPO”) of Corebridge. Equity investments without a readily determinable fair value had a carrying value of $
333.3
million as of December 31, 2023. In the period of acquisition and upon remeasurement in connection with an observable transaction, such investments are reported at fair value. See Note 8. “Fair Value Measurements of Financial Instruments” for additional detail. Upward and downward adjustments related to such investments held as of December 31, 2023 were $
4.3
million and $
62.3
million, respectively, during the year ended December 31, 2023, and $
184.6
million and $
6.2
million on a cumulative basis since the inception of the investments, respectively.
The following table presents Blackstone’s Realized and Net Change in Unrealized Gains (Losses) in Other Investments:
|
Year Ended December 31,
|
||||||||||||
|
2023
|
2022
|
2021
|
||||||||||
|
Realized Gains (Losses)
|
$
|
(
|
)
|
$
|
|
|
$
|
|
|
|||
|
Net Change in Unrealized Gains (Losses)
|
|
(
|
)
|
|
(
|
)
|
|
|
|
|||
|
|
|
|
|
|
|
|
|
|
||||
|
$
|
(
|
)
|
$
|
(
|
)
|
$
|
|
|
||||
|
|
|
|
|
|
|
|
|
|
||||
Blackstone Inc.
Notes to Consolidated Financial Statements—Continued
(All Dollars are in Thousands, Except Share and Per Share Data, Except Where Noted)
5. Net Asset Value as Fair Value
A summary of fair value by strategy type and ability to redeem such investments as of December 31, 2023 is presented below:
|
Strategy (a)
|
Fair Value
|
Redemption
Frequency (if currently eligible) |
Redemption
Notice Period |
|||||
|
Equity
|
$
|
|
|
(b)
|
(b)
|
|||
|
Real Estate
|
|
|
|
(c)
|
(c)
|
|||
|
Other
|
|
|
|
(d)
|
(d)
|
|||
|
|
|
|
||||||
|
$
|
|
|
||||||
|
|
|
|
||||||
|
(a)
|
As of December 31, 2023, Blackstone had no unfunded commitments.
|
|
(b)
|
The Equity category includes investments in hedge funds that invest primarily in domestic and international equity securities. Investments representing
|
|
(c)
|
The Real Estate category includes investments in funds that primarily invest in real estate assets. All investments in this category are redeemable as of the reporting date.
|
|
(d)
|
Other is composed of the Credit Driven category, the Commodities category and the Diversified Instruments category. The Credit Driven category includes investments in hedge funds that invest primarily in domestic and international bonds. The Commodities category includes investments in commodities-focused funds that primarily invest in futures and physical-based commodity driven strategies. The Diversified Instruments category includes investments in funds that invest across multiple strategies. All investments in these categories may not be redeemed at, or within three months of, the reporting date.
|
6. Derivative Financial Instruments
Blackstone and the consolidated Blackstone Funds enter into derivative contracts in the normal course of business to achieve certain risk management objectives and for general investment and business purposes. Blackstone may enter into derivative contracts in order to hedge its interest rate risk exposure against the effects of interest rate changes. Additionally, Blackstone may also enter into derivative contracts in order to hedge its foreign currency risk exposure against the effects of a portion of its non-U.S. dollar denominated currency net investments. As a result of the use of derivative contracts, Blackstone and the consolidated Blackstone Funds are exposed to the risk that counterparties will fail to fulfill their contractual obligations. To mitigate such counterparty risk, Blackstone and the consolidated Blackstone Funds enter into contracts with certain major financial institutions, all of which have investment grade ratings. Counterparty credit risk is evaluated in determining the fair value of derivative instruments.
Freestanding Derivatives
Freestanding derivatives are instruments that Blackstone and certain of the consolidated Blackstone Funds have entered into as part of their overall risk management and investment strategies. These derivative contracts are not designated as hedging instruments for accounting purposes. Such contracts may include interest rate swaps, foreign exchange contracts, equity swaps, options, futures and other derivative contracts.
18
7
Blackstone Inc.
Notes to Consolidated Financial Statements—Continued
(All Dollars are in Thousands, Except Share and Per Share Data, Except Where Noted)
The table below summarizes the aggregate notional amount and fair value of the derivative financial instruments. The notional amount represents the absolute value amount of all outstanding derivative contracts.
|
December 31, 2023
|
December 31, 2022
|
|||||||||||||||||||||||||||||||
|
Assets
|
Liabilities
|
Assets
|
Liabilities
|
|||||||||||||||||||||||||||||
|
Notional
|
Fair
Value
|
Notional
|
Fair
Value |
Notional
|
Fair
Value |
Notional
|
Fair
Value |
|||||||||||||||||||||||||
|
Freestanding Derivatives
|
||||||||||||||||||||||||||||||||
|
Blackstone
|
||||||||||||||||||||||||||||||||
|
Interest Rate Contracts
|
$
|
|
|
$
|
|
|
$
|
|
|
$
|
|
|
$
|
|
|
$
|
|
|
$
|
|
|
$
|
|
|
||||||||
|
Foreign Currency Contracts
|
|
|
|
|
|
|
|
|
|
|
|
|
|
|
|
|
|
|
|
|
|
|
|
|
||||||||
|
Credit Default Swaps
|
|
|
|
|
|
|
|
|
|
|
|
|
|
|
|
|
|
|
|
|
|
|
|
|
||||||||
|
Total Return Swaps
|
|
|
|
|
|
|
|
—
|
|
|
—
|
|
|
|
|
|
|
|
|
—
|
|
|
—
|
|
||||||||
|
Equity Options
|
|
—
|
|
|
—
|
|
|
|
|
|
|
|
|
—
|
|
|
—
|
|
|
|
|
|
|
|
||||||||
|
|
|
|
|
|
|
|
|
|
|
|
|
|
|
|
|
|
|
|
|
|
|
|
|
|||||||||
|
|
|
|
|
|
|
|
|
|
|
|
|
|
|
|
|
|
|
|
|
|
|
|
|
|||||||||
|
|
|
|
|
|
|
|
|
|
|
|
|
|
|
|
|
|
|
|
|
|
|
|
|
|||||||||
|
Investments of Consolidated Blackstone Funds
|
||||||||||||||||||||||||||||||||
|
Interest Rate Contracts
|
|
|
|
|
|
|
|
—
|
|
|
—
|
|
|
|
|
|
|
|
|
—
|
|
|
—
|
|
||||||||
|
Foreign Currency Contracts
|
|
—
|
|
|
—
|
|
|
—
|
|
|
—
|
|
|
—
|
|
|
—
|
|
|
|
|
|
|
|
||||||||
|
|
|
|
|
|
|
|
|
|
|
|
|
|
|
|
|
|
|
|
|
|
|
|
|
|||||||||
|
|
|
|
|
|
|
|
—
|
|
|
—
|
|
|
|
|
|
|
|
|
|
|
|
|
|
|||||||||
|
|
|
|
|
|
|
|
|
|
|
|
|
|
|
|
|
|
|
|
|
|
|
|
|
|||||||||
|
$
|
|
|
$
|
|
|
$
|
|
|
$
|
|
|
$
|
|
|
$
|
|
|
$
|
|
|
$
|
|
|
|||||||||
|
|
|
|
|
|
|
|
|
|
|
|
|
|
|
|
|
|
|
|
|
|
|
|
|
|||||||||
The table below summarizes the impact to the Consolidated Statements of Operations from derivative financial instruments:
|
Year Ended December 31,
|
||||||||||||
|
2023
|
2022
|
2021
|
||||||||||
|
Freestanding Derivatives
|
||||||||||||
|
Realized Gains (Losses)
|
||||||||||||
|
Interest Rate Contracts
|
$
|
|
|
$
|
|
|
$
|
|
|
|||
|
Foreign Currency Contracts
|
|
|
|
|
(
|
)
|
|
(
|
)
|
|||
|
Credit Default Swaps
|
|
(
|
)
|
|
(
|
)
|
|
(
|
)
|
|||
|
Total Return Swaps
|
|
|
|
|
|
|
|
(
|
)
|
|||
|
Other
|
|
—
|
|
|
—
|
|
|
(
|
)
|
|||
|
|
|
|
|
|
|
|
|
|
||||
|
|
|
|
|
|
|
|
(
|
)
|
||||
|
|
|
|
|
|
|
|
|
|
||||
|
Net Change in Unrealized Gains (Losses)
|
||||||||||||
|
Interest Rate Contracts
|
|
(
|
)
|
|
|
|
|
|
|
|||
|
Foreign Currency Contracts
|
|
|
|
|
|
|
|
|
|
|||
|
Credit Default Swaps
|
|
|
|
|
|
|
|
|
|
|||
|
Total Return Swaps
|
|
|
|
|
|
|
|
|
|
|||
|
Equity Options
|
|
(
|
)
|
|
(
|
)
|
|
—
|
|
|||
|
Other
|
|
—
|
|
|
—
|
|
|
(
|
)
|
|||
|
|
|
|
|
|
|
|
|
|
||||
|
|
(
|
)
|
|
|
|
|
|
|
||||
|
|
|
|
|
|
|
|
|
|
||||
|
$
|
(
|
)
|
$
|
|
|
$
|
|
|
||||
|
|
|
|
|
|
|
|
|
|
||||
1
8
8
Blackstone Inc.
Notes to Consolidated Financial Statements—Continued
(All Dollars are in Thousands, Except Share and Per Share Data, Except Where Noted)
As of December 31, 2023, 2022 and 2021, Blackstone had not designated any derivatives as fair value, cash flow or net investment hedges.
7. Fair Value Option
The following table summarizes the financial instruments for which the fair value option has been elected:
|
December 31,
|
||||||||
|
2023
|
2022
|
|||||||
|
Assets
|
||||||||
|
Loans and Receivables
|
$
|
|
|
$
|
|
|
||
|
Equity and Preferred Securities
|
|
|
|
|
|
|
||
|
Debt Securities
|
|
|
|
|
|
|
||
|
Assets of Consolidated CLO Vehicles
|
|
|
|
|
|
|
|
|
|
Corporate Loans
|
|
|
|
|
|
|
||
|
|
|
|
|
|
|
|||
|
$
|
|
|
$
|
|
|
|||
|
|
|
|
|
|
|
|||
|
Liabilities
|
||||||||
|
CLO Notes Payable
|
$
|
|
|
$
|
|
|
||
|
Corporate Treasury Commitments
|
|
|
|
|
|
|
||
|
|
|
|
|
|
|
|||
|
$
|
|
|
$
|
|
|
|||
|
|
|
|
|
|
|
|||
1
89
Blackstone Inc.
Notes to Consolidated Financial Statements—Continued
(All Dollars are in Thousands, Except Share and Per Share Data, Except Where Noted)
The following table presents the Realized and Net Change in Unrealized Gains (Losses) on financial instruments on which the fair value option was elected:
|
Year Ended December 31,
|
||||||||||||||||||||||||
|
2023
|
2022
|
2021
|
||||||||||||||||||||||
|
Net Change
|
Net Change
|
Net Change
|
||||||||||||||||||||||
|
Realized
|
in Unrealized
|
Realized
|
in Unrealized
|
Realized
|
in Unrealized
|
|||||||||||||||||||
|
Gains
|
Gains
|
Gains
|
Gains
|
Gains
|
Gains
|
|||||||||||||||||||
|
(Losses)
|
(Losses)
|
(Losses)
|
(Losses)
|
(Losses)
|
(Losses)
|
|||||||||||||||||||
|
Assets
|
||||||||||||||||||||||||
|
Loans and Receivables
|
$
|
(
|
)
|
$
|
|
|
$
|
(
|
)
|
$
|
(
|
)
|
$
|
(
|
)
|
$
|
|
|
||||||
|
Equity and Preferred Securities
|
|
(
|
)
|
|
(
|
)
|
|
|
|
|
(
|
)
|
|
|
|
|
|
|
||||||
|
Debt Securities
|
|
|
|
|
(
|
)
|
|
(
|
)
|
|
(
|
)
|
|
|
|
|
(
|
)
|
||||||
|
Assets of Consolidated CLO Vehicles
|
||||||||||||||||||||||||
|
Corporate Loans
|
|
(
|
)
|
|
|
|
|
—
|
|
|
—
|
|
|
—
|
|
|
—
|
|
||||||
|
|
|
|
|
|
|
|
|
|
|
|
|
|
|
|
|
|
|
|||||||
|
$
|
(
|
)
|
$
|
(
|
)
|
$
|
(
|
)
|
$
|
(
|
)
|
$
|
|
|
$
|
|
|
|||||||
|
|
|
|
|
|
|
|
|
|
|
|
|
|
|
|
|
|
|
|||||||
|
Liabilities
|
||||||||||||||||||||||||
|
CLO Notes Payable
|
$
|
—
|
|
$
|
|
|
$
|
—
|
|
$
|
—
|
|
$
|
—
|
|
$
|
—
|
|
||||||
|
Corporate Treasury Commitments
|
|
—
|
|
|
|
|
|
—
|
|
|
(
|
)
|
|
—
|
|
|
(
|
)
|
||||||
|
|
|
|
|
|
|
|
|
|
|
|
|
|
|
|
|
|
|
|||||||
|
$
|
—
|
|
$
|
|
|
$
|
—
|
|
$
|
(
|
)
|
$
|
—
|
|
$
|
(
|
)
|
|||||||
|
|
|
|
|
|
|
|
|
|
|
|
|
|
|
|
|
|
|
|||||||
The following table presents information for those financial instruments for which the fair value option was elected:
|
December 31, 2023
|
December 31, 2022
|
|||||||||||||||||||||||
|
For Financial Assets
Past Due (a)
|
For Financial Assets
Past Due (a) |
|||||||||||||||||||||||
|
Excess
|
Excess
|
Excess
|
Excess
|
|||||||||||||||||||||
|
(Deficiency)
|
(Deficiency)
|
(Deficiency)
|
(Deficiency)
|
|||||||||||||||||||||
|
of Fair Value
|
Fair
|
of Fair Value
|
of Fair Value
|
Fair
|
of Fair Value
|
|||||||||||||||||||
|
Over Principal
|
Value
|
Over Principal
|
Over Principal
|
Value
|
Over Principal
|
|||||||||||||||||||
|
Loans and Receivables
|
$
|
|
|
$
|
—
|
|
$
|
—
|
|
$
|
(
|
)
|
$
|
—
|
|
$
|
—
|
|
||||||
|
Debt Securities
|
|
(
|
)
|
|
—
|
|
|
—
|
|
|
(
|
)
|
|
—
|
|
|
—
|
|
||||||
|
Assets of Consolidated CLO Vehicles
|
||||||||||||||||||||||||
|
Corporate Loans
|
|
(
|
)
|
|
|
|
|
—
|
|
|
|
|
|
—
|
|
|
—
|
|
||||||
|
|
|
|
|
|
|
|
|
|
|
|
|
|
|
|
|
|
|
|||||||
|
$
|
(
|
)
|
$
|
|
|
$
|
—
|
|
$
|
(
|
)
|
$
|
—
|
|
$
|
—
|
|
|||||||
|
|
|
|
|
|
|
|
|
|
|
|
|
|
|
|
|
|
|
|||||||
|
(a)
|
Assets are classified as past due if contractual payments are more than 90 days past due.
|
As of December 31, 2023 and 2022,
no
Loans and Receivables for which the fair value option was elected were past due or in non-accrual status. As of December 31, 2023, there were
two
Corporate Loans included within the Assets of Consolidated CLO Vehicles for which the fair value option was elected that were past due but was not in non-accrual status. As of December 31, 2022,
no
Corporate Loans included within the Assets of Consolidated CLO Vehicles for which the fair value option was elected were past due or in non-accrual
status
.
1
0
Blackstone Inc.
Notes to Consolidated Financial Statements—Continued
(All Dollars are in Thousands, Except Share and Per Share Data, Except Where Noted)
8. Fair Value Measurements of Financial Instruments
The following tables summarize the valuation of Blackstone’s financial assets and liabilities by the fair value hierarchy:
|
|
|
December 31, 202
3
|
||||||||||||||||||
|
|
|
Level I
|
|
Level II
|
|
Level III
|
|
NAV
|
|
Total
|
||||||||||
|
Assets
|
|
|
|
|
|
|
|
|
|
|
|
|
|
|
|
|
|
|
|
|
|
Cash and Cash Equivalents
|
$
|
|
|
$
|
—
|
|
$
|
—
|
|
$
|
—
|
|
$
|
|
|
|||||
|
|
|
|
|
|
|
|
|
|
|
|
|
|
|
|
||||||
|
Investments
|
||||||||||||||||||||
|
Investments of Consolidated Blackstone Funds
|
||||||||||||||||||||
|
Equity Securities, Partnerships and LLC Interests (a)
|
|
|
|
|
|
|
|
|
|
|
|
|
|
|
|
|||||
|
Debt Instruments
|
|
—
|
|
|
|
|
|
|
|
|
—
|
|
|
|
|
|||||
|
Freestanding Derivatives
|
|
—
|
|
|
|
|
|
—
|
|
|
—
|
|
|
|
|
|||||
|
|
|
|
|
|
|
|
|
|
|
|
|
|
|
|
||||||
|
Total Investments of Consolidated Blackstone Funds
|
|
|
|
|
|
|
|
|
|
|
|
|
|
|
|
|||||
|
Corporate Treasury Investments
|
|
|
|
|
|
|
|
|
|
|
—
|
|
|
|
|
|||||
|
Other Investments
|
|
|
|
|
|
|
|
|
|
|
|
|
|
|
|
|||||
|
|
|
|
|
|
|
|
|
|
|
|
|
|
|
|
||||||
|
Total Investments
|
|
|
|
|
|
|
|
|
|
|
|
|
|
|
|
|||||
|
|
|
|
|
|
|
|
|
|
|
|
|
|
|
|
||||||
|
Accounts Receivable — Loans and Receivables
|
|
—
|
|
|
—
|
|
|
|
|
|
—
|
|
|
|
|
|||||
|
|
|
|
|
|
|
|
|
|
|
|
|
|
|
|
||||||
|
|
|
|
|
|
|
|
|
|
|
|
—
|
|
|
|
|
|||||
|
|
|
|
|
|
|
|
|
|
|
|
|
|
|
|
||||||
|
$
|
|
|
$
|
|
|
$
|
|
|
$
|
|
|
$
|
|
|
||||||
|
|
|
|
|
|
|
|
|
|
|
|
|
|
|
|
||||||
|
Liabilities
|
||||||||||||||||||||
|
Loans Payable — CLO Notes Payable
|
$
|
—
|
|
$
|
|
|
$
|
—
|
|
$
|
—
|
|
$
|
|
|
|||||
|
|
|
|
|
|
|
|
|
|
|
|
|
|
|
|
||||||
|
Accounts Payable, Accrued Expenses and Other Liabilities
|
||||||||||||||||||||
|
Freestanding Derivatives
|
|
|
|
|
|
|
|
|
|
|
—
|
|
|
|
|
|||||
|
Contingent Consideration
|
|
—
|
|
|
—
|
|
|
|
|
|
—
|
|
|
|
|
|||||
|
Corporate Treasury Commitments
|
|
—
|
|
|
—
|
|
|
|
|
|
—
|
|
|
|
|
|||||
|
Securities Sold, Not Yet Purchased
|
|
|
|
|
—
|
|
|
—
|
|
|
—
|
|
|
|
|
|||||
|
|
|
|
|
|
|
|
|
|
|
|
|
|
|
|
||||||
|
Total Accounts Payable, Accrued Expenses and Other Liabilities
|
|
|
|
|
|
|
|
|
|
|
—
|
|
|
|
|
|||||
|
|
|
|
|
|
|
|
|
|
|
|
|
|
|
|
||||||
|
$
|
|
|
$
|
|
|
$
|
|
|
$
|
—
|
|
$
|
|
|
||||||
|
|
|
|
|
|
|
|
|
|
|
|
|
|
|
|
||||||
19
1
Blackstone Inc.
Notes to Consolidated Financial Statements—Continued
(All Dollars are in Thousands, Except Share and Per Share Data, Except Where Noted)
|
|
|
|
|
December 31, 2022
|
||||||||||||||||||
|
|
|
Level I
|
|
Level II
|
|
Level III
|
|
NAV
|
|
Total
|
||||||||||
|
Assets
|
|
|
|
|
|
|
|
|
|
|
|
|
|
|
|
|
|
|
|
|
|
Cash and Cash Equivalents
|
$
|
|
|
$
|
—
|
|
$
|
—
|
|
$
|
—
|
|
$
|
|
|
|||||
|
|
|
|
|
|
|
|
|
|
|
|
|
|
|
|
||||||
|
Investments
|
||||||||||||||||||||
|
Investments of Consolidated Blackstone Funds
|
||||||||||||||||||||
|
Equity Securities, Partnerships and LLC Interests (a)
|
|
|
|
|
|
|
|
|
|
|
|
|
|
|
|
|||||
|
Debt Instruments
|
|
—
|
|
|
|
|
|
|
|
|
—
|
|
|
|
|
|||||
|
Freestanding Derivatives
|
|
—
|
|
|
|
|
|
—
|
|
|
—
|
|
|
|
|
|||||
|
|
|
|
|
|
|
|
|
|
|
|
|
|
|
|
||||||
|
Total Investments of Consolidated Blackstone Funds
|
|
|
|
|
|
|
|
|
|
|
|
|
|
|
|
|||||
|
Corporate Treasury Investments
|
|
|
|
|
|
|
|
|
|
|
—
|
|
|
|
|
|||||
|
Other Investments
|
|
|
|
|
|
|
|
|
|
|
|
|
|
|
|
|||||
|
|
|
|
|
|
|
|
|
|
|
|
|
|
|
|
||||||
|
Total Investments
|
|
|
|
|
|
|
|
|
|
|
|
|
|
|
|
|||||
|
|
|
|
|
|
|
|
|
|
|
|
|
|
|
|
||||||
|
Accounts Receivable — Loans and Receivables
|
|
—
|
|
|
—
|
|
|
|
|
|
—
|
|
|
|
|
|||||
|
|
|
|
|
|
|
|
|
|
|
|
|
|
|
|
||||||
|
|
|
|
|
|
|
|
|
|
|
|
—
|
|
|
|
|
|||||
|
|
|
|
|
|
|
|
|
|
|
|
|
|
|
|
||||||
|
$
|
|
|
$
|
|
|
$
|
|
|
$
|
|
|
$
|
|
|
||||||
|
|
|
|
|
|
|
|
|
|
|
|
|
|
|
|
||||||
|
Liabilities
|
||||||||||||||||||||
|
Accounts Payable, Accrued Expenses and Other Liabilities
|
||||||||||||||||||||
|
Consolidated Blackstone Funds — Freestanding Derivatives
|
$
|
—
|
|
$
|
|
|
$
|
—
|
|
$
|
—
|
|
$
|
|
|
|||||
|
Freestanding Derivatives
|
|
|
|
|
|
|
|
|
|
|
—
|
|
|
|
|
|||||
|
Corporate Treasury Commitments
|
|
—
|
|
|
—
|
|
|
|
|
|
—
|
|
|
|
|
|||||
|
Securities Sold, Not Yet Purchased
|
|
|
|
|
—
|
|
|
—
|
|
|
—
|
|
|
|
|
|||||
|
|
|
|
|
|
|
|
|
|
|
|
|
|
|
|
||||||
|
Total Accounts Payable, Accrued Expenses and Other Liabilities
|
|
|
|
|
|
|
|
|
|
|
—
|
|
|
|
|
|||||
|
|
|
|
|
|
|
|
|
|
|
|
|
|
|
|
||||||
|
$
|
|
|
$
|
|
|
$
|
|
|
$
|
—
|
|
$
|
|
|
||||||
|
|
|
|
|
|
|
|
|
|
|
|
|
|
|
|
||||||
LLC Limited Liability Company.
|
(a)
|
Equity Securities, Partnership and LLC Interest includes investments in investment funds.
|
19
2
Blackstone Inc.
Notes to Consolidated Financial Statements—Continued
(All Dollars are in Thousands, Except Share and Per Share Data, Except Where Noted)
The following table summarizes the quantitative inputs and assumptions used for items categorized in Level III of the fair value hierarchy as of December 31, 2023. Consistent with presentation in these Notes to Consolidated Financial Statements, this table presents the Level III Investments only of Consolidated Blackstone Funds and therefore does not reflect any other Blackstone Funds.
|
Impact to
|
||||||||||||||||||
|
Valuation
|
||||||||||||||||||
|
from an
|
||||||||||||||||||
|
Valuation
|
Unobservable
|
Weighted-
|
Increase
|
|||||||||||||||
|
Fair Value
|
Techniques
|
Inputs
|
Ranges
|
Average (a)
|
in Input
|
|||||||||||||
|
Financial Assets
|
||||||||||||||||||
|
Investments of Consolidated Blackstone Funds
|
||||||||||||||||||
|
Equity Securities, Partnership and LLC Interests
|
$
|
|
|
|
Discounted Cash Flows
|
|
|
Discount Rate
|
|
|
|
Lower
|
||||||
|
|
Exit Multiple - EBITDA
|
|
|
|
Higher
|
|||||||||||||
|
|
Exit Capitalization Rate
|
|
|
|
Lower
|
|||||||||||||
|
Debt Instruments
|
|
|
|
|
Third Party Pricing
|
|
|
n/a
|
|
|||||||||
|
|
|
|
||||||||||||||||
|
Total Investments of Consolidated Blackstone Funds
|
|
|
|
|||||||||||||||
|
Corporate Treasury Investments
|
|
|
|
|
Discounted Cash Flows
|
|
|
Discount Rate
|
|
|
|
Lower
|
||||||
|
|
Transaction Price
|
|
|
n/a
|
|
|||||||||||||
|
Loans and Receivables
|
|
|
|
|
Discounted Cash Flows
|
|
|
Discount Rate
|
|
|
|
Lower
|
||||||
|
Other Investments (b)
|
|
|
|
|
Third Party Pricing
|
|
|
n/a
|
|
|||||||||
|
|
Transaction Price
|
|
|
n/a
|
|
|||||||||||||
|
|
|
|
||||||||||||||||
|
$
|
|
|
||||||||||||||||
|
|
|
|
||||||||||||||||
|
Financial Liabilities
|
||||||||||||||||||
|
Freestanding Derivatives (c)
|
$
|
|
|
|
Option Pricing Model
|
|
|
Volatility
|
|
|
n/a
|
Higher
|
||||||
|
Other Liabilities (d)
|
|
|
|
|
Third Party Pricing
|
|
|
n/a
|
|
|||||||||
|
|
Other
|
|
|
n/a
|
|
|||||||||||||
|
|
|
|
||||||||||||||||
|
$
|
|
|
||||||||||||||||
|
|
|
|
||||||||||||||||
19
3
Blackstone Inc.
Notes to Consolidated Financial Statements—Continued
(All Dollars are in Thousands, Except Share and Per Share Data, Except Where Noted)
The following table summarizes the quantitative inputs and assumptions used for items categorized in Level III of the fair value hierarchy as of December 31, 2022:
|
Impact to
|
||||||||||||||||||
|
Valuation
|
||||||||||||||||||
|
from an
|
||||||||||||||||||
|
Valuation
|
Unobservable
|
Weighted-
|
Increase
|
|||||||||||||||
|
Fair Value
|
Techniques
|
Inputs
|
Ranges
|
Average (a)
|
in Input
|
|||||||||||||
|
Financial Assets
|
||||||||||||||||||
|
Investments of Consolidated Blackstone Funds
|
||||||||||||||||||
|
Equity Securities, Partnership and LLC Interests
|
$
|
|
|
|
Discounted Cash Flows
|
|
|
Discount Rate
|
|
|
|
Lower
|
||||||
|
|
Exit Multiple - EBITDA
|
|
|
|
Higher
|
|||||||||||||
|
|
Exit Capitalization Rate
|
|
|
|
Lower
|
|||||||||||||
|
|
Transaction Price
|
|
|
n/a
|
|
|||||||||||||
|
Debt Instruments
|
|
|
|
|
Transaction Price
|
|
|
n/a
|
|
|||||||||
|
|
Third Party Pricing
|
|
|
n/a
|
|
|||||||||||||
|
|
|
|
||||||||||||||||
|
Total Investments of Consolidated Blackstone Funds
|
|
|
|
|||||||||||||||
|
Corporate Treasury Investments
|
|
|
|
|
Third Party Pricing
|
|
|
n/a
|
|
|||||||||
|
Loans and Receivables
|
|
|
|
|
Discounted Cash Flows
|
|
|
Discount Rate
|
|
|
|
Lower
|
||||||
|
Other Investments (b)
|
|
|
|
|
Transaction Price
|
|
|
n/a
|
|
|||||||||
|
|
Third Party Pricing
|
|
|
n/a
|
|
|||||||||||||
|
|
|
|
||||||||||||||||
|
$
|
|
|
||||||||||||||||
|
|
|
|
||||||||||||||||
|
Financial Liabilities
|
||||||||||||||||||
|
Freestanding Derivatives (c)
|
$
|
|
|
|
Option Pricing Model
|
|
|
Volatility
|
|
|
n/a
|
Higher
|
||||||
|
Other Liabilities (d)
|
|
|
|
|
Third Party Pricing
|
|
|
n/a
|
|
|||||||||
|
|
|
|
||||||||||||||||
|
$
|
|
|
||||||||||||||||
|
|
|
|
||||||||||||||||
|
n/a
|
Not applicable.
|
|
|
EBITDA
|
Earnings before interest, taxes, depreciation and amortization.
|
|
|
Exit Multiple
|
Ranges include the last twelve months EBITDA and forward EBITDA multiples.
|
|
|
Third Party Pricing
|
Third Party Pricing is generally determined on the basis of unadjusted prices between market participants provided by reputable dealers or pricing services.
|
|
|
Transaction Price
|
Includes recent acquisitions or transactions.
|
|
|
(a)
|
Unobservable inputs were weighted based on the fair value of the investments included in the range.
|
|
|
(b)
|
As of December 31, 2023 and 2022, Other Investments includes Level III Freestanding Derivatives.
|
|
|
(c)
|
The volatility of the historical performance of the underlying reference entity is used to project the expected returns relevant for the fair value of the derivative.
|
|
|
(d)
|
As of December 31, 2023, Other Liabilities includes Level III Contingent Consideration and Level III Corporate Treasury Commitments. As of December 31, 2022, Other Liabilities is comprised only of Level III Corporate Treasury Commitments.
|
19
4
Blackstone Inc.
Notes to Consolidated Financial Statements—Continued
(All Dollars are in Thousands, Except Share and Per Share Data, Except Where Noted)
During the year ended December 31, 2023, there have been no changes in valuation techniques within Level II and Level III that have had a material impact on the valuation of financial instruments.
The following tables summarize the changes in financial assets and liabilities measured at fair value for which Blackstone has used Level III inputs to determine fair value and does not include gains or losses that were reported in Level III in prior years or for instruments that were transferred out of Level III prior to the end of the respective reporting period. These tables also exclude financial assets and liabilities measured at fair value on a non-recurring basis. Total realized and unrealized gains and losses recorded for Level III investments are reported in either Investment Income (Loss) or Net Gains (Losses) from Fund Investment Activities in the Consolidated Statements of Operations.
|
Level III Financial Assets at Fair Value
|
||||||||||||||||||||||||||||||||
|
Year Ended December 31,
|
||||||||||||||||||||||||||||||||
|
2023
|
2022
|
|||||||||||||||||||||||||||||||
|
Investments of
Consolidated Funds |
Loans
and
Receivables
|
Other
Investments (a) |
Total
|
Investments of
Consolidated Funds |
Loans
and
Receivables
|
Other
Investments (a) |
Total
|
|||||||||||||||||||||||||
|
Balance, Beginning of Period
|
$
|
|
|
$
|
|
|
$
|
|
|
$
|
|
|
$
|
|
|
$
|
|
|
$
|
|
|
$
|
|
|
||||||||
|
Transfer In Due to Consolidation and Acquisition
|
|
—
|
|
|
—
|
|
|
—
|
|
|
—
|
|
|
|
|
|
—
|
|
|
—
|
|
|
|
|
||||||||
|
Transfer Out Due to Deconsolidation
|
|
(
|
)
|
|
—
|
|
|
—
|
|
|
(
|
)
|
|
—
|
|
|
—
|
|
|
—
|
|
|
—
|
|
||||||||
|
Transfer In to Level III (b)
|
|
|
|
|
—
|
|
|
|
|
|
|
|
|
|
|
|
—
|
|
|
|
|
|
|
|
||||||||
|
Transfer Out of Level III (b)
|
|
(
|
)
|
|
—
|
|
|
(
|
)
|
|
(
|
)
|
|
(
|
)
|
|
—
|
|
|
(
|
)
|
|
(
|
)
|
||||||||
|
Purchases
|
|
|
|
|
|
|
|
|
|
|
|
|
|
|
|
|
|
|
|
|
|
|
|
|
||||||||
|
Sales
|
|
(
|
)
|
|
(
|
)
|
|
(
|
)
|
|
(
|
)
|
|
(
|
)
|
|
(
|
)
|
|
(
|
)
|
|
(
|
)
|
||||||||
|
Issuances
|
|
—
|
|
|
|
|
|
—
|
|
|
|
|
|
—
|
|
|
|
|
|
—
|
|
|
|
|
||||||||
|
Settlements (c)
|
|
—
|
|
|
(
|
)
|
|
(
|
)
|
|
(
|
)
|
|
—
|
|
|
(
|
)
|
|
(
|
)
|
|
(
|
)
|
||||||||
|
Changes in Gains (Losses) Included in Earnings
|
|
(
|
)
|
|
|
|
|
|
|
|
(
|
)
|
|
(
|
)
|
|
|
|
|
(
|
)
|
|
(
|
)
|
||||||||
|
|
|
|
|
|
|
|
|
|
|
|
|
|
|
|
|
|
|
|
|
|
|
|
|
|||||||||
|
Balance, End of Period
|
$
|
|
|
$
|
|
|
$
|
|
|
$
|
|
|
$
|
|
|
$
|
|
|
$
|
|
|
$
|
|
|
||||||||
|
|
|
|
|
|
|
|
|
|
|
|
|
|
|
|
|
|
|
|
|
|
|
|
|
|||||||||
|
|
$
|
(
|
)
|
$
|
|
|
$
|
|
|
$
|
(
|
)
|
$
|
(
|
)
|
$
|
(
|
)
|
$
|
(
|
)
|
$
|
(
|
)
|
||||||||
|
|
|
|
|
|
|
|
|
|
|
|
|
|
|
|
|
|
|
|
|
|
|
|
|
|||||||||
|
Level III Financial Liabilities at Fair Value
|
||||||||||||||||||||||||
|
Year Ended December 31,
|
||||||||||||||||||||||||
|
2023
|
2022
|
|||||||||||||||||||||||
|
Freestanding
Derivatives |
Other
Liabilities (d) |
Total
|
Freestanding
Derivatives |
Other
Liabilities (d) |
Total
|
|||||||||||||||||||
|
Balance, Beginning of Period
|
$
|
|
|
$
|
|
|
$
|
|
|
$
|
—
|
|
$
|
|
|
$
|
|
|
||||||
|
Transfer In Due to Consolidation and Acquisition
|
|
—
|
|
|
|
|
|
|
|
|
—
|
|
|
—
|
|
|
—
|
|
||||||
|
Sales
|
|
—
|
|
|
(
|
)
|
|
(
|
)
|
|
—
|
|
|
—
|
|
|
—
|
|
||||||
|
Changes in Losses (Gains) Included in Earnings
|
|
|
|
|
(
|
)
|
|
|
|
|
|
|
|
|
|
|
|
|
||||||
|
|
|
|
|
|
|
|
|
|
|
|
|
|
|
|
|
|
|
|||||||
|
Balance, End of Period
|
$
|
|
|
$
|
|
|
$
|
|
|
$
|
|
|
$
|
|
|
$
|
|
|
||||||
|
|
|
|
|
|
|
|
|
|
|
|
|
|
|
|
|
|
|
|||||||
|
Changes in Unrealized Losses (Gains) Included in Earnings Related to Financial Liabilities Still Held at the Reporting Date
|
$
|
|
|
$
|
(
|
)
|
$
|
|
|
$
|
|
|
$
|
|
|
$
|
|
|
||||||
|
|
|
|
|
|
|
|
|
|
|
|
|
|
|
|
|
|
|
|||||||
|
(a)
|
Represents freestanding derivatives, corporate treasury investments and Other Investments.
|
5
Blackstone Inc.
Notes to Consolidated Financial Statements—Continued
(All Dollars are in Thousands, Except Share and Per Share Data, Except Where Noted)
|
(b)
|
Transfers in and out of Level III financial assets and liabilities were due to changes in the observability of inputs used in the valuation of such assets and liabilities.
|
|
(c)
|
For Freestanding Derivatives included within Other Investments, Settlements includes all ongoing contractual cash payments made or received over the life of the instrument.
|
|
(d)
|
As of December 31, 2023, Other Liabilities includes Level III Contingent Consideration and Level III Corporate Treasury Commitments. As of December 31, 2022, Other Liabilities is comprised only of Level III Corporate Treasury Commitments.
|
|
9.
|
Variable Interest Entities
|
Pursuant to GAAP consolidation guidance, Blackstone consolidates certain VIEs for which it is the primary beneficiary either directly or indirectly, through a consolidated entity or affiliate. VIEs include certain private equity, real estate, credit-focused or funds of hedge funds entities and CLO vehicles. The purpose of such VIEs is to provide strategy specific investment opportunities for investors in exchange for management and performance-based fees. The investment strategies of the Blackstone Funds differ by product; however, the fundamental risks of the Blackstone Funds are similar, including loss of invested capital and loss of management fees and performance-based fees. In Blackstone’s role as general partner, collateral manager or investment adviser, it generally considers itself the sponsor of the applicable Blackstone Fund. Blackstone does not provide performance guarantees and has no other financial obligation to provide funding to consolidated VIEs other than its own capital commitments.
The assets of consolidated variable interest entities may only be used to settle obligations of these entities. In addition, there is no recourse to Blackstone for the consolidated VIEs’ liabilities.
Blackstone holds variable interests in certain VIEs which are not consolidated as it is determined that Blackstone is not the primary beneficiary. Blackstone’s involvement with such entities is in the form of direct and indirect equity interests and fee arrangements. The maximum exposure to loss represents the loss of assets recognized by Blackstone relating to non-consolidated VIEs and any clawback obligation relating to previously distributed Performance Allocations.
Blackstone’s maximum exposure to loss relating to non-consolidated VIEs were as follows:
|
December 31,
2023 |
December 31,
2022 |
|||||||
|
Investments
|
$
|
|
|
$
|
|
|
||
|
Due from Affiliates
|
|
|
|
|
|
|
||
|
Potential Clawback Obligation
|
|
|
|
|
|
|
||
|
|
|
|
|
|
|
|||
|
Maximum Exposure to Loss
|
$
|
|
|
$
|
|
|
||
|
|
|
|
|
|
|
|||
|
Amounts Due to Non-Consolidated VIEs
|
$
|
|
|
$
|
|
|
||
|
|
|
|
|
|
|
|||
|
10.
|
Repurchase Agreements
|
At December 31, 2023, Blackstone had
no
Repurchase Agreements and hence no pledged securities or cash. At December 31, 2022, Blackstone pledged securities with a carrying value of $
89.9
million and cash to collateralize its repurchase agreements. Such securities can be repledged, delivered or otherwise used by the counterparty.
6
Blackstone Inc.
Notes to Consolidated Financial Statements—Continued
(All Dollars are in Thousands, Except Share and Per Share Data, Except Where Noted)
The following table provides information regarding Blackstone’s Repurchase Agreements obligation by type of collateral pledged as of December 31, 2022. At December 31, 2023, Blackstone had no Repurchase Agreements and hence no collateral outstanding.
|
December 31, 2022
|
||||||||||||||||||||
|
Remaining Contractual Maturity of the Agreements
|
||||||||||||||||||||
|
Overnight and
Continuous |
Up to
30 Days |
30 - 90
Days |
Greater than
90 days |
Total
|
||||||||||||||||
|
Repurchase Agreements
|
||||||||||||||||||||
|
Loans
|
|
|
|
|
|
|
|
|
|
|
|
|
|
|
|
|||||
|
Gross Amount of Recognized Liabilities for Repurchase Agreements in Note 12. “Offsetting of Assets and Liabilities”
|
|
$
|
|
|
||||||||||||||||
|
|
|
|
||||||||||||||||||
|
Amounts Related to Agreements Not Included in Offsetting Disclosure in Note 12. “Offsetting of Assets and Liabilities”
|
|
$
|
|
|
||||||||||||||||
|
|
|
|
||||||||||||||||||
|
11.
|
Other Assets
|
Other Assets consists of the following:
|
December 31,
|
||||||||
|
2023
|
2022
|
|||||||
|
Furniture, Equipment and Leasehold Improvements
|
$
|
|
|
$
|
|
|
||
|
Less: Accumulated Depreciation
|
|
(
|
)
|
|
(
|
)
|
||
|
|
|
|
|
|
|
|||
|
Furniture, Equipment and Leasehold Improvements, Net
|
|
|
|
|
|
|
||
|
Prepaid Expenses
|
|
|
|
|
|
|
||
|
Freestanding Derivatives
|
|
|
|
|
|
|
||
|
Other
|
|
|
|
|
|
|
||
|
|
|
|
|
|
|
|||
|
$
|
|
|
$
|
|
|
|||
|
|
|
|
|
|
|
|||
Depreciation expense of $
94.1
million, $
69.2
million and $
52.2
million related to furniture, equipment and leasehold improvements for the years ended December 31, 2023, 2022 and 2021, respectively, is included in General, Administrative and Other in the Consolidated Statements of Operations.
|
12.
|
Offsetting of Assets and Liabilities
|
The following tables present the offsetting of assets and liabilities as of December 31, 2023 and 2022:
|
December 31, 2023
|
||||||||||||||||
|
Gross and Net
Amounts of Assets
Presented in the Statement of Financial Condition |
Gross Amounts Not Offset in
the Statement of
Financial Condition
|
|||||||||||||||
|
Financial
Instruments (a) |
Cash Collateral
Received |
Net
Amount |
||||||||||||||
|
Assets
|
||||||||||||||||
|
Freestanding Derivatives
|
$
|
|
|
$
|
|
|
$
|
|
|
$
|
|
|
||||
|
|
|
|
|
|
|
|
|
|
|
|
|
|||||
|
|
7
Blackstone Inc.
Notes to Consolidated Financial Statements—Continued
(All Dollars are in Thousands, Except Share and Per Share Data, Except Where Noted)
|
December 31, 2023
|
||||||||||||||||
|
Gross and Net
Amounts of Liabilities Presented in the Statement of
Financial Condition
|
Gross Amounts Not Offset in
the Statement of
Financial Condition
|
|||||||||||||||
|
Financial
Instruments (a) |
Cash Collateral
Pledged |
Net
Amount |
||||||||||||||
|
Liabilities
|
||||||||||||||||
|
Freestanding Derivatives
|
$
|
|
|
$
|
|
|
$
|
|
|
$
|
|
|
||||
|
|
|
|
|
|
|
|
|
|
|
|
|
|||||
|
December 31, 2022
|
||||||||||||||||
|
Gross and Net
Amounts of Assets Presented in the Statement of Financial Condition |
Gross Amounts Not Offset in
the Statement of
Financial Condition
|
|||||||||||||||
|
Financial
Instruments (a) |
Cash Collateral
Received |
Net
Amount |
||||||||||||||
|
Assets
|
||||||||||||||||
|
Freestanding Derivatives
|
$
|
|
|
$
|
|
|
$
|
|
|
$
|
|
|
||||
|
|
|
|
|
|
|
|
|
|
|
|
|
|||||
|
December 31, 2022
|
||||||||||||||||
|
Gross and Net
Amounts of Liabilities Presented in the Statement of
Financial Condition
|
Gross Amounts Not Offset in
the Statement of
Financial Condition
|
Net
Amount |
||||||||||||||
|
Financial
Instruments (a) |
Cash Collateral
Pledged |
|||||||||||||||
|
Liabilities
|
||||||||||||||||
|
Freestanding Derivatives
|
$
|
|
|
$
|
|
|
$
|
|
|
$
|
|
|
||||
|
Repurchase Agreements
|
|
|
|
|
|
|
|
|
|
|
|
|
||||
|
|
|
|
|
|
|
|
|
|
|
|
|
|||||
|
$
|
|
|
$
|
|
|
$
|
|
|
$
|
|
|
|||||
|
|
|
|
|
|
|
|
|
|
|
|
|
|||||
|
(a)
|
Amounts presented are inclusive of both legally enforceable master netting agreements, and financial instruments received or pledged as collateral. Financial instruments received or pledged as collateral offset derivative counterparty risk exposure, but do not reduce net balance sheet exposure.
|
Repurchase Agreements and Freestanding Derivative liabilities are included in Accounts Payable, Accrued Expenses and Other Liabilities in the Consolidated Statements of Financial Condition. Freestanding Derivative assets are included in Other Assets in the Consolidated Statements of Financial Condition. See Note 11. “Other Assets” for the components of Other Assets.
19
8
B
lackstone Inc.
Notes to Consolidated Financial Statements—Continued
(All Dollars are in Thousands, Except Share and Per Share Data, Except Where Noted)
Notional Pooling Arrangements
Blackstone has notional cash pooling arrangements with financial institutions for cash management purposes. These arrangements allow for cash withdrawals based upon aggregate cash balances on deposit at the same financial institution. Cash withdrawals cannot exceed aggregate cash balances on deposit. The net balance of cash on deposit and overdrafts is used as a basis for calculating net interest expense or income. As of December 31, 2023, the aggregate cash balance on deposit relating to the cash pooling arrangements was $
870.4
million, which was offset and reported net of the accompanying overdraft of $
870.4
million.
|
13.
|
Borrowings
|
On December 15, 2023, Blackstone, through its indirect subsidiary Blackstone Holdings Finance Co. L.L.C (the “Issuer”), entered into an amended and restated $
4.325
billion revolving credit facility with Citibank, N.A., as administrative agent, and the lenders party thereto. The amendment and restatement, among other things, increased the amount of available borrowings from $
4.135
billion to $
4.325
billion and extended the maturity date from
June 3, 2027
to
December 15, 2028
.
All of Blackstone’s outstanding senior notes as of December 31, 2023 are unsecured and unsubordinated obligations of the Issuer that are fully and unconditionally guaranteed by Blackstone Inc. and its indirect subsidiaries, Blackstone Holdings I L.P., Blackstone Holdings AI L.P., Blackstone Holdings II L.P., Blackstone Holdings III L.P. and Blackstone Holdings IV L.P. (the “Guarantors”). The guarantees are unsecured and unsubordinated obligations of the Guarantors. Transaction costs related to senior note issuances have been capitalized and are amortized over the life of each respective note.
199
Blackstone Inc.
Notes to Consolidated Financial Statements—Continued
(All Dollars are in Thousands, Except Share and Per Share Data, Except Where Noted)
Blackstone borrows and enters into credit agreements for its general operating and investment purposes and certain Blackstone Funds borrow to meet financing needs of their operating and investing activities. Borrowing facilities have been established for the benefit of selected Blackstone Funds. When a Blackstone Fund borrows from the facility in which it participates, the proceeds from the borrowing are strictly limited for its intended use by the borrowing fund and not available for other Blackstone purposes. Blackstone’s credit facilities consist of the following:
|
|
|
December 31,
|
||||||||||||||||||||||
|
|
|
2023
|
|
2022
|
||||||||||||||||||||
|
|
|
Credit
Available |
|
Borrowing
Outstanding |
|
Effective
Interest Rate |
|
Credit
Available |
|
Borrowing
Outstanding |
|
Effective
Interest Rate |
||||||||||||
|
Revolving Credit Facility (a)
|
$
|
|
|
$
|
|
|
|
|
|
$
|
|
|
$
|
|
|
|
|
|
||||||
|
Blackstone Issued Senior Notes (b)
|
||||||||||||||||||||||||
|
|
|
|
|
|
|
|
|
|
|
|
|
|
|
|
|
|
|
%
|
||||||
|
|
|
|
|
|
|
|
|
|
%
|
|
|
|
|
|
|
|
|
%
|
||||||
|
|
|
|
|
|
|
|
|
|
%
|
|
|
|
|
|
|
|
|
%
|
||||||
|
|
|
|
|
|
|
|
|
|
%
|
|
|
|
|
|
|
|
|
%
|
||||||
|
|
|
|
|
|
|
|
|
|
%
|
|
|
|
|
|
|
|
|
%
|
||||||
|
|
|
|
|
|
|
|
|
|
%
|
|
|
|
|
|
|
|
|
%
|
||||||
|
|
|
|
|
|
|
|
|
|
%
|
|
|
|
|
|
|
|
|
%
|
||||||
|
|
|
|
|
|
|
|
|
|
%
|
|
|
|
|
|
|
|
|
%
|
||||||
|
|
|
|
|
|
|
|
|
|
%
|
|
|
|
|
|
|
|
|
%
|
||||||
|
|
|
|
|
|
|
|
|
|
%
|
|
|
|
|
|
|
|
|
%
|
||||||
|
|
|
|
|
|
|
|
|
|
%
|
|
|
|
|
|
|
|
|
%
|
||||||
|
|
|
|
|
|
|
|
|
|
%
|
|
|
|
|
|
|
|
|
%
|
||||||
|
|
|
|
|
|
|
|
|
|
%
|
|
|
|
|
|
|
|
|
%
|
||||||
|
|
|
|
|
|
|
|
|
|
%
|
|
|
|
|
|
|
|
|
%
|
||||||
|
|
|
|
|
|
|
|
|
|
%
|
|
|
|
|
|
|
|
|
%
|
||||||
|
|
|
|
|
|
|
|
|
|
%
|
|
|
|
|
|
|
|
|
%
|
||||||
|
|
|
|
|
|
|
|
|
|
%
|
|
|
|
|
|
|
|
|
%
|
||||||
|
|
|
|
|
|
|
|
|
|
%
|
|
|
|
|
|
|
|
|
%
|
||||||
|
|
|
|
|
|
|
|
|
|
%
|
|
|
|
|
|
|
|
|
%
|
||||||
|
|
|
|
|
|
|
|
|
|
%
|
|
|
|
|
|
|
|
|
%
|
||||||
|
|
|
|
|
|
|
|
|
|
%
|
|
|
|
|
|
|
|
|
%
|
||||||
|
|
|
|
|
|
|
|
|
|
|
|
|
|||||||||||||
|
|
|
|
|
|
|
|
|
|
|
|
|
|||||||||||||
|
Other (c)
|
||||||||||||||||||||||||
|
Secured Borrowing, Due
|
|
|
|
|
|
|
|
|
%
|
|
|
|
|
|
|
|
|
|
||||||
|
Secured Borrowing, Due
|
|
|
|
|
|
|
|
|
%
|
|
|
|
|
|
|
|
|
|
||||||
|
|
|
|
|
|
|
|
|
|
|
|
|
|||||||||||||
|
|
|
|
|
|
|
|
|
|
|
|
|
|||||||||||||
|
|
|
|
|
|
|
|
|
|
|
|
|
|||||||||||||
|
Borrowings of Consolidated Blackstone Funds
|
||||||||||||||||||||||||
|
Blackstone Fund Facilities (d)
|
|
|
|
|
|
|
|
|
|
|
|
|
|
|
|
|
|
|
||||||
|
CLO Notes Payable (e)
|
|
|
|
|
|
|
|
|
%
|
|
|
|
|
|
|
|
|
|
||||||
|
|
|
|
|
|
|
|
|
|
|
|
|
|||||||||||||
|
|
|
|
|
|
|
|
|
|
|
|
|
|||||||||||||
|
|
|
|
|
|
|
|
|
|
|
|
|
|||||||||||||
|
$
|
|
|
$
|
|
|
$
|
|
|
$
|
|
|
|||||||||||||
|
|
|
|
|
|
|
|
|
|
|
|
|
|||||||||||||
|
(a)
|
Represents the Credit Facility of Blackstone, through the Issuer. Interest on the borrowings is based on an adjusted Secured Overnight Finance Rate (“SOFR”) or alternate base rate, in each case plus a margin, and undrawn commitments bear a commitment fee
|
0
Blackstone Inc.
Notes to Consolidated Financial Statements—Continued
(All Dollars are in Thousands, Except Share and Per Share Data, Except Where Noted)
|
of
|
|
(b)
|
The Issuer has issued long-term borrowings in the form of senior notes (the “Notes”). The Notes are unsecured and unsubordinated obligations of the Issuer. The Notes are fully and unconditionally guaranteed, jointly and severally, by Blackstone, the Guarantors and the Issuer. The guarantees are unsecured and unsubordinated obligations of the Guarantors. Transaction costs related to the issuance of the Notes have been deducted from the Note liability and are being amortized over the life of the Notes. The indentures include covenants, including limitations on the Issuer’s and the Guarantors’ ability to, subject to exceptions, incur indebtedness secured by liens on voting stock or profit participating equity interests of their subsidiaries or merge, consolidate or sell, transfer or lease assets. The indentures also provide for events of default and further provide that the trustee or the holders of not less than
|
|
(c)
|
Principal on the Secured Borrowings will be paid over the term with repayment amounts dependent on the performance of the underlying assets securing each borrowing. Repayment amounts from the underlying assets are restricted to solely satisfy the Secured Borrowings obligations. As of December 31, 2023, the fair value of the assets securing both Secured Borrowings equaled $
|
|
(d)
|
Represents borrowing facilities for the various consolidated Blackstone Funds used to meet liquidity and investing needs. Certain borrowings under these facilities were used for bridge financing and general liquidity purposes. Other borrowings were used to finance the purchase of investments with the borrowing remaining in place until the disposition or refinancing event. Such borrowings have varying maturities and may be rolled over until the disposition or refinancing event. Because the timing of such events is unknown and may occur in the near term, these borrowings are considered short-term in nature. Borrowings bear interest at spreads to market rates or at stated fixed rates that can vary over the borrowing term. Interest may be subject to the performance of the asset and therefore, the stated interest rate and effective interest rate may differ. Borrowings were secured according to the terms of each facility and are generally secured by the investment purchased with the proceeds of the borrowing and/or the uncalled capital commitment of each respective fund. Certain facilities have commitment fees. When a fund borrows, the proceeds are available only for use by that fund and are not available for the benefit of other funds. Collateral within each fund is also available only against the borrowings by that fund and not against the borrowings of other funds. These funds have been deconsolidated as of December 31, 2023.
|
|
(e)
|
CLO Notes Payable have maturity dates ranging from June 2025 to January 2037. A portion of the borrowing outstanding is comprised of subordinated notes which do not have contractual interest rates but instead pay distributions from the excess cash flows of the CLO vehicles.
|
1
B
lackstone Inc.
Notes to Consolidated Financial Statements—Continued
(All Dollars are in Thousands, Except Share and Per Share Data, Except Where Noted)
The following table presents the general characteristics of each of Blackstone’s notes, as well as their carrying value and fair value. The borrowings are included in Loans Payable within the Consolidated Statements of Financial Condition. Each of the Senior Notes were issued at a discount through Blackstone’s indirect subsidiary, Blackstone Holdings Finance Co. L.L.C. The Senior Notes accrue interest from the issue date thereof and pay interest in arrears on a
semi-annual
basis or annual basis. The Secured Borrowings were issued at par, accrue interest from the issue date thereof and pay interest in arrears on a quarterly basis. CLO Notes Payable pay interest in arrears on a quarterly basis.
2
Blackstone Inc.
Notes to Consolidated Financial Statements—Continued
(All Dollars are in Thousands, Except Share and Per Share Data, Except Where Noted)
|
|
|
December 31,
|
||||||||||||||
|
|
|
2023
|
|
2022
|
||||||||||||
|
Description
|
|
Carrying
Value
|
|
Fair Value
|
|
Carrying
Value
|
|
Fair Value
|
||||||||
|
Blackstone Operating Borrowings
|
|
|
|
|
|
|
|
|
|
|
|
|
|
|
|
|
|
Senior Notes (a)
|
||||||||||||||||
|
|
$
|
|
|
$
|
|
|
$
|
|
|
$
|
|
|
||||
|
|
|
|
|
|
|
|
|
|
|
|
|
|
||||
|
|
|
|
|
|
|
|
|
|
|
|
|
|
||||
|
|
|
|
|
|
|
|
|
|
|
|
|
|
||||
|
|
|
|
|
|
|
|
|
|
|
|
|
|
||||
|
|
|
|
|
|
|
|
|
|
|
|
|
|
||||
|
|
|
|
|
|
|
|
|
|
|
|
|
|
||||
|
|
|
|
|
|
|
|
|
|
|
|
|
|
||||
|
|
|
|
|
|
|
|
|
|
|
|
|
|
||||
|
|
|
|
|
|
|
|
|
|
|
|
|
|
||||
|
|
|
|
|
|
|
|
|
|
|
|
|
|
||||
|
|
|
|
|
|
|
|
|
|
|
|
|
|
||||
|
|
|
|
|
|
|
|
|
|
|
|
|
|
||||
|
|
|
|
|
|
|
|
|
|
|
|
|
|
||||
|
|
|
|
|
|
|
|
|
|
|
|
|
|
||||
|
|
|
|
|
|
|
|
|
|
|
|
|
|
||||
|
|
|
|
|
|
|
|
|
|
|
|
|
|
||||
|
|
|
|
|
|
|
|
|
|
|
|
|
|
||||
|
|
|
|
|
|
|
|
|
|
|
|
|
|
||||
|
|
|
|
|
|
|
|
|
|
|
|
|
|
||||
|
|
|
|
|
|
|
|
|
|
|
|
|
|
||||
|
|
|
|
|
|
|
|
|
|
|
|
|
|||||
|
|
|
|
|
|
|
|
|
|
|
|
|
|||||
|
Other
|
||||||||||||||||
|
Secured Borrowing, Due
|
|
|
|
|
|
|
|
|
|
|
|
|
||||
|
Secured Borrowing, Due
|
|
|
|
|
|
|
|
|
|
|
|
|
||||
|
|
|
|
|
|
|
|
|
|
|
|
|
|||||
|
|
|
|
|
|
|
|
|
|
|
|
|
|||||
|
|
|
|
|
|
|
|
|
|
|
|
|
|||||
|
Borrowings of Consolidated Blackstone Funds
|
||||||||||||||||
|
Blackstone Fund Facilities
|
|
|
|
|
|
|
|
|
|
|
|
|
||||
|
CLO Notes Payable
|
|
|
|
|
|
|
|
|
|
|
|
|
||||
|
|
|
|
|
|
|
|
|
|
|
|
|
|||||
|
|
|
|
|
|
|
|
|
|
|
|
|
|||||
|
|
|
|
|
|
|
|
|
|
|
|
|
|||||
|
$
|
|
|
$
|
|
|
$
|
|
|
$
|
|
|
|||||
|
|
|
|
|
|
|
|
|
|
|
|
|
|||||
|
(a)
|
Fair value is determined by broker quote and these notes would be classified as Level II within the fair value hierarchy.
|
3
Blackstone Inc.
Notes to Consolidated Financial Statements—Continued
(All Dollars are in Thousands, Except Share and Per Share Data, Except Where Noted)
Scheduled principal payments for borrowings at December 31, 2023 were as follows:
|
Blackstone
Operating Borrowings |
Borrowings of
Consolidated Blackstone Funds |
Total
Borrowings |
||||||||||
|
2024
|
$
|
|
|
$
|
|
|
$
|
|
|
|||
|
2025
|
|
|
|
|
|
|
|
|
|
|||
|
2026
|
|
|
|
|
|
|
|
|
|
|||
|
2027
|
|
|
|
|
|
|
|
|
|
|||
|
2028
|
|
|
|
|
|
|
|
|
|
|||
|
Thereafter
|
|
|
|
|
|
|
|
|
|
|||
|
|
|
|
|
|
|
|
|
|
||||
|
$
|
|
|
$
|
|
|
$
|
|
|
||||
|
|
|
|
|
|
|
|
|
|
||||
14. Leases
Blackstone enters into non-cancelable lease and sublease agreements primarily for office space, which expire on various dates through 2043. Occupancy lease agreements, in addition to base rentals, generally are subject to escalation provisions based on certain costs incurred by the landlord, and are recognized on a straight-line basis over the term of the lease agreement. Rent expense includes base contractual rent and variable costs such as building expenses, utilities, taxes and insurance. At December 31, 2023 and 2022, Blackstone maintained irrevocable standby letters of credit and cash deposits as security for the leases of $
14.7
million and $
12.3
million, respectively. As of December 31, 2023, the weighted-average remaining lease term was
6.0
years, and the weighted-average discount rate was
1.8
%.
The components of lease expense were as follows:
|
|
|
Year Ended December 31,
|
||||||||||
|
|
|
2023
|
|
2022
|
|
2021
|
||||||
|
Operating Lease Cost
|
||||||||||||
|
Straight-Line Lease Cost (a)
|
$
|
|
|
$
|
|
|
$
|
|
|
|||
|
Variable Lease Cost (b)
|
|
|
|
|
|
|
|
|
|
|||
|
Sublease Income
|
|
(
|
)
|
|
(
|
)
|
|
(
|
)
|
|||
|
|
|
|
|
|
|
|
|
|
||||
|
$
|
|
|
$
|
|
|
$
|
|
|
||||
|
|
|
|
|
|
|
|
|
|
||||
|
|
|
(a)
|
Straight-line lease cost includes short-term leases, which are immaterial.
|
|
(b)
|
Variable lease cost approximates variable lease cash payments.
|
Supplemental cash flow information related to leases were as follows:
|
Year Ended December 31,
|
||||||||||||
|
2023
|
2022
|
2021
|
||||||||||
|
Operating Cash Flows for Operating Lease Liabilities
|
$
|
|
|
$
|
|
|
$
|
|
|
|||
|
Non-Cash Right-of-Use Assets Obtained in Exchange for New Operating Lease Liabilities
|
$
|
|
|
$
|
|
|
$
|
|
|
|||
4
Blackstone Inc.
Notes to Consolidated Financial Statements—Continued
(All Dollars are in Thousands, Except Share and Per Share Data, Except Where Noted)
The following table shows the undiscounted cash flows on an annual basis for Operating Lease Liabilities as of December 31, 2023:
|
2024
|
$
|
|
|
|
|
2025
|
|
|
|
|
|
2026
|
|
|
|
|
|
2027
|
|
|
|
|
|
2028
|
|
|
|
|
|
Thereafter
|
|
|
|
|
|
|
|
|
||
|
Total Lease Payments (a)
|
|
|
|
|
|
Less: Imputed Interest
|
|
(
|
)
|
|
|
|
|
|
||
|
Present Value of Operating Lease Liabilities
|
$
|
|
|
|
|
|
|
|
|
(a)
|
Excludes signed leases that have not yet commenced.
|
15. Income Taxes
The Income Before Provision for Taxes consists of the following:
|
Year Ended December 31,
|
||||||||||||
|
2023
|
2022
|
2021
|
||||||||||
|
Income Before Provision (Benefit) for Taxes
|
||||||||||||
|
U.S. Domestic Income
|
$
|
|
|
$
|
|
|
$
|
|
|
|||
|
Foreign Income
|
|
|
|
|
|
|
|
|
|
|||
|
|
|
|
|
|
|
|
|
|
||||
|
$
|
|
|
$
|
|
|
$
|
|
|
||||
|
|
|
|
|
|
|
|
|
|
||||
The Provision for Taxes consists of the following:
|
Year Ended December 31,
|
||||||||||||
|
2023
|
2022
|
2021
|
||||||||||
|
Current
|
||||||||||||
|
Federal Income Tax
|
$
|
|
|
$
|
|
|
$
|
|
|
|||
|
Foreign Income Tax
|
|
|
|
|
|
|
|
|
|
|||
|
State and Local Income Tax
|
|
|
|
|
|
|
|
|
|
|||
|
|
|
|
|
|
|
|
|
|
||||
|
|
|
|
|
|
|
|
|
|
||||
|
|
|
|
|
|
|
|
|
|
||||
|
Deferred
|
||||||||||||
|
Federal Income Tax
|
|
(
|
)
|
|
(
|
)
|
|
|
|
|||
|
Foreign Income Tax
|
|
(
|
)
|
|
(
|
)
|
|
(
|
)
|
|||
|
State and Local Income Tax
|
|
(
|
)
|
|
(
|
)
|
|
|
|
|||
|
|
|
|
|
|
|
|
|
|
||||
|
|
(
|
)
|
|
(
|
)
|
|
|
|
||||
|
|
|
|
|
|
|
|
|
|
||||
|
Provision for Taxes
|
$
|
|
|
$
|
|
|
$
|
|
|
|||
|
|
|
|
|
|
|
|
|
|
||||
5
Blackstone Inc.
Notes to Consolidated Financial Statements—Continued
(All Dollars are in Thousands, Except Share and Per Share Data, Except Where Noted)
The following table summarizes Blackstone’s tax position:
|
Year Ended December 31,
|
||||||||||||
|
2023
|
2022
|
2021
|
||||||||||
|
Income Before Provision for Taxes
|
$
|
|
|
$
|
|
|
$
|
|
|
|||
|
Provision for Taxes
|
$
|
|
|
$
|
|
|
$
|
|
|
|||
|
Effective Income Tax Rate
|
|
|
%
|
|
|
%
|
|
|
%
|
|||
The following table reconciles the effective income tax rate to the U.S. federal statutory tax rate:
|
2023
|
2022
|
|||||||||||||||||||
|
Year Ended December 31,
|
vs.
|
vs.
|
||||||||||||||||||
|
2023
|
2022
|
2021
|
2022
|
2021
|
||||||||||||||||
|
Statutory U.S. Federal Income Tax Rate
|
|
|
%
|
|
|
%
|
|
|
%
|
|
—
|
|
|
—
|
|
|||||
|
Income Passed Through to Non-Controlling Interest Holders
|
|
-
|
%
|
|
-
|
%
|
|
-
|
%
|
|
-
|
%
|
|
|
%
|
|||||
|
State and Local Income Taxes
|
|
|
%
|
|
|
%
|
|
|
%
|
|
-
|
%
|
|
|
%
|
|||||
|
Change in Valuation Allowance
|
|
|
|
|
|
|
|
-
|
%
|
|
|
|
|
|
%
|
|||||
|
Basis Adjustment (a)
|
|
|
|
|
-
|
%
|
|
|
|
|
|
%
|
|
-
|
%
|
|||||
|
Other
|
|
|
%
|
|
-
|
%
|
|
-
|
%
|
|
|
%
|
|
-
|
%
|
|||||
|
|
|
|
|
|
|
|
|
|
|
|
|
|
|
|
||||||
|
Effective Income Tax Rate
|
|
|
%
|
|
|
%
|
|
|
%
|
|
|
%
|
|
|
%
|
|||||
|
|
|
|
|
|
|
|
|
|
|
|
|
|
|
|
||||||
|
(a)
|
Represents the impact of the out-of-period adjustment made during the year ended December 31, 2022 to revise the book investment basis used to calculate deferred tax assets and the deferred tax provision.
|
Deferred income taxes reflect the net tax effects of temporary differences that may exist between the carrying amounts of assets and liabilities for financial reporting purposes and the amounts used for income tax purposes using enacted tax rates in effect for the year in which the differences are expected to reverse.
A summary of the tax effects of the temporary differences is as follows:
|
December 31,
|
||||||||
|
2023
|
2022
|
|||||||
|
Deferred Tax Assets
|
||||||||
|
Investment Basis Differences/Net Unrealized Gains and Losses
|
$
|
|
|
$
|
|
|
||
|
Other
|
|
|
|
|
|
|
||
|
|
|
|
|
|
|
|||
|
Total Deferred Tax Assets
|
|
|
|
|
|
|
||
|
|
|
|
|
|
|
|||
|
Deferred Tax Liabilities
|
||||||||
|
Investment Basis Differences/Net Unrealized Gains and Losses
|
|
|
|
|
|
|
||
|
Other
|
|
|
|
|
|
|
||
|
|
|
|
|
|
|
|||
|
Total Deferred Tax Liabilities
|
|
|
|
|
|
|
||
|
|
|
|
|
|
|
|||
|
Net Deferred Tax Assets
|
$
|
|
|
$
|
|
|
||
|
|
|
|
|
|
|
|||
The net increase in the deferred tax asset for the year ended December 31, 2023, compared to the year ended December 31, 2022, is primarily due to recognition of additional tax basis in certain assets and recording corresponding deferred tax benefits related to quarterly exchanges of Blackstone Holdings Partnership units for common shares of Blackstone Inc. Realization of deferred tax assets depends on the expectation and character of future taxable income. In addition, Blackstone has
no
significant net operating losses carryforward at December 31, 2023.
6
Blackstone Inc.
Notes to Consolidated Financial Statements—Continued
(All Dollars are in Thousands, Except Share and Per Share Data, Except Where Noted)
In evaluating the ability to realize deferred tax assets, Blackstone among other things, considers projections of taxable income (including character of such income), beginning with historic results and incorporating assumptions of the amount of future pretax operating income. These assumptions about future taxable income require significant judgment and are consistent with the plans and estimates that Blackstone uses to manage its business. To the extent any portion of the deferred tax assets are not considered to be more likely than not to be realized, valuation allowances are recorded.
Currently, Blackstone does not believe it meets the indefinite reversal criteria that would preclude Blackstone from recognizing a deferred tax liability with respect to its foreign subsidiaries. Therefore, if applicable Blackstone recorded a deferred tax liability for any outside basis difference of an investment in a foreign subsidiary.
Blackstone files its tax returns as prescribed by the tax laws of the jurisdictions in which it operates. In the normal course of business, Blackstone is subject to examination by federal and certain state, local and foreign tax authorities. As of December 31, 2023, the most material jurisdictions where Blackstone entities are under active examination are New York State and City.
The following are the major filing jurisdictions and their respective earliest open period subject to examination:
|
Jurisdiction
|
Year
|
|||
|
Federal
|
|
|
|
|
|
New York City
|
|
|
|
|
|
New York State
|
|
|
|
|
|
United Kingdom
|
|
|
|
|
Blackstone’s unrecognized tax benefits, excluding related interest and penalties, were:
|
December 31,
|
||||||||||||
|
2023
|
2022
|
2021
|
||||||||||
|
Unrecognized Tax Benefits — January 1
|
$
|
|
|
$
|
|
|
$
|
|
|
|||
|
Additions Based on Tax Positions Related to Current Year
|
|
|
|
|
|
|
|
|
|
|||
|
Reductions for Tax Positions of Current Year
|
|
(
|
)
|
|
|
|
|
|
|
|||
|
Additions for Tax Positions of Prior Years
|
|
|
|
|
|
|
|
|
|
|||
|
Exchange Rate Fluctuations
|
|
|
|
|
|
|
|
|
|
|||
|
|
|
|
|
|
|
|
|
|
||||
|
Unrecognized Tax Benefits — December 31
|
$
|
|
|
$
|
|
|
$
|
|
|
|||
|
|
|
|
|
|
|
|
|
|
||||
If recognized, the above tax benefits would reduce the annual effective rate. Blackstone believes the liability established for unrecognized tax benefits is adequate in relation to the potential for additional assessments. It is reasonably possible that significant changes in the balance of unrecognized tax benefits may occur during the twelve months subsequent to December 31, 2023; however, it is not possible to estimate the expected change to the total unrecognized tax benefits and its impact on Blackstone’s effective tax rate during the twelve months subsequent to December 31, 2023.
The unrecognized tax benefits are recorded in Accounts Payable, Accrued Expenses and Other Liabilities in the Consolidated Statements of Financial Condition.
During the years ended December 31, 2023, 2022 and 2021, Blackstone accrued no penalties and accrued interest expense related to unrecognized tax benefits of $
22.8
million, $
32.6
million and $
1.5
million, respectively.
7
Blackstone Inc.
Notes to Consolidated Financial Statements—Continued
(All Dollars are in Thousands, Except Share and Per Share Data, Except Where Noted)
Other Income — Change in Tax Receivable Agreement Liability
In 2023 and 2022, the $(
27.2
) million and $
22.3
million, respectively, Change in Tax Receivable Agreement Liability was primarily attributable to a change in our state tax apportionment.
16. Earnings Per Share and Stockholders’ Equity
Earnings Per Share
Basic and diluted net income per share of common stock for the years ended December 31, 2023, 2022 and 2021 was calculated as follows:
|
Year Ended December 31,
|
||||||||||||
|
2023
|
2022
|
2021
|
||||||||||
|
Net Income for Per Share of Common Stock Calculations
|
||||||||||||
|
Net Income Attributable to Blackstone Inc., Basic and Diluted
|
$
|
|
|
$
|
|
|
$
|
|
|
|||
|
|
|
|
|
|
|
|
|
|
||||
|
Shares/Units Outstanding
|
||||||||||||
|
Weighted-Average Shares of Common Stock Outstanding, Basic
|
|
|
|
|
|
|
|
|
|
|||
|
Weighted-Average Shares of Unvested Deferred Restricted Common Stock (a)
|
|
|
|
|
|
|
|
|
|
|||
|
|
|
|
|
|
|
|
|
|
||||
|
Weighted-Average Shares of Common Stock Outstanding, Diluted
|
|
|
|
|
|
|
|
|
|
|||
|
|
|
|
|
|
|
|
|
|
||||
|
Net Income Per Share of Common Stock
|
||||||||||||
|
Basic
|
$
|
|
|
$
|
|
|
$
|
|
|
|||
|
|
|
|
|
|
|
|
|
|
||||
|
Diluted
|
$
|
|
|
$
|
|
|
$
|
|
|
|||
|
|
|
|
|
|
|
|
|
|
||||
|
Dividends Declared Per Share of Common Stock (b)
|
$
|
|
|
$
|
|
|
$
|
|
|
|||
|
|
|
|
|
|
|
|
|
|
||||
|
(a)
|
For the year ended December 31, 2023, this includes shares to be issued under the contingently issuable share model for an acquisition-related compensation arrangement.
|
|
(b)
|
Dividends declared reflects the calendar date of the declaration for each distribution. The fourth quarter dividends, if any, for any fiscal year will be declared and paid in the subsequent fiscal year.
|
In computing the dilutive effect that the exchange of Blackstone Holdings Partnership Units would have on Net Income Per Share of Common Stock, Blackstone considered that net income available to holders of shares of common stock would increase due to the elimination of non-controlling interests in Blackstone Holdings, inclusive of any tax impact. The hypothetical conversion may be dilutive to the extent there is activity at Blackstone Inc. level that has not previously been attributed to the non-controlling interests or if there is a change in tax rate as a result of a hypothetical conversion.
The following table summarizes the anti-dilutive securities for the periods indicated:
|
Year Ended December 31,
|
||||||||||||
|
2023
|
2022
|
2021
|
||||||||||
|
Weighted-Average Blackstone Holdings Partnership Units
|
|
|
|
|
|
|
|
|
|
|||
Stockholders’ Equity
As of December 31, 2023,
10
billion shares of preferred stock authorized with a par value of $
0.00001
Blackstone had
per share
,
of which (a)
999,999,000
shares are designated as Series I preferred stock and (b)
1,000
shares are designated as Series II preferred stock. The remaining
nine
billion shares may be designated from time to time in accordance with Blackstone’s certificate of incorporation. There was
one
share of Series I preferred stock and
one
share of Series II preferred stock issued and outstanding as of December 31, 2023.
0
8
Blackstone Inc.
Notes to Consolidated Financial Statements—Continued
(All Dollars are in Thousands, Except Share and Per Share Data, Except Where Noted)
Under
Blackstone’s certificate of incorporation and Delaware law, holders of Blackstone’s common stock are entitled to vote, together with holders of Blackstone’s Series I preferred stock, voting as a single class, on a number of significant matters, including certain sales, exchanges or other dispositions of all or substantially all of Blackstone’s assets, a merger, consolidation or other business combination, the removal of the Series II Preferred Stockholder and forced transfer by the Series II Preferred Stockholder of its shares of Series II preferred stock and the designation of a successor Series II Preferred Stockholder. The Series II Preferred Stockholder elects Blackstone’s directors. Holders of Blackstone’s Series I preferred stock and Series II preferred stock are not entitled to dividends from Blackstone, or receipt of any of Blackstone’s assets in the event of any dissolution, liquidation or winding up. Blackstone Partners L.L.C. is the sole holder of the Series I preferred stock and Blackstone Group Management L.L.C. is the sole holder of the Series II preferred stock.
Share Repurchase Program
On December 7, 2021, Blackstone’s board of directors authorized the repurchase of up to $
2.0
billion of common stock and Blackstone Holdings Partnership Units. Under the repurchase program, repurchases may be made from time to time in open market transactions, in privately negotiated transactions or otherwise. The timing and the actual numbers repurchased will depend on a variety of factors, including legal requirements, price and economic and market conditions. The repurchase program may be changed, suspended or discontinued at any time and does not have a specified expiration date.
During the year ended December 31, 2021, Blackstone repurchased
10.3
million shares of common stock at a total cost of $
1.2
billion. During the year ended December 31, 2022, Blackstone repurchased
3.9
million shares of common stock at a total cost of $
392.0
million. During the year ended December 31, 2023, Blackstone repurchased
3.7
million shares of common stock at a total cost of $
351.3
million. As of December 31, 2023, the amount remaining available for repurchases under the program was $
756.8
million.
Shares Eligible for Dividends and Distributions
As of December 31, 2023, the total shares of common stock and Blackstone Holdings Partnership Units entitled to participate in dividends and distributions were as follows:
|
Shares/Units
|
||||
|
Common Stock Outstanding
|
|
|
|
|
|
Unvested Participating Common Stock
|
|
|
|
|
|
|
|
|
||
|
Total Participating Common Stock
|
|
|
|
|
|
Participating Blackstone Holdings Partnership Units
|
|
|
|
|
|
|
|
|
||
|
|
|
|
||
|
|
|
|
||
|
17.
|
Equity-Based Compensation
|
Blackstone has granted equity-based compensation awards to Blackstone’s senior managing directors, non-partner professionals, non-professionals and selected external advisers under Blackstone’s Amended and Restated 2007 Equity Incentive Plan (the “Equity Plan”). The Equity Plan allows for the granting of options, share appreciation rights or other share-based awards (shares, restricted shares, restricted shares of common stock, deferred restricted shares of common stock, phantom restricted shares of common stock or other share-based awards based in whole or in part on the fair value of shares of common stock or Blackstone Holdings Partnership Units) which may contain certain service or performance requirements. As of January 1, 2023, Blackstone had the ability to grant
172,161,191
shares under the Equity Plan.
09
Blackstone Inc.
Notes to Consolidated Financial Statements—Continued
(All Dollars are in Thousands, Except Share and Per Share Data, Except Where Noted)
For the years ended December 31, 2023, 2022 and 2021 Blackstone recorded compensation expense of $
987.5
million, $
846.3
million, and $
637.4
million, respectively, in relation to its equity-based awards with corresponding tax benefits of $
183.4
million, $
135.9
million, and $
84.3
million, respectively.
As of December 31, 2023, there was $
2.3
billion of estimated unrecognized compensation expense related to unvested awards, including compensation with performance conditions where it is probable that the performance condition will be met. This cost is expected to be recognized over a weighted-average period of
3.4
years.
Total vested and unvested outstanding shares, including common stock, Blackstone Holdings Partnership Units and deferred restricted shares of common stock, were
1,216,569,512
as of December 31, 2023. Total outstanding phantom shares were
91,648
as of December 31, 2023.
A summary of the status of Blackstone’s unvested equity-based awards as of December 31, 2023 and of changes during the period January 1, 2023 through December 31, 2023 is presented below:
|
Blackstone Holdings
|
Blackstone Inc.
|
|||||||||||||||||||||||
|
Equity Settled Awards
|
Cash Settled Awards
|
|||||||||||||||||||||||
|
Unvested Shares/Units
|
Partnership
Units |
Weighted-
Average Grant Date Fair Value |
Deferred
Restricted Shares of Common Stock |
Weighted-
Average Grant Date Fair Value |
Phantom
Shares |
Weighted-
Average Grant Date Fair Value |
||||||||||||||||||
|
Balance, December 31, 2022
|
|
|
|
$
|
|
|
|
|
|
$
|
|
|
|
|
|
$
|
|
|
||||||
|
Granted
|
|
|
|
|
|
|
|
|
|
|
|
|
|
|
|
|
|
|
||||||
|
Vested
|
|
(
|
)
|
|
|
|
|
(
|
)
|
|
|
|
|
(
|
)
|
|
|
|
||||||
|
Forfeited
|
|
(
|
)
|
|
|
|
|
(
|
)
|
|
|
|
|
(
|
)
|
|
|
|
||||||
|
|
|
|
|
|
|
|
|
|
||||||||||||||||
|
Balance, December 31, 2023
|
|
|
|
$
|
|
|
|
|
|
$
|
|
|
|
|
|
$
|
|
|
||||||
|
|
|
|
|
|
|
|
|
|
||||||||||||||||
Shares/Units Expected to Vest
The following unvested shares and units, after expected forfeitures, as of December 31, 2023, are expected to vest:
|
Shares/Units
|
Weighted-Average
Service Period in Years |
|||||
|
Blackstone Holdings Partnership Units
|
|
|
|
|
||
|
Deferred Restricted Shares of Common Stock
|
|
|
|
|
||
|
|
|
|
|
|||
|
Total Equity-Based Awards
|
|
|
|
|
||
|
|
|
|
|
|||
|
Phantom Shares
|
|
|
|
|
||
|
|
|
|
|
|||
Deferred Restricted Shares of Common Stock and Phantom Shares
Blackstone has granted deferred restricted shares of common stock to certain senior and non-senior managing director professionals, analysts and senior finance and administrative personnel and selected external advisers and phantom shares (cash settled equity-based awards) to other senior and non-senior managing director employees. Holders of deferred restricted shares of common stock and phantom shares are not entitled to any voting rights. Only phantom shares are to be settled in cash. Deferred restricted shares of common stock where the number of shares have not been set are liability classified and excluded from the above tables.
0
Blackstone Inc.
Notes to Consolidated Financial Statements—Continued
(All Dollars are in Thousands, Except Share and Per Share Data, Except Where Noted)
The fair values of deferred restricted shares of common stock have been derived based on the closing price of common stock on the date of the grant, multiplied by the number of unvested awards and expensed over the assumed service period, which ranges from
1
to
5
years. Additionally, the calculation of the compensation expense assumes forfeiture rates based on historical turnover rates, ranging from
1.0
% to
13.0
% annually by employee class, and a per share discount, ranging from $
1.46
to $
21.53
.
The phantom shares vest over the assumed service period, which ranges from
1
to
5
years. On each such vesting date, Blackstone delivered or will deliver cash to the holder in an amount equal to the number of phantom shares held multiplied by the then fair market value of Blackstone’s common stock on such date. Additionally, the calculation of the compensation expense assumes a forfeiture rate based on historical turnover rates, ranging from
6.7
% to
13.0
% annually by employee class. Blackstone is accounting for these cash settled awards as a liability.
Blackstone paid $
1.7
million, $
0.6
million and $
1.1
million to employees in settlement of phantom shares for the years ended December 31, 2023, 2022 and 2021, respectively.
Performance-Based Compensation
During the year ended December 31, 2021, Blackstone issued performance-based compensation, the dollar value of which is based on the future achievement of established business performance conditions. The number of vested shares of common stock to be issued is variable based on the
30
-day volume weighted-average price at the end of the performance period. Due to the nature of settlement, the performance-based compensation is classified as a liability. Compensation expense is recognized over the performance period based upon the probable outcome of the performance condition. Due to the variable share settlement, the tables above exclude the impact of this performance-based compensation, as the number of shares to be issued is based on the probability of achieving the performance condition and not yet set.
Blackstone Holdings Partnership Units
Blackstone has granted deferred restricted Blackstone Holdings Partnership Units to certain current and former senior managing directors. Holders of deferred restricted Blackstone Holdings Partnership Units are not entitled to any voting rights.
The fair values of deferred restricted Blackstone Holdings Partnership Units have been derived based on the closing price of Blackstone’s common units on the date of the grant, multiplied by the number of unvested awards and expensed over the assumed service period, which ranges from
1
to
2
years. Additionally, the calculation of the compensation expense assumes a forfeiture rate of
6.7
%, based on historical experience.
21
1
Blackstone Inc.
Notes to Consolidated Financial Statements—Continued
(All Dollars are in Thousands, Except Share and Per Share Data, Except Where Noted)
18. Related Party Transactions
Affiliate Receivables and Payables
Due from Affiliates and Due to Affiliates consisted of the following:
|
December 31,
|
||||||||
|
2023
|
2022
|
|||||||
|
Due from Affiliates
|
||||||||
|
Management Fees, Performance Revenues, Reimbursable Expenses and Other Receivables from Non-Consolidated Entities and Portfolio Companies
|
$
|
|
|
$
|
|
|
||
|
Due from Certain Non-Controlling Interest Holders and Blackstone Employees
|
|
|
|
|
|
|
||
|
Accrual for Potential Clawback of Previously Distributed Performance Allocations
|
|
|
|
|
|
|
||
|
|
|
|
|
|
|
|||
|
$
|
|
|
$
|
|
|
|||
|
|
|
|
|
|
|
|||
|
December 31,
|
||||||||
|
2023
|
2022
|
|||||||
|
Due to Affiliates
|
||||||||
|
Due to Certain Non-Controlling Interest Holders in Connection with the Tax Receivable Agreements
|
$
|
|
|
$
|
|
|
||
|
Due to Non-Consolidated Entities
|
|
|
|
|
|
|
||
|
Due to Certain Non-Controlling Interest Holders and Blackstone Employees
|
|
|
|
|
|
|
||
|
Accrual for Potential Repayment of Previously Received Performance Allocations
|
|
|
|
|
|
|
||
|
|
|
|
|
|
|
|||
|
$
|
|
|
$
|
|
|
|||
|
|
|
|
|
|
|
|||
Interests of the Founder, Senior Managing Directors, Employees and Other Related Parties
The Founder, senior managing directors, employees and certain other related parties invest on a discretionary basis in the consolidated Blackstone Funds both directly and through consolidated entities. These investments generally are subject to preferential management fee and performance allocation or incentive fee arrangements. As of December 31, 2023 and 2022, such investments aggregated $
1.7
billion and $
1.6
billion, respectively. Their share of the Net Income Attributable to Redeemable Non-Controlling and Non-Controlling Interests in Consolidated Entities aggregated $
87.8
million, $
10.9
million and $
471.5
million for the years ended December 31, 2023, 2022 and 2021, respectively.
Contingent Repayment Guarantee
Blackstone and its personnel who have received Performance Allocation distributions have guaranteed payment on a several basis (subject to a cap) to the carry funds of any clawback obligation with respect to the excess Performance Allocation allocated to the general partners of such funds and indirectly received thereby to the extent that either Blackstone or its personnel fails to fulfill its clawback obligation, if any. The Accrual for Potential Repayment of Previously Received Performance Allocations represents amounts previously paid to Blackstone Holdings and non-controlling interest holders that would need to be repaid to the Blackstone Funds if the carry funds were to be liquidated based on the fair value of their underlying investments as of December 31, 2023. See Note 19. “Commitments and Contingencies — Contingencies — Contingent Obligations (Clawback).”
2
Blackstone Inc.
Notes to Consolidated Financial Statements—Continued
(All Dollars are in Thousands, Except Share and Per Share Data, Except Where Noted)
Tax Receivable Agreements
Blackstone used a portion of the proceeds from the IPO and other sales of shares to purchase interests in the predecessor businesses from the predecessor owners. In addition, holders of Blackstone Holdings Partnership Units may exchange their Blackstone Holdings Partnership Units for shares of Blackstone common stock on a one-for-one basis. The purchase and subsequent exchanges are expected to result in increases in the tax basis of the tangible and intangible assets of Blackstone Holdings and therefore reduce the amount of tax that Blackstone would otherwise be required to pay in the future.
Blackstone has entered into tax receivable agreements with each of the predecessor owners and additional tax receivable agreements have been executed, and will continue to be executed, with senior managing directors and others who acquire Blackstone Holdings Partnership Units. The agreements provide for the payment by the corporate taxpayer to such owners of
85
% of the amount of cash savings, if any, in U.S. federal, state and local income tax that the corporate taxpayers actually realize as a result of the aforementioned increases in tax basis and of certain other tax benefits related to entering into these tax receivable agreements. For purposes of the tax receivable agreements, cash savings in income tax will be computed by comparing the actual income tax liability of the corporate taxpayers to the amount of such taxes that the corporate taxpayers would have been required to pay had there been no increase to the tax basis of the tangible and intangible assets of Blackstone Holdings as a result of the exchanges and had the corporate taxpayers not entered into the tax receivable agreements.
Assuming no future material changes in the relevant tax law and that the corporate taxpayers earn sufficient taxable income to realize the full tax benefit of the increased amortization of the assets, the expected future payments under the tax receivable agreements (which are taxable to the recipients) will aggregate $
1.7
billion over the next
15
years. The after-tax net present value of these estimated payments totals $
522.6
million assuming a
15
% discount rate and using Blackstone’s most recent projections relating to the estimated timing of the benefit to be received. Future payments under the tax receivable agreements in respect of subsequent exchanges would be in addition to these amounts. The payments under the tax receivable agreements are not conditioned upon continued ownership of Blackstone equity interests by the pre-IPO owners and the others mentioned above. Subsequent to December 31, 2023, payments totaling $
92.4
million were made to certain pre-IPO owners and others mentioned above in accordance with the tax receivable agreement and related to tax benefits Blackstone received for the 2022 taxable year.
Amounts related to the deferred tax asset resulting from the increase in tax basis from the exchange of Blackstone Holdings Partnership Units to shares of Blackstone common stock, the resulting remeasurement of net deferred tax assets at the Blackstone ownership percentage at the balance sheet date, the due to affiliates for the future payments resulting from the tax receivable agreements and resulting adjustment to partners’ capital are included as Acquisition of Ownership Interests from Non-Controlling Interest Holders in the Supplemental Disclosure of Non-Cash Investing and Financing Activities in the Consolidated Statements of Cash Flows.
Other
Blackstone does business with and on behalf of some of its Portfolio Companies; all such arrangements are on a negotiated basis.
Additionally, please see Note 19. “Commitments and Contingencies — Contingencies — Guarantees” for information regarding guarantees provided to a lending institution for certain loans held by employees.
21
3
Blackstone Inc.
Notes to Consolidated Financial Statements—Continued
(All Dollars are in Thousands, Except Share and Per Share Data, Except Where Noted)
19. Commitments and Contingencies
Commitments
Investment Commitments
Blackstone had $
5.0
billion of investment commitments as of December 31, 2023 representing general partner capital funding commitments to the Blackstone Funds, limited partner capital funding to other funds and Blackstone principal investment commitments, including loan commitments. The consolidated Blackstone Funds had signed investment commitments of $
364.4
million as of December 31, 2023 which includes $
210.6
million of signed investment commitments for portfolio company acquisitions in the process of closing.
Regulated Entities
Certain U.S. and non-U.S. entities are subject to various investment adviser and other financial regulatory rules and requirements that may include minimum net capital requirements. These entities have continuously operated in excess of these requirements. This includes a number of U.S. entities that are registered as investment advisers with the SEC.
These regulatory capital requirements may restrict Blackstone’s ability to withdraw capital from its entities. At December 31, 2023, $
106.6
million of net assets of consolidated entities may be restricted as to the payment of cash dividends and advances to Blackstone.
Contingencies
Guarantees
Certain of Blackstone’s consolidated real estate funds guarantee payments to third parties in connection with the ongoing business activities and/or acquisitions of their Portfolio Companies. There is no direct recourse to Blackstone to fulfill such obligations. To the extent that underlying funds are required to fulfill guarantee obligations, Blackstone’s invested capital in such funds is at risk. Total investments at risk in respect of guarantees extended by consolidated real estate funds was $
27.9
million as of December 31, 2023.
The Blackstone Holdings Partnerships provided guarantees to a lending institution for certain loans held by employees either for investment in Blackstone Funds or for members’ capital contributions to The Blackstone Group International Partners LLP. The amount guaranteed as of December 31, 2023 was $
79.8
million.
4
Blackstone Inc.
Notes to Consolidated Financial Statements—Continued
(All Dollars are in Thousands, Except Share and Per Share Data, Except Where Noted)
Strategic Venture
In December 2022 and January 2023, Blackstone entered into
4.5
billion of Blackstone Real Estate Income Trust, Inc. (“BREIT”) Class I shares during the three months ended March 31, 2023.
11.25
% target annualized net return on its $
4.5
billion investment in BREIT shares and upside from its investment. This target return, while not guaranteed, is supported by a pledge by Blackstone of $
1.1
billion of its holdings in BREIT as of the subscription dates, including any appreciation or dividends received by Blackstone in respect thereof. Pursuant to the
5
% cash payment from UC Investments on any returns received in excess of the target return. An asset or liability is recognized based on fair value with the maximum potential future obligation capped at the fair value of the assets pledged by Blackstone in connection with the above arrangements. As of December 31, 2023, the fair value of the assets pledged was $
1.1
billion and the total liability recognized was $
564.0
million.
long‐te
strategic ventures
rm
(“UC strategic ventures”)
with the Regents of the University of California (“UC Investments”), an institutional investor that subscribed for $
The UC strategic ventures provide
a waterfall structure with UC Investments receiving an
UC
strategic
ventures
, Blackstone is entitled to receive an incremental
Litigation
Blackstone may from time to time be involved in litigation and claims incidental to the conduct of its business. Blackstone’s businesses are also subject to extensive regulation, which may result in regulatory proceedings against Blackstone.
Blackstone accrues a liability for legal proceedings only when those matters present loss contingencies that are both probable and reasonably estimable. In such cases, there may be an exposure to loss in excess of any amounts accrued. Although there can be no assurance of the outcome of such legal actions, based on information known by management, Blackstone does not have a potential liability related to any current legal proceeding or claim that would individually or in the aggregate materially affect its results of operations, financial position or cash flows.
In December 2017, eight pension plan members of the Kentucky Retirement System (“KRS”) filed a derivative lawsuit on behalf of KRS in the Franklin County Circuit Court of the Commonwealth of Kentucky (the “Mayberry Action”). The Mayberry Action alleged various breaches of fiduciary duty and other violations of Kentucky state law in connection with KRS’s investment in three hedge funds of funds, including a fund managed by Blackstone Alternative Asset Management L.P. (“BLP”). The suit named more than 30 defendants, including, among others, The Blackstone Group L.P. (now Blackstone Inc.); BLP; Stephen A. Schwarzman, as Chairman and CEO of Blackstone; and J. Tomilson Hill, as then-CEO of BLP (collectively, the “Blackstone Defendants”). In July 2020, the Kentucky Supreme Court directed the Circuit Court to dismiss the action due to the plaintiffs’ lack of standing.
Over the objection of the Blackstone Defendants and others, in December 2020, the Circuit Court permitted the Attorney General of the Commonwealth of Kentucky (the “AG”) to intervene in the Mayberry Action. In December 2022, the Mayberry Action was stayed pending resolution of an interlocutory appeal in which the Blackstone Defendants and others argued that the Circuit Court did not have jurisdiction to continue the Mayberry Action after the ruling of the Kentucky Supreme Court. In April 2023, the Kentucky Court of Appeals agreed with the defendants’ position, holding that the Circuit Court exceeded its authority in permitting the AG’s intervention despite the Kentucky Supreme Court’s instruction to dismiss. Accordingly, the Kentucky Court of Appeals vacated all orders entered by the Circuit Court other than the order dismissing the original derivative complaint in the Mayberry Action. In July 2023, the AG filed a motion for discretionary review of the Court of Appeals’ decision by the Kentucky Supreme Court, which was denied on January 10, 2024. Additionally, around the time the AG moved to intervene in 2020, the AG separately filed an additional back-up complaint asserting substantially identical claims against largely the same defendants as the Mayberry Action, including Stephen A. Schwarzman, J. Tomilson Hill and Blackstone Inc. (the “July 2020 Action”). The AG did not pursue the July 2020 Action until August 2023,
5
Blackstone Inc.
Notes to Consolidated Financial Statements—Continued
(All Dollars are in Thousands, Except Share and Per Share Data, Except Where Noted)
when the AG served a substantially identical amended complaint which, in September 2023, the named defendants moved to dismiss. Concurrently, out of an abundance of caution, BLP filed a motion to dismiss and a motion to strike references to BLP as a purported defendant, even though the July 2020 Action, as amended, did not name BLP as a defendant. The AG then added BLP as a party on November 20, 2023, and BLP subsequently filed a motion to dismiss on December 21, 2023. We believe that the July 2020 Action—initiated some nine years after BLP was engaged by KRS—is even more clearly barred by the statute of limitations than the Mayberry Action.
In August 2022, KRS was ordered to disclose, and in September 2022, did disclose, a report prepared in 2021 by a law firm retained by KRS to conduct an investigation into the investment activities underlying the lawsuit. According to the report, the investigators “did not find any violations of fiduciary duty or illegal activity by [BLP]” related to KRS’s due diligence and retention of BLP or KRS’s continued investment with BLP. The report quotes contemporaneous communications by KRS staff during the period of the investment recognizing that BLP was exceeding KRS’s returns benchmark, that BLP was providing KRS with “far fewer negative months than any liquid market comparable,” and that BLP “[h]as killed it.”
In January 2021, certain former plaintiffs in the Mayberry Action filed a separate action (“Taylor I”) against the Blackstone Defendants and other defendants named in the Mayberry Action, asserting allegations substantially similar to those in the Mayberry Action, and in July 2021 they amended their complaint to add class action allegations. Defendants removed Taylor I to the U.S. District Court for the Eastern District of Kentucky, and in March 2022, the District Court stayed Taylor I pending the resolution of the AG’s sui
t.
In August 2021, a group of KRS members—including those that filed Taylor I—filed a new action in Franklin County Circuit Court (“Taylor II”), against the Blackstone Defendants, other defendants named in the Mayberry Action, and other KRS officials. The filed complaint is substantially similar to that filed in Taylor I and the Mayberry Action. Motions to dismiss are pending. The Blackstone Defendants believe they have strong defenses on statute of limitations grounds, among others, to both Taylor I and Taylor II.
In May 2022, the presiding judge recused himself from the Mayberry Action and Taylor II, and the cases were reassigned to another judge in the Franklin County Circuit Court.
In April 2021, the AG filed an action (the “Declaratory Judgment Action”) against BLP and the other fund manager defendants from the Mayberry Action in Franklin County Circuit Court. The action sought to have certain provisions in the subscription agreements between KRS and the fund managers declared to be in violation of the Kentucky Constitution. In March 2022, the Circuit Court granted summary judgment to the AG and the Court of Appeals affirmed on December 1, 2023. On February 5, 2024, BLP’s petition for rehearing before the Court of Appeals was denied. BLP’s motion for discretionary review of the Court of Appeals’ decision by the Kentucky Supreme Court is due March 6, 2024.
Blackstone continues to believe that the preceding lawsuits against Blackstone are totally without merit and intends to defend them vigorously.
In July 2021, BLP filed a breach of contract action against defendants affiliated with KRS alleging that the Mayberry Action and the Declaratory Judgment Action breach the parties’ subscription agreements governing KRS’s investment with BLP. The action seeks damages, including legal fees and expenses incurred in defending against the above actions. In April 2022, the Circuit Court dismissed BLP’s complaint without prejudice to refiling, on the grounds that the action was not yet ripe for adjudication. In May 2023, the Court of Appeals affirmed the Circuit Court’s dismissal, without prejudice, of BLP’s complaint on ripeness grounds. In August 2023, BLP filed a motion with the Kentucky Supreme Court for discretionary review, which was granted on February 7, 2024.
In October 2022, as part of a sweep of private equity and other investment advisory firms, the SEC sent us a request for information relating to the retention of certain types of electronic business communications, including text messages, that may be required to be preserved under certain SEC rules. We are cooperating with the SEC’s inquiry.
6
Blackstone Inc.
Notes to Consolidated Financial Statements—Continued
(All Dollars are in Thousands, Except Share and Per Share Data, Except Where Noted)
Contingent Obligations (Clawback)
Performance Allocations are subject to clawback to the extent that the Performance Allocations received to date with respect to a fund exceeds the amount due to Blackstone based on cumulative results of that fund. The actual clawback liability, however, generally does not become realized until the end of a fund’s life except for certain Blackstone funds, which may have an interim clawback liability. The lives of the carry funds, including available contemplated extensions, for which a liability for potential clawback obligations has been recorded for financial reporting purposes, are currently anticipated to expire at various points through
2032
. Further extensions of such terms may be implemented under given circumstances.
For financial reporting purposes, when applicable, the general partners record a liability for potential clawback obligations to the limited partners of some of the carry funds due to changes in the unrealized value of a fund’s remaining investments and where the fund’s general partner has previously received Performance Allocation distributions with respect to such fund’s realized investments.
The following table presents the clawback obligations by segment:
|
December 31,
|
||||||||||||||||||||||||
|
2023
|
2022
|
|||||||||||||||||||||||
|
Segment
|
Blackstone
Holdings |
Current and
Former Personnel (a) |
Total (b)
|
Blackstone
Holdings |
Current and
Former Personnel (a) |
Total (b)
|
||||||||||||||||||
|
Real Estate
|
$
|
|
|
$
|
|
|
$
|
|
|
$
|
|
|
$
|
|
|
$
|
|
|
||||||
|
Private Equity
|
|
|
|
|
|
|
|
|
|
|
|
|
|
|
|
|
|
|
||||||
|
Credit & Insurance
|
|
|
|
|
|
|
|
|
|
|
|
|
|
|
|
|
|
|
||||||
|
|
|
|
|
|
|
|
|
|
|
|
|
|
|
|
|
|
|
|||||||
|
$
|
|
|
$
|
|
|
$
|
|
|
$
|
|
|
$
|
|
|
$
|
|
|
|||||||
|
|
|
|
|
|
|
|
|
|
|
|
|
|
|
|
|
|
|
|||||||
|
(a)
|
The split of clawback between Blackstone Holdings and Current and Former Personnel is based on the performance of individual investments held by a fund rather than on a fund by fund basis.
|
|
(b)
|
Total is a component of Due to Affiliates. See Note 18. “Related Party Transactions — Affiliate Receivables and Payables — Due to Affiliates.”
|
During the year ended December 31, 2023, the Blackstone general partners paid a cash clawback obligation of $
14.3
million, primarily related to funds in the Private Equity and Real Estate
9.3
million was paid by Blackstone Holdings and $
5.0
million by current and former Blackstone personnel.
segments
of which $
For Private Equity, Real Estate, and certain Credit & Insurance Funds, a portion of the Performance Allocations paid to current and former Blackstone personnel is held in segregated accounts in the event of a cash clawback obligation. These segregated accounts are not included in the Consolidated Financial Statements of Blackstone, except to the extent a portion of the assets held in the segregated accounts may be allocated to a consolidated Blackstone fund of hedge funds. At December 31, 2023, $
1.1
billion was held in segregated accounts for the purpose of meeting any clawback obligations of current and former personnel if such payments are required.
7
Blackstone Inc.
Notes to Consolidated Financial Statements—Continued
(All Dollars are in Thousands, Except Share and Per Share Data, Except Where Noted)
In the Credit & Insurance segment, payment of Performance Allocations to Blackstone by the majority of the stressed/distressed, mezzanine and credit alpha strategies funds are substantially deferred under the terms of the partnership agreements. This deferral mitigates the need to hold funds in segregated accounts in the event of a cash clawback obligation.
If,
at December 31, 2023, all of the investments held by Blackstone’s carry funds were deemed worthless, a possibility that management views as remote, the amount of Performance Allocations subject to potential clawback would be $
6.4
billion, on an after-tax basis where applicable, of which Blackstone Holdings is potentially liable for $
6.0
billion if current and former Blackstone personnel default on their share of the liability, a possibility that management also views as remote.
20. Segment Reporting
Blackstone conducts its alternative asset management businesses through four segments:
|
•
|
Real Estate – Blackstone’s Real Estate segment primarily comprises its management of opportunistic real estate funds, Core+ real estate funds, and real estate debt strategies.
|
|
|
•
|
|
Private Equity – Blackstone’s Private Equity segment includes its management of flagship Corporate Private Equity funds, sector and geographically-focused Corporate Private Equity funds, core private equity funds, an opportunistic investment platform, a secondary fund of funds business, infrastructure-focused funds, a life sciences investment platform, a growth equity investment platform, an investment platform offering eligible individual investors access to Blackstone’s private equity capabilities, a multi-asset investment program for eligible high-net-worth investors and a capital markets services business.
|
|
•
|
Credit & Insurance – Blackstone’s Credit & Insurance segment consists principally of Blackstone Credit & Insurance, which is organized into three overarching strategies: private corporate credit, liquid corporate credit and infrastructure and asset based credit. In addition, the segment includes our insurer-focused platform and a publicly traded energy infrastructure, renewables and master limited partnership investment platform.
|
|
•
|
Hedge Fund Solutions – The largest component of Blackstone’s Hedge Fund Solutions segment is Blackstone Alternative Asset Management, which manages a broad range of commingled and customized fund solutions. The segment also includes a GP Stakes business and investment platforms that invest directly, as well as investment platforms that seed new hedge fund businesses and create alternative solutions through daily liquidity products.
|
These business segments are differentiated by their various investment strategies. Each of the segments primarily earns its income from management fees and investment returns on assets under management.
Segment Distributable Earnings is Blackstone’s segment profitability measure used to make operating decisions and assess performance across Blackstone’s four segments.
Segment Distributable Earnings represents the net realized earnings of Blackstone’s segments and is the sum of Fee Related Earnings and Net Realizations for each segment. Blackstone’s segments are presented on a basis that deconsolidates Blackstone Funds, eliminates non-controlling ownership interests in Blackstone’s consolidated operating partnerships, removes the amortization of intangible assets and removes Transaction-Related and Non-Recurring Items. Transaction-Related and Non-Recurring Items arise from corporate actions including acquisitions, divestitures, Blackstone’s initial public offering and non-recurring gains, losses, or other charges, if any. They consist primarily of equity-based compensation charges, gains and losses on contingent consideration arrangements, changes in the balance of the Tax Receivable Agreement resulting from a change in tax law or similar event, transaction costs, gains or losses associated with these corporate actions and non-recurring gains, losses or other charges that affect period-to-period comparability and are not reflective of Blackstone’s operational performance.
1
8
Blackstone Inc.
Notes to Consolidated Financial Statements—Continued
(All Dollars are in Thousands, Except Share and Per Share Data, Except Where Noted)
F
or segment reporting purposes, Segment Distributable Earnings is presented along with its major components, Fee Related Earnings and Net Realizations. Fee Related Earnings is used to assess Blackstone’s ability to generate profits from revenues that are measured and received on a recurring basis and not subject to future realization events. Net Realizations is the sum of Realized Principal Investment Income and Realized Performance Revenues less Realized Performance Compensation. Performance Allocations and Incentive Fees are presented together and referred to collectively as Performance Revenues or Performance Compensation.
Geographic Information
Blackstone conducts its business primarily in the United States with domestically generated revenues making up
70
%,
77
% and
65
% of total GAAP revenues for the years ended December 31, 2023, 2022 and 2021, respectively.
The table below presents the percentage of total GAAP revenues generated by Blackstone by geographic region
. Revenues attributed to a geographic region are generally based on the geography of investments held by Blackstone and Blackstone Funds. The geography of
an investment
is generally the country of domicile for an asset or where a portfolio company is headquartered.
|
Year Ended December 31,
|
||||||||||||
|
2023
|
2022
|
2021
|
||||||||||
|
Americas
|
|
|
%
|
|
|
%
|
|
|
%
|
|||
|
Europe, Middle East and Africa
|
|
|
%
|
|
|
%
|
|
|
%
|
|||
|
Asia-Pacific
|
|
|
%
|
|
|
%
|
|
|
%
|
|||
|
|
|
|
|
|
|
|
|
|
||||
|
|
|
%
|
|
|
%
|
|
|
%
|
||||
|
|
|
|
|
|
|
|
|
|
||||
Blackstone’s long-lived assets are comprised of Right-of-Use Assets and Furniture, Equipment and Leasehold Improvements, Net. As of December 31, 2023 and 2022, Blackstone held long-lived assets in the United States of $
1.1
billion and $
1.0
billion, respectively. As of December 31, 2023, Blackstone held long-lived assets in the United Kingdom of $
141.7
million. No individual foreign country constituted more than 10% of Blackstone’s total long-lived assets as of December 31, 2022.
Major Customer Information
For the year ended December 31, 2023, BREIT accounted for $
839.9
million of Blackstone’s Management and Advisory Fees, Net. For the year ended December 31, 2023, Blackstone Private Credit Fund (“BCRED”) accounted for an aggregate of $
762.6
million of Management and Advisory Fees, Net and Incentive Fees. For the year ended December 31, 2022, BREIT accounted for $
841.3
million of Blackstone’s Management and Advisory Fees, Net. No individual customer constituted more than
10
% of Blackstone’s Management and Advisory Fees, Net and Incentive Fees for the year ended December 31, 2021. BREIT and BCRED are vehicles in Blackstone’s Real Estate segment and Credit & Insurance segment, respectively. Generally, for purposes of major customer analysis, Blackstone identifies the customer as the investors in its managed investment vehicles. For certain widely held vehicles like BREIT and BCRED, however, the investment vehicle is determined to be the customer. Blackstone evaluates the major customer disclosure in the context of its revenue streams as determined under the GAAP guidance for contracts with customers which includes Management and Advisory Fees, Net and Incentive Fees.
19
Blackstone Inc.
Notes to Consolidated Financial Statements—Continued
(All Dollars are in Thousands, Except Share and Per Share Data, Except Where Noted)
Segment Presentation
The following tables present the financial data for Blackstone’s
four
segments as of December 31, 2023 and 2022, and for the years ended December 31, 2023, 2022 and 2021.
|
December 31, 2023 and the Year Then Ended
|
||||||||||||||||||||
|
Real
Estate
|
Private Equity
|
Credit &
Insurance
|
Hedge Fund
Solutions
|
Total Segments
|
||||||||||||||||
|
Management and Advisory Fees, Net
|
||||||||||||||||||||
|
Base Management Fees
|
$
|
|
|
$
|
|
|
$
|
|
|
$
|
|
|
$
|
|
|
|||||
|
Transaction, Advisory and Other Fees, Net
|
|
|
|
|
|
|
|
|
|
|
|
|
|
|
|
|||||
|
Management Fee Offsets
|
|
(
|
)
|
|
(
|
)
|
|
(
|
)
|
|
(
|
)
|
|
(
|
)
|
|||||
|
|
|
|
|
|
|
|
|
|
|
|
|
|
|
|
||||||
|
Total Management and Advisory Fees, Net
|
|
|
|
|
|
|
|
|
|
|
|
|
|
|
|
|||||
|
Fee Related Performance Revenues
|
|
|
|
|
|
|
|
|
|
|
|
|
|
|
|
|||||
|
Fee Related Compensation
|
|
(
|
)
|
|
(
|
)
|
|
(
|
)
|
|
(
|
)
|
|
(
|
)
|
|||||
|
Other Operating Expenses
|
|
(
|
)
|
|
(
|
)
|
|
(
|
)
|
|
(
|
)
|
|
(
|
)
|
|||||
|
|
|
|
|
|
|
|
|
|
|
|
|
|
|
|
||||||
|
Fee Related Earnings
|
|
|
|
|
|
|
|
|
|
|
|
|
|
|
|
|||||
|
|
|
|
|
|
|
|
|
|
|
|
|
|
|
|
||||||
|
Realized Performance Revenues
|
|
|
|
|
|
|
|
|
|
|
|
|
|
|
|
|||||
|
Realized Performance Compensation
|
|
(
|
)
|
|
(
|
)
|
|
(
|
)
|
|
(
|
)
|
|
(
|
)
|
|||||
|
Realized Principal Investment Income
|
|
|
|
|
|
|
|
|
|
|
|
|
|
|
|
|||||
|
|
|
|
|
|
|
|
|
|
|
|
|
|
|
|
||||||
|
Total Net Realizations
|
|
|
|
|
|
|
|
|
|
|
|
|
|
|
|
|||||
|
|
|
|
|
|
|
|
|
|
|
|
|
|
|
|
||||||
|
Total Segment Distributable Earnings
|
$
|
|
|
$
|
|
|
$
|
|
|
$
|
|
|
$
|
|
|
|||||
|
|
|
|
|
|
|
|
|
|
|
|
|
|
|
|
||||||
|
Segment Assets
|
$
|
|
|
$
|
|
|
$
|
|
|
$
|
|
|
$
|
|
|
|||||
|
|
|
|
|
|
|
|
|
|
|
|
|
|
|
|
||||||
0
Blackstone Inc.
Notes to Consolidated Financial Statements—Continued
(All Dollars are in Thousands, Except Share and Per Share Data, Except Where Noted)
|
|
|
December 31, 2022 and the Year Then Ended
|
||||||||||||||||||
|
|
|
Real
Estate
|
|
Private Equity
|
|
Credit &
Insurance
|
|
Hedge Fund
Solutions
|
|
Total Segments
|
||||||||||
|
Management and Advisory Fees, Net
|
|
|
|
|
|
|
|
|
|
|
|
|
|
|
|
|
|
|
|
|
|
Base Management Fees
|
$
|
|
|
$
|
|
|
$
|
|
|
$
|
|
|
$
|
|
|
|||||
|
Transaction, Advisory and Other Fees, Net
|
|
|
|
|
|
|
|
|
|
|
|
|
|
|
|
|||||
|
Management Fee Offsets
|
|
(
|
)
|
|
(
|
)
|
|
(
|
)
|
|
(
|
)
|
|
(
|
)
|
|||||
|
|
|
|
|
|
|
|
|
|
|
|
|
|
|
|
||||||
|
Total Management and Advisory Fees, Net
|
|
|
|
|
|
|
|
|
|
|
|
|
|
|
|
|||||
|
Fee Related Performance Revenues
|
|
|
|
|
(
|
)
|
|
|
|
|
|
|
|
|
|
|||||
|
Fee Related Compensation
|
|
(
|
)
|
|
(
|
)
|
|
(
|
)
|
|
(
|
)
|
|
(
|
)
|
|||||
|
Other Operating Expenses
|
|
(
|
)
|
|
(
|
)
|
|
(
|
)
|
|
(
|
)
|
|
(
|
)
|
|||||
|
|
|
|
|
|
|
|
|
|
|
|
|
|
|
|
||||||
|
Fee Related Earnings
|
|
|
|
|
|
|
|
|
|
|
|
|
|
|
|
|||||
|
|
|
|
|
|
|
|
|
|
|
|
|
|
|
|
||||||
|
Realized Performance Revenues
|
|
|
|
|
|
|
|
|
|
|
|
|
|
|
|
|||||
|
Realized Performance Compensation
|
|
(
|
)
|
|
(
|
)
|
|
(
|
)
|
|
(
|
)
|
|
(
|
)
|
|||||
|
Realized Principal Investment Income
|
|
|
|
|
|
|
|
|
|
|
|
|
|
|
|
|||||
|
|
|
|
|
|
|
|
|
|
|
|
|
|
|
|
||||||
|
Total Net Realizations
|
|
|
|
|
|
|
|
|
|
|
|
|
|
|
|
|||||
|
|
|
|
|
|
|
|
|
|
|
|
|
|
|
|
||||||
|
Total Segment Distributable Earnings
|
$
|
|
|
$
|
|
|
$
|
|
|
$
|
|
|
$
|
|
|
|||||
|
|
|
|
|
|
|
|
|
|
|
|
|
|
|
|
||||||
|
Segment Assets
|
$
|
|
|
$
|
|
|
$
|
|
|
$
|
|
|
$
|
|
|
|||||
|
|
|
|
|
|
|
|
|
|
|
|
|
|
|
|
||||||
|
Year Ended December 31, 2021
|
||||||||||||||||||||
|
Real
Estate
|
Private Equity
|
Credit &
Insurance
|
Hedge Fund
Solutions
|
Total Segments
|
||||||||||||||||
|
Management and Advisory Fees, Net
|
||||||||||||||||||||
|
Base Management Fees
|
$
|
|
|
$
|
|
|
$
|
|
|
$
|
|
|
$
|
|
|
|||||
|
Transaction, Advisory and Other Fees, Net
|
|
|
|
|
|
|
|
|
|
|
|
|
|
|
|
|||||
|
Management Fee Offsets
|
|
(
|
)
|
|
(
|
)
|
|
(
|
)
|
|
(
|
)
|
|
(
|
)
|
|||||
|
|
|
|
|
|
|
|
|
|
|
|
|
|
|
|
||||||
|
Total Management and Advisory Fees, Net
|
|
|
|
|
|
|
|
|
|
|
|
|
|
|
|
|||||
|
Fee Related Performance Revenues
|
|
|
|
|
|
|
|
|
|
|
|
|
|
|
|
|||||
|
Fee Related Compensation
|
|
(
|
)
|
|
(
|
)
|
|
(
|
)
|
|
(
|
)
|
|
(
|
)
|
|||||
|
Other Operating Expenses
|
|
(
|
)
|
|
(
|
)
|
|
(
|
)
|
|
(
|
)
|
|
(
|
)
|
|||||
|
|
|
|
|
|
|
|
|
|
|
|
|
|
|
|
||||||
|
Fee Related Earnings
|
|
|
|
|
|
|
|
|
|
|
|
|
|
|
|
|||||
|
|
|
|
|
|
|
|
|
|
|
|
|
|
|
|
||||||
|
Realized Performance Revenues
|
|
|
|
|
|
|
|
|
|
|
|
|
|
|
|
|||||
|
Realized Performance Compensation
|
|
(
|
)
|
|
(
|
)
|
|
(
|
)
|
|
(
|
)
|
|
(
|
)
|
|||||
|
Realized Principal Investment Income
|
|
|
|
|
|
|
|
|
|
|
|
|
|
|
|
|||||
|
|
|
|
|
|
|
|
|
|
|
|
|
|
|
|
||||||
|
Total Net Realizations
|
|
|
|
|
|
|
|
|
|
|
|
|
|
|
|
|||||
|
|
|
|
|
|
|
|
|
|
|
|
|
|
|
|
||||||
|
Total Segment Distributable Earnings
|
$
|
|
|
$
|
|
|
$
|
|
|
$
|
|
|
$
|
|
|
|||||
|
|
|
|
|
|
|
|
|
|
|
|
|
|
|
|
||||||
1
Blackstone Inc.
Notes to Consolidated Financial Statements—Continued
(All Dollars are in Thousands, Except Share and Per Share Data, Except Where Noted)
Reconciliations of Total Segment Amounts
The following tables reconcile the Total Segment Revenues, Expenses and Distributable Earnings to their equivalent GAAP measure for the years ended December 31, 2023, 2022 and 2021 along with Total Assets as of December 31, 2023 and 2022:
|
Year Ended December 31,
|
||||||||||||
|
2023
|
2022
|
2021
|
||||||||||
|
Revenues
|
||||||||||||
|
Total GAAP Revenues
|
$
|
|
|
$
|
|
|
$
|
|
|
|||
|
Less: Unrealized Performance Revenues (a)
|
|
|
|
|
|
|
|
(
|
)
|
|||
|
Less: Unrealized Principal Investment (Income) Loss (b)
|
|
|
|
|
|
|
|
(
|
)
|
|||
|
Less: Interest and Dividend Revenue (c)
|
|
(
|
)
|
|
(
|
)
|
|
(
|
)
|
|||
|
Less: Other Revenue (d)
|
|
|
|
|
(
|
)
|
|
(
|
)
|
|||
|
Impact of Consolidation (e)
|
|
(
|
)
|
|
(
|
)
|
|
(
|
)
|
|||
|
Transaction-Related and Non-Recurring Items (f)
|
|
|
|
|
(
|
)
|
|
|
|
|||
|
Intersegment Eliminations
|
|
|
|
|
|
|
|
|
|
|||
|
|
|
|
|
|
|
|
|
|
||||
|
Total Segment Revenue (g)
|
$
|
|
|
$
|
|
|
$
|
|
|
|||
|
|
|
|
|
|
|
|
|
|
||||
|
Year Ended December 31,
|
||||||||||||
|
2023
|
2022
|
2021
|
||||||||||
|
Expenses
|
||||||||||||
|
Total GAAP Expenses
|
$
|
|
|
$
|
|
|
$
|
|
|
|||
|
Less: Unrealized Performance Allocations Compensation (h)
|
|
|
|
|
|
|
|
(
|
)
|
|||
|
Less: Equity-Based Compensation (i)
|
|
(
|
)
|
|
(
|
)
|
|
(
|
)
|
|||
|
Less: Interest Expense (j)
|
|
(
|
)
|
|
(
|
)
|
|
(
|
)
|
|||
|
Impact of Consolidation (e)
|
|
(
|
)
|
|
(
|
)
|
|
(
|
)
|
|||
|
Amortization of Intangibles (k)
|
|
(
|
)
|
|
(
|
)
|
|
(
|
)
|
|||
|
Transaction-Related and Non-Recurring Items (f)
|
|
(
|
)
|
|
(
|
)
|
|
(
|
)
|
|||
|
Administrative Fee Adjustment (l)
|
|
(
|
)
|
|
(
|
)
|
|
(
|
)
|
|||
|
Intersegment Eliminations
|
|
|
|
|
|
|
|
|
|
|||
|
|
|
|
|
|
|
|
|
|
||||
|
Total Segment Expenses (m)
|
$
|
|
|
$
|
|
|
$
|
|
|
|||
|
|
|
|
|
|
|
|
|
|
||||
|
|
|
Year Ended December 31,
|
||||||||||
|
|
|
2023
|
|
2022
|
|
2021
|
||||||
|
Other Income
|
|
|
|
|
|
|
|
|
|
|
|
|
|
Total GAAP Other Income
|
|
$
|
(
|
)
|
|
$
|
(
|
)
|
|
$
|
|
|
|
Impact of Consolidation (e)
|
|
|
|
|
|
|
|
|
|
|
(
|
)
|
|
|
|
|
|
|
|
|
|
|
|
|
|
|
|
Total Segment Other Income
|
|
$
|
|
|
|
$
|
|
|
|
$
|
|
|
|
|
|
|
|
|
|
|
|
|
|
|
|
|
2
Blackstone Inc.
Notes to Consolidated Financial Statements—Continued
(All Dollars are in Thousands, Except Share and Per Share Data, Except Where Noted)
|
|
|
Year Ended December 31,
|
||||||||||
|
|
|
2023
|
|
2022
|
|
2021
|
||||||
|
Income Before Provision for Taxes
|
|
|
|
|
|
|
|
|
|
|
|
|
|
Total GAAP Income Before Provision for Taxes
|
$
|
|
|
$
|
|
|
$
|
|
|
|||
|
Less: Unrealized Performance Revenues (a)
|
|
|
|
|
|
|
|
(
|
)
|
|||
|
Less: Unrealized Principal Investment (Income) Loss (b)
|
|
|
|
|
|
|
|
(
|
)
|
|||
|
Less: Interest and Dividend Revenue (c)
|
|
(
|
)
|
|
(
|
)
|
|
(
|
)
|
|||
|
Less: Other Revenue (d)
|
|
|
|
|
(
|
)
|
|
(
|
)
|
|||
|
Plus: Unrealized Performance Allocations Compensation (h)
|
|
(
|
)
|
|
(
|
)
|
|
|
|
|||
|
Plus: Equity-Based Compensation (i)
|
|
|
|
|
|
|
|
|
|
|||
|
Plus: Interest Expense (j)
|
|
|
|
|
|
|
|
|
|
|||
|
Impact of Consolidation (e)
|
|
|
|
|
|
|
|
(
|
)
|
|||
|
Amortization of Intangibles (k)
|
|
|
|
|
|
|
|
|
|
|||
|
Transaction-Related and Non-Recurring Items (f)
|
|
|
|
|
|
|
|
|
|
|||
|
Administrative Fee Adjustment (l)
|
|
|
|
|
|
|
|
|
|
|||
|
|
|
|
|
|
|
|
|
|
||||
|
Total Segment Distributable Earnings
|
$
|
|
|
$
|
|
|
$
|
|
|
|||
|
|
|
|
|
|
|
|
|
|
||||
|
As of December 31,
|
||||||||
|
2023
|
2022
|
|||||||
|
Total Assets
|
||||||||
|
Total GAAP Assets
|
$
|
|
|
$
|
|
|
||
|
Impact of Consolidation (e)
|
|
(
|
)
|
|
(
|
)
|
||
|
|
|
|
|
|
|
|||
|
Total Segment Assets
|
$
|
|
|
$
|
|
|
||
|
|
|
|
|
|
|
|||
Segment basis presents revenues and expenses on a basis that deconsolidates the investment funds Blackstone manages and excludes the amortization of intangibles and Transaction-Related and Non-Recurring Items.
|
(a)
|
This adjustment removes Unrealized Performance Revenues on a segment basis.
|
|
(b)
|
This adjustment removes Unrealized Principal Investment Income on a segment basis.
|
|
(c)
|
This adjustment removes Interest and Dividend Revenue on a segment basis.
|
|
(d)
|
This adjustment removes Other Revenue on a segment basis. For the years ended December 31, 2023, 2022 and 2021, Other Revenue on a GAAP basis was $(
|
|
(e)
|
This adjustment reverses the effect of consolidating Blackstone Funds, which are excluded from Blackstone’s segment presentation. This adjustment includes the elimination of Blackstone’s interest in these funds, the removal of revenue from the reimbursement of certain expenses by the Blackstone Funds, which are presented gross under GAAP but netted against Management and Advisory Fees, Net in the Total Segment measures, and the removal of amounts associated with the ownership of Blackstone consolidated operating partnerships held by non-controlling interests.
|
|
(f)
|
This adjustment removes Transaction-Related and Non-Recurring Items, which are excluded from Blackstone’s segment presentation. Transaction-Related and Non-Recurring Items arise from corporate actions including acquisitions, divestitures, Blackstone’s initial public offering and non-recurring gains, losses, or other charges, if any. They consist primarily of equity-based compensation charges, gains and losses on contingent consideration arrangements, changes in the balance of the Tax Receivable Agreement resulting from a change in tax law or similar event, transaction costs, gains or losses associated with these corporate actions and non-recurring gains, losses or other charges that affect period-to-period comparability and are not reflective of Blackstone’s operational performance.
|
3
Blackstone Inc.
Notes to Consolidated Financial Statements—Continued
(All Dollars are in Thousands, Except Share and Per Share Data, Except Where Noted)
|
(g)
|
Total Segment Revenues is comprised of the following:
|
|
|
|
Year Ended December 31,
|
||||||||||
|
|
|
2023
|
|
2022
|
|
2021
|
||||||
|
Total Segment Management and Advisory Fees, Net
|
$
|
|
|
$
|
|
|
$
|
|
|
|||
|
Total Segment Fee Related Performance Revenues
|
|
|
|
|
|
|
|
|
|
|||
|
Total Segment Realized Performance Revenues
|
|
|
|
|
|
|
|
|
|
|||
|
Total Segment Realized Principal Investment Income
|
|
|
|
|
|
|
|
|
|
|||
|
|
|
|
|
|
|
|
|
|
||||
|
Total Segment Revenues
|
$
|
|
|
$
|
|
|
$
|
|
|
|||
|
|
|
|
|
|
|
|
|
|
||||
|
(h)
|
This adjustment removes Unrealized Performance Allocations Compensation.
|
|
(i)
|
This adjustment removes Equity-Based Compensation on a segment basis.
|
|
(j)
|
This adjustment adds back Interest Expense on a segment basis, excluding interest expense related to the Tax Receivable Agreement.
|
|
(k)
|
This adjustment removes the amortization of transaction-related intangibles, which are excluded from Blackstone’s segment presentation.
|
|
(l)
|
This adjustment adds an amount equal to an administrative fee collected on a quarterly basis from certain holders of Blackstone Holdings Partnership Units. The administrative fee is accounted for as a capital contribution under GAAP, but is reflected as a reduction of Other Operating Expenses in Blackstone’s segment presentation.
|
|
(m)
|
Total Segment Expenses is comprised of the following:
|
|
|
|
Year Ended December 31,
|
||||||||||
|
|
|
2023
|
|
2022
|
|
2021
|
||||||
|
Total Segment Fee Related Compensation
|
$
|
|
|
$
|
|
|
$
|
|
|
|||
|
Total Segment Realized Performance Compensation
|
|
|
|
|
|
|
|
|
|
|||
|
Total Segment Other Operating Expenses
|
|
|
|
|
|
|
|
|
|
|||
|
|
|
|
|
|
|
|
|
|
||||
|
Total Segment Expenses
|
$
|
|
|
$
|
|
|
$
|
|
|
|||
|
|
|
|
|
|
|
|
|
|
||||
Reconciliations of Total Segment Components
The following tables reconcile the components of Total Segments to their equivalent GAAP measures, reported on the Consolidated Statement of Operations for the years ended December 31, 2023, 2022 and 2021:
|
|
|
Year Ended December 31,
|
||||||||||
|
|
|
2023
|
|
2022
|
|
2021
|
||||||
|
Management and Advisory Fees, Net
|
|
|
|
|
|
|
|
|
|
|
|
|
|
GAAP
|
$
|
|
|
$
|
|
|
$
|
|
|
|||
|
Segment Adjustment (a)
|
|
(
|
)
|
|
(
|
)
|
|
(
|
)
|
|||
|
|
|
|
|
|
|
|
|
|
||||
|
Total Segment
|
$
|
|
|
$
|
|
|
$
|
|
|
|||
|
|
|
|
|
|
|
|
|
|
||||
4
Blackstone Inc.
Notes to Consolidated Financial Statements—Continued
(All Dollars are in Thousands, Except Share and Per Share Data, Except Where Noted)
|
|
|
Year Ended December 31,
|
||||||||||
|
|
|
2023
|
|
2022
|
|
2021
|
||||||
|
GAAP Realized Performance Revenues to Total Segment Fee Related Performance Revenues
|
|
|
|
|
|
|
|
|
|
|
|
|
|
GAAP
|
|
|
|
|
|
|
|
|
|
|
|
|
|
Incentive Fees
|
$
|
|
|
$
|
|
|
$
|
|
|
|||
|
Investment Income — Realized Performance Allocations
|
|
|
|
|
|
|
|
|
|
|||
|
|
|
|
|
|
|
|
|
|
||||
|
GAAP
|
|
|
|
|
|
|
|
|
|
|||
|
Total Segment
|
||||||||||||
|
Less: Realized Performance Revenues
|
|
(
|
)
|
|
(
|
)
|
|
(
|
)
|
|||
|
Segment Adjustment (b)
|
|
|
|
|
|
|
|
|
|
|||
|
|
|
|
|
|
|
|
|
|
||||
|
Total Segment
|
$
|
|
|
$
|
|
|
$
|
|
|
|||
|
|
|
|
|
|
|
|
|
|
||||
|
|
|
Year Ended December 31,
|
||||||||||
|
|
|
2023
|
|
2022
|
|
2021
|
||||||
|
GAAP Compensation to Total Segment Fee Related Compensation
|
|
|
|
|
|
|
|
|
|
|
|
|
|
GAAP
|
|
|
|
|
|
|
|
|
|
|
|
|
|
Compensation
|
|
$
|
|
|
|
$
|
|
|
|
$
|
|
|
|
Incentive Fee Compensation
|
|
|
|
|
|
|
|
|
|
|
|
|
|
Realized Performance Allocations Compensation
|
|
|
|
|
|
|
|
|
|
|
|
|
|
|
|
|
|
|
|
|
|
|
|
|
|
|
|
GAAP
|
|
|
|
|
|
|
|
|
|
|
|
|
|
Total Segment
|
|
|
|
|
|
|
|
|
|
|
|
|
|
Less: Realized Performance Compensation
|
|
|
(
|
)
|
|
|
(
|
)
|
|
|
(
|
)
|
|
Less: Equity-Based Compensation — Fee Related Compensation
|
|
|
(
|
)
|
|
|
(
|
)
|
|
|
(
|
)
|
|
Less: Equity-Based Compensation — Performance Compensation
|
|
|
(
|
)
|
|
|
(
|
)
|
|
|
(
|
)
|
|
Segment Adjustment (c)
|
|
|
(
|
)
|
|
|
(
|
)
|
|
|
(
|
)
|
|
|
|
|
|
|
|
|
|
|
|
|
|
|
|
Total Segment
|
|
$
|
|
|
|
$
|
|
|
|
$
|
|
|
|
|
|
|
|
|
|
|
|
|
|
|
|
|
|
|
|
Year Ended December 31,
|
||||||||||
|
|
|
2023
|
|
2022
|
|
2021
|
||||||
|
GAAP General, Administrative and Other to Total Segment Other Operating Expenses
|
|
|
|
|
|
|
|
|
|
|
|
|
|
GAAP
|
|
$
|
|
|
|
$
|
|
|
|
$
|
|
|
|
Segment Adjustment (d)
|
|
|
(
|
)
|
|
|
(
|
)
|
|
|
(
|
)
|
|
|
|
|
|
|
|
|
|
|
|
|
|
|
|
Total Segment
|
|
$
|
|
|
|
$
|
|
|
|
$
|
|
|
|
|
|
|
|
|
|
|
|
|
|
|
|
|
5
Blackstone Inc.
Notes to Consolidated Financial Statements—Continued
(All Dollars are in Thousands, Except Share and Per Share Data, Except Where Noted)
|
|
|
Year Ended December 31,
|
||||||||||
|
|
|
2023
|
|
2022
|
|
2021
|
||||||
|
Realized Performance Revenues
|
|
|
|
|
|
|
|
|
|
|
|
|
|
GAAP
|
|
|
|
|
|
|
|
|
|
|
|
|
|
Incentive Fees
|
$
|
|
|
$
|
|
|
$
|
|
|
|||
|
Investment Income — Realized Performance Allocations
|
|
|
|
|
|
|
|
|
|
|||
|
|
|
|
|
|
|
|
|
|
||||
|
GAAP
|
|
|
|
|
|
|
|
|
|
|||
|
Total Segment
|
||||||||||||
|
Less: Fee Related Performance Revenues
|
|
(
|
)
|
|
(
|
)
|
|
(
|
)
|
|||
|
Segment Adjustment (b)
|
|
|
|
|
|
|
|
|
|
|||
|
|
|
|
|
|
|
|
|
|
||||
|
Total Segment
|
$
|
|
|
$
|
|
|
$
|
|
|
|||
|
|
|
|
|
|
|
|
|
|
||||
|
|
|
Year Ended December 31,
|
||||||||||
|
|
|
2023
|
|
2022
|
|
2021
|
||||||
|
Realized Performance Compensation
|
|
|
|
|
|
|
|
|
|
|
|
|
|
GAAP
|
|
|
|
|
|
|
|
|
|
|
|
|
|
Incentive Fee Compensation
|
|
$
|
|
|
|
$
|
|
|
|
$
|
|
|
|
Realized Performance Allocations Compensation
|
|
|
|
|
|
|
|
|
|
|
|
|
|
|
|
|
|
|
|
|
|
|
|
|
|
|
|
GAAP
|
|
|
|
|
|
|
|
|
|
|
|
|
|
Total Segment
|
|
|
|
|
|
|
|
|
|
|
|
|
|
Less: Fee Related Performance Compensation (e)
|
|
|
(
|
)
|
|
|
(
|
)
|
|
|
(
|
)
|
|
Less: Equity-Based Compensation — Performance Compensation
|
|
|
(
|
)
|
|
|
(
|
)
|
|
|
(
|
)
|
|
|
|
|
|
|
|
|
|
|
|
|
|
|
|
Total Segment
|
|
$
|
|
|
|
$
|
|
|
|
$
|
|
|
|
|
|
|
|
|
|
|
|
|
|
|
|
|
|
|
|
Year Ended December 31,
|
||||||||||
|
|
|
2023
|
|
2022
|
|
2021
|
||||||
|
Realized Principal Investment Income
|
|
|
|
|
|
|
|
|
|
|
|
|
|
GAAP
|
|
$
|
|
|
|
$
|
|
|
|
$
|
|
|
|
Segment Adjustment (f)
|
|
|
(
|
)
|
|
|
(
|
)
|
|
|
(
|
)
|
|
|
|
|
|
|
|
|
|
|
|
|
|
|
|
Total Segment
|
|
$
|
|
|
|
$
|
|
|
|
$
|
|
|
|
|
|
|
|
|
|
|
|
|
|
|
|
|
Segment basis presents revenues and expenses on a basis that deconsolidates the investment funds Blackstone manages and excludes the amortization of intangibles, the expense of equity-based awards and Transaction-Related and Non-Recurring Items.
|
(a)
|
Represents (1) the add back of net management fees earned from consolidated Blackstone Funds which have been eliminated in consolidation, and (2) the removal of revenue from the reimbursement of certain expenses by the Blackstone Funds, which are presented gross under GAAP but netted against Management and Advisory Fees, Net in the Total Segment measures.
|
|
(b)
|
Represents the add back of Performance Revenues earned from consolidated Blackstone Funds which have been eliminated in consolidation.
|
|
(c)
|
Represents the removal of Transaction-Related and Non-Recurring Items that are not recorded in the Total Segment measures.
|
|
(d)
|
Represents the (1) removal of amortization of transaction-related intangibles, (2) removal of certain expenses reimbursed by the Blackstone Funds, which are presented gross under GAAP but netted against Management and Advisory Fees, Net in the Total Segment measures, and (3) a reduction equal to an administrative fee collected on a quarterly basis from certain holders of Blackstone Holdings Partnership Units which is accounted for as a capital contribution under GAAP, but is reflected as a reduction of Other Operating Expenses in Blackstone’s segment presentation.
|
6
Blackstone Inc.
Notes to Consolidated Financial Statements—Continued
(All Dollars are in Thousands, Except Share and Per Share Data, Except Where Noted)
|
(e)
|
Fee related performance compensation may include equity-based compensation based on fee related performance revenues.
|
|
(f)
|
Represents (1) the add back of Principal Investment Income, including general partner income, earned from consolidated Blackstone Funds which have been eliminated in consolidation, and (2) the removal of amounts associated with the ownership of Blackstone consolidated operating partnerships held by non-controlling interests.
|
21. Subsequent Events
There have been no events since December 31, 2023 that require recognition or disclosure in the Consolidated Financial Statements.
22
7
|
Item 8A.
|
Unaudited Supplemental Presentation of Statements of Financial Condition
|
Blackstone Inc.
Unaudited Consolidating Statements of Financial Condition
(Dollars in Thousands)
|
December 31, 2023
|
||||||||||||||||
|
Consolidated
Operating Partnerships |
Consolidated
Blackstone Funds (a) |
Reclasses and
Eliminations |
Consolidated
|
|||||||||||||
|
Assets
|
||||||||||||||||
|
Cash and Cash Equivalents
|
$
|
2,955,866
|
|
$
|
—
|
|
$
|
—
|
|
$
|
2,955,866
|
|
||||
|
Cash Held by Blackstone Funds and Other
|
|
—
|
|
|
316,197
|
|
|
—
|
|
|
316,197
|
|
||||
|
Investments
|
|
22,595,236
|
|
|
4,319,483
|
|
|
(768,097
|
)
|
|
26,146,622
|
|
||||
|
Accounts Receivable
|
|
186,370
|
|
|
6,995
|
|
|
—
|
|
|
193,365
|
|
||||
|
Due from Affiliates
|
|
4,498,250
|
|
|
13,901
|
|
|
(45,630
|
)
|
|
4,466,521
|
|
||||
|
Intangible Assets, Net
|
|
201,208
|
|
|
—
|
|
|
—
|
|
|
201,208
|
|
||||
|
Goodwill
|
|
1,890,202
|
|
|
—
|
|
|
—
|
|
|
1,890,202
|
|
||||
|
Other Assets
|
|
944,078
|
|
|
770
|
|
|
—
|
|
|
944,848
|
|
||||
|
Right-of-Use Assets
|
|
841,307
|
|
|
—
|
|
|
—
|
|
|
841,307
|
|
||||
|
Deferred Tax Assets
|
|
2,331,394
|
|
|
—
|
|
|
—
|
|
|
2,331,394
|
|
||||
|
|
|
|
|
|
|
|
|
|
|
|
|
|||||
|
Total Assets
|
$
|
36,443,911
|
|
$
|
4,657,346
|
|
$
|
(813,727
|
)
|
$
|
40,287,530
|
|
||||
|
|
|
|
|
|
|
|
|
|
|
|
|
|||||
|
Liabilities and Equity
|
||||||||||||||||
|
Loans Payable
|
$
|
10,616,937
|
|
$
|
687,122
|
|
$
|
—
|
|
$
|
11,304,059
|
|
||||
|
Due to Affiliates
|
|
2,273,008
|
|
|
220,758
|
|
|
(100,356
|
)
|
|
2,393,410
|
|
||||
|
Accrued Compensation and Benefits
|
|
5,247,766
|
|
|
—
|
|
|
—
|
|
|
5,247,766
|
|
||||
|
Operating Lease Liabilities
|
|
989,823
|
|
|
—
|
|
|
—
|
|
|
989,823
|
|
||||
|
Accounts Payable, Accrued Expenses and Other Liabilities
|
|
1,886,086
|
|
|
391,172
|
|
|
—
|
|
|
2,277,258
|
|
||||
|
|
|
|
|
|
|
|
|
|
|
|
|
|||||
|
Total Liabilities
|
|
21,013,620
|
|
|
1,299,052
|
|
|
(100,356
|
)
|
|
22,212,316
|
|
||||
|
|
|
|
|
|
|
|
|
|
|
|
|
|||||
|
Redeemable Non-Controlling Interests in Consolidated Entities
|
|
9
|
|
|
1,179,064
|
|
|
—
|
|
|
1,179,073
|
|
||||
|
|
|
|
|
|
|
|
|
|
|
|
|
|||||
|
Equity
|
||||||||||||||||
|
Common Stock
|
|
7
|
|
|
—
|
|
|
—
|
|
|
7
|
|
||||
|
Series I Preferred Stock
|
|
—
|
|
|
—
|
|
|
—
|
|
|
—
|
|
||||
|
Series II Preferred Stock
|
|
—
|
|
|
—
|
|
|
—
|
|
|
—
|
|
||||
|
Additional Paid-in-Capital
|
|
6,175,190
|
|
|
701,792
|
|
|
(701,792
|
)
|
|
6,175,190
|
|
||||
|
Retained Earnings
|
|
660,734
|
|
|
11,579
|
|
|
(11,579
|
)
|
|
660,734
|
|
||||
|
Accumulated Other Comprehensive Income (Loss)
|
|
(36,175
|
)
|
|
17,042
|
|
|
—
|
|
|
(19,133
|
)
|
||||
|
Non-Controlling Interests in Consolidated Entities
|
|
3,728,438
|
|
|
1,448,817
|
|
|
—
|
|
|
5,177,255
|
|
||||
|
Non-Controlling Interests in Blackstone Holdings
|
|
4,902,088
|
|
|
—
|
|
|
—
|
|
|
4,902,088
|
|
||||
|
|
|
|
|
|
|
|
|
|
|
|
|
|||||
|
Total Equity
|
|
15,430,282
|
|
|
2,179,230
|
|
|
(713,371
|
)
|
|
16,896,141
|
|
||||
|
|
|
|
|
|
|
|
|
|
|
|
|
|||||
|
Total Liabilities and Equity
|
$
|
36,443,911
|
|
$
|
4,657,346
|
|
$
|
(813,727
|
)
|
$
|
40,287,530
|
|
||||
|
|
|
|
|
|
|
|
|
|
|
|
|
|||||
228
Blackstone Inc.
Unaudited Consolidating Statements of Financial Condition—Continued
(Dollars in Thousands)
|
December 31, 2022
|
||||||||||||||||
|
Consolidated
Operating Partnerships |
Consolidated
Blackstone Funds (a) |
Reclasses and
Eliminations |
Consolidated
|
|||||||||||||
|
Assets
|
||||||||||||||||
|
Cash and Cash Equivalents
|
$
|
4,252,003
|
|
$
|
—
|
|
$
|
—
|
|
$
|
4,252,003
|
|
||||
|
Cash Held by Blackstone Funds and Other
|
|
—
|
|
|
241,712
|
|
|
—
|
|
|
241,712
|
|
||||
|
Investments
|
|
23,236,603
|
|
|
5,136,542
|
|
|
(819,894
|
)
|
|
27,553,251
|
|
||||
|
Accounts Receivable
|
|
407,681
|
|
|
55,223
|
|
|
—
|
|
|
462,904
|
|
||||
|
Due from Affiliates
|
|
4,185,982
|
|
|
8,417
|
|
|
(47,692
|
)
|
|
4,146,707
|
|
||||
|
Intangible Assets, Net
|
|
217,287
|
|
|
—
|
|
|
—
|
|
|
217,287
|
|
||||
|
Goodwill
|
|
1,890,202
|
|
|
—
|
|
|
—
|
|
|
1,890,202
|
|
||||
|
Other Assets
|
|
798,299
|
|
|
2,159
|
|
|
—
|
|
|
800,458
|
|
||||
|
Right-of-Use Assets
|
|
896,981
|
|
|
—
|
|
|
—
|
|
|
896,981
|
|
||||
|
Deferred Tax Assets
|
|
2,062,722
|
|
|
—
|
|
|
—
|
|
|
2,062,722
|
|
||||
|
|
|
|
|
|
|
|
|
|
|
|
|
|||||
|
Total Assets
|
$
|
37,947,760
|
|
$
|
5,444,053
|
|
$
|
(867,586
|
)
|
$
|
42,524,227
|
|
||||
|
|
|
|
|
|
|
|
|
|
|
|
|
|||||
|
Liabilities and Equity
|
||||||||||||||||
|
Loans Payable
|
$
|
10,899,584
|
|
$
|
1,450,000
|
|
$
|
—
|
|
$
|
12,349,584
|
|
||||
|
Due to Affiliates
|
|
2,039,549
|
|
|
128,681
|
|
|
(49,749
|
)
|
|
2,118,481
|
|
||||
|
Accrued Compensation and Benefits
|
|
6,101,801
|
|
|
—
|
|
|
—
|
|
|
6,101,801
|
|
||||
|
Operating Lease Liabilities
|
|
1,021,454
|
|
|
—
|
|
|
—
|
|
|
1,021,454
|
|
||||
|
Accounts Payable, Accrued Expenses and Other Liabilities
|
|
1,225,982
|
|
|
25,858
|
|
|
—
|
|
|
1,251,840
|
|
||||
|
|
|
|
|
|
|
|
|
|
|
|
|
|||||
|
Total Liabilities
|
|
21,288,370
|
|
|
1,604,539
|
|
|
(49,749
|
)
|
|
22,843,160
|
|
||||
|
|
|
|
|
|
|
|
|
|
|
|
|
|||||
|
Redeemable Non-Controlling Interests in Consolidated Entities
|
|
3
|
|
|
1,715,003
|
|
|
—
|
|
|
1,715,006
|
|
||||
|
|
|
|
|
|
|
|
|
|
|
|
|
|||||
|
Equity
|
||||||||||||||||
|
Common Stock
|
|
7
|
|
|
—
|
|
|
—
|
|
|
7
|
|
||||
|
Series I Preferred Stock
|
|
—
|
|
|
—
|
|
|
—
|
|
|
—
|
|
||||
|
Series II Preferred Stock
|
|
—
|
|
|
—
|
|
|
—
|
|
|
—
|
|
||||
|
Additional Paid-in-Capital
|
|
5,935,273
|
|
|
800,381
|
|
|
(800,381
|
)
|
|
5,935,273
|
|
||||
|
Retained Earnings
|
|
1,748,106
|
|
|
17,456
|
|
|
(17,456
|
)
|
|
1,748,106
|
|
||||
|
Accumulated Other Comprehensive Income (Loss)
|
|
(35,346
|
)
|
|
7,871
|
|
|
—
|
|
|
(27,475
|
)
|
||||
|
Non-Controlling Interests in Consolidated Entities
|
|
3,757,677
|
|
|
1,298,803
|
|
|
—
|
|
|
5,056,480
|
|
||||
|
Non-Controlling Interests in Blackstone Holdings
|
|
5,253,670
|
|
|
—
|
|
|
—
|
|
|
5,253,670
|
|
||||
|
|
|
|
|
|
|
|
|
|
|
|
|
|||||
|
Total Equity
|
|
16,659,387
|
|
|
2,124,511
|
|
|
(817,837
|
)
|
|
17,966,061
|
|
||||
|
|
|
|
|
|
|
|
|
|
|
|
|
|||||
|
Total Liabilities and Equity
|
$
|
37,947,760
|
|
$
|
5,444,053
|
|
$
|
(867,586
|
)
|
$
|
42,524,227
|
|
||||
|
|
|
|
|
|
|
|
|
|
|
|
|
|||||
|
(a)
|
The Consolidated Blackstone Funds consisted of the following:
|
Blackstone / GSO Global Dynamic Credit Feeder Fund (Cayman) LP**
Blackstone / GSO Global Dynamic Credit Funding Designated Activity Company**
Blackstone / GSO Global Dynamic Credit Master Fund**
229
Blackstone / GSO Global Dynamic Credit USD Feeder Fund (Ireland)**
Blackstone Annex Onshore Fund L.P.
Blackstone Horizon Fund L.P.
Blackstone Real Estate Special Situations Holdings L.P.**
Blackstone Strategic Alliance Fund L.P.**
BTD CP Holdings LP
Blackstone Dislocation Fund L.P.
BEPIF (Aggregator) SCSp
BX Shipston SCSp
Blackstone Private Equity Strategies Fund L.P.
Blackstone Private Equity Strategies Fund SICAV
Blackstone Private Equity Strategies Fund (Master) FCP*
Blackstone Infrastructure Hogan Co-Invest (CYM) L.P.**
Clover Credit Partners CLO III, Ltd.*
Bayswater Park CLO, Ltd.*
Peebles Park CLO, Ltd.*
Mezzanine side-by-side investment vehicles**
Private equity side-by-side investment vehicles
Real estate side-by-side investment vehicles
Hedge Fund Solutions side-by-side investment vehicles.
|
*
|
Consolidated as of December 31, 2023 only
|
|
**
|
Consolidated as of December 31, 2022 only
|
230
|
Item 9.
|
Changes in and Disagreements With Accountants on Accounting and Financial Disclosure
|
None.
|
Item 9A.
|
Controls and Procedures
|
Evaluation of Disclosure Controls and Procedures
We maintain “disclosure controls and procedures,” as such term is defined in Rules
13a-15(e)
and
15d-15(e)
under the Securities Exchange Act of 1934, as amended (the “Exchange Act”), that are designed to ensure that information required to be disclosed by us in reports that we file or submit under the Exchange Act is recorded, processed, summarized and reported within the time periods specified in Securities and Exchange Commission rules and forms, and that such information is accumulated and communicated to our management, including our Chief Executive Officer and Chief Financial Officer, as appropriate, to allow timely decisions regarding required disclosure. In designing disclosure controls and procedures, our management necessarily was required to apply its judgment in evaluating the cost-benefit relationship of possible disclosure controls and procedures. The design of any disclosure controls and procedures also is based in part upon certain assumptions about the likelihood of future events, and there can be no assurance that any design will succeed in achieving its stated goals under all potential future conditions. Any controls and procedures, no matter how well designed and operated, can provide only reasonable assurance of achieving the desired objectives.
Our management, including our Chief Executive Officer and Chief Financial Officer, evaluated the effectiveness of our disclosure controls and procedures pursuant to Rule
13a-15
and
15d-15(e)
under the Exchange Act as of the end of the period covered by this report. Based on that evaluation, our Chief Executive Officer and Chief Financial Officer have concluded that, as of the end of the period covered by this Annual Report on Form
10-K,
our disclosure controls and procedures (as defined in Rule
13a-15(e)
and
15d-15(e)
under the Exchange Act) are effective at the reasonable assurance level to accomplish their objectives of ensuring that information we are required to disclose in reports that we file or submit under the Exchange Act is recorded, processed, summarized and reported within the time periods specified in Securities and Exchange Commission rules and forms, and that such information is accumulated and communicated to our management, including our Chief Executive Officer and Chief Financial Officer, as appropriate, to allow timely decisions regarding required disclosure.
Changes in Internal Control over Financial Reporting
No change in our internal control over financial reporting (as such term is defined in Rules 13a–15(f) and 15d–15(f) under the Exchange Act) occurred during our most recent quarter that has materially affected, or is reasonably likely to materially affect, our internal control over financial reporting.
Management’s Report on Internal Control Over Financial Reporting
Management of Blackstone Inc. and subsidiaries (“Blackstone”) is responsible for establishing and maintaining adequate internal control over financial reporting. Blackstone’s internal control over financial reporting is a process designed under the supervision of its principal executive and principal financial officers to provide reasonable assurance regarding the reliability of financial reporting and the preparation of its consolidated financial statements for external reporting purposes in accordance with accounting principles generally accepted in the United States of America.
231
Blackstone’s internal control over financial reporting includes policies and procedures that pertain to the maintenance of records that, in reasonable detail, accurately and fairly reflect transactions and dispositions of assets; provide reasonable assurances that transactions are recorded as necessary to permit preparation of financial statements in accordance with generally accepted accounting principles, and that receipts and expenditures are being made only in accordance with authorizations of management and the directors; and provide reasonable assurance regarding prevention or timely detection of unauthorized acquisition, use or disposition of Blackstone’s assets that could have a material effect on its financial statements.
Because of its inherent limitations, internal control over financial reporting may not prevent or detect misstatements. In addition, projections of any evaluation of effectiveness to future periods are subject to the risk that controls may become inadequate because of changes in conditions or that the degree of compliance with the policies or procedures may deteriorate.
Management conducted an assessment of the effectiveness of Blackstone’s internal control over financial reporting as of December 31, 2023 based on the framework established in
issued by the Committee of Sponsoring Organizations of the Treadway Commission. Based on this assessment, management has determined that Blackstone’s internal control over financial reporting as of December 31, 2023 was effective.
Internal Control — Integrated Framework (2013)
Deloitte & Touche LLP, an independent registered public accounting firm, has audited Blackstone’s financial statements included in this Annual Report on
Form 10-K
and issued its report on the effectiveness of Blackstone’s internal control over financial reporting as of December 31, 2023, which is included herein.
|
Item 9B.
|
Other Information
|
Section 13(r) Disclosure
Pursuant to Section 219 of the Iran Threat Reduction and Syria Human Rights Act of 2012, which added Section 13(r) of the Exchange Act, Blackstone hereby incorporates by reference herein Exhibit 99.1 of this report, which includes disclosures provided to us by Atlantia S.p.A.
2007 Equity Incentive Plan
On February 22, 2024, upon approval of the Series II Preferred Stockholder, the 2007 Equity Incentive Plan was amended and restated to extend the term of the plan until February 22, 2034.
|
Item 9C.
|
Disclosures Regarding Foreign Jurisdictions that Prevent Inspections
|
Not applicable.
232
Part III.
|
Item 10.
|
Directors, Executive Officers and Corporate Governance
|
Directors and Executive Officers of Blackstone Inc.
Our directors and executive officers as of the date of this filing are:
|
Name
|
Age
|
Position
|
||
|
Stephen A. Schwarzman
|
77
|
Co-Founder,
Chairman and Chief Executive Officer and Director
|
||
|
Jonathan D. Gray
|
54
|
President, Chief Operating Officer and Director
|
||
|
Michael S. Chae
|
55
|
Chief Financial Officer
|
||
|
John G. Finley
|
67
|
Chief Legal Officer
|
||
|
Vikrant Sawhney
|
53
|
Chief Administrative Officer and Global Head of Institutional Client Solutions
|
||
|
Joseph P. Baratta
|
53
|
Director
|
||
|
Kelly A. Ayotte
|
55
|
Director
|
||
|
James W. Breyer
|
62
|
Director
|
||
|
Reginald J. Brown
|
56
|
Director
|
||
|
Rochelle B. Lazarus
|
76
|
Director
|
||
|
The Right Honorable Brian Mulroney
|
84
|
Director
|
||
|
William G. Parrett
|
78
|
Director
|
||
|
Ruth Porat
|
66
|
Director
|
Stephen A. Schwarzman
Co-Founder
of Blackstone and the Chairman of our board of directors. Mr. Schwarzman was elected Chairman of the board of directors effective March 20, 2007. He also sits on the firm’s Management Committee. Mr. Schwarzman has been involved in all phases of the firm’s development since its founding in 1985. Mr. Schwarzman is an active philanthropist with a history of supporting education, as well as culture and the arts, among other things. In 2020, he signed The Giving Pledge, committing to give the majority of his wealth to philanthropic causes. In both business and philanthropy, Mr. Schwarzman has dedicated himself to tackling big problems with transformative solutions. Since 2019, he has donated £185 million to the University of Oxford to help redefine the study of the humanities for the 21st century. His gift – the largest single donation to Oxford since the renaissance – will create a new Centre for the Humanities which unites all humanities faculties under one roof for the first time in Oxford’s history and will offer new performing arts and exhibition venues as well as a new Institute for Ethics in AI. In October 2018, he announced a foundational $350 million gift to establish the MIT Schwarzman College of Computing, an interdisciplinary hub which will reorient MIT to address the opportunities and challenges presented by the rise of artificial intelligence, including critical ethical and policy considerations to ensure that the technologies are employed for the common good. Since 2015, Mr. Schwarzman has donated $162.8 million to Yale University to establish the Schwarzman Center, a
first-of-its-kind
Co-Chair
of the board of trustees of Schwarzman Scholars. In 2007, Mr. Schwarzman donated $100 million to the New York Public Library on whose board he serves. In 2019, Mr. Schwarzman published his first book,
What It Takes: Lessons in the Pursuit of Excellence
co-chair
of the Partnership for New York City and serves on the boards of The Asia Society and New York Presbyterian Hospital, as
233
well as on The Advisory Board of the School of Economics and Management at Tsinghua University, Beijing. He is a Trustee of The Frick Collection in New York City and Chairman Emeritus of the board of directors of The John F. Kennedy Center for the Performing Arts. In 2007, Mr. Schwarzman was included in TIME’s “100 Most Influential People.” In 2016, he topped Forbes Magazine’s list of the most influential people in finance and in 2018 was ranked in the Top 50 on Forbes’ list of the “World’s Most Powerful People.” The Republic of France has awarded Mr. Schwarzman both the Légion d’Honneur and the Ordre des Arts et des Lettres at the Commandeur level. Mr. Schwarzman is one of the only Americans to receive both awards recognizing significant contributions to France. He was also awarded the Order of the Aztec Eagle, Mexico’s highest honor for foreigners, for his work on behalf of the U.S. in support of the U.S.-Mexico-Canada Agreement in 2018. Mr. Schwarzman holds a BA from Yale University and an MBA from Harvard Business School. He has served as an adjunct professor at the Yale School of Management and on the Harvard Business School Board of Dean’s Advisors.
Jonathan D. Gray
Michael S. Chae
John G. Finley
Co-Head
of Global Mergers & Acquisitions. Mr. Finley is an Adviser on the American Law Institute’s Restatement of the Law, Corporate Governance project and a member of the Dean’s Advisory Board of Harvard Law School, Advisory Board of the Harvard Law School Program on Corporate Governance, Gettysburg Foundation, and Board of Advisors of the Penn Institute for Law and Economics. Mr. Finley previously served as a director at Tradeweb. He has served on the Committee of Securities Regulation of the New York State Bar Association and the Board of Advisors of the Knight-Bagehot Fellowship in Economics and Business Journalism at Columbia University. Mr. Finley received a BS in Economics from the Wharton School of the University of Pennsylvania, a BA in History from the College of Arts and Sciences of the University of Pennsylvania, and a JD from Harvard Law School.
234
Vikrant Sawhney
Joseph P. Baratta
Kelly A. Ayotte
non-profit
boards of the International Republican Institute, NH Veteran’s Count and NH Swim with a Mission. Ms. Ayotte is also a member of the board of advisors for the Center on Military and Political Power at the Foundation for Defense of Democracies.
James W. Breyer
Wal-Mart
Stores, Inc. from 2001 to 2013, as well as a number of other technology companies. Mr. Breyer is currently a
235
member of Harvard Business School’s Board of Dean’s Advisors, a member of Harvard University’s Global Advisory Council, a founding member of the Dean’s Advisory Board of Stanford University’s School of Engineering, Chairman of the Stanford Engineering Venture Fund and founding member of the Stanford Institute for Human-Assisted Artificial Intelligence Advisory Board. In addition, Mr. Breyer is a long-time active volunteer as a Trustee of the San Francisco Museum of Modern Art, the Metropolitan Museum of Art, the American Film Institute and Stanford’s Center for Philanthropy and Civil Society.
Reginald J. Brown
Rochelle B. Lazarus
The Right Honorable Brian Mulroney
William G. Parrett
co-founded
the Global Financial Services Industry practice of Deloitte and served as its first Chairman. Mr. Parrett is a member of the boards of directors of ThoughtWorks, where he is the chair of the audit committee and a member of the nominating and governance committee, and Oracle Corporation, where he is a member of the nominating and governance committee. Mr. Parrett is a senior advisor to the New York Foundation for Senior Citizens. Mr. Parrett was also previously a member of the boards of directors of Eastman Kodak Company, Thermo Fisher Scientific Inc., UBS AG, UBS Americas and Conduent Inc. Mr. Parrett is a past Senior Trustee of the United States Council for International Business and a past Chairman of the Board of Trustees of United Way Worldwide. Mr. Parrett is a Certified Public Accountant with an active license.
236
Ruth Porat
Co-Head
of Technology Investment Banking and Global Head of the Financial Institutions Group. Ms. Porat is a member of the boards of directors of the Stanford Management Company, the Council on Foreign Relations, and Bloomberg Philanthropies, and the Board of Trustees of Memorial Sloan Kettering Cancer Center. She previously spent ten years on Stanford University’s Board of Trustees. Ms. Porat holds a BA from Stanford University, an MSc from The London School of Economics and an MBA from the Wharton School.
Governance and Board Composition
Our capital stock consists of common stock, Series I preferred stock and Series II preferred stock. Under our amended and restated certificate of incorporation and Delaware law, holders of our common stock are entitled to vote, together with holders of our Series I preferred stock, voting as a single class, on a number of significant matters, including certain sales, exchanges or other dispositions of all or substantially all of our assets, a merger, consolidation or other business combination, the removal of the Series II Preferred Stockholder and forced transfer by the Series II Preferred Stockholder (as defined below) of its shares of Series II preferred stock and the designation of a successor Series II Preferred Stockholder. The single share of outstanding Series II preferred stock is currently held by Blackstone Group Management L.L.C. (the “Series II Preferred Stockholder”), an entity owned by our senior managing directors and controlled by our
Co-Founder,
Mr. Schwarzman.
The Series II Preferred Stockholder elects our board of directors in accordance with the Series II Preferred Stockholder’s limited liability company agreement, where our senior managing directors have agreed that our
Co-Founder,
Mr. Schwarzman will have the power to vote upon, act upon, consent to, approve or otherwise determine any matters to be voted upon, acted upon, consented to, approved or otherwise determined by the members of the Series II Preferred Stockholder. The limited liability company agreement of our Series II Preferred Stockholder provides that at such time as Mr. Schwarzman should cease to be a founding member, Jonathan D. Gray will thereupon succeed Mr. Schwarzman as the sole founding member of our Series II Preferred Stockholder, and thereafter such power will revert to the members of Series II Preferred Stockholder holding a majority in interest in the Series II Preferred Stockholder.
In identifying candidates for membership on the board of directors, Mr. Schwarzman, acting on behalf of the Series II Preferred Stockholder, takes into account (a) minimum individual qualifications, such as strength of character, mature judgment, industry knowledge or experience and an ability to work collegially with the other members of the board of directors, and (b) all other factors he considers appropriate.
After conducting an initial evaluation of a candidate, Mr. Schwarzman will interview that candidate if he believes the candidate might be suitable to be a director and may also ask the candidate to meet with other directors and senior management. If, following such interview and any consultations with directors and senior management, Mr. Schwarzman believes a candidate would be a valuable addition to the board of directors, he will appoint that individual to the board of directors.
When considering whether the members of the board of directors have the experience, qualifications, attributes and skills, taken as a whole, to enable the board to satisfy its oversight responsibilities effectively in light of Blackstone’s business and structure, Mr. Schwarzman focused on the information described in each of the board members’ biographical information set forth above. In particular, with regard to Ms. Ayotte, Mr. Schwarzman
237
considered her distinguished career in government and public service, especially her service as a United States Senator and as New Hampshire Attorney General. With regard to Mr. Breyer, Mr. Schwarzman considered his extensive financial background and significant investment experience at Breyer Capital and Accel Partners. With regard to Mr. Brown, Mr. Schwarzman considered his distinguished career in public service and experience advising large institutions and prominent figures in the private and public sector. With regard to Ms. Lazarus, Mr. Schwarzman considered her extensive business background and her management experience in a variety of senior leadership roles at Ogilvy & Mather. With regard to Mr. Mulroney, Mr. Schwarzman considered his distinguished career of government service, especially his service as the Prime Minister of Canada. With regard to Mr. Parrett, Mr. Schwarzman considered his significant experience, expertise and background with regard to auditing and accounting matters, his leadership role at Deloitte and his extensive experience serving as a director on boards of directors. With regard to Ms. Porat, Mr. Schwarzman considered her extensive experience in the financial industry and her leadership roles with Alphabet, Google and Morgan Stanley. With regard to Messrs. Gray and Baratta, Mr. Schwarzman considered their leadership and extensive knowledge of our business and operations gained through their years of service at our firm and, with regard to himself, Mr. Schwarzman considered his role as
co-founder
and long-time Chief Executive Officer of our firm.
Controlled Company Exception and Director Independence
Because the Series II Preferred Stockholder holds more than 50% of the voting power for the election of directors, we are a “controlled company” within the meaning of the corporate governance standards of the NYSE. Under these standards, a “controlled company” may elect not to comply with certain corporate governance standards, including the requirements (a) that a majority of its board of directors consist of independent directors, (b) that its board of directors have a compensation committee that is comprised entirely of independent directors with a written charter addressing the committee’s purpose and responsibilities and (c) that its board of directors have a nominating and corporate governance committee that is comprised entirely of independent directors with a written charter addressing the committee’s purpose and responsibilities. See “Part I. Item 1A Risk Factors — Risks Related to Our Organizational Structure — We are a controlled company and as a result qualify for some exceptions from certain corporate governance and other requirements of the New York Stock Exchange.” We currently utilize the second and third of these exemptions. In the event that we cease to be a “controlled company” and our shares of common stock continue to be listed on the NYSE, we will be required to comply with these provisions within the applicable transition periods. While we are exempt from the NYSE rules requiring a majority of independent directors, we currently have and intend to continue to maintain a majority independent board of directors.
Our board of directors has a total of ten members, including seven members, Messrs. Breyer, Brown, Mulroney and Parrett, and Mses. Ayotte, Lazarus and Porat, who are independent under NYSE rules relating to corporate governance matters and the independence standards described in our governance policy. In addition, Sir John Antony Hood, who stepped down from our board of directors effective August 25, 2023, satisfied the independence requirements of the NYSE during his tenure.
Board Committees
Our board of directors has three standing committees: the audit committee, the compensation committee and the executive committee.
Audit Committee
238
material risk to our operations and financial results, including major financial and cybersecurity risks and exposures and our guidelines and policies with respect to risk assessment and risk management. The members of the audit committee meet the independence standards and financial literacy requirements for service on an audit committee of a board of directors pursuant to the NYSE listing standards and SEC rules applicable to audit committees. The board of directors has determined that each of Mr. Parrett and Mses. Lazarus and Porat is an “audit committee financial expert” within the meaning of Item 407(d)(5) of
Regulation S-K.
The audit committee has a charter, which is available on our website at http://ir.blackstone.com under “Corporate Governance.”
Compensation Committee
Executive Committee
Code of Business Conduct and Ethics
We have a Code of Business Conduct and Ethics and a Code of Ethics for Financial Professionals, which apply to our principal executive officer, principal financial officer and principal accounting officer. Each of these codes is available on our website at http://ir.blackstone.com under “Corporate Governance.” We intend to disclose any amendment to or waiver of the Code of Ethics for Financial Professionals and any waiver of our Code of Business Conduct and Ethics on behalf of an executive officer or director either on our website or by filing a Current Report on
Form 8-K.
Corporate Governance Guidelines
The board of directors has a Governance Policy, which addresses matters such as the board of directors’ responsibilities and duties and the board of directors’ composition and compensation. The Governance Policy is available on our website at http://ir.blackstone.com under “Corporate Governance.”
Communications to the Board of Directors
The
non-management
members of our board of directors meet at least quarterly. The presiding director at these
non-management
board member meetings is Mr. Parrett. All interested parties, including any employee or stockholder, may send communications to the
non-management
members of our board of directors by writing to: Blackstone Inc., Attn: Audit Committee, 345 Park Avenue, New York, New York 10154.
239
|
Item 11.
|
Executive Compensation
|
Compensation Discussion and Analysis
Overview of Compensation Philosophy and Program
The intellectual capital collectively possessed by our senior managing directors (including our named executive officers) and other employees is the most important asset of our firm. We invest in people. We hire qualified people, train them, encourage them to provide their best thinking to the firm for the benefit of the investors in the funds we manage, and compensate them in a manner designed to retain and motivate them and align their interests with those of the investors in our funds and our stockholders.
Our overriding compensation philosophy for our senior managing directors and certain other employees is that compensation should be composed primarily of (a) annual cash bonus payments tied to Blackstone’s overall performance and the performance of the applicable business unit(s) in which such employee works, (b) performance interests (composed primarily of Performance Allocations, commonly referred to as carried interest, and incentive fee interests) tied to the performance of the investments made by the funds in the business unit in which such employee works or for which he or she has responsibility, and (c) deferred equity awards reflecting the value of our common stock. We believe that the appropriate combination of annual cash bonus payments and performance interests and/or deferred equity awards encourages our senior managing directors and other employees to focus on the underlying performance of our investment funds, as well as the overall performance of the firm and interests of our stockholders, and that base salary should represent a significantly lesser component of total compensation.
We believe that the proportion of compensation that is “at risk” should increase as an employee’s level of responsibility rises. Base salary generally represents a smaller percentage of the total compensation of employees at higher total compensation levels compared to employees at lower total compensation levels. Employees at higher total compensation levels are generally targeted to receive a greater percentage of their total compensation in the form of participation in performance interests, deferred equity awards and, to a lesser extent, annual cash bonuses subject to deferral.
Our compensation program includes significant elements that discourage excessive risk-taking and align the compensation of our employees with the long-term performance of the firm. For example, for accounting purposes we accrue compensation for the Performance Plans (as defined below) related to our carry funds as increases in the carrying value of the portfolio investments are recorded in those carry funds. Notwithstanding this fact, we only make cash payments to our employees related to carried interest when profitable investments have been realized and cash is distributed first to the investors in our funds, followed by the firm and only then to employees of the firm. Moreover, if a carry fund fails to achieve specified investment returns due to diminished performance of later investments, our Performance Plans entitle us to “clawback” carried interest payments previously made to an employee for the benefit of the limited partner investors in that fund, and we escrow a portion of all carried interest payments made to employees to help fund their potential future “clawback” obligations, all of which further discourages excessive risk-taking by our employees. Similarly, for our investment funds that pay incentive fees, those incentive fees are only paid to the firm and employees of the firm to the extent an applicable fund’s portfolio of investments has profitably appreciated in value (in most cases above a specified level) during the applicable period. In addition, and as noted below with respect to our named executive officers, requiring our professional employees to invest in certain of the funds they manage directly aligns the interests of our professionals and our fund investors. In most cases, the carried interest earned on these investments represent a significant percentage of such professional employees’
after-tax
compensation. Lastly, because our equity awards have significant vesting or deferral provisions, the actual amount of compensation realized by the recipient is tied directly to the long-term performance of our common stock. In applicable jurisdictions, specifically in the European Union and the United Kingdom, our compensation program includes additional remuneration policies that may limit or otherwise alter the compensation for certain employees consistent with local regulatory requirements and are aimed at, among other things, discouraging inappropriate risk-taking and aligning compensation with the firm’s strategy and long-term interests consistent with our general compensation program.
240
We believe our current compensation and benefit offerings for senior professionals are best in class and are consistent with companies in the alternative asset management industry. We generally do not rely on compensation surveys or compensation consultants. Our senior management periodically reviews the effectiveness and competitiveness of our compensation program, and such reviews may in the future involve the assistance of independent consultants.
Personal Investment Obligations
Minimum Retained Ownership Requirements
Named Executive Officers
In 2023, our named executive officers were:
|
Executive
|
Title
|
|
|
Stephen A. Schwarzman
|
Co-Founder,
Chairman and Chief Executive Officer
|
|
|
Jonathan D. Gray
|
President and Chief Operating Officer
|
|
|
Michael S. Chae
|
Chief Financial Officer
|
|
|
John G. Finley
|
Chief Legal Officer
|
|
|
Vikrant Sawhney
|
Chief Administrative Officer and Global Head of Institutional Client Solutions
|
Compensation Elements for Named Executive Officers
The key elements of the compensation of our named executive officers for 2023 were base compensation, which is composed of base salary, cash bonus and equity-based compensation, and performance compensation, which is composed of carried interest and incentive fee allocations:
1.
Base Salary
. Each named executive officer received a $350,000 annual base salary in 2023, which equals the total yearly partnership drawings that were received by each of our senior managing directors prior to our initial public offering in 2007. In keeping with historical practice, we continue to pay this amount as a base salary.
2.
Annual Cash Bonus Payments / Deferred Equity Awards
. Since our initial public offering, Mr. Schwarzman has not received any cash compensation other than the $350,000 annual salary described above and the actual realized carried interest distributions or incentive fees he may receive in respect of his participation in the carried interest or incentive fees earned from our funds through our Performance Plans described below. We believe that having Mr. Schwarzman’s compensation largely based on ownership of a portion of the carried interest or incentive fees earned from our funds aligns his interests with those of the investors in our funds and our stockholders.
241
Each of our named executive officers other than Mr. Schwarzman received annual cash bonus payments in respect of 2023 in addition to their base salary. These cash bonus payments included participation interests in the earnings of the firm’s various investment businesses. For all named executive officers, the amount of cash payments paid to such named executive officer at the end of the year in respect of such year was determined in the discretion of Mr. Schwarzman and Mr. Gray, as described below. Earnings for the firm’s investment businesses are calculated based on the annual operating income of the businesses and are generally a function of the performance of the businesses, which is evaluated by Mr. Schwarzman and Mr. Gray. The ultimate cash payment amounts were based on (a) the prior and anticipated performance of the named executive officer, (b) the prior and anticipated performance of the firm’s segments and product lines, (c) the overall success of the firm and (d) where applicable, the estimated participation interests given to the named executive officer at the beginning of the year in respect of the investments to be made in that year. We make annual cash bonus payments in the first quarter of the ensuing year to reward individual performance for the prior year. The ultimate cash payments that are made are fully discretionary as further discussed below under “— Determination of Incentive Compensation.”
For 2023, all named executive officers other than Mr. Schwarzman were selected to participate in the Bonus Deferral Plan. The Bonus Deferral Plan provides for the deferral of a portion of each participant’s annual cash bonus payment. Except as otherwise determined by the Plan Administrator (as defined in the Bonus Deferral Plan), the amount of each participant’s annual cash bonus payment deferred under the Bonus Deferral Plan is calculated pursuant to a deferral rate table using the participant’s total annual incentive compensation, which generally includes such participant’s annual cash bonus payment and a portion of any incentive fees earned in connection with our investment funds and is subject to certain adjustments, including reductions for mandatory contributions to our investment funds. By deferring a portion of a participant’s compensation, the Bonus Deferral Plan acts as an employment retention mechanism and thereby enhances the alignment of interests between such participant and the firm. Many publicly traded asset managers utilize deferred compensation plans as a means of retaining and motivating their professionals, and we believe that it is in the interest of our stockholders to do the same for our personnel.
On January 8, 2024, Mr. Gray, Mr. Chae, Mr. Finley and Mr. Sawhney each received a deferral award under the Bonus Deferral Plan of deferred restricted common stock units in respect of their service in 2023. The percentage of the 2023 annual cash bonus payment mandatorily deferred into deferred restricted common stock units for Messrs. Gray, Chae, Finley and Sawhney was approximately 100%, 30%, 40% and 25%, respectively. These awards are reflected as stock awards for fiscal year 2023 in the Summary Compensation Table and in the Grants of Plan-Based Awards in 2023 table.
3.
Discretionary Equity Awards
. On April 1, 2023, Mr. Gray, Mr. Chae, Mr. Finley and Mr. Sawhney were awarded a discretionary award of 349,191, 116,397, 104,758 and 104,758 deferred restricted common stock units, respectively. These awards reflected 2022 performance and were intended to further promote retention and to incentivize future performance. The awards were granted under the 2007 Equity Incentive Plan. The awards will vest 10% on July 1, 2024, 10% on July 1, 2025, 20% on July 1, 2026, 30% on July 1, 2027 and 30% on July 1, 2028. These awards are reflected as stock awards for fiscal 2023 in the Summary Compensation Table and in the Grants of Plan-Based Awards in 2023 table.
In January 2024, Mr. Gray, Mr. Chae, Mr. Finley and Mr. Sawhney were each informed of anticipated discretionary awards of deferred restricted common stock units with values of $25,000,000, $10,000,000, $9,000,000 and $9,000,000, respectively. These anticipated awards reflect 2023 performance and are intended to further promote retention and to incentivize future performance. These awards are expected to be granted under the 2007 Equity Incentive Plan on April 1, 2024, subject to the named executive officer’s continued employment through such date. Once granted, these awards will vest 10% on July 1, 2025, 10% on July 1, 2026, 20% on July 1, 2027, 30% on July 1, 2028 and 30% on July 1, 2029 and will be reflected as stock awards for fiscal 2024 in the Summary Compensation Table and in the Grants of Plan-Based Awards in 2024 table.
242
4.
Participation in Carried Interest and Incentive Fees
. During 2023, all of our named executive officers participated in the carried interest of our carry funds and/or the incentive fees of our funds that pay incentive fees through their participation interests in the carry or incentive fee pools generated by these funds. The carry or incentive fee pool with respect to each fund in a given year is funded by a fixed percentage of the total amount of carried interest or incentive fees earned by Blackstone for such fund in that year. We refer to these pools and employee participation therein as our “Performance Plans” and payments made thereunder as “performance payments.” The aggregate amount of performance payments payable through our Performance Plans is directly tied to the performance of the funds, which we believe fosters a strong alignment of interests between the investors in those funds and the named executive officers, and therefore benefits our stockholders. In addition, most alternative asset managers, including several of our competitors, use participation in carried interest or incentive fees as a central means of compensating and motivating their professionals, and we must do the same in order to attract and retain the most qualified personnel. For purposes of our financial statements, we treat the income allocated to all our personnel who have participation interests in the carried interest or incentive fees generated by our funds as compensation, and the amounts of carried interest and incentive fees earned by named executive officers are reflected as “All Other Compensation” in the Summary Compensation Table. Distributions in respect of our Performance Plans for each named executive officer are determined on the basis of the percentage participation in the relevant investments previously allocated to that named executive officer, which percentage participations are established in January of each year in respect of the investments to be made in that year. The percentage participation for a named executive officer may vary from year to year and fund to fund due to several factors, which may include changes in the size and composition of the pool of Blackstone personnel participating in such Performance Plan in a given year, the performance of our various businesses, new developments in our businesses and product lines, and the named executive officer’s leadership and oversight of the function for which the named executive officer is responsible and such named executive officer’s contributions with respect to our strategic initiatives. In addition, certain of our employees, including our named executive officers, may participate in profit sharing initiatives whereby these individuals may receive allocations of investment income from Blackstone’s firm investments. Our employees, including our named executive officers, may also receive equity awards in our investment advisory clients and/or be allocated securities of such clients that we have received.
(a)
. Distributions of carried interest in cash (or, in some cases,
Carried Interest
in-kind)
to our named executive officers and other employees who participate in our Performance Plans relating to our carry funds depends on the realized proceeds and timing of the cash realizations of the investments owned by the carry funds in which they participate. Our carry fund agreements also set forth specified preconditions to a carried interest distribution, which typically include that there must have been a positive return on the relevant investment and that the fund must be above its carried interest hurdle rate. In addition, as described below, employees or senior managing directors may also be required to have fulfilled specified service requirements to be eligible to receive carried interest distributions. For our carry funds, carried interest distributions for the named executive officer’s participation interests are generally made to the named executive officer following the actual realization of the investment, although a portion of such carried interest is held back by the firm in respect of any future “clawback” obligation related to the fund. In allocating participation interests in the carry pools, we have not historically taken into account or based such allocations on any prior or projected triggering of any “clawback” obligation related to any fund. To the extent any “clawback” obligation were to be triggered for a fund, carried interest previously distributed to a named executive officer would have to be returned to the limited partners of such fund, thereby reducing the named executive officer’s overall compensation for any such year. Moreover, because a carried interest recipient (including Blackstone itself) may have to fund more than its respective share of a “clawback” obligation under the governing documents (generally, up to an additional 67%), the compensation paid to a named executive officer for any given year could be significantly reduced or even negative in the event a “clawback” obligation were to arise.
Participation in carried interest generated by our carry funds for all named executive officers other than Mr. Schwarzman is subject to vesting. Vesting serves as an employment retention mechanism and thereby enhances the alignment of interests between a participant in our Performance Plans and the firm. Carried interest generally vests in equal installments on the first through fourth anniversary of the closing of the investment to which it relates (unless an investment is realized prior to the expiration of such four-year anniversary, in which case an active named executive officer is deemed 100% vested in the proceeds of such realizations). In addition, any named executive officer who is retirement eligible will automatically vest in 50% of their otherwise unvested carried interest allocation upon retirement. (See “—
Non-Competition
and
Non-Solicitation
Agreements — Retirement.”) We believe that vesting requirements of carried interest participation enhances the stability of our senior management team and provides greater incentives for our named executive officers to remain at the firm. Due to his unique status as a
co-founder
and the longtime chief executive officer of our firm, Mr. Schwarzman vests in 100% of his carried interest participation related to any investment by a carry fund upon the closing of that investment.
243
(b)
. Cash distributions of incentive fees to our named executive officers and other employees who participate in our Performance Plans relating to the funds that pay incentive fees depend on the performance of the investments owned by those funds in which they participate. For our investment funds that pay incentive fees, those incentive fees are only paid to the firm and employees of the firm to the extent an applicable fund’s portfolio of investments has profitably appreciated in value (in most cases above a specified level) during the applicable period and following the calculation of the profit split (if any) between the fund’s general partner or investment adviser and the fund’s investors.
Incentive Fees
(c)
. BXMT and Blackstone Real Estate Income Trust (“BREIT”) are investment advisory clients of Blackstone. Compensation we receive from investment advisory clients in the form of securities may be allocated to employees and senior managing directors. In 2023, Messrs. Schwarzman, Gray, Chae, Finley and Sawhney were allocated restricted shares of listed common stock of BXMT in connection with investment advisory services provided by Blackstone to BXMT. In 2023, Messrs. Schwarzman, Gray, Chae, Finley and Sawhney were also allocated fully vested shares of BREIT. The BREIT shares were allocated in the first quarter of 2023 in respect of 2022 performance. The value of these allocated shares is reflected as “All Other Compensation” in the Summary Compensation Table.
Investment Advisory Client Interests
5.
Other Benefits
. Upon the consummation of our initial public offering in June 2007, we entered into a founding member agreement with our
co-founder,
Mr. Schwarzman, which provides (as subsequently amended) specified benefits to him following his retirement. (See “— Narrative Disclosure to Summary Compensation Table and Grants of Plan-Based Awards in 2023 — Schwarzman Founding Member Agreement.”) Mr. Schwarzman is provided certain security services, which may include home security systems and monitoring, and personal and related security services. These security services are provided for our benefit, and we consider the related expenses to be appropriate business expenses rather than personal benefits for Mr. Schwarzman. Nevertheless, the expenses associated with these security services are reflected in the “All Other Compensation” column of the Summary Compensation Table below to the extent the aggregate amount of all perquisites or other personal benefits received exceeded $10,000.
Determination of Incentive Compensation
Mr. Schwarzman reserves final approval of each named executive officer’s compensation, other than his own, and receives recommendations from Mr. Gray on such compensation determinations (other than with respect to Mr. Gray’s own compensation). Mr. Schwarzman’s compensation has been established pursuant to the terms of his amended and restated founding member agreement, which is described below under “Narrative Disclosure to Summary Compensation Table and Grants of Plan-Based Awards in 2023 — Schwarzman Founding Member Agreement.” For 2023, these decisions were based primarily on Mr. Schwarzman’s and Mr. Gray’s assessment of such named executive officer’s individual performance, operational performance for the areas of the business for which the named executive officer has responsibility, and the named executive officer’s potential to enhance investment returns for the investors in our funds and service to our advisory clients, and to contribute to long-term stockholder value. In evaluating these factors, Mr. Schwarzman and Mr. Gray relied upon their judgment to determine the ultimate amount of a named executive officer’s annual cash bonus payment and participation in carried interest, incentive fees and investment advisory client interests that was necessary to properly induce the named executive officer to seek to achieve our objectives and reward a named executive officer in achieving those objectives over the course of the prior year. Key factors that Mr. Schwarzman considered in making such determination with respect to Mr. Gray were his service as President and Chief Operating Officer, his role in overseeing the growth and operations of the firm, and his leadership on the strategic direction of the firm. Key factors that Messrs. Schwarzman and Gray considered in making such determinations with respect to Mr. Chae were his leadership and oversight of our global finance, treasury, technology and corporate development functions and his role in strategic initiatives undertaken by the firm. Key factors that Messrs. Schwarzman and Gray considered in making such determinations with respect to Mr. Finley were his leadership and oversight of our global legal and compliance functions, his role in positioning the firm to be compliant with and responsive to evolving legal and regulatory requirements applicable to us and our investment businesses, and his role in strategic initiatives undertaken by the firm. Key factors that Messrs. Schwarzman and Gray considered in making such determinations with respect to Mr. Sawhney were his leadership and oversight of our global institutional and private client relationships, his role in overseeing aspects of the firm’s operations and his role in strategic initiatives undertaken by the firm. For 2023, Messrs. Schwarzman and Gray also considered Blackstone’s overall performance and each named executive officer’s prior year annual cash bonus payments, the named executive officers’ allocated share of performance interests through participation in our Performance Plans, the appropriate balance between incentives for long-term and short-term performance, and the compensation paid to the named executive officer’s peers within the firm. The actual cash bonus amounts awarded based on these considerations, net of the portion of Mr. Gray’s, Mr. Chae’s, Mr. Finley’s and Mr. Sawhney’s bonus mandatorily deferred into deferred restricted common stock units pursuant to the Bonus Deferral Plan, are reflected in the “Bonus” column of the Summary Compensation Table below.
244
Compensation Committee Report
The compensation committee of the board of directors has reviewed and discussed with management the foregoing Compensation Discussion and Analysis and, based on such review and discussion, has determined that the Compensation Discussion and Analysis should be included in this annual report.
Stephen A. Schwarzman
Compensation Committee Interlocks and Insider Participation
During 2023, our compensation committee was comprised of Mr. Schwarzman, and none of our executive officers served as a director or member of the compensation committee (or other committee serving an equivalent function) of any other entity whose executive officers served on our compensation committee or our board of directors. For a description of certain transactions between us and Mr. Schwarzman, see “— Item 13. Certain Relationships and Related Transactions, and Director Independence.”
Summary Compensation Table
The following table provides summary information concerning the compensation of our Chief Executive Officer, our Chief Financial Officer and each of our other named executive officers for services rendered to us. These individuals are referred to as our named executive officers in this annual report.
|
Name and Principal Position
|
Year
|
Salary
|
Bonus (a)
|
Stock Awards
(b) |
All Other
Compensation (c) |
Total
|
||||||||||||||||||
|
Stephen A. Schwarzman
|
|
2023
|
|
$
|
350,000
|
|
$
|
—
|
|
$
|
—
|
|
$
|
119,434,375
|
|
$
|
119,784,375
|
|
||||||
|
Chairman and
|
|
2022
|
|
$
|
350,000
|
|
$
|
—
|
|
$
|
—
|
|
$
|
252,772,146
|
|
$
|
253,122,146
|
|
||||||
|
Chief Executive Officer
|
|
2021
|
|
$
|
350,000
|
|
$
|
—
|
|
$
|
—
|
|
$
|
159,931,754
|
|
$
|
160,281,754
|
|
||||||
|
Jonathan D. Gray
|
|
2023
|
|
$
|
350,000
|
|
$
|
—
|
|
$
|
37,504,034
|
|
$
|
87,484,093
|
|
$
|
125,338,127
|
|
||||||
|
President and
|
|
2022
|
|
$
|
350,000
|
|
$
|
—
|
|
$
|
54,581,040
|
|
$
|
241,541,158
|
|
$
|
296,472,198
|
|
||||||
|
Chief Operating Officer
|
|
2021
|
|
$
|
350,000
|
|
$
|
—
|
|
$
|
52,408,134
|
|
$
|
103,836,036
|
|
$
|
156,594,170
|
|
||||||
|
Michael S. Chae
|
|
2023
|
|
$
|
350,000
|
|
$
|
4,296,409
|
|
$
|
12,128,412
|
|
$
|
9,606,467
|
|
$
|
26,381,288
|
|
||||||
|
Chief Financial Officer
|
|
2022
|
|
$
|
350,000
|
|
$
|
3,179,404
|
|
$
|
14,586,650
|
|
$
|
17,909,803
|
|
$
|
36,025,856
|
|
||||||
|
|
2021
|
|
$
|
350,000
|
|
$
|
4,566,274
|
|
$
|
11,278,331
|
|
$
|
14,610,658
|
|
$
|
30,805,263
|
|
|||||||
|
John G. Finley
|
|
2023
|
|
$
|
350,000
|
|
$
|
3,091,991
|
|
$
|
11,315,977
|
|
$
|
3,150,580
|
|
$
|
17,908,548
|
|
||||||
|
Chief Legal Officer
|
|
2022
|
|
$
|
350,000
|
|
$
|
2,863,548
|
|
$
|
12,316,037
|
|
$
|
6,681,266
|
|
$
|
22, 210,851
|
|
||||||
|
|
2021
|
|
$
|
350,000
|
|
$
|
3,558,699
|
|
$
|
9,623,557
|
|
$
|
4,260,136
|
|
$
|
17,792,392
|
|
|||||||
|
Vikrant Sawhney
|
|
2023
|
|
$
|
350,000
|
|
$
|
3,107,641
|
|
$
|
10,272,784
|
|
$
|
11,343,099
|
|
$
|
25,073,524
|
|
||||||
|
Chief Administrative Officer
|
||||||||||||||||||||||||
|
(a)
|
The amounts reported in this column reflect the annual cash bonus payments made for performance in the indicated year.
|
The amount reported as “bonus” for 2023 for Mr. Gray, Mr. Chae, Mr. Finley and Mr. Sawhney is shown net of their mandatory deferral pursuant to the Bonus Deferral Plan. The deferred amounts for 2023 were as follows: Mr. Gray, $6,650,000, Mr. Chae, $1,853,591, Mr. Finley, $2,058,009 and Mr. Sawhney $1,042,359. For additional information on the Bonus Deferral Plan, see “— Narrative Disclosure to Summary Compensation Table and Grants of Plan-Based Awards in 2023 — Terms of Deferred Restricted Common Stock Units Granted Under the Bonus Deferral Plan in 2024 and Prior Years.”
245
|
(b)
|
The reference to “stock” in this table refers to deferred restricted Blackstone Holdings Partnership Units or deferred restricted common stock units. The amounts reported in this column represent the grant date fair value of stock awards granted for financial statement reporting purposes in accordance with GAAP pertaining to equity-based compensation. The assumptions used in determining the grant date fair value are set forth in Note 17. “Equity-Based Compensation” in the “Notes to Consolidated Financial Statements” in “Part II. Item 8. Financial Statements and Supplementary Data.”
|
Amounts reported for 2023 reflect the following deferred restricted common stock units granted on January 8, 2024, for the 2023 performance under the Bonus Deferral Plan: Mr. Gray, 55,837 deferred restricted common stock units with a grant date fair value of $6,831,099, Mr. Chae, 15,564 deferred restricted common stock units with a grant date fair value of $1,904,100, Mr. Finley, 17,280 deferred restricted common stock units with a grant date fair value of $2,114,035 and Mr. Sawhney, 8,753 deferred restricted common stock units with a grant date fair value of $1,070,842. The grant date fair value of these equity awards is computed in accordance with GAAP and generally differs from the dollar amount of such awards. For additional information on the Bonus Deferral Plan, see “— Narrative Disclosure to Summary Compensation Table and Grants of Plan-Based Awards in 2023 — Terms of Discretionary Equity Awards.”
|
(c)
|
Amounts reported for 2023 include distributions, whether in cash or
in-kind,
in respect of carried interest or incentive fee allocations relating to our Performance Plans to the named executive officer in 2023 as follows: $79,591,445 for Mr. Schwarzman, $37,666,372 for Mr. Gray, $7,073,412 for Mr. Chae, $2,137,336 for Mr. Finley and $8,810,022 for Mr. Sawhney. Any
in-kind
distributions in respect of carried interest are reported based on the market value of the securities distributed as of the date of distribution. For 2023, no named executive officers received such
in-kind
distributions. We have determined to present compensation relating to carried interest and incentive fees within the Summary Compensation Table in the year in which such compensation is paid to the named executive officer under the terms of the relevant Performance Plan. Accordingly, the amounts presented in the table differ from the compensation expense recorded by us on an accrual basis for such year in respect of carried interest and incentive fees allocable to a named executive officer, which accrued amounts for 2023 are separately disclosed in this footnote to the Summary Compensation Table. We believe that the presentation of the amounts of carried interest- and incentive
fee-related
compensation paid to a named executive officer during the year, instead of the amounts of compensation expense we have recorded on an accrual basis, most appropriately reflects the actual compensation received by the named executive officer and represents the amount most directly aligned with the named executive officer’s performance. By contrast, the amount of compensation expense accrued in respect of carried interest and incentive fees allocable to a named executive officer can be highly volatile from year to year, with amounts accrued in one year being reversed in a following year, and vice versa, causing such amounts to be less useful as a measure of the compensation earned by a named executive officer in any particular year.
|
246
To the extent compensation expense recorded by us on an accrual basis in respect of carried interest or incentive fee allocations (rather than cash or
in-kind
distributions) were to be included for 2023, the amounts would be $32,347,255 for Mr. Schwarzman, $(991,108) for Mr. Gray, $3,362,698 for Mr. Chae, $933,029 for Mr. Finley and $8,394,392 for Mr. Sawhney. For financial statement reporting purposes, the accrual of compensation expense is equal to the amount of carried interest and incentive fees related to performance fee revenues as of the last day of the relevant period as if the performance fee revenues in the funds generating such carried interest or incentive fees were realized as of the last day of the relevant period.
Amounts shown for 2023 also include the value of restricted shares of listed common stock of BXMT allocated to our named executive officers based on the closing price of BXMT’s common stock on the date of the award as follows: $976,418 for Mr. Schwarzman, $766,122 for Mr. Gray, $80,475 for Mr. Chae, $32,211 for Mr. Finley and $80,496 for Mr. Sawhney. These restricted BXMT shares will vest over three years with
one-sixth
of the shares vesting at the end of the second quarter after the date of the award and the remaining shares vesting in ten equal quarterly installments thereafter. In addition, amounts shown for 2023 also include the value of BREIT shares allocated to our named executive officers based on BREIT’s 2022
year-end
net asset value as follows: $34,287,068 for Mr. Schwarzman, $49,051,599 for Mr. Gray, $2,452,580 for Mr. Chae, $981,032 for Mr. Finley and $2,452,580 for Mr. Sawhney. These BREIT shares are fully vested upon delivery. With the exception of $4,579,444 of expenses related to security services in 2023 for Mr. Schwarzman and members of his family, there were no perquisites or other personal benefits provided to the other named executive officers for which the aggregate incremental cost to the Company exceeded $10,000, and information regarding any such perquisites or other personal benefits has therefore not been included. As noted above under “— Compensation Discussion and Analysis — Compensation Elements for Named Executive Officers — Other Benefits,” we consider the expenses for security services for Mr. Schwarzman to be for our benefit and appropriate business expenses rather than personal benefits for Mr. Schwarzman. Mr. Schwarzman makes business and personal use of a car and driver and he and members of his family may also make occasional business and personal use of an airplane in which we have a fractional interest. In each case, he bears the full cost of such personal usage. In addition, certain Blackstone personnel administer personal matters for Mr. Schwarzman and members of his family and certain matters for the Stephen A. Schwarzman Education Foundation (“SASEF”) and the Stephen A. Schwarzman Foundation (“SASF”), and Mr. Schwarzman, SASEF and SASF, as applicable, respectively, bear the full incremental cost to us of such personnel, if any. There is no incremental expense incurred by us in connection with the use of any car and driver, airplane or personnel by Mr. Schwarzman, as described above.
247
Grants of Plan-Based Awards in 2023
The following table provides information concerning equity awards granted in 2023 or, for deferred restricted common stock units granted under the Bonus Deferral Plan or on the same terms as the deferred bonus awards under the Bonus Deferral Plan, with respect to 2023, to our named executive officers:
|
Name
|
Grant Date
|
All Other
Stock Awards:
Number of
Shares of
Stock
or Units
|
Grant Date Fair
Value
of Stock and
Option
Awards
|
|||||||||
|
Stephen A. Schwarzman
|
|
—
|
|
|
—
|
|
$
|
—
|
|
|||
|
Jonathan D. Gray
|
|
4/1/2023
|
|
|
349,191
|
(a)
|
$
|
30,672,936
|
|
|||
|
|
1/8/2024
|
|
|
55,837
|
(b)
|
$
|
6,831,098
|
|
||||
|
Michael S. Chae
|
|
4/1/2023
|
|
|
116,397
|
(a)
|
$
|
10,224,312
|
|
|||
|
|
1/8/2024
|
|
|
15,564
|
(b)
|
$
|
1,904,100
|
|
||||
|
John G. Finley
|
|
4/1/2023
|
|
|
104,758
|
(a)
|
$
|
9,201,942
|
|
|||
|
|
1/8/2024
|
|
|
17,280
|
(b)
|
$
|
2,114,035
|
|
||||
|
Vikrant Sawhney
|
|
4/1/2023
|
|
|
104,758
|
(a)
|
$
|
9,201,942
|
|
|||
|
|
1/8/2024
|
|
|
8,753
|
(b)
|
$
|
1,070,842
|
|
||||
|
(a)
|
Represents deferred restricted common stock units granted in 2023 under our 2007 Equity Incentive Plan for 2022 performance.
|
|
(b)
|
Represents deferred restricted common stock units granted in 2024 under the Bonus Deferral Plan for 2023 performance. These grants are reflected in the “Stock Awards” column of the Summary Compensation Table in 2023.
|
Narrative Disclosure to Summary Compensation Table and Grants of Plan-Based Awards in 2023
Terms of Discretionary Equity Awards
Vesting Provisions
248
Except as described below, unvested discretionary equity awards are generally forfeited upon termination of employment. With respect to Mr. Gray, the deferred restricted Blackstone Holdings Partnership Units granted to him in 2019 and the deferred common stock units granted to him in 2020 and subsequent years will become fully vested if he is terminated by us without cause. In addition, upon the death or permanent disability of a named executive officer, all unvested discretionary equity awards of common stock units held at that time will vest immediately. In connection with a named executive officer’s termination of employment due to qualifying retirement, 50% of such units will continue to vest and be delivered over the vesting period, subject to forfeiture if the named executive officer violates any applicable provision of his employment agreement or engages in any competitive activity (as such term is defined in the applicable award agreement). (See
“Non-Competition
and
Non-Solicitation
Agreements — Retirement.”) Further, in the event of a change in control (defined in the Blackstone Holdings partnership agreements as the occurrence of any person, other than Blackstone Group Management L.L.C. or a person approved by Blackstone Group Management L.L.C., becoming the Series II Preferred Stockholder), all unvested discretionary equity awards will automatically be deemed vested as of immediately prior to such change in control.
All vested and unvested equity awards (and our common stock delivered upon vesting or received in exchange for Blackstone Holdings Partnership Units) held by a named executive officer will be immediately forfeited in the event the named executive officer materially breaches any of their restrictive covenants set forth in the
non-competition
and
non-solicitation
agreement outlined under
“Non-Competition
and
Non-Solicitation
Agreements” or their service is terminated for cause. Notwithstanding the foregoing, Mr. Schwarzman will not be required to forfeit more than 25% of the units held by him as of March 1, 2018, the date of his amended and restated founding member agreement.
Cash Dividend Equivalents
Minimum Retained Ownership Requirements
Transfer Restrictions
This transfer restriction applies to sales and pledges of Blackstone Holdings Partnership Units, grants of options, rights or warrants to purchase Blackstone Holdings Partnership Units or swaps or other arrangements that transfer to another, in whole or in part, any of the economic consequences of ownership of the Blackstone Holdings Partnership Units other than as approved by us. We will generally approve pledges or transfers to personal planning vehicles beneficially owned by the families of our
pre-IPO
owners and charitable gifts, provided that the pledgee, transferee or donee agrees to be subject to the same transfer restrictions. Transfers to Blackstone are also exempt from the transfer restrictions.
249
The transfer restrictions set forth above will continue to apply generally for one year following the termination of employment of a named executive officer other than Mr. Schwarzman for any reason, except that the transfer restrictions set forth above will lapse upon death or permanent disability or in the event of a change in control (as defined above).
Terms of Deferred Restricted Common Stock Units Granted Under the Bonus Deferral Plan in 2024 and Prior Years
In 2007, we established our Bonus Deferral Plan for certain eligible employees in order to provide such eligible employees with a
pre-tax
deferred incentive compensation opportunity and to enhance the alignment of interests between such eligible employees and Blackstone. The Bonus Deferral Plan is an unfunded, nonqualified Bonus Deferral Plan which provides for the automatic, mandatory deferral of a portion of each participant’s annual cash bonus payment.
At the end of each year, the Plan Administrator selects plan participants in its sole discretion and notifies such individuals that they have been selected to participate in the Bonus Deferral Plan for such year. Participation is mandatory for those employees selected by the Plan Administrator to be participants. An individual who is not so selected may not elect to participate in the Bonus Deferral Plan. The selection of participants is made on an annual basis; an individual selected to participate in the Bonus Deferral Plan for a given year may not necessarily be selected to participate in a subsequent year. For 2023, all employees other than Mr. Schwarzman, who received no bonus in respect of 2023, were selected to participate in the Bonus Deferral Plan, with the deferred amount (if any) determined in accordance with the table described below or as otherwise determined in the discretion of the Plan Administrator. For fiscal 2023, the Plan Administrator determined that 100% of Mr. Gray’s annual cash bonus payment would be deferred.
In respect of the deferred portion of his or her annual cash bonus payment, each participant receives deferral units which represent rights to receive in the future a specified amount of common stock units under our 2007 Equity Incentive Plan, subject to vesting provisions described below. The amount of each participant’s annual cash bonus payment deferred under the Bonus Deferral Plan is calculated pursuant to a deferral rate table using the participant’s total annual incentive compensation, which generally includes such participant’s annual cash bonus payment and a portion of any incentive fees earned in connection with our investment funds, and is subject to certain adjustments, including reductions for mandatory contributions to our investment funds. For deferrals of annual cash bonus payments, the deferral percentage was calculated on the basis set forth in the following table (or such other table that may be adopted by the Plan Administrator).
|
Portion of Annual Incentive
|
Marginal
Deferral Rate Applicable to Such Portion |
Effective
Deferral Rate for Entire Annual Bonus (a) |
||||||
|
$0—100,000
|
|
0%
|
|
|
0.0%
|
|
||
|
$100,001—200,000
|
|
15%
|
|
|
7.5%
|
|
||
|
$200,001—500,000
|
|
20%
|
|
|
15.0%
|
|
||
|
$500,001—750,000
|
|
30%
|
|
|
20.0%
|
|
||
|
$750,001—1,250,000
|
|
40%
|
|
|
28.0%
|
|
||
|
$1,250,001—2,000,000
|
|
45%
|
|
|
34.4%
|
|
||
|
$2,000,001—3,000,000
|
|
50%
|
|
|
39.6%
|
|
||
|
$3,000,001—4,000,000
|
|
55%
|
|
|
43.4%
|
|
||
|
$4,000,001—5,000,000
|
|
60%
|
|
|
46.8%
|
|
||
|
$5,000,000 +
|
|
65%
|
|
|
52.8%
|
|
||
|
(a)
|
Effective deferral rates are shown for illustrative purposes only and are based on an annual cash payment equal to the maximum amount in the range shown in the far left column (which is assumed to be $7,500,000 for the last range shown).
|
250
Mandatory Deferral Awards
The 94,504, 52,993, 38,734 and 4,822 deferred restricted common stock granted to Mr. Gray, Mr. Chae, Mr. Finley and Mr. Sawhney, respectively, in 2021 for 2020 performance vested
one-third
on January 1, 2022,
one-third
on January 1, 2023, and
one-third
on January 1, 2024. The 105,312, 28,797, 23,663 and 12,074 deferred restricted common stock granted to Mr. Gray, Mr. Chae, Mr. Finley and Mr. Sawhney, respectively, in 2022 for 2021 performance vested
one-third
on January 1, 2023,
one-third
on January 1, 2024 and will vest
one-third
on January 1, 2025. The 176,874, 42,730, 34,307 and 57,250 deferred restricted common stock granted to Mr. Gray, Mr. Chae, Mr. Finley and Mr. Sawhney, respectively, in 2023 for 2022 performance vested
one-third
on January 1, 2024, and will vest
one-third
on January 1, 2025 and
one-third
on January 1, 2026. The 55,837, 15,564, 17,280 and 8,753 deferred restricted common stock granted to Mr. Gray, Mr. Chae, Mr. Finley and Mr. Sawhney, respectively, in 2024 for 2023 performance will vest
one-third
on January 1, 2025,
one-third
on January 1, 2026 and
one-third
on January 1, 2027.
Schwarzman Founding Member Agreement
Upon the consummation of our initial public offering, we entered into a founding member agreement with Mr. Schwarzman. On March 1, 2018, we amended and restated this agreement, with the approval of a committee of independent directors advised by independent counsel, to address certain retirement benefits to be received by Mr. Schwarzman. Mr. Schwarzman’s agreement provides that he will remain our Chairman and Chief Executive Officer (or, as determined by Mr. Schwarzman, our Chairman or Executive Chairman) while continuing service with us and requires him to give us six months’ prior written notice of intent to terminate service with us. The agreement provides that following retirement (or, if applicable, the date on which he ceases active service as a result of his permanent disability), Mr. Schwarzman will be provided with specified retirement benefits for the remainder of his life, including that he be permitted to retain his then current office and continue to be provided with administrative support, access to office services and a car and driver. Mr. Schwarzman will also continue to receive health benefits following his retirement until his death, subject to his continuing payment of the related health insurance premiums consistent with current policies. Finally, Mr. Schwarzman will also receive reimbursement for travel costs (including travel on personal aircraft) for Blackstone related business functions, annual home and personal security benefits, reasonable access to our Chief Legal Officer, reasonable access to certain events, legal representation for Blackstone related matters, and, subject to his continuing payment of costs and expenses related thereto, he will continue to be provided with offices, technology and support for his family office team at levels consistent with current practice.
251
The agreement provides that, following Mr. Schwarzman’s termination of service, he or related entities will remain entitled to receive awards of carried interest at reduced levels until the later of February 14, 2027 or the date of Mr. Schwarzman’s death. The profit sharing percentage for any carried interest awarded in new funds launched after Mr. Schwarzman’s termination of service shall generally be set at 50% of the profit sharing percentage Mr. Schwarzman held in the most recent corresponding predecessor fund prior to his termination of employment or, in the case of new funds without a corresponding predecessor fund prior to Mr. Schwarzman’s termination of service, a profit sharing percentage set at 50% of the median of the aggregate profit sharing percentages held by Mr. Schwarzman at the time of his termination of service.
While currently Mr. Schwarzman is entitled to invest in or alongside our investment funds without being subject to management fees or carried interest, this has been extended to continue until ten years following the date of Mr. Schwarzman’s death as to Mr. Schwarzman, his estate and related entities.
On July 1, 2019, in connection with the Conversion and with the approval of the conflicts committee advised by independent counsel, we amended this agreement to address the ongoing compensation to be received by Mr. Schwarzman. Pursuant to the amended agreement, Mr. Schwarzman is entitled to distributions and benefits in amounts and at levels that are consistent with current practices. In addition, the amended agreement provides that, prior to Mr. Schwarzman’s termination of service, the profit sharing percentage for any carried interest in new funds in which there is a corresponding predecessor fund shall be set at the same profit sharing percentage he or related entities held in the most recent such predecessor fund and, in the case where there is no such predecessor fund, the profit sharing percentage shall be set at the median profit sharing percentage owned by him or related entities across all funds existing at the time in question. In connection with the amended agreement, Mr. Schwarzman informed the former conflicts committee of our board of directors that he has no current plan to retire.
Senior Managing Director Agreements
We have entered into substantially similar senior managing director agreements with each of our named executive officers and other senior managing directors, other than our founder. The agreements generally provide that each senior managing director will devote substantially all of his or her business time, skill, energies and attention to us in a diligent manner. Each senior managing director will be paid distributions and receive benefits in amounts determined by Blackstone from time to time in its sole discretion. The agreements require us to provide the senior managing director with 90 days’ prior written notice prior to terminating his or her service with us (other than a termination for cause). Additionally, the agreements with our named executive officers require each senior managing director to give us 90 days’ prior written notice of intent to terminate service with us and include terms under which the senior managing director may be placed on a
90-day
period of “garden leave” following the senior managing director’s termination of service (as further described under the caption “—
Non-Competition
and
Non-Solicitation
Agreements” below).
252
Outstanding Equity Awards at 2023 Fiscal Year End
The following table provides information regarding outstanding unvested equity awards made to our named executive officers as of December 31, 2023.
|
Stock Awards (a)
|
||||||||
|
Name
|
Number of
Shares or Units of
Stock That
Have Not
Vested
|
Market Value of
Shares or
Units of Stock
That Have
Not Vested (b)
|
||||||
|
Stephen A. Schwarzman
|
|
—
|
|
$
|
—
|
|
||
|
Jonathan D. Gray
|
|
2,202,419
|
|
$
|
287,861,614
|
|
||
|
Michael S. Chae (c)
|
|
691,162
|
|
$
|
90,353,390
|
|
||
|
John G. Finley (c)
|
|
413,673
|
|
$
|
54,009,807
|
|
||
|
Vikrant Sawhney
|
|
479,026
|
|
$
|
62,638,983
|
|
||
|
(a)
|
The references to “stock” or “shares” in this table refer to unvested deferred restricted Blackstone Holdings Partnership Units and unvested deferred restricted common stock units (including deferred restricted common stock units granted under the Bonus Deferral Plan to Messrs. Gray, Chae, Finley and Sawhney in 2024 in respect of 2023 performance). The vesting terms of these awards are described under the caption “Narrative Disclosure to Summary Compensation Table and Grants of Plan-Based Awards in 2023” above.
|
|
(b)
|
The dollar amounts shown under this column were calculated by multiplying the number of unvested deferred restricted Blackstone Holdings Partnership Units or unvested deferred restricted common stock units held by the named executive officer by the closing market price of $130.92 per share of our common stock on December 29, 2023, the last trading day of 2023, other than the deferred restricted common stock units granted in 2024 in respect of 2023 performance, which are valued as of the date of their grant.
|
|
(c)
|
Amounts reported for Messrs. Chae and Finley include (1) 93,635 and 11,811 deferred restricted Blackstone Holdings Partnership Units, respectively, which reflects 50% of the unvested deferred restricted Blackstone Holdings Partnership Units that have been granted to Messrs. Chae and Finley as discretionary equity awards, (2) 204,369 and 154,890 deferred restricted common stock units, respectively, which reflects 50% of the unvested deferred restricted common stock units that have been granted to Messrs. Chae and Finley as discretionary equity awards and (3) 95,156 and 80,273 deferred restricted common stock units, respectively, granted to Messrs. Chae and Finley pursuant to the Bonus Deferral Plan, which are considered vested and undelivered for financial statement reporting purposes in accordance with GAAP pertaining to equity-based compensation due the retirement eligibility of Messrs. Chae and Finley. Upon retirement the deferred restricted Blackstone Holdings Partnership Units are scheduled to vest and be delivered over the vesting period and the deferred restricted common stock units are scheduled to be delivered in equal annual installments over the three year deferral period, in each case subject to forfeiture if the named executive officer violates any applicable provision of his employment agreement or engages in any competitive activity (as such term is defined in the applicable award agreement or the Bonus Deferral Plan, as applicable).
|
253
Option Exercises and Stock Vested in 2023
The following table provides information regarding the number of outstanding initially unvested equity awards made to our named executive officers that vested during 2023:
|
Stock Awards (a)
|
||||||||
|
Name
|
Number of Shares
Acquired on Vesting |
Value Realized
on Vesting (b)
|
||||||
|
Stephen A. Schwarzman
|
|
—
|
|
$
|
—
|
|
||
|
Jonathan D. Gray
|
|
515,465
|
|
$
|
46,671,939
|
|
||
|
Michael S. Chae
|
|
277,743
|
|
$
|
25,118,925
|
|
||
|
John G. Finley
|
|
86,841
|
|
$
|
7,426,599
|
|
||
|
Vikrant Sawhney
|
|
76,696
|
|
$
|
6,995,887
|
|
||
|
(a)
|
The references to “stock” or “shares” in this table refer to deferred restricted Blackstone Holdings Partnership Units and our deferred restricted common stock units.
|
|
(b)
|
The value realized on vesting is based on the closing market prices of our common stock on the day of vesting.
|
Potential Payments Upon Termination of Employment or Change in Control
Upon a change of control event where any person, other than Blackstone Group Management L.L.C. or a person approved by Blackstone Group Management L.L.C., becomes the Series II Preferred Stockholder or a termination of employment because of death or disability, any unvested deferred restricted Blackstone Holdings Partnership Units or unvested deferred restricted common stock units held by any of our named executive officers will automatically be deemed vested as of immediately prior to such occurrence of such change of control or such termination of employment. Had such a change of control or such a termination of employment occurred on December 29, 2023, the last business day of 2023, each of our continuing named executive officers would have vested in the following numbers of deferred restricted Blackstone Holdings Partnership Units and deferred restricted common stock units, having the following values based on our closing market price of $130.92 per share of common stock on December 29, 2023, other than the deferred restricted common stock units granted to Mr. Gray, Mr. Chae, Mr. Finley and Mr. Sawhney in 2024 in respect of 2023 performance, which are valued as of the date of their grant: Mr. Schwarzman had no outstanding unvested equity at December 29, 2023; Mr. Gray — 354,301 deferred restricted Blackstone Holdings Partnership Units and 1,848,118 deferred restricted common stock units with an aggregate value of $287,861,614, Mr. Chae — 187,269 deferred restricted Blackstone Holdings Partnership Units and 503,893 deferred restricted common stock units with an aggregate value of $90,353,390, Mr. Finley — 23,621 deferred restricted Blackstone Holdings Partnership Units and 390,052 deferred restricted common stock units with an aggregate value of $54,009,807, and Mr. Sawhney — 4,725 deferred restricted Blackstone Holdings Partnership Units and 474,301 deferred restricted common stock units with an aggregate value of $62,638,983. In addition, the Bonus Deferral Plan provides that upon a change in control or termination of the participant’s employment because of death, any fully vested but undelivered deferred restricted common stock units will become immediately deliverable.
In connection with a named executive officer’s termination of employment due to qualifying retirement, 50% of the unvested deferred restricted Blackstone Holdings Partnership Units will continue to vest and be delivered over the vesting period and any unvested deferred restricted common stock units will vest and be delivered in equal annual installments over the three year deferral period, in each case subject to forfeiture if the named executive officer violates any applicable provision of his employment agreement or engages in any competitive activity (as such term is defined in the applicable award agreement or the Bonus Deferral Plan, as applicable).
254
(See “Non-Competition and
Non-Solicitation
Agreements — Retirement.”) As of December 29, 2023, Messrs. Chae and Finley were retirement eligible. If Mr. Chae or Mr. Finley had retired on December 29, 2023, 93,635 and 11,811 of their deferred restricted Blackstone Holdings Partnership Units, respectively, and 204,369 and 154,890 of their deferred restricted common units granted as discretionary awards, respectively, would continue to vest and be delivered over the vesting period and 95,156 and 80,273 of their deferred restricted common stock units, respectively would vest and be delivered over the three year deferral period, in each case subject to forfeiture if the named executive officer violates any applicable provision of his employment agreement or engages in any competitive activity (as such term is defined in the applicable award agreement or the Bonus Deferral Plan, as applicable).
Upon a termination of Mr. Gray’s, Mr. Chae’s, Mr. Finley’s or Mr. Sawhney’s employment without cause, the deferred restricted common stock units granted to each of them under the Bonus Deferral Plan in respect of 2023, 2022 and 2021, as applicable, will become fully vested. Had such a termination of employment occurred on December 29, 2023, the last business day of 2023, each of Mr. Gray, Mr. Chae, Mr. Finley and Mr. Sawhney would have vested in the following numbers of deferred restricted common stock units, respectively, having the following values based on our closing market price of $130.92 per share of common stock on December 29, 2023, other than the deferred restricted common stock units granted to Mr. Gray, Mr. Chae, Mr. Finley and Mr. Sawhney in 2024 in respect of 2023 performance, which are valued as of the date of their grant: Mr. Gray — 334,420 deferred restricted common stock units with an aggregate value of $43,303,186, Mr. Chae — 95,156 deferred restricted common stock units with an aggregate value of $12,324,284, Mr. Finley — 80,273 deferred restricted common stock units with an aggregate value of $10,361,079 and Mr. Sawhney — 75,659 deferred restricted common stock units with an aggregate value of $9,830,176.
Upon a termination of Mr. Gray’s employment without cause, the deferred restricted Blackstone Holdings Partnership Units granted to him on July 1, 2019 and the deferred restricted common stock units granted to him on April 1, 2020, April 1, 2021, April 1, 2022 and April 1, 2023 will become fully vested. Had such a termination occurred on December 29, 2023, the last business day of 2023, Mr. Gray would have vested in 354,301 deferred restricted Blackstone Holdings Partnership units with a value of $46,385,087 and 1,513,698 deferred restricted common stock units with a value of $198,173,342 based on our closing market price of $130.92 per share of our common stock on December 29, 2023.
In addition, except as described below, unvested carried interest in our carry funds is generally forfeited upon termination of employment. Upon the death or disability of any named executive officer who participates in the carried interest of our carry funds, the named executive officer will be deemed 100% vested in any unvested portion of carried interest in our carry funds. Furthermore, any named executive officer that is retirement eligible will automatically vest in 50% of their otherwise unvested carried interest allocation upon retirement. (See “—
Non-Competition
and
Non-Solicitation
Agreements — Retirement.”) In addition, pursuant to Mr. Schwarzman’s founding member agreement described above under “Narrative Disclosure to Summary Compensation Table and Grants of Plan-Based Awards in 2023 — Schwarzman Founding Member Agreement,” following retirement and for the remainder of his life, Mr. Schwarzman will be provided with specified retirement benefits, including a car and driver, retention of his current office, administrative support and annual home and personal security benefits. The value of such retirement benefits is estimated at approximately $6.2 million per year based on 2023 costs. We have not assigned a value to the entitlements of Mr. Schwarzman and his estate and related entities to receive carried interest in new funds or to invest in our investment funds fee free following his termination of service as such value cannot be reasonably estimated. We anticipate that any incremental cost to us with respect to the other personal benefits to which Mr. Schwarzman is entitled following his retirement will be de minimis.
Non-Competition
and
Non-Solicitation
Agreements
Upon the consummation of our initial public offering, we entered into a
non-competition
and
non-solicitation
agreement with our founder, our other senior managing directors, and most of our other professional employees and specified senior administrative personnel. Senior managing directors and other personnel who joined the firm after our initial public offering have also executed similar restrictive covenant agreements, with the agreements covering
non-senior
managing directors being subject to certain variations from the terms described below based on their respective positions and local law limitations. The following are descriptions of the material terms of the agreements covering senior managing directors. With the exception of the differences noted in the description below, the terms of each
non-competition
and
non-solicitation
agreement covering senior managing directors are generally in relevant part similar.
255
Full-Time Commitment
Confidentiality
Notice of Termination
Garden Leave
90-day
period of “garden leave.” During this period the senior managing director will continue to receive base compensation and benefits but is prohibited from commencing employment with a new employer until the garden leave period has expired. The period of garden leave for each senior managing director will run concurrently with the
non-competition
Restricted Period that applies as described below and, as noted above, may also run concurrently with the notice period in certain jurisdictions. Mr. Schwarzman is subject to
non-competition
covenants but not garden leave requirements.
Non-Competition
|
•
|
engage in any business activity in which we operate, including any competitive business,
|
|
•
|
render any services to any competitive business, or
|
|
•
|
acquire a financial interest in or become actively involved with any competitive business (other than as a passive investor holding minimal percentages of the stock of public companies).
|
“Competitive business” means any business that competes, during the term of employment through the date of termination, with our business, including any businesses that we are actively considering conducting at the time of the senior managing director’s termination of employment, so long as the senior managing director knows or reasonably should have known about such plans, in any geographical or market area where we or our affiliates provide our products or services.
Non-Solicitation
In addition, during the term of employment of each senior managing director, and during the Restricted Period immediately thereafter, the senior managing director will not, directly or indirectly, in any manner solicit the business of any client or prospective client of ours with whom the senior managing director, employees reporting to the senior managing director, or anyone whom the senior managing director had direct or indirect responsibility over had personal contact or dealings on our behalf during the three-year period immediately preceding the senior managing director’s termination. Senior managing directors who are employed in our asset management businesses are subject to a similar
non-solicitation
covenant with respect to investors and prospective investors in our investment funds.
Non-Interference
and
Non-Disparagement
256
Restricted Period
|
Covenant
|
Stephen A. Schwarzman
|
Other Senior
Managing Directors
|
||
|
Non-competition
|
Two years after termination of employment.
|
One year after termination of employment (or 90 days in the event of a termination without “cause”).
|
||
|
Non-solicitation
of Blackstone employees
|
Two years after termination of employment.
|
Two years after termination of employment.
|
||
|
Non-solicitation
of Blackstone clients or investors
|
Two years after termination of employment.
|
One year after termination of employment.
|
||
|
Non-interference
with business relationships
|
Two years after termination of employment.
|
One year after termination of employment.
|
||
Retirement.
Intellectual Property
Specific Performance
non-competition,
non-solicitation,
non-interference,
non-disparagement
or intellectual property provisions by a senior managing director, the breaching individual agrees that we will be entitled to seek equitable relief in the form of specific performance, restraining orders, injunctions or other equitable remedies (including forfeiture of the breaching individual’s vested and unvested interests in Blackstone).
Pay Ratio Disclosure
As required by Section 953(b) of the Dodd-Frank Wall Street Reform and Consumer Protection Act, and Item 402(u) of Regulation
S-K,
we are providing the following information regarding the ratio of the annual total compensation for our principal executive officer to the median of the annual total compensation of all our employees (other than our principal executive officer) (the “CEO Pay Ratio”). Our CEO Pay Ratio is a reasonable estimate calculated in a manner consistent with Item 402(u). However, due to the flexibility afforded by Item 402(u) in calculating the CEO Pay Ratio, our CEO Pay Ratio may not be comparable to the CEO pay ratios presented by other companies. As of December 31, 2023, we employed approximately 4,735 people, including our 239 senior managing directors. We identified our median employee using our global employee population as of December 31, 2023. To identify our median employee, we used annual base salary and bonuses earned in 2023. We believe this consistently applied compensation measure reasonably reflects annual compensation across our employee base. Application of our consistently applied compensation measure identified a group of employees with the same total annual base salary and cash bonus earned in 2023. We identified our median employee from among these employees by reviewing the components of their annual total compensation and selecting the employee whose title, tenure and compensation characteristics most accurately reflected the compensation of a typical employee. After identifying our median employee, we calculated the median employee’s annual total compensation in accordance with the requirements of the Summary Compensation Table. For 2023, the annual total compensation for Mr. Schwarzman, our principal executive officer, was $119,784,375 and our median employee’s annual total compensation was $245,000. Accordingly, annual total compensation of our principal executive officer was approximately four hundred eighty nine times the annual total compensation of our median employee.
257
Director Compensation in 2023
No additional remuneration is paid to our employees for service on our board of directors. In 2023, each of our
non-employee
directors received an annual cash retainer of $150,000 and a grant of deferred restricted common stock units equivalent in value to $210,000, with a grant date fair value determined as described in footnote (a) to the first table below. An additional $40,000 annual retainer was paid to the Chairman of the Audit Committee during 2023, $30,000 of which was paid in cash and the remainder of which was paid in the form of deferred restricted common stock units equivalent in value to $10,000 and with the same vesting terms as the other deferred restricted common stock units. The amounts of our
non-employee
directors’ compensation were approved by our board of directors upon the recommendation of our founder following his review of directors’ compensation paid by comparable companies. The following table provides the director compensation for our directors for 2023:
|
Name
|
Fees
Earned or Paid in Cash |
Stock
Awards
(a)(b)
|
Total
|
|||||||||
|
Kelly A. Ayotte
|
$
|
150,000
|
|
$
|
209,222
|
|
$
|
359,222
|
|
|||
|
Joseph P. Baratta (c)
|
$
|
—
|
|
$
|
—
|
|
$
|
—
|
|
|||
|
James W. Breyer
|
$
|
150,000
|
|
$
|
210,037
|
|
$
|
360,037
|
|
|||
|
Reginald J. Brown
|
$
|
150,000
|
|
$
|
209,601
|
|
$
|
359,601
|
|
|||
|
Sir John Hood (d)
|
$
|
100,000
|
|
$
|
209,222
|
|
$
|
309,222
|
|
|||
|
Rochelle B. Lazarus
|
$
|
150,000
|
|
$
|
209,831
|
|
$
|
359,831
|
|
|||
|
The Right Honorable Brian Mulroney
|
$
|
150,000
|
|
$
|
208,475
|
|
$
|
358,475
|
|
|||
|
William G. Parrett
|
$
|
180,000
|
|
$
|
217,331
|
|
$
|
397,331
|
|
|||
|
Ruth Porat
|
$
|
150,000
|
|
$
|
208,884
|
|
$
|
358,884
|
|
|||
|
(a)
|
The references to “stock” in this table refer to our deferred restricted common stock units. Amounts for 2023 represent the grant date fair value of stock awards granted in the year, computed in accordance with GAAP, pertaining to equity-based compensation. The assumptions used in determining the grant date fair value are set forth in Note 16. “Earnings Per Share and Stockholders’ Equity” in the “Notes to Consolidated Financial Statements” in “Part II. Item 8. Financial Statements and Supplementary Data.” These deferred restricted common stock units vest, and the underlying shares of common stock will be delivered, on the first anniversary of the date of the grant, subject to the director’s continued service on our board of directors.
|
|
(b)
|
Each of our
non-employee
directors was granted deferred restricted common stock units upon appointment as a director. In 2023, in connection with the anniversary of his or her initial grant, each of the following directors was granted deferred restricted common stock units: Ms. Ayotte — 2,525 units; Mr. Breyer — 2,019 units; Mr. Brown — 1,842 units; Mr. Hood — 2,525 units; Ms. Lazarus — 2,283 units; Mr. Mulroney — 2,339 units; Mr. Parrett — 2,244 units; and Ms. Porat — 2,378 units.
|
258
The following table provides information regarding outstanding unvested equity awards made to our directors as of December 31, 2023:
|
Stock Awards (1)
|
||||||||
|
Name
|
Number of
Shares or
Units of
Stock That
Have Not
Vested
|
Market
Value of
Shares or
Units of
Stock That
Have Not
Vested (2)
|
||||||
|
Kelly A. Ayotte
|
|
2,525
|
|
$
|
330,573
|
|
||
|
James W. Breyer
|
|
2,019
|
|
$
|
264,327
|
|
||
|
Reginald J. Brown
|
|
1,842
|
|
$
|
241,155
|
|
||
|
Rochelle B. Lazarus
|
|
2,283
|
|
$
|
298,890
|
|
||
|
The Right Honorable Brian Mulroney
|
|
2,339
|
|
$
|
306,222
|
|
||
|
William G. Parrett
|
|
2,244
|
|
$
|
293,784
|
|
||
|
Ruth Porat
|
|
2,378
|
|
$
|
311,328
|
|
||
|
(1)
|
The references to “stock” or “shares” in this table refer to our deferred restricted common stock units.
|
|
(2)
|
The dollar amounts shown in this column were calculated by multiplying the number of unvested deferred restricted common stock units held by the director by the closing market price of $130.92 per share of our common stock on December 29, 2023, the last trading day of 2023.
|
|
(c)
|
Mr. Baratta is an employee and no additional remuneration is paid to him for his service as a director. Mr. Baratta’s employee compensation is discussed in “— Item 13. Certain Relationships and Related Transactions, and Director Independence.”
|
|
(d)
|
Effective August 25, 2023, Mr. Hood stepped down from the board of directors due to personal health reasons. Mr. Hood’s unvested equity awards vested immediately upon his resignation from the board, pursuant to the terms thereof.
|
259
|
Item 12.
|
Security Ownership of Certain Beneficial Owners and Management and Related Stockholder Matters
|
The following table sets forth information regarding the beneficial ownership of our common stock and Blackstone Holdings Partnership Units as of February 16, 2024 by:
|
•
|
each person known to us to beneficially own 5% of any class of the outstanding voting securities of Blackstone Inc.,
|
|
•
|
each member of our board of directors,
|
|
•
|
each of our named executive officers, and
|
|
•
|
all our current directors and executive officers as a group.
|
The amounts and percentage of common stock and Blackstone Holdings Partnership Units beneficially owned are reported on the basis of regulations of the SEC governing the determination of beneficial ownership of securities. Under the rules of the SEC, a person is deemed to be a “beneficial owner” of a security if that person has or shares “voting power,” which includes the power to vote or to direct the voting of such security, or “investment power,” which includes the power to dispose of or to direct the disposition of such security. A person is also deemed to be a beneficial owner of any securities of which that person has a right to acquire beneficial ownership within 60 days of February 16, 2024. Under these rules, more than one person may be deemed a beneficial owner of the same securities and a person may be deemed a beneficial owner of securities as to which he has no economic interest. Except as indicated by footnote, the persons named in the table below have sole voting and investment power with respect to all securities shown as beneficially owned by them, subject to community property laws where applicable. Unless otherwise included, for purposes of this table, the principal business address for each such person is c/o Blackstone Inc., 345 Park Avenue, New York, New York 10154.
|
Shares of Common Stock
Beneficially Owned
|
Blackstone Holdings
Partnership Units
Beneficially Owned (a)
|
|||||||||||||||
|
Name of Beneficial Owner
|
Number
|
% of
Class
|
Number
|
% of
Class
|
||||||||||||
|
5% Stockholders
|
||||||||||||||||
|
The Vanguard Group, Inc. (b)
|
|
62,972,154
|
|
|
8.8
|
%
|
|
—
|
|
|
—
|
|
||||
|
BlackRock, Inc. (c)
|
|
45,986,530
|
|
|
6.4
|
%
|
|
—
|
|
|
—
|
|
||||
|
Directors and Named Executive Officers (d)(e)
|
||||||||||||||||
|
Stephen A. Schwarzman (f)(g)
|
|
—
|
|
|
—
|
|
|
231,924,793
|
|
|
51.2
|
%
|
||||
|
Jonathan D. Gray (g)
|
|
1,160,666
|
|
|
*
|
|
|
40,939,600
|
|
|
9.0
|
%
|
||||
|
Michael S. Chae (g)
|
|
298,534
|
|
|
*
|
|
|
6,313,287
|
|
|
1.4
|
%
|
||||
|
John G. Finley (g)
|
|
82,848
|
|
|
*
|
|
|
411,155
|
|
|
*
|
|
||||
|
Vikrant Sawhney (g)
|
|
220,038
|
|
|
*
|
|
|
635,046
|
|
|
*
|
|
||||
|
Kelly A. Ayotte
|
|
13,989
|
|
|
*
|
|
|
—
|
|
|
—
|
|
||||
|
Joseph P. Baratta
|
|
319,008
|
|
|
*
|
|
|
6,129,130
|
|
|
1.4
|
%
|
||||
|
James W. Breyer
|
|
36,886
|
|
|
*
|
|
|
—
|
|
|
—
|
|
||||
|
Reginald J. Brown
|
|
12,707
|
|
|
*
|
|
|
—
|
|
|
—
|
|
||||
|
Rochelle B. Lazarus (g)
|
|
55,343
|
|
|
*
|
|
|
—
|
|
|
—
|
|
||||
|
The Right Honorable Brian Mulroney
|
|
177,431
|
|
|
*
|
|
|
—
|
|
|
—
|
|
||||
|
William G. Parrett (g)
|
|
90,112
|
|
|
*
|
|
|
—
|
|
|
—
|
|
||||
|
Ruth Porat
|
|
40,195
|
|
|
*
|
|
|
—
|
|
|
—
|
|
||||
|
All current executive officers and directors as a group (13 persons)
|
|
2,507,757
|
|
|
*
|
|
|
286,353,011
|
|
|
63.2
|
%
|
||||
|
*
|
Less than one percent
|
260
|
(a)
|
Subject to certain requirements and restrictions, the partnership units of Blackstone Holdings are exchangeable for shares of our common stock on a
one-for-one
one-for-one
|
|
(b)
|
Reflects shares of common stock beneficially owned by The Vanguard Group, Inc. and its subsidiaries based on the amended Schedule 13G filed by The Vanguard Group, Inc. on February 13, 2024. The Vanguard Group, Inc. reports shared voting power, sole dispositive power and shared dispositive power over 945,756; 59,792,095 and 3,180,059 shares, respectively. The address of The Vanguard Group, Inc. is 100 Vanguard Boulevard, Malvern, Pennsylvania 19355.
|
|
(c)
|
Reflects shares of common stock beneficially owned by BlackRock, Inc. and its subsidiaries based on the Schedule 13G filed by BlackRock, Inc. on January 29, 2024. BlackRock, Inc. reports sole voting power and sole dispositive power over 41,657,836 and 45,986,530 shares, respectively. The address of BlackRock, Inc. is 50 Hudson Yards, New York, NY 10001.
|
|
(d)
|
The shares of common stock and Blackstone Holdings Partnership Units beneficially owned by the directors and executive officers reflected above do not include the following number of securities that will be delivered to the respective individual more than 60 days after February 16, 2024: Mr. Gray — 354,301 deferred restricted Blackstone Holdings Partnership Units and 1,722,555 deferred restricted common stock; Mr. Chae — 187,269 deferred restricted Backstone Holdings Partnership Units and 462,386 deferred restricted common stock; Mr. Finley — 23,621 deferred restricted Blackstone Holdings Partnership Units and 357,818 deferred restricted common stock; Mr. Baratta — 650,115 deferred restricted Blackstone Holdings Partnership Units and 663,213 deferred restricted common stock; Mr. Sawhney — 4,725 deferred restricted Blackstone Holdings Partnership Units and 449,586 deferred restricted common stock; Ms. Ayotte — 2,525 deferred restricted common stock; Mr. Mulroney — 2,339 deferred restricted common stock; Mr. Parrett — 2,244 deferred restricted common stock; Ms. Lazarus — 2,283 deferred restricted common stock; Mr. Breyer — 2,019 deferred restricted common stock; Ms. Porat — 2,378 deferred restricted common stock; and Mr. Brown — 1,842 deferred restricted common stock.
|
|
(e)
|
The Blackstone Holdings Partnership Units shown in the table above include the following number of vested units being held back under our minimum retained ownership requirements: Mr. Schwarzman — 11,728,830 Blackstone Holdings Partnership Units; Mr. Gray — 11,566,546 Blackstone Holdings Partnership Units and 91,340 deferred restricted common units; Mr. Chae — 3,392,625 Blackstone Holdings Partnership Units and 23,666 deferred restricted common units; and Mr. Finley — 193,786 Blackstone Holdings Partnership Units and 14,540 deferred restricted common units; Mr. Baratta — 3,883,368 Blackstone Holdings Partnership Units and 315,767 deferred restricted common units; and Mr. Sawhney — 219,676 Blackstone Holdings Partnership Units and 107,313 deferred restricted common units.
|
|
(f)
|
On those few matters that may be submitted for a vote of the sole holder of the Series I preferred stock, Blackstone Partners L.L.C., an entity owned by senior managing directors of Blackstone and controlled by Mr. Schwarzman, is entitled to an aggregate number of votes on any matter that may be submitted for a vote of our common stock that is equal to the aggregate number of vested and unvested Blackstone Holdings Partnership Units held by the limited partners of Blackstone Holdings on the relevant record date and entitles it to participate in the vote on the same basis as our common stock. Our
senior
managing directors have agreed in the limited liability company agreement of Blackstone Partners L.L.C. that our founder, Mr. Schwarzman, will have the power to determine how the Series I preferred stock held by Blackstone Partners L.L.C. will be voted. Following the withdrawal, death or disability of Mr. Schwarzman (and any successor founder), this power will revert to the members of Blackstone Partners L.L.C. holding a majority in interest in that entity. The limited liability company agreement of Blackstone Partners L.L.C. provides that at such time as Mr. Schwarzman should cease to be a founding member, Jonathan D. Gray will thereupon succeed Mr. Schwarzman as the sole founding member of Blackstone Partners L.L.C. If Blackstone Partners L.L.C. directs us to do so, we will issue shares of Series I preferred stock to each of the limited partners of Blackstone Holdings, whereupon each holder of Series I preferred stock will be entitled to a number of votes that is equal to the number of vested and unvested Blackstone Holdings Partnership Units held by such Series I preferred stockholder on the relevant record date.
|
261
|
(g)
|
The Blackstone Holdings Partnership Units shown in the table above for such named executive officers and directors include: (a) the following units held for the benefit of family members with respect to which the named executive officer or director, as applicable, disclaims beneficial ownership: Mr. Schwarzman — 3,686,266 units held in various trusts for which Mr. Schwarzman is the investment trustee, Mr. Gray — 18,742,340 units held in a trust for which Mr. Gray is the investment trustee, Mr. Chae — 1,150,070 units held in a trust for which Mr. Chae is the investment trustee, Mr. Finley — 80,964 units held in a trust for which Mr. Finley is the investment trustee, Mr. Baratta — 142,237 units held in a trust for which Mr. Baratta is the investment trustee, and Mr. Sawhney 104,000 units held in a trust for which Mr. Sawhney is the investment trustee (b) the following units held in grantor retained annuity trusts for which the named executive officer or director, as applicable, is the investment trustee: Mr. Gray — 889,575 units, and (c) the following units held by a corporation for which the named executive officer is a controlling stockholder: Mr. Schwarzman — 1,438,529 units, Mr. Baratta — 4,413,950 units, and Mr. Sawhney — 56,000 units. Mr. Schwarzman also directly, or through a corporation for which he is the controlling stockholder, beneficially owns an additional 364,278 partnership units in each of Blackstone Holdings II L.P., Blackstone Holdings III L.P. and Blackstone Holdings IV L.P. In addition, with respect to Mr. Schwarzman, the above table excludes partnership units of Blackstone Holdings held by his children or in trusts for the benefit of his family as to which he has no voting or investment control. The Blackstone common stock shown in the table above for each named executive officer and director include: (a) the following shares held for the benefit of family members with respect to which the named executive officer or director, as applicable, disclaims beneficial ownership: Mr. Finley — 32,523 shares held in a family limited liability company and 4,000 shares held in a trust for the benefit of his spouse of which he is a trustee, and Ms. Lazarus — 2,950 shares held in a trust for the benefit of family members over which she shares investment control (b) Mr. Finley — 11,000 shares held in a trust for the benefit of Mr. Finley and his family of which he is a trustee; and (c) 34,155 and 10,000 shares that have been pledged by Messrs. Finley and Parrett, respectively, to a third party to secure payment for a loan.
|
262
Securities Authorized for Issuance under Equity Compensation Plans
The table set forth below provides information concerning the awards that may be issued under the 2007 Equity Incentive Plan as of December 31, 2023:
|
Number of
Securities to be Issued
Upon Exercise of
Outstanding Options,
Warrants and Rights (a)
|
Weighted-Average
Exercise Price of
Outstanding Options,
Warrants and Rights
|
Number of
Securities Remaining
Available for Future
Issuance Under Equity
Compensation Plans
(excluding securities
reflected in column (a)) (b)
|
||||||||||
|
Equity Compensation Plans Approved by Security Holders
|
|
60,137,420
|
|
|
—
|
|
|
156,583,532
|
|
|||
|
Equity Compensation Plans Not Approved by Security Holders
|
|
—
|
|
|
—
|
|
|
—
|
|
|||
|
|
|
|
|
|
|
|
|
|
||||
|
|
60,137,420
|
|
|
—
|
|
|
156,583,532
|
|
||||
|
|
|
|
|
|
|
|
|
|
||||
|
(a)
|
Reflects the outstanding number of our deferred restricted common stock units and deferred restricted Blackstone Holdings Partnership Units granted under the 2007 Equity Incentive Plan as of December 31, 2023.
|
|
(b)
|
The aggregate number of our common stock and Blackstone Holdings Partnership Units covered by the 2007 Equity Incentive Plan is increased on the first day of each fiscal year during its term by a number of shares of common stock equal to the positive difference, if any, of (a) 15% of the aggregate number of shares of our common stock and Blackstone Holdings Partnership Units outstanding on the last day of the immediately preceding fiscal year (excluding Blackstone Holdings Partnership Units held by Blackstone Inc. or its wholly owned subsidiaries) minus (b) the aggregate number of shares of our common stock and Blackstone Holdings Partnership Units covered by the 2007 Equity Incentive Plan as of such date (unless the administrator of the 2007 Equity Incentive Plan should decide to increase the number of shares of our common stock and Blackstone Holdings Partnership Units covered by the plan by a lesser amount). As of January 1, 2024, pursuant to this formula, 173,443,452 shares of common stock, which is equal to 0.15 times the number of shares of our common stock and Blackstone Holdings Partnership Units outstanding on December 31, 2023, were available for issuance under the 2007 Equity Incentive Plan. We have filed a registration statement and intend to file additional registration statements on Form
S-8
under the Securities Act to register shares of common stock covered by the 2007 Equity Incentive Plan (including pursuant to automatic annual increases). Any such Form
S-8
registration statement will automatically become effective upon filing. Accordingly, shares of common stock registered under such registration statement will be available for sale in the open market.
|
263
|
Item 13.
|
Certain Relationships and Related Transactions, and Director Independence
|
Tax Receivable Agreements
We used a portion of the proceeds from the IPO and the sale of
basis. A Blackstone Holdings limited partner must exchange one partnership unit in each of the Blackstone Holdings partnerships to effect an exchange for a share of common stock. Blackstone Holdings I L.P. and Blackstone Holdings II L.P. have made an election under Section 754 of the Internal Revenue Code effective for each taxable year in which an exchange of partnership units for a share of common stock occurs, which may result in an adjustment to the tax basis of the assets of such Blackstone Holdings Partnerships at the time of an exchange of partnership units. Other Blackstone Holdings Partnerships and certain subsidiary partnerships are expected to make such elections for the 2023 and subsequent taxable years with the filing of their federal income tax returns for such tax years. The purchase and subsequent exchanges of Blackstone Holdings Partnership Units are expected to result in increases in the tax basis of the tangible and intangible assets of Blackstone Holdings that otherwise would not have been available. These increases in tax basis may increase (for tax purposes) depreciation and amortization and therefore reduce the amount of tax that we would otherwise be required to pay in the future. We have entered into a tax receivable agreement with holders of Blackstone Holdings Partnership Units that provides for the payment by us to such holders of 85% of the amount of cash savings, if any, in U.S. federal, state and local income tax that we actually realize (or are deemed to realize in the case of an early termination payment by the corporate taxpayers or a change in control, as discussed below) as a result of these increases in tax basis and of certain other tax benefits related to our entering into the tax receivable agreement, including tax benefits attributable to payments under the tax receivable agreement. This payment obligation is an obligation of us (and certain of our subsidiaries that are treated as corporations for U.S. federal income tax purposes which we refer to as “the corporate taxpayers”) and not of Blackstone Holdings. The corporate taxpayers expect to benefit from the remaining 15% of cash savings, if any, in income tax that they realize. For purposes of the tax receivable agreement, cash savings in income tax will be computed by comparing the actual income tax liability of the corporate taxpayers to the amount of such taxes that the corporate taxpayer would have been required to pay had there been no increase to the tax basis of the tangible and intangible assets of Blackstone Holdings as a result of the exchanges and had the corporate taxpayers not entered into the tax receivable agreement. The term of the tax receivable agreement commenced upon consummation of our IPO and will continue until all such tax benefits have been utilized or expired, unless the corporate taxpayers exercise their right to terminate the tax receivable agreement for an amount based on the agreed payments remaining to be made under the agreement.
non-voting
common units to Beijing Wonderful Investments to purchase interests in the predecessor businesses from the predecessor owners. In addition, holders of Blackstone Holdings Partnership Units (other than Blackstone Inc.’s wholly owned subsidiaries), subject to the vesting and minimum retained ownership requirements and transfer restrictions set forth in the partnership agreements of the Blackstone Holdings partnerships, may up to four times each year (subject to the terms of the exchange agreement) exchange their Blackstone Holdings Partnership Units for shares of our common stock on a
one-for-one
264
Assuming no future material changes in the relevant tax law and that the corporate taxpayers earn sufficient taxable income to realize the full tax benefit of the increased amortization of the assets, the expected future payments under the tax receivable agreement (which are taxable to the recipients) in respect of the purchase and exchanges will aggregate $1.7 billion over the next 15 years. The
after-tax
net present value of these estimated payments totals $522.6 million assuming a 15% discount rate and using an estimate of timing of the benefit to be received. Future payments under the tax receivable agreement in respect of subsequent exchanges would be in addition to these amounts. The payments under the tax receivable agreement are not conditioned upon continued ownership of Blackstone equity interests by the holders of Blackstone Holdings Partnership Units mentioned above.
Subsequent to December 31, 2023, payments totaling $92.4 million were made to certain holders of Blackstone Holdings Partnership Units mentioned above in accordance with the tax receivable agreement and related to tax benefits the Partnership received for the 2022 taxable year. Such payments included $3.1 million to Mr. Schwarzman, $0.3 million to Mr. Chae, $0.2 million to Mr. Finley, $0.1 million to Mr. Sawhney, and $1.2 million to Mr. Baratta, which amounts include payments to vehicles controlled by such persons or their relatives, as applicable.
In addition, the tax receivable agreement provides that upon certain mergers, asset sales, other forms of business combinations or other changes of control, the corporate taxpayers’ (or their successors’) obligations with respect to exchanged or acquired units (whether exchanged or acquired before or after such transaction) would be based on certain assumptions, including that the corporate taxpayers would have sufficient taxable income to fully utilize the benefits arising from the increased tax deductions and tax basis and other similar benefits. Upon a subsequent actual exchange, any additional increase in tax deductions, tax basis and other similar benefits in excess of the amounts assumed at the change in control will also result in payments under the tax receivable agreement.
Decisions we make in the course of running our business, such as with respect to mergers, asset sales, other forms of business combinations or other changes in control, may influence the timing and amount of payments that are received by an exchanging or selling holder of Blackstone Holdings Partnership Units under the tax receivable agreement. For example, the earlier disposition of assets following an exchange or acquisition transaction will generally accelerate payments under a tax receivable agreement and increase the present value of such payments, and the disposition of assets before an exchange or acquisition transaction will increase the tax liability of a holder of Blackstone Holdings Partnership Units without giving rise to any rights of a holder of Blackstone Holdings Partnership Units to receive payments under any tax receivable agreements.
Although we are not aware of any issue that would cause the IRS to challenge a tax basis increase, the corporate taxpayers will not be reimbursed for any payments previously made under a tax receivable agreement. As a result, in certain circumstances, payments could be made under a tax receivable agreement in excess of the corporate taxpayers’ cash tax savings.
Registration Rights Agreement
In connection with the restructuring and IPO, we entered into a registration rights agreement with our
pre-IPO
owners, which was subsequently amended in connection with the Conversion, pursuant to which we granted them, their affiliates and certain of their transferees the right, under certain circumstances and subject to certain restrictions, to require us to register under the Securities Act shares of common stock delivered in exchange for Blackstone Holdings Partnership Units or shares of common stock (and other securities convertible into or exchangeable or exercisable for our shares of common stock) otherwise held by them. In addition, newly-admitted Blackstone senior managing directors and certain others who acquire Blackstone Holdings Partnership Units have subsequently become parties to the registration rights agreement. In addition, our founder, Stephen A. Schwarzman, has the right to request that we register the sale of shares of common stock held by holders of Blackstone Holdings Partnership Units an unlimited number of times and may require us to make available shelf registration statements permitting sales of shares of common stock into the market from time to time over an extended period. In addition, Mr. Schwarzman has the ability to exercise certain piggyback registration rights in respect of shares of common stock held by holders of Blackstone Holdings Partnership Units in connection with registered offerings requested by other registration rights holders or initiated by us.
265
Tsinghua University Education Foundation
As part of an initiative announced in 2013, Mr. Schwarzman, through the Stephen A. Schwarzman Education Foundation, personally committed $100 million to create and endow a post-graduate scholarship program at Tsinghua University in Beijing, entitled “Schwarzman Scholars,” and fund the construction of a residential and academic building. He has led a fundraising campaign to raise $600 million to support the “Schwarzman Endowment Fund.” The Tsinghua University Education Foundation (“TUEF”) will hold the Schwarzman Endowment Fund and has agreed to delegate management of the fund to Blackstone. We have agreed that TUEF, and certain entities affiliated with TUEF, will not be required to pay Blackstone a management fee for managing the Schwarzman Endowment Fund and, to the extent Blackstone allocates and invests assets of the Schwarzman Endowment Fund in our funds, which may take the form of funded or unfunded general partner commitments to our investment funds, we anticipate that such investments will be subject to reduced or waived management fees and/or carried interest.
Joseph P. Baratta
Mr. Baratta received a base salary of $350,000 and an annual cash bonus payment of $4,650,000. The cash payment was based upon the performance of our private equity business, including the contribution of all current and past funds within the business dating back to before the IPO. The ultimate cash payment to Mr. Baratta was, however, determined in the discretion of Mr. Schwarzman and Mr. Gray. On January 8, 2024, Mr. Baratta was granted 25,190 shares of deferred restricted common stock with a grant date fair value of $3,081,744, reflecting the portion of his annual cash bonus payment mandatorily deferred into deferred restricted common stock pursuant to the Bonus Deferral Plan. In April 2023, Mr. Baratta was awarded a discretionary award of 23,280 deferred restricted common stock units with a grant date fair value of $2,044,915. This award reflected 2022 performance and was intended to further promote retention and to incentivize future performance. See “— Item 11. Executive Compensation — Narrative Disclosure to Summary Compensation Table and Grants of Plan-Based Awards in 2023 — Terms of Discretionary Equity Awards” for discussion of the vesting terms applicable to Mr. Baratta’s equity awards.
Mr. Baratta also participated in the performance fees of our funds, consisting of carried interest in our carry funds and incentive fees in our funds that pay incentive fees. The compensation paid to Mr. Baratta in respect of carried interest in our carry funds primarily relates to Mr. Baratta’s participation in the private equity funds (which were formed both before and after the IPO). The amount of distributions, whether cash or
in-kind,
in respect of carried interest or incentive fee allocations to Mr. Baratta for 2023 was $18,724,362. Any
in-kind
distributions in respect of carried interest are reported based on the market value of the securities distributed as of the date of distribution. See “— Item 11. Executive Compensation — Compensation Elements for Named Executive Officers” in this report for additional discussion of the elements of our compensation program.
Blackstone Holdings Partnership Agreements
As a result of the reorganization and the IPO, Blackstone Inc. (at that time, The Blackstone Group L.P.) became a holding partnership and, through wholly owned subsidiaries, held equity interests in the five holdings partnerships (i.e., Blackstone Holdings I L.P., Blackstone Holdings II L.P., Blackstone Holdings III L.P., Blackstone Holdings IV L.P. and Blackstone Holdings V L.P.). On January 1, 2009, in order to simplify our structure and ease the related administrative burden and costs, we effected an internal restructuring to reduce the number of holding partnerships from five to four by causing Blackstone Holdings III L.P. to transfer all of its assets and liabilities to Blackstone Holdings IV L.P. In connection therewith, Blackstone Holdings IV L.P. was renamed Blackstone Holdings III L.P. and Blackstone Holdings V L.P. was renamed Blackstone Holdings IV L.P. On October 1, 2015, Blackstone formed a new holding partnership, Blackstone Holdings AI L.P., which holds certain operating entities and operates in a manner similar to the other Blackstone Holdings Partnerships. “Blackstone Holdings” refers to (a) Blackstone Holdings I L.P., Blackstone Holdings II L.P., Blackstone Holdings III L.P., Blackstone Holdings IV L.P. and Blackstone Holdings V L.P. prior to the January 2009 reorganization, (b) Blackstone Holdings I L.P., Blackstone Holdings II L.P., Blackstone Holdings III L.P. and Blackstone Holdings IV L.P. from January 1, 2009 through October 1, 2015 and (c) Blackstone Holdings I L.P., Blackstone Holdings II L.P., Blackstone Holdings III L.P., Blackstone Holdings IV L.P. and Blackstone Holdings AI L.P. subsequent to the October 2015 creation of Blackstone Holdings AI L.P.
266
Wholly owned subsidiaries of Blackstone Inc. which are the general partners of those partnerships have the right to determine when distributions will be made to the partners of Blackstone Holdings and the amount of any such distributions. If a distribution is authorized, such distribution will be made to the partners of Blackstone Holdings
pro-rata
in accordance with the percentages of their respective partnership interests as described under “Part II. Item 5. Market for Registrant’s Common Equity, Related Stockholder Matters and Issuer Purchases of Equity Securities — Dividend Policy.”
Each of the Blackstone Holdings Partnerships has an identical number of partnership units outstanding, and we use the terms “Blackstone Holdings Partnership Unit” or “partnership unit in/of Blackstone Holdings” to refer, collectively, to a partnership unit in each of the Blackstone Holdings Partnerships. The holders of partnership units in Blackstone Holdings, including Blackstone Inc.’s wholly owned subsidiaries, will incur U.S. federal, state and local income taxes on their proportionate share of any net taxable income of Blackstone profits and net losses of Blackstone Holdings will generally be allocated to its partners (including Blackstone Inc.’s wholly owned subsidiaries)
pro-rata
in accordance with the percentages of their respective partnership interests as described under “Part II. Item 5. Market for Registrant’s Common Equity, Related Stockholder Matters and Issuer Purchases of Equity Securities — Dividend Policy.” The partnership agreements of the Blackstone Holdings Partnerships provide for cash distributions, which we refer to as “tax distributions,” to the partners of such partnerships if the wholly owned subsidiaries of Blackstone Inc. which are the general partners of the Blackstone Holdings Partnerships determine that the taxable income of the relevant partnership will give rise to taxable income for its partners. Generally, these tax distributions are computed based on our estimate of the net taxable income of the relevant partnership allocable to a partner multiplied by an assumed tax rate equal to the highest effective marginal combined U.S. federal, state and local income tax rate prescribed for an individual or corporate resident in New York, New York (taking into account the
non-deductibility
of certain expenses and the character of our income). Tax distributions are made only to the extent all distributions from such partnerships for the relevant year are insufficient to cover such tax liabilities.
Subject to the vesting and minimum retained ownership requirements and transfer restrictions set forth in the partnership agreements of the Blackstone Holdings Partnerships, Blackstone Holdings Partnership Units may be exchanged for shares of common stock as described under “— Exchange Agreement” below. In addition, the Blackstone Holdings partnership agreements authorize the wholly owned subsidiaries of Blackstone Inc., which are the general partners of those partnerships, to issue an unlimited number of additional partnership securities of the Blackstone Holdings Partnerships with such designations, preferences, rights, powers and duties that are different from, and may be senior to, those applicable to the Blackstone Holdings Partnership Units, and which may be exchangeable for shares of our common stock.
See “— Item 11. Executive Compensation — Narrative Disclosure to Summary Compensation Table and Grants of Plan-Based Awards in 2023 — Terms of Discretionary Equity Awards” for a discussion of minimum retained ownership requirements and transfer restrictions applicable to the Blackstone Holdings Partnership Units. The generally applicable minimum retained ownership requirements and transfer restrictions are outlined in the sections referenced in the preceding sentence. There may be some different arrangements for some individuals in some instances. In addition, we may waive these requirements and restrictions from time to time.
In addition, substantially all of our expenses, including substantially all expenses solely incurred by or attributable to Blackstone Inc. but not including obligations incurred under the tax receivable agreement by Blackstone Inc.’s wholly owned subsidiaries, income tax expenses of Blackstone Inc.’s wholly owned subsidiaries and payments on indebtedness incurred by Blackstone Inc.’s wholly owned subsidiaries, are borne by Blackstone Holdings.
Exchange Agreement
In connection with the reorganization and IPO, we entered into an exchange agreement with the holders of partnership units in Blackstone Holdings (other than Blackstone Inc.’s wholly owned subsidiaries). In addition, certain Blackstone senior managing directors and others who have acquired Blackstone Holdings Partnership Units also have become parties to the exchange agreement. Under the exchange agreement, as amended, subject to the vesting and minimum retained ownership requirements and transfer restrictions set forth in the partnership agreements of the Blackstone Holdings Partnerships, each such holder of Blackstone Holdings Partnership Units
267
(and certain transferees thereof) may up to four times each year (subject to the terms of the exchange agreement) exchange these partnership units for shares of our common stock on a
basis, subject to customary conversion rate adjustments for splits, unit distributions and reclassifications. Under the exchange agreement, to effect an exchange a holder of partnership units in Blackstone Holdings must simultaneously exchange one partnership unit in each of the Blackstone Holdings Partnerships. As a holder exchanges its Blackstone Holdings Partnership Units, Blackstone Inc.’s indirect interest in the Blackstone Holdings Partnerships will be correspondingly increased.
one-for-one
Payments to Kirkland & Ellis LLP
Reginald J. Brown, a member of our board of directors, is a partner at the law firm of Kirkland & Ellis LLP (“Kirkland”). We have engaged Kirkland from time to time in the ordinary course of business to provide legal services to us and our subsidiaries. Our relationship with Kirkland
pre-dates
Mr. Brown’s appointment to our board of directors. During 2023, we paid Kirkland approximately $41.6 million in legal fees (the “Fees”), and Mr. Brown’s interest in the Fees is estimated to be less than 1% of the Fees. Mr. Brown does not receive any direct compensation, specific origination bonus or other disproportionate allocation from legal fees we pay to Kirkland.
Firm Use of Private Aircraft
Certain entities controlled by Mr. Schwarzman wholly own aircraft that we use for business purposes in the course of our operations, and in 2023, we made payments of $2.5 million for the use of such aircraft, which included $1.8 million paid directly to the managers of the aircraft. An entity controlled by Mr. Gray wholly owns aircraft that we use for business purposes in the course of our operations, and in 2023, we made payments of $2.0 million for the use of such aircraft, which included $1.5 million paid directly to the manager of the aircraft. An entity jointly controlled by Mr. Baratta and two other individuals owns aircraft that we use for business purposes in the course of our operations, and in 2023, we made payments of $1.8 million for the use of such aircraft, which included $1.3 million paid directly to the manager of the aircraft. Each of Messrs. Schwarzman, Gray, and Baratta paid for his respective ownership interest in his aircraft himself and bore his respective share of all operating, personnel and maintenance costs associated with the operation of such aircraft. The hourly payments we made for use of such aircraft were based on current market rates.
Investment In or Alongside Our Funds
Our directors and executive officers may invest their own capital in or alongside our funds and other vehicles we manage, in some instances, without being subject to management fees, carried interest or incentive fees. For our carry funds, these investments may be made through the applicable fund general partner and fund a portion of the general partner capital commitments to our funds. These investment opportunities are available to all of our senior managing directors and to those of our employees whom we have determined to have a status that reasonably permits us to offer them these types of investments and in compliance with applicable laws. During the year ended December 31, 2023, our directors and executive officers (and, in some cases, certain investment trusts or other family vehicles or charitable organizations controlled by them or their immediate family members) had the following gross contributions relating to their personal investments (and the investments of any such trusts) in Blackstone funds and other Blackstone-managed vehicles: Mr. Schwarzman, Mr. Gray, Mr. Baratta, Mr. Chae, Mr. Breyer, Ms. Porat, Mr. Sawhney, Mr. Finley, Mr. Brown, Mr. Parrett, Mr. Mulroney, and Ms. Ayotte made gross contributions of $256.2 million, $24.0 million, $5.3 million, $4.3 million, $3.4 million, $1.5 million, $0.8 million, $0.5 million, $0.3 million, $0.2 million, $0.1 million, and $0.001 million, respectively.
Statement of Policy Regarding Transactions with Related Persons
Our board of directors has adopted a written statement of policy regarding transactions with related persons, which we refer to as our “related person policy.” Our related person policy requires that a “related person” (as defined as in paragraph (a) of Item 404 of Regulation
S-K)
must promptly disclose to the Chief Legal Officer any “related person transaction” (defined as any transaction that is reportable by us under Item 404(a) of Regulation
S-K
in which we were or are to be a participant and the amount involved exceeds $120,000 and in which any related person had or will have a direct or indirect material interest) and all material facts with respect thereto. The Chief Legal Officer will then promptly communicate that information to the board of directors. No related person transaction will be consummated without the approval or ratification of the board of directors or any committee of the board of directors consisting exclusively of independent and disinterested directors. It is our policy that directors interested in a related person transaction will recuse themselves from any vote of a related person transaction in which they have an interest.
268
Non-Competition
and
Non-Solicitation
Agreements
We have entered into a
non-competition
and
non-solicitation
agreement with each of our Senior Managing Directors, including each of our executive officers. See “— Item 11. Executive Compensation—
Non-Competition
and
Non-Solicitation
Agreements” for a description of the material terms of such agreements.
Director Independence
See “— Item 10. Directors, Executive Officers and Corporate Governance — Controlled Company Exception and Director Independence” for information on director independence.
269
|
Item 14.
|
Principal Accountant Fees and Services
|
The following table summarizes the aggregate fees for professional services provided by Deloitte & Touche LLP, the member firms of Deloitte Touche Tohmatsu and their respective affiliates (collectively, the “Deloitte Entities”):
|
Year Ended December 31, 2023
|
||||||||||||||||
|
Blackstone
Inc.
|
Blackstone
Entities, Principally Fund Related (c) |
Blackstone
Funds, Transaction Related (d) |
Total
|
|||||||||||||
|
(Dollars in Thousands)
|
||||||||||||||||
|
Audit Fees
|
$
|
9,914
|
(a)
|
$
|
59,323
|
|
$
|
—
|
|
$
|
69,237
|
|
||||
|
Audit-Related Fees
|
|
—
|
|
|
226
|
|
|
15,966
|
|
|
16,192
|
|
||||
|
Tax Fees
|
|
731
|
(b)
|
|
89,699
|
|
|
8,610
|
|
|
99,040
|
|
||||
|
All Other Fees
|
|
—
|
|
|
—
|
|
|
—
|
|
|
—
|
|
||||
|
|
|
|
|
|
|
|
|
|
|
|
|
|||||
|
$
|
10,645
|
|
$
|
149,248
|
|
$
|
24,576
|
|
$
|
184,469
|
|
|||||
|
|
|
|
|
|
|
|
|
|
|
|
|
|||||
|
Year Ended December 31, 2022
|
||||||||||||||||
|
Blackstone
Inc.
|
Blackstone
Entities, Principally Fund Related (c) |
Blackstone
Funds, Transaction Related (d) |
Total
|
|||||||||||||
|
(Dollars in Thousands)
|
||||||||||||||||
|
Audit Fees
|
$
|
10,123
|
(a)
|
$
|
51,916
|
|
$
|
—
|
|
$
|
62,039
|
|
||||
|
Audit-Related Fees
|
|
—
|
|
|
370
|
|
|
22,395
|
|
|
22,765
|
|
||||
|
Tax Fees
|
|
775
|
(b)
|
|
84,828
|
|
|
22,845
|
|
|
108,448
|
|
||||
|
All Other Fees
|
|
—
|
|
|
—
|
|
|
—
|
|
|
—
|
|
||||
|
|
|
|
|
|
|
|
|
|
|
|
|
|||||
|
$
|
10,898
|
|
$
|
137,114
|
|
$
|
45,240
|
|
$
|
193,252
|
|
|||||
|
|
|
|
|
|
|
|
|
|
|
|
|
|||||
|
(a)
|
Audit Fees consisted of fees for (1) the audits of our consolidated financial statements in our Annual Report on Form
10-K
and services attendant to, or required by, statute or regulation, (2) reviews of the interim condensed consolidated financial statements included in our quarterly reports on Form
10-Q,
and (3) consents and other services related to SEC and other regulatory filings.
|
|
(b)
|
Tax Fees consisted of fees for services rendered for tax compliance and tax planning and advisory services.
|
|
(c)
|
The Deloitte Entities also provide audit, audit-related and tax services (primarily tax compliance and related services) to certain Blackstone Funds and other corporate entities.
|
|
(d)
|
Audit-Related and Tax Fees included merger and acquisition due diligence services provided in connection with potential acquisitions of portfolio companies for investment purposes primarily to certain private equity and real estate funds managed by Blackstone in its capacity as the general partner. In addition, the Deloitte Entities provide audit, audit-related, tax and other services to the portfolio companies, which are approved directly by the portfolio company’s management and are not included in the amounts presented here.
|
Our audit committee charter, which is available on our website at http://ir.blackstone.com under “Corporate Governance,” requires the audit committee to
pre-approve
all audit and
non-audit
services to be provided by our independent registered public accounting firm in accordance with the charter of the audit committee. All services reported in the Audit, Audit-Related, Tax and All Other Fees categories above were approved by the audit committee.
270
Part IV.
|
Item 15.
|
Exhibits and Financial Statement Schedules
|
|
(a)
|
The following documents are filed as part of this annual report.
|
|
1.
|
Financial Statements:
|
See Item 8 above.
|
2.
|
Financial Statement Schedules:
|
Schedules for which provision is made in the applicable accounting regulations of the SEC are not required under the related instructions or are not applicable, and therefore have been omitted.
|
3.
|
Exhibits:
|
|
Exhibit
Number |
Exhibit Description
|
|
|
3.1
|
||
|
3.2
|
||
|
4.1
|
||
|
4.2
|
||
|
4.3
|
||
|
4.4
|
||
|
4.5
|
||
|
4.6
|
||
271
|
4.7
|
||
|
4.8
|
||
|
4.9
|
||
|
4.10
|
||
|
4.11
|
||
|
4.12
|
||
|
4.13
|
||
|
4.14
|
||
|
4.15
|
||
|
4.16
|
||
|
4.17
|
||
|
4.18
|
||
272
|
4.19
|
||
|
4.20
|
||
|
4.21
|
||
|
4.22
|
||
|
4.23
|
||
|
4.24
|
||
|
4.25
|
||
|
4.26
|
||
|
4.27
|
||
|
4.28
|
||
|
4.29
|
||
|
4.30
|
||
|
4.31
|
||
273
|
4.32
|
||
|
4.33
|
||
|
4.34
|
||
|
4.35
|
||
|
4.36
|
||
|
4.37
|
||
|
4.38
|
||
|
4.39
|
||
|
4.40
|
||
|
4.41
|
||
|
4.42
|
||
|
4.43
|
||
|
4.44
|
||
274
|
4.45
|
||
|
4.46
|
||
|
10.1
|
||
|
10.2
|
||
|
10.3
|
||
|
10.4
|
||
|
10.5
|
||
|
10.6
|
||
|
10.7+
|
||
275
|
10.8
|
||
|
10.9+*
|
||
|
10.10+
|
||
|
10.11+
|
||
|
10.12+
|
||
|
10.13+
|
||
|
10.14+
|
||
|
10.15+
|
||
|
10.16+
|
||
|
10.17+
|
||
|
10.18+
|
||
|
10.19+
|
||
276
|
10.20+
|
||
|
10.21+
|
||
|
10.22+
|
||
|
10.23+
|
||
|
10.24+
|
||
|
10.25+
|
||
|
10.26+
|
||
|
10.27+
|
||
|
10.28+
|
||
277
|
10.29+
|
||
|
10.30+
|
||
|
10.31+
|
||
|
10.32+
|
||
|
10.33+
|
||
|
10.34+
|
||
|
10.35+
|
||
|
10.36+
|
||
|
10.37+
|
||
|
10.38+
|
||
|
10.39+
|
||
278
|
10.40+
|
||
|
10.41+
|
||
|
10.42+
|
||
|
10.43+
|
||
|
10.44+
|
||
|
10.45+
|
||
|
10.46+
|
||
|
10.47+
|
||
|
10.48+
|
||
|
10.49+
|
||
|
10.50+
|
||
279
|
10.51+
|
||
|
10.52+
|
||
|
10.53+
|
||
|
10.54+
|
||
|
10.55+
|
||
|
10.56+
|
||
|
10.57+
|
||
|
10.58+
|
||
|
10.59+
|
||
|
10.60+
|
||
|
10.61
|
||
280
|
10.62+
|
||
|
10.63+
|
||
|
10.64+
|
||
|
10.65+
|
||
|
10.66+
|
||
|
10.67+
|
||
|
10.68+
|
||
|
10.69+
|
||
|
10.70+
|
||
|
10.71+
|
||
|
10.72+
|
||
281
|
10.73+
|
||
|
10.74+
|
||
|
10.75+
|
||
|
10.76+
|
||
|
10.77+
|
||
|
10.78+
|
||
|
10.79+
|
||
|
10.80+
|
||
|
10.81+
|
||
|
10.82*
|
||
|
10.83
|
||
|
10.84
|
||
282
|
10.85
|
||
|
10.86+
|
||
|
10.87+
|
||
|
10.88+
|
||
|
10.89+
|
||
|
10.90+
|
||
|
10.91+
|
||
|
10.92+
|
||
|
10.93+
|
||
283
|
10.94+
|
||
|
10.95+
|
||
|
10.96+
|
||
|
10.97+
|
||
|
10.98+
|
||
|
10.99+
|
||
|
10.100+
|
||
|
10.101+
|
||
|
10.102+
|
||
|
10.103+
|
||
|
10.104+
|
||
284
|
10.105+
|
||
|
10.106+
|
||
|
10.107+
|
||
|
10.108+
|
||
|
10.109+
|
||
|
10.110+
|
||
|
10.111+
|
||
|
10.112+
|
||
|
10.113+
|
||
|
10.114+
|
||
285
|
10.115+
|
||
|
10.116+
|
||
|
10.117+
|
||
|
10.118+
|
||
|
10.119
|
||
|
10.120
|
||
|
10.121*
|
||
|
10.122+
|
||
|
10.123+
|
||
|
10.124+
|
||
|
10.125+
|
||
286
|
10.126+
|
||
|
10.127+
|
||
|
21.1*
|
||
|
23.1*
|
||
|
31.1*
|
||
|
31.2*
|
||
|
32.1**
|
||
|
32.2**
|
||
|
97.1*
|
||
|
99.1*
|
||
|
101.INS*
|
Inline XBRL Instance Document.
|
|
|
101.SCH*
|
Inline XBRL Taxonomy Extension Schema Document.
|
|
|
101.CAL*
|
Inline XBRL Taxonomy Extension Calculation Linkbase Document.
|
|
|
101.DEF*
|
Inline XBRL Taxonomy Extension Definition Linkbase Document.
|
|
|
101.LAB*
|
Inline XBRL Taxonomy Extension Label Linkbase Document.
|
|
|
101.PRE*
|
Inline XBRL Taxonomy Extension Presentation Linkbase Document.
|
|
|
104*
|
Cover Page Interactive Data File (formatted as Inline XBRL and contained in Exhibit 101).
|
|
|
*
|
Filed herewith.
|
|
**
|
Furnished herewith.
|
|
+
|
Management contract or compensatory plan or arrangement in which directors or executive officers are eligible to participate.
|
The agreements and other documents filed as exhibits to this report are not intended to provide factual information or other disclosure other than with respect to the terms of the agreements or other documents themselves, and you should not rely on them for that purpose. In particular, any representations and warranties made by us in these agreements or other documents were made solely within the specific context of the relevant agreement or document and may not describe the actual state of affairs as of the date they were made or at any other time.
|
Item 16.
|
Form
10-K
Summary
|
None.
287
Signatures
Pursuant to the requirements of Section 13 or 15(d) of the Securities Exchange Act of 1934, the Registrant has duly caused this report to be signed on its behalf by the undersigned, thereunto duly authorized.
Date: February 23, 2024
|
Blackstone Inc.
|
||
|
/s/ Michael S. Chae
|
||
|
Name:
|
Michael S. Chae
|
|
|
Title:
|
Chief Financial Officer
|
|
|
(Principal Financial Officer and Authorized Signatory)
|
||
Pursuant to the requirements of the Securities Exchange Act of 1934, this report has been signed below by the following persons on behalf of the registrant and in the capacities indicated on this 23rd day of February, 2024.
|
/s/ Stephen A. Schwarzman
Stephen A. Schwarzman, Chief Executive Officer
and Chairman of the Board of Directors
(Principal Executive Officer)
|
/s/ James W. Breyer
James W. Breyer, Director
|
|
|
/s/ Jonathan D. Gray
Jonathan D. Gray, President, Chief Operating Officer and Director
|
/s/ Reginald J. Brown
Reginald J. Brown, Director
|
|
|
/s/ Michael S. Chae
Michael S. Chae, Chief Financial Officer
(Principal Financial Officer)
|
/s/ Rochelle B. Lazarus
Rochelle B. Lazarus, Director
|
|
|
/s/ David Payne
David Payne, Chief Accounting Officer
(Principal Accounting Officer)
|
/s/ Brian Mulroney
Brian Mulroney, Director
|
|
|
/s/ Joseph P. Baratta
Joseph P. Baratta, Director
|
/s/ William G. Parrett
William G. Parrett, Director
|
|
|
/s/ Kelly A. Ayotte
Kelly A. Ayotte, Director
|
/s/ Ruth Porat
Ruth Porat, Director
|
|
288
TABLE OF CONTENTS
Part IItem 1. BusinessItem 1A. Risk FactorsItem 1B. Unresolved Staff CommentsItem 1C. CybersecurityItem 2. PropertiesItem 3. Legal ProceedingsItem 4. Mine Safety DisclosuresPart IIItem 5. Market For Registrant S Common Equity, Related Stockholder Matters and Issuer Purchases Of Equity SecuritiesItem 6. (reserved)Item 7. Management S Discussion and Analysis Of Financial Condition and Results Of OperationsItem 7A. Quantitative and Qualitative Disclosures About Market RiskItem 8. Financial Statements and Supplementary DataItem 8A. Unaudited Supplemental Presentation Of Statements Of Financial ConditionItem 9. Changes in and Disagreements with Accountants on Accounting and Financial DisclosureItem 9A. Controls and ProceduresItem 9B. Other InformationItem 9C. Disclosures Regarding Foreign Jurisdictions That Prevent InspectionsPart IIIItem 10. Directors, Executive Officers and Corporate GovernanceItem 11. Executive CompensationItem 12. Security Ownership Of Certain Beneficial Owners and Management and Related Stockholder MattersItem 13. Certain Relationships and Related Transactions, and Director IndependenceItem 14. Principal Accountant Fees and ServicesPart IVItem 15. Exhibits and Financial Statement SchedulesItem 16. Form 10-k Summary