BLACKSTONE MORTGAGE TRUST, INC.
10-Ks and 10-Qs
|
|
|
|
|
|
|
|
|
|
|
|
|
|
|
|
|
|
|
|
|
|
|
|
|
|
|
|
|
|
|
|
|
|
|
|
|
|
|
|
|
|
|
|
|
|
|
|
|
|
|
|
|
|
|
|
|
|
|
UNITED STATES
SECURITIES AND EXCHANGE COMMISSION
WASHINGTON, D.C. 20549
FORM
10-Q
(Mark One)
|
|
QUARTERLY REPORT PURSUANT TO SECTION 13 OR 15(d) OF THE SECURITIES EXCHANGE ACT OF 1934 FOR THE QUARTERLY PERIOD ENDED
|
||||
OR
|
|
TRANSITION REPORT PURSUANT TO SECTION 13 OR 15(d) OF THE SECURITIES EXCHANGE ACT OF 1934 | ||||
FOR THE TRANSITION PERIOD FROM ______ TO ______
Commission File Number:
001-14788

(Exact name of Registrant as specified in its charter)
|
|
|
||||
|
(State or other jurisdiction of
incorporation or organization)
|
(I.R.S. Employer
Identification No.)
|
||||
(Address of principal executive offices)(Zip Code)
(
212
)
655-0220
(Registrant’s telephone number, including area code)
N/A
(Former name, former address and former fiscal year, if changed since last report)
Securities registered pursuant to Section 12(b) of the Act:
| Title of each class |
Trading
symbol(s)
|
Name of each exchange
on which registered
|
|||||||||||||||
|
|
par value $0.01 per share |
|
|
||||||||||||||
Indicate by check mark whether the registrant (1) has filed all reports required to be filed by Section 13 or 15(d) of the Securities Exchange Act of 1934 during the preceding 12 months (or for such shorter period that the registrant was required to file such reports), and (2) has been subject to such filing requirements for the past 90 days.
Yes
☒ No ☐
Indicate by check mark whether the registrant has submitted electronically every Interactive Data File required to be submitted pursuant to Rule 405 of Regulation S-T (§232.405 of this chapter) during the preceding 12 months (or for such shorter period that the registrant was required to submit such files).
Yes
☒ No ☐
Indicate by check mark whether the registrant is a large accelerated filer, an accelerated filer, a non-accelerated filer, a smaller reporting company, or an emerging growth company. See the definitions of “large accelerated filer,” “accelerated filer,” “smaller reporting company” and “emerging growth company” in Rule 12b-2 of the Exchange Act.
|
|
☒ | Accelerated filer | ☐ | |||||||||||
| Non-accelerated filer | ☐ | Smaller reporting company |
|
|||||||||||
| Emerging growth company |
|
|||||||||||||
If an emerging growth company, indicate by check mark if the registrant has elected not to use the extended transition period for complying with any new or revised financial accounting standards provided pursuant to Section 13(a) of the Exchange Act. ☐
Indicate by check mark whether the registrant is a shell company (as defined in Rule 12b-2 of the Exchange Act). Yes
☐
No ☒
The number of the registrant’s shares of class A common stock, par value $0.01 per share, outstanding as of October 18, 2023 was
172,297,559
.
TABLE OF CONTENTS
| Page | ||||||||
| PART I. | FINANCIAL INFORMATION | |||||||
| ITEM 1. | ||||||||
| Consolidated Financial Statements (Unaudited): | ||||||||
| ITEM 2. | ||||||||
| ITEM 3. | ||||||||
| ITEM 4. | ||||||||
| PART II. | OTHER INFORMATION | |||||||
| ITEM 1. | ||||||||
| ITEM 1A. | ||||||||
| ITEM 2. | ||||||||
| ITEM 3. | ||||||||
| ITEM 4. | ||||||||
| ITEM 5. | ||||||||
| ITEM 6. | ||||||||
TABLE OF CONTENTS
Website Disclosure
We use our website (www.blackstonemortgagetrust.com) as a channel of distribution of company information. The information we post through this channel may be deemed material. Accordingly, investors should monitor this channel, in addition to following our press releases, Securities and Exchange Commission, or SEC, filings and public conference calls, and webcasts. In addition, you may automatically receive email alerts and other information about Blackstone Mortgage Trust when you enroll your email address by visiting the “Contact Us and Email Alerts” section of our website at http://ir.blackstonemortgagetrust.com. The contents of our website and any alerts are not, however, a part of this report.
PART I. FINANCIAL INFORMATION
ITEM 1. FINANCIAL STATEMENTS
Blackstone Mortgage Trust, Inc.
Consolidated Balance Sheets (Unaudited)
(in thousands, except share data)
| September 30, 2023 | December 31, 2022 | ||||||||||
| Assets | |||||||||||
| Cash and cash equivalents | $ |
|
$ |
|
|||||||
| Loans receivable |
|
|
|||||||||
| Current expected credit loss reserve |
(
|
(
|
|||||||||
| Loans receivable, net |
|
|
|||||||||
| Other assets |
|
|
|||||||||
| Total Assets | $ |
|
$ |
|
|||||||
| Liabilities and Equity | |||||||||||
| Secured debt, net | $ |
|
$ |
|
|||||||
| Securitized debt obligations, net |
|
|
|||||||||
| Asset-specific debt, net |
|
|
|||||||||
| Loan participations sold, net |
|
|
|||||||||
| Term loans, net |
|
|
|||||||||
| Senior secured notes, net |
|
|
|||||||||
| Convertible notes, net |
|
|
|||||||||
| Other liabilities |
|
|
|||||||||
| Total Liabilities |
|
|
|||||||||
| Commitments and contingencies |
|
|
|||||||||
| Equity | |||||||||||
|
Class A common stock, $
|
|
|
|||||||||
| Additional paid-in capital |
|
|
|||||||||
| Accumulated other comprehensive income |
|
|
|||||||||
| Accumulated deficit |
(
|
(
|
|||||||||
| Total Blackstone Mortgage Trust, Inc. stockholders’ equity |
|
|
|||||||||
| Non-controlling interests |
|
|
|||||||||
| Total Equity |
|
|
|||||||||
| Total Liabilities and Equity | $ |
|
$ |
|
|||||||
Note: The consolidated balance sheets as of September 30, 2023 and December 31, 2022 include assets of consolidated variable interest entities, or VIEs, that can only be used to settle obligations of each respective VIE, and liabilities of consolidated VIEs for which creditors do not have recourse to Blackstone Mortgage Trust, Inc. As of September 30, 2023 and December 31, 2022, assets of the consolidated VIEs totaled $
3.0
billion and $
3.2
billion, respectively and liabilities of the consolidated VIEs totaled $
2.5
billion and $
2.7
billion, respectively. Refer to Note 18 for additional discussion of the VIEs.
See accompanying notes to consolidated financial statements.
3
Blackstone Mortgage Trust, Inc.
Consolidated Statements of Operations (Unaudited)
(in thousands, except share and per share data)
|
Three Months Ended
September 30, |
Nine Months Ended
September 30, |
||||||||||||||||||||||
| 2023 | 2022 | 2023 | 2022 | ||||||||||||||||||||
| Income from loans and other investments | |||||||||||||||||||||||
| Interest and related income | $ |
|
$ |
|
$ |
|
$ |
|
|||||||||||||||
| Less: Interest and related expenses |
|
|
|
|
|||||||||||||||||||
| Income from loans and other investments, net |
|
|
|
|
|||||||||||||||||||
| Other expenses | |||||||||||||||||||||||
| Management and incentive fees |
|
|
|
|
|||||||||||||||||||
| General and administrative expenses |
|
|
|
|
|||||||||||||||||||
| Total other expenses |
|
|
|
|
|||||||||||||||||||
| Increase in current expected credit loss reserve |
(
|
(
|
(
|
(
|
|||||||||||||||||||
| Gain on extinguishment of debt |
|
|
|
|
|||||||||||||||||||
| Income before income taxes |
|
|
|
|
|||||||||||||||||||
| Income tax provision |
|
|
|
|
|||||||||||||||||||
| Net income |
|
|
|
|
|||||||||||||||||||
| Net income attributable to non-controlling interests |
(
|
(
|
(
|
(
|
|||||||||||||||||||
| Net income attributable to Blackstone Mortgage Trust, Inc. | $ |
|
$ |
|
$ |
|
$ |
|
|||||||||||||||
| Net income per share of common stock | |||||||||||||||||||||||
| Basic | $ |
|
$ |
|
$ |
|
$ |
|
|||||||||||||||
| Diluted | $ |
|
$ |
|
$ |
|
$ |
|
|||||||||||||||
| Weighted-average shares of common stock outstanding | |||||||||||||||||||||||
| Basic |
|
|
|
|
|||||||||||||||||||
| Diluted |
|
|
|
|
|||||||||||||||||||
See accompanying notes to consolidated financial statements.
4
Blackstone Mortgage Trust, Inc.
Consolidated Statements of Comprehensive Income (Unaudited)
(in thousands)
|
Three Months Ended
September 30, |
Nine Months Ended
September 30, |
||||||||||||||||||||||
| 2023 | 2022 | 2023 | 2022 | ||||||||||||||||||||
| Net income | $ |
|
$ |
|
$ |
|
$ |
|
|||||||||||||||
| Other comprehensive (loss) income | |||||||||||||||||||||||
|
Unrealized loss on foreign currency translation
|
(
|
(
|
(
|
(
|
|||||||||||||||||||
|
Realized and unrealized gain on derivative financial instruments
|
|
|
|
|
|||||||||||||||||||
|
Other comprehensive (loss) income
|
(
|
(
|
|
(
|
|||||||||||||||||||
| Comprehensive income |
|
|
|
|
|||||||||||||||||||
| Comprehensive income attributable to non-controlling interests |
(
|
(
|
(
|
(
|
|||||||||||||||||||
| Comprehensive income attributable to Blackstone Mortgage Trust, Inc. | $ |
|
$ |
|
$ |
|
$ |
|
|||||||||||||||
See accompanying notes to consolidated financial statements.
5
Blackstone Mortgage Trust, Inc.
Consolidated Statements of Changes in Equity (Unaudited)
(in thousands)
|
Blackstone Mortgage Trust, Inc.
|
|||||||||||||||||||||||||||||||||||||||||
|
Class A
Common Stock |
Additional Paid-
In Capital
|
Accumulated Other
Comprehensive Income (Loss) |
Accumulated
Deficit
|
Stockholders’
Equity
|
Non-Controlling
Interests
|
Total
Equity
|
|||||||||||||||||||||||||||||||||||
|
Balance at December 31, 2022
|
$ |
|
$ |
|
$ |
|
$ |
(
|
$ |
|
$ |
|
$ |
|
|||||||||||||||||||||||||||
| Restricted class A common stock earned |
|
|
— | — |
|
— |
|
||||||||||||||||||||||||||||||||||
| Dividends reinvested | — |
|
— | — |
|
— |
|
||||||||||||||||||||||||||||||||||
| Deferred directors’ compensation | — |
|
— | — |
|
— |
|
||||||||||||||||||||||||||||||||||
| Net income | — | — | — |
|
|
|
|
||||||||||||||||||||||||||||||||||
| Other comprehensive loss | — | — |
(
|
— |
(
|
— |
(
|
||||||||||||||||||||||||||||||||||
|
Dividends declared on common stock and deferred stock units, $
|
— | — | — |
(
|
(
|
— |
(
|
||||||||||||||||||||||||||||||||||
| Distributions to non-controlling interests | — | — | — | — | — |
(
|
(
|
||||||||||||||||||||||||||||||||||
|
Balance at March 31, 2023
|
$ |
|
$ |
|
$ |
|
$ |
(
|
$ |
|
$ |
|
$ |
|
|||||||||||||||||||||||||||
| Restricted class A common stock earned | — |
|
— | — |
|
— |
|
||||||||||||||||||||||||||||||||||
| Dividends reinvested | — |
|
— | — |
|
— |
|
||||||||||||||||||||||||||||||||||
| Deferred directors’ compensation | — |
|
— | — |
|
— |
|
||||||||||||||||||||||||||||||||||
| Net income | — | — | — |
|
|
|
|
||||||||||||||||||||||||||||||||||
| Other comprehensive income | — | — |
|
— |
|
— |
|
||||||||||||||||||||||||||||||||||
|
Dividends declared on common stock and deferred stock units, $
|
— | — | — |
(
|
(
|
— |
(
|
||||||||||||||||||||||||||||||||||
| Distributions to non-controlling interests | — | — | — | — | — |
(
|
(
|
||||||||||||||||||||||||||||||||||
|
Balance at June 30, 2023
|
$ |
|
$ |
|
$ |
|
$ |
(
|
$ |
|
$ |
|
$ |
|
|||||||||||||||||||||||||||
| Restricted class A common stock earned | — |
|
— | — |
|
— |
|
||||||||||||||||||||||||||||||||||
| Dividends reinvested | — |
|
— | — |
|
— |
|
||||||||||||||||||||||||||||||||||
| Deferred directors’ compensation | — |
|
— | — |
|
— |
|
||||||||||||||||||||||||||||||||||
| Net income | — | — | — |
|
|
|
|
||||||||||||||||||||||||||||||||||
| Other comprehensive loss | — | — |
(
|
— |
(
|
— |
(
|
||||||||||||||||||||||||||||||||||
|
Dividends declared on common stock and deferred stock units, $
|
— | — | — |
(
|
(
|
— |
(
|
||||||||||||||||||||||||||||||||||
| Distributions to non-controlling interests | — | — | — | — | — |
(
|
(
|
||||||||||||||||||||||||||||||||||
|
Balance at September 30, 2023
|
$ |
|
$ |
|
$ |
|
$ |
(
|
$ |
|
$ |
|
$ |
|
|||||||||||||||||||||||||||
6
Blackstone Mortgage Trust, Inc.
Consolidated Statements of Changes in Equity (Unaudited)
(in thousands)
|
Blackstone Mortgage Trust, Inc.
|
|||||||||||||||||||||||||||||||||||||||||
|
Class A
Common Stock |
Additional Paid-
In Capital
|
Accumulated Other
Comprehensive Income (Loss) |
Accumulated
Deficit
|
Stockholders’
Equity
|
Non-Controlling
Interests
|
Total
Equity
|
|||||||||||||||||||||||||||||||||||
|
Balance at December 31, 2021
|
$ |
|
$ |
|
$ |
|
$ |
(
|
$ |
|
$ |
|
$ |
|
|||||||||||||||||||||||||||
| — |
(
|
— |
|
(
|
— |
(
|
|||||||||||||||||||||||||||||||||||
| Shares of class A common stock issued, net |
|
|
— | — |
|
— |
|
||||||||||||||||||||||||||||||||||
| Restricted class A common stock earned |
|
|
— | — |
|
— |
|
||||||||||||||||||||||||||||||||||
| Dividends reinvested | — |
|
— | — |
|
— |
|
||||||||||||||||||||||||||||||||||
| Deferred directors’ compensation | — |
|
— | — |
|
— |
|
||||||||||||||||||||||||||||||||||
| Net income | — | — | — |
|
|
|
|
||||||||||||||||||||||||||||||||||
| Other comprehensive income | — | — |
|
— |
|
— |
|
||||||||||||||||||||||||||||||||||
|
Dividends declared on common stock and deferred stock units, $
|
— | — | — |
(
|
(
|
— |
(
|
||||||||||||||||||||||||||||||||||
| Contributions from non-controlling interests | — | — | — | — | — |
|
|
||||||||||||||||||||||||||||||||||
| Distributions to non-controlling interests | — | — | — | — | — |
(
|
(
|
||||||||||||||||||||||||||||||||||
|
Balance at March 31, 2022
|
$ |
|
$ |
|
$ |
|
$ |
(
|
$ |
|
$ |
|
$ |
|
|||||||||||||||||||||||||||
| Restricted class A common stock earned | — |
|
— | — |
|
— |
|
||||||||||||||||||||||||||||||||||
| Dividends reinvested | — |
|
— | — |
|
— |
|
||||||||||||||||||||||||||||||||||
| Deferred directors’ compensation | — |
|
— | — |
|
— |
|
||||||||||||||||||||||||||||||||||
| Net income | — | — | — |
|
|
|
|
||||||||||||||||||||||||||||||||||
| Other comprehensive loss | — | — |
(
|
— |
(
|
— |
(
|
||||||||||||||||||||||||||||||||||
|
Dividends declared on common stock and deferred stock units, $
|
— | — | — |
(
|
(
|
— |
(
|
||||||||||||||||||||||||||||||||||
| Distributions to non-controlling interests | — | — | — | — | — |
(
|
(
|
||||||||||||||||||||||||||||||||||
|
Balance at June 30, 2022
|
$ |
|
$ |
|
$ |
|
$ |
(
|
$ |
|
$ |
|
$ |
|
|||||||||||||||||||||||||||
| Shares of class A common stock issued, net |
|
|
$ | — | $ | — |
|
$ | — | $ |
|
||||||||||||||||||||||||||||||
| Restricted class A common stock earned | — |
|
— | — |
|
— |
|
||||||||||||||||||||||||||||||||||
| Dividends reinvested | — |
|
— | — |
|
— |
|
||||||||||||||||||||||||||||||||||
| Deferred directors’ compensation | — |
|
— | — |
|
— |
|
||||||||||||||||||||||||||||||||||
| Net income | — | — | — |
|
|
|
|
||||||||||||||||||||||||||||||||||
| Other comprehensive loss | — | — |
(
|
— |
(
|
— |
(
|
||||||||||||||||||||||||||||||||||
|
Dividends declared on common stock and deferred stock units, $
|
— | — | — |
(
|
(
|
— |
(
|
||||||||||||||||||||||||||||||||||
| Distributions to non-controlling interests | — | — | — | — | — |
(
|
(
|
||||||||||||||||||||||||||||||||||
|
Balance at September 30, 2022
|
$ |
|
$ |
|
$ |
|
$ |
(
|
$ |
|
$ |
|
$ |
|
|||||||||||||||||||||||||||
See accompanying notes to consolidated financial statements.
7
Blackstone Mortgage Trust, Inc.
Consolidated Statements of Cash Flows (Unaudited)
(in thousands)
| Nine Months Ended September 30, | |||||||||||
| 2023 | 2022 | ||||||||||
| Cash flows from operating activities | |||||||||||
| Net income | $ |
|
$ |
|
|||||||
| Adjustments to reconcile net income to net cash provided by operating activities | |||||||||||
| Non-cash compensation expense |
|
|
|||||||||
| Amortization of deferred fees on loans and debt securities |
(
|
(
|
|||||||||
| Amortization of deferred financing costs and premiums/discounts on debt obligations |
|
|
|||||||||
| Increase in current expected credit loss reserve |
|
|
|||||||||
| Gain on extinguishment of debt |
(
|
|
|||||||||
| Unrealized gain on assets denominated in foreign currencies, net |
|
(
|
|||||||||
| Unrealized loss (gain) on derivative financial instruments, net |
|
(
|
|||||||||
| Realized gain on derivative financial instruments, net |
(
|
(
|
|||||||||
| Changes in assets and liabilities, net | |||||||||||
| Other assets |
(
|
(
|
|||||||||
| Other liabilities |
(
|
|
|||||||||
| Net cash provided by operating activities |
|
|
|||||||||
| Cash flows from investing activities | |||||||||||
| Principal fundings of loans receivable |
(
|
(
|
|||||||||
| Principal collections, sales proceeds, and cost-recovery proceeds from loans receivable and debt securities |
|
|
|||||||||
| Origination and other fees received on loans receivable |
|
|
|||||||||
| Payments under derivative financial instruments |
(
|
(
|
|||||||||
| Receipts under derivative financial instruments |
|
|
|||||||||
| Collateral deposited under derivative agreements |
(
|
(
|
|||||||||
| Return of collateral deposited under derivative agreements |
|
|
|||||||||
| Net cash provided by (used in) investing activities |
|
(
|
|||||||||
See accompanying notes to consolidated financial statements.
8
Blackstone Mortgage Trust, Inc.
Consolidated Statements of Cash Flows (Unaudited)
(in thousands)
| Nine Months Ended September 30, | |||||||||||
| 2023 | 2022 | ||||||||||
| Cash flows from financing activities | |||||||||||
| Borrowings under secured debt | $ |
|
$ |
|
|||||||
| Repayments under secured debt |
(
|
(
|
|||||||||
|
Repayments of securitized debt obligations
|
(
|
|
|||||||||
| Borrowings under asset-specific debt |
|
|
|||||||||
| Repayments under asset-specific debt |
(
|
(
|
|||||||||
| Proceeds from sale of loan participations |
|
|
|||||||||
| Net proceeds from term loan borrowings |
|
|
|||||||||
| Repayments of term loans |
(
|
(
|
|||||||||
|
Repurchases of senior secured notes
|
(
|
|
|||||||||
| Net proceeds from issuance of convertible notes |
|
|
|||||||||
| Repayment of convertible notes |
(
|
(
|
|||||||||
| Payment of deferred financing costs |
(
|
(
|
|||||||||
| Contributions from non-controlling interests |
|
|
|||||||||
| Distributions to non-controlling interests |
(
|
(
|
|||||||||
| Net proceeds from issuance of class A common stock |
|
|
|||||||||
| Dividends paid on class A common stock |
(
|
(
|
|||||||||
| Net cash (used in) provided by financing activities |
(
|
|
|||||||||
| Net increase (decrease) in cash and cash equivalents |
|
(
|
|||||||||
| Cash and cash equivalents at beginning of period |
|
|
|||||||||
| Effects of currency translation on cash and cash equivalents |
|
(
|
|||||||||
| Cash and cash equivalents at end of period | $ |
|
$ |
|
|||||||
| Supplemental disclosure of cash flows information | |||||||||||
| Payments of interest | $ |
(
|
$ |
(
|
|||||||
| Payments of income taxes | $ |
(
|
$ |
(
|
|||||||
| Supplemental disclosure of non-cash investing and financing activities | |||||||||||
| Dividends declared, not paid | $ |
(
|
$ |
(
|
|||||||
| Loan principal payments held by servicer, net | $ |
|
$ |
|
|||||||
See accompanying notes to consolidated financial statements.
9
Blackstone Mortgage Trust, Inc.
Notes to Consolidated Financial Statements (Unaudited)
1.
ORGANIZATION
References herein to “Blackstone Mortgage Trust,” “Company,” “we,” “us” or “our” refer to Blackstone Mortgage Trust, Inc., a Maryland corporation, and its subsidiaries unless the context specifically requires otherwise.
Blackstone Mortgage Trust is a real estate finance company that originates senior loans collateralized by commercial real estate in North America, Europe, and Australia. Our portfolio is composed primarily of loans secured by high-quality, institutional assets in major markets, sponsored by experienced, well-capitalized real estate investment owners and operators. These senior loans are capitalized by accessing a variety of financing options, including borrowing under our credit facilities, issuing CLOs or single-asset securitizations, and syndicating senior loan participations, depending on our view of the most prudent financing option available for each of our investments. We are not in the business of buying or trading securities, and the only securities we own are the retained interests from our securitization financing transactions, which we have not financed. We are externally managed by BXMT Advisors L.L.C., or our Manager, a subsidiary of Blackstone Inc., or Blackstone, and are a real estate investment trust, or REIT, traded on the New York Stock Exchange, or NYSE, under the symbol “BXMT.” Our principal executive offices are located at 345 Park Avenue, 24th Floor, New York, New York 10154.
We conduct our operations as a REIT for U.S. federal income tax purposes. We generally will not be subject to U.S. federal income taxes on our taxable income to the extent that we annually distribute all of our net taxable income to stockholders and maintain our qualification as a REIT. We also operate our business in a manner that permits us to maintain an exclusion from registration under the Investment Company Act of 1940, as amended. We are organized as a holding company and conduct our business primarily through our various subsidiaries.
2.
SUMMARY OF SIGNIFICANT ACCOUNTING POLICIES
The accompanying unaudited consolidated financial statements have been prepared in accordance with accounting principles generally accepted in the United States of America, or GAAP, for interim financial information and the instructions to Form 10-Q and Rule 10-01 of Regulation S-X. The consolidated financial statements, including the notes thereto, are unaudited and exclude some of the disclosures required in audited financial statements. We believe we have made all necessary adjustments, consisting of only normal recurring items, so that the consolidated financial statements are presented fairly and that estimates made in preparing our consolidated financial statements are reasonable and prudent. The operating results presented for interim periods are not necessarily indicative of the results that may be expected for any other interim period or for the entire year. The accompanying unaudited consolidated interim financial statements should be read in conjunction with the audited consolidated financial statements included in our Annual Report on Form 10-K for the fiscal year ended December 31, 2022 filed with the Securities and Exchange Commission, or the SEC.
Basis of Presentation
The accompanying consolidated financial statements include, on a consolidated basis, our accounts, the accounts of our wholly-owned subsidiaries, majority-owned subsidiaries, and variable interest entities, or VIEs, of which we are the primary beneficiary. All intercompany balances and transactions have been eliminated in consolidation.
Certain reclassifications have been made in the presentation of the prior period statements of changes in equity related to restricted class A common stock and in the loans receivable disclosures related to risk ratings, property type, and geography in Note 3 to conform to the current period presentation.
Principles of Consolidation
We consolidate all entities that we control through either majority ownership or voting rights. In addition, we consolidate all VIEs of which we are considered the primary beneficiary. VIEs are defined as entities in which equity investors (i) do not have an interest with the characteristics of a controlling financial interest and/or (ii) do not have sufficient equity at risk for the entity to finance its activities without additional subordinated financial support from other parties. The entity that consolidates a VIE is known as its primary beneficiary and is generally the entity with (i) the power to direct the activities that most significantly affect the VIE’s economic performance and (ii) the right to receive benefits from the VIE or the obligation to absorb losses of the VIE that could be significant to the VIE.
In 2017, we entered into a joint venture, or our Multifamily Joint Venture, with Walker & Dunlop Inc. to originate, hold, and finance multifamily bridge loans. Pursuant to the terms of the agreements governing the joint venture, Walker &
10
Blackstone Mortgage Trust, Inc.
Notes to Consolidated Financial Statements (continued) (Unaudited)
Use of Estimates
The preparation of consolidated financial statements in conformity with GAAP requires us to make estimates and assumptions that affect the reported amounts of assets and liabilities and disclosure of contingent assets and liabilities as of the date of the consolidated financial statements and the reported amounts of revenues and expenses during the reporting period. Actual results may ultimately differ materially from those estimates.
Revenue Recognition
Interest income from our loans receivable portfolio is recognized over the life of each investment using the effective interest method and is recorded on the accrual basis. Recognition of fees, premiums, and discounts associated with these investments is deferred and recorded over the term of the loan as an adjustment to yield. Income accrual is generally suspended for loans at the earlier of the date at which payments become 90 days past due or when, in our opinion, recovery of income and principal becomes doubtful. Interest received is then recorded as income or as a reduction in the amortized cost basis, based on the specific facts and circumstances, until accrual is resumed when the loan becomes contractually current and performance is demonstrated to be resumed. In addition, for loans we originate, the related origination expenses are deferred and recognized as a reduction to interest income, however expenses related to loans we acquire are included in general and administrative expenses as incurred.
Cash and Cash Equivalents
Cash and cash equivalents represent cash held in banks and liquid investments with original maturities of three months or less. We may have bank balances in excess of federally insured amounts; however, we deposit our cash and cash equivalents with high credit-quality institutions to minimize credit risk exposure. We have not experienced, and do not expect, any losses on our cash or cash equivalents. As of both September 30, 2023 and December 31, 2022, we had
no
restricted cash on our consolidated balance sheets.
Through our subsidiaries, we have oversight of certain servicing accounts held with third-party servicers, or Servicing Accounts, which relate to borrower escrows and other cash balances aggregating $
634.7
million and $
459.6
million as of September 30, 2023 and December 31, 2022, respectively. This cash is maintained in segregated bank accounts, and these amounts are not included in the assets and liabilities presented in our consolidated balance sheets. Cash in these Servicing Accounts will be transferred by the respective third-party servicer to the borrower or us under the terms of the applicable loan agreement upon occurrence of certain future events. We do not generate any revenue or incur any expenses as a result of these Servicing Accounts.
Current Expected Credit Losses Reserve
The current expected credit loss, or CECL, reserve required under the Financial Accounting Standards Board, or FASB, Accounting Standards Codification, or ASC, Topic 326 “Financial Instruments – Credit Losses,” or ASC 326, reflects our current estimate of potential credit losses related to our loans included in our consolidated balance sheets. Changes to the CECL reserve are recognized through net income on our consolidated statements of operations. While ASC 326 does not require any particular method for determining the CECL reserve, it does specify the reserve should be based on relevant information about past events, including historical loss experience, current portfolio and market conditions, and reasonable and supportable forecasts for the duration of each respective loan. In addition, other than a few narrow exceptions, ASC 326 requires that all financial instruments subject to the CECL model have some amount of loss reserve to reflect the GAAP principal underlying the CECL model that all loans and similar assets have some inherent risk of loss, regardless of credit quality, subordinate capital, or other mitigating factors.
11
Blackstone Mortgage Trust, Inc.
Notes to Consolidated Financial Statements (continued) (Unaudited)
We estimate our CECL reserve primarily using the Weighted-Average Remaining Maturity, or WARM method, which has been identified as an acceptable loss-rate method for estimating CECL reserves in FASB Staff Q&A Topic 326, No. 1. The WARM method requires us to reference historic loan loss data across a comparable data set and apply such loss rate to each of our loans over their expected remaining term, taking into consideration expected economic conditions over the relevant timeframe. We apply the WARM method for the majority of our loan portfolio, which consists of loans that share similar risk characteristics. In certain instances, for loans with unique risk characteristics, we may instead use a probability-weighted model that considers the likelihood of default and expected loss given default for each such individual loan.
Application of the WARM method to estimate a CECL reserve requires judgment, including (i) the appropriate historical loan loss reference data, (ii) the expected timing and amount of future loan fundings and repayments, and (iii) the current credit quality of our portfolio and our expectations of performance and market conditions over the relevant time period. To estimate the historic loan losses relevant to our portfolio, we have augmented our historical loan performance, with market loan loss data licensed from Trepp LLC. This database includes commercial mortgage-backed securities, or CMBS, issued since January 1, 1999 through August 31, 2023. Within this database, we focused our historical loss reference calculations on the most relevant subset of available CMBS data, which we determined based on loan metrics that are most comparable to our loan portfolio including asset type, geography, and origination loan-to-value, or LTV. We believe this CMBS data, which includes month-over-month loan and property performance, is the most relevant, available, and comparable dataset to our portfolio.
Our loans typically include commitments to fund incremental proceeds to our borrowers over the life of the loan. These future funding commitments are also subject to the CECL model. The CECL reserve related to future loan fundings is recorded as a component of other liabilities on our consolidated balance sheets. This CECL reserve is estimated using the same process outlined above for our outstanding loan balances, and changes in this component of the CECL reserve will similarly impact our consolidated net income. For both the funded and unfunded portions of our loans, we consider our internal risk rating of each loan as the primary credit quality indicator underlying our assessment.
The CECL reserve is measured on a collective basis wherever similar risk characteristics exist within a pool of similar assets. We have identified the following pools and measure the reserve for credit losses using the following methods:
•
U.S. Loans
: WARM method that incorporates a subset of historical loss data, expected weighted-average remaining maturity of our loan pool, and an economic view.
•
Non-U.S. Loans
: WARM method that incorporates a subset of historical loss data, expected weighted-average remaining maturity of our loan pool, and an economic view.
•
Unique Loans
: a probability of default and loss given default model, assessed on an individual basis.
•
Impaired Loans
: impairment is indicated when it is deemed probable that we will not be able to collect all amounts due to us pursuant to the contractual terms of the loan. Determining that a loan is impaired requires significant judgment from management and is based on several factors including (i) the underlying collateral performance, (ii) discussions with the borrower, (iii) borrower events of default, and (iv) other facts that impact the borrower’s ability to pay the contractual amounts due under the terms of the loan. If a loan is determined to be impaired, we record the impairment as a component of our CECL reserve by applying the practical expedient for collateral dependent loans. The CECL reserve is assessed on an individual basis for these loans by comparing the estimated fair value of the underlying collateral, less costs to sell, to the book value of the respective loan. These valuations require significant judgments, which include assumptions regarding capitalization rates, discount rates, leasing, creditworthiness of major tenants, occupancy rates, availability and cost of financing, exit plan, loan sponsorship, actions of other lenders, and other factors. Actual losses, if any, could ultimately differ materially from these estimates. We only expect to charge-off the impairment losses if and when such amounts are deemed nonrecoverable. This is generally at the time a loan is repaid or foreclosed. However, non-recoverability may also be concluded if, in our determination, it is nearly certain that all amounts due will not be collected.
Contractual Term and Unfunded Loan Commitments
Expected credit losses are estimated over the contractual term of each loan, adjusted for expected repayments. As part of our quarterly review of our loan portfolio, we assess the expected repayment date of each loan, which is used to determine the contractual term for purposes of computing our CECL reserve.
Additionally, the expected credit losses over the contractual period of our loans are subject to the obligation to extend credit through our unfunded loan commitments. The CECL reserve for unfunded loan commitments is adjusted quarterly, as we consider the expected timing of future funding obligations over the estimated life of the loan. The considerations in
12
Blackstone Mortgage Trust, Inc.
Notes to Consolidated Financial Statements (continued) (Unaudited)
estimating our CECL reserve for unfunded loan commitments are similar to those used for the related outstanding loans receivable.
Credit Quality Indicator
Our risk rating is our primary credit quality indicator in assessing our current expected credit loss reserve. We perform a quarterly risk review of our portfolio of loans, and assign each loan a risk rating based on a variety of factors, including, without limitation, origination LTV, debt yield, property type, geographic and local market dynamics, physical condition, cash flow volatility, leasing and tenant profile, loan structure and exit plan, and project sponsorship. Based on a 5-point scale, our loans are rated “l” through “5,” from less risk to greater risk, relative to our loan portfolio in the aggregate, which ratings are defined as follows:
1 -
Very Low Risk
2 -
Low Risk
3 -
Medium Risk
4 -
High Risk/Potential for Loss:
A loan that has a risk of realizing a principal loss.
5 -
Impaired/Loss Likely:
A loan that has a very high risk of realizing a principal loss or has otherwise incurred a principal loss.
Estimation of Economic Conditions
Derivative Financial Instruments
We classify all derivative financial instruments as either other assets or other liabilities on our consolidated balance sheets at fair value.
On the date we enter into a derivative contract, we designate each contract as (i) a hedge of a net investment in a foreign operation, or net investment hedge, (ii) a hedge of a forecasted transaction or of the variability of cash flows to be received or paid related to a recognized asset or liability, or cash flow hedge, (iii) a hedge of a recognized asset or liability, or fair value hedge, or (iv) a derivative instrument not to be designated as a hedging derivative, or non-designated hedge. For all derivatives other than those designated as non-designated hedges, we formally document our hedge relationships and designation at the contract’s inception. This documentation includes the identification of the hedging instruments and the hedged items, its risk management objectives, strategy for undertaking the hedge transaction and our evaluation of the effectiveness of its hedged transaction.
On a quarterly basis, we also formally assess whether the derivative we designated in each hedging relationship is expected to be, and has been, highly effective in offsetting changes in the value or cash flows of the hedged items. If it is determined that a derivative is not highly effective at hedging the designated exposure, hedge accounting is discontinued and the changes in fair value of the instrument are included in net income prospectively. Our net investment hedges are assessed using a method based on changes in spot exchange rates. Gains and losses, representing hedge components excluded from the assessment of effectiveness, are recognized in interest income on our consolidated statements of operations over the contractual term of our net investment hedges on a systematic and rational basis, as documented at hedge inception in accordance with our accounting policy election. All other changes in the fair value of our derivative instruments that qualify as hedges are reported as a component of accumulated other comprehensive income (loss) on our consolidated financial statements. Deferred gains and losses are reclassified out of accumulated other comprehensive income (loss) and into net income in the same period or periods during which the hedged transaction affects earnings, and are presented in the
13
Blackstone Mortgage Trust, Inc.
Notes to Consolidated Financial Statements (continued) (Unaudited)
Secured Debt and Asset-Specific Debt
We record investments financed with secured debt or asset-specific debt as separate assets and the related borrowings under any secured debt or asset-specific debt are recorded as separate liabilities on our consolidated balance sheets. Interest income earned on the investments and interest expense incurred on the secured debt or asset-specific debt are reported separately on our consolidated statements of operations.
Term Loans
We record our term loans as liabilities on our consolidated balance sheets. Where applicable, any issue discount or transaction expenses are deferred and amortized through the maturity date of the term loans as additional non-cash interest expense.
Senior Secured Notes
We record our senior secured notes as liabilities on our consolidated balance sheets. Where applicable, any issue discount or transaction expenses are deferred and amortized through the maturity date of the senior secured notes as additional non-cash interest expense.
Convertible Notes
Convertible note proceeds, unless issued with a substantial premium or an embedded conversion feature, are classified as debt. Additionally, shares issuable under our convertible notes are included in diluted earnings per share in our consolidated financial statements, if the effect is dilutive, using the if-converted method, regardless of settlement intent. Where applicable, any issue discount or transaction expenses are deferred and amortized through the maturity date of the convertible notes as additional non-cash interest expense.
14
Blackstone Mortgage Trust, Inc.
Notes to Consolidated Financial Statements (continued) (Unaudited)
Fair Value of Financial Instruments
The “Fair Value Measurements and Disclosures” Topic o
f the FASB, or ASC 820, defines fair value, establishes a framework for measuring fair value, and requires certain disclosures about fair value measurements under GAAP. Specifically, this guidance defines fair value based on exit price, or the price that would be received upon the sale of an asset or the transfer of a liability in an orderly transaction between market participants at the measurement date.
ASC 820 also establishes a fair value hierarchy that prioritizes and ranks the level of market price observability used in measuring financial instruments. Market price observability is affected by a number of factors, including the type of financial instrument, the characteristics specific to the financial instrument, and the state of the marketplace, including the existence and transparency of transactions between market participants. Financial instruments with readily available quoted prices in active markets generally will have a higher degree of market price observability and a lesser degree of judgment used in measuring fair value.
Financial instruments measured and reported at fair value are classified and disclosed based on the observability of inputs used in the determination, as follows:
•
Level 1: Generally includes only unadjusted quoted prices that are available in active markets for identical financial instruments as of the reporting date.
•
Level 2: Pricing inputs include quoted prices in active markets for similar instruments, quoted prices in less active or inactive markets for identical or similar instruments where multiple price quotes can be obtained, and other observable inputs, such as interest rates, yield curves, credit risks, and default rates.
•
Level 3: Pricing inputs are unobservable for the financial instruments and include situations where there is little, if any, market activity for the financial instrument. These inputs require significant judgment or estimation by management of third-parties when determining fair value and generally represent anything that does not meet the criteria of Levels 1 and 2.
Certain of our other assets are reported at fair value, as of quarter-end, either (i) on a recurring basis or (ii) on a nonrecurring basis, as a result of impairment or other events. Our assets that are recorded at fair value are discussed further in Note 17. We generally value our assets recorded at fair value by either (i) discounting expected cash flows based on assumptions regarding the collection of principal and interest and estimated market rates, or (ii) obtaining assessments from third-parties. For collateral-dependent loans that are identified as impaired, we measure impairment by comparing our estimation of the fair value of the underlying collateral, less costs to sell, to the book value of the respective loan. These valuations require significant judgments, which include assumptions regarding capitalization rates, discount rates, leasing, creditworthiness of major tenants, occupancy rates, availability and cost of financing, exit plan, loan sponsorship, actions of other lenders, and other factors.
As of September 30, 2023, we had an aggregate $
322.6
million asset-specific CECL reserve related to
ten
of our loans receivable with an aggregate amortized cost basis of $
1.4
billion, net of cost-recovery proceeds. The CECL reserve was recorded based on our estimation of the fair value of the loans' aggregate underlying collateral as of September 30, 2023. These loans receivable are therefore measured at fair value on a nonrecurring basis using significant unobservable inputs, and are classified as Level 3 assets in the fair value hierarchy. We estimated the fair value of these loans receivable by considering a variety of inputs including property performance, market data, and comparable sales, as applicable. The significant unobservable inputs used include the exit capitalization rate assumption used to forecast the future sale price of the underlying real estate collateral, which ranged from
5.25
% to
7.80
%, and the unlevered discount rate, which ranged from
7.28
% to
10.00
%.
We are also required by GAAP to disclose fair value information about financial instruments, which are not otherwise reported at fair value in our consolidated balance sheet, to the extent it is practicable to estimate a fair value for those instruments. These disclosure requirements exclude certain financial instruments and all non-financial instruments.
The following methods and assumptions are used to estimate the fair value of each class of financial instruments, for which it is practicable to estimate that value:
•
Cash and cash equivalents: The carrying amount of cash and cash equivalents approximates fair value.
•
Loans receivable, net: The fair values of these loans were estimated using a discounted cash flow methodology, taking into consideration various factors including capitalization rates, discount rates, leasing, credit worthiness of
15
Blackstone Mortgage Trust, Inc.
Notes to Consolidated Financial Statements (continued) (Unaudited)
major tenants, occupancy rates, availability and cost of financing, exit plan, loan sponsorship, actions of other lenders, and other factors.
•
Derivative financial instruments: The fair value of our foreign currency and interest rate contracts was estimated using advice from a third-party derivative specialist, based on contractual cash flows and observable inputs comprising foreign currency rates and credit spreads.
•
Secured debt, net: The fair value of these instruments was estimated based on the rate at which a similar credit facility would currently be priced.
•
Securitized debt obligations, net: The fair value of these instruments was estimated by utilizing third-party pricing service providers. In determining the value of a particular investment, pricing service providers may use broker-dealer quotations, reported trades, or valuation estimates from their internal pricing models to determine the reported price.
•
Asset-specific debt, net: The fair value of these instruments was estimated based on the rate at which a similar agreement would currently be priced.
•
Loan participations sold, net: The fair value of these instruments was estimated based on the value of the related loan receivable asset.
•
Term loans, net: The fair value of these instruments was estimated by utilizing third-party pricing service providers. In determining the value of a particular investment, pricing service providers may use broker-dealer quotations, reported trades, or valuation estimates from their internal pricing models to determine the reported price.
•
Senior secured notes, net: The fair value of these instruments was estimated by utilizing third-party pricing service providers. In determining the value of a particular investment, pricing service providers may use broker-dealer quotations, reported trades, or valuation estimates from their internal pricing models to determine the reported price.
Income Taxes
Our financial results generally do not reflect provisions for current or deferred income taxes on our REIT taxable income. We believe that we operate in a manner that will continue to allow us to be taxed as a REIT and, as a result, we generally do not expect to pay substantial corporate level taxes other than those payable by our taxable REIT subsidiaries. If we were to fail to meet these requirements, we may be subject to federal, state, and local income tax on current and past income, and penalties. Refer to Note 15 for additional information.
Stock-Based Compensation
Our stock-based compensation consists of awards issued to our Manager, certain individuals employed by an affiliate of our Manager, and certain members of our board of directors that vest over the life of the awards, as well as deferred stock units issued to certain members of our board of directors. Stock-based compensation expense is recognized for these awards in net income on a variable basis over the applicable vesting period of the awards, based on the value of our class A common stock. Refer to Note 16 for additional information.
Earnings per Share
Basic earnings per share, or Basic EPS, is computed in accordance with the two-class method and is based on (i) the net earnings allocable to our class A common stock, including restricted class A common stock and deferred stock units, divided by (ii) the weighted-average number of shares of our class A common stock, including restricted class A common stock and deferred stock units outstanding during the period. Our restricted class A common stock is considered a participating security, as defined by GAAP, and has been included in our Basic EPS under the two-class method as these restricted shares have the same rights as our other shares of class A common stock, including participating in any gains or losses.
16
Blackstone Mortgage Trust, Inc.
Notes to Consolidated Financial Statements (continued) (Unaudited)
Recent Accounting Pronouncements
In March 2022, the FASB issued Accounting Standards Update, or ASU, 2022-02 “Financial Instruments-Credit Losses (Topic 326): Troubled Debt Restructurings and Vintage Disclosures,” or ASU 2022-02. ASU 2022-02 eliminates the accounting guidance for troubled debt restructurings and requires disclosure of current-period gross write-offs by year of loan origination. Additionally, ASU 2022-02 updates the accounting for credit losses under ASC 326 and adds enhanced disclosures with respect to loan refinancings and restructurings in the form of principal forgiveness, interest rate concessions, other-than-insignificant payment delays, or term extensions when the borrower is experiencing financial difficulties. ASU 2022-02 is effective for fiscal years beginning after December 15, 2022 and early adoption is permitted. The amendments should be applied prospectively, however for the recognition and measurement of troubled debt restructurings, the entity has the option to apply a modified retrospective transition method, resulting in a cumulative-effect adjustment to retained earnings in the period of adoption. The adoption of ASU 2022-02 on January 1, 2023 did not have a material impact on our consolidated financial statements.
Reference Rate Reform
LIBOR and certain other floating rate benchmark indices have been the subject of national, international and regulatory guidance and proposals for reform or replacement. The Federal Reserve, in conjunction with the Alternative Reference Rates Committee, a steering committee composed of large U.S. financial institutions, identified SOFR, an index calculated using short-term repurchase agreements backed by U.S. Treasury securities, as its preferred alternative rate for USD LIBOR. As of September 30, 2023, one-month term SOFR is utilized as the floating benchmark rate on all of our floating rate U.S. dollar loans and related financings. Additionally, market participants have continued to transition from GBP LIBOR to the Sterling Overnight Index Average, or SONIA, in line with guidance from the U.K. regulators. As of September 30, 2023, daily compounded SONIA is utilized as the floating benchmark rate for all of our floating rate British Pound Sterling loans and related financings. As of September 30, 2023, all of our floating rate loans and related financings have transitioned to the applicable replacement benchmark rate, or reference a benchmark rate that is not expected to be replaced.
17
Blackstone Mortgage Trust, Inc.
Notes to Consolidated Financial Statements (continued) (Unaudited)
3.
LOANS RECEIVABLE, NET
The following table details overall statistics for our loans receivable portfolio ($ in thousands):
| September 30, 2023 | December 31, 2022 | ||||||||||
| Number of loans |
|
|
|||||||||
| Principal balance | $ |
|
$ |
|
|||||||
| Net book value | $ |
|
$ |
|
|||||||
|
Unfunded loan commitments
(1)
|
$ |
|
$ |
|
|||||||
|
Weighted-average cash coupon
(2)
|
+
|
% |
+
|
% | |||||||
|
Weighted-average all-in yield
(2)
|
+
|
% |
+
|
% | |||||||
|
Weighted-average maximum maturity (years)
(3)
|
|
|
|||||||||
(1)
Unfunded commitments will primarily be funded to finance our borrowers’ construction or development of real estate-related assets, capital improvements of existing assets, or lease-related expenditures. These commitments will generally be funded over the term of each loan, subject in certain cases to an expiration date.
(2)
The weighted-average cash coupon and all-in yield are expressed as a spread over the relevant floating benchmark rates, which include SOFR, USD LIBOR, SONIA, EURIBOR, and other indices, as applicable to each loan. As of September 30, 2023
99
% of our loans by principal balance earned a floating rate of interest, primarily indexed to SOFR, and the remaining
1
% of our loans earned a fixed rate of interest. As of December 31, 2022, substantially all of our loans by principal balance earned a floating rate of interest, primarily indexed to SOFR and USD LIBOR. Floating rate exposure includes an interest rate swap with a notional amount of $
229.9
million that effectively converts our fixed rate loan exposure to floating rate exposure. In addition to cash coupon, all-in yield includes the amortization of deferred origination and extension fees, loan origination costs, and purchase discounts, as well as the accrual of exit fees. Excludes loans accounted for under the cost-recovery method.
18
Blackstone Mortgage Trust, Inc.
Notes to Consolidated Financial Statements (continued) (Unaudited)
The following table details the index rate floors for our loans receivable portfolio as of September 30, 2023 ($ in thousands):
| Loans Receivable Principal Balance | ||||||||||||||||||||
| Index Rate Floors | USD |
Non-USD
(1)
|
Total | |||||||||||||||||
| Fixed Rate | $ |
|
$ |
|
$ |
|
||||||||||||||
|
0.00% or no floor
(2)
|
|
|
|
|||||||||||||||||
| 0.01% to 1.00% floor |
|
|
|
|||||||||||||||||
| 1.01% to 1.50% floor |
|
|
|
|||||||||||||||||
| 1.51% to 2.00% floor |
|
|
|
|||||||||||||||||
| 2.01% or more floor |
|
|
|
|||||||||||||||||
|
Total
(3)
|
$ |
|
$ |
|
$ |
|
||||||||||||||
(1)
Includes Euro, British Pound Sterling, Swedish Krona, Australian Dollar, Swiss Franc, and Danish Krone currencies.
(2)
Includes an interest rate swap with a notional amount of $
229.9
million that effectively converts our fixed rate loan exposure to floating rate exposure.
(3)
As of September 30, 2023, the weighted-average index rate floor of our loans receivable principal balance was
0.42
%. Excluding 0.0% index rate floors and loans with no floor, the weighted-average index rate floor was
0.78
%.
Activity relating to our loans receivable portfolio was as follows ($ in thousands):
|
Principal
Balance
|
Deferred Fees /
Other Items
(1)
|
Net Book
Value
|
|||||||||||||||
|
Loans Receivable, as of December 31, 2022
|
$ |
|
$ |
(
|
$ |
|
|||||||||||
| Loan fundings |
|
— |
|
||||||||||||||
| Loan repayments, sales, and cost-recovery proceeds |
(
|
(
|
(
|
||||||||||||||
|
Unrealized (loss) gain on foreign currency translation
|
(
|
|
(
|
||||||||||||||
| Deferred fees and other items | — |
(
|
(
|
||||||||||||||
| Amortization of fees and other items | — |
|
|
||||||||||||||
|
Loans Receivable, as of September 30, 2023
|
$ |
|
$ |
(
|
$ |
|
|||||||||||
| CECL reserve |
(
|
||||||||||||||||
|
Loans Receivable, net, as of September 30, 2023
|
$ |
|
|||||||||||||||
(1)
Other items primarily consist of purchase and sale discounts or premiums, exit fees, deferred origination expenses, and cost-recovery proceeds.
19
Blackstone Mortgage Trust, Inc.
Notes to Consolidated Financial Statements (continued) (Unaudited)
The tables below detail the property type and geographic distribution of the properties securing the loans in our portfolio ($ in thousands):
| September 30, 2023 | ||||||||||||||||||||||||||||||||
| Property Type |
Number of
Loans
|
Net
Book Value
|
Total Loan
Exposure
(1)
|
Net Loan
Exposure
(2)
|
Net Loan Exposure Percentage of
Portfolio |
|||||||||||||||||||||||||||
| Office |
|
$ |
|
$ |
|
$ |
|
|
||||||||||||||||||||||||
| Multifamily |
|
|
|
|
|
|||||||||||||||||||||||||||
| Hospitality |
|
|
|
|
|
|||||||||||||||||||||||||||
| Industrial |
|
|
|
|
|
|||||||||||||||||||||||||||
| Retail |
|
|
|
|
|
|||||||||||||||||||||||||||
| Life Sciences / Studio |
|
|
|
|
|
|||||||||||||||||||||||||||
| Other |
|
|
|
|
|
|||||||||||||||||||||||||||
| Total loans receivable |
|
$ |
|
$ |
|
$ |
|
|
||||||||||||||||||||||||
| CECL reserve |
(
|
|||||||||||||||||||||||||||||||
| Loans receivable, net | $ |
|
||||||||||||||||||||||||||||||
| Geographic Location |
Number of
Loans
|
Net
Book Value
|
Total Loan
Exposure
(1)
|
Net Loan
Exposure
(2)
|
Net Loan Exposure Percentage of
Portfolio |
|||||||||||||||||||||||||||
| United States | ||||||||||||||||||||||||||||||||
| Sunbelt |
|
$ |
|
$ |
|
$ |
|
|
||||||||||||||||||||||||
| Northeast |
|
|
|
|
|
|||||||||||||||||||||||||||
| West |
|
|
|
|
|
|||||||||||||||||||||||||||
| Midwest |
|
|
|
|
|
|||||||||||||||||||||||||||
| Northwest |
|
|
|
|
|
|||||||||||||||||||||||||||
| Subtotal |
|
|
|
|
|
|||||||||||||||||||||||||||
| International | ||||||||||||||||||||||||||||||||
| United Kingdom |
|
|
|
|
|
|||||||||||||||||||||||||||
| Australia |
|
|
|
|
|
|||||||||||||||||||||||||||
| Ireland |
|
|
|
|
|
|||||||||||||||||||||||||||
| Spain |
|
|
|
|
|
|||||||||||||||||||||||||||
| Sweden |
|
|
|
|
|
|||||||||||||||||||||||||||
| Other Europe |
|
|
|
|
|
|||||||||||||||||||||||||||
| Subtotal |
|
|
|
|
|
|||||||||||||||||||||||||||
| Total loans receivable |
|
$ |
|
$ |
|
$ |
|
|
||||||||||||||||||||||||
| CECL reserve |
(
|
|||||||||||||||||||||||||||||||
| Loans receivable, net | $ |
|
||||||||||||||||||||||||||||||
(1)
Total loan exposure reflects our aggregate exposure to each loan investment. As of September 30, 2023, total loan exposure, includes (i) loans with an outstanding principal balance of $
23.8
billion that are included in our consolidated financial statements, (ii) $
1.1
billion of non-consolidated senior interests in loans we have sold, which are not included in our consolidated financial statements, and excludes (iii) $
48.8
million of junior loan interests that we have sold, but that remain included in our consolidated financial statements. See Note 2 for further discussion of loan participations sold.
(2)
Net loan exposure reflects the amount of each loan that is subject to risk of credit loss to us as of September 30, 2023, which is our total loan exposure net of (i) $
1.1
billion of non-consolidated senior interests, (ii) $
935.4
million of asset-specific debt, (iii) $
226.9
million of senior loan participations sold, (iv) $
40.7
million of cost-recovery proceeds, and (v) our total loans receivable CECL reserve of $
463.4
million. Our non-consolidated senior interests, asset-specific debt, and loan participations sold are structurally non-recourse and term-matched to the corresponding collateral loans.
20
Blackstone Mortgage Trust, Inc.
Notes to Consolidated Financial Statements (continued) (Unaudited)
| December 31, 2022 | ||||||||||||||||||||||||||||||||
| Property Type |
Number of
Loans
|
Net
Book Value
|
Total Loan
Exposure
(1)
|
Net Loan
Exposure
(2)
|
Net Loan Exposure Percentage of
Portfolio |
|||||||||||||||||||||||||||
| Office |
|
$ |
|
$ |
|
$ |
|
|
||||||||||||||||||||||||
| Multifamily |
|
|
|
|
|
|||||||||||||||||||||||||||
| Hospitality |
|
|
|
|
|
|||||||||||||||||||||||||||
| Industrial |
|
|
|
|
|
|||||||||||||||||||||||||||
| Retail |
|
|
|
|
|
|||||||||||||||||||||||||||
| Life Sciences/Studio |
|
|
|
|
|
|||||||||||||||||||||||||||
| Other |
|
|
|
|
|
|||||||||||||||||||||||||||
| Total loans receivable |
|
$ |
|
$ |
|
$ |
|
|
||||||||||||||||||||||||
| CECL reserve |
(
|
|||||||||||||||||||||||||||||||
| Loans receivable, net | $ |
|
||||||||||||||||||||||||||||||
| Geographic Location |
Number of
Loans
|
Net
Book Value
|
Total Loan
Exposure
(1)
|
Net Loan
Exposure
(2)
|
Net Loan Exposure Percentage of
Portfolio |
|||||||||||||||||||||||||||
| United States | ||||||||||||||||||||||||||||||||
| Sunbelt |
|
$ |
|
$ |
|
$ |
|
|
||||||||||||||||||||||||
| Northeast |
|
|
|
|
|
|||||||||||||||||||||||||||
| West |
|
|
|
|
|
|||||||||||||||||||||||||||
| Midwest |
|
|
|
|
|
|||||||||||||||||||||||||||
| Northwest |
|
|
|
|
|
|||||||||||||||||||||||||||
| Subtotal |
|
|
|
|
|
|||||||||||||||||||||||||||
| International | ||||||||||||||||||||||||||||||||
| United Kingdom |
|
|
|
|
|
|||||||||||||||||||||||||||
| Australia |
|
|
|
|
|
|||||||||||||||||||||||||||
| Spain |
|
|
|
|
|
|||||||||||||||||||||||||||
| Ireland |
|
|
|
|
|
|||||||||||||||||||||||||||
| Sweden |
|
|
|
|
|
|||||||||||||||||||||||||||
| Canada |
|
|
|
|
|
|||||||||||||||||||||||||||
| Other Europe |
|
|
|
|
|
|||||||||||||||||||||||||||
| Subtotal |
|
|
|
|
|
|||||||||||||||||||||||||||
| Total loans receivable |
|
$ |
|
$ |
|
$ |
|
|
||||||||||||||||||||||||
| CECL reserve |
(
|
|||||||||||||||||||||||||||||||
| Loans receivable, net | $ |
|
||||||||||||||||||||||||||||||
(1)
Total loan exposure reflects our aggregate exposure to each loan investment. As of December 31, 2022, total loan exposure, includes (i) loans with an outstanding principal balance of $
25.2
billion that are included in our consolidated financial statements and (ii) $
1.6
billion of non-consolidated senior interests in loans we have sold, which are not included in our consolidated financial statements. See Note 2 for further discussion of loan participations sold.
(2)
Net loan exposure reflects the amount of each loan that is subject to risk of credit loss to us as of December 31, 2022, which is our total loan exposure net of (i) $
1.6
billion of non-consolidated senior interests, (ii) $
950.3
million of asset-specific debt, (iii) $
224.7
million of senior loan participations sold, and (iv) our total loans receivable CECL reserve of $
326.1
million. Our non-consolidated senior interests, asset-specific debt, and loan participations sold are structurally non-recourse and term-matched to the corresponding collateral loans.
21
Blackstone Mortgage Trust, Inc.
Notes to Consolidated Financial Statements (continued) (Unaudited)
Loan Risk Ratings
As further described in Note 2, we evaluate our loan portfolio on a quarterly basis. In conjunction with our quarterly loan portfolio review, we assess the risk factors of each loan, and assign a risk rating based on several factors. Factors considered in the assessment include, but are not limited to, risk of loss, origination LTV, debt yield, collateral performance, structure, exit plan, and sponsorship. Loans are rated “1” (less risk) through “5” (greater risk), which ratings are defined in Note 2.
The following table allocates the net book value, total loan exposure, and net loan exposure balances based on our internal risk ratings ($ in thousands):
| September 30, 2023 | ||||||||||||||||||||||||||
|
Risk
Rating
|
Number
of Loans
|
Net
Book Value
|
Total Loan
Exposure
(1)
|
Net Loan
Exposure
(2)
|
||||||||||||||||||||||
| 1 |
|
$ |
|
$ |
|
$ |
|
|||||||||||||||||||
| 2 |
|
|
|
|
||||||||||||||||||||||
| 3 |
|
|
|
|
||||||||||||||||||||||
| 4 |
|
|
|
|
||||||||||||||||||||||
| 5 |
|
|
|
|
||||||||||||||||||||||
| Total loans receivable |
|
$ |
|
$ |
|
$ |
|
|||||||||||||||||||
| CECL reserve |
(
|
|||||||||||||||||||||||||
| Loans receivable, net | $ |
|
||||||||||||||||||||||||
| December 31, 2022 | ||||||||||||||||||||||||||
|
Risk
Rating
|
Number
of Loans
|
Net
Book Value
|
Total Loan
Exposure
(1)
|
Net Loan
Exposure
(2)
|
||||||||||||||||||||||
| 1 |
|
$ |
|
$ |
|
$ |
|
|||||||||||||||||||
| 2 |
|
|
|
|
||||||||||||||||||||||
| 3 |
|
|
|
|
||||||||||||||||||||||
| 4 |
|
|
|
|
||||||||||||||||||||||
| 5 |
|
|
|
|
||||||||||||||||||||||
| Total loans receivable |
|
$ |
|
$ |
|
$ |
|
|||||||||||||||||||
| CECL reserve |
(
|
|||||||||||||||||||||||||
| Loans receivable, net | $ |
|
||||||||||||||||||||||||
(1)
Total loan exposure reflects our aggregate exposure to each loan investment. As of September 30, 2023, total loan exposure, includes (i) loans with an outstanding principal balance of $
23.8
billion that are included in our consolidated financial statements, (ii) $
1.1
billion of non-consolidated senior interests in loans we have sold, which are not included in our consolidated financial statements, and excludes (iii) $
48.8
million of junior loan interests that we have sold, but that remain included in our consolidated financial statements. See Note 2 for further discussion of loan participations sold. As of December 31, 2022, total loan exposure, includes (i) loans with an outstanding principal balance of $
25.2
billion that are included in our consolidated financial statements and (ii) $
1.6
billion of non-consolidated senior interests in loans we have sold, which are not included in our consolidated financial statements. See Note 2 for further discussion of loan participations sold.
(2)
Net loan exposure reflects the amount of each loan that is subject to risk of credit loss to us as of September 30, 2023, which is our total loan exposure net of (i) $
1.1
billion of non-consolidated senior interests, (ii) $
935.4
million of asset-specific debt, (iii) $
226.9
million of senior loan participations sold, (iv) $
40.7
million of cost-recovery proceeds, and (v) our total loans receivable CECL reserve of $
463.4
million. Our net loan exposure as of December 31, 2022 is our total loan exposure net of (i) $
1.6
billion of non-consolidated senior interests, (ii) $
950.3
million of asset-specific debt, (iii) $
224.7
million of senior loan participations sold, and (iv) our total loans receivable CECL reserve of $
326.1
million. Our non-consolidated senior interests, asset-specific debt, and loan participations sold are structurally non-recourse and term-matched to the corresponding collateral loans.
Our loan portfolio had a weighted-average risk rating of
2.9
as of both September 30, 2023 and December 31, 2022.
22
Blackstone Mortgage Trust, Inc.
Notes to Consolidated Financial Statements (continued) (Unaudited)
Current Expected Credit Loss Reserve
The CECL reserve required under GAAP reflects our current estimate of potential credit losses related to the loans included in our consolidated balance sheets. Refer to Note 2 for further discussion of our CECL reserve.
The following table presents the activity in our loans receivable CECL reserve by investment pool for the three and nine months ended September 30, 2023 and 2022 ($ in thousands):
|
U.S. Loans
(1)
|
Non-U.S.
Loans
|
Unique
Loans
|
Impaired
Loans
|
Total | |||||||||||||||||||||||||
| Loans Receivable, Net | |||||||||||||||||||||||||||||
|
CECL reserve as of December 31, 2022
|
$ |
|
$ |
|
$ |
|
$ |
|
$ |
|
|||||||||||||||||||
| Increase (decrease) in CECL reserve |
|
(
|
|
|
|
||||||||||||||||||||||||
|
CECL reserve as of March 31, 2023
|
$ |
|
$ |
|
$ |
|
$ |
|
$ |
|
|||||||||||||||||||
| Increase (decrease) in CECL reserve |
|
|
(
|
|
|
||||||||||||||||||||||||
|
CECL reserve as of June 30, 2023
|
$ |
|
$ |
|
$ |
|
$ |
|
$ |
|
|||||||||||||||||||
| (Decrease) increase in CECL reserve |
(
|
(
|
(
|
|
|
||||||||||||||||||||||||
|
CECL reserve as of September 30, 2023
|
$ |
|
$ |
|
$ |
|
$ |
|
$ |
|
|||||||||||||||||||
|
CECL reserve as of December 31, 2021
|
$ |
|
$ |
|
$ |
|
$ |
|
$ |
|
|||||||||||||||||||
| Decrease in CECL reserve |
(
|
(
|
(
|
|
(
|
||||||||||||||||||||||||
|
CECL reserve as of March 31, 2022
|
$ |
|
$ |
|
$ |
|
$ |
|
$ |
|
|||||||||||||||||||
| Increase in CECL reserve |
|
|
|
|
|
||||||||||||||||||||||||
|
CECL reserve as of June 30, 2022
|
$ |
|
$ |
|
$ |
|
$ |
|
$ |
|
|||||||||||||||||||
|
Increase in CECL reserve
|
|
|
|
|
|
||||||||||||||||||||||||
|
CECL reserve as of September 30, 2022
|
$ |
|
$ |
|
$ |
|
$ |
|
$ |
|
|||||||||||||||||||
(1) Includes Canadian loans, which have similar risk characteristics as U.S. loans.
During the three months ended September 30, 2023, we recorded an increase of $
99.5
million in the CECL reserve against our loans receivable portfolio, bringing our total loans receivable CECL reserve to $
463.4
million as of September 30, 2023. This CECL reserve reflects certain loans assessed for impairment in our portfolio, as well as macroeconomic conditions.
During the three months ended September 30, 2023, we recorded an aggregate net increase of $
108.2
million in the asset-specific CECL reserve related to our impaired loans. The increase was primarily driven by
three
additional loans that were impaired during the three months ended September 30, 2023. As of September 30, 2023, the income accrual was suspended on these loans as recovery of income and principal was doubtful. During the three months ended September 30, 2023, we recorded $
7.2
million of interest income on these
three
loans.
As of September 30, 2023, we had an aggregate $
322.6
million asset-specific CECL reserve related to
ten
of our loans receivable, with an aggregate amortized cost basis of $
1.4
billion, net of cost-recovery proceeds. This CECL reserve was recorded based on our estimation of the fair value of each of the loan's underlying collateral as of September 30, 2023.
No
income was recorded on our impaired loans subsequent to determining that they were impaired. As of September 30, 2023, all such borrowers were compliant with the contractual terms of each respective loan, including any required payment of interest. During the three months ended September 30, 2023, we received an aggregate $
10.2
million of cash proceeds from such loans that were applied as a reduction to the amortized cost basis of each respective loan. Refer to Note 2 for further discussion of our revenue recognition and CECL reserve policies.
23
Blackstone Mortgage Trust, Inc.
Notes to Consolidated Financial Statements (continued) (Unaudited)
Our primary credit quality indicator is our risk ratings, which are further discussed above. The following tables present the net book value of our loan portfolio as of September 30, 2023 and December 31, 2022, respectively, by year of origination, investment pool, and risk rating ($ in thousands):
|
Net Book Value of Loans Receivable by Year of Origination
(1)
|
|||||||||||||||||||||||||||||||||||||||||||||||
| As of September 30, 2023 | |||||||||||||||||||||||||||||||||||||||||||||||
|
Risk Rating
|
2023 | 2022 | 2021 | 2020 | 2019 | Prior | Total | ||||||||||||||||||||||||||||||||||||||||
| U.S. loans | |||||||||||||||||||||||||||||||||||||||||||||||
| 1 | $ |
|
$ |
|
$ |
|
$ |
|
$ |
|
$ |
|
$ |
|
|||||||||||||||||||||||||||||||||
| 2 |
|
|
|
|
|
|
|
||||||||||||||||||||||||||||||||||||||||
| 3 |
|
|
|
|
|
|
|
||||||||||||||||||||||||||||||||||||||||
| 4 |
|
|
|
|
|
|
|
||||||||||||||||||||||||||||||||||||||||
| 5 |
|
|
|
|
|
|
|
||||||||||||||||||||||||||||||||||||||||
| Total U.S. loans | $ |
|
$ |
|
$ |
|
$ |
|
$ |
|
$ |
|
$ |
|
|||||||||||||||||||||||||||||||||
| Non-U.S. loans | |||||||||||||||||||||||||||||||||||||||||||||||
| 1 | $ |
|
$ |
|
$ |
|
$ |
|
$ |
|
$ |
|
$ |
|
|||||||||||||||||||||||||||||||||
| 2 |
|
|
|
|
|
|
|
||||||||||||||||||||||||||||||||||||||||
| 3 |
|
|
|
|
|
|
|
||||||||||||||||||||||||||||||||||||||||
| 4 |
|
|
|
|
|
|
|
||||||||||||||||||||||||||||||||||||||||
| 5 |
|
|
|
|
|
|
|
||||||||||||||||||||||||||||||||||||||||
| Total Non-U.S. loans | $ |
|
$ |
|
$ |
|
$ |
|
$ |
|
$ |
|
$ |
|
|||||||||||||||||||||||||||||||||
| Unique loans | |||||||||||||||||||||||||||||||||||||||||||||||
| 1 | $ |
|
$ |
|
$ |
|
$ |
|
$ |
|
$ |
|
$ |
|
|||||||||||||||||||||||||||||||||
| 2 |
|
|
|
|
|
|
|
||||||||||||||||||||||||||||||||||||||||
| 3 |
|
|
|
|
|
|
|
||||||||||||||||||||||||||||||||||||||||
| 4 |
|
|
|
|
|
|
|
||||||||||||||||||||||||||||||||||||||||
| 5 |
|
|
|
|
|
|
|
||||||||||||||||||||||||||||||||||||||||
| Total unique loans | $ |
|
$ |
|
$ |
|
$ |
|
$ |
|
$ |
|
$ |
|
|||||||||||||||||||||||||||||||||
| Impaired loans | |||||||||||||||||||||||||||||||||||||||||||||||
| 1 | $ |
|
$ |
|
$ |
|
$ |
|
$ |
|
$ |
|
$ |
|
|||||||||||||||||||||||||||||||||
| 2 |
|
|
|
|
|
|
|
||||||||||||||||||||||||||||||||||||||||
| 3 |
|
|
|
|
|
|
|
||||||||||||||||||||||||||||||||||||||||
| 4 |
|
|
|
|
|
|
|
||||||||||||||||||||||||||||||||||||||||
| 5 |
|
|
|
|
|
|
|
||||||||||||||||||||||||||||||||||||||||
| Total impaired loans | $ |
|
$ |
|
$ |
|
$ |
|
$ |
|
$ |
|
$ |
|
|||||||||||||||||||||||||||||||||
| Total loans receivable | |||||||||||||||||||||||||||||||||||||||||||||||
| 1 | $ |
|
$ |
|
$ |
|
$ |
|
$ |
|
$ |
|
$ |
|
|||||||||||||||||||||||||||||||||
| 2 |
|
|
|
|
|
|
|
||||||||||||||||||||||||||||||||||||||||
| 3 |
|
|
|
|
|
|
|
||||||||||||||||||||||||||||||||||||||||
| 4 |
|
|
|
|
|
|
|
||||||||||||||||||||||||||||||||||||||||
| 5 |
|
|
|
|
|
|
|
||||||||||||||||||||||||||||||||||||||||
| Total loans receivable | $ |
|
$ |
|
$ |
|
$ |
|
$ |
|
$ |
|
$ |
|
|||||||||||||||||||||||||||||||||
| CECL reserve |
(
|
||||||||||||||||||||||||||||||||||||||||||||||
| Loans receivable, net | $ |
|
|||||||||||||||||||||||||||||||||||||||||||||
(1)
Date loan was originated or acquired by us. Origination dates are subsequently updated to reflect material loan modifications.
24
Blackstone Mortgage Trust, Inc.
Notes to Consolidated Financial Statements (continued) (Unaudited)
|
Net Book Value of Loans Receivable by Year of Origination
(1)
|
|||||||||||||||||||||||||||||||||||||||||||||||
| As of December 31, 2022 | |||||||||||||||||||||||||||||||||||||||||||||||
|
Risk Rating
|
2022 | 2021 | 2020 | 2019 | 2018 | Prior | Total | ||||||||||||||||||||||||||||||||||||||||
|
U.S. loans
(2)
|
|||||||||||||||||||||||||||||||||||||||||||||||
| 1 | $ |
|
$ |
|
$ |
|
$ |
|
$ |
|
$ |
|
$ |
|
|||||||||||||||||||||||||||||||||
| 2 |
|
|
|
|
|
|
|
||||||||||||||||||||||||||||||||||||||||
| 3 |
|
|
|
|
|
|
|
||||||||||||||||||||||||||||||||||||||||
| 4 |
|
|
|
|
|
|
|
||||||||||||||||||||||||||||||||||||||||
| 5 |
|
|
|
|
|
|
|
||||||||||||||||||||||||||||||||||||||||
| Total U.S. loans | $ |
|
$ |
|
$ |
|
$ |
|
$ |
|
$ |
|
$ |
|
|||||||||||||||||||||||||||||||||
| Non-U.S. loans | |||||||||||||||||||||||||||||||||||||||||||||||
| 1 | $ |
|
$ |
|
$ |
|
$ |
|
$ |
|
$ |
|
$ |
|
|||||||||||||||||||||||||||||||||
| 2 |
|
|
|
|
|
|
|
||||||||||||||||||||||||||||||||||||||||
| 3 |
|
|
|
|
|
|
|
||||||||||||||||||||||||||||||||||||||||
| 4 |
|
|
|
|
|
|
|
||||||||||||||||||||||||||||||||||||||||
| 5 |
|
|
|
|
|
|
|
||||||||||||||||||||||||||||||||||||||||
| Total Non-U.S. loans | $ |
|
$ |
|
$ |
|
$ |
|
$ |
|
$ |
|
$ |
|
|||||||||||||||||||||||||||||||||
| Unique loans | |||||||||||||||||||||||||||||||||||||||||||||||
| 1 | $ |
|
$ |
|
$ |
|
$ |
|
$ |
|
$ |
|
$ |
|
|||||||||||||||||||||||||||||||||
| 2 |
|
|
|
|
|
|
|
||||||||||||||||||||||||||||||||||||||||
| 3 |
|
|
|
|
|
|
|
||||||||||||||||||||||||||||||||||||||||
| 4 |
|
|
|
|
|
|
|
||||||||||||||||||||||||||||||||||||||||
| 5 |
|
|
|
|
|
|
|
||||||||||||||||||||||||||||||||||||||||
| Total unique loans | $ |
|
$ |
|
$ |
|
$ |
|
$ |
|
$ |
|
$ |
|
|||||||||||||||||||||||||||||||||
| Impaired loans | |||||||||||||||||||||||||||||||||||||||||||||||
| 1 | $ |
|
$ |
|
$ |
|
$ |
|
$ |
|
$ |
|
$ |
|
|||||||||||||||||||||||||||||||||
| 2 |
|
|
|
|
|
|
|
||||||||||||||||||||||||||||||||||||||||
| 3 |
|
|
|
|
|
|
|
||||||||||||||||||||||||||||||||||||||||
| 4 |
|
|
|
|
|
|
|
||||||||||||||||||||||||||||||||||||||||
| 5 |
|
|
|
|
|
|
|
||||||||||||||||||||||||||||||||||||||||
| Total impaired loans | $ |
|
$ |
|
$ |
|
$ |
|
$ |
|
$ |
|
$ |
|
|||||||||||||||||||||||||||||||||
| Total loans receivable | |||||||||||||||||||||||||||||||||||||||||||||||
| 1 | $ |
|
$ |
|
$ |
|
$ |
|
$ |
|
$ |
|
$ |
|
|||||||||||||||||||||||||||||||||
| 2 |
|
|
|
|
|
|
|
||||||||||||||||||||||||||||||||||||||||
| 3 |
|
|
|
|
|
|
|
||||||||||||||||||||||||||||||||||||||||
| 4 |
|
|
|
|
|
|
|
||||||||||||||||||||||||||||||||||||||||
| 5 |
|
|
|
|
|
|
|
||||||||||||||||||||||||||||||||||||||||
| Total loans receivable | $ |
|
$ |
|
$ |
|
$ |
|
$ |
|
$ |
|
$ |
|
|||||||||||||||||||||||||||||||||
| CECL reserve |
(
|
||||||||||||||||||||||||||||||||||||||||||||||
| Loans receivable, net | $ |
|
|||||||||||||||||||||||||||||||||||||||||||||
(1)
Date loan was originated or acquired by us. Origination dates are subsequently updated to reflect material loan modifications.
(2)
Includes Canadian loans, which have similar risk characteristics as U.S. loans.
25
Blackstone Mortgage Trust, Inc.
Notes to Consolidated Financial Statements (continued) (Unaudited)
Loan Modifications Pursuant to ASC 326
During the nine months ended September 30, 2023, we entered into
four
loan modifications that require disclosure pursuant to ASC 326. All such loans were collateralized by office assets.
The other
two
loan modifications included a combination of changes to the contractual terms of the loans, including term extensions, other-than-insignificant payment delays, and/or interest rate reductions. The first loan modification included a term extension of
nineteen months
, a rate reduction of
2.74
% and conversion to fixed rate, with a portion of the interest paid in-kind. The borrower repaid $
4.9
million of the loan at the time of modification, with an additional $
2.5
million of repayment due during the initial maturity period. The second loan modification included a term extension of
4.5
years, a rate increase of
8.50
% with interest paid in-kind, a borrower contribution of $
2.0
million of additional reserves, and a $
50.0
million increase in our total loan commitment. As of September 30, 2023, the aggregate amortized cost basis of these loans was $
435.1
million, or
1.8
% of our aggregate loans receivable portfolio, with an aggregate $
40.0
million of unfunded commitments. The loans were performing pursuant to their contractual terms as of September 30, 2023. As of September 30, 2023, one of these loans had a risk rating of 4, and its modified terms were included in the determination of our general CECL reserve, and the other loan had a risk rating of 5 and has an asset-specific CECL reserve
.
Multifamily Joint Venture
4.
OTHER ASSETS AND LIABILITIES
Other Assets
The following table details the components of our other assets ($ in thousands):
| September 30, 2023 | December 31, 2022 | ||||||||||
| Accrued interest receivable | $ |
|
$ |
|
|||||||
| Derivative assets |
|
|
|||||||||
|
Loan portfolio payments held by servicer
(1)
|
|
|
|||||||||
| Accounts receivable and other assets |
|
|
|||||||||
| Prepaid expenses |
|
|
|||||||||
| Collateral deposited under derivative agreements |
|
|
|||||||||
| Total | $ |
|
$ |
|
|||||||
26
Blackstone Mortgage Trust, Inc.
Notes to Consolidated Financial Statements (continued) (Unaudited)
Other Liabilities
The following table details the components of our other liabilities ($ in thousands):
| September 30, 2023 | December 31, 2022 | ||||||||||
| Accrued dividends payable | $ |
|
$ |
|
|||||||
| Accrued interest payable |
|
|
|||||||||
|
Secured debt repayments pending servicer remittance
(1)
|
|
|
|||||||||
| Accrued management and incentive fees payable |
|
|
|||||||||
|
Current expected credit loss reserve for unfunded loan commitments
(2)
|
|
|
|||||||||
| Accounts payable and other liabilities |
|
|
|||||||||
| Derivative liabilities |
|
|
|||||||||
| Total | $ |
|
$ |
|
|||||||
(1)
Represents pending transfers from our third-party loan servicer that were remitted to our banking counterparties during the subsequent remittance cycle.
Current Expected Credit Loss Reserve for Unfunded Loan Commitments
As of September 30, 2023, we had unfunded commitments of $
2.7
billion related to
101
loans receivable. The expected credit losses over the contractual period of our loans is impacted by our obligation to extend further credit through our unfunded loan commitments. See Note 2 for further discussion of the CECL reserve related to our unfunded loan commitments, and Note 20 for further discussion of our unfunded loan commitments.
The following table presents the activity in the CECL reserve related to our unfunded loan commitments by investment pool for the three and nine months ended September 30, 2023 and 2022 ($ in thousands):
| U.S. Loans |
Non-U.S.
Loans
|
Unique
Loans
|
Impaired
Loans
|
Total | |||||||||||||||||||||||||
|
CECL reserve as of December 31, 2022
|
$ |
|
$ |
|
$ |
|
$ |
|
$ |
|
|||||||||||||||||||
| Decrease in CECL reserve |
(
|
(
|
|
|
(
|
||||||||||||||||||||||||
|
CECL reserve as of March 31, 2023
|
$ |
|
$ |
|
$ |
|
$ |
|
$ |
|
|||||||||||||||||||
| (Decrease) increase in CECL reserve |
(
|
|
|
|
|
||||||||||||||||||||||||
|
CECL reserve as of June 30, 2023
|
$ |
|
$ |
|
$ |
|
$ |
|
$ |
|
|||||||||||||||||||
| Decrease in CECL reserve |
(
|
(
|
|
|
(
|
||||||||||||||||||||||||
|
CECL reserve as of September 30, 2023
|
$ |
|
$ |
|
$ |
|
$ |
|
$ |
|
|||||||||||||||||||
|
CECL reserve as of December 31, 2021
|
$ |
|
$ |
|
$ |
|
$ |
|
$ |
|
|||||||||||||||||||
| Increase (decrease) in CECL reserve |
|
(
|
|
|
(
|
||||||||||||||||||||||||
|
CECL reserve as of March 31, 2022
|
$ |
|
$ |
|
$ |
|
$ |
|
$ |
|
|||||||||||||||||||
| Increase in CECL reserve |
|
|
|
|
|
||||||||||||||||||||||||
|
CECL reserve as of June 30, 2022
|
$ |
|
$ |
|
$ |
|
$ |
|
$ |
|
|||||||||||||||||||
| Increase in CECL reserve |
|
|
|
|
|
||||||||||||||||||||||||
|
CECL reserve as of September 30, 2022
|
$ |
|
$ |
|
$ |
|
$ |
|
$ |
|
|||||||||||||||||||
27
Blackstone Mortgage Trust, Inc.
Notes to Consolidated Financial Statements (continued) (Unaudited)
5.
SECURED DEBT, NET
Our secured debt includes our secured credit facilities and our acquisition facility. During the nine months ended September 30, 2023, we obtained approval for $
73.9
million of new borrowings against
$
92.4
million of collateral assets.
The following table details our secured debt ($ in thousands):
|
Secured Debt
Borrowings Outstanding
|
|||||||||||
| September 30, 2023 | December 31, 2022 | ||||||||||
| Secured credit facilities | $ |
|
$ |
|
|||||||
| Acquisition facility |
|
|
|||||||||
| Total secured debt | $ |
|
$ |
|
|||||||
|
Deferred financing costs
(1)
|
(
|
(
|
|||||||||
| Net book value of secured debt | $ |
|
$ |
|
|||||||
Secured Credit Facilities
Our secured credit facilities are bilateral agreements we use to finance diversified pools of senior loan collateral with sufficient flexibility to accommodate our investment and asset management strategy. The facilities are uniformly structured to provide currency, index, and term-matched financing without capital markets based mark-to-market provisions. Our credit facilities are diversified across
15
counterparties, primarily consisting of top global financial institutions to minimize our counterparty risk exposure.
The following table details our secured credit facilities by spread over the applicable base rates as of September 30, 2023 ($ in thousands):
| September 30, 2023 | ||||||||||||||||||||||||||||||||||||||||||||||||||||||||
| Recourse Limitation | ||||||||||||||||||||||||||||||||||||||||||||||||||||||||
| Currency |
Lenders
(1)
|
Borrowings |
Wtd. Avg. Maturity
(2)
|
Loan Count |
Collateral
(3)
|
Wtd. Avg.
Maturity
(4)
|
Wtd. Avg. | Range | ||||||||||||||||||||||||||||||||||||||||||||||||
| USD |
|
$ |
|
May 2026 |
|
$ |
|
May 2026 |
|
|
||||||||||||||||||||||||||||||||||||||||||||||
| GBP |
|
|
June 2026 |
|
|
July 2026 |
|
|
||||||||||||||||||||||||||||||||||||||||||||||||
| EUR |
|
|
September 2025 |
|
|
September 2025 |
|
|
||||||||||||||||||||||||||||||||||||||||||||||||
|
Others
(5)
|
|
|
July 2027 |
|
|
July 2027 |
|
|
||||||||||||||||||||||||||||||||||||||||||||||||
| Total |
|
$ |
|
May 2026 |
|
$ |
|
June 2026 |
|
|
||||||||||||||||||||||||||||||||||||||||||||||
(1)
Represents the number of lenders with fundings advanced in each respective currency, as well as the total number of facility lenders.
(2)
Our secured debt agreements are generally term-matched to their underlying collateral. Therefore, the weighted-average maturity is generally allocated based on the maximum maturity date of the collateral loans, assuming all extension options are exercised by the borrower. In limited instances, the maturity date of the respective secured credit facility is used.
(3)
Represents the principal balance of the collateral assets.
(4)
Maximum maturity assumes all extension options are exercised by the borrower, however our loans may be repaid prior to such date.
(5)
Includes Australian Dollar, Danish Krone, Swedish Krona, and Swiss Franc currencies.
The availability of funding under our secured credit facilities is based on the amount of approved collateral, which collateral is proposed by us in our discretion and approved by the respective counterparty in its discretion, resulting in a mutually agreed collateral portfolio construction. Certain structural elements of our secured credit facilities, including the limitation on recourse to us and facility economics are influenced by the specific collateral portfolio construction of each facility, and therefore vary within and among the facilities.
28
Blackstone Mortgage Trust, Inc.
Notes to Consolidated Financial Statements (continued) (Unaudited)
The following tables detail the spread of our secured debt as of September 30, 2023 and December 31, 2022 ($ in thousands):
| Nine Months Ended September 30, 2023 | September 30, 2023 | |||||||||||||||||||||||||||||||||||||||||||
|
Spread
(1)
|
New Financings
(2)
|
Total
Borrowings
|
Wtd. Avg.
All-in Cost
(1)(3)(4)
|
Collateral
(5)
|
Wtd. Avg.
All-in Yield
(1)(3)
|
Net Interest
Margin
(6)
|
||||||||||||||||||||||||||||||||||||||
| + 1.50% or less | $ |
|
$ |
|
+
|
% | $ |
|
+
|
% |
+
|
% | ||||||||||||||||||||||||||||||||
| + 1.51% to + 1.75% |
|
|
+
|
% |
|
+
|
% |
+
|
% | |||||||||||||||||||||||||||||||||||
| + 1.76% to + 2.00% |
|
|
+
|
% |
|
+
|
% |
+
|
% | |||||||||||||||||||||||||||||||||||
| + 2.01% or more |
|
|
+
|
% |
|
+
|
% |
+
|
% | |||||||||||||||||||||||||||||||||||
| Total | $ |
|
$ |
|
+
|
% | $ |
|
+
|
% |
+
|
% | ||||||||||||||||||||||||||||||||
| Year Ended December 31, 2022 | December 31, 2022 | |||||||||||||||||||||||||||||||||||||||||||
|
Spread
(1)
|
New Financings
(2)
|
Total
Borrowings
|
Wtd. Avg.
All-in Cost
(1)(3)(4)
|
Collateral
(5)
|
Wtd. Avg.
All-in Yield
(1)(3)
|
Net Interest
Margin
(6)
|
||||||||||||||||||||||||||||||||||||||
| + 1.50% or less | $ |
|
$ |
|
+
|
% | $ |
|
+
|
% |
+
|
% | ||||||||||||||||||||||||||||||||
| + 1.51% to + 1.75% |
|
|
+
|
% |
|
+
|
% |
+
|
% | |||||||||||||||||||||||||||||||||||
| + 1.76% to + 2.00% |
|
|
+
|
% |
|
+
|
% |
+
|
% | |||||||||||||||||||||||||||||||||||
| + 2.01% or more |
|
|
+
|
% |
|
+
|
% |
+
|
% | |||||||||||||||||||||||||||||||||||
| Total | $ |
|
$ |
|
+
|
% | $ |
|
+
|
% |
+
|
% | ||||||||||||||||||||||||||||||||
(1)
The spread, all-in cost, and all-in yield are expressed over the relevant floating benchmark rates, which include SOFR, USD LIBOR, SONIA, EURIBOR, and other indices as applicable.
(2)
Represents borrowings outstanding as of September 30, 2023 and December 31, 2022 for new financings closed during the nine months ended September 30, 2023 and year ended December 31, 2022, respectively.
(3)
In addition to spread, the cost includes the associated deferred fees and expenses related to the respective borrowings. In addition to cash coupon, all-in yield includes the amortization of deferred origination and extension fees, loan origination costs, and purchase discounts, as well as the accrual of exit fees. Excludes loans accounted for under the cost-recovery method.
(4)
Represents the weighted-average all-in cost as of September 30, 2023 and December 31, 2022, respectively, and is not necessarily indicative of the spread applicable to recent or future borrowings.
(5)
Represents the principal balance of the collateral assets.
(6)
Represents the difference between the weighted-average all-in yield and weighted-average all-in cost.
Our secured credit facilities generally permit us to increase or decrease the amount advanced against the pledged collateral in our discretion within certain maximum/minimum amounts and frequency limitations. As of September 30, 2023, there was an aggregate $
1.3
billion available to be drawn at our discretion under our credit facilities.
Acquisition Facility
We have a $
100.0
million full recourse secured credit facility that is designed to finance eligible first mortgage originations for up to nine months as a bridge to term financing without obtaining discretionary lender approval. The cost of borrowing under the facility is variable, dependent on the type of loan collateral, and its maturity date is April 3, 2024.
During the nine months ended September 30, 2023, we had
no
borrowings under the acquisition facility and we recorded interest expense of $
599,000
, including $
199,000
of amortization of deferred fees and expenses.
During the year ended December 31, 2022, we had
no
borrowings under the acquisition facility and we recorded interest expense of $
1.2
million, including $
333,000
of amortization of deferred fees and expenses.
29
Blackstone Mortgage Trust, Inc.
Notes to Consolidated Financial Statements (continued) (Unaudited)
Financial Covenants
We are subject to the following financial covenants related to our secured debt: (i) our ratio of earnings before interest, taxes, depreciation, and amortization, or EBITDA, to fixed charges, as defined in the agreements, shall be not less than
1.4
to 1.0; (ii) our tangible net worth, as defined in the agreements, shall not be less than $
3.6
billion as of each measurement date plus
75
% to
85
% of the net cash proceeds of future equity issuances subsequent to September 30, 2023; (iii) cash liquidity shall not be less than the greater of (x) $
10.0
million or (y) no more than
5
% of our recourse indebtedness; and (iv) our indebtedness shall not exceed
83.33
% of our total assets. As of September 30, 2023 and December 31, 2022, we were in compliance with these covenants.
6.
SECURITIZED DEBT OBLIGATIONS, NET
We have financed certain pools of our loans through collateralized loan obligations, or CLOs. The CLOs are consolidated in our financial statements and have issued securitized debt obligations that are non-recourse to us. Refer to Note 18 for further discussion of our CLOs.
The following tables detail our securitized debt obligations and the underlying collateral assets that are financed by our CLOs ($ in thousands):
| September 30, 2023 | ||||||||||||||||||||||||||||||||
| Securitized Debt Obligations | Count |
Principal
Balance
|
Book
Value
|
Wtd. Avg.
Yield/Cost
(1)(2)
|
Term
(3)
|
|||||||||||||||||||||||||||
| 2021 FL4 Collateralized Loan Obligation | ||||||||||||||||||||||||||||||||
| Senior CLO Securities Outstanding |
|
$ |
|
$ |
|
+
|
% | May 2038 | ||||||||||||||||||||||||
| Underlying Collateral Assets |
|
|
|
+
|
% | December 2025 | ||||||||||||||||||||||||||
| 2020 FL3 Collateralized Loan Obligation | ||||||||||||||||||||||||||||||||
| Senior CLO Securities Outstanding |
|
|
|
+
|
% | November 2037 | ||||||||||||||||||||||||||
| Underlying Collateral Assets |
|
|
|
+
|
% | May 2025 | ||||||||||||||||||||||||||
| 2020 FL2 Collateralized Loan Obligation | ||||||||||||||||||||||||||||||||
| Senior CLO Securities Outstanding |
|
|
|
+
|
% | February 2038 | ||||||||||||||||||||||||||
| Underlying Collateral Assets |
|
|
|
+
|
% | May 2025 | ||||||||||||||||||||||||||
| Total | ||||||||||||||||||||||||||||||||
|
Senior CLO Securities Outstanding
(4)
|
|
$ |
|
$ |
|
+
|
% | |||||||||||||||||||||||||
| Underlying Collateral Assets |
|
$ |
|
$ |
|
+
|
% | |||||||||||||||||||||||||
(1)
In addition to cash coupon, all-in yield includes the amortization of deferred origination and extension fees, loan origination costs, purchase discounts, and accrual of exit fees.
(2)
The weighted-average all-in yield and cost are expressed as a spread over SOFR, which is the relevant floating benchmark rate for each securitized debt obligation. Excludes loans accounted for under the cost-recovery method.
(3)
Underlying Collateral Assets term represents the weighted-average final maturity of such loans, assuming all extension options are exercised by the borrower. Repayments of securitized debt obligations are tied to timing of the related collateral loan asset repayments. The term of these obligations represents the rated final distribution date of the securitizations.
(4)
During the three and nine months ended September 30, 2023, we recorded $
44.5
million and $
127.6
million, respectively, of interest expense related to our securitized debt obligations.
30
Blackstone Mortgage Trust, Inc.
Notes to Consolidated Financial Statements (continued) (Unaudited)
| December 31, 2022 | ||||||||||||||||||||||||||||||||
| Securitized Debt Obligations | Count |
Principal
Balance
|
Book Value |
Wtd. Avg.
Yield/Cost
(1)(2)
|
Term
(3)
|
|||||||||||||||||||||||||||
| 2021 FL4 Collateralized Loan Obligation | ||||||||||||||||||||||||||||||||
| Senior CLO Securities Outstanding |
|
$ |
|
$ |
|
+
|
% | May 2038 | ||||||||||||||||||||||||
| Underlying Collateral Assets |
|
|
|
+
|
% | May 2025 | ||||||||||||||||||||||||||
| 2020 FL3 Collateralized Loan Obligation | ||||||||||||||||||||||||||||||||
| Senior CLO Securities Outstanding |
|
|
|
+
|
% | November 2037 | ||||||||||||||||||||||||||
| Underlying Collateral Assets |
|
|
|
+
|
% | November 2024 | ||||||||||||||||||||||||||
| 2020 FL2 Collateralized Loan Obligation | ||||||||||||||||||||||||||||||||
| Senior CLO Securities Outstanding |
|
|
|
+
|
% | February 2038 | ||||||||||||||||||||||||||
| Underlying Collateral Assets |
|
|
|
+
|
% | November 2024 | ||||||||||||||||||||||||||
| Total | ||||||||||||||||||||||||||||||||
|
Senior CLO Securities Outstanding
(4)
|
|
$ |
|
$ |
|
+
|
% | |||||||||||||||||||||||||
| Underlying Collateral Assets |
|
$ |
|
$ |
|
+
|
% | |||||||||||||||||||||||||
(1)
In addition to cash coupon, all-in yield includes the amortization of deferred origination and extension fees, loan origination costs, purchase discounts, and accrual of exit fees.
(2)
The weighted-average all-in yield and cost are expressed as a spread over the relevant floating benchmark rates, which include SOFR and USD LIBOR, as applicable to each securitized debt obligation. Excludes loans accounted for under the cost-recovery method.
(3)
Underlying Collateral Assets term represents the weighted-average final maturity of such loans, assuming all extension options are exercised by the borrower. Repayments of securitized debt obligations are tied to timing of the related collateral loan asset repayments. The term of these obligations represents the rated final distribution date of the securitizations.
(4)
During the three and nine months ended September 30, 2022, we recorded $
26.1
million and $
52.6
million, respectively, of interest expense related to our securitized debt obligations.
7.
ASSET-SPECIFIC DEBT, NET
The following table details our asset-specific debt ($ in thousands):
| September 30, 2023 | ||||||||||||||||||||||||||||||||
| Asset-Specific Debt | Count |
Principal
Balance
|
Book Value |
Wtd. Avg.
Yield/Cost
(1)
|
Wtd. Avg.
Term
(2)
|
|||||||||||||||||||||||||||
| Financing provided |
|
$ |
|
$ |
|
+
|
% | February 2026 | ||||||||||||||||||||||||
| Collateral assets |
|
$ |
|
$ |
|
+
|
% | February 2026 | ||||||||||||||||||||||||
| December 31, 2022 | ||||||||||||||||||||||||||||||||
| Asset-Specific Debt | Count |
Principal
Balance
|
Book Value |
Wtd. Avg.
Yield/Cost
(1)
|
Wtd. Avg.
Term
(2)
|
|||||||||||||||||||||||||||
| Financing provided |
|
$ |
|
$ |
|
+
|
% | January 2026 | ||||||||||||||||||||||||
| Collateral assets |
|
$ |
|
$ |
|
+
|
% | January 2026 | ||||||||||||||||||||||||
(1)
These floating rate loans and related liabilities are currency and index-matched to the applicable benchmark rate relevant in each arrangement. In addition to cash coupon, yield/cost includes the amortization of deferred origination fees and financing costs.
(2)
The weighted-average term is determined based on the maximum maturity of the corresponding loans, assuming all extension options are exercised by the borrower. Our non-recourse, asset-specific debt is term-matched in each case to the corresponding collateral loans.
31
Blackstone Mortgage Trust, Inc.
Notes to Consolidated Financial Statements (continued) (Unaudited)
8.
LOAN PARTICIPATIONS SOLD, NET
The sale of a non-recourse interest in a loan through a participation agreement generally does not qualify for sale accounting under GAAP. For such transactions, we therefore present the whole loan as an asset and the loan participation sold as a liability on our consolidated balance sheet until the loan is repaid. We generally have no obligation to pay principal and interest under these liabilities, and the gross presentation of loan participations sold does not impact our stockholders’ equity or net income.
The following table details our loan participations sold ($ in thousands):
| September 30, 2023 | ||||||||||||||||||||||||||||||||
| Loan Participations Sold | Count |
Principal
Balance
|
Book Value |
Wtd. Avg.
Yield/Cost
(1)
|
Term
(2)
|
|||||||||||||||||||||||||||
|
Senior Participations
|
||||||||||||||||||||||||||||||||
|
Loan Participation
|
|
$ |
|
$ |
|
+
|
% | March 2027 | ||||||||||||||||||||||||
| Total Loan |
|
|
|
+
|
% | March 2027 | ||||||||||||||||||||||||||
|
Junior Participations
|
||||||||||||||||||||||||||||||||
|
Loan Participation
|
|
$ |
|
$ |
|
+
|
% | June 2025 | ||||||||||||||||||||||||
|
Total Loan
|
|
|
|
+
|
% | June 2025 | ||||||||||||||||||||||||||
|
Total
|
||||||||||||||||||||||||||||||||
|
Loan Participation
(3)
|
|
$ |
|
$ |
|
|||||||||||||||||||||||||||
|
Total Loan
|
|
$ |
|
$ |
|
|||||||||||||||||||||||||||
| December 31, 2022 | ||||||||||||||||||||||||||||||||
| Loan Participations Sold | Count |
Principal
Balance |
Book Value |
Wtd. Avg.
Yield/Cost
(1)
|
Term
(2)
|
|||||||||||||||||||||||||||
|
Senior Participations
|
||||||||||||||||||||||||||||||||
|
Loan Participation
|
|
$ |
|
$ |
|
+
|
% | March 2027 | ||||||||||||||||||||||||
| Total Loan |
|
|
|
+
|
% | March 2027 | ||||||||||||||||||||||||||
|
Total
|
||||||||||||||||||||||||||||||||
|
Loan Participation
(3)
|
|
$ |
|
$ |
|
|||||||||||||||||||||||||||
|
Total Loan
|
|
$ |
|
$ |
|
|||||||||||||||||||||||||||
(1)
This non-debt participation sold structure is inherently matched in terms of currency and interest rate. In addition to cash coupon, yield/cost includes the amortization of deferred fees and financing costs.
(2)
The term is determined based on the maximum maturity of the loan, assuming all extension options are exercised by the borrower. Our loan participations sold are inherently non-recourse and term-matched to the corresponding loan.
(3)
During the three and nine months ended September 30, 2023, we recorded $
5.3
million and $
13.3
million, respectively, of interest expense related to our loan participations sold. During the three and nine months ended September 30, 2022 we recorded $
2.4
million and $
4.8
million, respectively, of interest expense related to our loan participations sold.
32
Blackstone Mortgage Trust, Inc.
Notes to Consolidated Financial Statements (continued) (Unaudited)
9.
TERM LOANS, NET
As of September 30, 2023, the following senior term loan facilities, or Term Loans, were outstanding ($ in thousands):
| Term Loans | Face Value |
Interest Rate
(1)
|
All-in Cost
(1)(2)
|
Maturity | ||||||||||||||||||||||
| B-1 Term Loan | $ |
|
+
|
% |
+
|
% | April 23, 2026 | |||||||||||||||||||
| B-3 Term Loan |
|
+
|
% |
+
|
% | April 23, 2026 | ||||||||||||||||||||
| B-4 Term Loan |
|
+
|
% |
+
|
% | May 9, 2029 | ||||||||||||||||||||
| Total face value | $ |
|
||||||||||||||||||||||||
(1)
The B-3 Term Loan and the B-4 Term Loan borrowings are subject to a floor of
0.50
%. The Term Loans are indexed to one-month SOFR.
(2)
Includes issue discount and transaction expenses that are amortized through interest expense over the life of the Term Loans.
The Term Loans are partially amortizing, with an amount equal to
1.0
% per annum of the aggregate initial principal balance due in quarterly installments. The issue discount and transaction expenses on the B-1 Term Loan were $
3.1
million and $
12.6
million, respectively. The issue discount and transaction expenses of the B-3 Term Loan were $
9.6
million and $
5.4
million, respectively. The issue discount and transaction expenses of the B-4 Term Loan were $
17.3
million and $
10.3
million, respectively. These discounts and expenses are amortized into interest expense over the life of each Term Loan. During the three and nine months ended September 30, 2023, we recorded $
47.0
million and $
133.8
million, respectively, of interest expense related to our Term Loans, including $
2.3
million and $
6.9
million, respectively, of amortization of deferred fees and expenses.
The following table details the net book value of our Term Loans on our consolidated balance sheets ($ in thousands):
| September 30, 2023 | December 31, 2022 | ||||||||||
| Face value | $ |
|
$ |
|
|||||||
| Deferred financing costs and unamortized discount |
(
|
(
|
|||||||||
| Net book value | $ |
|
$ |
|
|||||||
10.
SENIOR SECURED NOTES, NET
As of September 30, 2023, the following Senior Secured Notes, were outstanding ($ in thousands):
| Senior Secured Notes | Face Value | Interest Rate |
All-in Cost
(1)
|
Maturity | ||||||||||||||||||||||
| Senior Secured Notes | $ |
|
|
% |
|
% | January 15, 2027 | |||||||||||||||||||
(1)
Includes transaction expenses that are amortized through interest expense over the life of the Senior Secured Notes.
The transaction expenses on the Senior Secured Notes were $
6.3
million, which are amortized into interest expense over the life of the Senior Secured Notes. During the three and nine months ended September 30, 2023, we recorded $
3.9
million and $
12.0
million, respectively, of interest expense related to our Senior Secured Notes, including $
288,000
and $
882,000
, respectively, of amortization of deferred fees and expenses.
During the three months ended September 30, 2023, we repurchased an aggregate principal amount of $
33.4
million of the Senior Secured Notes at a weighted-average price of
85
%. This resulted in a gain on extinguishment of debt of $
4.5
million during both the three and nine months ended September 30, 2023. There was
no
repurchase activity in the three and nine months ended September 30, 2022.
33
Blackstone Mortgage Trust, Inc.
Notes to Consolidated Financial Statements (continued) (Unaudited)
The following table details the net book value of our Senior Secured Notes on our consolidated balance sheets ($ in thousands):
| September 30, 2023 | December 31, 2022 | ||||||||||
| Face value | $ |
|
$ |
|
|||||||
| Deferred financing costs |
(
|
(
|
|||||||||
| Net book value | $ |
|
$ |
|
|||||||
The Senior Secured Notes contain the financial covenant that our indebtedness shall not exceed
83.33
% of our total assets. As of September 30, 2023 and December 31, 2022, we were in compliance with this covenant. Under certain circumstances, we may, at our option, release all of the collateral securing our Senior Secured Notes, in which case we would also be required to maintain a total unencumbered assets to total unsecured indebtedness ratio of
1.20
or greater. This covenant is not currently in effect as the collateral securing our Senior Secured Notes has not been released.
11.
CONVERTIBLE NOTES, NET
During the nine months ended September 30, 2023, we repaid the aggregate $
220.0
million principal amount of our March 2018 convertible notes at maturity on March 15, 2023.
As of September 30, 2023, the following convertible senior notes, or Convertible Notes, were outstanding ($ in thousands):
| Convertible Notes Issuance | Face Value | Interest Rate |
All-in Cost
(1)
|
Conversion Price
(2)
|
Maturity | |||||||||||||||||||||||||||
| March 2022 | $ |
|
|
|
$
|
March 15, 2027 | ||||||||||||||||||||||||||
(1)
Includes issuance costs that are amortized through interest expense over the life of the Convertible Notes using the effective interest method.
Other than as provided by the optional redemption provisions with respect to our March 2022 convertible notes, we may not redeem the Convertible Notes prior to maturity. The March 2022 convertible notes are convertible at the holders’ option into shares of our class A common stock, only under specific circumstances, prior to the close of business on December 14, 2026 at the applicable conversion rate in effect on the conversion date. Thereafter, the March 2022 convertible notes are convertible at the option of the holder at any time until the second scheduled trading day immediately preceding the maturity date. The last reported sale price of our class A common stock of $
21.75
on September 29, 2023, the last trading day in the quarter ended September 30, 2023, was less than the per share conversion price of the March 2022 convertible notes.
The following table details the net book value of our Convertible Notes on our consolidated balance sheets ($ in thousands):
| September 30, 2023 | December 31, 2022 | ||||||||||
| Face value | $ |
|
$ |
|
|||||||
| Deferred financing costs and unamortized discount |
(
|
(
|
|||||||||
| Net book value | $ |
|
$ |
|
|||||||
34
Blackstone Mortgage Trust, Inc.
Notes to Consolidated Financial Statements (continued) (Unaudited)
The following table details our interest expense related to the Convertible Notes ($ in thousands):
| Three Months Ended September 30, | Nine Months Ended September 30, | ||||||||||||||||||||||
| 2023 | 2022 | 2023 | 2022 | ||||||||||||||||||||
| Cash coupon | $ |
|
$ |
|
$ |
|
$ |
|
|||||||||||||||
| Discount and issuance cost amortization |
|
|
|
|
|||||||||||||||||||
| Total interest expense | $ |
|
$ |
|
$ |
|
$ |
|
|||||||||||||||
12.
DERIVATIVE FINANCIAL INSTRUMENTS
The objective of our use of derivative financial instruments is to minimize the risks and/or costs associated with our investments and/or financing transactions. These derivatives may or may not qualify as net investment, cash flow, or fair value hedges under the hedge accounting requirements of ASC 815 – “Derivatives and Hedging.” Derivatives not designated as hedges are not speculative and are used to manage our exposure to interest rate movements and other identified risks. Refer to Note 2 for additional discussion of the accounting for designated and non-designated hedges.
The use of derivative financial instruments involves certain risks, including the risk that the counterparties to these contractual arrangements do not perform as agreed. To mitigate this risk, we only enter into derivative financial instruments with counterparties that have appropriate credit ratings and are major financial institutions with which we and our affiliates also have other financial relationships.
Net Investment Hedges of Foreign Currency Risk
Certain of our international investments expose us to fluctuations in foreign interest rates and currency exchange rates. These fluctuations may impact the value of our cash receipts and payments in terms of our functional currency, the U.S. dollar. We use foreign currency forward contracts to protect the value or fix the amount of certain investments or cash flows in terms of the U.S. dollar.
Designated Hedges of Foreign Currency Risk
The following table details our outstanding foreign exchange derivatives that were designated as net investment hedges of foreign currency risk (notional amounts in thousands):
| September 30, 2023 | December 31, 2022 | |||||||||||||||||||||||||||||||
| Foreign Currency Derivatives |
Number of
Instruments
|
Notional
Amount
|
Foreign Currency Derivatives |
Number of
Instruments
|
Notional
Amount
|
|||||||||||||||||||||||||||
| Buy USD / Sell SEK Forward |
|
kr |
|
Buy USD / Sell SEK Forward |
|
kr |
|
|||||||||||||||||||||||||
| Buy USD / Sell GBP Forward |
|
£ |
|
Buy USD / Sell EUR Forward |
|
€ |
|
|||||||||||||||||||||||||
| Buy USD / Sell EUR Forward |
|
€ |
|
Buy USD / Sell GBP Forward |
|
£ |
|
|||||||||||||||||||||||||
| Buy USD / Sell AUD Forward |
|
A$ |
|
Buy USD / Sell AUD Forward |
|
A$ |
|
|||||||||||||||||||||||||
| Buy USD / Sell DKK Forward |
|
kr. |
|
Buy USD / Sell DKK Forward |
|
kr. |
|
|||||||||||||||||||||||||
| Buy USD / Sell CHF Forward |
|
CHF |
|
Buy USD / Sell CAD Forward |
|
C$ |
|
|||||||||||||||||||||||||
| Buy USD / Sell CHF Forward |
|
CHF |
|
|||||||||||||||||||||||||||||
35
Blackstone Mortgage Trust, Inc.
Notes to Consolidated Financial Statements (continued) (Unaudited)
Non-designated Hedges of Foreign Currency Risk
The following table details our outstanding foreign exchange derivatives that were non-designated hedges of foreign currency risk (notional amounts in thousands):
| September 30, 2023 | December 31, 2022 | |||||||||||||||||||||||||||||||
| Non-designated Hedges |
Number of
Instruments
|
Notional
Amount
|
Non-designated Hedges |
Number of
Instruments
|
Notional
Amount
|
|||||||||||||||||||||||||||
| Buy GBP / Sell USD Forward |
|
£ |
|
Buy GBP / Sell USD Forward |
|
£ |
|
|||||||||||||||||||||||||
| Buy USD / Sell GBP Forward |
|
£ |
|
Buy USD / Sell GBP Forward |
|
£ |
|
|||||||||||||||||||||||||
| Buy AUD / Sell USD Forward |
|
A$ |
|
|||||||||||||||||||||||||||||
| Buy USD / Sell AUD Forward |
|
A$ |
|
|||||||||||||||||||||||||||||
Cash Flow Hedges of Interest Rate Risk
Certain of our financing transactions expose us to a fixed versus floating rate mismatch between our assets and liabilities. We use derivative financial instruments, which include interest rate swaps, and may also include interest rate caps, interest rate options, floors, and other interest rate derivative contracts, to hedge interest rate risk associated with our borrowings where there is potential for an index mismatch.
The following table details our outstanding interest rate derivatives that were designated as cash flow hedges of interest rate risk (notional amount in thousands):
| September 30, 2023 | ||||||||||||||||||||||||||||||||
| Interest Rate Derivatives | Number of Instruments | Notional Amount | Fixed Rate | Index | Wtd. Avg. Maturity (Years) | |||||||||||||||||||||||||||
| Interest Rate Swaps |
|
$ |
|
|
SOFR |
|
||||||||||||||||||||||||||
No cash flow hedges of interest rate risk were outstanding as of December 31, 2022.
Amounts reported in accumulated other comprehensive income (loss) related to derivatives will be reclassified to interest expense as interest payments are made on our floating rate debt. During the twelve months following September 30, 2023, we estimate that an additional $
1.6
million will be reclassified from accumulated other comprehensive income (loss) as a decrease to interest expense.
36
Blackstone Mortgage Trust, Inc.
Notes to Consolidated Financial Statements (continued) (Unaudited)
Financial Statement Impact of Hedges of Foreign Currency and Interest Rate Risks
The following table presents the effect of our derivative financial instruments on our consolidated statements of operations ($ in thousands):
| Increase (Decrease) to Net Interest Income Recognized from Derivatives | ||||||||||||||||||||||||||||||||
| Three Months Ended September 30, | Nine Months Ended September 30, | |||||||||||||||||||||||||||||||
|
Derivatives
in Hedging Relationships
|
Location of Income
(Expense) Recognized
|
2023 | 2022 | 2023 | 2022 | |||||||||||||||||||||||||||
| Designated Hedges |
Interest Income
(1)
|
$ |
|
$ |
|
$ |
|
$ |
|
|||||||||||||||||||||||
| Designated Hedges |
Interest Expense
(2)
|
|
|
|
|
|||||||||||||||||||||||||||
| Non-Designated Hedges |
Interest Income
(1)
|
|
(
|
|
(
|
|||||||||||||||||||||||||||
| Non-Designated Hedges |
Interest Expense
(3)
|
(
|
|
(
|
|
|||||||||||||||||||||||||||
| Total | $ |
|
$ |
|
$ |
|
$ |
|
||||||||||||||||||||||||
(1)
Represents the forward points earned on our foreign currency forward contracts, which reflect the interest rate differentials between the applicable base rate for our foreign currency investments and prevailing US interest rates. These forward contracts effectively convert the foreign currency rate exposure for such investments to USD-equivalent interest rates.
(2)
Represents the financial statement impact of proceeds (payments) from periodic settlements related to our interest rate swap, which is designated as a cash flow hedge.
Valuation and Other Comprehensive Income
The following table summarizes the fair value of our derivative financial instruments ($ in thousands):
|
Fair Value of Derivatives in an Asset
Position
(1)
as of
|
Fair Value of Derivatives in a Liability Position
(2)
as of
|
|||||||||||||||||||||||||
| September 30, 2023 | December 31, 2022 | September 30, 2023 | December 31, 2022 | |||||||||||||||||||||||
| Derivatives designated as hedging instruments: | ||||||||||||||||||||||||||
| Foreign exchange contracts | $ |
|
$ |
|
$ |
|
$ |
|
||||||||||||||||||
| Interest rate derivatives |
|
|
|
|
||||||||||||||||||||||
| Total derivatives designated as hedging instruments | $ |
|
$ |
|
$ |
|
$ |
|
||||||||||||||||||
| Derivatives not designated as hedging instruments: | ||||||||||||||||||||||||||
| Foreign exchange contracts | $ |
|
$ |
|
$ |
|
$ |
|
||||||||||||||||||
| Interest rate derivatives |
|
|
|
|
||||||||||||||||||||||
| Total derivatives not designated as hedging instruments | $ |
|
$ |
|
$ |
|
$ |
|
||||||||||||||||||
| Total Derivatives | $ |
|
$ |
|
$ |
|
$ |
|
||||||||||||||||||
(1)
Included in other assets in our consolidated balance sheets.
37
Blackstone Mortgage Trust, Inc.
Notes to Consolidated Financial Statements (continued) (Unaudited)
The following table presents the effect of our derivative financial instruments on our consolidated statements of comprehensive income and operations ($ in thousands):
|
Derivatives in Hedging Relationships
|
Amount of Gain (Loss) Recognized in
OCI on Derivatives
|
Location of
Gain (Loss) Reclassified from Accumulated OCI into Income |
Amount of
Gain Reclassified from
Accumulated OCI into Income
|
|||||||||||||||||||||||||||||
| Three Months Ended September 30, 2023 | Nine Months Ended September 30, 2023 | Three Months Ended September 30, 2023 | Nine Months Ended September 30, 2023 | |||||||||||||||||||||||||||||
| Net Investment Hedges | ||||||||||||||||||||||||||||||||
|
Foreign exchange contracts
(1)
|
$ |
|
$ |
|
Interest Expense | $ |
|
$ |
|
|||||||||||||||||||||||
| Cash Flow Hedges | ||||||||||||||||||||||||||||||||
| Interest rate derivatives |
|
|
Interest Expense
(2)
|
|
|
|||||||||||||||||||||||||||
| Total | $ |
|
$ |
|
$ |
|
$ |
|
||||||||||||||||||||||||
(1)
During the three and nine months ended September 30, 2023, we paid net cash settlements of $
44.7
million and $
183.9
million, respectively, on our foreign currency forward contracts. Those amounts are included as a component of accumulated other comprehensive income on our consolidated balance sheets.
(2)
During the three and nine months ended September 30, 2023, we recorded total interest and related expenses of $
354.0
million and $
1.0
billion, respectively, which were reduced by $
384,000
and $
459,000
, respectively, related to income generated by our cash flow hedges.
Credit-Risk Related Contingent Features
We have entered into agreements with certain of our derivative counterparties that contain provisions where if we were to default on any of our indebtedness, including default where repayment of the indebtedness has not been accelerated by the lender, we may also be declared in default on our derivative obligations. In addition, certain of our agreements with our derivative counterparties require that we post collateral to secure net liability positions. As of September 30, 2023, we were in a net asset position with our counterparties. As of September 30, 2023, we had
no
collateral posted with our counterparties. As of December 31, 2022, we were in a net liability position with one of our counterparties and in a net asset position with our other counterparty. As of December 31, 2022 we had collateral posted with our counterparties of $
103.1
million.
13.
EQUITY
Stock and Stock Equivalents
Authorized Capital
As of September 30, 2023, we had the authority to issue up to
500,000,000
shares of stock, consisting of
400,000,000
shares of class A common stock and
100,000,000
shares of preferred stock. Subject to applicable NYSE listing requirements, our board of directors is authorized to cause us to issue additional shares of authorized stock without stockholder approval. In addition, to the extent not issued, currently authorized stock may be reclassified between class A common stock and preferred stock. We did
no
t have any shares of preferred stock issued and outstanding as of September 30, 2023 and December 31, 2022.
Class A Common Stock and Deferred Stock Units
Holders of shares of our class A common stock are entitled to vote on all matters submitted to a vote of stockholders and are entitled to receive dividends authorized by our board of directors and declared by us, in all cases subject to the rights of the holders of shares of outstanding preferred stock, if any.
We also issue restricted class A common stock under our stock-based incentive plans. Refer to Note 16 for additional discussion of these long-term incentive plans. In addition to our class A common stock, we also issue deferred stock units to certain members of our board of directors for services rendered. These deferred stock units are non-voting, but carry the right to receive dividends in the form of additional deferred stock units in an amount equivalent to the cash dividends paid to holders of shares of class A common stock.
38
Blackstone Mortgage Trust, Inc.
Notes to Consolidated Financial Statements (continued) (Unaudited)
The following table details the movement in our outstanding shares of class A common stock, including restricted class A common stock and deferred stock units:
| Nine Months Ended September 30, | ||||||||||||||
|
Common Stock Outstanding
(1)
|
2023 | 2022 | ||||||||||||
| Beginning balance |
|
|
||||||||||||
|
Issuance of class A common stock
(2)
|
|
|
||||||||||||
|
Issuance of restricted class A common stock, net
(3)(4)
|
|
|
||||||||||||
| Issuance of deferred stock units |
|
|
||||||||||||
| Ending balance |
|
|
||||||||||||
(1)
Includes
349,232
and
399,512
deferred stock units held by members of our board of directors as of September 30, 2023 and 2022, respectively.
(2)
Includes
5,079
and
5,420
shares issued under our dividend reinvestment program during the nine months ended September 30, 2023 and 2022, respectively.
(3)
Includes
25,482
and
13,197
restricted shares issued to our board of directors during the nine months ended September 30, 2023 and 2022, respectively.
(4)
Net of
15,477
and
33,250
shares of restricted class A common stock forfeited under our stock-based incentive plans during the nine months ended September 30, 2023 and 2022, respectively.
Dividend Reinvestment and Direct Stock Purchase Plan
We have adopted a dividend reinvestment and direct stock purchase plan under which we registered and reserved for issuance, in the aggregate,
10,000,000
shares of class A common stock. Under the dividend reinvestment component of this plan, our class A common stockholders can designate all or a portion of their cash dividends to be reinvested in additional shares of class A common stock. The direct stock purchase component allows stockholders and new investors, subject to our approval, to purchase shares of class A common stock directly from us. During the nine months ended September 30, 2023 and 2022, we issued
5,079
shares and
5,420
shares, respectively, of class A common stock under the dividend reinvestment component of the plan. As of September 30, 2023, a total of
9,976,469
shares of class A common stock remained available for issuance under the dividend reinvestment and direct stock purchase plan.
At the Market Stock Offering Program
As of September 30, 2023, we are party to
seven
equity distribution agreements, or ATM Agreements, pursuant to which we may sell, from time to time, up to an aggregate sales price of $
699.1
million of our class A common stock. Sales of class A common stock made pursuant to our ATM Agreements may be made in negotiated transactions or transactions that are deemed to be “at the market” offerings as defined in Rule 415 under the Securities Act of 1933, as amended. Actual sales depend on a variety of factors including market conditions, the trading price of our class A common stock, our capital needs, and our determination of the appropriate sources of funding to meet such needs. During the nine months ended September 30, 2023, we did
no
t issue any shares of our class A common stock under ATM Agreements. During the nine months ended September 30, 2022, we issued and sold
2,303,469
shares of class A common stock under ATM Agreements, generating net proceeds totaling $
70.7
million. As of September 30, 2023, sales of our class A common stock with an aggregate sales price of $
480.9
million remained available for issuance under our ATM Agreements.
Dividends
We generally intend to distribute substantially all of our taxable income, which does not necessarily equal net income as calculated in accordance with GAAP, to our stockholders each year to comply with the REIT provisions of the Internal Revenue Code of 1986, as amended, or the Internal Revenue Code. Our dividend policy remains subject to revision at the discretion of our board of directors. All distributions will be made at the discretion of our board of directors and will depend upon our taxable income, our financial condition, our maintenance of REIT status, applicable law, and other factors as our board of directors deems relevant.
On September 15, 2023, we declared a dividend of $
0.62
per share, or $
106.8
million in aggregate, that was paid on October 13, 2023 to stockholders of record as of September 29, 2023.
39
Blackstone Mortgage Trust, Inc.
Notes to Consolidated Financial Statements (continued) (Unaudited)
The following table details our dividend activity ($ in thousands, except per share data):
| Three Months Ended September 30, | Nine Months Ended September 30, | ||||||||||||||||||||||
| 2023 | 2022 | 2023 | 2022 | ||||||||||||||||||||
| Dividends declared per share of common stock | $ |
|
$ |
|
$ |
|
$ |
|
|||||||||||||||
| Class A common stock dividends declared | $ |
|
$ |
|
$ |
|
$ |
|
|||||||||||||||
| Deferred stock unit dividends declared |
|
|
|
|
|||||||||||||||||||
| Total dividends declared | $ |
|
$ |
|
$ |
|
$ |
|
|||||||||||||||
Earnings Per Share
We calculate our basic and diluted earnings per share using the two-class method for all periods presented as the unvested shares of our restricted class A common stock qualify as participating securities, as defined by GAAP. These restricted shares have the same rights as our other shares of class A common stock, including participating in any dividends, and therefore have been included in our basic and diluted net income per share calculation. The shares issuable under our Convertible Notes are included in dilutive earnings per share using the if-converted method.
40
Blackstone Mortgage Trust, Inc.
Notes to Consolidated Financial Statements (continued) (Unaudited)
The following table sets forth the calculation of basic and diluted net income per share of class A common stock based on the weighted-average of both restricted and unrestricted class A common stock outstanding ($ in thousands, except per share data):
| Three Months Ended September 30, | Nine Months Ended September 30, | ||||||||||||||||||||||
| 2023 | 2022 | 2023 | 2022 | ||||||||||||||||||||
| Basic Earnings | |||||||||||||||||||||||
|
Net income
(1)
|
$ |
|
$ |
|
$ |
|
$ |
|
|||||||||||||||
| Weighted-average shares outstanding, basic |
|
|
|
|
|||||||||||||||||||
| Per share amount, basic | $ |
|
$ |
|
$ |
|
$ |
|
|||||||||||||||
| Diluted Earnings | |||||||||||||||||||||||
|
Net income
(1)
|
$ |
|
$ |
|
$ |
|
$ |
|
|||||||||||||||
|
Add back: Interest expense on Convertible Notes, net
(2)(3)
|
|
|
|
|
|||||||||||||||||||
| Diluted earnings | $ |
|
$ |
|
$ |
|
$ |
|
|||||||||||||||
| Weighted-average shares outstanding, basic |
|
|
|
|
|||||||||||||||||||
|
Effect of dilutive securities - Convertible Notes
(3)
|
|
|
|
|
|||||||||||||||||||
| Weighted-average common shares outstanding, diluted |
|
|
|
|
|||||||||||||||||||
| Per share amount, diluted | $ |
|
$ |
|
$ |
|
$ |
|
|||||||||||||||
(1)
Represents net income attributable to Blackstone Mortgage Trust.
(2)
Represents the interest expense on our Convertible Notes, net of incentive fees.
(3)
For the three months ended September 30, 2023, our Convertible Notes were not included in the calculation of diluted earnings per share, as the impact is antidilutive. For the nine months ended September 30, 2023, represents
8.3
million of weighted-average shares, using the if-converted method, related to our March 2022 convertible notes. For the three and nine months ended September 30, 2022, represents
8.3
million and
6.1
million of weighted-average shares, using the if-converted method, related to our March 2022 and March 2018 convertible notes, respectively. Our March 2018 convertible notes were repaid during the nine months ended September 30, 2023. Refer to Note 11 for additional discussion on our Convertible Notes.
Other Balance Sheet Items
Accumulated Other Comprehensive Income
As of September 30, 2023, total accumulated other comprehensive income was $
10.6
million, primarily representing $
281.8
million of net realized and unrealized gains related to changes in the fair value of derivative instruments offset by $
271.2
million of cumulative unrealized currency translation adjustments on assets and liabilities denominated in foreign currencies. As of December 31, 2022, total accumulated other comprehensive income was $
10.0
million, primarily representing $
259.8
million of net realized and unrealized gains related to changes in the fair value of derivative instruments offset by $
249.8
million of cumulative unrealized currency translation adjustments on assets and liabilities denominated in foreign currencies.
Non-Controlling Interests
41
Blackstone Mortgage Trust, Inc.
Notes to Consolidated Financial Statements (continued) (Unaudited)
14.
OTHER EXPENSES
Our other expenses consist of the management and incentive fees we pay to our Manager and our general and administrative expenses.
Management and Incentive Fees
Pursuant to a management agreement between our Manager and us, or our Management Agreement, our Manager earns a base management fee in an amount equal to
1.50
% per annum multiplied by our outstanding equity balance, as defined in the Management Agreement. In addition, our Manager is entitled to an incentive fee in an amount equal to the product of (i)
20
% and (ii) the excess of (a) our Core Earnings (as defined in our Management Agreement) for the previous 12-month period over (b) an amount equal to
7.00
% per annum multiplied by our outstanding Equity, provided that our Core Earnings over the prior
three-year
period is greater than
zero
. Core Earnings, as defined in our Management Agreement, is generally equal to our GAAP net income (loss), including realized gains and losses not otherwise recognized in current period GAAP net income (loss), and excluding (i) non-cash equity compensation expense, (ii) depreciation and amortization, (iii) unrealized gains (losses), (iv) net income (loss) attributable to our legacy portfolio, (v) certain non-cash items, and (vi) incentive management fees.
During the three and nine months ended September 30, 2023, we incurred $
18.8
million and $
56.0
million, respectively, of management fees payable to our manager, compared with $
18.3
million and $
54.6
million, respectively, during the same periods in 2022. In addition, during the three and nine months ended September 30, 2023, we incurred $
10.1
million and $
36.8
million, respectively, of incentive fees payable to our Manager, compared with $
7.6
million and $
21.9
million, respectively, during the same periods in 2022.
As of September 30, 2023 and December 31, 2022 we had accrued management and incentive fees payable to our Manager of $
28.9
million and $
33.8
million, respectively.
General and Administrative Expenses
General and administrative expenses consisted of the following ($ in thousands):
| Three Months Ended September 30, | Nine Months Ended September 30, | ||||||||||||||||||||||
| 2023 | 2022 | 2023 | 2022 | ||||||||||||||||||||
| Professional services | $ |
|
$ |
|
$ |
|
$ |
|
|||||||||||||||
| Operating and other costs |
|
|
|
|
|||||||||||||||||||
|
Subtotal
(1)
|
|
|
|
|
|||||||||||||||||||
| Non-cash compensation expenses | |||||||||||||||||||||||
| Restricted class A common stock earned |
|
|
|
|
|||||||||||||||||||
| Director stock-based compensation |
|
|
|
|
|||||||||||||||||||
| Subtotal |
|
|
|
|
|||||||||||||||||||
| Total general and administrative expenses | $ |
|
$ |
|
$ |
|
$ |
|
|||||||||||||||
(1)
During the three and nine months ended September 30, 2023, we recognized an aggregate $
230,000
and $
826,000
, respectively, of expenses related to our Multifamily Joint Venture. During the three and nine months ended September 30, 2022, we recognized an aggregate $
239,000
and $
783,000
, respectively, of expenses related to our Multifamily Joint Venture.
15.
INCOME TAXES
42
Blackstone Mortgage Trust, Inc.
Notes to Consolidated Financial Statements (continued) (Unaudited)
Our qualification as a REIT also depends on our ability to meet various other requirements imposed by the Internal Revenue Code, which relate to organizational structure, diversity of stock ownership, and certain restrictions with regard to the nature of our assets and the sources of our income. Even if we qualify as a REIT, we may be subject to certain U.S. federal income and excise taxes and state and local taxes on our income and assets. If we fail to maintain our qualification as a REIT for any taxable year, we may be subject to material penalties as well as federal, state, and local income tax on our taxable income at regular corporate rates and we would not be able to qualify as a REIT for the subsequent four full taxable years. As of September 30, 2023 and December 31, 2022, we were in compliance with all REIT requirements.
Securitization transactions could result in the creation of taxable mortgage pools for federal income tax purposes. As a REIT, so long as we own 100% of the equity interests in a taxable mortgage pool, we generally would not be adversely affected by the characterization of the securitization as a taxable mortgage pool. Certain categories of stockholders, however, such as foreign stockholders eligible for treaty or other benefits, stockholders with net operating losses, and certain tax-exempt stockholders that are subject to unrelated business income tax, or UBTI, could be subject to increased taxes on a portion of their dividend income from us that is attributable to the taxable mortgage pool. We have not made UBTI distributions to our common stockholders and do not intend to make such UBTI distributions in the future.
During the three and nine months ended September 30, 2023, we recorded a current income tax provision
of $
1.6
million and $
4.7
million, respectively, primarily related to activities of our taxable REIT subsidiaries and various state
and local taxes. During the three and nine months ended September 30, 2022, we recorded a current income tax provision of $
1.2
million and
$
2.1
million,
respectively.
We did not have any deferred tax assets or liabilities as of September 30, 2023 or December 31, 2022.
We have net operating losses, or NOLs, generated by our predecessor business that may be carried forward and utilized in current or future periods. As a result of our issuance of
25,875,000
shares of class A common stock in May 2013, the availability of our NOLs is generally limited to $
2.0
million per annum by change of control provisions promulgated by the Internal Revenue Service with respect to the ownership of Blackstone Mortgage Trust. As of September 30, 2023, we had estimated NOLs of $
159.0
million that will expire in 2029, unless they are utilized by us prior to expiration. Previously, we recorded a full valuation allowance against such NOLs as we expected that they would expire unutilized. However, although uncertain, we may utilize a portion of NOLs prior to expiration. We do not expect the utilization of NOLs to have a material impact on our consolidated financial statements. We have recorded a full valuation allowance against such NOLs as it is probable that they will expire unutilized.
16.
STOCK-BASED INCENTIVE PLANS
We are externally managed by our Manager and do not currently have any employees. However, as of September 30, 2023, our Manager, certain individuals employed by an affiliate of our Manager, and certain members of our board of directors were compensated, in part, through our issuance of stock-based instruments.
Under our
two
current stock incentive plans, a maximum of
10,400,000
shares of our class A common stock may be issued to our Manager, our directors and officers, and certain employees of affiliates of our Manager. As of September 30, 2023, there were
8,677,254
shares available under our current stock incentive plans. Prior to the adoption and shareholder approval of our new stock incentive plans in June 2022, we had stock-based incentive awards outstanding under
nine
stock incentive plans. In connection with the adoption of our new stock incentive plans, we consolidated all outstanding deferred stock units, or DSUs, under the new plans and retired the
seven
remaining historical plans. As such,
no
new awards may be issued under these expired plans, although our 2018 plans will continue to govern outstanding awards, other than DSUs, previously issued thereunder until such awards become vested or expire.
43
Blackstone Mortgage Trust, Inc.
Notes to Consolidated Financial Statements (continued) (Unaudited)
The following table details the movement in our outstanding shares of restricted class A common stock and the weighted-average grant date fair value per share:
|
Restricted Class A
Common Stock
|
Weighted-Average
Grant Date Fair
Value Per Share
|
||||||||||
|
Balance as of December 31, 2022
|
|
$ |
|
||||||||
| Granted |
|
|
|||||||||
| Vested |
(
|
|
|||||||||
| Forfeited |
(
|
|
|||||||||
|
Balance as of September 30, 2023
|
|
$ |
|
||||||||
These shares generally vest in installments over a period of
three years
, pursuant to the terms of the respective award agreements and the terms of our current benefit plans. The
1,539,475
shares of restricted class A common stock outstanding as of September 30, 2023 will vest as follows:
271,668
shares will vest in 2023;
844,109
shares will vest in 2024; and
423,698
shares will vest in 2025. As of September 30, 2023, total unrecognized compensation cost relating to unvested share-based compensation arrangements was $
38.4
million based on the grant date fair value of shares granted. This cost is expected to be recognized over a weighted-average period of
1.0
years from September 30, 2023.
17.
FAIR VALUES
Assets and Liabilities Measured at Fair Value
The following table summarizes our assets and liabilities measured at fair value on a recurring basis ($ in thousands):
| September 30, 2023 | December 31, 2022 | ||||||||||||||||||||||||||||||||||||||||||||||
| Level 1 | Level 2 | Level 3 | Total | Level 1 | Level 2 | Level 3 | Total | ||||||||||||||||||||||||||||||||||||||||
| Assets | |||||||||||||||||||||||||||||||||||||||||||||||
| Derivatives | $ |
|
$ |
|
$ |
|
$ |
|
$ |
|
$ |
|
$ |
|
$ |
|
|||||||||||||||||||||||||||||||
| Liabilities | |||||||||||||||||||||||||||||||||||||||||||||||
| Derivatives | $ |
|
$ |
|
$ |
|
$ |
|
$ |
|
$ |
|
$ |
|
$ |
|
|||||||||||||||||||||||||||||||
Refer to Note 2 for further discussion regarding fair value measurement.
Fair Value of Financial Instruments
As discussed in Note 2, GAAP requires disclosure of fair value information about financial instruments, whether or not recognized at fair value in the statement of financial position, for which it is practicable to estimate that value.
44
Blackstone Mortgage Trust, Inc.
Notes to Consolidated Financial Statements (continued) (Unaudited)
The following table details the book value, face amount, and fair value of the financial instruments described in Note 2 ($ in thousands):
| September 30, 2023 | December 31, 2022 | ||||||||||||||||||||||||||||||||||
|
Book
Value
|
Face
Amount
|
Fair
Value
|
Book
Value
|
Face
Amount
|
Fair
Value
|
||||||||||||||||||||||||||||||
| Financial assets | |||||||||||||||||||||||||||||||||||
| Cash and cash equivalents | $ |
|
$ |
|
$ |
|
$ |
|
$ |
|
$ |
|
|||||||||||||||||||||||
| Loans receivable, net |
|
|
|
|
|
|
|||||||||||||||||||||||||||||
| Financial liabilities | |||||||||||||||||||||||||||||||||||
| Secured debt, net |
|
|
|
|
|
|
|||||||||||||||||||||||||||||
| Securitized debt obligations, net |
|
|
|
|
|
|
|||||||||||||||||||||||||||||
| Asset-specific debt, net |
|
|
|
|
|
|
|||||||||||||||||||||||||||||
| Loan participations sold, net |
|
|
|
|
|
|
|||||||||||||||||||||||||||||
| Secured term loans, net |
|
|
|
|
|
|
|||||||||||||||||||||||||||||
| Senior secured notes, net |
|
|
|
|
|
|
|||||||||||||||||||||||||||||
| Convertible notes, net |
|
|
|
|
|
|
|||||||||||||||||||||||||||||
Estimates of fair value for cash and cash equivalents and convertible notes are measured using observable, quoted market prices, or Level 1 inputs. Estimates of fair value for securitized debt obligations, the term loans, and the senior secured notes are measured using observable, quoted market prices, in inactive markets, or Level 2 inputs. All other fair value significant estimates are measured using unobservable inputs, or Level 3 inputs. See Note 2 for further discussion regarding fair value measurement of certain of our assets and liabilities.
18.
VARIABLE INTEREST ENTITIES
We have financed a portion of our loans through the CLOs, all of which are VIEs. We are the primary beneficiary of, and therefore consolidate, the CLOs on our balance sheet as we (i) control the relevant interests of the CLOs that give us power to direct the activities that most significantly affect the CLOs, and (ii) have the right to receive benefits and obligation to absorb losses of the CLOs through the subordinate interests we own.
The following table details the assets and liabilities of our consolidated VIEs ($ in thousands):
| September 30, 2023 | December 31, 2022 | ||||||||||
| Assets | |||||||||||
| Loans receivable | $ |
|
$ |
|
|||||||
| Current expected credit loss reserve |
(
|
(
|
|||||||||
| Loans receivable, net |
|
|
|||||||||
| Other assets |
|
|
|||||||||
| Total assets | $ |
|
$ |
|
|||||||
| Liabilities | |||||||||||
| Securitized debt obligations, net | $ |
|
$ |
|
|||||||
| Other liabilities |
|
|
|||||||||
| Total liabilities | $ |
|
$ |
|
|||||||
45
Blackstone Mortgage Trust, Inc.
Notes to Consolidated Financial Statements (continued) (Unaudited)
19.
TRANSACTIONS WITH RELATED PARTIES
We are managed by our Manager pursuant to the Management Agreement, the current term of which expires on December 19, 2023, and will be automatically renewed for a
one year
term upon such date and each anniversary thereafter unless earlier terminated.
As of September 30, 2023 and December 31, 2022, our consolidated balance sheets included $
28.9
million and $
33.8
million of accrued management and incentive fees payable to our Manager, respectively. During the three and nine months ended September 30, 2023, we paid aggregate management and incentive fees of $
32.8
million and $
97.7
million, respectively, to our Manager, compared to $
27.1
million and $
78.9
million, respectively, during the same period of 2022. In addition, during the three and nine months ended September 30, 2023, we incurred expenses of $
325,000
and $
2.3
million, respectively, that were paid by our Manager and will be reimbursed by us, compared to $
163,000
and $
723,000
, respectively, of such expenses during the same period of 2022.
As of September 30, 2023, our Manager held
762,845
shares of unvested restricted class A common stock, which had an aggregate grant date fair value of $
20.6
million, and vest in installments over
three years
from the date of issuance. During the three and nine months ended September 30, 2023, we recorded non-cash expenses related to shares held by our Manager of $
3.9
million and $
11.7
million, respectively, compared to $
4.1
million and $
12.5
million during the same period in 2022. Refer to Note 16 for further details on our restricted class A common stock.
An affiliate of our Manager is the special servicer of the CLOs. This affiliate did not earn any special servicing fees related to the CLOs during the nine months ended September 30, 2023 and 2022.
During the three and nine months ended September 30, 2023, we incurred $
320,000
and $
800,000
, respectively, of expenses for various administrative and operations services to third-party service providers that are affiliates of our Manager, compared to $
88,000
and $
280,000
, respectively, during the same period of 2022.
20.
COMMITMENTS AND CONTINGENCIES
Unfunded Commitments Under Loans Receivable
As of September 30, 2023, we had aggregate unfunded commitments of $
2.7
billion across
101
loans receivable, and $
1.5
billion of committed or identified financings for those commitments, resulting in net unfunded commitments of $
1.2
billion. The unfunded loan commitments comprise funding for capital expenditures and construction, leasing costs, and interest and carry costs, and their fundability varies depending on the progress of capital projects, leasing, and cash flows at the properties securing our loans. Therefore, the exact timing and amounts of such future loan fundings are uncertain and will depend on the current and future performance of the underlying collateral assets. We expect to fund our loan commitments over the remaining term of the related loans, which have a weighted-average future funding period of
2.6
years.
46
Blackstone Mortgage Trust, Inc.
Notes to Consolidated Financial Statements (continued) (Unaudited)
Principal Debt Repayments
Our contractual principal debt repayments as of September 30, 2023 were as follows ($ in thousands):
| Year |
Secured
Debt
(1)
|
Asset-Specific Debt
(1)
|
Term
Loans
(2)
|
Senior Secured Notes |
Convertible Notes
(3)
|
Total
(4)
|
||||||||||||||||||||||||||||||||
| 2023 (remaining) | $ |
|
$ |
|
$ |
|
$ |
|
$ |
|
$ |
|
||||||||||||||||||||||||||
| 2024 |
|
|
|
|
|
|
||||||||||||||||||||||||||||||||
| 2025 |
|
|
|
|
|
|
||||||||||||||||||||||||||||||||
| 2026 |
|
|
|
|
|
|
||||||||||||||||||||||||||||||||
| 2027 |
|
|
|
|
|
|
||||||||||||||||||||||||||||||||
| Thereafter |
|
|
|
|
|
|
||||||||||||||||||||||||||||||||
| Total obligation | $ |
|
$ |
|
$ |
|
$ |
|
$ |
|
$ |
|
||||||||||||||||||||||||||
(1)
Our secured debt and asset-specific debt agreements are generally term-matched to their underlying collateral. Therefore, the allocation of payments under such agreements is generally allocated based on the maximum maturity date of the collateral loans, assuming all extension options are exercised by the borrower. In limited instances, the maturity date of the respective debt agreement is used.
(2)
The Term Loans are partially amortizing, with an amount equal to
1.0
% per annum of the initial principal balance due in quarterly installments. Refer to Note 9 for further details on our term loans.
(3)
Reflects the outstanding principal balance of Convertible Notes, excluding any potential conversion premium. Refer to Note 11 for further details on our Convertible Notes.
Board of Directors’ Compensation
As of September 30, 2023, of the
ten
members of our board of directors, our
six
independent directors are entitled to annual compensation of $
210,000
each, of which $
95,000
is paid in cash and $
115,000
is paid in the form of deferred stock units or, at their election, shares of restricted common stock. The other
four
board members, including our chairman and our chief executive officer, are not compensated by us for their service as directors. In addition, (i) the chairs of our audit, compensation, and corporate governance committees receive additional annual cash compensation of $
20,000
, $
15,000
, and $
10,000
, respectively and (ii) the members of our audit and investment risk management committees receive additional annual cash compensation of $
10,000
and $
7,500
, respectively.
Litigation
47
ITEM 2. MANAGEMENT’S DISCUSSION AND ANALYSIS OF FINANCIAL CONDITION AND RESULTS OF OPERATIONS
References herein to “Blackstone Mortgage Trust,” “Company,” “we,” “us,” or “our” refer to Blackstone Mortgage Trust, Inc. and its subsidiaries unless the context specifically requires otherwise.
The following discussion should be read in conjunction with the unaudited consolidated financial statements and notes thereto appearing elsewhere in this Quarterly Report on Form 10-Q. In addition to historical data, this discussion contains forward-looking statements within the meaning of Section 27A of the Securities Act of 1933, as amended, or the Securities Act, and Section 21E of the Securities Exchange Act of 1934, as amended, or the Exchange Act, which reflect our current views with respect to, among other things, our business, operations and financial performance. You can identify these forward-looking statements by the use of words such as “intend,” “goal,” “estimate,” “expect,” “project,” “projections,” “plans,” “seeks,” “anticipates,” “should,” “could,” “may,” “designed to,” “foreseeable future,” “believe,” “scheduled,” and similar expressions. Such forward-looking statements are subject to various risks, uncertainties and assumptions. Our actual results or outcomes may differ materially from those in this discussion as a result of various factors, including but not limited to those discussed in Item 1A. Risk Factors in our Annual Report on Form 10-K for the year ended December 31, 2022 and elsewhere in this Quarterly Report on Form 10-Q.
Introduction
Blackstone Mortgage Trust is a real estate finance company that originates senior loans collateralized by commercial real estate in North America, Europe, and Australia. Our portfolio is composed primarily of loans secured by high-quality, institutional assets in major markets, sponsored by experienced, well-capitalized real estate investment owners and operators. These senior loans are capitalized by accessing a variety of financing options, including borrowing under our credit facilities, issuing CLOs or single-asset securitizations, and syndicating senior loan participations, depending on our view of the most prudent financing option available for each of our investments. We are not in the business of buying or trading securities, and the only securities we own are the retained interests from our securitization financing transactions, which we have not financed. We are externally managed by BXMT Advisors L.L.C., or our Manager, a subsidiary of Blackstone Inc., or Blackstone, and are a real estate investment trust, or REIT, traded on the New York Stock Exchange, or NYSE, under the symbol “BXMT.”
We benefit from the deep knowledge, experience and information advantages of our Manager, which is a part of Blackstone’s real estate platform. Blackstone has built the world's preeminent global real estate business, with a proven track record of successfully navigating market cycles and emerging stronger through periods of volatility. The market-leading real estate expertise derived from the strength of the Blackstone platform deeply informs our credit and underwriting process, and we believe gives us the tools to expertly manage the assets in our portfolio and work with our borrowers throughout periods of economic stress and uncertainty.
We conduct our operations as a REIT for U.S. federal income tax purposes. We generally will not be subject to U.S. federal income taxes on our taxable income to the extent that we annually distribute all of our net taxable income to stockholders and maintain our qualification as a REIT. We also operate our business in a manner that permits us to maintain an exclusion from registration under the Investment Company Act of 1940, as amended. We are organized as a holding company and conduct our business primarily through our various subsidiaries.
Recent Developments
Macroeconomic Environment
The nine months ended September 30, 2023 have been characterized by continued volatility in global markets, driven by investor concerns over inflation, rising interest rates, slowing economic growth, political and regulatory uncertainty and geopolitical conditions. Recent events affecting financial institutions have also contributed to volatility in global markets and diminished liquidity and credit availability in the market broadly.
Continued inflation has prompted central banks to take monetary policy tightening actions, including raising interest rates, which has created further uncertainty for the economy and for our borrowers. Although our business model is such that rising interest rates will, all else equal, correlate to increases in our net income, increases in interest rates may adversely affect our existing borrowers and lead to nonperformance. Additionally, rising rates and increasing costs may dampen consumer spending and slow corporate profit growth, which may negatively impact the collateral underlying certain of our loans. It remains difficult to predict the full impact of recent events and any future changes in interest rates or inflation.
48
Reference Rate Reform
LIBOR and certain other floating rate benchmark indices have been the subject of national, international and regulatory guidance and proposals for reform or replacement. The Federal Reserve, in conjunction with the Alternative Reference Rates Committee, a steering committee composed of large U.S. financial institutions, identified SOFR, an index calculated using short-term repurchase agreements backed by U.S. Treasury securities, as its preferred alternative rate for USD LIBOR. As of September 30, 2023, one-month term SOFR is utilized as the floating benchmark rate on all of our floating rate U.S. dollar loans and related financings. Additionally, market participants have continued to transition from GBP LIBOR to the Sterling Overnight Index Average, or SONIA, in line with guidance from the U.K. regulators. As of September 30, 2023, daily compounded SONIA is utilized as the floating benchmark rate for all of our floating rate British Pound Sterling loans and related financings. As of September 30, 2023, all of our floating rate loans and related financings have transitioned to the applicable replacement benchmark rate, or reference a benchmark rate that is not expected to be replaced.
Refer to “Part I. Item 1A. Risk Factors—Risks Related to Our Lending and Investment Activities—The transition away from reference rates and use of alternative replacement reference rates may adversely affect net interest income related to our loans and investments or otherwise adversely affect our results of operations, cash flows and the market value of our investments” of our Annual Report on Form 10-K filed with the SEC on February 8, 2023.
I. Key Financial Measures and Indicators
As a real estate finance company, we believe the key financial measures and indicators for our business are earnings per share, dividends declared, Distributable Earnings, and book value per share. For the three months ended September 30, 2023, we recorded basic earnings per share of $0.17, declared a dividend of $0.62 per share, and reported $0.78 per share of Distributable Earnings. In addition, our book value as of September 30, 2023 was $25.90 per share, which is net of a $2.76 per share cumulative CECL reserve.
As further described below, Distributable Earnings is a measure that is not prepared in accordance with accounting principles generally accepted in the United States of America, or GAAP, which helps us to evaluate our performance excluding the effects of certain transactions and GAAP adjustments that we believe are not necessarily indicative of our current loan portfolio and operations. In addition, Distributable Earnings is a performance metric we consider when declaring our dividends.
Earnings Per Share and Dividends Declared
The following table sets forth the calculation of basic net income per share and dividends declared per share ($ in thousands, except per share data):
| Three Months Ended | |||||||||||
| September 30, 2023 | June 30, 2023 | ||||||||||
|
Net income
(1)
|
$ | 29,524 | $ | 101,651 | |||||||
| Weighted-average shares outstanding, basic | 172,648,118 | 172,615,385 | |||||||||
| Per share amount, basic | $ | 0.17 | $ | 0.59 | |||||||
| Dividends declared per share | $ | 0.62 | $ | 0.62 | |||||||
(1)
Represents net income attributable to Blackstone Mortgage Trust. Refer to Note 13 to our consolidated financial statements for the calculation of diluted net income per share.
Distributable Earnings
Distributable Earnings is a non-GAAP measure, which we define as GAAP net income (loss), including realized gains and losses not otherwise recognized in current period GAAP net income (loss), and excluding (i) non-cash equity compensation expense, (ii) depreciation and amortization, (iii) unrealized gains (losses), and (iv) certain non-cash items. Distributable Earnings may also be adjusted from time to time to exclude one-time events pursuant to changes in GAAP and certain other non-cash charges as determined by our Manager, subject to approval by a majority of our independent directors. Distributable Earnings mirrors the terms of our management agreement between our Manager and us, or our Management Agreement, for purposes of calculating our incentive fee expense.
49
Our CECL reserve has been excluded from Distributable Earnings consistent with other unrealized gains (losses) pursuant to our existing policy for reporting Distributable Earnings. We expect to only recognize such potential credit losses in Distributable Earnings if and when such amounts are deemed nonrecoverable upon a realization event. This is generally at the time a loan is repaid, or in the case of foreclosure, when the underlying asset is sold, but non-recoverability may also be concluded if, in our determination, it is nearly certain that all amounts due will not be collected. The realized loss amount reflected in Distributable Earnings will equal the difference between the cash received, or expected to be received, and the book value of the asset, and is reflective of our economic experience as it relates to the ultimate realization of the loan.
We believe that Distributable Earnings provides meaningful information to consider in addition to our net income (loss) and cash flow from operating activities determined in accordance with GAAP. We believe Distributable Earnings is a useful financial metric for existing and potential future holders of our class A common stock as historically, over time, Distributable Earnings has been a strong indicator of our dividends per share. As a REIT, we generally must distribute annually at least 90% of our net taxable income, subject to certain adjustments, and therefore we believe our dividends are one of the principal reasons stockholders may invest in our class A common stock. Refer to Note 15 to our consolidated financial statements for further discussion of our distribution requirements as a REIT. Further, Distributable Earnings helps us to evaluate our performance excluding the effects of certain transactions and GAAP adjustments that we believe are not necessarily indicative of our current loan portfolio and operations, and is a performance metric we consider when declaring our dividends.
Distributable Earnings does not represent net income (loss) or cash generated from operating activities and should not be considered as an alternative to GAAP net income (loss), or an indication of our GAAP cash flows from operations, a measure of our liquidity, or an indication of funds available for our cash needs. In addition, our methodology for calculating Distributable Earnings may differ from the methodologies employed by other companies to calculate the same or similar supplemental performance measures, and accordingly, our reported Distributable Earnings may not be comparable to the Distributable Earnings reported by other companies.
The following table provides a reconciliation of Distributable Earnings to GAAP net income ($ in thousands, except per share data):
| Three Months Ended | |||||||||||
| September 30, 2023 | June 30, 2023 | ||||||||||
|
Net income
(1)
|
$ | 29,524 | $ | 101,651 | |||||||
| Increase in current expected credit loss reserve | 96,900 | 27,807 | |||||||||
| Non-cash compensation expense | 7,610 | 7,665 | |||||||||
|
Realized hedging and foreign currency (loss) gain, net
(2)
|
32 | (130) | |||||||||
| Other items | — | 43 | |||||||||
| Adjustments attributable to non-controlling interests, net | 118 | (42) | |||||||||
| Distributable Earnings | $ | 134,184 | $ | 136,994 | |||||||
|
Weighted-average shares outstanding, basic
(3)
|
172,648,118 | 172,615,385 | |||||||||
| Distributable Earnings per share, basic | $ | 0.78 | $ | 0.79 | |||||||
(1)
Represents net income attributable to Blackstone Mortgage Trust.
(2)
Represents realized gains and losses on the repatriation of unhedged foreign currency. These amounts were not included in GAAP net income, but rather as a component of other comprehensive income in our consolidated financial statements.
(3)
The weighted-average shares outstanding, basic, exclude shares issuable from a potential conversion of our Convertible Notes. Consistent with the treatment of other unrealized adjustments to Distributable Earnings, these potentially issuable shares are excluded until a conversion occurs. Refer to Note 13 to our consolidated financial statements for the calculation of diluted net income per share.
50
Book Value Per Share
The following table calculates our book value per share ($ in thousands, except per share data):
| September 30, 2023 | June 30, 2023 | ||||||||||
| Stockholders’ equity | $ | 4,470,870 | $ | 4,540,662 | |||||||
| Shares | |||||||||||
| Class A common stock | 172,296,051 | 172,310,062 | |||||||||
| Deferred stock units | 349,232 | 339,702 | |||||||||
| Total outstanding | 172,645,283 | 172,649,764 | |||||||||
|
Book value per share
(1)
|
$ | 25.90 | $ | 26.30 | |||||||
(1)
The book value per share excludes shares issuable from a potential conversion of our Convertible Notes. Refer to Note 13 to our consolidated financial statements for the calculation of diluted net income per share.
II. Loan Portfolio
Loan fundings during the quarter totaled $440.4 million and loan repayments and sales during the quarter totaled $1.0 billion. We generated interest income of $519.3 million and incurred interest expense of $354.0 million during the quarter, which resulted in $165.4 million of net interest income during the three months ended September 30, 2023.
Portfolio Overview
The following table details our loan origination activity ($ in thousands):
| Three Months Ended September 30, 2023 | Nine Months Ended September 30, 2023 | ||||||||||
|
Loan originations
(1)
|
$ | 50,000 | $ | 50,000 | |||||||
|
Loan fundings
(2)
|
$ | 440,390 | $ | 1,326,880 | |||||||
|
Loan repayments and sales
(3)
|
(1,028,970) | (3,126,516) | |||||||||
| Total net repayments | $ | (588,580) | $ | (1,799,636) | |||||||
(1)
Includes new loan originations and additional commitments made under existing loans.
(2)
Loan fundings during the three and nine months ended September 30, 2023, include $87.0 million and $258.0 million, respectively, of additional fundings under related non-consolidated senior interests.
(3)
Loan repayments and sales during the three and nine months ended September 30, 2023, include $139.4 million and $795.8 million, respectively, of additional repayments or reduction of loan exposure under related non-consolidated senior interests. Additionally, loan repayments and sales during both the three and nine months ended September 30, 2023, include $50.7 million related to the sale of a junior loan interest.
51
The following table details overall statistics for our loan portfolio as of September 30, 2023 ($ in thousands):
|
Balance Sheet
Portfolio |
Loan
Exposure
(1)
|
||||||||||
| Number of investments | 185 | 185 | |||||||||
| Principal balance | $ | 23,849,497 | $ | 24,912,876 | |||||||
| Net book value | $ | 23,252,478 | $ | 23,252,478 | |||||||
|
Unfunded loan commitments
(2)
|
$ | 2,671,851 | $ | 2,671,851 | |||||||
|
Weighted-average cash coupon
(3)
|
+ 3.43 | % | + 3.38 | % | |||||||
|
Weighted-average all-in yield
(3)
|
+ 3.77 | % | + 3.73 | % | |||||||
|
Weighted-average maximum maturity (years)
(4)
|
2.6 | 2.6 | |||||||||
|
Origination loan to value (LTV)
(5)
|
63.8 | % | 64.0 | % | |||||||
(1)
Total loan exposure reflects our aggregate exposure to each loan investment. As of September 30, 2023, total loan exposure, includes (i) loans with an outstanding principal balance of $23.8 billion that are included in our consolidated financial statements, (ii) $1.1 billion of non-consolidated senior interests in loans we have sold, which are not included in our consolidated financial statements, and excludes (iii) $48.8 million of junior loan interests that we have sold, but that remain included in our consolidated financial statements. We have retained an aggregate $280.3 million of subordinate mezzanine loans, as of September 30, 2023, related to non-consolidated senior interests that are included in our balance sheet portfolio.
(2)
Unfunded commitments will primarily be funded to finance our borrowers’ construction or development of real estate-related assets, capital improvements of existing assets, or lease-related expenditures. These commitments will generally be funded over the term of each loan, subject in certain cases to an expiration date. Excludes $417.3 million of unfunded loan commitments related to our non-consolidated senior interests, as these commitments will not require cash outlays from us.
(3)
The weighted-average cash coupon and all-in yield are expressed as a spread over the relevant floating benchmark rates, which include SOFR, SONIA, EURIBOR, and other indices as applicable to each investment. As of September 30, 2023, 99% of our loans by principal balance earned a floating rate of interest, primarily indexed to SOFR, and the remaining 1% of our loans earn a fixed rate of interest. Floating rate exposure includes an interest rate swap with a notional amount of $229.9 million that effectively converts our fixed rate loan exposure to floating rate exposure. In addition to cash coupon, all-in yield includes the amortization of deferred origination and extension fees, loan origination costs, and purchase discounts, as well as the accrual of exit fees. Excludes loans accounted for under the cost-recovery method.
(4)
Maximum maturity assumes all extension options are exercised by the borrower, however our loans and other investments may be repaid prior to such date. As of September 30, 2023,
19% of our loans by total loan exposure were subject to yield maintenance or other prepayment restrictions and 81% were open to repayment by the borrower without penalty.
(5)
Based on LTV as of the dates loans were originated or acquired by us, excluding any junior participations sold.
52
The following table details the index rate floors for our loan portfolio based on total loan exposure as of September 30, 2023 ($ in thousands):
|
Total Loan Exposure
(1)
|
||||||||||||||||||||
| Index Rate Floors | USD |
Non-USD
(2)
|
Total | |||||||||||||||||
| Fixed Rate | $ | 326,972 | $ | — | $ | 326,972 | ||||||||||||||
|
0.00% or no floor
(3)
|
5,066,778 | 6,919,974 | 11,986,752 | |||||||||||||||||
| 0.01% to 1.00% floor | 7,796,251 | 803,299 | 8,599,550 | |||||||||||||||||
| 1.01% to 1.50% floor | 1,305,950 | 153,906 | 1,459,856 | |||||||||||||||||
| 1.51% to 2.00% floor | 1,048,115 | 234,344 | 1,282,459 | |||||||||||||||||
| 2.01% or more floor | 1,257,287 | — | 1,257,287 | |||||||||||||||||
|
Total
(4)
|
$ | 16,801,353 | $ | 8,111,523 | $ | 24,912,876 | ||||||||||||||
(1)
Total loan exposure reflects our aggregate exposure to each loan investment. As of September 30, 2023, total loan exposure, includes (i) loans with an outstanding principal balance of $23.8 billion that are included in our consolidated financial statements, (ii) $1.1 billion of non-consolidated senior interests in loans we have sold, which are not included in our consolidated financial statements, and excludes (iii) $48.8 million of junior loan interests that we have sold, but that remain included in our consolidated financial statements. See Note 2 for further discussion of loan participations sold.
(2)
Includes Euro, British Pound Sterling, Swedish Krona, Australian Dollar, Swiss Franc, and Danish Krone currencies.
(3)
Includes an interest rate swap with a notional amount of $229.9 million that effectively converts our fixed rate loan exposure to floating rate exposure.
(4)
As of September 30, 2023, the weighted-average index rate floor of our total loan exposure was 0.43%. Excluding 0.0% index rate floors and loans with no floor, the weighted-average index rate floor was 0.80%. As of December 31, 2022, the weighted-average index rate floor of our total loan exposure was 0.38%. Excluding 0.0% index rate floors and loans with no floor, the weighted-average index rate floor was 0.65%
The following table details the floating benchmark rates for our loan portfolio based on total loan exposure as of September 30, 2023 (total loan exposure amounts in thousands):
|
Investment
Count
|
Currency |
Total Loan Exposure
(1)
|
Floating Rate Index
(2)
|
Cash Coupon
(3)
|
All-in Yield
(3)
|
|||||||||||||||||||||||||||
| 145 | $ | $ | 16,801,353 |
SOFR
(4)
|
+ 3.22% | + 3.53% | ||||||||||||||||||||||||||
| 10 | € | € | 2,517,025 | EURIBOR | + 3.15% | + 3.60% | ||||||||||||||||||||||||||
| 23 | £ | £ | 2,890,166 | SONIA | + 3.82% | + 4.31% | ||||||||||||||||||||||||||
| 7 | Various | $ | 1,973,357 |
Other
(5)
|
+ 4.14% | + 4.43% | ||||||||||||||||||||||||||
| 185 | $ | 24,912,876 | Applicable Index | + 3.38% | + 3.73% | |||||||||||||||||||||||||||
(1)
Total loan exposure reflects our aggregate exposure to each loan investment. As of September 30, 2023, total loan exposure, includes (i) loans with an outstanding principal balance of $23.8 billion that are included in our consolidated financial statements, (ii) $1.1 billion of non-consolidated senior interests in loans we have sold, which are not included in our consolidated financial statements, and excludes (iii) $48.8 million of junior loan interests that we have sold, but that remain included in our consolidated financial statements. See Note 2 for further discussion of loan participations sold.
(2)
We use foreign currency forward contracts to protect the value or fix the amount of certain investments or cash flows in terms of the U.S. dollar. We earn forward points on our forward contracts that reflect the interest rate differentials between the applicable base rate for our foreign currency investments and prevailing U.S. interest rates. These forward contracts effectively convert the foreign currency rate exposure for such investments to USD-equivalent interest rates.
(3)
In addition to cash coupon, all-in yield includes the amortization of deferred origination and extension fees, loan origination costs, and purchase discounts, as well as the accrual of exit fees. Excludes loans accounted for under the cost-recovery method.
(4)
Includes an interest rate swap with a notional amount of $229.9 million that effectively converts our fixed rate loan exposure to floating rate exposure.
(5)
Includes floating rate loans indexed to STIBOR, BBSY, SARON, and CIBOR indices.
53
The charts below detail the geographic distribution and types of properties securing our loan portfolio, as of September 30, 2023:
Collateral Diversification
(Net Loan Exposure,
(1)
% of Total)
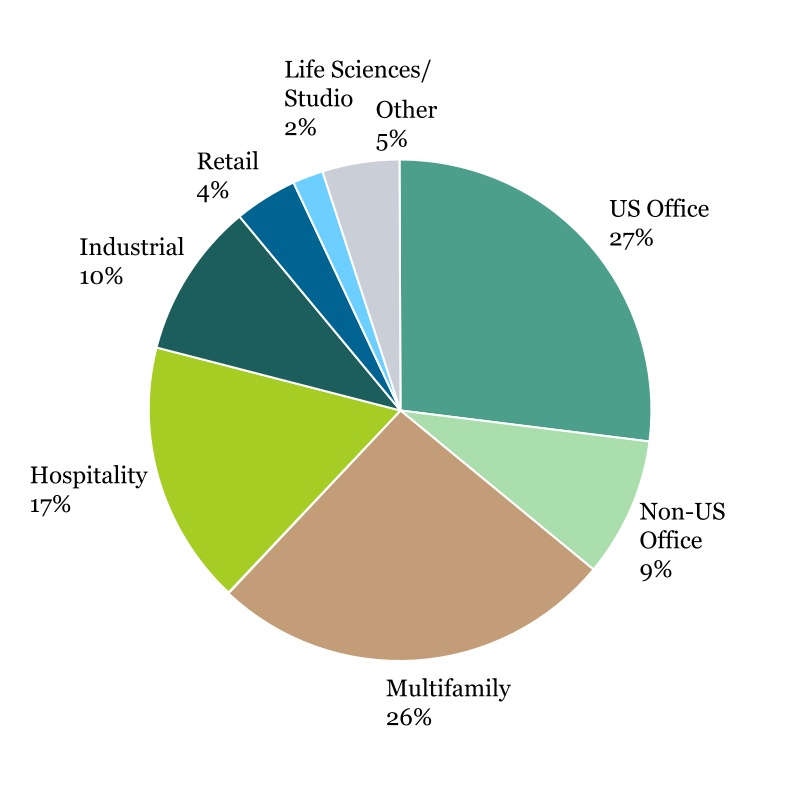
Geographic Diversification
(Net Loan Exposure,
(1)
% of Total)
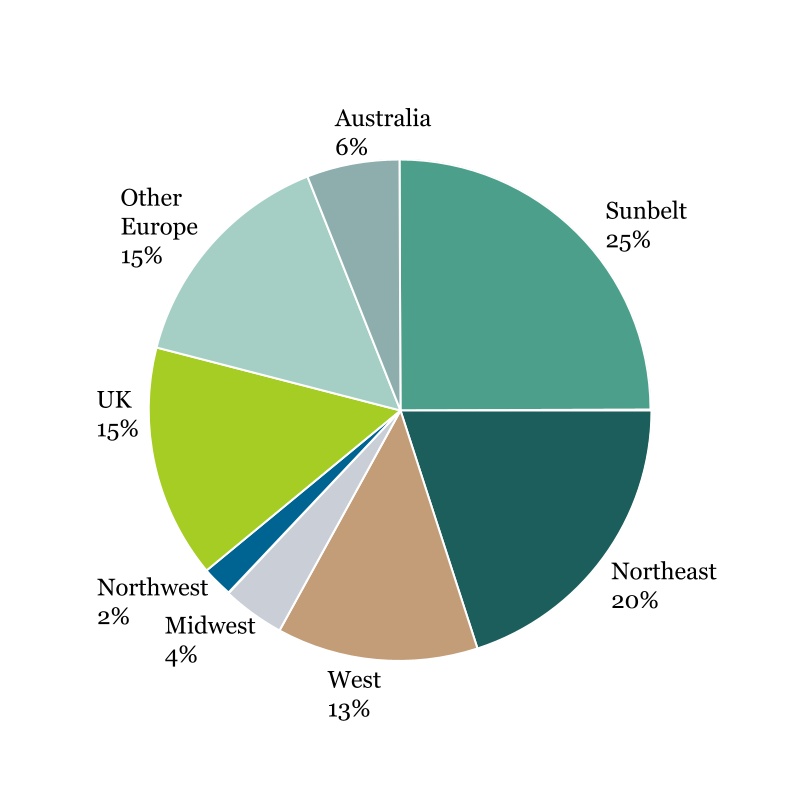
______________
(1)
Net loan exposure reflects the amount of each loan that is subject to risk of credit loss to us as of September 30, 2023, which is our total loan exposure net of (i) $1.1 billion of non-consolidated senior interests, (ii) $935.4 million of asset-specific debt, (iii) $226.9 million of senior loan participations sold, (iv) $40.7 million of cost-recovery proceeds, and (v) our total loans receivable CECL reserve of $463.4 million. Our non-consolidated senior interests, asset-specific debt, and loan participations sold are structurally non-recourse and term-matched to the corresponding collateral loans.
Refer to section VI of this Item 2 for details of our loan portfolio, on a loan-by-loan basis.
Portfolio Management
During the three months ended September 30, 2023,
all borrowers were compliant with the contractual terms of each respective loan, with limited interest deferrals. We believe this demonstrates the overall strength of our loan portfolio and the commitment and financial wherewithal of our borrowers generally, which are primarily affiliated with large real estate private equity funds and other strong, well-capitalized, and experienced sponsors.
We maintain a robust asset management relationship with our borrowers and utilize these relationships to maximize the performance of our portfolio, including during periods of volatility. We believe that we benefit from these relationships and from our long-standing core business model of originating senior loans collateralized by large assets in major markets with experienced, well-capitalized institutional sponsors. Our loan portfolio’s low weighted-average origination LTV of 64.0%, excluding any junior participations sold, as of September 30, 2023 reflects significant equity value that we expect our sponsors will be motivated to protect through periods of cyclical disruption. While we believe the principal amounts of our loans are generally adequately protected by underlying collateral value, there is a risk that we will not realize the entire principal value of certain investments. As of September 30, 2023, we had an aggregate $322.6 million asset-specific CECL
54
reserve related to ten of our loans receivable, with an aggregate amortized cost basis of $1.4 billion, net of cost-recovery proceeds. This CECL reserve was recorded based on our estimation of the fair value of each of the loan's underlying collateral as of September 30, 2023.
Our portfolio monitoring and asset management operations benefit from the deep knowledge, experience, and information advantages derived from our position as part of Blackstone’s real estate platform. Blackstone has built the world's preeminent global real estate business, with a proven track record of successfully navigating market cycles and emerging stronger through periods of volatility. The market-leading real estate expertise derived from the strength of the Blackstone platform deeply informs our credit and underwriting process, and gives us the tools to expertly asset manage our portfolio and work with our borrowers throughout periods of economic stress and uncertainty.
As discussed in Note 2 to our consolidated financial statements, we perform a quarterly review of our loan portfolio, assesses the performance of each loan, and assigns it a risk rating between “1” and “5,” from less risk to greater risk. Our loan portfolio had a weighted-average risk rating of 2.9 as of both September 30, 2023 and December 31, 2022.
The following table allocates the net book value, total loan exposure, and net loan exposure balances based on our internal risk ratings ($ in thousands):
| September 30, 2023 | ||||||||||||||||||||||||||
| Risk Rating |
Number
of Loans |
Net Book Value |
Total Loan
Exposure
(1)
|
Net Loan
Exposure
(2)
|
||||||||||||||||||||||
| 1 | 15 | $ | 763,494 | $ | 812,060 | $ | 764,174 | |||||||||||||||||||
| 2 | 40 | 6,102,290 | 6,578,639 | 5,105,664 | ||||||||||||||||||||||
| 3 | 107 | 12,493,474 | 13,120,942 | 12,281,191 | ||||||||||||||||||||||
| 4 | 13 | 2,965,121 | 2,967,865 | 2,913,093 | ||||||||||||||||||||||
| 5 | 10 | 1,391,522 | 1,433,370 | 1,070,087 | ||||||||||||||||||||||
| Loans receivable | 185 | $ | 23,715,901 | $ | 24,912,876 | $ | 22,134,209 | |||||||||||||||||||
| CECL reserve | (463,423) | |||||||||||||||||||||||||
| Loans receivable, net | $ | 23,252,478 | ||||||||||||||||||||||||
(1)
Total loan exposure reflects our aggregate exposure to each loan investment. As of September 30, 2023, total loan exposure, includes (i) loans with an outstanding principal balance of $23.8 billion that are included in our consolidated financial statements, (ii) $1.1 billion of non-consolidated senior interests in loans we have sold, which are not included in our consolidated financial statements, and excludes (iii) $48.8 million of junior loan interests that we have sold, but that remain included in our consolidated financial statements. See Note 2 for further discussion of loan participations sold.
(2)
Net loan exposure reflects the amount of each loan that is subject to risk of credit loss to us as of September 30, 2023, which is our total loan exposure net of (i) $1.1 billion of non-consolidated senior interests, (ii) $935.4 million of asset-specific debt, (iii) $226.9 million of senior loan participations sold, (iv) $40.7 million of cost-recovery proceeds, and (v) our total loans receivable CECL reserve of $463.4 million. Our non-consolidated senior interests, asset-specific debt, and loan participations sold are structurally non-recourse and term-matched to the corresponding collateral loans.
Current Expected Credit Loss Reserve
The CECL reserve required by GAAP reflects our current estimate of potential credit losses related to our loans included in our consolidated balance sheets. Other than a few narrow exceptions, GAAP requires that all financial instruments subject to the CECL model have some amount of loss reserve to reflect the principle underlying the CECL model that all loans and similar assets have some inherent risk of loss, regardless of credit quality, subordinate capital, or other mitigating factors.
During the three months ended September 30, 2023, we recorded an increase of $99.5 million in the CECL reserve against our loans receivable portfolio, bringing our total loans receivable CECL reserve to $463.4 million as of September 30, 2023. This CECL reserve reflects certain loans assessed for impairment in our portfolio, as well as macroeconomic conditions.
During the three months ended September 30, 2023, we recorded an aggregate net increase of $108.2 million in the asset-specific CECL reserve related to our impaired loans. The increase was primarily driven by three additional loans that were impaired during the three months ended September 30, 2023. As of September 30, 2023, the income accrual was suspended
55
on these loans as recovery of income and principal was doubtful. During the three months ended September 30, 2023, we recorded $7.2 million of interest income on these three loans.
As of September 30, 2023, we had an aggregate $322.6 million asset-specific CECL reserve related to ten of our loans receivable, with an aggregate amortized cost basis of $1.4 billion, net of cost-recovery proceeds. This CECL reserve was recorded based on our estimation of the fair value of each of the loan's underlying collateral as of September 30, 2023. No income was recorded on our impaired loans subsequent to determining that they were impaired. As of September 30, 2023, all such borrowers were compliant with the contractual terms of each respective loan, including any required payment of interest. During the three months ended September 30, 2023, we received an aggregate $10.2 million of cash proceeds from such loans that were applied as a reduction to the amortized cost basis of each respective loan. Refer to Note 2 for further discussion of our revenue recognition and CECL reserve policies.
Multifamily Joint Venture
As of September 30, 2023, our Multifamily Joint Venture held $639.2 million of loans, which are included in the loan disclosures above. Refer to Note 2 to our consolidated financial statements for additional discussion of our Multifamily Joint Venture.
Portfolio Financing
Our portfolio financing consists of secured debt, securitizations, and asset-specific debt. The following table details our portfolio financing ($ in thousands):
|
Portfolio Financing
Outstanding Principal Balance
|
|||||||||||
| September 30, 2023 | December 31, 2022 | ||||||||||
| Secured debt | $ | 12,809,913 | $ | 13,549,748 | |||||||
| Securitizations | 2,512,511 | 2,673,541 | |||||||||
| Asset-specific debt | 935,435 | 950,278 | |||||||||
| Total portfolio financing | $ | 16,257,859 | $ | 17,173,567 | |||||||
Secured Debt
The following table details our outstanding secured debt ($ in thousands):
|
Secured Debt
Borrowings Outstanding |
|||||||||||
| September 30, 2023 | December 31, 2022 | ||||||||||
| Secured credit facilities | $ | 12,809,913 | $ | 13,549,748 | |||||||
| Acquisition facility | — | — | |||||||||
| Total secured debt | $ | 12,809,913 | $ | 13,549,748 | |||||||
56
Secured Credit Facilities
The following table details our secured credit facilities by spread over the applicable base rates as of September 30, 2023 ($ in thousands):
| Nine Months Ended September 30, 2023 | September 30, 2023 | |||||||||||||||||||||||||||||||||||||||||||
|
Spread
(1)
|
New Financings
(2)
|
Total
Borrowings
|
Wtd. Avg.
All-in Cost
(1)(3)(4)
|
Collateral
(5)
|
Wtd. Avg.
All-in Yield
(1)(3)
|
Net Interest
Margin
(6)
|
||||||||||||||||||||||||||||||||||||||
|
+ 1.50% or less
|
$ | — | $ | 5,625,471 | +1.53 | % | $ | 8,308,855 | +3.27 | % | +1.74 | % | ||||||||||||||||||||||||||||||||
|
+ 1.51% to + 1.75%
|
$ | — | 2,794,848 | +1.82 | % | 3,902,545 | +3.57 | % | +1.75 | % | ||||||||||||||||||||||||||||||||||
|
+ 1.76% to + 2.00%
|
$ | — | 1,912,045 | +2.13 | % | 2,974,091 | +4.01 | % | +1.88 | % | ||||||||||||||||||||||||||||||||||
|
+ 2.01% or more
|
66,924 | 2,477,549 | +2.61 | % | 3,427,740 | +4.62 | % | +2.01 | % | |||||||||||||||||||||||||||||||||||
| Total | $ | 66,924 | $ | 12,809,913 | +1.89 | % | $ | 18,613,231 | +3.69 | % | +1.80 | % | ||||||||||||||||||||||||||||||||
(1)
The spread, all-in cost, and all-in yield are expressed over the relevant floating benchmark rates, which include SOFR, SONIA, EURIBOR, and other indices as applicable.
(2)
Represents borrowings outstanding as of September 30, 2023 for new financings closed during the nine months ended September 30, 2023.
(3)
In addition to spread, the cost includes the associated deferred fees and expenses related to the respective borrowings. In addition to cash coupon, all-in yield includes the amortization of deferred origination and extension fees, loan origination costs, and purchase discounts, as well as the accrual of exit fees. Excludes loans accounted for under the cost-recovery method.
(4)
Represents the weighted-average all-in cost as of September 30, 2023 and is not necessarily indicative of the spread applicable to recent or future borrowings.
(5)
Represents the principal balance of the collateral assets.
(6)
Represents the difference between the weighted-average all-in yield and weighted-average all-in cost.
Acquisition Facility
We have a $100.0 million full recourse secured credit facility that is designed to finance eligible first mortgage originations for up to nine months as a bridge to term financing without obtaining discretionary lender approval. The cost of borrowing under the facility is variable, dependent on the type of loan collateral, and its maturity date is April 3, 2024. As of September 30, 2023, we had no assets pledged to our acquisition facility and no outstanding borrowings.
57
Securitizations
Securitized Debt Obligations
We have financed certain pools of our loans through collateralized loan obligations, or CLOs. The following table details our securitized debt obligations and the underlying collateral assets that are financed by our CLOs ($ in thousands):
| September 30, 2023 | ||||||||||||||||||||||||||||||||
| Securitized Debt Obligations | Count |
Principal
Balance
|
Book
Value
|
Wtd. Avg.
Yield/Cost
(1)(2)
|
Term
(3)
|
|||||||||||||||||||||||||||
| 2021 FL4 Collateralized Loan Obligation | ||||||||||||||||||||||||||||||||
| Senior CLO Securities Outstanding | 1 | $ | 803,750 | $ | 801,392 | + 1.69 | % | May 2038 | ||||||||||||||||||||||||
| Underlying Collateral Assets | 27 | 1,000,000 | 1,000,000 | + 3.35 | % | December 2025 | ||||||||||||||||||||||||||
| 2020 FL3 Collateralized Loan Obligation | ||||||||||||||||||||||||||||||||
| Senior CLO Securities Outstanding | 1 | 716,342 | 716,284 | + 2.18 | % | November 2037 | ||||||||||||||||||||||||||
| Underlying Collateral Assets | 15 | 907,592 | 907,592 | + 3.04 | % | May 2025 | ||||||||||||||||||||||||||
| 2020 FL2 Collateralized Loan Obligation | ||||||||||||||||||||||||||||||||
| Senior CLO Securities Outstanding | 1 | 992,419 | 991,578 | + 1.57 | % | February 2038 | ||||||||||||||||||||||||||
| Underlying Collateral Assets | 16 | 1,249,294 | 1,249,294 | + 3.25 | % | May 2025 | ||||||||||||||||||||||||||
| Total | ||||||||||||||||||||||||||||||||
|
Senior CLO Securities Outstanding
(4)
|
3 | $ | 2,512,511 | $ | 2,509,254 | + 1.78 | % | |||||||||||||||||||||||||
| Underlying Collateral Assets | 58 | $ | 3,156,886 | $ | 3,156,886 | + 3.21 | % | |||||||||||||||||||||||||
(1)
In addition to cash coupon, all-in yield includes the amortization of deferred origination and extension fees, loan origination costs, purchase discounts, and accrual of exit fees.
(2)
The weighted-average all-in yield and cost are expressed as a spread over SOFR, which is the relevant floating benchmark rate for each securitized debt obligation. Excludes loans accounted for under the cost-recovery method.
(3)
Underlying Collateral Assets term represents the weighted-average final maturity of such loans, assuming all extension options are exercised by the borrower. Repayments of securitized debt obligations are tied to timing of the related collateral loan asset repayments. The term of these obligations represents the rated final distribution date of the securitizations.
(4)
During the three and nine months ended September 30, 2023, we recorded $44.5 million and $127.6 million, respectively, of interest expense related to our securitized debt obligations.
Refer to Note 6 and Note 18 to our consolidated financial statements for additional details of our securitized debt obligations.
58
Asset-Specific Debt
The following table details our asset-specific debt ($ in thousands):
| September 30, 2023 | ||||||||||||||||||||||||||||||||
| Asset-Specific Debt | Count |
Principal
Balance
|
Book Value |
Wtd. Avg.
Yield/Cost
(1)
|
Wtd. Avg.
Term
(2)
|
|||||||||||||||||||||||||||
| Financing provided | 2 | $ | 935,435 | $ | 930,757 | + 3.13 | % | February 2026 | ||||||||||||||||||||||||
| Collateral assets | 2 | $ | 1,111,453 | $ | 1,102,848 | + 3.95 | % | February 2026 | ||||||||||||||||||||||||
(1)
These floating rate loans and related liabilities are currency and index-matched to the applicable benchmark rate relevant in each arrangement. In addition to cash coupon, yield/cost includes the amortization of deferred origination fees and financing costs.
(2)
The weighted-average term is determined based on the maximum maturity of the corresponding loans, assuming all extension options are exercised by the borrower. Our non-recourse, asset-specific debt is term-matched in each case to the corresponding collateral loans.
Corporate Financing
The following table details our outstanding corporate financing ($ in thousands):
|
Corporate Financing
Outstanding Principal Balance |
|||||||||||
| September 30, 2023 | December 31, 2022 | ||||||||||
| Term loans | $ | 2,140,720 | $ | 2,157,218 | |||||||
| Senior secured notes | 366,590 | 400,000 | |||||||||
| Convertible notes | 300,000 | 520,000 | |||||||||
| Total corporate financing | $ | 2,807,310 | $ | 3,077,218 | |||||||
Term Loans
As of September 30, 2023, the following senior term loan facilities, or Term Loans, were outstanding ($ in thousands):
| Term Loans | Face Value |
Interest Rate
(1)
|
All-in Cost
(1)(2)
|
Maturity | ||||||||||||||||||||||
| B-1 Term Loan | $ | 913,230 | + 2.36 | % | + 2.65 | % | April 23, 2026 | |||||||||||||||||||
| B-3 Term Loan | $ | 411,998 | + 2.86 | % | + 3.54 | % | April 23, 2026 | |||||||||||||||||||
| B-4 Term Loan | $ | 815,492 | + 3.50 | % | + 4.11 | % | May 9, 2029 | |||||||||||||||||||
(1)
The B-3 Term Loan and the B-4 Term Loan borrowings are subject to a floor of 0.50%. The Term Loans are indexed to one-month SOFR.
(2)
Includes issue discount and transaction expenses that are amortized through interest expense over the life of the Term Loans.
Refer to Note 2 and Note 9 to our consolidated financial statements for additional discussion of our Term Loans.
Senior Secured Notes
During the three months ended September 30, 2023, we repurchased an aggregate principal amount of $33.4 million of the Senior Secured Notes at a weighted-average price of 85%. This resulted in a gain on extinguishment of debt of $4.5 million during both the three and nine months ended September 30, 2023.
59
As of September 30, 2023, the following Senior Secured Notes, were outstanding ($ in thousands):
| Senior Secured Notes | Face Value | Interest Rate |
All-in Cost
(1)
|
Maturity | ||||||||||||||||||||||
| Senior Secured Notes | $ | 366,590 | 3.75 | % | 4.02 | % | January 15, 2027 | |||||||||||||||||||
(1)
Includes transaction expenses that are amortized through interest expense over the life of the Senior Secured Notes.
Refer to Note 2 and Note 10 to our consolidated financial statements for additional discussion of our Senior Secured Notes.
Convertible Notes
As of September 30, 2023 the following convertible senior notes, or Convertible Notes, were outstanding ($ in thousands):
| Convertible Notes Issuance | Face Value |
Interest Rate
|
All-in Cost
(1)
|
Conversion Price
(2)
|
Maturity | |||||||||||||||||||||||||||
| March 2022 | $ | 300,000 | 5.50 | % | 5.94 | % | $36.27 | March 15, 2027 | ||||||||||||||||||||||||
(1)
Includes issuance costs that are amortized through interest expense over the life of the Convertible Notes using the effective interest method.
(2)
Represents the price of class A common stock per share based on a conversion rate of 27.5702 for the March 2022 convertible notes. The conversion rate represents the number of shares of class A common stock issuable per $1,000 principal amount of Convertible Notes. The cumulative dividend threshold as defined in the March 2022 convertible notes supplemental indenture has not been exceeded as of September 30, 2023.
Refer to Note 2 and Note 11 to our consolidated financial statements for additional discussion of our Convertible Notes.
Floating Rate Portfolio
Generally, our business model is such that rising interest rates will increase our net income, while declining interest rates will decrease net income. As of September 30, 2023, 99% of our loans by total loan exposure earned a floating rate of interest and were financed with liabilities that pay interest at floating rates, which resulted in an amount of net equity that is positively correlated to rising interest rates, subject to the impact of interest rate floors on certain of our floating rate loans.
Our liabilities are generally currency and index-matched to each collateral asset, resulting in a net exposure to movements in benchmark rates that varies by currency silo based on the relative proportion of floating rate assets and liabilities.
The following table details our investment portfolio’s exposure to interest rates by currency as of September 30, 2023 (amounts in thousands):
|
USD
|
GBP
|
EUR
|
All Other
(1)
|
||||||||||||||||||||
|
Floating rate loans
(2)(3)(4)
|
$ | 15,362,205 | £ | 2,664,166 | € | 2,517,025 | $ | 1,973,357 | |||||||||||||||
|
Floating rate debt
(2)(4)(5)
|
(12,465,258) | (1,960,364) | (1,876,023) | (1,558,353) | |||||||||||||||||||
| Net floating rate exposure | $ | 2,896,947 | £ | 703,802 | € | 641,002 | $ | 415,004 | |||||||||||||||
|
Net floating rate exposure in USD
(6)
|
$ | 2,896,947 | $ | 858,567 | $ | 677,730 | $ | 415,004 | |||||||||||||||
(1)
Includes Australian Dollar, Danish Krone, Swedish Krona, and Swiss Franc currencies.
(2)
Our floating rate loans and related liabilities are currency and index-matched to the applicable benchmark rate relevant in each arrangement.
(3)
Includes an interest rate swap with a notional amount of $229.9 million that effectively converts our fixed rate loan exposure to floating rate exposure.
(4)
Excludes $1.1 billion of non-consolidated senior interests and $275.7 million of loan participations sold, as of September 30, 2023. Our non-consolidated senior interests and loan participations sold are structurally non-recourse and term-matched to the corresponding loans, and have no impact on our net floating rate exposure
.
(5)
Includes amounts outstanding under secured debt, securitizations, asset-specific debt, and term loans.
(6)
Represents the U.S. dollar equivalent as of September 30, 2023.
60
III. Our Results of Operations
Operating Results
The following table sets forth information regarding our consolidated results of operations for the three months ended September 30, 2023 and June 30, 2023 ($ in thousands, except per share data):
| Three Months Ended | Change | ||||||||||||||||
| September 30, 2023 | June 30, 2023 | $ | |||||||||||||||
| Income from loans and other investments | |||||||||||||||||
| Interest and related income | $ | 519,342 | $ | 521,892 | $ | (2,550) | |||||||||||
| Less: Interest and related expenses | 353,972 | 344,549 | 9,423 | ||||||||||||||
| Income from loans and other investments, net | 165,370 | 177,343 | (11,973) | ||||||||||||||
| Other expenses | |||||||||||||||||
| Management and incentive fees | 28,882 | 32,815 | (3,933) | ||||||||||||||
| General and administrative expenses | 12,001 | 13,022 | (1,021) | ||||||||||||||
| Total other expenses | 40,883 | 45,837 | (4,954) | ||||||||||||||
| Increase in current expected credit loss reserve | (96,900) | (27,807) | (69,093) | ||||||||||||||
| Gain on extinguishment of debt | 4,541 | — | 4,541 | ||||||||||||||
| Income before income taxes | 32,128 | 103,699 | (71,571) | ||||||||||||||
| Income tax provision | 1,568 | 1,202 | 366 | ||||||||||||||
| Net Income | 30,560 | 102,497 | (71,937) | ||||||||||||||
| Net income attributable to non-controlling interests | (1,036) | (846) | (190) | ||||||||||||||
| Net income attributable to Blackstone Mortgage Trust, Inc. | $ | 29,524 | $ | 101,651 | $ | (72,127) | |||||||||||
| Net income per share of common stock | |||||||||||||||||
| Basic | $ | 0.17 | $ | 0.59 | $ | (0.42) | |||||||||||
| Diluted | $ | 0.17 | $ | 0.58 | $ | (0.41) | |||||||||||
| Weighted-average shares of common stock outstanding | |||||||||||||||||
| Basic | 172,648,118 | 172,615,385 | 32,733 | ||||||||||||||
| Diluted | 172,648,118 | 180,886,445 | (8,238,327) | ||||||||||||||
| Dividends declared per share | $ | 0.62 | $ | 0.62 | $ | — | |||||||||||
Income from loans and other investments, net
Income from loans and other investments, net decreased $12.0 million during the three months ended September 30, 2023 compared to the three months ended June 30, 2023. The decrease was primarily due to (i) a decrease in the weighted-average principal balance of our loan portfolio by $659.8 million for the three months ended September 30, 2023 compared to the three months ended June 30, 2023 and (ii) a decline in interest income related to an additional loan accounted for under the cost-recovery method effective June 30, 2023. This was offset by a decrease in the weighted-average principal balance of our outstanding financing arrangements by $715.7 million for the three months ended September 30, 2023 compared to the three months ended June 30, 2023.
Other expenses
Other expenses include management and incentive fees payable to our Manager and general and administrative expenses. Other expenses decreased by $5.0 million during the three months ended September 30, 2023 compared to the three months ended June 30, 2023 primarily due to a decrease of (i) $4.0 million of incentive fees payable to our Manager and (ii) $966,000 of general operating expenses.
Changes in current expected credit loss reserve
During the three months ended September 30, 2023, we recorded a $96.9 million increase in the CECL reserve, as compared to a $27.8 million increase during the three months ended June 30, 2023. This CECL reserve reflects certain
61
loans assessed for impairment in our portfolio, as well as macroeconomic conditions. See Notes 2 and 3 to our consolidated financial statements for further discussion of our CECL reserve.
Gain on extinguishment of debt
During the three months ended September 30, 2023, we recognized a gain on extinguishment of debt of $4.5 million related to the repurchase of an aggregate principal amount of $33.4 million of our Senior Secured Notes. There was no repurchase activity in the three months ended June 30, 2023.
Dividends per share
During the three months ended September 30, 2023, we declared aggregate dividends of $0.62 per share, or $106.8 million. During the three months ended June 30, 2023, we declared aggregate dividends of $0.62 per share, or $106.8 million.
The following table sets forth information regarding our consolidated results of operations for the nine months ended September 30, 2023 and 2022 ($ in thousands, except per share data):
| Nine Months Ended | Change | ||||||||||||||||
| September 30, 2023 | September 30, 2022 | $ | |||||||||||||||
| Income from loans and other investments | |||||||||||||||||
| Interest and related income | $ | 1,532,618 | $ | 876,676 | $ | 655,942 | |||||||||||
| Less: Interest and related expenses | 1,015,718 | 439,708 | 576,010 | ||||||||||||||
| Income from loans and other investments, net | 516,900 | 436,968 | 79,932 | ||||||||||||||
| Other expenses | |||||||||||||||||
| Management and incentive fees | 92,747 | 76,462 | 16,285 | ||||||||||||||
| General and administrative expenses | 37,888 | 37,701 | 187 | ||||||||||||||
| Total other expenses | 130,635 | 114,163 | 16,472 | ||||||||||||||
| Increase in current expected credit loss reserve | (134,530) | (22,694) | (111,836) | ||||||||||||||
| Gain on extinguishment of debt | 4,541 | — | 4,541 | ||||||||||||||
| Income before income taxes | 256,276 | 300,111 | (43,835) | ||||||||||||||
| Income tax provision | 4,663 | 2,064 | 2,599 | ||||||||||||||
| Net Income | 251,613 | 298,047 | (46,434) | ||||||||||||||
| Net income attributable to non-controlling interests | (2,681) | (1,864) | (817) | ||||||||||||||
| Net income attributable to Blackstone Mortgage Trust, Inc. | $ | 248,932 | $ | 296,183 | $ | (47,251) | |||||||||||
| Net income per share of common stock | |||||||||||||||||
| Basic | $ | 1.44 | $ | 1.74 | $ | (0.30) | |||||||||||
| Diluted | $ | 1.44 | $ | 1.71 | $ | (0.27) | |||||||||||
| Weighted-average shares of common stock outstanding | |||||||||||||||||
| Basic | 172,620,799 | 170,303,470 | 2,317,329 | ||||||||||||||
| Diluted | 180,891,859 | 182,011,842 | (1,119,983) | ||||||||||||||
| Dividends declared per share | $ | 1.86 | $ | 1.86 | $ | — | |||||||||||
Income from loans and other investments, net
Income from loans and other investments, net increased $79.9 million during the nine months ended September 30, 2023 compared to the nine months ended September 30, 2022. The increase was primarily due to (i) an increase in floating rate indices during the nine months ended September 30, 2023 compared to the nine months ended September 30, 2022, and (ii) an increase in the weighted-average principal balance of our loan portfolio by $835.7 million for the nine months ended September 30, 2023, as compared to the nine months ended September 30, 2022. This was offset by (i) an increase in the weighted-average principal balance of our outstanding financing arrangements by $821.0 million for the nine months
62
ended September 30, 2023, as compared to the nine months ended September 30, 2022 and (ii) a decline in interest income related to an additional four loans accounted for under the cost-recovery method effective December 31, 2022.
Other expenses
Other expenses increased by $16.5 million during the nine months ended September 30, 2023 compared to the nine months ended September 30, 2022 due to an increase of (i) $14.9 million of incentive fees payable to our Manager, due to an increase in Distributable Earnings, (ii) $2.5 million of general operating expenses, and (iii) $1.4 million of management fees payable to our Manager, primarily as a result of an increase in equity. This was offset by a reduction in non-cash restricted stock amortization of $2.4 million related to shares awarded under our long-term incentive plans.
Changes in current expected credit loss reserve
During the nine months ended September 30, 2023, we recorded a $134.5 million increase in the CECL reserve, as compared to a $22.7 million increase during the nine months ended September 30, 2022. This CECL reserve reflects certain loans assessed for impairment in our portfolio, as well as macroeconomic conditions.
Gain on extinguishment of debt
During the nine months ended September 30, 2023, we recognized a gain on extinguishment of debt of $4.5 million related to the repurchase of an aggregate principal amount of $33.4 million of our Senior Secured Notes. There was no repurchase activity in the nine months ended September 30, 2022.
Dividends per share
During the nine months ended September 30, 2023, we declared aggregate dividends of $1.86 per share, or $320.5 million. During the nine months ended September 30, 2022, we declared aggregate dividends of $1.86 per share, or $317.1 million.
IV. Liquidity and Capital Resources
Capitalization
We have capitalized our business to date primarily through the issuance and sale of shares of our class A common stock, corporate debt, and asset-level financings. As of September 30, 2023, our capitalization structure included
$4.5
billion of common equity, $2.8 billion of corporate debt, and $16.3 billion of asset-level financings. Our $2.8 billion of corporate debt includes $2.1 billion of term loan borrowings, $366.6 million of senior secured notes, and $300.0 million of convertible notes. Our $16.3 billion of asset-level financings includes $12.8 billion of secured debt, $2.5 billion of securitizations, and $935.4 million of asset-specific debt, all of which are structured to produce term, currency, and index matched funding with no margin call provisions based upon capital markets events.
As of September 30, 2023, we have $1.8 billion of liquidity that can be used to satisfy our short-term cash requirements and as working capital for our business.
See Notes 5, 6, 7, 8, 9, 10, and 11 to our co
nsolidated financial statements for additional details regarding our secured debt, securitized debt obligations, asset-specific debt, loan participations sold, Term Loans, Senior Secured Notes, and Convertible Notes, respectively.
63
Debt-to-Equity Ratio and Total Leverage Ratio
The following table presents our debt-to-equity ratio and total leverage ratio:
| September 30, 2023 | December 31, 2022 | ||||||||||
|
Debt-to-equity ratios
(1)
|
|||||||||||
|
Debt-to-equity ratio
(2)
|
3.6x | 3.8x | |||||||||
|
Adjusted debt-to-equity ratio
(3)
|
3.2x | 3.5x | |||||||||
|
Total leverage ratios
(1)
|
|||||||||||
|
Total leverage ratio
(4)
|
4.1x | 4.4x | |||||||||
|
Adjusted total leverage ratio
(5)
|
3.8x | 4.1x | |||||||||
(1)
The debt and leverage amounts included in the calculations above use gross outstanding principal balances, excluding any unamortized deferred financing costs and discounts.
(2)
Represents, in each case at period end, (i) total outstanding secured debt, asset-specific debt, term loans, senior secured notes, and convertible notes, less cash, to (ii) total equity.
(3)
Represents, in each case at period end, (i) total outstanding secured debt, asset-specific debt, term loans, senior secured notes, and convertible notes, less cash, to (ii) Adjusted Equity. Refer below for the reconciliation of Adjusted Equity to total equity.
(4)
Represents, in each case at period end, (i) total outstanding secured debt, securitizations, asset-specific debt, term loans, senior secured notes, and convertible notes, less cash, to (ii) total equity.
(5)
Represents, in each case at period end, (i) total outstanding secured debt, securitizations, asset-specific debt, term loans, senior secured notes, and convertible notes, less cash, to (ii) Adjusted Equity. Refer below for the reconciliation of Adjusted Equity to total equity.
Adjusted Debt-to-Equity Ratio and Adjusted Total Leverage Ratio
Our adjusted debt-to-equity and total leverage ratios are measures that are not prepared in accordance with GAAP, as they are calculated using Adjusted Equity, which we define as our total equity, excluding the aggregate CECL reserve on our loans receivable and unfunded loan commitments.
We believe that Adjusted Equity provides meaningful information to consider in addition to our total equity determined in accordance with GAAP in the context of assessing our debt-to-equity and total leverage ratios. The adjusted debt-to-equity and total leverage ratios are metrics we use, in addition to our unadjusted debt-to-equity and total leverage ratios, when evaluating our capitalization structure, as Adjusted Equity excludes the unrealized impact of our CECL reserve, which may vary from quarter-to-quarter as our loan portfolio changes and market and economic conditions evolve. We believe these ratios, and therefore our Adjusted Equity, are useful financial metrics for existing and potential future holders of our class A common stock to consider when evaluating how our business is capitalized and the relative amount of leverage in our business.
Adjusted Equity does not represent our total equity and should not be considered as an alternate to GAAP total equity. In addition, our methodology for calculating Adjusted Equity may differ from methodologies employed by other companies to calculate the same or similar supplemental measures, and accordingly, our reported Adjusted Equity may not be comparable to the Adjusted Equity reported by other companies.
The following table provides a reconciliation of Adjusted Equity to our GAAP total equity ($ in thousands):
| September 30, 2023 | December 31, 2022 | ||||||||||
|
Total equity
|
$ | 4,493,521 | $ | 4,544,200 | |||||||
|
Add back: aggregate CECL reserve
|
477,047 | 342,517 | |||||||||
| Adjusted Equity | $ | 4,970,568 | $ | 4,886,717 | |||||||
64
Sources of Liquidity
Our primary sources of liquidity include cash and cash equivalents, available borrowings under our secured debt facilities, and net receivables from servicers related to loan repayments, which are set forth in the following table ($ in thousands):
| September 30, 2023 | December 31, 2022 | ||||||||||
| Cash and cash equivalents | $ | 421,495 | $ | 291,340 | |||||||
| Available borrowings under secured debt | 1,343,881 | 1,536,638 | |||||||||
|
Loan principal payments held by servicer, net
(1)
|
12,713 | 7,425 | |||||||||
| $ | 1,778,089 | $ | 1,835,403 | ||||||||
(1)
Represents loan principal payments held by our third-party servicer as of the balance sheet date which were remitted to us during the subsequent remittance cycle, net of the related secured debt balance.
During the nine months ended September 30, 2023, we generated cash flow from operating activities of $349.1 million and received $2.3 billion from loan principal collections and sales proceeds. Furthermore, we are able to generate incremental liquidity through the replenishment provisions of certain of our CLOs, which allow us to replace a repaid loan in the CLO by increasing the principal amount of existing CLO collateral assets to maintain the aggregate amount of collateral assets in the CLO, and the related financing outstanding.
We have access to further liquidity through public offerings of debt and equity securities. To facilitate such offerings, in July 2022, we filed a shelf registration statement with the SEC that is effective for a term of three years and expires in July 2025. The amount of securities to be issued pursuant to this shelf registration statement was not specified when it was filed and there is no specific dollar limit on the amount of securities we may issue. The securities covered by this registration statement include: (i) class A common stock; (ii) preferred stock; (iii) depositary shares representing preferred stock; (iv) debt securities; (v) warrants; (vi) subscription rights; (vii) purchase contracts; and (viii) units consisting of one or more of such securities or any combination of these securities. The specifics of any future offerings, along with the use of proceeds of any securities offered, will be described in detail in a prospectus supplement, or other offering materials, at the time of any offering.
We may also access liquidity through our dividend reinvestment plan and direct stock purchase plan, under which 9,976,469 shares of class A common stock were available for issuance as of September 30, 2023, and our at the market stock offering program, pursuant to which we may sell, from time to time, up to $480.9 million of additional shares of our class A common stock as of September 30, 2023. Refer to Note 13 to our consolidated financial statements for additional details.
Liquidity Needs
In addition to our loan origination and funding activity and general operating expenses, our primary liquidity needs include interest and principal payments under our $12.8 billion of outstanding borrowings under secured debt, our asset-specific debt, our Term Loans, our Senior Secured Notes, and our Convertible Notes. From time to time we may also repurchase our outstanding debt or shares of our class A common stock. Such repurchases, if any, will depend on prevailing market conditions, our liquidity requirements, contractual restrictions, and other factors. The amounts involved in any such purchase transactions, individually or in the aggregate, may be material. During the three months ended September 30, 2023 we repurchased an aggregate principal amount of $33.4 million of the Senior Secured Notes at a weighted-average price of 85%. This resulted in a gain on extinguishment of debt of $4.5 million during the three months ended September 30, 2023.
As of September 30, 2023, we had unfunded commitments of $2.7 billion related to 101 loans receivable and $1.5 billion of committed or identified financing for those commitments resulting in net unfunded commitments of $1.2 billion. The unfunded loan commitments comprise funding for capital expenditures and construction, leasing costs, and interest and carry costs, and their fundability varies depending on the progress of capital projects, leasing, and cash flows at the properties securing our loans. Therefore, the exact timing and amounts of such future loan fundings are uncertain and will depend on the current and future performance of the underlying collateral assets. We expect to fund our loan commitments over the remaining term of the related loans, which have a weighted-average future funding period of 2.6 years
.
65
Contractual Obligations and Commitments
Our contractual obligations and commitments as of September 30, 2023 were as follows ($ in thousands):
| Payment Timing | |||||||||||||||||||||||||||||
|
Total
Obligation
|
Less Than
1 Year
(1)
|
1 to 3
Years
|
3 to 5
Years |
More Than
5 Years
|
|||||||||||||||||||||||||
|
Unfunded loan commitments
(2)
|
$ | 2,671,851 | $ | 680,820 | $ | 1,048,602 | $ | 398,520 | $ | 543,909 | |||||||||||||||||||
|
Principal repayments under secured debt
(3)
|
12,809,913 | 1,275,700 | 5,697,237 | 4,997,834 | 839,142 | ||||||||||||||||||||||||
|
Principal repayments under asset-specific debt
(3)
|
935,435 | — | 786,633 | — | 148,802 | ||||||||||||||||||||||||
|
Principal repayments of term loans
(4)
|
2,140,720 | 21,997 | 1,328,006 | 16,516 | 774,201 | ||||||||||||||||||||||||
| Principal repayments of senior secured notes | 366,590 | — | — | 366,590 | — | ||||||||||||||||||||||||
|
Principal repayments of convertible notes
(5)
|
300,000 | — | — | 300,000 | — | ||||||||||||||||||||||||
|
Interest payments
(3)(6)
|
3,356,015 | 1,173,532 | 1,634,769 | 466,186 | 81,528 | ||||||||||||||||||||||||
|
Total
(7)
|
$ | 22,580,524 | $ | 3,152,049 | $ | 10,495,247 | $ | 6,545,646 | $ | 2,387,582 | |||||||||||||||||||
(1)
Represents known and estimated short-term cash requirements related to our contractual obligations and commitments. Refer to the sources of liquidity section above for our sources of funds to satisfy our short-term cash requirements.
(2)
The allocation of our unfunded loan commitments is based on the earlier of the commitment expiration date or the final loan maturity date, however we may be obligated to fund these commitments earlier than such date.
(3)
Our secured debt and asset-specific debt agreements are generally term-matched to their underlying collateral. Therefore, the allocation of both principal and interest payments under such agreements is generally allocated based on the maximum maturity date of the collateral loans, assuming all extension options are exercised by the borrower. In limited instances, the maturity date of the respective debt agreement is used.
(4)
The Term Loans are partially amortizing, with an amount equal to 1.0% per annum of the initial principal balance due in quarterly installments. Refer to Note 9 for further details on our term loans.
(5)
Reflects the outstanding principal balance of convertible notes, excluding any potential conversion premium. Refer to Note 11 to our consolidated financial statements for further details on our convertible notes.
(6)
Represents interest payments on our secured debt, asset-specific debt, term loans, senior secured notes, and convertible notes. Future interest payment obligations are estimated assuming the interest rates in effect as of September 30, 2023 will remain constant into the future. This is only an estimate as actual amounts borrowed and interest rates will vary over time.
(7)
Total does not include $2.5 billion of consolidated securitized debt obligations, $1.1 billion of non-consolidated senior interests, and $275.7 million of loan participations sold, as the satisfaction of these liabilities will not require cash outlays from us.
We are also required to settle our foreign exchange and interest rate derivatives with our derivative counterparties upon maturity which, depending on foreign currency exchange and interest rate movements, may result in cash received from or due to such counterparties. The table above does not include these amounts as they are not fixed and determinable. Refer to Note 12 to our consolidated financial statements for details regarding our derivative contracts.
We are required to pay our Manager a base management fee, an incentive fee, and reimbursements for certain expenses pursuant to our Management Agreement. The table above does not include the amounts payable to our Manager under our Management Agreement as they are not fixed and determinable. Refer to Note 14 to our consolidated financial statements for additional terms and details of the fees payable under our Management Agreement.
As a REIT, we generally must distribute substantially all of our net taxable income to stockholders in the form of dividends to comply with the REIT provisions of the Internal Revenue Code. Our taxable income does not necessarily equal our net income as calculated in accordance with GAAP, or our Distributable Earnings as described above.
66
Cash Flows
The following table provides a breakdown of the net change in our cash and cash equivalents ($ in thousands):
|
Nine Months Ended
September 30, |
|||||||||||
| 2023 | 2022 | ||||||||||
| Cash flows provided by operating activities | $ | 349,053 | $ | 266,610 | |||||||
| Cash flows provided by (used in) investing activities | 1,187,092 | (3,200,070) | |||||||||
| Cash flows (used in) provided by financing activities | (1,407,463) | 2,671,630 | |||||||||
| Net increase (decrease) in cash and cash equivalents | $ | 128,682 | $ | (261,830) | |||||||
We experienced a net increase in cash and cash equivalents of $128.7 million for the nine months ended September 30, 2023, compared to a net decrease of $261.8 million for the nine months ended September 30, 2022. During the nine months ended September 30, 2023, we received $2.3 billion from loan principal collections and sales proceeds. Also, during the nine months ended September 30, 2023, we (i) funded $1.1 billion of loans, (ii) repaid a net $672.2 million of secured debt borrowings, (iii) paid $320.1 million of dividends on our class A common stock, and (iv) repaid $220.0 million of convertible notes.
Refer to Note 3 to our consolidated financial statements for further discussion of our loan activity. Refer to Notes 5, 7, 11, and 13 to our consolidated financial statements for additional discussion of our secured debt, asset-specific debt, convertible notes, and equity, respectively.
V. Other Items
Income Taxes
We have elected to be taxed as a REIT under the Internal Revenue Code for U.S. federal income tax purposes. We generally must distribute annually at least 90% of our net taxable income, subject to certain adjustments and excluding any net capital gain, in order for U.S. federal income tax not to apply to our earnings. To the extent that we satisfy this distribution requirement, but distribute less than 100% of our net taxable income, we will be subject to U.S. federal income tax on our undistributed taxable income. In addition, we will be subject to a 4% nondeductible excise tax if the actual amount that we pay out to our stockholders in a calendar year is less than a minimum amount specified under U.S. federal tax laws.
Our qualification as a REIT also depends on our ability to meet various other requirements imposed by the Internal Revenue Code, which relate to organizational structure, diversity of stock ownership, and certain restrictions with regard to the nature of our assets and the sources of our income. Even if we qualify as a REIT, we may be subject to certain U.S. federal income and excise taxes and state and local taxes on our income and assets. If we fail to maintain our qualification as a REIT for any taxable year, we may be subject to material penalties as well as federal, state and local income tax on our taxable income at regular corporate rates and we would not be able to qualify as a REIT for the subsequent four full taxable years. As of September 30, 2023 and December 31, 2022, we were in compliance with all REIT requirements.
Furthermore, our taxable REIT subsidiaries are subject to federal, state, and local income tax on their net taxable income. Refer to Note 15 to our consolidated financial statements for additional discussion of our income taxes.
Critical Accounting Policies
Our discussion and analysis of our financial condition and results of operations is based upon our consolidated financial statements, which have been prepared in accordance with GAAP. There have been no material changes to our Critical Accounting Policies described in our Annual Report on Form 10-K filed with the SEC on February 8, 2023.
Current Expected Credit Losses
The current expected credit loss, or CECL, reserve required under the FASB Accounting Standards Codification, or ASC, Topic 326 “Financial Instruments – Credit Losses,” or ASC 326, reflects our current estimate of potential credit losses related to our loans receivable portfolio. We estimate our CECL reserve primarily using the Weighted-Average Remaining Maturity, or WARM method, which has been identified as an acceptable loss-rate method for estimating CECL reserves in
67
the Financial Accounting Standards Board Staff Q&A Topic 326, No. 1. Estimating the CECL reserve requires judgment, including the following assumptions:
•
Historical loan loss reference data
: To estimate the historic loan losses relevant to our portfolio, we have augmented our historical loan performance with market loan loss data licensed from Trepp LLC. This database includes commercial mortgage-backed securities, or CMBS, issued since January 1, 1999 through August 31, 2023. Within this database, we focused our historical loss reference calculations on the most relevant subset of available CMBS data, which we determined based on loan metrics that are most comparable to our loan portfolio including asset type, geography, and origination loan-to-value, or LTV. We believe this CMBS data, which includes month-over-month loan and property performance, is the most relevant, available, and comparable dataset to our portfolio.
•
Expected timing and amount of future loan fundings and repayments
: Expected credit losses are estimated over the contractual term of each loan, adjusted for expected prepayments. As part of our quarterly review of our loan portfolio, we assess the expected repayment date of each loan, which is used to determine the contractual term for purposes of computing our CECL reserve. Additionally, the expected credit losses over the contractual period of our loans are subject to the obligation to extend credit through our unfunded loan commitments. The CECL reserve for unfunded loan commitments is adjusted quarterly, as we consider the expected timing of future funding obligations over the estimated life of the loan. The considerations in estimating our CECL reserve for unfunded loan commitments are similar to those used for the related outstanding loans receivable.
•
Current credit quality of our portfolio
: Our risk rating is our primary credit quality indicator in assessing our current expected credit loss reserve. We perform a quarterly risk review of our portfolio of loans, and assigns each loan a risk rating based on a variety of factors, including, without limitation, origination LTV, debt yield, property type, geographic and local market dynamics, physical condition, cash flow volatility, leasing and tenant profile, loan structure and exit plan, and project sponsorship.
•
Expectations of performance and market conditions
: Our CECL reserve is adjusted to reflect our estimation of the current and future economic conditions that impact the performance of the commercial real estate assets securing our loans. These estimations include unemployment rates, interest rates, inflation, and other macroeconomic factors impacting the likelihood and magnitude of potential credit losses for our loans during their anticipated term. In addition to the CMBS data we have licensed from Trepp LLC, we have also licensed certain macroeconomic financial forecasts to inform our view of the potential future impact that broader economic conditions may have on our loan portfolio’s performance. We generally also incorporate information from other sources, including information and opinions available to our Manager, to further inform these estimations. This process requires significant judgments about future events that, while based on the information available to us as of the balance sheet date, are ultimately indeterminate and the actual economic condition impacting our portfolio could vary significantly from the estimates we made as of September 30, 2023.
•
Impairment
: impairment is indicated when it is deemed probable that we will not be able to collect all amounts due to us pursuant to the contractual terms of the loan. Determining that a loan is impaired requires significant judgment from management and is based on several factors including (i) the underlying collateral performance, (ii) discussions with the borrower, (iii) borrower events of default, and (iv) other facts that impact the borrower’s ability to pay the contractual amounts due under the terms of the loan. If a loan is determined to be impaired, we record the impairment as a component of our CECL reserve by applying the practical expedient for collateral dependent loans. The CECL reserve is assessed on an individual basis for these loans by comparing the estimated fair value of the underlying collateral, less costs to sell, to the book value of the respective loan. These valuations require significant judgments, which include assumptions regarding capitalization rates, discount rates, leasing, creditworthiness of major tenants, occupancy rates, availability and cost of financing, exit plan, loan sponsorship, actions of other lenders, and other factors deemed relevant by us. Actual losses, if any, could ultimately differ materially from these estimates. We only expect to charge-off the impairment losses if and when such amounts are deemed nonrecoverable. This is generally at the time a loan is repaid or foreclosed. However, non-recoverability may also be concluded if, in our determination, it is nearly certain that all amounts due will not be collected.
These assumptions vary from quarter-to-quarter as our loan portfolio changes and market and economic conditions evolve. The sensitivity of each assumption and its impact on the CECL reserve may change over time and from period to period. During the nine months ended September 30, 2023, we recorded an aggregate $134.5 million increase in the CECL reserve related to our loans receivable and unfunded loan commitments, bringing our total reserve to $477.0 million as of September 30, 2023. See Notes 2 and 3 to our consolidated financial statements for further discussion of our CECL reserve.
68
Revenue Recognition
Interest income from our loans receivable portfolio is recognized over the life of each investment using the effective interest method and is recorded on the accrual basis. Recognition of fees, premiums, and discounts associated with these investments is deferred and recorded over the term of the loan as an adjustment to yield. Income accrual is generally suspended for loans at the earlier of the date at which payments become 90 days past due or when, in our opinion, recovery of income and principal becomes doubtful. Interest received is then recorded as income or as a reduction in the amortized cost basis, based on the specific facts and circumstances, until accrual is resumed when the loan becomes contractually current and performance is demonstrated to be resumed. In addition, for loans we originate, the related origination expenses are deferred and recognized as a reduction to interest income, however expenses related to loans we acquire are included in general and administrative expenses as incurred.
69
VI. Loan Portfolio Details
The following table provides details of our loan portfolio, on a loan-by-loan basis, as of September 30, 2023 ($ in millions):
|
Loan Type
(1)
|
Origination
Date
(2)
|
Total
Loan
(3)(4)
|
Principal
Balance
(4)
|
Net Book
Value |
Cash
Coupon
(5)
|
All-in
Yield
(5)
|
Maximum
Maturity
(6)
|
Location | Property Type |
Loan Per
SQFT / Unit / Key |
Origination
LTV
(2)
|
Risk
Rating |
||||||||||||||||||||||||||||||||||||||||||||||||||||||||||||||||||||||||||
| 1 | Senior Loan | 4/9/2018 | $ | 1,487 | $ | 1,111 | $ | 1,108 | +4.32 | % | +4.64 | % | 6/9/2025 | New York | Office | $392 / sqft | 48 | % | 2 | |||||||||||||||||||||||||||||||||||||||||||||||||||||||||||||||||||
| 2 | Senior Loan | 8/14/2019 | 1,043 | 954 | 952 | +3.02 | % | +3.78 | % | 12/23/2024 | Dublin - IE | Mixed-Use | $316 / sqft | 74 | % | 3 | ||||||||||||||||||||||||||||||||||||||||||||||||||||||||||||||||||||||
| 3 | Senior Loan | 6/24/2022 | 851 | 851 | 845 | +4.75 | % | +5.07 | % | 6/21/2029 | Diversified - AU | Hospitality | $387 / sqft | 59 | % | 3 | ||||||||||||||||||||||||||||||||||||||||||||||||||||||||||||||||||||||
| 4 | Senior Loan | 3/22/2018 | 600 | 600 | 600 | +3.25 | % | +3.31 | % | 3/15/2026 | Diversified - Spain | Mixed-Use | n / a | 71 | % | 4 | ||||||||||||||||||||||||||||||||||||||||||||||||||||||||||||||||||||||
| 5 |
Senior Loan
(4)
|
8/7/2019 | 571 | 571 | 116 | +3.22 | % | +3.46 | % | 9/9/2025 | Los Angeles | Office | $712 / sqft | 59 | % | 2 | ||||||||||||||||||||||||||||||||||||||||||||||||||||||||||||||||||||||
| 6 | Senior Loan | 7/23/2021 | 480 | 456 | 452 | +4.10 | % | +4.55 | % | 8/9/2027 | New York | Multi | $611,846 / unit | 58 | % | 2 | ||||||||||||||||||||||||||||||||||||||||||||||||||||||||||||||||||||||
| 7 | Senior Loan | 3/30/2021 | 454 | 454 | 452 | +3.20 | % | +3.41 | % | 5/15/2026 | Diversified - SE | Industrial | $84 / sqft | 76 | % | 2 | ||||||||||||||||||||||||||||||||||||||||||||||||||||||||||||||||||||||
| 8 |
Senior Loan
(4)
|
11/22/2019 | 470 | 383 | 76 | +3.78 | % | +4.25 | % | 12/9/2025 | Los Angeles | Office | $701 / sqft | 69 | % | 3 | ||||||||||||||||||||||||||||||||||||||||||||||||||||||||||||||||||||||
| 9 | Senior Loan | 12/9/2021 | 385 | 366 | 366 | +2.76 | % | +2.89 | % | 12/9/2026 | New York | Mixed-Use | $126 / sqft | 50 | % | 2 | ||||||||||||||||||||||||||||||||||||||||||||||||||||||||||||||||||||||
| 10 | Senior Loan | 9/23/2019 | 370 | 345 | 344 | +3.00 | % | +3.27 | % | 8/16/2024 | Diversified - Spain | Hospitality | $123,028 / key | 62 | % | 4 | ||||||||||||||||||||||||||||||||||||||||||||||||||||||||||||||||||||||
| 11 | Senior Loan | 4/11/2018 | 345 | 336 | 336 | +2.25 | % | +2.28 | % | 5/1/2025 | New York | Office | $426 / sqft | 71 | % | 4 | ||||||||||||||||||||||||||||||||||||||||||||||||||||||||||||||||||||||
| 12 | Senior Loan | 2/27/2020 | 303 | 302 | 302 | +2.70 | % | +2.94 | % | 3/9/2025 | New York | Multi | $795,074 / unit | 59 | % | 3 | ||||||||||||||||||||||||||||||||||||||||||||||||||||||||||||||||||||||
| 13 | Senior Loan | 5/6/2022 | 293 | 293 | 291 | +3.50 | % | +3.79 | % | 5/6/2027 | Diversified - UK | Industrial | $93 / sqft | 53 | % | 2 | ||||||||||||||||||||||||||||||||||||||||||||||||||||||||||||||||||||||
| 14 | Senior Loan | 9/29/2021 | 312 | 292 | 291 | +2.81 | % | +3.03 | % | 10/9/2026 | Washington, DC | Office | $381 / sqft | 66 | % | 2 | ||||||||||||||||||||||||||||||||||||||||||||||||||||||||||||||||||||||
| 15 | Senior Loan | 10/25/2021 | 290 | 290 | 288 | +4.00 | % | +4.32 | % | 10/25/2024 | Diversified - AU | Hospitality | $142,718 / key | 56 | % | 2 | ||||||||||||||||||||||||||||||||||||||||||||||||||||||||||||||||||||||
| 16 | Senior Loan | 12/11/2018 | 310 | 289 | 291 | +2.55 | % | +3.24 | % | 12/9/2023 | Chicago | Office | $246 / sqft | 78 | % | 4 | ||||||||||||||||||||||||||||||||||||||||||||||||||||||||||||||||||||||
| 17 | Senior Loan | 11/30/2018 | 286 | 286 | 270 | 7.90 | % | 7.90 | % | 8/9/2025 | New York | Hospitality | $306,870 / key | 73 | % | 5 | ||||||||||||||||||||||||||||||||||||||||||||||||||||||||||||||||||||||
| 18 | Senior Loan | 3/25/2022 | 284 | 284 | 282 | +4.50 | % | +4.86 | % | 3/25/2027 | Diversified - UK | Hospitality | $125,056 / key | 65 | % | 2 | ||||||||||||||||||||||||||||||||||||||||||||||||||||||||||||||||||||||
| 19 | Senior Loan | 10/23/2018 | 290 | 283 | 283 | +2.86 | % | +3.01 | % | 11/9/2024 | Atlanta | Mixed-Use | $264 / sqft | 64 | % | 2 | ||||||||||||||||||||||||||||||||||||||||||||||||||||||||||||||||||||||
| 20 | Senior Loan | 7/15/2021 | 302 | 280 | 277 | +4.25 | % | +4.74 | % | 7/16/2026 | Diversified - EUR | Hospitality | $213,942 / key | 53 | % | 3 | ||||||||||||||||||||||||||||||||||||||||||||||||||||||||||||||||||||||
| 21 | Senior Loan | 9/30/2021 | 280 | 276 | 275 | +2.61 | % | +2.88 | % | 9/30/2026 | Dallas | Multi | $145,532 / unit | 74 | % | 3 | ||||||||||||||||||||||||||||||||||||||||||||||||||||||||||||||||||||||
| 22 | Senior Loan | 6/8/2022 | 272 | 262 | 260 | +3.65 | % | +4.00 | % | 6/9/2027 | New York | Office | $1,465 / sqft | 75 | % | 3 | ||||||||||||||||||||||||||||||||||||||||||||||||||||||||||||||||||||||
| 23 | Senior Loan | 11/30/2018 | 261 | 261 | 261 | +2.80 | % | +3.04 | % | 12/9/2024 | San Francisco | Hospitality | $380,626 / key | 73 | % | 4 | ||||||||||||||||||||||||||||||||||||||||||||||||||||||||||||||||||||||
| 24 | Senior Loan | 9/14/2021 | 259 | 255 | 255 | +2.61 | % | +2.87 | % | 9/14/2026 | Dallas | Multi | $206,610 / unit | 72 | % | 3 | ||||||||||||||||||||||||||||||||||||||||||||||||||||||||||||||||||||||
| 25 | Senior Loan | 1/11/2019 | 252 | 252 | 252 | +5.02 | % | +5.06 | % | 6/14/2028 | Diversified - UK | Other | $249 / sqft | 74 | % | 3 | ||||||||||||||||||||||||||||||||||||||||||||||||||||||||||||||||||||||
| 26 | Senior Loan | 2/23/2022 | 245 | 231 | 230 | +2.60 | % | +2.84 | % | 3/9/2027 | Reno | Multi | $214,621 / unit | 74 | % | 3 | ||||||||||||||||||||||||||||||||||||||||||||||||||||||||||||||||||||||
| 27 |
Senior Loan
(7)
|
9/16/2021 | 229 | 229 | 229 | +1.63 | % | +1.63 | % | 11/9/2025 | San Francisco | Office | $278 / sqft | 53 | % | 4 | ||||||||||||||||||||||||||||||||||||||||||||||||||||||||||||||||||||||
| 28 | Senior Loan | 12/22/2016 | 252 | 212 | 206 | +10.50 | % | +10.50 | % | 6/9/2028 | New York | Office | $299 / sqft | 64 | % | 5 | ||||||||||||||||||||||||||||||||||||||||||||||||||||||||||||||||||||||
| 29 | Senior Loan | 4/23/2021 | 219 | 209 | 203 | +3.65 | % | +3.65 | % | 5/9/2024 | Washington, DC | Office | $234 / sqft | 57 | % | 5 | ||||||||||||||||||||||||||||||||||||||||||||||||||||||||||||||||||||||
| 30 | Senior Loan | 7/16/2021 | 223 | 209 | 207 | +3.25 | % | +3.51 | % | 2/15/2027 | London - UK | Multi | $215,650 / unit | 69 | % | 3 | ||||||||||||||||||||||||||||||||||||||||||||||||||||||||||||||||||||||
continued…
70
|
Loan Type
(1)
|
Origination
Date
(2)
|
Total
Loan
(3)(4)
|
Principal
Balance
(4)
|
Net Book
Value |
Cash
Coupon
(5)
|
All-in
Yield
(5)
|
Maximum
Maturity
(6)
|
Location | Property Type |
Loan Per
SQFT / Unit / Key |
Origination
LTV
(2)
|
Risk
Rating |
||||||||||||||||||||||||||||||||||||||||||||||||||||||||||||||||||||||||||
| 31 | Senior Loan | 8/31/2017 | $ | 203 | $ | 203 | $ | 192 | +2.62 | % | +2.62 | % | 10/9/2023 | Orange County | Office | $238 / sqft | 64 | % | 5 | |||||||||||||||||||||||||||||||||||||||||||||||||||||||||||||||||||
| 32 | Senior Loan | 6/27/2019 | 203 | 202 | 201 | +2.80 | % | +2.94 | % | 8/15/2026 | Berlin - DEU | Office | $425 / sqft | 62 | % | 3 | ||||||||||||||||||||||||||||||||||||||||||||||||||||||||||||||||||||||
| 33 | Senior Loan | 9/30/2021 | 256 | 201 | 200 | +3.11 | % | +3.50 | % | 10/9/2028 | Chicago | Office | $222 / sqft | 74 | % | 4 | ||||||||||||||||||||||||||||||||||||||||||||||||||||||||||||||||||||||
| 34 | Senior Loan | 6/28/2019 | 200 | 200 | 199 | +3.82 | % | +4.08 | % | 6/26/2024 | London - UK | Office | $481 / sqft | 71 | % | 3 | ||||||||||||||||||||||||||||||||||||||||||||||||||||||||||||||||||||||
| 35 |
Senior Loan
(4)
|
11/10/2021 | 362 | 199 | 39 | +4.11 | % | +4.93 | % | 12/9/2026 | San Francisco | Life Sciences | $377 / sqft | 66 | % | 3 | ||||||||||||||||||||||||||||||||||||||||||||||||||||||||||||||||||||||
| 36 | Senior Loan | 7/29/2022 | 268 | 195 | 192 | +4.60 | % | +5.65 | % | 7/27/2027 | London - UK | Industrial | $252 / sqft | 52 | % | 3 | ||||||||||||||||||||||||||||||||||||||||||||||||||||||||||||||||||||||
| 37 | Senior Loan | 9/30/2021 | 195 | 195 | 194 | +3.86 | % | +4.21 | % | 10/9/2026 | Boca Raton | Multi | $532,787 / unit | 77 | % | 3 | ||||||||||||||||||||||||||||||||||||||||||||||||||||||||||||||||||||||
| 38 | Senior Loan | 7/23/2021 | 244 | 187 | 185 | +5.11 | % | +5.50 | % | 8/9/2027 | New York | Office | $604 / sqft | 53 | % | 4 | ||||||||||||||||||||||||||||||||||||||||||||||||||||||||||||||||||||||
| 39 | Senior Loan | 6/28/2022 | 675 | 186 | 179 | +4.60 | % | +5.07 | % | 7/9/2029 | Austin | Mixed-Use | $155 / sqft | 53 | % | 3 | ||||||||||||||||||||||||||||||||||||||||||||||||||||||||||||||||||||||
| 40 | Senior Loan | 9/25/2019 | 180 | 180 | 179 | +4.47 | % | +4.84 | % | 9/26/2024 | London - UK | Office | $836 / sqft | 72 | % | 3 | ||||||||||||||||||||||||||||||||||||||||||||||||||||||||||||||||||||||
| 41 | Senior Loan | 11/23/2018 | 179 | 179 | 178 | +2.68 | % | +2.92 | % | 2/15/2024 | Diversified - UK | Office | $1,103 / sqft | 50 | % | 3 | ||||||||||||||||||||||||||||||||||||||||||||||||||||||||||||||||||||||
| 42 | Senior Loan | 2/15/2022 | 191 | 178 | 177 | +2.90 | % | +3.14 | % | 3/9/2027 | Denver | Office | $355 / sqft | 61 | % | 3 | ||||||||||||||||||||||||||||||||||||||||||||||||||||||||||||||||||||||
| 43 | Senior Loan | 12/21/2021 | 184 | 178 | 177 | +2.82 | % | +3.11 | % | 4/29/2027 | London - UK | Industrial | $361 / sqft | 67 | % | 3 | ||||||||||||||||||||||||||||||||||||||||||||||||||||||||||||||||||||||
| 44 | Senior Loan | 1/27/2022 | 178 | 177 | 176 | +3.10 | % | +3.40 | % | 2/9/2027 | Dallas | Multi | $115,406 / unit | 71 | % | 3 | ||||||||||||||||||||||||||||||||||||||||||||||||||||||||||||||||||||||
| 45 | Senior Loan | 5/13/2021 | 199 | 173 | 172 | +3.66 | % | +4.11 | % | 6/9/2026 | Boston | Life Sciences | $875 / sqft | 64 | % | 3 | ||||||||||||||||||||||||||||||||||||||||||||||||||||||||||||||||||||||
| 46 | Senior Loan | 3/9/2022 | 165 | 165 | 164 | +2.95 | % | +3.17 | % | 8/15/2027 | Diversified - UK | Retail | $140 / sqft | 55 | % | 2 | ||||||||||||||||||||||||||||||||||||||||||||||||||||||||||||||||||||||
| 47 | Senior Loan | 12/17/2021 | 168 | 165 | 164 | +3.95 | % | +4.33 | % | 1/9/2026 | Diversified - US | Other | $5,601 / unit | 48 | % | 1 | ||||||||||||||||||||||||||||||||||||||||||||||||||||||||||||||||||||||
| 48 | Senior Loan | 5/27/2021 | 205 | 163 | 163 | +2.81 | % | +3.11 | % | 6/9/2026 | Atlanta | Office | $137 / sqft | 66 | % | 3 | ||||||||||||||||||||||||||||||||||||||||||||||||||||||||||||||||||||||
| 49 | Senior Loan | 10/7/2021 | 165 | 160 | 160 | +3.25 | % | +3.58 | % | 10/9/2025 | Los Angeles | Office | $326 / sqft | 68 | % | 4 | ||||||||||||||||||||||||||||||||||||||||||||||||||||||||||||||||||||||
| 50 | Senior Loan | 3/7/2022 | 156 | 156 | 156 | +3.45 | % | +3.63 | % | 6/9/2026 | Los Angeles | Hospitality | $624,000 / key | 64 | % | 3 | ||||||||||||||||||||||||||||||||||||||||||||||||||||||||||||||||||||||
| 51 | Senior Loan | 6/4/2018 | 153 | 153 | 153 | +3.50 | % | +3.74 | % | 6/9/2025 | New York | Hospitality | $251,647 / key | 52 | % | 3 | ||||||||||||||||||||||||||||||||||||||||||||||||||||||||||||||||||||||
| 52 | Senior Loan | 1/17/2020 | 203 | 153 | 152 | +2.86 | % | +3.00 | % | 2/9/2025 | New York | Mixed-Use | $126 / sqft | 43 | % | 3 | ||||||||||||||||||||||||||||||||||||||||||||||||||||||||||||||||||||||
| 53 | Senior Loan | 1/7/2022 | 155 | 152 | 151 | +3.70 | % | +3.97 | % | 1/9/2027 | Fort Lauderdale | Office | $392 / sqft | 55 | % | 1 | ||||||||||||||||||||||||||||||||||||||||||||||||||||||||||||||||||||||
| 54 | Senior Loan | 9/4/2018 | 163 | 150 | 149 | +4.25 | % | +4.48 | % | 9/9/2024 | Las Vegas | Hospitality | $181,054 / key | 70 | % | 2 | ||||||||||||||||||||||||||||||||||||||||||||||||||||||||||||||||||||||
| 55 | Senior Loan | 3/10/2020 | 140 | 140 | 140 | +3.10 | % | +3.10 | % | 10/11/2024 | New York | Mixed-Use | $854 / sqft | 53 | % | 4 | ||||||||||||||||||||||||||||||||||||||||||||||||||||||||||||||||||||||
| 56 | Senior Loan | 11/18/2021 | 138 | 138 | 138 | +3.25 | % | +3.51 | % | 11/18/2026 | London - UK | Other | $174 / sqft | 65 | % | 2 | ||||||||||||||||||||||||||||||||||||||||||||||||||||||||||||||||||||||
| 57 | Senior Loan | 12/20/2019 | 137 | 137 | 137 | +3.22 | % | +3.44 | % | 12/18/2026 | London - UK | Office | $695 / sqft | 75 | % | 3 | ||||||||||||||||||||||||||||||||||||||||||||||||||||||||||||||||||||||
| 58 | Senior Loan | 2/20/2019 | 165 | 137 | 136 | +4.07 | % | +4.73 | % | 2/19/2024 | London - UK | Office | $550 / sqft | 61 | % | 3 | ||||||||||||||||||||||||||||||||||||||||||||||||||||||||||||||||||||||
| 59 | Senior Loan | 9/30/2021 | 181 | 137 | 135 | +4.00 | % | +4.51 | % | 9/30/2026 | Diversified - Spain | Hospitality | $117,931 / key | 60 | % | 3 | ||||||||||||||||||||||||||||||||||||||||||||||||||||||||||||||||||||||
| 60 | Senior Loan | 2/25/2022 | 133 | 133 | 132 | +4.05 | % | +4.43 | % | 2/25/2027 | Copenhagen - DK | Industrial | $75 / sqft | 69 | % | 2 | ||||||||||||||||||||||||||||||||||||||||||||||||||||||||||||||||||||||
continued…
71
|
Loan Type
(1)
|
Origination
Date
(2)
|
Total
Loan
(3)(4)
|
Principal
Balance
(4)
|
Net Book
Value |
Cash
Coupon
(5)
|
All-in
Yield
(5)
|
Maximum
Maturity
(6)
|
Location | Property Type |
Loan Per
SQFT / Unit / Key |
Origination
LTV
(2)
|
Risk
Rating |
||||||||||||||||||||||||||||||||||||||||||||||||||||||||||||||||||||||||||
| 61 | Senior Loan | 8/24/2021 | $ | 156 | $ | 133 | $ | 133 | +2.71 | % | +3.03 | % | 9/9/2026 | San Jose | Office | $317 / sqft | 65 | % | 3 | |||||||||||||||||||||||||||||||||||||||||||||||||||||||||||||||||||
| 62 | Senior Loan | 9/14/2021 | 132 | 129 | 129 | +2.81 | % | +3.07 | % | 10/9/2026 | San Bernardino | Multi | $260,871 / unit | 75 | % | 3 | ||||||||||||||||||||||||||||||||||||||||||||||||||||||||||||||||||||||
| 63 |
Senior Loan
(4)
|
3/17/2022 | 216 | 126 | 173 | +2.27 | % | +4.14 | % | 6/30/2025 | London - UK | Office | $566 / sqft | 50 | % | 3 | ||||||||||||||||||||||||||||||||||||||||||||||||||||||||||||||||||||||
| 64 | Senior Loan | 4/3/2018 | 126 | 125 | 125 | +2.86 | % | +3.11 | % | 4/9/2024 | Dallas | Retail | $761 / sqft | 64 | % | 3 | ||||||||||||||||||||||||||||||||||||||||||||||||||||||||||||||||||||||
| 65 | Senior Loan | 5/20/2021 | 150 | 124 | 124 | +3.76 | % | +3.76 | % | 6/9/2026 | San Jose | Office | $318 / sqft | 65 | % | 5 | ||||||||||||||||||||||||||||||||||||||||||||||||||||||||||||||||||||||
| 66 | Senior Loan | 6/30/2022 | 122 | 122 | 122 | +3.75 | % | +3.93 | % | 9/30/2025 | Canberra - AU | Hospitality | $237,408 / key | 60 | % | 2 | ||||||||||||||||||||||||||||||||||||||||||||||||||||||||||||||||||||||
| 67 | Senior Loan | 4/6/2021 | 123 | 122 | 122 | +3.31 | % | +3.60 | % | 4/9/2026 | Los Angeles | Office | $508 / sqft | 65 | % | 3 | ||||||||||||||||||||||||||||||||||||||||||||||||||||||||||||||||||||||
| 68 | Senior Loan | 12/23/2021 | 315 | 121 | 116 | +4.25 | % | +5.40 | % | 6/24/2028 | London - UK | Multi | $133,120 / unit | 59 | % | 3 | ||||||||||||||||||||||||||||||||||||||||||||||||||||||||||||||||||||||
| 69 | Senior Loan | 6/1/2021 | 120 | 120 | 120 | +2.96 | % | +3.17 | % | 6/9/2026 | Miami | Multi | $298,507 / unit | 61 | % | 2 | ||||||||||||||||||||||||||||||||||||||||||||||||||||||||||||||||||||||
| 70 | Senior Loan | 3/29/2021 | 124 | 119 | 119 | +4.02 | % | +4.61 | % | 3/29/2026 | Diversified - UK | Multi | $52,176 / unit | 61 | % | 3 | ||||||||||||||||||||||||||||||||||||||||||||||||||||||||||||||||||||||
| 71 | Senior Loan | 4/29/2022 | 118 | 118 | 118 | +3.50 | % | +3.77 | % | 2/18/2027 | Napa Valley | Hospitality | $1,240,799 / key | 66 | % | 3 | ||||||||||||||||||||||||||||||||||||||||||||||||||||||||||||||||||||||
| 72 | Senior Loan | 8/27/2021 | 122 | 118 | 117 | +3.11 | % | +3.41 | % | 9/9/2026 | San Diego | Retail | $444 / sqft | 58 | % | 3 | ||||||||||||||||||||||||||||||||||||||||||||||||||||||||||||||||||||||
| 73 | Senior Loan | 6/28/2019 | 125 | 117 | 117 | +2.87 | % | +3.13 | % | 2/1/2024 | Los Angeles | Studio | $591 / sqft | 48 | % | 3 | ||||||||||||||||||||||||||||||||||||||||||||||||||||||||||||||||||||||
| 74 | Senior Loan | 7/15/2019 | 138 | 117 | 116 | +3.01 | % | +3.43 | % | 8/9/2024 | Houston | Office | $211 / sqft | 58 | % | 3 | ||||||||||||||||||||||||||||||||||||||||||||||||||||||||||||||||||||||
| 75 | Senior Loan | 12/15/2021 | 144 | 116 | 115 | +2.92 | % | +4.12 | % | 12/9/2026 | Dublin - IE | Multi | $291,190 / unit | 79 | % | 3 | ||||||||||||||||||||||||||||||||||||||||||||||||||||||||||||||||||||||
| 76 | Senior Loan | 1/26/2022 | 338 | 115 | 112 | +4.10 | % | +4.68 | % | 2/9/2027 | Seattle | Office | $241 / sqft | 56 | % | 3 | ||||||||||||||||||||||||||||||||||||||||||||||||||||||||||||||||||||||
| 77 | Senior Loan | 12/21/2021 | 120 | 115 | 114 | +2.70 | % | +3.00 | % | 1/9/2027 | Washington, DC | Office | $393 / sqft | 68 | % | 3 | ||||||||||||||||||||||||||||||||||||||||||||||||||||||||||||||||||||||
| 78 | Senior Loan | 10/21/2021 | 114 | 114 | 114 | +3.01 | % | +3.26 | % | 11/9/2025 | Fort Lauderdale | Multi | $334,311 / unit | 64 | % | 2 | ||||||||||||||||||||||||||||||||||||||||||||||||||||||||||||||||||||||
| 79 | Senior Loan | 3/28/2022 | 130 | 114 | 113 | +2.55 | % | +2.85 | % | 4/9/2027 | Miami | Office | $309 / sqft | 69 | % | 3 | ||||||||||||||||||||||||||||||||||||||||||||||||||||||||||||||||||||||
| 80 |
Senior Loan
(4)
|
3/29/2022 | 224 | 108 | 21 | +4.50 | % | +5.70 | % | 4/9/2027 | Miami | Multi | $184,366 / unit | 72 | % | 3 | ||||||||||||||||||||||||||||||||||||||||||||||||||||||||||||||||||||||
| 81 | Senior Loan | 3/13/2018 | 123 | 108 | 108 | +3.11 | % | +3.34 | % | 4/9/2027 | Honolulu | Hospitality | $167,735 / key | 50 | % | 3 | ||||||||||||||||||||||||||||||||||||||||||||||||||||||||||||||||||||||
| 82 | Senior Loan | 11/8/2022 | 108 | 108 | 108 | +3.88 | % | +4.53 | % | 11/8/2027 | London - UK | Multi | $167,642 / unit | 60 | % | 2 | ||||||||||||||||||||||||||||||||||||||||||||||||||||||||||||||||||||||
| 83 | Senior Loan | 11/27/2019 | 109 | 107 | 107 | +2.86 | % | +3.20 | % | 12/9/2024 | Minneapolis | Office | $107 / sqft | 64 | % | 3 | ||||||||||||||||||||||||||||||||||||||||||||||||||||||||||||||||||||||
| 84 | Senior Loan | 12/29/2021 | 110 | 106 | 105 | +2.85 | % | +3.06 | % | 1/9/2027 | Phoenix | Multi | $181,512 / unit | 64 | % | 3 | ||||||||||||||||||||||||||||||||||||||||||||||||||||||||||||||||||||||
| 85 | Senior Loan | 12/10/2021 | 135 | 105 | 105 | +3.11 | % | +3.46 | % | 1/9/2027 | Miami | Office | $352 / sqft | 49 | % | 3 | ||||||||||||||||||||||||||||||||||||||||||||||||||||||||||||||||||||||
| 86 | Senior Loan | 2/15/2022 | 106 | 105 | 104 | +2.85 | % | +3.19 | % | 3/9/2027 | Tampa | Multi | $239,655 / unit | 73 | % | 2 | ||||||||||||||||||||||||||||||||||||||||||||||||||||||||||||||||||||||
| 87 | Senior Loan | 3/29/2022 | 103 | 101 | 101 | +2.70 | % | +2.96 | % | 4/9/2027 | Miami | Multi | $282,203 / unit | 75 | % | 3 | ||||||||||||||||||||||||||||||||||||||||||||||||||||||||||||||||||||||
| 88 | Senior Loan | 10/1/2021 | 101 | 100 | 100 | +2.86 | % | +3.13 | % | 10/1/2026 | Phoenix | Multi | $231,021 / unit | 77 | % | 3 | ||||||||||||||||||||||||||||||||||||||||||||||||||||||||||||||||||||||
| 89 | Senior Loan | 6/18/2021 | 99 | 99 | 98 | +2.71 | % | +2.95 | % | 7/9/2026 | New York | Industrial | $51 / sqft | 55 | % | 1 | ||||||||||||||||||||||||||||||||||||||||||||||||||||||||||||||||||||||
| 90 | Senior Loan | 10/28/2021 | 96 | 96 | 95 | +3.00 | % | +3.35 | % | 11/9/2026 | Philadelphia | Multi | $352,399 / unit | 79 | % | 3 | ||||||||||||||||||||||||||||||||||||||||||||||||||||||||||||||||||||||
continued…
72
|
Loan Type
(1)
|
Origination
Date
(2)
|
Total
Loan
(3)(4)
|
Principal
Balance
(4)
|
Net Book
Value |
Cash
Coupon
(5)
|
All-in
Yield
(5)
|
Maximum
Maturity
(6)
|
Location | Property Type |
Loan Per
SQFT / Unit / Key |
Origination
LTV
(2)
|
Risk
Rating |
||||||||||||||||||||||||||||||||||||||||||||||||||||||||||||||||||||||||||
| 91 | Senior Loan | 1/30/2020 | $ | 104 | $ | 95 | $ | 95 | +2.96 | % | +3.11 | % | 2/9/2026 | Honolulu | Hospitality | $305,679 / key | 63 | % | 3 | |||||||||||||||||||||||||||||||||||||||||||||||||||||||||||||||||||
| 92 | Senior Loan | 6/14/2021 | 100 | 94 | 92 | +3.81 | % | +3.81 | % | 7/9/2024 | Miami | Office | $198 / sqft | 65 | % | 5 | ||||||||||||||||||||||||||||||||||||||||||||||||||||||||||||||||||||||
| 93 | Senior Loan | 10/27/2021 | 93 | 93 | 92 | +2.61 | % | +2.81 | % | 11/9/2026 | Orlando | Multi | $155,612 / unit | 75 | % | 3 | ||||||||||||||||||||||||||||||||||||||||||||||||||||||||||||||||||||||
| 94 | Senior Loan | 3/3/2022 | 92 | 92 | 92 | +3.45 | % | +3.76 | % | 3/9/2027 | Boston | Hospitality | $418,182 / key | 64 | % | 2 | ||||||||||||||||||||||||||||||||||||||||||||||||||||||||||||||||||||||
| 95 | Senior Loan | 12/21/2018 | 98 | 92 | 92 | +2.71 | % | +2.71 | % | 1/9/2024 | Chicago | Office | $178 / sqft | 72 | % | 5 | ||||||||||||||||||||||||||||||||||||||||||||||||||||||||||||||||||||||
| 96 | Senior Loan | 12/22/2021 | 91 | 91 | 90 | +3.18 | % | +3.44 | % | 1/9/2027 | Las Vegas | Multi | $205,682 / unit | 65 | % | 3 | ||||||||||||||||||||||||||||||||||||||||||||||||||||||||||||||||||||||
| 97 | Senior Loan | 12/15/2021 | 91 | 90 | 90 | +2.96 | % | +3.22 | % | 1/9/2027 | Charlotte | Multi | $256,393 / unit | 76 | % | 3 | ||||||||||||||||||||||||||||||||||||||||||||||||||||||||||||||||||||||
| 98 | Senior Loan | 3/25/2020 | 90 | 90 | 89 | +2.40 | % | +2.67 | % | 3/31/2025 | Diversified - NL | Multi | $109,324 / unit | 65 | % | 2 | ||||||||||||||||||||||||||||||||||||||||||||||||||||||||||||||||||||||
| 99 | Senior Loan | 4/1/2021 | 102 | 89 | 89 | +7.41 | % | +7.41 | % | 4/9/2026 | San Jose | Office | $599 / sqft | 67 | % | 5 | ||||||||||||||||||||||||||||||||||||||||||||||||||||||||||||||||||||||
| 100 | Senior Loan | 10/16/2018 | 88 | 88 | 88 | +3.36 | % | +3.61 | % | 11/9/2024 | San Francisco | Hospitality | $191,807 / key | 72 | % | 4 | ||||||||||||||||||||||||||||||||||||||||||||||||||||||||||||||||||||||
| 101 | Senior Loan | 6/25/2021 | 85 | 85 | 85 | +2.86 | % | +3.31 | % | 7/1/2026 | St. Louis | Multi | $80,339 / unit | 70 | % | 3 | ||||||||||||||||||||||||||||||||||||||||||||||||||||||||||||||||||||||
| 102 | Senior Loan | 6/27/2019 | 88 | 85 | 85 | +2.75 | % | +2.99 | % | 7/9/2024 | West Palm Beach | Office | $292 / sqft | 70 | % | 2 | ||||||||||||||||||||||||||||||||||||||||||||||||||||||||||||||||||||||
| 103 | Senior Loan | 12/15/2021 | 84 | 84 | 83 | +4.00 | % | +4.29 | % | 12/15/2026 | Melbourne - AU | Multi | $61,241 / unit | 38 | % | 2 | ||||||||||||||||||||||||||||||||||||||||||||||||||||||||||||||||||||||
| 104 | Senior Loan | 3/31/2017 | 84 | 84 | 84 | +9.41 | % | +9.41 | % | 10/9/2023 | New York | Office | $403 / sqft | 64 | % | 5 | ||||||||||||||||||||||||||||||||||||||||||||||||||||||||||||||||||||||
| 105 | Senior Loan | 6/14/2022 | 106 | 84 | 83 | +2.95 | % | +3.30 | % | 7/9/2027 | San Francisco | Mixed-Use | $173 / sqft | 76 | % | 3 | ||||||||||||||||||||||||||||||||||||||||||||||||||||||||||||||||||||||
| 106 | Senior Loan | 12/10/2018 | 82 | 82 | 82 | +4.57 | % | +5.28 | % | 12/3/2024 | London - UK | Office | $392 / sqft | 72 | % | 3 | ||||||||||||||||||||||||||||||||||||||||||||||||||||||||||||||||||||||
| 107 | Senior Loan | 3/9/2022 | 92 | 82 | 82 | +2.90 | % | +3.43 | % | 3/9/2025 | Boston | Office | $216 / sqft | 68 | % | 4 | ||||||||||||||||||||||||||||||||||||||||||||||||||||||||||||||||||||||
| 108 | Senior Loan | 7/29/2021 | 82 | 82 | 81 | +2.76 | % | +3.08 | % | 8/9/2026 | Charlotte | Multi | $222,786 / unit | 78 | % | 3 | ||||||||||||||||||||||||||||||||||||||||||||||||||||||||||||||||||||||
| 109 | Senior Loan | 8/27/2021 | 79 | 78 | 78 | +4.10 | % | +4.35 | % | 9/9/2026 | Diversified - US | Hospitality | $115,521 / key | 67 | % | 3 | ||||||||||||||||||||||||||||||||||||||||||||||||||||||||||||||||||||||
| 110 | Senior Loan | 11/23/2021 | 92 | 77 | 76 | +2.85 | % | +3.17 | % | 12/9/2026 | Los Angeles | Industrial | $219 / sqft | 66 | % | 3 | ||||||||||||||||||||||||||||||||||||||||||||||||||||||||||||||||||||||
| 111 |
Senior Loan
(4)
|
12/30/2021 | 228 | 73 | 14 | +4.00 | % | +4.99 | % | 1/9/2028 | Los Angeles | Multi | $209,770 / unit | 50 | % | 3 | ||||||||||||||||||||||||||||||||||||||||||||||||||||||||||||||||||||||
| 112 | Senior Loan | 12/21/2021 | 74 | 72 | 72 | +2.70 | % | +3.06 | % | 1/9/2027 | Tampa | Multi | $212,382 / unit | 77 | % | 2 | ||||||||||||||||||||||||||||||||||||||||||||||||||||||||||||||||||||||
| 113 | Senior Loan | 8/14/2019 | 70 | 70 | 70 | +2.56 | % | +2.80 | % | 9/9/2024 | Los Angeles | Office | $684 / sqft | 57 | % | 3 | ||||||||||||||||||||||||||||||||||||||||||||||||||||||||||||||||||||||
| 114 | Senior Loan | 10/28/2021 | 69 | 69 | 69 | +2.66 | % | +2.86 | % | 11/9/2026 | Tacoma | Multi | $209,864 / unit | 70 | % | 3 | ||||||||||||||||||||||||||||||||||||||||||||||||||||||||||||||||||||||
| 115 | Senior Loan | 8/17/2022 | 75 | 67 | 67 | +3.35 | % | +3.83 | % | 8/17/2027 | Dublin - IE | Industrial | $104 / sqft | 72 | % | 3 | ||||||||||||||||||||||||||||||||||||||||||||||||||||||||||||||||||||||
| 116 | Senior Loan | 3/24/2022 | 65 | 65 | 65 | +3.50 | % | +3.59 | % | 4/1/2027 | Fairfield | Multi | $406,250 / unit | 70 | % | 3 | ||||||||||||||||||||||||||||||||||||||||||||||||||||||||||||||||||||||
| 117 | Senior Loan | 7/30/2021 | 67 | 65 | 65 | +2.61 | % | +2.87 | % | 8/9/2026 | Los Angeles | Multi | $168,048 / unit | 70 | % | 2 | ||||||||||||||||||||||||||||||||||||||||||||||||||||||||||||||||||||||
| 118 | Senior Loan | 3/31/2022 | 70 | 65 | 64 | +2.80 | % | +3.14 | % | 4/9/2027 | Las Vegas | Multi | $141,534 / unit | 71 | % | 3 | ||||||||||||||||||||||||||||||||||||||||||||||||||||||||||||||||||||||
| 119 | Senior Loan | 12/17/2021 | 66 | 63 | 63 | +4.35 | % | +4.83 | % | 1/9/2026 | Diversified - US | Other | $4,794 / unit | 37 | % | 1 | ||||||||||||||||||||||||||||||||||||||||||||||||||||||||||||||||||||||
| 120 | Senior Loan | 8/16/2022 | 65 | 63 | 62 | +4.75 | % | +5.17 | % | 8/16/2027 | London - UK | Hospitality | $466,659 / key | 64 | % | 3 | ||||||||||||||||||||||||||||||||||||||||||||||||||||||||||||||||||||||
continued…
73
|
Loan Type
(1)
|
Origination
Date
(2)
|
Total
Loan
(3)(4)
|
Principal
Balance
(4)
|
Net Book
Value |
Cash
Coupon
(5)
|
All-in
Yield
(5)
|
Maximum
Maturity
(6)
|
Location | Property Type |
Loan Per
SQFT / Unit / Key |
Origination
LTV
(2)
|
Risk
Rating |
||||||||||||||||||||||||||||||||||||||||||||||||||||||||||||||||||||||||||
| 121 | Senior Loan | 3/31/2021 | $ | 62 | $ | 62 | $ | 62 | +3.99 | % | +4.30 | % | 4/1/2024 | Boston | Multi | $316,327 / unit | 75 | % | 3 | |||||||||||||||||||||||||||||||||||||||||||||||||||||||||||||||||||
| 122 | Senior Loan | 7/30/2021 | 62 | 62 | 62 | +2.86 | % | +3.06 | % | 8/9/2026 | Salt Lake City | Multi | $224,185 / unit | 73 | % | 3 | ||||||||||||||||||||||||||||||||||||||||||||||||||||||||||||||||||||||
| 123 | Senior Loan | 12/23/2021 | 61 | 61 | 61 | +2.29 | % | +2.29 | % | 10/31/2023 | New York | Office | $238 / sqft | 71 | % | 3 | ||||||||||||||||||||||||||||||||||||||||||||||||||||||||||||||||||||||
| 124 | Senior Loan | 6/30/2021 | 65 | 61 | 61 | +2.95 | % | +3.23 | % | 7/9/2026 | Nashville | Office | $250 / sqft | 71 | % | 3 | ||||||||||||||||||||||||||||||||||||||||||||||||||||||||||||||||||||||
| 125 | Senior Loan | 4/15/2021 | 66 | 60 | 60 | +3.06 | % | +3.34 | % | 5/9/2026 | Austin | Office | $293 / sqft | 73 | % | 3 | ||||||||||||||||||||||||||||||||||||||||||||||||||||||||||||||||||||||
| 126 |
Senior Loan
(4)
|
3/23/2020 | 59 | 59 | 12 | +3.82 | % | +4.63 | % | 4/9/2025 | Nashville | Office | $90 / sqft | 60 | % | 1 | ||||||||||||||||||||||||||||||||||||||||||||||||||||||||||||||||||||||
| 127 | Senior Loan | 12/17/2021 | 58 | 58 | 58 | +2.65 | % | +2.85 | % | 1/9/2027 | Phoenix | Multi | $209,601 / unit | 69 | % | 3 | ||||||||||||||||||||||||||||||||||||||||||||||||||||||||||||||||||||||
| 128 | Senior Loan | 7/16/2021 | 58 | 58 | 58 | +2.75 | % | +3.03 | % | 8/1/2025 | Orlando | Multi | $195,750 / unit | 74 | % | 2 | ||||||||||||||||||||||||||||||||||||||||||||||||||||||||||||||||||||||
| 129 | Senior Loan | 12/10/2020 | 61 | 56 | 56 | +3.30 | % | +3.56 | % | 1/9/2026 | Fort Lauderdale | Office | $194 / sqft | 68 | % | 3 | ||||||||||||||||||||||||||||||||||||||||||||||||||||||||||||||||||||||
| 130 | Senior Loan | 1/21/2022 | 68 | 55 | 55 | +3.70 | % | +4.09 | % | 2/9/2027 | Denver | Office | $327 / sqft | 65 | % | 3 | ||||||||||||||||||||||||||||||||||||||||||||||||||||||||||||||||||||||
| 131 | Senior Loan | 12/22/2021 | 55 | 55 | 54 | +2.82 | % | +2.96 | % | 1/1/2027 | Los Angeles | Multi | $272,500 / unit | 68 | % | 3 | ||||||||||||||||||||||||||||||||||||||||||||||||||||||||||||||||||||||
| 132 | Senior Loan | 8/22/2019 | 54 | 54 | 54 | +2.66 | % | +2.89 | % | 9/9/2024 | Los Angeles | Office | $310 / sqft | 63 | % | 3 | ||||||||||||||||||||||||||||||||||||||||||||||||||||||||||||||||||||||
| 133 | Senior Loan | 12/14/2018 | 54 | 54 | 54 | +3.01 | % | +3.27 | % | 1/9/2024 | Diversified - US | Industrial | $40 / sqft | 57 | % | 1 | ||||||||||||||||||||||||||||||||||||||||||||||||||||||||||||||||||||||
| 134 | Senior Loan | 11/11/2021 | 53 | 53 | 53 | +4.07 | % | +4.87 | % | 8/12/2026 | London - UK | Hospitality | $189,304 / key | 40 | % | 3 | ||||||||||||||||||||||||||||||||||||||||||||||||||||||||||||||||||||||
| 135 | Senior Loan | 8/5/2021 | 57 | 53 | 53 | +2.96 | % | +3.24 | % | 8/9/2026 | Denver | Office | $200 / sqft | 70 | % | 3 | ||||||||||||||||||||||||||||||||||||||||||||||||||||||||||||||||||||||
| 136 | Senior Loan | 12/9/2021 | 51 | 51 | 51 | +2.75 | % | +2.89 | % | 1/1/2027 | Portland | Multi | $241,825 / unit | 65 | % | 3 | ||||||||||||||||||||||||||||||||||||||||||||||||||||||||||||||||||||||
| 137 | Senior Loan | 2/17/2021 | 53 | 51 | 51 | +3.66 | % | +3.86 | % | 3/9/2026 | Miami | Multi | $290,985 / unit | 64 | % | 2 | ||||||||||||||||||||||||||||||||||||||||||||||||||||||||||||||||||||||
| 138 | Senior Loan | 7/28/2021 | 53 | 50 | 50 | +2.75 | % | +3.07 | % | 8/9/2026 | Los Angeles | Multi | $284,104 / unit | 71 | % | 3 | ||||||||||||||||||||||||||||||||||||||||||||||||||||||||||||||||||||||
| 139 | Senior Loan | 9/23/2021 | 49 | 49 | 49 | +2.75 | % | +2.86 | % | 10/1/2026 | Portland | Multi | $232,938 / unit | 65 | % | 3 | ||||||||||||||||||||||||||||||||||||||||||||||||||||||||||||||||||||||
| 140 | Senior Loan | 11/30/2016 | 57 | 49 | 49 | +3.18 | % | +3.40 | % | 12/9/2023 | Chicago | Retail | $805 / sqft | 54 | % | 4 | ||||||||||||||||||||||||||||||||||||||||||||||||||||||||||||||||||||||
| 141 | Senior Loan | 7/20/2021 | 48 | 48 | 48 | +2.86 | % | +3.21 | % | 8/9/2026 | Los Angeles | Multi | $366,412 / unit | 60 | % | 3 | ||||||||||||||||||||||||||||||||||||||||||||||||||||||||||||||||||||||
| 142 | Senior Loan | 2/1/2022 | 76 | 47 | 46 | +4.50 | % | +6.37 | % | 2/1/2027 | Diversified - UK | Life Sciences | $359 / sqft | 45 | % | 3 | ||||||||||||||||||||||||||||||||||||||||||||||||||||||||||||||||||||||
| 143 | Senior Loan | 12/29/2021 | 47 | 47 | 46 | +2.85 | % | +2.96 | % | 1/1/2027 | Dallas | Multi | $155,000 / unit | 73 | % | 3 | ||||||||||||||||||||||||||||||||||||||||||||||||||||||||||||||||||||||
| 144 | Senior Loan | 4/7/2022 | 57 | 46 | 46 | +3.25 | % | +3.54 | % | 4/9/2027 | Denver | Office | $136 / sqft | 59 | % | 3 | ||||||||||||||||||||||||||||||||||||||||||||||||||||||||||||||||||||||
| 145 | Senior Loan | 10/1/2019 | 48 | 46 | 46 | +3.80 | % | +4.24 | % | 10/9/2025 | Atlanta | Hospitality | $259,356 / key | 74 | % | 3 | ||||||||||||||||||||||||||||||||||||||||||||||||||||||||||||||||||||||
| 146 | Senior Loan | 10/21/2022 | 46 | 46 | 46 | +4.14 | % | +4.51 | % | 10/18/2027 | Diversified - DEU | Industrial | $64 / sqft | 74 | % | 3 | ||||||||||||||||||||||||||||||||||||||||||||||||||||||||||||||||||||||
| 147 | Senior Loan | 7/30/2021 | 45 | 45 | 45 | +2.75 | % | +2.86 | % | 8/1/2026 | Portland | Multi | $62,378 / unit | 64 | % | 3 | ||||||||||||||||||||||||||||||||||||||||||||||||||||||||||||||||||||||
| 148 | Senior Loan | 12/8/2021 | 48 | 43 | 43 | +2.75 | % | +2.96 | % | 12/9/2026 | Columbus | Multi | $139,936 / unit | 69 | % | 3 | ||||||||||||||||||||||||||||||||||||||||||||||||||||||||||||||||||||||
| 149 | Senior Loan | 7/29/2021 | 42 | 42 | 42 | +2.86 | % | +3.06 | % | 8/9/2026 | Las Vegas | Multi | $167,113 / unit | 72 | % | 2 | ||||||||||||||||||||||||||||||||||||||||||||||||||||||||||||||||||||||
| 150 | Senior Loan | 11/3/2021 | 41 | 41 | 41 | +2.71 | % | +3.05 | % | 11/9/2026 | Washington, DC | Multi | $137,788 / unit | 68 | % | 2 | ||||||||||||||||||||||||||||||||||||||||||||||||||||||||||||||||||||||
continued…
74
|
Loan Type
(1)
|
Origination
Date
(2)
|
Total
Loan
(3)(4)
|
Principal
Balance
(4)
|
Net Book
Value |
Cash
Coupon
(5)
|
All-in
Yield
(5)
|
Maximum
Maturity
(6)
|
Location | Property Type |
Loan Per
SQFT / Unit / Key |
Origination
LTV
(2)
|
Risk
Rating |
||||||||||||||||||||||||||||||||||||||||||||||||||||||||||||||||||||||||||
| 151 - 185 | Senior Loan | Various | 1,077 | 1,035 | 1,031 | +3.05 | % | +3.51 | % | 2.2 yrs | Various | Various | Various | 62 | % | 2.3 | ||||||||||||||||||||||||||||||||||||||||||||||||||||||||||||||||||||||
| CECL reserve | (463) | |||||||||||||||||||||||||||||||||||||||||||||||||||||||||||||||||||||||||||||||||||||
| Loans receivable, net | $ | 28,002 | $ | 24,913 | $ | 23,252 | + 3.38 | % | + 3.73 | % | 2.6 yrs | 64 | % | 2.9 | ||||||||||||||||||||||||||||||||||||||||||||||||||||||||||||||||||||||||
(1)
Senior loans include senior mortgages and similar credit quality loans, including related contiguous subordinate loans and pari passu participations in senior mortgage loans.
(2)
Date loan was originated or acquired by us, and the LTV as of such date, excluding any junior participations sold. Origination dates are subsequently updated to reflect material loan modifications.
(3)
Total loan amount reflects outstanding principal balance as well as any related unfunded loan commitment.
(4)
Total loan exposure reflects our aggregate exposure to each loan investment. As of September 30, 2023, total loan exposure, includes (i) loans with an outstanding principal balance of $23.8 billion that are included in our consolidated financial statements, (ii) $1.1 billion of non-consolidated senior interests in loans we have sold, which are not included in our consolidated financial statements, and excludes (iii) $48.8 million of junior loan interests that we have sold, but that remain included in our consolidated financial statements.
(5)
The weighted-average cash coupon and all-in yield are expressed as a spread over the relevant floating benchmark rates, which include SOFR, SONIA, EURIBOR, and other indices as applicable to each loan. As of September 30, 2023, 99% of our loans by total loan exposure earned a floating rate of interest, primarily indexed to SOFR. The remaining 1% of our loans by total loan exposure earned a fixed rate of interest. In addition to cash coupon, all-in yield includes the amortization of deferred origination and extension fees, loan origination costs, and purchase discounts, as well as the accrual of exit fees. Excludes loans accounted for under the cost-recovery method.
(6)
Maximum maturity assumes all extension options are exercised, however our loans may be repaid prior to such date.
(7)
This loan earns interest at a fixed rate. Cash coupon and all-in yield are expressed as a floating rate to include an interest rate swap that effectively converts the loan to a floating rate exposure.
75
ITEM 3. QUANTITATIVE AND QUALITATIVE DISCLOSURES ABOUT MARKET RISK
Interest Rate Risk
For information on financial reference rate reforms, refer to “Part I. Item 2. Management’s Discussion and Analysis of Financial Condition and Results of Operations – Reference Rate Reform” of this report and “Part I. Item 1A. Risk Factors—Risks Related to Our Lending and Investment Activities—The transition away from reference rates and use of alternative replacement reference rates may adversely affect net interest income related to our loans and investments or otherwise adversely affect our results of operations, cash flows and the market value of our investments” of our Annual Report on Form 10-K filed with the SEC on February 8, 2023.
Investment Portfolio Net Interest Income
Generally, our business model is such that rising interest rates will increase our net income, while declining interest rates will decrease net income. As of September 30, 2023, 99% of our loans by total loan exposure earned a floating rate of interest and were financed with liabilities that pay interest at floating rates, which resulted in an amount of net equity that is positively correlated to rising interest rates, subject to the impact of interest rate floors on certain of our floating rate loans.
The following table projects the earnings impact on our interest income and expense, net of incentive fees, for the twelve-month period following September 30, 2023
, of an increase in the various floating-rate indices referenced by our portfolio, assuming no change in credit spreads, portfolio composition, or asset performance, relative to the average indices during the three months ended September 30, 2023 ($ in thousands):
|
Assets (Liabilities) Sensitive to Changes in Interest Rates
(1)
|
Interest Rate Sensitivity as of September 30, 2023
(2)(3)
|
|||||||||||||||||||||||||||||||
| Increase in Rates | Decrease in Rates | |||||||||||||||||||||||||||||||
|
50 Basis Points
|
100 Basis Points
|
50 Basis Points | 100 Basis Points | |||||||||||||||||||||||||||||
|
Floating rate assets
(4)(5)
|
$ | 23,246,828 | $ | 88,562 | $ | 177,123 | $ | (88,562) | $ | (177,123) | ||||||||||||||||||||||
|
Floating rate liabilities
(5)(6)
|
(18,398,580) | (73,594) | (147,189) | 73,594 | 147,189 | |||||||||||||||||||||||||||
| Net exposure | $ | 4,848,248 | $ | 14,968 | $ | 29,934 | $ | (14,968) | $ | (29,934) | ||||||||||||||||||||||
(1)
Reflects the USD equivalent value of floating rate assets and liabilities denominated in foreign currencies.
(2)
Increases (decreases) in interest income and expense are presented net of incentive fees. Refer to Note 14 to our consolidated financial statements for additional details of our incentive fee calculation.
(3)
Excludes income from loans accounted for under the cost-recovery method.
(4)
Includes an interest rate swap with a notional amount of $229.9 million that effectively converts our fixed rate loan exposure to floating rate exposure.
(5)
Excludes $1.1 billion of non-consolidated senior interests and $275.7 million of loan participations sold, as of September 30, 2023. Our non-consolidated senior interests and loan participations sold are structurally non-recourse and term-matched to the corresponding loans, and have no impact on our net floating rate exposure.
(6)
Includes amounts outstanding under secured debt, securitizations, asset-specific debt, and term loans.
Investment Portfolio Value
As of September 30, 2023, 99% of our portfolio earned a floating rate of interest, so the value of such investments is generally not impacted by changes in market interest rates. As of September 30, 2023, the remaining 1% of our portfolio earned a fixed rate of interest and as such, the values of such loans are sensitive to changes in interest rates. Additionally, we generally hold all of our loans to maturity and so do not expect to realize gains or losses resulting from any mark to market valuation adjustments on our loan portfolio.
Risk of Non-Performance
In addition to the risks related to fluctuations in cash flows and asset values associated with movements in interest rates, there is also the risk of non-performance on floating rate assets. In the case of a significant increase in interest rates, the cash flows of the collateral real estate assets may not be sufficient to pay debt service due under our loans, which may contribute to non-performance or, in severe cases, default. This risk is partially mitigated by our consideration of rising rate stress-testing during our underwriting process, which generally includes a requirement for our borrower to purchase an interest rate cap contract with an unaffiliated third-party, provide an interest reserve deposit, and/or provide other structural guarantees.
76
Credit Risks
Our loans are also subject to credit risk, including the risk of default. The performance and value of our loans depend upon the sponsors’ ability to operate the properties that serve as our collateral so that they produce cash flows adequate to pay interest and principal due to us. To monitor this risk, our asset management team reviews our loan portfolios and, in certain instances, is in regular contact with our borrowers, monitoring performance of the collateral and enforcing our rights as necessary.
In addition, we are exposed to the risks generally associated with the commercial real estate market, including changes in occupancy rates, capitalization rates, absorption rates, and other macroeconomic factors beyond our control. We seek to manage these risks through our underwriting and asset management processes.
We maintain a robust asset management relationship with our borrowers and utilize these relationships to maximize the performance of our portfolio, including during periods of volatility. We believe that we benefit from these relationships and from our long-standing core business model of originating senior loans collateralized by large assets in major markets with experienced, well-capitalized institutional sponsors. Our loan portfolio’s low weighted-average origination LTV of 64.0%, excluding any junior participations sold, as of September 30, 2023 reflects significant equity value that we expect our sponsors will be motivated to protect through periods of cyclical disruption. While we believe the principal amounts of our loans are generally adequately protected by underlying collateral value, there is a risk that we will not realize the entire principal value of certain loans. As of September 30, 2023, we had an aggregate $322.6 million asset-specific CECL reserve related to ten of our loans receivable, with an aggregate amortized cost basis of $1.4 billion, net of cost-recovery proceeds. This CECL reserve was recorded based on our estimation of the fair value of each of the loan’s underlying collateral as of September 30, 2023.
Our portfolio monitoring and asset management operations benefit from the deep knowledge, experience, and information advantages derived from our position as part of Blackstone’s real estate platform. Blackstone has built the world's preeminent global real estate business, with a proven track record of successfully navigating market cycles and emerging stronger through periods of volatility. The market-leading real estate expertise derived from the strength of the Blackstone platform deeply informs our credit and underwriting process, and we believe gives us the tools to expertly asset manage our portfolio and work with our borrowers throughout periods of economic stress and uncertainty.
The nine months ended September 30, 2023 have been characterized by continued volatility in global markets, driven by investor concerns over inflation, rising interest rates, slowing economic growth, political and regulatory uncertainty and geopolitical conditions. Recent events affecting financial institutions have also contributed to volatility in global markets and diminished liquidity and credit availability in the market broadly.
Continued inflation has prompted central banks to take monetary policy tightening actions, including raising interest rates, which has created further uncertainty for the economy and for our borrowers. Although our business model is such that rising interest rates will, all else equal, correlate to increases in our net income, increases in interest rates may adversely affect our existing borrowers and lead to nonperformance. Additionally, rising rates and increasing costs may dampen consumer spending and slow corporate profit growth, which may negatively impact the collateral underlying certain of our loans. It remains difficult to predict the full impact of recent events and any future changes in interest rates or inflation.
Capital Market Risks
We are exposed to risks related to the equity capital markets, and our related ability to raise capital through the issuance of our class A common stock or other equity instruments. We are also exposed to risks related to the debt capital markets, and our related ability to finance our business through borrowings under credit facilities or other debt instruments. As a REIT, we are required to distribute a significant portion of our taxable income annually, which constrains our ability to accumulate operating cash flow and therefore requires us to utilize debt or equity capital to finance our business. We seek to mitigate these risks by monitoring the debt and equity capital markets to inform our decisions on the amount, timing, and terms of capital we raise.
Margin call provisions under our credit facilities do not permit valuation adjustments based on capital markets events, and are limited to collateral-specific credit marks generally determined on a commercially reasonable basis.
Counterparty Risk
The nature of our business requires us to hold our cash and cash equivalents and obtain financing from various financial institutions. This exposes us to the risk that these financial institutions may not fulfill their obligations to us under these
77
various contractual arrangements. We mitigate this exposure by depositing our cash and cash equivalents and entering into financing agreements with high credit-quality institutions.
The nature of our loans also exposes us to the risk that our counterparties do not make required interest and principal payments on scheduled due dates. We seek to manage this risk through a comprehensive credit analysis prior to making a loan and active monitoring of the asset portfolios that serve as our collateral, as further discussed above.
Currency Risk
Our loans that are denominated in a foreign currency are also subject to risks related to fluctuations in currency rates. We generally mitigate this exposure by matching the currency of our assets to the currency of the financing for our assets. As a result, we substantially reduce our exposure to changes in portfolio value related to changes in foreign currency rates. In addition, substantially all of our net asset exposure to foreign currencies has been hedged with foreign currency forward contracts as of September 30, 2023.
The following table outlines our assets and liabilities that are denominated in a foreign currency (amounts in thousands):
| September 30, 2023 | |||||||||||||||||
| GBP | EUR |
All Other
(2)
|
|||||||||||||||
| Foreign currency assets | £ | 2,933,335 | € | 2,568,586 | $ | 2,003,299 | |||||||||||
| Foreign currency liabilities | (2,201,911) | (1,884,129) | (1,570,113) | ||||||||||||||
| Foreign currency contracts – notional | (722,576) | (676,126) | (427,009) | ||||||||||||||
| Net exposure to exchange rate fluctuations | £ | 8,848 | € | 8,331 | $ | 6,177 | |||||||||||
|
Net exposure to exchange rate fluctuations in USD
(1)
|
$ | 10,794 | $ | 8,808 | $ | 6,177 | |||||||||||
(1)
Represents the U.S. Dollar equivalent as of September 30, 2023.
(2)
Includes Swedish Krona, Australian Dollar, Swiss Franc, and Danish Krone currencies.
ITEM 4. CONTROLS AND PROCEDURES
Evaluation of Disclosure Controls and Procedures
The company maintains disclosure controls and procedures (as that term is defined in Rules 13a-15(e) and 15d-15(e) under the Exchange Act) that are designed to ensure that information required to be disclosed in the company’s reports under the Exchange Act is recorded, processed, and summarized and reported within the time periods specified in the SEC’s rules and forms, and that such information is accumulated and communicated to the company’s management, including its Chief Executive Officer and Chief Financial Officer, as appropriate, to allow timely decisions regarding required disclosures. Any controls and procedures, no matter how well designed and operated, can provide only reasonable assurance of achieving the desired control objectives. An evaluation of the effectiveness of the design and operation of our disclosure controls and procedures as of the end of the period covered by this Quarterly Report on Form 10-Q was made under the supervision and with the participation of our management, including our Chief Executive Officer and Chief Financial Officer. Based upon this evaluation, our Chief Executive Officer and Chief Financial Officer have concluded that our disclosure controls and procedures (a) are effective to ensure that information required to be disclosed by us in reports filed or submitted under the Exchange Act is recorded, processed, summarized and reported within the time periods specified by SEC rules and forms and (b) include, without limitation, controls and procedures designed to ensure that information required to be disclosed by us in reports filed or submitted under the Exchange Act is accumulated and communicated to our management, including our Chief Executive Officer and Chief Financial Officer, as appropriate to allow timely decisions regarding required disclosure.
Changes in Internal Control over Financial Reporting
There have been no changes in our “internal control over financial reporting” (as defined in Rule 13a–15(f) of the Exchange Act) that occurred during the period covered by this Quarterly Report on Form 10-Q that have materially affected, or are reasonably likely to materially affect, our internal control over financial reporting.
78
PART II. OTHER INFORMATION
ITEM 1. LEGAL PROCEEDINGS
From time to time, we may be involved in various claims and legal actions arising in the ordinary course of business. As of September 30, 2023, we were not involved in any material legal proceedings.
ITEM 1A. RISK FACTORS
There have been no material changes to the risk factors previously disclosed under ''Part I, Item 1A. Risk Factors" of our Annual Report on Form 10-K for the year ended December 31, 2022.
ITEM 2. UNREGISTERED SALES OF EQUITY SECURITIES, USE OF PROCEEDS, AND ISSUER PURCHASES OF EQUITY SECURITIES
None.
ITEM 3. DEFAULTS UPON SENIOR SECURITIES
None.
ITEM 4. MINE SAFETY DISCLOSURES
Not applicable.
ITEM 5. OTHER INFORMATION
Section 13(r) Disclosure
Pursuant to Section 219 of the Iran Threat Reduction and Syria Human Rights Act of 2012, which added Section 13(r) of the Exchange Act, we hereby incorporate by reference herein Exhibit 99.1 of this report, which includes disclosures regarding activities at Mundys S.p.A. (formerly “Atlantia S.p.A.”), which may be, or may have been at the time considered to be, an affiliate of Blackstone and, therefore, our affiliate.
79
| ITEM 6. | EXHIBITS | ||||
| 31.1 | ||||||||
| 31.2 | ||||||||
| 32.1 + | ||||||||
| 32.2 + | ||||||||
| 99.1 | ||||||||
| 101.INS | XBRL Instance Document – the instance document does not appear in the interactive data file because its XBRL tags are embedded within the inline XBRL document | |||||||
| 101.SCH | Inline XBRL Taxonomy Extension Schema Document | |||||||
| 101.CAL | Inline XBRL Taxonomy Extension Calculation Linkbase Document | |||||||
| 101.LAB | Inline XBRL Taxonomy Extension Label Linkbase Document | |||||||
| 101.PRE | Inline XBRL Taxonomy Extension Presentation Linkbase Document | |||||||
| 101.DEF | Inline XBRL Taxonomy Extension Definition Linkbase Document | |||||||
| 104 | Cover Page Interactive Data File (formatted as Inline XBRL and contained in Exhibit 101) | |||||||
___________
+
This exhibit shall not be deemed “filed” for purposes of Section 18 of the Exchange Act or otherwise subject to the liability of that Section. Such exhibit shall not be deemed incorporated into any filing under the Securities Act or the Exchange Act.
The agreements and other documents filed as exhibits to this report are not intended to provide factual information or other disclosure other than with respect to the terms of the agreements or other documents themselves, and you should not rely on them for that purpose. In particular, any representations and warranties made by us in these agreements or other documents were made solely within the specific context of the relevant agreement or document and may not describe the actual state of affairs as of the date they were made or at any other time.
80
SIGNATURES
Pursuant to the requirements of the Securities Exchange Act of 1934, the registrant has duly caused this report to be signed on its behalf by the undersigned thereunto duly authorized.
| BLACKSTONE MORTGAGE TRUST, INC. | ||||||||
| October 25, 2023 | /s/ Katharine A. Keenan | |||||||
| Date | Katharine A. Keenan | |||||||
| Chief Executive Officer | ||||||||
| (Principal Executive Officer) | ||||||||
| October 25, 2023 | /s/ Anthony F. Marone, Jr. | |||||||
| Date | Anthony F. Marone, Jr. | |||||||
| Chief Financial Officer | ||||||||
| (Principal Financial Officer and | ||||||||
| Principal Accounting Officer) | ||||||||
81
TABLE OF CONTENTS
Part I. Financial InformationItem 1. Financial StatementsItem 2. Management S Discussion and Analysis Of Financial Condition and Results Of OperationsItem 3. Quantitative and Qualitative Disclosures About Market RiskItem 4. Controls and ProceduresPart II. Other InformationItem 1. Legal ProceedingsItem 1A. Risk FactorsItem 2. Unregistered Sales Of Equity Securities, Use Of Proceeds, and Issuer Purchases Of Equity SecuritiesItem 3. Defaults Upon Senior SecuritiesItem 4. Mine Safety DisclosuresItem 5. Other InformationItem 6. Exhibits