BOYD GAMING CORP
10-Ks and 10-Qs
|
|
|
|
|
|
|
|
|
|
|
|
|
|
|
|
|
|
|
|
|
|
|
|
|
|
|
|
|
|
|
|
|
|
|
|
|
|
|
|
|
|
|
|
|
|
|
|
|
|
|
|
|
|
|
|
UNITED STATES
SECURITIES AND EXCHANGE COMMISSION
WASHINGTON, D.C. 20549
____________________________________________________
FORM 10-K
____________________________________________________
(Mark One)
|
x
|
ANNUAL REPORT PURSUANT TO SECTION 13 OR 15(d) OF THE SECURITIES EXCHANGE ACT OF 1934
|
For the fiscal year ended
December 31, 2017
OR
|
o
|
TRANSITION REPORT PURSUANT TO SECTION 13 OR 15(d) OF THE SECURITIES EXCHANGE ACT OF 1934
|
Commission file number: 1-12882
____________________________________________________

BOYD GAMING CORPORATION
(Exact name of registrant as specified in its charter)
____________________________________________________
|
Nevada
|
|
88-0242733
|
|
(State or other jurisdiction of
incorporation or organization)
|
|
(I.R.S. Employer
Identification No.)
|
3883 Howard Hughes Parkway, Ninth Floor, Las Vegas, NV 89169
(Address of principal executive offices) (Zip Code)
(702) 792-7200
(Registrant’s telephone number, including area code)
Securities registered pursuant to Section 12(b) of the Act:
|
Title of each class
|
Name of each exchange on which registered
|
|
Common Stock, par value of $0.01 per share
|
New York Stock Exchange
|
Securities registered pursuant to Section 12(g) of the Act: None
Indicate by check mark if the registrant is a well-known seasoned issuer, as defined in Rule 405 of the Securities Act. Yes
x
No
o
Indicate by check mark if the registrant is not required to file reports pursuant to Section 13 or Section 15(d) of the Act. Yes
o
No
x
Indicate by check mark whether the registrant (1) has filed all reports required to be filed by Section 13 or 15(d) of the Securities Exchange Act of 1934 during the preceding 12 months (or for such shorter period that the registrant was required to file such reports), and (2) has been subject to such filing requirements for the past 90 days. Yes
x
No
o
Indicate by check mark whether the registrant has submitted electronically and posted on its corporate Website, if any, every Interactive Data File required to be submitted and posted pursuant to Rule 405 of Regulation S-T (§232.405 of this chapter) during the preceding 12 months (or for such shorter period that the registrant was required to submit and post such files). Yes
x
No
o
Indicate by check mark if disclosure of delinquent filers pursuant to Item 405 of Regulation S-K (§229.405 of this chapter) is not contained herein, and will not be contained, to the best of registrant's knowledge, in definitive proxy or information statements incorporated by reference in Part III of this Form 10-K or any amendment to this Form 10-K.
x
Indicate by check mark whether the registrant is a large accelerated filer, an accelerated filer, a non-accelerated filer, a smaller reporting company, or an emerging growth company. See the definitions of "large accelerated filer," "accelerated filer," "smaller reporting company," and "emerging growth company" in Rule 12b-2 of the Exchange Act.
|
Large accelerated filer
|
|
x
|
Accelerated filer
|
|
o
|
|
|
Non-accelerated filer
|
|
o
(Do not check if a smaller reporting company)
|
Smaller reporting company
|
|
o
|
|
|
Emerging growth company
|
o
|
|||||
If an emerging growth company, indicate by check mark if the registrant has elected not to use the extended transition period for complying with any new or revised financial accounting standards provided pursuant to Section 13(a) of the Exchange Act.
o
Indicate by check mark whether the registrant is a shell company (as defined in Rule 12b-2 of the Exchange Act). Yes
o
No
x
As of June 30, 2017, the aggregate market value of the voting common stock held by non-affiliates of the registrant, based on the closing price on the New York Stock Exchange for such date, was approximately
$2.0 billion
.
Indicate the number of shares outstanding of each of the issuer’s classes of common stock, as of the latest practicable date.
|
Class
|
Outstanding as of February 21, 2018
|
|||
|
Common stock, $0.01 par value
|
112,507,885
|
|||
DOCUMENTS INCORPORATED BY REFERENCE
Portions of the definitive Proxy Statement for the registrant's 2018 Annual Meeting of Stockholders to be filed pursuant to Regulation 14A within 120 days after the registrant's fiscal year end of December 31, 2017 are incorporated by reference into Part III of this Form 10-K.
BOYD GAMING CORPORATION
ANNUAL REPORT ON FORM 10-K
FOR THE FISCAL YEAR ENDED
DECEMBER 31, 2017
TABLE OF CONTENTS
|
|
|
Page No.
|
|
|
PART I
|
|
|
ITEM 1.
|
||
|
ITEM 1A.
|
||
|
ITEM 1B.
|
||
|
ITEM 2.
|
||
|
ITEM 3.
|
||
|
ITEM 4.
|
||
|
|
PART II
|
|
|
ITEM 5.
|
||
|
ITEM 6.
|
||
|
ITEM 7.
|
||
|
ITEM 7A.
|
||
|
ITEM 8.
|
||
|
ITEM 9.
|
||
|
ITEM 9A.
|
||
|
ITEM 9B
.
|
||
|
|
PART III
|
|
|
ITEM 10.
|
||
|
ITEM 11.
|
||
|
ITEM 12.
|
||
|
ITEM 13.
|
||
|
ITEM 14.
|
||
|
|
PART IV
|
|
|
ITEM 15.
|
||
|
ITEM 16.
|
||
|
|
||
Overview
Boyd Gaming Corporation (the "Company," the "Registrant," "Boyd Gaming," "we" or "us") is a multi-jurisdictional gaming company that has been in operation since 1975. Headquartered in Las Vegas, we have 24 wholly owned gaming entertainment properties in Nevada, Illinois, Indiana, Iowa, Kansas, Louisiana and Mississippi.
Our primary areas of focus are: (i) ensuring our existing operations are managed as efficiently as possible and remain positioned for growth, including our strategic investing in non-gaming amenities; (ii) improving our capital structure and strengthening our balance sheet, including paying down debt, improving operations and diversifying our asset base; and (iii) successfully implementing our growth strategy, which is built on identifying development opportunities and acquiring assets that are a good strategic fit and provide an appropriate return to our shareholders.
Over the past several years, we have undertaken several programs aimed at reducing our cost structure in an effort to manage our properties' operations under tightened revenue trends. We have established a more efficient business model that we believe is helping us realize improved results, and we believe we have an opportunity to realize additional cost savings by leveraging our size and scale. We have strategically reinvested in our non-gaming amenities, including hotel rooms and restaurants, via a multi-year program that has now been completed to better capitalize on customers' evolving spending behaviors. We continue to manage our cost and expense structure to adjust to current business volumes and to generate strong and stable cash flows.
During 2017, we completed several transactions that improved our long-term financial position and strengthened our balance sheet. During first quarter 2017, we entered into Amendment No. 2 and Refinancing Amendment to our credit agreement which combined the Term B-1 Loan and Term B-2 Loan into the Refinancing Term B Loans. Since first quarter 2017, we have paid $85.0 million in prepayments on our Refinancing Term B Loans. On May 2, 2017, the Company announced that its Board of Directors had reaffirmed the Company's existing share repurchase program and authorized the reinstatement of the Company’s cash dividend program. Starting in second quarter 2017, the Company repurchased 1.2 million shares. The Company declared quarterly dividends of
$0.05
per share on May 2, 2017, September 6, 2017 and December 7, 2017.
We continually work to position our Company for greater success by strengthening our existing operations and growing through capital investment and other strategic initiatives. An example is our recent strategic initiative to enhance our non-gaming amenities at properties across the country that is designed to ensure our properties remain competitive and compelling to customers across generations. This initiative began in 2014 and continued into 2017, a period during which we invested over $100 million in these amenities. We have redesigned and enhanced approximately 3,100 hotel rooms at our properties across the country. We also introduced new food and beverage concepts across the Company, including Alder & Birch, Copper Whisk, Ondori, Bailiwick and the French Market Buffet at The Orleans, California Noodle House at the California, the Filament Bar at Fremont and the Filament Meetery & Eatery at Diamond Jo Dubuque, the Spotted Horse and Fast & Lucy’s Pub at Evangeline Downs, Angry Butcher and Big Mess BBQ at Sam's Town Las Vegas and Brigg’s Oyster Company at Suncoast.
On December 18, 2017, we announced that we had entered into a definitive agreement with Penn National Gaming, Inc. (the "Penn National Purchase Agreement"), to acquire the operations of four properties, which include Ameristar St. Charles and Ameristar Kansas City, both in Missouri, Belterra Casino Resort in Florence, Indiana, and Belterra Park in Cincinnati, Ohio, for total cash consideration of $575.0 million (the "Penn National Purchase"). As part of the transaction, we will enter into a master lease agreement with Gaming and Leisure Properties, Inc. ("GLPI"), which owns the real estate of Ameristar St. Charles, Ameristar Kansas City and Belterra Casino Resort. GLPI has entered into an agreement to purchase the real estate of Belterra Park from Penn National, and Belterra Park’s real estate will be leased to us as part of our master lease agreement with GLPI. The terms of our lease agreement will be substantially similar to Pinnacle’s current master lease with GLPI.
On December 20, 2017, we announced that we had entered into a definitive agreement with Valley Forge Convention Center Partners, L.P. (the "Valley Forge Merger Agreement"), to acquire Valley Forge Casino Resort in King of Prussia, Pennsylvania, for total cash consideration of $280.5 million (the "Valley Forge Merger").
The purchase price in each acquisition is subject to adjustment based on cash, working capital and indebtedness at closing. The completion of each acquisition is subject to customary conditions, including the receipt of all required regulatory approvals. In addition, the Penn National Purchase is also contingent upon the successful completion of Penn National’s proposed acquisition of Pinnacle Entertainment, Inc. Both acquisitions are currently expected to close in the second half of 2018.
We believe that the following factors have contributed to our success in the past and are central to our success in the future:
1
|
•
|
nine of our Las Vegas properties are well-positioned to capitalize on the attractive Las Vegas locals market;
|
|
•
|
our three downtown Las Vegas properties focus a majority of their marketing programs on, and derive a majority of their revenues from, a unique niche - Hawaiian customers;
|
|
•
|
our operations are geographically diversified within the United States;
|
|
•
|
we have strengthened our balance sheet and have increasing free cash flow;
|
|
•
|
we have the ability to expand certain existing properties and make opportunistic and strategic acquisitions; and
|
|
•
|
we have an experienced management team.
|
Properties
As of
December 31, 2017
, we own and operate 24 properties offering a total of
1,358,856
square feet of casino space,
30,267
slot machines,
632
table games and
9,372
hotel rooms. We derive the majority of our gross revenues from our gaming operations, which generated approximately
75%
of gross revenues for both
2017
and
2016
and 76% of gross revenues in
2015
. Food and beverage gross revenues represent our next most significant revenue source, generating approximately
13%
of gross revenues for
2017
,
2016
, and
2015
. Room revenues and other revenues each contributed less than 10% of gross revenues during each year.
We view each operating property as an operating segment. For financial reporting purposes, we aggregate our properties into three reportable business segments: (i) Las Vegas Locals; (ii) Downtown Las Vegas; and (iii) Midwest and South.
As a result of the sale of our equity interest in Borgata (see Note 2,
Acquisitions and Divestitures
), we report our interest in Borgata as discontinued operations. As of September 27, 2016, our Las Vegas Locals segment includes our wholly owned subsidiary Aliante, and as of December 20, 2016, our Las Vegas Locals segment includes our wholly owned subsidiaries Cannery and Eastside Cannery. See Note 2,
Acquisitions and Divestitures,
to our consolidated financial statements presented in Part II, Item 8 for further discussion of these activities.
For financial information related to our segments as of and for the three years in the period ended
December 31, 2017
, see Note 13,
Segment Information,
to our consolidated financial statements presented in Part II, Item 8
.
2
The following table sets forth certain information regarding our properties (listed by the Reportable Segment in which each such property is reported), as of and for the year ended
December 31, 2017
:
|
Year Opened or Acquired
|
Casino Space (Sq. ft.)
|
Slot Machines
|
Table Games
|
Hotel Rooms
|
Hotel Occupancy
|
Average Daily Rate
|
||||||||||||
|
Las Vegas Locals
|
||||||||||||||||||
|
Las Vegas, Nevada
|
||||||||||||||||||
|
Gold Coast Hotel and Casino
|
2004
|
88,915
|
|
1,768
|
|
49
|
|
712
|
|
81
|
%
|
$ 58
|
||||||
|
The Orleans Hotel and Casino
|
2004
|
137,000
|
|
2,407
|
|
60
|
|
1,885
|
|
84
|
%
|
$ 66
|
||||||
|
Sam's Town Hotel and Gambling Hall
|
1979
|
120,681
|
|
1,876
|
|
28
|
|
645
|
|
87
|
%
|
$ 60
|
||||||
|
Suncoast Hotel and Casino
|
2004
|
95,898
|
|
1,830
|
|
32
|
|
427
|
|
84
|
%
|
$ 80
|
||||||
|
Eastside Cannery Casino and Hotel
|
2016
|
63,879
|
|
1,170
|
|
13
|
|
306
|
|
78
|
%
|
$ 62
|
||||||
|
North Las Vegas, Nevada
|
||||||||||||||||||
|
Aliante Casino + Hotel + Spa
|
2016
|
125,000
|
|
1,825
|
|
37
|
|
202
|
|
91
|
%
|
$ 101
|
||||||
|
Cannery Casino Hotel
|
2016
|
86,000
|
|
1,531
|
|
22
|
|
200
|
|
91
|
%
|
$ 66
|
||||||
|
Henderson, Nevada
|
||||||||||||||||||
|
Eldorado Casino
|
1993
|
17,756
|
|
310
|
|
—
|
|
N/A
|
|
N/A
|
|
N/A
|
||||||
|
Jokers Wild Casino
|
1993
|
23,698
|
|
394
|
|
6
|
|
N/A
|
|
N/A
|
|
N/A
|
||||||
|
Downtown Las Vegas
|
||||||||||||||||||
|
Las Vegas, Nevada
|
||||||||||||||||||
|
California Hotel and Casino
|
1975
|
35,848
|
|
985
|
|
28
|
|
781
|
|
84
|
%
|
$ 45
|
||||||
|
Fremont Hotel and Casino
|
1985
|
30,244
|
|
944
|
|
26
|
|
447
|
|
91
|
%
|
$ 49
|
||||||
|
Main Street Station Casino, Brewery and Hotel
|
1993
|
26,918
|
|
824
|
|
19
|
|
406
|
|
94
|
%
|
$ 48
|
||||||
|
Midwest and South
|
||||||||||||||||||
|
East Peoria, Illinois
|
||||||||||||||||||
|
Par-A-Dice Hotel Casino
|
1996
|
26,116
|
|
907
|
|
25
|
|
202
|
|
80
|
%
|
$ 68
|
||||||
|
Michigan City, Indiana
|
||||||||||||||||||
|
Blue Chip Casino, Hotel & Spa
|
1999
|
65,000
|
|
1,690
|
|
40
|
|
486
|
|
79
|
%
|
$ 78
|
||||||
|
Dubuque, Iowa
|
||||||||||||||||||
|
Diamond Jo Dubuque
|
2012
|
43,495
|
|
918
|
|
20
|
|
N/A
|
|
N/A
|
|
N/A
|
||||||
|
Northwood, Iowa
|
||||||||||||||||||
|
Diamond Jo Worth
|
2012
|
38,721
|
|
915
|
|
32
|
|
N/A
|
|
N/A
|
|
N/A
|
||||||
|
Mulvane, Kansas
|
||||||||||||||||||
|
Kansas Star Casino
|
2012
|
70,010
|
|
1,769
|
|
52
|
|
N/A
|
|
N/A
|
|
N/A
|
||||||
|
Amelia, Louisiana
|
||||||||||||||||||
|
Amelia Belle Casino
|
2012
|
27,484
|
|
838
|
|
15
|
|
N/A
|
|
N/A
|
|
N/A
|
||||||
|
Vinton, Louisiana
|
||||||||||||||||||
|
Delta Downs Racetrack Casino & Hotel
|
2001
|
15,000
|
|
1,632
|
|
—
|
|
370
|
|
68
|
%
|
$ 72
|
||||||
|
Opelousas, Louisiana
|
||||||||||||||||||
|
Evangeline Downs Racetrack and Casino
|
2012
|
39,208
|
|
1,360
|
|
—
|
|
N/A
|
|
N/A
|
|
N/A
|
||||||
|
Shreveport, Louisiana
|
||||||||||||||||||
|
Sam's Town Hotel and Casino
|
2004
|
29,285
|
|
999
|
|
25
|
|
514
|
|
73
|
%
|
$ 74
|
||||||
|
Kenner, Louisiana
|
||||||||||||||||||
|
Treasure Chest Casino
|
1997
|
25,000
|
|
1,016
|
|
32
|
|
N/A
|
|
N/A
|
|
N/A
|
||||||
|
Biloxi, Mississippi
|
||||||||||||||||||
|
IP Casino Resort Spa
|
2011
|
81,700
|
|
1,538
|
|
52
|
|
1,089
|
|
85
|
%
|
$ 69
|
||||||
|
Tunica, Mississippi
|
||||||||||||||||||
|
Sam's Town Hotel and Gambling Hall
|
1994
|
46,000
|
|
821
|
|
19
|
|
700
|
|
52
|
%
|
$ 56
|
||||||
|
Total
|
1,358,856
|
|
30,267
|
|
632
|
|
9,372
|
|
||||||||||
|
N/A = Not Applicable
|
||||||||||||||||||
3
In addition to these properties, we own and operate a travel agency and a captive insurance company that underwrites travel-related insurance, each located in Hawaii. Financial results for these operations are included in our Downtown Las Vegas segment, as our Downtown Las Vegas properties concentrate their marketing efforts on gaming customers from Hawaii.
Las Vegas Locals Properties
Our Las Vegas Locals segment consists of nine casinos that primarily serve the resident population of the Las Vegas metropolitan area. Las Vegas has historically been characterized by a vibrant economy and strong demographics that include a large population of retirees and other active gaming customers. In recent years, the Las Vegas economy has strengthened, as reflected in the positive trends in employment, construction activity and visitation. Our Las Vegas Locals segment competes directly with other locals casinos and gaming companies, some of which operate larger casinos and offer different promotions than ours.
Gold Coast Hotel and Casino
Gold Coast Hotel and Casino ("Gold Coast") is located on Flamingo Road, approximately one mile west of the Las Vegas Strip and one-quarter mile west of Interstate 15, the major highway linking Las Vegas and southern California. Its location offers easy access from all four directions in the Las Vegas valley. The primary target market for Gold Coast consists of local middle-market customers who actively gamble. Gold Coast's amenities include
712
hotel rooms and suites along with meeting facilities, multiple restaurant options, a 70-lane bowling center and gaming, including slots, table games, a race and sports book and a bingo center.
The Orleans Hotel and Casino
The Orleans Hotel and Casino ("The Orleans") is located on Tropicana Avenue, a short distance from the Las Vegas Strip. The target markets for The Orleans are both local residents and visitors to the Las Vegas area. The Orleans provides an exciting New Orleans French Quarter-themed environment. Amenities at The Orleans include
1,885
hotel rooms, a variety of restaurants and bars, a spa and fitness center, 18 stadium-seating movie theaters, a 70-lane bowling center, banquet and meeting space, and a special events arena that seats up to 9,500 patrons.
Sam's Town Hotel and Gambling Hall
Sam's Town Hotel and Gambling Hall ("Sam's Town Las Vegas") is located on the Boulder Strip, approximately six miles east of the Las Vegas Strip, and features a contemporary western theme. Its informal, friendly atmosphere appeals to both local residents and visitors alike. Amenities at Sam's Town Las Vegas include
645
hotel rooms, a variety of restaurants and bars, 18 stadium-seating movie theaters, and a 56-lane bowling center.
Suncoast Hotel and Casino
Suncoast Hotel and Casino ("Suncoast") is located in Peccole Ranch, a master-planned community adjacent to Summerlin, and is readily accessible from most major points in Las Vegas, including downtown and the Las Vegas Strip. The primary target market for Suncoast consists of local middle-market customers who gamble frequently. Suncoast features
427
hotel rooms, multiple restaurant options, 25,000 square feet of banquet and meeting facilities, 16 stadium-seating movie theaters, and a 64-lane bowling center.
Eastside Cannery Casino and Hotel
Eastside Cannery is located directly south of Sam's Town Las Vegas at the intersection of Boulder Highway and Harmon Avenue in Las Vegas. Its location offers easy access for both the Las Vegas and Henderson valleys. Eastside Cannery has a
63,879
-square-foot casino,
306
hotel rooms, five restaurants and four bars, 20,000 square feet of meeting and ballroom space, and a 250-seat entertainment lounge.
Aliante Casino + Hotel + Spa
Aliante is located in North Las Vegas adjacent to an 18-hole championship golf course and has convenient access to major freeways connecting it to points throughout Las Vegas. The primary target market for Aliante consists of local high-end customers who gamble frequently. Aliante features a full-service Scottsdale-modern, desert-inspired casino and resort, which includes
202
hotel rooms, multiple restaurant options, 125,000 square feet of gaming space, a 200-seat bingo room, a 16-screen movie theater complex, a 587-seat showroom, a spa, and a resort style pool with cabanas.
Cannery Casino Hotel
Cannery is located in the Eastern part of the Las Vegas Valley and has convenient access to major freeways connecting it to points throughout Las Vegas. The primary target market for Cannery consists of local, casual working-class customers who gamble frequently. The Cannery has an
86,000
-square-foot casino, a
200
-room hotel, five restaurants and five bars, a 30,000 square foot entertainment venue and a 14-screen movie theater.
4
Eldorado Casino and Jokers Wild Casino
Located in downtown Henderson, the Eldorado Casino ("Eldorado") is approximately 14 miles from the Las Vegas Strip. Jokers Wild Casino ("Jokers Wild") is also located in Henderson. The amenities at each of these properties include a sports book and dining options, as well as gaming, including slots at both properties and table games at Jokers Wild. The principal customers of these properties are Henderson residents.
Downtown Las Vegas Properties
Our three Downtown Las Vegas properties directly compete with eight other casinos that operate in downtown Las Vegas. As such, we have developed a distinct niche for our downtown properties by focusing on customers from Hawaii. Our downtown properties focus their marketing on gaming enthusiasts from Hawaii and tour and travel agents in Hawaii with whom we have cultivated relationships since we opened our California Hotel and Casino (the "Cal") in 1975. Through our Hawaiian travel agency, Vacations Hawaii, we operate as many as four charter flights from Honolulu to Las Vegas each week, helping to provide air transportation for our customers. We also have strong, informal relationships with other Hawaiian travel agencies and offer affordable all-inclusive packages. These relationships, combined with our Hawaiian promotions, have allowed the Cal, Fremont Hotel and Casino ("Fremont") and Main Street Station Casino, Brewery and Hotel ("Main Street Station") to capture a significant share of the Hawaiian tourist trade in Las Vegas. During the year ended
December 31, 2017
, patrons from Hawaii comprised approximately 69% of the occupied room nights at the Cal, 37% of the occupied room nights at Fremont, and 45% of the occupied room nights at Main Street Station.
California Hotel and Casino
The Cal's amenities include
781
hotel rooms, multiple dining options, a sports book, and meeting space. The Cal and Main Street Station are connected by an indoor pedestrian bridge.
Fremont Hotel and Casino
Fremont is adjacent to the principal pedestrian thoroughfare in downtown Las Vegas, known as the Fremont Street Experience. The property's amenities include
447
hotel rooms, a race and sports book, and meeting space.
Main Street Station Casino, Brewery and Hotel
Main Street Station's amenities include
406
hotel rooms and three restaurants, one of which includes a brewery. In addition, Main Street Station features a 96-space recreational vehicle park, the only such facility in the downtown area.
Midwest and South Properties
Our Midwest and South properties consist of three land-based casinos, five dockside riverboat casinos, two racinos and two barge-based casinos that operate in six states in the Midwest and southern United States. Generally, these states allow casino gaming on a limited basis through the issuance of a limited number of gaming licenses. Each of our Midwest and South properties generally serve customers within a 100-mile radius and compete directly with other casino facilities operating in their respective immediate and surrounding market areas, as well as with gaming operations in surrounding jurisdictions.
Par-A-Dice Hotel Casino
Par-A-Dice Hotel Casino ("Par-A-Dice") is a dockside riverboat casino located on the Illinois River in East Peoria, Illinois that features a
202
-room hotel. Located adjacent to the Par-A-Dice riverboat is a land-based pavilion, which includes four restaurants and a gift shop. Par-A-Dice is strategically located near Interstate 74, a major east-west interstate highway, and it is the only casino gaming facility located within approximately 90 miles of Peoria, Illinois.
Blue Chip Casino, Hotel & Spa
Blue Chip Casino Hotel & Spa ("Blue Chip") is a dockside riverboat casino located in Michigan City, Indiana, which is 40 miles west of South Bend, Indiana and 60 miles east of Chicago, Illinois. The property competes primarily with five casinos in northern Indiana and southern Michigan and, to a lesser extent, with casinos in the Chicago area and racinos located near Indianapolis. The property features
486
guest rooms, a spa and fitness center, dining and nightlife venues, and meeting and event space, including a land-based pavilion.
Diamond Jo Dubuque
Diamond Jo is a land-based casino located in the Port of Dubuque, a waterfront development on the Mississippi River in downtown Dubuque, Iowa. Diamond Jo is a two-story, approximately 188,000 square foot property that includes
918
slot machines and
20
table games. Additional amenities include a 30-lane bowling center, a 33,000 square foot event center, and two banquet rooms. The property also features several dining outlets, including the Kitchen Buffet, a 190-seat live action buffet, Woodfire Grille, the casino's 118-seat high-end restaurant, The Filament, a new and electrifying-yet-casual restaurant and bar, and Mojo's, a 122-seat sports bar, as well as three full service bars and Mississippi Moon Bar, a live music venue.
5
Diamond Jo Worth
Diamond Jo Worth is a land-based casino situated on a 46-acre site in Northwood, Iowa, which is located in north-central Iowa, near the Minnesota border and approximately 30 miles north of Mason City. The casino currently has
915
slot machines and
32
table games in operation, as well as a 5,200 square foot event center and several dining options, including the Kitchen Buffet, a 190-seat buffet restaurant, and Woodfire Grille, a 114-seat high-end restaurant. There is a 102-room hotel attached to the casino and a 60-room hotel adjacent to the casino, both of which are owned and operated by third parties. Under terms of an agreement with the owner, Diamond Jo Worth has the option to purchase the 102-room hotel.
Kansas Star Casino
Kansas Star serves as Lottery Gaming Facility Manager for the South Central Gaming Zone on behalf of the Kansas Lottery pursuant to the Lottery Gaming Facility Management Contract (the "Kansas Management Contract"). The casino is located in Mulvane, Kansas, approximately 20 miles south of Wichita, Kansas and has
1,769
slot machines,
52
table games, a 250-seat buffet, a 140-seat steakhouse and a number of other amenities including a deli, noodle bar and casino bars. Kansas Star also has a 162,000 square foot arena designed to host various events, including concerts, trade shows and equestrian events. In addition, the property has an event center for conventions, banquets and other events and an equestrian pavilion that includes a practice arena and covered stalls. There is a 300-room hotel adjacent to the casino that is operated by a third party.
Amelia Belle Casino
The Amelia Belle Casino is located in south-central Louisiana, and is a three-level riverboat with gaming located on the first two decks, and includes
838
slot machines and
15
table games. The first deck of the riverboat includes a 20-seat café with the third deck of the riverboat including a 140-seat buffet and banquet room.
Delta Downs Racetrack Casino & Hotel
Delta Downs Racetrack Casino & Hotel ("Delta Downs") is located in Vinton, Louisiana and conducts horse races on a seasonal basis and operates year-round simulcast facilities for customers to wager on races held at other tracks. In addition, Delta Downs offers slot play and a
370
-room hotel. Delta Downs is approximately 25 miles closer to Houston than the next closest gaming properties, located in Lake Charles, Louisiana, and is conveniently located near a travel route taken by customers traveling between Houston, Beaumont and other parts of southeastern Texas to Lake Charles, Louisiana. In 2016, we completed a $45 million expansion of Delta Downs that added
a new hotel tower, redesigned all existing rooms and food and beverage facilities, and expanded the special events center.
Evangeline Downs
The Evangeline Downs is a land-based racino located in Louisiana. The racino currently includes a casino with
1,360
slot machines and a 23,000 square foot convention center. The racino features multiple food venues, including The Cajun Buffet, a 300-seat buffet; Café, an 89-seat restaurant; The Spotted Horse Tavern and Dining Parlor, a 132-seat restaurant and tavern; and Fast and Lucy’s Pub, a newly renovated 110-seat restaurant and bar. The racino includes a one-mile dirt track, a 7/8-mile turf track and stables for 968 horses. The Clubhouse, together with the grandstand and patio area, provides seating capacity for up to 4,295 patrons. In the Clubhouse, Silk's Fine Dining offers a varied menu and the grandstand area contains a concession and bar. There is also a 117-room hotel adjacent to the racino, which is operated by a third party.
Evangeline Downs currently operates three Off Track Betting ("OTB") locations in Henderson, Eunice and St. Martinville, Louisiana. Each OTB offers simulcast pari-mutuel wagering and video poker. Under Louisiana's racing and off-track betting laws, we have a right of prior approval with respect to any applicant seeking a permit to operate an OTB within a 55-mile radius of the Evangeline Downs racetrack, which effectively gives us the exclusive right, at our option, to operate additional OTBs within such a radius, provided that such OTB is not also within a 55-mile radius of another horse racetrack.
Sam's Town Hotel and Casino
Sam's Town Hotel and Casino ("Sam's Town Shreveport") is a dockside riverboat casino located along the Red River in Shreveport, Louisiana. Amenities at the property include
514
hotel rooms, a spa, four restaurants, a live entertainment venue, and convention and meeting space. Feeder markets include east Texas (including Dallas), Texarkana, Arkansas and surrounding Louisiana cities, including Bossier City, Minden, Ruston and Monroe.
Treasure Chest Casino
Treasure Chest Casino ("Treasure Chest") is a dockside riverboat casino located on Lake Pontchartrain in the western suburbs of New Orleans, Louisiana. The property is designed as a classic 18
th
century Victorian style paddlewheel riverboat, with a total capacity for 1,925 people. The entertainment complex located adjacent to the riverboat houses a 120-seat Caribbean showroom and two restaurants. Located approximately five miles from the New Orleans International Airport, Treasure Chest primarily serves residents of suburban New Orleans.
6
IP Casino Resort Spa
The IP Casino Resort Spa ("IP") overlooks the scenic back bay of Biloxi and is one of the premier resorts on the Mississippi Gulf Coast, and a recipient of a AAA Four Diamond Award. The property features more than 1,000 hotel rooms and suites;
81,700
-square-feet of casino space with
1,538
slot machines and
52
table games; more than 65,000 square feet of convention and meeting space; a spa and salon; a 1,383-seat theater offering regular headline entertainment; six lounges and bars; and eight restaurants, including a steak and seafood restaurant and an upscale Asian restaurant.
Sam's Town Hotel and Gambling Hall
Sam's Town Hotel and Gambling Hall ("Sam's Town Tunica") is a barge-based casino located in Tunica County, Mississippi. The property has extensive amenities, including
700
hotel rooms, an entertainment lounge, four dining venues, and the 1,600-seat River Palace Arena.
Competition
Our properties generally operate in highly competitive environments. We compete against other gaming companies as well as other hospitality, entertainment and leisure companies. We face significant competition in each of the jurisdictions in which we operate. Such competition may intensify in some of these jurisdictions if new gaming operations open in these markets or existing competitors expand their operations. Our properties compete directly with other gaming properties in each state in which we operate, as well as in adjacent states. We also compete for customers with other casino operators in other markets, including casinos located on Native American reservations, and other forms of gaming, such as lotteries and internet gaming. Many of our competitors are larger and have substantially greater name recognition and marketing and financial resources. In some instances, particularly with Native American casinos, our competitors pay substantially lower taxes or no taxes at all. We believe that increased legalized gaming in other states, particularly in areas close to our existing gaming properties and the development or expansion of Native American gaming in or near the states in which we operate, could create additional competition for us and could adversely affect our operations or future development projects.
Future Development Opportunities
Development agreement with Wilton Rancheria
We have a development agreement and a management agreement with Wilton Rancheria, a federally-recognized Native American tribe located southeast of Sacramento, California, to develop and manage a gaming entertainment complex, subject to approval by the National Indian Gaming Commission. In January 2017, the tribe received a favorable Record of Decision from the Bureau of Indian Affairs and in February 2017, the land was taken into trust on behalf of the tribe. In September 2017, the California State Legislature unanimously approved, and the Governor of California executed, a tribal-state gaming compact with the tribe allowing the development of the casino. With the compact now in place, we are in the process of finalizing project design and construction planning. Once commenced, the construction timeline is expected to span 18 to 24 months. The land parcel taken into trust is located next to a mall being developed by the Howard Hughes Corporation, approximately 15 miles southeast of Sacramento. The project is located on Highway 99, one of the two major north-south freeways in the Sacramento area.
Frequent Player Loyalty Programs
B Connected
We have established a nationwide branding initiative and loyalty program. Our players use their "B Connected" cards to earn and redeem points at nearly all of our properties. The "B Connected" club, among other benefits, rewards players for their loyalty as well as entitles them to qualify for promotions and earn rewards toward slot, video poker, or table games play.
In addition to the "B Connected" player loyalty program, we operate the "B Connected Mobile" program, the first multi-property, loyalty program-based iPhone and Android applications of its kind in the gaming industry. B Connected Mobile is a personalized mobile application that delivers customized offers and information directly to a customer’s iPhone, iPad or Android device, making "B Connected Mobile" the first application of its kind available on multiple platforms. The application further expands the benefits of the "B Connected" program by providing real-time personalized information on hotel, dining and gaming offers when a customer visits a Boyd property, instant access to event information, schedules and special offers, a search engine that allows customers to find Boyd Gaming casinos that have their favorite machines and displays the games’ locations on a casino floor map, the ability to track "B Connected" point balances in real time, and the ability to make immediate hotel or restaurant reservations. These tools allow our customers to receive the greatest value from their "B Connected" membership, and ensure that our marketing is as effective as possible.
We further improved our "B Connected" loyalty program with the introduction of "B Connected Social" in 2012, which rewards users for using "B Connected Online", "B Connected Mobile", or sharing offers and events on social networks. "B Connected Social" is a dynamic network loyalty program that allows "B Connected" members to share offers with friends, connect to their favorite social networks, check in online via certain social networks, as well as participate in a variety of online activities including
7
interfacing with "B Connected Online" or "B Connected Mobile", participate in online contests, and register for alerts to deliver targeted information specific to the "B Connected" member.
Other Programs
Kansas Star, Diamond Jo Dubuque, Aliante, Cannery, and Eastside Cannery continue to sponsor their own player loyalty programs to build brand awareness and leverage loyalty through marketing and promotional programs to retain existing customers, maintain trip frequency, acquire new customers, and recover lapsed customers. These properties offer their guests comprehensive, competitive and targeted marketing and promotion programs. Each program offers players a hassle-free way of earning points redeemable at each respective property for slot and table games play, food, beverage and retail items as well as complementaries and other rewards and benefits based on play. In addition, each property strives to differentiate its casino with high-quality guest services to further enhance overall brand and customer experience.
In the future we plan to extend the B Connected program to these properties, subject to the receipt of regulatory approvals. The implementation of "B Connected" will replace the individual property programs described above and provide our customers at these properties even more value for their rewards with a multi-property player loyalty program.
Other Promotional Activities
We provide other promotional offers and discounts targeted towards new customers, frequent customers, inactive customers, customers of various levels of play, and prospective customers who have not yet visited our properties, and mid-week and other promotional activities that seek to generate visits to our properties during slower periods. Complementaries are usually in the form of monetary discounts, and other rewards generally can only be redeemed at our restaurants, retail and spa facilities.
Government Regulation
We are subject to extensive regulation under laws, rules and supervisory procedures primarily in the jurisdictions where our facilities are located or docked. Some jurisdictions, including Nevada, Illinois, Indiana, Iowa, Kansas, Louisiana and Mississippi, empower their regulators to investigate participation by licensees in gaming outside their jurisdiction and may require access to periodic reports respecting those gaming activities. Violations of laws in one jurisdiction could result in disciplinary action in other jurisdictions. A detailed description of the governmental gaming regulations to which we are subject is filed as Exhibit 99.1 and is herein incorporated by reference.
If additional gaming regulations are adopted in a jurisdiction in which we operate, such regulations could impose restrictions or costs that could have a significant adverse effect on us. From time to time, various proposals have been introduced in the legislatures of some of the jurisdictions in which we have existing or planned operations that, if enacted, could adversely affect the tax, regulatory, operational or other aspects of the gaming industry and us. We do not know whether or not such legislation will be enacted. The federal government has also previously considered a federal tax on casino revenues and the elimination of betting on NCAA events and may consider such a tax or eliminations on betting in the future. In addition, gaming companies are currently subject to significant state and local taxes and fees in addition to normal federal and state corporate income taxes, and such taxes and fees are subject to increase at any time. Any material increase in these taxes or fees could adversely affect us.
Employees and Labor Relations
At
December 31, 2017
, we employed approximately 19,707 persons, and had collective bargaining agreements with two unions covering 1,811 employees. Negotiations for a first contract with an organized bargaining unit are in progress at several of our Las Vegas properties. Negotiations for contract renewal are also in progress at two of our Midwest and South properties.
Corporate Information
We were incorporated in Nevada in June 1988. Our principal executive offices are located at 3883 Howard Hughes Parkway, Ninth Floor, Las Vegas, NV 89169, and our main telephone number is (702) 792-7200. Our website is
www.boydgaming.com
.
Available Information
We file annual, quarterly and special reports, proxy statements and other information with the Securities and Exchange Commission (the "SEC"). These filings are also available on the SEC’s website at www.sec.gov. In addition, the public may read and copy any materials that we file with the SEC at the SEC’s Public Reference Room at 100 F Street, NE, Washington, D.C. 20549 and may obtain additional information and guidance by calling the SEC Investor Information Service at 1-800-SEC-0330. You also may read and copy reports and other information filed by us at the office of the New York Stock Exchange, Inc., 20 Broad Street, New York, New York 10005. A copy of this Annual Report on Form 10-K will be provided to a stockholder, with exhibits, without charge upon written request to Boyd Gaming Corporation, 3883 Howard Hughes Parkway, Ninth Floor, Las Vegas, Nevada 89169, (702) 792-7200, Attn: David Strow, Vice President Corporate Communications.
8
We make our Annual Reports on Form 10-K, our Quarterly Reports on Form 10-Q, our Current Reports on Form 8-K, and all amendments to these reports, available free of charge on our corporate website as soon as reasonably practicable after such reports are filed with, or furnished to, the SEC. In addition, our Code of Business Conduct and Ethics, Corporate Governance Guidelines, and charters of the Audit Committee, Compensation and Stock Option Committee, and the Corporate Governance and Nominating Committee are available on our website. We will provide reasonable quantities of electronic or paper copies of filings free of charge upon request. In addition, we will provide a copy of the above referenced charters to stockholders upon request.
Important Information Regarding Forward-Looking Statements
This Annual Report on Form 10-K contains forward-looking statements within the meaning of Section 27A of the Securities Act of 1933, as amended (the "Securities Act"), and Section 21E of the Securities Exchange Act of 1934, as amended (the "Exchange Act"). Such statements contain words such as "may," "will," "might," "expect," "believe," "anticipate," "could," "would," "estimate," "pursue," "target," "project," "intend," "plan," "seek," "should," "assume," and "continue," or the negative thereof or comparable terminology. Forward-looking statements involve certain risks and uncertainties, and actual results may differ materially from those discussed in any such statement. Factors that could cause actual results to differ materially from such forward-looking statements include:
|
•
|
The risk that the conditions to the closing of the Penn National Purchase or the Valley Forge Merger are not satisfied, that we fail to consummate such acquisitions, when anticipated, or at all, or that we fail to complete financing activities to obtain funds for such acquisitions.
|
|
•
|
The effects of intense competition that exists in the gaming industry.
|
|
•
|
The risk that our acquisitions and other expansion opportunities divert management’s attention or incur substantial costs, or that we are otherwise unable to develop, profitably manage or successfully integrate the businesses we acquire.
|
|
•
|
The fact that our expansion, development and renovation projects (including enhancements to improve property performance) are subject to many risks inherent in expansion, development or construction of a new or existing project.
|
|
•
|
The risk that any of our projects may not be completed, if at all, on time or within established budgets, or that any project will not result in increased earnings to us.
|
|
•
|
The risk that significant delays, cost overruns, or failures of any of our projects to achieve market acceptance could have a material adverse effect on our business, financial condition and results of operations.
|
|
•
|
The risk that new gaming licenses or jurisdictions become available (or offer different gaming regulations or taxes) that results in increased competition to us.
|
|
•
|
The risk that negative industry or economic trends, reduced estimates of future cash flows, disruptions to our business, slower growth rates or lack of growth in our business, may result in significant write-downs or impairments in future periods.
|
|
•
|
The risk that regulatory authorities may revoke, suspend, condition or limit our gaming or other licenses, impose substantial fines and take other adverse actions against any of our casino operations.
|
|
•
|
The risk that we may be unable to refinance our outstanding indebtedness as it comes due, or that if we do refinance, the terms are not favorable to us.
|
|
•
|
The effects of the extensive governmental gaming regulation and taxation policies that we are subject to, as well as any changes in laws and regulations, including increased taxes, which could harm our business.
|
|
•
|
The effects of federal, state and local laws affecting our business such as the regulation of smoking, the regulation of directors, officers, key employees and partners and regulations affecting business in general.
|
|
•
|
The effects of extreme weather conditions or natural disasters on our facilities and the geographic areas from which we draw our customers, and our ability to recover insurance proceeds (if any).
|
|
•
|
The effects of events adversely impacting the economy or the regions from which we draw a significant percentage of our customers, including the effects of economic recession, war, terrorist or similar activity or disasters in, at, or around our properties.
|
|
•
|
The risk that we fail to adapt our business and amenities to changing customer preferences.
|
|
•
|
Financial community and rating agency perceptions of us, and the effect of economic, credit and capital market conditions on the economy and the gaming and hotel industry.
|
|
•
|
The effect of the expansion of legalized gaming in the regions in which we operate.
|
|
•
|
The risk of failing to maintain the integrity of our information technology infrastructure causing the unintended distribution of our customer data to third parties and access by third parties to our customer data.
|
|
•
|
Our estimated effective income tax rates, estimated tax benefits, and merits of our tax positions.
|
|
•
|
Our ability to utilize our net operating loss carryforwards and certain other tax attributes.
|
|
•
|
The risks relating to owning our equity, including price and volume fluctuations of the stock market that may harm the market price of our common stock and the potential of certain of our stockholders owning large interest in our capital stock to significantly influence our affairs.
|
9
|
•
|
Other statements regarding our future operations, financial condition and prospects, and business strategies.
|
Additional factors that could cause actual results to differ are discussed in Part I, Item 1A,
Risk Factors
of this Annual Report on Form 10-K for the year ended
December 31, 2017
and in other current and periodic reports filed from time to time with the SEC. All forward-looking statements in this document are made as of the date hereof, based on information available to us as of the date hereof, and we assume no obligation to update any forward-looking statement.
In addition to the other information contained in this report on Form 10-K, the following Risk Factors should be considered carefully in evaluating our business.
If any of the following risks actually occur, our business, financial condition and results of operations could be materially and adversely affected. If this were to happen, the value of our securities, including our common stock and senior notes, could decline significantly, and investors could lose all or part of their investment.
This report is qualified in its entirety by these risk factors.
Risks Related to our Business
Our business is particularly sensitive to reductions in discretionary consumer spending as a result of downturns in the economy.
Consumer demand for entertainment and other amenities at casino hotel properties, such as ours, are particularly sensitive to downturns in the economy and the corresponding impact on discretionary spending on leisure activities. Changes in discretionary consumer spending or consumer preferences brought about by factors such as perceived or actual general economic conditions, effects of declines in consumer confidence in the economy, including the past housing, employment and credit crises, the impact of high energy and food costs, the increased cost of travel, the potential for bank failures, decreased disposable consumer income and wealth, or fears of war and future acts of terrorism could further reduce customer demand for the amenities that we offer, thus imposing practical limits on pricing and negatively impacting our results of operations and financial condition.
For example, beginning in 2007 we experienced one of the toughest economic periods in Las Vegas history. The housing crisis and economic slowdown in the United States resulted in a significant decline in the amount of tourism and spending in Las Vegas and other locations in which we own or invest in casino hotel properties. While the economy has improved significantly since the end of the recent economic recession, our business continues to be impacted from changes in consumer spending habits due to the recession. Our customers spend less per visit and differently than prior to the recession, including focusing more on non-gaming amenities. We cannot say when, if ever, or to what extent, customer behavior in our various markets will fully-revert to pre-recession behavior trends. If customers spend less per visit or customers prefer non-gaming amenities of our competitors, and we are unable to increase total visitation, our business may be adversely affected. Since our business model relies on consumer expenditures on entertainment, luxury and other discretionary items, a slowing or stoppage of the economic recovery or a return to an economic downturn will further adversely affect our results of operations and financial condition.
Intense competition exists in the gaming industry, and we expect competition to continue to intensify.
The gaming industry is highly competitive for both customers and employees, including those at the management level. We compete with numerous casinos and hotel casinos of varying quality and size in market areas where our properties are located. We also compete with other non-gaming resorts and vacation destinations, and with various other casino and other entertainment businesses, including online gaming websites, and could compete with any new forms of gaming that may be legalized in the future. The casino entertainment business is characterized by competitors that vary considerably in their size, quality of facilities, number of operations, brand identities, marketing and growth strategies, financial strength and capabilities, level of amenities, management talent and geographic diversity. In most markets, we compete directly with other casino facilities operating in the immediate and surrounding market areas. In some markets, we face competition from nearby markets in addition to direct competition within our market areas.
With fewer other new markets opening for development, competition in existing markets has intensified in recent years. We and our competitors have invested in expanding existing facilities, developing new facilities, and acquiring established facilities in existing markets. This expansion of existing casino entertainment properties, the increase in the number of properties and the aggressive marketing strategies of many of our competitors have increased competition in many markets in which we compete, and this intense competition can be expected to continue. For example, in December 2014, a new property opened in Lake Charles, Louisiana, that increased competition with Delta Downs Racetrack Casino & Hotel. At the end of December 2015, a new casino opened in D'Iberville, Mississippi that competes with IP Casino Resort Spa. In Illinois, the legalization of video lottery terminals in recent years has added more than 22,000 new gaming devices across the state, including nearly 4,000 in the immediate market of the Par-A-Dice Hotel Casino, increasing competition for that property. In January 2018, a new tribal casino in South Bend,
10
Indiana opened, which competes with Blue Chip for gaming customers. Additionally, competition may intensify if our competitors commit additional resources to aggressive pricing and promotional activities in order to attract customers.
Also, our business may be adversely impacted by the additional gaming and room capacity in states where we operate or intend to operate. Several states are also considering enabling the development and operation of casinos or casino-like operations in their jurisdictions.
The possible future expansion of gaming in Wisconsin or the possible expansion of gaming in Cedar Rapids, Iowa, if approved, could impact the operating results of the Diamond Jo Dubuque. Further, Kansas Star could, in the future, face competition from the Wichita Greyhound Park, located approximately 30 miles away in Park City, Kansas. While gaming is not currently permitted in Sedgwick County, Kansas (the site of the Wichita Greyhound Park), the Kansas Expanded Lottery Act permits the installation of slot machines at race tracks under certain conditions. If the Kansas legislature authorized a new gaming referendum in Sedgwick County and such referendum was approved, and certain other regulatory conditions were satisfied, the Wichita Greyhound Park could be permitted to install slot machines.
We also compete with legalized gaming from casinos located on Native American tribal lands. Expansion of Native American gaming in areas located near our properties, or in areas in or near those from which we draw our customers, could have an adverse effect on our operating results. For example, increased competition from federally recognized Native American tribes near Blue Chip and Sam's Town Shreveport has had a negative impact on our results. Native American gaming facilities typically have a significant operating advantage over our properties due to lower gaming fees or taxes, allowing those facilities to market more aggressively and to expand or update their facilities at an accelerated rate. Although we expanded our facility at Blue Chip in an effort to be more competitive in this market, competing Native American properties could continue to have an adverse impact on the operations of both Blue Chip and Sam's Town Shreveport. Kansas Star may face additional competition in the Wichita, Kansas metropolitan area. The Wyandotte Nation of Oklahoma previously filed an application with the U.S. Department of Interior to have certain land located in Park City, Kansas (in the Wichita metro area) taken into trust by the U.S. Government and to permit gaming. In July 2014, the U.S. Department of Interior rejected the Wyandotte Nation's trust application for the Park City land. However, the Nation has indicated it will seek to appeal this ruling. If an appeal were filed and ultimately successful, the Wyandotte Nation would be permitted to open a Class II gaming facility, and upon successful negotiation of a compact with the State of Kansas would be permitted to open a Class III gaming facility.
In addition, we also compete to some extent with other forms of gaming on both a local and national level, including state-sponsored lotteries, charitable gaming, on-and off-track wagering, and other forms of entertainment, including motion pictures, sporting events and other recreational activities. It is possible that these secondary competitors could reduce the number of visitors to our facilities or the amount they are willing to wager, which could have a material adverse effect on our ability to generate revenue or maintain our profitability and cash flows.
If our competitors operate more successfully than we do, if they attract customers away from us as a result of aggressive pricing and promotion, if they are more successful than us in attracting and retaining employees, if their properties are enhanced or expanded, if they operate in jurisdictions that give them operating advantages due to differences or changes in gaming regulations or taxes, or if additional hotels and casinos are established in and around the locations in which we conduct business, we may lose market share or the ability to attract or retain employees. In particular, the expansion of casino gaming in or near any geographic area from which we attract or expect to attract a significant number of our customers could have a significant adverse effect on our business, financial condition and results of operations.
In addition, increased competition may require us to make substantial capital expenditures to maintain and enhance the competitive positions of our properties, including updating slot machines to reflect changing technology, refurbishing public service areas periodically, replacing obsolete equipment on an ongoing basis and making other expenditures to increase the attractiveness and add to the appeal of our facilities. Because we are highly leveraged, after satisfying our obligations under our outstanding indebtedness, there can be no assurance that we will have sufficient funds to undertake these expenditures or that we will be able to obtain sufficient financing to fund such expenditures. If we are unable to make such expenditures, our competitive position could be materially adversely affected.
11
We may incur impairments to goodwill, indefinite-lived intangible assets, or long-lived assets.
In accordance with the authoritative accounting guidance for goodwill and other intangible assets, we test our goodwill and indefinite-lived intangible assets for impairment annually or if a triggering event occurs. We perform our annual impairment testing for goodwill and indefinite-lived intangible assets as of October 1. While no impairment charges were recorded as a result of the 2017 test, we recorded a non-cash impairment charge of $36.9 million in connection with the 2016 annual impairment test, comprised of impairment charges of $23.6 million to the Par-A-Dice gaming license, $12.5 million to Amelia Belle goodwill, and $0.8 million to trademarks in the Midwest and South segment. In connection with the 2015 annual impairment test, we recorded a non-cash impairment charge of $17.5 million to the Par-A-Dice gaming license.
If our estimates of projected cash flows related to our assets are not achieved, we may be subject to future impairment charges, which could have a material adverse impact on our consolidated financial statements.
We face risks associated with growth and acquisitions.
As part of our business strategy, we regularly evaluate opportunities for growth through development of gaming operations in existing or new markets, through acquiring other gaming entertainment facilities or through redeveloping our existing gaming facilities. For example, on December 18, 2017, we entered into a definitive agreement with Penn National Gaming, Inc. to acquire four properties in the Midwest and on December 20, 2017, we entered into a definitive agreement with Valley Forge Convention Center Partners, L.P., to acquire Valley Forge Casino Resort in King of Prussia, Pennsylvania (together the "Pending Acquisitions"). In the future, we may also pursue expansion opportunities, including joint ventures, in jurisdictions where casino gaming is not currently permitted in order to be prepared to develop projects upon approval of casino gaming.
Although we only intend to engage in acquisitions that, if consummated, will be accretive to us and our shareholders, acquisitions require significant management attention and resources to integrating new properties, businesses and operations. Additionally, once the Pending Acquisitions have closed, we will need to successfully integrate the additional properties into Boyd Gaming’s operating structure in order to realize the anticipated benefits of the Pending Acquisitions. Potential difficulties we may encounter as part of the integration process include the following:
|
•
|
the inability to successfully incorporate the assets in a manner that permits us to achieve the full revenue and other benefits anticipated to result from the Pending Acquisitions;
|
|
•
|
complexities associated with managing the combined business, including difficulty addressing possible differences in cultures and management philosophies and the challenge of integrating complex systems, technology, networks and other assets of each of the companies in a seamless manner that minimizes any adverse impact on customers, suppliers, employees and other constituencies; and
|
|
•
|
potential unknown liabilities and unforeseen increased expenses associated with the Pending Acquisitions.
|
In addition, it is possible that the integration process could result in:
|
•
|
diversion of the attention of our management; and
|
|
•
|
the disruption of, or the loss of momentum in, each our ongoing business or inconsistencies in standards, controls, procedures and policies,
|
any of which could adversely affect our ability to maintain relationships with customers, suppliers, employees and other constituencies or our ability to achieve the anticipated benefits, or could reduce our earnings or otherwise adversely affect our business and financial results.
There can be no assurance that we will be able to identify, acquire, develop or profitably manage additional companies or operations or successfully integrate such companies or operations, including the properties associated with the Pending Acquisitions into our existing operations without substantial costs, delays or other problems. Additionally, there can be no assurance that we will receive gaming or other necessary licenses or approvals for new projects that we may pursue or that gaming will be approved in jurisdictions where it is not currently approved.
Ballot measures or other voter-approved initiatives to allow gaming in jurisdictions where gaming, or certain types of gaming (such as slots), was not previously permitted could be challenged, and, if such challenges are successful, these ballot measures or initiatives could be invalidated. Furthermore, there can be no assurance that there will not be similar or other challenges to legalized gaming in existing or current markets in which we may operate or have development plans, and successful challenges to legalized gaming could require us to abandon or substantially curtail our operations or development plans in those locations, which could have a material adverse effect on our financial condition and results of operations.
12
There can be no assurance that we will not face similar challenges and difficulties with respect to new development projects or expansion efforts that we may undertake, which could result in significant sunk costs that we may not be able to fully recoup or that otherwise have a material adverse effect on our financial condition and results of operations.
Our ability to consummate the Pending Acquisitions is contingent upon the receipt of governmental approvals and satisfaction of certain closing conditions.
The consummation of the Pending Acquisitions is subject to customary conditions and the receipt of all required regulatory approvals, including, among others, approval by the state gaming commissions and the expiration or termination of the applicable waiting period under the Hart-Scott-Rodino Antitrust Improvements Act of 1976 ("HSR"), as amended. In addition, the Penn National Purchase is also contingent upon the successful completion of Penn National’s proposed acquisition of Pinnacle Entertainment, Inc. Further, the review of the Pending Acquisitions by the state gaming commissions is currently ongoing, and we have not yet received approval for from the state gaming commissions. If we fail to receive all such required regulatory approvals, or any required closing condition is not satisfied (or waived, where applicable), we will be unable to consummate the Pending Acquisitions and our business will be negatively affected. Such effects could include, but are not limited to, the failure to recognize the anticipated benefits of the Pending Acquisitions, the loss of management’s time and the expense expended with respect to investigating, entering into, and attempting to consummate such acquisition, as well as other related costs to Boyd Gaming’s business. Further, the failure to consummate the Penn National Purchase could result in a reverse termination fee payment of up to $58 million in certain circumstances.
Our expansion and development opportunities may face significant risks inherent in construction projects.
We regularly evaluate expansion, development, investment and renovation opportunities.
Any such development projects are subject to many other risks inherent in the expansion or renovation of an existing enterprise or construction of a new enterprise, including unanticipated design, construction, regulatory, environmental and operating problems and lack of demand for our projects. Our current and future projects could also experience:
|
•
|
changes to plans and specifications;
|
|
•
|
delays and significant cost increases;
|
|
•
|
shortages of materials;
|
|
•
|
shortages of skilled labor or work stoppages for contractors and subcontractors;
|
|
•
|
labor disputes or work stoppages;
|
|
•
|
disputes with and defaults by contractors and subcontractors;
|
|
•
|
health and safety incidents and site accidents;
|
|
•
|
engineering problems, including defective plans and specifications;
|
|
•
|
poor performance or nonperformance by any of our joint venture partners or other third parties on whom we place reliance;
|
|
•
|
changes in laws and regulations, or in the interpretation and enforcement of laws and regulations, applicable to gaming facilities, real estate development or construction projects;
|
|
•
|
unforeseen construction scheduling, engineering, environmental, permitting, construction or geological problems;
|
|
•
|
environmental issues, including the discovery of unknown environmental contamination;
|
|
•
|
weather interference, floods, fires or other casualty losses;
|
|
•
|
other unanticipated circumstances or cost increases; and
|
|
•
|
failure to obtain necessary licenses, permits, entitlements or other governmental approvals.
|
13
The occurrence of any of these development and construction risks could increase the total costs of our construction projects or delay or prevent the construction or opening or otherwise affect the design and features of our construction projects, which could materially adversely affect our plan of operations, financial condition and ability to satisfy our debt obligations.
In addition, actual costs and construction periods for any of our projects can differ significantly from initial expectations. Our initial project costs and construction periods are based upon budgets, conceptual design documents and construction schedule estimates prepared at inception of the project in consultation with architects and contractors. Many of these costs can increase over time as the project is built to completion. We can provide no assurance that any project will be completed on time, if at all, or within established budgets, or that any project will result in increased earnings to us. Significant delays, cost overruns, or failures of our projects to achieve market acceptance could have a material adverse effect on our business, financial condition and results of operations.
Although we design our projects to minimize disruption of our existing business operations, expansion and renovation projects require, from time to time, all or portions of affected existing operations to be closed or disrupted. Any significant disruption in operations of a property could have a significant adverse effect on our business, financial condition and results of operations.
The failure to obtain necessary government approvals in a timely manner, or at all, can adversely impact our various expansion, development, investment and renovation projects.
Certain permits, licenses and approvals necessary for some of our current or anticipated projects have not yet been obtained. The scope of the approvals required for expansion, development, investment or renovation projects can be extensive and may include gaming approvals, state and local land-use permits and building and zoning permits. Unexpected changes or concessions required by local, state or federal regulatory authorities could involve significant additional costs and delay the scheduled openings of the facilities. We may not obtain the necessary permits, licenses and approvals within the anticipated time frames, or at all.
Failure to maintain the integrity of our information technology systems, protect our internal information, or comply with applicable privacy and data security regulations could adversely affect us.
We rely extensively on our computer systems to process customer transactions, manage customer data, manage employee data and communicate with third-party vendors and other third parties, and we may also access the internet to use our computer systems. Our operations require that we collect and store customer data, including credit card numbers and other personal information, for various business purposes, including marketing and promotional purposes. We also collect and store personal information about our employees. Breaches of our security measures or information technology systems or the accidental loss, inadvertent disclosure or unapproved dissemination of proprietary information or sensitive personal information or confidential data about us, or our customers, or our employees including the potential loss or disclosure of such information as a result of hacking or other cyber-attack, computer virus, fraudulent use by customers, employees or employees of third party vendors, trickery or other forms of deception or unauthorized use, or due to system failure, could expose us, our customers, our employees or other individuals affected to a risk of loss or misuse of this information, result in litigation and potential liability for us, damage our casino or brand names and reputations or otherwise harm our business. We rely on proprietary and commercially available systems, software, tools and monitoring to provide security for processing, transmission and storage of customer information, such as payment card, employee information and other confidential or proprietary information. Our data security measures are reviewed and evaluated regularly, however they might not protect us against increasingly sophisticated and aggressive threats. The cost and operational consequences of implementing further data security measures could be significant.
Additionally, the collection of customer and employee personal information imposes various privacy compliance related obligations on our business and increases the risks associated with a breach or failure of the integrity of our information technology systems. The collection and use of personal information is governed by privacy laws and regulations enacted in the United States and other jurisdictions around the world. Privacy regulations continue to evolve and on occasion may be inconsistent from one jurisdiction to another. Compliance with applicable privacy laws and regulations may increase our operating costs and/or adversely impact our ability to market our products, properties and services to our customers. In addition, non-compliance with applicable privacy laws and regulations by us (or in some circumstances non-compliance by third party service providers engaged by us) may also result in damage of reputation, result in vulnerabilities that could be exploited to breach our systems and/or subject us to fines, payment of damages, lawsuits or restrictions on our use or transfer of personal information.
While we maintain cyber insurance coverage to protect against these risks to the Company, such insurance is unlikely to fully mitigate the impact of any information breach.
14
Risks Related to the Regulation of our Industry
We are subject to extensive governmental regulation, as well as federal, state and local laws affecting business in general, which may harm our business.
Our ownership, management and operation of gaming facilities are subject to extensive laws, regulations and ordinances which are administered by the Nevada Gaming Commission and Gaming Control Board, Mississippi Gaming Commission, Indiana Gaming Commission, Illinois Gaming Board, Iowa Racing and Gaming Commission, the Kansas Lottery Commission, the Kansas Racing and Gaming Commission, the Louisiana State Gaming Control Board, the Louisiana State Racing Commission and various other federal, state and local government entities and agencies. We are subject to regulations that apply specifically to the gaming industry and horse racetracks and casinos, in addition to regulations applicable to businesses generally. A more detailed description of the governmental gaming regulations to which we are subject is filed as Exhibit 99.1 herewith. If additional gaming regulations are adopted in a jurisdiction in which we operate, such regulations could impose restrictions or costs that could have a significant adverse effect on us. From time to time, various proposals are introduced in the legislatures of some of the jurisdictions in which we have existing or planned operations that, if enacted, could adversely affect the tax, regulatory, operational or other aspects of the gaming industry and our company.
To date, we have obtained all governmental licenses, findings of suitability, registrations, permits and approvals necessary for the operation of our properties. However, we can give no assurance that any additional licenses, permits and approvals that may be required will be given or that existing ones will be renewed or will not be revoked. Renewal is subject to, among other things, continued satisfaction of suitability requirements. Any failure to renew or maintain our licenses or to receive new licenses when necessary would have a material adverse effect on us.
Gambling
Legislative or administrative changes in applicable legal requirements, including legislation to prohibit casino gaming, have been proposed in the past. For example, in 1996, the State of Louisiana adopted a statute in connection with which votes were held locally where gaming operations were conducted and which, had the continuation of gaming been rejected by the voters, might have resulted in the termination of operations at the end of their current license terms. During the 1996 local gaming referendums, Lafayette Parish voted to disallow gaming in the Parish, whereas St. Landry Parish, the site of our racino, voted in favor of gaming. All parishes where riverboat gaming operations are currently conducted voted to continue riverboat gaming, but there can be no guarantee that similar referenda might not produce unfavorable results in the future. Proposals to amend or supplement the Louisiana Riverboat Economic Development and Gaming Control Act and the Pari-Mutuel Act also are frequently introduced in the Louisiana State legislature. In the 2001 session, a representative from Orleans Parish introduced a proposal to repeal the authority of horse racetracks in Calasieu Parish (the site of Delta Downs) and St. Landry Parish (the site of Evangeline Downs) to conduct slot machine gaming at such horse racetracks and to repeal the special taxing districts created for such purposes. If adopted, this proposal would have effectively prohibited us from operating the casino portion of our racino. In addition, the Louisiana legislature, from time to time, considers proposals to repeal the Pari-Mutuel Act.
The legislation permitting gaming in Iowa authorizes the granting of licenses to "qualified sponsoring organizations." Such "qualified sponsoring organizations" may operate the gambling structure itself, subject to satisfying necessary licensing requirements, or it may enter into an agreement with an operator to operate gambling on its behalf. An operator must be approved and licensed by the Iowa Racing and Gaming Commission. The Dubuque Racing Association ("DRA"), a not-for-profit corporation organized for the purpose of operating a pari-mutuel greyhound racing facility in Dubuque, Iowa, first received a riverboat gaming license in 1990 and, pursuant to the Amended DRA Operating Agreement, has served as the "qualified sponsoring organization" of the Diamond Jo since March 18, 1993. The term of the Amended DRA Operating Agreement expires on December 31, 2018. Diamond Jo Dubuque has entered into an amendment to the existing operating agreement with the qualified sponsoring organization. The new agreement will go into effect on January 1, 2019 and will extend for twelve years, expiring on December 31, 2030. The agreement is subject to review and approval by the state gaming commission. The Worth County Development Authority ("WCDA"), pursuant to the WCDA Operating Agreement, serves as the "qualified sponsoring organization" of Diamond Jo Worth. The term of the WCDA Operating Agreement expires on March 31, 2025, and is subject to automatic ten-year renewal periods. If the Amended DRA Operating Agreement or WCDA Operating Agreement were to terminate, or if the DRA or WCDA were to otherwise discontinue acting as our "qualified sponsoring organization" with respect to our operation of the Diamond Jo or Diamond Jo Worth, respectively, and we were unable to obtain approval from the Iowa Racing and Gaming Commission to partner with an alternative "qualified sponsoring organization" as required by our gaming license, we would no longer be able to continue our Diamond Jo or Diamond Jo Worth operations, which would materially and adversely affect our business, results of operations and cash flows.
15
Regulation of Smoking
Illinois has adopted laws that significantly restrict, or otherwise ban, smoking at our properties in those jurisdictions. The Illinois laws that restrict smoking at casinos, and similar legislation in other jurisdictions in which we operate, could materially impact the results of operations of our properties in those jurisdictions. Indiana imposes a state wide smoking ban in specified businesses, buildings, public places and other articulated locations. Indiana's statute specifically exempted riverboat casinos, and all other gaming facilities in Indiana, from the smoking ban; however, the statute also allowed local governments to enact more restrictive smoking bans than the state statute and also left in place any more restrictive local legislation that existed as of the effective date of the statute. To date, neither Michigan City nor LaPorte County, where Blue Chip is located, has enacted any ordinance or other law that would impose a smoking ban on Blue Chip.
Regulation of Directors, Officers, Key Employees and Partners
Our directors, officers, key employees, joint venture partners and certain shareholders must meet approval standards of certain state regulatory authorities. If state regulatory authorities were to find a person occupying any such position, a joint venture partner, or shareholder unsuitable, we would be required to sever our relationship with that person, or the joint venture partner or shareholder may be required to dispose of their interest. State regulatory agencies may conduct investigations into the conduct or associations of our directors, officers, key employees or joint venture partners to ensure compliance with applicable standards.
Certain public and private issuances of securities and other transactions that we are party to also require the approval of some state regulatory authorities.
Live Racing Regulations
Louisiana gaming regulations and our gaming license for the Evangeline Downs and Delta Downs require that we, among other things, conduct a minimum of 80 live racing days in a consecutive 20-week period each year of live horse race meetings at the horse racetrack. Live racing days typically vary in number from year to year and are based on a number of factors, many of which are beyond our control, including the number of suitable race horses and the occurrence of severe weather. If we fail to have the minimum number of racing days, our gaming license with respect to the racino may be canceled, and the casino will be required to cease operations. Any cessation of our operation would have a material adverse effect on our business, prospects, financial condition, results of operations and cash flows.
Regulations Affecting Businesses in General
In addition to gaming regulations, we are also subject to various federal, state and local laws and regulations affecting businesses in general. These laws and regulations include, but are not limited to, restrictions and conditions concerning alcoholic beverages, environmental matters, smoking, employees, currency transactions, taxation, zoning and building codes, and marketing and advertising. Such laws and regulations could change or could be interpreted differently in the future, or new laws and regulations could be enacted. For example, Nevada enacted legislation that eliminated, in most instances, and, for certain pre-existing development projects, reduced, property tax breaks and retroactively eliminated certain sales tax exemptions offered as incentives to companies developing projects that meet certain environmental "green" standards. As a result, we, along with other companies developing projects that meet such standards, have not been able to realize the full tax benefits that were originally anticipated.
We are subject to extensive taxation policies, which may harm our business.
The federal government has, from time to time, considered a federal tax on casino revenues and may consider such a tax in the future. If such an increase were to be enacted, it could adversely affect our business, financial conditions, results of operations and cash flow. Our ability to incur additional indebtedness in the future to finance casino development projects could be materially and adversely affected.
In addition, gaming companies are often subject to significant state and local taxes and fees, in addition to normal federal and state corporate income taxes, and such taxes and fees are subject to increase at any time and which increase may be retroactive to prior years.
Currently, in Iowa, we are taxed at an effective rate of approximately 21.5% of our adjusted gross receipts by the State of Iowa, we pay the city of Dubuque a fee equal to $500,000 per year and we pay a fee equal to 4.5% and 5.76% of adjusted gross receipts to the DRA and WCDA, respectively. In addition, all Iowa gaming licensees share equally in the costs of the Iowa Racing and Gaming Commission and related entities to administer gaming in Iowa, which is currently approximately $0.8 million per year per facility. Currently, at Evangeline Downs, we are taxed at an effective rate of approximately 36.5% of our adjusted gross slot revenue and pay to the Louisiana State Racing Commission a fee of $0.25 for each patron who enters the racino on live race days from the hours of 6:00 pm to midnight, enters the racino during non-racing season from the hours of noon to midnight Thursday through Monday, or enters any one of our off-track betting parlors. Our Amelia Belle riverboat casino in Louisiana pays an annual state gaming tax rate of 21.5% of adjusted gross receipts. In April 2017, the agreement Amelia Belle had with the Parish of St. Mary to permit the berthing of the riverboat casino in Amelia, Louisiana was modified. Prior to June 1, 2017, Amelia Belle paid
16
a percentage fee based on the level of net gaming revenue as follows: the first $60 million, 2.5%; $60 to $96 million, 3.5%; and greater than $96 million, 5.0%. The annual minimum fee due under this agreement was $1.5 million. Under the revised agreement with the Parish of St. Mary, Amelia Belle was to pay a flat fee of $1.5 million by June 1, 2017, which was met. Subsequent annual payments are due on June 15th of each year based on a net gaming proceeds for each twelve calendar month period of operation as follows: $1.4 million fee on net gaming proceeds up to $45 million, $1.5 million fee on amounts from $45 million to $50 million, $1.6 million fee on amounts from $50 million to $52.5 million, and $1.7 million fee on net gaming proceeds above $52.5 million. Kansas Star, pursuant to its Management Contract with the State of Kansas pays total taxes of between 27% and 31% of gross gaming revenue, based on achievement of the following revenue levels: 27% on gross gaming revenue up to $180 million, 29% on amounts from $180 million to $220 million, and 31% on amounts above $220 million in gross gaming revenue. Kansas Star is also contractually obligated to pay its proportionate share of certain expenses incurred by the Kansas Lottery Commission and the Kansas Racing and Gaming Commission, which historically have ranged from $3.0 million to $3.5 million on an annual basis.
If there is any material increase in state and local taxes and fees, our business, financial condition and results of operations could be adversely affected.
Risks Related to our Properties
We own real property and are subject to extensive environmental regulation, which creates uncertainty regarding future environmental expenditures and liabilities, and could affect our ability to develop, sell or rent our property or to borrow money where such property is required to be used as collateral.
We are subject to various federal, state and local environmental laws, ordinances and regulations, including those governing discharges to air and water, the generation, handling, management and disposal of petroleum products or hazardous substances or wastes, and the health and safety of our employees. Permits may be required for our operations and these permits are subject to renewal, modification and, in some cases, revocation. In addition, under environmental laws, ordinances or regulations, a current or previous owner or operator of property may be liable for the costs of investigation and removal or remediation of some kinds of hazardous substances or petroleum products on, under, or in its property, without regard to whether the owner or operator knew of, or caused, the presence of the contaminants, and regardless of whether the practices that resulted in the contamination were legal at the time they occurred. Additionally, as an owner or operator, we could also be held responsible to a governmental entity or third parties for property damage, personal injury and investigation and cleanup costs incurred by them in connection with any contamination. The liability under those laws has been interpreted to be joint and several unless the harm is divisible and there is a reasonable basis for allocation of the responsibility. The costs of investigation, remediation or removal of those substances may be substantial, and the presence of those substances, or the failure to remediate a property properly, may impair our ability to use our property.
The presence of, or failure to remediate properly, such substances may adversely affect the ability to sell or rent the property or to borrow funds using the property as collateral. Additionally, the owner of a site may be subject to claims by third parties based on damages and costs resulting from environmental contamination emanating from a site.
As part of our business in Worth County, Iowa, we operate a gas station, which includes a number of underground storage tanks containing petroleum products.
We have reviewed environmental assessments, in some cases including soil and groundwater testing, relating to our currently owned and leased properties in Dubuque, Iowa, and other properties we may lease from the City of Dubuque or other parties. As a result, we have become aware that there is contamination present on some of these properties apparently due to past industrial activities. Furthermore, the location of Kansas Star is the site of several non-operational oil wells, the remediation of which has been addressed in connection with the construction of the development project there. We have also reviewed environmental assessments and are not aware of any environmental liabilities related to any of our other properties.
Future developments regarding environmental matters could lead to material costs of environmental compliance for us and such costs could have a material adverse effect on our business and financial condition, operating results and cash flows.
Additionally, our horse racing operations are subject to oversight by the Environmental Protection Agency ("EPA"), including regulations governing concentrated animal feeding operations and the related processing of animal waste water. In 2015, Delta Downs commenced a remediation project, as a result of an EPA examination, to ensure its future compliance with the Clean Water Act. However, the ongoing operations of our horse racing operations could result in future violations of EPA regulations and exposure to associated potential fines.
We own facilities that are located in areas that experience extreme weather conditions.
Extreme weather conditions may interrupt our operations, damage our properties and reduce the number of customers who visit our facilities in the affected areas.
17
For example, certain of the properties we operate have been forced to close for extended periods due to floods and hurricanes, including Treasure Chest and Delta Downs, which have experienced closures for over 40 days on separate occasions in the past.
Blue Chip, Par-A-Dice, Sam's Town Tunica, Sam's Town Shreveport and Treasure Chest are each located in an area that has been identified by the director of the Federal Emergency Management Agency ("FEMA") as a special flood hazard area, which, according to FEMA statistics, has a 1% chance of a flood equal to or exceeding the base flood elevation (a 100-year flood) in any given year. Furthermore, our properties in Iowa, Kansas, Illinois and Indiana are at risk of experiencing snowstorms, tornadoes and flooding.
In addition to the risk of flooding and hurricanes, snowstorms and other adverse weather conditions may interrupt our operations, damage our properties and reduce the number of customers who visit our facilities in an affected area. For example, during the first quarter of 2011, and again in 2014, much of the country was impacted by unusually severe winter weather, particularly in the Midwest. These storms made it very difficult for our customers to visit, and we believe such winter weather had a material and adverse impact on the results of our operations during such times. If there is a prolonged disruption at any of our properties due to natural disasters, terrorist attacks or other catastrophic events, our results of operations and financial condition could be materially adversely affected.
To maintain our gaming licenses for our Evangeline Downs and Delta Downs racinos, we must conduct a minimum of 80 live racing days in a consecutive 20-week period each year of live horse race meetings at each racetrack, and poor weather conditions may make it difficult for us to comply with this requirement.
While we maintain insurance coverage that may cover certain of the costs and loss of revenue that we incur as a result of some extreme weather conditions, our coverage is subject to deductibles and limits on maximum benefits. There can be no assurance that we will be able to fully collect, if at all, on any claims resulting from extreme weather conditions. If any of our properties are damaged or if their operations are disrupted as a result of extreme weather in the future, or if extreme weather adversely impacts general economic or other conditions in the areas in which our properties are located or from which they draw their patrons, our business, financial condition and results of operations could be materially adversely affected.
Our insurance coverage may not be adequate to cover all possible losses that our properties could suffer, our insurance costs may increase, and we may not be able to obtain similar insurance coverage in the future.
Although we have "all risk" property insurance coverage for our operating properties, which covers damage caused by a casualty loss (such as fire, natural disasters, acts of war, or terrorism), each policy has certain exclusions. In addition, our property insurance coverage is in an amount that may be significantly less than the expected replacement cost of rebuilding the facilities if there was a total loss. Our level of insurance coverage also may not be adequate to cover all losses in the event of a major casualty. In addition, certain casualty events, such as labor strikes, nuclear events, acts of war, loss of income due to cancellation of room reservations or conventions due to fear of terrorism, deterioration or corrosion, insect or animal damage and pollution, may not be covered at all under our policies. Therefore, certain acts could expose us to substantial uninsured losses.
We also have "builder's risk" insurance coverage for our development and expansion projects. Builder's risk insurance provides coverage for projects during their construction for damage caused by a casualty loss. In general, our builder's risk coverage is subject to the same exclusions, risks and deficiencies as those described above for our all-risk property coverage. Our level of builder's risk insurance coverage may not be adequate to cover all losses in the event of a major casualty.
We maintain cyber insurance coverage that insures against certain expenses incurred by the Company in the event of any information breach, as well as insuring against certain costs and damages associated with losses by third parties. However, such insurance is unlikely to fully mitigate the impact of such an information breach.
Blue Chip, Par-A-Dice, Sam's Town Tunica, Sam's Town Shreveport and Treasure Chest are each located in an area that has been identified by the director of the FEMA as a special flood hazard area. Our level of flood insurance coverage may not be adequate to cover all losses in the event of a major flood.
We renew our insurance policies (other than our builder's risk insurance) on an annual basis. The cost of coverage may become so high that we may need to further reduce our policy limits or agree to certain exclusions from our coverage.
Our debt instruments and other material agreements require us to meet certain standards related to insurance coverage. Failure to satisfy these requirements could result in an event of default under these debt instruments or material agreements.
18
We draw a significant percentage of our customers from certain geographic regions. Events adversely impacting the economy or these regions, including public health outbreaks and man-made or natural disasters, may adversely impact our business.
The California, Fremont and Main Street Station draw a substantial portion of their customers from the Hawaiian market, with such customers historically comprising more than half of the room nights sold at each property. Decreases in discretionary consumer spending, as well as an increase in fuel costs or transportation prices, a decrease in airplane seat availability, or a deterioration of relations with tour and travel agents, particularly as they affect travel between the Hawaiian market and our facilities, could adversely affect our business, financial condition and results of operations.
Our Las Vegas properties also draw a substantial number of customers from certain other specific geographic areas, including the Southern California, Arizona and Las Vegas local markets. Native American casinos in California and other parts of the United States have diverted some potential visitors away from Nevada, which has had and could continue to have a negative effect on Nevada gaming markets. In addition, due to our significant concentration of properties in Nevada, any man-made or natural disasters in or around Nevada, or the areas from which we draw customers to our Las Vegas properties, could have a significant adverse effect on our business, financial condition and results of operations. Each of our properties located outside of Nevada depends primarily on visitors from their respective surrounding regions and are subject to comparable risk.
The strength and profitability of our business depends on consumer demand for hotel casino resorts in general and for the type of amenities our properties offer. Changes in consumer preferences or discretionary consumer spending could harm our business. Terrorist activities in the United States and elsewhere, military conflicts in Iraq, Afghanistan and elsewhere, outbreaks of infectious disease and pandemics, adverse weather conditions and natural disasters, among other things, have had negative impacts on travel and leisure expenditures. In addition, other factors affecting travel and discretionary consumer spending, including general economic conditions, disposable consumer income, fears of further economic decline and reduced consumer confidence in the economy, may negatively impact our business. We cannot predict the extent to which similar events and conditions may continue to affect us in the future. An extended period of reduced discretionary spending and/or disruptions or declines in tourism could significantly harm our operations.
Energy price increases may adversely affect our cost of operations and our revenues.
Our casino properties use significant amounts of electricity, natural gas and other forms of energy. In addition, our Hawaiian air charter operation uses a significant amount of jet fuel. While no shortages of energy or fuel have been experienced to date, substantial increases in energy and fuel prices, including jet fuel prices, in the United States have, and may continue to, negatively affect our results of operations. The extent of the impact is subject to the magnitude and duration of the energy and fuel price increases, of which the impact could be material. In addition, energy and gasoline price increases could result in a decline of disposable income of potential customers, an increase in the cost of travel and a corresponding decrease in visitation and spending at our properties, which could have a significant adverse effect on our business, financial condition and results of operations.
Our facilities, including our riverboats and dockside facilities, are subject to risks relating to mechanical failure and regulatory compliance.
Generally, all of our facilities are subject to the risk that operations could be halted for a temporary or extended period of time, as the result of casualty, forces of nature, mechanical failure, or extended or extraordinary maintenance, among other causes. In addition, our gaming operations, including those conducted on riverboats or at dockside facilities could be damaged or halted due to extreme weather conditions.
We currently conduct our Treasure Chest, Par-A-Dice, Blue Chip, Sam's Town Shreveport and Amelia Belle gaming operations on riverboats. Each of our riverboats must comply with the United States Coast Guard ("USCG") requirements as to boat design, on-board facilities, equipment, personnel and safety. Each riverboat must hold a Certificate of Inspection for stabilization and flotation, and may also be subject to local zoning codes. The USCG requirements establish design standards, set limits on the operation of the vessels and require individual licensing of all personnel involved with the operation of the vessels. Loss of a vessel's Certificate of Inspection would preclude its use as a casino.
USCG regulations require a hull inspection for all riverboats at five-year intervals. Under certain circumstances, alternative hull inspections may be approved. The USCG may require that such hull inspections be conducted at a dry-docking facility, and if so required, the cost of travel to and from such docking facility, as well as the time required for inspections of the affected riverboats, could be significant. To date, the USCG has allowed in-place underwater inspections of our riverboats twice every five years on alternate two- and three-year schedules. The USCG may not continue to allow these types of inspections in the future. The loss of a dockside casino or riverboat casino from service for any period of time could adversely affect our business, financial condition and results of operations.
Indiana and Louisiana have adopted alternate inspection standards for riverboats in those states. The standards require inspection by ABS Consulting ("ABSC"). ABSC inspection for our riverboats at Blue Chip, Treasure Chest and Sam's Town Shreveport
19
commenced during 2010. The Amelia Belle is also inspected by the ABSC. The Par-A-Dice riverboat will remain inspected by the USCG for the foreseeable future. ABSC imposes essentially the same design, personnel, safety, and hull inspection standards as the USCG. Therefore, the risks to our business associated with USCG inspection should not change by reason of inspection by ABSC. Failure of a vessel to meet the applicable USCG or ABSC standards would preclude its use as a casino.
USCG regulations also require us to prepare and follow certain security programs. In 2004, we implemented the American Gaming Association's Alternative Security Program at our riverboat casinos and dockside facilities. The American Gaming Association's Alternative Security Program is specifically designed to address maritime security requirements at riverboat casinos and their respective dockside facilities. Only portions of those regulations will apply to our riverboats inspected by ABSC. Changes to these regulations could adversely affect our business, financial condition and results of operations.
Some of our hotels and casinos are located on leased property. If we default on one or more leases, the applicable lessors could terminate the affected leases and we could lose possession of the affected hotel and/or casino.
We lease certain parcels of land on which Eastside Cannery, Suncoast, Treasure Chest, Sam's Town Shreveport and IP's hotels and gaming facilities are located. In addition, we lease other parcels of land on which portions of the California and the Fremont are located. As a ground lessee, we have the right to use the leased land; however, we do not retain fee ownership in the underlying land. Accordingly, with respect to the leased land, we will have no interest in the land or improvements thereon at the expiration of the ground leases. Moreover, since we do not completely control the land underlying the property, a landowner could take certain actions to disrupt our rights in the land leased under the long-term leases. While such interruption is unlikely, such events are beyond our control. If the entity owning any leased land chose to disrupt our use either permanently or for a significant period of time, then the value of our assets could be impaired and our business and operations could be adversely affected. If we were to default on any one or more of these leases, the applicable lessors could terminate the affected leases and we could lose possession of the affected land and any improvements on the land, including the hotels and casinos. This would have a significant adverse effect on our business, financial condition and results of operations as we would then be unable to operate all or portions of the affected facilities.
Our ability to utilize our net operating loss carryforwards and certain other tax attributes may be limited.
As of
December 31, 2017
, we had net operating losses ("NOLs") for federal income tax purposes. Under Section 382 of the Internal Revenue Code, if a corporation undergoes an "ownership change" as defined in that section, the corporation's ability to use its pre-change NOLs and other pre-change tax attributes to offset its post-change income may become subject to significant limitations. We may experience an ownership change in the future as a result of shifts in our stock ownership, which may result from the issuance of our common stock, the exercise of stock options and other equity compensation awards, as well as ordinary sales and purchases of our common stock, among other things. If an ownership change in our stock were to be triggered in the future, our subsequent ability to use any NOLs existing at that time could be significantly limited. Additionally, on December 22, 2017, the U.S. government enacted comprehensive tax legislation commonly referred to as the Tax Cuts and Jobs Act (the "Tax Act"). The Tax Act changed the carryback and carryforward periods for NOLs generated after December 31, 2017 and imposed annual limitations on the use of such NOLs. While the rules for NOLs generated prior to December 31, 2017 did not change, our NOLs all predate the change, it is possible future law changes could affect the ability to utilize NOLs prospectively.
Risks Related to our Indebtedness
We have a significant amount of indebtedness.
If we pursue, or continue to pursue, any expansion, development, investment or renovation projects, we expect that our long-term debt will substantially increase in connection with related capital expenditures. This indebtedness could have important consequences, including:
|
•
|
difficulty in satisfying our obligations under our current indebtedness;
|
|
•
|
increasing our vulnerability to general adverse economic and industry conditions;
|
|
•
|
requiring us to dedicate a substantial portion of our cash flows from operations to payments on our indebtedness, which would reduce the availability of our cash flows to fund working capital, capital expenditures, expansion efforts and other general corporate purposes;
|
|
•
|
limiting our flexibility in planning for, or reacting to, changes in our business and the industry in which we operate;
|
|
•
|
placing us at a disadvantage compared to our competitors that have less debt; and
|
|
•
|
limiting, along with the financial and other restrictive covenants in our indebtedness, among other things, our ability to borrow additional funds.
|
20
Our debt instruments contain, and any future debt instruments likely will contain, a number of restrictive covenants that impose significant operating and financial restrictions on us, including restrictions on our ability to, among other things:
|
•
|
incur additional debt, including providing guarantees or credit support;
|
|
•
|
incur liens securing indebtedness or other obligations;
|
|
•
|
make certain investments;
|
|
•
|
dispose of assets;
|
|
•
|
make certain acquisitions;
|
|
•
|
pay dividends or make distributions and make other restricted payments;
|
|
•
|
enter into sale and leaseback transactions;
|
|
•
|
engage in any new businesses; and
|
|
•
|
enter into transactions with our stockholders and our affiliates.
|
Failure to comply with these covenants could result in an event of default, which, if not cured or waived, could have a significant adverse effect on our business, results of operations and financial condition.
Note 7,
Long-Term Debt,
included in the notes to our audited consolidated financial statements presented in Part II, Item 8, contains further disclosure regarding our current outstanding debt.
To service our indebtedness, we will require a significant amount of cash. Our ability to generate cash depends on many factors beyond our control.
Our ability to make payments on and to refinance our indebtedness and to fund planned capital expenditures and expansion efforts will depend upon our ability to generate cash in the future. This, to a certain extent, is subject to general economic, financial, competitive, legislative, regulatory and other factors that are beyond our control.
It is unlikely that our business will generate sufficient cash flows from operations, or that future borrowings will be available to us under the Credit Facility in amounts sufficient to enable us to pay our indebtedness, as such indebtedness matures and to fund our other liquidity needs. We believe that we will need to refinance all or a portion of our indebtedness, at or before maturity, and cannot provide assurances that we will be able to refinance any of our indebtedness, including amounts borrowed under the Credit Facility, on commercially reasonable terms, or at all. We may have to adopt one or more alternatives, such as reducing or delaying planned expenses and capital expenditures, selling assets, restructuring debt, or obtaining additional equity or debt financing or joint venture partners. These financing strategies may not be affected on satisfactory terms, if at all. In addition, certain states' laws contain restrictions on the ability of companies engaged in the gaming business to undertake certain financing transactions. Some restrictions may prevent us from obtaining necessary capital.
We and our subsidiaries may still be able to incur substantially more debt, which could further exacerbate the risks described above.
We and our subsidiaries may be able to incur substantial additional indebtedness in the future. The terms of the indentures governing our senior notes do not fully prohibit us or our subsidiaries from doing so. Borrowings under the Credit Facility are effectively senior to our senior notes and the guarantees of our subsidiary guarantors to the extent of the value of the collateral securing such borrowings. If new debt is added to our, or our subsidiaries', current debt levels, the related risks that we or they now face could intensify.
If we are unable to finance our expansion, development, investment and renovation projects, as well as other capital expenditures, through cash flow, borrowings under the Credit Facility, access to the capital markets and additional financings, our expansion, development, investment and renovation efforts will be jeopardized.
We intend to finance our current and future expansion, which includes our Pending Acquisitions, development, investment and renovation projects, as well as our other capital expenditures, primarily with cash flow from operations, borrowings under our Credit Facility, and equity or debt financings. If we are unable to finance our current or future expansion, including our Pending Acquisitions, development, investment and renovation projects, or our other capital expenditures, we will have to adopt one or
21
more alternatives, such as reducing, delaying or abandoning planned expansion, development, investment and renovation projects, terminating our Pending Acquisitions, as well as other capital expenditures, selling assets, restructuring debt, obtaining additional equity financing or joint venture partners, or modifying the Credit Facility. These sources of funds may not be sufficient to finance our expansion, development, investment and renovation projects, and other financing may not be available on acceptable terms, in a timely manner, or at all. In addition, failure to consummate our Pending Acquisitions could have a material adverse impact on our business, and with respect to the Penn National Purchase could result in a reverse termination fee payment of up to $58 million in certain circumstances. In addition, our existing indebtedness contains certain restrictions on our ability to incur additional indebtedness.
Although we successfully refinanced a significant amount of our indebtedness in 2015, 2016 and 2017, we have no assurance that we will continue to have access to credit or capital markets at desirable times or at rates that we would consider acceptable, and the lack of such funding could have a material adverse effect on our business, results of operations and financial condition, including our ability to refinance Boyd Gaming's indebtedness, our flexibility to react to changing economic and business conditions and our ability or willingness to fund new development projects.
In the past, there have been significant disruptions in the global capital markets that adversely impacted the ability of borrowers to access capital. A crisis may greatly restrict the availability of capital and cause the cost of capital (if available) to be much higher than it has traditionally been. Although the financial markets have generally recovered from the most recent financial crisis and availability of capital has increased, the financial markets remain volatile. While we currently anticipate that we will be able to fund any expansion projects using cash flows from operations and availability under the Credit Facility (to the extent that availability exists after we meet our working capital needs), if availability under our Credit Facility does not exist or we are otherwise unable to make sufficient borrowings thereunder, any additional financing that is needed may not be available to us or, if available, may not be on terms favorable to us. As a result, if we are unable to obtain adequate project financing in a timely manner, or at all, we may be forced to sell assets in order to raise capital for projects, limit the scope of, or defer such projects, or cancel the projects altogether. In the event that we are unable to access capital with favorable terms, additional equity and/or credit support may be necessary to obtain construction financing for the remaining cost of the project.
We are not able to predict the duration or strength of the current economic recovery, the resulting impact on the solvency or liquidity of our lenders, or the possibility of a future recession. Prolonged slow growth or a downturn, or further worsening or broadening of adverse conditions in worldwide and domestic economies could affect our lenders. If a large percentage of our lenders were to file for bankruptcy or otherwise default on their obligations to us, we may not have the liquidity under the Credit Facility to fund our current projects. There is no certainty that our lenders will continue to remain solvent or fund their respective obligations under the Credit Facility. If we were otherwise required to renegotiate or replace the Credit Facility, there is no assurance that we would be able to secure terms that are as favorable to us, if at all.
Risks Related to our Equity Ownership
Our common stock price may fluctuate substantially, and a shareholder's investment could decline in value.
The market price of our common stock may fluctuate substantially due to many factors, including:
|
•
|
actual or anticipated fluctuations in our results of operations;
|
|
•
|
announcements of significant acquisitions or other agreements by us or by our competitors;
|
|
•
|
our sale of common stock or other securities in the future;
|
|
•
|
trading volume of our common stock;
|
|
•
|
conditions and trends in the gaming and destination entertainment industries;
|
|
•
|
changes in the estimation of the future size and growth of our markets; and
|
|
•
|
general economic conditions, including, without limitation, changes in the cost of fuel and air travel.
|
In addition, the stock market in general has experienced extreme price and volume fluctuations that have often been unrelated or disproportionate to companies' operating performance. Broad market and industry factors may materially harm the market price of our common stock, regardless of our operating performance. In the past, following periods of volatility in the market price of a company's securities, shareholder derivative lawsuits and/or securities class action litigation has often been instituted against that company. Such litigation, if instituted against us, could result in substantial costs and a diversion of management's attention and resources.
22
Certain of our stockholders own large interests in our capital stock and may significantly influence our affairs.
William S. Boyd, our Executive Chairman of the Board of Directors, together with his immediate family, beneficially owned approximately
27%
of the Company's outstanding shares of common stock as of
December 31, 2017
. As such, the Boyd family has the ability to significantly influence our affairs, including the election of members of our Board of Directors and, except as otherwise provided by law, approving or disapproving other matters submitted to a vote of our stockholders, including a merger, consolidation, or sale of assets.
None
23
Information relating to the location and general characteristics of our properties is provided in Part I, Item 1,
Business - Properties
, and is incorporated herein by reference.
As of
December 31, 2017
, some of our properties are located on leased property, including:
|
•
|
Suncoast, located on 49 acres of leased land.
|
|
•
|
Eastside Cannery, located on 30 acres of leased land.
|
|
•
|
California, located on 13.9 acres of owned land and 1.6 acres of leased land.
|
|
•
|
Fremont, located on 1.4 acres of owned land and 0.9 acres of leased land.
|
|
•
|
IP, located on 24 acres of owned land and 3.9 acres of leased land.
|
|
•
|
Treasure Chest, located on 14 acres of leased land.
|
|
•
|
Sam's Town Shreveport, located on 18 acres of leased land.
|
|
•
|
Diamond Jo Dubuque, located on 7 acres of owned land and leases approximately 2.0 acres of parking surfaces.
|
|
•
|
Diamond Jo Worth, which leases 33 acres of land in Emmons, Minnesota that is used as a nine-hole golf course and a nine-station sporting clay course and hunting facility.
|
|
•
|
Evangeline Downs, which leases the facilities that comprise the Henderson, Eunice and St. Martinville OTBs.
|
We are parties to various legal proceedings arising in the ordinary course of business. We believe that all pending claims, if adversely decided, would not have a material adverse effect on our business, financial position or results of operations.
Not applicable
24
|
ITEM 5.
|
Market for Registrant's Common Equity, Related Stockholder Matters and Issuer Purchases of Equity Securities
|
Our common stock is listed on the New York Stock Exchange under the symbol "BYD." Information with respect to sales prices and holders of record of our common stock is set forth below.
Market Information
The following table sets forth, for the calendar quarters indicated, the high and low sales prices of our common stock as reported by the New York Stock Exchange:
|
|
High
|
Low
|
|||||
|
Year Ended December 31, 2017
|
|
|
|||||
|
First Quarter
|
$
|
22.01
|
|
$
|
19.34
|
|
|
|
Second Quarter
|
25.93
|
|
21.32
|
|
|||
|
Third Quarter
|
26.79
|
|
24.40
|
|
|||
|
Fourth Quarter
|
35.81
|
|
25.58
|
|
|||
|
Year Ended December 31, 2016
|
|
|
|||||
|
First Quarter
|
$
|
20.74
|
|
$
|
14.96
|
|
|
|
Second Quarter
|
21.35
|
|
17.45
|
|
|||
|
Third Quarter
|
20.26
|
|
18.13
|
|
|||
|
Fourth Quarter
|
21.46
|
|
17.00
|
|
|||
On February 21, 2018, the closing sales price of our common stock on the NYSE was $35.01 per share. On that date, we had approximately 672 holders of record of our common stock and our directors and executive officers owned approximately 27% of the outstanding shares. There are no other classes of common equity outstanding.
Dividends
Dividends are declared at the discretion of our Board of Directors. We are subject to certain limitations regarding the payment of dividends, such as restricted payment limitations contained in our Credit Facility and the indentures for our outstanding notes.
On May 2, 2017, the Company announced that its Board of Directors had authorized the reinstatement of the Company’s cash dividend program. The dividends declared by the Board under this program are:
|
Declaration date
|
Record date
|
Payment date
|
Amount per share
|
|||
|
May 2, 2017
|
June 15, 2017
|
July 15, 2017
|
$0.05
|
|||
|
September 6, 2017
|
September 18, 2017
|
October 15, 2017
|
0.05
|
|||
|
December 7, 2017
|
December 28, 2017
|
January 15, 2018
|
0.05
|
|||
No dividends were declared during the years ended December 31,
2016
or
2015
.
Share Repurchase Program
The following table discloses share repurchases that we have made pursuant to our share repurchase program during the three months ended
December 31, 2017
.
|
Period
|
Total Number of Shares Purchased
|
Average Price Paid Per Share
|
Total Number of Shares Purchased as Part of a Publicly Announced Plan
|
Approximate Dollar Value That May Yet Be Purchased Under the Plan
|
||||||||||
|
October 1, 2017 through October 31, 2017
|
114,706
|
|
$
|
27.38
|
|
114,706
|
|
$
|
66,748,649
|
|
||||
|
November 1, 2017 through November 30, 2017
|
120,290
|
|
29.61
|
|
120,290
|
|
63,187,372
|
|
||||||
|
December 1, 2017 through December 31, 2017
|
93,119
|
|
32.92
|
|
93,119
|
|
60,122,294
|
|
||||||
|
Totals
|
328,115
|
|
328,115
|
|
$
|
60,122,294
|
|
|||||||
25
In July 2008, our Board of Directors authorized an amendment to our existing share repurchase program to increase the amount of common stock available to be repurchased to $100 million. On May 2, 2017 the Company announced that its Board of Directors had reaffirmed the Company's existing share repurchase program. As of
December 31, 2017
,
$60.1 million
of this authorization remained available to fund share repurchases. We are not obligated to repurchase any shares under this program. There were 1.2 million shares repurchased during the year ended
December 31, 2017
. Subject to applicable corporate securities laws, repurchases under this program may be made at such times and in such amounts as we deem appropriate. Repurchases are funded with existing cash resources and availability under the Credit Facility. We are subject to certain limitations regarding the repurchase of common stock, such as restricted payment limitations contained in our Credit Facility and the indentures for our outstanding notes.
We may acquire our debt or equity securities through open market purchases, privately negotiated transactions, tender offers, exchange offers, redemptions or otherwise, upon such terms and at such prices as we may determine.
Our Definitive Proxy Statement to be filed in connection with our 2018 Annual Meeting of Stockholders, incorporated herein by reference, contains information concerning securities authorized for issuance under equity compensation plans within the captions
Ownership of Certain Beneficial Owners and Management
and
Equity Compensation Plan Information.
26
Stock Performance Graph
The graph below compares the five-year cumulative total return on our common stock to the cumulative total return of the Standard & Poor's MidCap 400 Index ("S&P 400") and to companies in our peer group, which is comprised of Penn National Gaming, Inc., Pinnacle Entertainment, Inc., Red Rock Resort, Inc. and Eldorado Resorts, Inc. The peer group has been revised from the group presented in 2016, which consisted of Isle of Capri Casinos, Inc., Penn National Gaming, Inc. and Pinnacle Entertainment, Inc., due to the acquisition of Isle of Capri by another company. The performance graph assumes that $100 was invested on December 31, 2012 in each of the Company's common stock, the S&P 400 and our peer group, and that all dividends were reinvested. For purposes of the performance graph, in cases in which a shareholder of a peer group company received shares of another company in a corporate transaction, the value of the additional shares received are considered to be a dividend and assumed to be reinvested in the stock of the peer company on the date of the transaction. The stock price performance shown in this graph is neither necessarily indicative of, nor intended to suggest, future stock price performance.
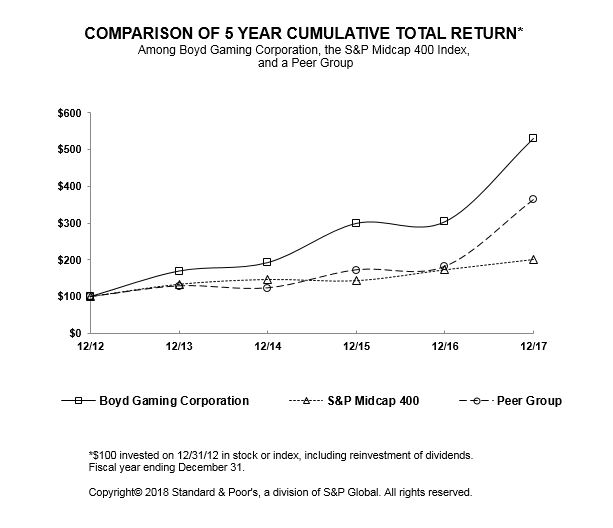
|
Indexed Returns
|
|||||||||||
|
|
Boyd Gaming Corp.
|
S&P 400
|
Peer Group
|
||||||||
|
December 2013
|
$
|
169.58
|
|
$
|
133.50
|
|
$
|
129.09
|
|
||
|
December 2014
|
192.47
|
|
146.54
|
|
123.68
|
|
|||||
|
December 2015
|
299.25
|
|
143.35
|
|
172.72
|
|
|||||
|
December 2016
|
303.77
|
|
173.08
|
|
182.10
|
|
|||||
|
December 2017
|
530.67
|
|
201.20
|
|
363.48
|
|
|||||
The performance graph should not be deemed filed or incorporated by reference into any other of our filings under the Securities Act of 1933 or the Exchange Act of 1934, unless we specifically incorporate the performance graph by reference therein.
27
The selected consolidated financial data presented below has been derived from our audited consolidated financial statements. This information should be read in conjunction with the Management’s Discussion and Analysis of Financial Condition and Results of Operations and our audited Consolidated Financial Statements and accompanying notes thereto.
|
Year Ended December 31,
|
|||||||||||||||||||
|
(In thousands, except per share data)
|
2017 (a)
|
2016 (b)
|
2015 (c)
|
2014 (d)
|
2013 (e)
|
||||||||||||||
|
|
|||||||||||||||||||
|
Net revenues
|
$
|
2,383,707
|
|
$
|
2,183,976
|
|
$
|
2,199,432
|
|
$
|
2,142,255
|
|
$
|
2,198,738
|
|
||||
|
Operating income
|
343,495
|
|
260,627
|
|
271,202
|
|
173,732
|
|
231,217
|
|
|||||||||
|
Income (loss) from continuing operations before income taxes
|
170,807
|
|
7,987
|
|
4,061
|
|
(56,033
|
)
|
(55,887
|
)
|
|||||||||
|
Income (loss) from continuing operations, net of tax
|
167,801
|
|
205,473
|
|
10,695
|
|
(50,625
|
)
|
(63,571
|
)
|
|||||||||
|
Income (loss) from discontinued operations, net of tax
|
21,392
|
|
212,530
|
|
36,539
|
|
8,987
|
|
(44,983
|
)
|
|||||||||
|
Net income (loss) attributable to Boyd Gaming Corporation
|
189,193
|
|
418,003
|
|
47,234
|
|
(53,041
|
)
|
(80,264
|
)
|
|||||||||
|
Income (loss) from continuing operations per common share
|
|||||||||||||||||||
|
Basic
|
$
|
1.46
|
|
$
|
1.79
|
|
$
|
0.10
|
|
$
|
(0.46
|
)
|
$
|
(0.65
|
)
|
||||
|
Diluted
|
$
|
1.45
|
|
$
|
1.78
|
|
$
|
0.10
|
|
$
|
(0.46
|
)
|
$
|
(0.65
|
)
|
||||
|
Dividends declared per common share
|
$
|
0.15
|
|
$
|
—
|
|
$
|
—
|
|
$
|
—
|
|
$
|
—
|
|
||||
|
|
|||||||||||||||||||
|
Cash and cash equivalents
|
$
|
203,104
|
|
$
|
193,862
|
|
$
|
158,821
|
|
$
|
145,341
|
|
$
|
140,311
|
|
||||
|
Total assets
|
4,685,930
|
|
4,670,751
|
|
4,350,900
|
|
4,422,384
|
|
5,657,522
|
|
|||||||||
|
Long-term debt, net of current maturities
|
3,051,899
|
|
3,199,119
|
|
3,239,799
|
|
3,375,098
|
|
3,482,610
|
|
|||||||||
|
Total stockholders' equity
|
1,100,976
|
|
934,126
|
|
508,011
|
|
438,087
|
|
650,437
|
|
|||||||||
|
Other Data:
|
|||||||||||||||||||
|
Ratio of earnings to fixed charges (f)
|
1.9x
|
|
1.0x
|
|
1.0x
|
|
—
|
|
—
|
|
|||||||||
(a)
2017 includes a full year of financial results for Aliante, Cannery and Eastside Cannery. Additionally, 2017 includes a noncash income tax benefit of $60.1 million related to the changes in tax legislation. Discontinued operations for 2017 include our after-tax share of the proceeds related to the final settlement of Borgata’s property tax disputes with Atlantic City. The Company has accounted for its 50% investment in Borgata as discontinued operations for all periods presented in these consolidated financial statements.
(b)
2016 includes $38.3 million in pretax, non-cash impairment charges which includes non-cash impairment charges of $23.6 million, $12.5 million and $0.8 million for a gaming license, goodwill and trademarks, respectively, in our Midwest and South segment; and $42.4 million in pretax loss on early extinguishments and modifications of debt. Additionally, 2016 includes a noncash income tax benefit of $201.5 million resulting from the release of a previously recorded deferred tax asset valuation allowance. The financial results of Aliante are included in these financial results from its September 27, 2016 date of acquisition, and the financial results of Cannery and Eastside Cannery are included from their December 20, 2016 date of acquisition. Discontinued operations for 2016 include an after-tax gain on the sale of our equity interest in Borgata of
$181.7 million
.
28
(c)
2015 includes $18.6 million in pretax, non-cash impairment charges, which includes a $17.5 million non-cash impairment charge for a gaming license in our Midwest and South segment; and $40.7 million in pretax loss on early extinguishments and modifications of debt.
(d)
2014 includes $48.7 million in pretax, non-cash impairment charges, which includes impairment charges of $39.8 million for gaming licenses and $0.3 million of trademarks in our Midwest and South segment, and a $8.7 million charge to write down the value of certain non-operating assets.
(e)
2013 includes $5.4 million in pretax, non-cash impairment charges; and $28.3 million in pretax loss on early extinguishments and modifications of debt. We completed the sale of certain assets and liabilities of the Dania Jai-Alai business on May 22, 2013, and have presented its results as discontinued operations for all periods presented. As a result of the sale of the Echelon site on March 4, 2013, we ceased consolidation of LVE Energy Partners, LLC, as of that date.
(f)
For purposes of computing this ratio, "earnings" consist of income before income taxes and income/(loss) from unconsolidated affiliates, plus fixed charges (excluding capitalized interest) and distributed income of equity investees. "Fixed charges" include interest whether expensed or capitalized, amortization of debt expense, discount, or premium related to indebtedness (included in interest expense), and such portion of rental expense that we deem to be a reasonable representation of the interest factor. Due primarily to certain non-cash charges deducted in the determination of our earnings, the earnings were less than fixed charges by $57.3 million and $57.0 million for 2014 and 2013, respectively.
29
The following discussion should be read in conjunction with our consolidated financial statements and the related notes thereto and other financial information included in this Annual Report on Form 10-K. In addition to the historical information, certain statements in this discussion are forward-looking statements based on current expectations that involve risks and uncertainties. Actual results and the timing of certain events may differ significantly from those projected in such forward-looking statements.
EXECUTIVE OVERVIEW
Boyd Gaming Corporation (the "Company," "Boyd Gaming," "we" or "us") is a multi-jurisdictional gaming company that has been in operation since 1975.
As of December 31, 2017, we are a diversified operator of 24 wholly owned gaming entertainment properties. Headquartered in Las Vegas, Nevada, we have gaming operations in Nevada, Illinois, Indiana, Iowa, Kansas, Louisiana and Mississippi. We view each operating property as an operating segment. For financial reporting purposes, we aggregate our wholly owned properties into the following three reportable segments:
|
Las Vegas Locals
|
|
|
Gold Coast Hotel and Casino
|
Las Vegas, Nevada
|
|
The Orleans Hotel and Casino
|
Las Vegas, Nevada
|
|
Sam's Town Hotel and Gambling Hall
|
Las Vegas, Nevada
|
|
Suncoast Hotel and Casino
|
Las Vegas, Nevada
|
|
Eastside Cannery Casino and Hotel
|
Las Vegas, Nevada
|
|
Aliante Casino + Hotel + Spa
|
North Las Vegas, Nevada
|
|
Cannery Casino Hotel
|
North Las Vegas, Nevada
|
|
Eldorado Casino
|
Henderson, Nevada
|
|
Jokers Wild Casino
|
Henderson, Nevada
|
|
Downtown Las Vegas
|
|
|
California Hotel and Casino
|
Las Vegas, Nevada
|
|
Fremont Hotel and Casino
|
Las Vegas, Nevada
|
|
Main Street Station Casino, Brewery and Hotel
|
Las Vegas, Nevada
|
|
Midwest and South
|
|
|
Par-A-Dice Hotel and Casino
|
East Peoria, Illinois
|
|
Blue Chip Casino, Hotel & Spa
|
Michigan City, Indiana
|
|
Diamond Jo Dubuque
|
Dubuque, Iowa
|
|
Diamond Jo Worth
|
Northwood, Iowa
|
|
Kansas Star Casino
|
Mulvane, Kansas
|
|
Amelia Belle Casino
|
Amelia, Louisiana
|
|
Delta Downs Racetrack Casino & Hotel
|
Vinton, Louisiana
|
|
Evangeline Downs Racetrack and Casino
|
Opelousas, Louisiana
|
|
Sam's Town Hotel and Casino
|
Shreveport, Louisiana
|
|
Treasure Chest Casino
|
Kenner, Louisiana
|
|
IP Casino Resort Spa
|
Biloxi, Mississippi
|
|
Sam's Town Hotel and Gambling Hall
|
Tunica, Mississippi
|
In addition to these properties, we own and operate a travel agency and a captive insurance company that underwrites travel-related insurance, each located in Hawaii. Financial results for these operations are included in our Downtown Las Vegas segment, as our Downtown Las Vegas properties concentrate their marketing efforts on gaming customers from Hawaii.
On May 31, 2016, we announced that we had entered into an Equity Purchase Agreement to sell our 50% equity interest in the parent company of Borgata Hotel Casino and Spa ("Borgata") to MGM Resorts International ("MGM"). This transaction closed
on August 1, 2016. We accounted for our investment in Borgata by applying the equity method and reported its results as discontinued operations for all periods presented in this Annual Report on Form 10-K.
30
On September 2, 2016, the Peninsula Gaming, LLC ("Peninsula") debt was refinanced, eliminating the financing structure that restricted our ability to transfer cash from Peninsula to Boyd Gaming. As a result of the elimination of this restriction, management concluded that the properties previously comprising the Peninsula segment would be aggregated into the Midwest and South reportable segment.
Our Las Vegas Locals segment includes our wholly owned subsidiaries Aliante Casino + Hotel + Spa ("Aliante") for the period following its September 27, 2016 acquisition, and Cannery Casino Hotel and Eastside Cannery Casino and Hotel (together, the "Cannery Properties") for the period following their December 20, 2016 acquisition. See Note 2,
Acquisitions and Divestitures
, to our consolidated financial statements presented in Part II, Item 8.
We operate gaming entertainment properties, most of which also include hotel, dining, retail and other amenities. Our main business emphasis is on slot revenues, which are highly dependent upon the number of visits and spending levels of customers at our properties, which affects our operating results.
Our properties have historically generated significant operating cash flow, with the majority of our revenue being cash-based. While we do provide casino credit, subject to certain gaming regulations and jurisdictions, most of our customers wager with cash and pay for non-gaming services by cash or credit card.
Our industry is capital intensive and we rely heavily on the ability of our properties to generate operating cash flow in order to fund maintenance capital expenditures, fund acquisitions, provide excess cash for future development, repay debt financing and associated interest costs, repurchase our debt or equity securities, and pay income taxes and dividends.
Our primary areas of focus are: (i) ensuring our existing operations are managed as efficiently as possible, and remain positioned for growth, including our strategic investing in non-gaming amenities; (ii) improving our capital structure and strengthening our balance sheet, including paying down debt, improving operations and diversifying our asset base; and (iii) successfully implementing our growth strategy, which is built on identifying development opportunities and acquiring assets that are a good strategic fit and provide an appropriate return to our shareholders.
Our Strategy
Our overriding strategy is to increase shareholder value by pursuing strategic initiatives that improve and grow our business.
Strengthening our Balance Sheet
We are committed to finding opportunities to strengthen our balance sheet through diversifying and increasing cash flow to reduce our debt.
Operating Efficiently
We are committed to operating more efficiently, and endeavor to prevent unneeded expense in our business. As we continue to experience revenue growth in both our gaming and non-gaming operations, the efficiencies of our business model position us to flow a substantial portion of revenue growth directly to the bottom line.
Evaluating Acquisition Opportunities
Our evaluations of potential transactions and acquisitions are strategic, deliberate, and disciplined. Our goal is to identify and pursue opportunities that are a good fit for our business, deliver a solid return for shareholders, and are available at the right price.
Maintaining our Brand
The ability of our employees to deliver great customer service helps distinguish our Company and our brands from our competitors. Our employees are an important reason that our customers continue to choose our properties over the competition across the country.
Our Key Performance Indicators
We use several key performance measures to evaluate the operations of our properties. These key performance measures include the following:
|
•
|
Gaming revenue measures
:
slot handle
, which means the dollar amount wagered in slot machines, and
table game drop
, which means the total amount of cash deposited in table games drop boxes, plus the sum of markers issued at all table games, are measures of volume and/or market share.
Slot win
and
table game hold
, which mean the difference between customer wagers and customer winnings on slot machines and table games, respectively, represent the amount of wagers retained by us and recorded as gaming revenues. Slot win percentage and table game hold percentage, which are not fully
|
31
controllable by us, represent the relationship between slot handle to slot win and table game drop to table game hold, respectively.
|
•
|
Food and beverage revenue measures
:
average guest check
, which means the average amount spent per customer visit and is a measure of volume and product offerings;
number of guests served
("food covers") is an indicator of volume; and the
cost per guest served
is a measure of operating margin.
|
|
•
|
Room revenue measures
:
hotel occupancy rate
, which measures the utilization of our available rooms; and
average daily rate
("ADR"), which is a price measure.
|
RESULTS OF OPERATIONS
Overview
|
Year Ended December 31,
|
|||||||||||
|
(In millions)
|
2017
|
2016
|
2015
|
||||||||
|
Net revenues
|
$
|
2,383.7
|
|
$
|
2,184.0
|
|
$
|
2,199.4
|
|
||
|
Operating income
|
343.5
|
|
260.6
|
|
271.2
|
|
|||||
|
Income from continuing operations, net of tax
|
167.8
|
|
205.5
|
|
10.7
|
|
|||||
|
Income from discontinued operations, net of tax
|
21.4
|
|
212.5
|
|
36.5
|
|
|||||
|
Net income
|
189.2
|
|
418.0
|
|
47.2
|
|
|||||
Net Revenues
Net revenues increased approximately
$199.7 million
, or
9.1%
, for
2017
as compared to
2016
due primarily to the acquisitions of Aliante and the Cannery Properties (the "Acquisitions") in September and December 2016, respectively. In addition, net revenues related to our Las Vegas Locals segment, excluding the Acquisitions, and the Downtown Las Vegas segment, increased $13.3 million and $7.2 million, respectively, from the prior year comparable period. These increases are offset by declines in net revenues in the Midwest and South segment, primarily at Evangeline Downs and Amelia Belle, due to localized economic weakness.
Net revenues decreased approximately $15.5 million, or 0.7%, for 2016 as compared to 2015 due to a $55.4 million decrease in net revenues in the Midwest and South segment, primarily in gaming revenue. These decreases were primarily at IP, Evangeline Downs and Par-A-Dice. The three markets in which these casinos operate continue to struggle with soft markets and increased gaming capacity. Offsetting this decrease were increases of $37.8 million and $2.2 million in net revenues in the Las Vegas Locals segment and the Downtown Las Vegas segment, respectively.
Operating Income
In
2017
, our operating income increased
$82.9 million
as compared to
2016
, which reflected the addition of the Acquisitions, as well as the impact of our continuing cost control efforts. Changes in operating margins are discussed in detail below. The increase was also driven by project development, preopening and writedowns expense decreasing by $7.7 million as compared to the prior year, along with the inclusion in the prior year of $38.3 million in impairments of intangible assets, both of which are discussed in their respective sections below. Corporate expense increased $15.5 million over the comparable prior year due to costs related to creation of back-of-house support functions as part of the implementation of our business improvement initiatives.
In 2016, our operating income decreased $10.6 million as compared to 2015 due to a $19.7 million increase in impairment charges and a $15.2 million increase in project development, preopening and writedowns costs over the prior year period, related primarily to costs surrounding our Acquisitions, which more than offset decreases in maintenance and utilities and depreciation and amortization expenses.
Income From Continuing Operations, Net of Tax
Income from continuing operations, net of tax was
$167.8 million
in
2017
, as compared to
$205.5 million
in
2016
, a decrease of
$37.7 million
. This decrease was attributable to a
$200.5 million
change in the income tax provision primarily due to the release in the prior year of a valuation allowance on our federal and unitary state income tax net operating loss carryforwards and deferred tax assets, offset by a noncash income tax benefit of $60.1 million related to the changes in tax legislation in 2017. Partially offsetting this benefit, is a $40.8 million decline in loss on early extinguishments of debt compared to the prior year period due to the modification of the Boyd Gaming Credit Facility, redemption of our 9.0% senior notes due 2018 and Peninsula Gaming's 8.375% senior notes due 2018, and the extinguishment of the Peninsula Gaming bank credit facility. In addition, operating income increased
$82.9 million
from the prior year period for those factors mentioned above and interest expense, net of amounts capitalized, declined by $39.6 million due to a decrease in average outstanding borrowings of $129.7 million, along with a decline in the weighted average interest rate of 0.9%.
32
Income from continuing operations, net of tax in 2016 increased $194.8 million, as compared to the comparable prior year period, due to an income tax benefit of $201.5 million related to the release of a valuation allowance on our federal and state income tax net operating loss carryforwards and other deferred tax assets. Interest expense, net of amounts capitalized, for 2016 decreased $11.9 million compared to the prior year primarily due to interest rate effects of our debt refinancing transactions. These items were offset by the increase in impairment charges and in project development, preopening and writedowns expenses.
Income From Discontinued Operations, Net of Tax
Income from discontinued operations, net of tax, reflects the results of our equity method investment in Borgata. The 2017 results include property tax recovery proceeds of $36.2 million related to the final settlement of Borgata's property tax disputes with Atlantic City. In 2016, the Company recorded a $181.7 million after-tax gain on the sale of our equity interest in Borgata and property tax refunds of $9.1 million, which were received after the sale, both of which are included in discontinued operations in 2016. The 2015 activity includes our share of Borgata's net income.
Net Income
For the year ended December 31,
2017
, net income was
$189.2 million
, compared with net income of
$418.0 million
for the corresponding period of the prior year. The
$228.8 million
change is primarily due to the decrease in income from continuing operations, net of tax along with a $191.1 million decrease in income from discontinued operations from the prior year (both items discussed above).
For the year ended December 31, 2016, net income was $418.0 million, compared with net income of $47.2 million for the corresponding period of the prior year. The $370.8 million increase is primarily due to an income tax benefit of $201.5 million related to the release of a valuation allowance on our federal and state income tax net operating loss carryforwards and other deferred tax assets and to the gain on the sale of our equity interest in Borgata on August 1, 2016.
Operating Revenues
We derive the majority of our gross revenues from our gaming operations, which generated approximately
75%
of gross revenues for both
2017
and
2016
and 76% of gross revenues in
2015
. Food and beverage gross revenues represent our next most significant revenue source, generating approximately
13%
of gross revenues for
2017
,
2016
, and
2015
. Room revenues and other revenues separately contributed less than 10% of gross revenues during each year.
|
Year Ended December 31,
|
|||||||||||
|
(In millions)
|
2017
|
2016
|
2015
|
||||||||
|
REVENUES
|
|||||||||||
|
Gaming
|
$
|
1,972.4
|
|
$
|
1,820.2
|
|
$
|
1,847.2
|
|
||
|
Food and beverage
|
349.3
|
|
306.1
|
|
307.4
|
|
|||||
|
Room
|
188.7
|
|
170.8
|
|
163.5
|
|
|||||
|
Other
|
132.7
|
|
122.5
|
|
124.0
|
|
|||||
|
Gross revenues
|
2,643.1
|
|
2,419.6
|
|
2,442.1
|
|
|||||
|
Less promotional allowances
|
259.4
|
|
235.6
|
|
242.7
|
|
|||||
|
Net revenues
|
$
|
2,383.7
|
|
$
|
2,184.0
|
|
$
|
2,199.4
|
|
||
|
COSTS AND EXPENSES
|
|||||||||||
|
Gaming
|
$
|
923.3
|
|
$
|
880.7
|
|
$
|
900.9
|
|
||
|
Food and beverage
|
194.5
|
|
170.1
|
|
168.1
|
|
|||||
|
Room
|
52.2
|
|
44.2
|
|
41.3
|
|
|||||
|
Other
|
77.1
|
|
76.7
|
|
80.5
|
|
|||||
|
Total costs and expenses
|
$
|
1,247.1
|
|
$
|
1,171.7
|
|
$
|
1,190.8
|
|
||
|
MARGINS
|
|||||||||||
|
Gaming
|
53.19
|
%
|
51.61
|
%
|
51.23
|
%
|
|||||
|
Food and beverage
|
44.32
|
%
|
44.45
|
%
|
45.32
|
%
|
|||||
|
Room
|
72.34
|
%
|
74.10
|
%
|
74.74
|
%
|
|||||
|
Other
|
41.90
|
%
|
37.33
|
%
|
35.05
|
%
|
|||||
33
Gaming
Gaming revenues are comprised primarily of the net win from our slot machine operations and to a lesser extent from table games win. The
$152.2 million
, or
8.4%
, increase in gaming revenues during
2017
as compared to the prior year, was primarily due to the addition of the Acquisitions to our Las Vegas Locals segment. Partially offsetting this increase, is a decrease in gaming revenues in the Midwest and South segment. The Midwest and South segment experienced a 1.5% decline in slot handle, along with a 2.8% decrease in table game drop. Gaming margins slightly increased as compared to prior year due to top line gaming revenue growth and effective cost control.
Gross gaming revenues decreased by $27.0 million, or 1.5%, during 2016 as compared to the prior year, which was due to a decrease of $58.3 million in the Midwest and South segment. The Midwest and South segment experienced a 4.8% decrease in slot handle and a 5.1% decrease in table game drop. Partially offsetting this decrease was an increase of $29.2 million in the Las Vegas Locals segment attributable primarily to the Acquisitions, an overall increase in both table game drop and slot hold, as well as a $2.1 million increase in the Downtown Las Vegas segment. Gaming expenses decreased by $20.2 million, or 2.2%, reflective of the overall reduction in gaming revenues.
Food and Beverage
Food and beverage revenues increased
$43.1 million
, or
14.1%
, during
2017
as compared to prior year due primarily to the Acquisitions, along with an increase in the Las Vegas Locals segment, excluding the Acquisitions, of $8.0 million, as food covers increased 33% and average check increased 16.3% in the segment. Food and beverage margins remained consistent as compared to prior year.
Food and beverage revenues decreased $1.3 million, or 0.4%, during 2016 as compared to 2015 due to a $7.2 million decrease in the Midwest and South segment, primarily at Par-A-Dice and Evangeline Downs. The decrease in food and beverage revenue was also a result of a decline in food covers across all segments. Offsetting this decrease were increases of food and beverage revenues of $5.2 million and $0.7 million in the Las Vegas Locals segment and Downtown Las Vegas segment, respectively, related to the Acquisitions and to increases in average guest check. Food and beverage expenses increased by $2.0 million and margin remained consistent as compared to last year.
Room
Room revenues increased
$17.9 million
, or
10.5%
, in
2017
compared to
2016
due to the addition of the Acquisitions in the Las Vegas Locals segment along with a $4.4 million increase in the Downtown Las Vegas segment. The Downtown Las Vegas segment's occupancy rate stayed consistent year-over-year however the average daily rate increased by 22.3% from the prior year. The growth in this segment over the prior year is due in part to the completion of the 300-room hotel renovation at the California property in August 2017. Overall, room margins decreased to 72.3% in 2017 from 74.1% in 2016, due primarily to increased costs as the cost per room increased by 7.0% whereas the average daily rate only increased by 6.0%.
Room revenues increased $7.3 million, or 4.5%, in 2016 compared to 2015 due to increases in average daily rates across all segments. The increase was offset by a $0.4 million decrease in the Midwest and South segment due primarily to a 3.1% decrease in hotel occupancy over the prior year.
Other
Other revenues relate to patronage visits at the amenities at our properties, including entertainment and nightclub revenues, retail sales, theater tickets and other venues. Other revenues increased by
$10.3 million
, or
8.4%
, during
2017
as compared to the prior year due primarily to the Acquisitions, which accounted for an increase to other revenue in the Las Vegas Locals segment.
Other revenues decreased by $1.5 million, or 1.2%, during 2016 as compared to the prior year due to decreased visitor spending.
Revenues by Reportable Segment
The following table presents our net revenues by Reportable Segment:
|
Year Ended December 31,
|
|||||||||||
|
(In millions)
|
2017
|
2016
|
2015
|
||||||||
|
Net Revenues by Reportable Segment
|
|||||||||||
|
Las Vegas Locals
|
$
|
858.9
|
|
$
|
647.9
|
|
$
|
610.1
|
|
||
|
Downtown Las Vegas
|
243.6
|
|
236.4
|
|
234.2
|
|
|||||
|
Midwest and South
|
1,281.2
|
|
1,299.7
|
|
1,355.1
|
|
|||||
|
Net revenues
|
$
|
2,383.7
|
|
$
|
2,184.0
|
|
$
|
2,199.4
|
|
||
34
Las Vegas Locals
Net revenues increased $211.0 million, or 32.6%, during
2017
as compared to the comparable prior year period primarily due to the addition of the Acquisitions.
Net revenues increased $37.8 million, or 6.2%, during 2016 as compared to the comparable prior year period. Gaming revenues increased $29.2 million, or 6.4%, due primarily to the Acquisitions. Table game drop and slot hold increased 0.3 and 0.2 percentage points, respectively, as compared to prior year. Room revenue increased $7.3 million resulting from increases of 2.7% in ADR and 0.8% in hotel occupancy rate. Food and beverage revenues increased by 5.0%, due primarily to a 2.0% increase in average guest check, offset by a 3.7% decrease in food covers.
Downtown Las Vegas
Net revenues increased by $7.2 million, or 3.0%, in
2017
as compared to the prior year, reflecting revenue increases in all departmental categories. We continue to tailor our marketing programs in the Downtown segment to cater to our Hawaiian market. Our Hawaiian market represented approximately 54% and 52% during 2017 and 2016, respectively, of our occupied rooms in this segment.
Net revenues increased by $2.2 million, or 0.9%, in 2016 as compared to the prior year due to an increase in all Downtown Las Vegas revenue sources. Gaming revenues increased $2.1 million, resulting from an 0.8% increase in slot handle. Additionally, food and beverage increased $0.7 million due to 2.7% increase in average guest check, which more than offset a 2.7% decrease in food covers. Room revenues and other revenues remained largely consistent with the prior year.
Midwest and South
Net revenues decreased 1.4%, during
2017
as compared to
2016
, primarily due to a gaming revenue decrease resulting from a 1.5% decline in slot coin, along with a 2.8% decrease in table game drop. Due to the decline in gaming revenue, there was a corresponding decrease of promotional allowances of $6.7 million. The results for this segment were impacted by Evangeline Downs and Amelia Belle experiencing localized economic weakness. The declines are partially offset by room revenue growth of $2.9 million at Delta Downs due to the opening of the new hotel tower and newly renovated rooms. The average daily rate at Delta Downs increased by 24.6% over the prior year.
Net revenues decreased $55.4 million, or 4.1%, during 2016 as compared to 2015 due to a decrease in all revenue sources at many of the Midwest and South properties. This decrease was primarily due to a $58.3 million, or 4.7%, decrease in gaming revenues coupled with a $7.2 million, or 4.8%, decrease in food and beverage, offset by an $11.0 million decrease in promotional allowances. The decrease in food and beverage revenues from the prior year was due primarily to a 7.3% decrease in food covers. Room revenues remained largely consistent with the prior year.
Other Operating Costs and Expenses
The following operating costs and expenses, as presented in our consolidated statements of operations, are further discussed below:
|
Year Ended December 31,
|
|||||||||||
|
(In millions)
|
2017
|
2016
|
2015
|
||||||||
|
Selling, general and administrative
|
$
|
362.0
|
|
$
|
322.0
|
|
$
|
322.4
|
|
||
|
Maintenance and utilities
|
109.5
|
|
100.0
|
|
104.5
|
|
|||||
|
Depreciation and amortization
|
217.5
|
|
196.2
|
|
207.1
|
|
|||||
|
Corporate expense
|
88.1
|
|
72.7
|
|
76.9
|
|
|||||
|
Project development, preopening and writedowns
|
14.5
|
|
22.1
|
|
6.9
|
|
|||||
|
Impairment of assets
|
(0.4
|
)
|
38.3
|
|
18.6
|
|
|||||
|
Other operating items, net
|
1.9
|
|
0.3
|
|
0.9
|
|
|||||
Selling, General and Administrative
Selling, general and administrative expenses include marketing, technology, compliance and risk, surveillance and security. These costs, as a percentage of gross revenues, were
13.7%
, 13.3% and 13.2% for 2017, 2016 and 2015, respectively. We continue to focus on disciplined and targeted marketing spend and on our cost containment efforts.
35
Maintenance and Utilities
Maintenance and utilities expenses, as a percentage of gross revenues, were
4.1%
for both 2017 and 2016 and 4.3% in 2015. The decreases between the periods are primarily due to the fact that no major maintenance projects were undertaken in the periods, coupled with cost reductions associated with the Company's energy savings initiatives.
Depreciation and Amortization
Depreciation and amortization expense, as a percentage of gross revenues, was
8.2%
, 8.1% and 8.5% for 2017, 2016 and 2015, respectively. Depreciation and amortization expense increased
$21.3 million
in the current year as compared to prior year due to the Acquisitions and recent capital expenditures. The decrease in depreciation and amortization from 2015 to 2016 was primarily due to the decrease in intangible asset amortization for the Midwest and South segment as its customer relationships were amortized using an accelerated method over their approximate useful life of five years.
Corporate Expense
Corporate expense represents unallocated payroll, professional fees, rent and various other administrative expenses that are not directly related to our casino and/or hotel operations, in addition to the corporate portion of share-based compensation expense. Corporate expense, represe
nted
3.3%
, 3
.0% and 3.2%, of gross revenues, for 2017, 2016 and 2015, respectively.
Project Development, Preopening and Writedowns
Project development, preopening and writedowns represent: (i) certain costs incurred and recoveries realized related to the activities associated with various acquisition opportunities, strategic initiatives, dispositions and other business development activities in the ordinary course of business; (ii) certain costs of start-up activities that are expensed as incurred in our ongoing efforts to develop gaming activities in new jurisdictions and expenses related to other new business development activities that do not qualify as capital costs; and (iii) asset write-downs. The decreases in such costs in the current year as compared to the prior year are due primarily to the Acquisitions that occurred in the prior year, with no similar transactions in the current year. The increase in such costs in 2016 as compared to 2015 was primarily due to the costs incurred related to the Acquisitions and the pursuit of strategic initiatives.
Impairment of Assets
Impairments of assets in 2017 include a $0.6 million write down of a land parcel in Missouri that was sold during the period. This impairment charge is offset by a $1.0 million excess reserve recovery related to the Echelon project. The value of the remaining Echelon inventory is fully reserved.
Impairments of assets of $38.3 million in 2016 include non-cash impairment charges of $23.6 million for a gaming license, $12.5 million for goodwill and $0.8 million for trademarks in our Midwest and South segment.
Impairment of assets of $18.6 million in 2015 include a $17.5 million non-cash impairment charge for a gaming license in our Midwest and South segment and a $1.1 million charge to write down the value of certain non-operating assets.
Other Operating Items, Net
Other operating items, net, is generally comprised of miscellaneous non-recurring operating charges, including direct and non-reimbursable costs associated with natural disasters and severe weather, including hurricane and flood expenses and subsequent recoveries of such costs, as applicable.
Other Expense (Income)
Interest Expense, net
|
Year Ended December 31,
|
|||||||||||
|
(In millions)
|
2017
|
2016
|
2015
|
||||||||
|
Interest Expense, net
|
$
|
171.3
|
|
$
|
209.7
|
|
$
|
222.7
|
|
||
|
Average Long-Term Debt Balance
|
3,207.2
|
|
3,337.0
|
|
3,416.5
|
|
|||||
|
Loss on Early Extinguishments and Modifications of Debt
|
1.6
|
|
42.4
|
|
40.7
|
|
|||||
|
Weighted Average Interest Rates
|
4.4
|
%
|
5.3
|
%
|
5.3
|
%
|
|||||
|
Mix of Boyd Gaming Corporation Debt at Year End
|
|||||||||||
|
Fixed rate debt
|
48.1
|
%
|
45.7
|
%
|
43.6
|
%
|
|||||
|
Variable rate debt
|
51.9
|
%
|
54.3
|
%
|
56.4
|
%
|
|||||
36
Interest expense, net of capitalized interest and interest income, for
2017
decreased
$38.4 million
, or
18.3%
, due to the redemptions of our 9.0% senior notes and the Peninsula 8.375% senior notes, the payoff of the Peninsula bank credit facility, the refinancing of the Boyd Gaming Credit Facility in September 2016 and the refinancing of Term B Loans in March 2017. These transactions led to a reduction in the average long-term debt balance of $129.7 million and a reduction in the weighted average interest rate from 5.3% to 4.4% for 2017.
Interest expense, net of capitalized interest and interest income, for 2016 decreased $13.0 million, or 5.8%, due to the reduction in our average long-term debt balance during the period.
Loss on Early Extinguishments and Modifications of Debt
The components of the loss on early extinguishments and modifications of debt, are as follows:
|
December 31,
|
|||||||||||
|
(In millions)
|
2017
|
2016
|
2015
|
||||||||
|
Boyd Gaming Credit Facility deferred finance charges
|
$
|
1.1
|
|
$
|
6.6
|
|
$
|
2.0
|
|
||
|
Refinancing Amendment
|
0.5
|
|
—
|
|
—
|
|
|||||
|
9.00% Senior Notes premium and consent fees
|
—
|
|
15.8
|
|
—
|
|
|||||
|
9.00% Senior Notes deferred finance charges
|
—
|
|
6.0
|
|
—
|
|
|||||
|
8.375% Senior Notes deferred finance charges
|
—
|
|
4.5
|
|
—
|
|
|||||
|
9.125% Senior Notes premium and consent fees
|
—
|
|
—
|
|
24.0
|
|
|||||
|
9.125% Senior Notes deferred finance charges
|
—
|
|
—
|
|
4.9
|
|
|||||
|
HoldCo Note
|
—
|
|
—
|
|
7.8
|
|
|||||
|
Peninsula Credit Facility deferred finance charges
|
—
|
|
9.5
|
|
2.1
|
|
|||||
|
Total loss on early extinguishments and modifications of debt
|
$
|
1.6
|
|
$
|
42.4
|
|
$
|
40.8
|
|
||
Income Taxes
The effective tax rate on income from continuing operations during 2017, 2016 and 2015 was 1.8%, (2,472.2%) and (163.4%), respectively. In 2017, our tax provision was favorably impacted by the change to the federal statutory tax rate on our net deferred tax liability. On December 22, 2017, the U.S. government enacted comprehensive tax legislation commonly referred to as the Tax Cuts and Jobs Act (the "Tax Act"). The Tax Act makes changes to the U.S. tax code, including, but not limited to, (1) reducing the U.S. federal corporate tax rate from a top marginal rate of 35% to a flat rate of 21%; (2) eliminating the corporate alternative minimum tax (AMT); (3) creating a new limitation on deductible interest expense; (4) changing bonus depreciation that will allow for full expensing of qualified property; (5) changing the limitations on executive compensation (6) altering the rules with respect to net operating losses generated after December 31, 2017. These changes have various effective dates. As a result of the reduction of the federal corporate income tax rate, we have revalued our net deferred tax liability as of December 31, 2017. Based on this revaluation, we have recorded a discrete tax benefit of $60.1 million.
During 2016, our tax benefit was primarily a result of the release of a valuation allowance on our federal and state net operating loss carryforwards and other deferred tax assets. The tax benefit for the year ended December 31, 2015 was favorably impacted by impairment charges to indefinite lived intangible assets which resulted in a reduction in our recognized deferred tax liability on these assets and adversely impacted by an accrual of non-cash tax expense in connection with the tax amortization of indefinite lived intangible assets. The deferred tax liabilities created by the tax amortization of these intangibles could not be used to offset our net operating loss or other deferred tax assets in determining our valuation allowance. In 2015, the tax benefit was favorably impacted by the partial release of the valuation allowance attributable to income from continuing operations and the federal and state release of unrecognized tax benefits (including associated interest reserves) in connection with our Internal Revenue Service (“IRS”) and New Jersey income tax examinations.
Valuation allowances are evaluated periodically and subject to change in future reporting periods as a result of changes in the factors noted above. As part of our review in determining the need for a valuation allowance, we assess the positive and negative evidence in each tax jurisdiction. In performing our analysis in 2016, we determined that the positive evidence in favor of releasing the valuation allowance, particularly evidence that was objectively verifiable, outweighed the negative evidence. We utilize a rolling twelve quarters of pretax income adjusted for permanent book to tax differences as a measure of cumulative results in recent years. We transitioned from a cumulative loss position to a cumulative income position over the rolling twelve quarters during 2016. Other evidence considered in the analysis included, but was not limited to, a trend reflective of improvement in recent earnings, forecasts of profitability and taxable income and the reversal of existing temporary differences. The change in these conditions during 2016 provided positive evidence that supported the release of the valuation allowance against a significant portion of our deferred tax assets. As such, we concluded that it was more likely than not that the benefit from these deferred tax
37
assets would be realized. As a result, during the year ended December 31, 2016, we released $201.5 million of valuation allowance on our federal and state income tax net operating loss carryforwards and other deferred tax assets.
We have maintained a valuation allowance of $28.7 million against certain federal and state deferred tax assets as of December 31, 2017 due to uncertainties related to our ability to realize the tax benefits associated with these assets. We considered, among other matters, the nature, frequency and severity of current and cumulative losses, forecasts of profitability and taxable income, the duration of statutory carryforward periods, our experience with the utilization of operating loss and tax credit carryforwards before expiration and tax planning strategies.
Income from Discontinued Operations, Net of Tax
Income from discontinued operations, net of tax, reflects the results of our equity method investment in Borgata, which we sold in August 2016. The results for the year ended December 31, 2017 include property tax recovery proceeds of $21.4 million, net of tax, related to the final settlement of Borgata's property tax disputes with Atlantic City. The corresponding period of the prior year, includes the $181.7 million after-tax gain on the sale of our equity interest in Borgata, our share of the results of Borgata through the date of sale and our portion of property tax refunds received in 2016 subsequent to the sale of our ownership interest. The Company applied the equity method of accounting to its 50% investment in Borgata.
LIQUIDITY AND CAPITAL RESOURCES
Financial Position
We operate our business with minimal or negative levels of working capital in order to minimize borrowings and related interest costs. Our cash and cash equivalents balance was
$203.1 million
and
$193.9 million
at
December 31, 2017
and
2016
, respectively. Our working capital deficit at
December 31, 2017
and
2016
was
$50.6 million
and $57.6 million, respectively.
Our credit facility generally provides any necessary funds for day-to-day operations, interest and tax payments, as well as capital expenditures. On a daily basis, we evaluate our cash position and adjust the balance under our credit facility, as necessary, by either borrowing or paying down debt with excess cash. We also plan the timing and the amounts of our capital expenditures. We believe that the borrowing capacity under our credit facility, subject to restrictive covenants, and cash flows from operating activities will be sufficient to meet our projected operating and maintenance capital expenditures for at least the next twelve months. The source of funds available to us for the repayment of our debt or to fund development projects is derived primarily from our cash flows from operations and availability under our credit facility, to the extent availability exists after we meet our working capital needs, and subject to restrictive covenants.
We could also seek to secure additional working capital, repay current debt maturities, or fund development projects, in whole or in part, through incremental bank financing and additional debt or equity offerings. If availability does not exist under our credit facility, or we are not otherwise able to draw funds on our credit facility, additional financing may not be available to us, and if available, may not be on terms favorable us.
38
Cash Flows Summary
|
Year Ended December 31,
|
|||||||||||
|
(In millions)
|
2017
|
2016
|
2015
|
||||||||
|
Net cash provided by operating activities
|
$
|
414.9
|
|
$
|
302.9
|
|
$
|
325.8
|
|
||
|
Cash Flows from Investing Activities
|
|||||||||||
|
Capital expenditures
|
(190.4
|
)
|
(160.4
|
)
|
(131.2
|
)
|
|||||
|
Cash paid for acquisitions, net of cash received
|
(1.2
|
)
|
(592.7
|
)
|
—
|
|
|||||
|
Advances pursuant to development agreement
|
(35.1
|
)
|
—
|
|
—
|
|
|||||
|
Other investing activities
|
0.7
|
|
14.1
|
|
4.5
|
|
|||||
|
Net cash used in investing activities
|
(226.0
|
)
|
(739.0
|
)
|
(126.7
|
)
|
|||||
|
Cash Flows from Financing Activities
|
|||||||||||
|
Net payments of debt
|
(161.5
|
)
|
(97.9
|
)
|
(203.4
|
)
|
|||||
|
Dividends paid
|
(11.3
|
)
|
—
|
|
—
|
|
|||||
|
Shares repurchased and retired
|
(31.9
|
)
|
—
|
|
—
|
|
|||||
|
Share-based compensation activities, net
|
(7.7
|
)
|
(1.3
|
)
|
3.7
|
|
|||||
|
Other financing activities
|
(2.9
|
)
|
—
|
|
—
|
|
|||||
|
Net cash used in financing activities
|
(215.3
|
)
|
(99.2
|
)
|
(199.7
|
)
|
|||||
|
Net cash provided by discontinued operations
|
35.7
|
|
570.3
|
|
14.1
|
|
|||||
|
Net increase in cash and cash equivalents
|
$
|
9.3
|
|
$
|
35.0
|
|
$
|
13.5
|
|
||
Cash Flows from Operating Activities
During
2017
,
2016
and
2015
, we generated net operating cash flow of
$414.9 million
,
$302.9 million
and
$325.8 million
, respectively. Generally, operating cash flows increased
$112.0 million
in
2017
compared to
2016
due to the flow through effect of higher revenues, including the impact of the Acquisitions, and the timing of working capital spending. Generally, operating cash flows decreased $22.9 million in 2016 compared to 2015 due to the flow through effect of lower revenues and increased project development expenses, offset by reduced interest expense.
Cash Flows from Investing Activities
Our industry is capital intensive and we use cash flows for acquisitions, facility expansions, investments in future development or business opportunities and maintenance capital expenditures.
During 2017, we incurred net cash outflows for investing activities of
$226.0 million
. The decline in outflows as compared to the prior year is due to the Acquisitions. Capital expenditures for 2017 include $43.0 million paid in February 2017 to exercise a purchase option to acquire leased land underlying The Orleans Hotel and Casino. In January 2017, we paid $35.1 million for the acquisition of land that is the intended site of the Wilton Rancheria casino, pursuant to our development agreement with the Wilton Rancheria Tribe. This cost will be reimbursed to us when the Tribe obtains permanent financing for the project.
During 2016, we incurred net cash outflows for investing activities of
$739.0 million
due to our Acquisitions and capital expenditures during the period of $160.4 million.
In 2015, we incurred net cash outflows for investing activities of
$126.7 million
due to our capital expenditures during the period of
$131.2 million
.
Cash Flows from Financing Activities
We rely upon our financing cash flows to provide funding for investment opportunities, repayments of obligations and ongoing operations.
In 2017, 2016 and 2015, our net cash outflows for financing activities totaled
$215.3 million
,
$99.2 million
and
$199.7 million
, respectively. The net cash outflows for financing activities in 2017, reflect primarily the use of excess cash to reduce our outstanding debt, repurchase outstanding common stock under our share repurchase program and pay cash dividends to our shareholders. The net cash outflows in 2016 reflect primarily the redemption of our 9.00% senior notes due 2020 and Peninsula Gaming's 8.375% senior notes due 2018, and extinguishment of the Peninsula Gaming bank credit facility during the period, using the net cash proceeds from the sale of our equity interest in Borgata, and cash flow from the Refinancing Amendment. In 2015, we used cash generated from operations to extinguish outstanding debt.
39
Cash Flows from Discontinued Operations
Discontinued operations activities in 2017, 2016 and 2015 represent Borgata. The net cash inflow of
$35.7 million
in 2017 includes property tax recovery proceeds related to the final settlement of Borgata's property tax disputes with Atlantic City. The net cash flow in 2016 includes the pretax cash proceeds of $589 million received from the sale of our 50% equity interest in the parent company of Borgata, to MGM in August 2016.
Indebtedness
The balances of our long-term debt and the changes in those balances, are as follows:
|
(In millions)
|
December 31, 2017
|
December 31, 2016
|
Decrease
|
||||||||
|
Bank credit facility
|
$
|
1,621.1
|
|
$
|
1,782.5
|
|
$
|
(161.4
|
)
|
||
|
6.875% senior notes due 2023
|
750.0
|
|
750.0
|
|
—
|
|
|||||
|
6.375% senior notes due 2026
|
750.0
|
|
750.0
|
|
—
|
|
|||||
|
Other
|
0.5
|
|
0.6
|
|
(0.1
|
)
|
|||||
|
Total long-term debt
|
3,121.6
|
|
3,283.1
|
|
(161.5
|
)
|
|||||
|
Less current maturities
|
24.0
|
|
30.3
|
|
(6.3
|
)
|
|||||
|
Long-term debt, net of current maturities
|
$
|
3,097.6
|
|
$
|
3,252.8
|
|
$
|
(155.2
|
)
|
||
The amount of current maturities includes certain non-extending balances scheduled to be repaid within the next twelve months under the bank credit facilities.
Boyd Gaming Corporation Debt
Bank Credit Facility
On March 29, 2017, the Company, as borrower, entered into Amendment No. 2 and Refinancing Amendment (the "Refinancing Amendment") with the lenders party thereto, and Bank of America, N.A. ("Bank of America"), as administrative agent. The Refinancing Amendment modifies the Third Amended and Restated Credit Agreement (as amended prior to the execution of the Refinancing Amendment, the "Existing Credit Agreement"), dated as of August 14, 2013, among the Company, certain financial institutions, and Bank of America, as administrative agent. The Refinancing Amendment modified the Existing Credit Agreement and is referred to as the "Amended Credit Agreement" (together referred to as the "Credit Facility").
The Amended Credit Agreement provides for (i) commitments to make Term B Loans in an amount equal to
$1,264.5
million (the "Refinancing Term B Loans"), with the proceeds used to refinance in full the Company’s Term B-1 Loans and Term B-2 Loans outstanding under the Existing Credit Agreement and (ii) certain other amendments to the Existing Credit Agreement. The revolving credit facility (the "Revolving Credit Facility") of
$775.0 million
and the senior secured term A loan (the "Term A Loan") of
$225.0 million
were not modified in the Refinancing Amendment.
The Refinancing Term B Loans mature on September 15, 2023 (or earlier upon occurrence or non-occurrence of certain events). The Revolving Credit Facility and the Term A Loan mature on September 15, 2021 (or earlier upon occurrence or non-occurrence of certain events).
The Credit Facility includes an accordion feature which permits an increase in the Revolving Credit Facility and the issuance and increase of senior secured term loans in an amount up to (i)
$550.0 million
, plus (ii) certain voluntary permanent reductions of the Revolving Credit Facility and certain voluntary prepayments of the senior secured term loans, plus (iii) certain reductions in the outstanding principal amounts under the term loans or the Revolving Credit Facility, plus (iv) any additional amount if, after giving effect thereto, the First Lien Leverage Ratio (as defined in the Credit Agreement) would not exceed
4.25
to
1.00
on a pro forma basis, less (v) any Incremental Equivalent Debt (as defined in the Credit Agreement), in each case, subject to the satisfaction of certain conditions.
Pursuant to the terms of the Credit Facility (i) the loans under the Term A Loan amortize in an annual amount equal to
5.00%
of the original principal amount thereof, commencing December 31, 2016, payable on a quarterly basis, (ii) the loans under the Refinancing Term B Loans amortize in an annual amount equal to
1.00%
of the original principal amount thereof, commencing June 30, 2017, payable on a quarterly basis, and (iii) beginning with the fiscal year ending December 31, 2016, the Company is required to use a portion of its annual Excess Cash Flow, as defined in the Credit Agreement, to prepay loans outstanding under the Credit Facility.
40
The interest rate on the outstanding balance from time to time of the Revolving Credit Facility and the Term A Loan is based upon, at the Company’s option, either: (i) the Eurodollar rate or (ii) the base rate, in each case, plus an applicable margin. Such applicable margin is a percentage per annum determined in accordance with a specified pricing grid based on the total leverage ratio and ranges from
1.75%
to
2.75%
(if using the Eurodollar rate) and from
0.75%
to
1.75%
(if using the base rate). A fee of a percentage per annum (which ranges from
0.25%
to
0.50%
determined in accordance with a specified pricing grid based on the total leverage ratio) will be payable on the unused portions of the Revolving Credit Facility.
The interest rate on the outstanding balance of the Refinancing Term B Loans under the Amended Credit Agreement is based upon, at the Company’s option, either: (i) the Eurodollar rate or (ii) the base rate, in each case, plus an applicable margin. Such applicable margin is a percentage per annum determined in accordance with the Company’s secured leverage ratio and ranges from
2.25%
to
2.50%
(if using the Eurodollar rate) and from
1.25%
to
1.50%
(if using the base rate).
The "base rate" under the Credit Agreement remains the highest of (x) Bank of America’s publicly-announced prime rate, (y) the federal funds rate plus
0.50%
, or (z) the Eurodollar rate for a one-month period plus
1.00%
.
The blended interest rate for outstanding borrowings under for the Credit Facility was
3.9%
at
December 31, 2017
and
3.4%
at
December 31, 2016
.
Amounts outstanding under the Refinancing Amendment may be prepaid without premium or penalty, and the commitments may be terminated without penalty, subject to certain exceptions.
Subject to certain exceptions, the Company may be required to repay the amounts outstanding under the Credit Facility in connection with certain asset sales and issuances of certain additional secured indebtedness.
The Credit Facility contains certain financial and other covenants, including, without limitation, various covenants: (i) requiring the maintenance of a minimum consolidated interest coverage ratio 1.75 to 1.00; (ii) establishing a maximum permitted consolidated total leverage ratio; (iii) establishing a maximum permitted secured leverage ratio; (iv) imposing limitations on the incurrence of indebtedness; (v) imposing limitations on transfers, sales and other dispositions; and (vi) imposing restrictions on investments, dividends and certain other payments.
The Company's obligations under the Credit Facility, subject to certain exceptions, are guaranteed by certain of the Company's subsidiaries and are secured by the capital stock of certain subsidiaries. In addition, subject to certain exceptions, the Company and each of the guarantors will grant the administrative agent first priority liens and security interests on substantially all of their real and personal property (other than gaming licenses and subject to certain other exceptions) as additional security for the performance of the secured obligations under the Credit Facility.
The outstanding principal amounts under the Credit Facility are comprised of the following:
|
December 31,
|
|||||||
|
(In millions)
|
2017
|
2016
|
|||||
|
Revolving Credit Facility
|
$
|
170.0
|
|
$
|
245.0
|
|
|
|
Term A Loan
|
211.0
|
|
222.2
|
|
|||
|
Refinancing Term B Loans
|
1,170.0
|
|
—
|
|
|||
|
Term B-1 Loan
|
—
|
|
271.8
|
|
|||
|
Term B-2 Loan
|
—
|
|
997.5
|
|
|||
|
Swing Loan
|
70.1
|
|
46.0
|
|
|||
|
Total outstanding principal amounts under the Credit Facility
|
$
|
1,621.1
|
|
$
|
1,782.5
|
|
|
After consideration of
$12.9 million
allocated to support various letters of credit, approximately
$522.0 million
of availability remained under our Credit Facility at
December 31, 2017
.
Senior Notes
6.875% Senior Notes due May 2023
On May 21, 2015, we issued $750 million aggregate principal amount of 6.875% senior notes due May 2023 (the "6.875% Notes"). The 6.875% Notes require semi-annual interest payments on May 15 and November 15 of each year, commencing on November 15, 2015. The 6.875% Notes will mature on May 15, 2023 and are fully and unconditionally guaranteed, on a joint and several basis, by certain of our current and future domestic restricted subsidiaries, all of which are 100% owned by us.
41
The 6.875% Notes contain certain restrictive covenants that, subject to exceptions and qualifications, among other things, limit our ability and the ability of our restricted subsidiaries (as defined in the base and supplemental indentures governing the 6.875% Notes, together, the "6.875% Indenture") to incur additional indebtedness or liens, pay dividends or make distributions or repurchase our capital stock, make certain investments, and sell or merge with other companies. In addition, upon the occurrence of a change of control (as defined in the 6.875% Indenture), we will be required, unless certain conditions are met, to offer to repurchase the 6.875% Notes at a price equal to 101% of the principal amount of the 6.875% Notes, plus accrued and unpaid interest and Additional Interest (as defined in the 6.875% Indenture), if any, to, but not including, the date of purchase. If we sell assets or experience an event of loss, we will be required under certain circumstances to offer to purchase the 6.875% Notes.
At any time prior to May 15, 2018, we may redeem the 6.875% Notes, in whole or in part, at a redemption price equal to 100% of the principal amount thereof, plus accrued and unpaid interest and Additional Interest, if any, up to, but excluding, the applicable redemption date, plus a make whole premium. After May 15, 2018, we may redeem all or a portion of the 6.875% Notes at redemption prices (expressed as percentages of the principal amount) ranging from 105.156% in 2018 to 100% in 2021 and thereafter, plus accrued and unpaid interest and Additional Interest.
6.375%
Senior Notes due April 2026
On March 28, 2016, we issued
$750 million
aggregate principal amount of
6.375%
senior notes due April 2026 (the "
6.375%
Notes"). The
6.375%
Notes require semi-annual interest payments on April 1 and October 1 of each year, commencing on October 1, 2016. The
6.375%
Notes will mature on April 1, 2026 and are fully and unconditionally guaranteed, on a joint and several basis, by certain of our current and future domestic restricted subsidiaries, all of which are
100%
owned by us. Net proceeds from the
6.375%
Notes were used to pay down the outstanding amount under the Revolving Credit Facility and the balance was deposited in money market funds and classified as cash equivalents on the consolidated balance sheets.
In conjunction with the issuance of the
6.375%
Notes, we incurred approximately
$13.0 million
in debt financing costs that have been deferred and are being amortized over the term of the
6.375%
Notes using the effective interest method.
The
6.375%
Notes contain certain restrictive covenants that, subject to exceptions and qualifications, among other things, limit our ability and the ability of our restricted subsidiaries (as defined in the base and supplemental indentures governing the
6.375%
Notes, together, the "6.375% Indenture") to incur additional indebtedness or liens, pay dividends or make distributions or repurchase our capital stock, make certain investments, and sell or merge with other companies. In addition, upon the occurrence of a change of control (as defined in the 6.375% Indenture), we will be required, unless certain conditions are met, to offer to repurchase the
6.375%
Notes at a price equal to
101%
of the principal amount of the
6.375%
Notes, plus accrued and unpaid interest and Additional Interest (as defined in the 6.375% Indenture), if any, to, but not including, the date of purchase. If we sell assets or experience an event of loss, we will be required under certain circumstances to offer to purchase the
6.375%
Notes.
At any time prior to April 1, 2021, we may redeem the
6.375%
Notes, in whole or in part, at a redemption price equal to
100%
of the principal amount thereof, plus accrued and unpaid interest and Additional Interest, if any, up to, but excluding, the applicable redemption date, plus a make whole premium. After April 1, 2021, we may redeem all or a portion of the
6.375%
Notes at redemption prices (expressed as percentages of the principal amount) ranging from
103.188%
in 2021 to
100%
in 2024 and thereafter, plus accrued and unpaid interest and Additional Interest.
In connection with the private placement of the 6.375% Notes, we entered into a registration rights agreement with the initial purchasers in which we agreed to file a registration statement with the SEC to permit the holders to exchange or resell the 6.375% Notes. We filed the required registration statement and commenced the exchange offer during December 2016. The exchange offer was completed on February 10, 2017 and our obligations under the registration rights agreement have been fulfilled.
9.00%
Senior Notes due July 2020
On September 6, 2016 we redeemed all of our
9.00%
senior notes due July 2020 (the "
9.00%
Notes") at a redemption price of
104.50%
plus accrued and unpaid interest to the redemption date. The redemption was funded using cash on hand. As a result of this redemption, the
9.00%
Notes have been fully extinguished.
Peninsula Gaming Debt
Peninsula Credit Facility
On September 2, 2016, Peninsula repaid all of the outstanding amounts, including all principal and accrued interest amounts, under the Peninsula senior secured credit facility (the "Peninsula Credit Facility") pursuant to the Peninsula Credit Agreement. In connection with the repayment in full of the Peninsula Credit Facility (the "Repayment"), the Peninsula Credit Agreement was terminated.
42
8.375%
Senior Notes due February 2018
On September 2, 2016, we redeemed all of our
8.375%
senior notes due February 2018 (the "
8.375%
Notes") at a redemption price of
100.0%
plus accrued and unpaid interest to the redemption date. The redemption was funded using cash on hand. As a result of this redemption, the 8.375% Notes have been fully extinguished.
Covenant Compliance
As of
December 31, 2017
, we believe that we were in compliance with the financial and other covenants contained in our debt instruments.
The scheduled maturities of long-term debt, as discussed above, are as follows:
|
(In millions)
|
Total
|
||
|
For the year ending December 31,
|
|||
|
2018
|
$
|
24.0
|
|
|
2019
|
24.0
|
|
|
|
2020
|
24.0
|
|
|
|
2021
|
430.0
|
|
|
|
2022
|
12.8
|
|
|
|
Thereafter
|
2,606.8
|
|
|
|
Total outstanding principal of long-term debt
|
$
|
3,121.6
|
|
Dividends
Dividends are declared at the discretion of our Board of Directors. We are subject to certain limitations regarding payment of dividends, such as restricted payment limitations related to our outstanding notes and our Credit Facility. On May 2, 2017, the Company announced that its Board of Directors had authorized the reinstatement of the Company’s cash dividend program. The dividends declared by the Board under this program are:
|
Declaration date
|
Record date
|
Payment date
|
Amount per share
|
|||
|
May 2, 2017
|
June 15, 2017
|
July 15, 2017
|
$0.05
|
|||
|
September 6, 2017
|
September 18, 2017
|
October 15, 2017
|
0.05
|
|||
|
December 7, 2017
|
December 28, 2017
|
January 15, 2018
|
0.05
|
|||
No dividends were declared during the years ended December 31,
2016
or
2015
.
Share Repurchase Program
Subject to applicable corporate securities laws, repurchases under our stock repurchase program may be made at such times and in such amounts as we deem appropriate. We are subject to certain limitations regarding the repurchase of common stock, such as restricted payment limitations related to our outstanding notes and our Credit Facility. Purchases under our stock repurchase program can be discontinued at any time that we feel additional purchases are not warranted. We intend to fund the repurchases under the stock repurchase program with existing cash resources and availability under our Credit Facility.
In July 2008, our Board of Directors authorized an amendment to our existing share repurchase program to increase the total amount of common stock available to be repurchased to $100 million. We are not obligated to purchase any shares under our stock repurchase program. The Board reaffirmed this program in May 2017 and we repurchased
1.2 million
shares of our common stock during the year ended December 31, 2017. There were no common stock repurchases during
2016
and
2015
. We are currently authorized to repurchase up to an additional
$60.1 million
in shares of our common stock under the share repurchase program.
We have in the past, and may in the future, acquire our debt or equity securities through open market purchases, privately negotiated transactions, tender offers, exchange offers, redemptions or otherwise, upon such terms and at such prices as we may determine.
Other Items Affecting Liquidity
We anticipate the ability to fund our capital requirements using our free cash flow from operations and availability under our Credit Facility, to the extent availability exists after we meet our working capital needs for the next twelve months. Any additional financing that is needed may not be available to us or, if available, may not be on terms favorable to us. The outcome of the following specific matters, including our commitments and contingencies, may also affect our liquidity.
43
Divestiture of Borgata
The proceeds we received upon the sale of our equity interest in Borgata did not include our 50% share of any future property tax settlement benefits, from the time period during which we held a 50% ownership in MDDHC, later received by Borgata and to which Boyd Gaming retained the right to receive payment. During 2016, we recognized $9.1 million in income, which was included in discontinued operations for the year ended December 31, 2016, for the cash we received for our share of property tax benefits realized by Borgata subsequent to the closing of the sale. On February 15, 2017, Borgata announced that it had entered into a settlement agreement under which it would receive payments totaling $72 million to resolve the property tax issues. Borgata received full payment, and we received our share of the proceeds, in June 2017. For the year ended December 31, 2017, we recognized $36.2 million in income for the cash we received for our share of property tax benefits realized by Borgata after the closing of the sale. These payments, net of tax of $14.8 million for the year ended December 31, 2017, are included in discontinued operations in the consolidated financial statements.
Commitments
Capital Spending and Development
We continually perform on-going refurbishment and maintenance at our facilities to maintain our standards of quality. Certain of these maintenance costs are capitalized, if such improvement or refurbishment extends the life of the related asset, while other maintenance costs that do not so qualify are expensed as incurred. The commitment of capital and the related timing thereof are contingent upon, among other things, negotiation of final agreements and receipt of approvals from the appropriate regulatory bodies. We must also comply with covenants and restrictions set forth in our debt agreements.
We currently estimate that our annual cash capital requirements to maintain our properties to our quality standards ranges from between $140 million and $160 million. We intend to fund such capital expenditures through our credit facility and operating cash flows.
In addition to the capital spending discussed above, we also continue to pursue other potential development projects that may require us to invest significant amounts of capital. For example, we continue to work with Wilton Rancheria, a federally-recognized Native American tribe located about 15 miles southeast of Sacramento, California, to develop and manage a gaming entertainment complex. In September 2017, the California State Legislature unanimously approved, and the Governor of California executed, a tribal-state gaming compact with the tribe allowing the development of the casino. With the compact now in place, we are in the process of finalizing project design and construction planning. Once commenced, the construction timeline is expected to span 18 to 24 months.
Pending Acquisitions
On December 18, 2017, we announced that we had entered into a definitive agreement with Penn National Gaming, Inc (the "Penn National Purchase Agreement"), to acquire the operations of four properties, which include Ameristar St. Charles and Ameristar Kansas City, both in Missouri, along with Belterra Casino Resort in Florence, Indiana, and Belterra Park in Cincinnati, Ohio, for total net cash consideration of $575.0 million (the "Penn National Purchase").
On December 20, 2017, we announced that we had entered into a definitive agreement with Valley Forge Convention Center Partners, L.P. (the "Valley Forge Merger Agreement"), to acquire Valley Forge Casino Resort in King of Prussia, Pennsylvania, for total cash consideration of $280.5 million (the "Valley Forge Merger").
The completion of the Penn National Purchase and the Valley Forge Merger are each subject to customary conditions and the receipt of all required regulatory approvals, including, among others, approval by the required state gaming commissions and the expiration or termination of the applicable waiting period under the Hart-Scott-Rodino Antitrust Improvements Act of 1976, as amended. In addition, the Penn National Purchase is also contingent upon the successful completion of Penn National’s proposed acquisition of Pinnacle Entertainment, Inc. Subject to the satisfaction or waiver of the respective conditions in each of the Penn National Purchase Agreement and the Valley Forge Merger Agreement, we currently expect each of the transactions to close during the second half of 2018. The acquisitions will be funded with cash on hand and available revolver capacity under the Bank Credit Facility.
44
CONTRACTUAL OBLIGATIONS
The following summarizes our contractual obligations, excluding the Penn National Purchase Agreement and the Valley Forge Merger Agreement discussed above, as of
December 31, 2017
:
|
Year Ending December 31,
|
|||||||||||||||||||||||||||
|
(In millions)
|
Total
|
2018
|
2019
|
2020
|
2021
|
2022
|
Thereafter
|
||||||||||||||||||||
|
CONTRACTUAL OBLIGATIONS:
|
|||||||||||||||||||||||||||
|
Long-Term Debt
|
|||||||||||||||||||||||||||
|
Bank credit facility
|
$
|
1,621.1
|
|
$
|
23.9
|
|
$
|
23.9
|
|
$
|
23.9
|
|
$
|
429.9
|
|
$
|
12.7
|
|
$
|
1,106.8
|
|
||||||
|
6.375% senior notes due 2026
|
750.0
|
|
—
|
|
—
|
|
—
|
|
—
|
|
—
|
|
750.0
|
|
|||||||||||||
|
6.875% senior notes due 2023
|
750.0
|
|
—
|
|
—
|
|
—
|
|
—
|
|
—
|
|
750.0
|
|
|||||||||||||
|
Other
|
0.5
|
|
0.1
|
|
0.1
|
|
0.1
|
|
0.1
|
|
0.1
|
|
—
|
|
|||||||||||||
|
Total long-term debt
|
3,121.6
|
|
24.0
|
|
24.0
|
|
24.0
|
|
430.0
|
|
12.8
|
|
2,606.8
|
|
|||||||||||||
|
Interest on Fixed Rate Debt
|
669.6
|
|
99.4
|
|
99.4
|
|
99.4
|
|
99.4
|
|
99.4
|
|
172.6
|
|
|||||||||||||
|
Interest on Variable Rate Debt (1)
|
313.5
|
|
62.6
|
|
61.7
|
|
60.7
|
|
54.9
|
|
44.3
|
|
29.3
|
|
|||||||||||||
|
Operating Leases
|
396.4
|
|
20.7
|
|
17.8
|
|
15.3
|
|
14.3
|
|
13.9
|
|
314.4
|
|
|||||||||||||
|
Purchase Obligations (2)
|
48.9
|
|
13.9
|
|
6.9
|
|
4.2
|
|
3.7
|
|
3.6
|
|
16.6
|
|
|||||||||||||
|
TOTAL CONTRACTUAL OBLIGATIONS
|
$
|
4,550.0
|
|
|
$
|
220.6
|
|
|
$
|
209.8
|
|
|
$
|
203.6
|
|
|
$
|
602.3
|
|
|
$
|
174.0
|
|
|
$
|
3,139.7
|
|
|
(1)
|
Estimated interest payments are based on principal amounts and scheduled maturities of debt outstanding at
December 31, 2017
. Estimated interest payments for variable-rate debt are based on rates at
December 31, 2017
.
|
(2) Purchase obligations include various contracted amounts, including construction contacts and information technology, advertising, maintenance and other service agreements.
Other Opportunities
We regularly investigate and pursue additional expansion opportunities in markets where casino gaming is currently permitted. We also pursue expansion opportunities in jurisdictions where casino gaming is not currently permitted in order to be prepared to develop projects upon approval of casino gaming. Such expansions will be affected and determined by several key factors, which may include the following:
|
•
|
the outcome of gaming license selection processes;
|
|
•
|
the approval of gaming in jurisdictions where we have been active but where casino gaming is not currently permitted;
|
|
•
|
identification of additional suitable investment opportunities in current gaming jurisdictions; and
|
|
•
|
availability of acceptable financing.
|
Additional projects may require us to make substantial investments or may cause us to incur substantial costs related to the investigation and pursuit of such opportunities, which investments and costs we may fund through cash flow from operations or availability under our Credit Facility. To the extent such sources of funds are not sufficient, we may also seek to raise such additional funds through public or private equity or debt financings or from other sources. No assurance can be given that additional financing will be available or that, if available, such financing will be obtainable on terms favorable to us. Moreover, we can provide no assurances that any expansion opportunity will result in a completed transaction.
Off Balance Sheet Arrangements
Our off balance sheet arrangements consist of the following:
Indemnification
We have entered into certain agreements that contain indemnification provisions, as well as indemnification agreements involving certain of our executive officers and directors. These agreements provide indemnity insurance pursuant to which directors and officers are indemnified or insured against liability or loss under certain circumstances, which may include liability or related loss under the Securities Act and the Exchange Act. In addition, our Restated Articles of Incorporation and Restated Bylaws contain provisions that provide for indemnification of our directors, officers, employees and other agents to the maximum extent permitted by law.
45
Outstanding Letters of Credit
At
December 31, 2017
, we had outstanding letters of credit totaling
$12.9 million
.
Other Arrangements
We have not entered into any transactions with special purpose entities, nor have we engaged in any derivative transactions.
CRITICAL ACCOUNTING POLICIES
Our discussion and analysis of our results of operations and liquidity and capital resources are based on our consolidated financial statements which have been prepared in accordance with accounting principles generally accepted in the United States of America, or GAAP. In accordance with GAAP, we are required to make estimates and assumptions that affect the reported amounts included in our consolidated financial statements. We base our estimates on historical experience and on various other assumptions that we believe to be reasonable under the circumstances. On an ongoing basis, management reviews and refines those estimates, the following of which materially impact our consolidated financial statements: the recoverability of long-lived assets; application of acquisition method of accounting; valuation of indefinite-lived intangible assets and goodwill; determination of self-insured reserves; and provisions for deferred tax assets, certain tax liabilities and uncertain tax positions.
Judgments are based on information including, but not limited to, historical experience, industry trends, conventional practices, expert opinions, terms of existing agreements and information from outside sources. Judgments are subject to an inherent degree of uncertainty, and therefore actual results could differ from these estimates.
We believe the following critical accounting policies require a higher degree of judgment and complexity, the sensitivity of which could result in a material impact on our consolidated financial statements.
Recoverability of Long-Lived Assets
Our long-lived assets were carried at
$2.5 billion
at
December 31, 2017
, or
54.2%
of our consolidated total assets. We evaluate the carrying value of long-lived assets whenever events or changes in circumstances indicate that the carrying value of such assets may not be recoverable. If triggering events are identified, we then compare the estimated undiscounted future cash flows of the asset to the carrying value of the asset. The asset is not impaired if the undiscounted future cash flows exceed its carrying value. If the carrying value exceeds the undiscounted future cash flows, then an impairment charge is recorded, typically measured using a discounted cash flow model, which is based on the estimated future results of the relevant reporting unit discounted using our weighted-average cost of capital and market indicators of terminal year free cash flow multiples.
A long-lived asset shall be tested for recoverability whenever events or changes in circumstances indicate that its carrying amount may not be recoverable. The following are examples of such events or changes in circumstances:
|
i.
|
a significant decrease in the market price of a long-lived asset;
|
|
ii.
|
a significant adverse change in the extent or manner in which a long-lived asset is being used or in its physical condition;
|
|
iii.
|
a significant adverse change in legal factors or in the business climate that could affect the value of a long-lived asset, including an adverse action or assessment by a regulator;
|
|
iv.
|
an accumulation of costs significantly in excess of the amount originally expected for the acquisition or construction of a long-lived asset;
|
|
v.
|
a current-period operating or cash flow loss combined with a history of operating or cash flow losses or a projection or forecast that demonstrates continuing losses associated with the use of a long-lived asset; and/or
|
|
vi.
|
a current expectation that, more likely than not, a long-lived asset will be sold or otherwise disposed of significantly before the end of its previously estimated useful life.
|
We reconsider changes in circumstances on a frequent basis, and if a triggering event related to potential impairment has occurred, we solicit third party valuation expertise to assist in the valuation of our investment. There are three generally accepted approaches available in developing an opinion of value: the cost, sales comparison and income approaches. We generally consider each of these approaches in developing a recommendation of the fair value of the asset; however, the reliability of each approach is dependent upon the availability and comparability of the market data uncovered, as well as, the decision-making criteria used by market participants when evaluating a property. We will bifurcate our investment and apply the most indicative approach to overall fair valuation, or in some cases, a weighted analysis of any or all of these methods.
Developing an opinion of land value is typically accomplished using a sales comparison approach by analyzing recent sales transactions of similar sites. Potential comparables are researched and the pertinent facts are confirmed with parties involved in the transaction. This process fosters a general understanding of the potential comparable sales and facilitates the selection of the most relevant comparables by the appraiser. Valuation is typically accomplished using a unit of comparison such as price per
46
square foot of land or potential building area. Adjustments are applied to the unit of comparison from an analysis of comparable sales, and the adjusted unit of comparison is then used to derive a value for the property.
The cost approach is based on the premise that a prudent investor would pay no more for an asset of similar utility than its replacement or reproduction cost. The cost to replace the asset would include the cost of constructing a similar asset of equivalent utility at prices applicable at the time of the valuation date. To arrive at an estimate of the fair value using the cost approach, the replacement cost new is determined and reduced for depreciation of the asset. Replacement cost new is defined as the current cost of producing or constructing a similar new item having the nearest equivalent utility as the property being valued.
The income approach focuses on the income-producing capability of the asset. The underlying premise of this approach is that the value of an asset can be measured by the present worth of the net economic benefit (cash receipts less cash outlays) to be received over the life of the subject asset. The steps followed in applying this approach include estimating the expected before-tax cash flows attributable to the asset over its life and converting these before-tax cash flows to present value through capitalization or discounting. The process uses a rate of return that accounts for both the time value of money and risk factors. There are two common methods for converting net income into value, those methods are the direct capitalization and discounted cash flow methods ("DCF"). Direct capitalization is a method used to convert an estimate of a single year's income expectancy into an indication of value in one direct step by dividing the income estimate by an appropriate capitalization rate. Under the DCF method, anticipated future cash flows and a reversionary value are discounted to an opinion of net present value at a specific internal rate of return or a yield rate, because net operating income of the subject property is not fully stabilized.
Application of Acquisition Method of Accounting
Acquisition of Cannery Casino Hotel and Nevada Palace, LLC
On December 20, 2016, we acquired The Cannery Hotel and Casino, LLC (“Cannery”), the owner and operator of Cannery Casino Hotel, and Nevada Palace, LLC (“Eastside Cannery”), the owner and operator of Eastside Cannery Casino and Hotel, pursuant to a Membership Interest Purchase Agreement (the “Purchase Agreement”) dated as of April 25, 2016, as amended on October 28, 2016, by and among Boyd, Cannery Casino Resorts, LLC (“Seller”), Cannery and Eastside Cannery. Accordingly, the assets and liabilities of Cannery and Eastside Cannery are included in our consolidated balance sheet as of December 31, 2017 and 2016, and the results of its operations and cash flows are reported in our consolidated statements of operations and cash flows, respectively, for the year ended December 31, 2017 and from December 20, 2016 through December 31, 2016, during the year ended December 31, 2016. The net purchase price was
$228.2 million
.
The Company followed the acquisition method of accounting per ASC 805 guidance. For purposes of these financial statements, we have allocated the purchase price to the assets acquired and the liabilities assumed based on their fair values as determined by management based on its judgment with assistance from third-party appraisals. The excess of the purchase price over the net book value of the assets acquired and liabilities assumed has been recorded as goodwill. The Company has recognized the assets acquired and liabilities assumed in the acquisitions based on fair value estimates as of the date of the Acquisition. The determination of the fair values of the acquired assets and assumed liabilities (and the related determination of estimated lives of depreciable tangible and identifiable intangible assets) was completed in third quarter of 2017. The measurement period adjustment and related tax impact were immaterial to our consolidated financial statements.
Acquisition of Aliante
On September 27, 2016, we acquired ALST, the holding company of Aliante Gaming, LLC ("Aliante"), the owner and operator of the Aliante Casino + Hotel + Spa, pursuant to the Merger Agreement. Pursuant to the Merger Agreement, Merger Sub merged (the "Merger") with and into ALST, with ALST surviving the Merger. ALST and Aliante are now wholly-owned subsidiaries of Boyd Gaming. Accordingly, the acquired assets and liabilities of Aliante are included in our consolidated balance sheet as of December 31, 2017 and 2016, and the results of its operations and cash flows are reported in our consolidated statements of operations and cash flows, respectively, for the year ended December 31, 2017 and from September 27, 2016 through December 31, 2016, during the year ended December 31, 2016. The net purchase price was
$372.3 million
.
The Company followed the acquisition method of accounting per Accounting Standards Codification 805 ("ASC 805") guidance. In accordance with ASC 805, the Company allocated the purchase price to the tangible and intangible assets acquired and liabilities assumed based on their fair values, which was determined primarily by management with assistance from third-party appraisals. The excess of the purchase price over those fair values has been recorded as goodwill. The determination of the fair values of the acquired assets and assumed liabilities (and the related determination of estimated lives of depreciable tangible and identifiable intangible assets) was completed in second quarter of 2017. The measurement period adjustment and related tax impact were immaterial to our consolidated financial statements.
47
Valuation of Indefinite-Lived Intangible Assets
Gaming license rights represent the value of the license to conduct gaming in certain jurisdictions, which is subject to highly extensive regulatory oversight and a limitation on the number of licenses available for issuance with these certain jurisdictions. License rights are tested for impairment using a discounted cash flow approach, and trademarks are tested for impairment using the relief-from-royalty method. The value of gaming licenses is determined using a multi-period excess earnings method, which is a specific discounted cash flow model. The value is determined at an amount equal to the present value of the incremental after-tax cash flows attributable only to future gaming revenue, discounted to present value at a risk-adjusted rate of return. With respect to the application of this methodology, we used the following significant projections and assumptions: gaming revenues; gaming operating expenses; general and administrative expenses; tax expense; terminal value; and discount rate. These projections are modeled for a five-year period.
Trademarks are based on the value of our brand, which reflects the level of service and quality we provide and from which we generate repeat business. Trademarks are valued using the relief from royalty method, which presumes that without ownership of such trademarks, we would have to make a stream of payments to a brand or franchise owner in return for the right to use their name. By virtue of this asset, we avoid any such payments and record the related intangible value of our ownership of the brand name. We used the following significant projections and assumptions to determine value under the relief from royalty method: revenue from gaming and hotel activities; royalty rate; tax expense; terminal growth rate; discount rate; and the present value of tax benefit. The projections underlying this discounted cash flow model were forecasted for fifteen years. Applying the selected pretax royalty rates to the applicable revenue base in each period yielded pretax income for each property's trademarks and trade name. These pretax totals were tax effected utilizing the applicable tax rate to arrive at net, after-tax cash flows. The net, after-tax flows were then discounted to present value utilizing an appropriate discount rate. The present value of the after-tax cash flows was then added to the present value of the amortization tax benefit (considering the 15-year amortization of intangible assets pursuant to recent tax legislation) to arrive at the recommended fair values for the trademarks and trade names.
Gaming license rights and trademarks are indefinite-lived intangible assets and are not subject to amortization, but are subject to an annual impairment test and between annual test dates in certain circumstances. If the fair value of an indefinite-lived intangible asset is less than its carrying amount, an impairment loss is recognized equal to the difference. Gaming license rights are tested for impairment using a discounted cash flow approach. Trademarks are tested for impairment using the relief-from-royalty method. As part of our annual impairment testing, management assesses the likelihood of impairment and solicits third party valuation expertise to assist in the valuation of indefinite-lived intangible assets that are deemed to have a greater likelihood of impairment.
Our annual impairment test, performed as of October 1,
2017
, did not result in an impairment charge.
We evaluate whether any triggering events or changes in circumstances had occurred subsequent to our annual impairment test that would indicate an impairment condition may exist. This evaluation required significant judgment, including consideration of whether there had been any significant adverse changes in legal factors or in our business climate, adverse action or assessment by a regulator, unanticipated competition, loss of key personnel or likely sale or disposal of all or a significant portion of a reporting unit. Based upon this evaluation, we concluded that there had not been any triggering events or changes in circumstances that indicated an impairment condition existed as of
December 31, 2017
. If an event described above occurs, and results in a significant impact to our revenue and profitability projections, or any significant assumption in our valuations methods is adversely impacted, the impact could result in a material impairment charge in the future.
Valuation of Goodwill
The authoritative guidance related to goodwill impairment requires goodwill to be tested for impairment at the reporting unit level at least annually. The guidance permits an entity to make a qualitative assessment, referred to as “Step Zero,” of whether it is more likely than not that a reporting unit’s fair value is less than its carrying amount. If the carrying value of the goodwill is considered impaired, a loss is measured as the excess of the reporting unit's carrying value over the fair value, with a limit of the goodwill allocated to that reporting unit.
As part of our annual impairment testing, management assesses the likelihood of impairment and solicits third party valuation expertise to assist in valuations of goodwill for those reporting units that are deemed to have a greater likelihood of impairment. We perform the test as of October 1, using a weighting of two different approaches to determine fair value: (i) the income approach; and (ii) the market approach.
The income approach is based on a discounted cash flow method, which focuses on the expected cash flow of the subject company. In applying this approach, the cash flow available for distribution is calculated for a finite period of years. Cash flow available for distribution is defined, for purposes of this analysis, as the amount of cash that could be distributed as a dividend without impairing the future profitability or operations of the subject company. The cash flow available for distribution and the terminal value (the value of the subject company at the end of the estimation period) are then discounted to present value to derive an indication of value of the business enterprise.
48
In the valuation of an asset, the income approach focuses on the income-producing capability of the subject asset. The underlying premise of this approach is that the value of an asset can be measured by the present worth of the net economic benefit (cash receipts less cash outlays) to be received over the life of the subject asset. The steps followed in applying this approach include estimating the expected after-tax cash flows attributable to the asset over its life and converting these after-tax cash flows to present value through "discounting." The discounting process uses a rate of return which accounts for both the time value of money and investment risk factors. Finally, the present value of the after-tax cash flows over the life of the asset is totaled to arrive at an indication of the fair value of the asset.
The market approach is comprised of the guideline company method, which focuses on comparing the subject company to selected reasonably similar, or "guideline", publicly-traded companies. Under this method, valuation multiples are: (i) derived from the operating data of selected guideline companies; (ii) evaluated and adjusted based on the strengths and weaknesses of the subject company relative to the selected guideline companies; and (iii) applied to the operating data of the subject company to arrive at an indication of value. In the valuation of an asset, the market approach measures value based on what typical purchasers in the market have paid for assets which can be considered reasonably similar to those being valued. When the market approach is utilized, data are collected on the prices paid for reasonably comparable assets. Adjustments are made to the similar assets to compensate for differences between reasonably similar assets and the asset being valued. The application of the market approach results in an estimate of the price reasonably expected to be realized from the sale of the subject asset.
The two methodologies were weighted 60.0% toward the income approach and 40.0% toward the market approach, to arrive at an overall fair value. At October 1, 2017, the fair value of our reporting units exceeded their carrying value. At
December 31, 2017
, we evaluated whether any triggering events or changes in circumstances had occurred subsequent to our annual impairment test that would indicate an impairment condition may exist. This evaluation required significant judgment, including consideration of whether there had been any significant adverse changes in legal factors or in our business climate, adverse action or assessment by a regulator, unanticipated competition, loss of key personnel or likely sale or disposal of all or a significant portion of a reporting unit. Based upon this evaluation, we concluded that there had not been a triggering event or change in circumstances that indicated an impairment condition existed at
December 31, 2017
.
Although we satisfied the impairment analysis requirements for each reporting unit tested, changes to certain underlying assumptions and variables, many of which are derived from external factors, could greatly impact the results of future tests. We cannot control or influence the impact of these factors from a fair valuation perspective, but they could nonetheless have a material effect on the results of valuation, particularly the guideline company method under the market approach, in the future.
Additionally, several of the assumptions underlying the discounted cash flow method under the income approach could pose a high degree of sensitivity to the resulting fair value. These factors include, but are not limited to, the following: total revenue, depreciation expense, depreciation overhang, tax expense and effective rates, debt-free net working capital, capital additions, terminal year growth factor, discount rate and the capitalization rate. A change in any of these variables that cause our undiscounted cash flows or terminal value or both to adversely and materially change could result in the failure of the impairment test, and a resulting impairment of our goodwill in an amount up to its book value of
$888.2 million
.
The Company has determined that each of its properties is a reporting unit for goodwill impairment testing, since discrete financial information is available at the property level.
Determination of Self-Insured Reserves
We are fully self-insured for general liability costs and self-insured for workers' compensation costs up to a stop loss limit of $0.5 million. Self-insurance reserves include accruals of estimated settlements for known claims, ("Case Reserves") as well as accruals of estimates for claims incurred but not yet reported ("IBNR"). Case reserves represent estimated liability for unpaid loss, based on a claims administrator's estimates of future payments on individual reported claims, including Loss Adjustment Expenses ("LAE"). Generally, LAE includes claims settlement costs directly assigned to specific claims, such as legal fees. We estimate case and LAE reserves on a combined basis, but do not include claim administration costs in our estimated ultimate loss reserves. IBNR reserves include the provision for unreported claims, changes in case reserves, and future payments on reopened claims.
We have relied upon an industry-based method to establish our self-insurance reserves, which projects the ultimate losses estimated by multiplying the exposures by a selected ultimate loss rate. The selected ultimate loss rates were determined based on a review of ultimate loss rates for prior years, adjusted for loss and exposure trend, and benefit level changes. We believe this method best provides an appropriate result, given the maturing experience and relative stabilization of our claims history. In previous years, and in certain instances, loss rates were based on industry Loss Development Factors ("LDFs"). Industry LDFs are from various national sources for workers compensation and general liability claims, and we utilize the most recent information available,
49
although there is some lag time between compilation and publishing of such reports, during which unfavorable trends or data could emerge, which would not be reflected in our reserves.
For workers' compensation, using payroll by state as weights, we calculate a weighted average industry LDF; for general liability claims, we use gross revenues as weights, and apply to a weighted average Industry LDF to yield an initial expectation of the ultimate loss amount. The paid LDFs are used to determine the percentage of the expected ultimate loss that is expected to be unpaid as of the reserving date. This future unpaid percentage is multiplied by the expected ultimate losses to derive the expected future paid losses. As a loss year matures, the expected future paid losses are replaced by actual paid losses.
In the computation of workers' compensation claims, we exclude any claim which has reached our stop loss limitation; and therefore, we do not include any allowance for expected recoverable from excess or reinsurance. We are, however, contingently liable in the event such reinsurer cannot meet its obligations. Although we place this risk with insurers rated better than A with AM Best, a national insurance company rating agency, there can be no assurance that such reinsurer will be able to meet their obligations in the future. At
December 31, 2017
, unpaid case reserves on claims in excess of $0.5 million, which we have subrogated to the reinsurer, totaled less than $2.9 million.
In estimating our reserves for unpaid losses, it is also necessary to project future loss payments. Actual future losses will not develop exactly as projected and may, in fact, vary significantly from the projections. Further, the projections make no provision for future emergence of new classes of losses or types of losses not sufficiently represented in our historical database or that are not yet quantifiable. Additionally, our results are estimates based on long term averages. Actual loss experience in any given year may differ from what is suggested by these averages. The sensitivity of key variables and assumptions in the analysis was considered. Key variables and assumptions include (but are not limited to) loss development factors, trend factors and the expected loss rates/ratios used. It is possible that reasonable alternative selections would produce materially different reserve estimates.
Management believes the estimates of future liability are reasonable based upon this methodology; however, changes in key variables and assumptions used above, or generally in health care costs, accident frequency and severity could materially affect the estimate for these reserves.
Provisions for Deferred Tax Assets, Certain Tax Liabilities and Uncertain Tax Positions
Income taxes are recorded under the asset and liability method, whereby deferred tax assets and liabilities are recognized based on the future tax consequences attributable to temporary differences between the financial statement carrying amounts of existing assets and liabilities and their respective tax bases, and attributable to operating loss and tax credit carryforwards. We reduce the carrying amounts of deferred tax assets by a valuation allowance, if based on the available evidence it is more likely than not that such assets will not be realized. Accordingly, the need to establish valuation allowances for deferred tax assets is assessed periodically based on more-likely-than-not realization threshold. This assessment considers, among other matters, the nature, frequency and severity of current and cumulative losses, forecasts of future profitability, the duration of statutory carryforward periods, our experience with the usability of operating loss and tax credit carryforwards before expiration, and tax planning alternatives.
The Company's income tax returns are subject to examination by the Internal Revenue Service ("IRS") and other tax authorities in the locations where it operates. The Company assesses potentially unfavorable outcomes of such examinations based on accounting standards for uncertain income taxes, which prescribe a minimum recognition threshold a tax position is required to meet before being recognized in the financial statements.
We recognize the tax benefit from an uncertain tax position only when it is more likely than not, based on the technical merits of the position, that the tax position will be sustained upon examination, including the resolution of any related appeals or litigation. The tax benefits recognized in the consolidated financial statements from such a position are measured as the largest benefit that has a greater than fifty percent likelihood of being realized upon ultimate resolution.
We have established contingency reserves for material, known tax exposures. Our tax reserves reflect management's judgment as to the resolution of the issues involved if subject to judicial review. While we believe our reserves are adequate to cover reasonably expected tax risks, there can be no assurance that, in all instances, an issue raised by a taxing authority will be resolved at a financial cost that does not exceed its related reserve. With respect to these reserves, our income tax expense would include: (i) any changes in tax reserves arising from material changes during the period in the facts and circumstances (i.e., new information) surrounding a tax issue; and (ii) any difference from our tax position as recorded in the financial statements and the final resolution of a tax issue during the period.
Our balance for uncertain tax benefits as of
December 31, 2017
was $2.5 million. While we believe that our reserves are adequate to cover reasonably expected tax risks, in the event that the ultimate resolution of our uncertain tax positions differ from our
50
estimates, we may be exposed to material increases in income tax expense, which could materially impact our financial position, results of operations and cash flows.
Recently Issued Accounting Pronouncements
For information with respect to recent accounting pronouncements and the impact of these pronouncements on our consolidated financial statements, see Note 1,
Summary of Significant Accounting Policies -
Recently Issued Accounting Pronouncements
, in the notes to the consolidated financial statements.
Market risk is the risk of loss arising from adverse changes in market rates and prices, such as interest rates, foreign currency exchange rates and commodity prices. We do not hold any market risk sensitive instruments for trading purposes. Our primary exposure to market risk is interest rate risk, specifically long-term U.S. treasury rates and the applicable spreads in the high-yield investment market, short-term and long-term LIBOR rates, and short-term Eurodollar rates, and their potential impact on our long-term debt. We attempt to limit our exposure to interest rate risk by managing the mix of our long-term fixed-rate borrowings and short-term borrowings under our Credit Facility. We do not currently utilize derivative financial instruments for trading or speculative purposes.
Table of Debt Maturities and Interest Rates
The following table provides information about our financial instruments that are sensitive to changes in interest rates, including debt obligations. For our debt obligations, the table presents principal cash flows and related weighted-average interest rates by expected maturity dates. The weighted-average variable rates are based upon prevailing interest rates.
The scheduled maturities of our long-term debt outstanding for the years ending December 31 are as follows:
|
|
Scheduled Maturity Date
|
||||||||||||||||||||||||||||||
|
|
Year Ending December 31,
|
||||||||||||||||||||||||||||||
|
(In millions, except percentages)
|
2018
|
2019
|
2020
|
2021
|
2022
|
Thereafter
|
Total
|
Fair
Value
|
|||||||||||||||||||||||
|
Long-term debt (including current portion):
|
|
|
|
|
|
|
|
|
|
|
|
|
|
|
|||||||||||||||||
|
Fixed-rate
|
$
|
0.1
|
|
$
|
0.1
|
|
$
|
0.1
|
|
$
|
0.1
|
|
$
|
0.1
|
|
$
|
1,500.0
|
|
$
|
1,500.5
|
|
$
|
1,609.2
|
|
|||||||
|
Average interest rate
|
6.6
|
%
|
6.6
|
%
|
6.6
|
%
|
6.6
|
%
|
6.6
|
%
|
6.4
|
%
|
6.6
|
%
|
|
|
|||||||||||||||
|
Variable-rate
|
$
|
23.9
|
|
$
|
23.9
|
|
$
|
23.9
|
|
$
|
429.9
|
|
$
|
12.7
|
|
$
|
1,106.8
|
|
$
|
1,621.1
|
|
$
|
1,625.2
|
|
|||||||
|
Average interest rate
|
3.9
|
%
|
3.9
|
%
|
3.9
|
%
|
3.9
|
%
|
4.0
|
%
|
4.0
|
%
|
3.9
|
%
|
|
|
|||||||||||||||
As of
December 31, 2017
, our long-term variable-rate borrowings represented approximately 51.9% of total long-term debt. Based on
December 31, 2017
debt levels, a 100-basis-point change in interest rate would cause our annual interest costs to change by approximately $16.2 million.
The following table provides other information about our long-term debt:
|
|
December 31, 2017
|
||||||||||||
|
(In millions)
|
Outstanding
Face
Amount
|
Carrying
Value
|
Estimated
Fair Value
|
Fair
Value
Hierarchy
|
|||||||||
|
Bank credit facility
|
$
|
1,621.1
|
|
$
|
1,595.7
|
|
$
|
1,625.2
|
|
Level 2
|
|||
|
6.875% senior notes due 2023
|
750.0
|
|
740.6
|
|
798.7
|
|
Level 1
|
||||||
|
6.375% senior notes due 2026
|
750.0
|
|
739.1
|
|
810.0
|
|
Level 1
|
||||||
|
Other
|
0.5
|
|
0.5
|
|
0.5
|
|
Level 3
|
||||||
|
Total long-term debt
|
$
|
3,121.6
|
|
$
|
3,075.9
|
|
$
|
3,234.4
|
|
||||
The estimated fair value of our Credit Facility is based on a relative value analysis performed on or about
December 31, 2017
.
51
The following consolidated financial statements for the three years in the period ended
December 31, 2017
are filed as part of this Report:
|
|
Page No.
|
The accompanying audited consolidated financial statements of Boyd Gaming Corporation (and together with its subsidiaries, the "Company," "we" or "us") have been prepared in accordance with the instructions to Form 10-K and Regulation S-X and include all information and footnote disclosures necessary for complete financial statements in conformity with accounting principles generally accepted in the United States ("GAAP").
52
REPORT OF INDEPENDENT REGISTERED PUBLIC ACCOUNTING FIRM
To the Shareholders and Board of Directors of Boyd Gaming Corporation and Subsidiaries:
Opinion on the Financial Statements
We have audited the accompanying consolidated balance sheets of Boyd Gaming Corporation and Subsidiaries (the “Company”) as of December 31, 2017 and 2016, and the related consolidated statements of operations, comprehensive income (loss), changes in stockholders’ equity, and cash flows for each of the three years in the period ended December 31, 2017. In our opinion, such consolidated financial statements present fairly, in all material respects, the financial position of Boyd Gaming Corporation and subsidiaries at December 31, 2017 and 2016, and the results of their operations and their cash flows for each of the three years in the period ended December 31, 2017, in conformity with accounting principles generally accepted in the United States of America.
We have also audited, in accordance with the standards of the Public Company Accounting Oversight Board (United States) (PCAOB), the Company’s internal control over financial reporting as of December 31, 2017, based on criteria established in
Internal Control – Integrated Framework (2013)
issued by the Committee of Sponsoring Organizations of the Treadway Commission and our report dated February 26, 2018 expressed an unqualified opinion on the Company’s internal control over financial reporting.
Basis for Opinion
These financial statements are the responsibility of the Company’s management. Our responsibility is to express an opinion on the Company’s financial statements based on our audits. We are a public accounting firm registered with the PCAOB and are required to be independent with respect to the Company in accordance with the U.S. federal securities laws and the applicable rules and regulations of the Securities and Exchange Commission and the PCAOB.
We conducted our audits in accordance with the standards of the PCAOB. Those standards require that we plan and perform the audit to obtain reasonable assurance about whether the financial statements are free of material misstatement, whether due to error or fraud. Our audits included performing procedures to assess the risks of material misstatement of the financial statements, whether due to error or fraud, and performing procedures that respond to those risks. Such procedures included examining, on a test basis, evidence regarding the amounts and disclosures in the financial statements. Our audit also included evaluating the accounting principles used and significant estimates made by management, as well as evaluating the overall presentation of the financial statements. We believe that our audits provide a reasonable basis for our opinion.
/s/ DELOITTE & TOUCHE LLP
Las Vegas, Nevada
February 26, 2018
We have served as the Company’s auditor since 1981.
53
BOYD GAMING CORPORATION AND SUBSIDIARIES
CONSOLIDATED BALANCE SHEETS
______________________________________________________________________________________________________
|
December 31,
|
|||||||
|
(In thousands, except share data)
|
2017
|
2016
|
|||||
|
ASSETS
|
|||||||
|
Current assets
|
|||||||
|
Cash and cash equivalents
|
$
|
203,104
|
|
$
|
193,862
|
|
|
|
Restricted cash
|
24,175
|
|
16,488
|
|
|||
|
Accounts receivable, net
|
40,322
|
|
30,371
|
|
|||
|
Inventories
|
18,004
|
|
18,568
|
|
|||
|
Prepaid expenses and other current assets
|
37,873
|
|
46,214
|
|
|||
|
Income taxes receivable
|
5,185
|
|
2,444
|
|
|||
|
Total current assets
|
328,663
|
|
307,947
|
|
|||
|
Property and equipment, net
|
2,539,786
|
|
2,605,169
|
|
|||
|
Other assets, net
|
81,128
|
|
49,205
|
|
|||
|
Intangible assets, net
|
842,946
|
|
881,954
|
|
|||
|
Goodwill, net
|
888,224
|
|
826,476
|
|
|||
|
Other long-term tax assets
|
5,183
|
|
—
|
|
|||
|
Total assets
|
$
|
4,685,930
|
|
$
|
4,670,751
|
|
|
|
LIABILITIES AND STOCKHOLDERS’ EQUITY
|
|||||||
|
Current liabilities
|
|||||||
|
Accounts payable
|
$
|
106,323
|
|
$
|
84,086
|
|
|
|
Current maturities of long-term debt
|
23,981
|
|
30,336
|
|
|||
|
Accrued liabilities
|
248,979
|
|
251,082
|
|
|||
|
Income tax payable
|
21
|
|
—
|
|
|||
|
Total current liabilities
|
379,304
|
|
365,504
|
|
|||
|
Long-term debt, net of current maturities and debt issuance costs
|
3,051,899
|
|
3,199,119
|
|
|||
|
Deferred income taxes
|
89,075
|
|
83,980
|
|
|||
|
Other long-term tax liabilities
|
3,447
|
|
3,307
|
|
|||
|
Other liabilities
|
61,229
|
|
84,715
|
|
|||
|
Commitments and contingencies (Note 9)
|
|
|
|||||
|
Stockholders’ equity
|
|||||||
|
Preferred stock, $0.01 par value, 5,000,000 shares authorized
|
—
|
|
—
|
|
|||
|
Common stock, $0.01 par value, 200,000,000 shares authorized; 112,634,418 and 112,896,377 shares outstanding
|
1,126
|
|
1,129
|
|
|||
|
Additional paid-in capital
|
931,858
|
|
953,440
|
|
|||
|
Retained earnings (accumulated deficit)
|
168,174
|
|
(19,878
|
)
|
|||
|
Accumulated other comprehensive income (loss)
|
(182
|
)
|
(615
|
)
|
|||
|
Total Boyd Gaming Corporation stockholders’ equity
|
1,100,976
|
|
934,076
|
|
|||
|
Noncontrolling interest
|
—
|
|
50
|
|
|||
|
Total stockholders’ equity
|
1,100,976
|
|
934,126
|
|
|||
|
Total liabilities and stockholders’ equity
|
$
|
4,685,930
|
|
$
|
4,670,751
|
|
|
The accompanying notes are an integral part of these consolidated financial statements.
54
BOYD GAMING CORPORATION AND SUBSIDIARIES
CONSOLIDATED STATEMENTS OF OPERATIONS
______________________________________________________________________________________________________
|
Year Ended December 31,
|
|||||||||||
|
(In thousands, except per share data)
|
2017
|
2016
|
2015
|
||||||||
|
Revenues
|
|||||||||||
|
Gaming
|
$
|
1,972,422
|
|
$
|
1,820,176
|
|
$
|
1,847,167
|
|
||
|
Food and beverage
|
349,271
|
|
306,145
|
|
307,442
|
|
|||||
|
Room
|
188,689
|
|
170,816
|
|
163,509
|
|
|||||
|
Other
|
132,695
|
|
122,416
|
|
123,959
|
|
|||||
|
Gross revenues
|
2,643,077
|
|
2,419,553
|
|
2,442,077
|
|
|||||
|
Less promotional allowances
|
259,370
|
|
235,577
|
|
242,645
|
|
|||||
|
Net revenues
|
2,383,707
|
|
2,183,976
|
|
2,199,432
|
|
|||||
|
Operating costs and expenses
|
|||||||||||
|
Gaming
|
923,266
|
|
880,716
|
|
900,922
|
|
|||||
|
Food and beverage
|
194,524
|
|
170,053
|
|
168,096
|
|
|||||
|
Room
|
52,196
|
|
44,245
|
|
41,298
|
|
|||||
|
Other
|
77,129
|
|
76,719
|
|
80,508
|
|
|||||
|
Selling, general and administrative
|
362,037
|
|
322,009
|
|
322,420
|
|
|||||
|
Maintenance and utilities
|
109,462
|
|
100,020
|
|
104,548
|
|
|||||
|
Depreciation and amortization
|
217,522
|
|
196,226
|
|
207,118
|
|
|||||
|
Corporate expense
|
88,148
|
|
72,668
|
|
76,941
|
|
|||||
|
Project development, preopening and writedowns
|
14,454
|
|
22,107
|
|
6,907
|
|
|||||
|
Impairments of assets
|
(426
|
)
|
38,302
|
|
18,565
|
|
|||||
|
Other operating items, net
|
1,900
|
|
284
|
|
907
|
|
|||||
|
Total operating costs and expenses
|
2,040,212
|
|
1,923,349
|
|
1,928,230
|
|
|||||
|
Operating income
|
343,495
|
|
260,627
|
|
271,202
|
|
|||||
|
Other expense (income)
|
|||||||||||
|
Interest income
|
(1,818
|
)
|
(2,961
|
)
|
(1,858
|
)
|
|||||
|
Interest expense, net of amounts capitalized
|
173,108
|
|
212,692
|
|
224,590
|
|
|||||
|
Loss on early extinguishments and modifications of debt
|
1,582
|
|
42,364
|
|
40,733
|
|
|||||
|
Other, net
|
(184
|
)
|
545
|
|
3,676
|
|
|||||
|
Total other expense, net
|
172,688
|
|
252,640
|
|
267,141
|
|
|||||
|
Income from continuing operations before income taxes
|
170,807
|
|
7,987
|
|
4,061
|
|
|||||
|
Income tax (provision) benefit
|
(3,006
|
)
|
197,486
|
|
6,634
|
|
|||||
|
Income from continuing operations, net of tax
|
167,801
|
|
205,473
|
|
10,695
|
|
|||||
|
Income from discontinued operations, net of tax
|
21,392
|
|
212,530
|
|
36,539
|
|
|||||
|
Net income
|
$
|
189,193
|
|
$
|
418,003
|
|
$
|
47,234
|
|
||
|
Basic net income per common share
|
|
|
|
|
|
|
|||||
|
Continuing operations
|
$
|
1.46
|
|
$
|
1.79
|
|
$
|
0.10
|
|
||
|
Discontinued operations
|
0.19
|
|
1.86
|
|
0.32
|
|
|||||
|
Basic net income per common share
|
$
|
1.65
|
|
$
|
3.65
|
|
$
|
0.42
|
|
||
|
Weighted average basic shares outstanding
|
114,957
|
|
114,507
|
|
112,789
|
|
|||||
|
Diluted net income per common share
|
|
|
|
|
|
|
|||||
|
Continuing operations
|
$
|
1.45
|
|
$
|
1.78
|
|
$
|
0.10
|
|
||
|
Discontinued operations
|
0.19
|
|
1.85
|
|
0.32
|
|
|||||
|
Diluted net income per common share
|
$
|
1.64
|
|
$
|
3.63
|
|
$
|
0.42
|
|
||
|
Weighted average diluted shares outstanding
|
115,628
|
|
115,189
|
|
113,676
|
|
|||||
|
Dividends per common share
|
$
|
0.15
|
|
$
|
—
|
|
$
|
—
|
|
||
The accompanying notes are an integral part of these consolidated financial statements.
55
BOYD GAMING CORPORATION AND SUBSIDIARIES
CONSOLIDATED STATEMENTS OF COMPREHENSIVE INCOME
______________________________________________________________________________________________________
|
Year Ended December 31,
|
|||||||||||
|
(In thousands)
|
2017
|
2016
|
2015
|
||||||||
|
Net income
|
$
|
189,193
|
|
$
|
418,003
|
|
$
|
47,234
|
|
||
|
Other comprehensive income (loss), net of tax:
|
|||||||||||
|
Fair value of adjustments to available-for-sale securities
|
433
|
|
(299
|
)
|
(263
|
)
|
|||||
|
Comprehensive income
|
$
|
189,626
|
|
$
|
417,704
|
|
$
|
46,971
|
|
||
The accompanying notes are an integral part of these consolidated financial statements.
56
BOYD GAMING CORPORATION AND SUBSIDIARIES
CONSOLIDATED STATEMENTS OF CHANGES IN STOCKHOLDERS’ EQUITY
______________________________________________________________________________________________________
|
Boyd Gaming Corporation Stockholders’ Equity
|
||||||||||||||||||||||||||
|
Retained
|
Accumulated
|
|||||||||||||||||||||||||
|
Additional
|
Earnings/
|
Other
|
Total
|
|||||||||||||||||||||||
|
Common Stock
|
Paid-in
|
(Accumulated
|
Comprehensive
|
Noncontrolling
|
Stockholders'
|
|||||||||||||||||||||
|
(In thousands, except share data)
|
Shares
|
Amount
|
Capital
|
Deficit)
|
Income (Loss), Net
|
Interest
|
Equity
|
|||||||||||||||||||
|
Balances, January 1, 2015
|
109,277,060
|
|
$
|
1,093
|
|
$
|
922,112
|
|
$
|
(485,115
|
)
|
$
|
(53
|
)
|
$
|
50
|
|
$
|
438,087
|
|
||||||
|
Net income
|
—
|
|
—
|
|
—
|
|
47,234
|
|
—
|
|
—
|
|
47,234
|
|
||||||||||||
|
Comprehensive loss attributable to Boyd
|
—
|
|
—
|
|
—
|
|
—
|
|
(263
|
)
|
—
|
|
(263
|
)
|
||||||||||||
|
Stock options exercised
|
1,301,789
|
|
13
|
|
9,794
|
|
—
|
|
—
|
|
—
|
|
9,807
|
|
||||||||||||
|
Release of restricted stock units, net of tax
|
553,822
|
|
6
|
|
(3,678
|
)
|
—
|
|
—
|
|
—
|
|
(3,672
|
)
|
||||||||||||
|
Release of performance stock units, net of tax
|
481,749
|
|
5
|
|
(2,451
|
)
|
—
|
|
—
|
|
—
|
|
(2,446
|
)
|
||||||||||||
|
Share-based compensation costs
|
—
|
|
—
|
|
19,264
|
|
—
|
|
—
|
|
—
|
|
19,264
|
|
||||||||||||
|
Balances, December 31, 2015
|
111,614,420
|
|
1,117
|
|
945,041
|
|
(437,881
|
)
|
(316
|
)
|
50
|
|
508,011
|
|
||||||||||||
|
Net income
|
—
|
|
—
|
|
—
|
|
418,003
|
|
—
|
|
—
|
|
418,003
|
|
||||||||||||
|
Comprehensive loss attributable to Boyd
|
—
|
|
—
|
|
—
|
|
—
|
|
(299
|
)
|
—
|
|
(299
|
)
|
||||||||||||
|
Stock options exercised
|
452,898
|
|
4
|
|
2,936
|
|
—
|
|
—
|
|
—
|
|
2,940
|
|
||||||||||||
|
Release of restricted stock units, net of tax
|
670,032
|
|
6
|
|
(3,374
|
)
|
—
|
|
—
|
|
—
|
|
(3,368
|
)
|
||||||||||||
|
Release of performance stock units, net of tax
|
159,027
|
|
2
|
|
(869
|
)
|
—
|
|
—
|
|
—
|
|
(867
|
)
|
||||||||||||
|
Tax effect from share-based compensation arrangements
|
—
|
|
—
|
|
(5,812
|
)
|
—
|
|
—
|
|
—
|
|
(5,812
|
)
|
||||||||||||
|
Share-based compensation costs
|
—
|
|
—
|
|
15,518
|
|
—
|
|
—
|
|
—
|
|
15,518
|
|
||||||||||||
|
Balances, December 31, 2016
|
112,896,377
|
|
1,129
|
|
953,440
|
|
(19,878
|
)
|
(615
|
)
|
50
|
|
934,126
|
|
||||||||||||
|
Cumulative effect of change in accounting principle, adoption of Update 2016-09
|
—
|
|
—
|
|
—
|
|
15,777
|
|
—
|
|
—
|
|
15,777
|
|
||||||||||||
|
Net income
|
—
|
|
—
|
|
—
|
|
189,193
|
|
—
|
|
—
|
|
189,193
|
|
||||||||||||
|
Comprehensive income attributable to Boyd
|
—
|
|
—
|
|
—
|
|
—
|
|
433
|
|
—
|
|
433
|
|
||||||||||||
|
Stock options exercised
|
241,964
|
|
2
|
|
2,082
|
|
—
|
|
—
|
|
—
|
|
2,084
|
|
||||||||||||
|
Release of restricted stock units, net of tax
|
520,854
|
|
5
|
|
(8,009
|
)
|
—
|
|
—
|
|
—
|
|
(8,004
|
)
|
||||||||||||
|
Release of performance stock units, net of tax
|
173,653
|
|
2
|
|
(1,793
|
)
|
—
|
|
—
|
|
—
|
|
(1,791
|
)
|
||||||||||||
|
Dividends Declared
|
—
|
|
—
|
|
—
|
|
(16,918
|
)
|
—
|
|
—
|
|
(16,918
|
)
|
||||||||||||
|
Shares repurchased and retired
|
(1,198,430
|
)
|
(12
|
)
|
(31,915
|
)
|
—
|
|
—
|
|
—
|
|
(31,927
|
)
|
||||||||||||
|
Share-based compensation costs
|
—
|
|
—
|
|
17,413
|
|
—
|
|
—
|
|
—
|
|
17,413
|
|
||||||||||||
|
Other
|
—
|
|
—
|
|
640
|
|
—
|
|
—
|
|
(50
|
)
|
590
|
|
||||||||||||
|
Balances, December 31, 2017
|
112,634,418
|
|
$
|
1,126
|
|
$
|
931,858
|
|
$
|
168,174
|
|
$
|
(182
|
)
|
$
|
—
|
|
$
|
1,100,976
|
|
||||||
The accompanying notes are an integral part of these consolidated financial statements.
57
BOYD GAMING CORPORATION AND SUBSIDIARIES
|
Year Ended December 31,
|
|||||||||||
|
(In thousands)
|
2017
|
2016
|
2015
|
||||||||
|
Cash Flows from Operating Activities
|
|||||||||||
|
Net income
|
$
|
189,193
|
|
$
|
418,003
|
|
$
|
47,234
|
|
||
|
Adjustments to reconcile net income to net cash provided by operating activities:
|
|||||||||||
|
Income from discontinued operations, net of tax
|
(21,392
|
)
|
(212,530
|
)
|
(36,539
|
)
|
|||||
|
Depreciation and amortization
|
217,522
|
|
196,226
|
|
207,118
|
|
|||||
|
Amortization of debt financing costs and discounts on debt
|
9,845
|
|
14,870
|
|
21,308
|
|
|||||
|
Share-based compensation expense
|
17,413
|
|
15,518
|
|
19,264
|
|
|||||
|
Deferred income taxes
|
5,095
|
|
(199,051
|
)
|
16,846
|
|
|||||
|
Non-cash impairment of assets
|
—
|
|
38,302
|
|
18,565
|
|
|||||
|
Gain on sale of assets
|
(1,027
|
)
|
(6,288
|
)
|
—
|
|
|||||
|
Loss on early extinguishments and modifications of debt
|
1,582
|
|
42,364
|
|
40,733
|
|
|||||
|
Other operating activities
|
(2,033
|
)
|
1,625
|
|
2,145
|
|
|||||
|
Changes in operating assets and liabilities:
|
|||||||||||
|
Restricted cash
|
(7,687
|
)
|
2,542
|
|
(923
|
)
|
|||||
|
Accounts receivable, net
|
(9,937
|
)
|
45
|
|
1,971
|
|
|||||
|
Inventories
|
565
|
|
884
|
|
(301
|
)
|
|||||
|
Prepaid expenses and other current assets
|
4,957
|
|
1,691
|
|
(4,275
|
)
|
|||||
|
Current other tax asset
|
—
|
|
—
|
|
1,802
|
|
|||||
|
Income taxes receivable
|
1,089
|
|
(1,064
|
)
|
(137
|
)
|
|||||
|
Other long-term tax assets, net
|
(5,183
|
)
|
—
|
|
—
|
|
|||||
|
Other assets, net
|
2,318
|
|
(626
|
)
|
922
|
|
|||||
|
Accounts payable and accrued liabilities
|
13,521
|
|
(11,824
|
)
|
13,207
|
|
|||||
|
Other long-term tax liabilities
|
140
|
|
222
|
|
(25,566
|
)
|
|||||
|
Other liabilities
|
(1,117
|
)
|
1,972
|
|
2,377
|
|
|||||
|
Net cash provided by operating activities
|
414,864
|
|
302,881
|
|
325,751
|
|
|||||
|
Cash Flows from Investing Activities
|
|||||||||||
|
Capital expenditures
|
(190,464
|
)
|
(160,358
|
)
|
(131,170
|
)
|
|||||
|
Cash paid for acquisitions, net of cash received
|
(1,153
|
)
|
(592,703
|
)
|
—
|
|
|||||
|
Advances pursuant to development agreement
|
(35,108
|
)
|
—
|
|
—
|
|
|||||
|
Other investing activities
|
706
|
|
14,207
|
|
4,528
|
|
|||||
|
Net cash used in investing activities
|
(226,019
|
)
|
(738,854
|
)
|
(126,642
|
)
|
|||||
58
BOYD GAMING CORPORATION AND SUBSIDIARIES
CONSOLIDATED STATEMENTS OF CASH FLOWS - (Continued)
_____________________________________________________________________________________________________
|
Year Ended December 31,
|
|||||||||||
|
(In thousands)
|
2017
|
2016
|
2015
|
||||||||
|
Cash Flows from Financing Activities
|
|||||||||||
|
Borrowings under Boyd Gaming bank credit facility
|
958,000
|
|
2,039,175
|
|
1,033,500
|
|
|||||
|
Payments under Boyd Gaming bank credit facility
|
(1,119,485
|
)
|
(1,466,362
|
)
|
(1,211,200
|
)
|
|||||
|
Borrowings under Peninsula bank credit facility
|
—
|
|
237,000
|
|
345,500
|
|
|||||
|
Payments under Peninsula bank credit facility
|
—
|
|
(899,750
|
)
|
(425,150
|
)
|
|||||
|
Proceeds from issuance of senior notes
|
—
|
|
750,000
|
|
750,000
|
|
|||||
|
Debt financing costs, net
|
(3,430
|
)
|
(42,220
|
)
|
(14,004
|
)
|
|||||
|
Retirements of senior notes
|
—
|
|
(700,000
|
)
|
(657,813
|
)
|
|||||
|
Premium and consent fees paid
|
—
|
|
(15,750
|
)
|
(24,246
|
)
|
|||||
|
Share-based compensation activities, net
|
(7,711
|
)
|
(1,295
|
)
|
3,689
|
|
|||||
|
Shares repurchased and retired
|
(31,927
|
)
|
—
|
|
—
|
|
|||||
|
Dividends paid
|
(11,286
|
)
|
—
|
|
—
|
|
|||||
|
Other financing activities
|
503
|
|
(45
|
)
|
—
|
|
|||||
|
Net cash used in financing activities
|
(215,336
|
)
|
(99,247
|
)
|
(199,724
|
)
|
|||||
|
Cash Flows from Discontinued Operations
|
|||||||||||
|
Cash flows from operating activities
|
(514
|
)
|
(27,796
|
)
|
14,095
|
|
|||||
|
Cash flows from investing activities
|
36,247
|
|
598,057
|
|
—
|
|
|||||
|
Cash flows from financing activities
|
—
|
|
—
|
|
—
|
|
|||||
|
Net cash provided by discontinued operations
|
35,733
|
|
570,261
|
|
14,095
|
|
|||||
|
Change in cash and cash equivalents
|
9,242
|
|
35,041
|
|
13,480
|
|
|||||
|
Cash and cash equivalents, beginning of period
|
193,862
|
|
158,821
|
|
145,341
|
|
|||||
|
Cash and cash equivalents, end of period
|
$
|
203,104
|
|
$
|
193,862
|
|
$
|
158,821
|
|
||
|
Supplemental Disclosure of Cash Flow Information
|
|||||||||||
|
Cash paid for interest, net of amounts capitalized
|
$
|
174,090
|
|
$
|
197,475
|
|
$
|
178,433
|
|
||
|
Cash paid (received) for income taxes, net of refunds
|
5,189
|
|
33,723
|
|
(1,159
|
)
|
|||||
|
Supplemental Schedule of Non-cash Investing and Financing Activities
|
|||||||||||
|
Payables incurred for capital expenditures
|
$
|
9,297
|
|
$
|
9,334
|
|
$
|
7,235
|
|
||
The accompanying notes are an integral part of these consolidated financial statements.
59
Organization
Boyd Gaming Corporation (and together with its subsidiaries, the "Company", the "Registrant", "Boyd Gaming", "Boyd", "we" or "us") was incorporated in the state of Nevada in 1988 and has been operating since 1975. The Company's common stock is traded on the New York Stock Exchange under the symbol "BYD".
As of
December 31, 2017
, we are a diversified operator of
24
wholly owned gaming entertainment properties. Headquartered in Las Vegas, we have gaming operations in Nevada, Illinois, Indiana, Iowa, Kansas, Louisiana and Mississippi, which we aggregate in order to present the following
three
reportable segments:
|
Las Vegas Locals
|
|
|
Gold Coast Hotel and Casino
|
Las Vegas, Nevada
|
|
The Orleans Hotel and Casino
|
Las Vegas, Nevada
|
|
Sam's Town Hotel and Gambling Hall
|
Las Vegas, Nevada
|
|
Suncoast Hotel and Casino
|
Las Vegas, Nevada
|
|
Eastside Cannery Casino and Hotel
|
Las Vegas, Nevada
|
|
Aliante Casino + Hotel + Spa
|
North Las Vegas, Nevada
|
|
Cannery Casino Hotel
|
North Las Vegas, Nevada
|
|
Eldorado Casino
|
Henderson, Nevada
|
|
Jokers Wild Casino
|
Henderson, Nevada
|
|
Downtown Las Vegas
|
|
|
California Hotel and Casino
|
Las Vegas, Nevada
|
|
Fremont Hotel and Casino
|
Las Vegas, Nevada
|
|
Main Street Station Casino, Brewery and Hotel
|
Las Vegas, Nevada
|
|
Midwest and South
|
|
|
Par-A-Dice Hotel Casino
|
East Peoria, Illinois
|
|
Blue Chip Casino, Hotel & Spa
|
Michigan City, Indiana
|
|
Diamond Jo Dubuque
|
Dubuque, Iowa
|
|
Diamond Jo Worth
|
Northwood, Iowa
|
|
Kansas Star Casino
|
Mulvane, Kansas
|
|
Amelia Belle Casino
|
Amelia, Louisiana
|
|
Delta Downs Racetrack Casino & Hotel
|
Vinton, Louisiana
|
|
Evangeline Downs Racetrack and Casino
|
Opelousas, Louisiana
|
|
Sam's Town Hotel and Casino
|
Shreveport, Louisiana
|
|
Treasure Chest Casino
|
Kenner, Louisiana
|
|
IP Casino Resort Spa
|
Biloxi, Mississippi
|
|
Sam's Town Hotel and Gambling Hall
|
Tunica, Mississippi
|
As a result of the sale of our equity interest in Borgata (see Note 2,
Acquisitions and Divestitures
), we no longer report our interest in Borgata as a Reportable Segment.
Our Las Vegas Locals segment includes the results of Aliante Gaming, LLC ("Aliante"), The Cannery Hotel and Casino, LLC (“Cannery”) and Nevada Palace, LLC (“Eastside Cannery”) (see Note 2,
Acquisitions and Divestitures
).
In addition to these properties, we own and operate a travel agency and a captive insurance company that underwrites travel-related insurance, each located in Hawaii. Financial results for our travel agency and our captive insurance company are included in our Downtown Las Vegas segment, as our Downtown Las Vegas properties concentrate significant marketing efforts on gaming customers from Hawaii.
60
BOYD GAMING CORPORATION AND SUBSIDIARIES
NOTES TO CONSOLIDATED FINANCIAL STATEMENTS - (Continued)
as of December 31, 2017 and 2016 and for the years ended December 31, 2017, 2016 and 2015
______________________________________________________________________________________________________
Basis of Presentation
The consolidated financial statements include the accounts of the Company and its subsidiaries.
See Note 2,
Acquisitions and Divestitures
, for discussion of our acquisitions of Aliante, Cannery and Eastside Cannery, which were completed during the year ended December 31, 2016. We have not disclosed the pro forma impact of these acquisitions to our results of operations, as the pro forma impact was deemed immaterial.
Investments in unconsolidated affiliates, which are
50%
or less owned and do not meet the consolidation criteria of the authoritative accounting guidance for voting interest, controlling interest or variable interest entities, are accounted for under the equity method.
All significant intercompany accounts and transactions have been eliminated in consolidation.
Discontinued Operations
On August 1, 2016, Boyd Gaming completed the sale of its
50%
equity interest in Marina District Development Holding Company, LLC ("MDDHC"), the parent company of Borgata, to MGM Resorts International ("MGM") pursuant to an Equity Purchase Agreement (the "Purchase Agreement") enter into on May 31, 2016, as amended on July 19, 2016 by and among Boyd, Boyd Atlantic City, Inc., a wholly owned subsidiary of Boyd, and MGM. (See Note 2,
Acquisitions and Divestitures
.) We accounted for our investment in Borgata by applying the equity method and reported its results as discontinued operations for all periods presented in these consolidated financial statements.
Cash and Cash Equivalents
Cash and cash equivalents include highly liquid investments with maturities of
three months
or less at their date of purchase, and are on deposit with high credit quality financial institutions. Although these balances may at times exceed the federal insured deposit limit, we believe such risk is mitigated by the quality of the institution holding such deposit. The carrying values of these instruments approximate their fair values as such balances are generally available on demand.
Restricted Cash
Restricted cash consists primarily of advance payments related to: (i) future bookings with our Hawaiian travel agency; and (ii) amounts restricted by regulation for gaming and racing purposes. These restricted cash balances are invested in highly liquid instruments with a maturity of
90 days
or less. These restricted cash balances are held by high credit quality financial institutions. The carrying value of these instruments approximates their fair value due to their short maturities.
Accounts Receivable, net
Accounts receivable consist primarily of casino, hotel and other receivables. Accounts receivable are typically non-interest bearing and are initially recorded at cost. Accounts are written off when management deems the account to be uncollectible, based upon historical collection experience, the age of the receivable and other relevant economic factors. An estimated allowance for doubtful accounts is maintained to reduce our receivables to their carrying amount. As a result, the net carrying value approximates fair value.
The activity comprising our allowance for doubtful accounts is as follows:
|
Year Ended December 31,
|
|||||||||||
|
(In thousands)
|
2017
|
2016
|
2015
|
||||||||
|
Beginning balance, January 1,
|
$
|
1,971
|
|
$
|
2,087
|
|
$
|
1,971
|
|
||
|
Additions due to Acquisitions
|
—
|
|
87
|
|
—
|
|
|||||
|
Additions
|
478
|
|
345
|
|
361
|
|
|||||
|
Deductions
|
(377
|
)
|
(548
|
)
|
(245
|
)
|
|||||
|
Ending balance
|
$
|
2,072
|
|
$
|
1,971
|
|
$
|
2,087
|
|
||
Inventories
Inventories consist primarily of food and beverage and retail items and are stated at the lower of cost or market. Cost is determined using the weighted-average inventory method.
61
BOYD GAMING CORPORATION AND SUBSIDIARIES
NOTES TO CONSOLIDATED FINANCIAL STATEMENTS - (Continued)
as of December 31, 2017 and 2016 and for the years ended December 31, 2017, 2016 and 2015
______________________________________________________________________________________________________
Property and Equipment, net
Property and equipment are stated at cost. Depreciation is computed using the straight-line method over the estimated useful lives of the assets or, for leasehold improvements, over the shorter of the asset's useful life or term of the lease.
The estimated useful lives of our major components of property and equipment are:
|
Building and improvements
|
3 through 40 years
|
|
Riverboats and barges
|
5 through 40 years
|
|
Furniture and equipment
|
1 through 10 years
|
Gains or losses on disposals of assets are recognized as incurred. Costs of major improvements are capitalized, while costs of normal repairs and maintenance are charged to expense as incurred.
For an asset that is held for sale, we recognize the asset at the lower of carrying value or fair market value, less costs of disposal, as estimated based on comparable asset sales, solicited offers, or a discounted cash flow model. For a long-lived asset to be held and used, we review the asset for impairment whenever events or changes in circumstances indicate that the carrying amount may not be recoverable. We then compare the estimated undiscounted future cash flows of the asset to the carrying value of the asset. The asset is not impaired if the undiscounted future cash flows exceed its carrying value. If the carrying value exceeds the undiscounted future cash flows, then an impairment charge is recorded, typically measured using a discounted cash flow model, which is based on the estimated future results of the relevant reporting unit discounted using our weighted-average cost of capital and market indicators of terminal year free cash flow multiples. All resulting recognized impairment charges are recorded as Impairment of assets within operating expenses.
Capitalized Interest
Interest costs associated with major construction projects are capitalized as part of the cost of the constructed assets. When no debt is incurred specifically for a project, interest is capitalized on amounts expended for the project using our weighted-average cost of borrowing. Capitalization of interest ceases when the project (or discernible portions of the project) is substantially complete. If substantially all of the construction activities of a project are suspended, capitalization of interest will cease until such activities are resumed. Interest capitalized during the years ended December 31,
2016
and
2015
was
$0.5 million
and
$0.1 million
, respectively. There was
no
interest capitalized for the year ended
December 31, 2017
.
Investment in Available for Sale Securities
We have an investment in
$20.5 million
aggregate principal amount of
7.5%
Urban Renewal Tax Increment Revenue Bonds, Taxable Series 2007 ("City Bonds"). This investment is classified as available-for-sale and is recorded at fair value. The fair value at
December 31, 2017
and
2016
was
$17.8 million
and
$17.3 million
, respectively. At
December 31, 2017
and
2016
,
$0.5 million
and
$0.4 million
, respectively, is included in prepaid expenses and other current assets, and
$17.3 million
and
$16.8 million
, respectively, is included in other assets, net.
Future maturities of the City Bonds, excluding the discount, for the years ending December 31 are summarized as follows:
|
(In thousands)
|
|||
|
For the year ending December 31,
|
|||
|
2018
|
$
|
475
|
|
|
2019
|
510
|
|
|
|
2020
|
550
|
|
|
|
2021
|
590
|
|
|
|
2022
|
635
|
|
|
|
Thereafter
|
17,760
|
|
|
|
Total
|
$
|
20,520
|
|
Intangible Assets
Intangible assets include customer relationships, favorable lease rates, development agreements, gaming license rights and trademarks.
62
BOYD GAMING CORPORATION AND SUBSIDIARIES
NOTES TO CONSOLIDATED FINANCIAL STATEMENTS - (Continued)
as of December 31, 2017 and 2016 and for the years ended December 31, 2017, 2016 and 2015
______________________________________________________________________________________________________
Amortizing Intangible Assets
Customer relationships represent the value of repeat business associated with our customer loyalty programs. These intangible assets are being amortized on an accelerated method over their approximate useful life. Favorable lease rates represent the amount by which acquired lease rental rates are favorable to market terms. These favorable lease values are amortized over the remaining lease term, primarily on leasehold land interests, originally ranging in duration from
41
to
52 years
. Development agreements are contracts between two parties establishing an agreement for development of a product or service. These agreements are amortized over the respective cash flow period of the related agreement.
Indefinite-Lived Intangible Assets
Trademarks are based on the value of our brands, which reflect the level of service and quality we provide and from which we generate repeat business. Gaming license rights represent the value of the license to conduct gaming in certain jurisdictions, which is subject to highly extensive regulatory oversight, and a limitation on the number of licenses available for issuance therein. These assets, considered indefinite-lived intangible assets, are not subject to amortization, but instead are subject to an annual impairment test, and between annual test dates in certain circumstances. If the fair value of an indefinite-lived intangible asset is less than its carrying amount, an impairment loss is recognized equal to the difference. License rights are tested for impairment using a discounted cash flow approach, and trademarks are tested for impairment using the relief-from-royalty method.
Goodwill
Goodwill is an asset representing the future economic benefits arising from other assets in a business combination that are not individually identified and separately recognized. Goodwill is not subject to amortization, but it is subject to an annual impairment test and between annual test dates in certain circumstances.
We evaluate goodwill using a weighted average allocation of both the income and market approach models. The income approach is based upon a discounted cash flow method, whereas the market approach uses the guideline public company method. Specifically, the income approach focuses on the expected cash flow of the subject reporting unit, considering the available cash flow for a finite period of years. Available cash flow is defined as the amount of cash that could be distributed as a dividend without impairing the future profitability or operations of the reporting unit. The underlying premise of the income approach is that the value of goodwill can be measured by the present value of the net economic benefit to be received over the life of the reporting unit. The market approach focuses on comparing the reporting unit to selected reasonably similar (or "guideline") publicly-traded companies. Under this method, valuation multiples are: (i) derived from the operating data of selected guideline companies; (ii) evaluated and adjusted based on the strengths and weaknesses of our reporting unit relative to the selected guideline companies; and (iii) applied to the operating data of our reporting unit to arrive at an indication of value. The application of the market approach results in an estimate of the price reasonably expected to be realized from the sale of the subject reporting unit.
Player Loyalty Point Program
We have established promotional programs to encourage repeat business from frequent and active slot machine customers and other patrons. Members earn points based on gaming activity and such points can be redeemed for complimentary slot play, food and beverage, and other free goods and services. We record points redeemed for complimentary slot play as a reduction to gaming revenue and points redeemed for food and beverage and other free goods and services as promotional allowances. The accrual for unredeemed points is based on estimates and assumptions regarding the redemption mix of complimentary slot play, food and beverage, and other free goods and services and the costs of providing those benefits. Historical data is used to assist in the determination of the estimated accruals. The player loyalty point program accrual is included in accrued liabilities on our consolidated balance sheets.
Long-Term Debt, Net
Long-term debt, net is reported as the outstanding debt amount net of amortized cost. Any unamortized debt issuance costs, which include legal and other direct costs related to the issuance of our outstanding debt, or discount granted to the initial purchasers or lenders upon issuance of our debt instruments is recorded as a direct reduction to the face amount of our outstanding debt. The debt issuance costs and discount are accreted to interest expense using the effective interest method over the contractual term of the underlying debt. In the event that our debt is modified, repurchased or otherwise reduced prior to its original maturity date, we ratably reduce the unamortized debt issuance costs and discount and record a loss on extinguishment of debt.
63
BOYD GAMING CORPORATION AND SUBSIDIARIES
NOTES TO CONSOLIDATED FINANCIAL STATEMENTS - (Continued)
as of December 31, 2017 and 2016 and for the years ended December 31, 2017, 2016 and 2015
______________________________________________________________________________________________________
Income Taxes
Income taxes are recorded under the asset and liability method, whereby deferred tax assets and liabilities are recognized based on the future tax consequences attributable to temporary differences between the financial statement carrying amounts of existing assets and liabilities and their respective tax bases. We reduce the carrying amounts of deferred tax assets by a valuation allowance, if based on the available evidence it is more likely than not that such assets will not be realized. Use of the term "more likely than not" indicates the likelihood of occurrence is greater than 50%. Accordingly, the need to establish valuation allowances for deferred tax assets is continually assessed based on a more-likely-than-not realization threshold. This assessment considers, among other matters, the nature, frequency and severity of current and cumulative losses, forecasts of profitability, the duration of statutory carryforward periods, our experience with the utilization of operating loss and tax credit carryforwards before expiration and tax planning strategies. In making such judgments, significant weight is given to evidence that can be objectively verified.
Other Long-Term Tax Liabilities
The Company's income tax returns are subject to examination by the Internal Revenue Service ("IRS") and other tax authorities in the locations where it operates. The Company assesses potentially unfavorable outcomes of such examinations based on accounting standards for uncertain income taxes, which prescribe a minimum recognition threshold a tax position is required to meet before being recognized in the financial statements.
Uncertain tax position accounting standards apply to all tax positions related to income taxes. These accounting standards utilize a two-step approach for evaluating tax positions. Recognition occurs when the Company concludes that a tax position, based on its technical merits, is more likely than not to be sustained upon examination. Measurement is only addressed if the position is deemed to be more likely than not to be sustained. The tax benefit is measured as the largest amount of benefit that is more likely than not to be realized upon settlement.
Tax positions failing to qualify for initial recognition are recognized in the first subsequent interim period that they meet the "more likely than not" standard. If it is subsequently determined that a previously recognized tax position no longer meets the "more likely than not" standard, it is required that the tax position is derecognized. Accounting standards for uncertain tax positions specifically prohibit the use of a valuation allowance as a substitute for derecognition of tax positions. As applicable, the Company will recognize accrued penalties and interest related to unrecognized tax benefits in the provision for income taxes. Accrued interest and penalties are included in other long-term tax liabilities on the balance sheet.
Self-Insurance Reserves
We are self-insured for various insurance coverages such as property, general liability, employee health and workers' compensation costs with the appropriate levels of deductibles and retentions. Insurance claims and reserves include accruals of estimated settlements for known claims, as well as accruals of estimates for claims incurred but not yet reported. In estimating these accruals, we consider historical loss experience and make judgments about the expected levels of costs per claim. Management believes the estimates of future liability are reasonable based upon our methodology; however, changes in health care costs, accident frequency and severity and other factors could materially affect the estimate for these liabilities. Certain of these claims represent obligations to make future payments; and therefore, we discount such reserves to an amount representing the present value of the claims which will be paid in the future using a blended rate, which represents the inherent risk and the average payout duration. Self-insurance reserves are included in other liabilities on our consolidated balance sheets.
The activity comprising our self-insurance reserves is as follows:
|
|
Year Ended December 31,
|
||||||||||
|
(In thousands)
|
2017
|
2016
|
2015
|
||||||||
|
Beginning balance
|
$
|
31,022
|
|
$
|
30,068
|
|
$
|
33,004
|
|
||
|
Additions
|
|||||||||||
|
Charged to costs and expenses
|
84,209
|
|
79,685
|
|
80,311
|
|
|||||
|
Due to acquisitions
|
—
|
|
14
|
|
—
|
|
|||||
|
Payments made
|
(81,236
|
)
|
(78,745
|
)
|
(83,247
|
)
|
|||||
|
Ending balance
|
$
|
33,995
|
|
$
|
31,022
|
|
$
|
30,068
|
|
||
64
BOYD GAMING CORPORATION AND SUBSIDIARIES
NOTES TO CONSOLIDATED FINANCIAL STATEMENTS - (Continued)
as of December 31, 2017 and 2016 and for the years ended December 31, 2017, 2016 and 2015
______________________________________________________________________________________________________
Accumulated Other Comprehensive Income (Loss)
Comprehensive income includes net income and other comprehensive income (loss). Components of the Company's comprehensive income are reported in the accompanying consolidated statements of changes in stockholders' equity and consolidated statements of comprehensive income. The accumulated other comprehensive income (loss) at
December 31, 2017
, consists of unrealized gains and losses on the investment available for sale resulting from changes in fair value.
Noncontrolling Interest
Noncontrolling interest represented the ownership interest in one of our subsidiaries that was held by a third party. During 2017, the joint venture in which we held an
80%
interest was dissolved, thus eliminating our noncontrolling interest.
Revenue Recognition
Gaming revenue represents the net win from gaming activities, which is the aggregate difference between gaming wins and losses. The majority of our gaming revenue is counted in the form of cash and chips and therefore is not subject to any significant or complex estimation procedures. Cash discounts, commissions and other cash incentives to customers related to gaming play are recorded as a reduction of gross gaming revenues.
Race revenue recognition criteria are met at the time the results of the event are official.
Room revenue recognition criteria are met at the time of occupancy.
Food and beverage revenue recognition criteria are met at the time of service.
Promotional Allowances
The retail value of accommodations, food and beverage, and other services furnished to guests without charge is included in gross revenues and then deducted as a promotional allowance. Promotional allowances also include incentives earned in our slot bonus program such as cash and the estimated retail value of goods and services (such as complimentary rooms and food and beverages). We reward customers, through the use of bonus programs, with points based on amounts wagered that can be redeemed for a specified period of time for complimentary slot play, food and beverage, and to a lesser extent for other goods or services, depending upon the property.
The amounts included in promotional allowances are as follows:
|
|
Year Ended December 31,
|
||||||||||
|
(In thousands)
|
2017
|
2016
|
2015
|
||||||||
|
Rooms
|
$
|
76,029
|
|
$
|
74,937
|
|
$
|
77,177
|
|
||
|
Food and beverage
|
168,886
|
|
146,946
|
|
150,598
|
|
|||||
|
Other
|
14,455
|
|
13,694
|
|
14,870
|
|
|||||
|
Total promotional allowances
|
$
|
259,370
|
|
$
|
235,577
|
|
$
|
242,645
|
|
||
The estimated costs of providing such promotional allowances are as follows:
|
|
Year Ended December 31,
|
||||||||||
|
(In thousands)
|
2017
|
2016
|
2015
|
||||||||
|
Rooms
|
$
|
33,584
|
|
$
|
33,514
|
|
$
|
35,605
|
|
||
|
Food and beverage
|
150,431
|
|
130,941
|
|
133,717
|
|
|||||
|
Other
|
13,315
|
|
12,417
|
|
12,290
|
|
|||||
|
Total cost of promotional allowances
|
$
|
197,330
|
|
$
|
176,872
|
|
$
|
181,612
|
|
||
Gaming Taxes
We are subject to taxes based on gross gaming revenues in the jurisdictions in which we operate. These gaming taxes are assessed based on our gaming revenues and are recorded as a gaming expense in the consolidated statements of operations. These taxes totaled approximately
$324.5 million
,
$321.7 million
and
$332.1 million
for the years ended
December 31, 2017
,
2016
and
2015
, respectively.
65
BOYD GAMING CORPORATION AND SUBSIDIARIES
NOTES TO CONSOLIDATED FINANCIAL STATEMENTS - (Continued)
as of December 31, 2017 and 2016 and for the years ended December 31, 2017, 2016 and 2015
______________________________________________________________________________________________________
Advertising Expense
Direct advertising costs are expensed the first time such advertising appears. Advertising costs are included in selling, general and administrative expenses on the consolidated statements of operations and totaled
$29.9 million
,
$32.3 million
and
$33.4 million
for the years ended
December 31, 2017
,
2016
and
2015
, respectively.
Corporate Expense
Corporate expense represents unallocated payroll, professional fees, aircraft costs and various other expenses that are not directly related to our casino hotel operations.
Project Development, Preopening and Writedowns
Project development, preopening and writedowns represent: (i) certain costs incurred and recoveries realized related to the activities associated with various acquisition opportunities, dispositions and other business development activities in the ordinary course of business; (ii) certain costs of start-up activities that are expensed as incurred and do not qualify as capital costs; and (iii) asset write-downs.
Share-Based Compensation
Share-based compensation expense is measured at the grant date, based on the estimated fair value of the award, and is recognized as expense, net of estimated forfeitures, over the employee's requisite service period. The requisite service period can be impacted by the provisions of the Company’s stock compensation programs that provide for automatic vesting acceleration upon retirement (including as a result of death or disability) for those long-service participants achieving defined age and years of service criteria. These acceleration provisions do not apply to stock grants and awards issued within six months of the employee’s retirement. Compensation costs related to stock option awards are calculated based on the fair value of each major option grant on the date of the grant using the Black-Scholes option pricing model, which requires the following assumptions: expected stock price volatility, risk-free interest rates, expected option lives and dividend yields. We formed our assumptions using historical experience and observable market conditions.
The Company did not issue any stock option grants in 2017. The following table discloses the weighted-average assumptions used in estimating the fair value of our significant stock option grants and awards in prior years:
|
Year Ended December 31,
|
|||||||
|
2016
|
2015
|
||||||
|
Expected stock price volatility
|
46.62
|
%
|
49.06
|
%
|
|||
|
Risk-free interest rate
|
1.39
|
%
|
1.59
|
%
|
|||
|
Expected option life (in years)
|
5.4
|
|
5.3
|
|
|||
|
Estimated fair value per share
|
$
|
7.67
|
|
$
|
9.06
|
|
|
Net Income per Share
Basic net income per share is computed by dividing net income applicable to Boyd Gaming Corporation stockholders by the weighted-average number of common shares outstanding during the period. Diluted earnings per share reflects the additional dilution for all potentially-dilutive securities, such as stock options.
Concentration of Credit Risk
Financial instruments that subject us to credit risk consist of cash equivalents and accounts receivable.
Our policy is to limit the amount of credit exposure to any one financial institution, and place investments with financial institutions evaluated as being creditworthy, or in short-term money market and tax-free bond funds which are exposed to minimal interest rate and credit risk. We have bank deposits that may at times exceed federally-insured limits.
Concentration of credit risk, with respect to gaming receivables, is limited through our credit evaluation process. We issue markers to approved gaming customers only following credit checks and investigations of creditworthiness.
Use of Estimates
The preparation of financial statements in conformity with GAAP requires management to make estimates and assumptions that affect the reported amounts of assets and liabilities and disclosure of contingent assets and liabilities at the date of the financial
66
BOYD GAMING CORPORATION AND SUBSIDIARIES
NOTES TO CONSOLIDATED FINANCIAL STATEMENTS - (Continued)
as of December 31, 2017 and 2016 and for the years ended December 31, 2017, 2016 and 2015
______________________________________________________________________________________________________
statements and the reported amounts of revenues and expenses during the reporting period. Actual results could differ from these estimates.
Change in Accounting Principle
In first quarter 2017, the Company adopted
Accounting Standards Update 2016-09, Compensation - Stock Compensation ("Update 2016-09")
which simplified several aspects of the accounting for share-based payment transactions, including the income tax consequences, classification of awards as either equity or liabilities, and classification on the statement of cash flows. Update 2016-09 requires excess tax benefits and deficiencies to be recorded in income tax expense instead of equity. The cumulative effect of this change in accounting principle is to record the benefit of previously unrecognized excess tax deductions as an increase in retained earnings of
$15.8 million
on the consolidated statement of changes in stockholders' equity for the year ended
December 31, 2017
. Additionally, for the year ended December 31, 2017, we recorded an excess tax benefit in our tax expense of approximately
$1.5 million
. We anticipate recording excess tax benefits as a component of tax expense will cause volatility in our future effective tax rate.
Recently Issued Accounting Pronouncements
Accounting Standards Update 2017-09, Compensation-Stock Compensation ("Update 2017-09")
In May 2017, the Financial Accounting Standards Board ("FASB") issued Update 2017-09, which amends the scope of modification accounting for share-based payment arrangements. An entity should account for the effects of a modification unless the fair value, vesting conditions, and classification of the awards are the same immediately before and after the modification. The standard is effective for the financial statements issued for annual periods and interim periods within those annual periods, beginning after December 15, 2017, and early adoption is permitted. The Company adopted Update 2017-09 during second quarter 2017. The early adoption did not have a material impact on our consolidated financial statements.
Accounting Standards Update 2017-04, Intangibles-Goodwill and Other ("Update 2017-04")
In January 2017, the FASB issued Update 2017-04, which addresses goodwill impairment testing. Instead of determining goodwill impairment by calculating the implied fair value of goodwill, an entity should perform goodwill impairment test by comparing the fair value of a reporting unit with its carrying amount. The standard is effective for financial statements issued for annual periods and interim periods within those annual periods, beginning after December 15, 2019, and early adoption is permitted. The Company adopted Update 2017-04 effective January 1, 2017. The early adoption did not have an impact on our consolidated financial statements.
Accounting Standards Update 2016-18, Statement of Cash Flows ("Update 2016-18")
In November 2016, the FASB issued Update 2016-18, which amends Accounting Standards Codification ("ASC") 230 to add or clarify the guidance on the classification and presentation of restricted cash in the statement of cash flows. The standard is effective for financial statements issued for annual periods and interim periods within those annual periods beginning after December 15, 2017, and early adoption is permitted. The Company is evaluating the impact of the adoption of Update 2016-18 to the consolidated financial statements.
Accounting Standards Update 2016-17, Consolidation ("Update 2016-17")
In October 2016, the FASB issued Update 2016-17, which amends the guidance on related parties that are under common control.
The ASU provides guidance on a single decision maker does not consider indirect interest held through related parties as equivalent to direct interests in determining whether it meets the economics criterion to be a primary beneficiary. The standard is effective for financial statements issued for annual periods and interim periods within those annual periods beginning after December 15, 2017, and early adoption is permitted. The Company determined that the impact of the new standard on its consolidated financial statements will not be material.
Accounting Standards Update 2016-16, Income Taxes ("Update 2016-16")
In October 2016, the FASB issued Update 2016-16, which addresses the immediate recognition of the current and deferred income tax effects of intra-entity transfers of assets other than inventory. The standard is effective for fiscal years, and interim periods within those years, beginning after December 15, 2017, and early adoption is permitted. The Company is evaluating the impact of the new standard on its consolidated financial statements. The Company determined that the impact of the new standard on its consolidated financial statements will not be material.
67
BOYD GAMING CORPORATION AND SUBSIDIARIES
NOTES TO CONSOLIDATED FINANCIAL STATEMENTS - (Continued)
as of December 31, 2017 and 2016 and for the years ended December 31, 2017, 2016 and 2015
______________________________________________________________________________________________________
Accounting Standards Update 2016-15, Statement of Cash Flows ("Update 2016-15")
In August 2016, the FASB issued Update 2016-15, which amends the guidance on the classification of certain cash receipts and payments in the statement of cash flows. The Accounting Standards Update ("ASU") is intended to reduce the lack of consistent principles on certain classifications such as debt prepayment, debt extinguishment costs, distributions, insurance claims and beneficial interest in securitization transactions. The standard is effective for financial statements issued for annual periods and interim periods within those annual periods beginning after December 15, 2017, and early adoption is permitted. The Company is evaluating the impact of the adoption of Update 2016-15 to the consolidated financial statements.
Accounting Standards Update 2016-13, Financial Instruments-Credit Losses ("Update 2016-13")
In June 2016, the FASB issued Update 2016-13, which amends the guidance on the impairment of financial instruments. Update 2016-13 adds to GAAP an impairment model (known as the current expected credit loss ("CECL") model) that is based on expected losses rather than incurred losses. The standard is effective for financial statements issued for annual periods and interim periods within those annual periods beginning after December 15, 2019, and early adoption is permitted. The Company is evaluating the impact of the adoption of Update 2016-13 to the consolidated financial statements.
Accounting Standards Update 2016-02, Leases ("Update 2016-02")
In February 2016, the FASB issued Update 2016-02 which requires the recognition of lease assets and lease liabilities on the balance sheet and the disclosure of key information about leasing arrangements. The standard is effective for financial statements issued for annual periods and interim periods within those annual periods beginning after December 15, 2018, and early adoption is permitted. The Company is evaluating the impact of the adoption of Update 2016-02 to the consolidated financial statements.
Accounting Standards Update 2014-09, Revenue from Contracts with Customers ("Update 2014-09"); Accounting Standards Update 2015-14, Revenue from Contracts with Customers - Deferral of the Effective Date ("Update 2015-14" ); Accounting Standards Update 2016-08, Revenue from Contracts with Customers - Principal versus Agent Considerations (Reporting Revenue Gross versus Net) ("Update 2016-08"); Accounting Standards Update 2016-10, Revenue from Contracts with Customers - Identifying Performance Obligations and Licensing ("Update 2016-10"); Accounting Standards Update 2016-11, Revenue Recognition (Topic 605) and Derivatives and Hedging (Topic 815) - Rescission of SEC Guidance Because of Accounting Standards Updates 2014-09 and 2014-16 Pursuant to Staff Announcements at the March 3, 2016 EITF Meeting ("Update 2016-11"); and Accounting Standards Update 2016-12, Revenue from Contracts with Customers - Narrow-Scope Improvements and Practical Expedients ("Update 2016-12"); (collectively, the “Revenue Standard”)
The Revenue Standard prescribes a new, single comprehensive model for entities to use in accounting for revenue arising from contracts with customers and supersedes most current revenue recognition guidance, including industry-specific guidance. The Revenue Standard is effective for our Company on January 1, 2018, and must be adopted by applying either a full retrospective approach for all periods presented in the period of adoption or a modified retrospective approach with the cumulative effect of initially applying the guidance recognized at the date of initial application. We are adopting the Revenue Standard by following the full retrospective approach. The accompanying financial statements and related disclosures do not reflect the effects of the Revenue Standard. We are finalizing our assessment of the effects of the Revenue Standard on our consolidated financial statements, and we will begin reporting under the new guidance effective with our first quarter 2018 financial report.
As a result of the Revenue Standard, our historical income statement presentation, which reflects revenues gross for goods and services provided to our customers as an inducement to play with us with an offsetting reduction for promotional allowances to derive net revenues, is no longer allowed. Under the new guidance, revenues are allocated among our departmental classifications based on the relative standalone selling prices of the goods and services provided to the customer. While the amount of net revenues is not changed, this methodology results in a reduction of our reported departmental revenues by an aggregate amount equivalent to our reported promotional allowance revenues. The majority of this adjustment is applied to our gaming revenues.
Historically, and in accordance with prior guidance, we reported the expense for amounts paid to operators of wide area progressive games as contra-revenues. Under the Revenue Standard, these payments will be reported as an operating expense. The impact of this classification change will be to increase our gaming revenues and gaming expenses by equal amounts.
The accounting for our frequent player programs is also impacted. Historically, we have valued the points earned under these programs based on the estimated cost of redemption. Under the new guidance, we will account for the point programs under a deferred revenue model. The impact of this change in accounting is not expected to be material to any annual accounting period.
68
BOYD GAMING CORPORATION AND SUBSIDIARIES
NOTES TO CONSOLIDATED FINANCIAL STATEMENTS - (Continued)
as of December 31, 2017 and 2016 and for the years ended December 31, 2017, 2016 and 2015
______________________________________________________________________________________________________
A variety of proposed or otherwise potential accounting standards are currently being studied by standard-setting organizations and certain regulatory agencies. Because of the tentative and preliminary nature of such proposed standards, we have not yet determined the effect, if any, that the implementation of such proposed standards would have on our consolidated financial statements.
Cannery Casino Hotel and Nevada Palace, LLC
On December 20, 2016 (the "Acquisition Date"), Boyd Gaming completed the acquisitions of Cannery, the owner and operator of Cannery Casino Hotel, and Nevada Palace, LLC, the owner and operator of Eastside Cannery Casino and Hotel, pursuant to a Membership Interest Purchase Agreement (the “Purchase Agreement”) dated as of April 25, 2016, as amended on October 28, 2016, by and among Boyd, Cannery Casino Resorts, LLC (“Seller”), Cannery and Eastside Cannery.
Pursuant to the terms of the Purchase Agreement, Boyd acquired from Seller all of the issued and outstanding membership interests of Cannery and Eastside Cannery (the “Acquisitions”). With the closing of the Acquisitions, each of Cannery and Eastside Cannery became wholly owned subsidiaries of Boyd. Accordingly, the assets and liabilities of Cannery and Eastside Cannery are included in our consolidated balance sheets as of December 31, 2017 and 2016 and the results of their operations and cash flows in our consolidated statements of operations and cash flows, respectively, for the year ended December 31, 2017 and the period from December 20, 2016 through December 31, 2016. The Cannery and Eastside Cannery are modern casinos and hotels in the Las Vegas Valley that offer premium accommodations, gaming, dining, entertainment and retail, and are aggregated into our Las Vegas Locals segment (See Note 1,
Summary of Significant Accounting Policies.)
The net purchase price was
$228.2 million
.
The fair value of the consideration transferred to the Seller on the Acquisition Date included the purchase price of the net assets transferred. The total gross consideration was
$238.6 million
. In addition, the Purchase Agreement provided for a working capital adjustment to the purchase consideration. This adjustment was calculated during second quarter 2017 and paid during the third quarter, resulting in an additional
$1.2 million
being paid to Seller.
Acquisition Method of Accounting
The Company followed the acquisition method of accounting according to the guidance of FASB Accounting Standards Codification Topic 805 ("ASC 805"). For purposes of these financial statements, we have allocated the purchase price to the assets acquired and the liabilities assumed based on their fair values, as determined by management based on its judgment with assistance from third-party appraisals. The excess of the purchase price over the fair value of the assets acquired and liabilities assumed has been recorded as goodwill. The purchase price allocation below represents the opening balance sheet on December 20, 2016, which was initially reported in our Form 10-K for the year ended December 31, 2016. During the measurement period, which concluded on September 30, 2017, opening balance sheet adjustments were made to finalize the preliminary fair value estimates, resulting in a
$62.5 million
reduction in acquired assets, primarily related to a
$56.7 million
reduction in property and equipment, and a
$5.0 million
reduction in assumed liabilities with a corresponding increase to goodwill of
$58.7 million
. The property and equipment adjustment resulted in a depreciation expense reduction of
$2.5 million
for the year ended December 31, 2017. The measurement period adjustment and the related tax impact were immaterial to our consolidated financial statements.
69
BOYD GAMING CORPORATION AND SUBSIDIARIES
NOTES TO CONSOLIDATED FINANCIAL STATEMENTS - (Continued)
as of December 31, 2017 and 2016 and for the years ended December 31, 2017, 2016 and 2015
______________________________________________________________________________________________________
The following table summarizes the components and allocation of the purchase price, including the measurement period adjustments:
|
(In thousands)
|
Preliminary Purchase Price Allocation
|
Adjustments
|
Final Purchase Price Allocation
|
||||||||
|
Current assets
|
$
|
29,929
|
|
$
|
(8,345
|
)
|
$
|
21,584
|
|
||
|
Property and equipment
|
181,757
|
|
(56,675
|
)
|
125,082
|
|
|||||
|
Other long-term assets
|
—
|
|
3,419
|
|
3,419
|
|
|||||
|
Intangible and other assets
|
16,330
|
|
(880
|
)
|
15,450
|
|
|||||
|
Total acquired assets
|
228,016
|
|
(62,481
|
)
|
165,535
|
|
|||||
|
Current liabilities
|
15,850
|
|
(4,984
|
)
|
10,866
|
|
|||||
|
Total liabilities assumed
|
15,850
|
|
(4,984
|
)
|
10,866
|
|
|||||
|
Net identifiable assets acquired
|
212,166
|
|
(57,497
|
)
|
154,669
|
|
|||||
|
Goodwill
|
26,401
|
|
58,651
|
|
85,052
|
|
|||||
|
Net assets acquired
|
$
|
238,567
|
|
$
|
1,154
|
|
$
|
239,721
|
|
||
The following table summarizes the values assigned to acquired property and equipment and estimated useful lives:
|
(In thousands)
|
Useful Lives
|
As Recorded
|
|||
|
Land
|
$
|
7,870
|
|
||
|
Buildings and improvements
|
10 - 40 years
|
107,268
|
|
||
|
Furniture and equipment
|
3 - 7 years
|
9,820
|
|
||
|
Construction in progress
|
124
|
|
|||
|
Property and equipment acquired
|
$
|
125,082
|
|
||
The goodwill was assigned to the Las Vegas Locals reportable segment. All of the goodwill is expected to be deductible for income tax purposes.
The Company recognized
$1.1 million
and
$10.5 million
of acquisition related costs that were expensed for the year ended December 31, 2017 and 2016, respectively. These costs are included in the consolidated statements of operations in the line item entitled "Project development, preopening and writedowns".
Aliante Casino + Hotel + Spa
On September 27, 2016, Boyd Gaming completed the acquisition of ALST Casino Holdco LLC, the holding company of Aliante Casino + Hotel + Spa ("Aliante"). Pursuant to the Merger Agreement, Merger Sub merged with and into ALST (the "Merger"), with ALST surviving the Merger. ALST and Aliante are now wholly owned subsidiaries of Boyd Gaming. Accordingly, the acquired assets and liabilities of Aliante are included in our consolidated balance sheets as of December 31, 2017 and 2016 and the results of its operations and cash flows in our consolidated statements of operations and cash flows, respectively, for the year ended December 31, 2017 and the period from September 27, 2016 through December 31, 2016. Aliante is an upscale, resort-style casino and hotel situated in North Las Vegas offering premium accommodations, gaming, dining, entertainment and retail, and is aggregated into our Las Vegas Locals segment (See Note 1,
Summary of Significant Accounting Policies.)
The net purchase price was
$372.3 million
.
The fair value of the consideration transferred on the acquisition date included the purchase price of the net assets transferred. The total gross consideration was
$399.1 million
.
Acquisition Method of Accounting
The Company followed the acquisition method of accounting per ASC 805 guidance. In accordance with ASC 805, the Company allocated the purchase price to the tangible and intangible assets acquired and liabilities assumed based on their fair values, which
70
BOYD GAMING CORPORATION AND SUBSIDIARIES
NOTES TO CONSOLIDATED FINANCIAL STATEMENTS - (Continued)
as of December 31, 2017 and 2016 and for the years ended December 31, 2017, 2016 and 2015
______________________________________________________________________________________________________
were determined primarily by management with assistance from third-party appraisals. The excess of the purchase price over those fair values was recorded as goodwill. The purchase price allocation below represents Aliante’s opening balance sheet on September 27, 2016, which was initially reported in our Form 10−K for the year ended December 31, 2016. During the measurement period, which concluded on June 30, 2017, opening balance sheet adjustments were made to finalize the preliminary fair value estimates, resulting in a
$2.6 million
reduction in other assets, primarily related to base stock, a
$0.8 million
reduction in property and equipment and a
$0.4 million
increase in assumed liabilities, with a corresponding net increase to goodwill of
$3.8 million
. The measurement period adjustment and the related tax impact were immaterial to our consolidated financial statements.
The following table presents the components and allocation of the purchase price, including the measurement period adjustments:
|
(In thousands)
|
Preliminary Purchase Price Allocation
|
Adjustments
|
Final Purchase Price Allocation
|
||||||||
|
Current assets
|
$
|
31,886
|
|
$
|
—
|
|
$
|
31,886
|
|
||
|
Property and equipment
|
226,309
|
|
(760
|
)
|
225,549
|
|
|||||
|
Intangible and other assets
|
20,791
|
|
(2,643
|
)
|
18,148
|
|
|||||
|
Total acquired assets
|
278,986
|
|
(3,403
|
)
|
275,583
|
|
|||||
|
Current liabilities
|
5,693
|
|
515
|
|
6,208
|
|
|||||
|
Other liabilities
|
636
|
|
(83
|
)
|
553
|
|
|||||
|
Total liabilities assumed
|
6,329
|
|
432
|
|
6,761
|
|
|||||
|
Net identifiable assets acquired
|
272,657
|
|
(3,835
|
)
|
268,822
|
|
|||||
|
Goodwill
|
126,489
|
|
3,835
|
|
130,324
|
|
|||||
|
Net assets acquired
|
$
|
399,146
|
|
$
|
—
|
|
$
|
399,146
|
|
||
The following table summarizes the values assigned to acquired property and equipment and estimated useful lives:
|
(In thousands)
|
Useful Lives
|
As Recorded
|
|||
|
Land
|
$
|
16,680
|
|
||
|
Buildings and improvements
|
10 - 45 years
|
200,770
|
|
||
|
Furniture and equipment
|
3 - 7 years
|
8,099
|
|
||
|
Property and equipment acquired
|
$
|
225,549
|
|
||
All of the goodwill was assigned to the Las Vegas Locals reportable segment. All of the goodwill is expected to be deductible for income tax purposes.
The Company recognized
$1.0 million
and
$2.2 million
of acquisition related costs that were expensed for the year ended December 31, 2017 and 2016, respectively. These costs are included in the consolidated statements of operations in the line item entitled "Project development, preopening and writedowns".
We have not provided the amount of revenue and earnings included in our consolidated financial results from the Aliante or Cannery acquisitions for the period subsequent to their respective acquisitions as such amounts are not material for the twelve months ended December 31, 2016.
Announced Acquisitions
On December 18, 2017, Boyd Gaming announced that it had entered into a definitive agreement to acquire Ameristar Casino Kansas City, LLC ("Ameristar Kansas City"), the owner and operator of Ameristar Casino Hotel Kansas City; Ameristar Casino St. Charles, LLC ("Ameristar St. Charles"), the owner and operator of Ameristar Casino Resort Spa St. Charles; Belterra Resort Indiana LLC ("Belterra"), the owner and operator of Belterra Casino Resort located in Florence, Indiana; and PNK (Ohio) LLC (“Belterra Park”), the owner and operator of Belterra Park, located in Cincinnati, Ohio. Ameristar Kansas City, Ameristar St. Charles, Belterra and Belterra Park are collectively referred to as the "Companies".
71
BOYD GAMING CORPORATION AND SUBSIDIARIES
NOTES TO CONSOLIDATED FINANCIAL STATEMENTS - (Continued)
as of December 31, 2017 and 2016 and for the years ended December 31, 2017, 2016 and 2015
______________________________________________________________________________________________________
Boyd Gaming will acquire the Companies pursuant to a Membership Interest Purchase Agreement (the "Penn National Purchase Agreement"), made and entered into on December 17, 2017 (the "Agreement Date"), by and among Boyd, Boyd TCIV, LLC, a wholly owned subsidiary of Boyd ("Boyd Sub"), Penn National Gaming, Inc. ("Penn"), and, solely following the execution and delivery of a joinder to the Penn National Purchase Agreement, Pinnacle Entertainment, Inc. ("Pinnacle Entertainment") and its wholly owned subsidiary, Pinnacle MLS, LLC (collectively with Pinnacle Entertainment, "Pinnacle"). The Penn National Purchase Agreement provides that, pursuant to the terms and subject to the conditions set forth therein, Boyd will acquire from Pinnacle all of the issued and outstanding membership interests of the Companies as well as certain other assets (and assume certain other liabilities) of Pinnacle related to the Companies (collectively, the "Pending Acquisitions"), such that following the Pending Acquisitions, each of the Companies will be a wholly owned subsidiary of Boyd.
The Pending Acquisitions will occur substantially concurrently with the acquisition of Pinnacle Entertainment by Penn (the "Merger") pursuant to the Merger Agreement (the "Merger Agreement"), dated the Agreement Date, by and among Pinnacle Entertainment, Penn and Franchise Merger Sub, Inc., a wholly owned subsidiary of Penn.
Upon the terms and subject to the conditions of the Purchase Agreement, Boyd will acquire the Companies for total cash consideration of approximately
$575.0
million, subject to adjustments based on (a) the adjusted 2017 EBITDA of each Company (as determined subsequent to the Agreement Date), and (b) working capital, cash and indebtedness of the Companies at closing and transaction expenses.
In addition, on the Agreement Date, Boyd entered into a Master Lease Commitment and Rent Allocation Agreement (the "Lease Commitment Agreement") by and among Boyd, Boyd Sub, Penn, Gaming and Leisure Properties, Inc. ("GLPI Parent") and Gold Merger Sub, LLC, a wholly owned subsidiary of GLPI Parent (collectively with GLPI Parent, "GLPI"), pursuant to which, among other things, concurrently with the consummation of the Pending Acquisitions, Boyd will enter into a new Master Lease with GLPI, under which Boyd will lease the real estate, improvements and fixtures owned by GLPI that are associated with the Companies and currently leased to Pinnacle (the "Master Lease"). The Lease Commitment Agreement also sets forth the manner in which rent will be calculated for the purposes of the Master Lease. GLPI’s commitment to enter into the Master Lease is subject to certain conditions, including that the conditions to the Merger under the Merger Agreement and the conditions to the Pending Acquisitions under the Penn National Purchase Agreement have been satisfied or waived, and that the sale of Belterra Park’s real property to GLPI has been consummated, as contemplated by a purchase agreement between Penn and GLPI (and, upon the execution of a joinder, Belterra Park) entered into on the Agreement Date.
The completion of the Pending Acquisitions is subject to the effectiveness of the Master Lease and the consummation of the Merger, and the receipt of all required regulatory approvals, as well as customary conditions, including, among others, approval by Missouri, Ohio and Indiana gaming authorities and the acceptance or approval by the Federal Trade Commission. In addition, the Penn National Purchase is also contingent upon the successful completion of Penn National’s proposed acquisition of Pinnacle Entertainment, Inc. Subject to the satisfaction or waiver of conditions in the Penn National Purchase Agreement, Boyd currently expects the transaction to close in the second half of 2018.
The Penn National Purchase Agreement contains certain termination rights for Boyd Gaming, and the other parties thereto, and could result in a reverse termination fee payment of up to
$58.0
million in certain circumstances.
On December 20, 2017, Boyd Gaming announced that it had entered into a definitive agreement to acquire Valley Forge Convention Center Partners, L.P. ("Valley Forge"), the owner and operator of Valley Forge Casino Resort in King of Prussia, Pennsylvania.
Boyd will acquire Valley Forge pursuant to an Agreement and Plan of Merger, made and entered into on December 20, 2017 (the "Valley Forge Merger Agreement"), by and among Boyd, Boyd TCV, LP, a Pennsylvania limited partnership and a wholly owned subsidiary of Boyd ("Boyd TCV"), Valley Forge, and VFCCP SR LLC, a Pennsylvania limited liability company, solely in its capacity as the representative of Valley Forge’s limited partners. The Valley Forge Merger Agreement provides that, pursuant to the terms and subject to the conditions set forth therein, Boyd TCV will be merged with and into Valley Forge (the "Merger"), following which Valley Forge will be the surviving entity and a wholly owned subsidiary of Boyd.
Upon the terms and subject to the conditions of the Valley Forge Merger Agreement, Boyd will acquire Valley Forge for cash consideration of approximately
$280.5
million, subject to adjustment based on working capital, cash and indebtedness of Valley Forge at closing and transaction expenses.
72
BOYD GAMING CORPORATION AND SUBSIDIARIES
NOTES TO CONSOLIDATED FINANCIAL STATEMENTS - (Continued)
as of December 31, 2017 and 2016 and for the years ended December 31, 2017, 2016 and 2015
______________________________________________________________________________________________________
The completion of the Merger is subject to customary conditions, including the receipt of all required regulatory approvals, including, among others, approval by the Pennsylvania Gaming Control Board and the expiration or termination of any applicable waiting period under the Hart-Scott-Rodino Antitrust Improvements Act of 1976, as amended. Subject to the satisfaction or waiver of conditions in the Valley Forge Merger Agreement, Boyd currently expects the transaction to close in the third quarter of 2018.
Investment in and Divestiture of Borgata
On August 1, 2016, Boyd Gaming completed the sale of its
50%
equity interest in Marina District Development Holding Company, LLC ("MDDHC"), the parent company of Borgata, to MGM, pursuant to an Equity Purchase Agreement ("Purchase Agreement") entered into on May 31, 2016, as amended on July 19, 2016, by and among Boyd, Boyd Atlantic City, Inc., a wholly-owned subsidiary of Boyd ("Seller"), and MGM. Pursuant to the Purchase Agreement, MGM acquired from Boyd Gaming
49%
of its
50%
membership interest in MDDHC and, immediately thereafter, MDDHC redeemed Boyd Gaming’s remaining
1%
membership interest in MDDHC (collectively, the "Transaction"). Following the Transaction, MDDHC became a wholly owned subsidiary of MGM.
In consideration for the Transaction, MGM paid Boyd Gaming
$900 million
. The initial net cash proceeds were approximately
$589 million
, net of certain expenses and adjustments on the closing date, including outstanding indebtedness, cash and working capital. The after-tax gain on the sale of Borgata was
$181.7 million
and is included in discontinued operations in the year ended December 31, 2016. The initial proceeds did not include our
50%
share of any future property tax settlement benefits, from the time period during which we held a
50%
ownership in MDDHC, to which Boyd Gaming retained the right to receive upon payment. During 2016, we recognized
$9.1 million
in income, which is included in discontinued operations, for the cash we received for our share of property tax benefits realized by Borgata subsequent to the closing of the sale. On February 15, 2017, Borgata announced that it had entered into a settlement agreement under which it would receive payments totaling
$72 million
to resolve the property tax issues. Borgata received full payment, and we received our share of the proceeds, in June 2017. For the year ended December 31, 2017, we recognized
$36.2 million
in income for the cash we received for our share of property tax benefits realized by Borgata after the closing of the sale. These proceeds, net of tax of
$14.8 million
for the year ended December 31, 2017, are included in discontinued operations in the consolidated financial statements.
We accounted for our investment in Borgata applying the equity method, through the date of the sale, and, as a result of the sale, we reported the results as discontinued operations for all periods presented in these consolidated financial statements.
The table below summarizes the results of operations information for periods prior to the date of divestiture:
|
|
Seven Months Ended
|
Twelve Months Ended
|
|||||
|
(In thousands)
|
July 31, 2016
|
December 31, 2015
|
|||||
|
Net revenues
|
$
|
485,510
|
|
$
|
804,166
|
|
|
|
Operating expenses
|
366,812
|
|
657,324
|
|
|||
|
Operating income
|
118,698
|
|
146,842
|
|
|||
|
Interest expense
|
26,378
|
|
59,681
|
|
|||
|
Loss on early extinguishments of debt
|
1,628
|
|
18,895
|
|
|||
|
State income tax expense (benefit)
|
8,274
|
|
(3,731
|
)
|
|||
|
Net income
|
$
|
82,418
|
|
$
|
71,997
|
|
|
73
BOYD GAMING CORPORATION AND SUBSIDIARIES
NOTES TO CONSOLIDATED FINANCIAL STATEMENTS - (Continued)
as of December 31, 2017 and 2016 and for the years ended December 31, 2017, 2016 and 2015
______________________________________________________________________________________________________
Property and equipment, net consists of the following:
|
December 31,
|
|||||||
|
(In thousands)
|
2017
|
2016
|
|||||
|
Land
|
$
|
294,533
|
|
$
|
251,316
|
|
|
|
Buildings and improvements
|
2,935,539
|
|
2,915,664
|
|
|||
|
Furniture and equipment
|
1,311,704
|
|
1,243,724
|
|
|||
|
Riverboats and barges
|
238,926
|
|
239,264
|
|
|||
|
Construction in progress
|
59,538
|
|
86,226
|
|
|||
|
Other
|
—
|
|
726
|
|
|||
|
Total property and equipment
|
4,840,240
|
|
4,736,920
|
|
|||
|
Less accumulated depreciation
|
2,300,454
|
|
2,131,751
|
|
|||
|
Property and equipment, net
|
$
|
2,539,786
|
|
$
|
2,605,169
|
|
|
Construction in progress primarily relates to costs capitalized in conjunction with major improvements that have not yet been placed into service, and accordingly, such costs are not currently being depreciated. Other property and equipment relates to the estimated net realizable value of construction materials inventory that was not disposed of with the sale of the Echelon project in 2013. Such assets are not in service and are not currently being depreciated.
Depreciation expense for the years ended
December 31, 2017
,
2016
and
2015
was
$199.3 million
,
$179.6 million
and
$179.9 million
, respectively.
Intangible assets consist of the following:
|
December 31, 2017
|
|||||||||||||||||
|
Weighted
|
Gross
|
Cumulative
|
|||||||||||||||
|
Average Life
|
Carrying
|
Cumulative
|
Impairment
|
Intangible
|
|||||||||||||
|
(In thousands)
|
Remaining
|
Value
|
Amortization
|
Losses
|
Assets, Net
|
||||||||||||
|
Amortizing intangibles:
|
|||||||||||||||||
|
Customer relationships
|
5.2 years
|
$
|
9,400
|
|
$
|
(3,470
|
)
|
$
|
—
|
|
$
|
5,930
|
|
||||
|
Favorable lease rates
|
38.0 years
|
11,730
|
|
(3,075
|
)
|
—
|
|
8,655
|
|
||||||||
|
Development agreement
|
—
|
21,373
|
|
—
|
|
—
|
|
21,373
|
|
||||||||
|
42,503
|
|
(6,545
|
)
|
—
|
|
35,958
|
|
||||||||||
|
Indefinite lived intangible assets:
|
|||||||||||||||||
|
Trademarks
|
Indefinite
|
151,887
|
|
—
|
|
(4,300
|
)
|
147,587
|
|
||||||||
|
Gaming license rights
|
Indefinite
|
873,335
|
|
(33,960
|
)
|
(179,974
|
)
|
659,401
|
|
||||||||
|
1,025,222
|
|
(33,960
|
)
|
(184,274
|
)
|
806,988
|
|
||||||||||
|
Balance, December 31, 2017
|
$
|
1,067,725
|
|
$
|
(40,505
|
)
|
$
|
(184,274
|
)
|
$
|
842,946
|
|
|||||
74
BOYD GAMING CORPORATION AND SUBSIDIARIES
NOTES TO CONSOLIDATED FINANCIAL STATEMENTS - (Continued)
as of December 31, 2017 and 2016 and for the years ended December 31, 2017, 2016 and 2015
______________________________________________________________________________________________________
|
December 31, 2016
|
|||||||||||||||||
|
Weighted
|
Gross
|
Cumulative
|
|||||||||||||||
|
Average Life
|
Carrying
|
Cumulative
|
Impairment
|
Intangible
|
|||||||||||||
|
(In thousands)
|
Remaining
|
Value
|
Amortization
|
Losses
|
Assets, Net
|
||||||||||||
|
Amortizing intangibles:
|
|||||||||||||||||
|
Customer relationships
|
1.1 years
|
$
|
144,780
|
|
$
|
(125,318
|
)
|
$
|
—
|
|
$
|
19,462
|
|
||||
|
Favorable lease rates
|
31.4 years
|
45,370
|
|
(13,039
|
)
|
—
|
|
32,331
|
|
||||||||
|
Development agreement
|
—
|
21,373
|
|
—
|
|
—
|
|
21,373
|
|
||||||||
|
211,523
|
|
(138,357
|
)
|
—
|
|
73,166
|
|
||||||||||
|
Indefinite lived intangible assets:
|
|||||||||||||||||
|
Trademarks
|
Indefinite
|
153,687
|
|
—
|
|
(4,300
|
)
|
149,387
|
|
||||||||
|
Gaming license rights
|
Indefinite
|
873,335
|
|
(33,960
|
)
|
(179,974
|
)
|
659,401
|
|
||||||||
|
1,027,022
|
|
(33,960
|
)
|
(184,274
|
)
|
808,788
|
|
||||||||||
|
Balance, December 31, 2016
|
$
|
1,238,545
|
|
$
|
(172,317
|
)
|
$
|
(184,274
|
)
|
$
|
881,954
|
|
|||||
Amortizing Intangible Assets
Customer Relationships
Customer relationships represent the value of repeat business associated with our customer loyalty programs. The value of customer relationships is determined using a multi-period excess earnings method, which is a specific discounted cash flow model. The value is determined at an amount equal to the present value of the incremental after-tax cash flows attributable only to these customers, discounted to present value at a risk-adjusted rate of return. With respect to the application of this methodology, we used the following significant projections and assumptions: revenue of our rated customers, based on expected level of play; promotional allowances provided to these existing customers; attrition rate related to these customers; operating expenses; general and administrative expenses; trademark expense; discount rate; and the present value of tax benefit.
Favorable Lease Rates
Favorable lease rates represent the rental rates for assumed land leases that are favorable to comparable market rates. The fair value is determined on a technique whereby the difference between the lease rate and the then current market rate for the remaining contractual term is discounted to present value. The assumptions underlying this computation include the actual lease rates, the expected remaining lease term, including renewal options, based on the existing lease; current rates of rent for leases on comparable properties with similar terms obtained from market data and analysis; and an assumed discount rate. The estimates underlying the result covered a term of
41
to
52 years
.
Development Agreement
Development agreement is an acquired contract with a Native American tribe (the "Tribe") under which the Company has the right to assist the Tribe in the development and management of a gaming facility on the Tribe's land. This asset although amortizable, is not amortized until development is completed. We are in the process of finalizing project design and construction planning. In the interim, this asset is subject to periodic impairment reviews.
Indefinite Lived Intangible Assets
Trademarks
Trademarks are based on the value of our brands, which reflect the level of service and quality we provide and from which we generate repeat business. Trademarks are valued using the relief from royalty method, which presumes that without ownership of such trademark, we would have to make a stream of payments to a brand or franchise owner in return for the right to use their name. By virtue of this asset, we avoid any such payments and record the related intangible value of our ownership of the trade name. We used the following significant projections and assumptions to determine value under the relief from royalty method: revenue from gaming and hotel activities; royalty rate; tax expense; terminal growth rate; discount rate; and the present value of tax benefit.
75
BOYD GAMING CORPORATION AND SUBSIDIARIES
NOTES TO CONSOLIDATED FINANCIAL STATEMENTS - (Continued)
as of December 31, 2017 and 2016 and for the years ended December 31, 2017, 2016 and 2015
______________________________________________________________________________________________________
Gaming License Rights
Gaming license rights represent the value of the license to conduct gaming in certain jurisdictions, which is subject to highly extensive regulatory oversight, and a limitation on the number of licenses available for issuance therein. In the majority of cases, the value of our gaming licenses is determined using a multi-period excess earnings method, which is a specific discounted cash flow model. The value is determined at an amount equal to the present value of the incremental after-tax cash flows attributable only to future gaming revenue, discounted to present value at a risk-adjusted rate of return. With respect to the application of this methodology, we used the following significant projections and assumptions: gaming revenues; gaming operating expenses; general and administrative expenses; tax expense; terminal value; and discount rate. In two instances, we determine the value of our gaming licenses by applying a cost approach. Our primary consideration in the application of this methodology is the initial statutory fee associated with acquiring a gaming license in the jurisdiction.
Activity for the Years Ended December 31, 2017, 2016 and 2015
The following table sets forth the changes in these intangible assets:
|
(In thousands)
|
Customer Relationships
|
Favorable Lease Rates
|
Development Agreements
|
Trademarks
|
Gaming License Rights
|
Intangible Assets, Net
|
|||||||||||||||||
|
Balance, January 1, 2015
|
$
|
51,958
|
|
$
|
34,414
|
|
$
|
21,373
|
|
$
|
126,001
|
|
$
|
700,503
|
|
$
|
934,249
|
|
|||||
|
Additions
|
—
|
|
—
|
|
—
|
|
—
|
|
—
|
|
—
|
|
|||||||||||
|
Impairments
|
—
|
|
—
|
|
—
|
|
—
|
|
(17,502
|
)
|
(17,502
|
)
|
|||||||||||
|
Amortization
|
(25,652
|
)
|
(1,041
|
)
|
—
|
|
—
|
|
—
|
|
(26,693
|
)
|
|||||||||||
|
Balance, December 31, 2015
|
26,306
|
|
33,373
|
|
21,373
|
|
126,001
|
|
683,001
|
|
890,054
|
|
|||||||||||
|
Additions
|
8,480
|
|
—
|
|
—
|
|
24,200
|
|
—
|
|
32,680
|
|
|||||||||||
|
Impairments
|
—
|
|
—
|
|
—
|
|
(800
|
)
|
(23,600
|
)
|
(24,400
|
)
|
|||||||||||
|
Amortization
|
(15,324
|
)
|
(1,042
|
)
|
—
|
|
—
|
|
—
|
|
(16,366
|
)
|
|||||||||||
|
Other
|
—
|
|
—
|
|
—
|
|
(14
|
)
|
—
|
|
(14
|
)
|
|||||||||||
|
Balance, December 31, 2016
|
19,462
|
|
32,331
|
|
21,373
|
|
149,387
|
|
659,401
|
|
881,954
|
|
|||||||||||
|
Additions
|
—
|
|
—
|
|
—
|
|
—
|
|
—
|
|
—
|
|
|||||||||||
|
Purchase price adjustment
|
920
|
|
—
|
|
—
|
|
(1,800
|
)
|
—
|
|
(880
|
)
|
|||||||||||
|
Impairments
|
—
|
|
—
|
|
—
|
|
—
|
|
—
|
|
—
|
|
|||||||||||
|
Amortization
|
(14,452
|
)
|
(228
|
)
|
—
|
|
—
|
|
—
|
|
(14,680
|
)
|
|||||||||||
|
Other
|
—
|
|
(23,448
|
)
|
—
|
|
—
|
|
—
|
|
(23,448
|
)
|
|||||||||||
|
Balance, December 31, 2017
|
$
|
5,930
|
|
$
|
8,655
|
|
$
|
21,373
|
|
$
|
147,587
|
|
$
|
659,401
|
|
$
|
842,946
|
|
|||||
In March 2017, The Orleans Hotel and Casino exercised an option in its lease agreement to terminate the existing lease and purchase the land subject to the lease therefore combining the remaining unamortized favorable lease rate asset into the cost of the land asset.
76
BOYD GAMING CORPORATION AND SUBSIDIARIES
NOTES TO CONSOLIDATED FINANCIAL STATEMENTS - (Continued)
as of December 31, 2017 and 2016 and for the years ended December 31, 2017, 2016 and 2015
______________________________________________________________________________________________________
Future Amortization
Customer relationships are being amortized on an accelerated basis over an estimated life of
five
years. Favorable lease rates are being amortized on a straight-line basis over a weighted-average original useful life of
38.0 years
. Future amortization is as follows:
|
(In thousands)
|
Customer Relationships
|
Favorable Lease Rates
|
Total
|
|||||||||
|
For the year ending December 31,
|
||||||||||||
|
2018
|
$
|
2,291
|
|
$
|
228
|
|
$
|
2,519
|
|
|||
|
2019
|
1,634
|
|
228
|
|
1,862
|
|
||||||
|
2020
|
1,043
|
|
228
|
|
1,271
|
|
||||||
|
2021
|
511
|
|
228
|
|
739
|
|
||||||
|
2022
|
271
|
|
228
|
|
499
|
|
||||||
|
Thereafter
|
180
|
|
7,515
|
|
7,695
|
|
||||||
|
Total future amortization
|
$
|
5,930
|
|
$
|
8,655
|
|
$
|
14,585
|
|
|||
Trademarks and gaming license rights are not subject to amortization, as we have determined that they have an indefinite useful life; however, these assets are subject to an annual impairment test each year and between annual test dates in certain circumstances.
Impairment Considerations
As a result of our annual impairment testing in the fourth quarter of 2017, there were no impairment charges recognized.
During the year ended 2016, we recognized non-cash impairment charges of
$23.6 million
of gaming licenses and
$0.8 million
of trademarks in our Midwest and South segment. These amounts are included in impairments of assets in the consolidated statements of operations for the year ended December 31, 2016.
During the year ended 2015, we recognized non-cash impairment charges of
$17.5 million
of a gaming license in our Midwest and South segment. These amounts are included in impairments of assets in the consolidated statements of operations for the year ended December 31, 2015.
Goodwill consists of the following:
|
(In thousands)
|
Gross Carrying Value
|
Cumulative Amortization
|
Cumulative Impairment Losses
|
Goodwill, Net
|
|||||||||||
|
Goodwill, net by Reportable Segment:
|
|||||||||||||||
|
Las Vegas Locals
|
$
|
593,567
|
|
$
|
—
|
|
$
|
(165,479
|
)
|
$
|
428,088
|
|
|||
|
Downtown Las Vegas
|
6,997
|
|
(6,134
|
)
|
—
|
|
863
|
|
|||||||
|
Midwest and South
|
471,735
|
|
—
|
|
(12,462
|
)
|
459,273
|
|
|||||||
|
Balance, December 31, 2017
|
$
|
1,072,299
|
|
$
|
(6,134
|
)
|
$
|
(177,941
|
)
|
$
|
888,224
|
|
|||
Changes in Goodwill
During the year ended December 31, 2017 and 2016, we recorded
$61.7 million
and
$153.6 million
of goodwill, respectively, in our Las Vegas Locals segment related to our acquisitions of Aliante on September 27, 2016 and Cannery and Eastside Cannery on December 20, 2016 as the acquisition accounting was finalized in the current year (see Note 2,
Acquisitions and Divestitures
).
Goodwill decreased approximately
$12.5 million
during 2016 due to an impairment in the Midwest and South segment.
77
BOYD GAMING CORPORATION AND SUBSIDIARIES
NOTES TO CONSOLIDATED FINANCIAL STATEMENTS - (Continued)
as of December 31, 2017 and 2016 and for the years ended December 31, 2017, 2016 and 2015
______________________________________________________________________________________________________
The following table sets forth the changes in our goodwill, net, during the years ended December 31, 2017, 2016 and 2015.
|
(In thousands)
|
Goodwill, Net
|
|||
|
Balance, January 1, 2015
|
$
|
685,310
|
|
|
|
Additions
|
—
|
|
||
|
Impairments
|
—
|
|
||
|
Balance, December 31, 2015
|
685,310
|
|
||
|
Additions
|
153,628
|
|
||
|
Impairments
|
(12,462
|
)
|
||
|
Balance, December 31, 2016
|
826,476
|
|
||
|
Additions
|
—
|
|
||
|
Impairments
|
—
|
|
||
|
Final purchase price adjustment
|
61,748
|
|
||
|
Balance, December 31, 2017
|
$
|
888,224
|
|
|
Accrued liabilities consist of the following:
|
December 31,
|
|||||||
|
(In thousands)
|
2017
|
2016
|
|||||
|
Payroll and related expenses
|
$
|
70,724
|
|
$
|
68,102
|
|
|
|
Interest
|
19,858
|
|
33,407
|
|
|||
|
Gaming liabilities
|
55,961
|
|
41,942
|
|
|||
|
Player loyalty program liabilities
|
18,322
|
|
|
19,076
|
|
||
|
Dividends payable
|
5,632
|
|
—
|
|
|||
|
Other accrued liabilities
|
78,482
|
|
88,555
|
|
|||
|
Total accrued liabilities
|
$
|
248,979
|
|
$
|
251,082
|
|
|
Long-term debt, net of current maturities and debt issuance costs consists of the following:
|
December 31, 2017
|
||||||||||||||||||
|
Interest
|
Unamortized
|
|||||||||||||||||
|
Rates at
|
Outstanding
|
Unamortized
|
Origination
|
Long-Term
|
||||||||||||||
|
(In thousands)
|
Dec. 31, 2017
|
Principal
|
Discount
|
Fees and Costs
|
Debt, Net
|
|||||||||||||
|
Bank credit facility
|
3.882
|
%
|
$
|
1,621,054
|
|
$
|
(1,556
|
)
|
$
|
(23,795
|
)
|
$
|
1,595,703
|
|
||||
|
6.875% senior notes due 2023
|
6.875
|
%
|
750,000
|
|
—
|
|
(9,455
|
)
|
740,545
|
|
||||||||
|
6.375% senior notes due 2026
|
6.375
|
%
|
750,000
|
|
—
|
|
(10,872
|
)
|
739,128
|
|
||||||||
|
Other
|
5.800
|
%
|
504
|
|
—
|
|
—
|
|
504
|
|
||||||||
|
Total long-term debt
|
3,121,558
|
|
|
(1,556
|
)
|
|
(44,122
|
)
|
|
3,075,880
|
|
|||||||
|
Less current maturities
|
23,981
|
|
—
|
|
—
|
|
23,981
|
|
||||||||||
|
Long-term debt, net
|
$
|
3,097,577
|
|
|
$
|
(1,556
|
)
|
|
$
|
(44,122
|
)
|
|
$
|
3,051,899
|
|
|||
78
BOYD GAMING CORPORATION AND SUBSIDIARIES
NOTES TO CONSOLIDATED FINANCIAL STATEMENTS - (Continued)
as of December 31, 2017 and 2016 and for the years ended December 31, 2017, 2016 and 2015
______________________________________________________________________________________________________
|
December 31, 2016
|
||||||||||||||||||
|
Interest
|
Unamortized
|
|||||||||||||||||
|
Rates at
|
Outstanding
|
Unamortized
|
Origination
|
Long-Term
|
||||||||||||||
|
(In thousands)
|
Dec. 31, 2016
|
Principal
|
Discount
|
Fees and Costs
|
Debt, Net
|
|||||||||||||
|
Bank credit facility
|
3.440
|
%
|
$
|
1,782,538
|
|
$
|
(1,888
|
)
|
$
|
(28,503
|
)
|
$
|
1,752,147
|
|
||||
|
6.875% senior notes due 2023
|
6.875
|
%
|
750,000
|
|
—
|
|
(11,209
|
)
|
738,791
|
|
||||||||
|
6.375% senior notes due 2026
|
6.375
|
%
|
750,000
|
|
—
|
|
(12,074
|
)
|
737,926
|
|
||||||||
|
Other
|
5.800
|
%
|
591
|
|
—
|
|
—
|
|
591
|
|
||||||||
|
Total long-term debt
|
3,283,129
|
|
(1,888
|
)
|
(51,786
|
)
|
3,229,455
|
|
||||||||||
|
Less current maturities
|
30,336
|
|
—
|
|
—
|
|
30,336
|
|
||||||||||
|
Long-term debt, net
|
$
|
3,252,793
|
|
$
|
(1,888
|
)
|
$
|
(51,786
|
)
|
$
|
3,199,119
|
|
||||||
Boyd Gaming Corporation Debt
Bank Credit Facility
Credit Agreement
On March 29, 2017, the Company, as borrower, entered into Amendment No. 2 and Refinancing Amendment (the "Refinancing Amendment") with the lenders party thereto, and Bank of America, N.A. ("Bank of America"), as administrative agent. The Refinancing Amendment modifies the Third Amended and Restated Credit Agreement (as amended prior to the execution of the Refinancing Amendment, the "Existing Credit Agreement"), dated as of August 14, 2013, among the Company, certain financial institutions, and Bank of America, as administrative agent. The Refinancing Amendment modified the Existing Credit Agreement and is referred to as the "Amended Credit Agreement" (together referred to as the "Credit Facility").
The Amended Credit Agreement provides for (i) commitments to make Term B Loans in an amount equal to
$1,264.5
million (the "Refinancing Term B Loans"), with the proceeds used to refinance in full the Company’s Term B-1 Loans and Term B-2 Loans outstanding under the Existing Credit Agreement and (ii) certain other amendments to the Existing Credit Agreement. The revolving credit facility (the "Revolving Credit Facility") of
$775.0 million
and the senior secured term A loan (the "Term A Loan") of
$225.0 million
were not modified in the Refinancing Amendment.
The Refinancing Term B Loans mature on September 15, 2023 (or earlier upon occurrence or non-occurrence of certain events). The Revolving Credit Facility and the Term A Loan mature on September 15, 2021 (or earlier upon occurrence or non-occurrence of certain events).
The Credit Facility includes an accordion feature which permits an increase in the Revolving Credit Facility and the issuance and increase of senior secured term loans in an amount up to (i)
$550.0 million
, plus (ii) certain voluntary permanent reductions of the Revolving Credit Facility and certain voluntary prepayments of the senior secured term loans, plus (iii) certain reductions in the outstanding principal amounts under the term loans or the Revolving Credit Facility, plus (iv) any additional amount if, after giving effect thereto, the First Lien Leverage Ratio (as defined in the Credit Agreement) would not exceed
4.25
to
1.00
on a pro forma basis, less (v) any Incremental Equivalent Debt (as defined in the Credit Agreement), in each case, subject to the satisfaction of certain conditions.
Amounts Outstanding
The outstanding principal amounts under the Credit Facility are comprised of the following:
|
December 31,
|
|||||||
|
(In thousands)
|
2017
|
2016
|
|||||
|
Revolving Credit Facility
|
$
|
170,000
|
|
$
|
245,000
|
|
|
|
Term A Loan
|
210,938
|
|
222,188
|
|
|||
|
Refinancing Term B Loans
|
1,170,016
|
|
—
|
|
|||
|
Term B-1 Loan
|
—
|
|
271,750
|
|
|||
|
Term B-2 Loan
|
—
|
|
997,500
|
|
|||
|
Swing Loan
|
70,100
|
|
46,100
|
|
|||
|
Total outstanding principal amounts
|
$
|
1,621,054
|
|
$
|
1,782,538
|
|
|
79
BOYD GAMING CORPORATION AND SUBSIDIARIES
NOTES TO CONSOLIDATED FINANCIAL STATEMENTS - (Continued)
as of December 31, 2017 and 2016 and for the years ended December 31, 2017, 2016 and 2015
______________________________________________________________________________________________________
At
December 31, 2017
approximately
$1.6 billion
was outstanding under the Credit Facility and
$12.9 million
was allocated to support various letters of credit, leaving remaining contractual availability of
$522.0 million
.
Interest and Fees
The interest rate on the outstanding balance from time to time of the Revolving Credit Facility and the Term A Loan is based upon, at the Company’s option, either: (i) the Eurodollar rate or (ii) the base rate, in each case, plus an applicable margin. Such applicable margin is a percentage per annum determined in accordance with a specified pricing grid based on the total leverage ratio and ranges from
1.75%
to
2.75%
(if using the Eurodollar rate) and from
0.75%
to
1.75%
(if using the base rate). A fee of a percentage per annum (which ranges from
0.25%
to
0.50%
determined in accordance with a specified pricing grid based on the total leverage ratio) will be payable on the unused portions of the Revolving Credit Facility.
The interest rate on the outstanding balance of the Refinancing Term B Loans under the Amended Credit Agreement is based upon, at the Company’s option, either: (i) the Eurodollar rate or (ii) the base rate, in each case, plus an applicable margin. Such applicable margin is a percentage per annum determined in accordance with the Company’s secured leverage ratio and ranges from
2.25%
to
2.50%
(if using the Eurodollar rate) and from
1.25%
to
1.50%
(if using the base rate).
The "base rate" under the Credit Agreement remains the highest of (x) Bank of America’s publicly-announced prime rate, (y) the federal funds rate plus
0.50%
, or (z) the Eurodollar rate for a one-month period plus
1.00%
.
Optional and Mandatory Prepayments
Pursuant to the terms of the Credit Facility (i) the loans under the Term A Loan amortize in an annual amount equal to
5.00%
of the original principal amount thereof, commencing December 31, 2016, payable on a quarterly basis, (ii) the loans under the Refinancing Term B Loans amortize in an annual amount equal to
1.00%
of the original principal amount thereof, commencing June 30, 2017, payable on a quarterly basis, and (iii) beginning with the fiscal year ending December 31, 2016, the Company is required to use a portion of its annual Excess Cash Flow, as defined in the Credit Agreement, to prepay loans outstanding under the Credit Facility.
Amounts outstanding under the Refinancing Amendment may be prepaid without premium or penalty, and the commitments may be terminated without penalty, subject to certain exceptions.
Subject to certain exceptions, the Company may be required to repay the amounts outstanding under the Credit Facility in connection with certain asset sales and issuances of certain additional secured indebtedness.
Guarantees and Collateral
The Company's obligations under the Credit Facility, subject to certain exceptions, are guaranteed by certain of the Company's subsidiaries and are secured by the capital stock of certain subsidiaries. In addition, subject to certain exceptions, the Company and each of the guarantors will grant the administrative agent first priority liens and security interests on substantially all of their real and personal property (other than gaming licenses and subject to certain other exceptions) as additional security for the performance of the secured obligations under the Credit Facility.
Financial and Other Covenants
The Credit Facility contains certain financial and other covenants, including, without limitation, various covenants: (i) requiring the maintenance of a minimum consolidated interest coverage ratio
1.75
to
1.00
; (ii) establishing a maximum permitted consolidated total leverage ratio (discussed below); (iii) establishing a maximum permitted secured leverage ratio (discussed below); (iv) imposing limitations on the incurrence of indebtedness; (v) imposing limitations on transfers, sales and other dispositions; and (vi) imposing restrictions on investments, dividends and certain other payments.
The maximum permitted consolidated Total Leverage Ratio is calculated as Consolidated Funded Indebtedness to twelve-month trailing Consolidated EBITDA, as defined by the Agreement. The following table provides our maximum Total Leverage Ratio during the remaining term of the Credit Facility:
80
BOYD GAMING CORPORATION AND SUBSIDIARIES
NOTES TO CONSOLIDATED FINANCIAL STATEMENTS - (Continued)
as of December 31, 2017 and 2016 and for the years ended December 31, 2017, 2016 and 2015
______________________________________________________________________________________________________
|
Maximum Total
|
|||
|
For the Trailing Four Quarters Ending
|
Leverage Ratio
|
||
|
March 31, 2017 through December 31, 2017
|
7.00
|
to
|
1.00
|
|
March 31, 2018 through December 31, 2018
|
6.25
|
to
|
1.00
|
|
March 31, 2019 through December 31, 2019
|
6.00
|
to
|
1.00
|
|
March 31, 2020 through December 31, 2020
|
5.75
|
to
|
1.00
|
|
March 31, 2021 and thereafter
|
5.50
|
to
|
1.00
|
The maximum permitted Secured Leverage Ratio is calculated as Secured Indebtedness to twelve-month trailing Consolidated EBITDA, as defined by the Agreement. The following table provides our maximum Secured Leverage Ratio during the remaining term of the Credit Facility:
|
Maximum Secured
|
|||
|
For the Trailing Four Quarters Ending
|
Leverage Ratio
|
||
|
September 30, 2016 through December 31, 2017
|
4.50
|
to
|
1.00
|
|
March 31, 2018 through December 31, 2018
|
4.00
|
to
|
1.00
|
|
March 31, 2019 through December 31, 2019
|
3.75
|
to
|
1.00
|
|
March 31, 2020 and thereafter
|
3.50
|
to
|
1.00
|
Current Maturities of Our Indebtedness
We classified certain non-extending balances under our Credit Facility as a current maturity, as such amounts come due within the next twelve months.
Senior Notes
6.875%
Senior Notes due May 2023
On May 21, 2015, we issued
$750 million
aggregate principal amount of
6.875%
senior notes due May 2023 (the "
6.875%
Notes"). The
6.875%
Notes require semi-annual interest payments on May 15 and November 15 of each year, commencing on November 15, 2015. The
6.875%
Notes will mature on May 15, 2023 and are fully and unconditionally guaranteed, on a joint and several basis, by certain of our current and future domestic restricted subsidiaries, all of which are
100%
owned by us.
The
6.875%
Notes contain certain restrictive covenants that, subject to exceptions and qualifications, among other things, limit our ability and the ability of our restricted subsidiaries (as defined in the base and supplemental indentures governing the
6.875%
Notes, together, the "
6.875%
Indenture") to incur additional indebtedness or liens, pay dividends or make distributions or repurchase our capital stock, make certain investments, and sell or merge with other companies. In addition, upon the occurrence of a change of control (as defined in the
6.875%
Indenture), we will be required, unless certain conditions are met, to offer to repurchase the
6.875%
Notes at a price equal to
101%
of the principal amount of the
6.875%
Notes, plus accrued and unpaid interest and Additional Interest (as defined in the
6.875%
Indenture), if any, to, but not including, the date of purchase. If we sell assets or experience an event of loss, we will be required under certain circumstances to offer to purchase the
6.875%
Notes.
At any time prior to May 15, 2018, we may redeem the
6.875%
Notes, in whole or in part, at a redemption price equal to
100%
of the principal amount thereof, plus accrued and unpaid interest and Additional Interest, if any, up to, but excluding, the applicable redemption date, plus a make whole premium. After May 15, 2018, we may redeem all or a portion of the
6.875%
Notes at redemption prices (expressed as percentages of the principal amount) ranging from
105.156%
in 2018 to
100%
in 2021 and thereafter, plus accrued and unpaid interest and Additional Interest.
In conjunction with the issuance of the
6.875%
Notes, we incurred approximately
$14.0 million
in debt financing costs that have been deferred and are being amortized over the term of the
6.875%
Notes using the effective interest method.
81
BOYD GAMING CORPORATION AND SUBSIDIARIES
NOTES TO CONSOLIDATED FINANCIAL STATEMENTS - (Continued)
as of December 31, 2017 and 2016 and for the years ended December 31, 2017, 2016 and 2015
______________________________________________________________________________________________________
6.375%
Senior Notes due April 2026
On March 28, 2016, we issued
$750 million
aggregate principal amount of
6.375%
senior notes due April 2026 (the "
6.375%
Notes"). The
6.375%
Notes require semi-annual interest payments on April 1 and October 1 of each year, commencing on October 1, 2016. The
6.375%
Notes will mature on April 1, 2026 and are fully and unconditionally guaranteed, on a joint and several basis, by certain of our current and future domestic restricted subsidiaries, all of which are
100%
owned by us. Net proceeds from the
6.375%
Notes were used to pay down the outstanding amount under the Revolving Credit Facility and the balance was deposited in money market funds and classified as cash equivalents on the consolidated balance sheets.
In conjunction with the issuance of the
6.375%
Notes, we incurred approximately
$13.0 million
in debt financing costs that have been deferred and are being amortized over the term of the
6.375%
Notes using the effective interest method.
The
6.375%
Notes contain certain restrictive covenants that, subject to exceptions and qualifications, among other things, limit our ability and the ability of our restricted subsidiaries (as defined in the base and supplemental indentures governing the
6.375%
Notes, together, the "
6.375%
Indenture") to incur additional indebtedness or liens, pay dividends or make distributions or repurchase our capital stock, make certain investments, and sell or merge with other companies. In addition, upon the occurrence of a change of control (as defined in the
6.375%
Indenture), we will be required, unless certain conditions are met, to offer to repurchase the
6.375%
Notes at a price equal to
101%
of the principal amount of the
6.375%
Notes, plus accrued and unpaid interest and Additional Interest (as defined in the
6.375%
Indenture), if any, to, but not including, the date of purchase. If we sell assets or experience an event of loss, we will be required under certain circumstances to offer to purchase the
6.375%
Notes.
At any time prior to April 1, 2021, we may redeem the
6.375%
Notes, in whole or in part, at a redemption price equal to
100%
of the principal amount thereof, plus accrued and unpaid interest and Additional Interest, if any, up to, but excluding, the applicable redemption date, plus a make whole premium. After April 1, 2021, we may redeem all or a portion of the
6.375%
Notes at redemption prices (expressed as percentages of the principal amount) ranging from
103.188%
in 2021 to
100%
in 2024 and thereafter, plus accrued and unpaid interest and Additional Interest.
In connection with the private placement of the
6.375%
Notes, we entered into a registration rights agreement with the initial purchasers in which we agreed to file a registration statement with the SEC to permit the holders to exchange or resell the
6.375%
Notes. We filed the required registration statement and commenced the exchange offer during December 2016. The exchange offer was completed on February 10, 2017 and our obligations under the registration rights agreement have been fulfilled.
9.00%
Senior Notes due July 2020
On September 6, 2016 we redeemed all of our
9.00%
senior notes due July 2020 (the "
9.00%
Notes") at a redemption price of
104.50%
plus accrued and unpaid interest to the redemption date. The redemption was funded using cash on hand. As a result of this redemption, the
9.00%
Notes have been fully extinguished.
Peninsula Gaming Debt
Peninsula Credit Facility
On September 2, 2016, Peninsula repaid all of the outstanding amounts, including all principal and accrued interest amounts, under the Peninsula senior secured credit facility (the "Peninsula Credit Facility") pursuant to the Peninsula Credit Agreement. In connection with the repayment in full of the Peninsula Credit Facility (the "Repayment"), the Peninsula Credit Agreement was terminated.
8.375%
Senior Notes due February 2018
On September 2, 2016 we redeemed all of our
8.375%
senior notes due February 2018 (the "
8.375%
Notes") at a redemption price of
100.0%
plus accrued and unpaid interest to the redemption date. The redemption was funded using cash on hand. As a result of this redemption, the
8.375%
Notes have been fully extinguished.
82
BOYD GAMING CORPORATION AND SUBSIDIARIES
NOTES TO CONSOLIDATED FINANCIAL STATEMENTS - (Continued)
as of December 31, 2017 and 2016 and for the years ended December 31, 2017, 2016 and 2015
______________________________________________________________________________________________________
Loss on Early Extinguishments and Modifications of Debt
The components of the loss on early extinguishments and modifications of debt, are as follows:
|
Year Ended December 31,
|
|||||||||||
|
(In thousands)
|
2017
|
2016
|
2015
|
||||||||
|
Boyd Gaming Credit Facility deferred finance charges
|
$
|
1,086
|
|
$
|
6,629
|
|
$
|
1,978
|
|
||
|
Refinancing Amendment
|
496
|
|
—
|
|
—
|
|
|||||
|
9.00% Senior Notes premium and consent fees
|
—
|
|
15,750
|
|
—
|
|
|||||
|
9.00% Senior Notes deferred finance charges
|
—
|
|
5,976
|
|
—
|
|
|||||
|
8.375% Senior Notes deferred finance charges
|
—
|
|
4,497
|
|
—
|
|
|||||
|
9.125% Senior Notes premium and consent fees
|
—
|
|
—
|
|
23,962
|
|
|||||
|
9.125% Senior Notes deferred finance charges
|
—
|
|
—
|
|
4,888
|
|
|||||
|
HoldCo Note
|
—
|
|
—
|
|
7,819
|
|
|||||
|
Peninsula Credit Facility deferred finance charges
|
—
|
|
9,512
|
|
2,086
|
|
|||||
|
Total loss on early extinguishments and modifications of debt
|
$
|
1,582
|
|
$
|
42,364
|
|
$
|
40,733
|
|
||
Covenant Compliance
As of
December 31, 2017
, we believe that we were in compliance with the financial and other covenants of our debt instruments.
The indentures governing the notes issued by the Company contain provisions that allow for the incurrence of additional indebtedness, if after giving effect to such incurrence, the coverage ratio (as defined in the respective indentures, essentially a ratio of the Company's consolidated EBITDA to fixed charges, including interest) for the Company's trailing four quarter period on a pro forma basis would be at least
2.0
to
1.0
. Should this provision prohibit the incurrence of additional debt, the Company may still borrow under its existing credit facility. At
December 31, 2017
, the available borrowing capacity under our Credit Facility was
$522.0 million
.
Scheduled Maturities of Long-Term Debt
The scheduled maturities of long-term debt, as discussed above, are as follows:
|
(In thousands)
|
Total
|
||
|
For the year ending December 31,
|
|||
|
2018
|
$
|
23,981
|
|
|
2019
|
23,991
|
|
|
|
2020
|
23,997
|
|
|
|
2021
|
430,040
|
|
|
|
2022
|
12,758
|
|
|
|
Thereafter
|
2,606,791
|
|
|
|
Total outstanding principal of long-term debt
|
$
|
3,121,558
|
|
Deferred Tax Assets and Liabilities
Deferred tax assets and liabilities are provided to record the effects of temporary differences between the tax basis of an asset or liability and its amount as reported in our consolidated balance sheets. These temporary differences result in taxable or deductible amounts in future years.
83
BOYD GAMING CORPORATION AND SUBSIDIARIES
NOTES TO CONSOLIDATED FINANCIAL STATEMENTS - (Continued)
as of December 31, 2017 and 2016 and for the years ended December 31, 2017, 2016 and 2015
______________________________________________________________________________________________________
The components comprising our deferred tax assets and liabilities are as follows:
|
December 31,
|
|||||||
|
(In thousands)
|
2017
|
2016
|
|||||
|
Deferred tax assets
|
|||||||
|
Federal net operating loss carryforwards
|
$
|
110,350
|
|
$
|
201,978
|
|
|
|
State net operating loss carryforwards
|
45,096
|
|
38,715
|
|
|||
|
Share-based compensation
|
14,226
|
|
26,344
|
|
|||
|
Other
|
33,001
|
|
61,289
|
|
|||
|
Gross deferred tax assets
|
202,673
|
|
328,326
|
|
|||
|
Valuation allowance
|
(28,821
|
)
|
(28,402
|
)
|
|||
|
Deferred tax assets, net of valuation allowance
|
173,852
|
|
299,924
|
|
|||
|
Deferred tax liabilities
|
|||||||
|
Difference between book and tax basis of property and intangible assets
|
219,090
|
|
337,654
|
|
|||
|
State tax liability
|
34,035
|
|
31,443
|
|
|||
|
Other
|
9,802
|
|
14,807
|
|
|||
|
Gross deferred tax liabilities
|
262,927
|
|
383,904
|
|
|||
|
Deferred tax liabilities, net
|
$
|
89,075
|
|
$
|
83,980
|
|
|
At
December 31, 2017
, we have unused federal general business tax credits of approximately
$8.0 million
which may be carried forward or used until expiration beginning in 2036 and alternative minimum tax credits of
$10.4 million
which may be used or refunded through 2022. We have a federal income tax net operating loss of approximately
$525.5 million
, which may be carried forward or used until expiration beginning in 2031. We also have state income tax net operating loss carryforwards of approximately
$732.4 million
, which may be used to reduce future state income taxes. The state net operating loss carryforwards will expire in various years ranging from 2018 to 2036, if not fully utilized.
On December 22, 2017, the U.S. government enacted comprehensive tax legislation commonly referred to as the Tax Cuts and Jobs Act (the "Tax Act"). As part of our analysis of the impact of the Tax Act, we have recorded a discrete net tax benefit of
$60.1 million
in the period ending December 31, 2017. This tax benefit is due to the corporate federal tax rate reduction on our net deferred tax liability.
The SEC staff issued Staff Accounting Bulletin 118 ("SAB 118") which provides guidance on accounting for the tax effects of the Tax Act. SAB 118 provides a measurement period that should not extend beyond one year from the Tax Act enactment date for companies to complete the accounting under Accounting Standards Codification 740,
Income Taxes
("ASC 740"). In accordance with SAB 118, a company must reflect the income tax effects of those aspects of the Tax Act for which the accounting under ASC 740 is complete. To the extent a company’s accounting for certain income tax effects of the Tax Act is incomplete but it is able to determine a reasonable estimate, it must record a provisional estimate in the financial statements. If a company cannot determine a provisional estimate to be included in the financial statements it should continue to apply ASC 740 on the basis of the provisions of the tax laws that were in effect immediately before the enactment of the Tax Act. We have recorded an adjustment as a result of the Tax Act as described above. We believe our analysis to be complete and do not anticipate any material future changes to financial statements as a result of the impact of the Tax Act. If any changes are determined, we will record those as part of the measurement period.
Valuation Allowance on Deferred Tax Assets
Management assesses available positive and negative evidence to estimate if sufficient future taxable income will be generated to use the existing deferred tax assets. In evaluating our ability to recover deferred tax assets, we consider whether it is more likely than not that some portion or all of the deferred tax assets will not be realized. The ultimate realization of deferred tax assets is dependent upon scheduled reversals of deferred tax liabilities, projected future taxable income, tax-planning strategies and results of recent operations.
84
BOYD GAMING CORPORATION AND SUBSIDIARIES
NOTES TO CONSOLIDATED FINANCIAL STATEMENTS - (Continued)
as of December 31, 2017 and 2016 and for the years ended December 31, 2017, 2016 and 2015
______________________________________________________________________________________________________
As part of our review in determining the need for a valuation allowance, we assess the potential release of existing valuation allowances. In 2016, we determined that the positive evidence in favor of releasing the valuation allowance, particularly evidence that was objectively verifiable, outweighed the negative evidence. We utilize a rolling twelve quarters of pretax income adjusted for permanent book to tax differences as a measure of cumulative results in recent years. We transitioned from a cumulative loss position to a cumulative income position over the rolling twelve quarters during 2016. Other evidence considered in the analysis included, but was not limited to, a trend reflective of improvement in recent earnings, forecasts of profitability and taxable income and the reversal of existing temporary differences. The change in these conditions during 2016 provided positive evidence that supported the release of the valuation allowance against a significant portion of our deferred tax assets. As such, we concluded that it was more likely than not that the benefit from these deferred tax assets would be realized. As a result, during the year ended December 31, 2016, we released
$201.5 million
of valuation allowance on our federal and state income tax net operating loss carryforwards and other deferred tax assets. For the year ended December 31, 2017, no significant changes of evidence have occurred that would require a change to our valuation allowance position.
We have maintained a valuation allowance of
$28.8 million
against certain federal and state deferred tax assets as of December 31, 2017 due to uncertainties related to our ability to realize the tax benefits associated with these assets. In assessing the need to establish a valuation allowance, we consider, among other matters, the nature, frequency and severity of current and cumulative losses, forecasts of profitability and taxable income, the duration of statutory carryforward periods, our experience with the utilization of operating loss and tax credit carryforwards before expiration and tax planning strategies. Valuation allowances are evaluated periodically and subject to change in future reporting periods as a result of changes in the factors noted above.
Provision (Benefit) for Income Taxes
A summary of the provision (benefit) for income taxes is as follows:
|
Year Ended December 31,
|
|||||||||||
|
(In thousands)
|
2017
|
2016
|
2015
|
||||||||
|
Current
|
|||||||||||
|
Federal
|
$
|
(10,367
|
)
|
$
|
—
|
|
$
|
—
|
|
||
|
State
|
5,335
|
|
1,242
|
|
2,052
|
|
|||||
|
Total current taxes provision
|
(5,032
|
)
|
1,242
|
|
2,052
|
|
|||||
|
Deferred
|
|||||||||||
|
Federal
|
6,343
|
|
(190,207
|
)
|
(9,493
|
)
|
|||||
|
State
|
1,695
|
|
(8,521
|
)
|
807
|
|
|||||
|
Total deferred taxes benefit
|
8,038
|
|
(198,728
|
)
|
(8,686
|
)
|
|||||
|
Provision (benefit) for income taxes from continuing operations
|
$
|
3,006
|
|
$
|
(197,486
|
)
|
$
|
(6,634
|
)
|
||
|
Provision (benefit) for income taxes included on the consolidated statement of operations
|
|||||||||||
|
Provision (benefit) for income taxes from continuing operations
|
$
|
3,006
|
|
$
|
(197,486
|
)
|
$
|
(6,634
|
)
|
||
|
Provision (benefit) for income taxes from discontinued operations
|
14,855
|
|
146,379
|
|
(540
|
)
|
|||||
|
Provision (benefit) for income taxes from continuing and discontinued operations
|
$
|
17,861
|
|
$
|
(51,107
|
)
|
$
|
(7,174
|
)
|
||
Our tax provision for the year ended
December 31, 2017
was favorably impacted by the federal statutory tax rate change applied to our net deferred tax liability. Based on this revaluation, we have recorded a discrete tax benefit of
$60.1 million
.
Our tax benefit for the year ended December 31, 2016 resulted from the release of a valuation allowance on our federal and state net operating loss carryforwards and other deferred tax assets.
Our tax benefit for the year ended December 31, 2015 was favorably impacted by the partial release of the valuation allowance on our federal and state net operating losses, impairment charges to indefinite lived intangible assets which resulted in a reduction in our recognized deferred tax liability on these assets, federal and state audit settlements in connection with our IRS and New Jersey income tax examinations and, the realization of certain unrecognized tax benefits, inclusive of the reversal of related accrued interest.
85
BOYD GAMING CORPORATION AND SUBSIDIARIES
NOTES TO CONSOLIDATED FINANCIAL STATEMENTS - (Continued)
as of December 31, 2017 and 2016 and for the years ended December 31, 2017, 2016 and 2015
______________________________________________________________________________________________________
Additionally, the tax benefit in 2015 was adversely impacted by an accrual of non-cash tax expense in connection with the tax amortization of indefinite lived intangible assets that was not available to offset existing deferred tax assets. The deferred tax liabilities created by the tax amortization of these intangibles cannot be used to offset corresponding increases in the net operating loss deferred tax assets in determining our valuation allowance.
The following table provides a reconciliation between the federal statutory rate and the effective income tax rate, expressed as a percentage of income from continuing operations before income taxes:
|
Year Ended December 31,
|
||||||||
|
2017
|
2016
|
2015
|
||||||
|
Tax at federal statutory rate
|
35.0
|
%
|
35.0
|
%
|
35.0
|
%
|
||
|
Federal statutory rate change on deferred tax liability
|
(35.2
|
)%
|
—
|
%
|
—
|
%
|
||
|
State income taxes, net of federal benefit
|
2.7
|
%
|
(59.2
|
)%
|
69.2
|
%
|
||
|
Compensation-based credits
|
(1.0
|
)%
|
(21.7
|
)%
|
(60.8
|
)%
|
||
|
Valuation allowance for deferred tax assets
|
—
|
%
|
(2,448.1
|
)%
|
200.9
|
%
|
||
|
Company provided benefits
|
0.5
|
%
|
14.8
|
%
|
152.9
|
%
|
||
|
Nondeductible expenses
|
0.5
|
%
|
10.3
|
%
|
19.0
|
%
|
||
|
Tax exempt interest
|
(0.3
|
)%
|
(6.9
|
)%
|
(13.8
|
)%
|
||
|
Accrued interest on uncertain tax benefits
|
0.1
|
%
|
2.1
|
%
|
(139.7
|
)%
|
||
|
Uncertain tax benefits
|
—
|
%
|
—
|
%
|
(421.6
|
)%
|
||
|
Other, net
|
(0.5
|
)%
|
1.5
|
%
|
(4.5
|
)%
|
||
|
Effective tax rate
|
1.8
|
%
|
(2,472.2
|
)%
|
(163.4
|
)%
|
||
Status of Examinations
In January 2015, we received Joint Committee on Taxation ("Joint Committee") approval of the 2005-2009 IRS appeals settlement reached in August 2013. We received a refund of
$2.4 million
in connection with the appeals settlement. Additionally, in 2015, we received a final audit determination in connection with our New Jersey examination, effectively settling years 2003 through 2009. We received a refund of
$1.1 million
as a result of the New Jersey examination.
We generated net operating losses on our federal income tax returns for years 2011 - 2013. These returns remain subject to federal examination until the statute of limitations expires for the year in which the net operating losses are utilized.
We are also currently under examination for various state income and franchise tax matters. As it relates to our material state returns, we are subject to examination for tax years ended on or after December 31, 2001, and the statute of limitations will expire over the period September 2018 through October 2021.
We believe that we have adequately reserved for any tax liability; however, the ultimate resolution of these examinations may result in an outcome that is different than our current expectation. We do not believe the ultimate resolution of these examinations will have a material impact on our consolidated financial statements.
Other Long-Term Tax Liabilities
The impact of an uncertain income tax position taken in our income tax return is recognized at the largest amount that is more-likely-than-not to be sustained upon audit by the relevant taxing authority. An uncertain income tax position is not recognized if it has less than a 50% likelihood of being sustained. Our liability for uncertain tax positions is recorded as other long-term tax liabilities in our consolidated balance sheets.
86
BOYD GAMING CORPORATION AND SUBSIDIARIES
NOTES TO CONSOLIDATED FINANCIAL STATEMENTS - (Continued)
as of December 31, 2017 and 2016 and for the years ended December 31, 2017, 2016 and 2015
______________________________________________________________________________________________________
A reconciliation of the beginning and ending amount of unrecognized tax benefits is as follows:
|
Year Ended December 31,
|
|||||||||||
|
(In thousands)
|
2017
|
2016
|
2015
|
||||||||
|
Unrecognized tax benefit, beginning of year
|
$
|
2,482
|
|
$
|
2,482
|
|
$
|
30,198
|
|
||
|
Additions:
|
|||||||||||
|
Tax positions related to current year
|
—
|
|
—
|
|
—
|
|
|||||
|
Reductions:
|
|||||||||||
|
Tax position related to prior years
|
—
|
|
—
|
|
(27,716
|
)
|
|||||
|
Unrecognized tax benefits, end of year
|
$
|
2,482
|
|
$
|
2,482
|
|
$
|
2,482
|
|
||
Included in the
$2.5 million
balance of unrecognized tax benefits at
December 31, 2017
, are
$2.0 million
of federally tax effected benefits that, if recognized, would impact the effective tax rate. We recognize interest related to unrecognized tax benefits in our income tax provision. During the year ended
December 31, 2017
, we recognized interest and penalties of approximately
$0.1 million
in our tax provision. During the year ended December 31, 2015 we recognized interest related benefits, due to favorable settlements, of
$6.2 million
in our income tax provision. We have accrued
$1.0 million
and
$0.8 million
of interest and penalties as of
December 31, 2017
and
2016
, respectively, in our consolidated balance sheets.
During the first quarter of 2015, we received Joint Committee approval on our IRS appeals agreement, effectively settling our 2005 through 2009 examination. During the third quarter of 2015, we received a final audit determination in connection with our New Jersey examination, effectively settling years 2003 through 2009. As a result of the resolution of these audits, we reduced our unrecognized tax benefits by
$27.7 million
, of which
$19.5 million
impacted our effective tax rate. Due to the utilization of tax loss carryforwards in certain states, the statute of limitations remains open with respect to years in which the tax losses are utilized. When these years close, unrecognized tax benefits may be realized. We do not anticipate any material changes to our unrecognized tax benefits over the next twelve-month period.
Commitments
Capital Spending and Development
We continually perform on-going refurbishment and maintenance at our facilities to maintain our standards of quality. Certain of these maintenance costs are capitalized, if such improvement or refurbishment extends the life of the related asset, while other maintenance costs that do not so qualify are expensed as incurred. The commitment of capital and the related timing thereof are contingent upon, among other things, negotiation of final agreements and receipt of approvals from the appropriate regulatory bodies. We must also comply with covenants and restrictions set forth in our debt agreements.
Acquisitions
We recently announced the Penn National Purchase Agreement and Valley Forge Merger Agreement, pursuant to which we will acquire additional casino properties. See Note 2,
Acquisitions and Divestitures
, for further discussion of the commitments arising from these agreements.
Kansas Management Contract
As part of the Kansas Management Contract approved by the Kansas Racing and gaming Commission on January 11, 2011, Kansas Star committed to donate
$1.5 million
each year to support education in the local area in which Kansas Star operates for the duration of the Kansas Management Contract. We have made all distributions under this commitment as scheduled and such related expenses are recorded in Selling, general and administrative expenses on the consolidated statements of operations.
Mulvane Development Agreement
On March 7, 2011, Kansas Star entered into a Development Agreement with the City of Mulvane ("Mulvane Development Agreement") related to the provision of water, sewer, and electrical utilities to the Kansas Star site. This agreement sets forth certain parameters governing the use of public financing for the provision of such utilities, through the issuance of general obligation bonds by the City of Mulvane, paid for through the imposition of a special tax assessment on the Kansas Star site payable over
15 years
in an amount equal to the City’s full obligations under the general obligation bonds.
87
BOYD GAMING CORPORATION AND SUBSIDIARIES
NOTES TO CONSOLIDATED FINANCIAL STATEMENTS - (Continued)
as of December 31, 2017 and 2016 and for the years ended December 31, 2017, 2016 and 2015
______________________________________________________________________________________________________
All infrastructure improvements to the Kansas Star site under the Mulvane Development Agreement are complete and the City of Mulvane issued
$19.7 million
in general obligation bonds related to these infrastructure improvements. As of
December 31, 2017
and 2016, under the Mulvane Development Agreement, Kansas Star recorded
$1.7 million
at each date, which is included in accrued liabilities on the consolidated balance sheets and
$8.2 million
, net of a
$3.5 million
discount, and
$8.9 million
, net of a
$4.0 million
discount, respectively, which is recorded as a long-term obligation in other liabilities on the consolidated balance sheets. Interest costs are expensed as incurred and the discount will be amortized to interest expense over the term of the special tax assessment ending in 2028. Kansas Star's special tax assessment related to these bonds is approximately
$1.7 million
annually. Payments under the special tax assessment are secured by irrevocable letters of credit of
$5.0 million
issued by the Company in favor of the City of Mulvane, representing an amount equal to three times the annual special assessment tax imposed on Kansas Star.
Contingent Payments
In connection with securing the Kansas Management Contract, Kansas Star agreed to pay a former casino project promoter
1%
of Kansas Star’s earnings before interest expense, taxes, depreciation and amortization ("EBITDA") each month for a period of
10
years commencing December 20, 2011.
Minimum Assessment Agreement
In 2007, Diamond Jo Dubuque entered into a Minimum Assessment Agreement with the City of Dubuque (the "City"). Under the Minimum Assessment Agreement, Diamond Jo Dubuque and the City agreed to a minimum taxable value related to the new casino of
$57.9 million
. Diamond Jo Dubuque agreed to pay property taxes to the City based on the actual taxable value of the casino, but not less than the minimum taxable value. Scheduled payments of principal and interest on the City Bonds will be funded through Diamond Jo Dubuque's payment obligations under the Minimum Assessment Agreement. Diamond Jo Dubuque is also obligated to pay any shortfall should property taxes be insufficient to fund the principal and interest payments on the City Bonds.
Interest costs under the Minimum Assessment Agreement obligation are expensed as incurred. As of
December 31, 2017
and
2016
, the remaining obligation under the Minimum Assessment Agreement was
$1.9 million
at each date, which was recorded in accrued liabilities on the consolidated balance sheets and
$13.8 million
, net of a
$2.6 million
discount, and
$14.1 million
, net of a
$2.8 million
discount, respectively, which was recorded as a long-term obligation in other liabilities on the consolidated balance sheets. The discount will be amortized to interest expense over the life of the Minimum Assessment Agreement. Total minimum payments by Diamond Jo Dubuque under the Minimum Assessment Agreement are approximately
$1.9 million
per year through 2036.
Public Parking Facility Agreement
Diamond Jo Dubuque has an agreement with the City for use of the public parking facility adjacent to Diamond Jo Dubuque's casino and owned and operated by the City (the "Parking Facility Agreement"). The Parking Facility Agreement calls for: (i) the payment by the Company for the reasonable and necessary actual operating costs incurred by the City for the operation, security, repair and maintenance of the public parking facility; and (ii) the payment by the Company to the City of
$65
per parking space in the public parking facility per year, subject to annual increases based on any increase in the Consumer Price Index, which funds will be deposited into a special sinking fund and used by the City for capital expenditures necessary to maintain the public parking facility. Operating costs of the parking facility incurred by Diamond Jo Dubuque are expensed as incurred. Deposits to the sinking fund are recorded as other assets. When the sinking fund is used for capital improvements, such amounts are capitalized and amortized over their remaining useful life.
Iowa Qualified Sponsoring Organization Agreements
Diamond Jo Dubuque and Diamond Jo Worth are required to pay their respective qualified sponsoring organization, who hold a joint gaming license with Diamond Jo Dubuque and Diamond Jo Worth,
4.50%
and
5.76%
, respectively, of the casino’s adjusted gross receipts on an ongoing basis. Diamond Jo Dubuque expensed
$3.1 million
, during the year ended
December 31, 2017
and
$3.0 million
, in the year ended December 31,
2016
and
2015
, respectively, related to its agreement. Diamond Jo Worth expensed
$5.0 million
,
$4.9 million
, and
$5.0 million
during the years ended December 31, 2017, 2016, and 2015, respectively, related to its agreement. The Diamond Jo Dubuque agreement expires on December 31, 2018. Diamond Jo Dubuque has entered into an amendment to the existing operating agreement with the qualified sponsoring organization. The new agreement will go into effect on January 1, 2019 and will extend for twelve years, expiring on December 31, 2030. The agreement is subject to review and approval by the state gaming commission. The Diamond Jo Worth agreement expires on March 31, 2025, and is subject to automatic ten-year renewal periods.
88
BOYD GAMING CORPORATION AND SUBSIDIARIES
NOTES TO CONSOLIDATED FINANCIAL STATEMENTS - (Continued)
as of December 31, 2017 and 2016 and for the years ended December 31, 2017, 2016 and 2015
______________________________________________________________________________________________________
Development Agreement
In September 2011, the Company acquired the membership interests of a limited liability company (the "LLC") for a purchase price of
$24.5 million
. The primary asset of the LLC was a previously executed development agreement (the "Development Agreement") with Wilton Rancheria (the "Tribe"). The purchase price was allocated primarily to an intangible asset associated with the Company's rights under the agreement to assist the Tribe in the development and management of a gaming facility on the Tribe's land.
In July 2012, the Company and the Tribe amended and replaced the agreement with a new development agreement and a management agreement (the "Agreements"). The Agreements obligate us to fund certain pre-development costs, which are estimated to be approximately
$1 million
to
$2 million
annually, for the next several years and to assist the Tribe in its development and oversight of the gaming facility construction. Upon opening, we will manage the gaming facility. The pre-development costs funded by us are reimbursable to us with future cash flows from the operations of the gaming facility under terms of a note receivable from the Tribe.
In January 2017, the Company funded the acquisition of land that is the intended site of the Wilton Rancheria casino and, in February 2017, the land was placed into
trust by the U.S. Bureau of Indian Affairs for the benefit of the Tribe. The cost of the land will be recorded as a receivable on our consolidated balance sheet, and we expect to be reimbursed for this cost when project financing is in place. Should the project be abandoned, ownership of the land would revert to the Company.
The Agreements provide that the Company will receive future revenue for its services to the Tribe contingent upon successful development of the gaming facility and based on future net revenues at the gaming facility. In September 2017, the California State Legislature unanimously approved, and the Governor of California executed, a tribal-state gaming compact with the tribe allowing the development of the casino. With the compact now in place, we are in the process of finalizing project design and preparation and expect to begin construction mid-2018, with a construction timeline of 18 to 24 months.
Future Minimum Lease Payments and Rental Income
Future minimum lease payments required under noncancelable operating leases, which are primarily related to land leases are as follows:
|
(In thousands)
|
Lease Obligations
|
||
|
For the year ending December 31,
|
|||
|
2018
|
$
|
20,642
|
|
|
2019
|
17,826
|
|
|
|
2020
|
15,325
|
|
|
|
2021
|
14,330
|
|
|
|
2022
|
13,884
|
|
|
|
Thereafter
|
314,391
|
|
|
|
Total
|
$
|
396,398
|
|
Rent expense included in selling, general and administrative expenses on the accompanying consolidated statements of operations for the years ended
December 31, 2017
,
2016
and
2015
was
$30.3 million
,
$31.0 million
, and
$29.0 million
, respectively, and primarily relates to land leases and advertising-related expenses.
89
BOYD GAMING CORPORATION AND SUBSIDIARIES
NOTES TO CONSOLIDATED FINANCIAL STATEMENTS - (Continued)
as of December 31, 2017 and 2016 and for the years ended December 31, 2017, 2016 and 2015
______________________________________________________________________________________________________
Future minimum rental income, which is primarily related to retail and restaurant facilities located within our properties are as follows:
|
(In thousands)
|
Minimum Rental Income
|
||
|
For the year ending December 31,
|
|||
|
2018
|
$
|
3,432
|
|
|
2019
|
2,371
|
|
|
|
2020
|
1,665
|
|
|
|
2021
|
930
|
|
|
|
2022
|
771
|
|
|
|
Thereafter
|
250
|
|
|
|
Total
|
$
|
9,419
|
|
Contingencies
Legal Matters
We are parties to various legal proceedings arising in the ordinary course of business. We believe that
all pending claims, if adversely decided, would not have a material adverse effect on our business, financial position or results of operations.
Share Repurchase Program
We have in the past, and may in the future, acquire our equity securities through open market purchases, privately negotiated transactions, tender offers, exchange offers, redemptions or otherwise, upon such terms and at such prices as we may determine from time to time. In July 2008, our Board of Directors authorized an amendment to an existing share repurchase program to increase the amount of common stock that can be repurchased to
$100 million
. We are not obligated to repurchase any shares under this program. On May 2, 2017 the Company announced that its Board of Directors had reaffirmed the Company's existing share repurchase program, and
1.2 million
shares were repurchased during the year ended
December 31, 2017
. As of
December 31, 2017
,
$60.1 million
remained available under this authorization. There were no share repurchases during the years ended December 31,
2016
or
2015
.
The following table provides information regarding share repurchases during the referenced periods.
(1)
|
(In thousands, except per share data)
|
For the Year Ended December 31, 2017
|
|||
|
Shares repurchased
(2)
|
1,198
|
|
||
|
Total cost, including brokerage fees
|
$
|
31,927
|
|
|
|
Average repurchase price per share
(3)
|
$
|
26.64
|
|
|
(1)
Shares repurchased reflect repurchases settled during the twelve months ended
December 31, 2017
. These amounts exclude repurchases traded but not yet settled on or before
December 31, 2017
.
(2)
All shares repurchased have been retired and constitute authorized but unissued shares.
(3)
Figures in the table may not recalculate exactly due to rounding. Average repurchase price per share is calculated based on unrounded numbers.
Subject to applicable corporate securities laws, repurchases under our stock repurchase program may be made at such times and in such amounts as we deem appropriate. Repurchases can be discontinued at any time that we feel additional purchases are not warranted. We intend to fund the repurchases under the stock repurchase program with existing cash resources and availability under our Credit Facility. We are subject to certain limitations regarding the repurchase of common stock, such as restricted payment limitations related to our outstanding notes and our Credit Facility.
Dividends
Dividends are declared at the discretion of our Board of Directors. We are subject to certain limitations regarding the payment of dividends, such as restricted payment limitations contained in our Credit Facility and the indentures for our outstanding notes.
90
BOYD GAMING CORPORATION AND SUBSIDIARIES
NOTES TO CONSOLIDATED FINANCIAL STATEMENTS - (Continued)
as of December 31, 2017 and 2016 and for the years ended December 31, 2017, 2016 and 2015
______________________________________________________________________________________________________
On May 2, 2017, the Company announced that its Board of Directors had authorized the reinstatement of the Company’s cash dividend program. The dividends declared by the Board under this program are:
|
Declaration date
|
Record date
|
Payment date
|
Amount per share
|
|||
|
May 2, 2017
|
June 15, 2017
|
July 15, 2017
|
$0.05
|
|||
|
September 6, 2017
|
September 18, 2017
|
October 15, 2017
|
0.05
|
|||
|
December 7, 2017
|
December 28, 2017
|
January 15, 2018
|
0.05
|
|||
No dividends were declared during the years ended December 31,
2016
or
2015
.
Stock Incentive Plan
In May 2012, the Company's stockholders approved the 2012 Stock Incentive Plan (the "2012 Plan"), which amended and restated the Company's 2002 Stock Incentive Plan (the "2002 Plan") to (a) provide for a term ending
ten years
from the date of stockholder approval at the Annual Meeting, (b) increase the maximum number of shares of the Company's common stock authorized for issuance over the term of the 2012 Plan by
4 million
shares from
17 million
to
21 million
shares, (c) permit the future grant of certain equity-based awards, including awards designed to constitute performance-based compensation under Section 162(m) of the Internal Revenue Code, and (d) make certain other changes. Under our 2012 Plan, approximately
4.4 million
shares remain available for grant at
December 31, 2017
. The number of authorized but unissued shares of common stock under this 2012 Plan as of
December 31, 2017
was approximately
9.7 million
shares.
Grants made under the 2012 Plan include provisions that entitle the grantee to automatic vesting acceleration in the event of a grantee’s separation from service (including as a result of retirement, death or disability), other than for cause (as defined), after reaching the defined age and years of service thresholds. These provisions result in the accelerated recognition of the stock compensation expense for those grants issued to employees who have met the stipulated thresholds.
Stock Options
Options granted under the 2012 Plan generally become exercisable ratably over a
three
-year period from the date of grant. Options that have been granted under the 2012 Plan had an exercise price equal to the market price of our common stock on the date of grant and will expire no later than ten years after the date of grant.
91
BOYD GAMING CORPORATION AND SUBSIDIARIES
NOTES TO CONSOLIDATED FINANCIAL STATEMENTS - (Continued)
as of December 31, 2017 and 2016 and for the years ended December 31, 2017, 2016 and 2015
______________________________________________________________________________________________________
Summarized stock option plan activity is as follows:
|
Options
|
Weighted Average Option Price
|
Weighted Average Remaining Term
|
Aggregate Intrinsic Value
|
|||||||||
|
(In years)
|
(In thousands)
|
|||||||||||
|
Outstanding at January 1, 2015
|
7,169,668
|
|
$
|
25.73
|
|
|||||||
|
Granted
|
200,673
|
|
19.98
|
|
||||||||
|
Canceled
|
(1,463,497
|
)
|
39.82
|
|
||||||||
|
Exercised
|
(1,301,789
|
)
|
7.53
|
|
||||||||
|
Outstanding at December 31, 2015
|
4,605,055
|
|
26.14
|
|
||||||||
|
Granted
|
216,509
|
|
17.50
|
|
||||||||
|
Canceled
|
(1,260,750
|
)
|
38.63
|
|
||||||||
|
Exercised
|
(452,898
|
)
|
6.49
|
|
||||||||
|
Outstanding at December 31, 2016
|
3,107,916
|
|
23.36
|
|
||||||||
|
Granted
|
—
|
|
—
|
|
||||||||
|
Canceled
|
(1,323,500
|
)
|
39.30
|
|
||||||||
|
Exercised
|
(241,964
|
)
|
8.61
|
|
||||||||
|
Outstanding at December 31, 2017
|
1,542,452
|
|
$
|
11.99
|
|
5.3
|
$
|
35,565
|
|
|||
|
Exercisable at December 31, 2016
|
2,696,315
|
|
$
|
24.27
|
|
3.1
|
$
|
14,587
|
|
|||
|
Exercisable at December 31, 2017
|
1,335,717
|
|
$
|
11.00
|
|
4.8
|
$
|
32,128
|
|
|||
Share-based compensation costs related to stock option awards are calculated based on the fair value of each option grant on the date of the grant using the Black-Scholes option pricing model.
The following table summarizes the information about stock options outstanding and exercisable at
December 31, 2017
:
|
Options Outstanding
|
Options Exercisable
|
|||||||||||||||
|
Range of Exercise Prices
|
Number Outstanding
|
Weighted-Average Remaining Contractual Life (Years)
|
Weighted-Average Exercise Price
|
Number Exercisable
|
Weighted-Average Exercise Price
|
|||||||||||
|
$5.22
|
25,510
|
|
4.9
|
$
|
5.22
|
|
25,510
|
|
$
|
5.22
|
|
|||||
|
6.60
|
28,000
|
|
0.8
|
6.60
|
|
28,000
|
|
6.60
|
|
|||||||
|
6.70
|
196,869
|
|
3.9
|
6.70
|
|
196,869
|
|
6.70
|
|
|||||||
|
7.55
|
65,000
|
|
1.8
|
7.55
|
|
65,000
|
|
7.55
|
|
|||||||
|
8.34
|
294,163
|
|
2.8
|
8.34
|
|
294,163
|
|
8.34
|
|
|||||||
|
9.86
|
260,882
|
|
5.9
|
9.86
|
|
260,882
|
|
9.86
|
|
|||||||
|
11.57
|
229,846
|
|
6.2
|
11.57
|
|
229,846
|
|
11.57
|
|
|||||||
|
17.75
|
216,509
|
|
8.9
|
17.75
|
|
72,174
|
|
17.75
|
|
|||||||
|
19.98
|
200,673
|
|
7.4
|
19.98
|
|
138,273
|
|
19.98
|
|
|||||||
|
33.31
|
25,000
|
|
0.0
|
33.31
|
|
25,000
|
|
33.31
|
|
|||||||
|
$5.22-$33.31
|
1,542,452
|
|
5.3
|
$
|
11.99
|
|
1,335,717
|
|
$
|
11.00
|
|
|||||
92
BOYD GAMING CORPORATION AND SUBSIDIARIES
NOTES TO CONSOLIDATED FINANCIAL STATEMENTS - (Continued)
as of December 31, 2017 and 2016 and for the years ended December 31, 2017, 2016 and 2015
______________________________________________________________________________________________________
The total intrinsic value of in-the-money options exercised during the years ended
December 31, 2017
,
2016
and
2015
was
$3.9 million
,
$5.9 million
, and
$11.1 million
, respectively. The total fair value of options vested during the years ended
December 31, 2017
,
2016
and
2015
was approximately
$1.6 million
,
$2.0 million
, and
$1.9 million
, respectively. As of
December 31, 2017
, there was approximately
$0.2 million
of total unrecognized share-based compensation costs related to unvested stock options, which is expected to be recognized over approximately
1.4 years
, the weighted-average remaining requisite service period.
Restricted Stock Units
Our 2012 Plan provides for the grant of Restricted Stock Units ("RSUs"). An RSU is an award that may be earned in whole, or in part, upon the passage of time, and that may be settled for cash, shares, other securities or a combination thereof. The RSUs do not contain voting rights and are not entitled to dividends. The RSUs are subject to the terms and conditions contained in the applicable award agreement and the 2012 Plan. Share-based compensation costs related to RSU awards are calculated based on the market price on the date of the grant.
We annually award RSUs to certain members of our Board of Directors. Each RSU is to be paid in shares of common stock upon the member’s cessation of service to the Company. These RSUs were issued for past service; therefore, they are expensed on the date of issuance.
We also grant RSUs to members of management of the Company, which represents a contingent right to receive one share of our common stock upon vesting. An RSU generally vests on the third anniversary of its issuance and the share-based compensation expense is amortized to expense over the requisite service period.
Summarized RSU activity is as follows:
|
Restricted Stock Units
|
Weighted Average Grant Date Fair Value
|
|||
|
Outstanding at January 1, 2015
|
2,534,496
|
|
||
|
Granted
|
541,016
|
|
$19.05
|
|
|
Canceled
|
(40,800
|
)
|
||
|
Awarded
|
(713,886
|
)
|
||
|
Outstanding at December 31, 2015
|
2,320,826
|
|
||
|
Granted
|
542,220
|
|
$18.06
|
|
|
Canceled
|
(30,400
|
)
|
||
|
Awarded
|
(871,528
|
)
|
||
|
Outstanding at December 31, 2016
|
1,961,118
|
|
||
|
Granted
|
442,879
|
|
$27.40
|
|
|
Canceled
|
(38,964
|
)
|
||
|
Awarded
|
(727,821
|
)
|
||
|
Outstanding at December 31, 2017
|
1,637,212
|
|
||
As of
December 31, 2017
, there was approximately
$12.1
million of total unrecognized share-based compensation costs related to unvested RSUs, which is expected to be recognized over approximately
2.5
years.
Performance Stock Units
Our 2012 Plan provides for the grant of Performance Stock Units ("PSUs"). A PSU is an award which may be earned in whole, or in part, upon the passage of time, and the attainment of performance criteria, and which may be settled for cash, shares, other securities or a combination thereof. The PSUs do not contain voting rights and are not entitled to dividends. The PSUs are subject to the terms and conditions contained in the applicable award agreement and our 2012 Plan. We annually award PSUs to certain members of management.
Each PSU represents a contingent right to receive a share of Boyd Gaming Corporation common stock; however, the actual number of common shares awarded is dependent upon the occurrence of: (i) a requisite service period; and (ii) an evaluation of specific performance conditions. The performance conditions are based on Company metrics for net revenue growth, EBITDA growth and
93
BOYD GAMING CORPORATION AND SUBSIDIARIES
NOTES TO CONSOLIDATED FINANCIAL STATEMENTS - (Continued)
as of December 31, 2017 and 2016 and for the years ended December 31, 2017, 2016 and 2015
______________________________________________________________________________________________________
customer service scores, all of which are determined on a comprehensive annual
three
-year growth rate. Based upon actual and combined achievement, the number of shares awarded could range from
zero
, if no conditions are met, a
50%
payout if only threshold performance is achieved, a payout of
100%
for target performance, or a payout of up to
200%
of the original award for achievement of maximum performance. Each condition weighs equally and separately in determining the payout, and based upon management's estimates at the service inception date, the Company is expected to meet the target for each performance condition. Therefore, the related compensation cost of these PSUs assumes all units granted will be awarded
. Share-based compensation costs related to PSU awards are calculated based on the market price on the date of the grant.
These PSUs will vest
three years
from the service inception date,
during which time achievement of the related performance conditions is periodically evaluated, and the number of shares expected to be awarded, and resulting compensation expense, is adjusted accordingly.
Performance Shares Vesting
The PSU grants awarded in fourth quarter 2013 and 2012 vested during first quarter 2017 and 2016, respectively. Common shares were issued based on the determination by the Compensation Committee of the Board of Directors of our actual achievement of net revenue growth, EBITDA growth and customer service scores for the three-year performance period of each grant. As provided under the provisions of our stock incentive plan, certain of the participants elected to surrender a portion of the shares to be received to pay the withholding and other payroll taxes payable on the compensation resulting from the vesting of the PSUs.
The PSU grant awarded in November 2013 resulted in a total of
268,429
shares being issued during first quarter 2017, representing approximately
0.80
shares per PSU. Of the
268,429
shares issued, a total of
94,776
were surrendered by the participants for payroll taxes, resulting in a net issuance of
173,653
shares due to the vesting of the 2013 grant. The actual achievement level under the award metrics equaled the estimated performance as of year-end 2016; therefore, the vesting of the PSUs did not impact compensation costs in our 2017 consolidated statement of operations.
The PSU grant awarded in December 2012 resulted in a total of
213,365
shares being issued during first quarter 2016, representing approximately
0.59
shares per PSU. Of the
213,365
shares issued, a total of
54,338
were surrendered by the participants for payroll taxes, resulting in a net issuance of
159,027
shares due to the vesting of the 2012 grant. The actual achievement level under the award metrics equaled the estimated performance as of year-end 2015; therefore, the vesting of the PSUs did not impact compensation costs in our 2016 consolidated statement of operations.
Summarized PSU activity is as follows:
|
Performance Stock Units
|
Weighted Average Grant Date Fair Value
|
|||
|
Outstanding at January 1, 2015
|
1,411,640
|
|
||
|
Granted
|
240,156
|
|
$16.75
|
|
|
Performance Adjustment
|
264,306
|
|
||
|
Canceled
|
(2,677
|
)
|
||
|
Awarded
|
(663,945
|
)
|
||
|
Outstanding at December 31, 2015
|
1,249,480
|
|
||
|
Granted
|
241,235
|
|
$17.75
|
|
|
Performance Adjustment
|
(148,272
|
)
|
||
|
Canceled
|
—
|
|
||
|
Awarded
|
(213,365
|
)
|
||
|
Outstanding at December 31, 2016
|
1,129,078
|
|
||
|
Granted
|
275,305
|
|
$28.94
|
|
|
Performance Adjustment
|
(73,407
|
)
|
||
|
Canceled
|
—
|
|
||
|
Awarded
|
(268,429
|
)
|
||
|
Outstanding at December 31, 2017
|
1,062,547
|
|
||
94
BOYD GAMING CORPORATION AND SUBSIDIARIES
NOTES TO CONSOLIDATED FINANCIAL STATEMENTS - (Continued)
as of December 31, 2017 and 2016 and for the years ended December 31, 2017, 2016 and 2015
______________________________________________________________________________________________________
As of
December 31, 2017
, there was approximately
$6.9 million
of total unrecognized share-based compensation costs related to unvested PSUs, which is expected to be recognized over approximately
2.7 years
. Based on the current estimates of performance compared to the targets set for the respective PSU grants, the Company estimates that approximately
1.4 million
shares will be issued to settle the PSUs outstanding at
December 31, 2017
.
Career Shares
Our Career Shares Program is a stock incentive award program for certain executive officers to provide for additional capital accumulation opportunities for retirement. The program incentivizes and rewards executives for their period of service. Our Career Shares Program was adopted in December 2006, and modified in October 2010, as part of the overall update of our compensation programs. The Career Shares Program rewards eligible executives with annual grants of Boyd Gaming Corporation stock units, to be paid out at retirement. The payout at retirement is dependent upon the executive's age at such retirement and the number of years of service with the Company. Executives must be at least
55 years
old and have at least
10 years
of service to receive any payout at retirement. Career Shares do not contain voting rights and are not entitled to dividends. Career Shares are subject to the terms and conditions contained in the applicable award agreement and our 2012 Plan. The Career Share awards are tranched by specific term, in the following periods:
10 years
,
15 years
and
20 years
of service. These grants vest over the remaining period of service required to fulfill the requisite years in each of these tranches, and compensation expense is recorded in accordance with the specific vesting provisions. Share-based compensation costs related to Career Shares awards are calculated based on the market price on the date of the grant.
Summarized Career Shares activity is as follows:
|
Career Shares
|
Weighted Average Grant Date Fair Value
|
|||
|
Outstanding at January 1, 2015
|
896,585
|
|
||
|
Granted
|
103,018
|
|
$12.51
|
|
|
Canceled
|
—
|
|
||
|
Awarded
|
(31,028
|
)
|
||
|
Outstanding at December 31, 2015
|
968,575
|
|
||
|
Granted
|
73,064
|
|
$19.01
|
|
|
Canceled
|
—
|
|
||
|
Awarded
|
—
|
|
||
|
Outstanding at December 31, 2016
|
1,041,639
|
|
||
|
Granted
|
66,000
|
|
$20.41
|
|
|
Canceled
|
(11,236
|
)
|
||
|
Awarded
|
(82,944
|
)
|
||
|
Outstanding at December 31, 2017
|
1,013,459
|
|
||
As of
December 31, 2017
, there was approximately
$1.1 million
of total unrecognized share-based compensation costs related to unvested Career Shares.
Share-Based Compensation
We account for share-based awards exchanged for employee services in accordance with the authoritative accounting guidance for share-based payments. Under the guidance, share-based compensation expense is measured at the grant date, based on the estimated fair value of the award, and is recognized as expense, net of estimated forfeitures, over the employee's requisite service period.
95
BOYD GAMING CORPORATION AND SUBSIDIARIES
NOTES TO CONSOLIDATED FINANCIAL STATEMENTS - (Continued)
as of December 31, 2017 and 2016 and for the years ended December 31, 2017, 2016 and 2015
______________________________________________________________________________________________________
The following table summarizes our share-based compensation costs by award type:
|
Year Ended December 31,
|
|||||||||||
|
(In thousands)
|
2017
|
2016
|
2015
|
||||||||
|
Stock Options
|
$
|
1,193
|
|
$
|
1,974
|
|
$
|
2,821
|
|
||
|
Restricted Stock Units
|
7,463
|
|
8,883
|
|
9,909
|
|
|||||
|
Performance Stock Units
|
7,381
|
|
3,353
|
|
5,135
|
|
|||||
|
Career Shares
|
1,376
|
|
1,308
|
|
1,399
|
|
|||||
|
Total share-based compensation costs
|
$
|
17,413
|
|
$
|
15,518
|
|
$
|
19,264
|
|
||
The following table provides classification detail of the total costs related to our share-based employee compensation plans reported in our consolidated statements of operations:
|
Year Ended December 31,
|
|||||||||||
|
(In thousands)
|
2017
|
2016
|
2015
|
||||||||
|
Gaming
|
$
|
363
|
|
$
|
428
|
|
$
|
393
|
|
||
|
Food and beverage
|
69
|
|
82
|
|
75
|
|
|||||
|
Room
|
33
|
|
39
|
|
36
|
|
|||||
|
Selling, general and administrative
|
1,846
|
|
2,176
|
|
1,996
|
|
|||||
|
Corporate expense
|
15,102
|
|
12,793
|
|
16,764
|
|
|||||
|
Total share-based compensation expense
|
$
|
17,413
|
|
$
|
15,518
|
|
$
|
19,264
|
|
||
We have adopted the authoritative accounting guidance for fair value measurements, which does not determine or affect the circumstances under which fair value measurements are used, but defines fair value, expands disclosure requirements around fair value and specifies a hierarchy of valuation techniques based on whether the inputs to those valuation techniques are observable or unobservable. Observable inputs reflect market data obtained from independent sources, while unobservable inputs reflect the Company's market assumptions.
These inputs create the following fair value hierarchy:
Level 1
: Quoted prices for identical instruments in active markets.
Level 2
: Quoted prices for similar instruments in active markets; quoted prices for identical or similar instruments in markets that are not active; and model-derived valuations in which all significant inputs and significant value drivers are observable in active markets.
Level 3
: Valuations derived from valuation techniques in which one or more significant inputs or significant value drivers are unobservable.
As required by the guidance for fair value measurements, financial assets and liabilities are classified in their entirety based on the lowest level of input that is significant to the fair value measurement. Thus, assets and liabilities categorized as Level 3 may be measured at fair value using inputs that are observable (Levels 1 and 2) and unobservable (Level 3). Management's assessment of the significance of a particular input to the fair value measurement requires judgment and may affect the valuation of assets and liabilities and their placement within the fair value hierarchy levels.
96
BOYD GAMING CORPORATION AND SUBSIDIARIES
NOTES TO CONSOLIDATED FINANCIAL STATEMENTS - (Continued)
as of December 31, 2017 and 2016 and for the years ended December 31, 2017, 2016 and 2015
______________________________________________________________________________________________________
Balances Measured at Fair Value
The following tables show the fair values of certain of our financial instruments:
|
|
December 31, 2017
|
||||||||||||||
|
(In thousands)
|
Balance
|
Level 1
|
Level 2
|
Level 3
|
|||||||||||
|
Assets
|
|||||||||||||||
|
Cash and cash equivalents
|
$
|
203,104
|
|
$
|
203,104
|
|
$
|
—
|
|
$
|
—
|
|
|||
|
Restricted cash
|
24,175
|
|
24,175
|
|
—
|
|
—
|
|
|||||||
|
Investment available for sale
|
17,752
|
|
—
|
|
—
|
|
17,752
|
|
|||||||
|
Liabilities
|
|||||||||||||||
|
Contingent payments
|
$
|
2,887
|
|
$
|
—
|
|
$
|
—
|
|
$
|
2,887
|
|
|||
|
|
December 31, 2016
|
||||||||||||||
|
(In thousands)
|
Balance
|
Level 1
|
Level 2
|
Level 3
|
|||||||||||
|
Assets
|
|||||||||||||||
|
Cash and cash equivalents
|
$
|
193,862
|
|
$
|
193,862
|
|
$
|
—
|
|
$
|
—
|
|
|||
|
Restricted cash
|
16,488
|
|
16,488
|
|
—
|
|
—
|
|
|||||||
|
Investment available for sale
|
17,259
|
|
—
|
|
—
|
|
17,259
|
|
|||||||
|
Liabilities
|
|||||||||||||||
|
Contingent payments
|
$
|
3,038
|
|
$
|
—
|
|
$
|
—
|
|
$
|
3,038
|
|
|||
Cash and Cash Equivalents and Restricted Cash
The fair value of our cash and cash equivalents and restricted cash, classified in the fair value hierarchy as Level 1, is based on statements received from our banks at
December 31, 2017
and
2016
.
Investment Available for Sale
We have an investment in a single municipal bond issuance of
$20.5 million
aggregate principal amount of
7.5%
Urban Renewal Tax Increment Revenue Bonds, Taxable Series 2007 that is classified as available for sale with a maturity date of June 1, 2037. We are the only holder of this instrument and there is no quoted market price for this instrument. As such, the fair value of this investment is classified as Level 3 in the fair value hierarchy. The estimate of the fair value of such investment was determined using a combination of current market rates and estimates of market conditions for instruments with similar terms, maturities, and degrees of risk and a discounted cash flows analysis as of
December 31, 2017
and
2016
. The fair value of the investment is estimated using a discounted cash flows approach and the significant unobservable input used in the valuation as of
December 31, 2017
and
2016
is a discount rate of
9.6%
and
10.3%
, respectively. Unrealized gains and losses on this instrument resulting from changes in the fair value of the instrument are not charged to earnings, but rather are recorded as other comprehensive income (loss) in the stockholders' equity section of the consolidated balance sheets. At
December 31, 2017
and
2016
,
$0.5 million
and
$0.4 million
, respectively, of the carrying value of the investment available for sale is included as a current asset in prepaid expenses and other current assets, and at
December 31, 2017
and
2016
,
$17.3 million
and
$16.8 million
, respectively, is included in investment on the consolidated balance sheets. The discount associated with this investment of
$2.9 million
and
$3.1 million
as of
December 31, 2017
and
2016
, respectively, is netted with the investment balance and is being accreted over the life of the investment using the effective interest method. The accretion of such discount is included in interest income on the consolidated statements of operations.
Contingent Payments
In connection with securing the Kansas Management Contract, Kansas Star agreed to pay a former casino project promoter
1%
of Kansas Star’s EBITDA each month for a period of ten years commencing December 20, 2011. The liability is recorded at the estimated fair value of the contingent payments using a discounted cash flows approach and the significant unobservable input used in the valuation at
December 31, 2017
and
2016
is a discount rate of
9.2%
and
18.5%
, respectively. At
December 31, 2017
and
2016
, there was a current liability of
$0.8 million
and
$0.9 million
, respectively, related to this agreement, which was recorded
97
BOYD GAMING CORPORATION AND SUBSIDIARIES
NOTES TO CONSOLIDATED FINANCIAL STATEMENTS - (Continued)
as of December 31, 2017 and 2016 and for the years ended December 31, 2017, 2016 and 2015
______________________________________________________________________________________________________
in accrued liabilities on the respective consolidated balance sheets, and long-term obligations of
$2.1 million
and
$2.2 million
, respectively, which were included in other liabilities on the respective consolidated balance sheets.
The following tables summarize the changes in fair value of the Company’s Level 3 assets and liabilities:
|
December 31, 2017
|
|||||||
|
Assets
|
Liabilities
|
||||||
|
(In thousands)
|
Investment
Available for Sale |
Contingent
Payments
|
|||||
|
Balance at January 1, 2017
|
$
|
17,259
|
|
$
|
(3,038
|
)
|
|
|
Total gains (losses) (realized or unrealized):
|
|||||||
|
Included in interest income (expense)
|
138
|
|
(335
|
)
|
|||
|
Included in other comprehensive income (loss)
|
795
|
|
—
|
|
|||
|
Included in other items, net
|
—
|
|
(333
|
)
|
|||
|
Purchases, sales, issuances and settlements:
|
|||||||
|
Settlements
|
(440
|
)
|
819
|
|
|||
|
Balance at December 31, 2017
|
$
|
17,752
|
|
$
|
(2,887
|
)
|
|
|
December 31, 2016
|
|||||||
|
Assets
|
Liabilities
|
||||||
|
(In thousands)
|
Investment
Available for
Sale
|
Contingent
Payments
|
|||||
|
Balance at January 1, 2016
|
$
|
17,839
|
|
$
|
(3,632
|
)
|
|
|
Total gains (losses) (realized or unrealized):
|
|||||||
|
Included in interest income (expense)
|
130
|
|
(600
|
)
|
|||
|
Included in other comprehensive income (loss)
|
(299
|
)
|
—
|
|
|||
|
Included in other items, net
|
—
|
|
346
|
|
|||
|
Purchases, sales, issuances and settlements:
|
|||||||
|
Settlements
|
(411
|
)
|
848
|
|
|||
|
Balance at December 31, 2016
|
$
|
17,259
|
|
$
|
(3,038
|
)
|
|
The fair value of intangible assets, classified in the fair value hierarchy as Level 3, is utilized in performing its impairment analyses (see Note 4,
Intangible Assets
).
Balances Disclosed at Fair Value
The following tables provide the fair value measurement information about our obligation under minimum assessment agreements and other financial instruments:
|
December 31, 2017
|
|||||||||||||
|
(In thousands)
|
Outstanding Face Amount
|
Carrying Value
|
Estimated Fair Value
|
Fair Value Hierarchy
|
|||||||||
|
Liabilities
|
|||||||||||||
|
Obligation under assessment arrangements
|
$
|
31,729
|
|
$
|
25,602
|
|
$
|
26,999
|
|
Level 3
|
|||
98
BOYD GAMING CORPORATION AND SUBSIDIARIES
NOTES TO CONSOLIDATED FINANCIAL STATEMENTS - (Continued)
as of December 31, 2017 and 2016 and for the years ended December 31, 2017, 2016 and 2015
______________________________________________________________________________________________________
|
|
December 31, 2016
|
||||||||||||
|
(In thousands)
|
Outstanding Face Amount
|
Carrying Value
|
Estimated Fair Value
|
Fair Value Hierarchy
|
|||||||||
|
Liabilities
|
|||||||||||||
|
Obligation under assessment arrangements
|
$
|
33,456
|
|
$
|
26,660
|
|
$
|
27,054
|
|
Level 3
|
|||
|
Other financial instruments
|
100
|
|
97
|
|
97
|
|
Level 3
|
||||||
The following tables provide the fair value measurement information about our long-term debt:
|
|
December 31, 2017
|
||||||||||||
|
(In thousands)
|
Outstanding Face Amount
|
Carrying Value
|
Estimated Fair Value
|
Fair Value Hierarchy
|
|||||||||
|
Credit Facility
|
$
|
1,621,054
|
|
$
|
1,595,703
|
|
$
|
1,625,178
|
|
Level 2
|
|||
|
6.875% Senior Notes due 2023
|
750,000
|
|
740,545
|
|
798,750
|
|
Level 1
|
||||||
|
6.375% Senior Notes due 2026
|
750,000
|
|
739,128
|
|
810,000
|
|
Level 1
|
||||||
|
Other
|
504
|
|
504
|
|
504
|
|
Level 3
|
||||||
|
Total debt
|
$
|
3,121,558
|
|
$
|
3,075,880
|
|
$
|
3,234,432
|
|
||||
|
December 31, 2016
|
|||||||||||||
|
(In thousands)
|
Outstanding Face Amount
|
Carrying Value
|
Estimated Fair Value
|
Fair Value Hierarchy
|
|||||||||
|
Credit Facility
|
$
|
1,782,538
|
|
$
|
1,752,147
|
|
$
|
1,791,853
|
|
Level 2
|
|||
|
6.875% Senior Notes due 2023
|
750,000
|
|
738,791
|
|
806,250
|
|
Level 1
|
||||||
|
6.375% Senior Notes due 2026
|
750,000
|
|
737,926
|
|
804,375
|
|
Level 1
|
||||||
|
Other
|
591
|
|
591
|
|
591
|
|
Level 3
|
||||||
|
Total debt
|
$
|
3,283,129
|
|
$
|
3,229,455
|
|
$
|
3,403,069
|
|
||||
The estimated fair value of the Credit Facility is based on a relative value analysis performed on or about
December 31, 2017
and
December 31, 2016
. The estimated fair values of our Senior Notes are based on quoted market prices as of
December 31, 2017
and
December 31, 2016
. The other debt is a fixed-rate debt that is payable in 32 semi-annual installments, beginning in 2008. It is not traded and does not have an observable market input; therefore, we have estimated its fair value to be equal to the carrying value.
There were no transfers between Level 1, Level 2 and Level 3 measurements during the years ended
December 31, 2017
and
2016
.
We contribute to multiemployer pension defined benefit plans under terms of collective-bargaining agreements that cover our union-represented employees. Contributions, based on wages paid to covered employees, totaled approximately
$1.6 million
,
$1.5 million
and
$1.4 million
for the years ended
December 31, 2017
,
2016
and
2015
, respectively. These aggregate contributions were not individually significant to any of the respective plans. Our share of the unfunded vested liability related to multi-employer plans, if any, is not determinable and our participation is not individually significant on an individual multiemployer plan basis.
We have retirement savings plans under Section 401(k) of the Internal Revenue Code covering our non-union employees. The plans allow employees to defer up to the lesser of the Internal Revenue Code prescribed maximum amount or 100% of their income on a pre-tax basis through contributions to the plans. We expensed our voluntary contributions to the 401(k) profit-sharing plans and trusts of
$4.4 million
,
$3.9 million
and
$3.3 million
for the years ended
December 31, 2017
,
2016
and
2015
, respectively.
We have aggregated certain of our properties in order to present
three
Reportable Segments: (i) Las Vegas Locals; (ii) Downtown Las Vegas; and (iii) Midwest and South. The table in Note 1,
Summary of Significant Accounting Policies,
lists the classification of each of our properties.
99
BOYD GAMING CORPORATION AND SUBSIDIARIES
NOTES TO CONSOLIDATED FINANCIAL STATEMENTS - (Continued)
as of December 31, 2017 and 2016 and for the years ended December 31, 2017, 2016 and 2015
______________________________________________________________________________________________________
Results of Operations - Total Reportable Segment Net Revenues and Adjusted EBITDA
We evaluate each of our property's profitability based upon Property Adjusted EBITDA, which represents each property's earnings before interest expense, income taxes, depreciation and amortization, deferred rent, share-based compensation expense, project development, preopening and writedowns expenses, impairments of assets, other operating items, net, and gain or loss on early retirements of debt, as applicable. Total Reportable Segment Adjusted EBITDA is the aggregate sum of the Property Adjusted EBITDA for each of the properties included in our Las Vegas Locals, Downtown Las Vegas, and Midwest and South segments. Results for Downtown Las Vegas include the results of our Hawaii-based travel agency and captive insurance company.
We reclassify the reporting of corporate expense on the accompanying table in order to exclude it from our subtotal for Total Reportable Segment Adjusted EBITDA. Furthermore, corporate expense excludes its portion of share-based compensation expense. Corporate expense represents unallocated payroll, professional fees, aircraft expenses and various other expenses not directly related to our casino and hotel operations.
The following table sets forth, for the periods indicated, certain operating data for our Reportable Segments, and reconciles Adjusted EBITDA to operating income, as reported in our accompanying consolidated statements of operations:
|
Year Ended December 31,
|
|||||||||||
|
(In thousands)
|
2017
|
2016
|
2015
|
||||||||
|
Net Revenues
|
|||||||||||
|
Las Vegas Locals
|
$
|
858,921
|
|
$
|
647,867
|
|
$
|
610,107
|
|
||
|
Downtown Las Vegas
|
243,543
|
|
236,385
|
|
234,191
|
|
|||||
|
Midwest and South
|
1,281,243
|
|
1,299,724
|
|
1,355,134
|
|
|||||
|
Total Reportable Segment Net Revenues
|
$
|
2,383,707
|
|
$
|
2,183,976
|
|
$
|
2,199,432
|
|
||
|
Adjusted EBITDA
|
|||||||||||
|
Las Vegas Locals
|
$
|
249,943
|
|
$
|
176,420
|
|
$
|
157,312
|
|
||
|
Downtown Las Vegas
|
54,535
|
|
52,420
|
|
49,314
|
|
|||||
|
Midwest and South
|
364,193
|
|
367,365
|
|
380,942
|
|
|||||
|
Total Reportable Segment Adjusted EBITDA
|
668,671
|
|
596,205
|
|
587,568
|
|
|||||
|
Corporate expense
|
(73,046
|
)
|
(59,875
|
)
|
(60,177
|
)
|
|||||
|
Adjusted EBITDA
|
595,625
|
|
536,330
|
|
527,391
|
|
|||||
|
Other operating costs and expenses
|
|||||||||||
|
Deferred rent
|
1,267
|
|
3,266
|
|
3,428
|
|
|||||
|
Depreciation and amortization
|
217,522
|
|
196,226
|
|
207,118
|
|
|||||
|
Project development, preopening and writedowns
|
14,454
|
|
22,107
|
|
6,907
|
|
|||||
|
Share-based compensation expense
|
17,413
|
|
15,518
|
|
19,264
|
|
|||||
|
Impairments of assets
|
(426
|
)
|
38,302
|
|
18,565
|
|
|||||
|
Other operating charges, net
|
1,900
|
|
284
|
|
907
|
|
|||||
|
Total other operating costs and expenses
|
252,130
|
|
275,703
|
|
256,189
|
|
|||||
|
Operating income
|
$
|
343,495
|
|
$
|
260,627
|
|
$
|
271,202
|
|
||
100
BOYD GAMING CORPORATION AND SUBSIDIARIES
NOTES TO CONSOLIDATED FINANCIAL STATEMENTS - (Continued)
as of December 31, 2017 and 2016 and for the years ended December 31, 2017, 2016 and 2015
______________________________________________________________________________________________________
Total Assets
The Company's total assets, by Reportable Segment, consisted of the following amounts:
|
December 31,
|
|||||||
|
(In thousands)
|
2017
|
2016
|
|||||
|
Assets
|
|||||||
|
Las Vegas Locals
|
$
|
1,792,119
|
|
$
|
1,785,858
|
|
|
|
Downtown Las Vegas
|
170,574
|
|
157,319
|
|
|||
|
Midwest and South
|
2,496,957
|
|
2,556,307
|
|
|||
|
Total Reportable Segment assets
|
4,459,650
|
|
4,499,484
|
|
|||
|
Corporate
|
226,280
|
|
171,267
|
|
|||
|
Total assets
|
$
|
4,685,930
|
|
$
|
4,670,751
|
|
|
Capital Expenditures
The Company's capital expenditures by Reportable Segment, consisted of the following:
|
Year Ended December 31,
|
|||||||||||
|
(In thousands)
|
2017
|
2016
|
2015
|
||||||||
|
Capital Expenditures:
|
|||||||||||
|
Las Vegas Locals
|
$
|
59,382
|
|
$
|
42,069
|
|
$
|
41,772
|
|
||
|
Downtown Las Vegas
|
21,705
|
|
28,431
|
|
13,000
|
|
|||||
|
Midwest and South
|
37,657
|
|
73,255
|
|
60,887
|
|
|||||
|
Total Reportable Segment Capital Expenditures
|
118,744
|
|
143,755
|
|
115,659
|
|
|||||
|
Corporate
|
71,673
|
|
16,672
|
|
12,646
|
|
|||||
|
Total Capital Expenditures
|
190,417
|
|
160,427
|
|
|
128,305
|
|
||||
|
Change in Accrued Property Additions
|
47
|
|
(69
|
)
|
2,865
|
|
|||||
|
Cash-Based Capital Expenditures
|
$
|
190,464
|
|
$
|
160,358
|
|
$
|
131,170
|
|
||
The Company utilizes the Corporate entities to centralize the development of major renovation and other capital development projects that are included as construction in progress. After the project is complete, the corporate entities transfer the projects to the segment subsidiaries.
101
BOYD GAMING CORPORATION AND SUBSIDIARIES
NOTES TO CONSOLIDATED FINANCIAL STATEMENTS - (Continued)
as of December 31, 2017 and 2016 and for the years ended December 31, 2017, 2016 and 2015
______________________________________________________________________________________________________
The following table presents selected quarterly financial information:
|
Year Ended December 31, 2017
|
|||||||||||||||||||
|
(In thousands, except per share data)
|
First
|
Second
|
Third
|
Fourth
|
Year
|
||||||||||||||
|
Summary Operating Results:
|
|||||||||||||||||||
|
Net revenues
|
$
|
605,342
|
|
$
|
599,868
|
|
$
|
587,665
|
|
$
|
590,832
|
|
$
|
2,383,707
|
|
||||
|
Operating income
|
94,868
|
|
89,361
|
|
78,665
|
|
80,601
|
|
343,495
|
|
|||||||||
|
Income from continuing operations, net of tax
|
$
|
35,114
|
|
$
|
27,561
|
|
$
|
22,976
|
|
$
|
82,150
|
|
$
|
167,801
|
|
||||
|
Income from discontinued operations, net of tax
|
375
|
|
21,017
|
|
—
|
|
—
|
|
21,392
|
|
|||||||||
|
Net income
|
$
|
35,489
|
|
$
|
48,578
|
|
$
|
22,976
|
|
$
|
82,150
|
|
$
|
189,193
|
|
||||
|
Basic net income per common share:
|
|||||||||||||||||||
|
Continuing operations
|
$
|
0.31
|
|
$
|
0.24
|
|
$
|
0.20
|
|
$
|
0.72
|
|
$
|
1.46
|
|
||||
|
Discontinued operations
|
—
|
|
0.18
|
|
—
|
|
—
|
|
0.19
|
|
|||||||||
|
Basic net income per common share
|
$
|
0.31
|
|
$
|
0.42
|
|
$
|
0.20
|
|
$
|
0.72
|
|
$
|
1.65
|
|
||||
|
Diluted net income per common share:
|
|||||||||||||||||||
|
Continuing operations
|
$
|
0.31
|
|
$
|
0.24
|
|
$
|
0.20
|
|
$
|
0.71
|
|
$
|
1.45
|
|
||||
|
Discontinued operations
|
—
|
|
0.18
|
|
—
|
|
—
|
|
0.19
|
|
|||||||||
|
Diluted net income per common share
|
$
|
0.31
|
|
$
|
0.42
|
|
$
|
0.20
|
|
$
|
0.71
|
|
$
|
1.64
|
|
||||
|
Year Ended December 31, 2016
|
|||||||||||||||||||
|
(In thousands, except per share data)
|
First
|
Second
|
Third
|
Fourth
|
Year
|
||||||||||||||
|
Summary Operating Results:
|
|||||||||||||||||||
|
Net revenues
|
$
|
552,378
|
|
$
|
544,874
|
|
$
|
531,901
|
|
$
|
554,823
|
|
$
|
2,183,976
|
|
||||
|
Operating income
|
82,250
|
|
80,490
|
|
67,916
|
|
29,971
|
|
260,627
|
|
|||||||||
|
Income from continuing operations, net of tax
|
$
|
21,560
|
|
$
|
11,307
|
|
$
|
161,864
|
|
$
|
10,742
|
|
$
|
205,473
|
|
||||
|
Income from discontinued operations, net of tax
|
11,630
|
|
18,715
|
|
180,707
|
|
1,478
|
|
212,530
|
|
|||||||||
|
Net income
|
$
|
33,190
|
|
$
|
30,022
|
|
$
|
342,571
|
|
$
|
12,220
|
|
$
|
418,003
|
|
||||
|
Basic net income per common share:
|
|||||||||||||||||||
|
Continuing operations
|
$
|
0.19
|
|
$
|
0.10
|
|
$
|
1.41
|
|
$
|
0.10
|
|
$
|
1.79
|
|
||||
|
Discontinued operations
|
0.10
|
|
0.16
|
|
1.58
|
|
0.01
|
|
1.86
|
|
|||||||||
|
Basic net income per common share
|
$
|
0.29
|
|
$
|
0.26
|
|
$
|
2.99
|
|
$
|
0.11
|
|
$
|
3.65
|
|
||||
|
Diluted net income per common share:
|
|||||||||||||||||||
|
Continuing operations
|
$
|
0.19
|
|
$
|
0.10
|
|
$
|
1.40
|
|
$
|
0.10
|
|
$
|
1.78
|
|
||||
|
Discontinued operations
|
0.10
|
|
0.16
|
|
1.57
|
|
0.01
|
|
1.85
|
|
|||||||||
|
Diluted net income per common share
|
$
|
0.29
|
|
$
|
0.26
|
|
$
|
2.97
|
|
$
|
0.11
|
|
$
|
3.63
|
|
||||
Separate condensed consolidating financial information for our subsidiary guarantors and non-guarantors of our
6.875%
Notes and our
6.375%
Notes is presented below. Each of these notes is fully and unconditionally guaranteed, on a joint and several basis, by certain of our current and future domestic restricted subsidiaries, all of which are
100%
owned by us. The non-guarantors primarily represent our special purpose entities, tax holding companies, our less significant operating subsidiaries and our less than wholly owned subsidiaries.
102
BOYD GAMING CORPORATION AND SUBSIDIARIES
NOTES TO CONSOLIDATED FINANCIAL STATEMENTS - (Continued)
as of December 31, 2017 and 2016 and for the years ended December 31, 2017, 2016 and 2015
______________________________________________________________________________________________________
On March 7, 2017, Aliante, Cannery and Eastside Cannery became guarantors of the
6.875%
Notes, the
6.375%
Notes and the Credit Facility.
The tables below present the condensed consolidating balance sheets as of
December 31, 2017
, and
2016
, the condensed consolidating statements of operations for the years ended
December 31, 2017
,
2016
and
2015
and the condensed consolidating statements of cash flows for the years ended
December 31, 2017
,
2016
and
2015
. We have reclassified certain prior year amounts in the current year presentation to reflect the designation of the additional Restricted Subsidiaries listed above as subsidiary guarantors.
Condensed Consolidating Balance Sheets
|
December 31, 2017
|
|||||||||||||||||||||||
|
Non-
|
Non-
|
||||||||||||||||||||||
|
Guarantor
|
Guarantor
|
||||||||||||||||||||||
|
Subsidiaries
|
Subsidiaries
|
||||||||||||||||||||||
|
Guarantor
|
(100%
|
(Not 100%
|
|||||||||||||||||||||
|
(In thousands)
|
Parent
|
Subsidiaries
|
Owned)
|
Owned)
|
Eliminations
|
Consolidated
|
|||||||||||||||||
|
Assets
|
|||||||||||||||||||||||
|
Cash and cash equivalents
|
$
|
347
|
|
$
|
199,574
|
|
$
|
3,183
|
|
$
|
—
|
|
$
|
—
|
|
$
|
203,104
|
|
|||||
|
Other current assets
|
78,226
|
|
35,310
|
|
12,568
|
|
—
|
|
(545
|
)
|
125,559
|
|
|||||||||||
|
Property and equipment, net
|
88,464
|
|
2,424,361
|
|
26,961
|
|
—
|
|
—
|
|
2,539,786
|
|
|||||||||||
|
Investments in subsidiaries
|
4,917,341
|
|
—
|
|
18,097
|
|
—
|
|
(4,935,438
|
)
|
—
|
|
|||||||||||
|
Intercompany receivable
|
—
|
|
1,934,559
|
|
—
|
|
—
|
|
(1,934,559
|
)
|
—
|
|
|||||||||||
|
Other assets, net
|
14,725
|
|
33,369
|
|
38,217
|
|
—
|
|
—
|
|
86,311
|
|
|||||||||||
|
Intangible assets, net
|
—
|
|
818,887
|
|
24,059
|
|
—
|
|
—
|
|
842,946
|
|
|||||||||||
|
Goodwill, net
|
—
|
|
887,442
|
|
782
|
|
—
|
|
—
|
|
888,224
|
|
|||||||||||
|
Total assets
|
$
|
5,099,103
|
|
$
|
6,333,502
|
|
$
|
123,867
|
|
$
|
—
|
|
$
|
(6,870,542
|
)
|
$
|
4,685,930
|
|
|||||
|
Liabilities and Stockholders' Equity
|
|||||||||||||||||||||||
|
Current maturities of long-term debt
|
$
|
23,895
|
|
$
|
86
|
|
$
|
—
|
|
$
|
—
|
|
$
|
—
|
|
$
|
23,981
|
|
|||||
|
Other current liabilities
|
130,030
|
|
205,994
|
|
19,563
|
|
—
|
|
(264
|
)
|
355,323
|
|
|||||||||||
|
Accumulated losses of subsidiaries in excess of investment
|
—
|
|
73,130
|
|
—
|
|
—
|
|
(73,130
|
)
|
—
|
|
|||||||||||
|
Intercompany payable
|
888,444
|
|
—
|
|
1,046,114
|
|
—
|
|
(1,934,558
|
)
|
—
|
|
|||||||||||
|
Long-term debt, net of current maturities and debt issuance costs
|
3,051,481
|
|
418
|
|
—
|
|
—
|
|
—
|
|
3,051,899
|
|
|||||||||||
|
Other long-term liabilities
|
(95,723
|
)
|
259,902
|
|
(10,428
|
)
|
—
|
|
—
|
|
153,751
|
|
|||||||||||
|
Total stockholders' equity (deficit)
|
1,100,976
|
|
5,793,972
|
|
(931,382
|
)
|
—
|
|
(4,862,590
|
)
|
1,100,976
|
|
|||||||||||
|
Total liabilities and stockholders' equity
|
$
|
5,099,103
|
|
$
|
6,333,502
|
|
$
|
123,867
|
|
$
|
—
|
|
$
|
(6,870,542
|
)
|
$
|
4,685,930
|
|
|||||
103
BOYD GAMING CORPORATION AND SUBSIDIARIES
NOTES TO CONSOLIDATED FINANCIAL STATEMENTS - (Continued)
as of December 31, 2017 and 2016 and for the years ended December 31, 2017, 2016 and 2015
______________________________________________________________________________________________________
Condensed Consolidating Balance Sheets - continued
|
December 31, 2016
|
|||||||||||||||||||||||
|
Non-
|
Non-
|
||||||||||||||||||||||
|
Guarantor
|
Guarantor
|
||||||||||||||||||||||
|
Subsidiaries
|
Subsidiaries
|
||||||||||||||||||||||
|
Guarantor
|
(100%
|
(Not 100%
|
|||||||||||||||||||||
|
(In thousands)
|
Parent
|
Subsidiaries
|
Owned)
|
Owned)
|
Eliminations
|
Consolidated
|
|||||||||||||||||
|
Assets
|
|||||||||||||||||||||||
|
Cash and cash equivalents
|
$
|
1,212
|
|
$
|
189,364
|
|
$
|
3,286
|
|
$
|
—
|
|
$
|
—
|
|
$
|
193,862
|
|
|||||
|
Other current assets
|
78,915
|
|
26,715
|
|
8,908
|
|
—
|
|
(453
|
)
|
114,085
|
|
|||||||||||
|
Property and equipment, net
|
73,180
|
|
2,503,127
|
|
28,862
|
|
—
|
|
—
|
|
2,605,169
|
|
|||||||||||
|
Investments in subsidiaries
|
4,505,897
|
|
139,465
|
|
—
|
|
—
|
|
(4,645,362
|
)
|
—
|
|
|||||||||||
|
Intercompany receivable
|
—
|
|
1,491,017
|
|
—
|
|
—
|
|
(1,491,017
|
)
|
—
|
|
|||||||||||
|
Other assets, net
|
13,598
|
|
31,899
|
|
3,708
|
|
—
|
|
—
|
|
49,205
|
|
|||||||||||
|
Intangible assets, net
|
—
|
|
857,894
|
|
24,060
|
|
—
|
|
—
|
|
881,954
|
|
|||||||||||
|
Goodwill, net
|
—
|
|
825,694
|
|
782
|
|
—
|
|
—
|
|
826,476
|
|
|||||||||||
|
Total assets
|
$
|
4,672,802
|
|
$
|
6,065,175
|
|
$
|
69,606
|
|
$
|
—
|
|
$
|
(6,136,832
|
)
|
$
|
4,670,751
|
|
|||||
|
Liabilities and Stockholders' Equity
|
|||||||||||||||||||||||
|
Current maturities of long-term debt
|
$
|
30,250
|
|
$
|
86
|
|
$
|
—
|
|
$
|
—
|
|
$
|
—
|
|
$
|
30,336
|
|
|||||
|
Other current liabilities
|
93,762
|
|
196,391
|
|
46,444
|
|
—
|
|
(1,429
|
)
|
335,168
|
|
|||||||||||
|
Accumulated losses of subsidiaries in excess of investment
|
—
|
|
—
|
|
8,257
|
|
—
|
|
(8,257
|
)
|
—
|
|
|||||||||||
|
Intercompany payable
|
521,002
|
|
—
|
|
968,811
|
|
254
|
|
(1,490,067
|
)
|
—
|
|
|||||||||||
|
Long-term debt, net of current maturities and debt issuance costs
|
3,198,613
|
|
506
|
|
—
|
|
—
|
|
—
|
|
3,199,119
|
|
|||||||||||
|
Other long-term liabilities
|
(104,901
|
)
|
298,624
|
|
(21,721
|
)
|
—
|
|
—
|
|
172,002
|
|
|||||||||||
|
|
|
||||||||||||||||||||||
|
Boyd Gaming Corporation stockholders' equity (deficit)
|
934,076
|
|
5,569,568
|
|
(932,185
|
)
|
(254
|
)
|
(4,637,129
|
)
|
934,076
|
|
|||||||||||
|
Noncontrolling interest
|
—
|
|
—
|
|
—
|
|
—
|
|
50
|
|
50
|
|
|||||||||||
|
Total stockholders' equity (deficit)
|
934,076
|
|
5,569,568
|
|
(932,185
|
)
|
(254
|
)
|
(4,637,079
|
)
|
934,126
|
|
|||||||||||
|
Total liabilities and stockholders' equity
|
$
|
4,672,802
|
|
$
|
6,065,175
|
|
$
|
69,606
|
|
$
|
—
|
|
$
|
(6,136,832
|
)
|
$
|
4,670,751
|
|
|||||
104
BOYD GAMING CORPORATION AND SUBSIDIARIES
NOTES TO CONSOLIDATED FINANCIAL STATEMENTS - (Continued)
as of December 31, 2017 and 2016 and for the years ended December 31, 2017, 2016 and 2015
______________________________________________________________________________________________________
Condensed Consolidating Statements of Operations
|
Year Ended December 31, 2017
|
|||||||||||||||||||||||
|
Non-
|
Non-
|
||||||||||||||||||||||
|
Guarantor
|
Guarantor
|
||||||||||||||||||||||
|
Subsidiaries
|
Subsidiaries
|
||||||||||||||||||||||
|
Guarantor
|
(100%
|
(Not 100%
|
|||||||||||||||||||||
|
(In thousands)
|
Parent
|
Subsidiaries
|
Owned)
|
Owned)
|
Eliminations
|
Consolidated
|
|||||||||||||||||
|
Net revenues
|
$
|
73,292
|
|
$
|
2,355,385
|
|
$
|
47,687
|
|
$
|
—
|
|
$
|
(92,657
|
)
|
$
|
2,383,707
|
|
|||||
|
Operating costs and expenses
|
|||||||||||||||||||||||
|
Operating
|
—
|
|
1,203,933
|
|
43,182
|
|
—
|
|
—
|
|
1,247,115
|
|
|||||||||||
|
Selling, general and administrative
|
44
|
|
354,423
|
|
7,612
|
|
—
|
|
(42
|
)
|
362,037
|
|
|||||||||||
|
Maintenance and utilities
|
—
|
|
108,092
|
|
1,370
|
|
—
|
|
—
|
|
109,462
|
|
|||||||||||
|
Depreciation and amortization
|
12,041
|
|
201,401
|
|
4,080
|
|
—
|
|
—
|
|
217,522
|
|
|||||||||||
|
Corporate expense
|
85,362
|
|
1,140
|
|
1,646
|
|
—
|
|
—
|
|
88,148
|
|
|||||||||||
|
Project development, preopening and writedowns
|
7,806
|
|
2,912
|
|
3,736
|
|
—
|
|
—
|
|
14,454
|
|
|||||||||||
|
Impairments of assets
|
600
|
|
1
|
|
(1,027
|
)
|
—
|
|
—
|
|
(426
|
)
|
|||||||||||
|
Other operating items, net
|
725
|
|
1,175
|
|
—
|
|
—
|
|
—
|
|
1,900
|
|
|||||||||||
|
Intercompany expenses
|
1,204
|
|
91,411
|
|
—
|
|
—
|
|
(92,615
|
)
|
—
|
|
|||||||||||
|
Total operating costs and expenses
|
107,782
|
|
1,964,488
|
|
60,599
|
|
—
|
|
(92,657
|
)
|
2,040,212
|
|
|||||||||||
|
Equity in earnings (losses) of subsidiaries
|
330,514
|
|
(1,374
|
)
|
—
|
|
—
|
|
(329,140
|
)
|
—
|
|
|||||||||||
|
Operating income (loss)
|
296,024
|
|
389,523
|
|
(12,912
|
)
|
—
|
|
(329,140
|
)
|
343,495
|
|
|||||||||||
|
Other expense (income)
|
|||||||||||||||||||||||
|
Interest expense, net
|
169,990
|
|
1,275
|
|
25
|
|
—
|
|
—
|
|
171,290
|
|
|||||||||||
|
Loss on early extinguishments and modifications of debt
|
1,582
|
|
—
|
|
—
|
|
—
|
|
—
|
|
1,582
|
|
|||||||||||
|
Other, net
|
(16
|
)
|
(98
|
)
|
(70
|
)
|
—
|
|
—
|
|
(184
|
)
|
|||||||||||
|
Total other expense, net
|
171,556
|
|
1,177
|
|
(45
|
)
|
—
|
|
—
|
|
172,688
|
|
|||||||||||
|
Income (loss) from continuing operations before income taxes
|
124,468
|
|
388,346
|
|
(12,867
|
)
|
—
|
|
(329,140
|
)
|
170,807
|
|
|||||||||||
|
Income tax benefit (provision)
|
64,725
|
|
(73,317
|
)
|
5,586
|
|
—
|
|
—
|
|
(3,006
|
)
|
|||||||||||
|
Income (loss) from continuing operations, net of tax
|
189,193
|
|
315,029
|
|
(7,281
|
)
|
—
|
|
(329,140
|
)
|
167,801
|
|
|||||||||||
|
Income from discontinued operations, net of tax
|
—
|
|
21,392
|
|
—
|
|
—
|
|
—
|
|
21,392
|
|
|||||||||||
|
Net income (loss)
|
$
|
189,193
|
|
$
|
336,421
|
|
$
|
(7,281
|
)
|
$
|
—
|
|
$
|
(329,140
|
)
|
$
|
189,193
|
|
|||||
|
Comprehensive income (loss)
|
$
|
189,626
|
|
$
|
336,854
|
|
$
|
(7,281
|
)
|
$
|
—
|
|
$
|
(329,573
|
)
|
$
|
189,626
|
|
|||||
105
BOYD GAMING CORPORATION AND SUBSIDIARIES
NOTES TO CONSOLIDATED FINANCIAL STATEMENTS - (Continued)
as of December 31, 2017 and 2016 and for the years ended December 31, 2017, 2016 and 2015
______________________________________________________________________________________________________
Condensed Consolidating Statements of Operations - continued
|
Year Ended December 31, 2016
|
|||||||||||||||||||||||
|
Non-
|
Non-
|
||||||||||||||||||||||
|
Guarantor
|
Guarantor
|
||||||||||||||||||||||
|
Subsidiaries
|
Subsidiaries
|
||||||||||||||||||||||
|
Guarantor
|
(100%
|
(Not 100%
|
|||||||||||||||||||||
|
(In thousands)
|
Parent
|
Subsidiaries
|
Owned)
|
Owned)
|
Eliminations
|
Consolidated
|
|||||||||||||||||
|
Net revenues
|
$
|
121,939
|
|
$
|
2,156,241
|
|
$
|
49,131
|
|
$
|
—
|
|
$
|
(143,335
|
)
|
$
|
2,183,976
|
|
|||||
|
Operating costs and expenses
|
|||||||||||||||||||||||
|
Operating
|
1,200
|
|
1,127,654
|
|
42,879
|
|
—
|
|
—
|
|
1,171,733
|
|
|||||||||||
|
Selling, general and administrative
|
49,938
|
|
265,485
|
|
6,584
|
|
—
|
|
2
|
|
322,009
|
|
|||||||||||
|
Maintenance and utilities
|
—
|
|
98,741
|
|
1,279
|
|
—
|
|
—
|
|
100,020
|
|
|||||||||||
|
Depreciation and amortization
|
8,767
|
|
183,531
|
|
3,928
|
|
—
|
|
—
|
|
196,226
|
|
|||||||||||
|
Corporate expense
|
66,703
|
|
1,738
|
|
4,227
|
|
—
|
|
—
|
|
72,668
|
|
|||||||||||
|
Project development, preopening and writedowns
|
18,079
|
|
(3,292
|
)
|
7,320
|
|
—
|
|
—
|
|
22,107
|
|
|||||||||||
|
Impairments of assets
|
1,440
|
|
36,862
|
|
—
|
|
—
|
|
—
|
|
38,302
|
|
|||||||||||
|
Other operating items, net
|
181
|
|
103
|
|
—
|
|
—
|
|
—
|
|
284
|
|
|||||||||||
|
Intercompany expenses
|
1,205
|
|
140,671
|
|
1,461
|
|
—
|
|
(143,337
|
)
|
—
|
|
|||||||||||
|
Total operating costs and expenses
|
147,513
|
|
1,851,493
|
|
67,678
|
|
—
|
|
(143,335
|
)
|
1,923,349
|
|
|||||||||||
|
Equity in earnings (losses) of subsidiaries
|
442,902
|
|
(2,039
|
)
|
—
|
|
—
|
|
(440,863
|
)
|
—
|
|
|||||||||||
|
Operating income (loss)
|
417,328
|
|
302,709
|
|
(18,547
|
)
|
—
|
|
(440,863
|
)
|
260,627
|
|
|||||||||||
|
Other expense (income)
|
|||||||||||||||||||||||
|
Interest expense, net
|
157,923
|
|
51,783
|
|
25
|
|
—
|
|
—
|
|
209,731
|
|
|||||||||||
|
Loss on early extinguishments of debt
|
28,356
|
|
14,008
|
|
—
|
|
—
|
|
—
|
|
42,364
|
|
|||||||||||
|
Other, net
|
1
|
|
617
|
|
(73
|
)
|
—
|
|
—
|
|
545
|
|
|||||||||||
|
Total other expense (income), net
|
186,280
|
|
66,408
|
|
(48
|
)
|
—
|
|
—
|
|
252,640
|
|
|||||||||||
|
Income (loss) from continuing operations before income taxes
|
231,048
|
|
236,301
|
|
(18,499
|
)
|
—
|
|
(440,863
|
)
|
7,987
|
|
|||||||||||
|
Income tax benefit
|
186,955
|
|
10,405
|
|
126
|
|
—
|
|
—
|
|
197,486
|
|
|||||||||||
|
Income (loss) from continuing operations, net of tax
|
418,003
|
|
246,706
|
|
(18,373
|
)
|
—
|
|
(440,863
|
)
|
205,473
|
|
|||||||||||
|
Income from discontinued operations, net of tax
|
—
|
|
212,530
|
|
—
|
|
—
|
|
—
|
|
212,530
|
|
|||||||||||
|
Net income (loss)
|
$
|
418,003
|
|
$
|
459,236
|
|
$
|
(18,373
|
)
|
$
|
—
|
|
$
|
(440,863
|
)
|
$
|
418,003
|
|
|||||
|
Comprehensive income (loss)
|
$
|
417,704
|
|
$
|
458,937
|
|
$
|
(18,373
|
)
|
$
|
—
|
|
$
|
(440,564
|
)
|
$
|
417,704
|
|
|||||
106
BOYD GAMING CORPORATION AND SUBSIDIARIES
NOTES TO CONSOLIDATED FINANCIAL STATEMENTS - (Continued)
as of December 31, 2017 and 2016 and for the years ended December 31, 2017, 2016 and 2015
______________________________________________________________________________________________________
Consolidating Statements of Operations - continued
|
Year Ended December 31, 2015
|
|||||||||||||||||||||||
|
Non-
|
Non-
|
||||||||||||||||||||||
|
Guarantor
|
Guarantor
|
||||||||||||||||||||||
|
Subsidiaries
|
Subsidiaries
|
||||||||||||||||||||||
|
Guarantor
|
(100%
|
(Not 100%
|
|||||||||||||||||||||
|
(In thousands)
|
Parent
|
Subsidiaries
|
Owned)
|
Owned)
|
Eliminations
|
Consolidated
|
|||||||||||||||||
|
Net revenues
|
$
|
121,541
|
|
$
|
2,173,147
|
|
$
|
48,353
|
|
$
|
—
|
|
$
|
(143,609
|
)
|
$
|
2,199,432
|
|
|||||
|
Operating costs and expenses
|
|||||||||||||||||||||||
|
Operating
|
1,800
|
|
1,145,181
|
|
43,843
|
|
—
|
|
—
|
|
1,190,824
|
|
|||||||||||
|
Selling, general and administrative
|
48,173
|
|
267,661
|
|
6,604
|
|
—
|
|
(18
|
)
|
322,420
|
|
|||||||||||
|
Maintenance and utilities
|
—
|
|
103,086
|
|
1,462
|
|
—
|
|
—
|
|
104,548
|
|
|||||||||||
|
Depreciation and amortization
|
6,179
|
|
196,865
|
|
4,074
|
|
—
|
|
—
|
|
207,118
|
|
|||||||||||
|
Corporate expense
|
71,700
|
|
1,781
|
|
3,460
|
|
—
|
|
—
|
|
76,941
|
|
|||||||||||
|
Project development, preopening and writedowns
|
884
|
|
2,351
|
|
3,596
|
|
76
|
|
—
|
|
6,907
|
|
|||||||||||
|
Impairments of assets
|
—
|
|
17,500
|
|
1,065
|
|
—
|
|
—
|
|
18,565
|
|
|||||||||||
|
Other operating items, net
|
599
|
|
308
|
|
—
|
|
—
|
|
—
|
|
907
|
|
|||||||||||
|
Intercompany expenses
|
1,204
|
|
140,971
|
|
1,416
|
|
—
|
|
(143,591
|
)
|
—
|
|
|||||||||||
|
Total operating costs and expenses
|
130,539
|
|
1,875,704
|
|
65,520
|
|
76
|
|
(143,609
|
)
|
1,928,230
|
|
|||||||||||
|
Equity in earnings (losses) of subsidiaries
|
190,570
|
|
(2,204
|
)
|
(76
|
)
|
—
|
|
(188,290
|
)
|
—
|
|
|||||||||||
|
Operating income (loss)
|
181,572
|
|
295,239
|
|
(17,243
|
)
|
(76
|
)
|
(188,290
|
)
|
271,202
|
|
|||||||||||
|
Other expense
|
|||||||||||||||||||||||
|
Interest expense, net
|
125,890
|
|
96,818
|
|
24
|
|
—
|
|
—
|
|
222,732
|
|
|||||||||||
|
Loss on early extinguishments of debt
|
30,829
|
|
9,904
|
|
—
|
|
—
|
|
—
|
|
40,733
|
|
|||||||||||
|
Other, net
|
396
|
|
2,959
|
|
321
|
|
—
|
|
—
|
|
3,676
|
|
|||||||||||
|
Total other expense, net
|
157,115
|
|
109,681
|
|
345
|
|
—
|
|
—
|
|
267,141
|
|
|||||||||||
|
Income (loss) from continuing operations before income taxes
|
24,457
|
|
185,558
|
|
(17,588
|
)
|
(76
|
)
|
(188,290
|
)
|
4,061
|
|
|||||||||||
|
Income tax benefit (provision)
|
22,777
|
|
(16,089
|
)
|
(54
|
)
|
—
|
|
—
|
|
6,634
|
|
|||||||||||
|
Income (loss) from continuing operations, net of tax
|
47,234
|
|
169,469
|
|
(17,642
|
)
|
(76
|
)
|
(188,290
|
)
|
10,695
|
|
|||||||||||
|
Income from discontinued operations, net of tax
|
—
|
|
36,539
|
|
—
|
|
—
|
|
—
|
|
36,539
|
|
|||||||||||
|
Net income (loss)
|
$
|
47,234
|
|
$
|
206,008
|
|
$
|
(17,642
|
)
|
$
|
(76
|
)
|
$
|
(188,290
|
)
|
$
|
47,234
|
|
|||||
|
Comprehensive income (loss)
|
$
|
46,971
|
|
$
|
205,745
|
|
$
|
(17,642
|
)
|
$
|
(76
|
)
|
$
|
(188,027
|
)
|
$
|
46,971
|
|
|||||
107
BOYD GAMING CORPORATION AND SUBSIDIARIES
NOTES TO CONSOLIDATED FINANCIAL STATEMENTS - (Continued)
as of December 31, 2017 and 2016 and for the years ended December 31, 2017, 2016 and 2015
______________________________________________________________________________________________________
Condensed Consolidating Statements of Cash Flows
|
Year Ended December 31, 2017
|
|||||||||||||||||||||||
|
Non-
|
Non-
|
||||||||||||||||||||||
|
Guarantor
|
Guarantor
|
||||||||||||||||||||||
|
Subsidiaries
|
Subsidiaries
|
||||||||||||||||||||||
|
Guarantor
|
(100%
|
(Not 100%
|
|||||||||||||||||||||
|
(In thousands)
|
Parent
|
Subsidiaries
|
Owned)
|
Owned)
|
Eliminations
|
Consolidated
|
|||||||||||||||||
|
Cash flows from operating activities
|
|||||||||||||||||||||||
|
Net cash from operating activities
|
$
|
(82,632
|
)
|
$
|
515,465
|
|
$
|
(19,172
|
)
|
$
|
254
|
|
$
|
949
|
|
$
|
414,864
|
|
|||||
|
Cash flows from investing activities
|
|||||||||||||||||||||||
|
Capital expenditures
|
(102,277
|
)
|
(87,590
|
)
|
(597
|
)
|
—
|
|
—
|
|
(190,464
|
)
|
|||||||||||
|
Cash paid for acquisitions, net of cash received
|
(1,153
|
)
|
—
|
|
—
|
|
—
|
|
—
|
|
(1,153
|
)
|
|||||||||||
|
Net activity with affiliates
|
—
|
|
(443,542
|
)
|
—
|
|
—
|
|
443,542
|
|
—
|
|
|||||||||||
|
Distributions from subsidiary
|
10,867
|
|
—
|
|
—
|
|
—
|
|
(10,867
|
)
|
—
|
|
|||||||||||
|
Advances pursuant to development agreement
|
—
|
|
—
|
|
(35,108
|
)
|
—
|
|
—
|
|
(35,108
|
)
|
|||||||||||
|
Other investing activities
|
—
|
|
706
|
|
—
|
|
—
|
|
—
|
|
706
|
|
|||||||||||
|
Net cash from investing activities
|
(92,563
|
)
|
(530,426
|
)
|
(35,705
|
)
|
—
|
|
432,675
|
|
(226,019
|
)
|
|||||||||||
|
Cash flows from financing activities
|
|||||||||||||||||||||||
|
Borrowings under bank credit facility
|
958,000
|
|
—
|
|
—
|
|
—
|
|
—
|
|
958,000
|
|
|||||||||||
|
Payments under bank credit facility
|
(1,119,485
|
)
|
—
|
|
—
|
|
—
|
|
—
|
|
(1,119,485
|
)
|
|||||||||||
|
Debt financing costs, net
|
(3,430
|
)
|
—
|
|
—
|
|
—
|
|
—
|
|
(3,430
|
)
|
|||||||||||
|
Net activity with affiliates
|
389,579
|
|
—
|
|
55,166
|
|
(254
|
)
|
(444,491
|
)
|
—
|
|
|||||||||||
|
Distributions to parent
|
—
|
|
(10,475
|
)
|
(392
|
)
|
—
|
|
10,867
|
|
—
|
|
|||||||||||
|
Share-based compensation activities, net
|
(7,711
|
)
|
—
|
|
—
|
|
—
|
|
—
|
|
(7,711
|
)
|
|||||||||||
|
Shares repurchased and retired
|
(31,927
|
)
|
—
|
|
—
|
|
—
|
|
—
|
|
(31,927
|
)
|
|||||||||||
|
Dividends paid
|
(11,286
|
)
|
—
|
|
—
|
|
—
|
|
—
|
|
(11,286
|
)
|
|||||||||||
|
Other financing activities
|
590
|
|
(87
|
)
|
—
|
|
—
|
|
—
|
|
503
|
|
|||||||||||
|
Net cash from financing activities
|
174,330
|
|
(10,562
|
)
|
54,774
|
|
(254
|
)
|
(433,624
|
)
|
(215,336
|
)
|
|||||||||||
|
Cash flows from discontinued operations
|
|||||||||||||||||||||||
|
Cash flows from operating activities
|
—
|
|
(514
|
)
|
—
|
|
—
|
|
—
|
|
(514
|
)
|
|||||||||||
|
Cash flows from investing activities
|
—
|
|
36,247
|
|
—
|
|
—
|
|
—
|
|
36,247
|
|
|||||||||||
|
Cash flows from financing activities
|
—
|
|
—
|
|
—
|
|
—
|
|
—
|
|
—
|
|
|||||||||||
|
Net cash from discontinued operations
|
—
|
|
35,733
|
|
—
|
|
—
|
|
—
|
|
35,733
|
|
|||||||||||
|
Net change in cash and cash equivalents
|
(865
|
)
|
10,210
|
|
(103
|
)
|
—
|
|
—
|
|
9,242
|
|
|||||||||||
|
Cash and cash equivalents, beginning of period
|
1,212
|
|
189,364
|
|
3,286
|
|
—
|
|
—
|
|
193,862
|
|
|||||||||||
|
Cash and cash equivalents, end of period
|
$
|
347
|
|
$
|
199,574
|
|
$
|
3,183
|
|
$
|
—
|
|
$
|
—
|
|
$
|
203,104
|
|
|||||
108
BOYD GAMING CORPORATION AND SUBSIDIARIES
NOTES TO CONSOLIDATED FINANCIAL STATEMENTS - (Continued)
as of December 31, 2017 and 2016 and for the years ended December 31, 2017, 2016 and 2015
______________________________________________________________________________________________________
Condensed Consolidating Statements of Cash Flows - continued
|
Year Ended December 31, 2016
|
|||||||||||||||||||||||
|
Non-
|
Non-
|
||||||||||||||||||||||
|
Guarantor
|
Guarantor
|
||||||||||||||||||||||
|
Subsidiaries
|
Subsidiaries
|
||||||||||||||||||||||
|
Guarantor
|
(100%
|
(Not 100%
|
|||||||||||||||||||||
|
(In thousands)
|
Parent
|
Subsidiaries
|
Owned)
|
Owned)
|
Eliminations
|
Consolidated
|
|||||||||||||||||
|
Cash flows from operating activities
|
|||||||||||||||||||||||
|
Net cash from operating activities
|
$
|
(86,502
|
)
|
$
|
382,742
|
|
$
|
7,837
|
|
$
|
—
|
|
$
|
(1,196
|
)
|
$
|
302,881
|
|
|||||
|
Cash flows from investing activities
|
|||||||||||||||||||||||
|
Capital expenditures
|
(42,840
|
)
|
(116,834
|
)
|
(684
|
)
|
—
|
|
—
|
|
(160,358
|
)
|
|||||||||||
|
Cash paid for acquisitions, net of cash received
|
(592,703
|
)
|
—
|
|
—
|
|
—
|
|
—
|
|
(592,703
|
)
|
|||||||||||
|
Net activity with affiliates
|
—
|
|
211,300
|
|
—
|
|
—
|
|
(211,300
|
)
|
—
|
|
|||||||||||
|
Distributions from subsidiary
|
9,150
|
|
—
|
|
—
|
|
—
|
|
(9,150
|
)
|
—
|
|
|||||||||||
|
Other investing activities
|
—
|
|
7,529
|
|
6,678
|
|
—
|
|
—
|
|
14,207
|
|
|||||||||||
|
Net cash from investing activities
|
(626,393
|
)
|
101,995
|
|
5,994
|
|
—
|
|
(220,450
|
)
|
(738,854
|
)
|
|||||||||||
|
Cash flows from financing activities
|
|||||||||||||||||||||||
|
Borrowings under bank credit facility
|
2,039,175
|
|
237,000
|
|
—
|
|
—
|
|
—
|
|
2,276,175
|
|
|||||||||||
|
Payments under bank credit facility
|
(1,466,362
|
)
|
(899,750
|
)
|
—
|
|
—
|
|
—
|
|
(2,366,112
|
)
|
|||||||||||
|
Proceeds from issuance of senior notes
|
750,000
|
|
—
|
|
—
|
|
—
|
|
—
|
|
750,000
|
|
|||||||||||
|
Debt financing costs, net
|
(42,220
|
)
|
—
|
|
—
|
|
—
|
|
—
|
|
(42,220
|
)
|
|||||||||||
|
Retirements of senior notes
|
(350,000
|
)
|
(350,000
|
)
|
—
|
|
—
|
|
—
|
|
(700,000
|
)
|
|||||||||||
|
Premium and consent fees paid
|
(15,750
|
)
|
—
|
|
—
|
|
—
|
|
—
|
|
(15,750
|
)
|
|||||||||||
|
Net activity with affiliates
|
(199,398
|
)
|
—
|
|
(12,877
|
)
|
(221
|
)
|
212,496
|
|
—
|
|
|||||||||||
|
Distributions to parent
|
—
|
|
(9,000
|
)
|
(150
|
)
|
—
|
|
9,150
|
|
—
|
|
|||||||||||
|
Share-based compensation activities, net
|
(1,295
|
)
|
—
|
|
—
|
|
—
|
|
—
|
|
(1,295
|
)
|
|||||||||||
|
Other financing activities
|
(45
|
)
|
—
|
|
—
|
|
—
|
|
—
|
|
(45
|
)
|
|||||||||||
|
Net cash from financing activities
|
714,105
|
|
(1,021,750
|
)
|
(13,027
|
)
|
(221
|
)
|
221,646
|
|
(99,247
|
)
|
|||||||||||
|
Cash flows from discontinued operations
|
|||||||||||||||||||||||
|
Cash flows from operating activities
|
—
|
|
(27,796
|
)
|
—
|
|
—
|
|
—
|
|
(27,796
|
)
|
|||||||||||
|
Cash flows from investing activities
|
—
|
|
598,057
|
|
—
|
|
—
|
|
—
|
|
598,057
|
|
|||||||||||
|
Cash flows from financing activities
|
—
|
|
—
|
|
—
|
|
—
|
|
—
|
|
—
|
|
|||||||||||
|
Net cash from discontinued operations
|
—
|
|
570,261
|
|
—
|
|
—
|
|
—
|
|
570,261
|
|
|||||||||||
|
Net change in cash and cash equivalents
|
1,210
|
|
33,248
|
|
804
|
|
(221
|
)
|
—
|
|
35,041
|
|
|||||||||||
|
Cash and cash equivalents, beginning of period
|
2
|
|
156,116
|
|
2,482
|
|
221
|
|
—
|
|
158,821
|
|
|||||||||||
|
Cash and cash equivalents, end of period
|
$
|
1,212
|
|
$
|
189,364
|
|
$
|
3,286
|
|
$
|
—
|
|
$
|
—
|
|
$
|
193,862
|
|
|||||
109
BOYD GAMING CORPORATION AND SUBSIDIARIES
NOTES TO CONSOLIDATED FINANCIAL STATEMENTS - (Continued)
as of December 31, 2017 and 2016 and for the years ended December 31, 2017, 2016 and 2015
______________________________________________________________________________________________________
Condensed Consolidating Statements of Cash Flows - continued
|
Year Ended December 31, 2015
|
|||||||||||||||||||||||
|
Non-
|
Non-
|
||||||||||||||||||||||
|
Guarantor
|
Guarantor
|
||||||||||||||||||||||
|
Subsidiaries
|
Subsidiaries
|
||||||||||||||||||||||
|
Guarantor
|
(100%
|
(Not 100%
|
|||||||||||||||||||||
|
(In thousands)
|
Parent
|
Subsidiaries
|
Owned)
|
Owned)
|
Eliminations
|
Consolidated
|
|||||||||||||||||
|
Cash flows from operating activities
|
|||||||||||||||||||||||
|
Net cash from operating activities
|
$
|
102,080
|
|
$
|
237,041
|
|
$
|
(13,085
|
)
|
$
|
(76
|
)
|
$
|
(209
|
)
|
$
|
325,751
|
|
|||||
|
Cash flows from investing activities
|
|||||||||||||||||||||||
|
Capital expenditures
|
(48,591
|
)
|
(82,392
|
)
|
(187
|
)
|
—
|
|
—
|
|
(131,170
|
)
|
|||||||||||
|
Net activity with affiliates
|
—
|
|
(66,691
|
)
|
—
|
|
—
|
|
66,691
|
|
—
|
|
|||||||||||
|
Distribution from subsidiary
|
11,200
|
|
—
|
|
—
|
|
—
|
|
(11,200
|
)
|
—
|
|
|||||||||||
|
Other investing activities
|
3,292
|
|
1,236
|
|
—
|
|
—
|
|
—
|
|
4,528
|
|
|||||||||||
|
Net cash from investing activities
|
(34,099
|
)
|
(147,847
|
)
|
(187
|
)
|
—
|
|
55,491
|
|
(126,642
|
)
|
|||||||||||
|
Cash flows from financing activities
|
|||||||||||||||||||||||
|
Borrowings under bank credit facility
|
1,033,500
|
|
345,500
|
|
—
|
|
—
|
|
—
|
|
1,379,000
|
|
|||||||||||
|
Payments under bank credit facility
|
(1,211,200
|
)
|
(425,150
|
)
|
—
|
|
—
|
|
—
|
|
(1,636,350
|
)
|
|||||||||||
|
Proceeds from issuance of senior notes
|
750,000
|
|
—
|
|
—
|
|
—
|
|
—
|
|
750,000
|
|
|||||||||||
|
Debt financing costs, net
|
(14,004
|
)
|
—
|
|
—
|
|
—
|
|
—
|
|
(14,004
|
)
|
|||||||||||
|
Payments on retirements of long-term debt
|
(500,000
|
)
|
(3
|
)
|
(157,810
|
)
|
—
|
|
—
|
|
(657,813
|
)
|
|||||||||||
|
Premium and consent fees paid
|
(24,246
|
)
|
—
|
|
—
|
|
—
|
|
—
|
|
(24,246
|
)
|
|||||||||||
|
Net activity with affiliates
|
(105,720
|
)
|
—
|
|
172,124
|
|
78
|
|
(66,482
|
)
|
—
|
|
|||||||||||
|
Distributions to parent
|
—
|
|
(11,100
|
)
|
(100
|
)
|
—
|
|
11,200
|
|
—
|
|
|||||||||||
|
Share-based compensation activities, net
|
3,689
|
|
—
|
|
—
|
|
—
|
|
—
|
|
3,689
|
|
|||||||||||
|
Net cash from financing activities
|
(67,981
|
)
|
(90,753
|
)
|
14,214
|
|
78
|
|
(55,282
|
)
|
(199,724
|
)
|
|||||||||||
|
Cash flows from discontinued operations
|
|||||||||||||||||||||||
|
Cash flows from operating activities
|
—
|
|
14,095
|
|
—
|
|
—
|
|
—
|
|
14,095
|
|
|||||||||||
|
Cash flows from investing activities
|
—
|
|
—
|
|
—
|
|
—
|
|
—
|
|
—
|
|
|||||||||||
|
Cash flows from financing activities
|
—
|
|
—
|
|
—
|
|
—
|
|
—
|
|
—
|
|
|||||||||||
|
Net cash from discontinued operations
|
—
|
|
14,095
|
|
—
|
|
—
|
|
—
|
|
14,095
|
|
|||||||||||
|
Net change in cash and cash equivalents
|
—
|
|
12,536
|
|
942
|
|
2
|
|
—
|
|
13,480
|
|
|||||||||||
|
Cash and cash equivalents, beginning of period
|
2
|
|
143,580
|
|
1,540
|
|
219
|
|
—
|
|
145,341
|
|
|||||||||||
|
Cash and cash equivalents, end of period
|
$
|
2
|
|
$
|
156,116
|
|
$
|
2,482
|
|
$
|
221
|
|
$
|
—
|
|
$
|
158,821
|
|
|||||
Boyd Percentage Ownership
William S. Boyd, our Executive Chairman of the Board of Directors, together with his immediate family, beneficially owned approximately
27%
of our outstanding shares of common stock as of
December 31, 2017
. As such, the Boyd family has the ability to significantly influence our affairs, including the election of members of our Board of Directors and, except as otherwise provided by law, approving or disapproving other matters submitted to a vote of our stockholders, including a merger, consolidation or sale of assets. For each of the years ended
December 31, 2017
,
2016
and
2015
, there were no related party transactions between the Company and the Boyd family other than compensation, including salary and equity incentives.
110
We have evaluated all events or transactions that occurred after
December 31, 2017
. During this period, up to the filing date, we did not identify any subsequent events, other than the payment of the cash dividend disclosed in Note 10,
Stockholder's Equity and Stock Incentive Plans
, the effects of which would require disclosure or adjustment to our financial position or results of operations.
111
There were no changes in or disagreements with accountants on accounting and financial disclosures during the two years in the period ended
December 31, 2017
.
As of the end of the period covered by this Report, we carried out an evaluation, under the supervision and with the participation of our Chief Executive Officer and Chief Financial Officer, of the effectiveness of the design and operation of our disclosure controls and procedures (as defined in Rules 13a-15(e) and 15d-15(e) under the Securities Exchange Act of 1934, as amended (the "Exchange Act"). Our disclosure controls and procedures are designed to ensure that information required to be disclosed in our reports that we file or submit under the Exchange Act is recorded, processed, summarized and reported within the time periods specified in the SEC's rules and forms. Disclosure controls and procedures include, without limitation, controls and procedures designed to ensure that information we are required to disclose in reports we file or submit under the Exchange Act is accumulated and communicated to our management, including our principal executive and principal financial officers, or persons performing similar functions, as appropriate to allow timely decisions regarding required disclosure. Based on the evaluation of the effectiveness of the design and operation of our disclosure controls and procedures, our Chief Executive Officer and Chief Financial Officer concluded that our disclosure controls and procedures were effective at a reasonable assurance level as of the end of the period covered by this Report.
Pursuant to Section 404 of the Sarbanes-Oxley Act of 2002, we include a report of management's assessment of the design and effectiveness of our internal controls as part of this Annual Report on Form 10-K for the fiscal year ended
December 31, 2017
. Our independent registered public accounting firm also reported on the effectiveness of our internal controls over financial reporting. Management's report and the independent registered public accounting firm's attestation report are located below.
There has been no change in our internal control over financial reporting that occurred during our most recent fiscal quarter that has materially affected or is reasonably likely to materially affect our internal control over financial reporting.
Management's Report on Internal Control over Financial Reporting
Our management is responsible for establishing and maintaining adequate internal control over financial reporting, as such term is defined in Rules 13a-15(f) and 15d-15(f) of the Exchange Act. Under the supervision and with the participation of our management, including our principal executive officer and principal financial officer, we evaluated the effectiveness of our internal control over financial reporting as of the end of the most recent fiscal year,
December 31, 2017
, based on the framework set forth in
Internal Control - Integrated Framework
issued in 2013 by the Committee of Sponsoring Organizations of the Treadway Commission.
Based on our evaluation under the framework set forth in
Internal Control - Integrated Framework
, our management concluded that our internal control over financial reporting was effective as of
December 31, 2017
, the end of our most recent fiscal year.
Deloitte & Touche LLP, an independent registered public accounting firm, has issued an attestation report on our internal control over financial reporting as of
December 31, 2017
, which report follows below.
112
REPORT OF INDEPENDENT REGISTERED PUBLIC ACCOUNTING FIRM
To the Shareholders and Board of Directors of Boyd Gaming Corporation and Subsidiaries:
Opinion on Internal Control over Financial Reporting
We have audited the internal control over financial reporting of Boyd Gaming Corporation and Subsidiaries (the "Company") as of December 31, 2017, based on criteria established in
Internal Control — Integrated Framework (2013)
issued by the Committee of Sponsoring Organizations of the Treadway Commission (COSO). In our opinion, the Company maintained, in all material respects,effective internal control over financial reporting as of December 31, 2017, based on the criteria established in
Internal Control — Integrated Framework (2013)
issued by COSO.We have also audited, in accordance with the standards of the Public Company Accounting Oversight Board (United States) (PCAOB), the consolidated financial statements as of and for the year ended December 31, 2017 of the Company and our report dated February 26, 2018 expressed an unqualified opinion on those financial statements.
Basis for Opinion
The Company’s management is responsible for maintaining effective internal control over financial reporting and for its assessment of the effectiveness of internal control over financial reporting, included in the accompanying Management’s Report on Internal Control over Financial Reporting. Our responsibility is to express an opinion on the Company’s internal control over financial reporting based on our audit. We are a public accounting firm registered with the PCAOB and are required to be independent with respect to the Company in accordance with the U.S. federal securities laws and applicable rules and regulations of the Securities and Exchange Commission and the PCAOB.
We conducted our audit in accordance with the standards of the PCAOB. Those standards require that we plan and perform the audit to obtain reasonable assurance about whether effective internal control over financial reporting was maintained in all material respects. Our audit included obtaining an understanding of internal control over financial reporting, assessing the risk that a material weakness exists, testing and evaluating the design and operating effectiveness of internal control based on the assessed risk, and performing such other procedures as we considered necessary in the circumstances. We believe that our audit provides a reasonable basis for our opinion.
Definition and Limitations of Internal Control over Financial Reporting
A company’s internal control over financial reporting is a process designed to provide reasonable assurance regarding the reliability of financial reporting and the preparation of financial statements for external purposes in accordance with generally accepted accounting principles. A company’s internal control over financial reporting includes those policies and procedures that (1) pertain to the maintenance of records that, in reasonable detail, accurately and fairly reflect the transactions and dispositions of the assets of the company; (2) provide reasonable assurance that transactions are recorded as necessary to permit preparation of financial statements in accordance with generally accepted accounting principles, and that receipts and expenditures of the company are being made only in accordance with authorizations of management and directors of the company; and (3) provide reasonable assurance regarding prevention or timely detection of unauthorized acquisition, use, or disposition of the company’s assets that could have a material effect on the financial statements. Because of its inherent limitations, internal control over financial reporting may not prevent or detect misstatements. Also, projections of any evaluation of the effectiveness of the internal control over financial reporting to future periods are subject to the risk that the controls may become inadequate because of changes in conditions or that the degree of compliance with the policies or procedures may deteriorate.
/s/ DELOITTE & TOUCHE LLP
Las Vegas, Nevada
February 26, 2018
113
None
Information required by this item regarding the members of our board of directors and our audit committee, including our audit committee financial experts, is set forth under the captions
Board Committees - Audit Committee
,
Director Nominees
, and
Section 16(a) Beneficial Ownership Reporting Compliance
in our Definitive Proxy Statement to be filed in connection with our 2018 Annual Meeting of Stockholders and is incorporated herein by reference.
The following table sets forth the non-director executive officers of Boyd Gaming Corporation as of
February 26, 2018
:
|
Name
|
Age
|
Position
|
||
|
Brian A. Larson
|
62
|
Executive Vice President, Secretary and General Counsel
|
||
|
Josh Hirsberg
|
56
|
Executive Vice President, Chief Financial Officer and Treasurer (Principal Financial Officer)
|
||
|
Theodore A. Bogich
|
63
|
Executive Vice President, Operations
|
||
|
Stephen S. Thompson
|
58
|
Executive Vice President, Operations
|
||
|
Anthony D. McDuffie
|
57
|
Vice President and Chief Accounting Officer (Principal Accounting Officer)
|
||
Brian A. Larson has served as our Executive Vice President and General Counsel since January 1, 2008 and as our Secretary since February 2001. Mr. Larson became our Senior Vice President and General Counsel in January 1998. He became our Associate General Counsel in March 1993 and Vice President-Development in June 1993.
Josh Hirsberg joined the Company as our Senior Vice President, Chief Financial Officer and Treasurer effective January 1, 2008 and was promoted to Executive Vice President effective January 13, 2016. Prior to his position with the Company, Mr. Hirsberg served as the Chief Financial Officer for EdgeStar Partners, a Las Vegas-based resort development concern. He previously held several senior-level finance positions in the gaming industry, including Vice President and Treasurer for Caesars Entertainment and Vice President, Strategic Planning and Investor Relations for Harrah's Entertainment.
Theodore A. Bogich was appointed an Executive Vice President, Operations on January 13, 2016. Mr. Bogich joined Boyd Gaming in 2004 as Vice President and General Manager of Sam’s Town Tunica, and was named Vice President and General Manager of Blue Chip Casino Hotel in Michigan City, Indiana, in 2007. He was promoted to Senior Vice President, Operations in 2012.
Stephen S. Thompson was appointed an Executive Vice President, Operations on January 13, 2016. Prior to his being appointed this position, Mr. Thompson served in numerous senior executive positions with Boyd Gaming since joining the Company in 1983, including Senior Vice President, Operations for Boyd Gaming’s Nevada region since 2004.
Anthony D. McDuffie has served as our Vice President and Chief Accounting Officer since March 2013. Prior to being appointed Vice President and Chief Accounting Officer, Mr. McDuffie, served as the Company's Director, Accounting Policy & Reporting, since October 2012. Mr. McDuffie previously served as Vice President, Finance and Controller of Pinnacle Airlines Corp. from October 2011 until September 2012. Prior to joining Pinnacle Airlines, Mr. McDuffie served as a financial accounting consultant to businesses in the manufacturing, health care and emergency air ambulance industries from May 2009 until October 2011. Mr. McDuffie served as Controller and Chief Accounting Officer of Caesars Entertainment Corporation from November 2001 to May 2009.
Code of Ethics.
We have adopted a Code of Business Conduct and Ethics ("Code of Ethics") that applies to each of our directors, executive officers and employees. Our Code of Ethics is posted on our website at www.boydgaming.com. Any waivers or amendments to our Code of Ethics will be posted on our website.
The information required by this item is set forth under the captions
Executive Officer and Director Compensation
,
Compensation and Stock Option Committee Interlocks and Insider Participation
, and
Compensation and Stock Option Committee Report
in our Definitive Proxy Statement to be filed in connection with our 2018 Annual Meeting of Stockholders and is incorporated herein by reference.
114
The information required by this item is set forth under the captions
Ownership of Certain Beneficial Owners and Management
and
Equity Compensation Plan Information
in our Definitive Proxy Statement to be filed in connection with our 2018 Annual Meeting of Stockholders and is incorporated herein by reference.
The information required by this item is set forth under the captions
Transactions with Related Persons
and
Director Independence
in our Definitive Proxy Statement to be filed in connection with our 2018 Annual Meeting of Stockholders and is incorporated herein by reference.
Information about principal accounting fees and services, as well as the audit committee's pre-approval policies appears under the captions
Audit and Non-Audit Fees
and
Audit Committee Pre-Approval of Audit and Non-Audit Services
in our Definitive Proxy Statement to be filed in connection with our 2018 Annual Meeting of Stockholders and is incorporated herein by reference.
115
|
1.
|
Financial Statements
|
Financial statements of the Company (including related notes to consolidated financial statements) filed as part of this report are listed below:
|
|
Page No.
|
|
2.
|
Financial Statement Schedules
|
All schedules have been omitted because they are not applicable, not required or the information required to be set forth therein is included in Consolidated Financial Statements or Notes thereto included in this Report.
|
3.
|
Exhibit List
|
|
Exhibit
|
||||
|
Number
|
Description of Exhibit
|
Method of Filing
|
||
|
2.1
|
Incorporated by reference to Exhibit 2.1 of the Registrant's Current Report on Form 8-K filed with the SEC on May 16, 2012.
|
|||
|
2.2
|
Incorporated by reference to Exhibit 2.1 of the Registrant's Quarterly Report on Form 10-Q for the quarter ended June 30, 2016.
|
|||
|
2.3
|
Incorporated by reference to Exhibit 2.2 of the Registrant's Quarterly Report on Form 10-Q for the quarter ended June 30, 2016.
|
|||
|
2.4
|
Incorporated by reference to Exhibit 2.1 of the Registrant's Current Report on Form 8-K filed with the SEC on June 2, 2016.
|
|||
|
2.5
|
Incorporated by reference to Exhibit 2.2 of the Registrant's Current Report on Form 8-K filed with the SEC on August 5, 2016.
|
|||
116
|
Exhibit
|
||||
|
Number
|
Description of Exhibit
|
Method of Filing
|
||
|
2.6
|
Incorporated by reference to Exhibit 2.2 of the Registrant's Current Report on Form 8-K filed with the SEC on September 27, 2016.
|
|||
|
2.7
|
Incorporated by reference to Exhibit 10.1 of the Registrant's Current Report on Form 8-K filed with the SEC on November 3, 2016.
|
|||
|
2.8*
|
Incorporated by reference to Exhibit 2.1 of the Registrant's Current Report on Form 8-K filed with the SEC on December 17, 2017.
|
|||
|
2.9*
|
Incorporated by reference to Exhibit 2.2 of the Registrant's Current Report on Form 8-K filed with the SEC on December 17, 2017.
|
|||
|
2.10*
|
Incorporated by reference to Exhibit 2.1 of the Registrant's Current Report on Form 8-K filed with the SEC on December 17, 2017.
|
|||
|
2.11
|
Filed electronically herewith.
|
|||
|
3.1
|
Incorporated by reference to Exhibit 3.1 of the Registrant's Current Report on Form 8-K, filed with the SEC on May 24, 2006.
|
|||
|
3.2
|
Incorporated by reference to Exhibit 3.1 of the Registrant's Current Report on Form 8-K filed with the SEC on October 26, 2016.
|
|||
|
4.1
|
Incorporated by reference to Exhibit 4.1 of the Registrant's Automatic Shelf Registration Statement on Form S-3ASR dated May 1, 2015.
|
|||
|
4.2
|
Incorporated by reference to Exhibit 4.2 of the Registrant's Automatic Shelf Registration Statement on Form S-3ASR dated May 1, 2015.
|
|||
|
4.3
|
Incorporated by reference to Exhibit 4.1 of the Registrant's Current Report on Form 8-K filed with the SEC on June 13, 2012.
|
|||
117
|
Exhibit
|
||||
|
Number
|
Description of Exhibit
|
Method of Filing
|
||
|
4.4
|
Incorporated by reference to the Registrant’s Current Report on Form 8-K filed with the SEC on August 19, 2013.
|
|||
|
4.5
|
Incorporated by reference to Exhibit 99.2 of the Registrant's Current Report on Form 8-K filed August 21, 2012.
|
|||
|
4.6
|
Incorporated by reference to Exhibit 4.1 of the Registrant's Current Report on Form 8-K filed May 8, 2015.
|
|||
|
4.7
|
Incorporated by reference to Exhibit 4.2 of the Registrant's Current Report on Form 8-K filed May 21, 2015.
|
|||
|
4.8
|
Incorporated by reference to Exhibit 4.1 of the Registrant's Current Report on Form 8-K filed with the SEC on March 29, 2016.
|
|||
|
4.9
|
Incorporated by reference to Exhibit 4.2 of the Registrant's Current Report on Form 8-K filed with the SEC on March 29, 2016.
|
|||
|
4.10
|
Incorporated by reference to Exhibit 4.3 of the Registrant's Current Report on Form 8-K filed with the SEC on March 29, 2016.
|
|||
|
4.11
|
Incorporated by reference to Exhibit 4.1 of the Registrant's Current Report on Form 8-K filed with the SEC on December 20, 2016.
|
|||
|
4.12
|
Incorporated by reference to Exhibit 4.2 of the Registrant's Current Report on Form 8-K filed with the SEC on December 20, 2016.
|
|||
|
4.13
|
Incorporated by reference to Exhibit 4.1 of the Registrant's Current Report on Form 8-K filed with the SEC on March 7, 2017.
|
|||
118
|
Exhibit
|
||||
|
Number
|
Description of Exhibit
|
Method of Filing
|
||
|
4.14
|
Incorporated by reference to Exhibit 4.2 of the Registrant's Current Report on Form 8-K filed with the SEC on March 7, 2017.
|
|||
|
10.1
|
Ninety-Nine Year Lease dated June 30, 1954, by and among Fremont Hotel, Inc., and Charles L. Ronnow and J.L. Ronnow, and Alice Elizabeth Ronnow
|
Incorporated by reference to the Registration Statement on Form S-1, File No. 33-51672, of California Hotel and Casino and California Hotel Finance Corporation, which was declared effective on November 18, 1992.
|
||
|
10.2
|
Lease Agreement dated October 31, 1963, by and between Fremont Hotel, Inc. and Cora Edit Garehime
|
Incorporated by reference to the Registration Statement on Form S-1, File No. 33-51672, of California Hotel and Casino and California Hotel Finance Corporation, which was declared effective on November 18, 1992.
|
||
|
10.3
|
Lease Agreement dated December 31, 1963, by and among Fremont Hotel, Inc., Bank of Nevada and Leon H. Rockwell, Jr.
|
Incorporated by reference to the Registration Statement on Form S-1, File No. 33-51672, of California Hotel and Casino and California Hotel Finance Corporation, which was declared effective on November 18, 1992.
|
||
|
10.4
|
Lease Agreement dated June 7, 1971, by and among Anthony Antonacci, Margaret Fay Simon and Bank of Nevada, as Co-Trustees under Peter Albert Simon's Last Will and Testament, and related Assignment of Lease dated February 25, 1985 to Sam-Will, Inc. and Fremont Hotel, Inc.
|
Incorporated by reference to the Registration Statement on Form S-1, File No. 33-51672, of California Hotel and Casino and California Hotel Finance Corporation, which was declared effective on November 18, 1992.
|
||
|
10.5
|
Lease Agreement dated July 25, 1973, by and between CH&C and William Peccole, as Trustee of the Peter Peccole 1970 Trust
|
Incorporated by reference to the Registrant's Annual Report on Form 10-K for the year ended June 30, 1995.
|
||
|
10.6
|
Lease Agreement dated July 1, 1974, by and among Fremont Hotel, Inc. and Bank of Nevada, Leon H. Rockwell, Jr. and Margorie Rockwell Riley
|
Incorporated by reference to the Registration Statement on Form S-1, File No. 33-51672, of California Hotel and Casino and California Hotel Finance Corporation, which was declared effective on November 18, 1992.
|
||
|
10.7
|
Ninety-Nine Year Lease, dated December 1, 1978, by and between Matthew Paratore, and George W. Morgan and LaRue Morgan, and related Lease Assignment dated November 10, 1987, to Sam-Will, Inc., d.b.a. Fremont Hotel and Casino
|
Incorporated by reference to the Registration Statement on Form S-1, File No. 33-51672, of California Hotel and Casino and California Hotel Finance Corporation, which was declared effective on November 18, 1992.
|
||
|
10.8
|
Form of Indemnification Agreement
|
Incorporated by reference to the Registrant's Registration Statement on Form S-1, File No. 33-64006, which was declared effective on October 15, 1993.
|
||
|
10.9
|
401(k) Profit Sharing Plan and Trust
|
Incorporated by reference to the Registration Statement on Form S-1, File No. 33-51672, of California Hotel and Casino and California Hotel Finance Corporation, which was declared effective on November 18, 1992.
|
||
119
|
Exhibit
|
||||
|
Number
|
Description of Exhibit
|
Method of Filing
|
||
|
10.10*
|
Incorporated by reference to Appendix A of the Registrant's Definitive Proxy Statement filed with the SEC on April 21, 2000.
|
|||
|
10.11*
|
Incorporated by reference to Exhibit 10.29 of the Registrant's Annual Report on Form 10-K for the year ended December 31, 2002.
|
|||
|
10.12*
|
Incorporated by reference to Exhibit 10.2 of the Registrant's Quarterly Report on Form 10-Q for the quarter ended March 31, 2008.
|
|||
|
10.13*
|
Incorporated by reference to Exhibit 10.1 of the Registrant's Quarterly Report on Form 10-Q for the quarter ended March 31, 2008.
|
|||
|
10.14*
|
Incorporated by reference to Exhibit 10.39 of the Registrant's Quarterly Report on Form 10-Q for the quarter ended September 30, 2004.
|
|||
|
10.15*
|
Incorporated by reference to Exhibit 10.40 of the Registrant's Quarterly Report on Form 10-Q for the quarter ended September 30, 2004.
|
|||
|
10.16*
|
Incorporated by reference to Exhibit 10.41 of the Registrant's Quarterly Report on Form 10-Q for the quarter ended September 30, 2004.
|
|||
|
10.17*
|
Incorporated by reference to Exhibit 10.42 of the Registrant's Quarterly Report on Form 10-Q for the quarter ended September 30, 2004.
|
|||
|
10.18*
|
Incorporated by reference to Exhibit 10.43 of the Registrant's Quarterly Report on Form 10-Q for the quarter ended September 30, 2004.
|
|||
|
10.19*
|
Incorporated by reference to Exhibit 10.48 of the Registrant's Quarterly Report on Form 10-Q for the quarter ended March 31, 2005.
|
|||
|
10.20*
|
Incorporated by reference to Appendix A of the Registrant's Definitive Proxy Statement filed with the SEC on April 2, 2008.
|
|||
|
10.21*
|
Incorporated by reference to Exhibit 10.35 of the Registrant's Annual Report on Form 10-K for the year ended December 31, 2005.
|
|||
|
10.22*
|
Incorporated by reference to Exhibit 10.1 of the Registrant's Current Report on Form 8-K, filed with the SEC on May 24, 2006.
|
|||
|
10.23*
|
Incorporated by reference to Exhibit 10.2 of the Registrant's Current Report on Form 8-K, filed with the SEC on May 24, 2006.
|
|||
120
|
Exhibit
|
||||
|
Number
|
Description of Exhibit
|
Method of Filing
|
||
|
10.24*
|
Incorporated by reference to Exhibit 10.3 of the Registrant's Quarterly Report on Form 10-Q for the quarter ended June 30, 2006.
|
|||
|
10.25*
|
Incorporated by reference to Exhibit 10.3 of the Registrant's Current Report on Form 8-K filed with the SEC on May 24, 2006.
|
|||
|
10.26*
|
Incorporated by reference to Exhibit 10.1 of the Registrant's Current Report on Form 8-K filed with the SEC on December 13, 2006.
|
|||
|
10.27*
|
Incorporated by reference to Exhibit 10.1 of the Registrant's Quarterly Report on Form 10-Q for the quarter ended June 30, 2007.
|
|||
|
10.28*
|
Incorporated by reference to Exhibit 10.46 of the Registrant's Annual Report on Form 10-K for the year ended December 31, 2006.
|
|||
|
10.29
|
Incorporated by reference to Exhibit 10.49 of the Registrant's Annual Report on Form 10-K for the year ended December 31, 2011.
|
|||
|
10.30
|
Incorporated by reference to Exhibit 10.1 of Peninsula Gaming, LLC's Quarterly Report on Form 10-Q filed November 14, 2006.
|
|||
|
10.31
|
Incorporated by reference to Exhibit 10.2 of Peninsula Gaming, LLC's Quarterly Report on Form 10-Q filed November 14, 2006.
|
|||
|
10.32
|
Incorporated by reference to Exhibit 10.3 of Peninsula Gaming, LLC's Quarterly Report on Form 10-Q filed November 14, 2006.
|
|||
|
10.33
|
Incorporated by reference to Exhibit 10.63 of Peninsula Gaming, LLC's Annual Report on Form 10-K filed March 28, 2008.
|
|||
|
10.34
|
Incorporated by reference to Exhibit 10.65 of Peninsula Gaming, LLC's Annual Report on Form 10-K filed March 28, 2008.
|
|||
|
10.35
|
Incorporated by reference to Exhibit 10.2 of Peninsula Gaming, LLC's Current Report on Form 8-K filed February 4, 2011.
|
|||
|
10.36
|
Incorporated by reference from the Registrant’s Current Report on Form 8-K dated August 14, 2013.
|
|||
121
|
Exhibit
|
||||
|
Number
|
Description of Exhibit
|
Method of Filing
|
||
|
10.37
|
Incorporated by reference to Exhibit 10.1 of the Registrant's Current Report on Form 10-Q for the quarter ended September 30, 2014.
|
|||
|
10.38
|
Incorporated by reference to Exhibit 10.1 of the Registrant's Current Report on Form 8-K filed with the SEC on September 19, 2016.
|
|||
|
10.39*
|
Incorporated by reference to Appendix A of the Registrant's Definitive Proxy Statement filed with the SEC on April 2, 2012.
|
|||
|
10.40
†
|
Incorporated by reference to Exhibit 10.40 of the Registrant's Current Report on Form 10-K filed with the SEC on February 21, 2017.
|
|||
|
10.41
|
Incorporated by reference to Exhibit 10.1 of the Registrant's Current Report on Form 8-K filed with the SEC on March 31, 2017.
|
|||
|
12
|
Filed electronically herewith.
|
|||
|
21.1
|
Filed electronically herewith.
|
|||
|
23.1
|
Filed electronically herewith.
|
|||
|
24
|
Filed electronically herewith.
|
|||
|
31.1
|
Filed electronically herewith.
|
|||
|
31.2
|
Filed electronically herewith.
|
|||
|
32.1
|
Filed electronically herewith.
|
|||
|
32.2
|
Filed electronically herewith.
|
|||
|
99.1
|
Filed electronically herewith.
|
|||
122
|
Exhibit
|
||||
|
Number
|
Description of Exhibit
|
Method of Filing
|
||
|
101
|
The following materials from Boyd Gaming Corporation's Annual Report on Form 10-K for the year ended December 31, 2017, formatted in XBRL (eXtensible Business Reporting Language): (i) Consolidated Balance Sheets as of December 31, 2017 and December 31, 2016; (ii) Consolidated Statements of Operations for the years ended December 31, 2017, 2016 and 2015; (iii) Consolidated Statement of Changes in Stockholders' Equity for the years ended December 31, 2017; (iv) Consolidated Statements of Cash Flows for the years ended December 31, 2017, 2016 and 2015; and (vi) Notes to Consolidated Financial Statements. ***
|
Filed electronically herewith.
|
||
________________________________
*
Management contracts or compensatory plans or arrangements.
** Certain portions of this exhibit have been granted confidential treatment by the Securities and Exchange Commission.
|
***
|
Pursuant to Rule 406T of Regulation S-T, the Interactive Data Files on Exhibit 101 hereto are deemed not filed or part of a registration statement or prospectus for purposes of Sections 11 or 12 of the Securities Act of 1933, as amended, are deemed not filed for purposes of Section 18 of the Securities and Exchange Act of 1934, as amended, and otherwise are not subject to liability under those sections.
|
|
†
|
Exhibits and schedules have been omitted pursuant to Item 601(b)(2) of Regulation S-K. The Company hereby undertakes to furnish supplementally copies of any of the omitted schedules upon request by the SEC.
|
None
123
SIGNATURES
Pursuant to the requirements of Section 13 or 15(d) of the Securities and Exchange Act of 1934, the Registrant has duly caused this report to be signed on its behalf by the undersigned, thereunto duly authorized, on
February 26, 2018
.
|
BOYD GAMING CORPORATION
|
||
|
By:
|
/s/ Anthony D. McDuffie
|
|
|
Anthony D. McDuffie
|
||
|
Vice President and Chief Accounting Officer
|
||
|
(Principal Accounting Officer)
|
||
124
POWER OF ATTORNEY
KNOW ALL PERSONS BY THESE PRESENTS, that each person whose signature appears below constitutes and appoints Keith E. Smith, Josh Hirsberg and Anthony D. McDuffie, and each of them, his attorneys-in-fact, each with the power of substitution, for him or her in any and all capacities, to sign any amendments to this Annual Report on Form 10-K and to file the same, with exhibits thereto and other documents in connection therewith, with the Securities and Exchange Commission, hereby ratifying and confirming all that each of said attorneys-in fact, or his substitute or substitutes, may do or cause to be done by virtue hereof.
Pursuant to the requirements of the Securities Exchange Act of 1934, this report has been signed by the following persons on behalf of the registrant and in the capacities and on the date indicated.
|
Signature
|
Title
|
Date
|
||
|
/s/ WILLIAM S. BOYD
|
Executive Chairman of the Board of Directors
|
February 26, 2018
|
||
|
William S. Boyd
|
||||
|
/s/ MARIANNE BOYD JOHNSON
|
Vice Chairman of the Board of Directors,
|
February 26, 2018
|
||
|
Marianne Boyd Johnson
|
Executive Vice President and Director
|
|||
|
/s/ KEITH E. SMITH
|
President, Chief Executive Officer and Director
|
February 26, 2018
|
||
|
Keith E. Smith
|
(Principal Executive Officer)
|
|||
|
/s/ JOSH HIRSBERG
|
Executive Vice President, Chief Financial Officer and Treasurer
|
February 26, 2018
|
||
|
Josh Hirsberg
|
||||
|
/s/ WILLIAM R. BOYD
|
Vice President and Director
|
February 26, 2018
|
||
|
William R. Boyd
|
||||
|
/s/ JOHN BAILEY
|
Director
|
February 26, 2018
|
||
|
John Bailey
|
||||
|
/s/ ROBERT L. BOUGHNER
|
Director
|
February 26, 2018
|
||
|
Robert L. Boughner
|
||||
|
/s/ RICHARD FLAHERTY
|
Director
|
February 26, 2018
|
||
|
Richard Flaherty
|
||||
|
/s/ CHRISTINE J. SPADAFOR
|
Director
|
February 26, 2018
|
||
|
Christine J. Spadafor
|
||||
|
/s/ PETER M. THOMAS
|
Director
|
February 26, 2018
|
||
|
Peter M. Thomas
|
||||
|
/s/ PAUL WHETSELL
|
Director
|
February 26, 2018
|
||
|
Paul Whetsell
|
||||
|
/s/ VERONICA J. WILSON
|
Director
|
February 26, 2018
|
||
|
Veronica J. Wilson
|
||||
|
/s/ ANTHONY D. MCDUFFIE
|
Vice President and Chief Accounting Officer
|
February 26, 2018
|
||
|
Anthony D. McDuffie
|
(Principal Accounting Officer)
|
|||
125
TABLE OF CONTENTS
Part IItem 1. BusinessItem 1A. Risk FactorsItem 1B. Unresolved Staff CommentsItem 2. PropertiesItem 3. Legal ProceedingsItem 4. Mine Safety DisclosuresPart IIItem 5. Market For Registrant's Common Equity, Related Stockholder Matters and Issuer Purchases Of Equity SecuritiesItem 6. Selected Financial DataItem 7. Management's Discussion and Analysis Of Financial Condition and Results Of OperationsItem 7A. Quantitative and Qualitative Disclosures About Market RiskItem 8. Financial Statements and Supplementary DataNote 1. Summary Of Significant Accounting PoliciesNote 2. Acquisitions and DivestituresNote 3. Property and Equipment, NetNote 4. Intangible AssetsNote 5. GoodwillNote 6. Accrued LiabilitiesNote 7. Long-term DebtNote 8. Income TaxesNote 9. Commitments and ContingenciesNote 10. Stockholders' Equity and Stock Incentive PlansNote 11. Fair Value MeasurementsNote 12. Employee Benefit PlansNote 13. Segment InformationNote 14. Selected Quarterly Financial Information (unaudited)Note 15. Condensed Consolidating Financial InformationNote 16. Related Party TransactionsNote 17. Subsequent EventsItem 9. Changes in and Disagreements with Accountants on Accounting and Financial DisclosureItem 9A. Controls and ProceduresItem 9B. Other InformationPart IIIItem 10. Directors, Executive Officers and Corporate GovernanceItem 11. Executive CompensationItem 12. Security Ownership Of Certain Beneficial Owners and Management and Related Stockholder MattersItem 13. Certain Relationships and Related Transactions, and Director IndependenceItem 14. Principal Accounting Fees and ServicesPart IVItem 15. Exhibits, Financial Statement SchedulesItem 16. Form 10-k Summary