|
|
|
|
|
|
|
|
|
|
|
|
|
|
|
|
|
|
|
|
|
|
|
|
|
|
|
|
|
|
|
|
|
|
|
|
|
|
|
|
|
|
|
|
|
|
|
|
|
|
UNITED STATES
SECURITIES AND EXCHANGE COMMISSION
WASHINGTON, D.C. 20549
FORM 10-Q
QUARTERLY REPORT PURSUANT TO SECTION 13 OR 15(d) OF
THE SECURITIES EXCHANGE ACT OF 1934
For the quarterly period ended March 31, 2010
Commission file number 1-9924
Citigroup Inc.
(Exact name of registrant as specified in its charter)
|
Delaware
(State or other jurisdiction of incorporation or organization) |
52-1568099
(I.R.S. Employer Identification No.) |
|
|
399 Park Avenue, New York, NY (Address of principal executive offices) |
|
10043 (Zip code) |
|
(212) 559-1000 (Registrant's telephone number, including area code) |
||
Indicate by check mark whether the registrant (1) has filed all reports required to be filed by Section 13 or 15(d) of the Securities Exchange Act of 1934 during the preceding 12 months (or for such shorter period that the registrant was required to file such reports), and (2) has been subject to such filing requirements for the past 90 days. Yes ý No o
Indicate by check mark whether the registrant has submitted electronically and posted on its corporate Web site, if any, every Interactive Data File required to be submitted and posted pursuant to Rule 405 of Regulation S-T (§232.405 of this chapter) during the preceding 12 months (or for such shorter period that the registrant was required to submit and post such files). Yes ý No o
Indicate by check mark whether the registrant is a large accelerated filer, an accelerated filer, a non-accelerated filer, or a smaller reporting company. See the definitions of "large accelerated filer," "accelerated filer" and "smaller reporting company" in Rule 12b-2 of the Exchange Act.
| Large accelerated filer ý | Accelerated filer o |
Non-accelerated filer
o
(Do not check if a smaller reporting company) |
Smaller reporting company o |
Indicate by check mark whether the registrant is a shell company (as defined in Rule 12b-2 of the Exchange Act). Yes o No ý
Indicate the number of shares outstanding of each of the issuer's classes of common stock as of the latest practicable date:
Common stock outstanding as of April 30, 2010: 28,979,879,336
Available on the web at www.citigroup.com
1
FIRST QUARTER 2010—FORM 10-Q
2
Introduction
Citigroup's history dates back to the founding of Citibank in 1812. Citigroup's original corporate predecessor was incorporated in 1988 under the laws of the State of Delaware. Following a series of transactions over a number of years, Citigroup Inc. was formed in 1998 upon the merger of Citicorp and Travelers Group Inc.
Citigroup is a global diversified financial services holding company whose businesses provide consumers, corporations, governments and institutions with a broad range of financial products and services. Citi has approximately 200 million customer accounts and does business in more than 140 countries.
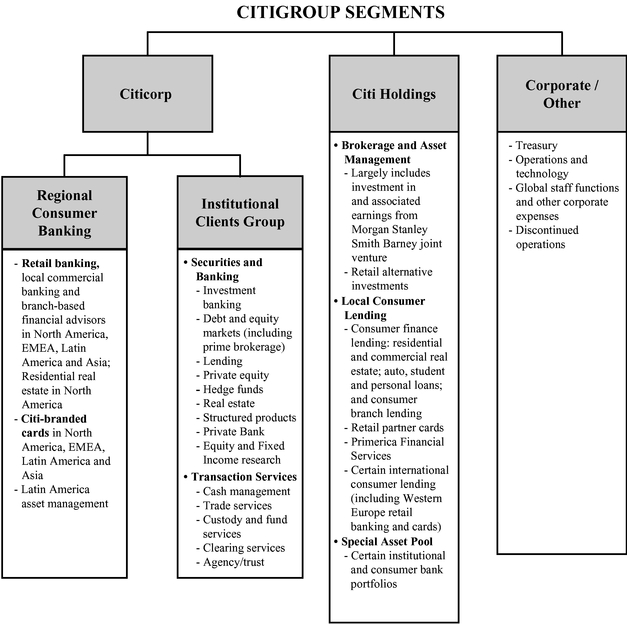
Citigroup currently operates, for management reporting purposes, via two primary business segments: Citicorp, consisting of our Regional Consumer Banking businesses and Institutional Clients Group ; and Citi Holdings, consisting of our Brokerage and Asset Management and Local Consumer Lending businesses, and a Special Asset Pool . There is also a third segment, Corporate/Other . For a further description of the business segments and the products and services they provide, see "Citigroup Segments" below, "Management's Discussion and Analysis of Financial Condition and Results of Operations" and Note 3 to the Consolidated Financial Statements.
Throughout this report, "Citigroup" and "Citi" refer to Citigroup Inc. and its consolidated subsidiaries.
This Quarterly Report on Form 10-Q should be read in conjunction with Citigroup's Annual Report on Form 10-K for the year ended December 31, 2009.
Additional information about Citigroup is available on the company's Web site at www.citigroup.com . Citigroup's recent annual reports on Form 10-K, quarterly reports on Form 10-Q, current reports on Form 8-K, as well as its other filings with the Securities and Exchange Commission (SEC) are available free of charge through the company's Web site by clicking on the "Investors" page and selecting "All SEC Filings." The SEC's Web site also contains periodic and current reports, proxy and information statements, and other information regarding Citi, at www.sec.gov .
Certain reclassifications have been made to the prior periods' financial statements to conform to the current period's presentation.
Within this Form 10-Q, please refer to the tables of contents on pages 2 and 78 for page references to Management's Discussion and Analysis of Financial Condition and Results of Operations and Notes to Consolidated Financial Statements, respectively.
Impact of Adoption of SFAS 166/167
Effective January 1, 2010, Citigroup adopted Accounting Standards Codification (ASC) 860 , Transfers and Servicing, formerly SFAS No. 166 , Accounting for Transfers of Financial Assets, an amendment of FASB Statement No. 140 (SFAS 166), and ASC 810 , Consolidations, formerly SFAS No. 167 , Amendments to FASB Interpretation No. 46(R) (SFAS 167). Among other requirements, the adoption of these standards includes the requirement that Citi consolidate certain of its credit card securitization trusts and eliminate sale accounting for transfers of credit card receivables to those trusts. As a result, reported and managed basis presentations are comparable for periods beginning January 1, 2010. For comparison purposes, prior period revenues, net credit losses, provisions for credit losses and for benefits and claims including managed net credit losses and loans are presented on a managed basis in this Form 10-Q. Managed presentations were applicable only to Citi's North American branded and retail partner credit card operations in North America Regional Consumer Banking and Citi Holdings— Local Consumer Lending and any aggregations in which they are included. See "Management's Discussion and Analysis of Financial Condition and Results of Operations—Executive Summary," "Capital Resources and Liquidity" and Note 1 to the Consolidated Financial Statements for an additional discussion of the adoption of SFAS 166/167 and its impact on Citigroup.
3
As described above, Citigroup is managed pursuant to the following segments:
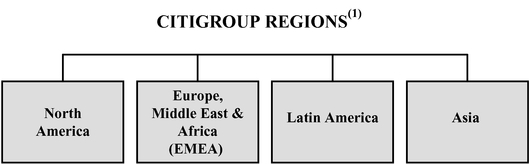
The following are the four regions in which Citigroup operates. The regional results are fully reflected in the segment results above.
- (1)
- Asia includes Japan, Latin America includes Mexico, and North America comprises the U.S., Canada and Puerto Rico.
4
MANAGEMENT'S DISCUSSION AND ANALYSIS OF FINANCIAL CONDITION AND RESULTS OF OPERATIONS
FIRST QUARTER 2010 EXECUTIVE SUMMARY
Citigroup reported net income of $4.4 billion, or $0.15 per diluted share, for the first quarter of 2010. Results reflected strong capital markets revenues, an improving credit environment and the impact of Citi's continued expense discipline. Citicorp's net income was $5.1 billion; Citi Holdings had a net loss of $0.9 billion. Both segments benefitted from a decline in net credit losses during the first quarter of 2010.
The first quarter of 2010 results reflected the adoption of SFAS 166/167, which resulted in the consolidation of $137 billion of incremental assets and $146 billion of liabilities onto the Consolidated Balance Sheet, including securitized credit card receivables. On the date of adoption of SFAS 166/167 (January 1, 2010), Citi's risk-weighted assets increased by a net $10 billion, the loan loss allowance was increased by $13.4 billion, deferred tax assets were increased by $5.0 billion, and retained earnings were reduced by $8.4 billion. The adoption also translated into a reduction in Tangible Common Equity of $8.4 billion, and decreased Tier 1 Common by $14.2 billion or 138 basis points. The impact to Citi's capital was largely offset by the earnings in the quarter. The Tier 1 Capital and Tier 1 Common ratios were 11.28% and 9.11%, respectively, at March 31, 2010. (Tangible Common Equity and Tier 1 Common and related ratios are non-GAAP financial measures, as defined by the SEC. See "Capital Resources and Liquidity—Capital Resources" for additional information on these measures.)
Revenues of $25.4 billion decreased 6% from comparable year-ago levels due primarily to lower revenues in Securities and Banking and Local Consumer Lending , offset by higher revenues in Special Asset Pool. The absence of Smith Barney revenues in the current quarter (which approximated $1.7 billion in the first quarter of 2009, recorded in Brokerage and Asset Management ) also contributed to the decline in revenues.
Securities and Banking revenues were $8 billion in the first quarter of 2010, compared to $12.2 billion in the year-ago period. Securities and Banking revenues were particularly strong in the first quarter of 2009 driven by strong fixed income markets revenues as well as $2.7 billion of positive credit value adjustments (CVA), compared to $289 million of positive CVA in the first quarter of 2010. The first quarter of 2010 saw continued strength in the fixed income markets in Securities and Banking .
Regional Consumer Banking revenues were up $245 million to $8.1 billion on a comparable basis. Transaction Services revenues were up 3% to $2.4 billion.
Local Consumer Lending revenues of $4.7 billion in the first quarter of 2010 were down 22% year-over-year on a comparable basis, driven by a declining asset base and the absence of a $1.1 billion gain on the sale of Redecard shares in the first quarter of 2009.
Revenues in the Special Asset Pool grew to $1.5 billion in the first quarter of 2010, from negative $4.5 billion in the prior year, driven by $1.4 billion of positive net revenue marks in the first quarter of 2010 (versus $4.5 billion of negative marks in the first quarter of 2009).
Net interest revenue increased 13% from the first quarter of 2009, primarily reflecting the adoption of SFAS 166/167. Citi's net interest margin (NIM) increased by 67 basis points to 3.32% during the first quarter of 2010. Nearly three-quarters of the increase was due to the adoption of SFAS 166/167. The remainder of the increase was driven by the absence of interest payments on trust preferred securities repaid in the fourth quarter of 2009 as well as the deployment of cash into higher-yielding investments.
Non-interest revenue decreased 6% from a year ago, primarily reflecting adoption of SFAS 166/167 as well as the absence of the $1.1 billion Redecard gain in the first quarter of 2009.
Operating expenses decreased 1% from the year-ago quarter and were down 6% from the fourth quarter of 2009 reflecting Citigroup's continued expense discipline. Citi's full-time employees were 263,000 at March 31, 2010, down 46,000 from March 31, 2009 and down 2,000 from December 31, 2009.
Net credit losses of $8.4 billion in the first quarter of 2010 were down 15% from year-ago levels and down 16% from the fourth quarter of 2009. Consumer net credit losses of $8.0 billion were down 3% from last year and down 10% from the prior quarter.
Citi's total allowance for loan losses was $48.7 billion at March 31, 2010, or 6.8% of total loans. This was up from 6.1% of total loans at December 31, 2009 and reflected an increase in loans of approximately $130 billion and an increase in loan loss reserves of $12.7 billion during the quarter, primarily reflecting the adoption of SFAS 166/167. During the first quarter of 2010, Citi had a net release of $18 million to its credit reserves, compared to a net build of $2.6 billion in the first quarter of 2009 and a net build of $706 million in the fourth quarter of 2009.
The total allowance for loan losses for consumer loans increased to $41.4 billion at the end of the quarter, or 7.8% of consumer loans, up from 6.7% of consumer loans at the end of the fourth quarter of 2009. The increase was primarily due to the adoption of SFAS 166/167. During the first quarter of 2010, both early- and later-stage delinquencies improved across most of the consumer loan portfolios, driven by improvement in North America mortgages. Delinquencies declined in first and second mortgages reflecting asset sales, organic improvement and modifications under the U.S. Treasury's Home Affordable Modification Program (HAMP) moving to permanent status. For total consumer loans, the 90 days or more consumer loan delinquency rate was 4.02% at March 31, 2010, compared to 4.28% at December 31, 2009 and 3.51% a year ago. The 30 to 89 days past due consumer loan delinquency rate was 3.11% at March 31, 2010, compared to 3.46% at December 31, 2009 and 3.38% a year ago. Consumer non-accrual loans totaled $15.6 billion at
5
March 31, 2010, compared to $18.3 billion at December 31, 2009 and $14.9 billion at March 31, 2009.
The total allowance for loan losses for funded corporate loans declined to $7.3 billion at the end of the quarter, or 3.9% of corporate loans, down from 4.6% in the fourth quarter of 2009. Corporate non-accrual loans were $12.9 billion at March 31, 2010, compared to $13.5 billion at December 31, 2009 and $11.2 billion a year ago. The decrease from the prior quarter was mainly due to loan sales and paydowns, which were partially offset by increases due to weakening of certain specific credits.
Citi's effective tax rate on continuing operations for the first quarter of 2010 was 20%. The effective tax rate reflected taxable earnings in lower rate jurisdictions, as well as income from tax advantaged sources.
Total deposits were $828 billion at March 31, 2010, down 1% from December 31, 2009 and up 9% from year-ago levels. At March 31, 2010, Citi's structural liquidity (equity, long-term debt and deposits) as a percentage of assets was 71% at March 31, 2010 compared with 73% at December 31, 2009 and 68% at March 31, 2009.
Citigroup's total assets of $2.0 trillion increased $146 billion from December 31, 2009, primarily from the adoption of SFAS 166/167, as discussed above.
Citigroup's total stockholders' equity decreased by $1.3 billion during the first quarter of 2010 to $151.4 billion, primarily reflecting the adoption of SFAS 166/167, partially offset by the net income during the quarter, $1.9 billion related to the ADIA share issuance and $1.1 billion improvement in Accumulated Other Comprehensive Income. Citigroup's total equity capital base and trust preferred securities were $173.1 billion at March 31, 2010.
Business Outlook
Citi's near-term performance will continue to be impacted by the pace of economic recovery generally, the level of activity in the capital markets and credit costs. Although Citi continued to see signs of economic improvement internationally during the first quarter of 2010, significant uncertainty remains in the U.S., particularly with regard to employment levels and the risk of future legislative actions that could adversely affect various Citi businesses, including possibly requiring the elimination or transformation of certain of its business activities.
With respect to revenues, while Citi believes Securities and Banking first quarter 2010 results were generally representative of Citi's core business, the first quarter is historically the strongest period of the year, particularly in fixed income. In addition, while pricing actions were able to offset the impact of The Credit Card Accountability Responsibility and Disclosure Act of 2009 (CARD Act) in the first quarter of 2010, the CARD Act will likely have an increasingly negative impact on U.S. credit card revenues during 2010. Net revenue marks in the Special Asset Pool will continue to be episodic.
With respect to expenses, while Citi intends to maintain continued expense discipline, operating expenses may increase in Citicorp going forward as a portion of the cost reductions achieved in Citi Holdings is re-invested in the core franchise. In addition, Citi will absorb the cost of the U.K. bonus tax in the second quarter of 2010, currently estimated to be approximately $400 million pretax.
Credit costs will continue to be a significant driver of Citi's near term results. Internationally, consumer credit trends are expected to stabilize and in some cases show gradual improvement as long as economic recovery in these regions is sustained. In North America, Citi currently believes consumer credit trends may continue to stabilize based on the stable to improving delinquencies observed in the company's major portfolios, as well as early signs of economic recovery, although sustained credit improvement will depend on the broader macroeconomic environment. Consumer loan loss reserve balances will continue to reflect the losses embedded in the company's portfolios due to factors including underlying credit trends as well as the impact of modification programs.
6
CITIGROUP INC. AND SUBSIDIARIES
SUMMARY OF SELECTED FINANCIAL DATA—Page 1
|
|
First Quarter |
|
|||||||||
|---|---|---|---|---|---|---|---|---|---|---|---|
|
In millions of dollars,
except per share amounts |
%
Change |
||||||||||
| 2010 | 2009 | ||||||||||
|
Total managed revenues(1) |
$ | 25,421 | $ | 26,973 | (6 | )% | |||||
|
Total managed net credit losses(1) |
8,384 | 9,830 | (15 | ) | |||||||
|
Net interest revenue |
$ | 14,561 | $ | 12,926 | 13 | % | |||||
|
Non-interest revenue |
10,860 | 11,595 | (6 | ) | |||||||
|
Revenues, net of interest expense |
$ | 25,421 | $ | 24,521 | 4 | % | |||||
|
Operating expenses |
11,518 | 11,685 | (1 | ) | |||||||
|
Provisions for credit losses and for benefits and claims |
8,618 | 10,307 | (16 | ) | |||||||
|
Income from continuing operations before income taxes |
$ | 5,285 | $ | 2,529 | NM | ||||||
|
Income taxes (losses) |
1,036 | 835 | 24 | % | |||||||
|
Income from continuing operations |
$ | 4,249 | $ | 1,694 | NM | ||||||
|
Income from discontinued operations, net of taxes |
211 | (117 | ) | NM | |||||||
|
Net Income (losses) before attribution of noncontrolling interests |
$ | 4,460 | $ | 1,577 | NM | ||||||
|
Net Income (losses) attributable to noncontrolling interests |
32 | (16 | ) | NM | |||||||
|
Citigroup's net income |
$ | 4,428 | $ | 1,593 | NM | ||||||
|
Less: |
|||||||||||
|
Preferred dividends—Basic |
$ | — | $ | 1,221 | (100 | ) | |||||
|
Impact of the conversion price reset related to the $12.5 billion convertible preferred stock private issuance—Basic(2) |
— | 1,285 | (100 | ) | |||||||
|
Preferred stock Series H discount accretion—Basic |
— | 53 | (100 | ) | |||||||
|
Income (loss) available to common stockholders |
$ | 4,428 | $ | (966 | ) | NM | |||||
|
Earnings allocated to participating securities, net of forfeitures |
28 | — | 100 | % | |||||||
|
Undistributed earnings (loss) for basic EPS |
$ | 4,400 | $ | (966 | ) | NM | |||||
|
Convertible Preferred Stock Dividends |
— | 270 | (100 | )% | |||||||
|
Undistributed earnings (loss) for diluted EPS |
$ | 4,400 | $ | (696 | ) | NM | |||||
|
Earnings per share |
|||||||||||
|
Basic(3) |
|||||||||||
|
Income (loss) from continuing operations |
$ | 0.15 | $ | (0.16 | ) | NM | |||||
|
Net income (loss) |
0.15 | (0.18 | ) | NM | |||||||
|
Diluted(3) |
|||||||||||
|
Income (loss) from continuing operations |
$ | 0.14 | $ | (0.16 | ) | NM | |||||
|
Net income (loss) |
0.15 | (0.18 | ) | NM | |||||||
[Continued on the following page, including notes to table.]
7
SUMMARY OF SELECTED FINANCIAL DATA—Page 2
|
|
First Quarter |
|
||||||||
|---|---|---|---|---|---|---|---|---|---|---|
|
|
%
Change |
|||||||||
| In millions of dollars, | 2010 | 2009 | ||||||||
|
At March 31: |
||||||||||
|
Total assets |
$ | 2,002,213 | $ | 1,822,578 | 10 | % | ||||
|
Total deposits |
827,914 | 762,696 | 9 | |||||||
|
Long-term debt |
439,274 | 337,252 | 30 | |||||||
|
Mandatorily redeemable securities of subsidiary Trusts (included in Long-term debt) |
21,682 | 24,694 | (12 | ) | ||||||
|
Common stockholders' equity |
151,109 | 69,688 | NM | |||||||
|
Total stockholders' equity |
151,421 | 143,934 | 5 | |||||||
|
Direct staff (in thousands) |
263 | 309 | (15 | ) | ||||||
|
Ratios: |
||||||||||
|
Return on common stockholders' equity(4) |
12.0 | % | (5.6 | )% | ||||||
|
Tier 1 Common(5) |
9.11 | % | 2.16 | % | ||||||
|
Tier 1 Capital |
11.28 | % | 11.92 | % | ||||||
|
Total Capital |
14.88 | % | 15.61 | % | ||||||
|
Leverage(6) |
6.16 | % | 6.60 | % | ||||||
|
Common stockholders' equity to assets |
7.5 | % | 3.8 | % | ||||||
|
Ratio of earnings to fixed charges and preferred
|
1.82 | 1.06 | ||||||||
- (1)
-
See
discussion of adoption of SFAS 166/167 on page 3 and Note 1 to the Consolidated Financial Statements.
- (2)
-
For
the three months ended March 31, 2009, Income available to common stockholders includes a reduction of $1.285 billion related to a
conversion price reset pursuant to Citigroup's prior agreement with the purchasers of $12.5 billion convertible preferred stock issued in a private offering in January 2008. The conversion
price was reset from $31.62 per share to $26.35 per share. There was no impact to net income, total stockholders' equity or capital ratios due to the reset. However, the reset resulted in a
reclassification from Retained earnings to Additional paid-in capital of $1.285 billion and a reduction in Income available to common stockholders of $1.285 billion.
- (3)
-
The
Diluted EPS calculation for the first quarter of 2009 utilizes Basic shares and Income available to common stockholders (Basic) due to the negative
Income available to common stockholders. Using Diluted shares and Income available to common stockholders (Diluted) would result in anti-dilution.
- (4)
-
The
return on average common stockholders' equity is calculated using income (loss) available to common stockholders.
- (5)
-
As
defined by the banking regulators, the Tier 1 Common ratio represents Tier 1 Capital less qualifying perpetual preferred stock, qualifying
noncontrolling interests in subsidiaries and qualifying mandatorily redeemable securities of subsidiary trusts divided by risk-weighted assets. Tier 1 Common ratio is a
non-GAAP financial measure. See "Capital Resources and Liquidity" below for additional information on this measure.
- (6)
- The Leverage ratio represents Tier 1 Capital divided by each period's quarterly adjusted average total assets.
NM Not meaningful
8
SEGMENT, BUSINESS AND PRODUCT—INCOME (LOSS) AND REVENUES
The following tables show the income (loss) and revenues for Citigroup on a segment, business and product view:
|
|
First Quarter |
|
||||||||
|---|---|---|---|---|---|---|---|---|---|---|
|
|
%
Change |
|||||||||
| In millions of dollars | 2010 | 2009 | ||||||||
|
Income (loss) from Continuing Operations |
||||||||||
|
CITICORP |
||||||||||
|
Regional Consumer Banking |
||||||||||
|
North America |
$ | 22 | $ | 357 | (94 | )% | ||||
|
EMEA |
27 | (33 | ) | NM | ||||||
|
Latin America |
389 | 219 | 78 | |||||||
|
Asia |
576 | 248 | NM | |||||||
|
Total |
$ | 1,014 | $ | 791 | 28 | % | ||||
|
Securities and Banking |
||||||||||
|
North America |
$ | 1,424 | $ | 2,497 | (43 | )% | ||||
|
EMEA |
1,032 | 2,171 | (52 | ) | ||||||
|
Latin America |
272 | 412 | (34 | ) | ||||||
|
Asia |
478 | 1,056 | (55 | ) | ||||||
|
Total |
$ | 3,206 | $ | 6,136 | (48 | )% | ||||
|
Transaction Services |
||||||||||
|
North America |
$ | 159 | $ | 138 | 15 | % | ||||
|
EMEA |
306 | 326 | (6 | ) | ||||||
|
Latin America |
157 | 160 | (2 | ) | ||||||
|
Asia |
319 | 280 | 14 | |||||||
|
Total |
$ | 941 | $ | 904 | 4 | % | ||||
|
Institutional Clients Group |
$ | 4,147 | $ | 7,040 | (41 | )% | ||||
|
Total Citicorp |
$ | 5,161 | $ | 7,831 | (34 | )% | ||||
|
CITI HOLDINGS |
||||||||||
|
Brokerage and Asset Management |
$ | 81 | $ | 34 | NM | |||||
|
Local Consumer Lending |
(1,838 | ) | (1,571 | ) | (17 | )% | ||||
|
Special Asset Pool |
881 | (3,948 | ) | NM | ||||||
|
Total Citi Holdings |
$ | (876 | ) | $ | (5,485 | ) | 84 | % | ||
|
Corporate/Other |
$ | (36 | ) | $ | (652 | ) | 94 | % | ||
|
Income from continuing operations |
$ | 4,249 | $ | 1,694 | NM | |||||
|
Discontinued operations |
$ | 211 | $ | (117 | ) | |||||
|
Net income (loss) attributable to noncontrolling interests |
32 | (16 | ) | |||||||
|
Citigroup's net income |
$ | 4,428 | $ | 1,593 | NM | |||||
NM Not meaningful
9
|
|
First Quarter |
|
||||||||
|---|---|---|---|---|---|---|---|---|---|---|
|
|
%
Change |
|||||||||
| In millions of dollars | 2010 | 2009 | ||||||||
|
CITICORP |
||||||||||
|
Regional Consumer Banking |
||||||||||
|
North America |
$ | 3,801 | $ | 2,503 | 52 | % | ||||
|
EMEA |
405 | 360 | 13 | |||||||
|
Latin America |
2,076 | 1,924 | 8 | |||||||
|
Asia |
1,800 | 1,566 | 15 | |||||||
|
Total |
$ | 8,082 | $ | 6,353 | 27 | % | ||||
|
Securities and Banking |
||||||||||
|
North America |
$ | 3,553 | $ | 5,016 | (29 | )% | ||||
|
EMEA |
2,515 | 4,222 | (40 | ) | ||||||
|
Latin America |
607 | 800 | (24 | ) | ||||||
|
Asia |
1,328 | 2,162 | (39 | ) | ||||||
|
Total |
$ | 8,003 | $ | 12,200 | (34 | )% | ||||
|
Transaction Services |
||||||||||
|
North America |
$ | 639 | $ | 589 | 8 | % | ||||
|
EMEA |
833 | 844 | (1 | ) | ||||||
|
Latin America |
344 | 343 | — | |||||||
|
Asia |
621 | 598 | 4 | |||||||
|
Total |
$ | 2,437 | $ | 2,374 | 3 | % | ||||
|
Institutional Clients Group |
$ | 10,440 | $ | 14,574 | (28 | )% | ||||
|
Total Citicorp |
$ | 18,522 | $ | 20,927 | (11 | )% | ||||
|
CITI HOLDINGS |
||||||||||
|
Brokerage and Asset Management |
$ | 340 | $ | 1,607 | (79 | )% | ||||
|
Local Consumer Lending |
4,670 | 6,021 | (22 | ) | ||||||
|
Special Asset Pool |
1,540 | (4,534 | ) | NM | ||||||
|
Total Citi Holdings |
$ | 6,550 | $ | 3,094 | NM | |||||
|
Corporate/Other |
$ | 349 | $ | 500 | (30 | )% | ||||
|
Total net revenues |
$ | 25,421 | $ | 24,521 | 4 | % | ||||
|
Impact of Credit Card Securitization Activity(1) |
||||||||||
|
Citicorp |
— | $ | 1,484 | (100 | )% | |||||
|
Citi Holdings |
— | 968 | (100 | ) | ||||||
|
Total impact of credit card securitization activity |
— | $ | 2,452 | (100 | )% | |||||
|
Total Citigoup—managed net revenues (1) |
$ | 25,421 | $ | 26,973 | (6 | )% | ||||
- (1)
- See discussion of adoption of SFAS 166/167 on page 3 and Note 1 to the Consolidated Financial Statements.
NM Not meaningful
10
Citicorp is the company's global bank for consumers and businesses and represents Citi's core franchise. Citicorp is focused on providing best-in-class products and services to customers and leveraging Citigroup's unparalleled global network. Citicorp is physically present in approximately 100 countries, many for over 100 years, and offers services in over 140 countries. Citi believes this global network provides a strong foundation for servicing the broad financial services needs of large multinational clients and for meeting the needs of retail, private banking and commercial customers around the world. Citigroup's global footprint provides coverage of the world's emerging economies, which the company believes represents a strong area of growth. At March 31, 2010, Citicorp had approximately $1.2 trillion of assets and $730 billion of deposits, representing approximately 62% of Citi's total assets and approximately 88% of its deposits.
Citicorp consists of the following businesses: Regional Consumer Banking (which includes retail banking and Citi-branded cards in four regions— North America, EMEA, Latin America and Asia ) and Institutional Clients Group (which includes Securities and Banking and Transaction Services ).
|
|
First Quarter |
|
||||||||
|---|---|---|---|---|---|---|---|---|---|---|
|
|
%
Change |
|||||||||
| In millions of dollars | 2010 | 2009 | ||||||||
|
Net interest revenue |
$ | 9,870 | $ | 8,511 | 16 | % | ||||
|
Non-interest revenue |
8,652 | 12,416 | (30 | ) | ||||||
|
Total revenues, net of interest expense |
$ | 18,522 | $ | 20,927 | (11 | )% | ||||
|
Provisions for credit losses and for benefits and claims |
||||||||||
|
Net credit losses |
$ | 3,142 | $ | 1,251 | NM | |||||
|
Credit reserve build/(release) |
(360 | ) | 998 | NM | ||||||
|
Provision for loan losses |
$ | 2,782 | $ | 2,249 | 24 | % | ||||
|
Provision for benefits and claims |
44 | 42 | 5 | |||||||
|
Provision for unfunded lending commitments |
(7 | ) | 32 | NM | ||||||
|
Total provisions for credit losses and for benefits and claims |
$ | 2,819 | $ | 2,323 | 21 | % | ||||
|
Total operating expenses |
$ | 8,485 | $ | 7,399 | 15 | % | ||||
|
Income from continuing operations before taxes |
$ | 7,218 | $ | 11,205 | (36 | )% | ||||
|
Provisions for income taxes |
2,057 | 3,374 | (39 | ) | ||||||
|
Income from continuing operations |
$ | 5,161 | $ | 7,831 | (34 | )% | ||||
|
Net income (loss) attributable to noncontrolling interests |
21 | (3 | ) | NM | ||||||
|
Citicorp's net income |
$ | 5,140 | $ | 7,834 | (34 | )% | ||||
|
Balance sheet data (in billions of dollars) |
||||||||||
|
Total EOP assets |
$ | 1,236 | $ | 1,022 | 21 | % | ||||
|
Average assets |
1,240 | 1,103 | 12 | |||||||
|
Total EOP deposits |
730 | 664 | 10 | |||||||
|
Total GAAP revenues |
$ | 18,522 | $ | 20,927 | (11 | )% | ||||
|
Net impact of credit card securitization activity(1) |
— | 1,484 | (100 | ) | ||||||
|
Total managed revenues |
$ | 18,522 | $ | 22,411 | (17 | )% | ||||
|
GAAP net credit losses |
$ | 3,142 | $ | 1,251 | NM | |||||
|
Impact of credit card securitization activity(1) |
— | 1,491 | (100 | )% | ||||||
|
Total managed net credit losses |
$ | 3,142 | $ | 2,742 | 15 | % | ||||
- (1)
- See discussion of adoption of SFAS 166/167 on page 3 and Note 1 to the Consolidated Financial Statements.
NM Not meaningful
11
Regional Consumer Banking (RCB) consists of Citigroup's four regional consumer banking businesses that provide traditional banking services to retail customers. RCB also contains Citigroup's branded cards business and Citi's local commercial banking business. RCB is a globally diversified business with over 4,200 branches in 39 countries around the world. During the first quarter of 2010, 53% of total RCB revenues were from outside North America . Additionally, the majority of international revenues and loans were from emerging economies in Asia, Latin America , and Central and Eastern Europe. At March 31, 2010, RCB had $313 billion of assets and $295 billion of deposits.
|
|
First Quarter |
|
||||||||
|---|---|---|---|---|---|---|---|---|---|---|
|
|
%
Change |
|||||||||
| In millions of dollars | 2010 | 2009 | ||||||||
|
Net interest revenue |
$ | 5,917 | $ | 3,842 | 54 | % | ||||
|
Non-interest revenue |
2,165 | 2,511 | (14 | ) | ||||||
|
Total revenues, net of interest expense |
$ | 8,082 | $ | 6,353 | 27 | % | ||||
|
Total operating expenses |
$ | 3,937 | $ | 3,504 | 12 | % | ||||
|
Net credit losses |
$ | 3,040 | $ | 1,174 | NM | |||||
|
Credit reserve build/(release) |
(180 | ) | 686 | NM | ||||||
|
Provisions for benefits and claims |
44 | 42 | 5 | % | ||||||
|
Provisions for loan losses and for benefits and claims |
$ | 2,904 | $ | 1,902 | 53 | % | ||||
|
Income from continuing operations before taxes |
$ | 1,241 | $ | 947 | 31 | % | ||||
|
Income taxes |
227 | 156 | 46 | |||||||
|
Income from continuing operations |
$ | 1,014 | $ | 791 | 28 | % | ||||
|
Net (loss) attributable to noncontrolling interests |
(5 | ) | — | — | ||||||
|
Net income |
$ | 1,019 | $ | 791 | 29 | % | ||||
|
Average assets (in billions of dollars) |
$ | 308 | $ | 229 | 34 | % | ||||
|
Return on assets |
1.34 | % | 1.40 | % | ||||||
|
Average deposits (in billions of dollars) |
289 | 256 | 13 | |||||||
|
Managed net credit losses as a percentage of average managed loans |
5.57 | % | 5.06 | % | ||||||
|
Revenue by business |
||||||||||
|
Retail banking |
$ | 3,814 | $ | 3,537 | 8 | % | ||||
|
Citi-branded cards |
4,268 | 2,816 | 52 | |||||||
|
Total GAAP revenues |
$ | 8,082 | $ | 6,353 | 27 | |||||
|
Net impact of credit card securitization activity(1) |
— | 1,484 | (100 | ) | ||||||
|
Total managed revenues |
$ | 8,082 | $ | 7,837 | 3 | % | ||||
|
Net credit losses by business |
||||||||||
|
Retail banking |
$ | 289 | $ | 338 | (14 | )% | ||||
|
Citi-branded cards |
2,751 | 836 | NM | |||||||
|
Total GAAP net credit losses |
$ | 3,040 | $ | 1,174 | NM | |||||
|
Net impact of credit card securitization activity(1) |
— | 1,491 | (100 | ) | ||||||
|
Total managed net credit losses |
$ | 3,040 | $ | 2,665 | 14 | % | ||||
|
Income (loss) from continuing operations by business |
||||||||||
|
Retail banking |
$ | 848 | $ | 650 | 30 | % | ||||
|
Citi-branded cards |
166 | 141 | 18 | |||||||
|
Total |
$ | 1,014 | $ | 791 | 28 | % | ||||
- (1)
- See discussion of adoption of SFAS 166/167 on page 3 and Note 1 to the Consolidated Financial Statements.
NM Not meaningful
12
NORTH AMERICA REGIONAL CONSUMER BANKING
North America Regional Consumer Banking (NA RCB) provides traditional banking and Citi-branded card services to retail customers and small to mid-size businesses in the U.S. NA RCB 's approximately 1,000 retail bank branches and 13.5 million retail customer accounts are largely concentrated in the greater metropolitan areas of New York, Los Angeles, San Francisco, Chicago, Miami, Washington, D.C., Boston, Philadelphia, and certain larger cities in Texas. At March 31, 2010, NA RCB had approximately $31.5 billion of retail banking and residential real estate loans and $146.3 billion of deposits. In addition, NA RCB had approximately 21.8 million Citi-branded credit card accounts, with $77.7 billion in outstanding loan balances.
|
|
First Quarter |
|
||||||||
|---|---|---|---|---|---|---|---|---|---|---|
|
|
%
Change |
|||||||||
| In millions of dollars | 2010 | 2009 | ||||||||
|
Net interest revenue |
$ | 2,954 | $ | 1,192 | NM | |||||
|
Non-interest revenue |
847 | 1,311 | (35 | )% | ||||||
|
Total revenues, net of interest expense |
$ | 3,801 | $ | 2,503 | 52 | % | ||||
|
Total operating expenses |
$ | 1,611 | $ | 1,494 | 8 | % | ||||
|
Net credit losses |
$ | 2,157 | $ | 257 | NM | |||||
|
Credit reserve build |
4 | 253 | (98 | )% | ||||||
|
Provisions for benefits and claims |
8 | 13 | (38 | ) | ||||||
|
Provisions for loan losses and for benefits and claims |
$ | 2,169 | $ | 523 | NM | |||||
|
Income from continuing operations before taxes |
$ | 21 | $ | 486 | (96 | )% | ||||
|
Income taxes (benefits) |
(1 | ) | 129 | (101 | ) | |||||
|
Income from continuing operations |
$ | 22 | $ | 357 | (94 | )% | ||||
|
Net income attributable to noncontrolling interests |
— | — | — | |||||||
|
Net income |
$ | 22 | $ | 357 | (94 | )% | ||||
|
Average assets (in billions of dollars) |
$ | 121 | $ | 72 | 68 | % | ||||
|
Average deposits (in billions of dollars) |
144.2 | 130.9 | 10 | |||||||
|
Managed net credit losses as a percentage of average managed loans(1) |
7.85 | % | 6.04 | % | ||||||
|
Revenue by business |
||||||||||
|
Retail banking |
$ | 1,280 | $ | 1,296 | (1 | )% | ||||
|
Citi-branded cards |
2,521 | 1,207 | NM | |||||||
|
Total GAAP revenues |
$ | 3,801 | $ | 2,503 | 52 | |||||
|
Net impact of credit card securitization activity(2) |
— | 1,484 | (100 | ) | ||||||
|
Total managed revenues |
$ | 3,801 | $ | 3,987 | (5 | )% | ||||
|
Net credit losses by business |
||||||||||
|
Retail banking |
$ | 73 | $ | 56 | 30 | % | ||||
|
Citi-branded cards |
2,084 | 201 | NM | |||||||
|
Total GAAP net credit losses |
$ | 2,157 | $ | 257 | NM | |||||
|
Net impact of credit card securitization activity(2) |
— | 1,491 | (100 | ) | ||||||
|
Total managed net credit losses |
$ | 2,157 | $ | 1,748 | 23 | % | ||||
|
Income (loss) from continuing operations by business |
||||||||||
|
Retail banking |
$ | 184 | $ | 241 | (24 | )% | ||||
|
Citi-branded cards |
(162 | ) | 116 | NM | ||||||
|
Total |
$ | 22 | $ | 357 | (94 | )% | ||||
- (1)
-
See
"Managed Presentations" below.
- (2)
- See discussion of adoption of SFAS 166/167 on page 3 and Note 1 to the Consolidated Financial Statements.
NM Not meaningful
1Q10 vs. 1Q09
Revenues, net of interest expense , increased 52%, primarily due to the consolidation of securitized credit card receivables pursuant to the adoption of FAS 166/167 effective January 1, 2010. On a managed basis , revenues, net of interest expense , decreased 5%, primarily reflecting lower volumes in cards and mortgages, which were partially offset by pricing actions in the branded cards portfolio in the latter part of 2009 and first quarter of 2010, in anticipation of the CARD Act, and higher deposit volumes in retail banking. See "Executive Summary—Business Outlook" for additional information.
On a managed basis, net interest revenue was down 1% driven by the impact of lower volumes in cards, where average loans were down 5% from the prior-year period, and in mortgages, with average loans down 10%. This decline was also partially offset by the pricing actions in the branded cards portfolio and higher deposit volumes in retail banking, with average deposits up 10% from the prior-year period.
On a managed basis, non-interest revenue declined 15%, driven by lower gains from mortgage loan sales and lower fees in cards mainly due to a 15% decline in open accounts from the prior-year period.
13
Operating expenses increased 8% from the prior-year period. Excluding the impact of a litigation reserve in the first quarter of 2010, expenses were down 1% reflecting the benefits from re-engineering efforts and lower marketing costs.
Provisions for loan losses and for benefits and claims increased $1.6 billion primarily due to the consolidation of securitized credit card receivables pursuant to the adoption of SFAS 166/167. On a comparable basis , provisions for loan losses and for benefits and claims increased 8% primarily due to rising net credit losses in the branded cards portfolio. Trends in the macroeconomic environment, including high unemployment and increased bankruptcy filings, drove higher credit costs. The branded cards managed net credit loss ratio increased 240 basis points to 10.67%, while the retail banking net credit loss ratio increased 28 basis points to 0.94%. The increase in net credit losses was partially offset by a lower loan loss reserve build, down $249 million from the prior-year period.
Managed Presentations
|
|
First Quarter | ||||||
|---|---|---|---|---|---|---|---|
|
|
2010 | 2009 | |||||
|
Managed credit losses as a percentage of average managed loans |
7.85 | % | 6.04 | % | |||
|
Impact from credit card securitizations(1) |
— | 3.91 | % | ||||
|
Net credit losses as a percentage of average loans |
7.85 | % | 2.13 | % | |||
- (1)
- See discussion of adoption of SFAS 166/167 on page 3 and Note 1 to the Consolidated Financial Statements.
14
EMEA REGIONAL CONSUMER BANKING
EMEA Regional Consumer Banking (EMEA RCB) provides traditional banking and Citi-branded card services to retail customers and small to mid-size businesses, primarily in Central and Eastern Europe, the Middle East and Africa. Western Europe retail banking is included in Citi Holdings. EMEA RCB has repositioned its business, shifting from a strategy of widespread distribution to a focused strategy concentrating on larger urban markets within the region. An exception is Bank Handlowy, which has a mass market presence in Poland. The countries in which EMEA RCB has the largest presence are Poland, Turkey, Russia and the United Arab Emirates. At March 31, 2010, EMEA RCB had approximately 310 retail bank branches with approximately 3.7 million customer accounts, $4.9 billion in retail banking loans and $9.5 billion in deposits. In addition, the business had approximately 2.6 million Citi-branded card accounts with $2.9 billion in outstanding loan balances.
|
|
First Quarter |
|
||||||||
|---|---|---|---|---|---|---|---|---|---|---|
|
|
%
Change |
|||||||||
| In millions of dollars | 2010 | 2009 | ||||||||
|
Net interest revenue |
$ | 248 | $ | 224 | 11 | % | ||||
|
Non-interest revenue |
157 | 136 | 15 | |||||||
|
Total revenues, net of interest expense |
$ | 405 | $ | 360 | 13 | % | ||||
|
Total operating expenses |
$ | 277 | $ | 256 | 8 | % | ||||
|
Net credit losses |
$ | 97 | 89 | 9 | % | |||||
|
Credit reserve build/(release) |
(10 | ) | 72 | NM | ||||||
|
Provisions for benefits and claims |
— | — | ||||||||
|
Provisions for loan losses and for benefits and claims |
$ | 87 | $ | 161 | (46 | )% | ||||
|
Income (loss) from continuing operations before taxes |
$ | 41 | $ | (57 | ) | NM | ||||
|
Income taxes (benefits) |
14 | (24 | ) | NM | ||||||
|
Income (loss) from continuing operations |
$ | 27 | $ | (33 | ) | NM | ||||
|
Net income attributable to noncontrolling interests |
— | — | NM | |||||||
|
Net income (loss) |
$ | 27 | $ | (33 | ) | — | ||||
|
Average assets (in billions of dollars) |
$ | 10 | $ | 11 | (9 | )% | ||||
|
Return on assets |
1.10 | % | (1.22 | )% | ||||||
|
Average deposits (in billions of dollars) |
9.7 | 8.3 | 17 | |||||||
|
Net credit losses as a percentage of average loans |
4.98 | % | 4.57 | % | ||||||
|
Revenue by business |
||||||||||
|
Retail banking |
$ | 222 | $ | 205 | 8 | % | ||||
|
Citi-branded cards |
183 | 155 | 18 | |||||||
|
Total |
$ | 405 | $ | 360 | 13 | % | ||||
|
Income (loss) from continuing operations by business |
||||||||||
|
Retail banking |
$ | (6 | ) | $ | (41 | ) | 85 | % | ||
|
Citi-branded cards |
33 | 8 | NM | |||||||
|
Total |
$ | 27 | $ | (33 | ) | NM | ||||
NM Not meaningful
1Q10 vs. 1Q09
Revenues, net of interest expense, increased 13%. The increase in revenue is primarily attributable to the impact of foreign exchange translation (generally referred to throughout this report as "FX translation") and higher revenues in cards, partially offset by lower wealth management revenues due to spread compression and lower lending revenues as a result of lower volumes due to tighter origination criteria. Investment sales were up 75% and assets under management increased by 26%.
Net interest revenue increased 11% mainly due to higher cards revenues, particularly in Russia and Poland, and the impact of FX translation. Average cards loans grew 16%.
Non-interest revenue increased 15%, primarily driven by higher results from an equity investment in Turkey.
Operating expenses increased 8% mainly due to the impact of FX translation, partially offset by cost savings from branch closures, headcount reductions and re-engineering benefits.
Provisions for loan losses and for benefits and claims decreased by $74 million, to $87 million for the current period. Net credit losses for the period increased by $8 million, primarily driven by higher losses in Poland. Release in loan loss reserves in the current period was driven by improvement in the credit environment in most countries coupled with a decline in receivables. The cards net credit loss ratio increased from 4.68% in the prior year quarter to 6.97% in the current quarter. The retail banking net credit loss ratio decreased from 4.50% in the prior year quarter to 3.88% in the current quarter.
15
LATIN AMERICA REGIONAL CONSUMER BANKING
Latin America Regional Consumer Banking (LATAM RCB) provides traditional banking and Citi-branded card services to retail customers and small to mid-size businesses, with the largest presence in Mexico and Brazil. LATAM RCB includes branch networks throughout Latin America as well as Banamex, Mexico's second largest bank with over 1,700 branches. At March 31, 2010, LATAM RCB had approximately 2,203 retail branches, with 25.9 million customer accounts, $19.4 billion in retail banking loan balances and $40.6 billion in deposits. In addition, the business had approximately 12.1 million Citi-branded card accounts with $12.1 billion in outstanding loan balances.
|
|
First Quarter |
|
||||||||
|---|---|---|---|---|---|---|---|---|---|---|
|
|
%
Change |
|||||||||
| In millions of dollars | 2010 | 2009 | ||||||||
|
Net interest revenue |
$ | 1,458 | $ | 1,275 | 14 | % | ||||
|
Non-interest revenue |
618 | 649 | (5 | ) | ||||||
|
Total revenues, net of interest expense |
$ | 2,076 | $ | 1,924 | 8 | % | ||||
|
Total operating expenses |
$ | 1,142 | $ | 958 | 19 | % | ||||
|
Net credit losses |
$ | 509 | $ | 541 | (6 | )% | ||||
|
Credit reserve build/(release) |
(136 | ) | 166 | NM | ||||||
|
Provision for benefits and claims |
36 | 29 | 24 | |||||||
|
Provisions for loan losses and for benefits and claims |
$ | 409 | $ | 736 | (44 | )% | ||||
|
Income from continuing operations before taxes |
$ | 525 | $ | 230 | NM | |||||
|
Income taxes |
136 | 11 | NM | |||||||
|
Income from continuing operations |
$ | 389 | $ | 219 | 78 | % | ||||
|
Net (loss) attributable to noncontrolling interests |
(5 | ) | — | — | ||||||
|
Net income |
$ | 394 | $ | 219 | 80 | % | ||||
|
Average assets (in billions of dollars) |
$ | 72 | $ | 60 | 20 | % | ||||
|
Return on assets |
2.22 | % | 1.48 | % | ||||||
|
Average deposits (in billions of dollars) |
39.6 | 34.1 | 16 | |||||||
|
Net credit losses as a percentage of average loans |
6.75 | % | 8.22 | % | ||||||
|
Revenue by business |
||||||||||
|
Retail banking |
$ | 1,196 | $ | 1,026 | 17 | % | ||||
|
Citi-branded cards |
880 | 898 | (2 | ) | ||||||
|
Total |
$ | 2,076 | $ | 1,924 | 8 | % | ||||
|
Income (loss) from continuing operations by business |
||||||||||
|
Retail banking |
$ | 256 | $ | 230 | 11 | % | ||||
|
Citi-branded cards |
133 | (11 | ) | NM | ||||||
|
Total |
$ | 389 | $ | 219 | 78 | % | ||||
NM Not meaningful
1Q10 vs. 1Q09
Revenues, net of interest expense , increased 8%, mainly due to the impact of FX translation and higher lending and deposit volumes in retail banking, partially offset by spread compression in the cards portfolio.
Net interest revenue increased 14%, mainly driven by the impact of FX translation and higher lending and deposit volumes in retail banking. Average retail banking loans and deposits increased 21% and 16%, respectively. The increase in retail banking was partially offset by spread compression in the cards portfolio as a result from a lower risk profile.
Non-interest revenue decreased 5%, primarily due to lower fees in the cards business. These declines were partially offset by higher investment sale revenues. Investment sales increased 24% compared to the prior-year period.
Operating expenses increased 19% mainly due to the impact of FX translation. Excluding the impact of FX translation, the increase in operating expenses was driven by the absence of an equity compensation accrual reversal in the prior-year period and the cost of 138 additional branch openings.
Provisions for loan losses and for benefits and claims decreased 44%, mainly driven by a loan loss reserve release in the current period reflecting improved credit conditions, especially in Mexico cards. The cards net credit loss ratio declined across the region during the period, from 15.3% to 14.0%, reflecting continued economic recovery in the region. The retail banking net credit loss ratio dropped significantly from 2.96% to 1.96%.
16
ASIA REGIONAL CONSUMER BANKING
Asia Regional Consumer Banking (Asia RCB) provides traditional banking and Citi-branded card services to retail customers and small to mid-size businesses, with the largest Citi presence in South Korea, Australia, Singapore, India, Taiwan, Malaysia, Japan and Hong Kong. At March 31, 2010, Asia RCB had approximately 704 retail branches, $98.4 billion in customer deposits, 16.1 million customer accounts and $54.8 billion in retail banking loans. In addition, the business had approximately 14.8 million Citi-branded card accounts with $17.5 billion in outstanding loan balances.
|
|
First Quarter |
|
||||||||
|---|---|---|---|---|---|---|---|---|---|---|
|
|
%
Change |
|||||||||
| In millions of dollars | 2010 | 2009 | ||||||||
|
Net interest revenue |
$ | 1,257 | $ | 1,151 | 9 | % | ||||
|
Non-interest revenue |
543 | 415 | 31 | |||||||
|
Total revenues, net of interest expense |
$ | 1,800 | $ | 1,566 | 15 | % | ||||
|
Total operating expenses |
$ | 907 | $ | 796 | 14 | % | ||||
|
Net credit losses |
$ | 277 | $ | 287 | (3 | )% | ||||
|
Credit reserve build/(release) |
(38 | ) | 195 | NM | ||||||
|
Provisions for loan losses and for benefits and claims |
$ | 239 | $ | 482 | (50 | )% | ||||
|
Income from continuing operations before taxes |
$ | 654 | $ | 288 | NM | |||||
|
Income taxes |
78 | 40 | 95 | % | ||||||
|
Income from continuing operations |
$ | 576 | $ | 248 | NM | |||||
|
Net income attributable to noncontrolling interests |
— | — | — | |||||||
|
Net income |
$ | 576 | $ | 248 | NM | |||||
|
Average assets (in billions of dollars) |
$ | 105 | $ | 86 | 22 | % | ||||
|
Return on assets |
2.22 | % | 1.17 | % | ||||||
|
Average deposits (in billions of dollars) |
95.7 | 83.1 | 15 | |||||||
|
Net credit losses as a percentage of average loans |
1.57 | % | 1.89 | % | ||||||
|
Revenue by business |
||||||||||
|
Retail banking |
$ | 1,116 | $ | 1,010 | 10 | % | ||||
|
Citi-branded cards |
684 | 556 | 23 | |||||||
|
Total |
$ | 1,800 | $ | 1,566 | 15 | % | ||||
|
Income from continuing operations by business |
||||||||||
|
Retail banking |
$ | 414 | $ | 220 | 88 | % | ||||
|
Citi-branded cards |
162 | 28 | NM | |||||||
|
Total |
$ | 576 | $ | 248 | NM | |||||
NM Not meaningful
1Q10 vs. 1Q09
Revenues, net of interest expense increased 15% reflecting the impact of FX translation as well as higher cards purchase sales, investment sales and loan and deposit volumes, partially offset by spread compression in deposits.
Net interest revenue was 9% higher than the prior-year period, mainly due to the impact of FX translation, and higher lending and deposit volumes. Excluding the impact of FX translation, net interest revenue was essentially flat. Average loans and deposits were up 16% and 15%, respectively, driven mostly by the impact of FX translation. While lending spreads remained relatively constant, lower deposit spreads reflected the continued low interest rate environment across the region.
Non-interest revenue increased 31%, primarily due to higher investment revenues, higher cards purchase sales, and the impact of FX translation.
Operating expenses increased 14%, primarily due to the impact of FX translation. Excluding the impact of FX translation, the increase was 4%, driven primarily by an increase in volumes and continued investment.
Provisions for loan losses and for benefits and claims decreased 50%, mainly due to the impact of a $38 million loan loss reserve release in the first quarter of 2010, compared to a $195 million loan loss reserve build in the prior-year quarter, and lower net credit losses. These declines were partially offset by the impact of FX translation. Delinquencies and net credit losses improved as Asia showed continuing signs of economic recovery and increased levels of customer activity. The cards net credit loss ratio decreased from 4.60% in the prior year period to 4.50% in the current quarter. The retail banking net credit loss ratio decreased from 0.98% in the prior year quarter to 0.60% in the current quarter.
17
Institutional Clients Group (ICG) includes Securities and Banking and Transaction Services . ICG provides corporate, institutional and high net worth clients with a full range of products and services, including cash management, trading, underwriting, lending and advisory services, around the world. ICG 's international presence is supported by trading floors in approximately 75 countries and a proprietary network within Transaction Services in approximately 95 countries. At March 31, 2010, ICG had approximately $923 billion of assets and $435 billion of deposits.
|
|
First Quarter |
|
||||||||
|---|---|---|---|---|---|---|---|---|---|---|
|
|
%
Change |
|||||||||
| In millions of dollars | 2010 | 2009 | ||||||||
|
Commissions and fees |
$ | 554 | $ | 440 | 26 | % | ||||
|
Administration and other fiduciary fees |
1,275 | 1,227 | 4 | |||||||
|
Investment banking |
953 | 941 | 1 | |||||||
|
Principal transactions |
3,344 | 6,950 | (52 | ) | ||||||
|
Other |
361 | 347 | 4 | |||||||
|
Total non-interest revenue |
$ | 6,487 | $ | 9,905 | (35 | )% | ||||
|
Net interest revenue (including dividends) |
3,953 | 4,669 | (15 | ) | ||||||
|
Total revenues, net of interest expense |
$ | 10,440 | $ | 14,574 | (28 | )% | ||||
|
Total operating expenses |
4,548 | 3,895 | 17 | |||||||
|
Net credit losses |
102 | 77 | 32 | |||||||
|
Provision for unfunded lending commitments |
(7 | ) | 32 | NM | ||||||
|
Credit reserve build/(release) |
(180 | ) | 312 | NM | ||||||
|
Provisions for benefits and claims |
— | — | — | |||||||
|
Provisions for loan losses and benefits and claims |
$ | (85 | ) | $ | 421 | NM | ||||
|
Income from continuing operations before taxes |
$ | 5,977 | $ | 10,258 | (42 | )% | ||||
|
Income taxes |
1,830 | 3,218 | (43 | ) | ||||||
|
Income from continuing operations |
$ | 4,147 | $ | 7,040 | (41 | )% | ||||
|
Net income (loss) attributable to noncontrolling interests |
26 | (3 | ) | NM | ||||||
|
Net income |
$ | 4,121 | $ | 7,043 | (41 | )% | ||||
|
Average assets (in billions of dollars) |
$ | 932 | $ | 874 | 7 | % | ||||
|
Return on assets |
1.79 | % | 3.27 | % | ||||||
|
Revenues by region |
||||||||||
|
North America |
$ | 4,192 | $ | 5,605 | (25 | )% | ||||
|
EMEA |
3,348 | 5,066 | (34 | ) | ||||||
|
Latin America |
951 | 1,143 | (17 | ) | ||||||
|
Asia |
1,949 | 2,760 | (29 | ) | ||||||
|
Total |
$ | 10,440 | $ | 14,574 | (28 | )% | ||||
|
Income from continuing operations by region |
||||||||||
|
North America |
$ | 1,583 | $ | 2,635 | (40 | )% | ||||
|
EMEA |
1,338 | 2,497 | (46 | ) | ||||||
|
Latin America |
429 | 572 | (25 | ) | ||||||
|
Asia |
797 | 1,336 | (40 | ) | ||||||
|
Total |
$ | 4,147 | $ | 7,040 | (41 | )% | ||||
|
Average loans by region (in billions of dollars) |
||||||||||
|
North America |
$ | 64 | $ | 57 | 12 | % | ||||
|
EMEA |
36 | 48 | (25 | ) | ||||||
|
Latin America |
22 | 21 | 5 | |||||||
|
Asia |
31 | 30 | 3 | |||||||
|
Total |
$ | 153 | $ | 156 | (2 | )% | ||||
NM Not meaningful
18
Securities and Banking (S&B) offers a wide array of investment and commercial banking services and products for corporations, governments, institutional and retail investors, and ultra-high net worth individuals. S&B includes investment banking and advisory services, lending, debt and equity sales and trading, institutional brokerage, foreign exchange, structured products, cash instruments and related derivatives, and private banking. S&B revenue is generated primarily from fees for investment banking and advisory services, fees and interest on loans, fees and spread on foreign exchange, structured products, cash instruments and related derivatives, income earned on principal transactions, and fees and spreads on private banking services.
|
|
First Quarter |
|
|||||||||
|---|---|---|---|---|---|---|---|---|---|---|---|
|
|
%
Change |
||||||||||
| In millions of dollars | 2010 | 2009 | |||||||||
|
Net interest revenue |
$ | 2,565 | $ | 3,263 | (21 | )% | |||||
|
Non-interest revenue |
5,438 | 8,937 | (39 | ) | |||||||
|
Revenues, net of interest expense |
$ | 8,003 | $ | 12,200 | (34 | )% | |||||
|
Total operating expenses |
3,397 | 2,821 | 20 | ||||||||
|
Net credit losses |
101 | 74 | 36 | ||||||||
|
Provisions for unfunded lending commitments |
(7 | ) | 32 | NM | |||||||
|
Credit reserve build/(release) |
(162 | ) | 314 | NM | |||||||
|
Provisions for benefits and claims |
— | — | — | ||||||||
|
Provisions for loan losses and benefits and claims |
$ | (68 | ) | $ | 420 | NM | |||||
|
Income before taxes and noncontrolling interests |
$ | 4,674 | $ | 8,959 | (48 | )% | |||||
|
Income taxes |
1,468 | 2,823 | (48 | ) | |||||||
|
Income from continuing operations |
3,206 | 6,136 | (48 | ) | |||||||
|
Net income attributable to noncontrolling interests |
21 | 1 | NM | ||||||||
|
Net income |
$ | 3,185 | $ | 6,135 | (48 | )% | |||||
|
Average assets (in billions of dollars) |
$ | 868 | $ | 816 | 6 | % | |||||
|
Return on assets |
1.49 | % | 3.05 | % | |||||||
|
Revenues by region |
|||||||||||
|
North America |
$ | 3,553 | $ | 5,016 | (29 | )% | |||||
|
EMEA |
2,515 | 4,222 | (40 | ) | |||||||
|
Latin America |
607 | 800 | (24 | ) | |||||||
|
Asia |
1,328 | 2,162 | (39 | ) | |||||||
|
Total revenues |
$ | 8,003 | $ | 12,200 | (34 | )% | |||||
|
Net income from continuing operations by region |
|||||||||||
|
North America |
$ | 1,424 | $ | 2,497 | (43 | )% | |||||
|
EMEA |
1,032 | 2,171 | (52 | ) | |||||||
|
Latin America |
272 | 412 | (34 | ) | |||||||
|
Asia |
478 | 1,056 | (55 | ) | |||||||
|
Total net income from continuing operations |
$ | 3,206 | $ | 6,136 | (48 | )% | |||||
|
Securities and Banking revenue details |
|||||||||||
|
Total investment banking |
$ | 1,057 | $ | 983 | 8 | % | |||||
|
Lending |
243 | (363 | ) | NM | |||||||
|
Equity markets |
1,213 | 1,605 | (24 | ) | |||||||
|
Fixed income markets |
5,380 | 10,023 | (46 | ) | |||||||
|
Private bank |
494 | 504 | (2 | ) | |||||||
|
Other Securities and Banking |
(384 | ) | (552 | ) | 30 | ||||||
|
Total Securities and Banking revenues |
$ | 8,003 | $ | 12,200 | (34 | )% | |||||
NM Not meaningful
19
1Q10 vs. 1Q09
Revenues, net of interest expense , in the first quarter of 2010, were $8.0 billion, compared to $12.2 billion in the first quarter of 2009, which was a particularly strong quarter driven by strong fixed income markets revenues, as well as $2.7 billion of positive CVA (versus $0.3 billion of positive CVA in the first quarter of 2010). Fixed income markets revenues excluding CVA declined $2.4 billion to $5.1 billion, driven by the high volatility and historically wide spreads exhibited in the first quarter of 2009. Equity markets revenues declined $0.4 billion to $1.2 billion, due to a challenging market environment as volatility trended downward. The $2.4 billion CVA decrease primarily reflected less significant movements in Citigroup spreads in the first quarter of 2010 compared to the prior year period. Investment banking revenues increased $74 million to $1.1 billion, led by stronger market volumes in equity underwriting and increased revenues in debt underwriting due to outperformance in leveraged finance and a strong high-yield bond market in the first quarter of 2010. This was partially offset by a decline in advisory revenues in the first quarter of 2010 resulting from a reduction in completed M&A transaction volume. Lending revenues increased from $(363) million to positive $243 million, driven by a reduction in losses on credit default swap hedges and an improvement in net interest margin.
Operating expenses increased 20%, or $0.6 billion to $3.4 billion, mainly driven by higher compensation costs.
Provisions for loan losses and for benefits and claims decreased by $0.5 billion to negative $68 million, primarily attributable to a $162 million net loan loss reserve release in the current quarter (versus a $314 million net loan loss reserve build in the prior year period) as the environment showed signs of stabilization, partially offset by higher net credit losses.
20
Transaction Services is composed of Treasury and Trade Solutions (TTS) and Securities and Fund Services (SFS). TTS provides comprehensive cash management and trade finance for corporations, financial institutions and public sector entities worldwide. SFS provides custody and funds services to investors such as insurance companies and mutual funds, clearing services to intermediaries such as broker-dealers, and depository and agency/trust services to multinational corporations and governments globally. Revenue is generated from net interest revenue on deposits in TTS and SFS, as well as from trade loans and from fees for transaction processing and fees on assets under custody in SFS.
|
|
First Quarter |
|
||||||||
|---|---|---|---|---|---|---|---|---|---|---|
|
|
%
Change |
|||||||||
| In millions of dollars | 2010 | 2009 | ||||||||
|
Net interest revenue |
$ | 1,388 | $ | 1,406 | (1 | )% | ||||
|
Non-interest revenue |
1,049 | 968 | 8 | |||||||
|
Total revenues, net of interest expense |
$ | 2,437 | $ | 2,374 | 3 | % | ||||
|
Total operating expenses |
1,151 | 1,074 | 7 | |||||||
|
Provisions for loan losses and for benefits and claims |
(17 | ) | 1 | NM | ||||||
|
Income before taxes and noncontrolling interests |
$ | 1,303 | $ | 1,299 | — | |||||
|
Income taxes |
362 | 395 | (8 | )% | ||||||
|
Income from continuing operations |
941 | 904 | 4 | |||||||
|
Net income (loss) attributable to noncontrolling interests |
5 | (4 | ) | NM | ||||||
|
Net income |
$ | 936 | $ | 908 | 3 | % | ||||
|
Average assets (in billions of dollars) |
$ | 64 | $ | 58 | 10 | % | ||||
|
Return on assets |
5.93 | % | 6.35 | % | ||||||
|
Revenues by region |
||||||||||
|
North America |
$ | 639 | $ | 589 | 8 | % | ||||
|
EMEA |
833 | 844 | (1 | ) | ||||||
|
Latin America |
344 | 343 | — | |||||||
|
Asia |
621 | 598 | 4 | |||||||
|
Total revenues |
$ | 2,437 | $ | 2,374 | 3 | % | ||||
|
Revenue Details |
||||||||||
|
Treasury and Trade Solutions |
$ | 1,781 | $ | 1,750 | 2 | % | ||||
|
Securities and Fund Services |
656 | 624 | 5 | |||||||
|
Total revenues |
$ | 2,437 | $ | 2,374 | 3 | % | ||||
|
Income from continuing operations by region |
||||||||||
|
North America |
$ | 159 | $ | 138 | 15 | % | ||||
|
EMEA |
306 | 326 | (6 | ) | ||||||
|
Latin America |
157 | 160 | (2 | ) | ||||||
|
Asia |
319 | 280 | 14 | |||||||
|
Total net income from continuing operations |
$ | 941 | $ | 904 | 4 | % | ||||
|
Key indicators (in billions of dollars) |
||||||||||
|
Average deposits and other customer liability balances |
$ | 319 | $ | 278 | 15 | % | ||||
|
EOP assets under custody (in trillions of dollars) |
11.8 | 10.5 | 12 | |||||||
NM Not meaningful
1Q10 vs. 1Q09
Revenues, net of interest expense, grew 3% as improvement in fees in both the TTS and SFS businesses more than offset spread compression. Average deposits and Assets under custody were up 15% and 12%, respectively, from a year ago.
Treasury and Trade Solutions revenue increased 2%, driven primarily by stronger performances in the Trade business as well as increased balances, offset partially by spread compression.
Securities and Funds Services revenues increased 5%, driven by higher asset valuations and volumes.
Operating expenses increased 7%, related to continued increased investment spend required to support future business growth.
Provisions for loan losses and for benefits and claims declined by $18 million, primarily attributable to overall portfolio improvement.
21
Citi Holdings contains businesses and portfolios of assets that Citigroup has determined are not central to its core Citicorp business. These noncore businesses tend to be more asset-intensive and reliant on wholesale funding and also may be product-driven rather than client-driven. Citi intends to exit these businesses as quickly as practicable yet in an economically rational manner through business divestitures, portfolio run-off and asset sales. Citi has made substantial progress divesting and exiting businesses from Citi Holdings, having completed 20 divestitures since the beginning of 2009 through March 31, 2010, including Smith Barney, Nikko Cordial Securities, Nikko Asset Management, Financial Institution Credit Card business (FI) and Diners Club North America. Citi Holdings' assets have been reduced by approximately 16%, or $96 billion, from the first quarter of 2009 and 39% from the peak in the first quarter of 2008. Citi Holdings' assets represented approximately 25% of Citi's assets as of March 31, 2010. Asset reductions from Citi Holdings have the combined benefits of further fortifying Citigroup's capital base, lowering risk, simplifying the organization and allowing Citi to allocate capital to fund long-term strategic businesses.
Citi Holdings consists of the following businesses: Brokerage and Asset Management; Local Consumer Lending; and Special Asset Pool.
|
|
First Quarter |
|
||||||||
|---|---|---|---|---|---|---|---|---|---|---|
|
|
%
Change |
|||||||||
| In millions of dollars | 2010 | 2009 | ||||||||
|
Net interest revenue |
$ | 4,373 | $ | 5,057 | (14 | )% | ||||
|
Non-interest revenue |
2,177 | (1,963 | ) | NM | ||||||
|
Total revenues, net of interest expense |
$ | 6,550 | $ | 3,094 | NM | |||||
|
Provisions for credit losses and for benefits and claims |
||||||||||
|
Net credit losses |
$ | 5,241 | $ | 6,027 | (13 | )% | ||||
|
Credit reserve build |
340 | 1,637 | (79 | ) | ||||||
|
Provision for loan losses |
$ | 5,581 | $ | 7,664 | (27 | )% | ||||
|
Provision for benefits and claims |
243 | 290 | (16 | ) | ||||||
|
Provision for unfunded lending commitments |
(26 | ) | 28 | NM | ||||||
|
Total provisions for credit losses and for benefits and claims |
$ | 5,798 | $ | 7,982 | (27 | )% | ||||
|
Total operating expenses |
$ | 2,574 | $ | 4,185 | (38 | )% | ||||
|
(Loss) from continuing operations before taxes |
$ | (1,822 | ) | $ | (9,073 | ) | 80 | % | ||
|
Benefits for income taxes |
(946 | ) | (3,588 | ) | 74 | |||||
|
Income (loss) from continuing operations |
$ | (876 | ) | $ | (5,485 | ) | 84 | % | ||
|
Net income (loss) attributable to noncontrolling interests |
11 | (11 | ) | NM | ||||||
|
Citi Holdings net (loss) |
$ | (887 | ) | $ | (5,474 | ) | 84 | % | ||
|
Balance sheet data (in billions of dollars) |
||||||||||
|
Total EOP assets |
$ | 503 | $ | 599 | (16 | )% | ||||
|
Total EOP deposits |
$ | 86 | $ | 85 | 1 | % | ||||
|
Total GAAP Revenues |
$ | 6,550 | $ | 3,094 | NM | |||||
|
Net Impact of Credit Card Securitization Activity(1) |
— | 968 | (100 | )% | ||||||
|
Total Managed Revenues |
$ | 6,550 | $ | 4,062 | 61 | % | ||||
|
GAAP Net Credit Losses |
$ | 5,241 | $ | 6,027 | (13 | )% | ||||
|
Impact of Credit Card Securitization Activity(1) |
— | 1,057 | (100 | ) | ||||||
|
Total Managed Net Credit Losses |
$ | 5,241 | $ | 7,084 | (26 | )% | ||||
- (1)
- See discussion of adoption of SFAS 166/167 on page 3 and Note 1 to the Consolidated Financial Statements.
NM Not meaningful
22
BROKERAGE AND ASSET MANAGEMENT
Brokerage and Asset Management (BAM) , which constituted approximately 6% of Citi Holdings by assets as of March 31, 2010, consists of Citi's global retail brokerage and asset management businesses. This segment was substantially affected by, and reduced in size in 2009 due to, the divestitures of Smith Barney (to the Morgan Stanley Smith Barney joint venture (MSSB JV)) and Nikko Cordial Securities. At March 31, 2010, BAM had approximately $31 billion of assets, primarily consisting of Citi's investment in, and associated earnings from, the MSSB JV. Morgan Stanley has options to purchase Citi's remaining stake in the MSSB JV over three years starting in 2012.
|
|
First Quarter |
|
|||||||||
|---|---|---|---|---|---|---|---|---|---|---|---|
|
|
%
Change |
||||||||||
| In millions of dollars | 2010 | 2009 | |||||||||
|
Net interest revenue |
$ | (65 | ) | $ | 364 | NM | |||||
|
Non-interest revenue |
405 | 1,243 | (67 | )% | |||||||
|
Total revenues, net of interest expense |
$ | 340 | $ | 1,607 | (79 | )% | |||||
|
Total operating expenses |
$ | 265 | $ | 1,499 | (82 | )% | |||||
|
Net credit losses |
$ | 11 | $ | — | — | ||||||
|
Credit reserve build/(release) |
(7 | ) | 43 | — | |||||||
|
Provision for unfunded lending commitments |
— | — | — | ||||||||
|
Provision for benefits and claims |
9 | 11 | (18 | )% | |||||||
|
Provisions for loan losses and for benefits and claims |
$ | 13 | $ | 54 | (76 | )% | |||||
|
Income from continuing operations before taxes |
$ | 62 | $ | 54 | 15 | % | |||||
|
Income taxes (benefits) |
(19 | ) | 20 | NM | |||||||
|
Income from continuing operations |
$ | 81 | $ | 34 | NM | ||||||
|
Net (loss) attributable to noncontrolling interests |
(5 | ) | (17 | ) | 71 | % | |||||
|
Net income |
$ | 86 | $ | 51 | 69 | % | |||||
|
EOP assets (in billions of dollars) |
$ | 31 | $ | 47 | (34 | )% | |||||
|
EOP deposits (in billions of dollars) |
59 | 59 | — | ||||||||
NM Not meaningful
1Q10 vs. 1Q09
Revenues, net of interest expense, decreased 79% from the prior-year period, primarily driven by the absence of Smith Barney revenue, partially offset by favorable net revenue marks in retail alternative investments and the sale of Chilean pension fund administrator AFP Habitat.
Operating expenses decreased 82% from the prior-year period, mainly driven by the absence of Smith Barney expenses and the absence of restructuring expenses in retail alternative investments incurred in the first quarter of 2009.
Provisions for loan losses and for benefits and claims decreased 76%, driven by a $50 million change in the reserve build in the first quarter of 2010.
Assets declined 34% versus the prior-year period, mostly driven by the sales of Nikko Cordial Securities and Nikko Asset Management, offset partially by the net impact of the MSSB JV.
23
Local Consumer Lending (LCL) , which constituted approximately 69% of Citi Holdings by assets as of March 31, 2010, includes a portion of Citigroup's North American mortgage business, retail partner cards, Western European cards and retail banking, CitiFinancial North America, Primerica (whose IPO closed on April 7, 2010), Student Loan Corporation and other local consumer finance businesses globally. At March 31, 2010, LCL had $346 billion of assets ($314 billion in North America ). Approximately $152 billion of assets in LCL as of March 31, 2010 consisted of U.S. mortgages in the company's CitiMortgage and CitiFinancial operations. The North American assets consist of residential mortgage loans, retail partner card loans, student loans, personal loans, auto loans, commercial real estate, and other consumer loans and assets.
|
|
First Quarter |
|
||||||||||
|---|---|---|---|---|---|---|---|---|---|---|---|---|
|
|
%
Change |
|||||||||||
| In millions of dollars | 2010 | 2009 | ||||||||||
|
Net interest revenue |
$ | 4,020 | $ | 3,704 | 9 | % | ||||||
|
Non-interest revenue |
650 | 2,317 | (72 | ) | ||||||||
|
Total revenues, net of interest expense |
$ | 4,670 | $ | 6,021 | (22 | )% | ||||||
|
Total operating expenses |
$ | 2,178 | $ | 2,470 | (12 | )% | ||||||
|
Net credit losses |
$ | 4,938 | $ | 4,517 | 9 | % | ||||||
|
Credit reserve build |
386 | 1,562 | (75 | ) | ||||||||
|
Provision for benefits and claims |
234 | 279 | (16 | ) | ||||||||
|
Provision for unfunded lending commitments |
— | — | — | |||||||||
|
Provisions for loan losses and for benefits and claims |
$ | 5,558 | $ | 6,358 | (13 | )% | ||||||
|
(Loss) from continuing operations before taxes |
$ | (3,066 | ) | $ | (2,807 | ) | (9 | )% | ||||
|
Income taxes (benefits) |
(1,228 | ) | (1,236 | ) | 1 | |||||||
|
(Loss) from continuing operations |
$ | (1,838 | ) | $ | (1,571 | ) | (17 | )% | ||||
|
Net income attributable to noncontrolling interests |
— | 7 | (100 | ) | ||||||||
|
Net (loss) |
$ | (1,838 | ) | $ | (1,578 | ) | (16 | )% | ||||
|
Average assets (in billions of dollars) |
$ | 355 | $ | 368 | (4 | )% | ||||||
|
Managed net credit losses as a percentage of average managed loans(1) |
6.30 | % | 6.36 | % | ||||||||
|
Revenue by business |
||||||||||||
|
International |
$ | 335 | $ | 2,024 | (83 | )% | ||||||
|
Retail Partner Cards |
2,206 | 1,527 | 44 | |||||||||
|
North America (ex Cards) |
2,129 | 2,470 | (14 | ) | ||||||||
|
Total GAAP Revenues |
$ | 4,670 | $ | 6,021 | (22 | )% | ||||||
|
Net impact of credit card securitization activity(2) |
— | 968 | (100 | ) | ||||||||
|
Total Managed Revenues |
$ | 4,670 | $ | 6,989 | (33 | )% | ||||||
|
Net Credit Losses by business |
||||||||||||
|
International |
$ | 612 | $ | 818 | (25 | )% | ||||||
|
Retail partner cards |
1,932 | 901 | NM | |||||||||
|
North America (ex Cards) |
2,394 | 2,798 | (14 | ) | ||||||||
|
Total GAAP net credit losses |
$ | 4,938 | $ | 4,517 | 9 | % | ||||||
|
Net impact of credit card securitization activity(2) |
— | 1,057 | (100 | ) | ||||||||
|
Total Managed Net Credit Losses |
$ | 4,938 | $ | 5,574 | (11 | )% | ||||||
- (1)
-
See
"Managed Presentations" below.
- (2)
- See discussion of adoption of SFAS 166/167 on page 3 and Note 1 to the Consolidated Financial Statements.
1Q10 vs. 1Q09
Revenues, net of interest expense decreased 22% from the prior-year period, mostly due to lower non-interest revenue (discussed below). Net interest revenue increased 9% primarily due to the adoption of SFAS 166/167 in the first quarter of 2010 and the impact of retail partner cards pricing actions in the latter part of 2009 and first quarter of 2010, in anticipation of the CARD Act. See "Executive Summary—Business Outlook" for additional information. This was partially offset by lower balances and the impact of higher delinquencies, interest write-offs, and loan modification programs. Non-interest revenue decreased 72% mainly driven by the absence of the $1.1 billion gain on the sale of Redecard shares in the prior-year period, losses on asset sales, and the adoption of SFAS 166/167 in the current quarter.
Operating expenses declined 12% due to lower volumes, re-engineering benefits, and the absence of costs associated with the U.S. government loss-sharing agreement which was exited in the fourth quarter of 2009.
Provisions for loan losses and for benefits and claims decreased 13% from the prior period reflecting a $1.2 billion decrease in the reserve build, partially offset by higher net credit losses (NCLs) primarily in the retail partner cards business due to the adoption of SFAS 166/167. On a managed basis, NCLs were lower across most businesses, primarily reflecting lower severity of loss, sales of non-performing assets, and the impact of modification programs in real estate, as well as an improvement in international credit trends.
24
Managed Presentations
|
|
First Quarter | ||||||
|---|---|---|---|---|---|---|---|
|
|
2010 | 2009 | |||||
|
Managed credit losses as a percentage of average managed loans |
6.30 | % | 6.36 | % | |||
|
Impact from credit card securitizations(1) |
— | 0.62 | |||||
|
Net credit losses as a percentage of average loans |
6.30 | % | 5.74 | % | |||
- (1)
- See discussion of adoption of SFAS 166/167 on page 3 and Note 1 to the Consolidated Financial Statements.
Assets declined 4% versus the prior-year period primarily driven by portfolio run-off, higher loan loss reserve balances, and the impact of asset sales and divestitures, partially offset by an increase of $41 billion resulting from the adoption of SFAS 166/167.
25
Special Asset Pool (SAP) , which constituted approximately 25% of Citi Holdings by assets as of March 31, 2010, is a portfolio of securities, loans and other assets that Citigroup intends to actively reduce over time through asset sales and portfolio run-off. At March 31, 2010, SAP had $126 billion of assets. SAP assets have declined by $202 billion, or 62% from peak levels in the fourth quarter of 2007 reflecting cumulative asset sales, write-downs and portfolio run-off. Approximately 58% of SAP assets are now accounted for on an accrual basis, which has helped reduce income volatility.
|
|
First Quarter |
|
||||||||
|---|---|---|---|---|---|---|---|---|---|---|
|
|
%
Change |
|||||||||
| In millions of dollars | 2010 | 2009 | ||||||||
|
Net interest revenue |
$ | 418 | $ | 989 | (58 | )% | ||||
|
Non-interest revenue |
1,122 | (5,523 | ) | NM | ||||||
|
Revenues, net of interest expense |
$ | 1,540 | $ | (4,534 | ) | NM | ||||
|
Total operating expenses |
131 | 216 | (39 | )% | ||||||
|
Net credit losses |
$ | 292 | $ | 1,510 | (81 | )% | ||||
|
Provision for unfunded lending commitments |
(26 | ) | 28 | NM | ||||||
|
Credit reserve builds/(release) |
(39 | ) | 32 | NM | ||||||
|
Provisions for loan losses and for benefits and claims |
$ | 227 | $ | 1,570 | (86 | )% | ||||
|
Income (loss) from continuing operations before taxes |
$ | 1,182 | $ | (6,320 | ) | NM | ||||
|
Income taxes (benefits) |
301 | (2,372 | ) | NM | ||||||
|
Income (loss) from continuing operations |
$ | 881 | $ | (3,948 | ) | NM | ||||
|
Net income (loss) attributable to noncontrolling interests |
16 | (1 | ) | NM | ||||||
|
Net income (loss) |
$ | 865 | $ | (3,947 | ) | NM | ||||
|
EOP assets (in billions of dollars) |
$ | 126 | $ | 193 | (35 | )% | ||||
NM Not meaningful
1Q10 vs. 1Q09
Revenues, net of interest expense, increased $6.1 billion from the prior-year period primarily due to favorable net revenue marks relative to the year-ago levels (positive net revenue marks of $1.4 billion in the first quarter of 2010 versus negative net revenue marks of $4.5 billion in the prior year period). Revenue in the current quarter included positive marks of $804 million on subprime-related direct exposures, $398 million related to CVA on the monoline insurers, and $395 million related to non-credit accretion, offset by negative revenues of $164 million on Alt-A mortgages and $48 million of other net write-downs and losses.
Operating expenses decreased 39% primarily driven by the absence of costs associated with the U.S. government loss-sharing agreement which was exited in the fourth quarter of 2009, lower franchise taxes, legal fees, and transaction expenses.
Provisions for loan losses and for benefits and claims decreased 86% to $227 million, driven by a $1.2 billion decrease in net credit losses.
Assets declined $67 billion, or 35% , versus the prior-year period, primarily driven by amortization and prepayments, sales, marks and charge-offs.
26
The following table provides details of the composition of SAP assets as of March 31, 2010.
|
|
Assets within Special Asset Pool as of
March 31, 2010 |
|||||||||
|---|---|---|---|---|---|---|---|---|---|---|
| In billions of dollars |
Carrying
value of assets |
Face value |
Carrying value
as % of face value |
|||||||
|
Securities in Available-for-Sale (AFS) |
||||||||||
|
Corporates |
$ | 7.6 | $ | 7.8 | 98 | % | ||||
|
Prime and non-U.S. mortgage-backed securities (MBS) |
4.7 | 5.8 | 81 | |||||||
|
Auction rate securities (ARS) |
2.4 | 2.9 | 82 | |||||||
|
Other securities(1) |
1.7 | 1.9 | 89 | |||||||
|
Total securities in AFS |
$ | 16.4 | $ | 18.4 | 89 | % | ||||
|
Securities in Held-to-Maturity (HTM) |
||||||||||
|
Prime and non-U.S. MBS |
$ | 11.8 | $ | 14.5 | 81 | % | ||||
|
Alt-A mortgages |
10.3 | 20.2 | 51 | |||||||
|
Corporates |
7.6 | 8.7 | 87 | |||||||
|
ARS |
5.3 | 7.4 | 72 | |||||||
|
Other securities(2) |
7.4 | 9.9 | 74 | |||||||
|
Total securities in HTM |
$ | 42.4 | $ | 60.7 | 70 | |||||
|
Loans, leases and letters of credit (LCs) in Held-for-Investment (HFI)/Held-for-Sale (HFS)(3) |
||||||||||
|
Corporates |
$ | 13.8 | $ | 15.2 | 91 | % | ||||
|
Commercial real estate (CRE) |
9.2 | 10.7 | 86 | |||||||
|
Other |
2.6 | 3.2 | 81 | |||||||
|
Loan loss reserves |
(3.5 | ) | NM | NM | ||||||
|
Total loans, leases and LCs in HFI/HFS |
$ | 22.1 | NM | NM | ||||||
|
Mark-to-market |
||||||||||
|
Subprime securities |
$ | 5.9 | $ | 12.7 | 46 | % | ||||
|
Other securities(4) |
5.3 | 23.2 | 23 | |||||||
|
Derivatives |
6.8 | NM | NM | |||||||
|
Loans, leases and letters of credit |
4.2 | 6.8 | 63 | |||||||
|
Repurchase agreements |
6.4 | NM | NM | |||||||
|
Total mark to market |
$ | 28.6 | NM | NM | ||||||
|
Highly leveraged finance commitments |
$ | 1.7 | $ | 3.3 | 52 | % | ||||
|
Equities (excludes ARS in AFS) |
6.3 | NM | NM | |||||||
|
Monolines |
1.3 | NM | NM | |||||||
|
Consumer and other(5) |
6.7 | NM | NM | |||||||
|
Total |
$ | 125.5 | ||||||||
- (1)
-
Includes
municipals ($1.0 billion) and asset-backed securities (ABS) ($0.6 billion).
- (2)
-
Includes
structured investment vehicle (SIV) assets that are not otherwise included in the categories above ($4.6 billion).
- (3)
-
Held-for-sale
(HFS) accounts for approximately $1.1 billion of the total.
- (4)
-
Includes
$1.5 billion of corporates and $1.5 billion of commercial real estate.
- (5)
- Includes $2.0 billion of small business banking and finance loans and $1.1 billion of personal loans.
Notes: Assets in the SIVs have been allocated to the corresponding asset categories above. SAP had total CRE assets of $12.8 billion at March 31, 2010 (78% in HFI/HFS, 13% in mark-to-market, 7% in equity method investments and 2% in AFS/HTM).
Excludes Discontinued Operations.
NM Not meaningful
27
Items Impacting SAP Revenues
The table below provides additional information regarding the net revenue marks affecting the SAP during the first quarter of 2010 and 2009, respectively.
|
|
Pretax revenue | ||||||
|---|---|---|---|---|---|---|---|
| In millions of dollars |
First
Quarter 2010 |
First
Quarter 2009 |
|||||
|
Subprime-related direct exposures(1) |
$ | 804 | $ | (2,296 | ) | ||
|
CVA related to exposure to monoline insurers |
398 | (1,090 | ) | ||||
|
Alt-A mortgages(2)(3) |
(164 | ) | (503 | ) | |||
|
CRE positions(2)(4) |
(58 | ) | (96 | ) | |||
|
CVA on derivatives positions, excluding monoline insurers |
50 | 313 | |||||
|
SIV assets |
(24 | ) | (47 | ) | |||
|
Private equity and equity investments |
(12 | ) | (1,015 | ) | |||
|
Highly leveraged loans and financing commitments(5) |
(1 | ) | (247 | ) | |||
|
ARS proprietary positions |
— | (23 | ) | ||||
|
CVA on Citi debt liabilities under fair value option |
(4 | ) | (18 | ) | |||
|
Subtotal |
$ | 989 | $ | (5,022 | ) | ||
|
Accretion on reclassified assets(6) |
395 | 541 | |||||
|
Total selected revenue items |
$ | 1,384 | $ | (4,481 | ) | ||
- (1)
-
Net
of impact from hedges against direct subprime ABS collateralized debt obligation (CDO) super senior positions.
- (2)
-
Net
of hedges.
- (3)
-
For
these purposes, Alt-A mortgage securities are non-agency residential MBS (RMBS) where (i) the underlying collateral has
weighted average FICO scores between 680 and 720 or (ii) for instances where FICO scores are greater than 720, RMBS have 30% or less of the underlying collateral composed of full documentation
loans.
- (4)
-
Excludes
positions in SIVs.
- (5)
-
Net
of underwriting fees.
- (6)
- Recorded as net interest revenue.
Credit Valuation Adjustment (CVA) Related to Monoline Insurers
CVA is calculated by applying forward default probabilities, which are derived using the counterparty's current credit spread, to the expected exposure profile. The exposure primarily relates to hedges on super-senior subprime exposures that were executed with various monoline insurance companies. CVA amounts also reflect expected settlements with certain counterparties.
28
Corporate/Other includes global staff functions (includes finance, risk, human resources, legal and compliance) and other corporate expense, global operations and technology (O&T), residual Corporate Treasury and Corporate items. At March 31, 2010, this segment had approximately $263 billion of assets, consisting primarily of Citi's liquidity portfolio.
|
|
First Quarter | ||||||
|---|---|---|---|---|---|---|---|
| In millions of dollars | 2010 | 2009 | |||||
|
Net interest revenue |
$ | 318 | $ | (642 | ) | ||
|
Non-interest revenue |
31 | 1,142 | |||||
|
Total revenues, net of interest expense |
$ | 349 | $ | 500 | |||
|
Total operating expenses |
$ | 459 | $ | 101 | |||
|
Provisions for loan losses and for benefits and claims |
1 | 2 | |||||
|
Income (loss) from continuing operations before taxes |
$ | (111 | ) | $ | 397 | ||
|
Income taxes (benefits) |
(75 | ) | 1,049 | ||||
|
(Loss) from continuing operations |
$ | (36 | ) | $ | (652 | ) | |
|
Income (loss) from discontinued operations, net of taxes |
211 | (117 | ) | ||||
|
Net income (loss) before attribution of noncontrolling interests |
$ | 175 | $ | (769 | ) | ||
|
Net income attributable to noncontrolling interests |
— | (2 | ) | ||||
|
Net income (loss) |
$ | 175 | $ | (767 | ) | ||
1Q10 vs. 1Q09
Revenues, net of interest expense , declined primarily due to lower Citi Treasury revenues, driven primarily by lower gains from hedging activity, offset partially by lower short-term funding costs.
Operating Expenses increased primarily due to compensation related costs, intersegment eliminations, and legal reserve charges.
29
| In millions of dollars |
Regional
Consumer Banking |
Institutional
Clients Group |
Subtotal
Citicorp |
Citi
Holdings |
Corporate/Other,
Discontinued Operations and Consolidating Eliminations |
Total
Citigroup Consolidated |
||||||||||||||
|---|---|---|---|---|---|---|---|---|---|---|---|---|---|---|---|---|---|---|---|---|
|
Assets |
||||||||||||||||||||
|
Cash and due from banks |
$ | 8,515 | $ | 15,258 | $ | 23,773 | $ | 1,444 | $ | 461 | $ | 25,678 | ||||||||
|
Deposits with banks |
8,402 | 42,907 | 51,309 | 4,616 | 107,600 | 163,525 | ||||||||||||||
|
Federal funds sold and securities borrowed or purchased under agreements to resell |
299 | 227,270 | 227,569 | 6,778 | 1 | 234,348 | ||||||||||||||
|
Brokerage receivables |
— | 22,944 | 22,944 | 10,977 | 80 | 34,001 | ||||||||||||||
|
Trading account assets |
11,787 | 314,510 | 326,297 | 26,570 | (7,084 | ) | 345,783 | |||||||||||||
|
Investments |
37,282 | 93,863 | 131,145 | 76,708 | 108,880 | 316,733 | ||||||||||||||
|
Loans, net of unearned income |
||||||||||||||||||||
|
Consumer |
219,588 | — | 219,588 | 311,881 | — | 531,469 | ||||||||||||||
|
Corporate |
— | 159,695 | 159,695 | 30,640 | — | 190,335 | ||||||||||||||
|
Loans, net of unearned income |
$ | 219,588 | $ | 159,695 | $ | 379,283 | $ | 342,521 | $ | — | $ | 721,804 | ||||||||
|
Allowance for loan losses |
(14,649 | ) | (3,854 | ) | (18,503 | ) | (30,243 | ) | — | (48,746 | ) | |||||||||
|
Total loans, net |
$ | 204,939 | $ | 155,841 | $ | 360,780 | $ | 312,278 | $ | — | $ | 673,058 | ||||||||
|
Goodwill |
10,179 | 10,757 | 20,936 | 4,726 | — | 25,662 | ||||||||||||||
|
Intangible assets (other than MSRs) |
2,427 | 1,052 | 3,479 | 4,798 | — | 8,277 | ||||||||||||||
|
Mortgage servicing rights (MSRs) |
2,407 | 71 | 2,478 | 3,961 | — | 6,439 | ||||||||||||||
|
Other assets |
27,135 | 37,983 | 65,118 | 50,200 | 53,391 | 168,709 | ||||||||||||||
|
Total assets |
$ | 313,372 | $ | 922,456 | $ | 1,235,828 | $ | 503,056 | $ | 263,329 | $ | 2,002,213 | ||||||||
|
Liabilities and equity |
||||||||||||||||||||
|
Total deposits |
$ | 294,724 | $ | 435,027 | $ | 729,751 | $ | 85,484 | $ | 12,679 | $ | 827,914 | ||||||||
|
Federal funds purchased and securities loaned or sold under agreements to repurchase |
4,051 | 203,540 | 207,591 | 2 | 318 | 207,911 | ||||||||||||||
|
Brokerage payables |
235 | 54,800 | 55,035 | 1 | 5 | 55,041 | ||||||||||||||
|
Trading account liabilities |
26 | 136,425 | 136,451 | 6,297 | — | 142,748 | ||||||||||||||
|
Short-term borrowings |
139 | 55,883 | 56,022 | 5,593 | 35,079 | 96,694 | ||||||||||||||
|
Long-term debt |
3,138 | 84,089 | 87,227 | 48,784 | 303,263 | 439,274 | ||||||||||||||
|
Other liabilities |
18,066 | 18,229 | 36,295 | 25,718 | 16,839 | 78,852 | ||||||||||||||
|
Net inter-segment funding (lending) |
(7,007 | ) | (65,537 | ) | (72,544 | ) | 331,177 | (258,633 | ) | — | ||||||||||
|
Total Citigroup stockholders' equity |
— | — | — | — | $ | 151,421 | $ | 151,421 | ||||||||||||
|
Noncontrolling interest |
— | — | — | — | 2,358 | 2,358 | ||||||||||||||
|
Total equity |
— | — | — | — | 153,779 | 153,779 | ||||||||||||||
|
Total liabilities and equity |
$ | 313,372 | $ | 922,456 | $ | 1,235,828 | $ | 503,056 | $ | 263,329 | $ | 2,002,213 | ||||||||
The supplemental information presented above reflects Citigroup's consolidated GAAP balance sheet by reporting segment as of March 31, 2010. The respective segment information closely depicts the assets and liabilities managed by each segment as of such date. While this presentation is not defined by GAAP, Citi believes that these non-GAAP financial measures enhance investors' understanding of the balance sheet components managed by the underlying business segments, as well as the beneficial interrelationship of the asset and liability dynamics of the balance sheet components among Citi's business segments.
30
CAPITAL RESOURCES AND LIQUIDITY
Overview
Historically, capital has been generated by earnings from Citi's operating businesses. In addition, Citi may augment, and during the recent financial crisis has augmented, its capital through issuances of common stock, convertible preferred stock, preferred stock, equity issued through awards under employee benefit plans, and, in the case of regulatory capital, through the issuance of subordinated debt underlying trust preferred securities. Further, the impact of future events on Citi's business results, such as corporate and asset dispositions, as well as changes in accounting standards, also affect Citi's capital levels.
Generally, capital is used primarily to support assets in Citi's businesses and to absorb market, credit, or operational losses. While capital may be used for other purposes, such as to pay dividends or repurchase common stock, Citi's ability to utilize its capital for these purposes is currently restricted due to its agreements with the U.S. government, generally for so long as the U.S. government continues to hold Citi's common stock or trust preferred securities.
Citigroup's capital management framework is designed to ensure that Citigroup and its principal subsidiaries maintain sufficient capital consistent with Citi's risk profile and all applicable regulatory standards and guidelines, as well as external rating agency considerations. The capital management process is centrally overseen by senior management and is reviewed at the consolidated, legal entity, and country levels.
Senior management is responsible for the capital management process mainly through Citigroup's Finance and Asset and Liability Committee (FinALCO), with oversight from the Risk Management and Finance Committee of Citigroup's Board of Directors. The FinALCO is composed of the senior-most management of Citigroup for the purpose of engaging management in decision-making and related discussions on capital and liquidity matters. Among other things, FinALCO's responsibilities include: determining the financial structure of Citigroup and its principal subsidiaries; ensuring that Citigroup and its regulated entities are adequately capitalized in consultation with its regulators; determining appropriate asset levels and return hurdles for Citigroup and individual businesses; reviewing the funding and capital markets plan for Citigroup; and monitoring interest rate risk, corporate and bank liquidity, and the impact of currency translation on non-U.S. earnings and capital.
Capital Ratios
Citigroup is subject to the risk-based capital guidelines issued by the Federal Reserve Board. Historically, capital adequacy has been measured, in part, based on two risk-based capital ratios, the Tier 1 Capital and Total Capital (Tier 1 Capital + Tier 2 Capital) ratios. Tier 1 Capital consists of the sum of "core capital elements," such as qualifying common stockholders' equity, as adjusted, qualifying noncontrolling interests, and qualifying mandatorily redeemable securities of subsidiary trusts, principally reduced by goodwill, other disallowed intangible assets, and disallowed deferred tax assets. Total Capital also includes "supplementary" Tier 2 Capital elements, such as qualifying subordinated debt and a limited portion of the allowance for credit losses. Both measures of capital adequacy are stated as a percentage of risk-weighted assets. Further, in conjunction with the conduct of the 2009 Supervisory Capital Assessment Program (SCAP), U.S. banking regulators developed a new measure of capital termed "Tier 1 Common," which has been defined as Tier 1 Capital less non-common elements, including qualifying perpetual preferred stock, qualifying noncontrolling interests, and qualifying mandatorily redeemable securities of subsidiary trusts. Tier 1 Common and related capital adequacy ratios are measures used and relied upon by U.S. banking regulators; however, they are non-GAAP financial measures for SEC purposes. See "Components of Capital Under Regulatory Guidelines" below.
Citigroup's risk-weighted assets are principally derived from application of the risk-based capital guidelines related to the measurement of credit risk. Pursuant to these guidelines, on-balance-sheet assets and the credit equivalent amount of certain off-balance-sheet exposures (such as financial guarantees, unfunded lending commitments, letters of credit, and derivatives) are assigned to one of several prescribed risk-weight categories based upon the perceived credit risk associated with the obligor, or if relevant, the guarantor, the nature of the collateral, or external credit ratings. Risk-weighted assets also incorporate a measure for market risk on covered trading account positions and all foreign exchange and commodity positions whether or not carried in the trading account. Excluded from risk-weighted assets are any assets, such as goodwill and deferred tax assets, to the extent required to be deducted from regulatory capital. See "Components of Capital Under Regulatory Guidelines" below.
Citigroup is also subject to a Leverage ratio requirement, a non-risk-based measure of capital adequacy, which is defined as Tier 1 Capital as a percentage of quarterly adjusted average total assets.
To be "well capitalized" under federal bank regulatory agency definitions, a bank holding company must have a Tier 1 Capital ratio of at least 6%, a Total Capital ratio of at least 10%, and a Leverage ratio of at least 3%, and not be subject to a Federal Reserve Board directive to maintain higher capital levels. The following table sets forth Citigroup's regulatory capital ratios as of March 31, 2010 and December 31, 2009.
31
Citigroup Regulatory Capital Ratios
|
|
Mar. 31,
2010 |
Dec. 31,
2009 |
|||||
|---|---|---|---|---|---|---|---|
|
Tier 1 Common |
9.11 | % | 9.60 | % | |||
|
Tier 1 Capital |
11.28 | 11.67 | |||||
|
Total Capital (Tier 1 Capital + Tier 2 Capital) |
14.88 | 15.25 | |||||
|
Leverage |
6.16 | 6.89 | |||||
As noted in the table above, Citigroup was "well capitalized" under the federal bank regulatory agency definitions as of March 31, 2010 and December 31, 2009.
Components of Capital Under Regulatory Guidelines
| In millions of dollars |
March 31,
2010 |
December 31,
2009(1) |
|||||
|---|---|---|---|---|---|---|---|
|
Tier 1 Common |
|||||||
|
Citigroup common stockholders' equity |
$ | 151,109 | $ | 152,388 | |||
|
Less: Net unrealized losses on securities available-for-sale, net of tax(2) |
(3,165 | ) | (4,347 | ) | |||
|
Less: Accumulated net losses on cash flow hedges, net of tax |
(2,959 | ) | (3,182 | ) | |||
|
Less: Pension liability adjustment, net of tax(3) |
(3,509 | ) | (3,461 | ) | |||
|
Less: Cumulative effect included in fair value of financial liabilities attributable to the change in own credit worthiness, net of tax(4) |
686 | 760 | |||||
|
Less: Disallowed deferred tax assets(5) |
30,852 | 26,044 | |||||
|
Less: Intangible assets: |
|||||||
|
Goodwill |
25,662 | 25,392 | |||||
|
Other disallowed intangible assets |
5,773 | 5,899 | |||||
|
Other |
(792 | ) | (788 | ) | |||
|
Total Tier 1 Common |
$ | 96,977 | $ | 104,495 | |||
|
Qualifying perpetual preferred stock |
$ | 312 | $ | 312 | |||
|
Qualifying mandatorily redeemable securities of subsidiary trusts |
21,555 | 19,217 | |||||
|
Qualifying noncontrolling interests |
1,206 | 1,135 | |||||
|
Other |
— | 1,875 | |||||
|
Total Tier 1 Capital |
$ | 120,050 | $ | 127,034 | |||
|
Tier 2 Capital |
|||||||
|
Allowance for credit losses(6) |
$ | 13,792 | $ | 13,934 | |||
|
Qualifying subordinated debt(7) |
23,658 | 24,242 | |||||
|
Net unrealized pretax gains on available-for-sale equity securities(2) |
792 | 773 | |||||
|
Total Tier 2 Capital |
$ | 38,242 | $ | 38,949 | |||
|
Total Capital (Tier 1 Capital and Tier 2 Capital) |
$ | 158,292 | $ | 165,983 | |||
|
Risk-weighted assets(8) |
$ | 1,064,042 | $ | 1,088,526 | |||
- (1)
-
Reclassified
to conform to the current period presentation.
- (2)
-
Tier 1
Capital excludes net unrealized gains (losses) on available-for-sale debt securities and net unrealized gains on
available-for-sale equity securities with readily determinable fair values, in accordance with risk-based capital guidelines. In arriving at Tier 1 Capital,
banking organizations are required to deduct net unrealized losses on available-for-sale equity securities with readily determinable fair values, net of tax. Banking
organizations are permitted to include in Tier 2 Capital up to 45% of net unrealized pretax gains on available-for-sale equity securities with readily determinable fair
values.
- (3)
-
The
Federal Reserve Board granted interim capital relief for the impact of ASC 715-20,
Compensation—Retirement Benefits—Defined Benefits Plans
(formerly SFAS 158).
- (4)
-
The
impact of including Citigroup's own credit rating in valuing financial liabilities for which the fair value option has been elected is excluded from
Tier 1 Capital, in accordance with risk-based capital guidelines.
- (5)
-
Of
Citi's approximately $50 billion of net deferred tax assets at March 31, 2010, approximately $15 billion of such assets were
includable without limitation in regulatory capital pursuant to risk-based capital guidelines, while approximately $31 billion of such assets exceeded the limitation imposed by
these guidelines and, as "disallowed deferred tax assets," were deducted in arriving at Tier 1 Capital. Citigroup's approximately $4 billion of other net deferred tax assets primarily
represented approximately $2 billion of deferred tax effects of unrealized gains and losses on available-for-sale debt securities and approximately $2 billion of
deferred tax effects of the pension liability adjustment, which are permitted to be excluded prior to deriving the amount of net deferred tax assets subject to limitation under the guidelines. Citi
had approximately $26 billion of disallowed deferred tax assets at December 31, 2009.
- (6)
-
Includable
up to 1.25% of risk-weighted assets. Any excess allowance for credit losses is deducted in arriving at risk-weighted
assets.
- (7)
-
Includes
qualifying subordinated debt in an amount not exceeding 50% of Tier 1 Capital.
- (8)
- Includes risk-weighted credit equivalent amounts, net of applicable bilateral netting agreements, of $61.3 billion for interest rate, commodity, and equity derivative contracts, foreign exchange contracts, and credit derivatives as of March 31, 2010, compared with $64.5 billion as of December 31, 2009. Market risk equivalent assets included in risk-weighted assets amounted to $75.5 billion at March 31, 2010 and $80.8 billion at December 31, 2009. Risk-weighted assets also include the effect of certain other off-balance-sheet exposures, such as unused lending commitments and letters of credit, and reflect deductions such as certain intangible assets and any excess allowance for credit losses.
32
Adoption of SFAS 166/167 Impact on Capital
The adoption of SFAS 166/167 had a significant and immediate impact on Citigroup's capital ratios in the first quarter of 2010.
As described elsewhere in the Form 10-Q, the adoption of SFAS 166/167 resulted in the consolidation of $137 billion of incremental assets and $146 billion of liabilities onto Citigroup's Consolidated Balance Sheet, including securitized credit card receivables on the date of adoption, January 1, 2010. The adoption of SFAS 166/167 also resulted in a net increase of $10 billion in risk-weighted assets. In addition, Citi added $13.4 billion to the loan loss allowance, increased deferred tax assets by $5.0 billion, and reduced retained earnings by $8.4 billion. This translated into a reduction in Tangible Common Equity of $8.4 billion, and a decrease in Tier 1 Common, Tier 1 Capital, and Total Capital of $14.2 billion, $14.2 billion, and $14.0 billion, respectively, which were partially offset by net income of $4.4 billion and $2.3 billion of qualifying mandatorily redeemable securities of subsidiary trusts issued during the quarter.
The impact on Citigroup's capital ratios from the January 1, 2010 adoption of SFAS 166/167 was as follows:
| As of January 1, 2010 | Impact | |||
|---|---|---|---|---|
|
Tier 1 Common |
(138 | ) bps | ||
|
Tier 1 Capital |
(141 | ) bps | ||
|
Total Capital |
(142 | ) bps | ||
|
Leverage |
(118 | ) bps | ||
|
TCE (TCE/RWA) |
(87 | ) bps | ||
For more information, see Note 1 to the Consolidated Financial Statements below.
Common Stockholders' Equity
Citigroup's common stockholders' equity decreased during the three months ended March 31, 2010 by $1.3 billion to $151.1 billion, and represented 7.5% of total assets as of March 31, 2010. Citigroup's common stockholders' equity was $152.4 billion, which represented 8.2% of total assets, at December 31, 2009.
The table below summarizes the change in Citigroup's common stockholders' equity during the first quarter of 2010:
| In billions of dollars |
|
|||
|---|---|---|---|---|
|
Common stockholders' equity, December 31, 2009 |
$ | 152.4 | ||
|
Transition adjustment to Retained Earnings associated with the adoption of SFAS 166/167 (as of January 1, 2010) |
(8.4 | ) | ||
|
Net income |
4.4 | |||
|
Employee benefit plans and other activities |
(0.3 | ) | ||
|
ADIA Upper DECs equity units purchase contract |
1.9 | |||
|
Net change in accumulated other comprehensive income (loss), net of tax |
1.1 | |||
|
Common stockholders' equity, March 31, 2010 |
$ | 151.1 | ||
33
As of March 31, 2010, $6.7 billion of stock repurchases remained under Citi's authorized repurchase programs. No material repurchases were made in the first quarter of 2010, or the year ended December 31, 2009. Generally, for so long as the U.S. government holds any Citigroup common stock or trust preferred securities, Citigroup has agreed not to acquire, repurchase, or redeem any Citigroup equity or trust preferred securities, other than pursuant to administering its employee benefit plans or other customary exceptions, or with the consent of the U.S. government. See also Part II, Item 2 of this Form 10-Q.
Tangible Common Equity (TCE)
TCE, as defined by Citigroup, represents Common equity less Goodwill and Intangible assets ( other than Mortgage Servicing Rights (MSRs) ) net of the related net deferred taxes. Other companies may calculate TCE in a manner different from that of Citigroup. Citi's TCE was $117.1 billion at March 31, 2010 and $118.2 billion at December 31, 2009.
The TCE ratio (TCE divided by risk-weighted assets) was 11.0% at March 31, 2010 and 10.9% at December 31, 2009.
TCE is a capital adequacy metric used and relied upon by industry analysts; however, it is a non-GAAP financial measure for SEC purposes. A reconciliation of Citigroup's total stockholders' equity to TCE follows:
| In millions of dollars |
Mar. 31,
2010 |
Dec. 31,
2009 |
||||||
|---|---|---|---|---|---|---|---|---|
|
Total Citigroup stockholders' equity |
$ | 151,421 | $ | 152,700 | ||||
|
Less: |
||||||||
|
Preferred stock |
312 | 312 | ||||||
|
Common equity |
$ | 151,109 | $ | 152,388 | ||||
|
Less: |
||||||||
|
Goodwill |
25,662 | 25,392 | ||||||
|
Intangible assets (other than MSRs) |
8,277 | 8,714 | ||||||
|
Intangible assets (other than MSRs)—recorded as assets held for sale in Other assets |
45 | — | ||||||
|
Related net deferred tax assets |
65 | 68 | ||||||
|
Tangible common equity (TCE) |
$ | 117,060 | $ | 118,214 | ||||
|
Tangible assets |
||||||||
|
GAAP assets |
$ | 2,002,213 | $ | 1,856,646 | ||||
|
Less: |
||||||||
|
Goodwill |
25,662 | 25,392 | ||||||
|
Intangible assets (other than MSRs) |
8,277 | 8,714 | ||||||
|
Intangible assets (other than MSRs)—recorded as assets held for sale in Other assets |
45 | — | ||||||
|
Related deferred tax assets |
388 | 386 | ||||||
|
Tangible assets (TA) |
$ | 1,967,841 | $ | 1,822,154 | ||||
|
Risk-weighted assets (RWA) |
$ | 1,064,042 | $ | 1,088,526 | ||||
|
TCE/TA ratio |
5.95 | % | 6.49 | % | ||||
|
TCE ratio (TCE/RWA) |
11.00 | % | 10.86 | % | ||||
Capital Resources of Citigroup's Depository Institutions
Citigroup's U.S. subsidiary depository institutions are subject to risk-based capital guidelines issued by their respective primary federal bank regulatory agencies, which are similar to the guidelines of the Federal Reserve Board. To be "well capitalized" under these regulatory definitions, Citigroup's depository institutions must have a Tier 1 Capital ratio of at least 6%, a Total Capital (Tier 1 Capital + Tier 2 Capital) ratio of at least 10%, and a Leverage ratio of at least 5%, and not be subject to a regulatory directive to meet and maintain higher capital levels.
There are various legal and regulatory limitations on the ability of Citigroup's subsidiary depository institutions to pay dividends, extend credit or otherwise supply funds to Citigroup and its non-bank subsidiaries. In determining the declaration of dividends, each depository institution must also consider its effect on applicable risk-based capital and Leverage ratio requirements, as well as policy statements of the federal regulatory agencies that indicate that banking organizations should generally pay dividends out of current operating earnings. Citigroup did not receive any dividends from its banking subsidiaries during the first quarter of 2010.
At March 31, 2010 and December 31, 2009, all of Citigroup's U.S. subsidiary depository institutions were "well capitalized" under federal bank regulatory agency definitions, including Citigroup's primary depository institution, Citibank, N.A., as noted in the following table:
Citibank, N.A. Components of Capital and Ratios Under Regulatory Guidelines
| In billions of dollars |
Mar. 31,
2010 |
Dec. 31,
2009 |
|||||
|---|---|---|---|---|---|---|---|
|
Tier 1 Capital |
$ | 99.1 | $ | 96.8 | |||
|
Total Capital (Tier 1 Capital + Tier 2 Capital) |
112.8 | 110.6 | |||||
|
Tier 1 Capital ratio |
13.60 | % | 13.16 | % | |||
|
Total Capital ratio |
15.48 | 15.03 | |||||
|
Leverage ratio(1) |
8.51 | 8.31 | |||||
- (1)
- Tier 1 Capital divided by each period's quarterly adjusted average total assets.
34
The following table presents the estimated sensitivity of Citigroup's and Citibank, N.A.'s capital ratios to changes of $100 million in Tier 1 Common, Tier 1 Capital, or Total Capital (numerator), or changes of $1 billion in risk-weighted assets or adjusted average total assets (denominator) based on financial information as of March 31, 2010. This information is provided for the purpose of analyzing the impact that a change in Citigroup's or Citibank, N.A.'s financial position or results of operations could have on these ratios. These sensitivities only consider a single change to either a component of capital, risk-weighted assets, or adjusted average total assets. Accordingly, an event that affects more than one factor may have a larger basis point impact than is reflected in this table.
|
|
Tier 1 Common ratio | Tier 1 Capital ratio | Total Capital ratio | Leverage ratio | |||||||||||||||||||||
|---|---|---|---|---|---|---|---|---|---|---|---|---|---|---|---|---|---|---|---|---|---|---|---|---|---|
|
|
Impact of $100
million change in Tier 1 Common |
Impact of $1
billion change in risk-weighted assets |
Impact of $100
million change in Tier 1 Capital |
Impact of $1
billion change in risk-weighted assets |
Impact of $100
million change in Total Capital |
Impact of $1
billion change in risk-weighted assets |
Impact of $100
million change in Tier 1 Capital |
Impact of $1
billion change in adjusted average total assets |
|||||||||||||||||
|
Citigroup |
0.9 bps | 0.9 bps | 0.9 bps | 1.1 bps | 0.9 bps | 1.4 bps | 0.5 bps | 0.3 bps | |||||||||||||||||
|
Citibank, N.A. |
— | — | 1.4 bps | 1.9 bps | 1.4 bps | 2.1 bps | 0.9 bps | 0.7 bps | |||||||||||||||||
Broker-Dealer Subsidiaries
At March 31, 2010, Citigroup Global Markets Inc., a broker-dealer registered with the SEC that is an indirect wholly owned subsidiary of Citigroup Global Markets Holdings Inc., had net capital, computed in accordance with the SEC's net capital rule, of $8.4 billion, which exceeded the minimum requirement by $7.7 billion.
In addition, certain of Citi's broker-dealer subsidiaries are subject to regulation in the other countries in which they do business, including requirements to maintain specified levels of net capital or its equivalent. Citigroup's broker-dealer subsidiaries were in compliance with their capital requirements at March 31, 2010.
The requirements applicable to these subsidiaries in the U.S. and other jurisdictions may be subject to political uncertainty and potential change in light of the recent financial crisis and regulatory reform proposals currently being considered at both the legislative and regulatory levels.
Regulatory Capital Standards Developments
Citigroup supports the move to a new set of risk-based capital standards, published on June 26, 2004 (and subsequently amended in November 2005) by the Basel Committee on Banking Supervision, currently consisting of the central banks and bank supervisors of its 27 members. The international version of the Basel II framework will allow Citigroup to leverage internal risk models used to measure credit, operational, and market risk exposures to drive regulatory capital calculations.
On December 7, 2007, the U.S. banking regulators published the rules for large banks to comply with Basel II in the U.S. These rules require Citigroup, as a large and internationally active bank, to comply with the most advanced Basel II approaches for calculating credit and operational risk capital requirements. The U.S. implementation timetable consists of a parallel calculation period under the current regulatory capital regime (Basel I) and Basel II followed by a three year transitional period.
Citi began parallel reporting on April 1, 2010. There will be at least four quarters of parallel reporting until Citi enters the three year transitional period. U.S. regulators have reserved the right to change how Basel II is applied in the U.S. following a review at the end of the second year of the transitional period, and to retain the existing prompt corrective action and leverage capital requirements applicable to banking organizations in the U.S. Citigroup intends to implement Basel II within the timeframe required by the U.S. regulators.
The Basel II (or its successor) requirements are the subject of political uncertainty and potential tightening or other change in light of the recent financial crisis and regulatory reform proposals currently being considered at both the legislative and regulatory levels.
35
General
Citigroup's cash flows and liquidity needs are primarily generated within its operating subsidiaries. Exceptions exist for major corporate items, such as equity and certain long-term debt issuances, which take place at the Citigroup corporate level. Generally, Citi's management of funding and liquidity is designed to optimize availability of funds as needed within Citi's legal and regulatory structure. Various constraints limit certain subsidiaries' ability to pay dividends or otherwise make funds available. Consistent with these constraints, Citigroup's primary objectives for funding and liquidity management are established by entity and in aggregate across three main operating entities, as follows: (i) Citigroup, as the parent holding company; (ii) banking subsidiaries; and (iii) non-banking subsidiaries.
Citigroup sources of funding include deposits, collateralized financing transactions and a variety of unsecured short- and long-term instruments, including federal funds purchased, commercial paper, long-term debt, trust preferred securities, preferred stock and common stock.
As a result of continued deleveraging, growth in deposits, term securitization under government and non-government programs, the issuance of long-term debt under the FDIC's Temporary Liquidity Guarantee Program (TLGP) and the issuance of non-guaranteed debt (particularly during the latter part of 2009), Citigroup substantially increased its balances of cash and highly liquid securities and reduced its short-term borrowings.
Citi has focused on growing a geographically diverse retail and corporate deposit base that stood at approximately $828 billion as of March 31, 2010, as compared with $836 billion at December 31, 2009 and $763 billion at March 31, 2009. During the first quarter of 2010, excluding FX translation, Citigroup experienced seasonal deposit declines in Transaction Services and tightened pricing on its deposits. As stated above, Citigroup's deposits are diversified across products and regions, with approximately 64% outside of the U.S. This diversification provides Citi with an important and low-cost source of funding. A significant portion of these deposits has been, and is currently expected to be, long-term and stable, and is considered to be core.
One of Citi's key structural liquidity measures is the cash capital ratio. Cash capital is a broader measure of the ability to fund the structurally illiquid portion of Citigroup's balance sheet than traditional measures, such as deposits to loans or core deposits to loans. Cash capital measures the amount of long-term funding (>1 year) available to fund illiquid assets. Long-term funding includes core customer deposits, long-term debt and equity. Illiquid assets include loans (net of liquidity adjustments), illiquid securities, securities haircuts and other assets (i.e., goodwill, intangibles, fixed assets, receivables, etc.). At March 31, 2010, the combined Citigroup, the parent holding company, and CGMHI, as well as the aggregate banking subsidiaries had an excess of cash capital. In addition, as of March 31, 2010, the combined Citigroup, the parent holding company, and CGMHI maintained liquidity to meet all maturing obligations significantly in excess of a one-year period without access to the unsecured wholesale markets.
At March 31, 2010, long-term debt and commercial paper outstanding for Citigroup, Citigroup Global Markets Holdings Inc. (CGMHI), Citigroup Funding Inc. (CFI) and other Citigroup subsidiaries, collectively, were as follows:
| In billions of dollars |
Citigroup
parent company |
CGMHI(1) | CFI(1) | VIE Cons. |
Other
Citigroup subs. |
Total
Citigroup |
|||||||||||||
|---|---|---|---|---|---|---|---|---|---|---|---|---|---|---|---|---|---|---|---|
|
Long-term debt(2) |
$ | 192.3 | $ | 9.1 | $ | 55.1 | $ | 113.6 | $ | 69.2 | (3) | $ | 439.3 | ||||||
|
Commercial paper |
$ | — | $ | — | $ | 10.8 | $ | 31.2 | $ | 0.5 | $ | 42.5 | |||||||
- (1)
-
Citigroup
guarantees all of CFI's debt and CGMHI's publicly issued securities.
- (2)
-
Of
this amount, approximately $64.6 billion is guaranteed by the FDIC under the TLGP with $6.3 billion maturing in 2010, $20.3 billion
maturing in 2011 and $38 billion maturing in 2012.
- (3)
- At March 31, 2010, approximately $21.6 billion relates to collateralized advances from the Federal Home Loan Bank.
The table below details the long-term debt issuances of Citigroup during the past five quarters.
| In billions of dollars | 1Q09 | 2Q09 | 3Q09 | 4Q09 | 1Q10 | ||||||||||||
|---|---|---|---|---|---|---|---|---|---|---|---|---|---|---|---|---|---|
|
Debt issued under TLGP guarantee |
$ | 21.9 | $ | 17.0 | $ | 10.0 | $ | 10.0 | $ | — | |||||||
|
Debt issued without TLGP guarantee: |
|||||||||||||||||
|
Citigroup parent company/CFI |
2.0 | 7.4 | 12.6 | 4.0 | (3) | 1.3 | |||||||||||
|
Other Citigroup subsidiaries |
0.5 | 10.1 | (1) | 7.9 | (2) | 5.8 | (4) | 3.7 | (5) | ||||||||
|
Total |
$ | 24.4 | $ | 34.5 | $ | 30.5 | $ | 19.8 | $ | 5.0 | |||||||
- (1)
-
Includes
$8.5 billion issued through the U.S. government-sponsored Department of Education Conduit Facility, and $1 billion issued by Citibank
Pty. Ltd. Australia and guaranteed by the Commonwealth of Australia.
- (2)
-
Includes
$3.3 billion issued through the U.S. government-sponsored Department of Education Conduit Facility, and $1 billion issued by Citibank
Pty. Ltd. Australia and guaranteed by the Commonwealth of Australia.
- (3)
-
Includes
$1.9 billion of senior debt issued under remarketing of $1.9 billion of Citigroup Capital XXIX trust preferred securities held by the
Abu Dhabi Investment Authority (ADIA) to enable them to execute the forward stock purchase contract in March 2010.
- (4)
-
Includes
$1.4 billion issued through the U.S. government-sponsored Department of Education Conduit Facility.
- (5)
- Includes $0.5 billion issued through the U.S. government-sponsored Department of Education Conduit Facility and $0.5 billion issued by Citibank Pty. Ltd. Australia and guaranteed by the Commonwealth of Australia.
See Note 12 to the Consolidated Financial Statements for further detail on Citigroup's and its affiliates' long-term debt and commercial paper outstanding. Commercial paper outstanding as of March 31, 2010 increased from $10.2 billion as of December 31, 2009 to $42.5 billion as a result of the consolidation of VIEs due to the adoption of SFAS 166/167.
36
Structural liquidity, defined as the sum of deposits, long-term debt and stockholders' equity as a percentage of total assets, was 71% at March 31, 2010, compared with 73% at December 31, 2009 and 68% at March 31, 2009. The reduction in the ratio during the current quarter primarily reflected the impact of adoption of SFAS 166/167.
Aggregate Liquidity Resources
|
|
Parent & Broker Dealer | Significant Bank Entities | Total | |||||||||||||||||||||||||
|---|---|---|---|---|---|---|---|---|---|---|---|---|---|---|---|---|---|---|---|---|---|---|---|---|---|---|---|---|
| In billions of dollars |
Mar. 31,
2010 |
Dec. 31,
2009 |
Mar. 31,
2009 |
Mar. 31,
2010 |
Dec. 31,
2009 |
Mar. 31,
2009 |
Mar. 31,
2010 |
Dec. 31,
2009 |
Mar. 31,
2009 |
|||||||||||||||||||
|
Cash at major central banks |
$ | 9.5 | $ | 10.4 | $ | 17.3 | $ | 108.9 | $ | 105.1 | $ | 99.0 | $ | 118.4 | $ | 115.5 | $ | 116.3 | ||||||||||
|
Unencumbered Liquid |
||||||||||||||||||||||||||||
|
Securities |
72.8 | 76.4 | 51.7 | 128.7 | 123.6 | 46.9 | 201.5 | 200.0 | 98.6 | |||||||||||||||||||
|
Total |
$ | 82.3 | $ | 86.8 | $ | 69.0 | $ | 237.6 | $ | 228.7 | $ | 145.9 | $ | 319.9 | $ | 315.5 | $ | 214.9 | ||||||||||
As noted in the table above, Citigroup's aggregate liquidity resources totaled $319.9 billion as of March 31, 2010 as compared with $315.5 billion as of December 31, 2009, and $214.9 billion as of March 31, 2009. As of March 31, 2010, Citigroup's and its affiliates' liquidity portfolio and broker-dealer "cash box" totaled $82.3 billion as compared with $86.8 billion at December 31, 2009 and $69.0 billion at March 31, 2009. This includes the liquidity portfolio and cash box held in the U.S. as well as government bonds held by Citigroup's broker-dealer entities in the United Kingdom and Japan. Further, at March 31, 2010, Citigroup's bank subsidiaries had an aggregate of approximately $108.9 billion of cash on deposit with major central banks (including the U.S. Federal Reserve Bank of New York, the European Central Bank, Bank of England, Swiss National Bank, Bank of Japan, the Monetary Authority of Singapore, and the Hong Kong Monetary Authority), compared with approximately $105.1 billion at December 31, 2009 and $99.0 billion at March 31, 2009. Citigroup's bank subsidiaries also have significant additional liquidity resources through unencumbered highly liquid securities available for secured funding through private markets or that are, or could be, pledged to the major central banks and the U.S. Federal Home Loan Banks. The value of these liquid securities was $128.7 billion at March 31, 2010, as compared with $123.6 billion at December 31, 2009 and $46.9 billion at March 31, 2009. Significant amounts of cash and liquid securities are also available in other Citigroup entities.
Consistent with the strategic reconfiguration of Citi's balance sheet, the build-up of liquidity resources and the shift in focus on increasing structural liabilities, Citigroup entered 2010 with much of its required long-term debt funding already in place. As a consequence, it is currently expected that the direct long-term funding requirements for Citigroup and CFI in 2010 will be an aggregate of $15 billion, which is well below the $39 billion of expected maturities. This $15 billion includes the approximately $2.3 billion of trust preferred securities that were issued by Citi during the first quarter of 2010.
Parameters for Intercompany Funding Transfers
In general, Citigroup, as the parent holding company, can freely transfer funding to other affiliated entities. Broker-dealer subsidiaries can transfer excess liquidity to the parent holding company through termination of intercompany borrowings and to the parent and other affiliates to the extent of its excess capital.
Some of Citigroup's non-bank subsidiaries have credit facilities with Citigroup's subsidiary depository institutions, including Citibank, N.A. Borrowings under these facilities must be secured in accordance with Section 23A of the Federal Reserve Act. As of March 31, 2010, the amount available for lending under these facilities was approximately $32 billion. There are various legal restrictions on the extent to which Citi's subsidiary depository institutions can lend or extend credit to or engage in certain other transactions with Citigroup and certain of its non-bank subsidiaries. In general, transactions must be on arm's-length terms and be secured by designated amounts of specified collateral. See Note 12 to the Consolidated Financial Statements.
37
Credit Ratings
Citigroup's ability to access the capital markets and other sources of funds, as well as the cost of these funds and its ability to maintain certain deposits, is dependent on its credit ratings. The table below indicates the current ratings for Citigroup. As a result of the Citigroup guarantee, changes in ratings for Citigroup Funding Inc. are the same as those of Citigroup.
Citigroup's Debt Ratings as of March 31, 2010
|
|
Citigroup Inc. | Citigroup Funding Inc. | Citibank, N.A. | |||||||||
|---|---|---|---|---|---|---|---|---|---|---|---|---|
|
|
Senior
debt |
Commercial
paper |
Senior
debt |
Commercial
paper |
Long-
term |
Short-
term |
||||||
|
Fitch Ratings |
A+ | F1+ | A+ | F1+ | A+ | F1+ | ||||||
|
Moody's Investors Service |
A3 | P-1 | A3 | P-1 | A1 | P-1 | ||||||
|
Standard & Poor's |
A | A-1 | A | A-1 | A+ | A-1 | ||||||
On February 9, 2010, S&P affirmed the counterparty credit and debt ratings of Citi. At the same time, S&P revised its outlook on Citi to negative from stable, bringing it in line with many large bank holding companies. This action was the result of S&P's view that there is increased uncertainty about the U.S. government's willingness to provide extraordinary support to a number of systemically important financial institutions. Ratings outlooks from both Moody's and Fitch remain stable. However, continued uncertainty remains for the industry regarding proposed regulatory and legislative changes, and rating agency actions in response to such changes.
Ratings downgrades by Fitch Ratings, Moody's Investors Service or Standard & Poor's could have material impacts on funding and liquidity through cash obligations, reduced funding capacity and due to collateral triggers. Because of the current credit ratings of Citigroup Inc., a one-notch downgrade of its senior debt/long-term rating may or may not impact Citigroup Inc.'s commercial paper/short-term rating by one notch. As of March 31, 2010, Citi currently believes that a one-notch downgrade of both the senior debt/long-term rating of Citigroup Inc. and a one-notch downgrade of Citigroup Inc.'s commercial paper/short-term rating, could likely result in the assumed loss of unsecured commercial paper ($10.8 billion) and tender option bonds funding ($2.5 billion) as well as derivative triggers and additional margin requirements ($1.1 billion). Additionally, other funding sources, such as repurchase agreements and other margin requirements for which there are no explicit triggers, could be adversely affected. The aggregate liquidity resources of Citigroup's parent holding company and broker-dealer stood at $82.3 billion as of March 31, 2010 in part as a contingency for such an event, and a broad range of mitigating actions are currently included in the Citigroup contingency funding plan. These mitigating factors include, but are not limited to, accessing funding capacity from existing clients, diversifying funding sources, adjusting the size of select trading books, and tailoring levels of reverse repurchase agreement lending.
Citi currently believes that a more severe ratings downgrade scenario, such as a two-notch downgrade of the senior debt/long-term rating of Citigroup Inc., accompanied by a one-notch downgrade of Citigroup Inc.'s commercial paper/short-term rating, could result in an additional $1.2 billion in funding requirement in the form of cash obligations and collateral.
Further, as of March 31, 2010, a one-notch downgrade of the senior debt/long-term ratings of Citibank, N.A. could result in an approximate $3.7 billion funding requirement in the form of collateral and cash obligations. Because of the current credit ratings of Citibank, N.A., a one-notch downgrade of its senior debt/long-term rating is unlikely to have any impact on its commercial paper/short-term rating. The significant bank entities, Citibank, N.A., and other bank vehicles have aggregate liquidity resources of $237.6 billion, and have a detailed contingency funding plan that encompasses a broad range of mitigating actions.
38
OFF-BALANCE-SHEET ARRANGEMENTS
Citigroup and its subsidiaries are involved with several types of off-balance-sheet arrangements, including special purpose entities (SPEs), primarily in connection with securitization activities in Regional Consumer Banking and Institutional Clients Group . Citigroup and its subsidiaries use SPEs principally to obtain liquidity and favorable capital treatment by securitizing certain of Citigroup's financial assets, assisting clients in securitizing their financial assets and creating investment products for clients. For further information on Citi's securitization activities and involvement in SPEs, see Notes 1 and 14 to the Consolidated Financial Statements.
39
Citigroup's risk management framework balances strong corporate oversight with well-defined independent risk management functions for each business and region, as well as cross-business product expertise. The Citigroup risk management framework is described in Citigroup's Annual Report on Form 10-K for the fiscal year ended December 31, 2009.
During the first quarter of 2010, Citigroup's aggregate loan portfolio increased by $130.3 billion to $721.8 billion primarily due to the adoption of SFAS 166/167. Excluding the impact of SFAS 166/167, the aggregate loan portfolio decreased by $16.0 billon. Citi's total allowance for loan losses totaled $48.7 billion at March 31, 2010, a coverage ratio of 6.80% of total loans, up from 6.09% at December 31, 2009 and 4.82% in the first quarter 2009.
During the first quarter of 2010, Citigroup recorded a net release of $18 million to its credit reserves compared to a $2.6 billion build in the first quarter of 2009. The release consisted of a net release of $242 million for corporate loans ($180 million release in ICG and $62 million release in SAP ), offset by a net build of $224 million for consumer loans ($386 million build in LCL, $25 million build in SAP, $180 million release in RCB, and a $7 million release in BAM ).
Net credit losses of $8.4 billion during the first quarter of 2010 decreased $1.4 billion from year-ago levels (on a managed basis). The decrease consisted of a net decrease of $239 million for consumer loans (mainly a $636 million decrease in LCL and a $375 million increase in RCB ) and a decrease of $1.2 billion for corporate loans ($1.2 billion decrease in SAP , slightly offset by a $25 million increase in ICG ).
Consumer non-accrual loans totaled $15.6 billion at March 31, 2010, compared to $18.3 billion at December 31, 2009 and $14.9 billion at March 31, 2009 (prior periods on a managed basis). The consumer loan 90 days or more past due delinquency rate was 4.02% at March 31, 2010, compared to 4.28% at December 31, 2009 and 3.51% at March 31, 2009. During the first quarter of 2010, delinquencies declined in Citi's first and second mortgage portfolios in Citi Holdings, reflecting asset sales, organic improvement, and HAMP mortgage modifications moving to permanent status. The decrease in delinquencies was partially offset by higher delinquencies in the student loan portfolio due to the impact of the adoption of SFAS 166/167. The 30 to 89 days past due delinquency rate was 3.11% at March 31, 2010, compared to 3.46% at December 31, 2009 and 3.38% at March 31, 2009.
Corporate non-accrual loans were $12.9 billion at March 31, 2010, compared to $13.5 billion at December 31, 2009 and $11.2 billion at March 31, 2009. The decrease from the prior quarter is mainly due to loan sales and paydowns, which were partially offset by increases due to weakening of certain specific credits.
See below for Citi's loan and credit accounting policies.
40
| In millions of dollars at year end |
1st Qtr.
2010 |
4th Qtr.
2009 |
3rd Qtr.
2009 |
2nd Qtr.
2009 |
1st Qtr.
2009 |
||||||||||||
|---|---|---|---|---|---|---|---|---|---|---|---|---|---|---|---|---|---|
|
Consumer loans |
|||||||||||||||||
|
In U.S. offices |
|||||||||||||||||
|
Mortgage and real estate(1) |
$ | 180,334 | $ | 183,842 | $ | 191,748 | $ | 197,358 | $ | 201,931 | |||||||
|
Installment, revolving credit, and other |
69,111 | 58,099 | 57,820 | 61,645 | 64,359 | ||||||||||||
|
Cards |
127,818 | 28,951 | 36,039 | 33,750 | 35,406 | ||||||||||||
|
Commercial and industrial |
5,386 | 5,640 | 5,848 | 6,016 | 6,123 | ||||||||||||
|
Lease financing |
7 | 11 | 15 | 16 | 19 | ||||||||||||
|
|
$ | 382,656 | $ | 276,543 | $ | 291,470 | $ | 298,785 | $ | 307,838 | |||||||
|
In offices outside the U.S. |
|||||||||||||||||
|
Mortgage and real estate(1) |
$ | 49,421 | $ | 47,297 | $ | 47,568 | $ | 45,986 | $ | 42,580 | |||||||
|
Installment, revolving credit, and other |
44,541 | 42,805 | 45,004 | 45,556 | 47,498 | ||||||||||||
|
Cards |
38,191 | 41,493 | 41,443 | 42,262 | 39,347 | ||||||||||||
|
Commercial and industrial |
14,828 | 14,780 | 14,858 | 13,858 | 15,550 | ||||||||||||
|
Lease financing |
771 | 331 | 345 | 339 | 288 | ||||||||||||
|
|
$ | 147,752 | $ | 146,706 | $ | 149,218 | $ | 148,001 | $ | 145,263 | |||||||
|
Total consumer loans |
$ | 530,408 | $ | 423,249 | $ | 440,688 | $ | 446,786 | $ | 453,101 | |||||||
|
Unearned income |
1,061 | 808 | 803 | 866 | 862 | ||||||||||||
|
Consumer loans, net of unearned income |
$ | 531,469 | $ | 424,057 | $ | 441,491 | $ | 447,652 | $ | 453,963 | |||||||
|
Corporate loans |
|||||||||||||||||
|
In U.S. offices |
|||||||||||||||||
|
Commercial and industrial |
$ | 15,558 | $ | 15,614 | $ | 19,692 | $ | 26,125 | $ | 22,020 | |||||||
|
Loans to financial institutions |
31,279 | 6,947 | 7,666 | 8,181 | 9,232 | ||||||||||||
|
Mortgage and real estate(1) |
21,283 | 22,560 | 23,221 | 23,862 | 29,486 | ||||||||||||
|
Installment, revolving credit, and other |
15,792 | 17,737 | 17,734 | 19,856 | 26,460 | ||||||||||||
|
Lease financing |
1,239 | 1,297 | 1,275 | 1,284 | 1,394 | ||||||||||||
|
|
$ | 85,151 | $ | 64,155 | $ | 69,588 | $ | 79,308 | $ | 88,592 | |||||||
|
In offices outside the U.S. |
|||||||||||||||||
|
Commercial and industrial |
$ | 64,903 | $ | 68,467 | $ | 73,564 | $ | 78,512 | $ | 72,243 | |||||||
|
Installment, revolving credit, and other |
10,956 | 9,683 | 10,949 | 11,638 | 18,379 | ||||||||||||
|
Mortgage and real estate(1) |
9,771 | 9,779 | 12,023 | 11,887 | 10,422 | ||||||||||||
|
Loans to financial institutions |
19,003 | 15,113 | 16,906 | 15,856 | 16,493 | ||||||||||||
|
Lease financing |
663 | 1,295 | 1,462 | 1,560 | 1,620 | ||||||||||||
|
Governments and official institutions |
1,324 | 1,229 | 826 | 713 | 597 | ||||||||||||
|
|
$ | 106,620 | $ | 105,566 | $ | 115,730 | $ | 120,166 | $ | 119,754 | |||||||
|
Total corporate loans |
$ | 191,771 | $ | 169,721 | $ | 185,318 | $ | 199,474 | $ | 208,346 | |||||||
|
Unearned income |
(1,436 | ) | (2,274 | ) | (4,598 | ) | (5,436 | ) | (5,017 | ) | |||||||
|
Corporate loans, net of unearned income |
$ | 190,335 | $ | 167,447 | $ | 180,720 | $ | 194,038 | $ | 203,329 | |||||||
|
Total loans—net of unearned income |
$ | 721,804 | $ | 591,504 | $ | 622,211 | $ | 641,690 | $ | 657,292 | |||||||
|
Allowance for loan losses—on drawn exposures |
(48,746 | ) | (36,033 | ) | (36,416 | ) | (35,940 | ) | (31,703 | ) | |||||||
|
Total loans—net of unearned income and allowance for credit losses |
$ | 673,058 | $ | 555,471 | $ | 585,795 | $ | 605,750 | $ | 625,589 | |||||||
|
Allowance for loan losses as a percentage of total loans—net of unearned income(2) |
6.80 | % | 6.09 | % | 5.85 | % | 5.60 | % | 4.82 | % | |||||||
|
Allowance for consumer loan losses as a percentage of total consumer loans—net of unearned income(2) |
7.84 | % | 6.70 | % | 6.44 | % | 6.25 | % | 5.29 | % | |||||||
|
Allowance for corporate loan losses as a percentage of total corporate loans—net of unearned income(2) |
3.90 | % | 4.56 | % | 4.42 | % | 4.11 | % | 3.77 | % | |||||||
- (1)
-
Loans
secured primarily by real estate.
- (2)
- First quarter 2010 excludes loans which are carried at fair value.
Included in the loan table above are lending products whose terms may give rise to additional credit issues. Credit cards with below-market introductory interest rates, multiple loans supported by the same collateral (e.g., home equity loans), and interest-only loans are examples of such products. However, these products are not material to Citigroup's financial position and are closely managed via credit controls that mitigate their additional inherent risk.
Impaired loans are those where Citigroup believes it is probable that it will not collect all amounts due according to the original contractual terms of the loan. Impaired loans include corporate non-accrual loans as well as smaller-balance homogeneous loans whose terms have been modified due to the borrower's financial difficulties and Citigroup granted a concession to the borrower. Such modifications may include interest rate reductions and/or principal forgiveness. Valuation allowances for these loans are estimated considering all available evidence including, as appropriate, the present value of the expected future cash flows discounted at the loan's original contractual effective rate, the secondary market value of the loan and the fair value of collateral less disposal costs. These totals exclude smaller-balance homogeneous loans that
41
have not been modified and are carried on a non-accrual basis, as well as substantially all loans modified for periods of 12 months or less.
At March 31, 2010, loans included in those short-term programs amounted to $7.9 billion.
The following table presents information about impaired loans:
| In millions of dollars at year end |
March 31,
2010 |
December 31,
2009 |
|||||
|---|---|---|---|---|---|---|---|
|
Non-accrual corporate loans |
|||||||
|
Commercial and industrial |
$ | 6,776 | $ | 6,347 | |||
|
Loans to financial institutions |
1,044 | 1,794 | |||||
|
Mortgage and real estate |
3,406 | 4,051 | |||||
|
Lease financing |
59 | — | |||||
|
Other |
1,647 | 1,287 | |||||
|
Total non-accrual corporate loans |
$ | 12,932 | $ | 13,479 | |||
|
Impaired consumer loans(1) |
|||||||
|
Mortgage and real estate |
$ | 14,136 | $ | 10,629 | |||
|
Installment and other |
4,578 | 3,853 | |||||
|
Cards |
5,026 | 2,453 | |||||
|
Total impaired consumer loans |
$ | 23,740 | $ | 16,935 | |||
|
Total(2) |
$ | 36,672 | $ | 30,414 | |||
|
Non-accrual corporate loans with valuation allowances |
$ | 8,626 | $ | 8,578 | |||
|
Impaired consumer loans with valuation allowances |
23,042 | 16,453 | |||||
|
Non-accrual corporate valuation allowance |
$ | 2,569 | $ | 2,480 | |||
|
Impaired consumer valuation allowance |
7,157 | 4,977 | |||||
|
Total valuation allowances(3) |
$ | 9,726 | $ | 7,457 | |||
- (1)
-
Prior
to 2008, Citi's financial accounting systems did not separately track impaired smaller-balance, homogeneous consumer loans whose terms were modified
due to the borrowers' financial difficulties and it was determined that a concession was granted to the borrower. Smaller-balance consumer loans modified since January 1, 2008 amounted to
$22.6 billion and $15.9 billion at March 31, 2010 and December 31, 2009, respectively. However, information derived from Citi's risk management systems indicates that the
amounts of outstanding modified loans, including those modified prior to 2008, approximated $24.6 billion and $18.1 billion at March 31, 2010 and December 31, 2009,
respectively.
- (2)
-
Excludes
loans purchased for investment purposes.
- (3)
- Included in the Allowance for loan losses .
Loan Accounting Policies
The following are Citigroup's accounting policies for Loans, Allowance for Loan Losses and related lending activities.
Loans
Loans are reported at their outstanding principal balances net of any unearned income and unamortized deferred fees and costs except that credit card receivable balances also include accrued interest and fees. Loan origination fees and certain direct origination costs are generally deferred and recognized as adjustments to income over the lives of the related loans.
As described in Note 17 to the Consolidated Financial Statements, Citi has elected fair value accounting for certain loans. Such loans are carried at fair value with changes in fair value reported in earnings. Interest income on such loans is recorded in Interest revenue at the contractually specified rate.
Loans for which the fair value option has not been elected are classified upon origination or acquisition as either held-for-investment or held-for-sale. This classification is based on management's initial intent and ability with regard to those loans.
Loans that are held-for-investment are classified as Loans, net of unearned income on the Consolidated Balance Sheet, and the related cash flows are included within the cash flows from investing activities category in the Consolidated Statement of Cash Flows on the line Change in loans . However, when the initial intent for holding a loan has changed from held-for-investment to held-for-sale, the loan is reclassified to held-for-sale, but the related cash flows continue to be reported in cash flows from investing activities in the Consolidated Statement of Cash Flows on the line Proceeds from sales and securitizations of loans .
Substantially all of the consumer loans sold or securitized by Citigroup are U.S. prime residential mortgage loans or U.S. credit card receivables. The practice of the U.S. prime mortgage business has been to sell all of its loans except for non-conforming adjustable rate loans. U.S. prime mortgage conforming loans are classified as held-for-sale at the time of origination. The related cash flows are classified in the Consolidated Statement of Cash Flows in the cash flows from operating activities category on the line Change in loans held-for-sale .
Prior to 2010, U.S. credit card receivables were classified at origination as loans-held-for-sale to the extent that management did not have the intent to hold the receivables for the foreseeable future or until maturity. Prior to 2010, the U.S. credit card securitization forecast for the three months following the latest balance sheet date, excluding replenishments, was the basis for the amount of such loans classified as held-for-sale. Cash flows related to U.S. credit card loans classified as held-for-sale at origination or acquisition are reported in the cash flows from operating activities category on the line Change in loans held-for-sale .
42
Consumer loans
Consumer loans represent loans and leases managed primarily by the Regional Consumer Banking and Local Consumer Lending businesses. As a general rule, interest accrual ceases for installment and real estate (both open- and closed-end) loans when payments are 90 days contractually past due. For credit cards and unsecured revolving loans, however, Citi generally accrues interest until payments are 180 days past due. Loans that have been modified to grant a short-term or long-term concession to a borrower who is in financial difficulty may not be accruing interest at the time of the modification. The policy for returning such modified loans to accrual status varies by product and/or region. In most cases, a minimum number of payments (ranging from one to six) are required, while in other cases the loan is never returned to accrual status.
Citi's charge-off policies follow the general guidelines below:
- •
-
Unsecured installment loans are charged off at 120 days past due.
- •
-
Unsecured revolving loans and credit card loans are charged off at 180 days contractually past due.
- •
-
Loans secured with non-real estate collateral are written down to the estimated value of the collateral, less
costs to sell, at 120 days past due.
- •
-
Real estate-secured loans are written down to the estimated value of the property, less costs to sell, at 180 days
contractually past due.
- •
-
Non-bank loans secured by real estate are written down to the estimated value of the property, less costs to
sell, at the earlier of the receipt of title or 12 months in foreclosure (a process that must commence when payments are 120 days contractually past due).
- •
-
Non-bank auto loans are written down to the estimated value of the collateral, less costs to sell, at
repossession or, if repossession is not pursued, no later than 180 days contractually past due.
- •
-
Non-bank unsecured personal loans are charged off when the loan is 180 days contractually past due if
there have been no payments within the last six months, but in no event can these loans exceed 360 days contractually past due.
- •
-
Unsecured loans in bankruptcy are charged off within 30 days of notification of filing by the bankruptcy court or
within the contractual write-off periods, whichever occurs earlier.
- •
-
Real estate-secured loans in bankruptcy are written down to the estimated value of the property, less costs to sell,
60 days after notification if the borrower is 60 days contractually past due.
- •
- Non-bank unsecured personal loans in bankruptcy are charged off when they are 30 days contractually past due.
Corporate loans
Corporate loans represent loans and leases managed by ICG or the Special Asset Pool . Corporate loans are identified as impaired and placed on a cash (non-accrual) basis when it is determined that the payment of interest or principal is doubtful or when interest or principal is 90 days past due, except when the loan is well-collateralized and in the process of collection. Any interest accrued on impaired corporate loans and leases is reversed at 90 days and charged against current earnings, and interest is thereafter included in earnings only to the extent actually received in cash. When there is doubt regarding the ultimate collectability of principal, all cash receipts are thereafter applied to reduce the recorded investment in the loan.
Impaired corporate loans and leases are written down to the extent that principal is judged to be uncollectible. Impaired collateral-dependent loans and leases, where repayment is expected to be provided solely by the sale of the underlying collateral and there are no other available and reliable sources of repayment, are written down to the lower of cost or collateral value. Cash-basis loans are returned to an accrual status when all contractual principal and interest amounts are reasonably assured of repayment and there is a sustained period of repayment performance in accordance with the contractual terms.
Loans Held-for-Sale
Corporate and consumer loans that have been identified for sale are classified as loans held-for-sale included in Other assets . With the exception of certain mortgage loans for which the fair value option has been elected, these loans are accounted for at the lower of cost or market value (LOCOM), with any write-downs or subsequent recoveries charged to Other revenue .
Allowance for Loan Losses
Allowance for loan losses represents management's best estimate of probable losses inherent in the portfolio, as well as probable losses related to large individually evaluated impaired loans and troubled debt restructurings. Attribution of the allowance is made for analytical purposes only, and the entire allowance is available to absorb probable credit losses inherent in the overall portfolio. Additions to the allowance are made through the provision for credit losses. Credit losses are deducted from the allowance, and subsequent recoveries are added. Securities received in exchange for loan claims in debt restructurings are initially recorded at fair value, with any gain or loss reflected as a recovery or charge-off to the allowance, and are subsequently accounted for as securities available-for-sale.
43
Corporate loans
In the Corporate portfolios, the allowance for loan losses includes an asset-specific component and a statistically-based component. The asset specific component is calculated under ASC 310-10-35, Receivables—Subsequent Measurement (formerly SFAS 114) on an individual basis for larger-balance, non-homogeneous loans, which are considered impaired. An asset-specific allowance is established when the discounted cash flows, collateral value (less disposal costs), or observable market price of the impaired loan is lower than its carrying value. This allowance considers the borrower's overall financial condition, resources, and payment record, the prospects for support from any financially responsible guarantors and, if appropriate, the realizable value of any collateral. The asset specific component of the allowance for smaller balance impaired loans is calculated on a pool basis considering historical loss experience. The allowance for the remainder of the loan portfolio is calculated under ASC 450, Contingencies (formerly SFAS 5) using a statistical methodology, supplemented by management judgment. The statistical analysis considers the portfolio's size, remaining tenor, and credit quality as measured by internal risk ratings assigned to individual credit facilities, which reflect probability of default and loss given default. The statistical analysis considers historical default rates and historical loss severity in the event of default, including historical average levels and historical variability. The result is an estimated range for inherent losses. The best estimate within the range is then determined by management's quantitative and qualitative assessment of current conditions, including general economic conditions, specific industry and geographic trends, and internal factors including portfolio concentrations, trends in internal credit quality indicators, and current and past underwriting standards.
Consumer loans
For Consumer loans , each portfolio of smaller-balance, homogeneous loans—including consumer mortgage, installment, revolving credit, and most other consumer loans—is independently evaluated for impairment. The allowance for loan losses attributed to these loans is established via a process that estimates the probable losses inherent in the specific portfolio based upon various analyses. These include migration analysis, in which historical delinquency and credit loss experience is applied to the current aging of the portfolio, together with analyses that reflect current trends and conditions.
Management also considers overall portfolio indicators, including historical credit losses, delinquent, non-performing, and classified loans, trends in volumes and terms of loans, an evaluation of overall credit quality, the credit process, including lending policies and procedures, and economic, geographical, product and other environmental factors. In addition, valuation allowances are determined for impaired smaller-balance homogeneous loans whose terms have been modified due to the borrowers' financial difficulties and where it has been determined that a concession was granted to the borrower. Such modifications may include interest rate reductions, principal forgiveness and/or term extensions. Where long-term concessions have been granted, such modifications are accounted for as "troubled debt restructurings" (TDRs). The allowance for loan losses for TDRs is determined in accordance with ASC-310-10-35 by comparing expected cash flows of the loans discounted at the loans' original effective interest rates to the carrying value of the loans. Where short-term concessions have been granted, the allowance for loan losses is materially consistent with the requirements of ASC-310-10-35.
Reserve Estimates and Policies
Management provides reserves for an estimate of probable losses inherent in the funded loan portfolio on the balance sheet in the form of an allowance for loan losses. These reserves are established in accordance with Citigroup's Credit Reserve Policies, as approved by the Audit Committee of the Board of Directors. Citi's Chief Risk Officer and Chief Financial Officer review the adequacy of the credit loss reserves each quarter with representatives from the Risk Management and Finance staffs for each applicable business area.
The above-mentioned representatives covering the business areas having classifiably managed portfolios, where internal credit-risk ratings are assigned (primarily ICG, Regional Consumer Banking and Local Consumer Lending ), or modified consumer loans, where concessions were granted due to the borrowers' financial difficulties present recommended reserve balances for their funded and unfunded lending portfolios along with supporting quantitative and qualitative data. The quantitative data include:
- •
-
Estimated probable losses for non-performing, non-homogeneous exposures
within a business line's classifiably managed portfolio and impaired smaller-balance homogeneous loans whose terms have been modified due to the borrowers' financial difficulties, and it was
determined that a concession was granted to the borrower.
Consideration may be given to the following, as appropriate, when determining this estimate: (i) the present
value of expected future cash flows discounted at the loan's original effective rate; (ii) the borrower's overall financial condition, resources and payment record; and (iii) the
prospects for support from financially responsible guarantors or the realizable value of any collateral. When impairment is measured based on the present value of expected future cash flows, the
entire change in present value is recorded in the
Provision for loan losses
.
- •
-
Statistically calculated losses inherent in the classifiably managed portfolio for performing and
de minimis non-performing exposures
. The calculation is based upon: (i) Citigroup's internal system of credit-risk ratings, which are analogous
to the risk ratings of the major rating agencies; and (ii) historical default and loss data, including rating-agency information regarding default rates from 1983 to 2008, and internal data
dating to the early 1970s on severity of losses in the event of default.
- •
- Additional adjustments include: (i) statistically calculated estimates to cover the historical fluctuation of the default rates over the credit cycle, the historical variability of loss severity among defaulted loans, and the degree to which there are large obligor concentrations in the global portfolio; and (ii) adjustments made for specifically known items, such as current environmental factors and credit trends.
44
In addition, representatives from both the Risk Management and Finance staffs that cover business areas that have delinquency-managed portfolios containing smaller homogeneous loans present their recommended reserve balances based upon leading credit indicators, including loan delinquencies and changes in portfolio size as well as economic trends including housing prices, unemployment and GDP. This methodology is applied separately for each individual product within each different geographic region in which these portfolios exist.
This evaluation process is subject to numerous estimates and judgments. The frequency of default, risk ratings, loss recovery rates, the size and diversity of individual large credits, and the ability of borrowers with foreign currency obligations to obtain the foreign currency necessary for orderly debt servicing, among other things, are all taken into account during this review. Changes in these estimates could have a direct impact on the credit costs in any quarter and could result in a change in the allowance. Changes to the reserve flow through the Consolidated Statement of Income on the line Provision for loan losses.
Allowance for Unfunded Lending Commitments
A similar approach to the allowance for loan losses is used for calculating a reserve for the expected losses related to unfunded loan commitments and standby letters of credit. This reserve is classified on the balance sheet in Other liabilities . Changes to the allowance for unfunded lending commitments flow through the Consolidated Statement of Income on the line Provision for unfunded lending commitments .
45
Details of Credit Loss Experience
| In millions of dollars |
1st Qtr.
2010 |
4th Qtr.
2009 |
3rd Qtr.
2009 |
2nd Qtr.
2009 |
1st Qtr.
2009 |
|||||||||||
|---|---|---|---|---|---|---|---|---|---|---|---|---|---|---|---|---|
|
Allowance for loan losses at beginning of period |
$ | 36,033 | $ | 36,416 | $ | 35,940 | $ | 31,703 | $ | 29,616 | ||||||
|
Provision for loan losses |
||||||||||||||||
|
Consumer |
$ | 8,244 | $ | 7,077 | $ | 7,321 | $ | 10,010 | $ | 8,010 | ||||||
|
Corporate |
122 | 764 | 1,450 | 2,223 | 1,905 | |||||||||||
|
|
$ | 8,366 | $ | 7,841 | $ | 8,771 | $ | 12,233 | $ | 9,915 | ||||||
|
Gross credit losses |
||||||||||||||||
|
Consumer |
||||||||||||||||
|
In U.S. offices |
$ | 6,942 | $ | 4,360 | $ | 4,459 | $ | 4,694 | $ | 4,124 | ||||||
|
In offices outside the U.S. |
1,797 | 2,187 | 2,406 | 2,305 | 1,936 | |||||||||||
|
Corporate |
||||||||||||||||
|
In U.S. offices |
404 | 478 | 1,101 | 1,216 | 1,176 | |||||||||||
|
In offices outside the U.S. |
155 | 877 | 483 | 558 | 424 | |||||||||||
|
|
$ | 9,298 | $ | 7,902 | $ | 8,449 | $ | 8,773 | $ | 7,660 | ||||||
|
Credit recoveries |
||||||||||||||||
|
Consumer |
||||||||||||||||
|
In U.S. offices |
$ | 419 | $ | 160 | $ | 149 | $ | 131 | $ | 136 | ||||||
|
In offices outside the U.S. |
300 | 327 | 288 | 261 | 213 | |||||||||||
|
Corporate |
||||||||||||||||
|
In U.S. offices |
177 | 246 | 30 | 4 | 1 | |||||||||||
|
In offices outside the U.S. |
18 | 34 | 13 | 22 | 28 | |||||||||||
|
|
$ | 914 | $ | 767 | $ | 480 | $ | 418 | $ | 378 | ||||||
|
Net credit losses |
||||||||||||||||
|
In U.S. offices |
$ | 6,750 | $ | 4,432 | $ | 5,381 | $ | 5,775 | $ | 5,163 | ||||||
|
In offices outside the U.S. |
1,634 | 2,703 | 2,588 | 2,580 | 2,119 | |||||||||||
|
Total |
$ | 8,384 | $ | 7,135 | $ | 7,969 | $ | 8,355 | $ | 7,282 | ||||||
|
Other—net(1)(2)(3)(4)(5) |
$ | 12,731 | $ | (1,089 | ) | $ | (326 | ) | $ | 359 | $ | (546 | ) | |||
|
Allowance for loan losses at end of period(6) |
$ | 48,746 | $ | 36,033 | $ | 36,416 | $ | 35,940 | $ | 31,703 | ||||||
|
Allowance for loan losses as a % of total loans |
6.80 | % | 6.09 | % | 5.85 | % | 5.60 | % | 4.82 | % | ||||||
|
Allowance for unfunded lending commitments(7) |
$ | 1,122 | $ | 1,157 | $ | 1,074 | $ | 1,082 | $ | 947 | ||||||
|
Total allowance for loan losses and unfunded lending commitments |
$ | 49,868 | $ | 37,190 | $ | 37,490 | $ | 37,022 | $ | 32,650 | ||||||
|
Net consumer credit losses |
$ | 8,020 | $ | 6,060 | $ | 6,428 | $ | 6,607 | $ | 5,711 | ||||||
|
As a percentage of average consumer loans |
6.04 | % | 5.43 | % | 5.66 | % | 5.88 | % | 4.95 | % | ||||||
|
Net corporate credit losses |
$ | 364 | $ | 1,075 | $ | 1,541 | $ | 1,748 | $ | 1,571 | ||||||
|
As a percentage of average corporate loans |
0.19 | % | 0.61 | % | 0.82 | % | 0.89 | % | 0.79 | % | ||||||
|
Allowance for loan losses at end of period(8) |
||||||||||||||||
|
Citicorp |
$ | 18,503 | $ | 10,731 | $ | 10,956 | $ | 10,676 | $ | 9,088 | ||||||
|
Citi Holdings |
30,243 | 25,302 | 25,460 | 25,264 | 22,615 | |||||||||||
|
Total Citigroup |
$ | 48,476 | $ | 36,033 | $ | 36,416 | $ | 35,940 | $ | 31,703 | ||||||
|
Allowance by type |
||||||||||||||||
|
Consumer(9) |
$ | 41,422 | $ | 28,397 | $ | 28,420 | $ | 27,969 | $ | 24,036 | ||||||
|
Corporate |
7,324 | 7,636 | 7,996 | 7,971 | 7,667 | |||||||||||
|
Total Citigroup |
$ | 48,746 | $ | 36,033 | $ | 36,416 | $ | 35,940 | $ | 31,703 | ||||||
- (1)
-
The
first quarter of 2010 primarily includes $13.4 billion related to the impact of consolidating entities in connection with Citi's adoption of
SFAS 166/167 as of January 1, 2010 and reductions of approximately $640 million related to the sale or transfer to held-for-sale of U.S. and U.K. real
estate lending loans.
- (2)
-
The
fourth quarter of 2009 includes a reduction of approximately $335 million related to securitizations and approximately $400 million
related to the sale or transfer to held-for-sale of U.S. real estate lending loans.
- (3)
-
The
third quarter of 2009 primarily includes a reduction to the credit loss reserves of $562 million related to the transfer of the U.K. Cards
portfolio to held-for-sale partially offset by increases related to FX translation.
- (4)
-
The
second quarter of 2009 primarily includes increases to the credit loss reserves primarily related to FX translation.
- (5)
-
The
first quarter of 2009 primarily includes reductions to the credit loss reserves of $213 million related to securitizations and reductions of
approximately $320 million primarily related to FX translation.
- (6)
-
Included
in the allowance for loan losses are reserves for loans which have been subject to troubled debt restructurings (TDRs) of $6,926 million,
$4,819 million, $4,587 million, $3,810 million and $2,760 million as of March 31, 2010, December 31, 2009, September 30, 2009, June 30, 2009 and
March 31, 2009, respectively.
- (7)
-
Represents
additional credit loss reserves for unfunded corporate lending commitments and letters of credit recorded in
Other
Liabilities
on the Consolidated Balance Sheet.
- (8)
-
Allowance
for loan losses represents management's best estimate of probable losses inherent in the portfolio, as well as probable losses related to large
individually evaluated impaired loans and troubled debt restructurings. Attribution of the allowance is made for analytical purposes only, and the entire allowance is available to absorb probable
credit losses inherent in the overall portfolio.
- (9)
- Included in the first quarter of 2010 consumer loan loss reserve is $21.7 billion related to Citi's global credit card portfolio and reflects the adoption of SFAS 166/167 as of January 1, 2010. See discussion on page 3 and Note 1 to the Consolidated Financial Statements.
46
The table below summarizes Citigroup's view of non-accrual loans as of the periods indicated. Non-accrual loans are loans in which the borrower has fallen behind in interest payments or, for corporate loans, where Citi has determined that the payment of interest or principal is doubtful, and which are therefore considered impaired. As discussed under "Loan Accounting Policies" above, in situations where Citi reasonably expects that only a portion of the principal and interest owed will ultimately be collected, all payments received are reflected as a reduction of principal and not as interest income. There is no industry-wide definition of non-accrual assets, however, and as such, analysis across the industry is not always comparable.
Corporate non-accrual loans may still be current on interest payments. Consistent with industry conventions, Citi generally accrues interest on credit card loans until such loans are charged-off, which typically occurs at 180 days' contractual delinquency. As such, the non-accrual loan disclosures in this section do not include credit card loans.
Non-accrual loans
| In millions of dollars |
1st Qtr.
2010 |
4th Qtr.
2009 |
3rd Qtr.
2009 |
2nd Qtr.
2009 |
1st Qtr.
2009 |
||||||||||||
|---|---|---|---|---|---|---|---|---|---|---|---|---|---|---|---|---|---|
|
Citicorp |
$ | 5,024 | $ | 5,353 | $ | 5,507 | $ | 5,395 | $ | 3,951 | |||||||
|
Citi Holdings |
23,544 | 26,387 | 27,177 | 22,851 | 22,160 | ||||||||||||
|
Total non-accrual loans (NAL) |
$ | 28,568 | $ | 31,740 | $ | 32,684 | $ | 28,246 | $ | 26,111 | |||||||
|
Corporate non-accrual loans(1) |
|||||||||||||||||
|
North America |
$ | 5,660 | $ | 5,621 | $ | 5,263 | $ | 3,499 | $ | 3,789 | |||||||
|
EMEA |
5,834 | 6,308 | 7,969 | 7,690 | 6,479 | ||||||||||||
|
Latin America |
608 | 569 | 416 | 230 | 300 | ||||||||||||
|
Asia |
830 | 981 | 1,061 | 1,056 | 635 | ||||||||||||
|
|
$ | 12,932 | $ | 13,479 | $ | 14,709 | $ | 12,475 | $ | 11,203 | |||||||
|
Citicorp |
$ | 2,975 | $ | 3,238 | $ | 3,300 | $ | 3,159 | $ | 1,935 | |||||||
|
Citi Holdings |
9,957 | 10,241 | $ | 11,409 | $ | 9,316 | $ | 9,268 | |||||||||
|
|
$ | 12,932 | $ | 13,479 | $ | 14,709 | $ | 12,475 | $ | 11,203 | |||||||
|
Consumer non-accrual loans(1) |
|||||||||||||||||
|
North America |
$ | 12,966 | $ | 15,111 | $ | 14,609 | $ | 12,154 | $ | 11,687 | |||||||
|
EMEA |
790 | 1,159 | 1,314 | 1,356 | 1,128 | ||||||||||||
|
Latin America |
1,246 | 1,340 | 1,342 | 1,520 | 1,338 | ||||||||||||
|
Asia |
634 | 651 | 710 | 741 | 755 | ||||||||||||
|
|
$ | 15,636 | $ | 18,261 | $ | 17,975 | $ | 15,771 | $ | 14,908 | |||||||
|
Citicorp |
$ | 2,049 | $ | 2,115 | $ | 2,207 | $ | 2,236 | $ | 2,016 | |||||||
|
Citi Holdings |
13,587 | 16,146 | 15,768 | 13,535 | 12,892 | ||||||||||||
|
|
$ | 15,636 | $ | 18,261 | $ | 17,975 | $ | 15,771 | $ | 14,908 | |||||||
- (1)
- Excludes purchased distressed loans as they are generally accreting interest. The carrying value of these loans was $804 million at March 31, 2010, $920 million at December 31, 2009, $1.267 billion at September 30, 2009, $1.509 billion at June 30, 2009, and $1.328 billion at March 31, 2009.
47
Non-Accrual Assets (continued)
The table below summarizes Citigroup's other real estate owned (OREO) assets. This represents the carrying value of all property acquired by foreclosure or other legal proceedings when Citi has taken possession of the collateral.
| OREO |
1st Qtr.
2010 |
4th Qtr.
2009 |
3rd Qtr.
2009 |
2nd Qtr.
2009 |
1st Qtr.
2009 |
|||||||||||
|---|---|---|---|---|---|---|---|---|---|---|---|---|---|---|---|---|
|
Citicorp |
$ | 881 | $ | 874 | $ | 284 | $ | 291 | $ | 307 | ||||||
|
Citi Holdings |
632 | 615 | 585 | 664 | 854 | |||||||||||
|
Corporate/Other |
8 | 11 | 15 | 14 | 41 | |||||||||||
|
Total OREO |
$ | 1,521 | $ | 1,500 | $ | 884 | $ | 969 | $ | 1,202 | ||||||
|
North America |
$ | 1,291 | $ | 1,294 | $ | 682 | $ | 789 | $ | 1,115 | ||||||
|
EMEA |
134 | 121 | 105 | 97 | 65 | |||||||||||
|
Latin America |
51 | 45 | 40 | 29 | 20 | |||||||||||
|
Asia |
45 | 40 | 57 | 54 | 2 | |||||||||||
|
|
$ | 1,521 | $ | 1,500 | $ | 884 | $ | 969 | $ | 1,202 | ||||||
|
Other repossessed assets(1) |
$ | 64 | $ | 73 | $ | 76 | $ | 72 | $ | 78 | ||||||
- (1)
- Primarily transportation equipment, carried at lower of cost or fair value, less costs to sell.
| Non-accrual assets—Total Citigroup |
1st Qtr.
2010 |
4th Qtr.
2009 |
3rd Qtr.
2009 |
2nd Qtr.
2009 |
1st Qtr.
2009 |
|||||||||||
|---|---|---|---|---|---|---|---|---|---|---|---|---|---|---|---|---|
|
Corporate non-accrual loans |
$ | 12,932 | $ | 13,479 | $ | 14,709 | $ | 12,475 | $ | 11,203 | ||||||
|
Consumer non-accrual loans |
15,636 | 18,261 | 17,975 | 15,771 | 14,908 | |||||||||||
|
Non-accrual loans (NAL) |
$ | 28,568 | $ | 31,740 | $ | 32,684 | $ | 28,246 | $ | 26,111 | ||||||
|
OREO |
$ | 1,521 | $ | 1,500 | $ | 884 | $ | 969 | $ | 1,202 | ||||||
|
Other repossessed assets |
64 | 73 | 76 | 72 | 78 | |||||||||||
|
Non-accrual assets (NAA) |
$ | 30,153 | $ | 33,313 | $ | 33,644 | $ | 29,287 | $ | 27,391 | ||||||
|
NAL as a percentage of total loans |
3.96 | % | 5.37 | % | 5.25 | % | 4.40 | % | 3.97 | % | ||||||
|
NAA as a percentage of total assets |
1.51 | % | 1.79 | % | 1.78 | % | 1.58 | % | 1.50 | % | ||||||
|
Allowance for loan losses as a percentage of NAL(1) |
171 | % | 114 | % | 111 | % | 127 | % | 121 | % | ||||||
- (1)
- The allowance for loan losses includes the allowance for credit card and purchased distressed loans, while the non-accrual loans exclude credit card balances and purchased distressed loans as these generally continue to accrue interest until write-off.
| Non-accrual assets—Total Citicorp |
1st Qtr.
2010 |
4th Qtr.
2009 |
3rd Qtr.
2009 |
2nd Qtr.
2009 |
1st Qtr.
2009 |
|||||||||||
|---|---|---|---|---|---|---|---|---|---|---|---|---|---|---|---|---|
|
Non-accrual loans (NAL) |
$ | 5,024 | $ | 5,353 | $ | 5,507 | $ | 5,395 | $ | 3,951 | ||||||
|
OREO |
881 | 874 | 284 | 291 | 307 | |||||||||||
|
Other repossessed assets |
N/A | N/A | N/A | N/A | N/A | |||||||||||
|
Non-accrual assets (NAA) |
$ | 5,905 | $ | 6,227 | $ | 5,791 | $ | 5,686 | $ | 4,258 | ||||||
|
NAA as a percentage of total assets |
0.48 | % | 0.55 | % | 0.54 | % | 0.54 | % | 0.42 | % | ||||||
|
Allowance for loan losses as a percentage of NAL(1) |
368 | % | 200 | % | 199 | % | 198 | % | 230 | % | ||||||
|
Non-accrual assets—Total Citi Holdings |
||||||||||||||||
|
Non-accrual loans (NAL) |
$ | 23,544 | $ | 26,387 | $ | 27,177 | $ | 22,851 | $ | 22,160 | ||||||
|
OREO |
632 | 615 | 585 | 664 | 854 | |||||||||||
|
Other repossessed assets |
N/A | N/A | N/A | N/A | N/A | |||||||||||
|
Non-accrual assets (NAA) |
$ | 24,176 | $ | 27,002 | $ | 27,762 | $ | 23,515 | $ | 23,014 | ||||||
|
NAA as a percentage of total assets |
4.81 | % | 5.54 | % | 4.99 | % | 4.04 | % | 3.84 | % | ||||||
|
Allowance for loan losses as a percentage of NAL(1) |
128 | % | 96 | % | 94 | % | 111 | % | 102 | % | ||||||
- (1)
- The allowance for loan losses includes the allowance for credit card ($21.7 billion at March 31, 2010) and purchased distressed loans, while the non-accrual loans exclude credit card balances and purchased distressed loans as these generally continue to accrue interest until write-off.
N/A Not available at the Citicorp or Citi Holdings level.
Renegotiated Loans
| In millions of dollars at year end |
1st Qtr.
2010 |
4th Qtr.
2009 |
|||||
|---|---|---|---|---|---|---|---|
|
Renegotiated loans(1)(2) |
|||||||
|
In U.S. offices |
$ | 19,064 | $ | 13,421 | |||
|
In offices outside the U.S. |
3,919 | 3,643 | |||||
|
|
$ | 22,983 | $ | 17,064 | |||
- (1)
-
Smaller-balance,
homogeneous renegotiated loans were derived from Citi's risk management systems.
- (2)
- Also includes Corporate and Commercial Business loans.
48
Representations and Warranties
When selling a loan, Citi makes various representations and warranties. In the event of a breach of these representations and warranties, Citi may be required to either repurchase the mortgage loans (generally at unpaid principal balance plus accrued interest), with the identified defects, or indemnify ("make whole") the investor or insurer. Citigroup's repurchases are primarily from Government Sponsored Entities. The specific representations and warranties made by Citi depend on the nature of the transaction and the requirements of the buyer. Market conditions and credit-ratings agency requirements may also affect representations and warranties and the other provisions Citi may agree to in loan sales. Citi has recorded a repurchase reserve that is included in Other liabilities in the Consolidated Balance Sheet. In the case of a repurchase, Citi will bear any subsequent credit loss on the mortgage loans.
Citi's representations and warranties are generally not subject to stated limits in amount or time of coverage. However, contractual liability arises only when the representations and warranties are breached and generally only when a loss results from the breach. In the case of a repurchase, the loan is typically considered a credit-impaired loan and accounted for under SOP 03-3, "Accounting for Certain Loans and Debt Securities, Acquired in a Transfer" (now incorporated into ASC 310-30, Receivables—Loans and Debt Securities Acquired with Deteriorated Credit Quality ). These repurchases have not had a material impact on nonperforming loan statistics because credit-impaired purchased SOP 03-3 loans are not included in nonaccrual loans.
In the case of a repurchase of a credit-impaired SOP 03-3 loan, the difference between the loan's fair value and unpaid principal balance at the time of the repurchase is recorded as a utilization of the repurchase reserve. Payments to make the investor whole are also treated as utilizations and charged directly against the reserve. The provision for estimated probable losses arising from loan sales is recorded as an adjustment to the gain on sale, which is included in Other revenue in the Consolidated Statement of Income. A liability for representations and warranties is estimated when Citi sells loans and is updated quarterly. Any change in estimate is recorded in Other revenue in the Consolidated Statement of Income.
The activity in the repurchase reserve for the quarters ended March 31, 2010 and March 31, 2009 is as follows:
| In millions of dollars | 2010 | 2009 | |||||
|---|---|---|---|---|---|---|---|
|
Balance, beginning of period |
$ | 482 | $ | 75 | |||
|
Additions for new sales |
5 | 5 | |||||
|
Change in estimate |
— | 171 | |||||
|
Utilizations |
(37 | ) | (33 | ) | |||
|
Balance, end of period |
$ | 450 | $ | 218 | |||
49
Consumer Loan Delinquency Amounts and Ratios
|
|
Total loans(6) | 90+ days past due(1) | 30-89 days past due(1) | |||||||||||||||||||
|---|---|---|---|---|---|---|---|---|---|---|---|---|---|---|---|---|---|---|---|---|---|---|
| In millions of dollars, except EOP loan amounts in billions |
Mar.
2010 |
Mar.
2010 |
Dec.
2009 |
Mar.
2009 |
Mar.
2010 |
Dec.
2009 |
Mar.
2009 |
|||||||||||||||
|
Citicorp |
||||||||||||||||||||||
|
Total |
$ | 220.8 | $ | 4,005 | $ | 4,070 | $ | 3,939 | $ | 4,289 | $ | 4,252 | $ | 4,649 | ||||||||
|
Ratio |
1.81 | % | 1.81 | % | 1.86 | % | 1.94 | % | 1.89 | % | 2.19 | % | ||||||||||
|
Retail Bank |
||||||||||||||||||||||
|
Total |
110.6 | 863 | 784 | 700 | 1,197 | 1,021 | 1,111 | |||||||||||||||
|
Ratio |
0.78 | % | 0.73 | % | 0.69 | % | 1.08 | % | 0.95 | % | 1.10 | % | ||||||||||
|
North America |
31.5 | 142 | 106 | 99 | 236 | 81 | 92 | |||||||||||||||
|
Ratio |
0.45 | % | 0.33 | % | 0.29 | % | 0.75 | % | 0.25 | % | 0.27 | % | ||||||||||
|
EMEA |
4.9 | 52 | 60 | 58 | 182 | 203 | 213 | |||||||||||||||
|
Ratio |
1.06 | % | 1.15 | % | 1.06 | % | 3.71 | % | 3.90 | % | 3.87 | % | ||||||||||
|
Latin America |
19.4 | 433 | 382 | 280 | 357 | 300 | 290 | |||||||||||||||
|
Ratio |
2.23 | % | 2.10 | % | 1.82 | % | 1.84 | % | 1.65 | % | 1.88 | % | ||||||||||
|
Asia |
54.8 | 236 | 236 | 263 | 422 | 437 | 516 | |||||||||||||||
|
Ratio |
0.43 | % | 0.46 | % | 0.57 | % | 0.77 | % | 0.85 | % | 1.12 | % | ||||||||||
|
Citi-Branded Cards(2)(3) |
||||||||||||||||||||||
|
Total |
110.2 | 3,142 | 3,286 | 3,239 | 3,092 | 3,231 | 3,538 | |||||||||||||||
|
Ratio |
2.85 | % | 2.80 | % | 2.92 | % | 2.81 | % | 2.75 | % | 3.19 | % | ||||||||||
|
North America |
77.7 | 2,304 | 2,371 | 2,307 | 2,145 | 2,182 | 2,337 | |||||||||||||||
|
Ratio |
2.96 | % | 2.82 | % | 2.82 | % | 2.76 | % | 2.59 | % | 2.86 | % | ||||||||||
|
EMEA |
2.9 | 77 | 85 | 58 | 113 | 140 | 131 | |||||||||||||||
|
Ratio |
2.66 | % | 2.82 | % | 2.33 | % | 3.91 | % | 4.67 | % | 5.24 | % | ||||||||||
|
Latin America |
12.1 | 497 | 553 | 555 | 473 | 556 | 683 | |||||||||||||||
|
Ratio |
4.11 | % | 4.46 | % | 4.91 | % | 3.91 | % | 4.48 | % | 6.04 | % | ||||||||||
|
Asia |
17.5 | 264 | 277 | 319 | 361 | 353 | 387 | |||||||||||||||
|
Ratio |
1.51 | % | 1.55 | % | 2.07 | % | 2.06 | % | 1.97 | % | 2.51 | % | ||||||||||
|
Citi Holdings—Local Consumer Lending |
||||||||||||||||||||||
|
Total |
308.9 | 16,808 | 18,457 | 15,478 | 11,836 | 13,945 | 14,058 | |||||||||||||||
|
Ratio |
5.66 | % | 6.11 | % | 4.54 | % | 3.99 | % | 4.62 | % | 4.12 | % | ||||||||||
|
International |
27.7 | 953 | 1,362 | 1,380 | 1,059 | 1,482 | 1,964 | |||||||||||||||
|
Ratio |
3.44 | % | 4.22 | % | 3.59 | % | 3.82 | % | 4.59 | % | 5.11 | % | ||||||||||
|
North America retail partners cards(2)(3) |
54.5 | 2,385 | 2,681 | 2,791 | 2,374 | 2,674 | 2,826 | |||||||||||||||
|
Ratio |
4.38 | % | 4.42 | % | 4.36 | % | 4.36 | % | 4.41 | % | 4.42 | % | ||||||||||
|
North America (excluding cards)(4)(5) |
226.7 | 13,470 | 14,414 | 11,307 | 8,403 | 9,789 | 9,268 | |||||||||||||||
|
Ratio |
6.27 | % | 6.89 | % | 4.74 | % | 3.91 | % | 4.68 | % | 3.88 | % | ||||||||||
|
Total Citigroup (excluding Special Asset Pool ) |
$ | 529.7 | $ | 20,813 | $ | 22,527 | $ | 19,417 | $ | 16,125 | $ | 18,197 | $ | 18,707 | ||||||||
|
Ratio |
4.02 | % | 4.28 | % | 3.51 | % | 3.11 | % | 3.46 | % | 3.38 | % | ||||||||||
- (1)
-
The
ratios of 90 days or more past due and 30 to 89 days past due are calculated based on end-of-period loans.
- (2)
-
The
90 days or more past due balances for Citi-branded cards and retail partners cards are generally still accruing interest. Citigroup's
policy is generally to accrue interest on credit card loans until 180 days past due, unless notification of bankruptcy filing has been received earlier.
- (3)
-
The
above information presents consumer credit information on a managed basis. Citigroup adopted SFAS 166/167 effective January 1, 2010. As a
result, beginning in the first quarter of 2010, there is no longer a difference between reported and managed delinquencies. Prior quarters' managed delinquencies are included herein for comparative
purposes to the 2010 first quarter delinquencies. Managed basis reporting historically impacted the
North America Regional Consumer
Banking
—Citi-branded cards and the
Local Consumer Lending
—retail partner cards businesses.
The historical disclosures reflect the impact from credit card securitizations only. See discussion of adoption of SFAS 166/167 on page 3 and Note 1 to the Consolidated Financial
Statements.
- (4)
-
The
90 or more and 30 to 89 days past due and related ratio for
North America LCL
(excluding cards)
excludes U.S. mortgage loans that are guaranteed by U.S. government sponsored agencies since the potential loss predominantly resides within the U.S. agencies. The amounts excluded for loans
90 days or more past due and (end-of-period loans) for each period are: $5.2 billion ($9.0 billion), $5.4 billion ($9.0 billion), and
$3.6 billion ($7.1 billion) as of March 31, 2010, December 31, 2009 and March 31, 2009, respectively. The amounts excluded for loans 30 to 89 days past due
(end-of-period loans have the same adjustment as above) for each period are: $1.2 billion, $1.0 billion, and $0.6 billion, as of March 31, 2010,
December 31, 2009 and March 31, 2009, respectively.
- (5)
-
The
March 31, 2010 loans 90 days or more past due and 30-89 days or more past due and related ratios for North America (ex Cards)
excludes $2.9 billion of loans that are carried at fair value.
- (6)
- Total loans include interest and fees on credit cards.
50
Consumer Loan Net Credit Losses and Ratios
|
|
Average
loans(1) |
Net credit losses(2) | |||||||||||||
|---|---|---|---|---|---|---|---|---|---|---|---|---|---|---|---|
| In millions of dollars, except average loan amounts in billions | 1Q10 | 1Q10 | 4Q09 | 1Q09 | |||||||||||
|
Citicorp |
|||||||||||||||
|
Total |
$ | 221.5 | $ | 3,040 | $ | 1,388 | $ | 1,174 | |||||||
|
Add: impact of credit card securitizations(3) |
— | 1,727 | 1,491 | ||||||||||||
|
Managed NCL |
$ | 3,040 | $ | 3,115 | $ | 2,665 | |||||||||
|
Ratio |
5.57 | % | 5.50 | % | 5.06 | % | |||||||||
|
Retail Bank |
|||||||||||||||
|
Total |
109.5 | 289 | 409 | 338 | |||||||||||
|
Ratio |
1.07 | % | 1.49 | % | 1.36 | % | |||||||||
|
North America |
32.2 | 73 | 88 | 56 | |||||||||||
|
Ratio |
0.94 | % | 1.04 | % | 0.66 | % | |||||||||
|
EMEA |
5.0 | 47 | 84 | 60 | |||||||||||
|
Ratio |
3.88 | % | 5.99 | % | 4.50 | % | |||||||||
|
Latin America |
18.5 | 91 | 149 | 112 | |||||||||||
|
Ratio |
1.96 | % | 3.31 | % | 2.96 | % | |||||||||
|
Asia |
53.8 | 78 | 88 | 110 | |||||||||||
|
Ratio |
0.60 | % | 0.68 | % | 0.98 | % | |||||||||
|
Citi-Branded Cards |
|||||||||||||||
|
Total |
112.0 | 2,751 | 979 | 836 | |||||||||||
|
Add: impact of credit card securitizations(3) |
— | 1,727 | 1,491 | ||||||||||||
|
Managed NCL |
2,751 | 2,706 | 2,327 | ||||||||||||
|
Ratio |
9.96 | % | 9.27 | % | 8.40 | % | |||||||||
|
North America |
79.2 | 2,084 | 220 | 201 | |||||||||||
|
Add: impact of credit card securitizations(3) |
— | 1,727 | 1,491 | ||||||||||||
|
Managed NCL |
2,084 | 1,947 | 1,692 | ||||||||||||
|
Ratio |
10.67 | % | 9.30 | % | 8.27 | % | |||||||||
|
EMEA |
2.9 | 50 | 54 | 29 | |||||||||||
|
Ratio |
6.97 | % | 7.13 | % | 4.68 | % | |||||||||
|
Latin America |
12.1 | 418 | 476 | 429 | |||||||||||
|
Ratio |
14.03 | % | 15.37 | % | 15.30 | % | |||||||||
|
Asia |
17.8 | 199 | 229 | 177 | |||||||||||
|
Ratio |
4.50 | % | 5.20 | % | 4.60 | % | |||||||||
|
Citi Holdings—Local Consumer Lending |
|||||||||||||||
|
Total |
318.0 | 4,938 | 4,612 | 4,517 | |||||||||||
|
Add: impact of credit card securitizations(3) |
— | 1,118 | 1,057 | ||||||||||||
|
Managed NCL |
4,938 | 5,730 | 5,574 | ||||||||||||
|
Ratio |
6.30 | % | 7.12 | % | 6.36 | % | |||||||||
|
International |
30.0 | 612 | 784 | 818 | |||||||||||
|
Ratio |
8.27 | % | 8.74 | % | 8.44 | % | |||||||||
|
North America retail partners cards |
57.1 | 1,932 | 845 | 901 | |||||||||||
|
Add: impact of credit card securitizations(3) |
— | 1,118 | 1,057 | ||||||||||||
|
Managed NCL |
1,932 | 1,963 | 1,958 | ||||||||||||
|
Ratio |
13.72 | % | 12.81 | % | 11.98 | % | |||||||||
|
North America (excluding cards) |
230.9 | 2,394 | 2,983 | 2,798 | |||||||||||
|
Ratio |
4.20 | % | 5.31 | % | 4.54 | % | |||||||||
|
Total Citigroup (excluding Special Asset Pool ) |
$ | 539.5 | $ | 7,978 | $ | 6,000 | $ | 5,691 | |||||||
|
Add: impact of credit card securitizations(3) |
— | 2,845 | 2,548 | ||||||||||||
|
Managed NCL |
7,978 | 8,845 | 8,239 | ||||||||||||
|
Ratio |
6.00 | % | 6.45 | % | 5.87 | % | |||||||||
- (1)
-
Average
loans include interest and fees on credit cards.
- (2)
-
The
ratios of net credit losses are calculated based on average loans, net of unearned income.
- (3)
- See page 3 and Note 1 to the Consolidated Financial Statements for a discussion of the impact of SFAS 166/167.
51
Consumer Loan Modification Programs
Citigroup has instituted a variety of modification programs to assist borrowers with financial difficulties. These programs include modifying the original loan terms, reducing interest rates, extending the remaining loan duration and/or waiving a portion of the remaining principal balance. At March 31, 2010, Citi's programs consist of the U.S. Treasury's Home Affordable Modification Program (HAMP), as well as short-term forbearance and long-term modification programs, each summarized below.
HAMP. The HAMP is designed to reduce monthly first mortgage payments to a 31% housing debt ratio by lowering the interest rate, extending the term of the loan and forbearing principal of certain eligible borrowers who have defaulted on their mortgages or who are at risk of imminent default due to economic hardship. In order to be entitled to loan modifications, borrowers must complete a three- to five-month trial period, make the agreed payments and provide the required documentation. Beginning March 1, 2010, documentation is required to be provided prior to beginning the trial period, whereas prior to that date, it was required to be provided before the end of the trial period. This change generally means that Citi is able to verify income up front for potential HAMP participants before they begin making lower monthly payments. Citi currently believes this change will limit the number of borrowers who ultimately fall out from the trials and potentially mitigates the impact of HAMP trial participants on early bucket delinquency data.
During the trial period, Citi requires that the original terms of the loans remain in effect pending completion of the modification. As of March 31, 2010, approximately $6.1 billion of first mortgages were enrolled in the HAMP trial period, while $1.5 billion have successfully completed the trial period. Upon completion of the trial period, the terms of the loan are contractually modified, and it is accounted for as a "troubled debt restructuring" (see "Long-term programs" below). For additional information on HAMP, see "U.S. Consumer Mortgage Lending" below.
Citi also recently agreed to participate in the U.S. Treasury's HAMP second mortgage program, which requires Citi to either: (1) modify the borrower's second mortgage according to a defined protocol; or (2) accept a lump sum payment from the U.S. Treasury in exchange for full extinguishment of the second mortgage. For a borrower to qualify, the borrower must have successfully modified his/her first mortgage under the HAMP and met other criteria.
Short-term programs. Citigroup has also instituted interest rate reduction programs (primarily in the U.S.) to assist borrowers experiencing temporary hardships. These programs include short-term (12 months or less) interest rate reductions and deferrals of past due payments. The loan volume under these short-term programs increased significantly during 2009, and loan loss reserves for these loans have been enhanced, giving consideration to the higher risk associated with those borrowers and reflecting the estimated future credit losses for those loans. See "Loan Accounting Policies" above for a further discussion of the allowance for loan losses for such modified loans.
The following table presents the amounts of gross loans modified under short-term interest rate reduction programs in the U.S. (excluding HAMP trial modifications) as of March 31, 2010.
|
|
March 31, 2010 | ||||||
|---|---|---|---|---|---|---|---|
| In millions of dollars | Accrual | Non-accrual | |||||
|
Mortgage and real estate |
$ | 2,505 | $ | 34 | |||
|
Cards |
3,800 | — | |||||
|
Installment and other |
1,599 | 9 | |||||
Long-term programs. Long-term modification programs or troubled debt restructurings (TDRs) occur when the terms of a loan have been modified due to the borrowers' financial difficulties and a long-term concession has been granted to the borrower. Substantially all programs in place provide permanent interest rate reductions. See "Loan Accounting Policies" above for a discussion of the allowance for loan losses for such modified loans.
The following table presents these TDRs as of March 31, 2010 and December 31, 2009:
|
|
Accrual | Non-accrual | |||||||||||
|---|---|---|---|---|---|---|---|---|---|---|---|---|---|
| In millions of dollars |
Mar. 31,
2010 |
Dec. 31,
2009 |
Mar. 31,
2010 |
Dec. 31,
2009 |
|||||||||
|
Mortgage and real estate |
$ | 11,596 | $ | 8,654 | $ | 2,007 | $ | 1,413 | |||||
|
Cards |
5,004 | 2,303 | 22 | 150 | |||||||||
|
Installment and other |
3,515 | 3,128 | 432 | 250 | |||||||||
Payment deferrals that do not continue to accrue interest primarily occur in the U.S. residential mortgage business. Other payment deferrals continue to accrue interest and are not deemed to offer concessions to the customer. Other types of concessions are not material.
As discussed in more detail in "U.S. Consumer Mortgage Lending" and "North America Cards" below, the measurement of the success of Citi's loan modification programs varies by program objectives, type of loan, geography, and other factors. Citigroup uses a variety of metrics to evaluate success, including re-default rates and balance reduction trends. These metrics may be compared against the performance of similarly situated customers who did not receive concessions.
52
U.S. Consumer Mortgage Lending
Overview
Citi's North America consumer mortgage portfolio consists of both first lien and second lien mortgages. As of March 31, 2010, the first lien mortgage portfolio totaled approximately $116 billion while the second lien mortgage portfolio was approximately $55 billion. Although the majority of the mortgage portfolio is managed by LCL within Citi Holdings, there are $19 billion of first lien mortgages and $5 billion of second lien mortgages reported in Citicorp.
Citi's first lien mortgage portfolio includes $9.4 billion of loans with Federal Housing Administration or Veterans Administration guarantees. These portfolios consist of loans originated to low-to-moderate-income borrowers with lower FICO (Fair Isaac Corporation) scores and generally have higher loan-to-value ratios (LTVs). These loans have high delinquency rates but, given the guarantees, Citi has experienced negligible credit losses on these loans. The first lien mortgage portfolio also includes $1.7 billion of loans with LTVs above 80%, which have insurance through private mortgage insurance (PMI) companies, and $3.5 billion of loans subject to Long-Term Standby Commitments (1) with U.S. government sponsored enterprises (GSEs), for which Citi has limited exposure to credit losses.
Citi's second lien mortgage portfolio includes $1.7 billion of loans subject to LTSCs with GSEs, for which Citi has limited exposure to credit losses.
Citi's allowance for loan loss calculations take into consideration the impact of these guarantees.
Consumer Mortgage Quarterly Trends—Delinquencies and Net Credit Losses
The following charts detail the quarterly trends in delinquencies and net credit losses for the Citi's first and second North America consumer mortgage portfolios.
In the first mortgage portfolio, both delinquencies and net credit losses are impacted by the HAMP trial loans and the growing backlog of foreclosures in process. The growing amount of foreclosures in process, which is related to an industry-wide phenomenon resulting from foreclosure moratoria and other efforts to prevent or forestall foreclosure, have specific implications on the portfolio:
- •
-
It tends to inflate the amount of 180+ day delinquencies in our mortgage statistics.
- •
-
It can result in increasing levels of consumer non-accrual loans, as we are unable to take possession of the
underlying assets and sell these properties on a timely basis.
- •
- It may have a dampening effect on net interest margin (NIM) as non-accrual assets build on the company's balance sheet.
As discussed in "Consumer Loan Modification Programs" above, Citigroup also offers short-term and long-term real estate loan modification programs. Citi monitors the performance of its real estate loan modification programs by tracking credit loss rates by vintage. At 18 months after modifying an account, in Citi's experience to date, credit loss rates are typically reduced by approximately one-third compared to similar accounts that were not modified.
Currently, Citi's efforts are concentrated on the HAMP. Contractual modifications of loans that successfully completed the HAMP trial period began in September 2009; accordingly, this is the earliest HAMP vintage available for comparison. While still early, and while Citi continues to evaluate the impact of HAMP, Citi's experience to date is that re-default rates are likely to be lower for HAMP modified loans as compared to non-HAMP programs.
As previously disclosed, loans in the HAMP trial modification period that do not make their original contractual payment are reported as delinquent, even if the reduced payments agreed to under the program are made by the borrower. Upon conclusion of the trial period, loans that are not modified permanently are returned to the delinquency status in which they began their trial period, adjusted for the number of payments received during trial period. If the loans are modified permanently, they will be returned to current status.
Citigroup believes that the success rate of the HAMP will be a key factor influencing net credit losses from delinquent first mortgage loans, at least during the first half of 2010, and the outcome of the program will largely depend on the success rates of borrowers completing the trial period and meeting the documentation requirements.
As set forth in the charts below, both first and second mortgages experienced lower net credit losses and lower 90 days or more delinquencies in the first quarter of 2010. Net credit losses on first mortgages declined during the quarter, primarily due to HAMP loan conversions, an improvement in loan loss severity and approximately $1 billion of asset sales during the quarter. As of March 31, 2010, over $2 billion of HAMP trial modifications in Citi's on-balance sheet portfolio were converted to permanent modifications (including $1.5 billion of HAMP modifications).
For second mortgages, the net credit loss decrease during the quarter was driven by roll rate improvement.
- (1)
- A Long-Term Standby Commitment (LTSC) is a structured transaction in which Citi transfers the credit risk of certain eligible loans to an investor in exchange for a fee. These loans remain on balance sheet unless they reach a certain delinquency level (between 120 and 180 days), in which case the LTSC investor is required to buy the loan at par.
53
Note: Includes loans for Canada and Puerto Rico. Loans 90 days or more past due exclude loans recorded at fair value and U.S. mortgage loans that are guaranteed by U.S. government-sponsored agencies because the potential loss predominately resides with the U.S. agencies.
Note: Includes loans for Canada and Puerto Rico. Loans 90 days or more past due exclude loans recorded at fair value and U.S. mortgage loans that are guaranteed by U.S. government-sponsored agencies because the potential loss predominately resides with the U.S. agencies.
54
Consumer Mortgage FICO and LTV
Data appearing in the tables below have been sourced from Citigroup's risk systems and, as such, may not reconcile with disclosures elsewhere generally due to differences in methodology or variations in the manner in which information is captured. Citi has noted such variations in instances where it believes they could be material to reconcile the information presented elsewhere.
Citi's credit risk policy is not to offer option adjustable rate mortgages (ARMs)/negative amortizing mortgage products to its customers. As a result, option ARMs/negative amortizing mortgages represent an insignificant portion of total balances that were acquired only incidentally as part of prior portfolio and business purchases.
A portion of loans in the U.S. consumer mortgage portfolio currently requires a payment to satisfy only the current accrued interest for the payment period, or an interest only payment. Citi's mortgage portfolio includes approximately $29 billion of first and second lien home equity lines of credit (HELOCs) that are still within their revolving period and have not commenced amortization. The interest only payment feature during the revolving period is standard for the HELOC product across the industry. The first mortgage portfolio contains approximately $33 billion of ARMs that are currently required to make an interest only payment. These loans will be required to make a fully amortizing payment upon expiration of their interest only payment period, and most will do so within a few years of origination. Borrowers that are currently required to make an interest only payment cannot select a lower payment that would negatively amortize the loan. First mortgage loans with this payment feature are primarily to high credit quality borrowers that have on average significantly higher refreshed FICO scores than other loans in the first mortgage portfolio.
Loan Balances
First Mortgages—Loan Balances. As a consequence of the difficult economic environment and the decrease in housing prices, LTV and FICO scores have deteriorated since origination as depicted in the table below. On a refreshed basis, approximately 28% of first lien mortgages had a LTV ratio above 100%, compared to approximately 0% at origination. Approximately 30% of the first lien mortgages had FICO scores less than 620 on a refreshed basis, compared to 15% at origination.
Balances: March 31, 2010—First Lien Mortgages
|
At Origination
|
FICO ³ 660 | 620 £ FICO<660 | FICO<620 | |||||||
|---|---|---|---|---|---|---|---|---|---|---|
|
LTV £ 80% |
59 | % | 6 | % | 7 | % | ||||
|
80% < LTV £ 100% |
13 | % | 7 | % | 8 | % | ||||
|
LTV > 100% |
N.M. | N.M | N.M. | |||||||
|
Refreshed
|
FICO ³ 660 | 620 £ FICO<660 | FICO<620 | |||||||
|---|---|---|---|---|---|---|---|---|---|---|
|
LTV £ 80% |
28 | % | 4 | % | 10 | % | ||||
|
80% < LTV £ 100% |
17 | % | 3 | % | 10 | % | ||||
|
LTV > 100% |
15 | % | 3 | % | 10 | % | ||||
Note: N.M.—Not meaningful. First lien mortgage table excludes loans in Canada and Puerto Rico. Table excludes loans guaranteed by U.S. government sponsored agencies, loans recorded at fair value and loans subject to LTSCs. Table also excludes $1.8 billion from At Origination balances and $0.6 billion from Refreshed balances for which FICO or LTV data was unavailable. Balances exclude deferred fees/costs Refreshed FICO scores based on updated credit scores obtained from Fair Isaac Corporation. Refreshed LTV ratios are derived from data at origination updated using mainly the Loan Performance Price Index or the Federal Housing Finance Agency Price Index.
Second Mortgages—Loan Balances. In the second lien mortgage portfolio, the majority of loans are in the higher FICO categories. The challenging economic conditions have caused a migration towards lower FICO scores and higher LTV ratios. Approximately 48% of that portfolio had refreshed LTVs above 100%, compared to approximately 0% at origination. Approximately 18% of second lien mortgages had FICO scores less than 620 on a refreshed basis, compared to 3% at origination.
55
Balances: March 31, 2010—Second Lien Mortgages
|
At Origination
|
FICO ³ 660 | 620 £ FICO<660 | FICO<620 | |||||||
|---|---|---|---|---|---|---|---|---|---|---|
|
LTV £ 80% |
49 | % | 2 | % | 2 | % | ||||
|
80% < LTV £ 100% |
43 | % | 3 | % | 1 | % | ||||
|
LTV > 100% |
N.M. | N.M. | N.M. | |||||||
|
Refreshed
|
FICO ³ 660 | 620 £ FICO<660 | FICO<620 | |||||||
|---|---|---|---|---|---|---|---|---|---|---|
|
LTV £ 80% |
22 | % | 1 | % | 3 | % | ||||
|
80% < LTV £ 100% |
20 | % | 2 | % | 4 | % | ||||
|
LTV > 100% |
33 | % | 4 | % | 11 | % | ||||
Note: N.M.—Not meaningful. Second lien mortgage table excludes loans in Canada and Puerto Rico. Table excludes loans recorded at fair value and loans subject to LTSCs. Table also excludes $1.6 billion from At Origination balances and $0.4 billion from Refreshed balances for which FICO or LTV data was unavailable. Refreshed FICO scores based on updated credit scores obtained from Fair Isaac Corporation. Refreshed LTV ratios are derived from data at origination updated using mainly the Loan Performance Price Index or the Federal Housing Finance Agency Price Index.
Delinquencies
The tables below provide delinquency statistics for loans 90 or more days past due (90+DPD), as a percentage of outstandings in each of the FICO/LTV combinations, in both the first lien and second lien mortgage portfolios. For example, loans with FICO ³ 660 and LTV £ 80% at origination have a 90+DPD rate of 6.9%.
Loans with FICO scores of less than 620 exhibit significantly higher delinquencies than in any other FICO band. Similarly, loans with LTVs greater than 100% have higher delinquencies than LTVs of less than or equal to 100%.
Delinquencies: 90+DPD Rates—First Lien Mortgages
|
At Origination
|
FICO ³ 660 | 620 £ FICO<660 | FICO<620 | |||||||
|---|---|---|---|---|---|---|---|---|---|---|
|
LTV £ 80% |
6.9 | % | 12.5 | % | 13.5 | % | ||||
|
80% < LTV £ 100% |
9.5 | % | 15.7 | % | 19.2 | % | ||||
|
LTV > 100% |
N.M. | N.M. | N.M. | |||||||
|
Refreshed
|
FICO ³ 660 | 620 £ FICO<660 | FICO<620 | |||||||
|---|---|---|---|---|---|---|---|---|---|---|
|
LTV £ 80% |
0.2 | % | 3.5 | % | 16.9 | % | ||||
|
80% < LTV £ 100% |
0.6 | % | 8.5 | % | 25.9 | % | ||||
|
LTV > 100% |
1.7 | % | 20.3 | % | 36.7 | % | ||||
Note: 90+DPD are based on balances referenced in the tables above.
Delinquencies: 90+DPD Rates—Second Lien Mortgages
|
At Origination
|
FICO ³ 660 | 620 £ FICO<660 | FICO<620 | |||||||
|---|---|---|---|---|---|---|---|---|---|---|
|
LTV £ 80% |
1.6 | % | 4.9 | % | 5.5 | % | ||||
|
80% < LTV £ 100% |
3.8 | % | 4.9 | % | 7.0 | % | ||||
|
LTV > 100% |
N.M. | N.M. | N.M. | |||||||
|
Refreshed
|
FICO ³ 660 | 620 £ FICO<660 | FICO<620 | |||||||
|---|---|---|---|---|---|---|---|---|---|---|
|
LTV £ 80% |
0.0 | % | 1.5 | % | 8.4 | % | ||||
|
80% < LTV £ 100% |
0.1 | % | 1.4 | % | 9.5 | % | ||||
|
LTV > 100% |
0.4 | % | 3.6 | % | 17.0 | % | ||||
Note: 90+DPD are based on balances referenced in the tables above.
Origination Channel, Geographic Distribution and Origination Vintage
The following tables detail Citi's first and second lien U.S. consumer mortgage portfolio by origination channels, geographic distribution and origination vintage.
By Origination Channel
Citi's U.S. consumer mortgage portfolio has been originated from three main channels: retail, broker and correspondent.
- •
-
Retail: loans originated through a direct relationship with the borrower.
- •
-
Broker: loans originated through a mortgage broker, where Citi underwrites the loan directly with the borrower.
- •
- Correspondent: loans originated and funded by a third party, where Citi purchases the closed loans after the correspondent has funded the loan. This channel includes loans acquired in large bulk purchases from other mortgage originators primarily in 2006 and 2007. Such bulk purchases were discontinued in 2007.
First Lien Mortgages: March 31, 2010
As of March 31, 2010, approximately 54% of the first lien mortgage portfolio was originated through third-party channels. Given that loans originated through correspondents have exhibited higher 90+DPD delinquency rates than retail originated mortgages, Citi terminated business with a number of correspondent sellers in 2007 and 2008. During 2008, Citi also severed relationships with a number of brokers, only maintaining those who have produced strong, high-quality and profitable volume.
|
CHANNEL
($ in billions) |
First Lien
Mortgages |
Channel
% Total |
90+DPD % | *FICO < 620 | *LTV > 100% | |||||||||||
|---|---|---|---|---|---|---|---|---|---|---|---|---|---|---|---|---|
|
Retail |
$ | 46.6 | 45.9 | % | 5.4 | % | $ | 14.2 | $ | 9.2 | ||||||
|
Broker |
$ | 17.8 | 17.6 | % | 9.6 | % | $ | 3.4 | $ | 6.4 | ||||||
|
Correspondent |
$ | 37.2 | 36.6 | % | 14.8 | % | $ | 13.1 | $ | 13.4 | ||||||
- *
- Refreshed FICO and LTV.
Note: First lien mortgage table excludes Canada and Puerto Rico, deferred fees/costs, loans recorded at fair value, loans guaranteed by U.S. government sponsored agencies and loans subject to LTSCs.
56
Second Lien Mortgages: March 31, 2010
For second lien mortgages, approximately 48% of the loans were originated through third-party channels. As these mortgages have demonstrated a higher incidence of delinquencies, Citi no longer originates second mortgages through third-party channels.
|
CHANNEL
($ in billions) |
Second Lien
Mortgages |
Channel
% Total |
90+DPD % | *FICO < 620 | *LTV > 100% | |||||||||||
|---|---|---|---|---|---|---|---|---|---|---|---|---|---|---|---|---|
|
Retail |
$ | 24.5 | 51.6 | % | 1.7 | % | $ | 3.9 | $ | 8.0 | ||||||
|
Broker |
$ | 11.9 | 25.0 | % | 3.8 | % | $ | 2.1 | $ | 7.8 | ||||||
|
Correspondent |
$ | 11.1 | 23.5 | % | 4.4 | % | $ | 2.7 | $ | 7.0 | ||||||
- *
- Refreshed FICO and LTV.
Note: Excludes Canada and Puerto Rico, loans recorded at fair value and loans subject to LTSCs.
By State
Approximately half of the Citi's U.S. consumer mortgage portfolio is located in five states: California, New York, Florida, Illinois and Texas. Those states represent 50% of first lien mortgages and 55% of second lien mortgages.
Florida and Illinois have above average 90+DPD delinquency rates. Florida has 59% of its first mortgage lien portfolio with refreshed LTV>100%, compared to 29% overall for first lien mortgages. Illinois has 39% of its loan portfolio with refreshed LTV>100%. Texas, despite having 41% of its portfolio with FICO<620, has a lower delinquency rate relative to the overall portfolio. Texas has less than 1% of its loan portfolio with refreshed LTV>100%.
First Lien Mortgages: March 31, 2010
|
STATES
($ in billions) |
First Lien
Mortgages |
State
% Total |
90+DPD % | *FICO < 620 | *LTV > 100% | |||||||||||
|---|---|---|---|---|---|---|---|---|---|---|---|---|---|---|---|---|
|
California |
$ | 28.0 | 27.5 | % | 8.9 | % | $ | 4.6 | $ | 13.1 | ||||||
|
New York |
$ | 8.4 | 8.2 | % | 6.8 | % | $ | 1.6 | $ | 0.4 | ||||||
|
Florida |
$ | 6.1 | 6.0 | % | 15.2 | % | $ | 2.3 | $ | 3.6 | ||||||
|
Illinois |
$ | 4.2 | 4.2 | % | 11.6 | % | $ | 1.4 | $ | 1.6 | ||||||
|
Texas |
$ | 4.1 | 4.0 | % | 6.2 | % | $ | 1.7 | $ | 0.0 | ||||||
|
Others |
$ | 50.8 | 50.0 | % | 9.8 | % | $ | 19.2 | $ | 10.2 | ||||||
- *
- Refreshed FICO and LTV.
Note: First lien mortgage table excludes Canada and Puerto Rico, deferred fees/costs, loans recorded at fair value, loans guaranteed by U.S. government sponsored agencies and loans subject to LTSCs.
In the second lien mortgage portfolio, Florida continues to experience above-average delinquencies, with approximately 76% of their loans with LTV > 100% compared to 48% overall for second lien mortgages.
Second Lien Mortgages: March 31, 2010
|
STATES
($ in billions) |
Second Lien
Mortgages |
State
% Total |
90+DPD % | *FICO < 620 | *LTV > 100% | |||||||||||
|---|---|---|---|---|---|---|---|---|---|---|---|---|---|---|---|---|
|
California |
$ | 13.2 | 27.9 | % | 3.2 | % | $ | 1.9 | $ | 8.0 | ||||||
|
New York |
$ | 6.4 | 13.6 | % | 2.1 | % | $ | 0.9 | $ | 1.4 | ||||||
|
Florida |
$ | 3.1 | 6.5 | % | 4.9 | % | $ | 0.7 | $ | 2.3 | ||||||
|
Illinois |
$ | 1.8 | 3.9 | % | 2.6 | % | $ | 0.4 | $ | 1.2 | ||||||
|
Texas |
$ | 1.3 | 2.8 | % | 1.4 | % | $ | 0.2 | $ | 0.0 | ||||||
|
Others |
$ | 21.6 | 45.4 | % | 2.8 | % | $ | 4.7 | $ | 9.9 | ||||||
- *
- Refreshed FICO and LTV.
Note: Excludes Canada and Puerto Rico, loans recorded at fair value and loans subject to LTSCs.
By Vintage
For Citigroup's combined U.S. consumer mortgage portfolio (first and second lien mortgages), approximately half of the portfolio consists of 2006 and 2007 vintages, which demonstrate above average delinquencies. In first mortgages, approximately 43% of the portfolio is of 2006 and 2007 vintages, which have 90+DPD rates well above the overall portfolio rate. In second mortgages, 62% of the portfolio is of 2006 and 2007 vintages, which again have higher delinquencies compared to the overall portfolio rate.
First Lien Mortgages: March 31, 2010
|
VINTAGES
($ in billions) |
First Lien
Mortgages |
Vintage
% Total |
90+DPD % | *FICO < 620 | *LTV > 100% | |||||||||||
|---|---|---|---|---|---|---|---|---|---|---|---|---|---|---|---|---|
|
2010 |
$ | 0.4 | 0.4 | % | 0.2 | % | $ | 0.1 | $ | 0.0 | ||||||
|
2009 |
$ | 4.4 | 4.3 | % | 0.8 | % | $ | 0.6 | $ | 0.3 | ||||||
|
2008 |
$ | 13.1 | 12.9 | % | 5.3 | % | $ | 3.0 | $ | 2.5 | ||||||
|
2007 |
$ | 25.6 | 25.2 | % | 14.8 | % | $ | 9.7 | $ | 11.4 | ||||||
|
2006 |
$ | 18.3 | 18.0 | % | 12.6 | % | $ | 6.0 | $ | 8.0 | ||||||
|
2005 |
$ | 17.5 | 17.3 | % | 7.4 | % | $ | 4.2 | $ | 5.6 | ||||||
|
£ 2004 |
$ | 22.2 | 21.9 | % | 7.1 | % | $ | 7.1 | $ | 1.2 | ||||||
- *
- Refreshed FICO and LTV.
Note: First lien mortgage table excludes Canada and Puerto Rico, deferred fees/costs, loans recorded at fair value, loans guaranteed by U.S. government sponsored agencies and loans subject to LTSCs.
57
Second Lien Mortgages: March 31, 2010
|
VINTAGES
($ in billions) |
Second Lien
Mortgages |
Vintage
% Total |
90+DPD % | *FICO < 620 | *LTV > 100% | |||||||||||
|---|---|---|---|---|---|---|---|---|---|---|---|---|---|---|---|---|
|
2010 |
$ | 0.1 | 0.1 | % | N.M. | $ | 0.0 | $ | 0.0 | |||||||
|
2009 |
$ | 0.6 | 1.3 | % | 0.2 | % | $ | 0.0 | $ | 0.0 | ||||||
|
2008 |
$ | 4.2 | 8.8 | % | 1.2 | % | $ | 0.6 | $ | 0.9 | ||||||
|
2007 |
$ | 14.0 | 29.5 | % | 3.4 | % | $ | 2.9 | $ | 7.8 | ||||||
|
2006 |
$ | 15.4 | 32.4 | % | 3.4 | % | $ | 3.1 | $ | 9.3 | ||||||
|
2005 |
$ | 9.1 | 19.3 | % | 2.6 | % | $ | 1.4 | $ | 4.2 | ||||||
|
£ 2004 |
$ | 4.1 | 8.7 | % | 1.8 | % | $ | 0.7 | $ | 0.6 | ||||||
- *
- Refreshed FICO and LTV.
Note: Excludes Canada and Puerto Rico, loans recorded at fair value and loans subject to LTSCs.
North America Cards
Overview
Citi's North America cards portfolio consists of our Citi-branded and retail partner cards portfolios located in Citicorp— Regional Consumer Banking and Citi Holdings— Local Consumer Lending , respectively. As of March 31, 2010, the Citi-branded portfolio totaled approximately $78 billion while the retail partner cards portfolio was approximately $55 billion.
The following charts detail the quarterly trends in delinquencies and net credit losses for Citigroup's North America Citi-branded and retail partner cards portfolios.
During the first quarter of 2010, Citi continued to see stable to improving trends across both portfolios. In Citi-branded cards, higher delinquencies in the fourth quarter of 2009 created an expected increase in net credit losses in the first quarter of 2010. However, dollar delinquencies declined in the first quarter of 2010. On a percentage basis, delinquencies were up in Citi-branded cards due to declining loan balances. In retail partner cards, net credit losses declined for the third consecutive quarter, driven by loss mitigation efforts and declining loan balances. Delinquencies also improved in the first quarter.
In each of the two portfolios, Citi continues to actively eliminate riskier accounts to mitigate losses. First, higher risk customers have been removed from the portfolio by either reducing available lines of credit or closing accounts. On a net basis, end of period open accounts are down 15% in Citi-branded cards and down 12% in retail partner cards versus prior year levels. In addition, Citi has improved the tools used to identify and manage exposure in each of the portfolios by targeting unique customer attributes.
In Citi's experience to date, these portfolios have significantly different characteristics:
- •
-
Citi-branded cards tend to have a longer estimated account life, with higher credit lines and balances
reflecting the greater utility of a multi-purpose credit card.
- •
- Retail partner cards tend to have a shorter account life, with smaller credit lines and balances. The account portfolio, by nature, turns faster and the loan balances reflect more recent vintages.
As a result, loss mitigation efforts, such as stricter underwriting standards for new accounts, decreasing higher risk credit lines, closing high risk accounts and re-pricing, tend to affect the retail partner cards portfolio faster than the branded portfolio.
In addition to tightening credit standards, Citi also continues to pursue other loss mitigation efforts, including improvements in collections effectiveness and various modification programs, described below. Citi believes modification programs can help to improve the longer-term quality of these accounts.
Specifically, Citigroup offers both short-term and long-term modification programs to its credit card customers, primarily in the U.S. The short-term U.S. programs provide interest rate reductions for up to 12 months, while the long-term programs provide interest rate reductions for up to five years. In both types of U.S. programs, the annual percentage rate (APR) is typically reduced to below 10%.
Citigroup monitors the performance of these U.S. credit card short-term and long-term modification programs by tracking cumulative loss rates by vintages (when customers enter a program) and comparing that performance with that of similar accounts whose terms were not modified. For example, for U.S. credit cards, in Citi's experience to date, at 24 months after modifying an account, Citi typically reduces credit losses by approximately one-third compared to similar accounts that were not modified. Citi has observed that this improved performance of modified loans relative to those not modified is generally greatest during the first 12 months after modification. Following that period, losses have tended to increase but have typically stabilized at levels which are still below those for similar loans that were not modified, resulting in an improved cumulative loss performance. To date, Citi has tended to see that this benefit is sustained over time across our U.S. credit card portfolios.
Overall, however, Citi remains cautious and currently believes that net credit losses in each of the cards portfolios will continue to remain at elevated levels and will continue to be highly dependent on the external environment and industry changes, including continued implementation of the CARD Act.
58
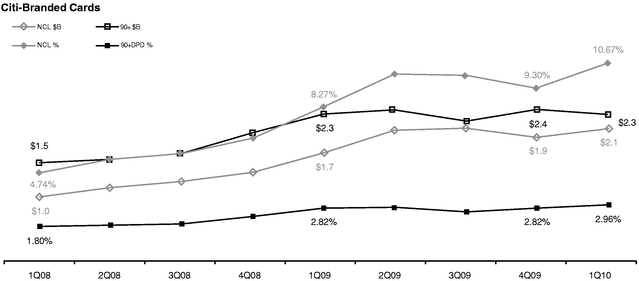
Note: Includes Puerto Rico.
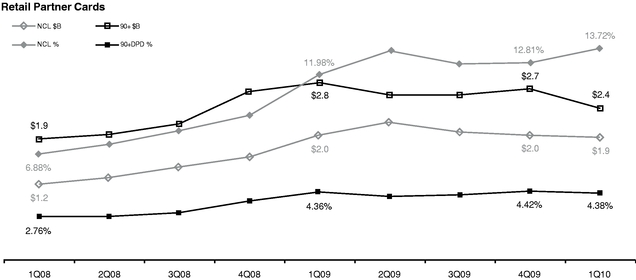
Note: Includes Canada and Puerto Rico. Includes Installment Lending.
59
North America Cards—FICO Information
As set forth in the table below, approximately 72% of the Citi-branded portfolio had FICO credit scores of at least 660 on a refreshed basis as of March 31, 2010, while 62% of the retail partner cards portfolio had scores above 660.
Balances: March 31, 2010
|
Refreshed
|
Citi Branded | Retail Partners | |||||
|---|---|---|---|---|---|---|---|
|
FICO ³ 660 |
72 | % | 62 | % | |||
|
620 £ FICO < 660 |
11 | % | 13 | % | |||
|
FICO < 620 |
17 | % | 25 | % | |||
Note: Based on balances of $123 billion. Balances include interest and fees. Excludes Canada, Puerto Rico and Installment and Classified portfolios. Excludes balances where FICO was unavailable ($2.4 billion for Citi-branded, $2.1 billion for retail partner cards).
The table below provides delinquency statistics for loans 90+DPD for both the Citi-branded and retail partner cards portfolios as of March 31, 2010. Given the economic environment, customers have migrated down from higher FICO score ranges, driven by their delinquencies with Citi and/or with other creditors. As these customers roll through the delinquency buckets, they materially damage their credit score and may ultimately go to charge-off. Loans 90+DPD are more likely to be associated with low refreshed FICO scores both because low scores are indicative of repayment risk and because their delinquency has been reported by Citigroup to the credit bureaus. Loans with FICO scores less than 620, which constitute 17% of the Citi-branded portfolio, have a 90+DPD rate of 16.7%; in the retail partner cards portfolio, loans with FICO scores less than 620 constitute 25% of the portfolio and have a 90+DPD rate of 17.4%.
90+DPD Delinquency Rate: March 31, 2010
|
Refreshed
|
Citi Branded
90+DPD% |
Retail Partners
90+DPD% |
|||||
|---|---|---|---|---|---|---|---|
|
FICO ³ 660 |
0.1 | % | 0.2 | % | |||
|
620 £ FICO < 660 |
0.6 | % | 0.7 | % | |||
|
FICO < 620 |
16.7 | % | 17.4 | % | |||
Note: Based on balances of $123 billion. Balances include interest and fees. Excludes Canada, Puerto Rico and Installment and Classified portfolios.
U.S. Installment and Other Revolving Loans
In the table below, the U.S. installment portfolio consists of consumer loans in the following businesses: Consumer Finance, Retail Banking, Auto, Student Lending and Cards. Other Revolving consists of consumer loans (Ready Credit and Checking Plus products) in the Consumer Retail Banking business. Commercial-related loans are not included.
As of March 31, 2010, the U.S. Installment portfolio totaled approximately $69 billion, while the U.S. Other Revolving portfolio was approximately $0.9 billion. While substantially all of the U.S. Installment portfolio is managed under LCL within Citi Holdings, it does include $0.4 billion of Consumer Retail Banking loans which are reported in Citicorp. The U.S. Other Revolving portfolio is managed under Citicorp. The U.S. Installment portfolio includes approximately $33 billion of Student Loans originated under the Federal Family Education Loan Program (FFELP) where losses are substantially mitigated by federal guarantees if the loans are properly serviced. In addition, there are approximately $6 billion of non-FFELP Student Loans where losses are mitigated by private insurance. These insurance providers insure the Company against a significant portion of losses arising from borrower loan default, bankruptcy or death.
Approximately 39% of the Installment portfolio had FICO credit scores less than 620 on a refreshed basis. Approximately 29% of the Other Revolving portfolio is composed of loans having FICO less than 620.
Balances: March 31, 2010
|
Refreshed
|
Installment | Other Revolving | |||||
|---|---|---|---|---|---|---|---|
|
FICO ³ 660 |
47 | % | 56 | % | |||
|
620 £ FICO < 660 |
14 | % | 15 | % | |||
|
FICO < 620 |
39 | % | 29 | % | |||
Note: Based on balances of $67 billion for Installment and $0.8 billion for Other Revolving. Excludes Canada and Puerto Rico. Excludes balances where FICO was unavailable ($1.8 billion for Installment, $0.1 billion for Other Revolving).
The table below provides delinquency statistics for loans 90+DPD for both the Installment and Other Revolving portfolios. Loans 90+DPD are more likely to be associated with low refreshed FICO scores both because low scores are indicative of repayment risk and because their delinquency has been reported by Citigroup to the credit bureaus. On a refreshed basis, loans with FICO scores of less than 620 exhibit significantly higher delinquencies than in any other FICO band and will drive the majority of the losses.
90+DPD Delinquency Rate: March 31, 2010
|
Refreshed
|
Installment
90+DPD% |
Other Revolving
90+DPD% |
|||||
|---|---|---|---|---|---|---|---|
|
FICO ³ 660 |
0.2 | % | 0.0 | % | |||
|
620 £ FICO < 660 |
1.1 | % | 0.8 | % | |||
|
FICO < 620 |
7.2 | % | 8.1 | % | |||
Note: Based on balances of $67 billion for Installment and $0.8 billion for Other Revolving. Excludes Canada and Puerto Rico.
60
Interest Rate Risk Associated with Consumer Mortgage Lending Activity
Citigroup originates and funds mortgage loans. As with all other lending activity, this exposes Citigroup to several risks, including credit, liquidity and interest rate risks. To manage credit and liquidity risk, Citigroup sells most of the mortgage loans it originates, but retains the servicing rights. These sale transactions create an intangible asset referred to as mortgage servicing rights (MSRs). The fair value of this asset is primarily affected by changes in prepayments that result from shifts in mortgage interest rates. Thus, by retaining the servicing rights of sold mortgage loans, Citigroup is still exposed to interest rate risk.
In managing this risk, Citigroup hedges a significant portion of the value of its MSRs through the use of interest rate derivative contracts, forward purchase commitments of mortgage-backed securities, and purchased securities classified as trading (primarily mortgage-backed securities including principal-only strips).
Since the change in the value of these hedging instruments does not perfectly match the change in the value of the MSRs, Citigroup is still exposed to what is commonly referred to as "basis risk." Citigroup manages this risk by reviewing the mix of the various hedging instruments referred to above on a daily basis.
Citigroup's MSRs totaled $6.439 billion and $6.530 billion at March 31, 2010 and December 31, 2009, respectively. For additional information on Citi's MSRs, see Notes 11 and 14 to the Consolidated Financial Statements.
As part of the mortgage lending activity, Citigroup commonly enters into purchase commitments to fund residential mortgage loans at specific interest rates within a given period of time, generally up to 60 days after the rate has been set. If the resulting loans from these commitments will be classified as loans held-for-sale, Citigroup accounts for the commitments as derivatives. Accordingly, the initial and subsequent changes in the fair value of these commitments, which are driven by changes in mortgage interest rates, are recognized in current earnings after taking into consideration the likelihood that the commitment will be funded.
Citigroup hedges its exposure to the change in the value of these commitments by utilizing hedging instruments similar to those referred to above.
61
The following table presents credit data for Citigroup's corporate loans and unfunded lending commitments at March 31, 2010. The ratings scale is based on Citi's internal risk ratings, which generally correspond to the ratings as defined by S&P and Moody's.
|
|
At March 31, 2010 | ||||||||||||||
|---|---|---|---|---|---|---|---|---|---|---|---|---|---|---|---|
|
Corporate loans(1)
in millions of dollars |
Recorded investment
in loans(2) |
% of total(3) |
Unfunded
lending commitments |
% of total(3) | |||||||||||
|
Investment grade(4) |
$ | 116,320 | 66 | % | $ | 238,157 | 87 | % | |||||||
|
Non-investment grade(4) |
|||||||||||||||
|
Noncriticized |
21,102 | 12 | 16,220 | 6 | |||||||||||
|
Criticized performing(5) |
24,974 | 14 | 16,934 | 6 | |||||||||||
|
Commercial real estate (CRE) |
5,906 | 3 | 2,335 | 1 | |||||||||||
|
Commercial and Industrial and Other |
19,068 | 11 | 14,599 | 5 | |||||||||||
|
Non-accrual (criticized)(5) |
12,932 | 7 | 3,342 | 1 | |||||||||||
|
CRE |
3,406 | 2 | 1,229 | — | |||||||||||
|
Commercial and Industrial and Other |
9,526 | 5 | 2,113 | 1 | |||||||||||
|
Total non-investment grade |
$ | 59,008 | 34 | % | $ | 36,496 | 13 | % | |||||||
|
Private Banking loans managed on a delinquency basis(4) |
13,986 | 2,279 | |||||||||||||
|
Loans at fair value |
2,457 | — | |||||||||||||
|
Total corporate loans |
$ | 191,771 | $ | 276,932 | |||||||||||
|
Unearned income |
(1,436 | ) | — | ||||||||||||
|
Corporate loans, net of unearned income |
$ | 190,335 | $ | 276,932 | |||||||||||
- (1)
-
Includes
$1.1 billion of TDRs for which concessions, such as the reduction of interest rates or the deferral of interest or principal payments, have
been granted as a result of deterioration in the borrowers' financial condition. Each of the borrowers is current under the restructured terms.
- (2)
-
Recorded
investment in a loan includes accrued interest, net deferred loan fees and costs, unamortized premium or discount, less any direct write-downs.
- (3)
-
Percentages
disclosed above exclude Private Banking loans managed on a delinquency basis and loans at fair value.
- (4)
-
Held-for-investment
loans accounted for on an amortized cost basis.
- (5)
- Criticized exposures correspond to the "Special Mention," "Substandard" and "Doubtful" asset categories defined by banking regulatory authorities.
62
The following tables represent the corporate credit portfolio (excluding Private Banking), before consideration of collateral, by maturity at March 31, 2010. The corporate portfolio is broken out by direct outstandings that include drawn loans, overdrafts, interbank placements, bankers' acceptances, certain investment securities and leases and unfunded commitments that include unused commitments to lend, letters of credit and financial guarantees.
|
|
At March 31, 2010 | ||||||||||||
|---|---|---|---|---|---|---|---|---|---|---|---|---|---|
| In billions of dollars |
Due
within 1 year |
Greater than 1 year
but within 5 years |
Greater
than 5 years |
Total
exposure |
|||||||||
|
Direct outstandings |
$ | 199 | $ | 60 | $ | 7 | $ | 266 | |||||
|
Unfunded lending commitments |
157 | 111 | 10 | 278 | |||||||||
|
Total |
$ | 356 | $ | 171 | $ | 17 | $ | 544 | |||||
|
|
At December 31, 2009 | ||||||||||||
|---|---|---|---|---|---|---|---|---|---|---|---|---|---|
| In billions of dollars |
Due
within 1 year |
Greater
than 1 year but within 5 years |
Greater
than 5 years |
Total
exposure |
|||||||||
|
Direct outstandings |
$ | 213 | $ | 66 | $ | 7 | $ | 286 | |||||
|
Unfunded lending commitments |
182 | 120 | 10 | 312 | |||||||||
|
Total |
$ | 395 | $ | 186 | $ | 17 | $ | 598 | |||||
Portfolio Mix
The corporate credit portfolio is diverse across counterparty and industry, and geography. The following table shows direct outstandings and unfunded commitments by region:
|
|
March 31,
2010 |
December 31,
2009 |
|||||
|---|---|---|---|---|---|---|---|
|
North America |
46 | % | 51 | % | |||
|
EMEA |
29 | 27 | |||||
|
Latin America |
15 | 9 | |||||
|
Asia |
10 | 13 | |||||
|
Total |
100 | % | 100 | % | |||
The maintenance of accurate and consistent risk ratings across the corporate credit portfolio facilitates the comparison of credit exposure across all lines of business, geographic regions and products.
Obligor risk ratings reflect an estimated probability of default for an obligor and are derived primarily through the use of statistical models (which are validated periodically), external rating agencies (under defined circumstances) or approved scoring methodologies. Facility risk ratings are assigned, using the obligor risk rating, and then factors that affect the loss-given default of the facility, such as support or collateral, are taken into account. With regard to climate change risk, factors evaluated include consideration of the business impact, impact of regulatory requirements, or lack thereof, and impact of physical effects on obligors and their assets.
These factors may adversely affect the ability of some obligors to perform and thus increase the risk of lending activities to these obligors. Citigroup also has incorporated climate risk assessment criteria for certain obligors, as necessary.
Internal obligor ratings equivalent to BBB and above are considered investment grade. Ratings below the equivalent of the BBB category are considered non-investment grade.
The following table presents the corporate credit portfolio by facility risk rating at March 31, 2010 and December 31, 2009, as a percentage of the total portfolio:
|
|
Direct outstandings and
unfunded commitments |
||||||
|---|---|---|---|---|---|---|---|
|
|
March 31,
2010 |
December 31,
2009 |
|||||
|
AAA/AA/A |
54 | % | 58 | % | |||
|
BBB |
27 | 24 | |||||
|
BB/B |
12 | 11 | |||||
|
CCC or below |
7 | 7 | |||||
|
Unrated |
— | — | |||||
|
Total |
100 | % | 100 | % | |||
The corporate credit portfolio is diversified by industry, with a concentration only in the financial sector, including banks, other financial institutions, insurance companies, investment banks and government and central banks. The following table shows the allocation of direct outstandings and unfunded commitments to industries as a percentage of the total corporate portfolio:
|
|
Direct outstandings and
unfunded commitments |
||||||
|---|---|---|---|---|---|---|---|
|
|
March 31,
2010 |
December 31,
2009 |
|||||
|
Government and central banks |
13 | % | 12 | % | |||
|
Banks |
11 | 9 | |||||
|
Investment banks |
6 | 5 | |||||
|
Other financial institutions |
5 | 12 | |||||
|
Utilities |
4 | 4 | |||||
|
Insurance |
4 | 4 | |||||
|
Petroleum |
4 | 4 | |||||
|
Agriculture and food preparation |
4 | 4 | |||||
|
Telephone and cable |
3 | 3 | |||||
|
Industrial machinery and equipment |
2 | 2 | |||||
|
Global information technology |
2 | 2 | |||||
|
Chemicals |
2 | 2 | |||||
|
Real estate |
3 | 3 | |||||
|
Other industries(1) |
37 | 34 | |||||
|
Total |
100 | % | 100 | % | |||
- (1)
- Includes all other industries, none of which exceeds 2% of total outstandings.
63
Credit Risk Mitigation
As part of its overall risk management activities, Citigroup uses credit derivatives and other risk mitigants to hedge portions of the credit risk in its portfolio, in addition to outright asset sales. The purpose of these transactions is to transfer credit risk to third parties. The results of the mark-to-market and any realized gains or losses on credit derivatives are reflected in the Principal transactions line on the Consolidated Statement of Income.
At March 31, 2010 and December 31, 2009, $53.1 billion and $59.6 billion, respectively, of credit risk exposure were economically hedged. Citigroup's expected loss model used in the calculation of its loan loss reserve does not include the favorable impact of credit derivatives and other risk mitigants. In addition, the reported amounts of direct outstandings and unfunded commitments in this report do not reflect the impact of these hedging transactions. At March 31, 2010 and December 31, 2009, the credit protection was economically hedging underlying credit exposure with the following risk rating distribution, respectively:
Rating of Hedged Exposure
|
|
March 31,
2010 |
December 31,
2009 |
|||||
|---|---|---|---|---|---|---|---|
|
AAA/AA/A |
45 | % | 45 | % | |||
|
BBB |
37 | 37 | |||||
|
BB/B |
12 | 11 | |||||
|
CCC or below |
6 | 7 | |||||
|
Total |
100 | % | 100 | % | |||
At March 31, 2010 and December 31, 2009, the credit protection was economically hedging underlying credit exposure with the following industry distribution, respectively:
Industry of Hedged Exposure
|
|
March 31,
2010 |
December 31,
2009 |
|||||
|---|---|---|---|---|---|---|---|
|
Utilities |
8 | % | 9 | % | |||
|
Telephone and cable |
8 | 9 | |||||
|
Agriculture and food preparation |
8 | 8 | |||||
|
Chemicals |
7 | 8 | |||||
|
Petroleum |
6 | 6 | |||||
|
Industrial machinery and equipment |
6 | 6 | |||||
|
Autos |
6 | 6 | |||||
|
Retail |
5 | 4 | |||||
|
Insurance |
4 | 4 | |||||
|
Other financial institutions |
4 | 4 | |||||
|
Pharmaceuticals |
4 | 5 | |||||
|
Natural gas distribution |
4 | 3 | |||||
|
Metals |
4 | 4 | |||||
|
Global information technology |
3 | 3 | |||||
|
Other industries(1) |
23 | 21 | |||||
|
Total |
100 | % | 100 | % | |||
- (1)
- Includes all other industries, none of which is greater than 2% of the total hedged amount.
64
Market risk encompasses liquidity risk and price risk, both of which arise in the normal course of business of a global financial intermediary. Liquidity risk is the risk that an entity may be unable to meet a financial commitment to a customer, creditor, or investor when due. Liquidity risk is discussed in "Capital Resources and Liquidity" above. Price risk is the earnings risk from changes in interest rates, foreign exchange rates, equity and commodity prices, and in their implied volatilities. Price risk arises in non-trading portfolios, as well as in trading portfolios.
Interest Rate Exposure (IRE) for Non-Trading Portfolios
The exposures in the following table represent the approximate annualized risk to net interest revenue (NIR) assuming an unanticipated parallel instantaneous 100 basis points change, as well as a more gradual 100 basis points (25 basis points per quarter) parallel change in rates compared with the market forward interest rates in selected currencies.
|
|
March 31, 2010 | December 31, 2009 | March 31, 2009 | ||||||||||||||||
|---|---|---|---|---|---|---|---|---|---|---|---|---|---|---|---|---|---|---|---|
| In millions of dollars | Increase | Decrease | Increase | Decrease | Increase | Decrease | |||||||||||||
|
U.S. dollar |
|||||||||||||||||||
|
Instantaneous change |
$ | (488 | ) | NM | $ | (859 | ) | NM | $ | (843 | ) | NM | |||||||
|
Gradual change |
$ | (110 | ) | NM | $ | (460 | ) | NM | $ | (497 | ) | NM | |||||||
|
Mexican peso |
|||||||||||||||||||
|
Instantaneous change |
$ | 42 | (42 | ) | $ | 50 | $ | (50 | ) | $ | (20 | ) | $ | 20 | |||||
|
Gradual change |
$ | 21 | (21 | ) | $ | 26 | $ | (26 | ) | $ | (14 | ) | $ | 14 | |||||
|
Euro |
|||||||||||||||||||
|
Instantaneous change |
$ | (56 | ) | NM | $ | 85 | NM | $ | 37 | $ | (37 | ) | |||||||
|
Gradual change |
$ | (50 | ) | NM | $ | 47 | NM | $ | 23 | $ | (23 | ) | |||||||
|
Japanese yen |
|||||||||||||||||||
|
Instantaneous change |
$ | 148 | NM | $ | 200 | NM | $ | 194 | NM | ||||||||||
|
Gradual change |
$ | 97 | NM | $ | 116 | NM | $ | 116 | NM | ||||||||||
|
Pound sterling |
|||||||||||||||||||
|
Instantaneous change |
$ | (3 | ) | NM | $ | (11 | ) | NM | $ | 15 | $ | (15 | ) | ||||||
|
Gradual change |
$ | (5 | ) | NM | $ | (6 | ) | NM | $ | 7 | $ | (7 | ) | ||||||
NM Not meaningful. A 100 basis point decrease in interest rates would imply negative rates for the yield curve.
Certain trading-oriented businesses within Citi have accrual-accounted positions. The U.S. dollar IRE associated with these businesses is ($92) million for a 100 basis points instantaneous increase in interest rates. The changes in the U.S. dollar IRE from the previous period reflect changes in the customer-related asset and liability mix, the expected impact of market rates on customer behavior and Citigroup's view of prevailing interest rates.
The following table shows the risk to NIR from six different changes in the implied-forward rates. Each scenario assumes that the rate change will occur on a gradual basis every three months over the course of one year.
|
|
Scenario 1 | Scenario 2 | Scenario 3 | Scenario 4 | Scenario 5 | Scenario 6 | |||||||||||||
|---|---|---|---|---|---|---|---|---|---|---|---|---|---|---|---|---|---|---|---|
|
Overnight rate change (bps) |
— | 100 | 200 | (200 | ) | (100 | ) | — | |||||||||||
|
10-year rate change (bps) |
(100 | ) | — | 100 | (100 | ) | — | 100 | |||||||||||
|
Impact to net interest revenue
|
$ |
67 |
$ |
(278 |
) |
$ |
(703 |
) |
NM |
NM |
$ |
48 |
|||||||
NM Not meaningful. A 100 basis point or more decrease in the overnight rate would imply negative rates for the yield curve.
65
Value at Risk for Trading Portfolios
For Citigroup's major trading centers, the aggregate pretax value at risk (VAR) in the trading portfolios was $172 million, $205 million, $273 million and $292 million at March 31, 2010, December 31, 2009, September 30, 2009, and March 31, 2009, respectively. Daily Citigroup trading VAR averaged $200 million and ranged from $145 million to $289 million during the first quarter of 2010. The following table summarizes VAR for Citigroup trading portfolios at March 31, 2010, December 31, 2009, September 30, 2009, and March 31, 2009, including the total VAR, the specific risk only component of VAR, and the general market factors only VAR, along with the quarterly averages. Citigroup moved guidelines under SFAS 133 to SFAS 157/159 for mark-to-market trading on February 1, 2010.
| In million of dollars |
March 31,
2010 |
First
Quarter 2010 Average |
December 31,
2009 |
Fourth
Quarter 2009 Average |
March 31,
2009 |
First
Quarter 2009 Average |
|||||||||||||
|---|---|---|---|---|---|---|---|---|---|---|---|---|---|---|---|---|---|---|---|
|
Interest rate |
$ | 201 | $ | 193 | $ | 192 | $ | 216 | $ | 239 | $ | 272 | |||||||
|
Foreign exchange |
53 | 51 | 45 | 37 | 38 | 73 | |||||||||||||
|
Equity |
49 | 73 | 69 | 62 | 144 | 97 | |||||||||||||
|
Commodity |
17 | 18 | 18 | 38 | 33 | 22 | |||||||||||||
|
Diversification benefit |
(148 | ) | (135 | ) | (119 | ) | (121 | ) | (162 | ) | (173 | ) | |||||||
|
Total—All market risk factors, including general and specific risk |
$ | 172 | $ | 200 | $ | 205 | $ | 232 | $ | 292 | $ | 291 | |||||||
|
Specific risk only component |
$ | 15 | $ | 20 | $ | 20 | $ | 22 | $ | 14 | $ | 19 | |||||||
|
Total—General market factors only |
$ | 157 | $ | 180 | $ | 185 | $ | 210 | $ | 278 | $ | 272 | |||||||
The specific risk only component represents the level of equity and debt issuer-specific risk embedded in VAR.
The table below provides the range of market factor VARs, inclusive of specific risk, across the quarters ended:
|
|
March 31,
2010 |
December 31,
2009 |
March 31,
2009 |
||||||||||||||||
|---|---|---|---|---|---|---|---|---|---|---|---|---|---|---|---|---|---|---|---|
| In millions of dollars | Low | High | Low | High | Low | High | |||||||||||||
|
Interest rate |
$ | 171 | $ | 228 | $ | 185 | $ | 241 | $ | 209 | $ | 320 | |||||||
|
Foreign exchange |
37 | 78 | 18 | 98 | 29 | 140 | |||||||||||||
|
Equity |
47 | 111 | 46 | 91 | 47 | 167 | |||||||||||||
|
Commodity |
15 | 20 | 18 | 47 | 12 | 34 | |||||||||||||
The following table provides the VAR for S&B for the first quarter of 2010 and fourth quarter of 2009:
| In millions of dollars |
March 31,
2010 |
December 31,
2009 |
|||||
|---|---|---|---|---|---|---|---|
|
Total—All market risk factors, including general and specific risk |
$ | 104 | $ | 149 | |||
|
Average—during quarter |
144 | 174 | |||||
|
High—during quarter |
235 | 206 | |||||
|
Low—during quarter |
99 | 144 | |||||
66
Average Rates—Interest Revenue, Interest Expense, and Net Interest Margin
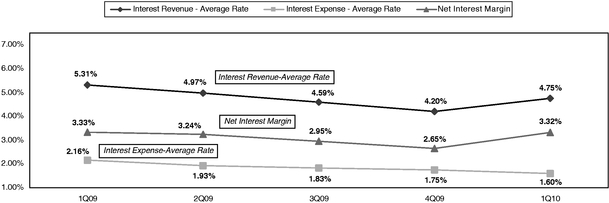
| In millions of dollars |
1st Qtr.
2010 |
4th Qtr.
2009 |
1st Qtr.
2009 |
Change
1Q10 vs. 1Q09 |
|||||||||
|---|---|---|---|---|---|---|---|---|---|---|---|---|---|
|
Interest revenue(1) |
$ | 20,852 | $ | 17,703 | $ | 20,583 | 1 | % | |||||
|
Interest expense(2) |
6,291 | 6,542 | 7,657 | (18 | )% | ||||||||
|
Net interest revenue(1)(2) |
$ | 14,561 | $ | 11,161 | $ | 12,926 | 13 | % | |||||
|
Interest revenue—average rate |
4.75 | % | 4.20 | % | 5.31 | % | (56 | ) bps | |||||
|
Interest expense—average rate |
1.60 | % | 1.75 | % | 2.16 | % | (56 | ) bps | |||||
|
Net interest margin |
3.32 | % | 2.65 | % | 3.33 | % | (1 | ) bps | |||||
|
Interest-rate benchmarks: |
|||||||||||||
|
Federal Funds rate—end of period |
0.00-0.25 | % | 0.00-0.25 | % | 0.00-0.25 | % | — | ||||||
|
Federal Funds rate—average rate |
0.00-0.25 | % | 0.00-0.25 | % | 0.00-0.25 | % | — | ||||||
|
Two-year U.S. Treasury note—average rate |
0.92 | % | 0.88 | % | 0.90 | % | 2 | bps | |||||
|
10-year U.S. Treasury note—average rate |
3.72 | % | 3.46 | % | 2.74 | % | 98 | bps | |||||
|
10-year vs. two-year spread |
280 | bps | 258 | bps | 184 | bps | |||||||
- (1)
-
Excludes
taxable equivalent adjustments (based on the U.S. federal statutory tax rate of 35%) of $135 million, $186 million and
$97 million for the first quarter of 2010, the fourth quarter of 2009 and the first quarter of 2009, respectively.
- (2)
- Excludes expenses associated with hybrid financial instruments and beneficial interest in consolidated VIEs. These obligations are classified as Long-term debt and accounted for at fair value with changes recorded in Principal transactions .
A significant portion of Citi's business activities are based upon gathering deposits and borrowing money and then lending or investing those funds, including market-making activities in tradable securities. Net interest margin (NIM) is calculated by dividing annualized gross interest revenue less gross interest expense by average interest earning assets (which includes non-accrual loans).
NIM increased by 67 basis points during the first quarter of 2010, primarily driven by the adoption of SFAS 166/167. Additionally, the absence of interest on the trust preferred securities repaid in the fourth quarter of 2009 and the deployment of cash into higher-yielding investments favorably impacted NIM during the first quarter.
67
AVERAGE BALANCES AND INTEREST RATES—ASSETS(1)(2)(3)(4)
|
|
Average Volume | Interest Revenue | % Average Rate | ||||||||||||||||||||||||||
|---|---|---|---|---|---|---|---|---|---|---|---|---|---|---|---|---|---|---|---|---|---|---|---|---|---|---|---|---|---|
| In millions of dollars |
1st Qtr.
2010 |
4th Qtr.
2009 |
1st Qtr.
2009 |
1st Qtr.
2010 |
4th Qtr.
2009 |
1st Qtr.
2009 |
1st Qtr.
2010 |
4th Qtr.
2009 |
1st Qtr.
2009 |
||||||||||||||||||||
|
Assets |
|||||||||||||||||||||||||||||
|
Deposits with banks(5) |
$ | 166,378 | $ | 219,321 | $ | 169,142 | $ | 290 | $ | 352 | $ | 436 | 0.71 | % | 0.64 | % | 1.05 | % | |||||||||||
|
Federal funds sold and securities borrowed or purchased under agreements to resell(6) |
|||||||||||||||||||||||||||||
|
In U.S. offices |
$ | 160,033 | $ | 154,035 | $ | 128,004 | $ | 471 | $ | 434 | $ | 550 | 1.19 | % | 1.12 | % | 1.74 | % | |||||||||||
|
In offices outside the U.S.(5) |
78,052 | 71,031 | 52,431 | 281 | 243 | 335 | 1.46 | 1.36 | 2.59 | ||||||||||||||||||||
|
Total |
$ | 238,085 | $ | 225,066 | $ | 180,435 | $ | 752 | $ | 677 | $ | 885 | 1.28 | % | 1.19 | % | 1.99 | % | |||||||||||
|
Trading account assets(7)(8) |
|||||||||||||||||||||||||||||
|
In U.S. offices |
$ | 131,776 | $ | 140,299 | $ | 147,516 | $ | 1,069 | $ | 1,407 | $ | 1,984 | 3.29 | % | 3.98 | % | 5.45 | % | |||||||||||
|
In offices outside the U.S.(5) |
152,403 | 147,180 | 108,451 | 803 | 790 | 967 | 2.14 | 2.13 | 3.62 | ||||||||||||||||||||
|
Total |
$ | 284,179 | $ | 287,479 | $ | 255,967 | $ | 1,872 | $ | 2,197 | $ | 2,951 | 2.67 | % | 3.03 | % | 4.68 | % | |||||||||||
|
Investments |
|||||||||||||||||||||||||||||
|
In U.S. offices |
|||||||||||||||||||||||||||||
|
Taxable |
$ | 150,858 | $ | 129,925 | $ | 121,901 | $ | 1,389 | $ | 1,486 | $ | 1,480 | 3.73 | % | 4.54 | % | 4.92 | % | |||||||||||
|
Exempt from U.S. income tax(1) |
15,570 | 16,423 | 14,574 | 173 | 273 | 118 | 4.51 | 6.60 | 3.28 | ||||||||||||||||||||
|
In offices outside the U.S.(5) |
144,892 | 128,160 | 106,950 | 1,547 | 1,466 | 1,578 | 4.33 | 4.54 | 5.98 | ||||||||||||||||||||
|
Total |
$ | 311,320 | $ | 274,508 | $ | 243,425 | $ | 3,109 | $ | 3,225 | $ | 3,176 | 4.05 | % | 4.66 | % | 5.29 | % | |||||||||||
|
Loans (net of unearned income)(9) |
|||||||||||||||||||||||||||||
|
Consumer loans |
|||||||||||||||||||||||||||||
|
In U.S. offices |
$ | 391,753 | $ | 291,574 | $ | 322,986 | $ | 9,152 | $ | 5,219 | $ | 6,254 | 9.47 | % | 7.10 | % | 7.85 | % | |||||||||||
|
In offices outside the U.S.(5) |
146,538 | 151,229 | 149,341 | 3,756 | 3,856 | 3,999 | 10.40 | 10.12 | 10.86 | ||||||||||||||||||||
|
Total consumer loans |
$ | 538,291 | $ | 442,803 | $ | 472,327 | $ | 12,908 | $ | 9,075 | $ | 10,253 | 9.73 | % | 8.13 | % | 8.80 | % | |||||||||||
|
Corporate loans |
|||||||||||||||||||||||||||||
|
In U.S. offices |
$ | 87,631 | $ | 64,887 | $ | 80,482 | $ | 359 | $ | 448 | $ | 577 | 1.66 | % | 2.74 | % | 2.91 | % | |||||||||||
|
In offices outside the U.S.(5) |
107,950 | 112,448 | 118,906 | 1,406 | 1,549 | 2,025 | 5.28 | 5.47 | 6.91 | ||||||||||||||||||||
|
Total corporate loans |
$ | 195,581 | $ | 177,335 | $ | 199,388 | $ | 1,765 | $ | 1,997 | $ | 2,602 | 3.66 | % | 4.47 | % | 5.29 | % | |||||||||||
|
Total loans |
$ | 733,872 | $ | 620,138 | $ | 671,715 | $ | 14,673 | $ | 11,072 | $ | 12,855 | 8.11 | % | 7.08 | % | 7.76 | % | |||||||||||
|
Other interest-earning Assets |
$ | 45,894 | $ | 45,912 | $ | 51,631 | $ | 156 | $ | 180 | $ | 280 | 1.38 | % | 1.56 | % | 2.20 | % | |||||||||||
|
Total interest-earning Assets |
$ | 1,779,728 | $ | 1,672,424 | $ | 1,572,315 | $ | 20,852 | $ | 17,703 | $ | 20,583 | 4.75 | % | 4.20 | % | 5.31 | % | |||||||||||
|
Non-interest-earning assets(7) |
233,344 | 224,932 | 315,573 | ||||||||||||||||||||||||||
|
Total Assets from discontinued operations |
— | — | 20,083 | ||||||||||||||||||||||||||
|
Total assets |
$ | 2,013,072 | $ | 1,897,356 | $ | 1,907,971 | |||||||||||||||||||||||
- (1)
-
Interest
revenue excludes the taxable equivalent adjustments (based on the U.S. federal statutory tax rate of 35%) of $135 million,
$186 million and $97 million for the first quarter of 2010, the fourth quarter of 2009 and the first quarter of 2009, respectively.
- (2)
-
Interest
rates and amounts include the effects of risk management activities associated with the respective asset and liability categories.
- (3)
-
Monthly
averages have been used by certain subsidiaries where daily averages are unavailable.
- (4)
-
Detailed
average volume, interest revenue and interest expense exclude discontinued operations.
- (5)
-
Average
rates reflect prevailing local interest rates, including inflationary effects and monetary correction in certain countries.
- (6)
-
Average
volumes of securities borrowed or purchased under agreements to resell are reported net pursuant to FIN 41 and Interest revenue excludes the
impact of FIN 41.
- (7)
-
The
fair value carrying amounts of derivative and foreign exchange contracts are reported in non-interest-earning assets and other
non-interest-bearing liabilities.
- (8)
-
Interest
expense on
Trading account liabilities
of
ICG
is
reported as a reduction of Interest revenue. Interest revenue and Interest expense on cash collateral positions are reported in
Trading account assets
and
Trading account liabilities
, respectively.
- (9)
- Includes cash-basis loans.
68
AVERAGE BALANCES AND INTEREST RATES—LIABILITIES AND EQUITY, AND NET INTEREST REVENUE(1)(2)(3)(4)
|
|
Average Volume | Interest Expense | % Average Rate | ||||||||||||||||||||||||||
|---|---|---|---|---|---|---|---|---|---|---|---|---|---|---|---|---|---|---|---|---|---|---|---|---|---|---|---|---|---|
| In millions of dollars |
1st Qtr.
2010 |
4th Qtr.
2009 |
1st Qtr.
2009 |
1st Qtr.
2010 |
4th Qtr.
2009 |
1st Qtr.
2009 |
1st Qtr.
2010 |
4th Qtr.
2009 |
1st Qtr.
2009 |
||||||||||||||||||||
|
Liabilities |
|||||||||||||||||||||||||||||
|
Deposits |
|||||||||||||||||||||||||||||
|
In U. S. offices |
|||||||||||||||||||||||||||||
|
Savings deposits(5) |
$ | 178,266 | $ | 184,894 | $ | 164,977 | $ | 458 | $ | 520 | $ | 633 | 1.04 | % | 1.12 | % | 1.56 | % | |||||||||||
|
Other time deposits |
54,391 | 57,284 | 61,283 | 143 | 186 | 416 | 1.07 | 1.29 | 2.75 | ||||||||||||||||||||
|
In offices outside the U.S.(6) |
481,002 | 478,233 | 408,840 | 1,479 | 1,454 | 1,799 | 1.25 | 1.21 | 1.78 | ||||||||||||||||||||
|
Total |
$ | 713,659 | $ | 720,411 | $ | 635,100 | $ | 2,080 | $ | 2,160 | $ | 2,848 | 1.18 | % | 1.19 | % | 1.82 | % | |||||||||||
|
Federal funds purchased and securities loaned or sold under agreements to repurchase(7) |
|||||||||||||||||||||||||||||
|
In U.S. offices |
$ | 120,695 | $ | 115,656 | $ | 152,256 | $ | 179 | $ | 136 | $ | 316 | 0.60 | % | 0.47 | % | 0.84 | % | |||||||||||
|
In offices outside the U.S.(6) |
79,447 | 74,200 | 68,184 | 475 | 490 | 788 | 2.42 | 2.62 | 4.69 | ||||||||||||||||||||
|
Total |
$ | 200,142 | $ | 189,856 | $ | 220,440 | $ | 654 | $ | 626 | $ | 1,104 | 1.33 | % | 1.31 | % | 2.03 | % | |||||||||||
|
Trading account liabilities(8)(9) |
|||||||||||||||||||||||||||||
|
In U.S. offices |
$ | 32,642 | $ | 29,908 | $ | 20,712 | $ | 44 | $ | 51 | $ | 93 | 0.55 | % | 0.68 | % | 1.82 | % | |||||||||||
|
In offices outside the U.S.(6) |
46,905 | 41,790 | 31,101 | 19 | 18 | 15 | 0.16 | 0.17 | 0.20 | ||||||||||||||||||||
|
Total |
$ | 79,547 | $ | 71,698 | $ | 51,813 | $ | 63 | $ | 69 | $ | 108 | 0.32 | % | 0.38 | % | 0.85 | % | |||||||||||
|
Short-term borrowings |
|||||||||||||||||||||||||||||
|
In U.S. offices |
$ | 152,785 | $ | 99,325 | $ | 148,673 | $ | 204 | $ | 215 | $ | 367 | 0.54 | % | 0.86 | % | 1.00 | % | |||||||||||
|
In offices outside the U.S.(6) |
27,659 | 32,016 | 35,214 | 72 | 82 | 96 | 1.06 | 1.02 | 1.11 | ||||||||||||||||||||
|
Total |
$ | 180,444 | $ | 131,341 | $ | 183,887 | $ | 276 | $ | 297 | $ | 463 | 0.62 | % | 0.90 | % | 1.02 | % | |||||||||||
|
Long-term debt(10) |
|||||||||||||||||||||||||||||
|
In U.S. offices |
$ | 397,113 | $ | 340,287 | $ | 309,670 | $ | 3,005 | $ | 3,148 | $ | 2,820 | 3.07 | % | 3.67 | % | 3.69 | % | |||||||||||
|
In offices outside the U.S.(6) |
25,955 | 25,704 | 34,058 | 213 | 242 | 314 | 3.33 | 3.74 | 3.74 | ||||||||||||||||||||
|
Total |
$ | 423,068 | $ | 365,991 | $ | 343,728 | $ | 3,218 | $ | 3,390 | $ | 3,134 | 3.08 | % | 3.67 | % | 3.70 | % | |||||||||||
|
Total interest-bearing liabilities |
$ | 1,596,860 | $ | 1,479,297 | $ | 1,434,968 | $ | 6,291 | $ | 6,542 | $ | 7,657 | 1.60 | % | 1.75 | % | 2.16 | % | |||||||||||
|
Demand deposits in U.S. offices |
16,675 | 38,567 | 15,383 | ||||||||||||||||||||||||||
|
Other non-interest-bearing liabilities(8) |
247,365 | 234,746 | 300,614 | ||||||||||||||||||||||||||
|
Total liabilities from discontinued operations |
— | — | 11,698 | ||||||||||||||||||||||||||
|
Total liabilities |
$ | 1,860,900 | $ | 1,752,610 | $ | 1,762,663 | |||||||||||||||||||||||
|
Citigroup equity(11) |
$ | 149,993 | $ | 142,749 | $ | 143,297 | |||||||||||||||||||||||
|
Non controlling interest |
$ | 2,179 | $ | 1,997 | $ | 2,011 | |||||||||||||||||||||||
|
Total stockholders' equity(11) |
$ | 152,172 | $ | 144,746 | $ | 145,308 | |||||||||||||||||||||||
|
Total liabilities and Citigroup stockholders' equity |
$ | 2,013,072 | $ | 1,897,356 | $ | 1,907,971 | |||||||||||||||||||||||
|
Net interest revenue as a percentage of average interest-earning assets(12) |
|||||||||||||||||||||||||||||
|
In U.S. offices |
$ | 1,080,673 | $ | 985,669 | $ | 970,429 | $ | 8,660 | $ | 5,168 | $ | 6,643 | 3.25 | % | 2.08 | % | 2.78 | % | |||||||||||
|
In offices outside the U.S.(6) |
699,055 | 686,755 | 601,886 | 5,901 | 5,993 | 6,283 | 3.42 | 3.46 | 4.23 | ||||||||||||||||||||
|
Total |
$ | 1,779,728 | $ | 1,672,424 | $ | 1,572,315 | $ | 14,561 | $ | 11,161 | $ | 12,926 | 3.32 | % | 2.65 | % | 3.33 | % | |||||||||||
- (1)
-
Interest
revenue excludes the taxable equivalent adjustments (based on the U.S. federal statutory tax rate of 35%) of $135 million,
$186 million and $97 million for the first quarter of 2010, the fourth quarter of 2009 and the first quarter of 2009, respectively.
- (2)
-
Interest
rates and amounts include the effects of risk management activities associated with the respective asset and liability categories.
- (3)
-
Monthly
averages have been used by certain subsidiaries where daily averages are unavailable.
- (4)
-
Detailed
average volume, interest revenue and interest expense exclude discontinued operations.
- (5)
-
Savings
deposits consist of Insured Money Market Rate accounts, NOW accounts, and other savings deposits. The interest expense includes FDIC deposit
insurance fees and charges of $223 million, $213 million and $299 million for the three months ended March 31, 2010, December 31, 2009 and March 31, 2009,
respectively.
- (6)
-
Average
rates reflect prevailing local interest rates, including inflationary effects and monetary corrections in certain countries.
- (7)
-
Average
volumes of securities loaned or sold under agreements to repurchase are reported net pursuant to FIN 41 and Interest expense excludes the
impact of FIN 41.
- (8)
-
The
fair value carrying amounts of derivative and foreign exchange contracts are reported in non-interest-earning assets and other
non-interest-bearing liabilities.
- (9)
-
Interest
expense on
Trading account liabilities
of
ICG
is
reported as a reduction of Interest revenue. Interest revenue and Interest expense on cash collateral positions are reported in
Trading account assets
and
Trading account liabilities
, respectively.
- (10)
-
Excludes
hybrid financial instruments and beneficial interests in consolidated VIEs that are classified as
Long-term
debt
as these obligations are accounted for at fair value with changes recorded in
Principal transactions
.
- (11)
-
Includes
stockholders' equity from discontinued operations.
- (12)
- Includes allocations for capital and funding costs based on the location of the asset.
69
ANALYSIS OF CHANGES IN INTEREST REVENUE(1)(2)(3)
|
|
1st Qtr. 2010 vs. 4th Qtr. 2009 | 1st Qtr. 2010 vs. 1st Qtr. 2009 | |||||||||||||||||
|---|---|---|---|---|---|---|---|---|---|---|---|---|---|---|---|---|---|---|---|
|
|
Increase (Decrease)
Due to Change in: |
|
Increase (Decrease)
Due to Change in: |
|
|||||||||||||||
| In millions of dollars |
Average
Volume |
Average
Rate |
Net
Change |
Average
Volume |
Average
Rate |
Net
Change |
|||||||||||||
|
Deposits with banks(4) |
$ | (90 | ) | $ | 28 | $ | (62 | ) | $ | (7 | ) | $ | (139 | ) | $ | (146 | ) | ||
|
Federal funds sold and securities borrowed or purchased under agreements to resell |
|||||||||||||||||||
|
In U.S. offices |
$ | 17 | $ | 20 | $ | 37 | $ | 118 | $ | (197 | ) | $ | (79 | ) | |||||
|
In offices outside the U.S.(4) |
25 | 13 | 38 | 126 | (180 | ) | (54 | ) | |||||||||||
|
Total |
$ | 42 | $ | 33 | $ | 75 | $ | 244 | $ | (377 | ) | $ | (133 | ) | |||||
|
Trading account assets(5) |
|||||||||||||||||||
|
In U.S. offices |
$ | (82 | ) | $ | (256 | ) | $ | (338 | ) | $ | (194 | ) | $ | (721 | ) | $ | (915 | ) | |
|
In offices outside the U.S.(4) |
28 | (15 | ) | 13 | 312 | (476 | ) | (164 | ) | ||||||||||
|
Total |
$ | (54 | ) | $ | (271 | ) | $ | (325 | ) | $ | 118 | $ | (1,197 | ) | $ | (1,079 | ) | ||
|
Investments(1) |
|||||||||||||||||||
|
In U.S. offices |
$ | 221 | $ | (418 | ) | $ | (197 | ) | $ | 314 | $ | (350 | ) | $ | (36 | ) | |||
|
In offices outside the U.S.(4) |
183 | (102 | ) | 81 | 473 | (504 | ) | (31 | ) | ||||||||||
|
Total |
$ | 404 | $ | (520 | ) | $ | (116 | ) | $ | 787 | $ | (854 | ) | $ | (67 | ) | |||
|
Loans—consumer |
|||||||||||||||||||
|
In U.S. offices |
$ | 2,083 | $ | 1,850 | $ | 3,933 | $ | 1,471 | $ | 1,427 | $ | 2,898 | |||||||
|
In offices outside the U.S.(4) |
(120 | ) | 20 | (100 | ) | (74 | ) | (169 | ) | (243 | ) | ||||||||
|
Total |
$ | 1,963 | $ | 1,870 | $ | 3,833 | $ | 1,397 | $ | 1,258 | $ | 2,655 | |||||||
|
Loans—corporate |
|||||||||||||||||||
|
In U.S. offices |
$ | 127 | $ | (216 | ) | $ | (89 | ) | $ | 47 | $ | (265 | ) | $ | (218 | ) | |||
|
In offices outside the U.S.(4) |
(61 | ) | (82 | ) | (143 | ) | (174 | ) | (445 | ) | (619 | ) | |||||||
|
Total |
$ | 66 | $ | (298 | ) | $ | (232 | ) | $ | (127 | ) | $ | (710 | ) | $ | (837 | ) | ||
|
Total loans |
$ | 2,029 | $ | 1,572 | $ | 3,601 | $ | 1,270 | $ | 548 | $ | 1,818 | |||||||
|
Other interest-earning assets |
$ | — | $ | (24 | ) | $ | (24 | ) | $ | (28 | ) | $ | (96 | ) | $ | (124 | ) | ||
|
Total interest revenue |
$ | 2,331 | $ | 818 | $ | 3,149 | $ | 2,384 | $ | (2,115 | ) | $ | 269 | ||||||
- (1)
-
The
taxable equivalent adjustment is based on the U.S. federal statutory tax rate of 35%, and is excluded from this presentation.
- (2)
-
Rate/volume
variance is allocated based on the percentage relationship of changes in volume and changes in rate to the total net change.
- (3)
-
Detailed
average volume, interest revenue and interest expense exclude discontinued operations.
- (4)
-
Changes
in average rates reflect changes in prevailing local interest rates, including inflationary effects and monetary corrections in certain countries.
- (5)
- Interest expense on Trading account liabilities of ICG is reported as a reduction of Interest revenue. Interest revenue and Interest expense on cash collateral positions are reported in Trading account assets and Trading account liabilities , respectively.
70
ANALYSIS OF CHANGES IN INTEREST EXPENSE AND NET INTEREST REVENUE(1)(2)(3)
|
|
1st Qtr. 2010 vs. 4th Qtr. 2009 | 1st Qtr. 2010 vs. 1st Qtr. 2009 | |||||||||||||||||
|---|---|---|---|---|---|---|---|---|---|---|---|---|---|---|---|---|---|---|---|
|
|
Increase (Decrease)
Due to Change in: |
|
Increase (Decrease)
Due to Change in: |
|
|||||||||||||||
| In millions of dollars |
Average
Volume |
Average
Rate |
Net
Change |
Average
Volume |
Average
Rate |
Net
Change |
|||||||||||||
|
Deposits |
|||||||||||||||||||
|
In U.S. offices |
$ | (27 | ) | $ | (78 | ) | $ | (105 | ) | $ | 29 | $ | (477 | ) | $ | (448 | ) | ||
|
In offices outside the U.S.(4) |
8 | 17 | 25 | 282 | (602 | ) | (320 | ) | |||||||||||
|
Total |
$ | (19 | ) | $ | (61 | ) | $ | (80 | ) | $ | 311 | $ | (1,079 | ) | $ | (768 | ) | ||
|
Federal funds purchased and securities loaned or sold under agreements to repurchase |
|||||||||||||||||||
|
In U.S. offices |
$ | 6 | $ | 37 | $ | 43 | $ | (58 | ) | $ | (79 | ) | $ | (137 | ) | ||||
|
In offices outside the U.S.(4) |
33 | (48 | ) | (15 | ) | 114 | (427 | ) | (313 | ) | |||||||||
|
Total |
$ | 39 | $ | (11 | ) | $ | 28 | $ | 56 | $ | (506 | ) | $ | (450 | ) | ||||
|
Trading account liabilities(5) |
|||||||||||||||||||
|
In U.S. offices |
$ | 4 | $ | (11 | ) | $ | (7 | ) | $ | 37 | $ | (86 | ) | $ | (49 | ) | |||
|
In offices outside the U.S.(4) |
2 | (1 | ) | 1 | 7 | (3 | ) | 4 | |||||||||||
|
Total |
$ | 6 | $ | (12 | ) | $ | (6 | ) | $ | 44 | $ | (89 | ) | $ | (45 | ) | |||
|
Short-term borrowings |
|||||||||||||||||||
|
In U.S. offices |
$ | 90 | $ | (101 | ) | $ | (11 | ) | $ | 10 | $ | (173 | ) | $ | (163 | ) | |||
|
In offices outside the U.S.(4) |
(12 | ) | 2 | (10 | ) | (20 | ) | (4 | ) | (24 | ) | ||||||||
|
Total |
$ | 78 | $ | (99 | ) | $ | (21 | ) | $ | (10 | ) | $ | (177 | ) | $ | (187 | ) | ||
|
Long-term debt |
|||||||||||||||||||
|
In U.S. offices |
$ | 480 | $ | (623 | ) | $ | (143 | ) | $ | 712 | $ | (527 | ) | $ | 185 | ||||
|
In offices outside the U.S.(4) |
2 | (31 | ) | (29 | ) | (69 | ) | (32 | ) | (101 | ) | ||||||||
|
Total |
$ | 482 | $ | (654 | ) | $ | (172 | ) | $ | 643 | $ | (559 | ) | $ | 84 | ||||
|
Total interest expense |
$ | 586 | $ | (837 | ) | $ | (251 | ) | $ | 1,044 | $ | (2,410 | ) | $ | (1,366 | ) | |||
|
Net interest revenue |
$ | 1,745 | $ | 1,655 | $ | 3,400 | $ | 1,340 | $ | 295 | $ | 1,635 | |||||||
- (1)
-
The
taxable equivalent adjustment is based on the U.S. federal statutory tax rate of 35%, and is excluded from this presentation.
- (2)
-
Rate/volume
variance is allocated based on the percentage relationship of changes in volume and changes in rate to the total net change.
- (3)
-
Detailed
average volume, interest revenue and interest expense exclude discontinued operations.
- (4)
-
Changes
in average rates reflect changes in prevailing local interest rates, including inflationary effects and monetary corrections in certain countries.
- (5)
- Interest expense on Trading account liabilities of ICG is reported as a reduction of Interest revenue. Interest revenue and Interest expense on cash collateral positions are reported in Trading account assets and Trading account liabilities , respectively.
71
The table below shows all countries where total Federal Financial Institutions Examination Council (FFIEC) cross-border outstandings exceed 0.75% of total Citigroup assets:
|
|
Cross-Border Claims on Third Parties | March 31, 2010 | December 31, 2009 | ||||||||||||||||||||||||||||
|---|---|---|---|---|---|---|---|---|---|---|---|---|---|---|---|---|---|---|---|---|---|---|---|---|---|---|---|---|---|---|---|
| In billions of U.S. dollars | Banks | Public | Private | Total |
Trading and
Short-Term Claims |
Investments
in and Funding of Local Franchises |
Total
Cross-Border Outstandings |
Commitments |
Total
Cross-Border Outstandings |
Commitments | |||||||||||||||||||||
|
France |
$ | 13.0 | $ | 13.4 | $ | 13.4 | $ | 39.8 | $ | 30.5 | $ | 0.1 | $ | 39.9 | $ | 60.0 | $ | 32.7 | $ | 68.5 | |||||||||||
|
Germany |
11.4 | 10.4 | 6.2 | 28.0 | 20.7 | 4.7 | 32.7 | 46.9 | 28.5 | 53.1 | |||||||||||||||||||||
|
India |
2.2 | 0.3 | 12.7 | 15.2 | 12.5 | 15.9 | 31.1 | 1.7 | 28.0 | 1.8 | |||||||||||||||||||||
|
Cayman Islands |
0.3 | — | 20.0 | 20.3 | 19.2 | — | 20.3 | 6.1 | 16.7 | 6.1 | |||||||||||||||||||||
|
United Kingdom |
10.5 | 0.9 | 8.7 | 20.1 | 17.8 | — | 20.1 | 111.9 | 16.5 | 140.2 | |||||||||||||||||||||
|
South Korea |
0.9 | 1.2 | 7.1 | 9.2 | 9.0 | 10.9 | 20.1 | 15.5 | 22.1 | 14.4 | |||||||||||||||||||||
|
Netherlands |
6.0 | 4.4 | 7.3 | 17.7 | 11.1 | — | 17.7 | 58.0 | 20.3 | 65.7 | |||||||||||||||||||||
|
Italy |
1.0 | 10.9 | 4.6 | 16.5 | 14.1 | 1.1 | 17.6 | 19.8 | 21.7 | 21.2 | |||||||||||||||||||||
|
Japan |
9.3 | 0.1 | 3.9 | 13.3 | 13.0 | 0.2 | 13.5 | 24.2 | 18.8 | 26.3 | |||||||||||||||||||||
72
See Note 15 to the Consolidated Financial Statements for a discussion and disclosures related to Citigroup's derivative activities. The following discussions relate to the Fair Valuation Adjustments for Derivatives and Credit Derivatives activities.
Fair Valuation Adjustments for Derivatives
The table below summarizes the CVA applied to the fair value of derivative instruments as of March 31, 2010 and December 31, 2009.
|
|
Credit valuation adjustment
Contra-liability (contra-asset) |
||||||
|---|---|---|---|---|---|---|---|
| In millions of dollars | March 31, 2010 | December 31, 2009 | |||||
|
Non-monoline counterparties |
$ | (2,225 | ) | $ | (2,483 | ) | |
|
Citigroup (own) |
1,432 | 1,349 | |||||
|
Net non-monoline CVA |
$ | (793 | ) | $ | (1,134 | ) | |
|
Monoline counterparties |
(5,182 | ) | (5,580 | ) | |||
|
Total CVA—derivative instruments |
$ | (5,975 | ) | $ | (6,714 | ) | |
The table below summarizes pretax gains (losses) related to changes in CVA on derivative instruments for the quarters ended March 31, 2010 and 2009:
|
|
Credit valuation
adjustment gain (loss) |
||||||
|---|---|---|---|---|---|---|---|
| In millions of dollars |
First Quarter
2010 |
First Quarter
2009 |
|||||
|
Non-monoline counterparties |
$ | 258 | $ | 151 | |||
|
Citigroup (own) |
83 | 2,623 | |||||
|
Net non-monoline CVA |
$ | 341 | $ | 2,774 | |||
|
Monoline counterparties |
398 | (1,090 | ) | ||||
|
Total CVA—derivative instruments |
$ | 739 | $ | 1,684 | |||
The CVA amounts shown above relate solely to the derivative portfolio, and do not include:
- •
-
Own-credit adjustments for non-derivative liabilities measured at fair value under the fair value
option. See Note 16 to the Consolidated Financial Statements for further information.
- •
- The effect of counterparty credit risk embedded in non-derivative instruments. Losses on non-derivative instruments, such as bonds and loans, related to counterparty credit risk are not included in the table above.
Credit Derivatives
Citigroup makes markets in and trades a range of credit derivatives, both on behalf of clients as well as for its own account. Through these contracts Citigroup either purchases or writes protection on either a single-name or portfolio basis. Citi uses credit derivatives to help mitigate credit risk in its corporate loan portfolio and other cash positions, to take proprietary trading positions, and to facilitate client transactions.
Credit derivatives generally require that the seller of credit protection make payments to the buyer upon the occurrence of predefined events (settlement triggers). These settlement triggers, which are defined by the form of the derivative and the referenced credit, are generally limited to the market standard of failure to pay on indebtedness and bankruptcy (or comparable events) of the reference credit and, in a more limited range of transactions, debt restructuring.
Credit derivative transactions referring to emerging market reference credits will also typically include additional settlement triggers to cover the acceleration of indebtedness and the risk of repudiation or a payment moratorium. In certain transactions on a portfolio of referenced credits or asset-backed securities, the seller of protection may not be required to make payment until a specified amount of losses has occurred with respect to the portfolio and/or may only be required to pay for losses up to a specified amount.
73
The following tables summarize the key characteristics of Citi's credit derivative portfolio by counterparty and derivative form as of March 31, 2010 and December 31, 2009:
March 31, 2010:
|
|
Fair values | Notionals | |||||||||||
|---|---|---|---|---|---|---|---|---|---|---|---|---|---|
| In millions of dollars | Receivable | Payable | Beneficiary | Guarantor | |||||||||
|
By industry/counterparty |
|||||||||||||
|
Bank |
$ | 49,417 | $ | 47,618 | $ | 854,853 | $ | 801,785 | |||||
|
Broker-dealer |
19,974 | 19,999 | 317,622 | 316,463 | |||||||||
|
Monoline |
6,606 | 90 | 9,861 | 123 | |||||||||
|
Non-financial |
92 | 137 | 1,874 | 530 | |||||||||
|
Insurance and other financial institutions |
11,791 | 9,036 | 129,343 | 79,752 | |||||||||
|
Total by industry/counterparty |
$ | 87,880 | $ | 76,880 | $ | 1,313,553 | $ | 1,198,653 | |||||
|
By instrument |
|||||||||||||
|
Credit default swaps and options |
$ | 87,313 | $ | 75,585 | $ | 1,284,742 | $ | 1,197,837 | |||||
|
Total return swaps and other |
567 | 1,295 | 28,811 | 816 | |||||||||
|
Total by instrument |
$ | 87,880 | $ | 76,880 | $ | 1,313,553 | $ | 1,198,653 | |||||
|
By rating: |
|||||||||||||
|
Investment grade |
$ | 23,108 | $ | 19,646 | $ | 607,357 | $ | 538,020 | |||||
|
Non-investment grade |
43,408 | 32,527 | 353,186 | 319,885 | |||||||||
|
Not rated |
21,364 | 24,707 | 353,010 | 340,748 | |||||||||
|
Total by Rating |
$ | 87,880 | $ | 76,880 | $ | 1,313,553 | $ | 1,198,653 | |||||
|
By maturity: |
|||||||||||||
|
Within 1 year |
$ | 2,172 | $ | 2,272 | $ | 144,180 | $ | 140,408 | |||||
|
From 1 to 5 years |
48,054 | 42,014 | 878,025 | 802,909 | |||||||||
|
After 5 years |
37,654 | 32,594 | 291,348 | 255,336 | |||||||||
|
Total by maturity |
$ | 87,880 | $ | 76,880 | $ | 1,313,553 | $ | 1,198,653 | |||||
December 31, 2009:
|
|
Fair values | Notionals | |||||||||||
|---|---|---|---|---|---|---|---|---|---|---|---|---|---|
| In millions of dollars | Receivable | Payable | Beneficiary | Guarantor | |||||||||
|
By industry/counterparty |
|||||||||||||
|
Bank |
$ | 52,383 | $ | 50,778 | $ | 872,523 | $ | 807,484 | |||||
|
Broker-dealer |
23,241 | 22,932 | 338,829 | 340,949 | |||||||||
|
Monoline |
5,860 | — | 10,018 | 33 | |||||||||
|
Non-financial |
339 | 371 | 1,781 | 623 | |||||||||
|
Insurance and other financial institutions |
10,969 | 8,343 | 109,811 | 64,964 | |||||||||
|
Total by industry/counterparty |
$ | 92,792 | $ | 82,424 | $ | 1,332,962 | $ | 1,214,053 | |||||
|
By instrument |
|||||||||||||
|
Credit default swaps and options |
$ | 91,625 | $ | 81,174 | $ | 1,305,724 | $ | 1,213,208 | |||||
|
Total return swaps and other |
1,167 | 1,250 | 27,238 | 845 | |||||||||
|
Total by instrument |
$ | 92,792 | $ | 82,424 | $ | 1,332,962 | $ | 1,214,053 | |||||
|
By rating: |
|||||||||||||
|
Investment grade |
$ | 26,666 | $ | 22,469 | $ | 656,876 | $ | 576,930 | |||||
|
Non-investment grade |
46,832 | 34,898 | 373,910 | 339,920 | |||||||||
|
Not rated |
19,294 | 25,057 | 302,176 | 297,203 | |||||||||
|
Total by Rating |
$ | 92,792 | $ | 82,424 | $ | 1,332,962 | $ | 1,214,053 | |||||
|
By maturity: |
|||||||||||||
|
Within 1 year |
$ | 2,167 | $ | 2,067 | $ | 173,880 | $ | 165,056 | |||||
|
From 1 to 5 years |
54,079 | 47,350 | 877,573 | 806,143 | |||||||||
|
After 5 years |
36,546 | 33,007 | 281,509 | 242,854 | |||||||||
|
Total by maturity |
$ | 92,792 | $ | 82,424 | $ | 1,332,962 | $ | 1,214,053 | |||||
74
The fair values shown are prior to the application of any netting agreements, cash collateral, and market or credit value adjustments.
Citigroup actively participates in trading a variety of credit derivatives products as both an active two-way market-maker for clients and to manage credit risk. The majority of this activity was transacted with other financial intermediaries, including both banks and broker-dealers. Citigroup generally has a mismatch between the total notional amounts of protection purchased and sold and it may hold the reference assets directly, rather than entering into offsetting credit derivative contracts as and when desired. The open risk exposures from credit derivative contracts are largely matched after certain cash positions in reference assets are considered and after notional amounts are adjusted, either to a duration-based equivalent basis or to reflect the level of subordination in tranched structures.
Citi actively monitors its counterparty credit risk in credit derivative contracts. Approximately 85% of the gross receivables are from counterparties with which Citi maintains collateral agreements as of March 31, 2010 and December 31, 2009. A majority of Citi's top 15 counterparties (by receivable balance owed to the company) are banks, financial institutions or other dealers. Contracts with these counterparties do not include ratings-based termination events. However, counterparty rating downgrades may have an incremental effect by lowering the threshold at which Citigroup may call for additional collateral. A number of the remaining significant counterparties are monolines (which have CVA as shown above).
Deferred Tax Assets
Deferred taxes are recorded for the future consequences of events that have been recognized in the financial statements or tax returns, based upon enacted tax laws and rates. Deferred tax assets (DTAs) are recognized subject to management's judgment that realization is more likely than not.
As of March 31, 2010, Citigroup had recognized a net deferred tax asset of approximately $50.2 billion, an increase of $4.1 billion from $46.1 billion at December 31, 2009. The principal item impacting the deferred tax asset during the first quarter of 2010 was the recognition of a deferred tax asset of $5.0 billion related to the allowance for loan losses recorded upon consolidation of credit card trusts pursuant to the adoption of SFAS 166/167 on January 1, 2010. The major items reducing the deferred tax asset during the quarter were the tax effect of the change in Other Comprehensive Income and the tax effect of equity compensation.
Although realization is not assured, Citi believes that the realization of the recognized net deferred tax asset of $50.2 billion at March 31, 2010 is more likely than not based on expectations as to future taxable income in the jurisdictions in which the DTAs arise, and based on available tax planning strategies as defined in ASC 740, Income Taxes, that could be implemented if necessary to prevent a carryforward from expiring.
Approximately $21 billion of Citigroup's DTA is represented by U.S. federal, foreign, state and local tax return carry-forwards subject to expiration substantially beginning in 2017 and continuing through 2029. Included in Citi's overall net DTA of $50.2 billion are $29 billion of future tax deductions and credits that arose largely due to timing differences between the recognition of income for GAAP and tax purposes and represent net deductions and credits that have not yet been taken on a tax return. The most significant source of these timing differences is the loan loss reserve build, which accounts for approximately $20 billion of the net DTA. In general, Citi would need to recognize approximately $99 billion of taxable income, primarily in U.S. taxable jurisdictions, during the respective carryforward periods to fully realize its U.S. federal, state and local DTAs.
Citi's ability to utilize its DTAs to offset future taxable income may be significantly limited if Citi experiences an "ownership change," as defined in Section 382 of the Internal Revenue Code of 1986, as amended (the "Code"). In general, an ownership change will occur if there is a cumulative change in Citi's ownership by "5% shareholders" (as defined in the Code) that exceeds 50 percentage points over a rolling three-year period. A corporation that experiences an ownership change will generally be subject to an annual limitation on its pre-ownership change deferred tax assets equal to the value of the corporation immediately before the ownership change, multiplied by the long-term tax-exempt rate (subject to certain adjustments); provided that the annual limitation would be increased each year to the extent that there is an unused limitation in a prior year. The limitation arising from an ownership change under Section 382 on Citigroup's ability to utilize its DTAs will depend on the value of Citigroup's stock at the time of the ownership change.
Under IRS Notice 2010-2, Citigroup will not experience an ownership change within the meaning of Section 382 as a
75
result of the sales of its common stock held by the U.S. Treasury.
Approximately $15 billion of the net deferred tax asset is included in Tier 1 and Tier 1 Common regulatory capital.
In addition to the uncertain tax positions disclosed in Footnote 11 of Citigroup's 2009 Annual Report on Form 10-K, it is reasonably possible that an audit in Germany may conclude in the next 12 months. The gross uncertain tax positions at March 31, 2010 for the items expected to be resolved in the audit are approximately $185 million plus gross interest of approximately $9 million. The potential tax benefit, which would be shown in continuing and discontinued operations, could be approximately $34 million and $160 million, respectively.
See Citi's Annual Report on Form 10-K for the fiscal year ended December 31, 2009, and Note 12 to the Consolidated Financial Statements in this Form 10-Q , for a discussion of contractual obligations.
Disclosure
Citigroup's disclosure controls and procedures are designed to ensure that information required to be disclosed under the Securities Exchange Act of 1934 is accumulated and communicated to management, including the Chief Executive Officer (CEO) and Chief Financial Officer (CFO), to allow for timely decisions regarding required disclosure and appropriate SEC filings.
Citi's Disclosure Committee is responsible for ensuring that there is an adequate and effective process for establishing, maintaining and evaluating disclosure controls and procedures for Citi's external disclosures.
Citigroup's management, with the participation of the company's CEO and CFO, has evaluated the effectiveness of Citigroup's disclosure controls and procedures (as defined in Rule 13a-15(e) under the Exchange Act) as of March 31, 2010 and, based on that evaluation, the CEO and CFO have concluded that at that date Citigroup's disclosure controls and procedures were effective.
Financial Reporting
There were no changes in Citigroup's internal control over financial reporting (as defined in Rule 13a-15(f) under the Exchange Act) during the fiscal quarter ended March 31, 2010 that materially affected, or is reasonably likely to materially affect, Citi's internal control over financial reporting.
76
Certain statements in this Form 10-Q, including but not limited to statements included within the Management's Discussion and Analysis of Financial Condition and Results of Operations, are forward-looking statements within the meaning of the Private Securities Litigation Reform Act of 1995. Generally, forward-looking statements are not based on historical facts but instead represent only Citigroup's and management's beliefs regarding future events. Such statements may be identified by words such as believe, expect, anticipate, intend, estimate, may increase, may fluctuate , and similar expressions, or future or conditional verbs such as will, should, would and could .
Such statements are based on management's current expectations and are subject to uncertainty and changes in circumstances. Actual results may differ materially from those included in these statements due to a variety of factors, including but not limited to the factors listed and described under "Risk Factors" in Citi's 2009 Annual Report on Form 10-K for the fiscal year ending December 31, 2009 and those factors described below:
- •
-
the impact of the economic recession and disruptions in the global financial markets on Citi's business and results of
operations;
- •
-
the impact of previously enacted and potential future legislation on Citi's businesses, business practices, costs of
operations or otherwise (including without limitation financial regulatory reform legislation (and credit rating agency response thereto) and the continued implementation of the CARD Act);
- •
-
Citi's participation in U.S. government programs to modify first and second lien mortgage loans, as well as Citi's own
loss mitigation and forbearance programs, and their effect on the amount and timing of Citi's earnings and credit losses related to those loans;
- •
-
the expiration of a provision of the U.S. tax law allowing Citi to defer U.S. taxes on certain active financial services
income and its effect on Citi's tax expense;
- •
-
risks arising from Citi's extensive operations outside the U.S.;
- •
-
potential reduction in earnings available to Citi's common stockholders and return on Citi's equity due to future
issuances of Citi common stock and preferred stock;
- •
-
the effect of the U.S. Treasury's sale of its stake in Citi on the market price of Citi common stock;
- •
-
an "ownership change" under the Internal Revenue Code and its effect on Citi's ability to utilize its deferred tax assets
to offset future taxable income;
- •
-
the impact of increases in FDIC insurance premiums and other proposed fees on banks on Citi's earnings;
- •
-
Citi's ability to compete effectively in the financial services industry, on a global, regional and product basis and with
competitors who may face fewer regulatory constraints;
- •
-
Citi's ability to hire and retain qualified employees;
- •
-
Citi's ability to maintain the value of the Citi brand;
- •
-
Citi's ability to maintain sufficient capitalization consistent with its risk profile and robust relative to future
capital requirements;
- •
-
Citi's continuing ability to obtain financing from external sources and maintain adequate liquidity;
- •
-
reduction in Citi's or its subsidiaries' credit ratings and its effect on the cost of funding from, and access to, the
capital markets;
- •
-
market disruptions and their impact on the risk of customer or counterparty delinquency or default;
- •
-
failure to realize all of the anticipated benefits of the realignment of Citi's business;
- •
-
volatile and illiquid market conditions, which could lead to further write-downs of Citi's financial instruments;
- •
-
the elimination of QSPEs from the guidance in SFAS 140 and changes in FIN 46(R) and their impact on Citi's
Consolidated Financial Statements;
- •
-
the accuracy of Citi's assumptions and estimates used to prepare its financial statements;
- •
-
changes in accounting standards, including without limitation upcoming changes relating to certain embedded credit
derivatives, and their impact on how Citi records and reports its financial condition and results of operations;
- •
-
the effectiveness of Citi's risk management processes and strategies;
- •
-
the exposure of Citi to reputational damage and significant legal and regulatory liability as a member of the financial
services industry; and
- •
- a failure in Citi's operational systems or infrastructure, or those of third parties.
77
FINANCIAL STATEMENTS AND NOTES
TABLE OF CONTENTS
78
This page intentionally left blank.
79
CONSOLIDATED FINANCIAL STATEMENTS
CITIGROUP INC. AND SUBSIDIARIES
Citigroup Inc. and Subsidiaries
|
|
Three months ended March 31, | |||||||
|---|---|---|---|---|---|---|---|---|
| In millions of dollars, except per-share amounts | 2010 | 2009 | ||||||
|
Revenues |
||||||||
|
Interest revenue |
$ | 20,852 | $ | 20,583 | ||||
|
Interest expense |
6,291 | 7,657 | ||||||
|
Net interest revenue |
$ | 14,561 | $ | 12,926 | ||||
|
Commissions and fees |
$ | 3,760 | $ | 4,168 | ||||
|
Principal transactions |
4,051 | 3,670 | ||||||
|
Administration and other fiduciary fees |
1,022 | 1,606 | ||||||
|
Realized gains (losses) on sales of investments |
538 | 757 | ||||||
|
Other than temporary impairment losses on investments |
||||||||
|
Gross impairment losses |
(550 | ) | (1,379 | ) | ||||
|
Less: Impairments recognized in OCI |
43 | 631 | ||||||
|
Net impairment losses recognized in earnings |
$ | (507 | ) | $ | (748 | ) | ||
|
Insurance premiums |
$ | 748 | $ | 755 | ||||
|
Other revenue |
1,248 | 1,387 | ||||||
|
Total non-interest revenues |
$ | 10,860 | $ | 11,595 | ||||
|
Total revenues, net of interest expense |
$ | 25,421 | $ | 24,521 | ||||
|
Provisions for credit losses and for benefits and claims |
||||||||
|
Provision for loan losses |
$ | 8,366 | $ | 9,915 | ||||
|
Policyholder benefits and claims |
287 | 332 | ||||||
|
Provision for unfunded lending commitments |
(35 | ) | 60 | |||||
|
Total provisions for credit losses and for benefits and claims |
$ | 8,618 | $ | 10,307 | ||||
|
Operating expenses |
||||||||
|
Compensation and benefits |
$ | 6,162 | $ | 6,235 | ||||
|
Premises and equipment |
965 | 1,083 | ||||||
|
Technology/communication |
1,064 | 1,142 | ||||||
|
Advertising and marketing |
302 | 334 | ||||||
|
Restructuring |
(3 | ) | (13 | ) | ||||
|
Other operating |
3,028 | 2,904 | ||||||
|
Total operating expenses |
$ | 11,518 | $ | 11,685 | ||||
|
Income from continuing operations before income taxes |
$ | 5,285 | $ | 2,529 | ||||
|
Provision for income taxes |
1,036 | 835 | ||||||
|
Income from continuing operations |
$ | 4,249 | $ | 1,694 | ||||
|
Discontinued operations |
||||||||
|
Income (loss) from discontinued operations |
$ | (5 | ) | $ | (152 | ) | ||
|
Gain on sale |
94 | (12 | ) | |||||
|
Provision (benefit) for income taxes |
(122 | ) | (47 | ) | ||||
|
Income (loss) from discontinued operations, net of taxes |
$ | 211 | $ | (117 | ) | |||
|
Net income before attribution of noncontrolling interests |
$ | 4,460 | $ | 1,577 | ||||
|
Net income (loss) attributable to noncontrolling interests |
32 | (16 | ) | |||||
|
Citigroup's net income |
$ | 4,428 | $ | 1,593 | ||||
|
Basic earnings per share(1)(2) |
||||||||
|
Income (loss) from continuing operations |
$ | 0.15 | $ | (0.16 | ) | |||
|
Income (loss) from discontinued operations, net of taxes |
0.01 | (0.02 | ) | |||||
|
Net income (loss) |
$ | 0.15 | $ | (0.18 | ) | |||
|
Weighted average common shares outstanding |
28,444.3 | 5,385.0 | ||||||
|
Diluted earnings per share(1) |
||||||||
|
Income (loss) from continuing operations |
$ | 0.14 | $ | (0.16 | ) | |||
|
Income (loss) from discontinued operations, net of taxes |
0.01 | (0.02 | ) | |||||
|
Net income (loss) |
$ | 0.15 | $ | (0.18 | ) | |||
|
Adjusted weighted average common shares outstanding |
29,333.5 | 5,953.3 | ||||||
- (1)
-
The
Diluted EPS calculation for 2009 utilizes Basic shares and Income available to common shareholders (Basic) due to the negative Income available to
common shareholders. Using Diluted shares and Income available to common shareholders (Diluted) would result in anti-dilution.
- (2)
- Due to rounding, earnings per share on continuing operations and discontinued operations may not sum to earnings per share on net income.
See Notes to the Consolidated Financial Statements.
80
CITIGROUP INC. AND SUBSIDIARIES
Citigroup Inc. and Subsidiaries
| In millions of dollars, except shares |
March 31,
2010 |
December 31,
2009 |
||||||
|---|---|---|---|---|---|---|---|---|
|
|
(Unaudited)
|
|
||||||
|
Assets |
||||||||
|
Cash and due from banks (including segregated cash and other deposits) |
$ | 25,678 | $ | 25,472 | ||||
|
Deposits with banks |
163,525 | 167,414 | ||||||
|
Federal funds sold and securities borrowed or purchased under agreements to resell (including $96,596 and $87,837 as of March 31, 2010 and December 31, 2009, respectively, at fair value) |
234,348 | 222,022 | ||||||
|
Brokerage receivables |
34,001 | 33,634 | ||||||
|
Trading account assets (including $137,078 and $111,219 pledged to creditors at March 31, 2010 and December 31, 2009, respectively) |
345,783 | 342,773 | ||||||
|
Investments (including $17,506 and $15,154 pledged to creditors at March 31, 2010 and December 31, 2009, respectively and $262,138 and $246,429 at March 31, 2010 and December 31, 2009, respectively, at fair value) |
316,733 | 306,119 | ||||||
|
Loans, net of unearned income |
||||||||
|
Consumer (including $2,911 and $34 at fair value as of March 31, 2010 and December 31, 2009, respectively) |
531,469 | 424,057 | ||||||
|
Corporate (including $2,457 and $1,405 at March 31, 2010 and December 31, 2009, respectively, at fair value) |
190,335 | 167,447 | ||||||
|
Loans, net of unearned income |
$ | 721,804 | $ | 591,504 | ||||
|
Allowance for loan losses |
(48,746 | ) | (36,033 | ) | ||||
|
Total loans, net |
$ | 673,058 | $ | 555,471 | ||||
|
Goodwill |
25,662 | 25,392 | ||||||
|
Intangible assets (other than MSRs) |
8,277 | 8,714 | ||||||
|
Mortgage servicing rights (MSRs) |
6,439 | 6,530 | ||||||
|
Other assets (including $13,248 and $12,664 as of March 31, 2010 and December 31, 2009 respectively, at fair value) |
168,709 | 163,105 | ||||||
|
Total assets |
$ | 2,002,213 | $ | 1,856,646 | ||||
The following table presents certain assets of consolidated VIEs, which are included in the Consolidated Balance Sheet above. The assets in the table below include only those assets that can be used to settle obligations of consolidated VIEs on the following page, and are in excess of those obligations.
|
|
March 31, 2010 | |||
|---|---|---|---|---|
|
Assets of consolidated VIEs that can only be used to settle obligations of consolidated VIEs |
||||
|
Cash and due from banks (including segregated cash and other deposits) |
$ | 2,776 | ||
|
Trading account assets |
10,738 | |||
|
Investments |
10,859 | |||
|
Loans, net of unearned income |
||||
|
Consumer (including $2,880 at fair value) |
157,834 | |||
|
Corporate (including $1,266 at fair value) |
26,592 | |||
|
Loans, net of unearned income |
$ | 184,426 | ||
|
Allowance for loan losses |
(14,520 | ) | ||
|
Total loans, net |
$ | 169,906 | ||
|
Other assets |
2,588 | |||
|
Total assets of consolidated VIEs that can only be used to settle obligations of consolidated VIEs |
$ | 196,867 | ||
81
CITIGROUP INC. AND SUBSIDIARIES
CONSOLIDATED BALANCE SHEET
(Continued)
Citigroup Inc. and Subsidiaries
| In millions of dollars, except shares |
March 31,
2010 |
December 31,
2009 |
|||||
|---|---|---|---|---|---|---|---|
|
|
(Unaudited)
|
|
|||||
|
Liabilities |
|||||||
|
Non-interest-bearing deposits in U.S. offices |
$ | 66,796 | $ | 71,325 | |||
|
Interest-bearing deposits in U.S. offices (including $736 and $700 at March 31, 2010 and December 31, 2009, respectively, at fair value) |
230,919 | 232,093 | |||||
|
Non-interest-bearing deposits in offices outside the U.S. |
45,471 | 44,904 | |||||
|
Interest-bearing deposits in offices outside the U.S. (including $804 and $845 at March 31, 2010 and December 31, 2009, respectively, at fair value) |
484,728 | 487,581 | |||||
|
Total deposits |
$ | 827,914 | $ | 835,903 | |||
|
Federal funds purchased and securities loaned or sold under agreements to repurchase (including $136,526 and $104,030 as of March 31, 2010 and December 31, 2009, respectively, at fair value) |
207,911 | 154,281 | |||||
|
Brokerage payables |
55,041 | 60,846 | |||||
|
Trading account liabilities |
142,748 | 137,512 | |||||
|
Short-term borrowings (including $1,225 and $639 at March 31, 2010 and December 31, 2009, respectively, at fair value) |
96,694 | 68,879 | |||||
|
Long-term debt (including $28,112 and $25,942 at March 31, 2010 and December 31, 2009, respectively, at fair value) |
439,274 | 364,019 | |||||
|
Other liabilities (including $11,481 and $11,542 as of March 31, 2010 and December 31, 2009, respectively, at fair value) |
78,852 | 80,233 | |||||
|
Total liabilities |
$ | 1,848,434 | $ | 1,701,673 | |||
|
Stockholders' equity |
|||||||
|
Preferred stock ($1.00 par value; authorized shares: 30 million), issued shares: 12,038 at March 31, 2010 , at aggregate liquidation value |
$ | 312 | $ | 312 | |||
|
Common stock ($0.01 par value; authorized shares: 60 billion), issued shares: 28,685,038,572 at March 31, 2010 and 28,626,100,389 at December 31, 2009 |
287 | 286 | |||||
|
Additional paid-in capital |
96,427 | 98,142 | |||||
|
Retained earnings |
73,432 | 77,440 | |||||
|
Treasury stock, at cost: March 31, 2010—64,790,181 shares and December 31, 2009—142,833,099 shares |
(1,178 | ) | (4,543 | ) | |||
|
Accumulated other comprehensive income (loss) |
(17,859 | ) | (18,937 | ) | |||
|
Total Citigroup stockholders' equity |
$ | 151,421 | $ | 152,700 | |||
|
Noncontrolling interest |
2,358 | 2,273 | |||||
|
Total equity |
$ | 153,779 | $ | 154,973 | |||
|
Total liabilities and equity |
$ | 2,002,213 | $ | 1,856,646 | |||
See Notes to the Consolidated Financial Statements.
The following table presents certain liabilities of consolidated VIEs, which are included in the Consolidated Balance Sheet above. The liabilities in the table below include third party liabilities of consolidated VIEs only, and exclude intercompany balances that eliminate in consolidation. The liabilities also exclude amounts where creditors or beneficial interest holders have recourse to the general credit of Citigroup.
|
|
March 31, 2010 | |||
|---|---|---|---|---|
|
Liabilities of consolidated VIEs for which creditors or beneficial interest holders do not have recourse to the general credit of Citigroup: |
||||
|
Short-term borrowings |
$ | 39,996 | ||
|
Long-term debt (including $7,005 at fair value) |
113,604 | |||
|
Other liabilities |
2,531 | |||
|
Total liabilities of consolidated VIEs for which creditors or beneficial interest holders do not have recourse to the general credit of Citigroup |
$ | 156,131 | ||
82
CITIGROUP INC. AND SUBSIDIARIES
CONSOLIDATED STATEMENT OF CHANGES IN STOCKHOLDERS' EQUITY (Unaudited)
Citigroup Inc. and Subsidiaries
|
|
Three Months Ended March 31, | ||||||
|---|---|---|---|---|---|---|---|
| In millions of dollars, except shares in thousands | 2010 | 2009 | |||||
|
Preferred stock at aggregate liquidation value |
|||||||
|
Balance, beginning of period |
$ | 312 | $ | 70,664 | |||
|
Issuance of new preferred stock |
— | 3,582 | |||||
|
Balance, end of period |
$ | 312 | $ | 74,246 | |||
|
Common stock and additional paid-in capital |
|||||||
|
Balance, beginning of period |
$ | 98,428 | $ | 19,222 | |||
|
Employee benefit plans |
(3,506 | ) | (4,013 | ) | |||
|
Reset of convertible preferred stock conversion price |
— | 1,285 | |||||
|
Issuance of TARP-related warrants |
— | 88 | |||||
|
ADIA Upper Decs Equity Units Purchase Contract |
1,875 | — | |||||
|
Other |
(83 | ) | — | ||||
|
Balance, end of period |
$ | 96,714 | $ | 16,582 | |||
|
Retained earnings |
|||||||
|
Balance, beginning of period |
$ | 77,440 | $ | 86,521 | |||
|
Adjustment to opening balance, net of taxes(1)(2) |
(8,442 | ) | 413 | ||||
|
Adjusted balance, beginning of period |
$ | 68,998 | $ | 86,934 | |||
|
Net income |
4,428 | 1,593 | |||||
|
Common dividends(3) |
6 | (63 | ) | ||||
|
Preferred dividends |
— | (1,011 | ) | ||||
|
Preferred stock Series H discount accretion |
— | (53 | ) | ||||
|
Reset of convertible preferred stock conversion price |
— | (1,285 | ) | ||||
|
Balance, end of period |
$ | 73,432 | $ | 86,115 | |||
|
Treasury stock, at cost |
|||||||
|
Balance, beginning of period |
$ | (4,543 | ) | $ | (9,582 | ) | |
|
Issuance of shares pursuant to employee benefit plans |
3,364 | 3,579 | |||||
|
Treasury stock acquired(4) |
(1 | ) | (1 | ) | |||
|
Other |
2 | 8 | |||||
|
Balance, end of period |
$ | (1,178 | ) | $ | (5,996 | ) | |
|
Accumulated other comprehensive income (loss) |
|||||||
|
Balance, beginning of period |
$ | (18,937 | ) | $ | (25,195 | ) | |
|
Adjustment to opening balance, net of taxes(1) |
— | (413 | ) | ||||
|
Adjusted balance, beginning of period |
$ | (18,937 | ) | $ | (25,608 | ) | |
|
Net change in unrealized gains and losses on investment securities, net of taxes |
1,182 | 20 | |||||
|
Net change in cash flow hedges, net of taxes |
223 | 1,483 | |||||
|
Net change in foreign currency translation adjustment, net of taxes |
(279 | ) | (2,974 | ) | |||
|
Pension liability adjustment, net of taxes |
(48 | ) | 66 | ||||
|
Net change in Accumulated other comprehensive income (loss) |
$ | 1,078 | $ | (1,405 | ) | ||
|
Balance, end of period |
$ | (17,859 | ) | $ | (27,013 | ) | |
|
Total Citigroup common stockholders' equity (shares outstanding: 28,620,248 at March 31, 2010 and 28,483,267 at December 31, 2009 ) |
$ | 151,109 | $ | 69,688 | |||
|
Total Citigroup stockholders' equity |
$ | 151,421 | $ | 143,934 | |||
[Statement continues on the following page, including notes to table]
83
CITIGROUP INC. AND SUBSIDIARIES
CONSOLIDATED STATEMENT OF CHANGES IN STOCKHOLDERS' EQUITY (Unaudited)
(Continued)
Citigroup Inc. and Subsidiaries
|
|
Three Months Ended March 31, | |||||||
|---|---|---|---|---|---|---|---|---|
| In millions of dollars, except shares in thousands | 2010 | 2009 | ||||||
|
Noncontrolling interest |
||||||||
|
Balance, beginning of period |
$ | 2,273 | $ | 2,392 | ||||
|
Origination of a noncontrolling interest |
(10 | ) | — | |||||
|
Transactions between noncontrolling interest shareholders and the related consolidating subsidiary |
(22 | ) | (120 | ) | ||||
|
Transactions between Citigroup and the noncontrolling-interest shareholders |
— | (216 | ) | |||||
|
Net income attributable to noncontrolling-interest shareholders |
32 | (16 | ) | |||||
|
Dividends paid to noncontrolling–interest shareholders |
(54 | ) | (6 | ) | ||||
|
Accumulated other comprehensive income—net change in unrealized gains and losses on investment securities, net of tax |
12 | (3 | ) | |||||
|
Accumulated other comprehensive income—net change in FX translation adjustment, net of tax |
(5 | ) | (86 | ) | ||||
|
All other |
132 | 48 | ||||||
|
Net change in noncontrolling interests |
$ | 85 | $ | (399 | ) | |||
|
Balance, end of period |
$ | 2,358 | $ | 1,993 | ||||
|
Total equity |
$ | 153,779 | $ | 145,927 | ||||
|
Comprehensive income (loss) |
||||||||
|
Net income (loss) before attribution of noncontrolling interests |
$ | 4,460 | $ | 1,577 | ||||
|
Net change in Accumulated other comprehensive income (loss) |
1,085 | (1,494 | ) | |||||
|
Total comprehensive income |
$ | 5,545 | $ | 83 | ||||
|
Comprehensive income (loss) attributable to the noncontrolling interests |
$ | 39 | $ | (105 | ) | |||
|
Comprehensive income attributable to Citigroup |
$ | 5,506 | $ | 188 | ||||
- (1)
-
The
adjustment to the opening balances for
Retained earnings
and
Accumulated other
comprehensive income (loss)
in 2009 represents the cumulative effect of initially adopting ASC 320-10-35-34,
Investments—Debt and Equity securities: Recognition of an Other-Than-Temporary
Impairment
(formerly FSP
FAS 115-2 and FAS 124-2).
- (2)
-
The
adjustment to the opening balance for
Retained earnings
in 2010 represents the cumulative effect of
initially adopting ASC 810,
Consolidation
(formerly FASB Interpretation No. 46(R), Consolidation of Variable Interest Entities).
- (3)
-
Common
dividends in 2010 are related to forfeitures of previously issued but unvested employee stock awards. Common dividends declared were as follows:
$0.01 per share in the first quarter of 2009.
- (4)
- All open market repurchases were transacted under an existing authorized share repurchase plan and relate to customer fails/errors.
See Notes to the Consolidated Financial Statements.
84
CITIGROUP INC. AND SUBSIDIARIES
|
|
Three Months Ended March 31, | |||||||
|---|---|---|---|---|---|---|---|---|
| In millions of dollars | 2010 | 2009 | ||||||
|
Cash flows from operating activities of continuing operations |
||||||||
|
Net income before attribution of noncontrolling interests |
$ | 4,460 | $ | 1,577 | ||||
|
Net income (loss) attributable to noncontrolling interests |
32 | (16 | ) | |||||
|
Citigroup's net income |
$ | 4,428 | $ | 1,593 | ||||
|
Income (loss) from discontinued operations, net of taxes |
147 | (105 | ) | |||||
|
Gain (loss) on sale, net of taxes |
64 | (12 | ) | |||||
|
Income from continuing operations—excluding noncontrolling interests |
$ | 4,217 | $ | 1,710 | ||||
|
Adjustments to reconcile net income (loss) to net cash provided by (used in) operating activities of continuing operations |
||||||||
|
Amortization of deferred policy acquisition costs and present value of future profits |
102 | 101 | ||||||
|
Additions to deferred policy acquisition costs |
1,994 | (90 | ) | |||||
|
Depreciation and amortization |
623 | 13 | ||||||
|
Provision for credit losses |
8,331 | 9,975 | ||||||
|
Change in trading account assets |
(13,110 | ) | 42,413 | |||||
|
Change in trading account liabilities |
5,236 | (36,652 | ) | |||||
|
Change in federal funds sold and securities borrowed or purchased under agreements to resell |
(12,326 | ) | 4,530 | |||||
|
Change in federal funds purchased and securities loaned or sold under agreements to repurchase |
53,630 | (20,490 | ) | |||||
|
Change in brokerage receivables net of brokerage payables |
(6,172 | ) | (11,017 | ) | ||||
|
Net losses (gains) from sales of investments |
(538 | ) | (757 | ) | ||||
|
Change in loans held-for-sale |
(1,444 | ) | (889 | ) | ||||
|
Other, net |
(5,125 | ) | 2,772 | |||||
|
Total adjustments |
$ | 31,201 | $ | (10,091 | ) | |||
|
Net cash provided by (used in) operating activities of continuing operations |
$ | 35,418 | $ | (8,381 | ) | |||
|
Cash flows from investing activities of continuing operations |
||||||||
|
Change in deposits at interest with banks |
$ | 3,889 | $ | 10,828 | ||||
|
Change in loans |
25,536 | (31,999 | ) | |||||
|
Proceeds from sales and securitizations of loans |
1,252 | 60,329 | ||||||
|
Purchases of investments |
(95,504 | ) | (58,136 | ) | ||||
|
Proceeds from sales of investments |
32,962 | 27,774 | ||||||
|
Proceeds from maturities of investments |
45,904 | 32,928 | ||||||
|
Capital expenditures on premises and equipment |
(278 | ) | (282 | ) | ||||
|
Proceeds from sales of premises and equipment, subsidiaries and affiliates, and repossessed assets |
637 | 1,032 | ||||||
|
Net cash provided by investing activities of continuing operations |
$ | 14,398 | $ | 42,474 | ||||
|
Cash flows from financing activities of continuing operations |
||||||||
|
Dividends paid |
$ | — | $ | (1,074 | ) | |||
|
Issuance of ADIA Upper Decs equity units purchase contract |
1,875 | — | ||||||
|
Treasury stock acquired |
(1 | ) | (1 | ) | ||||
|
Stock tendered for payment of withholding taxes |
(126 | ) | (88 | ) | ||||
|
Issuance of long-term debt |
7,331 | 65,398 | ||||||
|
Payments and redemptions of long-term debt |
(16,682 | ) | (74,055 | ) | ||||
|
Change in deposits |
(7,989 | ) | (11,489 | ) | ||||
|
Change in short-term borrowings |
(33,885 | ) | (10,302 | ) | ||||
|
Net cash used in financing activities of continuing operations |
$ | (49,477 | ) | $ | (31,611 | ) | ||
|
Effect of exchange rate changes on cash and cash equivalents |
(185 | ) | (756 | ) | ||||
|
Net cash from discontinued operations |
52 | 84 | ||||||
|
Change in cash and due from banks |
$ | 206 | $ | 1,810 | ||||
|
Cash and due from banks at beginning of period |
25,472 | 29,253 | ||||||
|
Cash and due from banks at end of period |
$ | 25,678 | $ | 31,063 | ||||
|
Supplemental disclosure of cash flow information for continuing operations |
||||||||
|
Cash paid during the period for income taxes |
$ | 1,802 | $ | 1,111 | ||||
|
Cash paid during the period for interest |
$ | 5,711 | $ | 8,362 | ||||
|
Non-cash investing activities |
||||||||
|
Transfers to repossessed assets |
$ | 669 | $ | 643 | ||||
See Notes to the Unaudited Consolidated Financial Statements.
85
This page intentionally left blank.
86
CITIBANK, N.A. AND SUBSIDIARIES
|
|
Citibank, N.A. and Subsidiaries
|
||||||
|---|---|---|---|---|---|---|---|
| In millions of dollars, except shares |
March 31,
2010 |
December 31,
2009 |
|||||
|
|
(Unaudited)
|
|
|||||
|
Assets |
|||||||
|
Cash and due from banks |
$ | 19,986 | $ | 20,246 | |||
|
Deposits with banks |
145,122 | 154,372 | |||||
|
Federal funds sold and securities purchased under agreements to resell |
20,124 | 31,434 | |||||
|
Trading account assets (including $463 and $914 pledged to creditors at March 31, 2010 and December 31, 2009, respectively) |
147,411 | 156,380 | |||||
|
Investments (including $3,339 and $3,849 pledged to creditors at March 31, 2010 and December 31, 2009, respectively) |
248,377 | 233,086 | |||||
|
Loans, net of unearned income |
499,413 | 477,974 | |||||
|
Allowance for loan losses |
(22,372 | ) | (22,685 | ) | |||
|
Total loans, net |
$ | 477,041 | $ | 455,289 | |||
|
Goodwill |
10,209 | 10,200 | |||||
|
Intangible assets |
7,917 | 8,243 | |||||
|
Premises and equipment, net |
4,681 | 4,832 | |||||
|
Interest and fees receivable |
6,813 | 6,840 | |||||
|
Other assets |
83,229 | 80,439 | |||||
|
Total assets |
$ | 1,170,910 | $ | 1,161,361 | |||
The following table presents certain assets of consolidated VIEs, which are included in the Consolidated Balance Sheet above. The assets in the table below include only those assets that can be used to settle obligations of consolidated VIEs on the following page, and are in excess of those obligations.
|
|
March 31, 2010 | ||||
|---|---|---|---|---|---|
|
Assets of consolidated VIEs that can only be used to settle obligations of consolidated VIEs |
|||||
|
Cash and due from banks (including segregated cash and other deposits) |
$ | 2,205 | |||
|
Trading account assets |
3,833 | ||||
|
Investments |
9,091 | ||||
|
Loans, net of unearned income |
|||||
|
Consumer (including $2,880 at fair value) |
43,579 | ||||
|
Corporate (including $494 at fair value) |
25,514 | ||||
|
Loans, net of unearned income |
$ | 69,093 | |||
|
Allowance for loan losses |
(336 | ) | |||
|
Total loans, net |
$ | 68,757 | |||
|
Other assets |
1,248 | ||||
|
Total assets of consolidated VIEs that can only be used to settle obligations of consolidated VIEs |
$ | 85,134 | |||
[Statement continues on the following page]
87
CITIBANK, N.A. AND SUBSIDIARIES
CONSOLIDATED BALANCE SHEET
(Continued)
|
|
Citibank, N.A. and Subsidiaries
|
||||||
|---|---|---|---|---|---|---|---|
| In millions of dollars, except shares |
March 31,
2010 |
December 31,
2009 |
|||||
|
|
(Unaudited)
|
|
|||||
|
Liabilities |
|||||||
|
Non-interest-bearing deposits in U.S. offices |
$ | 73,820 | $ | 76,729 | |||
|
Interest-bearing deposits in U.S. offices |
176,352 | 176,149 | |||||
|
Non-interest-bearing deposits in offices outside the U.S. |
40,600 | 39,414 | |||||
|
Interest-bearing deposits in offices outside the U.S. |
474,660 | 479,350 | |||||
|
Total deposits |
$ | 765,432 | $ | 771,642 | |||
|
Trading account liabilities |
51,469 | 52,010 | |||||
|
Purchased funds and other borrowings |
85,146 | 89,503 | |||||
|
Accrued taxes and other expenses |
8,270 | 9,046 | |||||
|
Long-term debt and subordinated notes |
99,739 | 82,086 | |||||
|
Other liabilities |
40,093 | 39,181 | |||||
|
Total liabilities |
$ | 1,050,149 | $ | 1,043,468 | |||
|
Citibank stockholder's equity |
|||||||
|
Capital stock ($20 par value) outstanding shares: 37,534,553 in each period |
$ | 751 | $ | 751 | |||
|
Surplus |
108,401 | 107,923 | |||||
|
Retained earnings |
21,527 | 19,457 | |||||
|
Accumulated other comprehensive income (loss)(1) |
(11,188 | ) | (11,532 | ) | |||
|
Total Citibank stockholder's equity |
$ | 119,491 | $ | 116,599 | |||
|
Noncontrolling interest |
1,270 | 1,294 | |||||
|
Total equity |
$ | 120,761 | $ | 117,893 | |||
|
Total liabilities and equity |
$ | 1,170,910 | $ | 1,161,361 | |||
- (1)
- Amounts at March 31, 2010 and December 31, 2009 include the after-tax amounts for net unrealized gains (losses) on investment securities of $(3.720) billion and $(4.735) billion, respectively, for foreign currency translation of $(4.041) billion and $(3.255) billion, respectively, for cash flow hedges of $(2.235) billion and $(2.367) billion, respectively, and for pension liability adjustments of $(1.192) billion and $(1.175) billion, respectively.
See Notes to the Consolidated Financial Statements.
The following table presents certain liabilities of consolidated VIEs, which are included in the Consolidated Balance Sheet above. The liabilities in the table below include third party liabilities of consolidated VIEs only, and exclude intercompany balances that eliminate in consolidation. The liabilities also exclude amounts where creditors or beneficial interest holders have recourse to the general credit of Citigroup.
|
|
March 31, 2010 | |||
|---|---|---|---|---|
|
Liabilities of consolidated VIEs for which creditors or beneficial interest holders do not have recourse to the general credit of Citigroup: |
||||
|
Short-term borrowings |
$ | 27,016 | ||
|
Long-term debt (including $3,084 at fair value) |
38,749 | |||
|
Other liabilities |
1,734 | |||
|
Total liabilities of consolidated VIEs for which creditors or beneficial interest holders do not have recourse to the general credit of Citigroup |
$ | 67,499 | ||
88
CITIGROUP INC. AND SUBSIDIARIES
NOTES TO CONSOLIDATED FINANCIAL STATEMENTS (Unaudited)
The accompanying unaudited Consolidated Financial Statements as of March 31, 2010 and for the three-month period ended March 31, 2010 include the accounts of Citigroup Inc. (Citigroup) and its subsidiaries (collectively, the Company). In the opinion of management, all adjustments, consisting of normal recurring adjustments, necessary for a fair presentation, have been reflected. The accompanying Unaudited Consolidated Financial Statements should be read in conjunction with the Consolidated Financial Statements and related notes included in Citigroup's Annual Report on Form 10-K for the fiscal year ended December 31, 2009.
Certain financial information that is normally included in annual financial statements prepared in accordance with U.S. generally accepted accounting principles, but is not required for interim reporting purposes, has been condensed or omitted.
Management must make estimates and assumptions that affect the Consolidated Financial Statements and the related footnote disclosures. While management makes its best judgment, actual results could differ from those estimates. Current market conditions increase the risk and complexity of the judgments in these estimates.
Certain reclassifications have been made to the prior-period's financial statements to conform to the current period's presentation.
As noted above, the Notes to Consolidated Financial Statements are unaudited.
Citibank, N.A.
Citibank, N.A. is a commercial bank and wholly owned subsidiary of Citigroup Inc. Citibank's principal offerings include consumer finance, mortgage lending, and retail banking products and services; investment banking, commercial banking, cash management, trade finance and e-commerce products and services; and private banking products and services.
The Company includes a balance sheet and statement of changes in stockholder's equity for Citibank, N.A. to provide information about this entity to shareholders of Citigroup and international regulatory agencies. (See Note 21 to the Consolidated Financial Statements for further discussion.)
Significant Accounting Policies
The Company's accounting policies are fundamental to understanding management's discussion and analysis of results of operations and financial condition. The Company has identified six policies as being significant because they require management to make subjective and/or complex judgments about matters that are inherently uncertain. These policies relate to Valuations of Financial Instruments, Allowance for Credit Losses, Securitizations, Goodwill, Income Taxes and Legal Reserves. The Company, in consultation with the Audit Committee of the Board of Directors, has reviewed and approved these significant accounting policies, which are further described in the Company's Annual Report on Form 10-K for the fiscal year ended December 31, 2009.
Principles of Consolidation
The Consolidated Financial Statements include the accounts of Citigroup and its subsidiaries (the Company). The Company consolidates subsidiaries in which it holds, directly or indirectly, more than 50% of the voting rights or where it exercises control. Entities where the Company holds 20% to 50% of the voting rights and/or has the ability to exercise significant influence, other than investments of designated venture capital subsidiaries, or investments accounted for at fair value under the fair value option, are accounted for under the equity method, and the pro rata share of their income (loss) is included in Other revenue . Income from investments in less than 20%-owned companies is recognized when dividends are received. As discussed below, Citigroup consolidates entities deemed to be variable-interest entities when Citigroup is determined to be the primary beneficiary. Gains and losses on the disposition of branches, subsidiaries, affiliates, buildings, and other investments and charges for management's estimate of impairment in their value that is other than temporary, such that recovery of the carrying amount is deemed unlikely, are included in Other revenue .
The following Significant Accounting Policies have been updated since the Company filed with the SEC its Annual Report on Form 10-K for the fiscal year ended December 31, 2009.
Securities Borrowed and Securities Loaned
Securities borrowing and lending transactions generally do not constitute a sale of the underlying securities for accounting purposes, and so are treated as collateralized financing transactions when the transaction involves the exchange of cash. Such transactions are recorded at the amount of cash advanced or received plus accrued interest. As set out in Note 17 to the Consolidated Financial Statements, the Company has elected to apply fair value accounting to a number of securities borrowing and lending transactions. Irrespective of whether the Company has elected fair value accounting, fees paid or received for all securities lending and borrowing transactions are recorded in Interest expense or Interest revenue at the contractually specified rate.
Where the conditions of ASC 210-20 are met, amounts recognized in respect of securities borrowed and securities loaned are presented net on the Consolidated Balance Sheet.
With respect to securities borrowed or loaned, the Company pays or receives cash collateral in an amount in excess of the market value of securities borrowed or loaned. The Company monitors the market value of securities borrowed and loaned on a daily basis with additional collateral received or paid as necessary.
As described in Note 16 to the Consolidated Financial Statements, the Company uses a discounted cash flow technique to determine the fair value of securities lending and borrowing transactions.
89
Repurchase and Resale Agreements
Securities sold under agreements to repurchase (repos) and securities purchased under agreements to resell (reverse repos) generally do not constitute a sale for accounting purposes of the underlying securities, and so are treated as collateralized financing transactions. As set out in Note 17 to the Consolidated Financial Statements, the Company has elected to apply fair value accounting to a majority of such transactions, with changes in fair value reported in earnings. Any transactions for which fair value accounting has not been elected are recorded at the amount of cash advanced or received plus accrued interest. Irrespective of whether the Company has elected fair value accounting, interest paid or received on all repo and reverse repo transactions is recorded in Interest expense or Interest revenue at the contractually specified rate.
Where the conditions of ASC 210-20-45-11, Balance Sheet—Offsetting: Repurchase and Reverse Repurchase Agreements (formerly FASB Interpretation No. 41, "Offsetting of Amounts Related to Certain Repurchase and Reverse Repurchase Agreements"), are met, repos and reverse repos are presented net on the Consolidated Balance Sheet.
The Company's policy is to take possession of securities purchased under agreements to resell. The market value of securities to be repurchased and resold is monitored, and additional collateral is obtained where appropriate to protect against credit exposure.
As described in Note 16 to the Consolidated Financial Statements, the Company uses a discounted cash flow technique to determine the fair value of repo and reverse repo transactions.
Repurchase and Resale Agreements, and Securities Lending and Borrowing Agreements Accounted for as Sales
Where certain conditions are met under ASC 860-10, Transfers and Servicing (formerly FASB Statement No. 166, Accounting for Transfers of Financial Assets ), the Company accounts for certain repurchase agreements and securities lending agreements as sales. The key distinction resulting in these agreements being accounted for as sales is a reduction in initial margin or restriction in daily maintenance margin. At March 31, 2010 and December 31, 2009, $1.3 billion and $13.0 billion of these transactions, respectively, were accounted for as sales that reduced trading account assets. Included in the December 31, 2009 amount is $5.7 billion of repurchase and securities lending agreements that were accounted for as sales in error. As of December 31, 2009, this error comprised 0.3% of Total assets , 0.3% of Total liabilities and 3.7% of Federal funds purchased and securities loaned or sold under agreements to repurchase. The maximum error amount at any quarter end during the past three years was $9.2 billion of repurchase and securities lending agreements accounted for as sales, which comprised 0.5% of both Total assets and Total liabilities , respectively, and 2.3% of Federal funds purchased and securities loaned or sold under agreements to repurchase. There was no impact on Net income (loss) in any period. Management believes that this error was immaterial to Citigroup's financial statements during all periods at issue. Effective in the first quarter of 2010, the Company has prospectively changed the accounting for these repurchase and securities lending transactions so that the accounting reflects a secured borrowing transaction, thus conforming the accounting to the transaction terms.
Variable Interest Entities
An entity is referred to as a variable interest entity (VIE) if it meets the criteria outlined in ASC 810, Consolidation (formerly FASB Interpretation No. 46(R), Consolidation of Variable Interest Entities (revised December 2003) (FIN 46(R)), which are: (1) the entity has equity that is insufficient to permit the entity to finance its activities without additional subordinated financial support from other parties, or (2) the entity has equity investors that cannot make significant decisions about the entity's operations or that do not absorb their proportionate share of the expected losses or receive the expected returns of the entity.
Prior to January 1, 2010, the Company consolidated a VIE if it had a majority of the expected losses or a majority of the expected residual returns or both. As of January 1, 2010, when the Company adopted SFAS 167's amendments to the VIE consolidation guidance, the Company consolidates a VIE when it has both the power to direct the activities that most significantly impact the VIE's economic success and a right to receive benefits or absorb losses of the entity that could be potentially significant to the VIE.
Along with the VIEs that are consolidated in accordance with these guidelines, the Company has variable interests in other VIEs that are not consolidated because the Company is not the primary beneficiary.These include multi-seller finance companies, certain collateralized debt obligations (CDOs), many structured finance transactions, and various investment funds.
However, these VIEs as well as all other unconsolidated VIEs are continually monitored by the Company to determine if any events have occurred that could cause its primary beneficiary status to change. These events include:
- •
-
additional purchases or sales of variable interests by Citigroup or an unrelated third party, which cause Citigroup's
overall variable interest ownership to change;
- •
-
changes in contractual arrangements in a manner that reallocates expected losses and residual returns among the variable
interest holders; and
- •
- providing support to an entity that results in an implicit variable interest.
All other entities not deemed to be VIEs with which the Company has involvement are evaluated for consolidation under other subtopics of ASC 810 (formerly Accounting Research Bulletin (ARB) No. 51, Consolidated Financial Statements , SFAS No. 94, Consolidation of All Majority-Owned Subsidiaries , and EITF Issue No. 04-5, "Determining Whether a General Partner, or the General Partners as a Group, Controls a Limited Partnership or Similar Entity When the Limited Partners Have Certain Rights").
Securitizations
The Company primarily securitizes credit card receivables and mortgages. Other types of securitized assets include corporate debt instruments (in cash and synthetic form) and student loans.
There are two key accounting determinations that must be made relating to securitizations. In cases where the Company originated or owned the financial assets transferred to the securitization entity, it determines whether that transfer is considered a sale under U.S. Generally Accepted Accounting Principles (GAAP). If it is a sale, the transferred assets are
90
removed from the Company's Consolidated Balance Sheet with a gain or loss recognized. Alternatively, if the Company determines that the transfer is a financing rather than a sale, the assets remain on the Company's Consolidated Balance Sheet with an offsetting liability recognized in the amount of proceeds received.
In addition, the Company determines whether the securitization entity would be included in its Consolidated Financial Statements. If the securitization entity is a VIE, the Company consolidates the VIE if it is the primary beneficiary.
For all other securitization entities determined not to be VIEs in which Citigroup participates, a consolidation decision is made by evaluating several factors, including how much of the entity's ownership is in the hands of third-party investors, who controls the securitization entity, and who reaps the rewards and bears the risks of the entity. Only securitization entities controlled by Citigroup are consolidated.
As of January 1, 2010, upon adoption of SFAS 166/167, Citi first makes a determination as to whether the securitization entity would be consolidated. Second, it determines whether the transfer of financial assets is considered a sale under GAAP. Furthermore, former qualifying special purpose entities (QSPEs) are now considered VIEs and are no longer exempt from consolidation. The Company consolidates VIEs when it has both: (1) power to direct activities of the VIE that most significantly impact the entity's economic performance and (2) an obligation to absorb losses or right to receive benefits from the entity that could potentially be significant to the VIE.
Interests in the securitized and sold assets may be retained in the form of subordinated interest-only strips, subordinated tranches, spread accounts, and servicing rights. In credit card securitizations, the Company retains a seller's interest in the credit card receivables transferred to the trusts, which is not in securitized form. Prior to January 1, 2010, when the securitization trusts were consolidated, the seller's interest was carried on a historical cost basis and classified as Consumer loans . Retained interests in securitized mortgage loans and student loans were classified as Trading account assets , as were a majority of the retained interests in securitized credit card receivables.
Transfers of Financial Assets
For a transfer of financial assets to be considered a sale: the assets must have been isolated from the Company, even in bankruptcy or other receivership; the purchaser must have the right to sell the assets transferred or, if the purchaser is an entity whose sole purpose is to engage in securitization and asset-backed financing activities and that entity is constrained from pledging the assets it receives, each beneficial interest holder must have the right to sell the assets (prior to January 1 2010, the entity had to be a QSPE); and the Company may not have an option or any obligation to reacquire the assets. If these sale requirements are met, the assets are removed from the Company's Consolidated Balance Sheet. If the conditions for sale are not met, the transfer is considered to be a secured borrowing, the assets remain on the Consolidated Balance Sheet, and the sale proceeds are recognized as the Company's liability. A legal opinion on a sale is generally obtained for complex transactions or where the Company has continuing involvement with assets transferred or with the securitization entity. For a transfer to be eligible for sale accounting, those opinions must state that the asset transfer is considered a sale and that the assets transferred would not be consolidated with the Company's Other assets in the event of the Company's insolvency.
For a transfer of a portion of a financial asset to be considered a sale, the portion transferred must meet the definition of a participating interest. A participating interest must represent a pro rata ownership in an entire financial asset; all cash flows must be divided proportionally, with the same priority of payment; no participating interest in the transferred asset may be subordinated to the interest of another participating interest holder; and no party may have the right to pledge or exchange the entire financial asset unless all participating interest holders agree. Otherwise, the transfer is accounted for as a secured borrowing.
See Note 14 to the Consolidated Financial Statements for further discussion.
91
ACCOUNTING CHANGES
Additional Disclosures Regarding Fair Value Measurements
In January 2010, the FASB issued ASU 2010-06, Improving Disclosures about Fair Value Measurements. The ASU requires disclosing the amounts of significant transfers in and out of Level 1 and 2 of the fair value hierarchy and describing the reasons for the transfers. The disclosures are effective for reporting periods beginning after December 15, 2009. The Company adopted ASU 2010-06 as of January 1, 2010. The required disclosures are included in Note 16. Additionally, disclosures of the gross purchases, sales, issuances and settlements activity in the Level 3 of the fair value measurement hierarchy will be required for fiscal years beginning after December 15, 2010.
Elimination of QSPEs and Changes in the Consolidation Model for Variable Interest Entities
In June 2009, the FASB issued SFAS No. 166, Accounting for Transfers of Financial Assets, an amendment of FASB Statement No. 140 (SFAS 166, now incorporated into ASC Topic 860) and SFAS No. 167, Amendments to FASB Interpretation No. 46(R) (SFAS 167, now incorporated into ASC Topic 810). Citigroup adopted both standards on January 1, 2010. Citigroup has elected to apply SFAS 166 and SFAS 167 prospectively. Accordingly, prior periods have not been restated.
SFAS 166 eliminates QSPEs. SFAS 167 details three key changes to the consolidation model. First, former QSPEs are now included in the scope of SFAS 167. In addition, the FASB has changed the method of analyzing which party to a VIE should consolidate the VIE (known as the primary beneficiary) to a qualitative determination of which party to the VIE has "power" combined with potentially significant benefits or losses, instead of the previous quantitative risks and rewards model. The party that has "power" has the ability to direct the activities of the VIE that most significantly impact the VIE's economic performance. Finally, the new standard requires that the primary beneficiary analysis be re-evaluated whenever circumstances change. The previous rules required reconsideration of the primary beneficiary only when specified reconsideration events occurred.
As a result of implementing these new accounting standards, Citigroup consolidated certain of the VIEs and former QSPEs with which it currently has involvement. Further, certain asset transfers, including transfers of portions of assets, that would have been considered sales under SFAS 140, are considered secured borrowings under the new standards.
In accordance with SFAS 167, Citigroup employed three approaches for newly consolidating certain VIEs and former QSPEs as of January 1, 2010. The first approach requires initially measuring the assets, liabilities, and noncontrolling interests of the VIEs and former QSPEs at their carrying values (the amounts at which the assets, liabilities, and noncontrolling interests would have been carried in the Consolidated Financial Statements, if Citigroup had always consolidated these VIEs and former QSPEs). The second approach measures assets at their unpaid principal amount, and is applied where using carrying values is not practicable. The third approach is to elect the fair value option, in which all of the financial assets and liabilities of certain designated VIEs and former QSPEs are recorded at fair value upon adoption of SFAS 167 and continue to be marked to market thereafter, with changes in fair value reported in earnings.
Citigroup consolidated all required VIEs and former QSPEs, as of January 1, 2010 at carrying values or unpaid principal amounts, except for certain private label residential mortgage and mutual fund deferred sales commissions VIEs, for which the fair value option was elected. The following tables present the impact of adopting these new accounting standards applying these approaches.
The incremental impact of these changes on GAAP assets and resulting risk-weighted assets for those VIEs and former QSPEs that were consolidated or deconsolidated for accounting purposes as of January 1, 2010 was as follows:
|
|
Incremental | |||||||
|---|---|---|---|---|---|---|---|---|
| In billions of dollars |
GAAP
assets |
Risk-
weighted assets(3) |
||||||
|
Impact of consolidation |
||||||||
|
Credit cards |
$ | 86.3 | $ | 0.8 | ||||
|
Commercial paper conduits |
28.3 | 13.0 | ||||||
|
Student loans |
13.6 | 3.7 | ||||||
|
Private label consumer mortgages |
4.4 | 1.3 | ||||||
|
Municipal tender option bonds |
0.6 | 0.1 | ||||||
|
Collateralized loan obligations |
0.5 | 0.5 | ||||||
|
Mutual fund deferred sales commissions |
0.5 | 0.5 | ||||||
|
Subtotal |
$ | 134.2 | $ | 19.9 | ||||
|
Impact of deconsolidation |
||||||||
|
Collateralized debt obligations(1) |
$ | 1.9 | $ | 3.6 | ||||
|
Equity-linked notes(2) |
1.2 | 0.5 | ||||||
|
Total |
$ | 137.3 | $ | 24.0 | ||||
- (1)
-
The
implementation of SFAS 167 resulted in the deconsolidation of certain synthetic and cash collateralized debt obligation (CDO) VIEs that were
previously consolidated under the requirements of ASC 810 (FIN 46(R)). Upon deconsolidation of these synthetic CDOs, Citigroup's Consolidated Balance Sheet reflects the recognition of current
receivables and payables related to purchased and written credit default swaps entered into with these VIEs, which had previously been eliminated in consolidation. The deconsolidation of certain cash
CDOs has a minimal impact on GAAP assets, but causes a sizable increase in risk-weighted assets. The impact on risk-weighted assets results from replacing, in Citigroup's
trading account, largely investment grade securities owned by these VIEs when consolidated, with Citigroup's holdings of non-investment grade or unrated securities issued by these VIEs
when deconsolidated.
- (2)
-
Certain
equity-linked note client intermediation transactions that had previously been consolidated under the requirements of ASC 810 (FIN 46 (R))
because Citigroup had repurchased and held a majority of the notes issued by the VIE were deconsolidated with the implementation of SFAS 167, because Citigroup does not have the power to direct
the activities of the VIE that most significantly impact the VIE's economic performance. Upon deconsolidation, Citigroup's Consolidated Balance Sheet reflects both the equity-linked notes issued by
the VIEs and held by Citigroup as trading assets, as well as related trading liabilities in the form of prepaid equity derivatives. These trading assets and trading liabilities were formerly
eliminated in consolidation.
- (3)
- The net increase in risk-weighted assets (RWA) was $10 billion, principally reflecting the deduction from gross RWA of $13 billion of loan loss reserves (LLR) recognized from the adoption of SFAS 166/167, which exceeded the 1.25% limitation on LLRs includable in Tier 2 Capital.
92
The following table reflects the incremental impact of adopting SFAS 166/167 on Citigroup's GAAP assets, liabilities, and stockholders' equity.
| In billions of dollars |
January 1,
2010 |
||||
|---|---|---|---|---|---|
|
Assets |
|||||
|
Trading account assets |
$ | (9.9 | ) | ||
|
Investments |
(0.6 | ) | |||
|
Loans |
159.4 | ||||
|
Allowance for loan losses |
(13.4 | ) | |||
|
Other assets |
1.8 | ||||
|
Total assets |
$ | 137.3 | |||
|
Liabilities |
|||||
|
Short-term borrowings |
$ | 58.3 | |||
|
Long-term debt |
86.1 | ||||
|
Other liabilities |
1.3 | ||||
|
Total liabilities |
$ | 145.7 | |||
|
Stockholders' equity |
|||||
|
Retained earnings |
$ | (8.4 | ) | ||
|
Total stockholders' equity |
(8.4 | ) | |||
|
Total liabilities and stockholders' equity |
$ | 137.3 | |||
The preceding tables reflect: (i) the portion of the assets of former QSPEs to which Citigroup, acting as principal, had transferred assets and received sales treatment prior to January 1, 2010 (totaling approximately $712.0 billion), and (ii) the assets of significant VIEs as of January 1, 2010 with which Citigroup is involved (totaling approximately $219.2 billion) that were previously unconsolidated and are required to be consolidated under the new accounting standards. Due to the variety of transaction structures and the level of Citigroup involvement in individual former QSPEs and VIEs, only a portion of the former QSPEs and VIEs with which the Company is involved were required to be consolidated.
In addition, the cumulative effect of adopting these new accounting standards as of January 1, 2010 resulted in an aggregate after-tax charge to Retained earnings of $8.4 billion, reflecting the net effect of an overall pretax charge to Retained earnings (primarily relating to the establishment of loan loss reserves and the reversal of residual interests held) of $13.4 billion and the recognition of related deferred tax assets amounting to $5.0 billion.
The impact on certain of Citigroup's regulatory capital ratios of adopting these new accounting standards, reflecting immediate implementation of the recently issued final risk-based capital rules regarding SFAS 166/167, was as follows:
|
|
As of January 1, 2010 | |||
|---|---|---|---|---|
|
|
Impact | |||
|
Tier 1 Capital |
(141) bps | |||
|
Total Capital |
(142) bps | |||
Non-consolidation of Certain Investment Funds
The FASB issued Accounting Standards Update No. 2010-10, Consolidation (Topic 810), Amendments for Certain Investment Funds (ASU 2010-10) in the first quarter of 2010. ASU 2010-10 provides a deferral to the requirements of SFAS 167 where the following criteria are met:
- (1)
-
The
entity being evaluated for consolidation is an investment company, as defined, or an entity for which it is acceptable based on industry practice to
apply measurement principles that are consistent with an investment company;
- (2)
-
The
reporting enterprise does not have an explicit or implicit obligation to fund losses of the entity that could potentially be significant to the entity;
and
- (3)
-
The
entity being evaluated for consolidation is not:
- •
-
A securitization entity;
- •
-
An asset-backed financing entity;
- •
- An entity that was formerly considered a qualifying special-purpose entity.
The Company has determined that a majority of the investment vehicles managed by Citigroup are provided a deferral from the requirements of SFAS 167, because they meet these criteria. These vehicles continue to be evaluated under the requirements of ASC 810-10, prior to the implementation of SFAS 167 (FIN 46(R)).
Where the Company has determined that certain investment vehicles are subject to the consolidation requirements of SFAS 167, the consolidation conclusions reached upon initial application of SFAS 167 are consistent with the consolidation conclusions reached under the requirements of ASC 810-10, prior to the implementation of SFAS 167.
93
Investments in Certain Entities that Calculate Net Asset Value per Share
As of December 31, 2009, the Company adopted Accounting Standards Update (ASU) No. 2009-12, Investments in Certain Entities that Calculate Net Asset Value per Share (or its Equivalent) , which provides guidance on measuring the fair value of certain alternative investments. The ASU permits entities to use net asset value as a practical expedient to measure the fair value of their investments in certain investment funds. The ASU also requires additional disclosures regarding the nature and risks of such investments and provides guidance on the classification of such investments as Level 2 or Level 3 of the fair value hierarchy. This ASU did not have a material impact on the Company's accounting for its investments in alternative investment funds.
FUTURE APPLICATIONS OF ACCOUNTING STANDARDS
Change in Accounting for Embedded Credit Derivatives
In March 2010, the FASB issued ASU 2010-11, Scope Exception Related to Embedded Credit Derivatives . The ASU clarifies that certain embedded derivatives, such as those contained in certain securitizations, CDOs and structured notes, should be considered embedded credit derivatives subject to potential bifurcation and separate fair value accounting. The ASU allows any beneficial interest issued by a securitization vehicle to be accounted for under the fair value option at transition. At transition, the Company may elect to reclassify various debt securities (on an instrument-by-instrument basis) from held-to-maturity (HTM) or available-for-sale (AFS) to trading. The new rules are effective July 1, 2010. The Company is currently analyzing the impact of the changes to determine the population of instruments that may be reclassified to trading upon adoption.
Loss-Contingency Disclosures
In June 2008, the FASB issued an exposure draft proposing expanded disclosures regarding loss contingencies. This proposal increases the number of loss contingencies subject to disclosure and requires substantial quantitative and qualitative information to be provided about those loss contingencies. The proposal will have no impact on the Company's accounting for loss contingencies.
Investment Company Audit Guide (SOP 07-1)
In July 2007, the AICPA issued Statement of Position 07-1, "Clarification of the Scope of the Audit and Accounting Guide for Investment Companies and Accounting by Parent Companies and Equity Method Investors for Investments in Investment Companies" (SOP 07-1) (now incorporated into ASC 946-10, Financial Services-Investment Companies ), which was expected to be effective for fiscal years beginning on or after December 15, 2007. However, in February 2008, the FASB delayed the effective date indefinitely by issuing an FSP SOP 07-1-1, "Effective Date of AICPA Statement of Position 07-1." This statement sets forth more stringent criteria for qualifying as an investment company than does the predecessor Audit Guide. In addition, ASC 946-10 (SOP 07-1) establishes new criteria for a parent company or equity method investor to retain investment company accounting in their consolidated financial statements. Investment companies record all their investments at fair value with changes in value reflected in earnings. The Company is currently evaluating the potential impact of adopting the SOP.
94
Sale of Nikko Cordial
On October 1, 2009, the Company announced the successful completion of the sale of Nikko Cordial Securities to Sumitomo Mitsui Banking Corporation. The transaction had a total cash value to Citi of 776 billion yen (US$8.7 billion at an exchange rate of 89.60 yen to US$1.00 as of September 30, 2009). The cash value is composed of the purchase price for the transferred business of 545 billion yen, the purchase price for certain Japanese-listed equity securities held by Nikko Cordial Securities of 30 billion yen, and 201 billion yen of excess cash derived through the repayment of outstanding indebtedness to Citi. After considering the impact of foreign exchange hedges of the proceeds of the transaction, the sale resulted in an immaterial gain in 2009. A total of about 7,800 employees are included in the transaction.
The Nikko Cordial operations had total assets and total liabilities of approximately $24 billion and $16 billion, respectively, at the time of sale, which were reflected in Citi Holdings prior to the sale.
Results for all of the Nikko Cordial businesses sold are reported as Discontinued operations for all periods presented.
Summarized financial information for Discontinued operations, including cash flows, related to the sale of Nikko Cordial is as follows:
|
|
Three Months
Ended March 31, |
||||||
|---|---|---|---|---|---|---|---|
| In millions of dollars | 2010 | 2009 | |||||
|
Total revenues, net of interest expense |
$ | 92 | $ | 268 | |||
|
Loss from discontinued operations |
$ | (7 | ) | $ | (134 | ) | |
|
Gain on sale |
94 | — | |||||
|
Benefit for income taxes and noncontrolling interest, net of taxes |
(122 | ) | (50 | ) | |||
|
Income (loss) from discontinued operations, net of taxes |
$ | 209 | $ | (84 | ) | ||
|
|
Three Months
Ended March 31, |
||||||
|---|---|---|---|---|---|---|---|
| In millions of dollars | 2010 | 2009 | |||||
|
Cash flows from operating activities |
$ | (133 | ) | $ | (1,184 | ) | |
|
Cash flows from investing activities |
185 | 1,239 | |||||
|
Cash flows from financing activities |
— | — | |||||
|
Net cash provided by discontinued operations |
$ | 52 | $ | 55 | |||
Sale of Citigroup's German Retail Banking Operations
On December 5, 2008, Citigroup sold its German retail banking operations to Credit Mutuel for 5.2 billion Euros in cash plus the German retail bank's operating net earnings accrued in 2008 through the closing. The sale resulted in an after-tax gain of approximately $3.9 billion including the after-tax gain on the foreign currency hedge of $383 million recognized during the fourth quarter of 2008.
The sale did not include the corporate and investment banking business or the Germany-based European data center. Results for all of the German retail banking businesses sold are reported as Discontinued operations for all periods presented.
Summarized financial information for Discontinued operations, including cash flows, related to the sale of the German retail banking operations is as follows:
|
|
Three Months
Ended March 31, |
||||||
|---|---|---|---|---|---|---|---|
| In millions of dollars | 2010 | 2009 | |||||
|
Total revenues, net of interest expense |
$ | 21 | $ | 6 | |||
|
Income (loss) from discontinued operations |
$ | 3 | $ | (19 | ) | ||
|
Loss on sale |
— | (41 | ) | ||||
|
Provision (benefit) for income taxes and noncontrolling interest, net of taxes |
1 | (7 | ) | ||||
|
Income (loss) from discontinued operations, net of taxes |
$ | 2 | $ | (53 | ) | ||
|
|
Three Months
Ended March 31, |
||||||
|---|---|---|---|---|---|---|---|
| In millions of dollars | 2010 | 2009 | |||||
|
Cash flows from operating activities |
$ | (2 | ) | $ | 19 | ||
|
Cash flows from investing activities |
1 | (10 | ) | ||||
|
Cash flows from financing activities |
1 | (9 | ) | ||||
|
Net cash provided by (used in) discontinued operations |
$ | — | $ | — | |||
CitiCapital
On July 31, 2008, Citigroup sold substantially all of CitiCapital, the equipment finance unit in North America . The total proceeds from the transaction were approximately $12.5 billion and resulted in an after-tax loss to Citigroup of $305 million. This loss is included in Income from discontinued operations on the Company's Consolidated Statement of Income for the second quarter of 2008.
Results for all of the CitiCapital businesses sold are reported as Discontinued operations for all periods presented.
Summarized financial information for Discontinued operations, including cash flows, related to the sale of CitiCapital is as follows:
|
|
Three Months
Ended March 31, |
||||||
|---|---|---|---|---|---|---|---|
| In millions of dollars | 2010 | 2009 | |||||
|
Total revenues, net of interest expense |
$ | 4 | $ | 9 | |||
|
Income (loss) from discontinued operations |
$ | (1 | ) | $ | 1 | ||
|
Gain (loss) on sale |
— | — | |||||
|
(Benefit) for income taxes and noncontrolling interest, net of taxes |
(1 | ) | — | ||||
|
Income from discontinued operations, net of taxes |
$ | — | $ | 1 | |||
|
|
Three Months
Ended March 31, |
||||||
|---|---|---|---|---|---|---|---|
| In millions of dollars | 2010 | 2009 | |||||
|
Cash flows from operating activities |
$ | — | $ | — | |||
|
Cash flows from investing activities |
— | — | |||||
|
Cash flows from financing activities |
— | — | |||||
|
Net cash provided by (used in) discontinued operations |
$ | — | $ | — | |||
95
Combined Results for Discontinued Operations
The following is summarized financial information for the Nikko Cordial business, German retail banking operations and CitiCapital business. Additionally, contingency consideration payments received during the first quarter of 2009 of $29 million pretax ($19 million after-tax) related to the sale of Citigroup's Asset Management business, which was sold in December 2005, is also included in these balances.
|
|
Three Months
Ended March 31, |
||||||
|---|---|---|---|---|---|---|---|
| In millions of dollars | 2010 | 2009 | |||||
|
Total revenues, net of interest expense |
$ | 117 | $ | 283 | |||
|
(Loss) from discontinued operations |
$ | (5 | ) | $ | (152 | ) | |
|
Gain (loss) on sale |
94 | (12 | ) | ||||
|
(Benefit) for income taxes and noncontrolling interest, net of taxes |
(122 | ) | (47 | ) | |||
|
Loss from discontinued operations, net of taxes |
$ | 211 | $ | (117 | ) | ||
Cash flows from discontinued operations
|
|
Three Months
Ended March 31, |
||||||
|---|---|---|---|---|---|---|---|
| In millions of dollars | 2010 | 2009 | |||||
|
Cash flows from operating activities |
$ | (135 | ) | $ | (1,165 | ) | |
|
Cash flows from investing activities |
186 | 1,258 | |||||
|
Cash flows from financing activities |
1 | (9 | ) | ||||
|
Net cash provided by discontinued operations |
$ | 52 | $ | 84 | |||
96
The following table presents certain information regarding the Company's operations by segment:
|
|
Revenues, net
of interest expense(1) |
Provision (benefit)
for income taxes |
Income (loss) from
continuing operations(1)(2) |
Identifiable assets | ||||||||||||||||||||||
|---|---|---|---|---|---|---|---|---|---|---|---|---|---|---|---|---|---|---|---|---|---|---|---|---|---|---|
|
|
Three Months Ended March 31, |
|
|
|||||||||||||||||||||||
|
In millions of dollars, except
identifiable assets in billions |
Mar. 31,
2010 |
Dec. 31,
2009 |
||||||||||||||||||||||||
| 2010 | 2009 | 2010 | 2009 | 2010 | 2009 | |||||||||||||||||||||
|
Regional Consumer Banking |
$ | 8,082 | $ | 6,353 | $ | 227 | $ | 156 | $ | 1,014 | $ | 791 | $ | 313 | $ | 257 | ||||||||||
|
Institutional Clients Group |
10,440 | 14,574 | 1,830 | 3,218 | 4,147 | 7,040 | 923 | 882 | ||||||||||||||||||
|
Subtotal Citicorp |
$ | 18,522 | $ | 20,927 | $ | 2,057 | $ | 3,374 | $ | 5,161 | $ | 7,831 | $ | 1,236 | $ | 1,139 | ||||||||||
|
Citi Holdings |
6,550 | 3,094 | (946 | ) | (3,588 | ) | (876 | ) | (5,485 | ) | 503 | 487 | ||||||||||||||
|
Corporate/Other |
349 | 500 | (75 | ) | 1,049 | (36 | ) | (652 | ) | 263 | 231 | |||||||||||||||
|
Total |
$ | 25,421 | $ | 24,521 | $ | 1,036 | $ | 835 | $ | 4,249 | $ | 1,694 | $ | 2,002 | $ | 1,857 | ||||||||||
- (1)
-
Includes
Citicorp total revenues, net of interest expense, in
North America
of $3.8 billion and
$2.5 billion; in
EMEA
of $405 million and $360 million; in
Latin America
of
$2.1 billion and $1.9 billion; and in
Asia
of $1.8 billion and $1.6 billion for the three months ended March 31, 2010
and 2009, respectively. Regional numbers exclude Citi Holdings and Corporate/Other, which largely operate within the U.S.
- (2)
- Includes pretax provisions (credits) for credit losses and for benefits and claims in the Regional Consumer Banking results of $2.9 billion and $1.9 billion; in the ICG results of $(85) million and $421 million; and in the Citi Holdings results of $5.8 billion and $8.0 billion for the three months ended March 31, 2010 and 2009, respectively.
97
4. INTEREST REVENUE AND EXPENSE
For the three months ended March 31, 2010 and 2009, respectively, interest revenue and expense consisted of the following:
|
|
Three Months
Ended March 31, |
||||||
|---|---|---|---|---|---|---|---|
| In millions of dollars | 2010 | 2009 | |||||
|
Interest revenue |
|||||||
|
Loan interest, including fees |
$ | 14,673 | $ | 12,855 | |||
|
Deposits with banks |
290 | 436 | |||||
|
Federal funds sold and securities purchased under agreements to resell |
752 | 885 | |||||
|
Investments, including dividends |
3,109 | 3,176 | |||||
|
Trading account assets(1) |
1,872 | 2,951 | |||||
|
Other interest |
156 | 280 | |||||
|
Total interest revenue |
$ | 20,852 | $ | 20,583 | |||
|
Interest expense |
|||||||
|
Deposits(2) |
$ | 2,080 | $ | 2,848 | |||
|
Federal funds purchased and securities loaned or sold under agreements to repurchase |
654 | 1,104 | |||||
|
Trading account liabilities(1) |
63 | 108 | |||||
|
Short-term borrowings |
276 | 463 | |||||
|
Long-term debt |
3,218 | 3,134 | |||||
|
Total interest expense |
$ | 6,291 | $ | 7,657 | |||
|
Net interest revenue |
$ | 14,561 | $ | 12,926 | |||
|
Provision for loan losses |
8,366 | 9,915 | |||||
|
Net interest revenue after provision for loan losses |
$ | 6,195 | $ | 3,011 | |||
- (1)
-
Interest
expense on
Trading account liabilities
of
ICG
is
reported as a reduction of interest revenue from
Trading account assets
.
- (2)
- Includes FDIC deposit insurance fees and charges of $223 million and $299 million for the three months ended ended March 31, 2010 and March 31, 2009, respectively.
Commissions and fees revenue includes charges to customers for credit and bank cards, including transaction-processing fees and annual fees; advisory and equity and debt underwriting services; lending and deposit-related transactions, such as loan commitments, standby letters of credit and other deposit and loan servicing activities; investment management-related fees, including brokerage services and custody and trust services; and insurance fees and commissions.
The following table presents commissions and fees revenue for the three months ended March 31:
|
|
Three Months
Ended March 31, |
||||||
|---|---|---|---|---|---|---|---|
| In millions of dollars | 2010 | 2009 | |||||
|
Credit cards and bank cards |
$ | 965 | $ | 977 | |||
|
Investment banking |
845 | 814 | |||||
|
Smith Barney |
— | 515 | |||||
|
ICG trading-related |
453 | 347 | |||||
|
Transaction services |
347 | 316 | |||||
|
Other consumer |
331 | 241 | |||||
|
Checking-related |
273 | 264 | |||||
|
Other ICG |
172 | 150 | |||||
|
Primerica |
91 | 73 | |||||
|
Loan servicing(1) |
254 | 196 | |||||
|
Corporate finance |
96 | 250 | |||||
|
Other |
(67 | ) | 25 | ||||
|
Total commissions and fees |
$ | 3,760 | $ | 4,168 | |||
- (1)
- Includes fair value adjustments on mortgage servicing assets. The mark-to-market on the underlying economic hedges of the MSRs is included in Other revenue.
98
Principal transactions revenue consists of realized and unrealized gains and losses from trading activities. Trading activities include revenues from fixed income, equities, credit and commodities products, as well as foreign exchange transactions. Not included in the table below is the impact of net interest revenue related to trading activities, which is an integral part of trading activities' profitability. The following tables present principal transactions revenue for the three months ended March 31:
|
|
Three Months
Ended March 31, |
|||||||
|---|---|---|---|---|---|---|---|---|
| In millions of dollars | 2010 | 2009 | ||||||
|
Regional Consumer Banking |
$ | 134 | $ | 233 | ||||
|
Institutional Clients Group |
3,344 | 6,950 | ||||||
|
Subtotal Citicorp |
$ | 3,478 | $ | 7,183 | ||||
|
Local Consumer Lending |
(201 | ) | 340 | |||||
|
Brokerage and Asset Management |
(26 | ) | (17 | ) | ||||
|
Special Asset Pool |
1,147 | (4,042 | ) | |||||
|
Subtotal Citi Holdings |
$ | 920 | $ | (3,719 | ) | |||
|
Corporate/Other |
(347 | ) | 206 | |||||
|
Total Citigroup |
$ | 4,051 | $ | 3,670 | ||||
|
|
Three Months
Ended March 31, |
||||||
|---|---|---|---|---|---|---|---|
| In millions of dollars | 2010 | 2009 | |||||
|
Interest rate contracts(1) |
$ | 1,309 | $ | 4,597 | |||
|
Foreign exchange contracts(2) |
241 | 1,006 | |||||
|
Equity contracts(3) |
565 | 1,078 | |||||
|
Commodity and other contracts(4) |
109 | 697 | |||||
|
Credit derivatives(5) |
1,827 | (3,708 | ) | ||||
|
Total Citigroup |
$ | 4,051 | $ | 3,670 | |||
- (1)
-
Includes
revenues from government securities and corporate debt, municipal securities, preferred stock, mortgage securities, and other debt instruments.
Also includes options on fixed income securities, interest rate swaps, swap options, caps and floors, financial futures, OTC options, and forward contracts on fixed income securities.
- (2)
-
Includes
revenues from foreign exchange spot, forward, option and swap contracts, as well as translation gains and losses.
- (3)
-
Includes
revenues from common, preferred and convertible preferred stock, convertible corporate debt, equity-linked notes, and exchange-traded and OTC
equity options and warrants.
- (4)
-
Primarily
includes revenues from crude oil, refined oil products, natural gas, and other commodities trades.
- (5)
- Includes revenues from structured credit products.
99
The Company has several non-contributory defined benefit pension plans covering certain U.S. employees in 2009 and has various defined benefit pension and termination indemnity plans covering employees outside the United States. The U.S. qualified defined benefit plan provides benefits under a cash balance formula. However, employees satisfying certain age and service requirements remain covered by a prior final average pay formula under that plan. Effective January 1, 2008, the U.S. qualified pension plan was frozen for most employees. Accordingly, no additional compensation-based contributions were credited to the cash balance plan for existing plan participants during 2008 or 2009. However, employees still covered under the prior final pay plan will continue to accrue benefits. The Company also offers postretirement health care and life insurance benefits to certain eligible U.S. retired employees, as well as to certain eligible employees outside the United States.
The Patient Protection and Affordable Care Act and the Health Care and Education Reconciliation Act of 2010 (collectively, the "Act") were signed into law in the U.S. in March 2010. One provision of the Act that impacts Citigroup is the elimination of the tax deductibility for benefits paid that are related to the retiree Medicare Part D subsidy starting in 2013. Citigroup is required to recognize the full accounting impact in the period in which the Act is signed, which resulted in a $45 million reduction in deferred tax assets with a corresponding charge to income from continuing operations in the first quarter of 2010. The other provisions of the Act are not expected to have a significant impact on Citigroup's pension and post-retirement plans.
The following tables summarize the components of net (benefit) expense recognized in the Consolidated Statement of Income and the funded status and amounts recognized in the Consolidated Balance Sheet for the Company's U.S. qualified pension plan, postretirement plans and plans outside the United States. The Company uses a December 31 measurement date for the U.S. plans as well as the plans outside the United States.
Net (Benefit) Expense
|
|
Three Months Ended March 31, | |||||||||||||||||||||||||
|---|---|---|---|---|---|---|---|---|---|---|---|---|---|---|---|---|---|---|---|---|---|---|---|---|---|---|
|
|
Pension Plans | Postretirement Benefit Plans | ||||||||||||||||||||||||
|
|
U.S. plans(1) | Non-U.S. plans | U.S. plans | Non-U.S. plans | ||||||||||||||||||||||
| In millions of dollars | 2010 | 2009 | 2010 | 2009 | 2010 | 2009 | 2010 | 2009 | ||||||||||||||||||
|
Benefits earned during the period |
$ | 4 | $ | 6 | $ | 41 | $ | 37 | $ | — | $ | — | $ | 6 | $ | 7 | ||||||||||
|
Interest cost on benefit obligation |
159 | 163 | 84 | 70 | 14 | 15 | 26 | 21 | ||||||||||||||||||
|
Expected return on plan assets |
(211 | ) | (229 | ) | (94 | ) | (78 | ) | (2 | ) | (2 | ) | (25 | ) | (18 | ) | ||||||||||
|
Amortization of unrecognized: |
||||||||||||||||||||||||||
|
Prior service cost (benefit) |
1 | 1 | — | — | — | |||||||||||||||||||||
|
Net actuarial loss |
11 | — | 14 | 15 | 1 | 1 | 5 | 4 | ||||||||||||||||||
|
Net (benefit) expense |
$ | (37 | ) | $ | (59 | ) | $ | 46 | $ | 44 | $ | 13 | $ | 14 | $ | 12 | $ | 14 | ||||||||
- (1)
- The U.S. plans exclude nonqualified pension plans, for which the net expense was $11 million and $10 million for the three months ended March 31, 2010 and 2009, respectively.
Employer Contributions
Citigroup's pension funding policy for U.S. plans and non-U.S. plans is generally to fund to applicable minimum funding requirements, rather than to the amounts of accumulated benefit obligations. For the U.S. plans, the Company may increase its contributions above the minimum required contribution under the Employee Retirement Income Security Act of 1974, as amended, if appropriate to its tax and cash position and the plan's funded position. For the U.S. plans, at March 31, 2010 there were no minimum required cash contributions and no discretionary cash or non-cash contributions are currently planned. For the non-U.S. plans, the Company contributed $60 million during the first quarter of 2010. The Company expects to contribute an additional $98 million to fund its non-U.S. plans in 2010.
100
The following is a reconciliation of the income and share data used in the basic and diluted earnings per share computations for the three months ended March 31:
|
|
Three Months Ended March 31, | ||||||
|---|---|---|---|---|---|---|---|
| In millions, except per-share amounts | 2010 | 2009 | |||||
|
Income before attribution of noncontrolling interests |
$ | 4,249 | $ | 1,694 | |||
|
Noncontrolling interests |
32 | (16 | ) | ||||
|
Net income from continuing operations (for EPS purposes) |
$ | 4,217 | $ | 1,710 | |||
|
Income (loss) from discontinued operations, net of taxes |
211 | (117 | ) | ||||
|
Citigroup's net income (loss) |
$ | 4,428 | $ | 1,593 | |||
|
Preferred dividends |
— | (1,221 | ) | ||||
|
Impact of the conversion price reset related to the $12.5 billion convertible preferred stock private issuance |
— | (1,285 | ) | ||||
|
Preferred stock Series H discount accretion |
— | (53 | ) | ||||
|
Net income (loss) available to common shareholders |
$ | 4,428 | $ | (966 | ) | ||
|
Income allocated to participating securities |
28 | — | |||||
|
Net income (loss) allocated to common shareholders for basic EPS(1) |
$ | 4,400 | $ | (966 | ) | ||
|
Effect of dilutive securities |
— | 270 | |||||
|
Net income (loss) allocated to common shareholders for diluted EPS(1) |
$ | 4,400 | $ | (696 | ) | ||
|
Weighted-average common shares outstanding applicable to basic EPS |
28,444.3 | 5,385.0 | |||||
|
Effect of dilutive securities |
|||||||
|
TDECs |
882.8 | — | |||||
|
Convertible securities |
0.7 | 568.3 | |||||
|
Other employee plans |
5.7 | — | |||||
|
Adjusted weighted-average common shares outstanding applicable to diluted EPS(2) |
29,333.5 | 5,953.3 | |||||
|
Basic earnings per share(3) |
|||||||
|
Income (loss) from continuing operations |
$ | 0.15 | $ | (0.16 | ) | ||
|
Discontinued operations |
0.01 | (0.02 | ) | ||||
|
Net income (loss) |
$ | 0.15 | $ | (0.18 | ) | ||
|
Diluted earnings per share(3) |
|||||||
|
Income (loss) from continuing operations |
$ | 0.14 | $ | (0.16 | ) | ||
|
Discontinued operations |
0.01 | (0.02 | ) | ||||
|
Net income (loss) |
$ | 0.15 | $ | (0.18 | ) | ||
- (1)
-
Due
to the net loss available to common shareholders in 2009, loss available to common shareholders for basic EPS was used to calculate diluted EPS. Adding
back the effect of dilutive securities would result in anti-dilution.
- (2)
-
Due
to the net loss available to common shareholders in 2009, basic shares were used to calculate diluted EPS. Adding dilutive securities to the denominator
would result in anti-dilution.
- (3)
- Due to rounding, earnings per share on continuing operations and discontinued operations may not sum to earnings per share on net income.
During the first three months of 2010 and 2009, weighted-average options to purchase 390.5 million and 121.1 million shares of common stock, respectively, were outstanding but not included in the computation of earnings per common share, because the weighted-average exercise prices of $11.21 and $40.34, respectively, were greater than the average market price of the Company's common stock. In addition, equity awards granted under the Management Committee Long-Term Incentive Plan (MC LTIP) were not included in the 2009 computation of earnings per common share, because the performance targets under the terms of the awards were not met and, as a result, the awards expired in the first quarter of 2010.
Approximately $1.7 billion of Common Stock Equivalent (CSE) awards payable in April 2010 in shares of Citigroup common stock were not included in the computation of earnings per common share, because the awards were anti-dilutive under the treasury stock method. Equity units convertible into approximately 177 million shares of Citigroup common stock held by the Abu Dhabi Investment Authority (ADIA) were not included in the computation of earnings per common share, because the exercise price of $31.83 was greater than the average market price of Citigroup's common stock. Approximately 5 million of other incentive compensation awards were not included in the computation of earnings per common share, because they were anti-dilutive for the periods presented.
101
9. TRADING ACCOUNT ASSETS AND LIABILITIES
Trading account assets and Trading account liabilities , at fair value, consisted of the following at March 31, 2010 and December 31, 2009:
| In millions of dollars |
March 31,
2010 |
December 31,
2009 |
||||||
|---|---|---|---|---|---|---|---|---|
|
Trading account assets |
||||||||
|
Mortgage-backed securities(1) |
||||||||
|
U.S. government sponsored agency guaranteed |
$ | 29,154 | $ | 20,638 | ||||
|
Prime |
1,368 | 1,156 | ||||||
|
Alt-A |
1,364 | 1,229 | ||||||
|
Subprime |
7,148 | 9,734 | ||||||
|
Non-U.S. residential |
2,779 | 2,368 | ||||||
|
Commercial |
3,205 | 3,455 | ||||||
|
Total mortgage-backed securities(1) |
$ | 45,018 | $ | 38,580 | ||||
|
U.S. Treasury and federal agencies |
||||||||
|
U.S. Treasuries |
$ | 27,174 | $ | 28,938 | ||||
|
Agency and direct obligations |
5,248 | 2,041 | ||||||
|
Total U.S. Treasury and federal agencies |
$ | 32,422 | $ | 30,979 | ||||
|
State and municipal securities |
7,672 | $ | 7,147 | |||||
|
Foreign government securities |
86,000 | 72,769 | ||||||
|
Corporate |
56,995 | 51,985 | ||||||
|
Derivatives(2) |
53,710 | 58,879 | ||||||
|
Equity securities |
43,054 | 46,221 | ||||||
|
Asset-backed securities(1) |
5,475 | 4,089 | ||||||
|
Other debt securities |
15,437 | 32,124 | ||||||
|
Total trading account assets |
$ | 345,783 | $ | 342,773 | ||||
|
Trading account liabilities |
||||||||
|
Securities sold, not yet purchased |
$ | 83,134 | $ | 73,406 | ||||
|
Derivatives(2) |
59,614 | 64,106 | ||||||
|
Total trading account liabilities |
$ | 142,748 | $ | 137,512 | ||||
- (1)
-
The
Company invests in mortgage-backed securities and asset-backed securities. Mortgage securitizations are generally considered variable interest entities
(VIEs). The Company's maximum exposure to loss from these VIEs is equal to the carrying amount of the securities, which is reflected in the table above. For mortgage-backed and asset-backed
securitizations in which the Company has other involvement, information is provided in Note 14 to the Consolidated Financial Statements.
- (2)
- Presented net, pursuant to master netting agreements. See Note 15 to the Consolidated Financial Statements for a discussion regarding the accounting and reporting for derivatives.
102
| In millions of dollars |
March 31,
2010 |
December 31,
2009 |
|||||
|---|---|---|---|---|---|---|---|
|
Securities available-for-sale |
$ | 253,367 | $ | 239,599 | |||
|
Debt securities held-to-maturity(1) |
46,348 | 51,527 | |||||
|
Non-marketable equity securities carried at fair value(2) |
8,771 | 6,830 | |||||
|
Non-marketable equity securities carried at cost(3) |
8,247 | 8,163 | |||||
|
Total investments |
$ | 316,733 | $ | 306,119 | |||
- (1)
-
Recorded
at amortized cost, less credit-related impairment.
- (2)
-
Unrealized
gains and losses for non-marketable equity securities carried at fair value are recognized in earnings.
- (3)
- Non-marketable equity securities carried at cost primarily consist of shares issued by the Federal Reserve Bank, Federal Home Loan Bank, foreign central banks and various clearing houses of which Citigroup is a member.
Securities Available-for-Sale
The amortized cost and fair value of securities available-for-sale at March 31, 2010 and December 31, 2009 were as follows:
|
|
March 31, 2010 | December 31, 2009 | |||||||||||||||||||||||
|---|---|---|---|---|---|---|---|---|---|---|---|---|---|---|---|---|---|---|---|---|---|---|---|---|---|
|
In millions of dollars
|
Amortized
cost |
Gross
unrealized gains |
Gross
unrealized losses |
Fair
value |
Amortized
cost |
Gross
unrealized gains |
Gross
unrealized losses |
Fair
value |
|||||||||||||||||
|
Debt securities available-for-sale |
|||||||||||||||||||||||||
|
Mortgage-backed securities(1) |
|||||||||||||||||||||||||
|
U.S. government-agency guaranteed |
$ | 20,075 | $ | 407 | $ | 25 | $ | 20,457 | $ | 20,625 | $ | 339 | $ | 50 | $ | 20,914 | |||||||||
|
Prime |
6,749 | 13 | 884 | 5,878 | 7,291 | 119 | 932 | 6,478 | |||||||||||||||||
|
Alt-A |
248 | 5 | 1 | 252 | 538 | 93 | 4 | 627 | |||||||||||||||||
|
Subprime |
1 | — | — | 1 | 1 | — | — | 1 | |||||||||||||||||
|
Non-U.S. residential |
202 | 2 | — | 204 | 258 | — | 3 | 255 | |||||||||||||||||
|
Commercial |
635 | 16 | 65 | 586 | 883 | 10 | 100 | 793 | |||||||||||||||||
|
Total mortgage-backed securities |
$ | 27,910 | $ | 443 | $ | 975 | $ | 27,378 | $ | 29,596 | $ | 561 | $ | 1,089 | $ | 29,068 | |||||||||
|
U.S. Treasury and federal agency securities |
|||||||||||||||||||||||||
|
U.S. Treasury |
31,857 | 41 | 155 | 31,743 | 26,857 | 36 | 331 | 26,562 | |||||||||||||||||
|
Agency obligations |
35,761 | 80 | 85 | 35,756 | 27,714 | 46 | 208 | 27,552 | |||||||||||||||||
|
Total U.S. Treasury and federal agency securities |
$ | 67,618 | $ | 121 | $ | 240 | $ | 67,499 | $ | 54,571 | $ | 82 | $ | 539 | $ | 54,114 | |||||||||
|
State and municipal |
16,531 | 114 | 1,300 | 15,345 | 16,677 | 147 | 1,214 | 15,610 | |||||||||||||||||
|
Foreign government |
106,226 | 1,227 | 181 | 107,272 | 101,987 | 860 | 328 | 102,519 | |||||||||||||||||
|
Corporate |
16,798 | 367 | 79 | 17,086 | 20,024 | 435 | 146 | 20,313 | |||||||||||||||||
|
Asset-backed securities(1) |
10,310 | 61 | 88 | 10,283 | 10,089 | 50 | 93 | 10,046 | |||||||||||||||||
|
Other debt securities |
2,614 | 28 | 69 | 2,573 | 2,179 | 21 | 77 | 2,123 | |||||||||||||||||
|
Total debt securities available- for-sale |
$ | 248,007 | $ | 2,361 | $ | 2,932 | $ | 247,436 | $ | 235,123 | $ | 2,156 | $ | 3,486 | $ | 233,793 | |||||||||
|
Marketable equity securities available-for-sale |
$ | 4,164 | $ | 1,993 | $ | 226 | $ | 5,931 | $ | 4,089 | $ | 1,929 | $ | 212 | $ | 5,806 | |||||||||
|
Total securities available-for-sale |
$ | 252,171 | $ | 4,354 | $ | 3,158 | $ | 253,367 | $ | 239,212 | $ | 4,085 | $ | 3,698 | $ | 239,599 | |||||||||
- (1)
- The Company invests in mortgage-backed and asset-backed securities. These securitizations are generally considered variable interest entities (VIEs). The Company's maximum exposure to loss from these VIEs is equal to the carrying amount of the securities, which is reflected in the table above. For mortgage-backed and asset-backed securitizations in which the Company has other involvement, information is provided in Note 14 to the Consolidated Financial Statements.
As discussed in more detail below, the Company conducts and documents periodic reviews of all securities with unrealized losses to evaluate whether the impairment is other than temporary. Any credit-related impairment related to debt securities the Company does not plan to sell and is not likely to be required to sell is recognized in the Consolidated Statement of Income, with the non-credit-related impairment recognized in OCI. For other impaired debt securities, the entire impairment is recognized in the Consolidated Statement of Income.
103
The table below shows the fair value of investments in available-for-sale securities that have been in an unrealized loss position for less than 12 months or for 12 months or longer as of March 31, 2010 and December 31, 2009:
|
|
Less than 12 months | 12 months or longer | Total | ||||||||||||||||
|---|---|---|---|---|---|---|---|---|---|---|---|---|---|---|---|---|---|---|---|
| In millions of dollars |
Fair
value |
Gross
unrealized losses |
Fair
value |
Gross
unrealized losses |
Fair
value |
Gross
unrealized losses |
|||||||||||||
|
March 31, 2010 |
|||||||||||||||||||
|
Securities available-for-sale |
|||||||||||||||||||
|
Mortgage-backed securities |
|||||||||||||||||||
|
U.S. government-agency guaranteed |
$ | 2,301 | $ | 25 | $ | 38 | $ | — | $ | 2,339 | $ | 25 | |||||||
|
Prime |
4,810 | 875 | 439 | 9 | 5,249 | 884 | |||||||||||||
|
Alt-A |
4 | — | 155 | 1 | 159 | 1 | |||||||||||||
|
Subprime |
— | — | — | — | — | — | |||||||||||||
|
Non-U.S. residential |
— | — | — | — | — | — | |||||||||||||
|
Commercial |
102 | 25 | 45 | 40 | 147 | 65 | |||||||||||||
|
Total mortgage-backed securities |
$ | 7,217 | $ | 925 | $ | 677 | $ | 50 | $ | 7,894 | $ | 975 | |||||||
|
U.S. Treasury and federal agency securities |
|||||||||||||||||||
|
U.S. Treasury |
23,957 | 110 | 359 | 45 | 24,316 | 155 | |||||||||||||
|
Agency obligations |
15,159 | 85 | 1 | — | 15,160 | 85 | |||||||||||||
|
Total U.S. Treasury and federal agency securities |
$ | 39,116 | $ | 195 | $ | 360 | $ | 45 | $ | 39,476 | $ | 240 | |||||||
|
State and municipal |
1,253 | 106 | 10,277 | 1,194 | 11,530 | 1,300 | |||||||||||||
|
Foreign government |
16,643 | 73 | 3,857 | 108 | 20,500 | 181 | |||||||||||||
|
Corporate |
3,119 | 33 | 727 | 46 | 3,846 | 79 | |||||||||||||
|
Asset-backed securities |
188 | 8 | 1,088 | 80 | 1,276 | 88 | |||||||||||||
|
Other debt securities |
— | 1 | 362 | 68 | 362 | 69 | |||||||||||||
|
Marketable equity securities available-for-sale |
79 | 2 | 2,386 | 224 | 2,465 | 226 | |||||||||||||
|
Total securities available-for-sale |
$ | 67,615 | $ | 1,343 | $ | 19,734 | $ | 1,815 | $ | 87,349 | $ | 3,158 | |||||||
|
December 31, 2009 |
|||||||||||||||||||
|
Securities available-for-sale |
|||||||||||||||||||
|
Mortgage-backed securities |
|||||||||||||||||||
|
U.S. government-agency guaranteed |
$ | 6,793 | $ | 47 | $ | 263 | $ | 3 | $ | 7,056 | $ | 50 | |||||||
|
Prime |
5,074 | 905 | 228 | 27 | 5,302 | 932 | |||||||||||||
|
Alt-A |
106 | — | 35 | 4 | 141 | 4 | |||||||||||||
|
Subprime |
— | — | — | — | — | — | |||||||||||||
|
Non-U.S. residential |
250 | 3 | — | — | 250 | 3 | |||||||||||||
|
Commercial |
93 | 2 | 259 | 98 | 352 | 100 | |||||||||||||
|
Total mortgage-backed securities |
$ | 12,316 | $ | 957 | $ | 785 | $ | 132 | $ | 13,101 | $ | 1,089 | |||||||
|
U.S. Treasury and federal agency securities |
|||||||||||||||||||
|
U.S. Treasury |
23,378 | 224 | 308 | 107 | 23,686 | 331 | |||||||||||||
|
Agency obligations |
17,957 | 208 | 7 | — | 17,964 | 208 | |||||||||||||
|
Total U.S. Treasury and federal agency securities |
$ | 41,335 | $ | 432 | $ | 315 | $ | 107 | $ | 41,650 | $ | 539 | |||||||
|
State and municipal |
754 | 97 | 10,630 | 1,117 | 11,384 | 1,214 | |||||||||||||
|
Foreign government |
39,241 | 217 | 10,398 | 111 | 49,639 | 328 | |||||||||||||
|
Corporate |
1,165 | 47 | 907 | 99 | 2,072 | 146 | |||||||||||||
|
Asset-backed securities |
627 | 4 | 986 | 89 | 1,613 | 93 | |||||||||||||
|
Other debt securities |
28 | 2 | 647 | 75 | 675 | 77 | |||||||||||||
|
Marketable equity securities available-for-sale |
102 | 4 | 2,526 | 208 | 2,628 | 212 | |||||||||||||
|
Total securities available-for-sale |
$ | 95,568 | $ | 1,760 | $ | 27,194 | $ | 1,938 | $ | 122,762 | $ | 3,698 | |||||||
104
The following table presents the amortized cost and fair value of debt securities available-for-sale by contractual maturity dates as of March 31, 2010 and December 31, 2009:
|
|
March 31, 2010 | December 31, 2009 | |||||||||||
|---|---|---|---|---|---|---|---|---|---|---|---|---|---|
| In millions of dollars |
Amortized
cost |
Fair
value |
Amortized
cost |
Fair
value |
|||||||||
|
Mortgage-backed securities(1) |
|||||||||||||
|
Due within 1 year |
$ | 6 | $ | 5 | $ | 2 | $ | 3 | |||||
|
After 1 but within 5 years |
10 | 10 | 16 | 16 | |||||||||
|
After 5 but within 10 years |
544 | 527 | 626 | 597 | |||||||||
|
After 10 years(2) |
27,350 | 26,836 | 28,952 | 28,452 | |||||||||
|
Total |
$ | 27,910 | $ | 27,378 | $ | 29,596 | $ | 29,068 | |||||
|
U.S. Treasury and federal agencies |
|||||||||||||
|
Due within 1 year |
$ | 6,350 | $ | 6,347 | $ | 5,357 | $ | 5,366 | |||||
|
After 1 but within 5 years |
48,381 | 48,308 | 35,912 | 35,618 | |||||||||
|
After 5 but within 10 years |
9,506 | 9,509 | 8,815 | 8,773 | |||||||||
|
After 10 years(2) |
3,381 | 3,335 | 4,487 | 4,357 | |||||||||
|
Total |
$ | 67,618 | $ | 67,499 | $ | 54,571 | $ | 54,114 | |||||
|
State and municipal |
|||||||||||||
|
Due within 1 year |
$ | 15 | $ | 15 | $ | 7 | $ | 8 | |||||
|
After 1 but within 5 years |
125 | 131 | 119 | 129 | |||||||||
|
After 5 but within 10 years |
282 | 286 | 340 | 359 | |||||||||
|
After 10 years(2) |
16,109 | 14,913 | 16,211 | 15,114 | |||||||||
|
Total |
$ | 16,531 | $ | 15,345 | $ | 16,677 | $ | 15,610 | |||||
|
Foreign government |
|||||||||||||
|
Due within 1 year |
$ | 32,367 | $ | 32,507 | $ | 32,223 | $ | 32,365 | |||||
|
After 1 but within 5 years |
62,549 | 63,173 | 61,165 | 61,426 | |||||||||
|
After 5 but within 10 years |
10,308 | 10,459 | 7,844 | 7,845 | |||||||||
|
After 10 years(2) |
1,002 | 1,133 | 755 | 883 | |||||||||
|
Total |
$ | 106,226 | $ | 107,272 | $ | 101,987 | $ | 102,519 | |||||
|
All other(3) |
|||||||||||||
|
Due within 1 year |
$ | 3,662 | $ | 3,658 | $ | 4,243 | $ | 4,244 | |||||
|
After 1 but within 5 years |
12,901 | 13,079 | 14,286 | 14,494 | |||||||||
|
After 5 but within 10 years |
8,648 | 8,721 | 9,483 | 9,597 | |||||||||
|
After 10 years(2) |
4,511 | 4,484 | 4,280 | 4,147 | |||||||||
|
Total |
$ | 29,722 | $ | 29,942 | $ | 32,292 | $ | 32,482 | |||||
|
Total debt securities available-for-sale |
$ | 248,007 | $ | 247,436 | $ | 235,123 | $ | 233,793 | |||||
- (1)
-
Includes
mortgage-backed securities of U.S. federal agencies.
- (2)
-
Investments
with no stated maturities are included as contractual maturities of greater than 10 years. Actual maturities may differ due to call or
prepayment rights.
- (3)
- Includes corporate securities and other debt securities.
The following table presents interest and dividends on investments for the quarter ended March 31, 2010 and 2009:
|
|
Three months ended | ||||||
|---|---|---|---|---|---|---|---|
| In millions of dollars |
March 31,
2010 |
March 31,
2009 |
|||||
|
Taxable interest |
$ | 2,868 | $ | 3,013 | |||
|
Interest exempt from U.S. federal income tax |
173 | 118 | |||||
|
Dividends |
68 | 45 | |||||
|
Total interest and dividends |
$ | 3,109 | $ | 3,176 | |||
The following table presents realized gains and losses on investments for the quarters ended March 31, 2010 and 2009.
The gross realized investment losses exclude losses from other-than-temporary impairment:
|
|
Three months ended | ||||||
|---|---|---|---|---|---|---|---|
| In millions of dollars |
March 31,
2010 |
March31,
2009 |
|||||
|
Gross realized investment gains |
$ | 593 | $ | 781 | |||
|
Gross realized investment losses(1) |
(55 | ) | (24 | ) | |||
|
Net realized gains |
$ | 538 | $ | 757 | |||
- (1)
- During the first quarter of 2010, the Company sold four corporate debt securities that were classified as held-to-maturity. These sales were in response to a significant deterioration in the creditworthiness of the issuers. The securities sold had a carrying value of $413 million, and the Company recorded a realized loss of $49 million.
105
Debt Securities Held-to-Maturity
The carrying value and fair value of securities held-to-maturity (HTM) at March 31, 2010 and December 31, 2009 were as follows:
| In millions of dollars |
Amortized
cost(1) |
Net unrealized
loss recognized in AOCI |
Carrying
value(2) |
Gross
unrecognized gains |
Gross
unrecognized losses |
Fair
value |
||||||||||||||
|---|---|---|---|---|---|---|---|---|---|---|---|---|---|---|---|---|---|---|---|---|
|
March 31, 2010 |
||||||||||||||||||||
|
Debt securities held-to-maturity(3) |
||||||||||||||||||||
|
Mortgage-backed securities |
||||||||||||||||||||
|
Prime |
$ | 5,818 | $ | 1,011 | $ | 4,807 | $ | 311 | $ | 6 | $ | 5,112 | ||||||||
|
Alt-A |
14,055 | 3,779 | 10,276 | 375 | 237 | 10,414 | ||||||||||||||
|
Subprime |
1,028 | 133 | 895 | 23 | 100 | 818 | ||||||||||||||
|
Non-U.S. residential |
8,016 | 989 | 7,027 | 527 | 76 | 7,478 | ||||||||||||||
|
Commercial |
1,227 | 38 | 1,189 | 11 | 172 | 1,028 | ||||||||||||||
|
Total mortgage-backed securities |
$ | 30,144 | $ | 5,950 | $ | 24,194 | $ | 1,247 | $ | 591 | $ | 24,850 | ||||||||
|
U.S. Treasury and federal agency securities |
— | — | — | — | — | — | ||||||||||||||
|
Total U.S. Treasury and federal agency securities |
$ | — | $ | — | $ | — | $ | — | $ | — | $ | — | ||||||||
|
State and municipal |
2,974 | 144 | 2,830 | 109 | 86 | 2,853 | ||||||||||||||
|
Corporate |
6,867 | 226 | 6,641 | 659 | 29 | 7,271 | ||||||||||||||
|
Asset-backed securities(3) |
13,081 | 398 | 12,683 | 371 | 383 | 12,671 | ||||||||||||||
|
Other debt securities |
— | — | — | — | — | — | ||||||||||||||
|
Total debt securities held-to-maturity |
$ | 53,066 | $ | 6,718 | $ | 46,348 | $ | 2,386 | $ | 1,089 | $ | 47,645 | ||||||||
|
December 31, 2009 |
||||||||||||||||||||
|
Debt securities held-to-maturity(3) |
||||||||||||||||||||
|
Mortgage-backed securities |
||||||||||||||||||||
|
Prime |
$ | 6,118 | $ | 1,151 | $ | 4,967 | $ | 317 | $ | 5 | $ | 5,279 | ||||||||
|
Alt-A |
14,710 | 4,276 | 10,434 | 905 | 243 | 11,096 | ||||||||||||||
|
Subprime |
1,087 | 128 | 959 | 77 | 100 | 936 | ||||||||||||||
|
Non-U.S. residential |
9,002 | 1,119 | 7,883 | 469 | 134 | 8,218 | ||||||||||||||
|
Commercial |
1,303 | 45 | 1,258 | 1 | 208 | 1,051 | ||||||||||||||
|
Total mortgage-backed securities |
$ | 32,220 | $ | 6,719 | $ | 25,501 | $ | 1,769 | $ | 690 | $ | 26,580 | ||||||||
|
U.S. Treasury and federal agency securities |
— | — | — | — | — | — | ||||||||||||||
|
Total U.S. Treasury and federal agency securities |
$ | — | $ | — | $ | — | $ | — | $ | — | $ | — | ||||||||
|
State and municipal |
3,067 | 147 | 2,920 | 92 | 113 | 2,899 | ||||||||||||||
|
Corporate |
7,457 | 264 | 7,193 | 524 | 182 | 7,535 | ||||||||||||||
|
Asset-backed securities(3) |
16,348 | 435 | 15,913 | 567 | 496 | 15,984 | ||||||||||||||
|
Other debt securities |
— | — | — | — | — | — | ||||||||||||||
|
Total debt securities held-to-maturity |
$ | 59,092 | $ | 7,565 | $ | 51,527 | $ | 2,952 | $ | 1,481 | $ | 52,998 | ||||||||
- (1)
-
For
securities transferred to HTM from
Trading account assets
, amortized cost is defined as the fair value
amount of the securities at the date of transfer plus any accretion income and less any impairments recognized in earnings subsequent to transfer. For securities transferred to HTM from AFS, amortized
cost is defined as the original purchase cost, plus or minus any accretion or amortization of a purchase discount or premium, less any impairment previously recognized in earnings.
- (2)
-
HTM
securities are carried on the Consolidated Balance Sheet at amortized cost and the changes in the value of these securities, other than impairment
charges, are not reported on the financial statements.
- (3)
- The Company invests in mortgage-backed and asset-backed securities. These securitizations are generally considered variable interest entities (VIEs). The Company's maximum exposure to loss from these VIEs is equal to the carrying amount of the securities, which is reflected in the table above. For mortgage-backed and asset-backed securitizations in which the Company has other involvement, information is provided in Note 14 to the Consolidated Financial Statements.
The net unrealized losses classified in Accumulated other comprehensive income (AOCI) relate to debt securities reclassified from AFS investments to HTM investments. Additionally, for HTM securities that have suffered credit impairment, declines in fair value for reasons other than credit losses are recorded in AOCI. The AOCI balance was $6.7 billion as of March 31, 2010, compared to $7.6 billion as of December 31, 2009. The AOCI balance for HTM securities is amortized over the remaining life of the related securities as an adjustment of yield in a manner consistent with the accretion of discount on the same debt securities. This will have no impact on the Company's net income because the amortization of the unrealized holding loss reported in equity will offset the effect on interest income of the accretion of the discount on these securities.
The credit-related impairment on HTM securities is recognized in earnings.
106
The table below shows the fair value of investments in HTM that have been in an unrecognized loss position for less than 12 months or for 12 months or longer as of March 31, 2010 and December 31, 2009:
|
|
Less than 12 months | 12 months or longer | Total | ||||||||||||||||
|---|---|---|---|---|---|---|---|---|---|---|---|---|---|---|---|---|---|---|---|
| In millions of dollars |
Fair
value |
Gross
unrecognized losses |
Fair
value |
Gross
unrecognized losses |
Fair
value |
Gross
unrecognized losses |
|||||||||||||
|
March 31, 2010 |
|||||||||||||||||||
|
Debt securities held-to-maturity |
|||||||||||||||||||
|
Mortgage-backed securities |
$ | 91 | $ | 43 | $ | 15,328 | $ | 548 | $ | 15,419 | $ | 591 | |||||||
|
State and municipal |
569 | 50 | 577 | 36 | 1,146 | 86 | |||||||||||||
|
Corporate |
— | — | 988 | 29 | 988 | 29 | |||||||||||||
|
Asset-backed securities |
— | — | 4,114 | 383 | 4,114 | 383 | |||||||||||||
|
Other debt securities |
— | — | — | — | — | — | |||||||||||||
|
Total debt securities held-to-maturity |
$ | 660 | $ | 93 | $ | 21,007 | $ | 996 | $ | 21,667 | $ | 1,089 | |||||||
|
December 31, 2009 |
|||||||||||||||||||
|
Debt securities held-to-maturity |
|||||||||||||||||||
|
Mortgage-backed securities |
$ | — | $ | — | $ | 16,923 | $ | 690 | $ | 16,923 | $ | 690 | |||||||
|
State and municipal |
755 | 79 | 713 | 34 | 1,468 | 113 | |||||||||||||
|
Corporate |
— | — | 1,519 | 182 | 1,519 | 182 | |||||||||||||
|
Asset-backed securities |
348 | 18 | 5,460 | 478 | 5,808 | 496 | |||||||||||||
|
Other debt securities |
— | — | — | — | — | — | |||||||||||||
|
Total debt securities held-to-maturity |
$ | 1,103 | $ | 97 | $ | 24,615 | $ | 1,384 | $ | 25,718 | $ | 1,481 | |||||||
Excluded from the gross unrecognized losses presented in the above table are the $6.7 billion and $7.6 billion of gross unrealized losses recorded in AOCI mainly related to the HTM securities that were reclassified from AFS investments as of March 31, 2010 and December 31, 2009, respectively. Virtually all of these unrealized losses relate to securities that have been in a loss position for 12 months or longer at both March 31, 2010 and December 31, 2009.
The following table presents the carrying value and fair value of HTM debt securities by contractual maturity dates as of March 31, 2010 and December 31, 2009:
|
|
March 31, 2010 | December 31, 2009 | |||||||||||
|---|---|---|---|---|---|---|---|---|---|---|---|---|---|
| In millions of dollars |
Carrying
value |
Fair
value |
Carrying
value |
Fair
value |
|||||||||
|
Mortgage-backed securities |
|||||||||||||
|
Due within 1 year |
$ | — | $ | — | $ | 1 | $ | 1 | |||||
|
After 1 but within 5 years |
629 | 540 | 466 | 385 | |||||||||
|
After 5 but within 10 years |
618 | 542 | 697 | 605 | |||||||||
|
After 10 years(1) |
22,947 | 23,768 | 24,337 | 25,589 | |||||||||
|
Total |
$ | 24,194 | $ | 24,850 | $ | 25,501 | $ | 26,580 | |||||
|
State and municipal |
|||||||||||||
|
Due within 1 year |
$ | 14 | $ | 14 | $ | 6 | $ | 6 | |||||
|
After 1 but within 5 years |
39 | 64 | 53 | 79 | |||||||||
|
After 5 but within 10 years |
88 | 88 | 99 | 99 | |||||||||
|
After 10 years(1) |
2,689 | 2,687 | 2,762 | 2,715 | |||||||||
|
Total |
$ | 2,830 | $ | 2,853 | $ | 2,920 | $ | 2,899 | |||||
|
All other(2) |
|||||||||||||
|
Due within 1 year |
$ | 2,835 | $ | 2,856 | $ | 4,652 | $ | 4,875 | |||||
|
After 1 but within 5 years |
2,741 | 2,865 | 3,795 | 3,858 | |||||||||
|
After 5 but within 10 years |
6,113 | 6,660 | 6,240 | 6,526 | |||||||||
|
After 10 years(1) |
7,635 | 7,561 | 8,419 | 8,260 | |||||||||
|
Total |
$ | 19,324 | $ | 19,942 | $ | 23,106 | $ | 23,519 | |||||
|
Total debt securities held-to-maturity |
$ | 46,348 | $ | 47,645 | $ | 51,527 | $ | 52,998 | |||||
- (1)
-
Investments
with no stated maturities are included as contractual maturities of greater than 10 years. Actual maturities may differ due to call or
prepayment rights.
- (2)
- Includes asset-backed securities and all other debt securities.
107
Evaluating Investments for Other-Than-Temporary Impairments
The Company conducts and documents periodic reviews of all securities with unrealized losses to evaluate whether the impairment is other than temporary. Prior to January 1, 2009, these reviews were conducted pursuant to FASB Staff Position No. FAS 115-1, The Meaning of Other-Than-Temporary Impairment and its Application to Certain Investments (now incorporated into ASC 320-10-35, Investments—Debt and Equity Securities—Subsequent Measurement ). Any unrealized loss identified as other than temporary was recorded directly in the Consolidated Statement of Income. As of January 1, 2009, the Company adopted FSP FAS 115-2 and FAS 124-2 (now incorporated into ASC 320-10-35-34, Investments—Debt and Equity Securities: Recognition of an Other-Than-Temporary Impairment ). This guidance amends the impairment model for debt securities; the impairment model for equity securities was not affected.
Under the new guidance for debt securities, other-than-temporary impairment is recognized in earnings for debt securities which the Company has an intent to sell or which the Company believes it is more-likely-than-not that it will be required to sell prior to recovery of the amortized cost basis. For those securities which the Company does not intend to sell or expect to be required to sell, credit-related impairment is recognized in earnings, with the non-credit-related impairment recorded in AOCI.
An unrealized loss exists when the current fair value of an individual security is less than its amortized cost basis. Unrealized losses that are determined to be temporary in nature are recorded, net of tax, in AOCI for AFS securities, while such losses related to HTM securities are not recorded, as these investments are carried at their amortized cost. For securities transferred to HTM from Trading account assets , amortized cost is defined as the fair value of the securities at the date of transfer, plus any accretion income and less any impairment recognized in earnings subsequent to transfer. For securities transferred to HTM from AFS, amortized cost is defined as the original purchase cost, plus or minus any accretion or amortization of a purchase discount or premium, less any impairment recognized in earnings subsequent to transfer.
Regardless of the classification of the securities as AFS or HTM, the Company has assessed each position for impairment.
Factors considered in determining whether a loss is temporary include:
- •
-
the length of time and the extent to which fair value has been below cost;
- •
-
the severity of the impairment;
- •
-
the cause of the impairment and the financial condition and near-term prospects of the issuer;
- •
-
activity in the market of the issuer which may indicate adverse credit conditions; and
- •
- the Company's ability and intent to hold the investment for a period of time sufficient to allow for any anticipated recovery.
The Company's review for impairment generally entails:
- •
-
identification and evaluation of investments that have indications of possible impairment;
- •
-
analysis of individual investments that have fair values less than amortized cost, including consideration of the length
of time the investment has been in an unrealized loss position and the expected recovery period;
- •
-
discussion of evidential matter, including an evaluation of factors or triggers that could cause individual investments to
qualify as having other-than-temporary impairment and those that would not support other-than-temporary impairment; and
- •
- documentation of the results of these analyses, as required under business policies.
For equity securities, management considers the various factors described above, including its intent and ability to hold the equity security for a period of time sufficient for recovery to amortized cost. Where management lacks that intent or ability, the security's decline in fair value is deemed to be other than temporary and is recorded in earnings. AFS equity securities deemed other-than-temporarily impaired are written down to fair value, with the full difference between fair value and amortized cost recognized in earnings.
For debt securities that are not deemed to be credit impaired, management assesses whether it intends to sell or whether it is more-likely-than-not that it would be required to sell the investment before the expected recovery of the amortized cost basis. In most cases, management has asserted that it has no intent to sell and that it believes it is not likely to be required to sell the investment before recovery of its amortized cost basis. Where such an assertion has not been made, the security's decline in fair value is deemed to be other than temporary and is recorded in earnings.
For debt securities, a critical component of the evaluation for other-than-temporary impairment is the identification of credit impaired securities, where management does not expect to receive cash flows sufficient to recover the entire amortized cost basis of the security. For securities purchased and classified as AFS with the expectation of receiving full principal and interest cash flows, this analysis considers the likelihood of receiving all contractual principal and interest. For securities reclassified out of the trading category in the fourth quarter of 2008, the analysis considered the likelihood of receiving the expected principal and interest cash flows anticipated as of the date of reclassification in the fourth quarter of 2008. The extent of the Company's analysis regarding credit quality and the stress on assumptions used in the analysis have been refined for securities where the current fair value or other characteristics of the security warrant. The paragraphs below describe the Company's process for identifying credit impairment in security types with the most significant unrealized losses as of March 31, 2010.
108
Mortgage-backed securities
For U.S. mortgage-backed securities (and in particular for Alt-A and other mortgage-backed securities that have significant unrealized losses as a percentage of amortized cost), credit impairment is assessed using a cash flow model that estimates the cash flows on the underlying mortgages, using the security-specific collateral and transaction structure. The model estimates cash flows from the underlying mortgage loans and distributes those cash flows to various tranches of securities, considering the transaction structure and any subordination and credit enhancements that exist in that structure. The cash flow model incorporates actual cash flows on the mortgage-backed securities through the current period and then projects the remaining cash flows using a number of assumptions, including default rates, prepayment rates, and recovery rates (on foreclosed properties).
Management develops specific assumptions using as much market data as possible and includes internal estimates as well as estimates published by rating agencies and other third-party sources. Default rates are projected by considering current underlying mortgage loan performance, generally assuming the default of (1) 10% of current loans, (2) 25% of 30-59 day delinquent loans, (3) 70% of 60-90 day delinquent loans and (4) 100% of 91+ day delinquent loans. These estimates are extrapolated along a default timing curve to estimate the total lifetime pool default rate. Other assumptions used contemplate the actual collateral attributes, including geographic concentrations, rating agency loss projections, rating actions and current market prices.
The key assumptions for mortgage-backed securities as of March 31, 2010 are in the table below:
|
|
March 31, 2010 | |||
|---|---|---|---|---|
|
Prepayment rate |
3-8 CRR | |||
|
Loss severity(1) |
45%-75% | |||
|
Unemployment rate |
9.8% | |||
- (1)
- Loss severity rates are estimated considering collateral characteristics and generally range from 45%-55% for prime bonds, 50%-75% for Alt-A bonds, and 65%-75% for subprime bonds.
The valuation as of March 31, 2010 assumes that U.S. housing prices are unchanged for the remainder of 2010, increase 0.6% in 2011, increase 1.4% in 2012, increase 2.2% in 2013 and increase 3% per year from 2014 onwards.
In addition, cash flow projections are developed using more stressful parameters, and management assesses the results of those stress tests (including the severity of any cash shortfall indicated and the likelihood of the stress scenarios actually occurring based on the underlying pool's characteristics and performance) to assess whether management expects to recover the amortized cost basis of the security. If cash flow projections indicate that the Company does not expect to recover its amortized cost basis, the Company recognizes the estimated credit loss in earnings.
State and municipal securities
Citigroup's AFS state and municipal bonds consist mainly of bonds that are financed through Tender Option Bond programs. The process for identifying credit impairment for bonds in this program as well as for bonds that were previously financed in this program is largely based on third-party credit ratings. Individual bond positions must meet minimum ratings requirements, which vary based on the sector of the bond issuer. The average portfolio rating, ignoring any insurance, is Aa3/AA-.
Citigroup monitors the bond issuer and insurer ratings on a daily basis. In the event of a downgrade of the bond below the Aa3/AA-, the subject bond is specifically reviewed for potential shortfall in contractual principal and interest. Citigroup has not recorded any credit impairments on bonds held as part of the Tender Option Bond program or on bonds that were previously held as part of the Tender Option Bond program.
The remainder of Citigroup's AFS state and municipal bonds, outside of the above, are specifically reviewed for credit impairment based on instrument-specific estimates of cash flows, probability of default and loss given default.
Recognition and Measurement of Other-Than-Temporary Impairment
The following table presents the total other-than-temporary impairments recognized during the 3 months ended March 31, 2010:
| Other-Than-Temporary Impairments (OTTI) on Investments | Three months ended March 31, 2010 | |||||||||
|---|---|---|---|---|---|---|---|---|---|---|
| In millions of dollars | AFS | HTM | Total | |||||||
|
Impairment losses related to securities that the Company does not intend to sell nor will likely be required to sell |
||||||||||
|
Total OTTI losses recognized during the three months ended March 31, 2010 |
$ | 197 | $ | 332 | $ | 529 | ||||
|
Less: portion of OTTI loss recognized in AOCI (before taxes) |
3 | 40 | 43 | |||||||
|
Net impairment losses recognized in earnings for securities that the Company does not intend to sell nor will likely be required to sell |
$ | 194 | $ | 292 | $ | 486 | ||||
|
OTTI losses recognized in earnings for securities that the Company intends to sell or more- likely-than-not will be required to sell before recovery |
21 | — | 21 | |||||||
|
Total impairment losses recognized in earnings |
$ | 215 | $ | 292 | $ | 507 | ||||
109
The following is a 3-month roll-forward of the credit-related position recognized in earnings for AFS and HTM debt securities held as of March 31, 2010:
|
|
Cumulative Other-Than-Temporary Impairment Credit Losses Recognized in Earnings | ||||||||||||||||
|---|---|---|---|---|---|---|---|---|---|---|---|---|---|---|---|---|---|
| In millions of dollars |
December 31, 2009
balance |
Credit impairments
recognized in earnings on securities not previously impaired |
Credit impairments
recognized in earnings on securities that have been previously impaired |
Reductions due to
sales of credit impaired securities sold or matured |
March 31, 2010
balance |
||||||||||||
|
AFS debt securities |
|||||||||||||||||
|
Mortgage-backed securities |
|||||||||||||||||
|
Prime |
$ | 242 | $ | 12 | $ | — | $ | — | $ | 254 | |||||||
|
Alt-A |
1 | 1 | — | — | 2 | ||||||||||||
|
Commercial real estate |
2 | — | — | — | 2 | ||||||||||||
|
Total mortgage-backed securities |
245 | 13 | — | — | 258 | ||||||||||||
|
U.S. Treasury |
— | 35 | — | — | 35 | ||||||||||||
|
Foreign government |
20 | 134 | — | — | 154 | ||||||||||||
|
Corporate |
137 | 4 | 5 | — | 146 | ||||||||||||
|
Asset-backed securities |
9 | — | — | — | 9 | ||||||||||||
|
Other debt securities |
49 | 3 | — | — | 52 | ||||||||||||
|
Total OTTI credit losses recognized for AFS debt securities |
$ | 460 | $ | 189 | $ | 5 | $ | — | $ | 654 | |||||||
|
HTM debt securities |
|||||||||||||||||
|
Mortgage-backed securities |
|||||||||||||||||
|
Prime |
$ | 170 | $ | 75 | $ | 1 | $ | — | $ | 246 | |||||||
|
Alt-A |
2,569 | 178 | 2 | — | 2,749 | ||||||||||||
|
Subprime |
210 | 1 | 2 | — | 213 | ||||||||||||
|
Non-U.S. residential |
96 | — | — | — | 96 | ||||||||||||
|
Commercial real estate |
9 | — | — | — | 9 | ||||||||||||
|
Total mortgage-backed securities |
3,054 | 254 | 5 | — | 3,313 | ||||||||||||
|
State and municipal |
7 | — | — | — | 7 | ||||||||||||
|
Corporate |
351 | — | — | — | 351 | ||||||||||||
|
Asset-backed securities |
48 | 33 | — | — | 81 | ||||||||||||
|
Other debt securities |
4 | — | — | — | 4 | ||||||||||||
|
Total OTTI credit losses recognized for HTM debt securities |
$ | 3,464 | $ | 287 | $ | 5 | $ | — | $ | 3,756 | |||||||
Investments in Alternative Investment Funds
The Company holds investments in certain hedge funds, private equity funds, fund of funds and real estate funds, and includes both funds that are managed by the Company and funds managed by third parties. These investments are generally classified as non-marketable equity securities carried at fair value. The fair value of these investments has been estimated using the net asset value (NAV) per share of the Company's ownership interest in the funds, where it is not probable that the Company will sell an investment at a price other than NAV.
| In millions of dollars at March 31, 2010 | Fair value | Unfunded commitments |
Redemption frequency
(if currently eligible) |
Redemption notice period | |||||||||
|---|---|---|---|---|---|---|---|---|---|---|---|---|---|
|
Hedge funds |
$ | 69 | $ | — |
Monthly, quarterly,
annually |
10-95 days | |||||||
|
Private equity funds |
1,250 | 558 | — | — | |||||||||
|
Real estate funds(1) |
126 | 37 | — | — | |||||||||
|
Total |
$ | 1,445 | $ | 595 | |||||||||
- (1)
- This category includes several real estate funds that invest primarily in commercial real estate in the U.S., Europe and Asia. These investments can never be redeemed with the funds. Distributions from each fund will be received as the underlying investments in the funds are liquidated. It is estimated that the underlying assets of the fund will be liquidated over a period of several years as market conditions allow. While certain assets within the portfolio may be sold, no specific assets have been identified for sale. Because it is not probable that any individual investment will be sold, the fair value of each individual investment has been estimated using the net asset value of the Company's ownership interest in the partners' capital. There is no standard redemption frequency nor is a prior notice period required. The investee fund's management must approve of the buyer before the sale of the investments can be completed.
110
11. GOODWILL AND INTANGIBLE ASSETS
Goodwill
The changes in Goodwill during the first three months of 2010 were as follows:
| In millions of dollars |
|
|||
|---|---|---|---|---|
|
Balance at December 31, 2009 |
$ | 25,392 | ||
|
Foreign exchange translation |
294 | |||
|
Smaller acquisitions/divestitures, purchase accounting adjustments and other |
(24 | ) | ||
|
Balance at March 31, 2010 |
$ | 25,662 | ||
During the first quarter of 2010, no goodwill was written off due to impairment and no interim impairment test on goodwill was performed. Goodwill is tested for impairment annually during the third quarter at the reporting unit level and between annual tests if an event occurs or circumstances change that would more likely than not reduce the fair value of a reporting unit below its carrying amount. There were no triggering events present during the first quarter of 2010 for any reporting unit and an interim goodwill impairment test was not required.
The Company will continue to monitor the Local Consumer Lending—Cards reporting unit for triggering events in the interim as the goodwill in this reporting unit may be particularly sensitive to further deterioration in economic conditions. The fair value as a percentage of allocated book value for Local Consumer Lending—Cards is 112%, based on the results of the goodwill impairment test performed during the fourth quarter of 2009. If economic conditions deteriorate or other events adversely impact the business models and the related assumptions including the discount rate, expected recovery, and expected loss rates used to value this reporting unit, the Company could potentially experience future material impairment charges with respect to the $4,662 million of goodwill remaining in its Local Consumer Lending—Cards reporting unit. Any such charges, by themselves, would not negatively affect the Company's Tier 1 Common, Tier 1 Capital or Total Capital regulatory ratios, its Tangible Common Equity or the Company's liquidity position.
The realignment of Citicorp and Citi Holdings during the first quarter of 2010 left Citigroup's reporting segments and reporting units unchanged. However, because certain businesses were moved from Brokerage and Asset Management to LATAM Regional Consumer Bank , goodwill was reassigned from Brokerage and Asset Management to LATAM Regional Consumer Bank , using a relative fair value approach.
The following tables present the Company's goodwill balances by reporting unit and by segment at March 31, 2010:
| In millions of dollars | ||||
|---|---|---|---|---|
| Reporting unit(1) | Goodwill | |||
|
North America Regional Consumer Banking |
$ | 2,452 | ||
|
EMEA Regional Consumer Banking |
257 | |||
|
Asia Regional Consumer Banking |
5,758 | |||
|
Latin America Regional Consumer Banking |
1,712 | |||
|
Securities and Banking |
9,184 | |||
|
Transaction Services |
1,573 | |||
|
Brokerage and Asset Management |
64 | |||
|
Local Consumer Lending— Cards |
4,662 | |||
|
Total |
$ | 25,662 | ||
|
By Segment |
||||
|
Regional Consumer Banking |
$ | 10,179 | ||
|
Institutional Clients Group |
10,757 | |||
|
Citi Holdings |
4,726 | |||
|
Total |
$ | 25,662 | ||
- (1)
- Local Consumer Lending— Other is excluded from the table as there is no goodwill allocated to it.
111
Intangible Assets
The components of intangible assets were as follows:
|
|
March 31, 2010 | December 31, 2009 | |||||||||||||||||
|---|---|---|---|---|---|---|---|---|---|---|---|---|---|---|---|---|---|---|---|
| In millions of dollars |
Gross
carrying amount |
Accumulated
amortization |
Net
carrying amount |
Gross
carrying amount |
Accumulated
amortization |
Net
carrying amount |
|||||||||||||
|
Purchased credit card relationships |
$ | 8,066 | $ | 4,873 | $ | 3,193 | $ | 8,148 | $ | 4,838 | $ | 3,310 | |||||||
|
Core deposit intangibles |
1,411 | 846 | 565 | 1,373 | 791 | 582 | |||||||||||||
|
Other customer relationships |
667 | 184 | 483 | 675 | 176 | 499 | |||||||||||||
|
Present value of future profits |
241 | 105 | 136 | 418 | 280 | 138 | |||||||||||||
|
Indefinite-lived intangible assets |
536 | — | 536 | 569 | — | 569 | |||||||||||||
|
Other(1) |
4,806 | 1,442 | 3,364 | 4,977 | 1,361 | 3,616 | |||||||||||||
|
Intangible assets (excluding MSRs) |
$ | 15,727 | $ | 7,450 | $ | 8,277 | $ | 16,160 | $ | 7,446 | $ | 8,714 | |||||||
|
Mortgage servicing rights (MSRs) |
6,439 | — | 6,439 | 6,530 | — | 6,530 | |||||||||||||
|
Total intangible assets |
$ | 22,166 | $ | 7,450 | $ | 14,716 | $ | 22,690 | $ | 7,446 | $ | 15,244 | |||||||
- (1)
- Includes contract-related intangible assets.
The changes in intangible assets during the first three months of 2010 were as follows:
| In millions of dollars |
Net carrying
amount at December 31, 2009 |
Acquisitions/
divestitures |
Amortization | Impairments |
FX
and other(1) |
Net carrying
amount at March 31, 2010 |
|||||||||||||
|---|---|---|---|---|---|---|---|---|---|---|---|---|---|---|---|---|---|---|---|
|
Purchased credit card relationships |
$ | 3,310 | $ | — | $ | (128 | ) | $ | — | $ | 11 | $ | 3,193 | ||||||
|
Core deposit intangibles |
582 | — | (27 | ) | — | 10 | 565 | ||||||||||||
|
Other customer relationships |
499 | — | (13 | ) | — | (3 | ) | 483 | |||||||||||
|
Present value of future profits |
138 | — | (3 | ) | — | 1 | 136 | ||||||||||||
|
Indefinite-lived intangible assets |
569 | (46 | ) | — | — | 13 | 536 | ||||||||||||
|
Other |
3,616 | — | (78 | ) | — | (174 | ) | 3,364 | |||||||||||
|
Intangible assets (excluding MSRs) |
$ | 8,714 | $ | (46 | ) | $ | (249 | ) | $ | — | $ | (142 | ) | $ | 8,277 | ||||
|
Mortgage servicing rights (MSRs)(2) |
6,530 | 6,439 | |||||||||||||||||
|
Total intangible assets |
$ | 15,244 | $ | 14,716 | |||||||||||||||
- (1)
-
Includes
foreign exchange translation and purchase accounting adjustments.
- (2)
- See Note 14 to the Consolidated Financial Statements for the roll-forward of mortgage servicing rights.
112
Short-Term Borrowings
Short-term borrowings consist of commercial paper and other borrowings as follows:
| In millions of dollars |
March 31,
2010 |
December 31,
2009 |
|||||
|---|---|---|---|---|---|---|---|
|
Commercial paper |
|||||||
|
Citigroup Funding Inc. (CFI) |
$ | 10,770 | $ | 9,846 | |||
|
Other Citigroup subsidiaries |
455 | 377 | |||||
|
Consolidated VIE-related commercial paper |
31,247 | — | |||||
|
|
$ | 42,472 | $ | 10,223 | |||
|
Other short-term borrowings |
54,222 | 58,656 | |||||
|
Total short-term borrowings |
$ | 96,694 | $ | 68,879 | |||
Borrowings under bank lines of credit may be at interest rates based on LIBOR, CD rates, the prime rate, or bids submitted by the banks. Citigroup pays commitment fees for its lines of credit.
Some of Citigroup's non-bank subsidiaries have credit facilities with Citigroup's subsidiary depository institutions, including Citibank, N.A. Borrowings under these facilities must be secured in accordance with Section 23A of the Federal Reserve Act.
Citigroup Global Markets Holdings Inc. (CGMHI) has substantial borrowing agreements consisting of facilities that CGMHI has been advised are available, but where no contractual lending obligation exists. These arrangements are reviewed on an ongoing basis to ensure flexibility in meeting CGMHI's short-term requirements.
| In millions of dollars |
March 31,
2010 |
December 31,
2009 |
|||||
|---|---|---|---|---|---|---|---|
|
Citigroup parent company |
$ | 192,325 | $ | 197,804 | |||
|
Other Citigroup subsidiaries(1) |
69,154 | 97,294 | |||||
|
CGMHI |
9,091 | 13,422 | |||||
|
CFI(2) |
55,100 | 55,499 | |||||
|
Consolidated VIE related long-term debt |
113,604 | — | |||||
|
Total long-term debt |
$ | 439,274 | $ | 364,019 | |||
- (1)
-
At
March 31, 2010 and December 31, 2009, collateralized advances from the Federal Home Loan Bank were $21.6 billion and
$24.1 billion, respectively.
- (2)
- Includes Principal-Protected Trust Securities (Safety First Trust Securities) with carrying values of $534 million issued by Safety First Trust Series 2006-1, 2007-1, 2007-2, 2007-3, 2007-4, 2008-1, 2008-2, 2008-3, 2008-4, 2008-5, 2008-6, 2009-1, 2009-2, and 2009-3 (collectively, the "Safety First Trusts") at March 31, 2010 and $528 million issued by Safety First Trust Series 2006-1, 2007-1, 2007-2, 2007-3, 2007-4, 2008-1, 2008-2, 2008-3, 2008-4, 2008-5, 2008-6, 2009-1, 2009-2, and 2009-3 at December 31, 2009. CFI owns all of the voting securities of the Safety First Trusts. The Safety First Trusts have no assets, operations, revenues or cash flows other than those related to the issuance, administration, and repayment of the Safety First Trust Securities and the Safety First Trusts' common securities. The Safety First Trusts' obligations under the Safety First Trust Securities are fully and unconditionally guaranteed by CFI, and CFI's guarantee obligations are fully and unconditionally guaranteed by Citigroup.
CGMHI has committed long-term financing facilities with unaffiliated banks. At March 31, 2010, CGMHI had drawn down the full $900 million available under these facilities, of which $150 million is guaranteed by Citigroup. Generally, a bank can terminate these facilities by giving CGMHI one-year prior notice.
The Company issues both fixed and variable rate debt in a range of currencies. It uses derivative contracts, primarily interest rate swaps, to effectively convert a portion of its fixed rate debt to variable rate debt and variable rate debt to fixed rate debt. The maturity structure of the derivatives generally corresponds to the maturity structure of the debt being hedged. In addition, the Company uses other derivative contracts to manage the impact of FX translation on certain debt issuances.
Long-term debt at March 31, 2010 and December 31, 2009 includes $21.7 billion and $19.3 billion, respectively, of junior subordinated debt. The Company formed statutory business trusts under the laws of the state of Delaware. The trusts exist for the exclusive purposes of (1) issuing trust securities representing undivided beneficial interests in the assets of the trust; (2) investing the gross proceeds of the trust securities in junior subordinated deferrable interest debentures (subordinated debentures) of its parent; and (3) engaging in only those activities necessary or incidental thereto. Upon approval from the Federal Reserve Board, Citigroup has the right to redeem these securities.
Citigroup has contractually agreed not to redeem or purchase (i) the 6.50% Enhanced Trust Preferred Securities of Citigroup Capital XV before September 15, 2056, (ii) the 6.45% Enhanced Trust Preferred Securities of Citigroup Capital XVI before December 31, 2046, (iii) the 6.35% Enhanced Trust Preferred Securities of Citigroup Capital XVII before March 15, 2057, (iv) the 6.829% Fixed Rate/Floating Rate Enhanced Trust Preferred Securities of Citigroup Capital XVIII before June 28, 2047, (v) the 7.250% Enhanced Trust Preferred Securities of Citigroup Capital XIX before August 15, 2047, (vi) the 7.875% Enhanced Trust Preferred Securities of Citigroup Capital XX before December 15, 2067, and (vii) the 8.300% Fixed Rate/Floating Rate Enhanced Trust Preferred Securities of Citigroup Capital XXI before December 21, 2067, unless certain conditions, described in Exhibit 4.03 to Citigroup's Current Report on Form 8-K filed on September 18, 2006, in Exhibit 4.02 to Citigroup's Current Report on Form 8-K filed on November 28, 2006, in Exhibit 4.02 to Citigroup's Current Report on Form 8-K filed on March 8, 2007, in Exhibit 4.02 to Citigroup's Current Report on Form 8-K filed on July 2, 2007, in Exhibit 4.02 to Citigroup's Current Report on Form 8-K filed on August 17, 2007, in Exhibit 4.2 to Citigroup's Current Report on Form 8-K filed on November 27, 2007, and in Exhibit 4.2 to Citigroup's Current Report on Form 8-K filed on December 21, 2007, respectively, are met. These agreements are for the benefit of the holders of Citigroup's 6.00% Junior Subordinated Deferrable Interest Debentures due 2034.
113
Citigroup owns all of the voting securities of these subsidiary trusts. These subsidiary trusts have no assets, operations, revenues or cash flows other than those related to the issuance, administration, and repayment of the subsidiary trusts and the subsidiary trusts' common securities. These subsidiary trusts' obligations are fully and unconditionally guaranteed by Citigroup.
The following table summarizes the financial structure of each of the Company's subsidiary trusts at March 31, 2010:
|
|
|
|
|
|
|
Junior subordinated debentures
owned by trust |
|||||||||||||||||||
|---|---|---|---|---|---|---|---|---|---|---|---|---|---|---|---|---|---|---|---|---|---|---|---|---|---|
|
Trust securities with distributions
guaranteed by Citigroup In millions of dollars, except share amounts |
Issuance
date |
Securities
issued |
Liquidation
value |
Coupon
rate |
Common
shares issued to parent |
Amount(1) | Maturity |
Redeemable
by issuer beginning |
|||||||||||||||||
|
Citigroup Capital III |
Dec. 1996 | 194,053 | $ | 194 | 7.625 | % | 6,003 | $ | 200 | Dec. 1, 2036 | Not redeemable | ||||||||||||||
|
Citigroup Capital VII |
July 2001 | 35,885,898 | 897 | 7.125 | % | 1,109,874 | 925 | July 31, 2031 | July 31, 2006 | ||||||||||||||||
|
Citigroup Capital VIII |
Sept. 2001 | 43,651,597 | 1,091 | 6.950 | % | 1,350,050 | 1,125 | Sept. 15, 2031 | Sept. 17, 2006 | ||||||||||||||||
|
Citigroup Capital IX |
Feb. 2003 | 33,874,813 | 847 | 6.000 | % | 1,047,675 | 873 | Feb. 14, 2033 | Feb. 13, 2008 | ||||||||||||||||
|
Citigroup Capital X |
Sept. 2003 | 14,757,823 | 369 | 6.100 | % | 456,428 | 380 | Sept. 30, 2033 | Sept. 30, 2008 | ||||||||||||||||
|
Citigroup Capital XI |
Sept. 2004 | 18,387,128 | 460 | 6.000 | % | 568,675 | 474 | Sept. 27, 2034 | Sept. 27, 2009 | ||||||||||||||||
|
Citigroup Capital XII |
Mar. 2010 | 92,000,000 | 2,300 | 8.500 | % | 25 | 2,300 | Mar. 30, 2040 | Mar. 30, 2015 | ||||||||||||||||
|
Citigroup Capital XIV |
June 2006 | 12,227,281 | 306 | 6.875 | % | 40,000 | 307 | June 30, 2066 | June 30, 2011 | ||||||||||||||||
|
Citigroup Capital XV |
Sept. 2006 | 25,210,733 | 630 | 6.500 | % | 40,000 | 631 | Sept. 15, 2066 | Sept. 15, 2011 | ||||||||||||||||
|
Citigroup Capital XVI |
Nov. 2006 | 38,148,947 | 954 | 6.450 | % | 20,000 | 954 | Dec. 31, 2066 | Dec. 31, 2011 | ||||||||||||||||
|
Citigroup Capital XVII |
Mar. 2007 | 28,047,927 | 701 | 6.350 | % | 20,000 | 702 | Mar. 15, 2067 | Mar. 15, 2012 | ||||||||||||||||
|
Citigroup Capital XVIII |
June 2007 | 99,901 | 152 | 6.829 | % | 50 | 152 | June 28, 2067 | June 28, 2017 | ||||||||||||||||
|
Citigroup Capital XIX |
Aug. 2007 | 22,771,968 | 569 | 7.250 | % | 20,000 | 570 | Aug. 15, 2067 | Aug. 15, 2012 | ||||||||||||||||
|
Citigroup Capital XX |
Nov. 2007 | 17,709,814 | 443 | 7.875 | % | 20,000 | 443 | Dec. 15, 2067 | Dec. 15, 2012 | ||||||||||||||||
|
Citigroup Capital XXI |
Dec. 2007 | 2,345,801 | 2,346 | 8.300 | % | 500 | 2,346 | Dec. 21, 2077 | Dec. 21, 2037 | ||||||||||||||||
|
Citigroup Capital XXX |
Nov. 2007 | 1,875,000 | 1,875 | 6.455 | % | 10 | 1,875 | Sept. 15, 2041 | Sept. 15, 2013 | ||||||||||||||||
|
Citigroup Capital XXXI |
Nov. 2007 | 1,875,000 | 1,875 | 6.700 | % | 10 | 1,875 | Mar. 15, 2042 | Mar. 15, 2014 | ||||||||||||||||
|
Citigroup Capital XXXII |
Nov. 2007 | 1,875,000 | 1,875 | 6.935 | % | 10 | 1,875 | Sept. 15, 2042 | Sept. 15, 2014 | ||||||||||||||||
|
Citigroup Capital XXXIII |
July 2009 | 5,259,000 | 5,259 | 8.000 | % | 100 | 5,259 | July 30, 2039 | July 30, 2014 | ||||||||||||||||
|
Adam Capital Trust III |
Dec. 2002 | 17,500 | 18 |
3 mo. LIB
+335 bp. |
542 | 18 | Jan. 7, 2033 | Jan. 7, 2008 | |||||||||||||||||
|
Adam Statutory Trust III |
Dec. 2002 | 25,000 | 25 |
3 mo. LIB
+325 bp. |
774 | 26 | Dec. 26, 2032 | Dec. 26, 2007 | |||||||||||||||||
|
Adam Statutory Trust IV |
Sept. 2003 | 40,000 | 40 |
3 mo. LIB
+295 bp. |
1,238 | 41 | Sept. 17, 2033 | Sept. 17, 2008 | |||||||||||||||||
|
Adam Statutory Trust V |
Mar. 2004 | 35,000 | 35 |
3 mo. LIB
+279 bp. |
1,083 | 36 | Mar. 17, 2034 | Mar. 17, 2009 | |||||||||||||||||
|
Total obligated |
$ | 23,261 | $ | 23,387 | |||||||||||||||||||||
- (1)
- Represents the proceeds received from the Trust at the date of issuance.
In each case, the coupon rate on the debentures is the same as that on the trust securities. Distributions on the trust securities and interest on the debentures are payable quarterly, except for Citigroup Capital III, Citigroup Capital XVIII and Citigroup Capital XXI on which distributions are payable semiannually.
During the third quarter of 2009, pursuant to the "Exchange Offers," Citigroup converted $5.8 billion liquidation value of trust preferred securities across Citigroup Capital III, Citigroup Capital VII, Citigroup Capital VIII, Citigroup Capital IX, Citigroup Capital X, Citigroup Capital XI, Citigroup Capital XIV, Citigroup Capital XV, Citigroup Capital XVI, Citigroup Capital XVII, Citigroup Capital XVIII, Citigroup Capital XIX, Citigroup Capital XX and Citigroup Capital XXI to common stock and issued $27.1 billion of Citigroup Capital XXXIII trust preferred securities to the U.S. government in exchange for the Series G and I of preferred stock. On March 17, 2010, Citigroup issued $2.3 billion of Citigroup Capital XII trust preferred securities.
114
13. CHANGES IN ACCUMULATED OTHER COMPREHENSIVE INCOME (LOSS)
Changes in each component of "Accumulated Other Comprehensive Income (Loss)" for the three-month period ended March 31, 2010 are as follows:
| In millions of dollars |
Net unrealized
gains (losses) on investment securities |
Foreign
currency translation adjustment, net of hedges |
Cash flow
hedges |
Pension
liability adjustments |
Accumulated other
comprehensive income (loss) |
|||||||||||
|---|---|---|---|---|---|---|---|---|---|---|---|---|---|---|---|---|
|
Balance, December 31, 2009 |
$ | (4,347 | ) | $ | (7,947 | ) | $ | (3,182 | ) | $ | (3,461 | ) | $ | (18,937 | ) | |
|
Change in net unrealized gains (losses) on investment securities, net of taxes |
1,210 | — | — | — | 1,210 | |||||||||||
|
Reclassification adjustment for net gains included in net income, net of taxes |
(28 | ) | — | — | — | (28 | ) | |||||||||
|
Foreign currency translation adjustment, net of taxes(1) |
— | (279 | ) | — | — | (279 | ) | |||||||||
|
Cash flow hedges, net of taxes(2) |
— | — | 223 | — | 223 | |||||||||||
|
Pension liability adjustment, net of taxes(3) |
— | — | — | (48 | ) | (48 | ) | |||||||||
|
Change |
$ | 1,182 | $ | (279 | ) | $ | 223 | $ | (48 | ) | $ | 1,078 | ||||
|
Balance, March 31, 2010(4) |
$ | (3,165 | ) | $ | (8,226 | ) | $ | (2,959 | ) | $ | (3,509 | ) | $ | (17,859 | ) | |
- (1)
-
Primarily
impacted by the movements in the British pound, Euro, Japanese yen, Korean won, and Mexican peso against the U.S. dollar, and changes in related
tax effects and hedges.
- (2)
-
Primarily
driven by Citigroup's pay fixed/receive floating interest rate swap programs that are hedging the floating rates on deposits and
long-term debt.
- (3)
-
Reflects
adjustments to the funded status of pension and postretirement plans, which is the difference between the fair value of the plan assets and the
projected benefit obligation.
- (4)
- The March 31, 2010 balance of $(3.2) billion for net unrealized losses on investment securities consists of $(4.2) billion for those investments classified as held-to-maturity and $1.0 billion for those classified as available-for-sale.
115
14. SECURITIZATIONS AND VARIABLE INTEREST ENTITIES
Overview
Citigroup and its subsidiaries are involved with several types of off-balance sheet arrangements, including special purpose entities (SPEs). See Note 1 to the Consolidated Financial Statements for a discussion of changes to the accounting for transfers and servicing of financial assets and consolidation of Variable Interest Entities (VIEs), including the elimination of Qualifying SPEs (QSPEs).
Uses of SPEs
An SPE is an entity designed to fulfill a specific limited need of the company that organized it. The principal uses of SPEs are to obtain liquidity and favorable capital treatment by securitizing certain of Citigroup's financial assets, to assist clients in securitizing their financial assets, and to create investment products for clients. SPEs may be organized in many legal forms including trusts, partnerships or corporations. In a securitization, the company transferring assets to an SPE converts all (or a portion) of those assets into cash before they would have been realized in the normal course of business, through the SPE's issuance of debt and equity instruments, certificates, commercial paper and other notes of indebtedness, which are recorded on the balance sheet of the SPE and not reflected in the transferring company's balance sheet, assuming applicable accounting requirements are satisfied. Investors usually have recourse to the assets in the SPE and often benefit from other credit enhancements, such as a collateral account or over-collateralization in the form of excess assets in the SPE, a line of credit, or from a liquidity facility, such as a liquidity put option or asset purchase agreement. The SPE can typically obtain a more favorable credit rating from rating agencies than the transferor could obtain for its own debt issuances, resulting in less expensive financing costs than unsecured debt. The SPE may also enter into derivative contracts in order to convert the yield or currency of the underlying assets to match the needs of the SPE investors or to limit or change the credit risk of the SPE. Citigroup may be the provider of certain credit enhancements as well as the counterparty to any related derivative contracts. Since QSPEs were eliminated, most of Citigroup's SPEs are now VIEs.
Variable Interest Entities
VIEs are entities that have either a total equity investment that is insufficient to permit the entity to finance its activities without additional subordinated financial support or whose equity investors lack the characteristics of a controlling financial interest (i.e., ability to make significant decisions through voting rights, and right to receive the expected residual returns of the entity or obligation to absorb the expected losses of the entity). Investors that finance the VIE through debt or equity interests or other counterparties that provide other forms of support, such as guarantees, subordinated fee arrangements, or certain types of derivative contracts, are variable interest holders in the entity. Since January 1, 2010, the variable interest holder, if any, that has a controlling financial interest in a VIE is deemed to be the primary beneficiary and must consolidate the VIE. Citigroup would be deemed to have a controlling financial interest if it has both of the following characteristics:
- 1.
-
Power
to direct activities of a VIE that most significantly impact the entity's economic performance; and
- 2.
- Obligation to absorb losses of the entity that could potentially be significant to the VIE or right to receive benefits from the entity that could potentially be significant to the VIE.
The Company must evaluate its involvement in each VIE and understand the purpose and design of the entity, the role the Company had in the entity's design, and its involvement in its ongoing activities. The Company then must evaluate which activities most significantly impact the economic performance of the VIE and who has the power to direct such activities.
For those VIEs where the Company determines that it has the power to direct the activities that most significantly impact the VIE's economic performance, the Company then must evaluate its economic interests, if any, and determine whether it could absorb losses or receive benefits that could potentially be significant to the VIE. When evaluating whether the Company has an obligation to absorb losses that could potentially be significant, it considers the maximum exposure to such loss without consideration of probability. Such obligations could be in various forms, including but not limited to, debt and equity investments, guarantees, liquidity agreements, and certain derivative contracts.
Prior to January 1, 2010, the variable interest holder, if any, that would absorb a majority of the entity's expected losses, receive a majority of the entity's residual returns or both was deemed to be the primary beneficiary and consolidated the VIE. Consolidation of the VIE was determined based primarily on the variability generated in scenarios that are considered most likely to occur, rather than on scenarios that are considered more remote. In many cases, a detailed quantitative analysis was required to make this determination.
In various other transactions, the Company may act as a derivative counterparty (for example, interest rate swap, cross-currency swap, or purchaser of credit protection under a credit default swap or total return swap where the Company pays the total return on certain assets to the SPE); may act as underwriter or placement agent; may provide administrative, trustee, or other services; or may make a market in debt securities or other instruments issued by VIEs. The Company generally considers such involvement, by itself, not to be variable interests and thus not an indicator of power or potentially significant benefits or losses.
116
Citigroup's involvement with consolidated and unconsolidated VIEs with which the Company holds significant variable interests as of March 31, 2010 and December 31, 2009 is presented below:
| As of March 31, 2010 | |||||||||||||||||||||||||
|---|---|---|---|---|---|---|---|---|---|---|---|---|---|---|---|---|---|---|---|---|---|---|---|---|---|
|
|
|
|
|
Maximum exposure to loss in significant unconsolidated VIEs(1) | |||||||||||||||||||||
|
|
|
|
|
Funded exposures(2) | Unfunded exposures(3) | Total | |||||||||||||||||||
|
|
Total
involvement with SPE assets |
|
|
||||||||||||||||||||||
| In millions of dollars |
Consolidated
VIE / SPE assets(4) |
Significant
unconsolidated VIE assets(4)(5) |
Debt
investments |
Equity
investments |
Funding
commitments |
Guarantees
and derivatives |
Total | ||||||||||||||||||
|
Citicorp |
|||||||||||||||||||||||||
|
Credit card securitizations |
$ | 66,328 | $ | 66,328 | $ | — | $ | — | $ | — | $ | — | $ | — | $ | — | |||||||||
|
Mortgage securitizations(6) |
179,772 | 2,790 | 176,982 | 2,479 | — | — | 9 | 2,488 | |||||||||||||||||
|
Citi-administered asset-backed commercial paper conduits (ABCP) |
32,308 | 24,408 | 7,900 | — | — | 7,900 | — | 7,900 | |||||||||||||||||
|
Third-party commercial paper conduits |
4,296 | — | 4,296 | 231 | — | 344 | — | 575 | |||||||||||||||||
|
Collateralized debt obligations (CDOs) |
5,655 | — | 5,655 | 134 | — | — | — | 134 | |||||||||||||||||
|
Collateralized loan obligations (CLOs) |
8,260 | — | 8,260 | 119 | — | — | — | 119 | |||||||||||||||||
|
Asset-based financing |
22,511 | 2,319 | 20,192 | 3,859 | 12 | 491 | 160 | 4,522 | |||||||||||||||||
|
Municipal securities tender option bond trusts (TOBs) |
20,106 | 10,751 | 9,355 | — | — | 6,411 | 537 | 6,948 | |||||||||||||||||
|
Municipal investments |
12,421 | 238 | 12,183 | 528 | 2,418 | 615 | — | 3,561 | |||||||||||||||||
|
Client intermediation |
8,923 | 2,210 | 6,713 | 2,014 | — | — | — | 2,014 | |||||||||||||||||
|
Investment funds |
2,833 | 40 | 2,793 | 10 | 56 | — | — | 66 | |||||||||||||||||
|
Trust preferred securities |
21,682 | — | 21,682 | — | 128 | — | — | 128 | |||||||||||||||||
|
Other |
5,184 | 1,305 | 3,879 | 338 | 11 | 46 | 227 | 622 | |||||||||||||||||
|
Total |
$ | 390,279 | $ | 110,389 | $ | 279,890 | $ | 9,712 | $ | 2,625 | $ | 15,807 | $ | 933 | $ | 29,077 | |||||||||
|
Citi Holdings |
|||||||||||||||||||||||||
|
Credit card securitizations |
$ | 34,298 | $ | 34,298 | $ | — | $ | — | $ | — | $ | — | $ | — | $ | — | |||||||||
|
Mortgage securitizations(6) |
298,981 | 6,755 | 292,226 | 3,803 | — | — | 107 | 3,910 | |||||||||||||||||
|
Student loan securitizations |
35,937 | 35,937 | — | — | — | — | — | — | |||||||||||||||||
|
Auto loan securitizations |
2,385 | 2,385 | — | — | — | — | — | — | |||||||||||||||||
|
Citi-administered asset-backed commercial paper conduits (ABCP) |
100 | 100 | — | — | — | — | — | — | |||||||||||||||||
|
Third-party commercial paper conduits |
3,296 | — | 3,296 | — | 252 | — | 252 | ||||||||||||||||||
|
Collateralized debt obligations (CDOs) |
19,825 | 3,636 | 16,189 | 1,378 | — | — | 753 | 2,131 | |||||||||||||||||
|
Collateralized loan obligations (CLOs) |
13,625 | 500 | 13,125 | 1,484 | — | 13 | 380 | 1,877 | |||||||||||||||||
|
Asset-based financing |
50,107 | 3 | 50,104 | 16,080 | 30 | 1,251 | — | 17,361 | |||||||||||||||||
|
Municipal securities tender option bond trusts (TOBs) |
1,129 | 1,129 | — | — | — | — | — | — | |||||||||||||||||
|
Municipal investments |
4,573 | — | 4,573 | 59 | 184 | 124 | — | 367 | |||||||||||||||||
|
Client intermediation |
686 | 205 | 481 | 62 | — | — | 347 | 409 | |||||||||||||||||
|
Investment funds |
9,908 | 1,036 | 8,872 | — | 149 | 19 | — | 168 | |||||||||||||||||
|
Other |
2,162 | 494 | 1,668 | 220 | 128 | 228 | 15 | 591 | |||||||||||||||||
|
Total |
$ | 477,012 | $ | 86,478 | $ | 390,534 | $ | 23,086 | $ | 491 | $ | 1,887 | $ | 1,602 | $ | 27,066 | |||||||||
|
Total Citigroup |
$ | 867,291 | $ | 196,867 | $ | 670,424 | $ | 32,798 | $ | 3,116 | $ | 17,694 | $ | 2,535 | $ | 56,143 | |||||||||
- (1)
-
The
definition of maximum exposure to loss is included in the text that follows.
- (2)
-
Included
in Citigroup's March 31, 2010 Consolidated Balance Sheet.
- (3)
-
Not
included in Citigroup's March 31, 2010 Consolidated Balance Sheet.
- (4)
-
Due
to the adoption of ASC 810, Consolidation (formerly FASB Interpretation No. 46(R), Consolidation of Variable Interest Entities) on
January 1, 2010, the previously disclosed assets of former QSPEs are now included in either the "Consolidated VIE / SPE assets" or the "Significant unconsolidated VIE assets" columns for the
March 31, 2010 period.
- (5)
-
A
significant unconsolidated VIE is an entity where the Company has any variable interest considered to be significant, regardless of the likelihood of loss
or the notional amount of exposure.
- (6)
- A significant portion of the Company's securitized mortgage portfolio was transferred from Citi Holdings to Citicorp during the first quarter of 2010.
117
|
|
|
|
|
As of December 31, 2009 | ||||||||||||
|---|---|---|---|---|---|---|---|---|---|---|---|---|---|---|---|---|
| In millions of dollars |
Total
involvement with SPE assets |
QSPE
assets |
Consolidated
VIE assets |
Significant
unconsolidated VIE assets(1) |
Maximum exposure to
loss in significant unconsolidated VIEs(2) |
|||||||||||
|
Citicorp |
||||||||||||||||
|
Credit card securitizations |
$ | 78,833 | $ | 78,833 | $ | — | $ | — | $ | — | ||||||
|
Mortgage securitizations |
81,953 | 81,953 | — | — | — | |||||||||||
|
Citi-administered asset-backed commercial paper conduits (ABCP) |
36,327 | — | — | 36,327 | 36,326 | |||||||||||
|
Third-party commercial paper conduits |
3,718 | — | — | 3,718 | 353 | |||||||||||
|
Collateralized debt obligations (CDOs) |
2,785 | — | — | 2,785 | 21 | |||||||||||
|
Collateralized loan obligations (CLOs) |
5,409 | — | — | 5,409 | 120 | |||||||||||
|
Asset-based financing |
19,612 | — | 1,279 | 18,333 | 5,221 | |||||||||||
|
Municipal securities tender option bond trusts (TOBs) |
19,455 | 705 | 9,623 | 9,127 | 6,841 | |||||||||||
|
Municipal investments |
10,906 | — | 11 | 10,895 | 2,370 | |||||||||||
|
Client intermediation |
8,607 | — | 2,749 | 5,858 | 881 | |||||||||||
|
Investment funds |
93 | — | 39 | 54 | 10 | |||||||||||
|
Trust preferred securities |
19,345 | — | — | 19,345 | 128 | |||||||||||
|
Other |
7,380 | 1,808 | 1,838 | 3,734 | 446 | |||||||||||
|
Total |
$ | 294,423 | $ | 163,299 | $ | 15,539 | $ | 115,585 | $ | 52,717 | ||||||
|
Citi Holdings |
||||||||||||||||
|
Credit card securitizations |
$ | 42,274 | $ | 42,274 | $ | — | $ | — | $ | — | ||||||
|
Mortgage securitizations |
491,500 | 491,500 | — | — | — | |||||||||||
|
Student loan securitizations |
14,343 | 14,343 | — | — | — | |||||||||||
|
Citi-administered asset-backed commercial paper conduits (ABCP) |
98 | — | 98 | — | — | |||||||||||
|
Third-party commercial paper conduits |
5,776 | — | — | 5,776 | 439 | |||||||||||
|
Collateralized debt obligations (CDOs) |
24,157 | — | 7,614 | 16,543 | 1,158 | |||||||||||
|
Collateralized loan obligations (CLOs) |
13,515 | — | 142 | 13,373 | 1,658 | |||||||||||
|
Asset-based financing |
52,598 | — | 370 | 52,228 | 18,385 | |||||||||||
|
Municipal securities tender option bond trusts (TOBs) |
1,999 | — | 1,999 | — | — | |||||||||||
|
Municipal investments |
5,364 | — | 882 | 4,482 | 375 | |||||||||||
|
Client intermediation |
675 | — | 230 | 445 | 396 | |||||||||||
|
Investment funds |
10,178 | — | 1,037 | 9,141 | 268 | |||||||||||
|
Other |
3,732 | 610 | 1,472 | 1,650 | 604 | |||||||||||
|
Total |
$ | 666,209 | $ | 548,727 | $ | 13,844 | $ | 103,638 | $ | 23,283 | ||||||
|
Total Citigroup |
$ | 960,632 | $ | 712,026 | $ | 29,383 | $ | 219,223 | $ | 76,000 | ||||||
- (1)
-
A
significant unconsolidated VIE is an entity where the Company has any variable interest considered to be significant, regardless of the likelihood of loss
or the notional amount of exposure.
- (2)
- The definition of maximum exposure to loss is included in the text that follows.
Reclassified to conform to the current period's presentation.
118
The previous table does not include:
- •
-
certain venture capital investments made by some of the Company's private equity subsidiaries, as the Company accounts for
these investments in accordance with the Investment Company Audit Guide;
- •
-
certain limited partnerships where the Company is the general partner and the limited partners have the right to replace
the general partner or liquidate the funds;
- •
-
certain investment funds for which the Company provides investment management services and personal estate trusts for
which the Company provides administrative, trustee and/or investment management services;
- •
-
VIEs structured by third parties where the Company holds securities in inventory. These investments are made on
arm's-length terms; and
- •
- certain positions in mortgage-backed and asset-backed securities held by the Company, which are classified as Trading account assets or Investments , where the Company has no other involvement with the related securitization entity. For more information on these positions, please see Notes 9 and 10 to the consolidated financial statements.
Prior to January 1, 2010, the table did not include:
- •
- assets transferred to a VIE where the transfer did not qualify as a sale and where the Company did not have any other involvement that is deemed to be a variable interest with the VIE. These transfers are accounted for as secured borrowings by the Company.
The asset balances for consolidated VIEs represent the carrying amounts of the assets consolidated by the Company. The carrying amount may represent the amortized cost or the current fair value of the assets depending on the legal form of the asset (e.g., security or loan) and the Company's standard accounting policies for the asset type and line of business.
The asset balances for unconsolidated VIEs where the Company has significant involvement represent the most current information available to the Company. In most cases, the asset balances represent an amortized cost basis without regard to impairments in fair value, unless fair value information is readily available to the Company. For VIEs that obtain asset exposures synthetically through derivative instruments (for example, synthetic CDOs), the table includes the full original notional amount of the derivative as an asset.
The maximum funded exposure represents the balance sheet carrying amount of the Company's investment in the VIE. It reflects the initial amount of cash invested in the VIE plus any accrued interest and is adjusted for any impairments in value recognized in earnings and any cash principal payments received. The maximum exposure of unfunded positions represents the remaining undrawn committed amount, including liquidity and credit facilities provided by the Company, or the notional amount of a derivative instrument considered to be a variable interest, adjusted for any declines in fair value recognized in earnings. In certain transactions, the Company has entered into derivative instruments or other arrangements that are not considered variable interests in the VIE (e.g., interest rate swaps, cross-currency swaps, or where the Company is the purchaser of credit protection under a credit default swap or total return swap where the Company pays the total return on certain assets to the SPE). Receivables under such arrangements are not included in the maximum exposure amounts.
Funding Commitments for Significant Unconsolidated VIEs—Liquidity Facilities and Loan Commitments
The following table presents the notional amount of liquidity facilities and loan commitments that are classified as funding commitments in the SPE table as of March 31, 2010:
| In millions of dollars | Liquidity Facilities | Loan Commitments | |||||
|---|---|---|---|---|---|---|---|
|
Citicorp |
|||||||
|
Citi-administered asset-backed commercial paper conduits (ABCP) |
$ | 7,900 | $ | — | |||
|
Third-party commercial paper conduits |
344 | — | |||||
|
Asset-based financing |
4 | 487 | |||||
|
Municipal securities tender option bond trusts (TOBs) |
6,411 | — | |||||
|
Municipal investments |
— | 615 | |||||
|
Other |
— | 46 | |||||
|
Total Citicorp |
$ | 14,659 | $ | 1,148 | |||
|
Citi Holdings |
|||||||
|
Third-party commercial paper conduits |
$ | 252 | $ | — | |||
|
Collateralized loan obligations (CLOs) |
— | 13 | |||||
|
Asset-based financing |
— | 1,251 | |||||
|
Municipal investments |
— | 124 | |||||
|
Investment Funds |
— | 19 | |||||
|
Other |
— | 228 | |||||
|
Total Citi Holdings |
$ | 252 | $ | 1,635 | |||
|
Total Citigroup funding commitments |
$ | 14,911 | $ | 2,783 | |||
119
Citicorp & Citi Holdings Consolidated VIEs
The following table presents the carrying amounts and classifications of consolidated assets that are collateral for consolidated VIE and SPE obligations.
The Company engages in on-balance-sheet securitizations which are securitizations that do not qualify for sales treatment; thus, the assets remain on the Company's balance sheet. The consolidated VIEs included in the tables below represent hundreds of separate entities with which the Company is involved. In general, the third-party investors in the obligations of consolidated VIEs have legal recourse only to the assets of the VIEs and do not have such recourse to the Company, except where the Company has provided a guarantee to the investors or is the counterparty to certain derivative transactions involving the VIE. In addition, the assets are generally restricted only to pay such liabilities. Thus, the Company's maximum legal exposure to loss related to consolidated VIEs is significantly less than the carrying value of the consolidated VIE assets due to outstanding third-party financing. Intercompany assets and liabilities are excluded from the table. All assets are restricted from being sold or pledged as collateral. The cash flows from these assets are the only source used to pay down the associated liabilities, which are non-recourse to the Company's general assets.
|
|
March 31, 2010 | December 31, 2009 | |||||||||||||||||
|---|---|---|---|---|---|---|---|---|---|---|---|---|---|---|---|---|---|---|---|
| In billions of dollars | Citicorp | Citi Holdings | Citigroup | Citicorp | Citi Holdings | Citigroup | |||||||||||||
|
Cash |
$ | 0.8 | $ | 2.0 | $ | 2.8 | $ | — | $ | 1.4 | $ | 1.4 | |||||||
|
Trading account assets |
5.7 | 5.0 | 10.7 | 3.7 | 9.5 | 13.2 | |||||||||||||
|
Investments |
9.9 | 1.0 | 10.9 | 9.8 | 2.8 | 12.6 | |||||||||||||
|
Total loans, net |
92.5 | 77.4 | 169.9 | 0.1 | 25.0 | 25.1 | |||||||||||||
|
Other |
1.5 | 1.1 | 2.6 | 1.9 | 1.3 | 3.2 | |||||||||||||
|
Total Assets |
$ | 110.4 | $ | 86.5 | $ | 196.9 | $ | 15.5 | $ | 40.0 | $ | 55.5 | |||||||
|
Short-term borrowings |
$ | 41.5 | $ | 4.2 | $ | 45.7 | $ | 9.5 | $ | 2.6 | $ | 12.1 | |||||||
|
Long-term debt |
57.8 | 55.8 | 113.6 | 4.6 | 21.2 | 25.8 | |||||||||||||
|
Other Liabilities |
1.5 | 1.0 | 2.5 | 0.1 | 3.6 | 3.7 | |||||||||||||
|
Total Liabilities |
$ | 100.8 | $ | 61.0 | $ | 161.8 | $ | 14.2 | $ | 27.4 | $ | 41.6 | |||||||
Citicorp & Citi Holdings Significant Interests in Unconsolidated VIEs—Balance Sheet Classification
The following tables present the carrying amounts and classification of significant interests in unconsolidated VIEs:
|
|
March 31, 2010 | December 31, 2009 | |||||||||||||||||
|---|---|---|---|---|---|---|---|---|---|---|---|---|---|---|---|---|---|---|---|
| In billions of dollars | Citicorp | Citi Holdings | Citigroup | Citicorp | Citi Holdings | Citigroup | |||||||||||||
|
Trading account assets |
$ | 4.3 | $ | 4.2 | $ | 8.5 | $ | 3.2 | $ | 3.1 | $ | 6.3 | |||||||
|
Investments |
3.0 | 7.2 | 10.2 | 2.0 | 7.3 | 9.3 | |||||||||||||
|
Loans |
1.9 | 9.8 | 11.7 | 2.3 | 10.5 | 12.8 | |||||||||||||
|
Other |
3.3 | 3.9 | 7.2 | 0.5 | 0.1 | 0.6 | |||||||||||||
|
Total Assets |
$ | 12.5 | $ | 25.1 | $ | 37.6 | $ | 8.0 | $ | 21.0 | $ | 29.0 | |||||||
|
Long-term debt |
$ | 0.5 | $ | — | $ | 0.5 | $ | 0.5 | $ | — | $ | 0.5 | |||||||
|
Other Liabilities |
0.4 | — | 0.4 | 0.3 | 0.2 | 0.5 | |||||||||||||
|
Total Liabilities |
$ | 0.9 | $ | — | $ | 0.9 | $ | 0.8 | $ | 0.2 | $ | 1.0 | |||||||
120
Credit Card Securitizations
The Company securitizes credit card receivables through trusts that are established to purchase the receivables. Citigroup transfers receivables into the trusts on a non-recourse basis. Credit card securitizations are revolving securitizations; that is, as customers pay their credit card balances, the cash proceeds are used to purchase new receivables and replenish the receivables in the trust. Prior to 2010, such transfers were accounted for as sale transactions under SFAS 140 and, accordingly, the sold assets were removed from the consolidated balance sheet and a gain or loss was recognized in connection with the transaction. With the adoption of SFAS 166 and SFAS 167, beginning in 2010 the trusts are treated as consolidated entities, because, as servicer, Citigroup has power to direct the activities that most significantly impact the economic performance of the trusts and also holds a seller's interest and certain securities issued by the trusts, and provides liquidity facilities to the trusts, which could result in potentially significant losses or benefits from the trusts. Accordingly, the transferred credit card receivables are required to remain on the consolidated balance sheet with no gain or loss recognized. The debt issued by the trusts to third parties is included in the consolidated balance sheet.
The Company relies on securitizations to fund a significant portion of its credit card businesses in North America. The following table reflects amounts related to the Company's securitized credit card receivables:
|
|
Citicorp | Citi Holdings | ||||||||||||
|---|---|---|---|---|---|---|---|---|---|---|---|---|---|---|
| In billions of dollars |
March 31,
2010 |
December 31,
2009 |
March 31,
2010 |
December 31,
2009 |
||||||||||
|
Principal amount of credit card receivables in trusts |
$ | 72.2 | $ | 78.8 | $ | 38.3 | $ | 42.3 | ||||||
|
Ownership interests in principal amount of trust credit card receivables |
||||||||||||||
|
Sold to investors via trust-issued securities |
56.0 | 66.5 | 20.1 | 28.2 | ||||||||||
|
Retained by Citigroup as trust-issued securities |
4.9 | 5.0 | 8.3 | 10.1 | ||||||||||
|
Retained by Citigroup via non-certificated interests |
11.3 | 7.3 | 9.9 | 4.0 | ||||||||||
|
Total ownership interests in principal amount of trust credit card receivables |
$ | 72.2 | $ | 78.8 | $ | 38.3 | $ | 42.3 | ||||||
|
Other amounts recorded on the balance sheet related to interests retained in the trusts |
||||||||||||||
|
Other retained interests in securitized assets |
NA | $ | 1.4 | NA | $ | 1.6 | ||||||||
|
Residual interest in securitized assets(1) |
NA | 0.3 | NA | 1.2 | ||||||||||
|
Amounts payable to trusts |
NA | 1.2 | NA | 0.8 | ||||||||||
- (1)
- December 31, 2009 balances include net unbilled interest of $0.3 billion for Citicorp and $0.4 billion for Citi Holdings.
Credit Card Securitizations—Citicorp
The Company recorded net gains (losses) from securitization of credit card receivables of $99 million during the three months ended March 31, 2009. Net gains (losses) reflect the following:
- •
-
incremental gains (losses) from new securitizations;
- •
-
the reversal of the allowance for loan losses associated with receivables sold;
- •
-
net gains on replenishments of the trust assets offset by other-than-temporary impairments; and
- •
- changes in fair value for the portion of the residual interest classified as trading assets.
The following table summarizes selected cash flow information related to Citicorp's credit card securitizations for the three months ended March 31, 2010 and 2009:
| In billions of dollars | 2010 | 2009 | |||||
|---|---|---|---|---|---|---|---|
|
Proceeds from new securitizations |
$ | — | $ | 3.5 | |||
|
Pay down of maturing notes |
(10.5 | ) | N/A | ||||
|
Proceeds from collections reinvested in new receivables |
N/A | 35.4 | |||||
|
Contractual servicing fees received |
N/A | 0.3 | |||||
|
Cash flows received on retained interests and other net cash flows |
N/A | 0.9 | |||||
N/A—Not applicable due to the adoption of SFAS 166/167
121
Managed Loans
As previously mentioned, prior to 2010, securitized receivables were treated as sold and removed from the balance sheet. Beginning in 2010, all securitized credit card receivables are included in the consolidated balance sheet. Accordingly, the Managed-basis (Managed) presentation is only relevant prior to 2010.
After securitization of credit card receivables, the Company continues to maintain credit card customer account relationships and provides servicing for receivables transferred to the trusts. As a result, the Company considers the securitized credit card receivables to be part of the business it manages.
Managed-basis presentations are non-GAAP financial measures. Managed presentations include results from both the on-balance-sheet loans and off-balance-sheet loans, and exclude the impact of card securitization activity. Managed presentations assume that securitized loans have not been sold and present the results of the securitized loans in the same manner as Citigroup's owned loans. Citigroup's management believes that Managed presentations provide a greater understanding of ongoing operations and enhance comparability of those results in prior periods as well as demonstrating the effects of unusual gains and charges in the current period. Management further believes that a meaningful analysis of the Company's financial performance requires an understanding of the factors underlying that performance and that investors find it useful to see these non-GAAP financial measures to analyze financial performance without the impact of unusual items that may obscure trends in Citigroup's underlying performance.
Managed Loans—Citicorp
The following tables present a reconciliation between the Managed basis and on-balance-sheet credit card portfolios and the related delinquencies (loans which are 90 days or more past due) and credit losses, net of recoveries.
| In millions of dollars, except loans in billions |
March 31,
2010 |
December 31,
2009 |
|||||
|---|---|---|---|---|---|---|---|
|
Loan amounts, at period end |
|||||||
|
On balance sheet |
$ | 110.2 | $ | 44.8 | |||
|
Securitized amounts |
— | 72.6 | |||||
|
Total managed loans |
$ | 110.2 | $ | 117.4 | |||
|
Delinquencies, at period end |
|||||||
|
On balance sheet |
$ | 3,142 | $ | 1,165 | |||
|
Securitized amounts |
— | 2,121 | |||||
|
Total managed delinquencies |
$ | 3,142 | $ | 3,286 | |||
|
Credit losses, net of recoveries, for the
quarter ended March 31, |
2010 | 2009 | |||||
|---|---|---|---|---|---|---|---|
|
On balance sheet |
$ | 2,749 | $ | 836 | |||
|
Securitized amounts |
— | 1,491 | |||||
|
Total managed |
$ | 2,749 | $ | 2,327 | |||
Credit Card Securitizations—Citi Holdings
The Company recorded net gains (losses) from securitization of Citi Holdings' credit card receivables of $(64) million for the three months ended March 31, 2009.
The following table summarizes selected cash flow information related to Citi Holdings' credit card securitizations for the three months ended March 31, 2010 and 2009:
| In billions of dollars | 2010 | 2009 | |||||
|---|---|---|---|---|---|---|---|
|
Proceeds from new securitizations |
$ | 1.7 | $ | 10.1 | |||
|
Pay down of maturing notes |
(9.8 | ) | N/A | ||||
|
Proceeds from collections reinvested in new receivables |
N/A | 11.6 | |||||
|
Contractual servicing fees received |
N/A | 0.2 | |||||
|
Cash flows received on retained interests and other net cash flows |
N/A | 0.6 | |||||
N/A—Not applicable due to the adoption of SFAS 166/167
Managed Loans—Citi Holdings
The following tables present a reconciliation between the Managed basis and on-balance-sheet credit card portfolios and the related delinquencies (loans which are 90 days or more past due) and credit losses, net of recoveries.
|
In millions of dollars,
except loans in billions |
March 31,
2010 |
December 31,
2009 |
|||||
|---|---|---|---|---|---|---|---|
|
Loan amounts, at period end |
|||||||
|
On balance sheet |
$ | 59.0 | $ | 27.0 | |||
|
Securitized amounts |
— | 38.8 | |||||
|
Total managed loans |
$ | 59.0 | $ | 65.8 | |||
|
Delinquencies, at period end |
|||||||
|
On balance sheet |
$ | 2,279 | $ | 1,250 | |||
|
Securitized amounts |
— | 1,326 | |||||
|
Total managed delinquencies |
$ | 2,279 | $ | 2,576 | |||
|
Credit losses, net of recoveries, for the
quarter ended March 31, |
2010 | 2009 | |||||
|---|---|---|---|---|---|---|---|
|
On balance sheet |
$ | 2,126 | $ | 1,107 | |||
|
Securitized amounts |
— | 1,058 | |||||
|
Total managed credit losses |
$ | 2,126 | $ | 2,165 | |||
Funding, Liquidity Facilities and Subordinated Interests
Citigroup securitizes credit card receivables through three securitization trusts — Citibank Credit Card Master Trust ("Master Trust"), which is part of Citicorp, and the Citibank OMNI Master Trust ("Omni Trust") and Broadway Credit Card Trust ("Broadway Trust"), which are part of Citi Holdings.
Master Trust issues fixed- and floating-rate term notes as well as commercial paper. Some of the term notes are issued to multi-seller commercial paper conduits. In 2009, the Master Trust issued $4.3 billion of notes that are eligible for the Term Asset-Backed Securities Loan Facility (TALF) program, where investors can borrow from the Federal Reserve using the trust securities as collateral. The weighted average maturity of the term notes issued by the Master Trust was 3.5 years as of March 31, 2010 and 3.6 years as of December 31, 2009. Beginning in 2010, the liabilities of the trusts are included in the Consolidated Balance Sheet.
122
Master Trust liabilities (at par value)
| In billions of dollars |
March 31,
2010 |
December 31,
2009 |
|||||
|---|---|---|---|---|---|---|---|
|
Term notes issued to multi- seller CP conduits |
$ | 0.2 | $ | 0.8 | |||
|
Term notes issued to third parties |
48.8 | 51.2 | |||||
|
Term notes retained by Citigroup affiliates |
4.9 | 5.0 | |||||
|
Commercial paper |
7.0 | 14.5 | |||||
|
Total Master Trust liabilities |
$ | 60.9 | $ | 71.5 | |||
Both Omni and Broadway Trusts issue fixed- and floating-rate term notes, some of which are purchased by multi-seller commercial paper conduits. The Omni Trust also issues commercial paper. During 2009, a portion of the Omni Trust commercial paper had been purchased by the Federal Reserve's Commercial Paper Funding Facility (CPFF). In addition, some of the multi-seller conduits that hold Omni Trust term notes had placed commercial paper with CPFF. No Omni trust liabilities were funded through CPFF as of March 31, 2010. The total amount of Omni Trust liabilities funded directly or indirectly through the CPFF was $2.5 billion at December 31, 2009.
The weighted average maturity of the third-party term notes issued by the Omni Trust was 2.0 years as of March 31, 2010 and December 31, 2009. The weighted average maturity of the third-party term notes issued by the Broadway Trust was 2.3 years as of March 31, 2010 and 2.5 years as of December 31, 2009.
Omni Trust liabilities (at par value)
| In billions of dollars |
March 31,
2010 |
December 31,
2009 |
|||||
|---|---|---|---|---|---|---|---|
|
Term notes issued to multi- seller commercial paper conduits |
$ | 9.4 | $ | 13.1 | |||
|
Term notes issued to third parties |
9.2 | 9.2 | |||||
|
Term notes retained by Citigroup affiliates |
8.0 | 9.8 | |||||
|
Commercial paper |
— | 4.4 | |||||
|
Total Omni Trust liabilities |
$ | 26.6 | $ | 36.5 | |||
Broadway Trust liabilities (at par value)
| In billions of dollars |
March 31,
2010 |
December 31,
2009 |
|||||
|---|---|---|---|---|---|---|---|
|
Term notes issued to multi- seller commercial paper conduits |
$ | 0.5 | $ | 0.5 | |||
|
Term notes issued to third parties |
1.0 | 1.0 | |||||
|
Term notes retained by Citigroup affiliates |
0.3 | 0.3 | |||||
|
Total Broadway Trust liabilities |
$ | 1.8 | $ | 1.8 | |||
Citibank (South Dakota), N.A. is the sole provider of full liquidity facilities to the commercial paper programs of the Master and Omni Trusts. Both of these facilities, which represent contractual obligations on the part of Citibank (South Dakota), N.A. to provide liquidity for the issued commercial paper, are made available on market terms to each of the trusts. The liquidity facilities require Citibank (South Dakota), N.A. to purchase the commercial paper issued by each trust at maturity, if the commercial paper does not roll over, as long as there are available credit enhancements outstanding, typically in the form of subordinated notes. As there was no Omni trust commercial paper outstanding as of March 31, 2010, there was no liquidity commitment at that time. The liquidity commitment related to the Omni Trust commercial paper programs amounted to $4.4 billion at December 31, 2009. The liquidity commitment related to the Master Trust commercial paper program amounted to $7.0 billion at March 31, 2010 and $14.5 billion at December 31, 2009. As of March 31, 2010 and December 31, 2009, none of the Master Trust liquidity commitment was drawn.
In addition, Citibank (South Dakota), N.A. had provided liquidity to a third-party, non-consolidated multi-seller commercial paper conduit, which is not a VIE. The commercial paper conduit had acquired notes issued by the Omni Trust. The liquidity commitment to the third-party conduit was $2.5 billion at December 31, 2009, of which none was drawn.
During 2009, all three of Citigroup's primary credit card securitization trusts—Master Trust, Omni Trust, and Broadway Trust—had bonds placed on ratings watch with negative implications by rating agencies. As a result of the ratings watch status, certain actions were taken by Citi with respect to each of the trusts. In general, the actions subordinated certain senior interests in the trust assets that were retained by Citi, which effectively placed these interests below investor interests in terms of priority of payment.
As a result of these actions, based on the applicable regulatory capital rules, Citigroup began including the sold assets for all three of the credit card securitization trusts in its risk-weighted assets for purposes of calculating its risk-based capital ratios during 2009. The increase in risk-weighted assets occurred in the quarter during 2009 in which the respective actions took place. The effect of these changes increased Citigroup's risk-weighted assets by approximately $82 billion, and decreased Citigroup's Tier 1 Capital ratio by approximately 100 basis points each as of March 31, 2009, with respect to the Master and Omni Trusts. The inclusion of the Broadway Trust increased Citigroup's risk-weighted assets
123
by an additional approximately $900 million at June 30, 2009. With the consolidation of the trusts, beginning in 2010 the credit card receivables that had previously been considered sold under SFAS 140 are now included in the Consolidated Balance Sheet and accordingly these assets continue to be included in Citigroup's risk-weighted assets. All bond ratings for each of the trusts have been affirmed by the rating agencies and no downgrades have occurred as of March 31, 2010.
Mortgage Securitizations
The Company provides a wide range of mortgage loan products to a diverse customer base.
Once originated, the Company often securitizes these loans through the use of SPEs, which prior to 2010 were QSPEs. These SPEs are funded through the issuance of Trust Certificates backed solely by the transferred assets. These certificates have the same average life as the transferred assets. In addition to providing a source of liquidity and less expensive funding, securitizing these assets also reduces the Company's credit exposure to the borrowers. These mortgage loan securitizations are primarily non-recourse, thereby effectively transferring the risk of future credit losses to the purchasers of the securities issued by the trust. However, the Company's Consumer business generally retains the servicing rights and in certain instances retains investment securities, interest-only strips and residual interests in future cash flows from the trusts. Securities and Banking and Special Asset Pool retain servicing for a limited number of their mortgage securitizations.
The Company securitizes mortgage loans generally through either a government-sponsored agency, such as Ginnie Mae, FNMA or Freddie Mac (U.S. agency–sponsored mortgages), or private label (Non-agency-sponsored mortgages) securitization. The Company is not the primary beneficiary of its U.S. agency-sponsored mortgage securitizations, because Citigroup does not have the power to direct the activities of the SPE that most significantly impact the entity's economic performance. Therefore, Citi does not consolidate these U.S. agency-sponsored mortgage securitizations. In certain instances, the Company has (1) the power to direct the activities and (2) the obligation to either absorb losses or right to receive benefits that could be potentially significant to its Non-agency-sponsored mortgage securitizations and therefore consolidates those SPEs as primary beneficiary. When both of these two characteristics are met, the Company consolidates the SPE.
Mortgage Securitizations — Citicorp
The following tables summarize selected cash flow information related to mortgage securitizations for the quarters ended March 31, 2010 and 2009:
|
|
2010 | 2009 | ||||||||
|---|---|---|---|---|---|---|---|---|---|---|
| In billions of dollars |
U.S. agency-
sponsored mortgages |
Non-agency-
sponsored mortgages |
Agency- and non-agency-
sponsored mortgages |
|||||||
|
Proceeds from new securitizations |
$ | 10.6 | $ | 0.5 | $ | 1.3 | ||||
|
Contractual servicing fees received |
0.1 | — | — | |||||||
|
Cash flows received on retained interests and other net cash flows |
— | — | — | |||||||
Gains (losses) recognized on the securitization of U.S. agency-sponsored mortgages during the first quarter of 2010 were $3 million. For the quarter ended March 31, 2010, gains (losses) recognized on the securitization of non-agency-sponsored mortgages were $1 million.
Agency and non-agency securitization gains (losses) for the quarter ended March 31, 2009 were $3 million and $15 million, respectively.
Key assumptions used in measuring the fair value of retained interests at the date of sale or securitization of mortgage receivables for the quarters ended March 31, 2010 and 2009 are as follows:
|
|
March 31, 2010 | March 31, 2009 | ||||
|---|---|---|---|---|---|---|
|
|
U.S. agency-
sponsored mortgages |
Non-agency-
sponsored mortgages |
Agency- and non-agency-
sponsored mortgages |
|||
|
Discount rate |
2.7% to 27.2% | 2.2% to 44.8% | 0.0% to 29.6% | |||
|
Constant prepayment rate |
4.4% to 28.0% | 3.0% to 5.0% | 2.0% to 48.3% | |||
|
Anticipated net credit losses |
0.0% | 40.0% to 80.0% | 0.0% to 85.0% | |||
The range in the key assumptions is due to the different characteristics of the interests retained by the Company. The interests retained range from highly rated and/or senior in the capital structure to unrated and/or residual interests.
The effect of adverse changes of 10% and 20% in each of the key assumptions used to determine the fair value of retained interests is disclosed below. The negative effect of each change is calculated independently, holding all other assumptions constant. Because the key assumptions may not in fact be independent, the net effect of simultaneous adverse changes in the key assumptions may be less than the sum of the individual effects shown below.
124
At March 31, 2010, the key assumptions used to value retained interests and the sensitivity of the fair value to adverse changes of 10% and 20% in each of the key assumptions were as follows:
|
|
March 31, 2010 | |||
|---|---|---|---|---|
|
|
U.S. agency-
sponsored mortgages |
Non-agency-
sponsored mortgages |
||
|
Discount rate |
2.7% to 27.2% | 2.2% to 44.8% | ||
|
Constant prepayment rate |
9.9% to 28.0% | 3.0% to 9.8% | ||
|
Anticipated net credit losses |
0.0% | 0.0% to 80.0% | ||
| In millions of dollars |
U.S. agency-
sponsored mortgages |
Non-agency-
sponsored mortgages |
||||||
|---|---|---|---|---|---|---|---|---|
|
Carrying value of retained interests |
$ | 2,755 | $ | 728 | ||||
|
Discount rates |
||||||||
|
Adverse change of 10% |
$ | (99 | ) | $ | (21 | ) | ||
|
Adverse change of 20% |
(192 | ) | (41 | ) | ||||
|
Constant prepayment rate |
||||||||
|
Adverse change of 10% |
$ | (114 | ) | $ | (9 | ) | ||
|
Adverse change of 20% |
(220 | ) | (19 | ) | ||||
|
Anticipated net credit losses |
||||||||
|
Adverse change of 10% |
$ | (1 | ) | $ | (33 | ) | ||
|
Adverse change of 20% |
(2 | ) | (61 | ) | ||||
Mortgage Securitizations—Citi Holdings
The following tables summarize selected cash flow information related to mortgage securitizations for the quarters ended March 31, 2010 and 2009:
|
|
2010 | 2009 | ||||||||
|---|---|---|---|---|---|---|---|---|---|---|
| In billions of dollars |
U.S. agency-
sponsored mortgages |
Non-agency-
sponsored mortgages |
Agency- and Non-agency-
sponsored mortgages |
|||||||
|
Proceeds from new securitizations |
$ | — | $ | — | $ | 20.0 | ||||
|
Contractual servicing fees received |
0.2 | — | 0.4 | |||||||
|
Cash flows received on retained interests and other net cash flows |
— | — | 0.1 | |||||||
The Company did not recognize gains (losses) on the securitization of U.S. agency- and Non-agency-sponsored mortgages in the quarters ended March 31, 2010 and 2009.
Key assumptions used in measuring the fair value of retained interests at the date of sale or securitization of mortgage receivables for the quarters ended March 31, 2010 and 2009 are as follows:
|
|
2010 | 2009 | ||||
|---|---|---|---|---|---|---|
|
|
U.S. agency-
sponsored mortgages |
Non-agency
sponsored mortgages |
Agency- and Non-agency-
sponsored mortgages |
|||
|
Discount rate |
N/A | N/A | 0.0% to 52.2% | |||
|
Constant prepayment rate |
N/A | N/A | 2.0% to 18.2% | |||
|
Anticipated net credit losses |
N/A | N/A | 0.1% to 85.0% | |||
N/A Not applicable
125
The range in the key assumptions is due to the different characteristics of the interests retained by the Company. The interests retained range from highly rated and/or senior in the capital structure to unrated and/or residual interests.
The effect of adverse changes of 10% and 20% in each of the key assumptions used to determine the fair value of retained interests is disclosed below. The negative effect of each change is calculated independently, holding all other assumptions constant. Because the key assumptions may not in fact be independent, the net effect of simultaneous adverse changes in the key assumptions may be less than the sum of the individual effects shown below.
At March 31, 2010, the key assumptions used to value retained interests and the sensitivity of the fair value to adverse changes of 10% and 20% in each of the key assumptions were as follows:
|
|
March 31, 2010 | ||||
|---|---|---|---|---|---|
|
|
U.S. agency-
sponsored mortgages |
Non-agency-
sponsored mortgages |
|||
|
Discount rate |
12.1 | % | 2.2% to 44.8% | ||
|
Constant prepayment rate |
14.8 | % | 5.0% to 12.6% | ||
|
Anticipated net credit losses |
0.0 | % | 0.1% to 70.0% | ||
|
Weighted average life |
6.2 years | 0.1 to 9.4 years | |||
| In millions of dollars |
U.S. agency-
sponsored mortgages |
Non-agency-
sponsored mortgages |
||||||
|---|---|---|---|---|---|---|---|---|
|
Carrying value of retained interests |
$ | 3,634 | $ | 514 | ||||
|
Discount rates |
||||||||
|
Adverse change of 10% |
$ | (146 | ) | $ | (33 | ) | ||
|
Adverse change of 20% |
(282 | ) | (64 | ) | ||||
|
Constant prepayment rate |
||||||||
|
Adverse change of 10% |
$ | (206 | ) | $ | (32 | ) | ||
|
Adverse change of 20% |
(396 | ) | (63 | ) | ||||
|
Anticipated net credit losses |
||||||||
|
Adverse change of 10% |
$ | (8 | ) | $ | (36 | ) | ||
|
Adverse change of 20% |
(16 | ) | (70 | ) | ||||
126
Mortgage Servicing Rights
In connection with the securitization of mortgage loans, the Company's U.S. Consumer mortgage business retains the servicing rights, which entitle the Company to a future stream of cash flows based on the outstanding principal balances of the loans and the contractual servicing fee. Failure to service the loans in accordance with contractual requirements may lead to a termination of the servicing rights and the loss of future servicing fees.
The fair value of capitalized mortgage servicing rights (MSRs) was $6.4 billion and $5.5 billion at March 31, 2010 and 2009, respectively. The MSRs correspond to principal loan balances of $542 billion and $610 billion as of March 31, 2010 and 2009, respectively. The following table summarizes the changes in capitalized MSRs for the quarters ended March 31, 2010 and 2009:
| In millions of dollars | 2010 | 2009 | |||||
|---|---|---|---|---|---|---|---|
|
Balance, beginning of year |
$ | 6,530 | $ | 5,657 | |||
|
Originations |
152 | 235 | |||||
|
Changes in fair value of MSRs due to changes in inputs and assumptions |
90 | 174 | |||||
|
Other changes(1) |
(333 | ) | (585 | ) | |||
|
Balance, as of March 31 |
$ | 6,439 | $ | 5,481 | |||
- (1)
- Represents changes due to customer payments and passage of time.
The market for MSRs is not sufficiently liquid to provide participants with quoted market prices. Therefore, the Company uses an option-adjusted spread valuation approach to determine the fair value of MSRs. This approach consists of projecting servicing cash flows under multiple interest rate scenarios and discounting these cash flows using risk-adjusted discount rates. The key assumptions used in the valuation of MSRs include mortgage prepayment speeds and discount rates. The model assumptions and the MSRs' fair value estimates are compared to observable trades of similar MSR portfolios and interest-only security portfolios, as available, as well as to MSR broker valuations and industry surveys. The cash flow model and underlying prepayment and interest rate models used to value these MSRs are subject to validation in accordance with the Company's model validation policies.
The fair value of the MSRs is primarily affected by changes in prepayments that result from shifts in mortgage interest rates. In managing this risk, the Company economically hedges a significant portion of the value of its MSRs through the use of interest rate derivative contracts, forward purchase commitments of mortgage-backed securities and purchased securities classified as trading.
The Company receives fees during the course of servicing previously securitized mortgages. The amounts of these fees for the quarters ended March 31, 2010 and 2009 were as follows:
| In millions of dollars | 2010 | 2009 | |||||
|---|---|---|---|---|---|---|---|
|
Servicing fees |
$ | 369 | $ | 429 | |||
|
Late fees |
23 | 25 | |||||
|
Ancillary fees |
39 | 20 | |||||
|
Total MSR fees |
$ | 431 | $ | 474 | |||
These fees are classified in the Consolidated Statement of Income as Commissions and fees .
Student Loan Securitizations
The Company indirectly owns, through Citibank, N.A., 80% of the outstanding common stock of The Student Loan Corporation (SLC), which is located within Citi Holdings— Local Consumer Lending . Through this business, the Company maintains programs to securitize certain portfolios of student loan assets. Under these securitization programs, loans are sold to VIEs (some of them being former QSPEs), which are funded through the issuance of pass-through term notes collateralized solely by the trust assets.
The Company has (1) the power to direct the activities of these VIEs that most significantly impact their economic performance and (2) the obligation to either absorb losses or the right to receive benefits that could be potentially significant to the VIEs.
As a result of the adoption of SFAS 166 and SFAS 167, the Company consolidated all student loan trusts that were formerly QSPEs, as well as newly created securitization VIEs, as the primary beneficiary. Prior to the adoption of SFAS 166 and SFAS 167, the student loan securitizations through QSPEs were accounted for as off-balance-sheet securitizations, with the Company generally retaining interest in the form of subordinated residual interests (i.e., interest only strips) and servicing rights.
Under terms of the trust arrangements, the Company has no obligation to provide financial support and has not provided such support. A substantial portion of the credit risk associated with the securitized loans has been transferred to third-party guarantors or insurers either under the Federal Family Education Loan Program (FFEL Program), authorized by the U.S. Department of Education under the Higher Education Act of 1965, as amended, or through private credit insurance. On March 30, 2010, the Health Care and Education Reconciliation Act of 2010 was signed into law, which eliminated new FFEL Program loan originations. Effective July 1, 2010, in compliance with this regulatory change, SLC will cease originating new FFEL Program loans. This change is not currently anticipated to materially impact the Company's financial statements.
The following table summarizes selected cash flow information related to student loan securitizations for the three months ended March 31, 2010 and 2009:
| In billions of dollars | 2010 | 2009 | |||||
|---|---|---|---|---|---|---|---|
|
Cash flows received on retained interests and other net cash flows |
$ | — | $ | 0.1 | |||
Citi-Administered Asset-Backed Commercial Paper Conduits
The Company is active in the asset-backed commercial paper conduit business as administrator of several multi-seller commercial paper conduits, and also as a service provider to single-seller and other commercial paper conduits sponsored by third parties.
The multi-seller commercial paper conduits are designed to provide the Company's customers access to low-cost funding in the commercial paper markets. The conduits purchase assets from or provide financing facilities to customers and are funded by issuing commercial paper to third-party investors. The conduits generally do not purchase assets originated by the Company. The funding of the conduit is facilitated by the liquidity support and credit enhancements provided by the Company.
127
As administrator to the conduits, the Company is generally responsible for selecting and structuring assets purchased or financed by the conduits, making decisions regarding the funding of the conduits, including determining the tenor and other features of the commercial paper issued, monitoring the quality and performance of the conduits' assets, and facilitating the operations and cash flows of the conduits. In return, the Company earns structuring fees from customers for individual transactions and earns an administration fee from the conduit, which is equal to the income from client program and liquidity fees of the conduit after payment of interest costs and other fees. This administration fee is fairly stable, since most risks and rewards of the underlying assets are passed back to the customers and, once the asset pricing is negotiated, most ongoing income, costs and fees are relatively stable as a percentage of the conduit's size.
The conduits administered by the Company do not generally invest in liquid securities that are formally rated by third parties. The assets are privately negotiated and structured transactions that are designed to be held by the conduit, rather than actively traded and sold. The yield earned by the conduit on each asset is generally tied to the rate on the commercial paper issued by the conduit, thus passing interest rate risk to the client. Each asset purchased by the conduit is structured with transaction-specific credit enhancement features provided by the third-party seller, including over collateralization, cash and excess spread collateral accounts, direct recourse or third-party guarantees. These credit enhancements are sized with the objective of approximating a credit rating of A or above, based on the Company's internal risk ratings.
Substantially all of the funding of the conduits is in the form of short-term commercial paper, with a weighted average life generally ranging from 30 to 45 days. As of March 31, 2010 and December 31, 2009, the weighted average life of the commercial paper issued by consolidated and unconsolidated conduits was approximately 48 days and 30 days, respectively. In addition, as of March 31, 2010 the conduits have issued subordinate loss notes and equity with a notional amount of approximately $39 million and varying remaining tenors ranging from 1 day to 5 years.
The primary credit enhancement provided to the conduit investors is in the form of transaction-specific credit enhancement described above. In addition, there are generally two additional forms of credit enhancement that protect the commercial paper investors from defaulting assets. First, the subordinate loss notes issued by each conduit absorb any credit losses up to their full notional amount. Second, each conduit has obtained a letter of credit from the Company, which is generally 8-10% of the conduit's assets. The letters of credit provided by the Company to the consolidated conduits total approximately $3.4 billion. The net result across all multi-seller conduits administered by the Company is that, in the event defaulted assets exceed the transaction-specific credit enhancement described above, any losses in each conduit are allocated in the following order:
- •
-
subordinate loss note holders,
- •
-
the Company, and
- •
- the commercial paper investors.
The Company also provides the conduits with two forms of liquidity agreements that are used to provide funding to the conduits in the event of a market disruption, among other events. Each asset of the conduit is supported by a transaction-specific liquidity facility in the form of an asset purchase agreement (APA). Under the APA, the Company has agreed to purchase non-defaulted eligible receivables from the conduit at par. Any assets purchased under the APA are subject to increased pricing. The APA is not designed to provide credit support to the conduit, as it generally does not permit the purchase of defaulted or impaired assets and generally reprices the assets purchased to consider potential increased credit risk. The APA covers all assets in the conduits and is considered in the Company's maximum exposure to loss. In addition, the Company provides the conduits with program-wide liquidity in the form of short-term lending commitments. Under these commitments, the Company has agreed to lend to the conduits in the event of a short-term disruption in the commercial paper market, subject to specified conditions. The total notional exposure under the program-wide liquidity agreement for the Company's unconsolidated administered conduit is $0.6 billion and is considered in the Company's maximum exposure to loss. The Company receives fees for providing both types of liquidity agreement and considers these fees to be on fair market terms.
Finally, the Company is one of several named dealers in the commercial paper issued by the conduits and earns a market-based fee for providing such services. Along with third-party dealers, the Company makes a market in the commercial paper and may from time to time fund commercial paper pending sale to a third party. On specific dates with less liquidity in the market, the Company may hold in inventory commercial paper issued by conduits administered by the Company, as well as conduits administered by third parties. The amount of commercial paper issued by its administered conduits held in inventory fluctuates based on market conditions and activity. As of March 31, 2010, the Company owned none of the commercial paper issued by its unconsolidated administered conduit.
Upon adoption of SFAS 167 on January 1, 2010, with the exception of the government-guaranteed loan conduit described below, the asset-backed commercial paper conduits were consolidated by the Company. The Company determined that through its role as administrator it had the power to direct the activities that most significantly impacted the entities' economic performance. These powers included its ability to structure and approve the assets purchased by the conduits, its ongoing surveillance and credit mitigation activities, and its liability management. In addition, as a result of all the Company's involvement described above, it was concluded that the Company had an economic interest that could potentially be significant.
The Company administers one conduit that originates loans to third-party borrowers and those obligations are fully guaranteed primarily by AAA-rated government agencies that support export and development financing programs. The economic performance of this government-guaranteed loan conduit is most significantly impacted by the performance of its underlying assets. The guarantors must approve each loan held by the entity and the guarantors have the ability (through establishment of the servicing terms to direct default mitigation and to purchase defaulted loans) to manage the
128
conduit's loans that become delinquent to improve the economic performance of the conduit. Because the Company does not have the power to direct the activities of this government-guaranteed loan conduit that most significantly impact the economic performance of the entity, it was concluded that the Company should not consolidate the entity. As of March 31, 2010, this unconsolidated government-guaranteed loan conduit held assets of approximately $7.9 billion.
Prior to January 1, 2010, the Company was required to analyze the expected variability of the conduit quantitatively to determine whether the Company is the primary beneficiary of the conduit. The Company performed this analysis on a quarterly basis. For conduits where the subordinate loss notes or third-party guarantees were sufficient to absorb a majority of the expected loss of the conduit, the Company did not consolidate. In circumstances where the subordinate loss notes or third-party guarantees were insufficient to absorb a majority of the expected loss, the Company consolidated the conduit as its primary beneficiary due to the additional credit enhancement provided by the Company. In conducting this analysis, the Company considers three primary sources of variability in the conduit: credit risk, interest rate risk and fee variability.
Third-Party Commercial Paper Conduits
The Company also provides liquidity facilities to single- and multi-seller conduits sponsored by third parties. These conduits are independently owned and managed and invest in a variety of asset classes, depending on the nature of the conduit. The facilities provided by the Company typically represent a small portion of the total liquidity facilities obtained by each conduit, and are collateralized by the assets of each conduit. As of March 31, 2010, the notional amount of these facilities was approximately $827 million, and $231 million was funded under these facilities. The Company is not the party that has the power to direct the activities of these conduits that most significantly impact their economic performance and thus does not consolidate them.
Collateralized Debt and Loan Obligations
A securitized collateralized debt obligation (CDO) is an SPE that purchases a pool of assets consisting of asset-backed securities and synthetic exposures through derivatives on asset-backed securities and issues multiple tranches of equity and notes to investors. A third-party asset manager is typically retained by the CDO to select the pool of assets and manage those assets over the term of the CDO. The Company earns fees for warehousing assets prior to the creation of a CDO, structuring CDOs and placing debt securities with investors. In addition, the Company has retained interests in many of the CDOs it has structured and makes a market in those issued notes.
A cash CDO, or arbitrage CDO, is a CDO designed to take advantage of the difference between the yield on a portfolio of selected assets, typically residential mortgage-backed securities, and the cost of funding the CDO through the sale of notes to investors. "Cash flow" CDOs are vehicles in which the CDO passes on cash flows from a pool of assets, while "market value" CDOs pay to investors the market value of the pool of assets owned by the CDO at maturity. Both types of CDOs are typically managed by a third-party asset manager. In these transactions, all of the equity and notes issued by the CDO are funded, as the cash is needed to purchase the debt securities. In a typical cash CDO, a third-party investment manager selects a portfolio of assets, which the Company funds through a warehouse financing arrangement prior to the creation of the CDO. The Company then sells the debt securities to the CDO in exchange for cash raised through the issuance of notes. The Company's continuing involvement in cash CDOs is typically limited to investing in a portion of the notes or loans issued by the CDO and making a market in those securities, and acting as derivative counterparty for interest rate or foreign currency swaps used in the structuring of the CDO.
A synthetic CDO is similar to a cash CDO, except that the CDO obtains exposure to all or a portion of the referenced assets synthetically through derivative instruments, such as credit default swaps. Because the CDO does not need to raise cash sufficient to purchase the entire referenced portfolio, a substantial portion of the senior tranches of risk is typically passed on to CDO investors in the form of unfunded liabilities or derivative instruments. Thus, the CDO writes credit protection on select referenced debt securities to the Company or third parties and the risk is then passed on to the CDO investors in the form of funded notes or purchased credit protection through derivative instruments. Any cash raised from investors is invested in a portfolio of collateral securities or investment contracts. The collateral is then used to support the obligations of the CDO on the credit default swaps written to counterparties. The Company's continuing involvement in synthetic CDOs generally includes purchasing credit protection through credit default swaps with the CDO, owning a portion of the capital structure of the CDO in the form of both unfunded derivative positions (primarily super-senior exposures discussed below) and funded notes, entering into interest-rate swap and total-return swap transactions with the CDO, lending to the CDO, and making a market in those funded notes.
A securitized collateralized loan obligation (CLO) is substantially similar to the CDO transactions described above, except that the assets owned by the SPE (either cash instruments or synthetic exposures through derivative instruments) are corporate loans and to a lesser extent corporate bonds, rather than asset-backed debt securities.
Where a CDO vehicle issues preferred shares, the preferred shares generally represent an insufficient amount of equity (less than 10%) and create the presumption that the preferred shares are insufficient to finance the entity's activities without subordinated financial support. In addition, although the preferred shareholders generally have full exposure to expected losses on the collateral and uncapped potential to receive expected residual rewards, it is not always clear whether they have the ability to make decisions about the entity that have a significant effect on the entity's financial results because of their limited role in making day-to-day decisions and their limited ability to remove the third-party asset manager. Because one or both of the above conditions will generally be met, we have assumed that, even where a CDO vehicle issued preferred shares, the vehicle should be classified as a VIE.
129
Consolidation and subsequent deconsolidation of CDOs
Substantially all of the CDOs that the Company is involved with are managed by a third-party asset manager. In general, the third-party asset manager, through its ability to purchase and sell assets or, where the reinvestment period of a CDO has expired, the ability to sell assets, will have the power to direct the activities of the vehicle that most significantly impact the economic performance of the CDO. However, where a CDO has experienced an event of default, the activities of the third-party asset manager may be curtailed and certain additional rights will generally be provided to the investors in a CDO vehicle, including the right to direct the liquidation of the CDO vehicle.
The Company has retained significant portions of the "super-senior" positions issued by certain CDOs. These positions are referred to as "super-senior" because they represent the most senior positions in the CDO and, at the time of structuring, were senior to tranches rated AAA by independent rating agencies. These positions include facilities structured in the form of short-term commercial paper, where the Company wrote put options ("liquidity puts") to certain CDOs. Under the terms of the liquidity puts, if the CDO was unable to issue commercial paper at a rate below a specified maximum (generally LIBOR + 35 bps to LIBOR + 40 bps), the Company was obligated to fund the senior tranche of the CDO at a specified interest rate. As of March 31, 2010, the Company had purchased all $25 billion of the commercial paper subject to these liquidity puts.
Since the inception of many CDO transactions, the subordinate tranches of the CDOs have diminished significantly in value and in rating. The declines in value of the subordinate tranches and in the super-senior tranches indicate that the super-senior tranches are now exposed to a significant portion of the expected losses of the CDOs, based on current market assumptions.
The Company does not generally have the power to direct the activities of the vehicle that most significantly impact the economic performance of the CDOs as this power is held by the third-party asset manager of the CDO. As such, certain synthetic and cash CDOs that were consolidated under ASC 810, were deconsolidated upon the adoption of SFAS 167. The deconsolidation of certain synthetic CDOs resulted in the recognition of current receivables and payables related to purchased and written credit default swaps entered into by Citigroup with the CDOs, which had previously been eliminated upon consolidation of these vehicles.
Where: (i) an event of default has occurred for a CDO vehicle, (ii) the Company has the unilateral ability to remove the third-party asset manager without cause or liquidate the CDO, and (iii) the Company has exposure to the vehicle that is potentially significant to the vehicle, the Company will consolidate the CDO. In addition, where the Company is the asset manager of the CDO vehicle and has exposure to the vehicle that is potentially significant, the Company will generally consolidate the CDO.
The net impact of adopting SFAS 167 for CDOs was an increase in the Company's assets of $1.9 billion and liabilities of $1.9 billion as of January 1, 2010. During the quarter, the Company consolidated 5 CDO vehicles due to the Company's obtaining the unilateral ability to remove the third-party asset manager without cause or liquidate the CDO. The Company continues to monitor its involvement in unconsolidated VIEs. If the Company were to acquire additional interests in these vehicles, be provided the right to direct the activities of a VIE, or if the CDOs' contractual arrangements were to be changed to reallocate expected losses or residual returns among the various interest holders, the Company may be required to consolidate the CDOs. For cash CDOs, the net result of such consolidation would be to gross up the Company's balance sheet by the current fair value of the subordinate securities held by third parties, whose amounts are not considered material. For synthetic CDOs, the net result of such consolidation may reduce the Company's balance sheet by eliminating intercompany derivative receivables and payables in consolidation.
Key Assumptions and Retained Interests—Citi Holdings
The key assumptions, used for the securitization of CDOs and CLOs during the quarter ended March 31, 2010, in measuring the fair value of retained interests at the date of sale or securitization are as follows:
|
|
CDOs | CLOs | ||
|---|---|---|---|---|
|
Discount rate |
36.2% to 39.5% | 3.6% to 4.0% | ||
The effect of two negative changes in discount rates used to determine the fair value of retained interests is disclosed below.
| In millions of dollars | CDOs | CLOs | |||||
|---|---|---|---|---|---|---|---|
|
Carrying value of retained interests |
$ | 194 | $ | 677 | |||
|
Discount rates |
|||||||
|
Adverse change of 10% |
$ | (24 | ) | $ | (9 | ) | |
|
Adverse change of 20% |
(47 | ) | (19 | ) | |||
Asset-Based Financing — Citicorp
The Company provides loans and other forms of financing to VIEs that hold assets. Those loans are subject to the same credit approvals as all other loans originated or purchased by the Company. Financings in the form of debt securities or derivatives are, in most circumstances, reported in Trading account assets and accounted for at fair value through earnings. The Company does not have the power to direct the activities that most significantly impact these VIEs' economic performance and thus it does not consolidate them.
The primary types of Citicorp's asset-based financing, total assets of the unconsolidated VIEs with significant involvement and the Company's maximum exposure to loss at March 31, 2010 are shown below. For the Company to realize that maximum loss, the VIE (borrower) would have to default with no recovery from the assets held by the VIE.
|
In billions of dollars
Type |
Total
assets |
Maximum
exposure |
|||||
|---|---|---|---|---|---|---|---|
|
Commercial and other real estate |
$ | 8.0 | $ | 0.3 | |||
|
Hedge funds and equities |
5.5 | 2.8 | |||||
|
Airplanes, ships and other assets |
6.7 | 1.4 | |||||
|
Total |
$ | 20.2 | $ | 4.5 | |||
130
Asset-Based Financing—Citi Holdings
The Company provides loans and other forms of financing to VIEs that hold assets. Those loans are subject to the same credit approvals as all other loans originated or purchased by the Company. Financings in the form of debt securities or derivatives are, in most circumstances, reported in Trading account assets and accounted for at fair value through earnings.
The primary types of Citi Holdings' asset-based financing, total assets of the unconsolidated VIEs with significant involvement and the Company's maximum exposure to loss at March 31, 2010 are shown below. For the Company to realize that maximum loss, the VIE (borrower) would have to default with no recovery from the assets held by the VIE.
|
In billions of dollars
Type |
Total
assets |
Maximum
exposure |
|||||
|---|---|---|---|---|---|---|---|
|
Commercial and other real estate |
$ | 34.1 | $ | 6.8 | |||
|
Hedge funds and equities |
2.4 | 0.8 | |||||
|
Corporate loans |
7.9 | 6.8 | |||||
|
Airplanes, ships and other assets |
5.7 | 3.0 | |||||
|
Total |
$ | 50.1 | $ | 17.4 | |||
The following table summarizes selected cash flow information related to asset-based financing for the quarter ended March 31, 2010 and 2009:
| In billions of dollars | 2010 | 2009 | |||||
|---|---|---|---|---|---|---|---|
|
Cash flows received on retained interests and other net cash flows |
$ | 0.5 | $ | 1.9 | |||
The effect of two negative changes in discount rates used to determine the fair value of retained interests is disclosed below.
| In millions of dollars |
Asset-based
financing |
|||
|---|---|---|---|---|
|
Carrying value of retained interests |
$ | 6,756 | ||
|
Value of underlying portfolio |
||||
|
Adverse change of 10% |
$ | — | ||
|
Adverse change of 20% |
(224 | ) | ||
Municipal Securities Tender Option Bond (TOB) Trusts
The Company sponsors TOB trusts that hold fixed- and floating-rate, tax-exempt securities issued by state or local municipalities. The trusts are typically single-issuer trusts whose assets are purchased from the Company and from the market. The trusts are referred to as Tender Option Bond trusts because the senior interest holders have the ability to tender their interests periodically back to the issuing trust, as described further below.
The TOB trusts fund the purchase of their assets by issuing long-term senior floating rate notes (Floaters) and junior residual securities (Residuals). The Floaters and the Residuals have a tenor equal to the maturity of the trust, which is equal to or shorter than the tenor of the underlying municipal bond. Residuals are frequently less than 1% of a trust's total funding and entitle their holder to the residual cash flows from the issuing trust. The Residuals are generally rated based on the long-term rating of the underlying municipal bond. The Floaters bear interest rates that are typically reset weekly to a new market rate (based on the SIFMA index: a seven day high grade market index of tax exempt, variable rate municipal bonds). Floater holders have an option to tender their Floaters back to the trust periodically. The Floaters have a long-term rating based on the long-term rating of the underlying municipal bond, including any credit enhancement provided by monoline insurance companies, and a short-term rating based on that of the liquidity provider to the trust.
The Company sponsors two kinds of TOB trusts: customer TOB trusts and proprietary TOB trusts. Customer TOB trusts are trusts through which customers finance investments in municipal securities. The Residuals and the Floaters are held by customers. Proprietary TOB trusts are trusts through which the Company finances its own investments in municipal securities. The Company holds the Residuals in proprietary TOB trusts.
The Company serves as remarketing agent to the trusts, facilitating the sale of the Floaters to third parties at inception and facilitating the reset of the Floater coupon and tenders of Floaters. If Floaters are tendered and the Company (in its role as remarketing agent) is unable to find a new investor within a specified period of time, it can declare a failed remarketing (in which case the trust is unwound) or it may choose to buy the Floaters into its own inventory and may continue to try to sell them to a third-party investor. While the level of the Company's inventory of Floaters fluctuates, the Company held none of the Floater inventory related to the customer or proprietary TOB programs as of March 31, 2010.
Approximately $2.0 billion of the municipal bonds owned by TOB trusts have a credit guarantee provided by the Company. In all other cases, the assets are either unenhanced or are insured with a monoline insurance. While the trusts have not encountered any adverse credit events as defined in the underlying trust agreements, certain monoline insurance companies have experienced downgrades. In these cases, the Company has proactively managed the TOB programs by applying additional insurance on the assets or proceeding with orderly unwinds of the trusts.
If a trust is unwound early due to an event other than a credit event on the underlying municipal bond, the underlying municipal bond is sold in the market. If there is an accompanying shortfall in the trust's cash flows to fund the redemption of the Floaters after the sale of the underlying municipal bond, the trust draws on a liquidity agreement in an amount equal to the shortfall. Liquidity agreements are generally provided to the trust directly by the Company. For customer TOBs where the Residual is less than 25% of the trust's capital structure, the Company has a reimbursement agreement with the Residual holder under which the Residual holder reimburses the Company for any payment made under the liquidity arrangement. Through this reimbursement agreement, the Residual holder remains economically exposed to fluctuations in value of the municipal bond. These reimbursement agreements are actively margined based on changes in value of the underlying municipal bond to mitigate the Company's counterparty credit risk. In cases where a third party provides liquidity to a proprietary TOB trust, a similar reimbursement arrangement is made whereby the Company (or a consolidated subsidiary of the Company) as Residual holder absorbs any losses incurred by the liquidity provider. As of March 31, 2010, liquidity agreements provided with respect to customer TOB trusts totaled $6.4 billion, offset by reimbursement agreements in place with a notional amount
131
of $4.8 billion. The remaining exposure relates to TOB transactions where the Residual owned by the customer is at least 25% of the bond value at the inception of the transaction and no reimbursement agreement is executed. In addition, the Company has provided liquidity arrangements with a notional amount of $0.1 billion for other non-consolidated proprietary TOB trusts described below.
The Company considers the customer and proprietary TOB trusts to be VIEs. Customer TOB trusts were not consolidated by the Company in prior periods and remain unconsolidated upon the Company's adoption of SFAS 167. Because third-party investors hold the Residual and Floater interests in the customer TOB trusts, the Company's involvement includes only its role as remarketing agent and liquidity provider. The Company has concluded that the power over customer TOB trusts is primarily held by the customer Residual holder, who may unilaterally cause the sale of the trust's bonds. Because the Company does not hold the Residual interest and thus does not have the power to direct the activities that most significantly impact the trust's economic performance, it does not consolidate the customer TOB trusts under SFAS 167.
Proprietary TOB trusts generally were consolidated in prior periods. They remain consolidated upon the Company's adoption of SFAS 167. The Company's involvement with the Proprietary TOB trusts includes holding the Residual interests as well as the remarketing and liquidity agreements with the trusts. Similar to customer TOB trusts, the Company has concluded that the power over the proprietary TOB trusts is primarily held by the Residual holder, who may unilaterally cause the sale of the trust's bonds. Because the Company holds the Residual interest, and thus has the power to direct the activities that most significantly impact the trust's economic performance, it continues to consolidate the proprietary TOB trusts under SFAS 167.
Prior to 2010, certain TOB trusts met the definition of a QSPE and were not consolidated in prior periods. Upon the Company's adoption of SFAS 167, former QSPE trusts have been consolidated by the Company as Residual interest holder and are presented as proprietary TOB trusts.
Total assets in proprietary TOB trusts also include $0.6 billion of assets where the Residuals are held by hedge funds that are consolidated and managed by the Company. The assets and the associated liabilities of these TOB trusts are not consolidated by the hedge funds (and, thus, are not consolidated by the Company) under the application of ASC 946, Financial Services—Investment Companies , which precludes consolidation of owned investments. The Company consolidates the hedge funds, because the Company holds controlling financial interests in the hedge funds. Certain of the Company's equity investments in the hedge funds are hedged with derivatives transactions executed by the Company with third parties referencing the returns of the hedge fund. The Company's accounting for these hedge funds and their interests in the TOB trusts is unchanged by the Company's adoption of SFAS 167.
Municipal Investments
Municipal investment transactions are primarily interests in partnerships that finance the construction and rehabilitation of low-income housing, facilitate lending in new or underserved markets, or finance the construction or operation of renewable municipal energy facilities. The Company generally invests in these partnerships as a limited partner and earns a return primarily through the receipt of tax credits and grants earned from the investments made by the partnership. These entities are generally considered VIEs. The power to direct the activities of these entities is typically held by the general partner. Accordingly, these entities have remained unconsolidated by the Company upon adoption of SFAS 167.
Client Intermediation
Client intermediation transactions represent a range of transactions designed to provide investors with specified returns based on the returns of an underlying security, referenced asset or index. These transactions include credit-linked notes and equity-linked notes. In these transactions, the SPE typically obtains exposure to the underlying security, referenced asset or index through a derivative instrument, such as a total-return swap or a credit-default swap. In turn the SPE issues notes to investors that pay a return based on the specified underlying security, referenced asset or index. The SPE invests the proceeds in a financial asset or a guaranteed insurance contract (GIC) that serves as collateral for the derivative contract over the term of the transaction. The Company's involvement in these transactions includes being the counterparty to the SPE's derivative instruments and investing in a portion of the notes issued by the SPE. In certain transactions, the investor's maximum risk of loss is limited and the Company absorbs risk of loss above a specified level. The Company does not have the power to direct the activities of the VIEs which most significantly impact their economic performance and thus it does not consolidate them.
The Company's maximum risk of loss in these transactions is defined as the amount invested in notes issued by the SPE and the notional amount of any risk of loss absorbed by the Company through a separate instrument issued by the SPE. The derivative instrument held by the Company may generate a receivable from the SPE (for example, where the Company purchases credit protection from the SPE in connection with the SPE's issuance of a credit-linked note), which is collateralized by the assets owned by the SPE. These derivative instruments are not considered variable interests and any associated receivables are not included in the calculation of maximum exposure to the SPE.
Structured Investment Vehicles
Structured Investment Vehicles (SIVs) are SPEs that issue junior notes and senior debt (medium-term notes and short-term commercial paper) to fund the purchase of high quality assets. The Company acts as manager for the SIVs.
In order to complete the wind-down of the SIVs, the Company purchased the remaining assets of the SIVs in November 2008. The Company funded the purchase of the SIV assets by assuming the obligation to pay amounts due under the medium-term notes issued by the SIVs as the medium-term notes mature.
132
Investment Funds
The Company is the investment manager for certain investment funds that invest in various asset classes including private equity, hedge funds, real estate, fixed income and infrastructure. The Company earns a management fee, which is a percentage of capital under management, and may earn performance fees. In addition, for some of these funds the Company has an ownership interest in the investment funds. The Company has also established a number of investment funds as opportunities for qualified employees to invest in private equity investments. The Company acts as investment manager to these funds and may provide employees with financing on both recourse and non-recourse bases for a portion of the employees' investment commitments.
The Company has determined that a majority of the investment vehicles managed by Citigroup are provided a deferral from the requirements of SFAS 167, because they meet the criteria in Accounting Standards Update No. 2010-10, Consolidation (Topic 810), Amendments for Certain Investment Funds (ASU 2010-10) (see Note 1). These vehicles continue to be evaluated under the requirements of ASC 810-10, prior to the implementation of SFAS 167 (FIN 46(R)).
Where the Company has determined that certain investment vehicles are subject to the consolidation requirements of SFAS 167, the consolidation conclusions reached upon initial application of SFAS 167 are consistent with the consolidation conclusions reached under the requirements of ASC 810-10, prior to the implementation of SFAS 167.
Trust Preferred Securities
The Company has raised financing through the issuance of trust preferred securities. In these transactions, the Company forms a statutory business trust and owns all of the voting equity shares of the trust. The trust issues preferred equity securities to third-party investors and invests the gross proceeds in junior subordinated deferrable interest debentures issued by the Company. These trusts have no assets, operations, revenues or cash flows other than those related to the issuance, administration and repayment of the preferred equity securities held by third-party investors. These trusts' obligations are fully and unconditionally guaranteed by the Company.
Because the sole asset of the trust is a receivable from the Company and the proceeds to the Company from the receivable exceed the Company's investment in the VIE's equity shares, the Company is not permitted to consolidate the trusts, even though the Company owns all of the voting equity shares of the trust, has fully guaranteed the trusts' obligations, and has the right to redeem the preferred securities in certain circumstances. The Company recognizes the subordinated debentures on its Consolidated Balance Sheet as long-term liabilities.
133
In the ordinary course of business, Citigroup enters into various types of derivative transactions. These derivative transactions include:
- •
-
Futures and forward contracts
which are commitments to buy or sell at a
future date a financial instrument, commodity or currency at a contracted price and may be settled in cash or through delivery.
- •
-
Swap contracts
which are commitments to settle in cash at a future date or
dates that may range from a few days to a number of years, based on differentials between specified financial indices, as applied to a notional principal amount.
- •
- Option contracts which give the purchaser, for a fee, the right, but not the obligation, to buy or sell within a limited time a financial instrument, commodity or currency at a contracted price that may also be settled in cash, based on differentials between specified indices or prices.
Citigroup enters into these derivative contracts relating to interest rate, foreign currency, commodity, and other market/credit risks for the following reasons:
- •
-
Trading Purposes—Customer Needs:
Citigroup
offers its customers derivatives in connection with their risk-management actions to transfer, modify or reduce their interest rate, foreign exchange and other market/credit risks or for
their own trading purposes. As part of this process, Citigroup considers the customers' suitability for the risk involved and the business purpose for the transaction. Citigroup also manages its
derivative-risk positions through offsetting trade activities, controls focused on price verification, and daily reporting of positions to senior managers.
- •
-
Trading Purposes—Own Account:
Citigroup
trades derivatives for its own account and as an active market maker. Trading limits and price verification controls are key aspects of this activity.
- •
- Hedging: Citigroup uses derivatives in connection with its risk-management activities to hedge certain risks or reposition the risk profile of the Company. For example, Citigroup may issue fixed-rate long-term debt and then enter into a receive-fixed, pay-variable-rate interest rate swap with the same tenor and notional amount to convert the interest payments to a net variable-rate basis. This strategy is the most common form of an interest rate hedge, as it minimizes interest cost in certain yield curve environments. Derivatives are also used to manage risks inherent in specific groups of on-balance-sheet assets and liabilities, including investments, corporate and consumer loans, deposit liabilities, as well as other interest-sensitive assets and liabilities. In addition, foreign-exchange contracts are used to hedge non-U.S.-dollar-denominated debt, foreign-currency-denominated available-for-sale securities, net capital exposures and foreign-exchange transactions.
Derivatives may expose Citigroup to market, credit or liquidity risks in excess of the amounts recorded on the Consolidated Balance Sheet. Market risk on a derivative product is the exposure created by potential fluctuations in interest rates, foreign-exchange rates and other factors and is a function of the type of product, the volume of transactions, the tenor and terms of the agreement, and the underlying volatility. Credit risk is the exposure to loss in the event of nonperformance by the other party to the transaction where the value of any collateral held is not adequate to cover such losses. The recognition in earnings of unrealized gains on these transactions is subject to management's assessment as to collectability. Liquidity risk is the potential exposure that arises when the size of the derivative position may not be able to be rapidly adjusted in periods of high volatility and financial stress at a reasonable cost.
Information pertaining to the volume of derivative activity is provided in the tables below. The notional amounts, for both long and short derivative positions, of Citigroup's derivative instruments as of March 31, 2010 and December 31, 2009 are presented in the table below.
134
Derivative Notionals
|
|
Hedging
instruments under ASC 815 (SFAS 133)(1)(2) |
Other derivative instruments | ||||||||||||||||||
|---|---|---|---|---|---|---|---|---|---|---|---|---|---|---|---|---|---|---|---|---|
|
|
|
|
Trading derivatives | Management hedges(3) | ||||||||||||||||
| In millions of dollars |
March 31,
2010 |
December 31,
2009 |
March 31,
2010 |
December 31,
2009 |
March 31,
2010 |
December 31,
2009 |
||||||||||||||
|
Interest rate contracts |
||||||||||||||||||||
|
Swaps |
$ | 134,386 | $ | 128,797 | $ | 21,938,409 | $ | 20,571,814 | $ | 118,006 | $ | 107,193 | ||||||||
|
Futures and forwards |
55 | — | 4,512,437 | 3,366,927 | 58,925 | 65,597 | ||||||||||||||
|
Written options |
— | — | 3,551,129 | 3,616,240 | 4,348 | 11,050 | ||||||||||||||
|
Purchased options |
— | — | 3,343,453 | 3,590,032 | 30,831 | 28,725 | ||||||||||||||
|
Total interest rate contract notionals |
$ | 134,441 | $ | 128,797 | $ | 33,345,428 | $ | 31,145,013 | $ | 212,110 | $ | 212,565 | ||||||||
|
Foreign exchange contracts |
||||||||||||||||||||
|
Swaps |
$ | 28,754 | $ | 42,621 | $ | 967,684 | $ | 855,560 | $ | 34,187 | $ | 24,044 | ||||||||
|
Futures and forwards |
81,921 | 76,507 | 2,016,019 | 1,946,802 | 48,234 | 54,249 | ||||||||||||||
|
Written options |
3,563 | 4,685 | 475,064 | 409,991 | 2,878 | 9,305 | ||||||||||||||
|
Purchased options |
17,533 | 22,594 | 437,304 | 387,786 | 3,682 | 10,188 | ||||||||||||||
|
Total foreign exchange contract notionals |
$ | 131,771 | $ | 146,407 | $ | 3,896,071 | $ | 3,600,139 | $ | 88,981 | $ | 97,786 | ||||||||
|
Equity contracts |
||||||||||||||||||||
|
Swaps |
$ | — | $ | — | $ | 65,534 | $ | 59,391 | $ | — | $ | — | ||||||||
|
Futures and forwards |
— | — | 17,606 | 14,627 | — | — | ||||||||||||||
|
Written options |
— | — | 531,948 | 410,002 | — | — | ||||||||||||||
|
Purchased options |
— | — | 436,384 | 377,961 | — | 275 | ||||||||||||||
|
Total equity contract notionals |
$ | — | $ | — | $ | 1,051,472 | $ | 861,981 | $ | — | $ | 275 | ||||||||
|
Commodity and other contracts |
||||||||||||||||||||
|
Swaps |
$ | — | $ | — | $ | 30,682 | $ | 25,956 | $ | — | $ | — | ||||||||
|
Futures and forwards |
— | — | 93,253 | 91,582 | — | — | ||||||||||||||
|
Written options |
— | — | 41,392 | 37,952 | — | — | ||||||||||||||
|
Purchased options |
— | — | 48,232 | 40,321 | 3 | 3 | ||||||||||||||
|
Total commodity and other contract notionals |
$ | — | $ | — | $ | 213,559 | $ | 195,811 | $ | 3 | $ | 3 | ||||||||
|
Credit derivatives(4) |
||||||||||||||||||||
|
Protection sold |
$ | — | $ | — | $ | 1,198,653 | $ | 1,214,053 | $ | — | $ | — | ||||||||
|
Protection purchased |
6,756 | 6,981 | 1,306,797 | 1,325,981 | — | — | ||||||||||||||
|
Total credit derivatives |
$ | 6,756 | $ | 6,981 | $ | 2,505,450 | $ | 2,540,034 | $ | — | $ | — | ||||||||
|
Total derivative notionals |
$ | 272,968 | $ | 282,185 | $ | 41,011,980 | $ | 38,342,978 | $ | 301,094 | $ | 310,629 | ||||||||
- (1)
-
The
notional amounts presented in this table do not include derivatives in hedge accounting relationships under ASC 815 (SFAS 133), where Citigroup
is hedging the foreign currency risk of a net investment in a foreign operation by issuing a foreign currency denominated debt instrument. The notional amount of such debt is $7,056 million and
$7,442 million at March 31, 2010 and December 31, 2009, respectively.
- (2)
-
Derivatives
in hedge accounting relationships accounted for under ASC 815 (SFAS 133) are recorded in either
Other
assets/liabilities
or
Trading account assets/liabilities
on the Consolidated Balance Sheet.
- (3)
-
Management
hedges represent derivative instruments used in certain economic hedging relationships that are identified for management purposes, but for which
hedge accounting is not applied. These derivatives are recorded in
Other assets/liabilities
on the Consolidated Balance Sheet.
- (4)
- Credit derivatives are arrangements designed to allow one party (protection buyer) to transfer the credit risk of a "reference asset" to another party (protection seller). These arrangements allow a protection seller to assume the credit risk associated with the reference asset without directly purchasing that asset. The Company has entered into credit derivatives positions for purposes such as risk management, yield enhancement, reduction of credit concentrations and diversification of overall risk.
135
Derivative Mark-to-Market (MTM) Receivables/Payables
|
|
Derivatives classified in trading
account assets/liabilities(1) |
Derivatives classified in
other assets/liabilities |
|||||||||||
|---|---|---|---|---|---|---|---|---|---|---|---|---|---|
| In millions of dollars at March 31, 2010 | Assets | Liabilities | Assets | Liabilities | |||||||||
|
Derivative instruments designated as ASC 815 (SFAS 133) hedges |
|||||||||||||
|
Interest rate contracts |
$ | 418 | $ | 40 | $ | 5,424 | $ | 2,778 | |||||
|
Foreign exchange contracts |
810 | 841 | 1,988 | 1,940 | |||||||||
|
Total derivative instruments designated as ASC 815 (SFAS 133) hedges |
$ | 1,228 | $ | 881 | $ | 7,412 | $ | 4,718 | |||||
|
Other derivative instruments |
|||||||||||||
|
Interest rate contracts |
$ | 459,763 | $ | 459,797 | $ | 2,997 | $ | 2,377 | |||||
|
Foreign exchange contracts |
69,870 | 69,841 | 1,056 | 2,492 | |||||||||
|
Equity contracts |
18,166 | 36,096 | — | — | |||||||||
|
Commodity and other contracts |
17,172 | 17,550 | — | — | |||||||||
|
Credit derivatives(2) |
87,880 | 76,880 | — | — | |||||||||
|
Total other derivative instruments |
$ | 652,851 | $ | 660,164 | $ | 4,053 | $ | 4,869 | |||||
|
Total derivatives |
$ | 654,079 | $ | 661,045 | $ | 11,465 | $ | 9,587 | |||||
|
Cash collateral paid/received |
48,247 | 39,144 | 409 | 3,094 | |||||||||
|
Less: Netting agreements and market value adjustments |
(648,616 | ) | (640,575 | ) | (2,455 | ) | (2,455 | ) | |||||
|
Net receivables/payables |
$ | 53,710 | $ | 59,614 | $ | 9,419 | $ | 10,226 | |||||
- (1)
-
The
trading derivatives fair values are presented in Note 9 to the Consolidated Financial Statements.
- (2)
- The credit derivatives trading assets are composed of $64,302 million related to protection purchased and $23,578 million related to protection sold as of March 31, 2010. The credit derivatives trading liabilities are composed of $23,418 million related to protection purchased and $53,462 million related to protection sold as of March 31, 2010.
|
|
Derivatives classified in trading
account assets/liabilities(1) |
Derivatives classified in
other assets/liabilities |
|||||||||||
|---|---|---|---|---|---|---|---|---|---|---|---|---|---|
| In millions of dollars at December 31, 2009 | Assets | Liabilities | Assets | Liabilities | |||||||||
|
Derivative instruments designated as ASC 815 (SFAS 133) hedges |
|||||||||||||
|
Interest rate contracts |
$ | 304 | $ | 87 | $ | 4,267 | $ | 2,898 | |||||
|
Foreign exchange contracts |
753 | 1,580 | 3,599 | 1,416 | |||||||||
|
Total derivative instruments designated as ASC 815 (SFAS 133) hedges |
$ | 1,057 | $ | 1,667 | $ | 7,866 | $ | 4,314 | |||||
|
Other derivative instruments |
|||||||||||||
|
Interest rate contracts |
$ | 454,974 | $ | 449,551 | $ | 2,882 | $ | 3,022 | |||||
|
Foreign exchange contracts |
71,005 | 70,584 | 1,498 | 2,381 | |||||||||
|
Equity contracts |
18,132 | 40,612 | 6 | 5 | |||||||||
|
Commodity and other contracts |
16,698 | 15,492 | — | — | |||||||||
|
Credit derivatives(2) |
92,792 | 82,424 | — | — | |||||||||
|
Total other derivative instruments |
$ | 653,601 | $ | 658,663 | $ | 4,386 | $ | 5,408 | |||||
|
Total derivatives |
$ | 654,658 | $ | 660,330 | $ | 12,252 | $ | 9,722 | |||||
|
Cash collateral paid/received |
48,561 | 38,611 | 263 | 4,950 | |||||||||
|
Less: Netting agreements and market value adjustments |
(644,340 | ) | (634,835 | ) | (4,224 | ) | (4,224 | ) | |||||
|
Net receivables/payables |
$ | 58,879 | $ | 64,106 | $ | 8,291 | $ | 10,448 | |||||
- (1)
-
The
trading derivatives fair values are presented in Note 9 to the Consolidated Financial Statements.
- (2)
- The credit derivatives trading assets are composed of $68,558 million related to protection purchased and $24,234 million related to protection sold as of December 31, 2009. The credit derivatives trading liabilities are composed of $24,162 million related to protection purchased and $58,262 million related to protection sold as of December 31, 2009.
All derivatives are reported on the balance sheet at fair value. In addition, where applicable, all such contracts covered by master netting agreements are reported net. Gross positive fair values are netted with gross negative fair values by counterparty pursuant to a valid master netting agreement. In addition, payables and receivables in respect of cash collateral received from or paid to a given counterparty are included in this netting. However, non-cash collateral is not included.
The amount of payables in respect of cash collateral received that was netted with unrealized gains from derivatives was $32 billion and $30 billion as of March 31, 2010 and December 31, 2009, respectively. The amount of receivables in respect of cash collateral paid that was netted with unrealized losses from derivatives was $42 billion and $41 billion as of March 31, 2010 and December 31, 2009, respectively.
The amounts recognized in Principal transactions in the Consolidated Statement of Income for the three months ended March 31, 2010 and March 31, 2009 related to derivatives not designated in a qualifying hedging relationship as well as the underlying non-derivative instruments are included in the table below. Citigroup has elected to present this disclosure by business classification, showing derivative gains and losses related to its trading activities together with gains and losses related to non-derivative instruments within the same trading portfolios, as this better represents the way these portfolios are risk managed.
136
|
|
Principal transactions gains
(losses) for the three months ended March 31, |
||||||
|---|---|---|---|---|---|---|---|
| In millions of dollars | 2010 | 2009 | |||||
|
Interest Rate Contracts |
$ | 1,309 | $ | 4,597 | |||
|
Foreign Exchange Contracts |
241 | 1,006 | |||||
|
Equity Contracts |
565 | 1,078 | |||||
|
Commodity and other contracts |
109 | 697 | |||||
|
Credit Derivatives |
1,827 | (3,708 | ) | ||||
|
Total(1) |
$ | 4,051 | $ | 3,670 | |||
- (1)
- Also see Note 6 to the Consolidated Financial Statements.
The amounts recognized in Other revenue in the Consolidated Statement of Income for the three months ended March 31, 2010 and March 31, 2009 relate to derivatives not designated in a qualifying hedging relationship and not recorded within Trading account assets or Trading account liabilities are shown below. The table below does not include the offsetting gains/losses on the hedged items, which amounts are also recorded in Other revenue .
|
|
Gains (losses) included in
Other Revenue for the three months ended March 31, |
||||||
|---|---|---|---|---|---|---|---|
| In millions of dollars | 2010 | 2009 | |||||
|
Interest Rate Contracts |
$ | (94 | ) | 11 | |||
|
Foreign Exchange Contracts |
(2,817 | ) | (996 | ) | |||
|
Equity Contracts |
— | — | |||||
|
Commodity and other contracts |
— | — | |||||
|
Credit Derivatives |
— | — | |||||
|
Total(1) |
$ | (2,911 | ) | $ | (985 | ) | |
- (1)
- Non-designated derivatives are derivative instruments not designated in qualifying hedging relationships.
Accounting for Derivative Hedging
Citigroup accounts for its hedging activities in accordance with ASC 815, Derivatives and Hedging (formerly SFAS 133). As a general rule, hedge accounting is permitted where the Company is exposed to a particular risk, such as interest-rate or foreign-exchange risk, that causes changes in the fair value of an asset or liability or variability in the expected future cash flows of an existing asset, liability or a forecasted transaction that may affect earnings.
Derivative contracts hedging the risks associated with the changes in fair value are referred to as fair value hedges, while contracts hedging the risks affecting the expected future cash flows are called cash flow hedges. Hedges that utilize derivatives or debt instruments to manage the foreign exchange risk associated with equity investments in non-U.S.-dollar functional currency foreign subsidiaries (net investment in a foreign operation) are called net investment hedges.
If certain hedging criteria specified in ASC 815 are met, including testing for hedge effectiveness, special hedge accounting may be applied. The hedge effectiveness assessment methodologies for similar hedges are performed in a similar manner and are used consistently throughout the hedging relationships. For fair value hedges, the changes in value of the hedging derivative, as well as the changes in value of the related hedged item due to the risk being hedged, are reflected in current earnings. For cash flow hedges and net investment hedges, the changes in value of the hedging derivative are reflected in Accumulated other comprehensive income (loss) in Citigroup's stockholders' equity, to the extent the hedge is effective. Hedge ineffectiveness, in either case, is reflected in current earnings.
For asset/liability management hedging, the fixed-rate long-term debt may be recorded at amortized cost under current U.S. GAAP. However, by electing to use ASC 815 (SFAS 133) hedge accounting, the carrying value of the debt is adjusted for changes in the benchmark interest rate, with any such changes in value recorded in current earnings. The related interest-rate swap is also recorded on the balance sheet at fair value, with any changes in fair value reflected in earnings. Thus, any ineffectiveness resulting from the hedging relationship is recorded in current earnings. Alternatively, an economic hedge, which does not meet the ASC 815 hedging criteria, would involve recording only the derivative at fair value on the balance sheet, with its associated changes in fair value recorded in earnings. The debt would continue to be carried at amortized cost and, therefore, current earnings would be impacted only by the interest rate shifts and other factors that cause the change in the swap's value and the underlying yield of the debt. This type of hedge is undertaken when hedging requirements cannot be achieved or management decides not to apply ASC 815 hedge accounting. Another alternative for the Company would be to elect to carry the debt at fair value under the fair value option. Once the irrevocable election is made upon issuance of the debt, the full change in fair value of the debt would be reported in earnings. The related interest rate swap, with changes in fair value, would also be reflected in earnings, and provides a natural offset to the debt's fair value change. To the extent the two offsets would not be exactly equal, the difference would be reflected in current earnings. This type of economic hedge is undertaken when the Company prefers to follow this simpler method that achieves generally similar financial statement results to an ASC 815 fair value hedge.
Key aspects of achieving ASC 815 hedge accounting are documentation of hedging strategy and hedge effectiveness at the hedge inception and substantiating hedge effectiveness on an ongoing basis. A derivative must be highly effective in accomplishing the hedge objective of offsetting either changes in the fair value or cash flows of the hedged item for the risk being hedged. Any ineffectiveness in the hedge relationship is recognized in current earnings. The assessment of effectiveness excludes changes in the value of the hedged item that are unrelated to the risks being hedged. Similarly, the assessment of effectiveness may exclude changes in the fair value of a derivative related to time value that, if excluded, are recognized in current earnings.
137
Fair Value Hedges
Hedging of benchmark interest rate risk
Citigroup hedges exposure to changes in the fair value of outstanding fixed-rate issued debt and borrowings. The fixed cash flows from those financing transactions are converted to benchmark variable-rate cash flows by entering into receive-fixed, pay-variable interest rate swaps. These fair value hedge relationships use dollar-offset ratio analysis to determine whether the hedging relationships are highly effective at inception and on an ongoing basis.
Citigroup also hedges exposure to changes in the fair value of fixed-rate assets, including available-for-sale debt securities and loans. The hedging instruments used are receive-variable, pay-fixed interest rate swaps. Most of these fair value hedging relationships use dollar-offset ratio analysis to determine whether the hedging relationships are highly effective at inception and on an ongoing basis, while certain others use regression analysis.
Hedging of foreign exchange risk
Citigroup hedges the change in fair value attributable to foreign-exchange rate movements in available-for-sale securities that are denominated in currencies other than the functional currency of the entity holding the securities, which may be within or outside the U.S. The hedging instrument employed is a forward foreign-exchange contract. In this type of hedge, the change in fair value of the hedged available-for-sale security attributable to the portion of foreign exchange risk hedged is reported in earnings and not Accumulated other comprehensive income —a process that serves to offset substantially the change in fair value of the forward contract that is also reflected in earnings. Citigroup considers the premium associated with forward contracts (differential between spot and contractual forward rates) as the cost of hedging; this is excluded from the assessment of hedge effectiveness and reflected directly in earnings. Dollar-offset method is used to assess hedge effectiveness. Since that assessment is based on changes in fair value attributable to changes in spot rates on both the available-for-sale securities and the forward contracts for the portion of the relationship hedged, the amount of hedge ineffectiveness is not significant.
The following table summarizes the gains (losses) on the Company's fair value hedges for the three months ended March 31, 2010 and March 31, 2009:
|
|
Gains (losses) on fair value hedges(1) | ||||||
|---|---|---|---|---|---|---|---|
|
|
Three Months ended March 31, | ||||||
| In millions of dollars | 2010 | 2009 | |||||
|
Gain (loss) on fair value designated and qualifying hedges |
|||||||
|
Interest rate contracts |
$ | 833 | $ | (1,743 | ) | ||
|
Foreign exchange contracts |
(242 | ) | (28 | ) | |||
|
Total gain (loss) on fair value designated and qualifying hedges |
$ | 591 | $ | (1,771 | ) | ||
|
Gain (loss) on the hedged item in designated and qualifying fair value hedges |
|||||||
|
Interest rate hedges |
$ | (905 | ) | $ | 1,995 | ||
|
Foreign exchange hedges |
269 | 443 | |||||
|
Total gain (loss) on the hedged item in designated and qualifying fair value hedges |
$ | (636 | ) | $ | 2,438 | ||
|
Hedge ineffectiveness recognized in earnings on designated and qualifying fair value hedges |
|||||||
|
Interest rate hedges |
$ | (75 | ) | $ | 336 | ||
|
Foreign exchange hedges |
1 | 148 | |||||
|
Total hedge ineffectiveness recognized in earnings on designated and qualifying fair value hedges |
$ | (74 | ) | $ | 484 | ||
|
Net gain (loss) excluded from assessment of the effectiveness of fair value hedges |
|||||||
|
Interest rate contracts |
$ | 3 | $ | (84 | ) | ||
|
Foreign exchange contracts |
26 | 267 | |||||
|
Total net gain(loss) excluded from assessment of the effectiveness of fair value hedges |
$ | 29 | $ | 183 | |||
- (1)
- Amounts are included in Other revenue on the Consolidated Statement of Income. The accrued interest income on fair value hedges is recorded in Net interest revenue and is excluded from this table.
138
Cash Flow Hedges
Hedging of benchmark interest rate risk
Citigroup hedges variable cash flows resulting from floating-rate liabilities and roll-over (re-issuance) of short-term liabilities. Variable cash flows from those liabilities are converted to fixed-rate cash flows by entering into receive-variable, pay-fixed interest-rate swaps and receive-variable, pay-fixed forward-starting interest-rate swaps. These cash-flow hedging relationships use either regression analysis or dollar-offset ratio analysis to assess whether the hedging relationships are highly effective at inception and on an ongoing basis. Since efforts are made to match the terms of the derivatives to those of the hedged forecasted cash flows as closely as possible, the amount of hedge ineffectiveness is not significant.
Hedging of foreign exchange risk
Citigroup locks in the functional currency equivalent of cash flows of various balance sheet liability exposures, including short-term borrowings and long-term debt (and the forecasted issuances or rollover of such items) that are denominated in a currency other than the functional currency of the issuing entity. Depending on the risk-management objectives, these types of hedges are designated as either cash-flow hedges of only foreign exchange risk or cash-flow hedges of both foreign-exchange and interest rate risk, and the hedging instruments used are foreign-exchange forward contracts, cross-currency swaps and foreign-currency options. For some hedges, Citigroup matches all terms of the hedged item and the hedging derivative at inception and on an ongoing basis to eliminate hedge ineffectiveness. Citigroup does not exclude any terms from consideration when applying the matched terms method. To the extent all terms are not perfectly matched, any ineffectiveness is measured using the "hypothetical derivative method" from FASB Derivative Implementation Group Issue G7 (now ASC 815-30-35-12 through 35-32). Efforts are made to match up the terms of the hypothetical and actual derivatives used as closely as possible. As a result, the amount of hedge ineffectiveness is not significant even when the terms do not match perfectly.
Hedging total return
Citigroup generally manages the risk associated with highly leveraged financing it has entered into by seeking to sell a majority of its exposures to the market prior to or shortly after funding. The portion of the highly leveraged financing that is retained by Citigroup is hedged with a total return swap.
The amount of hedge ineffectiveness on the cash flow hedges recognized in earnings for the three months ended March 31, 2010 and March 31, 2009 is not significant.
The pretax change in Accumulated other comprehensive income (loss) from cash flow hedges for three months ended March 31, 2010 and March 31, 2009 is presented below:
|
|
Three Months ended March 31, | ||||||
|---|---|---|---|---|---|---|---|
| In millions of dollars | 2010 | 2009 | |||||
|
Effective portion of cash flow hedges included in AOCI |
|||||||
|
Interest rate contracts |
$ | (241 | ) | $ | 168 | ||
|
Foreign exchange contracts |
9 | 400 | |||||
|
Credit Derivatives |
— | 1,493 | |||||
|
Total effective portion of cash flow hedges included in AOCI |
$ | (232 | ) | $ | 2,061 | ||
|
Effective portion of cash flow hedges reclassified from AOCI to earnings |
|||||||
|
Interest rate contracts |
$ | (370 | ) | $ | (412 | ) | |
|
Foreign exchange contracts |
(178 | ) | 86 | ||||
|
Total effective portion of cash flow hedges reclassified from AOCI to earnings(1) |
$ | (548 | ) | $ | (326 | ) | |
- (1)
- Included primarily in Other revenue and Net interest revenue on the Consolidated Income Statement.
For cash flow hedges, any changes in the fair value of the end-user derivative remaining in Accumulated other comprehensive income (loss) on the Consolidated Balance Sheet will be included in earnings of future periods to offset the variability of the hedged cash flows when such cash flows affect earnings. The net loss associated with cash flow hedges expected to be reclassified from Accumulated other comprehensive income within 12 months of March 31, 2010 is approximately $1.8 billion. The maximum length of time over which forecasted cash flows are hedged is 10 years.
The impact of cash flow hedges on AOCI is also shown in Note 13 to the Consolidated Financial Statements.
Net Investment Hedges
Consistent with ASC 830-20, Foreign Currency Matters—Foreign Currency Transactions ( formerly SFAS 52, Foreign Currency Translation) , ASC 815 allows hedging of the foreign-currency risk of a net investment in a foreign operation. Citigroup uses foreign-currency forwards, options and swaps and foreign-currency-denominated debt instruments to manage the foreign-exchange risk associated with Citigroup's equity investments in several non-U.S. dollar functional currency foreign subsidiaries. Citigroup records the change in the carrying amount of these investments in the Cumulative translation adjustment account within Accumulated other comprehensive income (loss) . Simultaneously, the effective portion of the hedge of this exposure is also recorded in the Cumulative translation adjustment account and the ineffective portion, if any, is immediately recorded in earnings.
For derivatives used in net investment hedges, Citigroup follows the forward-rate method from FASB Derivative Implementation Group Issue H8 (now ASC 815-35-35-16 through 35-26), "Foreign Currency Hedges: Measuring the Amount of Ineffectiveness in a Net Investment Hedge." According to that method, all changes in fair value, including changes related to the forward-rate component of the foreign-currency forward contracts and the time-value of foreign-currency options, are recorded in the foreign-currency.
139
Cumulative translation adjustment account . For foreign-currency denominated debt instruments that are designated as hedges of net investments, the translation gain or loss that is recorded in the foreign-currency translation adjustment account is based on the spot exchange rate between the functional currency of the respective subsidiary and the U.S. dollar, which is the functional currency of Citigroup. To the extent the notional amount of the hedging instrument exactly matches the hedged net investment and the underlying exchange rate of the derivative hedging instrument relates to the exchange rate between the functional currency of the net investment and Citigroup's functional currency (or, in the case of a non-derivative debt instrument, such instrument is denominated in the functional currency of the net investment), no ineffectiveness is recorded in earnings.
The pretax gain (loss) recorded in foreign-currency translation adjustment within Accumulated other comprehensive income (loss) , related to the effective portion of the net investment hedges, is $(190) million and $877 million during the three months ended March 31, 2010 and March 31, 2009, respectively.
Credit Derivatives
A credit derivative is a bilateral contract between a buyer and a seller under which the seller agrees to provide protection to the buyer against the credit risk of a particular entity ("reference entity" or "reference credit"). Credit derivatives generally require that the seller of credit protection make payments to the buyer upon the occurrence of predefined credit events (commonly referred to as "settlement triggers"). These settlement triggers are defined by the form of the derivative and the reference credit and are generally limited to the market standard of failure to pay on indebtedness and bankruptcy of the reference credit and, in a more limited range of transactions, debt restructuring. Credit derivative transactions referring to emerging market reference credits will also typically include additional settlement triggers to cover the acceleration of indebtedness and the risk of repudiation or a payment moratorium. In certain transactions, protection may be provided on a portfolio of referenced credits or asset-backed securities. The seller of such protection may not be required to make payment until a specified amount of losses has occurred with respect to the portfolio and/or may only be required to pay for losses up to a specified amount.
The Company makes markets in and trades a range of credit derivatives, both on behalf of clients as well as for its own account. Through these contracts, the Company either purchases or writes protection on either a single name or a portfolio of reference credits. The Company uses credit derivatives to help mitigate credit risk in its corporate and consumer loan portfolio and other cash positions, to take proprietary trading positions, and to facilitate client transactions.
The range of credit derivatives sold includes credit default swaps, total return swaps and credit options.
A credit default swap is a contract in which, for a fee, a protection seller agrees to reimburse a protection buyer for any losses that occur due to a credit event on a reference entity. If there is no credit default event or settlement trigger, as defined by the specific derivative contract, then the protection seller makes no payments to the protection buyer and receives only the contractually specified fee. However, if a credit event occurs as defined in the specific derivative contract sold, the protection seller will be required to make a payment to the protection buyer.
A total return swap transfers the total economic performance of a reference asset, which includes all associated cash flows, as well as capital appreciation or depreciation. The protection buyer receives a floating rate of interest and any depreciation on the reference asset from the protection seller and, in return, the protection seller receives the cash flows associated with the reference asset plus any appreciation. Thus, according to the total return swap agreement, the protection seller will be obligated to make a payment anytime the floating interest rate payment and any depreciation of the reference asset exceed the cash flows associated with the underlying asset. A total return swap may terminate upon a default of the reference asset subject to the provisions of the related total return swap agreement between the protection seller and the protection buyer.
A credit option is a credit derivative that allows investors to trade or hedge changes in the credit quality of the reference asset. For example, in a credit spread option, the option writer assumes the obligation to purchase or sell the reference asset at a specified "strike" spread level. The option purchaser buys the right to sell the reference asset to, or purchase it from, the option writer at the strike spread level. The payments on credit spread options depend either on a particular credit spread or the price of the underlying credit-sensitive asset. The options usually terminate if the underlying assets default.
A credit-linked note is a form of credit derivative structured as a debt security with an embedded credit default swap. The purchaser of the note writes credit protection to the issuer, and receives a return which will be negatively affected by credit events on the underlying reference credit. If the reference entity defaults, the purchaser of the credit-linked note may assume the long position in the debt security and any future cash flows from it, but will lose the amount paid to the issuer of the credit-linked note. Thus the maximum amount of the exposure is the carrying amount of the credit-linked note. As of March 31, 2010 and December 31, 2009, the amount of credit-linked notes held by the Company in trading inventory was immaterial.
140
The following tables summarize the key characteristics of the Company's credit derivative portfolio as protection seller as of March 31, 2010 and December 31, 2009:
|
In millions of dollars as of
March 31, 2010 |
Maximum potential
amount of future payments |
Fair value
payable(1) |
|||||
|---|---|---|---|---|---|---|---|
|
By industry/counterparty |
|||||||
|
Bank |
$ | 801,785 | $ | 31,919 | |||
|
Broker-dealer |
316,463 | 13,814 | |||||
|
Monoline |
123 | 90 | |||||
|
Non-financial |
530 | 110 | |||||
|
Insurance and other financial institutions |
79,752 | 7,529 | |||||
|
Total by industry/counterparty |
$ | 1,198,653 | $ | 53,462 | |||
|
By instrument |
|||||||
|
Credit default swaps and options |
$ | 1,197,837 | $ | 53,069 | |||
|
Total return swaps and other |
816 | 393 | |||||
|
Total by instrument |
$ | 1,198,653 | $ | 53,462 | |||
|
By rating |
|||||||
|
Investment grade |
$ | 538,020 | 7,518 | ||||
|
Non-investment grade |
319,885 | 26,517 | |||||
|
Not rated |
340,748 | 19,427 | |||||
|
Total by rating |
$ | 1,198,653 | $ | 53,462 | |||
|
By maturity: |
|||||||
|
Within 1 year |
$ | 140,408 | $ | 1,302 | |||
|
From 1 to 5 years |
802,909 | 25,178 | |||||
|
After 5 years |
255,336 | 26,982 | |||||
|
Total by maturity |
$ | 1,198,653 | $ | 53,462 | |||
- (1)
- In addition, fair value amounts receivable under credit derivatives sold were $23,578 million.
|
In millions of dollars as of
December 31, 2009 |
Maximum potential
amount of future payments |
Fair value
payable(1) |
|||||
|---|---|---|---|---|---|---|---|
|
By industry/counterparty |
|||||||
|
Bank |
$ | 807,484 | $ | 34,666 | |||
|
Broker-dealer |
340,949 | 16,309 | |||||
|
Monoline |
33 | — | |||||
|
Non-financial |
623 | 262 | |||||
|
Insurance and other financial institutions |
64,964 | 7,025 | |||||
|
Total by industry/counterparty |
$ | 1,214,053 | $ | 58,262 | |||
|
By instrument |
|||||||
|
Credit default swaps and options |
$ | 1,213,208 | $ | 57,987 | |||
|
Total return swaps and other |
845 | 275 | |||||
|
Total by instrument |
$ | 1,214,053 | $ | 58,262 | |||
|
By rating |
|||||||
|
Investment grade |
$ | 576,930 | 9,632 | ||||
|
Non-investment grade |
339,920 | 28,664 | |||||
|
Not rated |
297,203 | 19,966 | |||||
|
Total by rating |
$ | 1,214,053 | $ | 58,262 | |||
|
By maturity: |
|||||||
|
Within 1 year |
$ | 165,056 | $ | 873 | |||
|
From 1 to 5 years |
806,143 | 30,181 | |||||
|
After 5 years |
242,854 | 27,208 | |||||
|
Total by maturity |
$ | 1,214,053 | $ | 58,262 | |||
- (1)
- In addition, fair value amounts receivable under credit derivatives sold were $24,234 million.
Citigroup evaluates the payment/performance risk of the credit derivatives to which it stands as a protection seller based on the credit rating which has been assigned to the underlying referenced credit. Where external ratings by nationally recognized statistical rating organizations (such as Moody's and S&P) are used, investment grade ratings are considered to be Baa/BBB or above, while anything below is considered non-investment grade. The Citigroup internal ratings are in line with the related external credit rating system. On certain underlying reference credits, mainly related to over-the-counter credit derivatives, ratings are not available, and these are included in the not-rated category. Credit derivatives written on an underlying non-investment grade reference credit represent greater payment risk to the Company. The non-investment grade category in the table above primarily includes credit derivatives where the underlying referenced entity has been downgraded subsequent to the inception of the derivative.
The maximum potential amount of future payments under credit derivative contracts presented in the table above is based on the notional value of the derivatives. The Company believes that the maximum potential amount of future payments for credit protection sold is not representative of the actual loss exposure based on historical experience. This amount has not been reduced by the Company's rights to the underlying assets and the related cash flows. In accordance with most credit derivative contracts, should a credit event (or settlement trigger) occur, the Company is usually liable for the difference between the protection sold and the recourse it holds in the value of the underlying assets. Thus, if the reference entity defaults, Citi will generally have a right to collect on the underlying reference credit and any related cash flows, while being liable for the full notional amount of credit protection sold to the buyer. Furthermore, this maximum potential amount of future payments for credit protection sold has not been reduced for any cash collateral paid to a given counterparty, as such payments would be calculated after netting all derivative exposures, including any credit derivatives with that counterparty in accordance with a related master netting agreement. Due to such netting processes, determining the amount of collateral that corresponds to credit derivative exposures only is not possible. The Company actively monitors open credit risk exposures, and manages this exposure by using a variety of strategies including purchased credit derivatives, cash collateral or direct holdings of the referenced assets. This risk mitigation activity is not captured in the table above.
Credit-Risk-Related Contingent Features in Derivatives
Certain derivative instruments contain provisions that require the Company to either post additional collateral or immediately settle any outstanding liability balances upon the occurrence of a specified credit-risk-related event. These events, which are defined by the existing derivative contracts, are primarily downgrades in the credit ratings of the Company and its affiliates. The fair value of all derivative instruments with credit-risk-related contingent features that are in a liability position at March 31, 2010 and December 31, 2009 is $22 billion and $17 billion, respectively. The Company has posted $15 billion and $11 billion as collateral for this exposure in the normal course of business as of March 31, 2010 and December 31, 2009, respectively. Each downgrade would trigger additional collateral requirements for the Company and its affiliates. In the event that each legal entity was downgraded a single notch as of March 31, 2010, the Company would be required to post additional collateral of $2.0 billion.
141
SFAS 157 (now ASC 820-10) defines fair value, establishes a consistent framework for measuring fair value and expands disclosure requirements about fair value measurements. Among other things, the standard requires the Company to maximize the use of observable inputs and minimize the use of unobservable inputs when measuring fair value. In addition, it precludes the use of block discounts when measuring the fair value of instruments traded in an active market; and requires recognition of trade-date gains related to certain derivative transactions whose fair value has been determined using unobservable market inputs.
This standard also requires that the impact of Citigroup's own credit risk on derivatives and other liabilities measured at fair value be factored into the valuation.
Fair Value Hierarchy
ASC 820-10 specifies a hierarchy of valuation techniques based on whether the inputs to those valuation techniques are observable or unobservable. Observable inputs reflect market data obtained from independent sources, while unobservable inputs reflect the Company's market assumptions. These two types of inputs have created the following fair-value hierarchy:
- •
-
Level 1: Quoted prices for
identical
instruments in active markets.
- •
-
Level 2: Quoted prices for
similar
instruments in active markets;
quoted prices for identical or similar instruments in markets that are not active; and model-derived valuations in which all significant inputs and significant value drivers are
observable
in active
markets.
- •
- Level 3: Valuations derived from valuation techniques in which one or more significant inputs or significant value drivers are unobservable .
This hierarchy requires the use of observable market data when available. The Company considers relevant and observable market prices in its valuations where possible. The frequency of transactions, the size of the bid-ask spread and the amount of adjustment necessary when comparing similar transactions are all factors in determining the liquidity of markets and the relevance of observed prices in those markets.
The Company's policy with respect to transfers between levels of the fair value hierarchy is to recognize transfers into and out of each level as of the end of the reporting period.
Determination of Fair Value
For assets and liabilities carried at fair value, the Company measures such value using the procedures set out below, irrespective of whether these assets and liabilities are carried at fair value as a result of an election or whether they were previously carried at fair value.
When available, the Company generally uses quoted market prices to determine fair value and classifies such items as Level 1. In some cases where a market price is available, the Company will make use of acceptable practical expedients (such as matrix pricing) to calculate fair value, in which case the items are classified as Level 2.
If quoted market prices are not available, fair value is based upon internally developed valuation techniques that use, where possible, current market-based or independently sourced market parameters, such as interest rates, currency rates, option volatilities, etc. Items valued using such internally generated valuation techniques are classified according to the lowest level input or value driver that is significant to the valuation. Thus, an item may be classified in Level 3 even though there may be some significant inputs that are readily observable.
Where available, the Company may also make use of quoted prices for recent trading activity in positions with the same or similar characteristics to that being valued. The frequency and size of transactions and the amount of the bid-ask spread are among the factors considered in determining the liquidity of markets and the relevance of observed prices from those markets. If relevant and observable prices are available, those valuations would be classified as Level 2. If prices are not available, other valuation techniques would be used and the item would be classified as Level 3.
Fair value estimates from internal valuation techniques are verified, where possible, to prices obtained from independent vendors or brokers. Vendors and brokers' valuations may be based on a variety of inputs ranging from observed prices to proprietary valuation models.
The following section describes the valuation methodologies used by the Company to measure various financial instruments at fair value, including an indication of the level in the fair value hierarchy in which each instrument is generally classified. Where appropriate, the description includes details of the valuation models, the key inputs to those models as well as any significant assumptions.
Securities purchased under agreements to resell and securities sold under agreements to repurchase
No quoted prices exist for such instruments and so fair value is determined using a discounted cash-flow technique. Cash flows are estimated based on the terms of the contract, taking into account any embedded derivative or other features. Expected cash flows are discounted using market rates appropriate to the maturity of the instrument as well as the nature and amount of collateral taken or received. Generally, such instruments are classified within Level 2 of the fair value hierarchy as the inputs used in the fair valuation are readily observable.
142
Trading account assets and liabilities—trading securities and trading loans
When available, the Company uses quoted market prices to determine the fair value of trading securities; such items are classified as Level 1 of the fair value hierarchy. Examples include some government securities and exchange-traded equity securities.
For bonds and secondary market loans traded over the counter, the Company generally determines fair value utilizing internal valuation techniques. Fair value estimates from internal valuation techniques are verified, where possible, to prices obtained from independent vendors. Vendors compile prices from various sources and may apply matrix pricing for similar bonds or loans where no price is observable. If available, the Company may also use quoted prices for recent trading activity of assets with similar characteristics to the bond or loan being valued. Trading securities and loans priced using such methods are generally classified as Level 2. However, when less liquidity exists for a security or loan, a quoted price is stale or prices from independent sources vary, a loan or security is generally classified as Level 3.
Where the Company's principal market for a portfolio of loans is the securitization market, the Company uses the securitization price to determine the fair value of the portfolio. The securitization price is determined from the assumed proceeds of a hypothetical securitization in the current market, adjusted for transformation costs (i.e., direct costs other than transaction costs) and securitization uncertainties such as market conditions and liquidity. As a result of the severe reduction in the level of activity in certain securitization markets since the second half of 2007, observable securitization prices for certain directly comparable portfolios of loans have not been readily available. Therefore, such portfolios of loans are generally classified as Level 3 of the fair value hierarchy. However, for other loan securitization markets, such as those related to conforming prime fixed-rate and conforming adjustable-rate mortgage loans, pricing verification of the hypothetical securitizations has been possible, since these markets have remained active. Accordingly, these loan portfolios are classified as Level 2 in the fair value hierarchy.
Trading account assets and liabilities—derivatives
Exchange-traded derivatives are generally fair valued using quoted market (i.e., exchange) prices and so are classified as Level 1 of the fair value hierarchy.
The majority of derivatives entered into by the Company are executed over the counter and so are valued using internal valuation techniques as no quoted market prices exist for such instruments. The valuation techniques and inputs depend on the type of derivative and the nature of the underlying instrument. The principal techniques used to value these instruments are discounted cash flows, Black-Scholes and Monte Carlo simulation. The fair values of derivative contracts reflect cash the Company has paid or received (for example, option premiums paid and received).
The key inputs depend upon the type of derivative and the nature of the underlying instrument and include interest rate yield curves, foreign-exchange rates, the spot price of the underlying volatility and correlation. The item is placed in either Level 2 or Level 3 depending on the observability of the significant inputs to the model. Correlation and items with longer tenors are generally less observable.
Subprime-related direct exposures in CDOs
The Company accounts for its CDO super-senior subprime direct exposures and the underlying securities on a fair-value basis with all changes in fair value recorded in earnings. Citigroup's CDO super-senior subprime direct exposures are not subject to valuation based on observable transactions. Accordingly, the fair value of these exposures is based on management's best estimates based on facts and circumstances as of the date of these Consolidated Financial Statements.
Citigroup's CDO super-senior subprime direct exposures are Level 3 assets. The valuation of the high-grade and mezzanine ABS CDO positions uses trader prices based on the underlying assets of each high-grade and mezzanine ABS CDO. Unlike the ABCP positions, the high-grade and mezzanine positions are now largely hedged through the ABX and bond short positions, which are trader priced. This results in closer symmetry in the way these long and short positions are valued by the Company. Citigroup intends to use trader marks to value this portion of the portfolio going forward so long as it remains largely hedged.
The fair values of ABCP positions are based on significant unobservable inputs. Fair value of these exposures are based on estimates of future cash flows from the mortgage loans underlying the assets of the ABS CDOs. To determine the performance of the underlying mortgage loan portfolios, the Company estimates the prepayments, defaults and loss severities based on a number of macroeconomic factors, including housing price changes, unemployment rates, interest rates and borrower and loan attributes, such as age, credit scores, documentation status, loan-to-value (LTV) ratios and debt-to-income (DTI) ratios. The model is calibrated using available mortgage loan information including historical loan performance. In addition, the methodology estimates the impact of geographic concentration of mortgages and the impact of reported fraud in the origination of subprime mortgages. An appropriate discount rate is then applied to the cash flows generated for each ABCP tranche, in order to estimate its fair value under current market conditions.
When necessary, the valuation methodology used by Citigroup is refined and the inputs used for the purposes of estimation are modified, in part, to reflect ongoing market developments. More specifically, the inputs of home price appreciation (HPA) assumptions and delinquency data were updated along with discount rates that are based upon a weighted average combination of implied spreads from single name ABS bond prices and ABX indices, as well as CLO spreads under current market conditions.
The housing-price changes were estimated using a forward-looking projection, which incorporated the Loan Performance Index. In addition, the Company's mortgage default model also uses recent mortgage performance data, a period of sharp home price declines and high levels of mortgage foreclosures.
The valuation as of March 31, 2010 assumes that U.S. housing prices are unchanged for the remainder of 2010, increase 0.6% in 2011, increase 1.4% in 2012, increase 2.2% in 2013 and increase 3% per year from 2014 onwards.
In addition, the discount rates were based on a weighted average combination of the implied spreads from single name
143
ABS bond prices, ABX indices and CLO spreads, depending on vintage and asset types. To determine the discount margin, the Company applies the mortgage default model to the bonds underlying the ABX indices and other referenced cash bonds and solves for the discount margin that produces the current market prices of those instruments.
The primary drivers that currently impact the model valuations are the discount rates used to calculate the present value of projected cash flows and projected mortgage loan performance.
For most of the lending and structuring direct subprime exposures (excluding super seniors), fair value is determined utilizing observable transactions where available, other market data for similar assets in markets that are not active and other internal valuation techniques.
Investments
The investments category includes available-for-sale debt and marketable equity securities, whose fair value is determined using the same procedures described for trading securities above or, in some cases, using vendor prices as the primary source.
Also included in investments are nonpublic investments in private equity and real estate entities held by the S&B business. Determining the fair value of nonpublic securities involves a significant degree of management resources and judgment as no quoted prices exist and such securities are generally very thinly traded. In addition, there may be transfer restrictions on private equity securities. The Company uses an established process for determining the fair value of such securities, using commonly accepted valuation techniques, including the use of earnings multiples based on comparable public securities, industry-specific non-earnings-based multiples and discounted cash flow models. In determining the fair value of nonpublic securities, the Company also considers events such as a proposed sale of the investee company, initial public offerings, equity issuances, or other observable transactions.
Private equity securities are generally classified as Level 3 of the fair value hierarchy.
Short-term borrowings and long-term debt
Where fair value accounting has been elected, the fair value of non-structured liabilities is determined by discounting expected cash flows using the appropriate discount rate for the applicable maturity. Such instruments are generally classified as Level 2 of the fair value hierarchy as all inputs are readily observable.
The Company determines the fair value of structured liabilities (where performance is linked to structured interest rates, inflation or currency risks) and hybrid financial instruments (performance linked to risks other than interest rates, inflation or currency risks) using the appropriate derivative valuation methodology (described above) given the nature of the embedded risk profile. Such instruments are classified as Level 2 or Level 3 depending on the observability of significant inputs to the model.
Market valuation adjustments
Liquidity adjustments are applied to items in Level 2 and Level 3 of the fair value hierarchy to ensure that the fair value reflects the price at which the entire position could be liquidated. The liquidity reserve is based on the bid-offer spread for an instrument, adjusted to take into account the size of the position.
Counterparty credit-risk adjustments are applied to derivatives, such as over-the-counter derivatives, where the base valuation uses market parameters based on the LIBOR interest rate curves. Not all counterparties have the same credit risk as that implied by the relevant LIBOR curve, so it is necessary to consider the market view of the credit risk of a counterparty in order to estimate the fair value of such an item.
Bilateral or "own" credit-risk adjustments are applied to reflect the Company's own credit risk when valuing derivatives and liabilities measured at fair value. Counterparty and own credit adjustments consider the expected future cash flows between Citi and its counterparties under the terms of the instrument and the effect of credit risk on the valuation of those cash flows, rather than a point-in-time assessment of the current recognized net asset or liability. Furthermore, the credit-risk adjustments take into account the effect of credit-risk mitigants, such as pledged collateral and any legal right of offset (to the extent such offset exists) with a counterparty through arrangements such as netting agreements.
Auction rate securities
Auction rate securities (ARS) are long-term municipal bonds, corporate bonds, securitizations and preferred stocks with interest rates or dividend yields that are reset through periodic auctions. The coupon paid in the current period is based on the rate determined by the prior auction. In the event of an auction failure, ARS holders receive a "fail rate" coupon, which is specified by the original issue documentation of each ARS.
Where insufficient orders to purchase all of the ARS issue to be sold in an auction were received, the primary dealer or auction agent would traditionally have purchased any residual unsold inventory (without a contractual obligation to do so). This residual inventory would then be repaid through subsequent auctions, typically in a short timeframe. Due to this auction mechanism and generally liquid market, ARS have historically traded and were valued as short-term instruments.
Citigroup acted in the capacity of primary dealer for approximately $72 billion of ARS and continued to purchase residual unsold inventory in support of the auction mechanism until mid-February 2008. After this date, liquidity in the ARS market deteriorated significantly, auctions failed due to a lack of bids from third-party investors and Citigroup ceased to purchase unsold inventory. Following a number of ARS refinancings, at March 31, 2010, Citigroup continued to act in the capacity of primary dealer for approximately $27.1 billion of outstanding ARS.
The Company classifies its ARS as held-to-maturity, available-for-sale and trading securities.
Prior to the Company's first auction's failing in the first quarter of 2008, Citigroup valued ARS based on observation of auction market prices, because the auctions had a short maturity period (7, 28 and 35 days). This generally resulted in valuations at par. Once the auctions failed, ARS could no longer be valued using observation of auction market prices. Accordingly, the fair value of ARS is currently estimated using internally developed discounted cash flow valuation
144
techniques specific to the nature of the assets underlying each ARS.
For ARS with U.S. municipal securities as underlying assets, future cash flows are estimated based on the terms of the securities underlying each individual ARS and discounted at an estimated discount rate in order to estimate the current fair value. The key assumptions that impact the ARS valuations are estimated prepayments and refinancings, estimated fail rate coupons (i.e., the rate paid in the event of auction failure, which varies according to the current credit rating of the issuer) and the discount rate used to calculate the present value of projected cash flows. The discount rate used for each ARS is based on rates observed for straight issuances of other municipal securities. In order to arrive at the appropriate discount rate, these observed rates were adjusted upward to factor in the specifics of the ARS structure being valued, such as callability, and the illiquidity in the ARS market.
For ARS with student loans as underlying assets, future cash flows are estimated based on the terms of the loans underlying each individual ARS, discounted at an appropriate rate in order to estimate the current fair value. The key assumptions that impact the ARS valuations are the expected weighted average life of the structure, estimated fail rate coupons, the amount of leverage in each structure and the discount rate used to calculate the present value of projected cash flows. The discount rate used for each ARS is based on rates observed for basic securitizations with similar maturities to the loans underlying each ARS being valued. In order to arrive at the appropriate discount rate, these observed rates were adjusted upward to factor in the specifics of the ARS structure being valued, such as callability, and the illiquidity in the ARS market.
The majority of ARS continue to be classified as Level 3.
Alt-A mortgage securities
The Company classifies its Alt-A mortgage securities as held-to-maturity, available-for-sale and trading investments. The securities classified as trading and available-for-sale are recorded at fair value with changes in fair value reported in current earnings and AOCI, respectively. For these purposes, Alt-A mortgage securities are non-agency residential mortgage-backed securities (RMBS) where (1) the underlying collateral has weighted average FICO scores between 680 and 720 or (2) for instances where FICO scores are greater than 720, RMBS have 30% or less of the underlying collateral composed of full documentation loans.
Similar to the valuation methodologies used for other trading securities and trading loans, the Company generally determines the fair value of Alt-A mortgage securities utilizing internal valuation techniques. Fair-value estimates from internal valuation techniques are verified, where possible, to prices obtained from independent vendors. Vendors compile prices from various sources. Where available, the Company may also make use of quoted prices for recent trading activity in securities with the same or similar characteristics to that being valued.
The internal valuation techniques used for Alt-A mortgage securities, as with other mortgage exposures, consider estimated housing price changes, unemployment rates, interest rates and borrower attributes. They also consider prepayment rates as well as other market indicators.
Alt-A mortgage securities that are valued using these methods are generally classified as Level 2. However, Alt-A mortgage securities backed by Alt-A mortgages of lower quality or more recent vintages are mostly classified as Level 3 due to the reduced liquidity that exists for such positions, which reduces the reliability of prices available from independent sources.
Commercial real estate exposure
Citigroup reports a number of different exposures linked to commercial real estate at fair value with changes in fair value reported in earnings, including securities, loans and investments in entities that hold commercial real estate loans or commercial real estate directly. The Company also reports securities backed by commercial real estate as available-for-sale investments, which are carried at fair value with changes in fair-value reported in AOCI.
Similar to the valuation methodologies used for other trading securities and trading loans, the Company generally determines the fair value of securities and loans linked to commercial real estate utilizing internal valuation techniques. Fair-value estimates from internal valuation techniques are verified, where possible, to prices obtained from independent vendors. Vendors compile prices from various sources. Where available, the Company may also make use of quoted prices for recent trading activity in securities or loans with the same or similar characteristics to those being valued. Securities and loans linked to commercial real estate valued using these methodologies are generally classified as Level 3 as a result of the reduced liquidity currently in the market for such exposures.
The fair value of investments in entities that hold commercial real estate loans or commercial real estate directly is determined using a similar methodology to that used for other non-public investments in real estate held by the S&B business. The Company uses an established process for determining the fair value of such securities, using commonly accepted valuation techniques, including the use of earnings multiples based on comparable public securities, industry-specific non-earnings-based multiples and discounted cash flow models. In determining the fair value of such investments, the Company also considers events, such as a proposed sale of the investee company, initial public offerings, equity issuances, or other observable transactions. Such investments are generally classified as Level 3 of the fair-value hierarchy.
145
Items Measured at Fair Value on a Recurring Basis
The following tables present for each of the fair-value hierarchy levels the Company's assets and liabilities that are measured at fair value on a recurring basis. The Company often hedges positions that have been classified in the Level 3 category with financial instruments that have been classified as Level 1 or Level 2. In addition, the Company also hedges items classified in the Level 3 category with instruments classified in Level 3 of the fair value hierarchy. The effects of these hedges are presented gross in the following table.
| In millions of dollars at March 31, 2010 | Level 1 | Level 2 | Level 3 |
Gross
inventory |
Netting(1) |
Net
balance |
||||||||||||||||
|---|---|---|---|---|---|---|---|---|---|---|---|---|---|---|---|---|---|---|---|---|---|---|
|
Assets |
||||||||||||||||||||||
|
Federal funds sold and securities borrowed or purchased under agreements to resell |
$ | — | $ | 147,565 | $ | 1,907 | $ | 149,472 | $ | (52,876 | ) | $ | 96,596 | |||||||||
|
Trading securities |
||||||||||||||||||||||
|
Trading mortgage-backed securities |
||||||||||||||||||||||
|
U.S. government sponsored |
$ | — | $ | 28,207 | $ | 947 | $ | 29,154 | $ | — | $ | 29,154 | ||||||||||
|
Prime |
— | 969 | 399 | 1,368 | — | 1,368 | ||||||||||||||||
|
Alt-A |
— | 1,043 | 321 | 1,364 | — | 1,364 | ||||||||||||||||
|
Subprime |
— | 623 | 6,525 | 7,148 | — | 7,148 | ||||||||||||||||
|
Non-U.S. residential |
— | 2,536 | 243 | 2,779 | — | 2,779 | ||||||||||||||||
|
Commercial |
— | 990 | 2,215 | 3,205 | — | 3,205 | ||||||||||||||||
|
Total trading mortgage-backed securities |
$ | — | $ | 34,368 | $ | 10,650 | $ | 45,018 | $ | — | $ | 45,018 | ||||||||||
|
U.S. Treasury and federal agencies securities |
||||||||||||||||||||||
|
U.S. Treasury |
$ | 26,308 | $ | 866 | $ | — | $ | 27,174 | $ | — | $ | 27,174 | ||||||||||
|
Agency obligations |
— | 5,248 | — | 5,248 | — | 5,248 | ||||||||||||||||
|
Total U.S. Treasury and federal agencies securities |
$ | 26,308 | $ | 6,114 | $ | — | $ | 32,422 | $ | — | $ | 32,422 | ||||||||||
|
State and municipal |
$ | — | $ | 7,219 | $ | 453 | $ | 7,672 | $ | — | $ | 7,672 | ||||||||||
|
Foreign government |
68,746 | 16,610 | 644 | 86,000 | — | 86,000 | ||||||||||||||||
|
Corporate |
— | 49,045 | 7,950 | 56,995 | — | 56,995 | ||||||||||||||||
|
Equity securities |
32,440 | 9,709 | 905 | 43,054 | — | 43,054 | ||||||||||||||||
|
Asset-backed securities |
— | 1,275 | 4,200 | 5,475 | 5,475 | |||||||||||||||||
|
Other debt securities |
— | 14,308 | 1,129 | 15,437 | — | 15,437 | ||||||||||||||||
|
Total trading securities |
$ | 127,494 | $ | 138,648 | $ | 25,931 | $ | 292,073 | $ | — | $ | 292,073 | ||||||||||
|
Derivatives |
||||||||||||||||||||||
|
Interest rate contracts |
$ | 116 | $ | 457,713 | $ | 2,352 | $ | 460,181 | ||||||||||||||
|
Foreign exchange contracts |
4 | 69,978 | 698 | 70,680 | ||||||||||||||||||
|
Equity contracts |
3,320 | 12,970 | 1,876 | 18,166 | ||||||||||||||||||
|
Commodity and other contracts |
— | 16,293 | 879 | 17,172 | ||||||||||||||||||
|
Credit derivatives |
— | 65,312 | 22,568 | 87,880 | ||||||||||||||||||
|
Total Gross Derivatives |
$ | 3,440 | $ | 622,266 | $ | 28,373 | $ | 654,079 | ||||||||||||||
|
Cash Collateral Paid |
— | 48,247 | ||||||||||||||||||||
|
Netting agreements and market value adjustments |
(648,616 | ) | ||||||||||||||||||||
|
Total Derivatives |
$ | 3,440 | $ | 622,266 | $ | 28,373 | $ | 702,326 | $ | (648,616 | ) | $ | 53,710 | |||||||||
|
Investments |
||||||||||||||||||||||
|
Mortgage-backed securities |
||||||||||||||||||||||
|
U.S. government sponsored |
$ | 86 | $ | 20,370 | $ | 1 | $ | 20,457 | $ | — | $ | 20,457 | ||||||||||
|
Prime |
— | 5,602 | 276 | 5,878 | — | 5,878 | ||||||||||||||||
|
Alt-A |
— | 222 | 30 | 252 | — | 252 | ||||||||||||||||
|
Subprime |
— | — | 1 | 1 | — | 1 | ||||||||||||||||
|
Non-U.S. Residential |
— | 204 | — | 204 | — | 204 | ||||||||||||||||
|
Commercial |
— | 40 | 546 | 586 | — | 586 | ||||||||||||||||
146
| In millions of dollars at March 31, 2010 | Level 1 | Level 2 | Level 3 |
Gross
inventory |
Netting(1) |
Net
balance |
|||||||||||||||||
|---|---|---|---|---|---|---|---|---|---|---|---|---|---|---|---|---|---|---|---|---|---|---|---|
|
Total investment mortgage-backed securities |
$ | 86 | $ | 26,438 | $ | 854 | $ | 27,378 | $ | — | $ | 27,378 | |||||||||||
|
U.S. Treasury and federal agency securities |
|||||||||||||||||||||||
|
U.S. Treasury |
$ | 5,261 | $ | 26,482 | $ | — | $ | 31,743 | $ | — | $ | 31,743 | |||||||||||
|
Agency obligations |
— | 35,737 | 19 | 35,756 | 35,756 | ||||||||||||||||||
|
Total U.S. Treasury and federal agency |
$ | 5,261 | $ | 62,219 | $ | 19 | $ | 67,499 | $ | — | $ | 67,499 | |||||||||||
|
State and municipal |
$ | — | $ | 15,083 | $ | 262 | $ | 15,345 | — | $ | 15,345 | ||||||||||||
|
Foreign government |
58,561 | 48,424 | 287 | 107,272 | — | 107,272 | |||||||||||||||||
|
Corporate |
— | 16,024 | 1,062 | 17,086 | — | 17,086 | |||||||||||||||||
|
Equity securities |
3,335 | 128 | 2,468 | 5,931 | — | 5,931 | |||||||||||||||||
|
Asset-backed securities |
— | 2,347 | 7,936 | 10,283 | — | 10,283 | |||||||||||||||||
|
Other debt securities |
— | 1,566 | 1,007 | 2,573 | — | 2,573 | |||||||||||||||||
|
Non-marketable equity securities |
— | 158 | 8,613 | 8,771 | — | 8,771 | |||||||||||||||||
|
Total investments |
$ | 67,243 | $ | 172,387 | $ | 22,508 | $ | 262,138 | — | $ | 262,138 | ||||||||||||
|
Loans(2) |
$ | — | 973 | $ | 4,395 | 5,368 | — | $ | 5,368 | ||||||||||||||
|
Mortgage servicing rights |
— | — | 6,439 | 6,439 | — | 6,439 | |||||||||||||||||
|
Other financial assets measured on a recurring basis |
— | 14,796 | 907 | 15,703 | (2,455 | ) | 13,248 | ||||||||||||||||
|
Total assets |
$ | 198,177 | $ | 1,096,635 | $ | 90,460 | 1,433,519 | $ | (703,947 | ) | $ | 729,572 | |||||||||||
|
Total as a percentage of gross assets(3) |
14.3 | % | 79.2 | % | 6.5 | % | 100.0 | % | |||||||||||||||
|
Liabilities |
|||||||||||||||||||||||
|
Interest-bearing deposits |
$ | — | $ | 1,382 | $ | 158 | $ | 1,540 | — | $ | 1,540 | ||||||||||||
|
Federal funds purchased and securities loaned or sold under agreements to repurchase |
— | 188,427 | 975 | 189,402 | (52,876 | ) | 136,526 | ||||||||||||||||
|
Trading account liabilities |
|||||||||||||||||||||||
|
Securities sold, not yet purchased |
68,086 | 14,900 | 148 | 83,134 | — | 83,134 | |||||||||||||||||
|
Derivatives |
|||||||||||||||||||||||
|
Interest rate contracts |
128 | 457,696 | 2,013 | 459,837 | |||||||||||||||||||
|
Foreign exchange contracts |
19 | 69,998 | 665 | 70,682 | |||||||||||||||||||
|
Equity contracts |
3,327 | 29,473 | 3,296 | 36,096 | |||||||||||||||||||
|
Commodity and other contracts |
— | 16,026 | 1,524 | 17,550 | |||||||||||||||||||
|
Credit derivatives |
— | 59,341 | 17,539 | 76,880 | |||||||||||||||||||
|
Total gross derivatives |
$ | 3,474 | $ | 632,534 | $ | 25,037 | $ | 661,045 | |||||||||||||||
|
Cash collateral received |
— | 39,144 | |||||||||||||||||||||
|
Netting agreements and market value adjustments |
(640,575 | ) | |||||||||||||||||||||
|
Total derivatives |
$ | 3,474 | $ | 632,534 | $ | 25,037 | $ | 700,189 | $ | (640,575 | ) | $ | 59,614 | ||||||||||
|
Short-term borrowings |
— | 967 | 258 | 1,225 | 1,225 | ||||||||||||||||||
|
Long-term debt |
— | 15,276 | 12,836 | 28,112 | 28,112 | ||||||||||||||||||
|
Other financial liabilities measured on a recurring basis |
— | 13,934 | 2 | 13,936 | (2,455 | ) | 11,481 | ||||||||||||||||
|
Total liabilities |
$ | 71,560 | $ | 867,420 | $ | 39,414 | 1,017,538 | (695,906 | ) | $ | 321,632 | ||||||||||||
|
Total as a percentage of gross liabilities(3) |
7.3 | % | 88.7 | % | 4.0 | % | 100.0 | % | |||||||||||||||
- (1)
-
Represents
netting of: (i) the amounts due under securities purchased under agreements to resell and the amounts owed under securities sold under
agreements to repurchase, and (ii) derivative exposures covered by a qualifying master netting agreement, cash collateral, and the market value adjustment.
- (2)
-
There
is no allowance for loan losses recorded for loans reported at fair value.
- (3)
- Percentage is calculated based on total assets and liabilities excluding collateral received/paid on derivatives.
147
| In millions of dollars at December 31, 2009 | Level 1 | Level 2 | Level 3 |
Gross
inventory |
Netting(1) |
Net
balance |
||||||||||||||||
|---|---|---|---|---|---|---|---|---|---|---|---|---|---|---|---|---|---|---|---|---|---|---|
|
ASSETS |
||||||||||||||||||||||
|
Federal funds sold and securities borrowed or purchased under agreements to resell |
$ | — | $ | 138,550 | $ | — | $ | 138,550 | $ | (50,713 | ) | $ | 87,837 | |||||||||
|
Trading securities |
||||||||||||||||||||||
|
Trading mortgage-backed securities |
||||||||||||||||||||||
|
U.S. government-sponsored agency guaranteed |
$ | — | $ | 19,666 | $ | 972 | $ | 20,638 | $ | — | $ | 20,638 | ||||||||||
|
Prime |
— | 772 | 384 | 1,156 | — | 1,156 | ||||||||||||||||
|
Alt-A |
— | 842 | 387 | 1,229 | — | 1,229 | ||||||||||||||||
|
Subprime |
— | 736 | 8,998 | 9,734 | — | 9,734 | ||||||||||||||||
|
Non-U.S. residential |
— | 1,796 | 572 | 2,368 | — | 2,368 | ||||||||||||||||
|
Commercial |
— | 1,004 | 2,451 | 3,455 | — | 3,455 | ||||||||||||||||
|
Total trading mortgage-backed securities |
$ | — | $ | 24,816 | $ | 13,764 | $ | 38,580 | $ | — | $ | 38,580 | ||||||||||
|
U.S. Treasury and federal agencies securities |
||||||||||||||||||||||
|
U.S. Treasury |
$ | 27,943 | $ | 995 | $ | — | $ | 28,938 | $ | — | $ | 28,938 | ||||||||||
|
Agency obligations |
— | 2,041 | — | $ | 2,041 | — | 2,041 | |||||||||||||||
|
Total U.S. Treasury and federal agencies securities |
$ | 27,943 | $ | 3,036 | $ | — | $ | 30,979 | $ | — | $ | 30,979 | ||||||||||
|
Other trading securities |
||||||||||||||||||||||
|
State and municipal |
$ | — | $ | 6,925 | $ | 222 | $ | 7,147 | $ | — | $ | 7,147 | ||||||||||
|
Foreign government |
59,229 | 13,081 | 459 | 72,769 | — | 72,769 | ||||||||||||||||
|
Corporate |
— | 43,365 | 8,620 | 51,985 | — | 51,985 | ||||||||||||||||
|
Equity securities |
33,754 | 11,827 | 640 | 46,221 | — | 46,221 | ||||||||||||||||
|
Other debt securities |
— | 19,976 | 16,237 | 36,213 | — | 36,213 | ||||||||||||||||
|
Total trading securities |
$ | 120,926 | $ | 123,026 | $ | 39,942 | $ | 283,894 | $ | — | $ | 283,894 | ||||||||||
|
Total derivatives(2) |
$ | 4,002 | $ | 671,532 | $ | 27,685 | $ | 703,219 | $ | (644,340 | ) | $ | 58,879 | |||||||||
|
Investments |
||||||||||||||||||||||
|
Mortgage-backed securities |
||||||||||||||||||||||
|
U.S. government-sponsored agency guaranteed |
$ | 89 | $ | 20,823 | $ | 2 | $ | 20,914 | $ | — | $ | 20,914 | ||||||||||
|
Prime |
— | 5,742 | 736 | 6,478 | — | 6,478 | ||||||||||||||||
|
Alt-A |
— | 572 | 55 | 627 | — | 627 | ||||||||||||||||
|
Subprime |
— | — | 1 | 1 | — | 1 | ||||||||||||||||
|
Non-U.S. residential |
— | 255 | — | 255 | — | 255 | ||||||||||||||||
|
Commercial |
— | 47 | 746 | 793 | — | 793 | ||||||||||||||||
|
Total investment mortgage-backed securities |
$ | 89 | $ | 27,439 | $ | 1,540 | $ | 29,068 | $ | — | $ | 29,068 | ||||||||||
|
U.S. Treasury and federal agency securities |
||||||||||||||||||||||
|
U.S. Treasury |
$ | 5,943 | $ | 20,619 | $ | — | $ | 26,562 | $ | — | $ | 26,562 | ||||||||||
|
Agency obligations |
— | 27,531 | 21 | 27,552 | — | 27,552 | ||||||||||||||||
|
Total U.S. Treasury and federal agency |
$ | 5,943 | $ | 48,150 | $ | 21 | $ | 54,114 | $ | — | $ | 54,114 | ||||||||||
|
State and municipal |
$ | — | $ | 15,393 | $ | 217 | $ | 15,610 | $ | — | $ | 15,610 | ||||||||||
|
Foreign government |
60,484 | 41,765 | 270 | 102,519 | — | 102,519 | ||||||||||||||||
|
Corporate |
— | 19,056 | 1,257 | 20,313 | — | 20,313 | ||||||||||||||||
|
Equity securities |
3,056 | 237 | 2,513 | 5,806 | — | 5,806 | ||||||||||||||||
|
Other debt securities |
— | 3,337 | 8,832 | 12,169 | — | 12,169 | ||||||||||||||||
|
Non-marketable equity securities |
— | 77 | 6,753 | 6,830 | — | 6,830 | ||||||||||||||||
|
Total investments |
$ | 69,572 | $ | 155,454 | $ | 21,403 | $ | 246,429 | $ | — | $ | 246,429 | ||||||||||
|
Loans(3) |
$ | — | $ | 1,226 | $ | 213 | $ | 1,439 | $ | — | $ | 1,439 | ||||||||||
|
Mortgage servicing rights |
— | — | 6,530 | 6,530 | — | 6,530 | ||||||||||||||||
|
Other financial assets measured on a recurring basis |
— | 15,787 | 1,101 | 16,888 | (4,224 | ) | 12,664 | |||||||||||||||
|
Total assets |
$ | 194,500 | $ | 1,105,575 | $ | 96,874 | $ | 1,396,949 | $ | (699,277 | ) | $ | 697,672 | |||||||||
|
|
13.9 | % | 79.2 | % | 6.9 | % | 100.0 | % | ||||||||||||||
148
| In millions of dollars at December 31, 2009 | Level 1 | Level 2 | Level 3 |
Gross
inventory |
Netting(1) |
Net
balance |
||||||||||||||
|---|---|---|---|---|---|---|---|---|---|---|---|---|---|---|---|---|---|---|---|---|
|
LIABILITIES |
||||||||||||||||||||
|
Interest-bearing deposits |
$ | — | $ | 1,517 | $ | 28 | $ | 1,545 | $ | — | $ | 1,545 | ||||||||
|
Federal funds purchased and securities loaned or sold under agreements to repurchase |
— | 152,687 | 2,056 | 154,743 | (50,713 | ) | 104,030 | |||||||||||||
|
Trading account liabilities |
||||||||||||||||||||
|
Securities sold, not yet purchased |
52,399 | 20,233 | 774 | 73,406 | — | 73,406 | ||||||||||||||
|
Derivatives(2) |
4,980 | 669,384 | 24,577 | 698,941 | (634,835 | ) | 64,106 | |||||||||||||
|
Short-term borrowings |
— | 408 | 231 | 639 | — | 639 | ||||||||||||||
|
Long-term debt |
— | 16,288 | 9,654 | 25,942 | — | 25,942 | ||||||||||||||
|
Other financial liabilities measured on a recurring basis |
— | 15,753 | 13 | 15,766 | (4,224 | ) | 11,542 | |||||||||||||
|
Total liabilities |
$ | 57,379 | $ | 876,270 | $ | 37,333 | $ | 970,982 | $ | (689,772 | ) | $ | 281,210 | |||||||
|
|
5.9 | % | 90.2 | % | 3.8 | % | 100.0 | % | ||||||||||||
- (1)
-
Represents
netting of: (i) the amounts due under securities purchased under agreements to resell and the amounts owed under securities sold under
agreements to repurchase, and (ii) derivative exposures covered by a qualifying master netting agreement, cash collateral, and the market value adjustment.
- (2)
-
Cash
collateral paid/received is included in Level 2 Derivative assets/liabilities, as it is primarily related to derivative positions classified in
Level 2.
- (3)
- There is no allowance for loan losses recorded for loans reported at fair value.
149
Changes in Level 3 Fair-Value Category
The following tables present the changes in the Level 3 fair-value category for the three months ended March 31, 2010 and March 31, 2009. The Company classifies financial instruments in Level 3 of the fair-value hierarchy when there is reliance on at least one significant unobservable input to the valuation model. In addition to these unobservable inputs, the valuation models for Level 3 financial instruments typically also rely on a number of inputs that are readily observable either directly or indirectly. Thus, the gains and losses presented below include changes in the fair value related to both observable and unobservable inputs.
The Company often hedges positions with offsetting positions that are classified in a different level. For example, the gains and losses for assets and liabilities in the Level 3 category presented in the tables below do not reflect the effect of offsetting losses and gains on hedging instruments that have been classified by the Company in the Level 1 and Level 2 categories. In addition, the Company hedges items classified in the Level 3 category with instruments also classified in Level 3 of the fair-value hierarchy. The effects of these hedges are presented gross in the following tables.
|
|
|
Net realized/ unrealized
gains (losses) included in |
|
|
|
|
|||||||||||||||||||
|---|---|---|---|---|---|---|---|---|---|---|---|---|---|---|---|---|---|---|---|---|---|---|---|---|---|
|
|
|
Transfers
in and/or out of Level 3 |
Purchases,
issuances and settlements |
|
Unrealized
gains (losses) still held(3) |
||||||||||||||||||||
| In millions of dollars |
December 31,
2009 |
Principal
transactions |
Other(1)(2) |
March 31,
2010 |
|||||||||||||||||||||
|
Assets |
|||||||||||||||||||||||||
|
Federal funds sold and securities borrowed or purchased under agreements to resell |
$ | — | $ | 63 | $ | — | $ | 1,052 | $ | 792 | $ | 1,907 | $ | — | |||||||||||
|
Trading securities |
|||||||||||||||||||||||||
|
Trading mortgage-backed securities |
|||||||||||||||||||||||||
|
U.S. government sponsored |
$ | 972 | $ | (51 | ) | $ | — | $ | 98 | $ | (72 | ) | $ | 947 | $ | (18 | ) | ||||||||
|
Prime |
384 | 35 | — | 83 | (103 | ) | 399 | 6 | |||||||||||||||||
|
Alt-A |
387 | 15 | — | 60 | (141 | ) | 321 | 5 | |||||||||||||||||
|
Subprime |
8,998 | 733 | — | (751 | ) | (2,455 | ) | 6,525 | 724 | ||||||||||||||||
|
Non-U.S. residential |
572 | (41 | ) | — | (279 | ) | (9 | ) | 243 | 15 | |||||||||||||||
|
Commercial |
2,451 | (12 | ) | — | (41 | ) | (183 | ) | 2,215 | 3 | |||||||||||||||
|
Total trading mortgage-backed securities |
$ | 13,764 | $ | 679 | $ | — | $ | (830 | ) | $ | (2,963 | ) | $ | 10,650 | $ | 735 | |||||||||
|
State and municipal |
$ | 222 | $ | 3 | $ | — | $ | 185 | 43 | $ | 453 | $ | 1 | ||||||||||||
|
Foreign government |
459 | 26 | — | (197 | ) | 356 | 644 | 16 | |||||||||||||||||
|
Corporate |
8,620 | (1 | ) | — | (339 | ) | (330 | ) | 7,950 | 92 | |||||||||||||||
|
Equity securities |
640 | 6 | — | 326 | (67 | ) | 905 | 31 | |||||||||||||||||
|
Asset-backed securities |
3,006 | (61 | ) | — | (30 | ) | 1,285 | 4,200 | (3 | ) | |||||||||||||||
|
Other debt securities |
13,231 | 95 | — | (207 | ) | (11,990 | ) | 1,129 | 26 | ||||||||||||||||
|
Total trading securities |
$ | 39,942 | $ | 747 | $ | — | $ | (1,092 | ) | $ | (13,666 | ) | $ | 25,931 | $ | 898 | |||||||||
|
Derivatives, net(4) |
|||||||||||||||||||||||||
|
Interest rate contracts |
$ | (374 | ) | $ | 475 | $ | — | $ | 512 | $ | (274 | ) | $ | 339 | $ | 415 | |||||||||
|
Foreign exchange contracts |
(38 | ) | 138 | — | (97 | ) | 30 | 33 | 154 | ||||||||||||||||
|
Equity contracts |
(1,110 | ) | (179 | ) | — | (231 | ) | 100 | (1,420 | ) | (167 | ) | |||||||||||||
|
Commodity and other contracts |
(529 | ) | (201 | ) | — | 30 | 55 | (645 | ) | (163 | ) | ||||||||||||||
|
Credit derivatives |
5,159 | 146 | — | (517 | ) | 241 | 5,029 | 116 | |||||||||||||||||
|
Total Derivatives, net(4) |
$ | 3,108 | $ | 379 | $ | — | $ | (303 | ) | $ | 152 | $ | 3,336 | $ | 355 | ||||||||||
|
Investments |
|||||||||||||||||||||||||
|
Mortgage-backed securities |
|||||||||||||||||||||||||
|
U.S. government-sponsored agency guaranteed |
$ | 2 | $ | — | $ | (1 | ) | $ | — | $ | — | $ | 1 | $ | — | ||||||||||
|
Prime |
736 | — | (97 | ) | (505 | ) | 142 | 276 | — | ||||||||||||||||
|
Alt-A |
55 | — | (23 | ) | — | (2 | ) | 30 | — | ||||||||||||||||
|
Subprime |
1 | — | — | — | — | 1 | — | ||||||||||||||||||
|
Commercial |
746 | — | (462 | ) | 1 | 261 | 546 | — | |||||||||||||||||
|
Total investment mortgage-backed debt securities |
$ | 1,540 | $ | — | $ | (583 | ) | $ | (504 | ) | $ | 401 | $ | 854 | $ | — | |||||||||
|
U.S. Treasury and federal agencies securities |
|||||||||||||||||||||||||
|
Agency Obligations |
$ | 21 | $ | — | $ | (21 | ) | $ | — | $ | 19 | $ | 19 | $ | (1 | ) | |||||||||
|
Total U.S. Treasury and federal agencies securities |
$ | 21 | $ | — | $ | (21 | ) | $ | — | $ | 19 | $ | 19 | $ | (1 | ) | |||||||||
|
State and municipal |
$ | 217 | $ | — | $ | 1 | $ | — | $ | 44 | $ | 262 | $ | 1 | |||||||||||
|
Foreign government |
270 | — | 8 | 17 | (8 | ) | 287 | 1 | |||||||||||||||||
|
Corporate |
1,257 | — | (74 | ) | (59 | ) | (62 | ) | 1,062 | 26 | |||||||||||||||
|
Equity securities |
2,513 | — | 12 | 89 | (146 | ) | 2,468 | 13 | |||||||||||||||||
|
Asset-backed securities |
8,272 | — | (30 | ) | 16 | (322 | ) | 7,936 | (27 | ) | |||||||||||||||
|
Other debt securities |
560 | — | 7 | 6 | 434 | 1,007 | 10 | ||||||||||||||||||
|
Non-marketable equity securities |
6,753 | — | 17 | 1,969 | (126 | ) | 8,613 | 4 | |||||||||||||||||
150
|
|
|
Net realized/ unrealized
gains (losses) included in |
|
|
|
|
|||||||||||||||||
|---|---|---|---|---|---|---|---|---|---|---|---|---|---|---|---|---|---|---|---|---|---|---|---|
|
|
|
Transfers
in and/or out of Level 3 |
Purchases,
issuances and settlements |
|
Unrealized
gains (losses) still held(3) |
||||||||||||||||||
| In millions of dollars |
December 31,
2009 |
Principal
transactions |
Other(1)(2) |
March 31,
2010 |
|||||||||||||||||||
|
Total investments |
$ | 21,403 | $ | — | $ | (663 | ) | $ | 1,534 | $ | 234 | $ | 22,508 | $ | 27 | ||||||||
|
Loans |
$ | 213 | $ | — | $ | 156 | $ | 620 | $ | 3,406 | $ | 4,395 | $ | 143 | |||||||||
|
Mortgage servicing rights |
6,530 | — | 144 | — | (235 | ) | 6,439 | 213 | |||||||||||||||
|
Other financial assets measured on a recurring basis |
1,101 | — | 8 | (13 | ) | (189 | ) | 907 | 15 | ||||||||||||||
|
Liabilities |
|||||||||||||||||||||||
|
Interest-bearing deposits |
$ | 28 | $ | — | $ | 6 | $ | (2 | ) | $ | 138 | $ | 158 | $ | 1 | ||||||||
|
Federal funds purchased and securities loaned or sold under agreements to repurchase |
2,056 | 1 | — | (1,052 | ) | (28 | ) | 975 | 1 | ||||||||||||||
|
Trading account liabilities |
|||||||||||||||||||||||
|
Securities sold, not yet purchased |
774 | 19 | — | (578 | ) | (29 | ) | 148 | 9 | ||||||||||||||
|
Short-term borrowings |
231 | (10 | ) | — | (118 | ) | 135 | 258 | 31 | ||||||||||||||
|
Long-term debt |
9,654 | 146 | (145 | ) | 482 | 2,701 | 12,836 | 42 | |||||||||||||||
|
Other financial liabilities measured on a recurring basis |
13 | — | (5 | ) | — | (16 | ) | 2 | (2 | ) | |||||||||||||
|
|
|
Net realized/ unrealized
gains (losses) included in |
|
|
|
|
||||||||||||||||||
|---|---|---|---|---|---|---|---|---|---|---|---|---|---|---|---|---|---|---|---|---|---|---|---|---|
|
|
|
Transfers
in and/or out of Level 3 |
Purchases,
issuances and settlements |
|
Unrealized
gains (losses) still held(3) |
|||||||||||||||||||
| In millions of dollars |
December 31,
2008 |
Principal
transactions |
Other(1)(2) |
March 31,
2009 |
||||||||||||||||||||
|
Assets |
||||||||||||||||||||||||
|
Trading securities |
||||||||||||||||||||||||
|
Trading mortgage-backed securities |
||||||||||||||||||||||||
|
U.S. government sponsored |
$ | 1,397 | $ | (28 | ) | $ | — | $ | 10 | $ | 9 | $ | 1,388 | $ | (1 | ) | ||||||||
|
Prime |
850 | (35 | ) | — | 439 | 31 | 1,285 | (19 | ) | |||||||||||||||
|
Alt-A |
735 | (69 | ) | — | (187 | ) | 353 | 832 | (9 | ) | ||||||||||||||
|
Subprime |
14,494 | (2,363 | ) | — | (710 | ) | (385 | ) | 11,036 | (2,049 | ) | |||||||||||||
|
Non-U.S. residential |
714 | (32 | ) | — | (490 | ) | (11 | ) | 181 | (3 | ) | |||||||||||||
|
Commercial |
2,086 | (200 | ) | — | 159 | (25 | ) | 2,020 | (161 | ) | ||||||||||||||
|
Total trading mortgage-backed securities |
$ | 20,276 | $ | (2,727 | ) | $ | — | $ | (779 | ) | $ | (28 | ) | $ | 16,742 | $ | (2,242 | ) | ||||||
|
U.S. Treasury and federal agencies securities |
||||||||||||||||||||||||
|
U.S. Treasury |
$ | — | $ | — | $ | — | $ | — | $ | — | $ | — | $ | — | ||||||||||
|
Agency obligations |
59 | (9 | ) | — | — | 1 | 51 | (9 | ) | |||||||||||||||
|
Total U.S. Treasury and federal agencies securities |
$ | 59 | $ | (9 | ) | $ | — | $ | — | $ | 1 | $ | 51 | $ | (9 | ) | ||||||||
|
State and municipal |
$ | 233 | $ | 1 | — | $ | 56 | $ | (92 | ) | $ | 198 | $ | — | ||||||||||
|
Foreign government |
1,261 | 36 | — | 23 | (309 | ) | 1,011 | 31 | ||||||||||||||||
|
Corporate |
16,027 | (924 | ) | — | (1,041 | ) | (1,680 | ) | 12,382 | (1,045 | ) | |||||||||||||
|
Equity securities |
1,387 | (21 | ) | — | 17 | 357 | 1,740 | 31 | ||||||||||||||||
|
Other debt securities |
11,530 | (327 | ) | — | (1,307 | ) | 850 | 10,746 | (23 | ) | ||||||||||||||
|
Total trading securities |
$ | 50,773 | $ | (3,971 | ) | $ | — | (3,031 | ) | $ | (901 | ) | $ | 42,870 | $ | (3,257 | ) | |||||||
|
Derivatives, net(4) |
$ | 3,586 | $ | 116 | $ | — | $ | (1,081 | ) | $ | 918 | $ | 3,539 | $ | 26 | |||||||||
|
Investments |
||||||||||||||||||||||||
|
Mortgage-backed securities |
||||||||||||||||||||||||
|
Prime |
$ | 1,163 | $ | — | $ | 2 | $ | 204 | $ | (244 | ) | $ | 1,125 | $ | (5 | ) | ||||||||
|
Alt-A |
111 | — | (7 | ) | 8 | 65 | 177 | (10 | ) | |||||||||||||||
|
Subprime |
25 | — | (6 | ) | — | (7 | ) | 12 | (5 | ) | ||||||||||||||
|
Commercial |
964 | — | (19 | ) | (402 | ) | (74 | ) | 469 | (18 | ) | |||||||||||||
151
|
|
|
Net realized/ unrealized
gains (losses) included in |
|
|
|
|
|||||||||||||||||
|---|---|---|---|---|---|---|---|---|---|---|---|---|---|---|---|---|---|---|---|---|---|---|---|
|
|
|
Transfers
in and/or out of Level 3 |
Purchases,
issuances and settlements |
|
Unrealized
gains (losses) still held(3) |
||||||||||||||||||
| In millions of dollars |
December 31,
2008 |
Principal
transactions |
Other(1)(2) |
March 31,
2009 |
|||||||||||||||||||
|
Total investment mortgage-backed debt securities |
$ | 2,263 | $ | — | (30 | ) | (190 | ) | (260 | ) | $ | 1,783 | $ | (38 | ) | ||||||||
|
State and municipal |
$ | 222 | $ | — | $ | — | $ | (15 | ) | $ | — | $ | 207 | $ | — | ||||||||
|
Foreign government |
571 | — | — | 72 | — | 643 | — | ||||||||||||||||
|
Corporate |
1,019 | — | (23 | ) | 753 | 443 | 2,192 | (2 | ) | ||||||||||||||
|
Equity securities |
3,807 | — | (529 | ) | (123 | ) | (306 | ) | 2,849 | (389 | ) | ||||||||||||
|
Other debt securities |
11,324 | — | (1,670 | ) | (562 | ) | (1,550 | ) | 7,542 | (1,741 | ) | ||||||||||||
|
Non-marketable equity securities |
9,067 | — | (727 | ) | (858 | ) | (3 | ) | 7,479 | (530 | ) | ||||||||||||
|
Total investments |
$ | 28,273 | $ | — | $ | (2,979 | ) | $ | (923 | ) | $ | (1,676 | ) | $ | 22,695 | $ | (2,700 | ) | |||||
|
Loans |
$ | 160 | $ | — | $ | (5 | ) | $ | — | $ | 16 | $ | 171 | $ | (5 | ) | |||||||
|
Mortgage servicing rights |
5,657 | — | (130 | ) | — | (46 | ) | 5,481 | (130 | ) | |||||||||||||
|
Other financial assets measured on a recurring basis |
359 | — | 1,919 | 427 | (190 | ) | 2,515 | 1,640 | |||||||||||||||
|
Liabilities |
|||||||||||||||||||||||
|
Interest-bearing deposits |
$ | 54 | $ | — | $ | 4 | $ | — | $ | (9 | ) | $ | 41 | $ | 3 | ||||||||
|
Federal funds purchased and securities loaned or sold under agreements to repurchase |
11,167 | 32 | — | (329 | ) | (74 | ) | 10,732 | 32 | ||||||||||||||
|
Trading account liabilities |
|||||||||||||||||||||||
|
Securities sold, not yet purchased |
653 | 36 | — | 419 | 275 | 1,311 | (8 | ) | |||||||||||||||
|
Short-term borrowings |
1,329 | — | (108 | ) | (697 | ) | 290 | 1,030 | (86 | ) | |||||||||||||
|
Long-term debt |
11,198 | — | 448 | (377 | ) | 65 | 10,438 | 309 | |||||||||||||||
|
Other financial liabilities measured on a recurring basis |
1 | — | (1 | ) | — | (1 | ) | 1 | (1 | ) | |||||||||||||
- (1)
-
Changes
in fair value for available-for-sale investments (debt securities) are recorded in
Accumulated other
comprehensive income
, while gains and losses from sales are recorded in
Realized gains (losses) from sales of investments
on the
Consolidated Statement of Income.
- (2)
-
Unrealized
gains (losses) on MSRs are recorded in
Commissions and fees
on the Consolidated Statement of
Income.
- (3)
-
Represents
the amount of total gains or losses for the period, included in earnings (and
Accumulated other comprehensive
income
for changes in fair value for available-for-sale investments), attributable to the change in fair value relating to assets and liabilities
classified as Level 3 that are still held at March 31, 2010 and 2009.
- (4)
- Total Level 3 derivative assets and liabilities have been netted in these tables for presentation purposes only.
152
The following is a discussion of the changes to the Level 3 balances for each of the roll-forward tables presented above.
The significant changes from December 31, 2009 to March 31, 2010 in Level 3 assets and liabilities are due to:
- •
-
A net increase in Federal funds sold and securities borrowed or purchased under agreements to resell of
$1.9 billion, which included transfers from Level 2 to Level 3 of $1.1 billion.
- •
-
A net decrease in trading securities of $14 billion that was mainly driven by:
- •
-
A decrease of $12 billion in Other debt trading securities, due primarily to the impact of the consolidation of the
credit card securitization trusts by the Company upon the adoption of SFAS 166/167 on January 1, 2010. Upon consolidation of the trusts, the Company's investments in the trusts and other
inter-company balances are eliminated. At January 1, 2010, the Company's investment in these newly consolidated VIEs included certificates issued by these trusts of $11.1 billion that
were classified as Level 3. The impact of the elimination of these certificates has been reflected as net settlements in the Level 3 roll-forward table above.
- •
-
A decrease of $2.5 billion in subprime trading mortgage-backed securities, primarily due to liquidations and
paydowns of $2.5 billion during the first quarter.
- •
-
The increase in Investments of $1.1 billion included transfers to Level 3 of non-marketable
equity securities of $2 billion, which related to preferred shares held by the Company in the MSSB joint venture.
- •
-
The increase in Loans of $4.2 billion is due primarily to the Company's consolidation of certain VIEs upon the
adoption of SFAS 166/167 on January 1, 2010, for which the fair value option was elected. These include private label mortgage securitization trust VIEs ($3.2 billion) and mutual
fund deferred sales commission VIEs ($0.5 billion). The impact from the consolidation of these VIEs on Level 3 loans has been reflected as purchases in the roll-forward table
above.
- •
-
The decrease in Federal funds purchased and securities loaned or sold under agreements to repurchase of
$1.1 billion is due to transfers to Level 2.
- •
- The increase in long-term debt of $3.2 billion is due primarily to the Company's consolidation of certain VIEs upon the adoption of SFAS 166/167 on January 1, 2010, for which the fair value option was elected. These include private label mortgage securitization trust VIEs ($3.1 billion), mutual fund deferred sales commission VIEs ($0.4 billion) and collateralized loan obligations ($0.5 billion). The impact of these newly consolidated VIEs on long-term debt classified as Level 3 is reflected as net issuances in the roll-forward table above. These increases were partially offset by paydowns/liquidations of long-term debt during the quarter, including credit-linked notes.
The significant changes from December 31, 2008 to March 31, 2009 in Level 3 assets and liabilities are due to:
- •
-
A net decrease in Trading securities and loans of $7.9 billion that was driven by:
- •
-
Net realized and unrealized losses of $4.0 billion recorded in principal transactions, mainly comprised of
write-downs on ABCP securities, and commercial and residential loans.
- •
-
Net transfers of $3.0 billion to Level 2 inventory as a result of better vendor pricing coverage for
corporate debt.
- •
-
A decrease in Level 3 investments of $5.6 billion that primarily resulted from:
- •
-
Net realized/unrealized losses recorded in other income of $3.0 billion mainly driven by $1.6 billion in
losses on hedged senior debt securities retained from the sale of a portfolio of highly leveraged loans; as well as losses on private equity investments and real estate fund investments. Offsetting
this loss on the retained highly-leveraged debt securities is a gain on the corresponding cash flow hedge that is reflected in AOCI and on the line Other Financial Assets measured on a Recurring basis
within the fair value hierarchy table presented above as a Level 3 asset.
- •
-
Net settlements of investment securities of $1.7 billion mainly due to pay-downs during the quarter.
- •
- The decrease in Level 3 derivatives is related to greater availability of consensus data for investment grade CDX indices and improved price verification methodologies.
Transfers between Level 1 and Level 2 of the Fair Value Hierarchy
The Company did not have any significant transfers of assets or liabilities between Levels 1 and 2 of the fair value hierarchy during the first quarter of 2010.
153
Items Measured at Fair Value on a Nonrecurring Basis
Certain assets and liabilities are measured at fair value on a nonrecurring basis and therefore are not included in the tables above.
These include assets measured at cost that have been written down to fair value during the periods as a result of an impairment. In addition, these assets include loans held-for-sale that are measured at LOCOM that were recognized at fair value below cost at the end of the period.
The fair value of loans measured on a LOCOM basis is determined where possible using quoted secondary-market prices. Such loans are generally classified as Level 2 of the fair-value hierarchy given the level of activity in the market and the frequency of available quotes. If no such quoted price exists, the fair value of a loan is determined using quoted prices for a similar asset or assets, adjusted for the specific attributes of that loan.
The following table presents all loans held-for-sale that are carried at LOCOM as of March 31, 2010 and December 31, 2009 (in billions):
|
|
Aggregate
cost |
Fair value | Level 2 | Level 3 | |||||||||
|---|---|---|---|---|---|---|---|---|---|---|---|---|---|
|
March 31, 2010 |
$ | 1.8 | $ | 1.5 | $ | 1.2 | $ | 0.3 | |||||
|
December 31, 2009 |
2.5 | 1.6 | 0.3 | 1.3 | |||||||||
154
The Company may elect to report most financial instruments and certain other items at fair value on an instrument-by-instrument basis with changes in fair value reported in earnings. After the initial adoption, the election is made upon the acquisition of an eligible financial asset, financial liability or firm commitment or when certain specified reconsideration events occur. The fair-value election may not be revoked once an election is made.
The Company also has elected to adopt the fair value accounting provisions for certain assets and liabilities prospectively. Hybrid financial instruments, such as structured notes containing embedded derivatives that otherwise would require bifurcation, as well as certain interest-only instruments, may be accounted for at fair value if the Company makes an irrevocable election to do so on an instrument-by-instrument basis. The changes in fair value are recorded in current earnings. Additional discussion regarding the applicable areas in which fair value elections were made is presented in Note 16 to the Consolidated Financial Statements.
All servicing rights must now be recognized initially at fair value. The Company has elected fair-value accounting for its mortgage and student loan classes of servicing rights. The impact of adopting this standard was not material. See Note 14 to the Consolidated Financial Statements for further discussions regarding the accounting and reporting of mortgage servicing rights.
155
The following table presents, as of March 31, 2010 and December 31, 2009, the fair value of those positions selected for fair-value accounting, as well as the changes in fair value for the three months ended March 31, 2010 and 2009:
|
|
Fair value at |
Changes in fair value gains
(losses) for three months ended March 31, |
||||||||||||
|---|---|---|---|---|---|---|---|---|---|---|---|---|---|---|
| In millions of dollars |
March 31,
2010 |
December 31,
2009 |
2010 | 2009(1) | ||||||||||
|
Assets |
||||||||||||||
|
Federal funds sold and securities borrowed or purchased under agreements to resell |
||||||||||||||
|
Selected portfolios of securities purchased under agreements to resell, securities borrowed(2) |
$ | 96,596 | $ | 87,837 | $ | (13 | ) | $ | (289 | ) | ||||
|
Trading account assets |
||||||||||||||
|
Selected letters of credit hedged by credit default swaps or participation notes |
$ | 22 | $ | 30 | $ | (8 | ) | $ | 2 | |||||
|
Certain credit products |
13,994 | 14,338 | 388 | 1,139 | ||||||||||
|
Certain hybrid financial instruments |
— | — | — | — | ||||||||||
|
Retained interests from asset securitizations |
769 | 2,357 | (29 | ) | 507 | |||||||||
|
Total trading account assets |
$ | 14,785 | $ | 16,725 | $ | 351 | $ | 1,648 | ||||||
|
Investments |
||||||||||||||
|
Certain investments in private equity and real estate ventures |
$ | 237 | $ | 321 | $ | 1 | $ | (28 | ) | |||||
|
Other |
273 | 253 | 25 | (72 | ) | |||||||||
|
Total investments |
$ | 510 | $ | 574 | $ | 26 | $ | (100 | ) | |||||
|
Loans |
||||||||||||||
|
Certain credit products |
$ | 740 | $ | 945 | $ | 9 | $ | (21 | ) | |||||
|
Certain corporate loans(3) |
1,266 | — | (8 | ) | — | |||||||||
|
Certain consumer loans(3) |
2,911 | 34 | 249 | (1 | ) | |||||||||
|
Certain hybrid financial instruments |
451 | 460 | (15 | ) | 18 | |||||||||
|
Total loans |
$ | 5,368 | $ | 1,439 | $ | 235 | $ | (4 | ) | |||||
|
Other assets |
||||||||||||||
|
Mortgage servicing rights |
$ | 6,439 | $ | 6,530 | $ | 144 | $ | 130 | ||||||
|
Certain mortgage loans (HFS) |
3,051 | 3,338 | 52 | 116 | ||||||||||
|
Certain equity method investments |
562 | 598 | 13 | (22 | ) | |||||||||
|
Total other assets |
$ | 10,052 | $ | 10,466 | $ | 209 | $ | 224 | ||||||
|
Total |
$ | 127,311 | $ | 117,041 | $ | 808 | $ | 1,479 | ||||||
|
Liabilities |
||||||||||||||
|
Interest-bearing deposits |
||||||||||||||
|
Certain structured liabilities |
$ | 264 | $ | 167 | $ | 4 | $ | — | ||||||
|
Certain hybrid financial instruments |
1,276 | 1,378 | (22 | ) | 35 | |||||||||
|
Total interest-bearing deposits |
$ | 1,540 | $ | 1,545 | $ | (18 | ) | $ | 35 | |||||
|
Federal funds purchased and securities loaned or sold under agreements to repurchase |
||||||||||||||
|
Selected portfolios of securities sold under agreements to repurchase, securities loaned(2) |
$ | 136,526 | $ | 104,030 | $ | 9 | $ | 27 | ||||||
|
Trading account liabilities |
||||||||||||||
|
Selected letters of credit hedged by credit default swaps or participation notes |
$ | — | $ | — | $ | — | $ | 37 | ||||||
|
Certain hybrid financial instruments |
5,191 | 5,325 | (155 | ) | 528 | |||||||||
|
Total trading account liabilities |
$ | 5,191 | $ | 5,325 | $ | (155 | ) | $ | 565 | |||||
|
Short-term borrowings |
||||||||||||||
|
Certain non-collateralized short-term borrowings |
$ | 131 | $ | 140 | $ | 2 | $ | 34 | ||||||
|
Certain hybrid financial instruments |
1,094 | 499 | 10 | 30 | ||||||||||
|
Certain structured liabilities |
— | — | — | — | ||||||||||
|
Certain non-structured liabilities |
— | — | — | 8 | ||||||||||
|
Total short-term borrowings |
$ | 1,225 | $ | 639 | $ | 12 | $ | 72 | ||||||
|
Long-term debt |
||||||||||||||
|
Certain structured liabilities |
$ | 3,787 | $ | 3,666 | $ | 11 | $ | 229 | ||||||
|
Certain non-structured liabilities |
11,610 | 8,008 | (308 | ) | 44 | |||||||||
|
Certain hybrid financial instruments |
12,715 | 14,268 | 62 | 512 | ||||||||||
|
Total long-term debt |
$ | 28,112 | $ | 25,942 | $ | (235 | ) | $ | 785 | |||||
|
Total |
$ | 172,594 | $ | 137,481 | $ | (387 | ) | $ | 1,484 | |||||
- (1)
-
Reclassified
to conform to current period's presentation.
- (2)
-
Reflects
netting of the amounts due from securities purchased under agreements to resell and the amounts owed under securities sold under agreements to
repurchase.
- (3)
- Substantially all relates to mortgage loans held by mortgage loan securitization VIEs consolidated upon the adoption of SFAS 166/167 on January 1, 2010.
156
Own Credit Valuation Adjustment
The fair value of debt liabilities for which the fair value option is elected (other than non-recourse and similar liabilities) is impacted by the narrowing or widening of the Company's credit spreads. The estimated change in the fair value of these debt liabilities due to such changes in the Company's own credit risk (or instrument-specific credit risk) was a $6 million loss and a gain of $180 million for the three months ended March 31, 2010 and 2009, respectively. Changes in fair value resulting from changes in instrument-specific credit risk were estimated by incorporating the Company's current observable credit spreads into the relevant valuation technique used to value each liability as described above.
The Fair Value Option for Financial Assets and Financial Liabilities
Selected portfolios of securities purchased under agreements to resell, securities borrowed, securities sold under agreements to repurchase, securities loaned and certain non-collateralized short-term borrowings
The Company elected the fair value option retrospectively for our United States and United Kingdom portfolios of fixed-income securities purchased under agreements to resell and fixed-income securities sold under agreements to repurchase (and certain non-collateralized short-term borrowings). In addition, the fair value option has been selected for certain portfolios of fixed-income securities lending and borrowing transactions based in Japan. In each case, the election was made because the related interest-rate risk is managed on a portfolio basis, primarily with derivative instruments that are accounted for at fair value through earnings.
Changes in fair value for transactions in these portfolios are recorded in Principal transactions . The related interest revenue and interest expense are measured based on the contractual rates specified in the transactions and are reported as interest revenue and expense in the Consolidated Statement of Income.
Selected letters of credit and revolving loans hedged by credit default swaps or participation notes
The Company has elected the fair value option for certain letters of credit that are hedged with derivative instruments or participation notes. Upon electing the fair value option, the related portions of the allowance for loan losses and the allowance for unfunded lending commitments were reversed. Citigroup elected the fair value option for these transactions because the risk is managed on a fair value basis and mitigates accounting mismatches.
The notional amount of these unfunded letters of credit was $1.8 billion as of March 31, 2010 and December 31, 2009. The amount funded was insignificant with no amounts 90 days or more past due or on a non-accrual status at March 31, 2010 and December 31, 2009.
These items have been classified in Trading account assets or Trading account liabilities on the Consolidated Balance Sheet. Changes in fair value of these items are classified in Principal transactions in the Company's Consolidated Statement of Income.
Certain credit products
Citigroup has elected the fair value option for certain originated and purchased loans, including certain unfunded loan products, such as guarantees and letters of credit, executed by Citigroup's trading businesses. None of these credit products is a highly leveraged financing commitment. Significant groups of transactions include loans and unfunded loan products that are expected to be either sold or securitized in the near term, or transactions where the economic risks are hedged with derivative instruments such as purchased credit default swaps or total return swaps where the Company pays the total return on the underlying loans to a third party. Citigroup has elected the fair value option to mitigate accounting mismatches in cases where hedge accounting is complex and to achieve operational simplifications. Fair value was not elected for most lending transactions across the Company, including where management objectives would not be met.
157
The following table provides information about certain credit products carried at fair value:
|
|
March 31, 2010 | December 31, 2009 | |||||||||||
|---|---|---|---|---|---|---|---|---|---|---|---|---|---|
| In millions of dollars |
Trading
assets |
Loans |
Trading
assets |
Loans | |||||||||
|
Carrying amount reported on the Consolidated Balance Sheet |
$ | 13,994 | $ | 740 | $ | 14,338 | $ | 945 | |||||
|
Aggregate unpaid principal balance in excess of fair value |
384 | (72 | ) | 390 | (44 | ) | |||||||
|
Balance of non-accrual loans or loans more than 90 days past due |
284 | — | 312 | — | |||||||||
|
Aggregate unpaid principal balance in excess of fair value for non-accrual loans or loans more than 90 days past due |
293 | — | 267 | — | |||||||||
In addition to the amounts reported above, $200 million of unfunded loan commitments related to certain credit products selected for fair value accounting was outstanding as of March 31, 2010 and December 31, 2009.
Changes in fair value of funded and unfunded credit products are classified in Principal transactions in the Company's Consolidated Statement of Income. Related interest revenue is measured based on the contractual interest rates and reported as Interest revenue on trading account assets or loan interest depending on the balance sheet classifications of the credit products. The changes in fair value for the three months ended March 31, 2010 and 2009 due to instrument-specific credit risk totaled to a gain of $26 million and a loss of $9 million, respectively.
Certain hybrid financial instruments
The Company has elected to apply fair value accounting for certain hybrid financial assets and liabilities whose performance is linked to risks other than interest rate, foreign exchange or inflation (e.g., equity, credit or commodity risks). In addition, the Company has elected fair value accounting for residual interests retained from securitizing certain financial assets.
The Company has elected fair value accounting for these instruments because these exposures are considered to be trading-related positions and, therefore, are managed on a fair value basis. In addition, the accounting for these instruments is simplified under a fair value approach as it eliminates the complicated operational requirements of bifurcating the embedded derivatives from the host contracts and accounting for each separately. The hybrid financial instruments are classified as Trading account assets, Loans , Deposits , Trading account liabilitie s (for prepaid derivatives), Short-term borrowings or Long-term debt on the Company's Consolidated Balance Sheet according to their legal form, while residual interests in certain securitizations are classified as Trading account assets .
For hybrid financial instruments for which fair value accounting has been elected and that are classified as Long-term debt , the aggregate unpaid principal exceeded the aggregate fair value by $2.4 billion and $3.4 billion as of March 31, 2010 and December 31, 2009, respectively. The difference for those instruments classified as Loans is immaterial.
Changes in fair value for hybrid financial instruments, which in most cases includes a component for accrued interest, are recorded in Principal transactions in the Company's Consolidated Statement of Income. Interest accruals for certain hybrid instruments classified as trading assets are recorded separately from the change in fair value as Interest revenue in the Company's Consolidated Statement of Income.
Certain investments in private equity and real estate ventures and certain equity method investments
Citigroup invests in private equity and real estate ventures for the purpose of earning investment returns and for capital appreciation. The Company has elected the fair value option for certain of these ventures, because such investments are considered similar to many private equity or hedge fund activities in Citi's investment companies, which are reported at fair value. The fair value option brings consistency in the accounting and evaluation of certain of these investments. All investments (debt and equity) in such private equity and real estate entities are accounted for at fair value. These investments are classified as Investments on Citigroup's Consolidated Balance Sheet.
Citigroup also holds various non-strategic investments in leveraged buyout funds and other hedge funds for which the Company elected fair value accounting to reduce operational and accounting complexity. Since the funds account for all of their underlying assets at fair value, the impact of applying the equity method to Citigroup's investment in these funds was equivalent to fair value accounting. Thus, this fair value election had no impact on opening Retained earnings . These investments are classified as Other assets on Citigroup's Consolidated Balance Sheet.
Changes in the fair values of these investments are classified in Other revenue in the Company's Consolidated Statement of Income.
Certain mortgage loans (HFS)
Citigroup has elected the fair value option for certain purchased and originated prime fixed-rate and conforming adjustable-rate first mortgage loans held-for-sale. These loans are intended for sale or securitization and are hedged with derivative instruments. The Company has elected the fair value option to mitigate accounting mismatches in cases where hedge accounting is complex and to achieve operational simplifications.
158
The following table provides information about certain mortgage loans held for sale carried at fair value:
| In millions of dollars | March 31, 2010 | December 31, 2009 | |||||
|---|---|---|---|---|---|---|---|
|
Carrying amount reported on the Consolidated Balance Sheet |
$ | 3,051 | $ | 3,338 | |||
|
Aggregate fair value in excess of unpaid principal balance |
71 | 55 | |||||
|
Balance of non-accrual loans or loans more than 90 days past due |
4 | 4 | |||||
|
Aggregate unpaid principal balance in excess of fair value for non-accrual loans or loans more than 90 days past due |
2 | 3 | |||||
The changes in fair values of these mortgage loans are reported in Other revenue in the Company's Consolidated Statement of Income. The changes in fair value during the three months ended March 31, 2010 and 2009 due to instrument-specific credit risk resulted in a $2 million loss and $5 million loss, respectively. Related interest income continues to be measured based on the contractual interest rates and reported as such in the Consolidated Statement of Income.
Certain Consolidated VIEs
The Company has elected the fair value option for all qualified assets and liabilities of certain VIEs that were consolidated upon the adoption of SFAS 166/167 on January 1, 2010, including certain private label mortgage securitizations, mutual fund deferred sales commissions and collateralized loan obligation VIEs. The Company elected the fair value option for these VIEs as the Company believes this method better reflects the economic risks, since substantially all of the Company's retained interests in these entities are carried at fair value.
With respect to the consolidated mortgage VIEs, the Company determined the fair value for the mortgage loans and long-term debt utilizing internal valuation techniques. The fair value of the long-term debt measured using internal valuation techniques is verified, where possible, to prices obtained from independent vendors. Vendors compile prices from various sources and may apply matrix pricing for similar securities when no price is observable. Security pricing associated with long-term debt that is verified is classified as Level 2 and non-verified debt is classified as Level 3. The fair value of mortgage loans of each VIE is derived from the security pricing. When substantially all of the long-term debt of a VIE is valued using Level 2 inputs, the corresponding mortgage loans are classified as Level 2. Otherwise, the mortgage loans of a VIE are classified as Level 3.
With respect to the consolidated mortgage VIEs for which the fair value option was elected, the mortgage loans are classified as Loans on Citigroup's Consolidated Balance Sheet. The changes in fair value of the loans are reported as Other revenue in the Company's Consolidated Statement of Income. Related interest revenue is measured based on the contractual interest rates and reported as interest revenue in the Company's Consolidated Statement of Income. Information about these mortgage loans is included in the table below. The changes in fair value of these loans due to instrument-specific credit risk was a gain of $244 million for the three months ended March 31, 2010.
The debt issued by these consolidated VIEs is classified as long-term debt on Citigroup's Consolidated Balance Sheet. The changes in fair value for the majority of these liabilities are reported in Other revenue in the Company's Consolidated Statement of Income. Related interest expense is measured based on the contractual interest rates and reported as such in the Consolidated Statement of Income. The aggregate unpaid principal balance of long-term debt of these consolidated VIEs exceeded the aggregate fair value by $2.0 billion as of March 31, 2010.
The following table provides information about corporate and consumer loans of consolidated VIEs carried at fair value:
|
|
March 31, 2010 | ||||||
|---|---|---|---|---|---|---|---|
| In millions of dollars |
Corporate
Loans |
Consumer
Loans |
|||||
|
Carrying amount reported on the Consolidated Balance Sheet |
$ | 1,266 | $ | 2,880 | |||
|
Aggregate unpaid principal balance in excess of fair value |
1,040 | 827 | |||||
|
Balance of non-accrual loans or loans more than 90 days past due |
321 | 320 | |||||
|
Aggregate unpaid principal balance in excess of fair value for non-accrual loans or loans more than 90 days past due |
419 | 260 | |||||
Mortgage servicing rights
The Company accounts for mortgage servicing rights (MSRs) at fair value. Fair value for MSRs is determined using an option-adjusted spread valuation approach. This approach consists of projecting servicing cash flows under multiple interest-rate scenarios and discounting these cash flows using risk-adjusted rates. The model assumptions used in the valuation of MSRs include mortgage prepayment speeds and discount rates. The fair value of MSRs is primarily affected by changes in prepayments that result from shifts in mortgage interest rates. In managing this risk, the Company hedges a significant portion of the values of its MSRs through the use of interest-rate derivative contracts, forward-purchase commitments of mortgage-backed securities, and purchased securities classified as trading. See Note14 to the Consolidated Financial Statements for further discussions regarding the accounting and reporting of MSRs.
These MSRs, which totaled $6.4 billion and $6.5 billion as of March 31, 2010 and December 31, 2009, respectively, are classified as Mortgage servicing rights on Citigroup's Consolidated Balance Sheet. Changes in fair value of MSRs are recorded in Commissions and fees in the Company's Consolidated Statement of Income.
Certain structured liabilities
The Company has elected the fair value option for certain structured liabilities whose performance is linked to structured interest rates, inflation or currency risks ("structured liabilities"). The Company elected the fair value option, because these exposures are considered to be trading-
159
related positions and, therefore, are managed on a fair value basis. These positions will continue to be classified as debt, deposits or derivatives ( Trading account liabilities ) on the Company's Consolidated Balance Sheet according to their legal form.
For those structured liabilities classified as Long-term debt for which the fair value option has been elected, the aggregate unpaid principal balance exceeded the aggregate fair value by $48 million and $125 million as of March 31, 2010 and December 31, 2009, respectively.
The change in fair value for these structured liabilities is reported in Principal transactions in the Company's Consolidated Statement of Income.
Related interest expense is measured based on the contractual interest rates and reported as such in the Consolidated Statement of Income.
Certain non-structured liabilities
The Company has elected the fair value option for certain non-structured liabilities with fixed and floating interest rates ("non-structured liabilities"). The Company has elected the fair value option where the interest-rate risk of such liabilities is economically hedged with derivative contracts or the proceeds are used to purchase financial assets that will also be accounted for at fair value through earnings. The election has been made to mitigate accounting mismatches and to achieve operational simplifications. These positions are reported in Short-term borrowings and Long-term debt on the Company's Consolidated Balance Sheet.
For non-structured liabilities excluding the debt issued by the consolidated VIEs, classified as Long-term debt for which the fair value option has been elected, the aggregate unpaid principal balance exceeded the aggregate fair value by $141 million as of March 31, 2010 and the aggregate fair value exceeded the unpaid principal by $93 million as of December 31, 2009, respectively. The change in fair value for these non-structured liabilities is reported in Principal transactions in the Company's Consolidated Statement of Income.
Related interest expense continues to be measured based on the contractual interest rates and reported as such in the Consolidated Statement of Income.
160
18. FAIR VALUE OF FINANCIAL INSTRUMENTS
Estimated Fair Value of Financial Instruments
The table below presents the carrying value and fair value of Citigroup's financial instruments. The disclosure excludes leases, affiliate investments, pension and benefit obligations and insurance policy claim reserves. In addition, contract-holder fund amounts exclude certain insurance contracts. Also as required, the disclosure excludes the effect of taxes, any premium or discount that could result from offering for sale at one time the entire holdings of a particular instrument, excess fair value associated with deposits with no fixed maturity and other expenses that would be incurred in a market transaction. In addition, the table excludes the values of non-financial assets and liabilities, as well as a wide range of franchise, relationship and intangible values (but includes mortgage servicing rights), which are integral to a full assessment of Citigroup's financial position and the value of its net assets.
The fair value represents management's best estimates based on a range of methodologies and assumptions. The carrying value of short-term financial instruments not accounted for at fair value, as well as receivables and payables arising in the ordinary course of business, approximates fair value because of the relatively short period of time between their origination and expected realization. Quoted market prices are used when available for investments and for both trading and end-user derivatives, as well as for liabilities, such as long-term debt, with quoted prices. For performing loans not accounted for at fair value, contractual cash flows are discounted at quoted secondary market rates or estimated market rates if available. Otherwise, sales of comparable loan portfolios or current market origination rates for loans with similar terms and risk characteristics are used. For loans with doubt as to collectability, expected cash flows are discounted using an appropriate rate considering the time of collection and the premium for the uncertainty of the cash flows. The value of collateral is also considered. For liabilities such as long-term debt not accounted for at fair value and without quoted market prices, market borrowing rates of interest are used to discount contractual cash flows.
|
|
March 31, 2010 | December 31, 2009 | |||||||||||
|---|---|---|---|---|---|---|---|---|---|---|---|---|---|
| In billions of dollars |
Carrying
value |
Estimated
fair value |
Carrying
value |
Estimated
fair value |
|||||||||
|
Assets |
|||||||||||||
|
Investments |
$ | 316.7 | $ | 318.0 | $ | 306.1 | $ | 307.6 | |||||
|
Federal funds sold and securities borrowed or purchased under agreements to resell |
234.3 | 234.3 | 222.0 | 222.0 | |||||||||
|
Trading account assets |
345.8 | 345.8 | 342.8 | 342.8 | |||||||||
|
Loans(1) |
670.4 | 658.3 | 552.5 | 542.8 | |||||||||
|
Other financial assets(2) |
284.8 | 284.8 | 290.9 | 290.9 | |||||||||
|
|
March 31, 2010 | December 31, 2009 | |||||||||||
|---|---|---|---|---|---|---|---|---|---|---|---|---|---|
| In billions of dollars |
Carrying
value |
Estimated
fair value |
Carrying
value |
Estimated
fair value |
|||||||||
|
Liabilities |
|||||||||||||
|
Deposits |
$ | 827.9 | $ | 826.8 | $ | 835.9 | $ | 834.5 | |||||
|
Federal funds purchased and securities loaned or sold under agreements to repurchase |
207.9 | 207.9 | 154.3 | 154.3 | |||||||||
|
Trading account liabilities |
142.7 | 142.7 | 137.5 | 137.5 | |||||||||
|
Long-term debt |
439.3 | 438.5 | 364.0 | 354.8 | |||||||||
|
Other financial liabilities(3) |
196.1 | 196.1 | 175.8 | 175.8 | |||||||||
- (1)
-
The
carrying value of loans is net of the
Allowance for loan losses
of $48.7 billion and
$36.0 billion for March 31, 2010 and December 31, 2009, respectively. In addition, the carrying values exclude $2.7 billion and $2.9 billion of lease finance
receivables at March 31, 2010 and December 31, 2009, respectively.
- (2)
-
Includes
cash and due from banks, deposits with banks, brokerage receivables, reinsurance recoverable, mortgage servicing rights, separate and variable
accounts and other financial instruments included in
Other assets
on the Consolidated Balance Sheet, for all of which the carrying value is a reasonable
estimate of fair value.
- (3)
- Includes brokerage payables, separate and variable accounts, short-term borrowings and other financial instruments included in Other liabilities on the Consolidated Balance Sheet, for all of which the carrying value is a reasonable estimate of fair value.
Fair values vary from period to period based on changes in a wide range of factors, including interest rates, credit quality, and market perceptions of value and as existing assets and liabilities run off and new transactions are entered into.
The estimated fair values of loans reflect changes in credit status since the loans were made, changes in interest rates in the case of fixed-rate loans, and premium values at origination of certain loans. The carrying values (reduced by the Allowance for loan losses ) exceeded the estimated fair values of Citigroup's loans, in aggregate, by $12.1 billion and $9.7 billion and March 31, 2010 and December 31, 2009, respectively. At March 31, 2010, the carrying values, net of allowances, exceeded the estimated values by $10.1 billion and $2.0 billion for consumer loans and corporate loans, respectively.
The estimated fair values of the Company's corporate unfunded lending commitments at March 31, 2010 and December 31, 2009 were liabilities of $6.6 billion and $5.0 billion, respectively. The Company does not estimate the fair values of consumer unfunded lending commitments, which are generally cancellable by providing notice to the borrower.
161
The Company provides a variety of guarantees and indemnifications to Citigroup customers to enhance their credit standing and enable them to complete a wide variety of business transactions. For certain contracts meeting the definition of a guarantee, the guarantor must recognize, at inception, a liability for the fair value of the obligation undertaken in issuing the guarantee.
In addition, the guarantor must disclose the maximum potential amount of future payments the guarantor could be required to make under the guarantee, if there were a total default by the guaranteed parties. The determination of the maximum potential future payments is based on the notional amount of the guarantees without consideration of possible recoveries under recourse provisions or from collateral held or pledged. Such amounts bear no relationship to the anticipated losses, if any, on these guarantees.
The following tables present information about the Company's guarantees at March 31, 2010 and December 31, 2009:
|
|
Maximum potential amount of future payments | ||||||||||||
|---|---|---|---|---|---|---|---|---|---|---|---|---|---|
|
In billions of dollars at March 31,
except carrying value in millions |
Expire within
1 year |
Expire after
1 year |
Total amount
outstanding |
Carrying value
(in millions) |
|||||||||
|
2010 |
|||||||||||||
|
Financial standby letters of credit |
$ | 37.3 | $ | 47.9 | $ | 85.2 | $ | 411.7 | |||||
|
Performance guarantees |
8.7 | 4.9 | 13.6 | 28.9 | |||||||||
|
Derivative instruments considered to be guarantees |
3.8 | 3.9 | 7.7 | 813.7 | |||||||||
|
Loans sold with recourse |
— | 0.3 | 0.3 | 76.0 | |||||||||
|
Securities lending indemnifications(1) |
70.6 | — | 70.6 | — | |||||||||
|
Credit card merchant processing(1) |
54.9 | — | 54.9 | — | |||||||||
|
Custody indemnifications and other |
— | 34.5 | 34.5 | 275.7 | |||||||||
|
Total |
$ | 175.3 | $ | 91.5 | $ | 266.8 | $ | 1,606.0 | |||||
- (1)
- The carrying values of guarantees of collections of contractual cash flows, securities lending indemnifications and credit card merchant processing are not material, as the Company has determined that the amount and probability of potential liabilities arising from these guarantees are not significant.
|
|
Maximum potential amount of future payments | ||||||||||||
|---|---|---|---|---|---|---|---|---|---|---|---|---|---|
|
In billions of dollars at December 31,
except carrying value in millions |
Expire within
1 year |
Expire after
1 year |
Total amount
outstanding |
Carrying value
(in millions) |
|||||||||
|
2009 |
|||||||||||||
|
Financial standby letters of credit |
$ | 41.4 | $ | 48.0 | $ | 89.4 | $ | 438.8 | |||||
|
Performance guarantees |
9.4 | 4.5 | 13.9 | 32.4 | |||||||||
|
Derivative instruments considered to be guarantees |
4.1 | 3.6 | 7.7 | 569.2 | |||||||||
|
Loans sold with recourse |
— | 0.3 | 0.3 | 76.6 | |||||||||
|
Securities lending indemnifications(1) |
64.5 | — | 64.5 | — | |||||||||
|
Credit card merchant processing(1) |
59.7 | — | 59.7 | — | |||||||||
|
Custody indemnifications and other |
— | 33.5 | 33.5 | 121.4 | |||||||||
|
Total |
$ | 179.1 | $ | 89.9 | $ | 269.0 | $ | 1,238.4 | |||||
- (1)
- The carrying values of guarantees of collections of contractual cash flows, securities lending indemnifications and credit card merchant processing are not material, as the Company has determined that the amount and probability of potential liabilities arising from these guarantees are not significant.
162
Financial standby letters of credit
Citigroup issues standby letters of credit which substitute its own credit for that of the borrower. If a letter of credit is drawn down, the borrower is obligated to repay Citigroup. Standby letters of credit protect a third party from defaults on contractual obligations. Financial standby letters of credit include guarantees of payment of insurance premiums and reinsurance risks that support industrial revenue bond underwriting and settlement of payment obligations to clearing houses, and also support options and purchases of securities or are in lieu of escrow deposit accounts. Financial standbys also backstop loans, credit facilities, promissory notes and trade acceptances.
Performance guarantees
Performance guarantees and letters of credit are issued to guarantee a customer's tender bid on a construction or systems-installation project or to guarantee completion of such projects in accordance with contract terms. They are also issued to support a customer's obligation to supply specified products, commodities, or maintenance or warranty services to a third party.
Derivative instruments considered to be guarantees
Derivatives are financial instruments whose cash flows are based on a notional amount or an underlying instrument, where there is little or no initial investment, and whose terms require or permit net settlement. Derivatives may be used for a variety of reasons, including risk management, or to enhance returns. Financial institutions often act as intermediaries for their clients, helping clients reduce their risks. However, derivatives may also be used to take a risk position.
The derivative instruments considered to be guarantees, which are presented in the tables above, include only those instruments that require Citi to make payments to the counterparty based on changes in an underlying that is related to an asset, a liability, or an equity security held by the guaranteed party. More specifically, derivative instruments considered to be guarantees include certain over-the-counter written put options where the counterparty is not a bank, hedge fund or broker-dealer (such counterparties are considered to be dealers in these markets, and may therefore not hold the underlying instruments). However, credit derivatives sold by the Company are excluded from this presentation, as they are disclosed separately within this note below. In addition, non-credit derivative contracts that are cash settled and for which the Company is unable to assert that it is probable the counterparty held the underlying instrument at the inception of the contract also are excluded from the disclosure above.
In instances where the Company's maximum potential future payment is unlimited, the notional amount of the contract is disclosed.
Loans sold with recourse
Loans sold with recourse represent the Company's obligations to reimburse the buyers for loan losses under certain circumstances. Recourse refers to the clause in a sales agreement under which a lender will fully reimburse the buyer/investor for any losses resulting from the purchased loans. This may be accomplished by the seller's taking back any loans that become delinquent.
Securities lending indemnifications
Owners of securities frequently lend those securities for a fee to other parties who may sell them short or deliver them to another party to satisfy some other obligation. Banks may administer such securities lending programs for their clients. Securities lending indemnifications are issued by the bank to guarantee that a securities lending customer will be made whole in the event that the security borrower does not return the security subject to the lending agreement and collateral held is insufficient to cover the market value of the security.
Credit card merchant processing
Credit card merchant processing guarantees represent the Company's indirect obligations in connection with the processing of private label and bankcard transactions on behalf of merchants.
Citigroup's primary credit card business is the issuance of credit cards to individuals. In addition, the Company provides transaction processing services to various merchants with respect to bankcard and private-label cards. In the event of a billing dispute with respect to a bankcard transaction between a merchant and a cardholder that is ultimately resolved in the cardholder's favor, the third party holds the primary contingent liability to credit or refund the amount to the cardholder and charge back the transaction to the merchant. If the third party is unable to collect this amount from the merchant, it bears the loss for the amount of the credit or refund paid to the cardholder.
The Company continues to have the primary contingent liability with respect to its portfolio of private-label merchants. The risk of loss is mitigated as the cash flows between the third party or the Company and the merchant are settled on a net basis and the third party or the Company has the right to offset any payments with cash flows otherwise due to the merchant. To further mitigate this risk, the third party or the Company may require a merchant to make an escrow deposit, delay settlement, or include event triggers to provide the third party or the Company with more financial and operational control in the event of the financial deterioration of the merchant, or require various credit enhancements (including letters of credit and bank guarantees). In the unlikely event that a private-label merchant is unable to deliver products, services or a refund to its private-label cardholders, Citigroup is contingently liable to credit or refund cardholders. In addition, although a third party holds the primary contingent liability with respect to the processing of bankcard transactions, in the event that the third party does not have sufficient collateral from the merchant or sufficient financial resources of its own to provide the credit or refunds to the cardholders, Citigroup would be liable to credit or refund the cardholders.
The Company's maximum potential contingent liability related to both bankcard and private-label merchant processing services is estimated to be the total volume of credit card transactions that meet the requirements to be valid chargeback transactions at any given time. At March 31, 2010 and
163
December 31, 2009, this maximum potential exposure was estimated to be $55 billion and $60 billion, respectively.
However, the Company believes that the maximum exposure is not representative of the actual potential loss exposure based on the Company's historical experience and its position as a secondary guarantor (in the case of bankcards). In most cases, this contingent liability is unlikely to arise, as most products and services are delivered when purchased, and amounts are refunded when items are returned to merchants. The Company assesses the probability and amount of its contingent liability related to merchant processing based on the financial strength of the primary guarantor (in the case of bankcards) and the extent and nature of unresolved chargebacks and its historical loss experience. At March 31, 2010 and December 31, 2009, the estimated losses incurred and the carrying amounts of the Company's contingent obligations related to merchant processing activities were immaterial.
Custody indemnifications
Custody indemnifications are issued to guarantee that custody clients will be made whole in the event that a third-party subcustodian or depository institution fails to safeguard clients' assets.
Other
Citigroup has an accrual related to certain of Visa USA's litigation matters. As of March 31, 2010 and December 31, 2009, the carrying value of the accrual was $276 million and $121 million, respectively, and the amount is included in Other liabilities on the Consolidated Balance Sheet.
Other guarantees and indemnifications
The Company, through its credit card business, provides various cardholder protection programs on several of its card products, including programs that provide insurance coverage for rental cars, coverage for certain losses associated with purchased products, price protection for certain purchases and protection for lost luggage. These guarantees are not included in the table, since the total outstanding amount of the guarantees and the Company's maximum exposure to loss cannot be quantified. The protection is limited to certain types of purchases and certain types of losses and it is not possible to quantify the purchases that would qualify for these benefits at any given time. The Company assesses the probability and amount of its potential liability related to these programs based on the extent and nature of its historical loss experience. At March 31, 2010 and December 31, 2009, the actual and estimated losses incurred and the carrying value of the Company's obligations related to these programs were immaterial.
In the normal course of business, the Company provides standard representations and warranties to counterparties in contracts in connection with numerous transactions and also provides indemnifications that protect the counterparties to the contracts in the event that additional taxes are owed due either to a change in the tax law or an adverse interpretation of the tax law. Counterparties to these transactions provide the Company with comparable indemnifications. While such representations, warranties and tax indemnifications are essential components of many contractual relationships, they do not represent the underlying business purpose for the transactions. The indemnification clauses are often standard contractual terms related to the Company's own performance under the terms of a contract and are entered into in the normal course of business based on an assessment that the risk of loss is remote. Often these clauses are intended to ensure that terms of a contract are met at inception (for example, that loans transferred to a counterparty in a sales transaction did in fact meet the conditions specified in the contract at the transfer date). No compensation is received for these standard representations and warranties, and it is not possible to determine their fair value because they rarely, if ever, result in a payment. In many cases, there are no stated or notional amounts included in the indemnification clauses and the contingencies potentially triggering the obligation to indemnify have not occurred and are not expected to occur. These indemnifications are not included in the table above.
In addition, the Company is a member of or shareholder in hundreds of value-transfer networks (VTNs) (payment clearing and settlement systems as well as securities exchanges) around the world. As a condition of membership, many of these VTNs require that members stand ready to backstop the net effect on the VTNs of a member's default on its obligations. The Company's potential obligations as a shareholder or member of VTN associations are excluded from the scope of FIN 45, since the shareholders and members represent subordinated classes of investors in the VTNs. Accordingly, the Company's participation in VTNs is not reported in the table and there are no amounts reflected on the Consolidated Balance Sheet as of March 31, 2010 or December 31, 2009 for potential obligations that could arise from the Company's involvement with VTN associations.
In the sale of an insurance subsidiary, the Company provided an indemnification to an insurance company for policyholder claims and other liabilities relating to a book of long-term care (LTC) business (for the entire term of the LTC policies) that is fully reinsured by another insurance company. The reinsurer has funded two trusts with securities whose fair value (approximately $3.7 billion and $3.3 billion at March 31, 2010 and December 31, 2009, respectively) is designed to cover the insurance company's statutory liabilities for the LTC policies. The assets in these trusts are evaluated and adjusted periodically to ensure that the fair value of the assets continues to cover the estimated statutory liabilities related to the LTC policies, as those statutory liabilities change over time. If the reinsurer fails to perform under the reinsurance agreement for any reason, including insolvency, and the assets in the two trusts are insufficient or unavailable to the ceding insurance company, then Citigroup must indemnify the ceding insurance company for any losses actually incurred in connection with the LTC policies. Since both events would have to occur before Citi would become responsible for any payment to the ceding insurance company pursuant to its indemnification obligation and the likelihood of such events occurring is currently not probable, there is no liability reflected in the Consolidated Balance Sheet as of March 31, 2010 and December 31, 2009 related to this indemnification.
164
At March 31, 2010 and December 31, 2009, the total carrying amounts of the liabilities related to the guarantees and indemnifications included in the table amounted to approximately $1.6 billion and $1.2 billion, respectively. The carrying value of derivative instruments is included in either Trading liabilities or Other liabilities , depending upon whether the derivative was entered into for trading or non-trading purposes. The carrying value of financial and performance guarantees is included in Other liabilities . For loans sold with recourse, the carrying value of the liability is included in Other liabilities . In addition, at March 31, 2010 and December 31, 2009, Other liabilities on the Consolidated Balance Sheet include an allowance for credit losses of $1,157 million and $1,122 million relating to letters of credit and unfunded lending commitments, respectively.
Collateral
Cash collateral available to the Company to reimburse losses realized under these guarantees and indemnifications amounted to $34 billion and $31 billion at March 31, 2010 and December 31, 2009, respectively. Securities and other marketable assets held as collateral amounted to $46 billion and $43 billion, respectively, the majority of which collateral is held to reimburse losses realized under securities lending indemnifications. Additionally, letters of credit in favor of the Company held as collateral amounted to $1.5 billion at March 31, 2010 and $1.4 billion at December 31, 2009. Other property may also be available to the Company to cover losses under certain guarantees and indemnifications; however, the value of such property has not been determined.
Performance risk
Citigroup evaluates the performance risk of its guarantees based on the assigned referenced counterparty internal or external ratings. Where external ratings are used, investment-grade ratings are considered to be Baa/BBB and above, while anything below is considered non-investment grade. The Citigroup internal ratings are in line with the related external rating system. On certain underlying referenced credits or entities, ratings are not available. Such referenced credits are included in the not rated category. The maximum potential amount of the future payments related to guarantees and credit derivatives sold is determined to be the notional amount of these contracts, which is the par amount of the assets guaranteed.
Presented in the tables below are the maximum potential amounts of future payments classified based upon internal and external credit ratings as of March 31, 2010 and December 31, 2009. As previously mentioned, the determination of the maximum potential future payments is based on the notional amount of the guarantees without consideration of possible recoveries under recourse provisions or from collateral held or pledged. Such amounts bear no relationship to the anticipated losses, if any, on these guarantees.
|
|
Maximum potential amount of future payments | ||||||||||||
|---|---|---|---|---|---|---|---|---|---|---|---|---|---|
| In billions of dollars as of March 31, 2010 |
Investment
grade |
Non-investment
grade |
Not rated | Total | |||||||||
|
Financial standby letters of credit |
$ | 46.3 | $ | 13.8 | $ | 25.1 | $ | 85.2 | |||||
|
Performance guarantees |
6.7 | 3.8 | 3.1 | 13.6 | |||||||||
|
Derivative instruments deemed to be guarantees |
— | — | 7.7 | 7.7 | |||||||||
|
Loans sold with recourse |
— | — | 0.3 | 0.3 | |||||||||
|
Securities lending indemnifications |
— | — | 70.6 | 70.6 | |||||||||
|
Credit card merchant processing |
— | — | 54.9 | 54.9 | |||||||||
|
Custody indemnifications and other |
28.7 | 5.8 | — | 34.5 | |||||||||
|
Total |
$ | 81.7 | $ | 23.4 | $ | 161.7 | $ | 266.8 | |||||
|
|
Maximum potential amount of future payments | ||||||||||||
|---|---|---|---|---|---|---|---|---|---|---|---|---|---|
| In billions of dollars as of December 31, 2009 |
Investment
grade |
Non-investment
grade |
Not rated | Total | |||||||||
|
Financial standby letters of credit |
$ | 49.2 | $ | 13.5 | $ | 26.7 | $ | 89.4 | |||||
|
Performance guarantees |
6.5 | 3.7 | 3.7 | 13.9 | |||||||||
|
Derivative instruments deemed to be guarantees |
— | — | 7.7 | 7.7 | |||||||||
|
Loans sold with recourse |
— | — | 0.3 | 0.3 | |||||||||
|
Securities lending indemnifications |
— | — | 64.5 | 64.5 | |||||||||
|
Credit card merchant processing |
— | — | 59.7 | 59.7 | |||||||||
|
Custody indemnifications and other |
27.7 | 5.8 | — | 33.5 | |||||||||
|
Total |
$ | 83.4 | $ | 23.0 | $ | 162.6 | $ | 269.0 | |||||
165
Credit Commitments and Lines of Credit
The table below summarizes Citigroup's credit commitments as of March 31, 2010 and December 31, 2009:
| In millions of dollars | U.S. |
Outside of
U.S. |
March 31,
2010 |
December 31,
2009 |
|||||||||
|---|---|---|---|---|---|---|---|---|---|---|---|---|---|
|
Commercial and similar letters of credit |
$ | 1,457 | $ | 6,493 | $ | 7,950 | $ | 7,211 | |||||
|
One- to four-family residential mortgages |
722 | 279 | 1,001 | 1,070 | |||||||||
|
Revolving open-end loans secured by one- to four-family residential properties |
20,023 | 3,011 | 23,034 | 23,916 | |||||||||
|
Commercial real estate, construction and land development |
1,651 | 536 | 2,187 | 1,704 | |||||||||
|
Credit card lines |
611,141 | 129,826 | 740,967 | 785,495 | |||||||||
|
Commercial and other consumer loan commitments |
118,061 | 86,243 | 204,304 | 257,342 | |||||||||
|
Total |
$ | 753,055 | $ | 226,388 | $ | 979,443 | $ | 1,076,738 | |||||
The majority of unused commitments are contingent upon customers' maintaining specific credit standards. Commercial commitments generally have floating interest rates and fixed expiration dates and may require payment of fees. Such fees (net of certain direct costs) are deferred and, upon exercise of the commitment, amortized over the life of the loan or, if exercise is deemed remote, amortized over the commitment period.
Commercial and similar letters of credit
A commercial letter of credit is an instrument by which Citigroup substitutes its credit for that of a customer to enable the customer to finance the purchase of goods or to incur other commitments. Citigroup issues a letter on behalf of its client to a supplier and agrees to pay the supplier upon presentation of documentary evidence that the supplier has performed in accordance with the terms of the letter of credit. When a letter of credit is drawn, the customer is then required to reimburse Citigroup.
One- to four-family residential mortgages
A one- to four-family residential mortgage commitment is a written confirmation from Citigroup to a seller of a property that the bank will advance the specified sums enabling the buyer to complete the purchase.
Revolving open-end loans secured by one- to four-family residential properties
Revolving open-end loans secured by one- to four-family residential properties are essentially home equity lines of credit. A home equity line of credit is a loan secured by a primary residence or second home to the extent of the excess of fair market value over the debt outstanding for the first mortgage.
Commercial real estate, construction and land development
Commercial real estate, construction and land development include unused portions of commitments to extend credit for the purpose of financing commercial and multifamily residential properties as well as land development projects. Both secured-by-real-estate and unsecured commitments are included in this line, as well as undistributed loan proceeds, where there is an obligation to advance for construction progress payments. However, this line only includes those extensions of credit that, once funded, will be classified as Total loans, net on the Consolidated Balance Sheet.
Credit card lines
Citigroup provides credit to customers by issuing credit cards. The credit card lines are unconditionally cancellable by the issuer.
Commercial and other consumer loan commitments
Commercial and other consumer loan commitments include overdraft and liquidity facilities, as well as commercial commitments to make or purchase loans, to purchase third-party receivables, to provide note issuance or revolving underwriting facilities and to invest in the form of equity. Amounts include $82 billion and $126 billion with an original maturity of less than one year at March 31, 2010 and December 31, 2009, respectively.
In addition, included in this line item are highly leveraged financing commitments, which are agreements that provide funding to a borrower with higher levels of debt (measured by the ratio of debt capital to equity capital of the borrower) than is generally considered normal for other companies. This type of financing is commonly employed in corporate acquisitions, management buy-outs and similar transactions.
166
In accordance with ASC 450 (formerly SFAS 5), Citigroup establishes accruals for litigation and regulatory matters when those matters present loss contingencies that both are probable and can be reasonably estimated. Once established, accruals are adjusted from time to time, as appropriate, in light of additional information. In view of the inherent unpredictability of litigation and regulatory matters, particularly where the damages sought are substantial or indeterminate, the investigations or proceedings are in the early stages, or the matters involve novel legal theories or a large number of parties, Citigroup cannot state with certainty the timing or ultimate resolution of litigations and regulatory matters, and the actual costs of resolving litigations and regulatory matters may be substantially higher or lower than the amounts accrued for those matters.
Subject to the foregoing, it is the opinion of Citigroup's management, based on current knowledge and after taking into account available insurance coverage and its current accruals, that the eventual outcome of such matters would not be likely to have a material adverse effect on the consolidated financial condition of Citi. Nonetheless, given the substantial or indeterminate amounts sought in certain of these matters, and the inherent unpredictability of such matters, an adverse outcome in certain of these matters could, from time to time, have a material adverse effect on Citi's consolidated results of operations or cash flows in particular quarterly or annual periods.
167
21. CITIBANK, N.A. STOCKHOLDER'S EQUITY
Statement of Changes in Stockholder's Equity
|
|
Citibank, N.A. and Subsidiaries | ||||||
|---|---|---|---|---|---|---|---|
|
|
Three Months Ended March 31, | ||||||
| In millions of dollars, except shares | 2010 | 2009 | |||||
|
Common stock ($20 par value) |
|||||||
|
Balance, beginning of period—shares: 37,534,553 in 2010 and 2009 |
$ | 751 | $ | 751 | |||
|
Balance, end of period |
$ | 751 | $ | 751 | |||
|
Surplus |
|||||||
|
Balance, beginning of period |
$ | 107,923 | $ | 74,767 | |||
|
Capital contribution from parent company |
346 | 27,451 | |||||
|
Employee benefit plans |
132 | 1 | |||||
|
Balance, end of period |
$ | 108,401 | $ | 102,219 | |||
|
Retained earnings |
|||||||
|
Balance, beginning of period |
$ | 19,457 | $ | 21,735 | |||
|
Adjustment to opening balance, net of taxes(1)(2) |
(411 | ) | 402 | ||||
|
Adjusted balance, beginning of period |
$ | 19,046 | $ | 22,137 | |||
|
Net income |
2,472 | 1,470 | |||||
|
Dividends(3) |
9 | — | |||||
|
Other(4) |
— | 117 | |||||
|
Balance, end of period |
$ | 21,527 | $ | 23,724 | |||
|
Accumulated other comprehensive income (loss) |
|||||||
|
Balance, beginning of period |
$ | (11,532 | ) | $ | (15,895 | ) | |
|
Adjustment to opening balance, net of taxes(1) |
— | (402 | ) | ||||
|
Adjusted balance, beginning of period |
$ | (11,532 | ) | $ | (16,297 | ) | |
|
Net change in unrealized gains (losses) on investment securities available-for-sale, net of taxes |
1,014 | (125 | ) | ||||
|
Net change in foreign currency translation adjustment, net of taxes |
(786 | ) | (2,106 | ) | |||
|
Net change in cash flow hedges, net of taxes |
133 | 1,131 | |||||
|
Pension liability adjustment, net of taxes |
(17 | ) | 24 | ||||
|
Net change in accumulated other comprehensive income (loss) |
$ | 344 | $ | (1,076 | ) | ||
|
Balance, end of period |
$ | (11,188 | ) | $ | (17,373 | ) | |
|
Total Citibank stockholder's equity |
$ | 119,491 | $ | 109,321 | |||
|
Noncontrolling interest |
|||||||
|
Balance, beginning of period |
$ | 1,294 | $ | 1,082 | |||
|
Initial origination of a noncontrolling interest |
(39 | ) | — | ||||
|
Transactions between noncontrolling interest and the related consolidating subsidiary |
(1 | ) | (130 | ) | |||
|
Net income attributable to noncontrolling interest shareholders |
22 | 8 | |||||
|
Dividends paid to noncontrolling interest shareholders |
(1 | ) | (6 | ) | |||
|
Accumulated other comprehensive income—Net change in unrealized gains and losses on investment securities, net of tax |
12 | (3 | ) | ||||
|
Accumulated other comprehensive income—Net change in FX translation adjustment, net of tax |
(5 | ) | (86 | ) | |||
|
All other |
(12 | ) | (5 | ) | |||
|
Net change in noncontrolling interest |
(24 | ) | (222 | ) | |||
|
Balance, end of period |
$ | 1,270 | $ | 860 | |||
|
Total equity |
$ | 120,761 | $ | 110,181 | |||
|
Comprehensive income (loss) |
|||||||
|
Net income (loss) before attribution of noncontrolling interest |
$ | 2,494 | $ | 1,478 | |||
|
Net change in accumulated other comprehensive income (loss) |
351 | (1,165 | ) | ||||
|
Total comprehensive income (loss) |
$ | 2,845 | $ | 313 | |||
|
Comprehensive income attributable to the noncontrolling interest |
29 | (81 | ) | ||||
|
Comprehensive income attributable to Citibank |
$ | 2,816 | $ | 394 | |||
- (1)
-
The
adjustment to the opening balances for
Retained earnings
and
Accumulated other
comprehensive income (loss)
in 2009 represents the cumulative effect of initially adopting ASC 320-10-35-34 (FSP
FAS 115-2 and FAS 124-2).
- (2)
-
The
adjustment to the opening balance for
Retained earnings
in 2010 represents the cumulative effect of
initially adopting ASC 810,
Consolidation
(formerly FASB Interpretation No. 46(R), Consolidation of Variable Interest Entities). See
Note 1 to the Consolidated Financial Statements.
- (3)
-
The
2010 period includes common dividends related to forfeitures of previously issued but unvested employee stock awards.
- (4)
- Represents the accounting for the transfers of assets and liabilities between Citibank, N.A. and other affiliates under the common control of Citigroup.
168
LQIF Acquisition
In May 2010, Citigroup received regulatory approval and finalized its exercise of two call options increasing Citi's stake from 32.96% to 50% in LQIF, a wholly owned subsidiary of Quiñenco that controls Banco de Chile, and is accounted for under the equity method of accounting. The exercise price of the two options are approximately $510 million and $519 million, respectively, which were paid to Quiñenco. As a result of the transaction, Citi obtained a 30.9% voting interest and 20.4% economic interest in Banco de Chile and the right to appoint additional directors on both the LQIF and Banco de Chile boards, bringing the totals up to 3 (of 7) and 5 (of 11), respectively.
The Company has evaluated subsequent events through May 7, 2010, which is the date its Consolidated Financial Statements were issued.
23. CONDENSED CONSOLIDATING FINANCIAL STATEMENTS SCHEDULES
These condensed Consolidating Financial Statements schedules are presented for purposes of additional analysis but should be considered in relation to the Consolidated Financial Statements of Citigroup taken as a whole.
Citigroup Parent Company
The holding company, Citigroup Inc.
Citigroup Global Markets Holdings Inc. (CGMHI)
Citigroup guarantees various debt obligations of CGMHI as well as all of the outstanding debt obligations under CGMHI's publicly issued debt.
Citigroup Funding Inc. (CFI)
CFI is a first-tier subsidiary of Citigroup, which issues commercial paper, medium-term notes and structured equity-linked and credit-linked notes, all of which are guaranteed by Citigroup.
CitiFinancial Credit Company (CCC)
An indirect wholly owned subsidiary of Citigroup. CCC is a wholly owned subsidiary of Associates. Citigroup has issued a full and unconditional guarantee of the outstanding indebtedness of CCC.
Associates First Capital Corporation (Associates)
A wholly owned subsidiary of Citigroup. Citigroup has issued a full and unconditional guarantee of the outstanding long-term debt securities and commercial paper of Associates. In addition, Citigroup guaranteed various debt obligations of Citigroup Finance Canada Inc. (CFCI), a wholly owned subsidiary of Associates. CFCI continues to issue debt in the Canadian market supported by a Citigroup guarantee. Associates is the immediate parent company of CCC.
Other Citigroup Subsidiaries
Includes all other subsidiaries of Citigroup, intercompany eliminations, and income/loss from discontinued operations.
Consolidating Adjustments
Includes Citigroup parent company elimination of distributed and undistributed income of subsidiaries, investment in subsidiaries and the elimination of CCC, which is included in the Associates column.
169
Condensed Consolidating Statements of Income
|
|
Three Months Ended March 31, 2010 | ||||||||||||||||||||||||
|---|---|---|---|---|---|---|---|---|---|---|---|---|---|---|---|---|---|---|---|---|---|---|---|---|---|
| In millions of dollars | Citigroup parent company | CGMHI | CFI | CCC | Associates |
Other
Citigroup subsidiaries, eliminations and income from discontinued operations |
Consolidating
adjustments |
Citigroup
consolidated |
|||||||||||||||||
|
Revenues |
|||||||||||||||||||||||||
|
Dividends from subsidiary banks and bank holding companies |
$ | 2,313 | $ | — | $ | — | $ | — | $ | — | $ | — | $ | (2,313 | ) | $ | — | ||||||||
|
Interest revenue |
75 | 1,490 | — | 1,399 | 1,606 | 17,681 | (1,399 | ) | 20,852 | ||||||||||||||||
|
Interest revenue—intercompany |
508 | 565 | 824 | 20 | 96 | (1,993 | ) | (20 | ) | — | |||||||||||||||
|
Interest expense |
2,188 | 522 | 799 | 24 | 94 | 2,688 | (24 | ) | 6,291 | ||||||||||||||||
|
Interest expense—intercompany |
(199 | ) | 666 | (282 | ) | 517 | 308 | (493 | ) | (517 | ) | — | |||||||||||||
|
Net interest revenue |
$ | (1,406 | ) | $ | 867 | $ | 307 | $ | 878 | $ | 1,300 | $ | 13,493 | (878 | ) | $ | 14,561 | ||||||||
|
Commissions and fees |
$ | — | $ | 1,287 | $ | — | $ | 11 | $ | 33 | $ | 2,440 | $ | (11 | ) | $ | 3,760 | ||||||||
|
Commissions and fees—intercompany |
— | 58 | — | 40 | 44 | (102 | ) | (40 | ) | — | |||||||||||||||
|
Principal transactions |
(117 | ) | 3,821 | 289 | — | (2 | ) | 60 | — | 4,051 | |||||||||||||||
|
Principal transactions—intercompany |
(4 | ) | (1,668 | ) | (273 | ) | — | (18 | ) | 1,963 | — | — | |||||||||||||
|
Other income |
1,019 | 352 | (200 | ) | 104 | 141 | 1,737 | (104 | ) | 3,049 | |||||||||||||||
|
Other income—intercompany |
(825 | ) | 30 | 218 | — | 9 | 568 | — | — | ||||||||||||||||
|
Total non-interest revenues |
$ | 73 | $ | 3,880 | $ | 34 | $ | 155 | $ | 207 | $ | 6,666 | $ | (155 | ) | $ | 10,860 | ||||||||
|
Total revenues, net of interest expense |
$ | 980 | $ | 4,747 | $ | 341 | $ | 1,033 | $ | 1,507 | $ | 20,159 | $ | (3,346 | ) | $ | 25,421 | ||||||||
|
Provisions for credit losses and for benefits and claims |
$ | — | $ | 4 | $ | — | $ | 685 | $ | 750 | $ | 7,864 | $ | (685 | ) | $ | 8,618 | ||||||||
|
Expenses |
|||||||||||||||||||||||||
|
Compensation and benefits |
$ | 102 | $ | 1,496 | $ | — | $ | 126 | $ | 180 | $ | 4,384 | $ | (126 | ) | $ | 6,162 | ||||||||
|
Compensation and benefits—intercompany |
2 | 54 | — | 34 | 34 | (90 | ) | (34 | ) | — | |||||||||||||||
|
Other expense |
140 | 494 | — | 112 | 152 | 4,570 | (112 | ) | 5,356 | ||||||||||||||||
|
Other expense—intercompany |
64 | 241 | 2 | 179 | 187 | (494 | ) | (179 | ) | — | |||||||||||||||
|
Total operating expenses |
$ | 308 | $ | 2,285 | $ | 2 | $ | 451 | $ | 553 | $ | 8,370 | $ | (451 | ) | $ | 11,518 | ||||||||
|
Income (loss) before taxes and equity in undistributed income of subsidiaries |
$ | 672 | $ | 2,458 | $ | 339 | $ | (103 | ) | $ | 204 | $ | 3,925 | $ | (2,210 | ) | $ | 5,285 | |||||||
|
Income taxes (benefits) |
(1,070 | ) | 820 | 119 | (42 | ) | 67 | 1,100 | 42 | 1,036 | |||||||||||||||
|
Equities in undistributed income of subsidiaries |
2,686 | — | — | — | — | — | (2,686 | ) | — | ||||||||||||||||
|
Income (loss) from continuing operations |
$ | 4,428 | $ | 1,638 | $ | 220 | $ | (61 | ) | $ | 137 | $ | 2,825 | $ | (4,938 | ) | $ | 4,249 | |||||||
|
Income (loss) from discontinued operations, net of taxes |
— | — | — | — | — | 211 | — | 211 | |||||||||||||||||
|
Net income (loss) before attrition of noncontrolling interest |
$ | 4,428 | $ | 1,638 | $ | 220 | $ | (61 | ) | $ | 137 | $ | 3,036 | $ | (4,938 | ) | $ | 4,460 | |||||||
|
Net income (loss) attributable to noncontrolling interests |
— | 14 | — | — | — | 18 | — | 32 | |||||||||||||||||
|
Citigroup's net income (loss) |
$ | 4,428 | $ | 1,624 | $ | 220 | $ | (61 | ) | $ | 137 | $ | 3,018 | $ | (4,938 | ) | $ | 4,428 | |||||||
170
Condensed Consolidating Statements of Income
|
|
Three Months Ended March 31, 2009 | ||||||||||||||||||||||||
|---|---|---|---|---|---|---|---|---|---|---|---|---|---|---|---|---|---|---|---|---|---|---|---|---|---|
| In millions of dollars |
Citigroup
parent company |
CGMHI | CFI | CCC | Associates |
Other
Citigroup subsidiaries, eliminations |
Consolidating
adjustments |
Citigroup
consolidated |
|||||||||||||||||
|
Revenues |
|||||||||||||||||||||||||
|
Dividends from subsidiary banks and bank holding companies |
$ | 19 | $ | — | $ | — | $ | — | $ | — | $ | — | $ | (19 | ) | $ | — | ||||||||
|
Interest revenue |
120 | 2,269 | — | 1,633 | 1,864 | 16,330 | (1,633 | ) | 20,583 | ||||||||||||||||
|
Interest revenue—intercompany |
802 | 708 | 1,060 | 10 | 116 | (2,686 | ) | (10 | ) | — | |||||||||||||||
|
Interest expense |
2,224 | 691 | 516 | 25 | 102 | 4,124 | (25 | ) | 7,657 | ||||||||||||||||
|
Interest expense—intercompany |
(236 | ) | 1,099 | 179 | 576 | 470 | (1,512 | ) | (576 | ) | — | ||||||||||||||
|
Net interest revenue |
$ | (1,066 | ) | $ | 1,187 | $ | 365 | $ | 1,042 | $ | 1,408 | $ | 11,032 | $ | (1,042 | ) | $ | 12,926 | |||||||
|
Commissions and fees |
$ | — | $ | 1,653 | $ | — | $ | 11 | $ | 30 | $ | 2,485 | $ | (11 | ) | $ | 4,168 | ||||||||
|
Commissions and fees—intercompany |
— | 33 | — | 19 | 21 | (54 | ) | (19 | ) | — | |||||||||||||||
|
Principal transactions |
(357 | ) | (1,704 | ) | 986 | — | (2 | ) | 4,747 | — | 3,670 | ||||||||||||||
|
Principal transactions—intercompany |
143 | 3,138 | (673 | ) | — | (10 | ) | (2,598 | ) | — | — | ||||||||||||||
|
Other income |
3,522 | 702 | (40 | ) | 102 | 148 | (575 | ) | (102 | ) | 3,757 | ||||||||||||||
|
Other income—intercompany |
(2,369 | ) | 18 | 30 | — | 24 | 2,297 | — | — | ||||||||||||||||
|
Total non-interest revenues |
$ | 939 | $ | 3,840 | $ | 303 | $ | 132 | $ | 211 | $ | 6,302 | $ | (132 | ) | $ | 11,595 | ||||||||
|
Total revenues, net of interest expense |
$ | (108 | ) | $ | 5,027 | $ | 668 | $ | 1,174 | $ | 1,619 | $ | 17,334 | $ | (1,193 | ) | $ | 24,521 | |||||||
|
Provisions for credit losses and for benefits and claims |
$ | — | $ | 24 | $ | — | $ | 956 | $ | 1,051 | $ | 9,232 | $ | (956 | ) | $ | 10,307 | ||||||||
|
Expenses |
|||||||||||||||||||||||||
|
Compensation and benefits |
$ | (50 | ) | $ | 1,857 | $ | — | $ | 120 | $ | 148 | $ | 4,280 | $ | (120 | ) | $ | 6,235 | |||||||
|
Compensation and benefits— intercompany |
2 | 193 | — | — | 37 | (232 | ) | — | — | ||||||||||||||||
|
Other expense |
228 | 659 | 1 | 109 | 147 | 4,415 | (109 | ) | 5,450 | ||||||||||||||||
|
Other expense—intercompany |
109 | 6 | 3 | 166 | 153 | (271 | ) | (166 | ) | — | |||||||||||||||
|
Total operating expenses |
$ | 289 | $ | 2,715 | $ | 4 | $ | 395 | $ | 485 | $ | 8,192 | $ | (395 | ) | $ | 11,685 | ||||||||
|
Income (Loss) before taxes and equity in undistributed income of subsidiaries |
$ | (397 | ) | $ | 2,288 | $ | 664 | $ | (177 | ) | $ | 83 | $ | (90 | ) | $ | 158 | $ | 2,529 | ||||||
|
Income taxes (benefits) |
651 | 692 | 232 | (59 | ) | 32 | (772 | ) | 59 | 835 | |||||||||||||||
|
Equities in undistributed income of subsidiaries |
2,641 | — | — | — | — | — | (2,641 | ) | — | ||||||||||||||||
|
Income (Loss) from continuing operations |
$ | 1,593 | $ | 1,596 | $ | 432 | $ | (118 | ) | $ | 51 | $ | 682 | $ | (2,542 | ) | $ | 1,694 | |||||||
|
Income from discontinued operations, net of taxes |
— | — | — | — | — | (117 | ) | — | (117 | ) | |||||||||||||||
|
Net income (Loss) before attribution of Noncontrolling Interests |
$ | 1,593 | $ | 1,596 | $ | 432 | $ | (118 | ) | $ | 51 | $ | 565 | $ | (2,542 | ) | $ | 1,577 | |||||||
|
Net Income (Loss) attributable to Noncontrolling Interests |
— | (1 | ) | — | — | — | (15 | ) | — | (16 | ) | ||||||||||||||
|
Citigroup's Net Income (Loss) |
$ | 1,593 | $ | 1,597 | $ | 432 | $ | (118 | ) | $ | 51 | $ | 580 | $ | (2,542 | ) | $ | 1,593 | |||||||
171
Condensed Consolidating Balance Sheet
|
|
March 31, 2010 | ||||||||||||||||||||||||
|---|---|---|---|---|---|---|---|---|---|---|---|---|---|---|---|---|---|---|---|---|---|---|---|---|---|
| In millions of dollars |
Citigroup
parent company |
CGMHI | CFI | CCC | Associates |
Other
Citigroup subsidiaries and eliminations |
Consolidating
adjustments |
Citigroup
consolidated |
|||||||||||||||||
|
Assets |
|||||||||||||||||||||||||
|
Cash and due from banks |
$ | — | $ | 2,612 | $ | — | $ | 108 | $ | 237 | $ | 22,829 | $ | (108 | ) | $ | 25,678 | ||||||||
|
Cash and due from banks—intercompany |
5 | 3,102 | 1 | 143 | 164 | (3,272 | ) | (143 | ) | — | |||||||||||||||
|
Federal funds sold and resale agreements |
— | 207,752 | — | — | — | 26,596 | — | 234,348 | |||||||||||||||||
|
Federal funds sold and resale agreements—intercompany |
— | 18,951 | — | — | — | (18,951 | ) | — | — | ||||||||||||||||
|
Trading account assets |
23 | 162,737 | — | — | 18 | 183,005 | — | 345,783 | |||||||||||||||||
|
Trading account assets—intercompany |
116 | 7,953 | 1,131 | — | — | (9,200 | ) | — | — | ||||||||||||||||
|
Investments |
11,361 | 2,237 | — | 2,443 | 2,587 | 300,548 | (2,443 | ) | 316,733 | ||||||||||||||||
|
Loans, net of unearned income |
— | 970 | — | 40,688 | 46,540 | 674,294 | (40,688 | ) | 721,804 | ||||||||||||||||
|
Loans, net of unearned income—intercompany |
— | — | 119,370 | 3,337 | 7,127 | (126,497 | ) | (3,337 | ) | — | |||||||||||||||
|
Allowance for loan losses |
— | (48 | ) | — | (3,683 | ) | (4,045 | ) | (44,653 | ) | 3,683 | (48,746 | ) | ||||||||||||
|
Total loans, net |
$ | — | $ | 922 | $ | 119,370 | $ | 40,342 | $ | 49,622 | $ | 503,144 | $ | (40,342 | ) | $ | 673,058 | ||||||||
|
Advances to subsidiaries |
124,196 | — | — | — | — | (124,196 | ) | — | — | ||||||||||||||||
|
Investments in subsidiaries |
214,362 | — | — | — | — | — | (214,362 | ) | — | ||||||||||||||||
|
Other assets |
17,695 | 65,188 | 805 | 6,501 | 7,411 | 315,514 | (6,501 | ) | 406,613 | ||||||||||||||||
|
Other assets—intercompany |
10,468 | 31,017 | 3,324 | 18 | 1,539 | (46,348 | ) | (18 | ) | — | |||||||||||||||
|
Total assets |
$ | 378,226 | $ | 502,471 | $ | 124,631 | $ | 49,555 | $ | 61,578 | $ | 1,149,669 | $ | (263,917 | ) | $ | 2,002,213 | ||||||||
|
Liabilities and equity |
|||||||||||||||||||||||||
|
Deposits |
$ | — | $ | — | $ | — | $ | — | $ | — | $ | 827,914 | $ | — | $ | 827,914 | |||||||||
|
Federal funds purchased and securities loaned or sold |
— | 170,497 | — | — | — | 37,414 | — | 207,911 | |||||||||||||||||
|
Federal funds purchased and securities loaned or sold—intercompany |
185 | 5,838 | — | — | — | (6,023 | ) | — | — | ||||||||||||||||
|
Trading account liabilities |
— | 92,342 | 79 | — | — | 50,327 | — | 142,748 | |||||||||||||||||
|
Trading account liabilities—intercompany |
116 | 5,800 | 1,587 | — | — | (7,503 | ) | — | — | ||||||||||||||||
|
Short-term borrowings |
1,168 | 4,166 | 11,670 | — | 456 | 79,234 | — | 96,694 | |||||||||||||||||
|
Short-term borrowings—intercompany |
— | 62,983 | 50,815 | 4,618 | 33,363 | (147,161 | ) | (4,618 | ) | — | |||||||||||||||
|
Long-term debt |
192,325 | 12,795 | 55,100 | 2,636 | 6,696 | 172,358 | (2,636 | ) | 439,274 | ||||||||||||||||
|
Long-term debt—intercompany |
387 | 57,228 | 1,026 | 34,787 | 12,945 | (71,586 | ) | (34,787 | ) | — | |||||||||||||||
|
Advances from subsidiaries |
20,969 | — | — | — | — | (20,969 | ) | — | — | ||||||||||||||||
|
Other liabilities |
6,657 | 61,578 | 474 | 1,827 | 1,958 | 63,226 | (1,827 | ) | 133,893 | ||||||||||||||||
|
Other liabilities—intercompany |
4,998 | 9,060 | 119 | 810 | 406 | (14,583 | ) | (810 | ) | — | |||||||||||||||
|
Total liabilities |
$ | 226,805 | $ | 482,287 | $ | 120,870 | $ | 44,678 | $ | 55,824 | $ | 962,648 | $ | (44,678 | ) | $ | 1,848,434 | ||||||||
|
Citigroup stockholders' equity |
151,421 | 19,736 | 3,761 | 4,877 | 5,754 | 185,111 | (219,239 | ) | 151,421 | ||||||||||||||||
|
Noncontrolling interest |
— | 448 | — | — | — | 1,910 | — | 2,358 | |||||||||||||||||
|
Total equity |
$ | 151,421 | $ | 20,184 | $ | 3,761 | $ | 4,877 | $ | 5,754 | $ | 187,021 | $ | (219,239 | ) | $ | 153,779 | ||||||||
|
Total liabilities and equity |
$ | 378,226 | $ | 502,471 | $ | 124,631 | $ | 49,555 | $ | 61,578 | $ | 1,149,669 | $ | (263,917 | ) | $ | 2,002,213 | ||||||||
172
Condensed Consolidating Balance Sheet
|
|
December 31, 2009 | ||||||||||||||||||||||||
|---|---|---|---|---|---|---|---|---|---|---|---|---|---|---|---|---|---|---|---|---|---|---|---|---|---|
|
In millions of dollars
|
Citigroup
parent company |
CGMHI | CFI | CCC | Associates |
Other
Citigroup subsidiaries and eliminations |
Consolidating
adjustments |
Citigroup
consolidated |
|||||||||||||||||
|
Assets |
|||||||||||||||||||||||||
|
Cash and due from banks |
$ | — | $ | 1,801 | $ | — | $ | 198 | $ | 297 | $ | 23,374 | $ | (198 | ) | $ | 25,472 | ||||||||
|
Cash and due from banks—intercompany |
5 | 3,146 | 1 | 145 | 168 | (3,320 | ) | (145 | ) | — | |||||||||||||||
|
Federal funds sold and resale agreements |
— | 199,760 | — | — | — | 22,262 | — | 222,022 | |||||||||||||||||
|
Federal funds sold and resale agreements—intercompany |
— | 20,626 | — | — | — | (20,626 | ) | — | — | ||||||||||||||||
|
Trading account assets |
26 | 140,777 | 71 | — | 17 | 201,882 | — | 342,773 | |||||||||||||||||
|
Trading account assets—intercompany |
196 | 6,812 | 788 | — | — | (7,796 | ) | — | — | ||||||||||||||||
|
Investments |
13,318 | 237 | — | 2,293 | 2,506 | 290,058 | (2,293 | ) | 306,119 | ||||||||||||||||
|
Loans, net of unearned income |
— | 248 | — | 42,739 | 48,821 | 542,435 | (42,739 | ) | 591,504 | ||||||||||||||||
|
Loans, net of unearned income—intercompany |
— | — | 129,317 | 3,387 | 7,261 | (136,578 | ) | (3,387 | ) | — | |||||||||||||||
|
Allowance for loan losses |
— | (83 | ) | — | (3,680 | ) | (4,056 | ) | (31,894 | ) | 3,680 | (36,033 | ) | ||||||||||||
|
Total loans, net |
$ | — | $ | 165 | $ | 129,317 | $ | 42,446 | $ | 52,026 | $ | 373,963 | $ | (42,446 | ) | $ | 555,471 | ||||||||
|
Advances to subsidiaries |
144,497 | — | — | — | — | (144,497 | ) | — | — | ||||||||||||||||
|
Investments in subsidiaries |
210,895 | — | — | — | — | — | (210,895 | ) | — | ||||||||||||||||
|
Other assets |
14,196 | 69,907 | 1,186 | 6,440 | 7,317 | 312,183 | (6,440 | ) | 404,789 | ||||||||||||||||
|
Other assets—intercompany |
10,412 | 38,047 | 3,168 | 47 | 1,383 | (53,010 | ) | (47 | ) | — | |||||||||||||||
|
Total assets |
$ | 393,545 | $ | 481,278 | $ | 134,531 | $ | 51,569 | $ | 63,714 | $ | 994,473 | $ | (262,464 | ) | $ | 1,856,646 | ||||||||
|
Liabilities and equity |
|||||||||||||||||||||||||
|
Deposits |
$ | — | $ | — | $ | — | $ | — | $ | — | $ | 835,903 | $ | — | $ | 835,903 | |||||||||
|
Federal funds purchased and securities loaned or sold |
— | 124,522 | — | — | — | 29,759 | — | 154,281 | |||||||||||||||||
|
Federal funds purchased and securities loaned or sold—intercompany |
185 | 18,721 | — | — | — | (18,906 | ) | — | — | ||||||||||||||||
|
Trading account liabilities |
— | 82,905 | 115 | — | — | 54,492 | — | 137,512 | |||||||||||||||||
|
Trading account liabilities—intercompany |
198 | 7,495 | 1,082 | — | — | (8,775 | ) | — | — | ||||||||||||||||
|
Short-term borrowings |
1,177 | 4,593 | 10,136 | — | 379 | 52,594 | — | 68,879 | |||||||||||||||||
|
Short-term borrowings—intercompany |
— | 69,306 | 62,336 | 3,304 | 33,818 | (165,460 | ) | (3,304 | ) | — | |||||||||||||||
|
Long-term debt |
197,804 | 13,422 | 55,499 | 2,893 | 7,542 | 89,752 | (2,893 | ) | 364,019 | ||||||||||||||||
|
Long-term debt—intercompany |
367 | 62,050 | 1,039 | 37,600 | 14,278 | (77,734 | ) | (37,600 | ) | — | |||||||||||||||
|
Advances from subsidiaries |
30,275 | — | — | — | — | (30,275 | ) | — | — | ||||||||||||||||
|
Other liabilities |
5,985 | 70,477 | 585 | 1,772 | 1,742 | 62,290 | (1,772 | ) | 141,079 | ||||||||||||||||
|
Other liabilities—intercompany |
4,854 | 7,911 | 198 | 1,080 | 386 | (13,349 | ) | (1,080 | ) | — | |||||||||||||||
|
Total liabilities |
$ | 240,845 | $ | 461,402 | $ | 130,990 | $ | 46,649 | $ | 58,145 | $ | 810,291 | $ | (46,649 | ) | $ | 1,701,673 | ||||||||
|
Citigroup stockholders' equity |
152,700 | 19,448 | 3,541 | 4,920 | 5,569 | 182,337 | (215,815 | ) | 152,700 | ||||||||||||||||
|
Noncontrolling interest |
— | 428 | — | — | — | 1,845 | — | 2,273 | |||||||||||||||||
|
Total equity |
$ | 152,700 | $ | 19,876 | $ | 3,541 | $ | 4,920 | $ | 5,569 | $ | 184,182 | $ | (215,815 | ) | $ | 154,973 | ||||||||
|
Total liabilities and equity |
$ | 393,545 | $ | 481,278 | $ | 134,531 | $ | 51,569 | $ | 63,714 | $ | 994,473 | $ | (262,464 | ) | $ | 1,856,646 | ||||||||
173
Condensed Consolidating Statements of Cash Flows
|
|
Three Months Ended March 31, 2010 | ||||||||||||||||||||||||
|---|---|---|---|---|---|---|---|---|---|---|---|---|---|---|---|---|---|---|---|---|---|---|---|---|---|
| In millions of dollars |
Citigroup
parent company |
CGMHI | CFI | CCC | Associates |
Other
Citigroup subsidiaries and eliminations |
Consolidating
adjustments |
Citigroup
Consolidated |
|||||||||||||||||
|
Net cash (used in) provided by operating activities |
$ | (4,305 | ) | $ | 12,468 | $ | 394 | $ | 658 | $ | 1,033 | $ | 25,828 | $ | (658 | ) | $ | 35,418 | |||||||
|
Cash flows from investing activities |
|||||||||||||||||||||||||
|
Change in loans |
$ | — | $ | 6 | $ | 10,024 | $ | 1,038 | $ | 1,178 | $ | 14,328 | $ | (1,038 | ) | $ | 25,536 | ||||||||
|
Proceeds from sales and securitizations of loans |
— | 1 | — | — | — | 1,251 | — | 1,252 | |||||||||||||||||
|
Purchases of investments |
(1,176 | ) | — | — | (220 | ) | (226 | ) | (94,102 | ) | 220 | (95,504 | ) | ||||||||||||
|
Proceeds from sales of investments |
155 | — | — | 68 | 142 | 32,665 | (68 | ) | 32,962 | ||||||||||||||||
|
Proceeds from maturities of investments |
3,091 | — | — | 70 | 75 | 42,738 | (70 | ) | 45,904 | ||||||||||||||||
|
Changes in investments and advances—intercompany |
12,690 | — | — | 50 | 134 | (12,824 | ) | (50 | ) | — | |||||||||||||||
|
Business acquisitions |
— | — | — | — | — | — | — | — | |||||||||||||||||
|
Other investing activities |
— | 1,549 | — | — | — | 2,699 | — | 4,248 | |||||||||||||||||
|
Net cash provided by (used in) investing activities |
$ | 14,760 | $ | 1,556 | $ | 10,024 | $ | 1,006 | $ | 1,303 | $ | (13,245 | ) | $ | (1,006 | ) | $ | 14,398 | |||||||
|
Cash flows from financing activities |
|||||||||||||||||||||||||
|
Dividends paid |
$ | — | $ | — | $ | — | $ | — | $ | — | $ | — | $ | — | $ | — | |||||||||
|
Dividends paid—intercompany |
— | (1,328 | ) | — | — | — | 1,328 | — | — | ||||||||||||||||
|
Issuance of common stock |
1 | — | — | — | — | (1 | ) | — | — | ||||||||||||||||
|
Issuance of preferred stock |
— | — | — | — | — | — | — | — | |||||||||||||||||
|
Treasury stock acquired |
(1 | ) | — | — | — | — | — | — | (1 | ) | |||||||||||||||
|
Proceeds/(Repayments) from issuance of long-term debt—third-party, net |
(2,713 | ) | (384 | ) | (432 | ) | (257 | ) | (846 | ) | (4,976 | ) | 257 | (9,351 | ) | ||||||||||
|
Proceeds/(Repayments) from issuance of long-term debt—intercompany, net |
— | (4,795 | ) | — | (2,813 | ) | (1,333 | ) | 6,128 | 2,813 | — | ||||||||||||||
|
Change in deposits |
— | — | — | — | — | (7,989 | ) | — | (7,989 | ) | |||||||||||||||
|
Net change in short-term borrowings and other investment banking and brokerage borrowings—third-party |
11 | (427 | ) | 1,706 | 1,314 | 235 | (35,410 | ) | (1,314 | ) | (33,885 | ) | |||||||||||||
|
Net change in short-term borrowings and other advances—intercompany |
(9,501 | ) | (6,323 | ) | (11,692 | ) | — | (455 | ) | 27,971 | — | — | |||||||||||||
|
Capital contributions from parent |
— | — | — | — | — | — | — | — | |||||||||||||||||
|
Other financing activities |
1,748 | — | — | — | — | 1 | — | 1,749 | |||||||||||||||||
|
Net cash used in financing activities |
$ | (10,455 | ) | $ | (13,257 | ) | $ | (10,418 | ) | $ | (1,756 | ) | $ | (2,399 | ) | $ | (12,948 | ) | $ | 1,756 | $ | (49,477 | ) | ||
|
Effect of exchange rate changes on cash and due from banks |
$ | — | $ | — | $ | — | $ | — | $ | — | $ | (185 | ) | $ | — | $ | (185 | ) | |||||||
|
Net cash used in discontinued operations |
$ | — | $ | — | $ | — | $ | — | $ | — | $ | 52 | $ | — | $ | 52 | |||||||||
|
Net increase (decrease) in cash and due from banks |
$ | — | $ | 767 | $ | — | $ | (92 | ) | $ | (63 | ) | $ | (498 | ) | $ | 92 | $ | 206 | ||||||
|
Cash and due from banks at beginning of period |
5 | 4,947 | 1 | 343 | 464 | 20,055 | (343 | ) | 25,472 | ||||||||||||||||
|
Cash and due from banks at end of period |
$ | 5 | $ | 5,714 | $ | 1 | $ | 251 | $ | 401 | $ | 19,557 | $ | (251 | ) | $ | 25,678 | ||||||||
|
Supplemental disclosure of cash flow information |
|||||||||||||||||||||||||
|
Cash paid during the year for: |
|||||||||||||||||||||||||
|
Income taxes |
$ | 75 | $ | 55 | $ | 17 | $ | 10 | $ | (18 | ) | $ | 1,677 | $ | (14 | ) | $ | 1,802 | |||||||
|
Interest |
2,262 | 1,366 | 419 | 826 | 386 | 1,278 | (826 | ) | 5,711 | ||||||||||||||||
|
Non-cash investing activities: |
|||||||||||||||||||||||||
|
Transfers to repossessed assets |
$ | — | $ | — | $ | — | $ | 378 | $ | 393 | $ | 276 | $ | (378 | ) | $ | 669 | ||||||||
174
Condensed Consolidating Statements of Cash Flows
|
|
Three Months Ended March 31, 2009 | ||||||||||||||||||||||||
|---|---|---|---|---|---|---|---|---|---|---|---|---|---|---|---|---|---|---|---|---|---|---|---|---|---|
| In millions of dollars |
Citigroup
parent company |
CGMHI | CFI | CCC | Associates |
Other
Citigroup subsidiaries and eliminations |
Consolidating
adjustments |
Citigroup
Consolidated |
|||||||||||||||||
|
Net cash provided by (used in) operating activities |
$ | (7,277 | ) | $ | 15,551 | $ | 1,623 | $ | 981 | $ | 826 | $ | (19,104 | ) | $ | (981 | ) | $ | (8,381 | ) | |||||
|
Cash flows from investing activities |
|||||||||||||||||||||||||
|
Change in loans |
$ | — | $ | — | $ | (2,468 | ) | $ | 817 | $ | 1,053 | $ | (30,584 | ) | $ | (817 | ) | $ | (31,999 | ) | |||||
|
Proceeds from sales and securitizations of loans |
— | 97 | — | — | — | 60,232 | — | 60,329 | |||||||||||||||||
|
Purchases of investments |
(9,590 | ) | (13 | ) | — | (195 | ) | (211 | ) | (48,322 | ) | 195 | (58,136 | ) | |||||||||||
|
Proceeds from sales of investments |
6,892 | — | — | 34 | 42 | 20,840 | (34 | ) | 27,774 | ||||||||||||||||
|
Proceeds from maturities of investments |
17,159 | — | — | 122 | 165 | 15,604 | (122 | ) | 32,928 | ||||||||||||||||
|
Changes in investments and advances—intercompany |
(2,727 | ) | — | — | (1,719 | ) | 1,858 | 869 | 1,719 | — | |||||||||||||||
|
Business acquisitions |
— | — | — | — | — | — | — | — | |||||||||||||||||
|
Other investing activities |
— | 3,312 | — | — | — | 8,266 | — | 11,578 | |||||||||||||||||
|
Net cash (used in) provided by investing activities |
$ | 11,734 | $ | 3,396 | $ | (2,468 | ) | $ | (941 | ) | $ | 2,907 | $ | 26,905 | $ | 941 | $ | 42,474 | |||||||
|
Cash flows from financing activities |
|||||||||||||||||||||||||
|
Dividends paid |
$ | (1,074 | ) | $ | — | $ | — | $ | — | $ | — | $ | — | $ | — | $ | (1,074 | ) | |||||||
|
Dividends paid—intercompany |
(56 | ) | — | — | — | — | 56 | — | — | ||||||||||||||||
|
Issuance of common stock |
— | — | — | — | — | — | — | — | |||||||||||||||||
|
Issuance of preferred stock |
— | — | — | — | — | — | — | — | |||||||||||||||||
|
Treasury stock acquired |
(1 | ) | — | — | — | — | — | — | (1 | ) | |||||||||||||||
|
Proceeds/(Repayments) from issuance of long-term debt—third-party, net |
1,791 | (1,428 | ) | 4,047 | (90 | ) | (642 | ) | (12,425 | ) | 90 | (8,657 | ) | ||||||||||||
|
Proceeds/(Repayments) from issuance of long-term debt—intercompany, net |
— | (18,200 | ) | — | (960 | ) | (1 | ) | 18,201 | 960 | — | ||||||||||||||
|
Change in deposits |
— | — | — | — | — | (11,489 | ) | — | (11,489 | ) | |||||||||||||||
|
Net change in short-term borrowings and other investment banking and brokerage borrowings—third-party |
— | (2,656 | ) | (126 | ) | — | 51 | (7,571 | ) | — | (10,302 | ) | |||||||||||||
|
Net change in short-term borrowings and other advances—intercompany |
(5,028 | ) | 2,943 | (3,076 | ) | 994 | (3,195 | ) | 8,356 | (994 | ) | — | |||||||||||||
|
Capital contributions from parent |
— | — | — | — | — | — | — | — | |||||||||||||||||
|
Other financing activities |
(88 | ) | — | — | — | — | — | — | (88 | ) | |||||||||||||||
|
Net cash provided by (used in) financing activities |
$ | (4,456 | ) | $ | (19,341 | ) | $ | 845 | $ | (56 | ) | $ | (3,787 | ) | $ | (4,872 | ) | $ | 56 | $ | (31,611 | ) | |||
|
Effect of exchange rate changes on cash and due from banks |
$ | — | $ | — | $ | — | $ | — | $ | — | $ | (756 | ) | $ | — | $ | (756 | ) | |||||||
|
Net cash used in discontinued operations |
$ | — | $ | — | $ | — | $ | — | $ | — | $ | 84 | $ | — | $ | 84 | |||||||||
|
Net increase (decrease) in cash and due from banks |
$ | 1 | $ | (394 | ) | $ | — | $ | (16 | ) | $ | (54 | ) | $ | 2,257 | $ | 16 | $ | 1,810 | ||||||
|
Cash and due from banks at beginning of period |
13 | 4,557 | 1 | 290 | 396 | 24,286 | (290 | ) | 29,253 | ||||||||||||||||
|
Cash and due from banks at end of period |
$ | 14 | $ | 4,163 | $ | 1 | $ | 274 | $ | 342 | $ | 26,543 | $ | (274 | ) | $ | 31,063 | ||||||||
|
Supplemental disclosure of cash flow information |
|||||||||||||||||||||||||
|
Cash paid during the year for: |
|||||||||||||||||||||||||
|
Income taxes |
$ | (27 | ) | $ | — | $ | 148 | $ | 53 | $ | 94 | $ | 896 | $ | (53 | ) | $ | 1,111 | |||||||
|
Interest |
2,237 | 3,314 | 813 | 763 | 185 | 1,813 | (763 | ) | 8,362 | ||||||||||||||||
|
Non-cash investing activities: |
|||||||||||||||||||||||||
|
Transfers to repossessed assets |
$ | — | $ | — | $ | — | $ | 367 | $ | 380 | $ | 263 | $ | (367 | ) | $ | 643 | ||||||||
175
The following information supplements and amends our discussion set forth under Part I, Item 3 "Legal Proceedings" in our Annual Report on Form 10-K for the fiscal year ended December 31, 2009.
Credit-Crisis-Related Litigation and Other Matters
Citigroup and its affiliates continue to defend lawsuits and arbitrations asserting claims for damages and related relief for losses arising from the global financial credit and subprime-mortgage crisis that began in 2007. Certain of these actions have been resolved, through either settlements or court proceedings.
In addition, Citigroup continues to cooperate fully in response to subpoenas and requests for information from the Securities and Exchange Commission and other government agencies in connection with various formal and informal inquiries concerning Citigroup's subprime mortgage-related conduct and business activities. Citigroup is involved in discussions with certain of its regulators to resolve certain of these matters.
In accordance with ASC 450 (formerly SFAS 5), Citigroup establishes accruals for all litigation and regulatory matters, including matters related to the credit crisis, when those matters present loss contingencies that both are probable and can reasonably be estimated. Once established, accruals are adjusted from time to time, as appropriate, in light of additional information. The actual costs of resolving those matters may be substantially higher or lower than the amounts accrued for those matters.
Lehman Structured Notes Matters
In Spain, Citigroup has made a settlement offer to all eligible purchasers of notes distributed by Citigroup. A significant majority of the eligible purchasers have accepted this offer.
Bruno's Litigation
On March 24, 2010, pursuant to the settlement agreement between plaintiffs and the Citigroup subsidiaries and affiliates ("Citigroup Defendants"), the Alabama state court entered an Order of Final Judgment and Dismissal and bar order, dismissing the Citigroup Defendants from the Bruno's Actions with prejudice.
Payments required in settlement agreements described above have been made or are covered by existing accruals. Additional lawsuits containing claims similar to those described above may be filed in the future.
176
For a discussion of the risk factors affecting Citigroup, see "Risk Factors" in Part I, Item 1A of Citi's Annual Report on Form 10-K for the fiscal year ended December 31, 2009.
177
Unregistered Sales of Equity Securities
None.
Share Repurchases
Under its long-standing repurchase program, Citigroup may buy back common shares in the market or otherwise from time to time. This program is used for many purposes, including offsetting dilution from stock-based compensation programs.
The following table summarizes Citigroup's share repurchases during 2010:
| In millions, except per share amounts |
Total shares
purchased(1) |
Average
price paid per share |
Approximate dollar
value of shares that may yet be purchased under the plan or programs |
||||||||
|---|---|---|---|---|---|---|---|---|---|---|---|
|
January 2010 |
|||||||||||
|
Open market repurchases(1) |
— | $ | — | $ | 6,739 | ||||||
|
Employee transactions(2) |
10.8 | 3.50 | N/A | ||||||||
|
February 2010 |
|||||||||||
|
Open market repurchases(1) |
— | $ | — | $ | 6,739 | ||||||
|
Employee transactions(2) |
— | — | N/A | ||||||||
|
March 2010 |
|||||||||||
|
Open market repurchases(1) |
— | $ | — | $ | 6,739 | ||||||
|
Employee transactions(2) |
1.7 | 3.97 | N/A | ||||||||
|
First quarter 2010 |
|||||||||||
|
Open market repurchases(1) |
— | $ | — | $ | 6,739 | ||||||
|
Employee transactions(2) |
12.5 | 3.57 | N/A | ||||||||
|
Total first quarter 2010 |
12.5 | $ | 3.57 | $ | 6,739 | ||||||
- (1)
-
Open
market repurchases would be transacted under an existing authorized share repurchase plan. Since 2000, the Board of Directors has authorized the
repurchase of shares in the aggregate amount of $40 billion under Citi's existing share repurchase plan.
- (2)
- Consists of shares added to treasury stock related to activity on employee stock option program exercises, where the employee delivers existing shares to cover the option exercise, or under Citi's employee restricted or deferred stock program, where shares are withheld to satisfy tax requirements.
N/A Not applicable
Generally, for so long as the U.S. government holds any Citigroup common stock or trust preferred securities, Citigroup has agreed not to acquire, repurchase or redeem any Citigroup equity or trust preferred securities, other than pursuant to administrating its employee benefit plans or other customary exceptions, or with the consent of the U.S. government.
178
See Exhibit Index.
179
Pursuant to the requirements of the Securities Exchange Act of 1934, the Registrant has duly caused this report to be signed on its behalf by the undersigned, thereunto duly authorized, on the 7th day of May, 2010.
|
|
|
CITIGROUP INC. (Registrant) |
||
|
|
|
By |
|
/s/ JOHN C. GERSPACH John C. Gerspach Chief Financial Officer (Principal Financial Officer) |
|
|
|
By |
|
/s/ JEFFREY R. WALSH Jeffrey R. Walsh Controller and Chief Accounting Officer (Principal Accounting Officer) |
180
| 2.01 | Amended and Restated Joint Venture Contribution and Formation Agreement, dated May 29, 2009, by and among Citigroup Inc. (the Company), Morgan Stanley and Morgan Stanley Smith Barney Holdings LLC, incorporated by reference to Exhibit 10.1 to the Company's Current Report on Form 8-K filed June 3, 2009 (File No. 1-9924). | ||
|
|
2.02 |
|
Share Purchase Agreement, dated May 1, 2009, by and among Nikko Citi Holdings Inc., Nikko Cordial Securities Inc., Nikko Citi Business Services Inc., Nikko Citigroup Limited, and Sumitomo Mitsui Banking Corporation, incorporated by reference to Exhibit 2.02 to the Company's Quarterly Report on Form 10-Q for the fiscal quarter ended June 30, 2009 (File No. 1-9924). |
|
|
2.03 |
|
Share Purchase Agreement, dated July 11, 2008, by and between Citigroup Global Markets Finance Corporation & Co. Beschrankt Haftende KG, CM Akquisitions GmbH, and Banque Federative du Credit Mutuel S.A., incorporated by reference to Exhibit 2.01 to the Company's Quarterly Report on Form 10-Q for the fiscal quarter ended September 30, 2008 (File No. 1-9924). |
|
|
3.01 |
|
Restated Certificate of Incorporation of the Company, incorporated by reference to Exhibit 3.01 to the Company's Quarterly Report on Form 10-Q for the fiscal quarter ended September 30, 2009 (File No. 1-9924). |
|
|
3.02 |
|
By-Laws of the Company, as amended, effective December 15, 2009, incorporated by reference to Exhibit 3.1 to the Company's Current Report on Form 8-K filed December 16, 2009 (File No. 1-9924). |
|
|
4.01 |
|
Warrant, dated October 28, 2008, issued by the Company to the United States Department of the Treasury (the UST), incorporated by reference to Exhibit 4.1 to the Company's Current Report on Form 8-K filed October 30, 2008 (File No. 1-9924). |
|
|
4.02 |
|
Warrant, dated December 31, 2008, issued by the Company to the UST, incorporated by reference to Exhibit 4.1 to the Company's Current Report on Form 8-K filed December 31, 2008 (File No. 1-9924). |
|
|
4.03 |
|
Warrant, dated January 15, 2009, issued by the Company to the UST, incorporated by reference to Exhibit 4.1 to the Company's Current Report on Form 8-K filed January 16, 2009 (File No. 1-9924). |
|
|
4.04 |
|
Tax Benefits Preservation Plan, dated June 9, 2009, between the Company and Computershare Trust Company, N.A., incorporated by reference to Exhibit 4.1 to the Company's Current Report on Form 8-K filed June 10, 2009 (File No. 1-9924). |
|
|
4.05 |
|
Capital Securities Guarantee Agreement, dated as of July 30, 2009, between the Company, as Guarantor, and The Bank of New York Mellon, as Guarantee Trustee, incorporated by reference to Exhibit 4.03 to the Company's Current Report on Form 8-K filed July 30, 2009 (File No. 1-9924). |
|
|
10.01 |
|
Equity Distribution Agreement, dated April 26, 2010, among the Company, the UST and Morgan Stanley & Co. Incorporated, incorporated by reference to Exhibit 10.1 to the Company's Current Report on Form 8-K filed April 26, 2010 (File No. 1-9924). |
|
|
10.02 |
|
Citigroup 2009 Stock Incentive Plan (as amended and restated effective April 20, 2010), incorporated by reference to Exhibit 4.1 to the Company's Registration Statement on Form S-8 filed April 22, 2010 (No. 333-166242). |
|
|
10.03 |
+ |
Letter Agreement, dated April 5, 2010, between the Company and Dr. Robert L. Joss. |
|
|
10.04 |
+ |
Contract of Employment, dated March 23, 2010, between the Company and Alberto Verme. |
|
|
10.05 |
+ |
Employment Letter, dated March 22, 2010, between the Company and Alberto Verme. |
|
|
10.06 |
+ |
Citigroup Inc. Deferred Cash Award Plan (as Amended and Restated Effective as of January 1, 2010). |
|
|
10.07 |
+ |
Individual Employment Contract, dated November 8, 1971, between Banco Nacional de Mexico, S.A. and Manuel Medina-Mora (English translation). |
|
|
12.01 |
+ |
Calculation of Ratio of Income to Fixed Charges. |
|
|
|
|
|
181
| 12.02 | + | Calculation of Ratio of Income to Fixed Charges (including preferred stock dividends). | |
|
|
31.01 |
+ |
Certification of principal executive officer pursuant to Section 302 of the Sarbanes-Oxley Act of 2002. |
|
|
31.02 |
+ |
Certification of principal financial officer pursuant to Section 302 of the Sarbanes-Oxley Act of 2002. |
|
|
32.01 |
+ |
Certification pursuant to 18 U.S.C. Section 1350, as adopted pursuant to Section 906 of the Sarbanes-Oxley Act of 2002. |
|
|
101.01 |
+ |
Financial statements from the Quarterly Report on Form 10-Q of Citigroup Inc. for the quarter ended March 31, 2010, filed on May 7, 2010, formatted in XBRL: (i) the Consolidated Statement of Income, (ii) the Consolidated Balance Sheet, (iii) the Consolidated Statement of Changes in Equity, (iv) the Consolidated Statement of Cash Flows and (v) the Notes to Consolidated Financial Statements tagged as blocks of text. |
The total amount of securities authorized pursuant to any instrument defining rights of holders of long-term debt of the Company does not exceed 10% of the total assets of the Company and its consolidated subsidiaries. The Company will furnish copies of any such instrument to the Securities and Exchange Commission upon request.
- +
-
Filed
herewith
182