CAMDEN NATIONAL CORP
10-Ks and 10-Qs
|
|
|
|
|
|
|
|
|
|
|
|
|
|
|
|
|
|
|
|
|
|
|
|
|
|
|
|
|
|
|
|
|
|
|
|
|
|
|
|
|
|
|
|
|
|
|
|
|
|
|
|
|
|
|
|
|
|
|
UNITED STATES
SECURITIES AND EXCHANGE COMMISSION
Washington, D.C. 20549
FORM 10-K
|
x
|
ANNUAL REPORT PURSUANT TO SECTION 13 OR 15(d)
OF THE SECURITIES EXCHANGE ACT OF 1934
|
|
For the Fiscal Year Ended December 31, 2013
|
o
|
TRANSITION REPORT PURSUANT TO SECTION 13 OR 15(d)
OF THE SECURITIES EXCHANGE ACT OF 1934
|
|
Commission File No. 0-28190
CAMDEN NATIONAL CORPORATION
(Exact Name of Registrant As Specified in Its Charter)
|
Maine
|
|
01-0413282
|
|
(State or Other Jurisdiction of
Incorporation or Organization)
|
|
(I.R.S. Employer
Identification No.)
|
|
2 Elm Street, Camden, ME
|
04843
|
|
|
(Address of Principal Executive Offices)
|
(Zip Code)
|
|
Registrant’s Telephone Number, Including Area Code:
(207) 236-8821
Securities registered pursuant to Section 12(b) of the Act:
|
Title of Each Class
|
Name of Exchange on Which Registered
|
|
|
Common Stock, without par value
|
The NASDAQ Stock Market LLC
|
|
Securities registered pursuant to Section 12(g) of the Act:
None
Indicate by check mark if the registrant is a well-known seasoned issuer, as defined in Rule 405 of the Securities Act. Yes
o
No
x
Indicate by check mark if the registrant is not required to file reports pursuant to Section 13 or Section 15(d) of the Act. Yes
o
No
x
Indicate by check mark whether the registrant (1) has filed all reports required to be filed by Section 13 or 15(d) of the Securities Exchange Act of 1934 during the preceding 12 months (or for such shorter periods that the registrant was required to file such reports), and (2) has been subject to such filing requirements for the past 90 days. Yes
x
No
o
Indicate by check mark whether the registrant has submitted electronically and posted on its corporate Website, if any, every Interactive Data File required to be submitted and posted pursuant to Rule 405 of Regulation S-T during the preceding 12 months (or for such shorter period that the registrant was required to submit and post such files). Yes
x
No
o
Indicate by check mark if disclosure of delinquent filers pursuant to Item 405 of Regulation S-K is not contained herein, and will not be contained, to the best of registrant’s knowledge, in definitive proxy or information statements incorporated by reference in Part III of this Form 10-K or any amendment to this Form 10-K.
o
Indicate by check mark whether the registrant is a large accelerated filer, an accelerated filer, a non-accelerated filer or a smaller reporting company. See definitions of “large accelerated filer,” “accelerated filer” and “smaller reporting company” in Rule 12b-2 of the Exchange Act. (Check one):
|
Large accelerated filer
o
|
|
Accelerated filer
x
|
|
Non-accelerated filer
o
|
|
Smaller reporting company
o
|
|
|
|
|
|
(Do not check if a smaller reporting company)
|
|
|
Indicate by check mark whether the registrant is a shell company (as defined in Rule 12b-2 of the Exchange Act). Yes
o
No
x
The aggregate market value of the voting and non-voting common equity held by non-affiliates computed by reference to the price at which the common equity was last sold, or the average bid and asked price of such common equity, as of the last business day of the Registrant’s most recently completed second fiscal quarter: $235,031,598. Shares of the Registrant’s common stock held by each executive officer, director and person who beneficially owns 5% or more of the Registrant’s outstanding common stock have been excluded, in that such persons may be deemed to be affiliates. This determination of affiliate status is not necessarily a conclusive determination for other purposes.
The number of shares outstanding of each of the registrant’s classes of common stock, as of March 3, 2014, is 7,509,789.
Certain information required in response to Items 10, 11, 12, 13 and 14 of Part III of this Form 10-K is incorporated by reference from Camden National Corporation’s Definitive Proxy Statement for the 2014 Annual Meeting of Shareholders pursuant to Regulation 14A of the General Rules and Regulations of the Commission.
CAMDEN NATIONAL CORPORATION
2013 FORM 10-K ANNUAL REPORT
TABLE OF CONTENTS
|
Page
|
||
|
PART I
|
||
|
PART II
|
||
|
PART III
|
||
|
PART IV
|
||
i
FORWARD-LOOKING STATEMENTS
The discussions set forth below and in the documents we incorporate by reference herein contain certain statements that may be considered forward-looking statements under the Private Securities Litigation Reform Act of 1995, including certain plans, exceptions, goals, projections, and statements, which are subject to numerous risks, assumptions, and uncertainties. Forward-looking statements can be identified by the use of the words “believe,” “expect,” “anticipate,” “intend,” “estimate,” “assume,” “plan,” “target,” “goal” or future or conditional verbs such as “will,” “may,” “might,” “should,” “could” and other expressions which predict or indicate future events or trends and which do not relate to historical matters. Forward-looking statements should not be relied on, because they involve known and unknown risks, uncertainties and other factors, some of which are beyond the control of the Company. These risks, uncertainties and other factors may cause the actual results, performance or achievements of the Company to be materially different from the anticipated future results, performance or achievements expressed or implied by the forward-looking statements.
The following factors, among others, could cause the Company’s financial performance to differ materially from the Company’s goals, plans, objectives, intentions, expectations and other forward-looking statements:
|
•
|
continued weakness in the United States economy in general and the regional and local economies within the New England region and Maine, which could result in a deterioration of credit quality, an increase in the allowance for loan losses, or a reduced demand for the Company’s credit or fee-based products and services;
|
|
•
|
adverse changes in the local real estate market could result in a deterioration of credit quality and an increase in the allowance for loan loss, as most of the Company’s loans are concentrated in Maine, and a substantial portion of these loans have real estate as collateral;
|
|
•
|
changes in trade, monetary and fiscal policies and laws, including the interest rate policies of the Board of Governors of the Federal Reserve System;
|
|
•
|
inflation, interest rate, market and monetary fluctuations;
|
|
•
|
competitive pressures, including continued industry consolidation and the increased financial services provided by non-banks;
|
|
•
|
volatility in the securities markets that could adversely affect the value or credit quality of the Company’s assets, impairment of goodwill, the availability and terms of funding necessary to meet the Company’s liquidity needs, and could lead to impairment in the value of securities in the Company's investment portfolio;
|
|
•
|
changes in information technology that require increased capital spending;
|
|
•
|
changes in consumer spending and savings habits;
|
|
•
|
new laws and regulations regarding the financial services industry including but not limited to, the implementation of the Dodd-Frank Wall Street Reform & Consumer Protection Act and Basel III capital rules;
|
|
•
|
changes in laws and regulations including laws and regulations concerning taxes, banking, securities and insurance; and
|
|
•
|
changes in accounting policies, practices and standards, as may be adopted by the regulatory agencies as well as the Financial Accounting Standards Board ("FASB") and other accounting standards setters.
|
You should carefully review all of these factors, and be aware that there may be other factors that could cause differences, including the risk factors listed in Part I, Item 1A, “Risk Factors,” beginning on page
11
. Readers should carefully review the risk factors described therein and should not place undue reliance on our forward-looking statements.
These forward-looking statements were based on information, plans and estimates at the date of this report, and we do not promise to update any forward-looking statements to reflect changes in underlying assumptions or factors, new information, future events or other changes.
1
Overview
. Camden National Corporation (hereafter referred to as “we,” “our,” “us,” or the “Company”) is a publicly-held bank holding company, with $2.6 billion in assets and 44 branches at December 31, 2013, incorporated under the laws of the State of Maine and headquartered in Camden, Maine. The Company, as a diversified financial services provider, pursues the objective of achieving long-term sustainable growth by balancing growth opportunities against profit, while mitigating risks inherent in the financial services industry. The primary business of the Company and its subsidiaries is to attract deposits from, and to extend loans to, consumer, institutional, municipal, non-profit and commercial customers. The Company offers commercial and consumer banking products and services through its subsidiary, Camden National Bank (the “Bank”), and brokerage and insurance services through Camden Financial Consultants (“Camden Financial”), a division of the Bank. The Company also offers investment management and fiduciary services through its subsidiary, Acadia Trust, N.A. (“Acadia Trust”), a federally-regulated, non-depository trust company headquartered in Portland, Maine. In addition to serving as a holding company, the Company provides managerial, operational, human resource, marketing, financial management, risk management and technology services to its subsidiaries. The consolidated financial statements of the Company accompanying this Form 10-K include the accounts of the Company, the Bank and its divisions, and Acadia Trust. All inter-company accounts and transactions have been eliminated in consolidation.
The Company is committed to the philosophy of serving the financial needs of customers in local communities, as described in its core purpose:
Through each interaction, we will enrich the lives of people, help businesses succeed and vitalize communities.
The Company has achieved a five-year compounded annual asset growth rate of 2%, resulting in $2.6 billion in total assets at December 31, 2013. The primary factors contributing to our net asset growth are: (i) the acquisition of 14 branches, including $287.6 million in deposits and $5.7 million in small business loans, from Bank of America, National Association, in October 2012, partially offset by (ii) the divestiture of our five Franklin County branches, including $46.0 million in loans and $85.9 million in deposits and borrowings, in October 2013. The financial services industry continues to experience consolidations through mergers that could create opportunities for the Company to promote its value proposition to customers. The Company evaluates the possibility of expansion into new markets through both de novo expansion and acquisitions. In addition, the Company is focused on maximizing the potential for growth in existing markets, especially in markets where the Company has less of a presence. Further information on the Company's financial information can be found within the consolidated financial statements found within Item 8 of this report.
Camden National Bank
. The Bank is a national banking association chartered under the laws of the United States headquartered in Camden, Maine. Originally founded in 1875, the Bank became a direct, wholly-owned subsidiary of the Company as a result of a corporate reorganization in 1985. The Bank offers its products and services in the Maine counties of Androscoggin, Cumberland, Hancock, Kennebec, Knox, Lincoln, Penobscot, Piscataquis, Somerset, Waldo, Washington, and York, and focuses primarily on attracting deposits from the general public through its branches, and then using such deposits to originate residential mortgage loans, commercial business loans, commercial real estate loans and a variety of consumer loans. Customers may also access the Bank’s products and services using other channels, including the Bank’s website located at
www.camdennational.com.
Camden Financial Consultants, located at Camden National Bank
. Camden Financial is a full-service brokerage and insurance division of the Bank in the business of helping clients meet all of their financial needs by using a total wealth management approach. Its financial offerings include college, retirement, and estate planning, mutual funds, strategic asset management accounts, and variable and fixed annuities.
Acadia Trust, N.A.
Acadia Trust is a limited purpose national banking association chartered under the laws of the United States headquartered in Portland, Maine. Acadia Trust provides a broad range of trust, trust-related, investment and wealth management services to both individual and institutional clients. The financial services provided by Acadia Trust complement the services provided by the Bank by offering customers investment management services. Acadia Trust’s website is located at
www.acadiatrust.com.
2
The Company’s Investor Relations information can be obtained through the Bank’s internet address,
www.camdennational.com
. The Company makes available on or through its Investor Relations page, without charge, its annual reports on Form 10-K, quarterly reports on Form 10-Q, and current reports on Form 8-K and amendments to those reports filed or furnished pursuant to Section 13(a) or 15(d) of the Securities Exchange Act of 1934, as amended, as soon as reasonably practicable after such reports are electronically filed with, or furnished to, the SEC. The Company’s reports filed with, or furnished to, the SEC are also available at the SEC’s website at
www.sec.gov
. In addition, the Company makes available, free of charge, its press releases and Code of Ethics through the Company’s Investor Relations page. Information on our website is not incorporated by reference into this document and should not be considered part of this Report.
Competition
. Through the Bank and its division, Camden Financial, the Company competes throughout Maine, and considers its primary market area to be in Knox, Hancock, Waldo, Penobscot, Androscoggin, Kennebec, Somerset, and Piscataquis counties, with a growing presence in Cumberland, Kennebec, Lincoln and York counties. The combined population of Knox and Waldo counties is approximately 79,000 people and their economies are based primarily on tourism, healthcare, and marine related industries and supported by a substantial population of retirees. The counties with the highest population levels within our primary market area are Penobscot County with approximately 154,000 people, Kennebec County with approximately 122,000 people, and Androscoggin County with approximately 108,000 people. The Bank operates throughout various Maine markets that are characterized as rural areas. Major competitors in the Company’s primary market area include local branches of large regional bank affiliates and brokerage houses, as well as local independent banks, financial advisors, thrift institutions and credit unions. Other competitors for deposits and loans within the Bank’s primary market area include insurance companies, money market funds, consumer finance companies and financing affiliates of consumer durable goods manufacturers.
The Company and the Bank generally have effectively competed with other financial institutions by emphasizing customer service, which is branded as the Camden National Experience, highlighted by local decision-making, establishing long-term customer relationships, building customer loyalty and providing products and services designed to meet the needs of customers. The Company, through its non-bank subsidiary, Acadia Trust, competes for trust, trust-related, investment management, retirement and pension plan management services with local banks and non-banks, which may now, or in the future, offer a similar range of services, as well as with a number of brokerage firms and investment advisors with offices in the Company’s market area. In addition, most of these services are widely available to the Company’s customers by telephone and over the internet through firms located outside the Company’s market area.
Employees
. The Company employs 481 people on a full- or part-time basis as of December 31, 2013.
Supervision and Regulation
The following discussion addresses elements of the regulatory framework applicable to bank holding companies and their subsidiaries. This regulatory framework is intended primarily for the protection of the safety and soundness of depository institutions, the federal deposit insurance system, and depositors, rather than the protection of shareholders of a bank holding company such as the Company.
As a bank holding company, the Company is subject to regulation, supervision and examination by the Board of Governors of the Federal Reserve System (the “FRB”) under the Bank Holding Company Act of 1956, as amended (the “BHCA”). The Bank is subject to regulation, supervision and examination by the Office of the Comptroller of the Currency (the “OCC”). Acadia Trust is subject to regulation, supervision and examination by the OCC. As a limited purpose national bank, Acadia Trust does not take deposits or make loans.
The following is a summary of certain aspects of various statutes and regulations applicable to the Company and its subsidiaries. This summary is not a comprehensive analysis of all applicable law, however, and you should refer to the applicable statutes and regulations for more information.
3
The Dodd-Frank Act
. The Dodd-Frank Wall Street Reform and Consumer Protection Act (the “Dodd- Frank Act”), enacted on July 21, 2010, comprehensively reformed the regulation of financial institutions, products and services. Among other things, the Dodd-Frank Act:
|
•
|
granted the FRB increased supervisory authority and codified the source of strength doctrine, as discussed in more detail in “— Regulation of the Company — Source of Strength” below;
|
|
•
|
provided for new capital standards applicable to the Company, as discussed in more detail in “— Capital Adequacy and Safety and Soundness — Regulatory Capital Requirements” below;
|
|
•
|
modified the scope and costs associated with deposit insurance coverage, as discussed in “— Regulation of the Bank — Deposit Insurance” below;
|
|
•
|
permitted well capitalized and well managed banks to acquire other banks in any state, subject to certain deposit concentration limits and other conditions, as discussed in “— Regulation of the Bank — Acquisitions and Branching” below;
|
|
•
|
permitted the payment of interest on business demand deposit accounts;
|
|
•
|
established the Bureau of Consumer Financial Protection (the “CFPB”);
|
|
•
|
established new minimum mortgage underwriting standards for residential mortgages, as discussed in “— Consumer Protection Regulation — Mortgage Reform” below;
|
|
•
|
barred banking organizations, such as the Company, from engaging in proprietary trading and from sponsoring and investing in hedge funds and private equity funds, except as permitted under certain circumstances, as discussed in “— Regulation of Other Activities — Volcker Rule Restrictions on Proprietary Trading and Sponsorship of Hedge Funds and Private Equity Funds” below; and
|
|
•
|
established the Financial Stability Oversight Council to designate certain activities as posing a risk to the United States ("U.S.") financial system and recommended new or heightened standards and safeguards for financial institutions engaging in such activities.
|
Regulation of the Company
The Company is subject to regulation, supervision and examination by the FRB, which has the authority, among other things, to order bank holding companies to cease and desist from unsafe or unsound banking practices; to assess civil money penalties; and to order termination of non-banking activities or termination of ownership and control of a non-banking subsidiary by a bank holding company.
Source of Strength
. Under the BHCA and the Dodd-Frank Act, the Company is required to serve as a source of financial strength for the Bank. This support may be required at times when the bank holding company may not have the resources to provide support to the Bank. In the event of a bank holding company’s bankruptcy, any commitment by the bank holding company to a federal bank regulatory agency to maintain the capital of a bank subsidiary will be assumed by the bankruptcy trustee and entitled to a priority of payment. In addition, any loans by a bank holding company to any of its bank subsidiaries are subordinate to the payment of deposits and to certain other indebtedness.
Acquisitions and Activities
. The BHCA prohibits a bank holding company from acquiring substantially all the assets of a bank or acquiring direct or indirect ownership or control of more than 5% of the voting shares of any bank or bank holding company without prior approval of the FRB. The BHCA also prohibits a bank holding company from engaging directly or indirectly in activities other than those of banking, managing or controlling banks or furnishing services to its subsidiary banks. However, a bank holding company may engage in and may own shares of companies engaged in certain activities that the FRB determines to be so closely related to banking or managing and controlling banks so as to be a proper incident thereto.
Limitations on Acquisitions of Company Common Stock
. The Change in Bank Control Act prohibits a person or group of persons from acquiring “control” of a bank holding company unless the FRB has been notified and has not objected to the transaction. Under a rebuttable presumption established by the FRB, the acquisition of 10% or more of a class of voting securities of a bank holding company with a class of securities registered under Section 12 of the Exchange Act would, under the circumstances set forth in the presumption, constitute acquisition of control of the BHC. In addition, a company is required to obtain the approval of the FRB under the BHCA before acquiring 25% (5% in the case of an acquirer that is a bank holding company) or more, or otherwise obtaining control or a “controlling influence,” over that bank holding company. In 2008, the FRB released guidance on minority investments in banks that relaxed the presumption of control for investments of greater than 10% of a class of outstanding voting securities of a bank holding company in certain instances.
4
Regulation of the Bank
The Bank is subject to regulation, supervision, and examination by the OCC. Additionally, the Federal Deposit Insurance Corporation (the “FDIC”) has secondary supervisory authority as the insurer of the Bank’s deposits. Pursuant to the Dodd-Frank Act, the FRB may directly examine the subsidiaries of the Company, including the Bank. The enforcement powers available to the federal banking regulators include, among other things, the ability to issue cease and desist or removal orders to terminate insurance of deposits; to assess civil money penalties; to issue directives to increase capital; to place the Bank into receivership; and to initiate injunctive actions against banking organizations and institution-affiliated parties.
Deposit Insurance
. Substantially all of the deposits of the Bank are insured up to applicable limits by the FDIC's Deposit Insurance Fund ("DIF") and are subject to deposit insurance assessment to maintain the DIF. The Federal Deposit Insurance Act ("FDIA"), as amended by the Federal Deposit Insurance Reform Act and the Dodd-Frank Act, requires the FDIC to set a ratio of deposit insurance reserves to estimated insured deposits of 1.35%. The FDIC utilizes a risk-based assessment system that imposes insurance premiums based upon a risk matrix that takes into account a bank's capital level and supervisory rating ("CAMELS rating"). CAMELS ratings reflect the applicable bank regulatory agency’s evaluation of the financial institution’s capital, asset quality, management, earnings, liquidity and sensitivity to risk. Assessment rates may also vary for certain institutions based on long-term debt issuer ratings, or secured or brokered deposits. Pursuant to the Dodd-Frank Act, deposit premiums are based on assets rather than insurable deposits. To determine its actual deposit insurance premiums, the Bank computes the base amount on its average consolidated assets less its average tangible equity (defined as the amount of Tier I capital) and the applicable assessment rate. The FDIC has the power to adjust deposit insurance assessment rates at any time. For 2013, the aggregate FDIC insurance expense for the Bank was $1.5 million.
The Dodd-Frank Act permanently increased the FDIC deposit insurance limit to $250,000 per depositor. On December 31, 2012, the temporary unlimited deposit insurance coverage for noninterest-bearing transactions accounts under the Dodd-Frank Act expired.
Under the FDIA, the FDIC may terminate deposit insurance upon a finding that the institution has engaged in unsafe and unsound practices, is in an unsafe or unsound condition to continue operations, or has violated any applicable law, regulation, rule, order or condition imposed by the FDIC.
Acquisitions and Branching
. The Bank must seek prior regulatory approval from the OCC to acquire another bank or establish a new branch office. Well capitalized and well managed banks may acquire other banks in any state, subject to certain deposit concentration limits and other conditions, pursuant to the Riegle-Neal Interstate Banking and Branching Efficiency Act of 1994 and the Dodd-Frank Act. In addition, the Dodd-Frank Act authorizes a state-chartered bank to establish new branches on an interstate basis to the same extent a bank chartered by the host state may establish branches.
Activities and Investments of National Banking Associations
. National banking associations must comply with the National Bank Act and the regulations promulgated thereunder by the OCC, which limit the activities of national banking associations to those that are deemed to be part of, or incidental to, the “business of banking.” Activities that are part of, or incidental to, the business of banking include taking deposits, borrowing and lending money and discounting or negotiating promissory notes, drafts, bills of exchange, and other evidences of debt. Subsidiaries of national banking associations generally may only engage in activities permissible for the parent national bank. The Dodd-Frank Act bars the Bank from engaging in proprietary trading and from sponsoring and investing in hedge funds and private equity funds, except as permitted under certain limited circumstances.
Lending Restrictions
. Federal law limits a bank’s authority to extend credit to its directors, executive officers and 10% shareholders, as well as to entities controlled by such persons. Among other things, extensions of credit to insiders are required to be made on terms that are substantially the same as, and follow credit underwriting procedures that are not less stringent than, those prevailing for comparable transactions with unaffiliated persons. Also, the terms of such extensions of credit may not involve more than the normal risk of repayment or present other unfavorable features and may not exceed certain limitations on the amount of credit extended to such persons, individually and in the aggregate, which limits are based, in part, on the amount of the bank’s capital. The Dodd-Frank Act explicitly provides that an extension of credit to an insider includes credit exposure arising from a derivatives transaction, repurchase agreement, reverse repurchase agreement, securities lending transaction or securities borrowing transaction. Additionally, the Dodd-Frank Act requires that asset sale transactions with insiders must be on market terms, and if the transaction represents more than 10% of the capital and surplus of the Bank, be approved by a majority of the disinterested directors of the Bank.
5
Brokered Deposits
. Section 29 of the FDIA and FDIC regulations generally limit the ability of an insured depository institution to accept, renew or roll over any brokered deposit unless the institution’s capital category is “well capitalized” or, with the FDIC’s approval, “adequately capitalized.” Depository institutions, other than those in the lowest risk category, that have brokered deposits in excess of 10% of total deposits will be subject to increased FDIC deposit insurance premium assessments. Additionally, depository institutions considered “adequately capitalized” that need FDIC approval to accept, renew or roll over any brokered deposits are subject to additional restrictions on the interest rate they may pay on deposits.
Community Reinvestment Act
. The Community Reinvestment Act (“CRA”) requires the OCC to evaluate the Bank’s performance in helping to meet the credit needs of the entire communities it serves, including low and moderate income neighborhoods, consistent with its safe and sound banking operations, and to take this record into consideration when evaluating certain applications. The FDIC’s CRA regulations are generally based upon objective criteria of the performance of institutions under three key assessment tests: (i) a lending test, to evaluate the institution’s record of making loans in its service areas; (ii) an investment test, to evaluate the institution’s record of investing in community development projects, affordable housing, and programs benefiting low or moderate income individuals and businesses; and (iii) a service test, to evaluate the institution’s delivery of services through its branches, ATMs, and other offices. The Bank currently has an “outstanding” CRA rating.
Capital Adequacy and Safety and Soundness
Regulatory Capital Requirements.
The FRB and the OCC have issued substantially similar risk-based and leverage capital guidelines applicable to United States banking organizations. These guidelines are intended to reflect the relationship between the banking organization's capital and the degree of risk associated with its operations based on transactions recorded on-balance sheet as well as off-balance sheet items. In addition, these regulatory agencies may from time to time require that a banking organization maintain capital above the minimum levels, whether because of its financial condition or actual or anticipated growth.
Current FRB capital adequacy guidelines define a three-tier capital framework. Tier I capital for bank holding companies generally consists of the sum of common shareholders’ equity, perpetual preferred stock and trust preferred securities (both subject to certain limitations and, in the case of the latter, to specific limitations on the kind and amount of such securities that may be included as Tier I capital and certain additional restrictions described below), and minority interests in the equity accounts of consolidated subsidiaries, less goodwill and other non-qualifying intangible assets. Pursuant to the Dodd-Frank Act, trust preferred securities issued after May 19, 2010, will not count as Tier I capital. The Company's currently outstanding trust preferred securities were grandfathered for Tier I eligibility, subject to a limit of 25% of Tier I capital, under the Final Capital Rule discussed below. Tier II capital generally consists of hybrid capital instruments, perpetual debt and mandatory convertible debt securities, perpetual preferred stock and trust preferred securities (to the extent not eligible to be included as Tier I capital), term subordinated debt and intermediate-term preferred stock, and, subject to limitations, general allowances for loan losses. The sum of Tier I and Tier II capital less certain required deductions, such as investments in unconsolidated banking or finance subsidiaries, represents qualifying total capital. Risk-based capital ratios are calculated by dividing Tier I and total capital, respectively, by risk-weighted assets. Assets and off-balance sheet credit equivalents are assigned to one of four categories of risk-weights, based primarily on relative credit risk. The minimum Tier I risk-based capital ratio is 4% and the minimum total risk-based capital ratio is 8%. As of December 31, 2013, the Company's Tier I risk-based capital ratio was 15.20%, and its total risk-based capital ratio was 16.45%. The Company is currently considered "well capitalized" under all regulatory definitions.
In addition to the risk-based capital requirements, the FRB requires top-rated bank holding companies to maintain a minimum leverage capital ratio of Tier I capital (defined by reference to the risk-based capital guidelines) to its average total consolidated assets of at least 3.0%. For most other bank holding companies (including the Company), the minimum leverage capital ratio is 4.0%. Bank holding companies with supervisory, financial, operational or managerial weaknesses, as well as bank holding companies that are anticipating or experiencing significant growth, are expected to maintain capital ratios well above the minimum levels. The Company's leverage capital ratio as of December 31, 2013 was 9.43%.
The OCC has promulgated regulations to implement the system of prompt corrective action established by Section 38 of the FDIA. Under the regulations, a bank is “well capitalized” if it has: (1) a total risk-based capital ratio of 10.0% or greater; (2) a Tier I risk-based capital ratio of 6.0% or greater; (3) a leverage ratio of 5.0% or greater; and (4) is not subject to any written agreement, order, capital directive or prompt corrective action directive to meet and maintain a specific capital level for any capital measure. A bank is “adequately capitalized” if it has: (1) a total risk-based capital ratio of 8.0% or greater; (2) a Tier I risk-based capital ratio of 4.0% or greater; and (3) a leverage ratio of 4.0% or greater (3.0% under certain circumstances) and does not meet the definition of a “well capitalized bank.” The OCC also must take into consideration: (1) concentrations of credit risk; (2) interest rate risk; and (3) risks from non-traditional activities, as well as an institution’s ability to manage those
6
risks, when determining the adequacy of an institution’s capital. This evaluation will be made as a part of the institution’s regular safety and soundness examination.
At December 31, 2013, the Bank was deemed to be a “well capitalized” institution for the above purposes. Information concerning the Company and the Bank with respect to capital requirements is incorporated by reference from Item 7. Management’s Discussion and Analysis of Financial Condition and Results of Operations, in the section entitled “Capital Resources,” and Item 8. Financial Statements and Supplementary Data, in the section entitled “Note 19, Regulatory Capital Requirements.”
Generally, a bank, upon receiving notice that it is “undercapitalized”, becomes subject to the prompt corrective action provisions of Section 38 of the FDIA that, for example, (i) restrict payment of capital distributions and management fees, (ii) require that the OCC monitor the condition of the institution and its efforts to restore its capital, (iii) require submission of a capital restoration plan, (iv) restrict the growth of the institution’s assets and (v) require prior regulatory approval of certain expansion proposals. A bank that is required to submit a capital restoration plan must concurrently submit a performance guarantee by each company that controls the bank. A bank that is “critically undercapitalized” has a ratio of tangible equity to total assets that is equal to or less than 2.0%, will be subject to further restrictions, and generally will be placed in conservatorship or receivership within 90 days.
The Basel Committee on Banking Supervision has also released new capital requirements, known as Basel III, setting forth higher capital requirements, enhanced risk coverage, a global leverage ratio, provisions for counter-cyclical capital, and liquidity standards. On July 2, 2013, the FRB, along with the other federal banking agencies, issued a final rule (the “Final Capital Rule”) implementing the Basel III capital standards and establishing the minimum capital requirements for banks and bank holding companies required under the Dodd-Frank Act. The majority of the provisions of the Final Capital Rule apply to bank holding companies and banks with consolidated assets of $500 million or more, such as the Company and the Bank. The Final Capital Rule establishes a new capital risk-based capital ratio, a minimum common equity Tier I capital ratio of 6.5% of risk-weighted assets to be a “well capitalized” institution, and increase the minimum total Tier I capital ratio to be a “well capitalized" institution from 6.0% to 8.0%. The Final Capital Rule also requires that an institution establish a capital conservation buffer of common equity Tier I capital in an amount above the minimum risk-based capital requirements for “adequately capitalized” institutions equal to 2.5% of total risk weight assets, or face restrictions on capital distributions and executive bonuses. The Final Capital Rule increases the required capital for certain categories of assets, including higher-risk construction real estate loans and certain exposures related to securitizations. Under the Final Capital Rule, the Company may make a one-time, permanent election to continue to exclude accumulated other comprehensive income from capital. If the Company does not make this election, unrealized gains and losses will be included in the calculation of its regulatory capital.
The Company must comply with the Final Capital Rule beginning on January 1, 2015.
Safety and Soundness Standards.
The FDIA requires the federal bank regulatory agencies to prescribe standards, by regulations or guidelines, relating to internal controls, information systems and internal audit systems, risk management, loan documentation, credit underwriting, interest rate risk exposure, asset growth, asset quality, earnings, stock valuation and compensation, fees and benefits, and such other operational and managerial standards as the agencies deem appropriate. Guidelines adopted by the federal bank regulatory agencies establish general standards relating to internal controls and information systems, internal audit systems, loan documentation, credit underwriting, interest rate exposure, asset growth and compensation, fees and benefits. In general, these guidelines require, among other things, appropriate systems and practices to identify and manage the risk and exposures specified in the guidelines. The guidelines prohibit excessive compensation as an unsafe and unsound practice and describe compensation as excessive when the amounts paid are unreasonable or disproportionate to the services performed by an executive officer, employee, director or principal stockholder. In addition, the federal banking agencies adopted regulations that authorize, but do not require, an agency to order an institution that has been given notice by an agency that it is not satisfying any of such safety and soundness standards to submit a compliance plan. If, after being so notified, an institution fails to submit an acceptable compliance plan or fails in any material respect to implement an acceptable compliance plan, the agency must issue an order directing action to correct the deficiency and may issue an order directing other actions of the types to which an undercapitalized institution is subject under the “prompt corrective action” provisions of the FDIA. See “— Regulatory Capital Requirements” above. If an institution fails to comply with such an order, the agency may seek to enforce such order in judicial proceedings and to impose civil money penalties.
7
Dividend Restrictions
The Company is a legal entity separate and distinct from its subsidiaries. The revenue of the Company (on a parent-only basis) is derived primarily from interest and dividends paid to it by the Bank. The right of the Company, and consequently the right of shareholders of the Company, to participate in any distribution of the assets or earnings of the Bank through the payment of such dividends or otherwise is necessarily subject to the prior claims of creditors of the Bank (including depositors), except to the extent that certain claims of the Company in a creditor capacity may be recognized.
Restrictions on Bank Holding Company Dividends.
The FRB has the authority to prohibit bank holding companies from paying dividends if such payment is deemed to be an unsafe or unsound practice. The FRB has indicated generally that it may be an unsafe or unsound practice for bank holding companies to pay dividends unless the bank holding company’s net income over the preceding year is sufficient to fund the dividends and the expected rate of earnings retention is consistent with the organization’s capital needs, asset quality and overall financial condition. Further, when the Final Capital Rule comes into effect, the Company’s ability to pay dividends would be restricted if it does not maintain a capital conservation buffer. See “— Capital Adequacy and Safety and Soundness — Regulatory Capital Requirements” above.
Under Maine law, a corporation’s board of directors may declare, and the corporation may pay, dividends on its outstanding shares, in cash or other property, generally only out of the corporation’s unreserved and unrestricted earned surplus, or out of the unreserved and unrestricted net earnings of the current fiscal year and the next preceding fiscal year taken as a single period, except under certain circumstances, including when the corporation is insolvent, or when the payment of the dividend would render the corporation insolvent or when the declaration would be contrary to the corporation’s charter.
Restrictions on Bank Dividends
. National banks generally may not declare a dividend in excess of the bank’s undivided profits and, absent OCC approval, if the total amount of dividends declared by the national bank in any calendar year exceeds the total of the national bank’s retained net income of that year to date combined with its retained net income for the preceding two years. National banks also are prohibited from declaring or paying any dividend if, after making the dividend, the national bank would be considered “undercapitalized” (as defined by reference to other OCC regulations). The OCC has the authority to use its enforcement powers to prohibit a national bank, such as the Bank, from paying dividends if, in its opinion, the payment of dividends would constitute an unsafe or unsound practice.
Certain Transactions by Bank Holding Companies with their Affiliates
There are various statutory restrictions on the extent to which bank holding companies and their non-bank subsidiaries may borrow, obtain credit from or otherwise engage in “covered transactions” with their insured depository institution subsidiaries. The Dodd-Frank Act amended the definition of affiliate to include an investment fund for which the depository institution or one of its affiliates is an investment adviser. An insured depository institution (and its subsidiaries) may not lend money to, or engage in covered transactions with, its non-depository institution affiliates if the aggregate amount of covered transactions outstanding involving the bank, plus the proposed transaction exceeds the following limits: (i) in the case of any one such affiliate, the aggregate amount of covered transactions of the insured depository institution and its subsidiaries cannot exceed 10% of the capital stock and surplus of the insured depository institution; and (ii) in the case of all affiliates, the aggregate amount of covered transactions of the insured depository institution and its subsidiaries cannot exceed 20% of the capital stock and surplus of the insured depository institution. For this purpose, “covered transactions” are defined by statute to include a loan or extension of credit to an affiliate, a purchase of or investment in securities issued by an affiliate, a purchase of assets from an affiliate unless exempted by the Federal Reserve, the acceptance of securities issued by an affiliate as collateral for a loan or extension of credit to any person or company, the issuance of a guarantee, acceptance or letter of credit on behalf of an affiliate, securities borrowing or lending transactions with an affiliate that creates a credit exposure to such affiliate, or a derivatives transaction with an affiliate that creates a credit exposure to such affiliate. Covered transactions are also subject to certain collateral security requirements. Covered transactions as well as other types of transactions between a bank and a bank holding company must be on market terms and not otherwise unduly favorable to the holding company or an affiliate of the holding company. Moreover, Section 106 of the BHCA provides that, to further competition, a bank holding company and its subsidiaries are prohibited from engaging in certain tying arrangements in connection with any extension of credit, lease or sale of property of any kind, or furnishing of any service.
8
Consumer Protection Regulation
The Company and the Bank are subject to federal and state laws designed to protect consumers and prohibit unfair or deceptive business practices. These laws include the Equal Credit Opportunity Act, the Fair Housing Act, the Home Ownership Protection Act, the Fair Credit Reporting Act, as amended by the Fair and Accurate Credit Transactions Act of 2003 (the “FACT Act”), the Gramm-Leach-Bliley Act of 1999 (the “GLBA”), Truth in Lending Act, the CRA, the Home Mortgage Disclosure Act, Real Estate Settlement Procedures Act, National Flood Insurance Act and various state law counterparts. These laws and regulations mandate certain disclosure requirements and regulate the manner in which financial institutions must interact with customers when taking deposits, making loans, collecting loans and providing other services. Further, the Dodd-Frank Act established the CFPB, which has the responsibility for making rules and regulations under the federal consumer protection laws relating to financial products and services. The CFPB also has a broad mandate to prohibit unfair or deceptive acts and practices and is specifically empowered to require certain disclosures to consumers and draft model disclosure forms. Failure to comply with consumer protection laws and regulations can subject financial institutions to enforcement actions, fines and other penalties. The OCC examines the Bank for compliance with CFPB rules and will enforce CFPB rules with respect to the Bank.
Mortgage Reform.
The Dodd-Frank Act prescribes certain standards that mortgage lenders must consider before making a residential mortgage loan, including verifying a borrower’s ability to repay such mortgage loan, and allows borrowers to assert violations of certain provisions of the Truth-in-Lending Act as a defense to foreclosure proceedings. Under the Dodd-Frank Act, prepayment penalties are prohibited for certain mortgage transactions and creditors are prohibited from financing insurance policies in connection with a residential mortgage loan or home equity line of credit. In addition, the Dodd-Frank Act prohibits mortgage originators from receiving compensation based on the terms of residential mortgage loans and generally limits the ability of a mortgage originator to be compensated by others if compensation is received from a consumer. The Dodd-Frank Act requires mortgage lenders to make additional disclosures prior to the extension of credit, in each billing statement and for negative amortization loans and hybrid adjustable rate mortgages.
Privacy and Customer Information Security
. The GLBA requires financial institutions to implement policies and procedures regarding the disclosure of nonpublic personal information about consumers to nonaffiliated third parties. In general, the Bank must provide its customers with an annual disclosure that explains its policies and procedures regarding the disclosure of such nonpublic personal information, and, except as otherwise required or permitted by law, the Bank is prohibited from disclosing such information except as provided in such policies and procedures. The GLBA also requires that the Bank develop, implement and maintain a comprehensive written information security program designed to ensure the security and confidentiality of customer information (as defined under GLBA), to protect against anticipated threats or hazards to the security or integrity of such information; and to protect against unauthorized access to or use of such information that could result in substantial harm or inconvenience to any customer. The Bank is also required to send a notice to customers whose “sensitive information” has been compromised if unauthorized use of this information is “reasonably possible.” A majority of states have enacted legislation concerning breaches of data security and Congress is considering federal legislation that would require consumer notice of data security breaches. Pursuant to the FACT Act, the Bank must also develop and implement a written identity theft prevention program to detect, prevent, and mitigate identity theft in connection with the opening of certain accounts or certain existing accounts. Additionally, the FACT Act amends the Fair Credit Reporting Act to generally prohibit a person from using information received from an affiliate to make a solicitation for marketing purposes to a consumer, unless the consumer is given notice and a reasonable opportunity and a reasonable and simple method to opt out of the making of such solicitations.
Anti-Money Laundering
The Bank Secrecy Act
. Under the Bank Secrecy Act (“BSA”), a financial institution, is required to have systems in place to detect certain transactions, based on the size and nature of the transaction. Financial institutions are generally required to report to the United States Treasury any cash transactions involving more than $10,000. In addition, financial institutions are required to file suspicious activity reports for transactions that involve more than $5,000 and which the financial institution knows, suspects or has reason to suspect involves illegal funds, is designed to evade the requirements of the BSA or has no lawful purpose. The Uniting and Strengthening America by Providing Appropriate Tools Required to Intercept and Obstruct Terrorism Act of 2001 (the “USA PATRIOT Act”), which amended the BSA, is designed to deny terrorists and others the ability to obtain anonymous access to the U.S. financial system. The USA PATRIOT Act has significant implications for financial institutions and businesses of other types involved in the transfer of money. The USA PATRIOT Act, together with the implementing regulations of various federal regulatory agencies, has caused financial institutions, such as the Bank, to adopt and implement additional policies or amend existing policies and procedures with respect to, among other things, anti-money laundering compliance, suspicious activity, currency transaction reporting, customer identity verification and customer risk analysis. In
9
evaluating an application under Section 3 of the BHCA to acquire a bank or an application under the Bank Merger Act to merge banks or affect a purchase of assets and assumption of deposits and other liabilities, the applicable federal banking regulator must consider the anti-money laundering compliance record of both the applicant and the target. In addition, under the USA PATRIOT Act financial institutions are required to take steps to monitor their correspondent banking and private banking relationships as well as, if applicable, their relationships with “shell banks.”
Office of Foreign Assets Control (“OFAC”)
. The United States has imposed economic sanctions that affect transactions with designated foreign countries, nationals and others. These sanctions, which are administered by OFAC, take many different forms. Generally, however, they contain one or more of the following elements: (i) restrictions on trade with or investment in a sanctioned country, including prohibitions against direct or indirect imports from and exports to a sanctioned country and prohibitions on “U.S. persons” engaging in financial transactions relating to making investments in, or providing investment-related advice or assistance to, a sanctioned country; and (ii) a blocking of assets in which the government or specially designated nationals of the sanctioned country have an interest, by prohibiting transfers of property subject to U.S. jurisdiction (including property in the possession or control of U.S. persons). Blocked assets (for example, property and bank deposits) cannot be paid out, withdrawn, set off or transferred in any manner without a license from OFAC. Failure to comply with these sanctions could have serious legal and reputational consequences for the Company.
Regulation of Other Activities
Volcker Rule Restrictions on Proprietary Trading and Sponsorship of Hedge Funds and Private Equity Funds
. The Dodd-Frank Act bars banking organizations, such as the Company and the Bank, from engaging in proprietary trading and from sponsoring and investing in hedge funds and private equity funds, except as permitted under certain circumstances, in a provision commonly referred to as the “Volcker Rule.” Under the Dodd-Frank Act, proprietary trading generally means trading by a banking entity or its affiliate for its own account. Hedge funds and private equity funds are described by the Dodd-Frank Act as funds that would be registered under the 1940 Act but for certain enumerated exemptions. The Volcker Rule restrictions apply to the Company, the Bank and all of their subsidiaries and affiliates.
Legal Contingencies
In the normal course of business, the Company and its subsidiaries are subject to pending and threatened legal actions. Although the Company is not able to predict the outcome of such actions, after reviewing pending and threatened actions with counsel, management believes that based on the information currently available the outcome of such actions, individually or in the aggregate, will not have a material adverse effect on the Company’s consolidated financial position as a whole.
Reserves are established for legal claims only when losses associated with the claims are judged to be probable, and the loss can be reasonably estimated. In many lawsuits and arbitrations, it is not possible to determine whether a liability has been incurred or to estimate the ultimate or minimum amount of that liability until the case is close to resolution, in which case a reserve will not be recognized until that time.
10
If our allowance for loan losses is not adequate to cover actual loan losses, our earnings could decrease.
We make various assumptions and judgments about the collectability of our loan portfolio and provide an allowance for probable loan losses based on a number of factors. On a monthly basis, management reviews the allowance for loan losses to assess recent asset quality trends and impact on the Company's financial condition. On a quarterly basis, the allowance for loan losses is brought before the Bank's board of directors for discussion, review, and approval. If the assumptions are incorrect, the allowance for loan losses may not be sufficient to cover the losses we could experience, which would have an adverse effect on operating results, and may also cause us to increase the allowance for loan losses in the future. In addition, bank regulators periodically review our allowance for loan losses and may require us to increase our provisions for credit losses or recognize further loan charge-offs. Any increase in our allowance for loan losses or loan charge-offs as required by regulatory authorities could have a material adverse effect on our consolidated results of operations and financial condition. If additional amounts are provided to the allowance for loan losses, our earnings could decrease.
Our loans are concentrated in certain areas of Maine and adverse conditions in those markets could adversely affect our operations.
We are exposed to real estate and economic factors throughout Maine, as virtually the entire loan portfolio is concentrated among borrowers in Maine, with higher concentrations of exposure in Cumberland, Hancock, Knox and Waldo counties. Further, because a substantial portion of the loan portfolio is secured by real estate in this area, the value of the associated collateral is also subject to regional real estate market conditions. Adverse economic, political or business developments or natural hazards may affect these areas and the ability of property owners in these areas to make payments of principal and interest on the underlying mortgages. If these regions experience adverse economic, political or business conditions, we would likely experience higher rates of loss and delinquency on these loans than if the loans were more geographically diverse.
We experience strong competition within our markets, which may impact our profitability.
Competition in the banking and financial services industry is strong. In our market areas, we compete for loans, deposits and other financial products and services with local independent banks, thrift institutions, savings institutions, mortgage brokerage firms, credit unions, finance companies, mutual funds, insurance companies and brokerage and investment banking firms operating locally as well as nationally. Many of these competitors have substantially greater resources and lending limits than those of our subsidiaries and may offer services that our subsidiaries do not or cannot provide. There is also increased competition by out-of-market competitors through the internet. Our long-term success depends on the ability of our subsidiaries to compete successfully with other financial institutions in their service areas. Because we maintain a smaller staff and have fewer financial and other resources than larger institutions with which we compete, we may be limited in our ability to attract customers. If we are unable to attract and retain customers, we may be unable to achieve growth in the loan and core deposit portfolios, and our results of operations and financial condition may be negatively impacted.
Interest rate volatility may reduce our profitability.
Our profitability depends to a large extent upon our net interest income, which is the difference between interest income on interest-earning assets, such as loans and investments, and interest expense related to interest-bearing liabilities, such as deposits and borrowed funds. Net interest income can be affected significantly by changes in market interest rates. In particular, changes in relative interest rates may reduce our net interest income as the difference between interest income and interest expense decreases. As a result, we have adopted asset and liability management policies to minimize the potential adverse effects of changes in interest rates on net interest income, primarily by altering the mix and maturity of loans, investments and funding sources. However, there can be no assurance that a change in interest rates will not negatively impact our results of operations or financial condition. Because market interest rates may change by differing magnitudes and at different times, significant changes in interest rates over an extended period of time could reduce overall net interest income. An increase in interest rates could also have a negative impact on our results of operations by reducing the ability of borrowers to repay their current loan obligations, which could not only result in increased loan defaults, foreclosures and write-offs, but also necessitate further increases to our allowance for loan losses.
11
Our cost of funds for banking operations may increase as a result of general economic conditions, interest rates and competitive pressures.
The Bank has traditionally obtained funds principally through deposits and borrowings. As a general matter, deposits are a less costly source of funds than borrowings because interest rates paid for deposits are typically less than interest rates charged for borrowings. If, as a result of general economic conditions, market interest rates, competitive pressures or otherwise, total deposits at the Bank decrease relative to our overall banking operations, we may have to rely more heavily on borrowings as a source of funds in the future.
We are subject to liquidity risk.
Liquidity risk is the risk of potential loss if we are unable to meet our funding requirements at a reasonable cost. Our liquidity could be impaired by an inability to access the capital markets or by unforeseen outflows of cash. This situation may arise due to circumstances that we may be unable to control, such as a general market disruption or an operational problem that affects third parties or us.
Prepayments of loans may negatively impact our business.
Generally, our customers may prepay the principal amount of their outstanding loans at any time. The speeds at which such prepayments occur, as well as the size of such prepayments, are within our customers’ discretion. If customers prepay the principal amount of their loans, and we are unable to lend those funds to other borrowers or invest the funds at the same or higher interest rates, our interest income will be reduced. A significant reduction in interest income could have a negative impact on our results of operations and financial condition.
Our banking business is highly regulated, and we may be adversely affected by changes in law and regulation.
We are subject to regulation and supervision by the FRB, and the Bank is subject to regulation and supervision by the OCC and the FDIC. Federal laws and regulations govern numerous matters affecting us, including changes in the ownership or control of banks and bank holding companies, maintenance of adequate capital and the financial condition of a financial institution, permissible types, amounts and terms of extensions of credit and investments, permissible nonbanking activities, the level of reserves against deposits and restrictions on dividend payments. The OCC possesses the power to issue cease and desist orders to prevent or remedy unsafe or unsound practices or violations of law by banks subject to their regulation, and the FRB possesses similar powers with respect to bank holding companies. These and other restrictions limit the manner in which we may conduct business and obtain financing.
Our banking business is also affected by the monetary policies of the FRB. Changes in monetary or legislative policies may affect the interest rates the Bank must offer to attract deposits and the interest rates it must charge on loans, as well as the manner in which it offers deposits and makes loans. These monetary policies have had, and are expected to continue to have, significant effects on the operating results of depository institutions generally, including the Bank.
Our business is highly regulated and the laws, rules, regulations, and supervisory guidance and policies applicable to us are subject to regular modification and change. It is impossible to predict the competitive impact that any such changes would have on the banking and financial services industry in general or on our business in particular. Such changes may, among other things, increase the cost of doing business, limit permissible activities, or affect the competitive balance between banks and other financial institutions. The Dodd-Frank Act instituted major changes to the banking and financial institutions regulatory regimes in light of the performance of and government intervention in the financial services sector. Other changes to statutes, regulations, or regulatory policies, including changes in interpretation or implementation of statutes, regulations, or policies, could affect us in substantial and unpredictable ways. Such changes could subject us to additional costs, limit the types of financial services and products we may offer, and/or increase the ability of non-banks to offer competing financial services and products, among other things. Failure to comply with laws, regulations, or policies could result in sanctions by regulatory agencies, civil money penalties, and/or reputation damage, which could have a material adverse effect on our business, financial condition, and results of operations. See Item 1. “Business — Supervision and Regulation.”
12
Additional requirements imposed by the Dodd-Frank Act could adversely affect us.
The Dodd-Frank Act comprehensively reformed the regulation of financial institutions, products and services. Because many aspects of the Dodd-Frank Act are subject to rulemaking that will take effect over several years, it is difficult to forecast the full impact that such rulemaking will have on us, our customers or the financial industry. Among other things, the Dodd-Frank Act established the CFPB as an independent bureau of the FRB. The CFPB has the authority to prescribe rules for all depository institutions governing the provision of consumer financial products and services, which may result in rules and regulations that reduce the profitability of such products and services or impose greater costs and restrictions on us and our subsidiaries. The Dodd-Frank Act also established new minimum mortgage underwriting standards for residential mortgages and the regulatory agencies have focused on the examination and supervision of mortgage lending and servicing activities.
Effective December 10, 2013, pursuant to the Dodd-Frank Act, federal banking and securities regulators issued final rules to implement Section 619 of the Dodd-Frank Act, also known as the “Volcker Rule.” Generally, the Volcker Rule restricts banking organizations and their affiliated companies from engaging in proprietary trading and from sponsoring and investing in hedge funds and private equity funds, except as permitted under certain limited circumstances. After the transition period, the Volcker Rule restrictions will apply to the Company, the Bank and all of our subsidiaries and affiliates, unless an exception applies. We are analyzing the impact of the Volcker Rule on our investment portfolio, and may make changes to our investment strategies that could negatively affect our earnings.
Current and future legal and regulatory requirements, restrictions, and regulations, including those imposed under the Dodd-Frank Act, may adversely impact our profitability and may have a material and adverse effect on our business, financial condition, and results of operations; may require us to invest significant management attention and resources to evaluate and make any changes required by the legislation and related regulations; and may make it more difficult for us to attract and retain qualified executive officers and employees.
We will become subject to more stringent capital requirements.
The Dodd-Frank Act required the federal banking agencies to establish minimum leverage and risk-based capital requirements for insured banks and their holding companies. The federal banking agencies issued a joint final rule (the “Final Capital Rule”) that implements the Basel III capital standards and establishes the minimum capital levels required under the Dodd-Frank Act. We must comply with the Final Capital Rule by January 1, 2015. The Final Capital Rule establishes a minimum common equity Tier I capital ratio of 6.5% of risk-weighted assets for a “well capitalized” institution and increases the minimum Tier I capital ratio for a “well capitalized” institution from 6.0% to 8.0%. Additionally, the Final Capital Rule requires an institution to maintain a 2.5% common equity Tier I capital conservation buffer over the 6.5% minimum risk-based capital requirement for "adequately capitalized" institutions, or face restrictions on the ability to pay dividends, discretionary bonuses, and engage in share repurchases. The Final Capital Rule permanently grandfathers trust preferred securities issued before May 19, 2010, subject to a limit of 25% of Tier I capital. The Final Capital Rule increases the required capital for certain categories of assets, including high-volatility construction real estate loans and certain exposures related to securitizations; however, the Final Capital Rule retains the current capital treatment of residential mortgages. Under the Final Capital Rule, we may make a one-time, permanent election to continue to exclude accumulated other comprehensive income from capital. If we do not make this election, unrealized gains and losses will be included in the calculation of our regulatory capital. Implementation of these standards, or any other new regulations, may adversely affect our ability to pay dividends, or require us to reduce business levels or raise capital, including in ways that may adversely affect our results of operations or financial condition.
We face significant legal risks, both from regulatory investigations and proceedings and from private actions brought against us.
From time to time, we are named as a defendant or are otherwise involved in various legal proceedings, including class actions and other litigation or disputes with third parties. There is no assurance that litigation with private parties will not increase in the future. Future actions against us may result in judgments, settlements, fines, penalties or other results adverse to us, which could materially adversely affect our business, financial condition or results of operations, or cause serious reputational harm to us. As a participant in the financial services industry, we are exposed to a high level of potential litigation related to our businesses and operations. Although we maintain insurance, the scope of this coverage may not provide us with full, or even partial, coverage in any particular case. As a result, a judgment against us in any such litigation could have a material adverse effect on our financial condition and results of operation.
Our businesses and operations are also subject to increasing regulatory oversight and scrutiny, which may lead to additional regulatory investigations or enforcement actions. These and other initiatives from federal and state officials may
13
subject us to further judgments, settlements, fines or penalties, or cause us to be required to restructure our operations and activities, all of which could lead to reputational issues, or higher operational costs, thereby reducing our revenue.
We may incur fines, penalties and other negative consequences from regulatory violations, possibly even inadvertent or unintentional violations.
We maintain systems and procedures designed to ensure that we comply with applicable laws and regulations. However, some legal/regulatory frameworks provide for the imposition of fines or penalties for noncompliance even though the noncompliance was inadvertent or unintentional and even though there was in place at the time systems and procedures designed to ensure compliance. For example, we are subject to regulations issued by the Office of Foreign Assets Control, or “OFAC,” that prohibit financial institutions from participating in the transfer of property belonging to the governments of certain foreign countries and designated nationals of those countries. OFAC may impose penalties for inadvertent or unintentional violations even if reasonable processes are in place to prevent the violations. There may be other negative consequences resulting from a finding of noncompliance, including restrictions on certain activities. Such a finding may also damage our reputation as described below and could restrict the ability of institutional investment managers to invest in our securities.
Our loan portfolio includes commercial real estate and commercial loans, which are generally riskier than other types of loans.
At December 31, 2013, our commercial real estate and commercial loan portfolios comprised 46% of total loans. Commercial loans generally carry larger loan balances and involve a higher risk of nonpayment or late payment than residential mortgage loans. These loans may lack standardized terms and may include a balloon payment feature. The ability of a borrower to make or refinance a balloon payment may be affected by a number of factors, including the financial condition of the borrower, prevailing economic conditions and prevailing interest rates. Repayment of these loans is generally more dependent on the economy and the successful operation of a business. Because of the risks associated with commercial loans, we may experience higher rates of default than if the portfolio were more heavily weighted toward residential mortgage loans. Higher rates of default could have an adverse effect on our financial condition and results of operations.
The two most significant industry exposures within our commercial real estate loan portfolio are non-residential building operators (operators of commercial and industrial buildings, retail establishments, theaters, banks and insurance buildings) and lodging (inns, bed & breakfasts, ski lodges, tourist cabins, hotels, and motels). At December 31, 2013, exposure to these two industries, as a percentage of total commercial real estate loans was 28% and 25%, respectively.
We may incur significant losses as a result of ineffective risk management processes and strategies.
We seek to monitor and control our risk exposure through a risk and control framework encompassing a variety of separate but complementary financial, credit, operational, compliance and legal reporting systems, internal controls, management review processes and other mechanisms. While we employ a broad and diversified set of risk monitoring and risk mitigation techniques, those techniques and the judgments that accompany their application may not be effective and may not anticipate every economic and financial outcome in all market environments or the specifics and timing of such outcomes. Market conditions over the last several years have involved unprecedented dislocations and highlight the limitations inherent in using historical data to manage risk.
We may be unable to attract and retain key personnel.
Our success depends, in large part, on our ability to attract and retain key personnel. Competition for qualified personnel in the financial services industry can be intense and we may not be able to hire or retain the key personnel that we depend upon for success. The unexpected loss of services of one or more of our key personnel could have a material adverse impact on our business because of their skills, knowledge of the markets in which we operate, years of industry experience and the difficulty of promptly finding qualified replacement personnel.
14
We have credit and counterparty risk inherent in our securities portfolio and the soundness of other financial institutions that could adversely affect us.
Our ability to engage in routine funding transactions could be adversely affected by the actions and commercial soundness of other financial institutions. Financial services institutions are interrelated as a result of trading, clearing, counterparty and other relationships. We maintain a diversified securities portfolio and have exposure to many different counterparties, and we routinely execute transactions with counterparties in the financial industry, including brokers and dealers, other commercial banks, investment banks, mutual and hedge funds, and other financial institutions. As a result, defaults by, or even rumors or questions about, one or more financial services institutions, or the financial services industry generally, could lead to market-wide liquidity problems and losses or defaults by us or by other institutions and organizations. Many of these transactions expose us to credit risk in the event of default of our counterparty or client. In addition, the current economic environment and volatility of financial markets increase the difficulty of assessing investment securities impairment and the same influences tend to increase the risk of potential impairment of these assets. Furthermore, our credit risk may be exacerbated when the collateral held by us cannot be liquidated or is liquidated at prices not sufficient to recover the full amount of the financial instrument exposure due to us. There is no assurance that any such losses would not materially and adversely affect our results of operations.
The current economic environment and volatility of financial markets increase the difficulty of assessing investment securities impairment and the same influences tend to increase the risk of potential impairment of these assets. For the years ended December 31, 2012 and 2011, we recorded charges for other-than-temporary impairment of securities of $39,000 and $109,000, respectively. We did not record any charges for other-than-temporary impairment of securities in 2013. We believe that we have adequately reviewed our investment securities for impairment and that our investment securities are carried at fair value. However, over time, the economic and market environment may provide additional insight regarding the fair value of certain securities, which could change our judgment regarding impairment. In addition, if the counter-party should default, become insolvent, declare bankruptcy, or otherwise cease to exist, the value of our investment may be impaired. This could result in realized losses relating to other-than-temporary declines being charged against future income. Given the volatility in market conditions and the significant judgments involved, there is continuing risk that further declines in fair value may occur and additional material other-than-temporary impairments may be charged to income in future periods, resulting in realized losses.
We could be held responsible for environmental liabilities of properties we acquired through foreclosure.
In the course of business, we may acquire, through foreclosure, properties securing loans originated or purchased that are in default. Particularly in commercial real estate lending, there is a risk that material environmental violations could be discovered on these properties. In this event, we might be required to remedy these violations at the affected properties at our sole cost and expense. The cost of remedial action could substantially exceed the value of affected properties. We may not have adequate remedies against the prior owner or other responsible parties and could find it difficult or impossible to sell the affected properties. These events could have an adverse effect on our financial condition and results of operations.
We are subject to reputational risk.
We are dependent on our reputation within our market area, as a trusted and responsible financial company, for all aspects of our relationships with customers, employees, vendors, third-party service providers, and others, with whom we conduct business or potential future business. Our actual or perceived failure to (a) identify and address potential conflicts of interest, ethical issues, money-laundering, or privacy issues; (b) meet legal and regulatory requirements applicable to the Bank and to the Company; (c) maintain the privacy of customer and accompanying personal information; (d) maintain adequate record keeping; (e) engage in proper sales and trading practices; and (f) identify the legal, reputational, credit, liquidity and market risks inherent in our products could give rise to reputational risk that could cause harm to the Bank and our business prospects. If we fail to address any of these issues in an appropriate manner, we could be subject to additional legal risks, which, in turn, could increase the size and number of litigation claims and damages asserted or subject us to enforcement actions, fines and penalties and cause us to incur related costs and expenses. Our ability to attract and retain customers and employees could be adversely affected to the extent our reputation is damaged.
15
To the extent that we acquire other companies, our business may be negatively impacted by certain risks inherent with such acquisitions.
We have acquired and will continue to consider the acquisition of other financial services companies. To the extent that we acquire other companies in the future, our business may be negatively impacted by certain risks inherent with such acquisitions. Some of these risks include the following:
|
•
|
the risk that the acquired business will not perform in accordance with management’s expectations;
|
|
•
|
the risk that difficulties will arise in connection with the integration of the operations of the acquired business with the operations of our business;
|
|
•
|
the risk that management will divert its attention from other aspects of our business;
|
|
•
|
the risk that we will lose key employees of the combined business; and
|
|
•
|
the risks associated with entering into geographic and product markets in which we have limited or no direct prior experience.
|
We may be required to write down goodwill and other identifiable intangible assets.
When we acquire a business, a portion of the purchase price of the acquisition may be allocated to goodwill and other identifiable intangible assets. The excess of the purchase price over the fair value of the net identifiable tangible and intangible assets acquired determines the amount of the purchase price that is allocated to goodwill acquired. At December 31, 2013, our goodwill and other identifiable intangible assets were approximately $49.3 million. Under current accounting standards, if we determine goodwill or intangible assets are impaired, we would be required to write down the value of these assets. We conduct an annual review, or more frequently if events or circumstances warrant such, to determine whether goodwill and other identifiable intangible assets are impaired. We recently completed such an impairment analysis and recorded a goodwill write-down of $2.8 million related to our financial services reporting unit. We concluded that no such write-down was necessary for our banking reporting unit. We cannot provide assurance that we will not be required to take an additional impairment charge in the future. Any impairment charge would have a negative effect on our shareholders’ equity and financial results and may cause a decline in our stock price.
Systems failures, interruptions or breaches of security could have an adverse effect on our financial condition and results of operations.
We are subject to certain operational risks, including, but not limited to, data processing system failures and errors, inadequate or failed internal processes, customer or employee fraud and catastrophic failures resulting from terrorist acts or natural disasters. We depend upon data processing, software, communication, and information exchange on a variety of computing platforms and networks and over the Internet, and we rely on the services of a variety of vendors to meet our data processing and communication needs. Despite instituted safeguards, we cannot be certain that all of our systems are entirely free from vulnerability to attack or other technological difficulties or failures. Information security risks have increased significantly due to the use of online, telephone and mobile banking channels by clients and the increased sophistication and activities of organized crime, hackers, terrorists and other external parties. Our technologies, systems, networks and our clients’ devices may be the target of, cyber-attacks, computer viruses, malicious code, phishing attacks or information security breaches that could result in the unauthorized release, gathering, monitoring, misuse, loss or destruction of our or our clients’ confidential, proprietary and other information, the theft of client assets through fraudulent transactions or disruption of our or our clients’ or other third parties’ business operations. If information security is breached or other technology difficulties or failures occur, information may be lost or misappropriated, services and operations may be interrupted and we could be exposed to claims from customers. While we maintain a system of internal controls and procedures, any of these results could have a material adverse effect on our business, financial condition, results of operations or liquidity.
16
We must adapt to information technology changes in the financial services industry, which could present operational issues, require significant capital spending, or impact our reputation.
The financial services industry is constantly undergoing technological changes, with frequent introductions of new technology-driven products and services. The effective use of technology increases efficiency and enables financial institutions to better serve customers and reduce costs. Our future success will depend, in part, upon our ability to address the needs of our customers by using technology to provide products and services that will satisfy customer demands for convenience, as well as to create additional efficiencies in our operations. We may not be able to effectively implement new technology-driven products and services or be successful in marketing these products and services to our customers.
We rely on other companies to provide key components of our business infrastructure.
Third party vendors provide key components of our business infrastructure such as internet connections, network access and core application processing. While we have selected these third party vendors carefully, we do not control their actions. Any problems caused by these third parties, including as a result of their not providing us their services for any reason or their performing their services poorly, could adversely affect our ability to deliver products and services to our customers or otherwise conduct our business efficiently and effectively. Replacing these third party vendors could also entail significant delay and expense.
The market value of wealth management assets under administration may be negatively affected by changes in economic and market conditions.
A substantial portion of income from fiduciary services is dependent on the market value of wealth management assets under administration, which are primarily marketable securities. Changes in domestic and foreign economic conditions, volatility in financial markets, and general trends in business and finance, all of which are beyond our control, could adversely impact the market value of these assets and the fee revenues derived from the management of these assets.
We may not be able to attract and retain wealth management clients at current levels.
Due to strong competition, our wealth management division may not be able to attract and retain clients at current levels. Competition is strong as there are numerous well-established and successful investment management and wealth advisory firms including commercial banks and trust companies, investment advisory firms, mutual fund companies, stock brokerage firms, and other financial companies. Our ability to attract and retain wealth management clients is dependent upon our ability to compete with competitors’ investment products, level of investment performance, client services, marketing and distribution capabilities. If we are not successful, our results of operations and financial condition may be negatively impacted.
If we do not maintain net income growth, the market price of our common stock could be adversely affected.
Our return on shareholders’ equity and other measures of profitability, which affect the market price of our common stock, depend in part on our continued growth and expansion. Our growth strategy has two principal components: internal growth and external growth. Our ability to generate internal growth is affected by the competitive factors described below as well as by the primarily rural characteristics and related demographic features of the markets we serve. Our ability to continue to identify and invest in suitable acquisition candidates on acceptable terms is an important component of our external growth strategy. In pursuing acquisition opportunities, we may be in competition with other companies having similar growth strategies. As a result, we may not be able to identify or acquire promising acquisition candidates on acceptable terms. Competition for these acquisitions could result in increased acquisition prices and a diminished pool of acquisition opportunities. An inability to find suitable acquisition candidates at reasonable prices could slow our growth rate and have a negative effect on the market price of our common stock.
We are a holding company and dependent upon our subsidiaries for dividends, distributions and other payments.
We are a legal entity separate and distinct from our subsidiaries. Our revenue (on a parent-only basis) is derived primarily from interest and dividends paid to us by the Bank. Our right, and consequently the right of our shareholders, to participate in any distribution of the assets or earnings of the Bank through the payment of such dividends or otherwise is necessarily subject to the prior claims of creditors of the Bank (including depositors), except to the extent that certain claims of us in a creditor capacity may be recognized.
17
Holders of our common stock are entitled to receive dividends only when, and if declared by our board of directors. Although we have historically declared cash dividends on our common stock, we are not required to do so and our board of directors may reduce or eliminate our common stock dividend in the future. The FRB has authority to prohibit bank holding companies from paying dividends if such payment is deemed to be an unsafe or unsound practice. Additionally, the OCC has the authority to use its enforcement powers to prohibit a bank from paying dividends if, in its opinion, the payment of dividends would constitute an unsafe or unsound practice. Further, when the Final Capital Rule comes into effect, our ability to pay dividends would be restricted if we do not maintain a capital conservation buffer. A reduction or elimination of dividends could adversely affect the market price of our common stock. See Part I, Item 1, “Business — Supervision and Regulation — Dividend Restrictions” and “Business — Supervision and Regulation — Regulatory Capital Requirements.”
Changes in accounting standards can be difficult to predict and can materially impact how we record and report our financial condition and results of operations.
Our accounting policies and methods are fundamental to how we record and report our financial condition and results of operations. From time to time, the Financial Accounting Standards Board (“FASB”) changes the financial accounting and reporting standards that govern the preparation of our financial statements. These changes can be hard to anticipate and implement and can materially impact how we record and report our financial condition and results of operations. For example, the FASB’s current financial instruments project could, among other things, significantly change the way loan loss provisions are determined from an incurred loss model to an expected loss model.
Our financial statements are based in part on assumptions and estimates, which, if wrong, could cause unexpected losses in the future.
Pursuant to U.S. generally accepted accounting principles, we are required to use certain assumptions and estimates in preparing our financial statements, including in determining credit loss reserves, reserves related to litigation and the fair value of certain assets and liabilities, among other items. If assumptions or estimates underlying our financial statements are incorrect, we may experience material losses. For additional information, see Item 7. “Management’s Discussion and Analysis of Financial Condition and Results of Operations — Critical Accounting Policies.”
Our financial condition and results of operations have been adversely affected, and may continue to be adversely affected, by the U.S. and international financial market and economic conditions.
We have been and continue to be impacted by general business and economic conditions in the United States and, to a lesser extent, abroad. These conditions include short-term and long-term interest rates, inflation, money supply, political issues, legislative and regulatory changes, fluctuations in both debt and equity capital markets, broad trends in industry and finance, unemployment and the strength of the U.S. economy and the local economies in which the Company operates, all of which are beyond the Company’s control. Deterioration in any of these conditions could result in an increase in loan delinquencies, and non-performing assets, decreases in loan collateral values and a decrease in demand for the Company’s products and services. While there are indications that the U.S. economy is stabilizing, there remains significant uncertainty regarding the sustainability of the economic recovery.
Continued market volatility may impact our business and the value of our common stock.
Our business performance and the trading price of shares of our common stock may be affected by many factors affecting financial institutions, including volatility in the credit, mortgage and housing markets, the markets for securities relating to mortgages or housing, and the value of debt and mortgage-backed and other securities that we hold in our investment portfolio. Government action and legislation may also impact us and the value of our common stock. We cannot predict what impact, if any, volatility will have on our business or share price and for these and other reasons our shares of common stock may trade at a price lower than that at which they were purchased.
18
None.
At December 31, 2013, the Company owns or leases a total of 45 facilities. All facilities are fully utilized and considered suitable and adequate for the purposes intended. The Company owns 26 of its facilities, none of which are subject to a mortgage, and the remaining branches and two parking lots are leased by the Company. Related rent expense appears in Note 6 of the consolidated financial statements. The Company has a 44 branch network located in 12 counties throughout Maine. The following table presents our materially important properties as of December 31, 2013.
|
Facility Name
|
Location
|
General
Character of the Physical Property
|
Primary Business Segment
|
Property
Status
|
Property
Square Feet
|
|||||||
|
Main Office
|
Camden, Maine
|
3 story building
|
Principal executive office
|
Owned
|
15,500
|
|
||||||
|
Hanley Center
|
Rockport, Maine
|
2 story building
|
Service center
|
Owned
|
32,360
|
|
||||||
|
Bangor
|
Bangor, Maine
|
1 floor
|
Branch
|
Leased
|
17,432
|
|
(1)
|
|||||
|
Acadia Trust
|
Portland, Maine
|
1 floor
|
Main office
|
Leased
|
4,212
|
|
(1)
|
|||||
|
Rockland
|
Rockland, Maine
|
3 story building
|
Branch
|
Owned
|
21,600
|
|
||||||
|
Ellsworth
|
Ellsworth, Maine
|
3 story building
|
Branch
|
Owned
|
44,000
|
|
(2)
|
|||||
|
Waterville
|
Waterville, Maine
|
3 story building
|
Branch
|
Owned
|
17,099
|
|
||||||
|
Auburn
|
Auburn, Maine
|
2 floors
|
Branch
|
Leased
|
8,824
|
|
(1)
|
|||||
(1) Property square feet represents the square footage occupied by the Company.
(2) Includes space leased to third parties.
Various legal claims arise from time to time in the normal course of the Company’s business, which in our opinion, are not expected to have a material effect on our consolidated financial statements.
Not applicable.
19
The Company’s common stock is currently traded on the NASDAQ Global Market (“NASDAQ”) under the ticker symbol “CAC.” The Company has paid quarterly dividends since its foundation in 1984. The high and low closing sales prices (as quoted by NASDAQ for 2013 and 2012) and cash dividends declared per share of the Company’s common stock, by calendar quarter for the past two years, were as follows:
|
2013
|
2012
|
||||||||||||||||||||||
|
|
Market Price
|
Dividends Declared per Share
|
Market Price
|
Dividends Declared per Share
|
|||||||||||||||||||
|
|
High
|
Low
|
High
|
Low
|
|||||||||||||||||||
|
First Quarter
|
$
|
36.81
|
|
$
|
33.08
|
|
$
|
0.27
|
|
$
|
37.25
|
|
$
|
31.90
|
|
$
|
0.25
|
|
|||||
|
Second Quarter
|
$
|
37.99
|
|
$
|
31.91
|
|
$
|
0.27
|
|
$
|
36.62
|
|
$
|
30.83
|
|
$
|
0.25
|
|
|||||
|
Third Quarter
|
$
|
41.13
|
|
$
|
35.50
|
|
$
|
0.27
|
|
$
|
39.73
|
|
$
|
33.87
|
|
$
|
0.25
|
|
|||||
|
Fourth Quarter
|
$
|
43.54
|
|
$
|
38.79
|
|
$
|
0.27
|
|
$
|
38.09
|
|
$
|
31.10
|
|
$
|
0.25
|
|
|||||
As of March 3, 2014, there were 7,509,789 shares of the Company’s common stock outstanding held of record by approximately 1,200 shareholders, as obtained through our transfer agent. Such number of record holders does not reflect the number of persons or entities holding stock in nominee name through banks, brokerage firms and other nominees, which is estimated to be 3,400 shareholders.
Although the Company has historically paid quarterly dividends on its common stock, the Company’s ability to pay such dividends depends on a number of factors, including restrictions under federal laws and regulations on the Company’s ability to pay dividends, and as a result, there can be no assurance that dividends will be paid in the future. For further information on dividend restrictions, refer to Item 7. “Management’s Discussion and Analysis of Financial Condition and Results of Operations — Capital Resources".
The following graph illustrates the annual percentage change in the cumulative total shareholder return of the Company’s common stock for the period December 31, 2008 through December 31, 2013. For purposes of comparison, the graph illustrates comparable shareholder returns of the SNL $1B – $5B Bank Index and the Russell 2000 Stock Index. The graph assumes a $100 investment on December 31, 2008 in each case and measures the amount by which the market value, assuming reinvestment of dividends, has changed as of December 31, 2013.
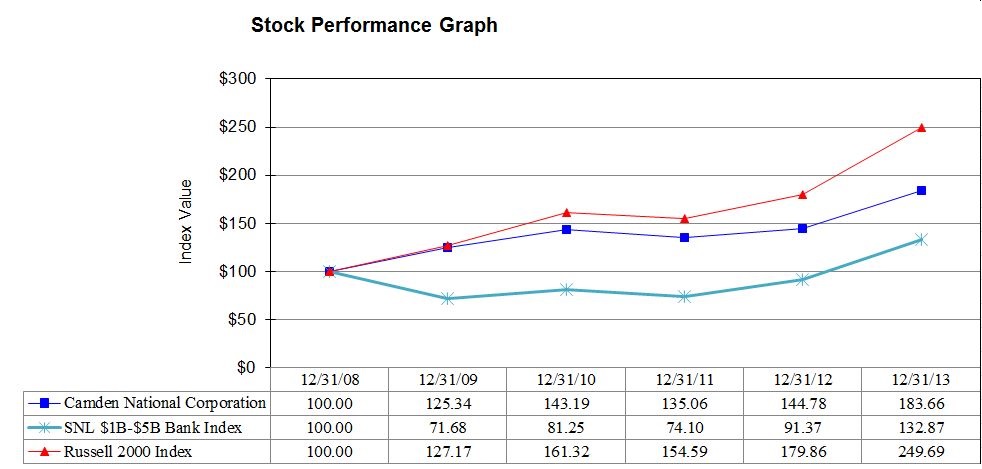
20
On September 24, 2013, the board of directors authorized a common stock repurchase program (the "2013 Repurchase Plan"). The 2013 Repurchase Plan allows for the repurchase of up to 250,000 shares of the Company’s outstanding common stock. This program is expected to continue until the authorized number of shares is repurchased, or the Company’s board of directors terminate the program. There is no specified expiration date of the 2013 Repurchase Plan. As of December 31, 2013, the Company repurchased 68,145 shares at an average price of $40.78, or 27% of the program’s total allotment and 1% of total outstanding shares. The Company did not repurchase any shares of Company common stock during the first, second, or third quarter of 2013.
On September 25, 2012, the board of directors authorized a common stock repurchase program (the "2012 Repurchase Plan"). The 2012 Repurchase Plan authorized management to repurchase up to
500,000
shares of the Company's outstanding common stock over a one-year term which expired on
October 1, 2013
. The Company did not repurchase any shares under the 2012 Repurchase Plan.
|
Issuer's Purchases of Equity Securities
|
|||||||||||||
|
Period
|
Total
number of
shares (or units)
purchased
|
Average
price paid
per share (or unit)
|
Total number of
shares (or units) purchased
as part of publicly
announced plans or programs
|
Maximum number (or appropriate dollar value) of shares (or units) that may yet be purchased under the plans or programs
|
|||||||||
|
10/1/2013 to 10/31/2013
|
—
|
|
$
|
—
|
|
—
|
|
250,000
|
|
||||
|
11/1/2013 to 11/30/2013
|
22,000
|
|
39.16
|
|
22,000
|
|
228,000
|
|
|||||
|
12/1/2013 to 12/31/2013
|
46,145
|
|
41.55
|
|
46,145
|
|
181,855
|
|
|||||
|
Total
|
68,145
|
|
$
|
40.78
|
|
68,145
|
|
181,855
|
|
||||
Other information required by this item is incorporated by reference to Item 12. “Security Ownership of Certain Beneficial Owners and Management and Related Stockholder Matters.”
21
The selected consolidated financial and other data of the Company set forth below does not purport to be complete and should be read in conjunction with, and is qualified in its entirety by, the more detailed information, including the consolidated financial statements and related notes, appearing elsewhere herein.
|
At or for the Year Ended December 31,
|
||||||||||||||||||||
|
(In Thousands, Except per Share Data)
|
2013
(1)
|
2012
(2)
|
2011
|
2010
|
2009
|
|||||||||||||||
|
Financial Condition Data
|
|
|
|
|
|
|
|
|
|
|
||||||||||
|
Investments
|
$
|
828,201
|
|
$
|
802,084
|
|
$
|
611,998
|
|
$
|
611,643
|
|
$
|
539,587
|
|
|||||
|
Loans and loans held for sale
|
1,580,402
|
|
1,563,866
|
|
1,520,089
|
|
1,530,280
|
|
1,526,758
|
|
||||||||||
|
Allowance for loan losses
|
21,590
|
|
23,044
|
|
23,011
|
|
22,293
|
|
20,246
|
|
||||||||||
|
Total assets
|
2,603,829
|
|
2,564,757
|
|
2,302,720
|
|
2,306,007
|
|
2,235,383
|
|
||||||||||
|
Deposits
|
1,813,824
|
|
1,929,469
|
|
1,591,366
|
|
1,515,811
|
|
1,495,807
|
|
||||||||||
|
Borrowings
|
530,092
|
|
360,163
|
|
456,233
|
|
559,919
|
|
527,347
|
|
||||||||||
|
Shareholders’ equity
|
231,096
|
|
233,815
|
|
218,876
|
|
205,995
|
|
190,561
|
|
||||||||||
|
Operating Data
|
|
|
|
|
|
|
|
|
||||||||||||
|
Interest income
|
$
|
88,217
|
|
$
|
90,947
|
|
$
|
98,372
|
|
$
|
104,507
|
|
$
|
113,331
|
|
|||||
|
Interest expense
|
12,742
|
|
17,202
|
|
23,153
|
|
30,217
|
|
40,320
|
|
||||||||||
|
Net interest income
|
75,475
|
|
73,745
|
|
75,219
|
|
74,290
|
|
73,011
|
|
||||||||||
|
Provision for credit losses
|
2,028
|
|
3,816
|
|
4,735
|
|
6,299
|
|
8,213
|
|
||||||||||
|
Net interest income after provision for credit losses
|
73,447
|
|
69,929
|
|
70,484
|
|
67,991
|
|
64,798
|
|
||||||||||
|
Non-interest income
|
27,801
|
|
23,412
|
|
23,053
|
|
20,825
|
|
19,423
|
|
||||||||||
|
Non-interest expense
|
66,333
|
|
59,031
|
|
55,579
|
|
52,937
|
|
51,005
|
|
||||||||||
|
Income before income taxes
|
34,915
|
|
34,310
|
|
37,958
|
|
35,879
|
|
33,216
|
|
||||||||||
|
Income taxes
|
12,132
|
|
10,882
|
|
11,781
|
|
11,113
|
|
10,443
|
|
||||||||||
|
Net income
|
$
|
22,783
|
|
$
|
23,428
|
|
$
|
26,177
|
|
$
|
24,766
|
|
$
|
22,773
|
|
|||||
|
Ratios
|
|
|
|
|
|
|
|
|
|
|
||||||||||
|
Return on average assets
|
0.88
|
%
|
0.98
|
%
|
1.13
|
%
|
1.09
|
%
|
1.00
|
%
|
||||||||||
|
Return on average shareholders' equity
|
9.74
|
%
|
10.31
|
%
|
12.16
|
%
|
12.42
|
%
|
12.81
|
%
|
||||||||||
|
Return on average tangible shareholders' equity (Non-GAAP)
(3)
|
14.55
|
%
|
13.19
|
%
|
15.67
|
%
|
16.40
|
%
|
17.67
|
%
|
||||||||||
|
Net interest margin
|
3.20
|
%
|
3.36
|
%
|
3.57
|
%
|
3.60
|
%
|
3.53
|
%
|
||||||||||
|
Efficiency ratio (Non-GAAP)
(3)
|
62.78
|
%
|
57.45
|
%
|
54.63
|
%
|
55.74
|
%
|
54.26
|
%
|
||||||||||
|
Tier I leverage capital ratio
|
9.43
|
%
|
8.94
|
%
|
9.59
|
%
|
8.77
|
%
|
8.17
|
%
|
||||||||||
|
Tier I risk-based capital ratio
|
15.20
|
%
|
14.31
|
%
|
14.69
|
%
|
13.80
|
%
|
12.24
|
%
|
||||||||||
|
Total risk-based capital ratio
|
16.45
|
%
|
15.56
|
%
|
15.95
|
%
|
15.05
|
%
|
13.49
|
%
|
||||||||||
|
Allowance for credit losses to total loans
|
1.37
|
%
|
1.48
|
%
|
1.52
|
%
|
1.46
|
%
|
1.33
|
%
|
||||||||||
|
Net charge-offs to average loans
|
0.22
|
%
|
0.24
|
%
|
0.26
|
%
|
0.28
|
%
|
0.37
|
%
|
||||||||||
|
Non-performing loans to total loans
|
1.80
|
%
|
1.78
|
%
|
1.82
|
%
|
1.47
|
%
|
1.29
|
%
|
||||||||||
|
Non-performing assets to total assets
|
1.18
|
%
|
1.13
|
%
|
1.27
|
%
|
1.08
|
%
|
1.13
|
%
|
||||||||||
|
Per common share data
|
|
|
|
|
|
|
|
|
||||||||||||
|
Basic earnings per share
|
$
|
2.98
|
|
$
|
3.06
|
|
$
|
3.41
|
|
$
|
3.23
|
|
$
|
2.98
|
|
|||||
|
Diluted earnings per share
|
2.97
|
|
3.05
|
|
3.40
|
|
3.23
|
|
2.97
|
|
||||||||||
|
Dividends declared per share
|
1.08
|
|
1.00
|
|
1.50
|
|
1.00
|
|
1.00
|
|
||||||||||
|
Book value per share
|
30.49
|
|
30.67
|
|
28.56
|
|
26.90
|
|
24.93
|
|
||||||||||
|
Tangible book value per share (Non-GAAP)
(3)
|
23.98
|
|
23.68
|
|
22.66
|
|
20.91
|
|
18.86
|
|
||||||||||
|
Dividend payout ratio
|
36.30
|
%
|
32.73
|
%
|
44.05
|
%
|
30.95
|
%
|
33.56
|
%
|
||||||||||
(1) The 2013 data reflects the divestiture of five Franklin County branches. Please see Note 2 of the consolidated financial statements within Item 8. "Financial Statement and Supplemental Data" for discussion.
(2) The 2012 data includes the acquisition of 14 branches from Bank of America, National Association. Please see Note 2 of the consolidated financial statements within Item 8. "Financial Statement and Supplemental Data" for discussion.
(3) Please see Item 7. "Management's Discussion and Analysis of Financial Condition and Results of Operations — Non-GAAP Financial Measures and Reconciliation to GAAP" for discussion and reconciliations of non-GAAP measures.
22
The discussion below focuses on the factors affecting our consolidated results of operations for the years ended December 31, 2013, 2012 and 2011 and financial condition at December 31, 2013 and 2012 and, where appropriate, factors that may affect our future financial performance, unless stated otherwise. The information within the tables is presented in thousands, except for number of shares and per share data. This discussion should be read in conjunction with the consolidated financial statements, notes to the consolidated financial statements and selected consolidated financial data.
The acronyms and abbreviations identified below are used in the "Management's Discussion and Analysis of Financial Condition and Results of Operations" as well as in Item 8. "Financial Statements and Supplementary Data". The following is provided to aid the reader and provide a reference page when reviewing the consolidated financial statements.
|
Acadia Trust:
|
Acadia Trust, N.A., a wholly-owned subsidiary of Camden National Corporation
|
Freddie Mac:
|
Federal Home Loan Mortgage Corporation
|
|
|
Act:
|
Medicare Prescription Drug, Improvement and Modernization Act
|
GAAP:
|
Generally accepted accounting principles in the United States
|
|
|
AFS:
|
Available-for-sale
|
IRS:
|
Internal Revenue Service
|
|
|
ALCO:
|
Asset/Liability Committee
|
LIBOR:
|
London Interbank Offered Rate
|
|
|
ALL:
|
Allowance for loan losses
|
LTIP:
|
Long-Term Performance Share Plan
|
|
|
AOCI:
|
Accumulated other comprehensive income (loss)
|
MaineHousing:
|
Maine State Housing Authority
|
|
|
ASC:
|
Accounting Standards Codification
|
Management ALCO:
|
Management Asset/Liability Committee
|
|
|
ASU:
|
Accounting Standards Update
|
MSPP:
|
Management Stock Purchase Plan
|
|
|
Bank:
|
Camden National Bank, a wholly-owned subsidiary of Camden National Corporation
|
MSRs:
|
Mortgage servicing rights
|
|
|
BOLI:
|
Bank-owned life insurance
|
Non-Agency or Non-Agencies:
|
Non-agency private issue collateralized mortgage obligation(s)
|
|
|
Board ALCO:
|
Board of directors' Asset/Liability Committee
|
OCC:
|
Office of the Comptroller of the Currency
|
|
|
Branch Acquisition:
|
The acquisition of 14 branches from Bank of America, N.A. in 2012, after divesting of one branch as required by the Department of Justice
|
OCI:
|
Other comprehensive income (loss)
|
|
|
Branch Divestiture:
|
The divestiture of five Franklin County branches in 2013
|
OFAC:
|
Office of Foreign Assets Control
|
|
|
BSA:
|
Bank Secrecy Act
|
OREO:
|
Other real estate owned
|
|
|
CCTA:
|
Camden Capital Trust A, an unconsolidated entity formed by Camden National Corporation
|
OTTI:
|
Other-than-temporary impairment
|
|
|
CSV:
|
Cash surrender value
|
SERP:
|
Supplemental executive retirement plans
|
|
|
Company:
|
Camden National Corporation
|
TDR:
|
Troubled-debt restructuring
|
|
|
DCRP:
|
Defined Contribution Retirement Plan
|
UBCT:
|
Union Bankshares Capital Trust I, an unconsolidated entity formed by Union Bankshares Company that was subsequently acquired by Camden National Corporation
|
|
|
EPS:
|
Earnings per share
|
U.S.:
|
United States of America
|
|
|
FASB:
|
Financial Accounting Standards Board
|
2003 Plan
|
2003 Stock Option and Incentive Plan
|
|
|
FDIC:
|
Federal Deposit Insurance Corporation
|
2012 Plan
|
2012 Equity and Incentive Plan
|
|
|
FHLB:
|
Federal Home Loan Bank
|
2013 Repurchase Plan:
|
2013 Common Stock Repurchase Program, approved by the Company's board of directors
|
|
|
FHLBB:
|
Federal Home Loan Bank of Boston
|
2012 Repurchase Plan:
|
2012 Common Stock Repurchase Program, approved by the Company's board of directors
|
|
|
FRB:
|
Federal Reserve Bank
|
|||
23
Executive Overview
The Company reported net income for the year ended December 31, 2013 of $22.8 million and diluted earnings per share of $2.97 for 2013 compared to net income and diluted earnings per share of $23.4 million and $3.05, respectively, for 2012. Return on average assets and return on average shareholders' equity for 2013 were 0.88% and 9.74%, respectively, compared to a return on average assets and return on average shareholders' equity for 2012 of 0.98% and 10.31%, respectively.
The fourth quarter of 2013 was the mark of two major milestones for the Company: (i) October was the one-year anniversary of the acquisition of 15 branches from Bank of America, National Association; and (ii) in October the Company divested its five Franklin County branches. The Branch Acquisition provided the Company with an instant increase in market present and customer-base within some of Maine's major markets. The Branch Acquisition provided over 25,000 new customers and approximately $287.6 million in low-cost deposits. The Company saw the benefit of these additional customers and low-cost deposits in 2013 as non-interest income increased and average cost of funds decreased 26 basis points to 0.55% compared to 2012. In addition, non-interest expense increased in 2013 due to recognition of a full year of associated costs with operating and maintaining the new branches and increased customer activity. The Branch Divestiture included the sale of $46.0 million of loans, $85.9 million in total deposits and borrowings, and a pre-tax gain of $2.7 million. Company management recognizes that these transactions have an immediate impact on short-term earnings; however, their focus continues to be on driving long-term shareholder value through strategic repositioning.
Net income and diluted earnings per share for 2013 decreased $645,000 and $0.08 per share, respectively, compared to 2012. The decrease in net income was largely due to non-recurring transactions that are not representative of the Company's core operations. In the fourth quarter of 2013, a goodwill impairment charge of $2.8 million was recorded related to the Company's financial services reporting unit. This goodwill write-down decreased 2013 net income by $2.8 million as the write-down does not provide for any tax benefit. This loss was partially offset by a $1.5 million after-tax gain recognized from the Branch Divestiture, including related divestiture costs.
Total assets grew 2% during the year to $2.6 billion at December 31, 2013. The largest contributors to this growth were loans and investments, with organic loan growth of $62.6 million, or 4%, after adjusting for the Branch Divestiture, and an increase in the investment portfolio of $26.1 million, or 3%. Total deposits were $1.8 billion at December 31, 2013, reflecting the sale of $80.4 million of deposits as part of the Branch Divestiture. Core deposits (demand, interest checking, savings and money market) continue to represent the majority of total deposits.
The Company declared dividends payable of $1.08 per share during 2013, representing an increase of $0.08 per share, or 8%, compared to 2012.
Critical Accounting Policies
Critical accounting policies are defined as those that are reflective of significant judgments and uncertainties, and could potentially result in materially different results under different assumptions and conditions. In preparing the Company’s consolidated financial statements, management is required to make significant estimates and assumptions that affect assets, liabilities, revenues, and expenses reported. Actual results could materially differ from our current estimates, as a result of changing conditions and future events. Several estimates are particularly critical and are susceptible to significant near-term change, including the allowance for credit losses, accounting for acquisitions and the review of goodwill and other identifiable intangible assets for impairment, valuation of other real estate owned, other-than-temporary impairment of investments, effectiveness of hedging derivatives, accounting for postretirement plans, stock-based compensation, and income taxes. Our significant accounting policies and critical estimates are summarized in Note 1 to the consolidated financial statements included in Item 8. “Financial Statements and Supplementary Data”.
Allowance for Credit Losses.
Management is committed to maintaining an allowance for loan losses (“ALL”) that is appropriate to absorb likely loss exposure in the loan portfolio. Evaluating the appropriateness of the ALL is a key management function, one that requires the most significant amount of management estimates and assumptions. The ALL, which is established through a charge to the provision for credit losses, consists of two components: (i) a reduction to total gross loans in the asset section of the balance sheet, and (ii) the reserve for unfunded commitments included in other liabilities on the balance sheet. We regularly evaluate the ALL for adequacy by taking into consideration, among other factors, historical trends in charge-offs and delinquencies, overall risk characteristics and size of the portfolios, ongoing review of significant individual loans, trends in levels of watched or criticized assets, business and economic conditions, local industry trends, evaluation of results of examinations by regulatory authorities and other third parties, and other relevant factors.
24
In determining the appropriate level of ALL, we use a methodology to systematically measure the amount of estimated loan loss exposure inherent in the loan portfolio. The methodology focuses on four key elements: (i) identification of loss allocations for specific loans, (ii) loss allocation factors for certain loan types based on credit grade and loss experience, (iii) general loss allocations for other environmental factors, and (iv) the unallocated portion of the allowance.
In accordance with GAAP, a loan is impaired when it is probable we will be unable to collect all contractual payments as scheduled. We have concluded that loans that meet this definition are risk rated as substandard or doubtful. As such, quarterly we review individual loans with a carrying value greater than $250,000 and that are risk rated as substandard or doubtful or are on non-accrual status for impairment. If deemed impaired, an allowance is established for these loans to reduce the net carrying value of the loan to fair value. The fair value of an impaired loan is determined by one of three methods in accordance with GAAP: (i) the present value of expected future cash flows, (ii) the observable market price, or (iii), if the loan is collateral-dependent, the fair value of the collateral, less the estimated costs to sell the collateral.
We use a risk rating system to determine the credit quality of our loans and apply the related loss allocation factors. In assessing the risk rating of a particular loan, we consider, among other factors, the obligor’s debt capacity, financial condition, the level of the obligor’s earnings, the amount and sources of repayment, the performance with respect to loan terms, the adequacy of collateral, the level and nature of contingent liabilities, management strength, and the industry in which the obligor operates. These factors are based on an evaluation of historical information, as well as a subjective assessment and interpretation of current conditions. Emphasizing one factor over another, or considering additional factors that may be relevant in determining the risk rating of a particular loan but which are not currently an explicit part of our methodology, could impact the risk rating assigned to that loan.
Three times annually, management conducts a thorough review of adversely risk rated commercial and commercial real estate exposures exceeding certain thresholds to re-evaluate the risk rating and identify impaired loans. This extensive review takes into account the obligor’s repayment history and financial condition, collateral value, guarantor support, local economic and industry trends, and other factors relevant to the particular loan relationship.
We periodically reassess and revise the loss allocation factors used in the assignment of loss exposure to appropriately reflect our analysis of loss experience. Portfolios of more homogenous populations of loans including home equity and consumer loans are analyzed as groups taking into account delinquency rates and other economic conditions which may affect the ability of borrowers to meet debt service requirements, including interest rates and energy costs. An additional allocation is determined based on a judgmental process whereby management considers qualitative and quantitative assessments of other environmental factors. Finally, an unallocated portion of the total allowance is maintained to allow for measurement imprecision attributable to uncertainty in the economic environment.
Because the methodology is based upon historical experience and trends as well as management’s judgment, factors may arise that result in different estimations. Significant factors that could give rise to changes in these estimates may include, but are not limited to, changes in economic conditions in our market area, concentration of risk, declines in local property values, and the results of regulatory examinations. While management’s evaluation of the ALL as of December 31, 2013 determined the allowance to be appropriate, under adversely different conditions or assumptions, we may need to increase the allowance. Monthly, management reviews the ALL to assess recent asset quality trends and impact on the Company's financial condition. Quarterly, the ALL is brought before the Bank's board of directors for discussion, review, and approval. Refer to Item 7. "Management's Discussion and Analysis — Financial Condition — Asset Quality" for further discussion of our ALL process.
The adequacy of the reserve for unfunded commitments is determined in a similar manner as the ALL, with the exception that management must also estimate the likelihood of these commitments being funded and becoming loans. This is accomplished by evaluating the historical utilization of each type of unfunded commitment and estimating the likelihood that the historical utilization rates could change in the future.
Branch Purchase Price Allocation and Impairment of Goodwill and Identifiable Intangible Assets
. We record all assets and liabilities acquired in purchase acquisitions at fair value, which is an estimate determined by the use of internal and other valuation techniques. We utilize third-party services for the valuation of real estate and core deposit intangibles. These valuation estimates result in goodwill and other intangible assets, which are subject to ongoing periodic impairment tests using various fair value techniques. Goodwill impairment evaluations are required to be performed annually and may be required more frequently if certain conditions indicating potential impairment exist. Our policy is to perform the goodwill impairment analysis as of November 30 of each year, or more frequently as warranted, at the reporting unit level - (i) banking and (ii) financial services. The banking reporting unit is representative of our core banking business line, while the financial services reporting unit is representative of our wealth management, trust and services business line. Identifiable intangible assets are amortized over their estimated useful lives and are subject to impairment tests if events or circumstances indicate a possible
25
inability to realize the carrying amount. Goodwill is evaluated for impairment using several standard valuation techniques including discounted cash flow analyses, as well as an estimation of the impact of business conditions. The use of different estimates or assumptions could produce different estimates of carrying value.
In 2013, goodwill impairment of $2.8 million was recorded related to the financial services reporting unit. This impairment was 42% of the December 31, 2012 goodwill balance attributable to the financial service reporting unit. We also performed the annual goodwill impairment analysis for the banking reporting unit and determined it was not impaired.
Valuation of OREO
. Periodically, we acquire property in connection with foreclosures or in satisfaction of debt previously contracted. The valuation of this property is accounted for individually based on its fair value on the date of acquisition. At the acquisition date, if the fair value of the property, less the costs to sell is less than the book value of the loan, a charge or reduction in the ALL is recorded. If the value of the property becomes permanently impaired, as determined by an appraisal or an evaluation in accordance with our appraisal policy, we will record the decline by charging against current earnings. Upon acquisition of a property, we use a current appraisal or broker’s opinion to substantiate fair value for the property.
OTTI of Investments
. We record an investment impairment charge at the point we believe an investment has experienced a decline in value that is other-than-temporary. In determining whether an OTTI has occurred, we review information about the underlying investment that is publicly available, analysts’ reports, applicable industry data and other pertinent information, and assess our ability to hold the securities for the foreseeable future. The investment is written down to its current market value at the time the impairment is deemed to have occurred. Future adverse changes in market conditions, continued poor operating results of underlying investments or other factors could result in further losses that may not be reflected in an investment’s current carrying value, possibly requiring an additional impairment charge in the future.
Effectiveness of Hedging Derivatives
. The Company maintains an overall interest rate risk management strategy that incorporates the use of interest rate contracts, which are generally non-leveraged generic interest rate and basis swaps, to minimize significant fluctuations in earnings that are caused by interest rate volatility. Interest rate contracts are used by the Company in the management of its interest rate risk position. The Company’s goal is to manage interest rate sensitivity so that movements in interest rates do not significantly adversely affect earnings and cash flows. When interest rates fluctuate, hedged assets and liabilities appreciate or depreciate in fair value or cash flows. Gains or losses on the derivative instruments that are linked to the hedged assets and liabilities are expected to substantially offset this unrealized appreciation or depreciation or changes in cash flows. The Company utilizes a third-party service to evaluate the effectiveness of its cash flow hedges on a quarterly basis. The effective portion of a gain or loss on a cash flow hedge is recorded in other comprehensive income, net of tax, and other assets or other liabilities on the consolidated statements of condition. The ineffective portions of cash flow hedging transactions are included in “other income” in the consolidated statements of income, if material.
Accounting for Postretirement Plans
. We use a December 31 measurement date to determine the expenses for our postretirement plans and related financial disclosure information. Postretirement plan expense is sensitive to changes in the number of eligible employees (and their related demographics) and to changes in the discount rate and other expected rates, such as medical cost trends rates. As with the computations on plan expense, cash contribution requirements are also sensitive to such changes.
Stock-Based Compensation
. The fair value of restricted stock and stock options is determined on the date of grant and amortized to compensation expense, with a corresponding increase in common stock, over the longer of the service period or performance period, but in no event beyond an employee’s retirement date. For performance-based restricted stock, we estimate the degree to which performance conditions will be met to determine the number of shares that will vest and the related compensation expense. Compensation expense is adjusted in the period such estimates change. Non-forfeitable dividends, if any, paid on shares of restricted stock are recorded to retained earnings for shares that are expected to vest and to compensation expense for shares that are not expected to vest.
Income Taxes
. We account for income taxes by deferring income taxes based on the estimated future tax effects of differences between the book and tax bases of assets and liabilities considering the provisions of enacted tax laws. These differences result in deferred tax assets and liabilities, which are included in the consolidated statements of condition. We must also assess the likelihood that any deferred tax assets will be recovered from future taxable income and establish a valuation allowance for those assets determined not likely to be recoverable. Judgment is required in determining the amount and timing of recognition of the resulting deferred tax assets and liabilities, including projections of future taxable income. Although we have determined a valuation allowance is not required for all deferred tax assets, there is no guarantee that these assets will be realized. Although not currently under review, income tax returns for the years ended December 31, 2010 through 2012 are open to audit by federal and Maine authorities. If we, as a result of an audit, were assessed interest and penalties, the amounts would be recorded through other non-interest expense on the consolidated statements of income.
26
Non-GAAP Financial Measures and Reconciliation to GAAP
In addition to evaluating the Company’s results of operations in accordance with GAAP, management supplements this evaluation with an analysis of certain non-GAAP financial measures, such as the efficiency ratio, tax equivalent net interest income, return on average tangible shareholders' equity, and tangible book value per share. We believe these non-GAAP financial measures help investors in understanding the Company’s operating performance and trends and allow for better performance comparisons to other banks. In addition, these non-GAAP financial measures remove the impact of unusual items that may obscure trends in the Company’s underlying performance. These disclosures should not be viewed as a substitute for GAAP operating results, nor are they necessarily comparable to non-GAAP performance measures that may be presented by other financial institutions.
Efficiency Ratio
. The efficiency ratio, which represents an approximate measure of the cost required for the Company to generate a dollar of revenue, is the ratio of (i) total non-interest expense excluding (a) Branch Acquisition and Divestiture costs, (b) prepayment penalties on borrowings, and (c) goodwill impairment (the numerator) to (ii) net interest income on a fully taxable equivalent basis (assumed 35% tax rate) plus total non-interest income excluding (a) net gains or losses on sale of securities, net of OTTI, (b) gain on the Branch Divestiture, (c) gain on sale of branch facility, and (d) proceeds from a 2010 legal settlement (the denominator).
|
At or for the Year Ended December 31,
|
||||||||||||||||||||
|
(In Thousands)
|
2013
|
2012
|
2011
|
2010
|
2009
|
|||||||||||||||
|
Non-interest expense, as presented
|
$
|
66,333
|
|
$
|
59,031
|
|
$
|
55,579
|
|
$
|
52,937
|
|
$
|
51,005
|
|
|||||
|
Less: Branch Acquisition and Divestiture costs
|
374
|
|
2,324
|
|
—
|
|
—
|
|
—
|
|
||||||||||
|
Less: prepayment penalties on borrowings
|
—
|
|
2,030
|
|
2,318
|
|
—
|
|
—
|
|
||||||||||
|
Less: goodwill impairment
|
2,830
|
|
—
|
|
50
|
|
—
|
|
—
|
|
||||||||||
|
Adjusted non-interest expense
|
$
|
63,129
|
|
$
|
54,677
|
|
$
|
53,211
|
|
$
|
52,937
|
|
$
|
51,005
|
|
|||||
|
Net interest income, as presented
|
$
|
75,475
|
|
$
|
73,745
|
|
$
|
75,219
|
|
$
|
74,290
|
|
$
|
73,011
|
|
|||||
|
Effect of tax-exempt income
|
808
|
|
988
|
|
1,212
|
|
1,452
|
|
1,628
|
|
||||||||||
|
Non-interest income
|
27,801
|
|
23,412
|
|
23,053
|
|
20,825
|
|
19,423
|
|
||||||||||
|
Less: net gains or (losses) on sale of securities, net of OTTI
|
785
|
|
2,498
|
|
2,076
|
|
(409
|
)
|
41
|
|
||||||||||
|
Less: gain on Branch Divestiture
|
2,742
|
|
—
|
|
—
|
|
—
|
|
—
|
|
||||||||||
|
Less: gain on sale of branch facility
|
—
|
|
479
|
|
—
|
|
—
|
|
—
|
|
||||||||||
|
Less: legal settlement proceeds
|
—
|
|
—
|
|
—
|
|
2,000
|
|
—
|
|
||||||||||
|
Adjusted net interest income plus
non-interest income
|
$
|
100,557
|
|
$
|
95,168
|
|
$
|
97,408
|
|
$
|
94,976
|
|
$
|
94,021
|
|
|||||
|
Non-GAAP efficiency ratio
|
62.78
|
%
|
57.45
|
%
|
54.63
|
%
|
55.74
|
%
|
54.26
|
%
|
||||||||||
|
GAAP efficiency ratio
|
64.23
|
%
|
60.76
|
%
|
56.49
|
%
|
55.53
|
%
|
55.17
|
%
|
||||||||||
Tax Equivalent Net Interest Income
. Tax-equivalent net interest income is net interest income plus the taxes that would have been paid had tax-exempt securities been taxable. This number attempts to enhance the comparability of the performance of assets that have different tax liabilities. The following table provides a reconciliation of tax equivalent net interest income to GAAP net interest income using a 35% tax rate.
|
At or for the Year Ended December 31,
|
||||||||||||||||||||
|
(In Thousands)
|
2013
|
2012
|
2011
|
2010
|
2009
|
|||||||||||||||
|
Net interest income, as presented
|
$
|
75,475
|
|
$
|
73,745
|
|
$
|
75,219
|
|
$
|
74,290
|
|
$
|
73,011
|
|
|||||
|
Effect of tax-exempt income
|
808
|
|
988
|
|
1,212
|
|
1,452
|
|
1,628
|
|
||||||||||
|
Net interest income, tax equivalent
|
$
|
76,283
|
|
$
|
74,733
|
|
$
|
76,431
|
|
$
|
75,742
|
|
$
|
74,639
|
|
|||||
27
Return on Average Tangible Shareholders' Equity.
Return on average tangible shareholders' equity is the ratio of (i) net income, adjusted for (a) tax effected amortization of intangible assets and (b) goodwill impairment (the numerator) to (ii) average shareholders' equity, adjusted for goodwill and other intangible assets. We believe this is a meaningful measure of our financial performance as it reflects the return on the equity deployed in our business and is a common measure within our industry.
|
At or for the Year Ended December 31,
|
||||||||||||||||||||
|
(In Thousands)
|
2013
|
2012
|
2011
|
2010
|
2009
|
|||||||||||||||
|
Net income, as presented
|
$
|
22,873
|
|
$
|
23,428
|
|
$
|
26,177
|
|
$
|
24,766
|
|
$
|
22,773
|
|
|||||
|
Tax effected amortization of intangible assets
|
747
|
|
427
|
|
375
|
|
375
|
|
376
|
|
||||||||||
|
Goodwill impairment
|
2,830
|
|
—
|
|
50
|
|
—
|
|
—
|
|
||||||||||
|
Net income, adjusted
|
$
|
26,450
|
|
$
|
23,855
|
|
$
|
26,602
|
|
$
|
25,141
|
|
$
|
23,149
|
|
|||||
|
Average shareholders' equity
|
$
|
233,888
|
|
$
|
227,129
|
|
$
|
215,311
|
|
$
|
199,428
|
|
$
|
177,730
|
|
|||||
|
Less: average goodwill and other intangible assets
|
52,708
|
|
46,253
|
|
45,533
|
|
46,115
|
|
46,688
|
|
||||||||||
|
Average tangible shareholders' equity
|
$
|
181,180
|
|
$
|
180,876
|
|
$
|
169,778
|
|
$
|
153,313
|
|
$
|
131,042
|
|
|||||
|
Return on average tangible shareholders' equity
|
14.55
|
%
|
13.19
|
%
|
15.67
|
%
|
16.40
|
%
|
17.67
|
%
|
||||||||||
|
Return on average shareholders' equity
|
9.74
|
%
|
10.31
|
%
|
12.16
|
%
|
12.42
|
%
|
12.81
|
%
|
||||||||||
Tangible Book Value per Share
. Tangible book value per share is the ratio of (i) shareholders’ equity less goodwill, premium on deposits and other acquisition-related intangibles (the numerator) to (ii) total common shares outstanding at period end. The following table reconciles tangible book value per share to book value per share. We believe this is a meaningful measure as it provides information to assess capital adequacy and is a common measure within our industry.
|
At or for the Year Ended December 31,
|
||||||||||||||||||||
|
(In Thousands, Except per Share Data)
|
2013
|
2012
|
2011
|
2010
|
2009
|
|||||||||||||||
|
Shareholders’ equity
|
$
|
231,096
|
|
$
|
233,815
|
|
$
|
218,876
|
|
$
|
205,995
|
|
$
|
190,561
|
|
|||||
|
Less: goodwill and other intangibles
|
49,319
|
|
53,299
|
|
45,194
|
|
45,821
|
|
46,379
|
|
||||||||||
|
Tangible shareholders’ equity
|
$
|
181,777
|
|
$
|
180,516
|
|
$
|
173,682
|
|
$
|
160,174
|
|
$
|
144,182
|
|
|||||
|
Shares outstanding at period end
|
7,579,913
|
|
7,622,750
|
|
7,664,975
|
|
7,658,496
|
|
7,644,837
|
|
||||||||||
|
Tangible book value per share
|
$
|
23.98
|
|
$
|
23.68
|
|
$
|
22.66
|
|
$
|
20.91
|
|
$
|
18.86
|
|
|||||
|
Book value per share
|
$
|
30.49
|
|
$
|
30.67
|
|
$
|
28.56
|
|
$
|
26.90
|
|
$
|
24.93
|
|
|||||
Results of Operations
For the year ended December 31, 2013, we reported net income of $22.8 million compared to $23.4 million for the year ended December 31, 2012, and $26.2 million for the year ended December 31, 2011. Diluted earnings per share for each of these years were $2.97, $3.05, and $3.40, respectively. The major components of these results, which include net interest income, provision for credit losses, non-interest income, non-interest expense, and income taxes, are discussed below.
Net Interest Income
Net interest income is interest earned on loans, securities, and other interest-earning assets, plus loan fees, less the interest paid on interest-bearing deposits and borrowings. Net interest income, which is our largest source of revenue accounting for approximately 73% of total revenues, is affected by factors including, but not limited to: changes in interest rates, loan and deposit pricing strategies and competitive conditions, the volume and mix of interest-earning assets and interest-bearing liabilities, and the level of non-performing assets. Net interest margin is calculated as net interest income on a fully taxable equivalent basis as a percentage of average interest-earning assets. Net interest margin for 2013, 2012 and 2011 of 3.20%, 3.36%, and 3.57%, respectively, has declined reflecting the challenging interest rate environment over the past three years. The historically low interest rate environment adversely affected our net interest income as (i) new loan volumes and investments earn the current market interest rates, and (ii) acceleration of borrower repayment of loans and investment cash flows are reinvested at lower interest rates.
28
Net interest income was $76.3 million on a fully-taxable equivalent basis for 2013, compared to $74.7 million for 2012, an increase of $1.6 million, or 2%. The increase in net interest income is reflective of 7% growth in average interest-earning assets during 2013 partially offset by a 16 basis point decline in our net interest margin to 3.20% in 2013 from 3.36% in 2012. In the fourth quarter of 2012, the Company completed the Branch Acquisition that resulted in $287.6 million of deposits. The Company’s long-term strategy is to leverage these deposits by funding loan growth in the new branch locations over a five-year period. In the short-term, the Company reduced borrowings, lowered interest rates on our deposit base and purchased investment securities. As a result of the acquired deposits and strategies to deploy these funds, average investment balances for 2013 increased $124.9 million, or 18%, average loan balances increased $45.2 million, or 3%, and average deposits increased $230.5 million, or 15%. The yield on our average earning assets decreased 41 basis points during 2013 compared to a 26 basis point decrease on our average cost of funding. Yield on our earning assets averaged 3.73% in 2013 compared to 4.14% in 2012 as both the investment and loan portfolio yields continue to be impacted by the current low interest rate environment. The cost of funds averaged 0.55% in 2013, compared to 0.81% in 2012 due to a shift in the funding mix to low cost deposits combined with the repricing of certificates of deposit and borrowings to lower interest rates.
Net interest income was $74.7 million on a fully-taxable equivalent basis for 2012, compared to $76.4 million for 2011, a decrease of $1.7 million, or 2%. The decrease in net interest income is due to the 21 basis point decline in our net interest margin to 3.36% in 2012 from 3.57% in 2011. The yield on our average earning assets decreased 51 basis points during 2012 compared to a 31 basis point decrease in our average cost of funding. Yield on our earning assets averaged 4.14% in 2012 compared to 4.65% in 2011, as amortization and prepayments on loans and investments were reinvested at lower rates, particularly in the investment portfolio. The average investment balances for 2012 increased $69.4 million, or 11%, as the Company actively redeployed investment cash flows and pre-invested a portion of the liquidity expected from the Branch Acquisition. The cost of funds averaged 0.81% in 2012, compared to 1.12% in 2011. The decrease in the cost of funds was reflective of disciplined deposit pricing, whereby interest rates on various deposit products were lowered throughout 2012 in response to market conditions. Additionally, customer deposits held in higher costing time deposits continued to decline as customers continue to shift to more liquid deposit instruments given the current low interest rate environment. Average balance sheet growth was funded primarily by growth in average core deposits (demand deposits, interest checking, savings and money market accounts) of $148.1 million, or 15%. Average deposits in 2012 were $102.0 million higher than 2011 due to the Branch Acquisition in the fourth quarter of 2012. Average borrowings (including brokered deposits) decreased $38.7 million in 2012 as compared to the prior year.
The following table presents, for the years noted, average balances, interest income, interest expense, and the corresponding average yields earned and rates paid, as well as net interest income, net interest rate spread and net interest margin:
29
|
Average Balance, Interest and Yield/Rate Analysis
|
|||||||||||||||||||||||||||||||||
|
December 31,
|
|||||||||||||||||||||||||||||||||
|
|
2013
|
2012
|
2011
|
||||||||||||||||||||||||||||||
|
(Dollars in Thousands)
|
Average Balance
|
Interest
|
Yield/Rate
|
Average Balance
|
Interest
|
Yield/Rate
|
Average Balance
|
Interest
|
Yield/Rate
|
||||||||||||||||||||||||
|
ASSETS
|
|
|
|
|
|
|
|
|
|
|
|
|
|
|
|
|
|
|
|||||||||||||||
|
Interest-earning assets:
|
|
|
|
|
|
|
|
|
|
|
|
|
|
|
|
|
|
|
|||||||||||||||
|
Securities – taxable
|
$
|
772,095
|
|
$
|
16,751
|
|
2.17
|
%
|
$
|
640,779
|
|
$
|
16,646
|
|
2.60
|
%
|
$
|
564,418
|
|
$
|
18,497
|
|
3.28
|
%
|
|||||||||
|
Securities – nontaxable
(1)
|
30,672
|
|
1,799
|
|
5.87
|
%
|
37,163
|
|
2,130
|
|
5.73
|
%
|
44,112
|
|
2,556
|
|
5.79
|
%
|
|||||||||||||||
|
Trading account assets
|
2,295
|
|
34
|
|
1.48
|
%
|
2,214
|
|
43
|
|
1.94
|
%
|
2,245
|
|
39
|
|
1.74
|
%
|
|||||||||||||||
|
Federal funds sold
|
—
|
|
—
|
|
—
|
|
5,601
|
|
14
|
|
0.25
|
%
|
—
|
|
—
|
|
—
|
|
|||||||||||||||
|
Loans
(2)
:
|
|
|
|
|
|
|
|
|
|
|
|
|
|||||||||||||||||||||
|
Residential real estate
|
571,291
|
|
25,209
|
|
4.41
|
%
|
573,227
|
|
27,210
|
|
4.75
|
%
|
590,238
|
|
30,184
|
|
5.11
|
%
|
|||||||||||||||
|
Commercial real estate
|
515,501
|
|
24,764
|
|
4.80
|
%
|
491,732
|
|
24,572
|
|
5.00
|
%
|
463,581
|
|
25,381
|
|
5.47
|
%
|
|||||||||||||||
|
Commercial
|
173,933
|
|
7,591
|
|
4.36
|
%
|
169,043
|
|
7,961
|
|
4.71
|
%
|
175,760
|
|
9,007
|
|
5.12
|
%
|
|||||||||||||||
|
Municipal
(1)
|
11,799
|
|
508
|
|
4.31
|
%
|
14,473
|
|
694
|
|
4.80
|
%
|
19,465
|
|
910
|
|
4.68
|
%
|
|||||||||||||||
|
Consumer
|
308,335
|
|
12,369
|
|
4.01
|
%
|
287,173
|
|
12,665
|
|
4.41
|
%
|
281,596
|
|
13,010
|
|
4.62
|
%
|
|||||||||||||||
|
Total loans
|
1,580,859
|
|
70,441
|
|
4.46
|
%
|
1,535,648
|
|
73,102
|
|
4.76
|
%
|
1,530,640
|
|
78,492
|
|
5.13
|
%
|
|||||||||||||||
|
Total interest-earning assets
|
2,385,921
|
|
89,025
|
|
3.73
|
%
|
2,221,405
|
|
91,935
|
|
4.14
|
%
|
2,141,415
|
|
99,584
|
|
4.65
|
%
|
|||||||||||||||
|
Cash and due from banks
|
43,879
|
|
|
|
|
|
42,165
|
|
|
|
|
|
36,168
|
|
|
|
|
|
|||||||||||||||
|
Other assets
|
167,557
|
|
|
|
|
|
154,970
|
|
|
|
|
|
154,550
|
|
|
|
|
|
|||||||||||||||
|
Less: ALL
|
(22,968
|
)
|
(23,050
|
)
|
(22,850
|
)
|
|||||||||||||||||||||||||||
|
Total assets
|
$
|
2,574,389
|
|
$
|
2,395,490
|
|
$
|
2,309,283
|
|
||||||||||||||||||||||||
|
LIABILITIES & SHAREHOLDERS’ EQUITY
|
|
|
|
|
|
|
|
|
|
|
|
|
|
|
|
|
|
|
|||||||||||||||
|
Deposits:
|
|
|
|
|
|
|
|
|
|
|
|
|
|
|
|
|
|
|
|||||||||||||||
|
Non-interest bearing demand deposits
|
$
|
246,637
|
|
$
|
—
|
|
—
|
|
$
|
240,369
|
|
$
|
—
|
|
—
|
|
$
|
246,995
|
|
$
|
—
|
|
—
|
|
|||||||||
|
Interest checking accounts
|
471,331
|
|
324
|
|
0.07
|
%
|
351,232
|
|
336
|
|
0.10
|
%
|
258,322
|
|
509
|
|
0.20
|
%
|
|||||||||||||||
|
Savings accounts
|
237,110
|
|
133
|
|
0.06
|
%
|
195,800
|
|
285
|
|
0.15
|
%
|
171,840
|
|
426
|
|
0.25
|
%
|
|||||||||||||||
|
Money market accounts
|
442,908
|
|
1,346
|
|
0.30
|
%
|
382,274
|
|
2,019
|
|
0.53
|
%
|
344,369
|
|
2,369
|
|
0.69
|
%
|
|||||||||||||||
|
Certificates of deposit
|
387,816
|
|
3,856
|
|
0.99
|
%
|
385,666
|
|
4,998
|
|
1.30
|
%
|
431,850
|
|
6,322
|
|
1.46
|
%
|
|||||||||||||||
|
Total deposits
|
1,785,802
|
|
5,659
|
|
0.32
|
%
|
1,555,341
|
|
7,638
|
|
0.49
|
%
|
1,453,376
|
|
9,626
|
|
0.66
|
%
|
|||||||||||||||
|
Borrowings:
|
|
|
|
|
|
|
|
|
|
|
|
|
|
|
|
|
|
|
|||||||||||||||
|
Brokered deposits
|
118,423
|
|
1,414
|
|
1.19
|
%
|
117,815
|
|
1,655
|
|
1.40
|
%
|
120,143
|
|
1,965
|
|
1.64
|
%
|
|||||||||||||||
|
Junior subordinated debentures
|
43,871
|
|
2,532
|
|
5.77
|
%
|
43,769
|
|
2,546
|
|
5.82
|
%
|
43,666
|
|
2,614
|
|
5.99
|
%
|
|||||||||||||||
|
Other borrowings
|
360,948
|
|
3,137
|
|
0.87
|
%
|
414,566
|
|
5,363
|
|
1.29
|
%
|
451,034
|
|
8,948
|
|
1.98
|
%
|
|||||||||||||||
|
Total borrowings
|
523,242
|
|
7,083
|
|
1.35
|
%
|
576,150
|
|
9,564
|
|
1.66
|
%
|
614,843
|
|
13,527
|
|
2.20
|
%
|
|||||||||||||||
|
Total funding liabilities
|
2,309,044
|
|
12,742
|
|
0.55
|
%
|
2,131,491
|
|
17,202
|
|
0.81
|
%
|
2,068,219
|
|
23,153
|
|
1.12
|
%
|
|||||||||||||||
|
Other liabilities
|
31,457
|
|
|
|
|
|
36,870
|
|
|
|
|
|
25,753
|
|
|
|
|
|
|||||||||||||||
|
Shareholders’ equity
|
233,888
|
|
227,129
|
|
215,311
|
|
|||||||||||||||||||||||||||
|
Total liabilities and shareholders’ equity
|
$
|
2,574,389
|
|
|
$
|
2,395,490
|
|
$
|
2,309,283
|
|
|||||||||||||||||||||||
|
Net interest income (fully-taxable equivalent)
|
|
|
76,283
|
|
|
|
|
|
74,733
|
|
|
|
|
|
76,431
|
|
|
|
|||||||||||||||
|
Less: fully-taxable equivalent adjustment
|
(808
|
)
|
(988
|
)
|
(1,212
|
)
|
|||||||||||||||||||||||||||
|
Net interest income
|
$
|
75,475
|
|
$
|
73,745
|
|
$
|
75,219
|
|
||||||||||||||||||||||||
|
Net interest rate spread (fully-taxable equivalent)
|
3.18
|
%
|
3.33
|
%
|
3.53
|
%
|
|||||||||||||||||||||||||||
|
Net interest margin (fully-taxable equivalent)
|
3.20
|
%
|
3.36
|
%
|
3.57
|
%
|
|||||||||||||||||||||||||||
(1) Reported on tax-equivalent basis calculated using a rate of 35%.
(2) Non-accrual loans are included in total average loans.
30
The following table presents certain information on a fully-taxable equivalent basis regarding changes in interest income and interest expense for the periods indicated. For each category of interest-earning assets and interest-bearing liabilities, information is provided with respect to changes attributable to rate and volume.
|
December 31, 2013 vs. 2012
Increase (Decrease) Due to:
|
December 31, 2012 vs. 2011
Increase (Decrease) Due to:
|
|||||||||||||||||||||||
|
(Dollars in Thousands)
|
Volume
|
Rate
|
Total
|
Volume
|
Rate
|
Total
|
||||||||||||||||||
|
Interest-earning assets:
|
|
|
|
|
|
|
|
|
|
|
|
|
||||||||||||
|
Securities – taxable
|
$
|
3,414
|
|
$
|
(3,309
|
)
|
$
|
105
|
|
$
|
2,505
|
|
$
|
(4,356
|
)
|
$
|
(1,851
|
)
|
||||||
|
Securities – nontaxable
|
(372
|
)
|
41
|
|
(331
|
)
|
(402
|
)
|
(24
|
)
|
(426
|
)
|
||||||||||||
|
Trading account assets
|
2
|
|
(11
|
)
|
(9
|
)
|
(1
|
)
|
5
|
|
4
|
|
||||||||||||
|
Federal funds sold
|
(14
|
)
|
—
|
|
(14
|
)
|
14
|
|
—
|
|
14
|
|
||||||||||||
|
Residential real estate
|
(92
|
)
|
(1,909
|
)
|
(2,001
|
)
|
(869
|
)
|
(2,105
|
)
|
(2,974
|
)
|
||||||||||||
|
Commercial real estate
|
1,188
|
|
(996
|
)
|
192
|
|
1,540
|
|
(2,349
|
)
|
(809
|
)
|
||||||||||||
|
Commercial
|
230
|
|
(600
|
)
|
(370
|
)
|
(344
|
)
|
(702
|
)
|
(1,046
|
)
|
||||||||||||
|
Municipal
|
(128
|
)
|
(58
|
)
|
(186
|
)
|
(234
|
)
|
18
|
|
(216
|
)
|
||||||||||||
|
Consumer
|
933
|
|
(1,229
|
)
|
(296
|
)
|
258
|
|
(603
|
)
|
(345
|
)
|
||||||||||||
|
Total interest income
|
5,161
|
|
(8,071
|
)
|
(2,910
|
)
|
2,467
|
|
(10,116
|
)
|
(7,649
|
)
|
||||||||||||
|
Interest-bearing liabilities:
|
||||||||||||||||||||||||
|
Interest checking accounts
|
120
|
|
(132
|
)
|
(12
|
)
|
186
|
|
(359
|
)
|
(173
|
)
|
||||||||||||
|
Savings accounts
|
62
|
|
(214
|
)
|
(152
|
)
|
60
|
|
(201
|
)
|
(141
|
)
|
||||||||||||
|
Money market accounts
|
321
|
|
(994
|
)
|
(673
|
)
|
262
|
|
(612
|
)
|
(350
|
)
|
||||||||||||
|
Certificates of deposit
|
28
|
|
(1,170
|
)
|
(1,142
|
)
|
(674
|
)
|
(650
|
)
|
(1,324
|
)
|
||||||||||||
|
Brokered deposits
|
9
|
|
(250
|
)
|
(241
|
)
|
(38
|
)
|
(272
|
)
|
(310
|
)
|
||||||||||||
|
Junior subordinated debentures
|
6
|
|
(20
|
)
|
(14
|
)
|
6
|
|
(74
|
)
|
(68
|
)
|
||||||||||||
|
Borrowings
|
(692
|
)
|
(1,534
|
)
|
(2,226
|
)
|
(722
|
)
|
(2,863
|
)
|
(3,585
|
)
|
||||||||||||
|
Total interest expense
|
(146
|
)
|
(4,314
|
)
|
(4,460
|
)
|
(920
|
)
|
(5,031
|
)
|
(5,951
|
)
|
||||||||||||
|
Net interest income (fully-taxable equivalent)
|
$
|
5,307
|
|
$
|
(3,757
|
)
|
$
|
1,550
|
|
$
|
3,387
|
|
$
|
(5,085
|
)
|
$
|
(1,698
|
)
|
||||||
Provision and Allowance for Loan Losses
The provision for loan losses is a recorded expense determined by management that adjusts the allowance for loan losses to a level, which, in management’s best estimate, is necessary to absorb probable losses within the existing loan portfolio. The provision for loan losses reflects loan quality trends, including, among other factors, the levels of and trends related to non-accrual loans, past due loans, potential problem loans, criticized loans, net charge-offs or recoveries and growth in the loan portfolio. Accordingly, the amount of the provision reflects both the necessary increases in the allowance for loan losses related to newly identified criticized loans, as well as the actions taken related to other loans including, among other things, any necessary increases or decreases in required allowances for specific loans or loan pools. The provision for credit losses for 2013 totaled $2.0 million, or 0.13% of average loans, compared to $3.8 million, or 0.25% of average loans, for 2012 and $4.7 million, or 0.31% of average loans, for 2011. Please see “— Financial Condition — Asset Quality” for additional discussion regarding the allowance for loan losses.
31
Non-Interest Income
The following table presents the components of non-interest income for the years ended December 31, 2013, 2012, and 2011:
|
Year Ended December 31,
|
||||||||||||||||||||||||||
|
2013
|
2012
|
Change from
|
2011
|
Change from
|
||||||||||||||||||||||
|
2013 to 2012
|
2012 to 2011
|
|||||||||||||||||||||||||
|
(Dollars in Thousands)
|
$
|
%
|
$
|
%
|
||||||||||||||||||||||
|
Service charges on deposit accounts
|
$
|
6,740
|
|
$
|
5,557
|
|
$
|
1,183
|
|
21
|
%
|
$
|
5,134
|
|
$
|
423
|
|
8
|
%
|
|||||||
|
Other service charges and fees
|
5,971
|
|
4,061
|
|
1,910
|
|
47
|
%
|
3,577
|
|
484
|
|
14
|
%
|
||||||||||||
|
Income from fiduciary services
|
4,751
|
|
5,038
|
|
(287
|
)
|
(6
|
)%
|
6,027
|
|
(989
|
)
|
(16
|
)%
|
||||||||||||
|
Brokerage and insurance commissions
|
1,697
|
|
1,491
|
|
206
|
|
14
|
%
|
1,363
|
|
128
|
|
9
|
%
|
||||||||||||
|
Mortgage banking income, net
|
1,406
|
|
588
|
|
818
|
|
139
|
%
|
729
|
|
(141
|
)
|
(19
|
)%
|
||||||||||||
|
Bank-owned life insurance
|
1,310
|
|
1,382
|
|
(72
|
)
|
(5
|
)%
|
2,173
|
|
(791
|
)
|
(36
|
)%
|
||||||||||||
|
Gain on Branch Divestiture
|
2,742
|
|
—
|
|
2,742
|
|
—
|
|
—
|
|
—
|
|
—
|
|
||||||||||||
|
Net gain on sale of securities and OTTI
|
785
|
|
2,498
|
|
(1,713
|
)
|
(69
|
)%
|
2,076
|
|
422
|
|
20
|
%
|
||||||||||||
|
Other income
|
2,399
|
|
2,797
|
|
(398
|
)
|
(14
|
)%
|
1,974
|
|
823
|
|
42
|
%
|
||||||||||||
|
Total non-interest income
|
$
|
27,801
|
|
$
|
23,412
|
|
$
|
4,389
|
|
19
|
%
|
$
|
23,053
|
|
$
|
359
|
|
2
|
%
|
|||||||
|
Non-interest income as a percentage of total revenues
(1)
|
27
|
%
|
24
|
%
|
23
|
%
|
||||||||||||||||||||
(1) Revenue is defined as net interest income plus non-interest income.
Non-interest income for 2013 was $27.8 million, representing an increase of $4.4 million, or 19%, compared to 2012. The significant changes in non-interest income in 2013 compared to 2012 include:
|
•
|
An increase in deposit-related services (including other service charges and fees) of $3.1 million primarily due to the full year benefit in volume and activity resulting from the Branch Acquisition that occurred in the fourth quarter of 2012 that included over 25,000 new customer accounts;
|
|
•
|
An increase in mortgage banking income is due to an increase in net gains recognized on the sale of mortgages of $460,000, and an associated increase in servicing fee income of $358,000 attributable to MSRs;
|
|
•
|
A gain of $2.7 million resulting from the Branch Divestiture; and
|
|
•
|
A decrease in net gain on sale of securities during 2013 of $1.7 million.
|
Non-interest income for 2012 was $23.4 million, representing an increase of $359,000, or 2%, compared to 2011. The significant changes in non-interest income in 2012 compared to 2011 include:
|
•
|
An increase in deposit-related service fees (including other service charges and fees) of $907,000 as the result of an increase in service fees associated with the redesign of our deposit products and two months of fees from new customers we acquired through the Branch Acquisition;
|
|
•
|
A decrease in fiduciary income of $989,000 as a result of the outsourcing of the Company’s employee benefits business line;
|
|
•
|
An increase in other income of $823,000 primarily due to a $479,000 gain on the sale of a branch facility;
|
|
•
|
A decrease in bank-owned life insurance income of $791,000 due to non-recurring life insurance proceeds of $740,000 recorded in 2011; and
|
|
•
|
An increase in net gains on the sale of securities of $422,000.
|
32
Non-Interest Expenses
The following table presents the components of non-interest expense for the years ended December 31, 2013, 2012, and 2011:
|
Year Ended December 31,
|
||||||||||||||||||||||||||
|
2013
|
2012
|
Change from
|
2011
|
Change from
|
||||||||||||||||||||||
|
2013 to 2012
|
2012 to 2011
|
|||||||||||||||||||||||||
|
(Dollars in Thousands)
|
$
|
%
|
$
|
%
|
||||||||||||||||||||||
|
Salaries and employee benefits
|
$
|
32,609
|
|
$
|
29,689
|
|
$
|
2,920
|
|
10
|
%
|
$
|
28,627
|
|
$
|
1,062
|
|
4
|
%
|
|||||||
|
Furniture, equipment and data processing
|
7,051
|
|
5,079
|
|
1,972
|
|
39
|
%
|
4,773
|
|
306
|
|
6
|
%
|
||||||||||||
|
Net occupancy
|
5,449
|
|
4,365
|
|
1,084
|
|
25
|
%
|
3,949
|
|
416
|
|
11
|
%
|
||||||||||||
|
Other real estate owned and collection costs
|
2,162
|
|
2,284
|
|
(122
|
)
|
(5
|
)%
|
2,104
|
|
180
|
|
9
|
%
|
||||||||||||
|
Consulting and professional fees
|
2,337
|
|
1,818
|
|
519
|
|
29
|
%
|
2,629
|
|
(811
|
)
|
(31
|
)%
|
||||||||||||
|
Regulatory assessments
|
1,997
|
|
1,793
|
|
204
|
|
11
|
%
|
1,955
|
|
(162
|
)
|
(8
|
)%
|
||||||||||||
|
Amortization of intangible assets
|
1,150
|
|
657
|
|
493
|
|
75
|
%
|
577
|
|
80
|
|
14
|
%
|
||||||||||||
|
Goodwill impairment
|
2,830
|
|
—
|
|
2,830
|
|
—
|
|
50
|
|
(50
|
)
|
—
|
|
||||||||||||
|
Branch Acquisition and Divestiture costs
|
374
|
|
2,324
|
|
(1,950
|
)
|
(84
|
)%
|
—
|
|
2,324
|
|
—
|
|
||||||||||||
|
Prepayment fees on borrowings
|
—
|
|
2,030
|
|
(2,030
|
)
|
—
|
|
2,318
|
|
(288
|
)
|
(12
|
)%
|
||||||||||||
|
Other expenses
|
10,374
|
|
8,992
|
|
1,382
|
|
15
|
%
|
8,597
|
|
395
|
|
5
|
%
|
||||||||||||
|
Total non-interest expenses
|
$
|
66,333
|
|
$
|
59,031
|
|
$
|
7,302
|
|
12
|
%
|
$
|
55,579
|
|
$
|
3,452
|
|
6
|
%
|
|||||||
|
Efficiency ratio (Non-GAAP)
(1)
|
62.78
|
%
|
57.45
|
%
|
54.63
|
%
|
||||||||||||||||||||
(1) Refer to Item 7. "Management's Discussion and Analysis of Financial Condition and Results of Operations — Non-GAAP Financial Measures and Reconciliation to GAAP" for details of calculation.
Non-interest expenses for 2013 were $66.3 million, representing an increase of $7.3 million, or 12%, compared to 2012. The significant changes in non-interest expense in 2013 compared to 2012 include:
|
•
|
An increase in salaries and employee benefits of $2.9 million, or 10%, primarily due to the addition of approximately 75 employees for a full year as part of the Branch Acquisition that occurred in October 2012. The increase in employees was necessary to support operations at the additional branches and operational resources to support the increase in production and activities;
|
|
•
|
An increase in furniture, equipment and data processing and net occupancy costs totaling $3.1 million, or 32%, primarily attributable to the additional costs associated with maintaining and operating 12 additional branch facilities, including, but not limited to, rent expense and building maintenance, depreciation and amortization expense, and data processing fees. Also, with a full year impact of the Branch Acquisition, adding over 25,000 customers and ongoing upgrades to our on-line banking platform, our on-line and mobile banking fees increased $723,000 in 2013 compared to 2012;
|
|
•
|
An increase of $2.8 million resulting from a goodwill impairment charge recorded in 2013 related to our financial services reporting unit. The goodwill write-down is a non-recurring charge that did not occur during 2012;
|
|
•
|
A decrease in Branch Acquisition and Divestiture costs of $2.0 million, or 84%, in 2013 compared to 2012. The conversion and integration costs incurred during 2012 were related to the Branch Acquisition, while the costs incurred during 2013 were related to the Branch Divestiture. These costs are non-recurring in nature; and
|
|
•
|
A decrease of $2.0 million in costs associated with the prepayment of borrowings in 2012.
|
33
Non-interest expenses for 2012 were $59.0 million, representing an increase of $3.5 million, or 6%, compared to 2011. The significant changes in non-interest expense in 2012 compared to 2011 include:
|
•
|
One-time conversion and integration costs of acquired branches of $2.3 million;
|
|
•
|
Increase in salaries and employee benefits of $1.1 million, or 4%, primarily due to merit increases and new positions associated with the branch acquisition, and increased health insurance cost of $245,000, or 8%; and
|
|
•
|
Decrease in consulting and professional fees of $811,000 during the year primarily due to the outsourcing of the employee benefits business line.
|
Goodwill Impairment
Our annual impairment evaluation of goodwill associated with the banking reporting unit did not identify any impairment in 2013. We engaged an independent valuation firm to assist with the goodwill impairment assessment for the financial services reporting unit as of November 30, 2013 as qualitative factors suggested that it was more-likely-than-not that the fair value of the reporting unit was less than its carrying amount. These qualitative factors included a decline in the revenue base as the result of (i) a decision to focus on our core business of managing assets and administering trusts for families and local nonprofit organizations resulting in a lower revenue base by increasing account minimums and transferring smaller relationships to affiliates; and (ii) divesting the employee benefits product line. Also in the fourth quarter of 2013, new information became available resulting in us refining our approach of who represents a market participant for our financial services reporting unit and reassessing the valuation implications imposed by the required regulatory capital requirements.
We performed the two-step goodwill impairment test in accordance with GAAP. In performing step 1, two separate valuation methodologies were used to determine the fair value of the financial services reporting unit - (i) a discounted cash flow valuation technique (income approach) and (ii) a comparison of the price to revenue and assets under management of comparable market participant transactions (market approach). Both methods indicated the fair value of the financial services reporting unit was less than its carrying value. The step 2 analysis was then performed, and the results indicated the financial services reporting unit goodwill was impaired as the implied fair value of goodwill was less than its carrying value. As a result, we recorded a non-cash goodwill impairment charge of $2.8 million related to the financial services reporting unit included within non-interest expense in the consolidated statements of income for the year ended December 31, 2013. The impairment was caused by lower forecasted revenue, an increase in the discount rate, the anticipated market participants and increased regulatory driven operating costs and capital levels required by potential market participants which impacts the valuation metrics.
The fair value of the financial services reporting unit goodwill as of November 30, 2013 was determined by evenly weighting the income and market approach. The income approach utilized a discounted cash flow method, which is based on the expected future cash flows of the reporting unit. The key assumptions within the discounted cash flow model include projected assets under management and revenue growth, projected margin, and the discount rate. The market approach measures fair value based on what other market participants have paid for assets that can be considered reasonably similar to those being valued. Changes in key inputs and assumptions, including a lower rate of revenue or net income than forecasted and lower market multiples, could have a negative effect on the fair value of this reporting unit, which in turn could result in an impairment charge to goodwill in future periods. The unobservable inputs are highly uncertain as future cash flow projections can be impacted by change economic factors or regulator changes not currently considered. See Note 5 of the consolidated financial statements for further discussion of key inputs and assumptions.
The annual impairment evaluation of goodwill did not identify any impairment for 2012.
Income Taxes
Income tax expense totaled $12.1 million, $10.9 million, and $11.8 million for the years ended December 31, 2013, 2012 and 2011, respectively. The Company’s effective income tax rate was 34.7% 31.7%, 31.0% in each of the past three years, respectively. These effective rates differ from our marginal rate of about 35%, primarily due to our non-taxable interest income from state and political subdivisions obligations, life insurance income, and tax credits received. Our 2013 effective tax rate increased 3.0% compared to 2012, primarily as a result of the goodwill impairment charge of $2.8 million, which was a non-deductible expense. Full detail of these amounts can be found in Note 11 to the consolidated financial statements.
34
Impact of Inflation and Changing Prices
The consolidated financial statements and the notes to the consolidated financial statements presented in Item 8. “Financial Statements and Supplementary Data,” have been prepared in accordance with GAAP, which require the measurement of the financial position and operating results in terms of historical dollars and, in some case, current fair values without considering changes in the relative purchasing power of money over time due to inflation. Unlike many industrial companies, substantially all of our assets and virtually all of our liabilities are monetary in nature. As a result, interest rates have a more significant impact on our performance than the general level of inflation. Over short periods of time, interest rates and the yield curve may not necessarily move in the same direction or in the same magnitude as inflation.
Financial Condition
Overview
Total assets at December 31, 2013 were $2.6 billion, an increase of $39.1 million, or 2%, compared to December 31, 2012. The increase in total assets was primarily due to growth of our loan portfolio and investment portfolio. Total loans grew $62.6 million, representing 4% organic loan growth for 2013, after adjusting for $46.0 million of loans sold in the Branch Divestiture. Our investment portfolio grew $26.1 million, or 3%, during 2013.
Total liabilities were $2.4 billion at December 31, 2013, representing an increase of $41.8 million, or 2%, compared to December 31, 2012. Total deposits decreased $115.6 million, reflecting the impact of the Branch Divestiture of $80.4 million of deposits combined with a decline in retail certificates of deposit of $52.7 million (adjusted for retail certificate of deposits sold as part of the Branch Divestiture). Total shareholders’ equity decreased $2.7 million, which was primarily attributable to a decrease in other comprehensive income of $15.3 million and dividends declared of $8.3 million in 2013, offset by 2013 earnings of $22.8 million.
Average assets during 2013 were $2.6 billion, an increase of $178.9 million, or 7%, compared to 2012. The increase is largely due to the increase in average interest-earning assets during 2013 of $164.5 million, representing growth of 7% during the year. Average funding liabilities increased $177.6 million, or 8%, in 2013 compared to 2012, reflecting the full year benefit of the Branch Acquisition with average deposits increasing $230.5 million during 2013, partially offset by a decrease in average borrowings of $52.9 million.
Investment Securities
We invest in securities of U.S. government sponsored enterprises, states and political subdivisions, mortgage-backed securities (collateralized mortgage obligations and pass-through securities), FHLB and FRB stock, and investment grade corporate bonds and equities to diversify our revenues, interest rate and credit risk, and to provide for liquidity and funding needs. Total investment securities increased $26.1 million to $828.2 million at December 31, 2013.
Our portfolio of residential mortgage-backed securities is directly impacted by the interest rate environment and yield curve. The FRB’s actions, designed to lower longer term interest rates, have directly affected the interest income earned on our residential mortgage backed securities by accelerating prepayments and, consequently, the timing of our premium amortization due to the retroactive catch up adjustment required under the application of the interest method. In addition, the current rate environment and yield curve also decrease the yield earned upon reinvestment of the repayment proceeds, impacting our net interest income and margin. As of December 31, 2013, the amount of net premiums on our mortgage-backed securities to be recognized in future periods amounted to $7.3 million, which equated to a weighted-average premium above par of approximately 1.0%. Subsequent changes to the interest rate environment will continue to impact our yield.
Our AFS securities portfolio is primarily invested in residential mortgage-backed securities, which comprised 95% of our total AFS portfolio at December 31, 2013 and 2012. During 2013, the Company purchased approximately $205.0 million in mortgage-backed securities ($151.3 million in pass-through securities and $53.7 million in collateralized mortgage obligation). During 2013 and 2012, the Company sold $16.8 million and $113.0 million in AFS securities, respectively, primarily pass-through securities based on an assessment of their potential prepayment risk. The Company recognized net gains on the sale of these securities of $785,000 and $2.5 million in 2013 and 2012, respectively. The overall mix of securities within the portfolio for 2013 compared to 2012 remains unchanged and well positioned to provide a stable source of cash flow. The duration of our AFS securities increased modestly to 3.98 years at December 31, 2013 from 3.64 years at December 31, 2012.
35
Unrealized gains or losses on AFS securities are recorded as adjustments to shareholders’ equity, net of related deferred income taxes, and the change in unrealized gains or losses are a component of OCI in the consolidated statements of changes in shareholders’ equity and the consolidated statements of comprehensive income. At December 31, 2013, unrealized losses on AFS securities, net of deferred tax benefits, totaled $8.0 million, compared to $12.9 million of unrealized gains, net of deferred tax liabilities, at December 31, 2012. The unrealized gains and losses represent the difference between the fair value and the amortized cost of our securities that fluctuates in response to changes in market interest rates, changes in credit spreads, or levels of liquidity in the market. The change from unrealized gains to losses of $20.9 million during 2013 was primarily attributable to the increase in market interest rates and not representative of a credit deterioration of our investment portfolio.
Within our AFS portfolio, we hold senior tranches of Non-Agencies, which were rated Triple-A by Moody’s, S&P and/or Fitch at the time of purchase. At December 31, 2013, five of our Non-Agencies were non-investment grade, with fair values of $6.0 million, and unrealized losses of $393,000. We believe that the decline in the fair values is temporary and does not reflect deterioration in the credit. The Company has the intent and ability to hold these securities until recovery and will continue to evaluate the unrealized losses within our portfolio each quarter to determine if the impairment is other-than-temporary.
Each month we determine if a security has OTTI by evaluating the present value of projected credit losses that result from a discounted cash flow analysis. The analyses include several stress tests scenarios, which determine expected cash flows and forecast potential losses. Stress tests, which are performed monthly on higher risk investments (non-investment grade and/or coverage ratio of less than 1.00), use current statistical data to determine expected cash flows and forecast potential losses. Information on the securities is sourced from the Bloomberg and FTM models, which enables management to track loan and performance data for the individual tranche and the entire issue as well as prepayment history. We review the significant inputs of the discounted cash flow analysis to ensure reasonableness and a prudent measure; we compare the Bloomberg assumptions to the assumptions used by FTN Financial, which is a division of First Tennessee Bank. Included in the monthly analyses is a review of the performance of the individual tranches held and the related entire issue, a base case and several stress test scenarios. The base case stress test uses both current data and historical performance and provides a basis for determining if a credit loss is projected during the life of the investment. When deemed appropriate, the significant inputs for the base case stress test are adjusted to better reflect future expected cash flows.
Based on the results of this analysis, no OTTI write-downs were recorded during 2013, compared to $39,000 in 2012 and $109,000 in 2011.
During 2013, the Company did not sell any of its Non-Agency securities. During 2012, the Company recorded proceeds of $2.0 million on the sale of one below investment grade Non-Agency investment classified as AFS, which resulted in a realized loss of $39,000.
36
The following table presents the carrying amount and fully-taxable equivalent weighted-average yields of our AFS investment securities by contractual maturity as of the dates indicated.
|
December 31,
|
||||||||||||||||||||||||||||
|
|
2013
|
2012
|
2011
|
|||||||||||||||||||||||||
|
(In thousands)
|
Due in
1 year or less
|
Due in
1 – 5 years
|
Due in 5 – 10 years
|
Due in over 10 years
|
Carrying Value
|
Carrying Value
|
Carrying Value
|
|||||||||||||||||||||
|
Obligations of U.S. government sponsored enterprises
|
$
|
—
|
|
$
|
—
|
|
$
|
—
|
|
$
|
—
|
|
$
|
—
|
|
$
|
—
|
|
$
|
30,107
|
|
|||||||
|
Obligations of states and political subdivisions
|
1,666
|
|
11,401
|
|
16,326
|
|
1,814
|
|
31,207
|
|
33,040
|
|
39,758
|
|
||||||||||||||
|
Mortgage-backed securities issued or guaranteed by U.S. government sponsored enterprises
|
1
|
|
9,546
|
|
91,092
|
|
295,264
|
|
395,903
|
|
358,148
|
|
376,934
|
|
||||||||||||||
|
Collateralized mortgage obligations issued or guaranteed by U.S. government sponsored enterprises
|
—
|
|
9,486
|
|
47,897
|
|
317,052
|
|
374,435
|
|
381,688
|
|
128,450
|
|
||||||||||||||
|
Private issue collateralized mortgage obligations
|
—
|
|
—
|
|
—
|
|
6,932
|
|
6,932
|
|
8,174
|
|
10,641
|
|
||||||||||||||
|
Total debt securities
|
1,667
|
|
30,433
|
|
155,315
|
|
621,062
|
|
808,477
|
|
781,050
|
|
585,890
|
|
||||||||||||||
|
Equity securities (no fixed maturity)
|
—
|
|
—
|
|
—
|
|
—
|
|
—
|
|
—
|
|
4,146
|
|
||||||||||||||
|
Total AFS securities
|
$
|
1,667
|
|
$
|
30,433
|
|
$
|
155,315
|
|
$
|
621,062
|
|
$
|
808,477
|
|
$
|
781,050
|
|
$
|
590,036
|
|
|||||||
|
Weighted average yield on AFS securities
|
4.23
|
%
|
2.95
|
%
|
2.53
|
%
|
2.11
|
%
|
|
|
|
|
|
|
||||||||||||||
Federal Home Loan Bank Stock
We are required to maintain a level of investment in FHLBB stock based on the level of our FHLBB advances. As of December 31, 2013 and 2012, our investment in FHLBB stock totaled $18.8 million and $20.1 million, respectively. No market exists for shares of the FHLBB. FHLBB stock may be redeemed at par value five years following termination of FHLBB membership, subject to limitations or restrictions that may be imposed by the FHLBB or its regulator, the Federal Housing Finance Agency, to maintain capital adequacy of the FHLBB. While we currently have no intention to terminate our FHLBB membership, the ability to redeem our investment in FHLBB stock would be subject to the conditions imposed by the FHLBB. In 2013 and 2012, $1.3 million and $928,000 of FHLBB stock was repurchased from the Company, respectively.
Loans
We provide loans primarily to customers located within our geographic market area. At December 31, 2013, total loans of $1.6 billion increased $16.5 million from December 31, 2012, which includes loan sales associated with the Branch Divestiture of $46.0 million in October 2013.
37
The following table sets forth the composition of our loan portfolio at the dates indicated.
|
December 31,
|
|||||||||||||||||||||||||||||||||||
|
(Dollars in Thousands)
|
2013
|
2012
|
2011
|
2010
|
2009
|
||||||||||||||||||||||||||||||
|
Residential real estate
|
$
|
569,819
|
|
36
|
%
|
$
|
572,173
|
|
37
|
%
|
$
|
578,262
|
|
38
|
%
|
$
|
596,308
|
|
39
|
%
|
$
|
627,655
|
|
41
|
%
|
||||||||||
|
Commercial real estate
|
541,099
|
|
34
|
%
|
506,231
|
|
32
|
%
|
470,061
|
|
31
|
%
|
464,037
|
|
30
|
%
|
434,783
|
|
28
|
%
|
|||||||||||||||
|
Commercial
|
179,203
|
|
11
|
%
|
190,454
|
|
12
|
%
|
185,045
|
|
12
|
%
|
180,592
|
|
12
|
%
|
191,214
|
|
13
|
%
|
|||||||||||||||
|
Consumer and home equity
|
290,281
|
|
19
|
%
|
295,008
|
|
19
|
%
|
280,660
|
|
19
|
%
|
283,815
|
|
19
|
%
|
273,106
|
|
18
|
%
|
|||||||||||||||
|
Total loans
|
$
|
1,580,402
|
|
100
|
%
|
$
|
1,563,866
|
|
100
|
%
|
$
|
1,514,028
|
|
100
|
%
|
$
|
1,524,752
|
|
100
|
%
|
$
|
1,526,758
|
|
100
|
%
|
||||||||||
Residential real estate loans
. Residential real estate loans consist of loans secured by one-to four-family residences. We generally retain in our portfolio adjustable-rate mortgages and fixed-rate mortgages with original terms of 20 years or less. Based on market risk assessments, we may retain 30-year fixed-rate mortgages. During 2013, we originated and sold $33.3 million in residential fixed-rate 30-year production on the secondary market to Freddie Mac. Residential real estate loan balances declined $2.4 million in 2013 due to loan sales combined with a drop in mortgage loan volume and refinance activity during the second half of 2013 as the Treasury rates climbed approximately 100 basis points during 2013. In 2012, residential real estate loan balances decreased $6.1 million compared to 2011 partially due to a shift to the home equity loan product and mortgage loan sales of $16.9 million.
Commercial real estate loans
. Commercial real estate loans consist of loans secured by income and non-income producing commercial real estate. We focus on lending to financially sound business customers primarily within our geographic marketplace, as well as offering loans for the acquisition, development and construction of commercial real estate. The most significant industry concentrations are the non-residential building operators industry (operators of commercial and industrial buildings, retail establishments, theaters, banks and insurance buildings) and the lodging industry (inns, bed & breakfasts, ski lodges, tourist cabins, hotels, and motels). At December 31, 2013, exposure to these two industries, as a percentage of total commercial real estate loans, was 28% and 25%, respectively. Commercial real estate loans at December 31, 2013 increased $34.9 million, or 7%, compared to December 31, 2012. In 2012, commercial real estate loans increased $36.2 million, or 8%, from 2011.
Commercial loans
. Commercial loans consist of loans secured by various corporate assets, as well as loans to provide working capital in the form of lines of credit, which may be secured or unsecured. Municipal loans primarily consist of short-term tax anticipation notes made to municipalities for fixed asset or construction-related purposes and are included in commercial loans. We focus on lending to financially sound business customers and municipalities within our geographic marketplace. Commercial loans at December 31, 2013 decreased $11.3 million, or 6%, compared to December 31, 2012. The decrease is primarily attributable to the commercial loans sold with the Branch Divestiture of $6.1 million. In 2012, commercial loans increased $5.4 million, or 3%, from 2011, which was primarily due to loans acquired with the Branch Acquisition of $5.7 million.
Consumer loans and home equity loans
. Consumer loans and home equity loans are originated for a wide variety of purposes designed to meet the needs of our customers. Consumer loans include overdraft protection, automobile, boat, recreational vehicle, and mobile home loans, home equity loans and lines, and secured and unsecured personal loans. In 2013, consumer and home equity loans decreased by $4.7 million, or 2%, from 2012, largely due to loan sales of $32.6 million associated with the Branch Divestiture. When adjusting for the loan sales, we had growth in the consumer and home equity loan portfolios during 2013 of 9%. In 2012, consumer and home equity loans increased by $14.3 million, or 5%, from 2011, largely due to a ten-year fixed-rate home equity promotion and a car loan campaign.
Asset Quality
The Bank's board of directors monitors credit risk through the Directors’ Loan Review Committee, which reviews large credit exposures, monitors the external loan review reports, reviews the lending authority for individual loan officers when required, and has approval authority and responsibility for all matters regarding the loan policy and other credit-related policies, including reviewing and monitoring asset quality trends, concentration levels, and the ALL methodology. The Corporate Risk Management Group and the Credit Risk Policy Committee oversee management’s systems and procedures to monitor the credit quality of the loan portfolio, conduct a loan review program, maintain the integrity of the loan rating system, determine the adequacy of the ALL, and support the oversight efforts of the Directors' Loan Review Committee and the board of directors. Our practice is to proactively manage the portfolio such that management can identify problem credits early, assess and
38
implement effective work-out strategies, and take charge-offs as promptly as practical. In addition, management continuously reassesses its underwriting standards in response to credit risk posed by changes in economic conditions.
Non-Performing Assets
. Non-performing assets include non-accrual loans, accruing loans 90 days or more past due, accruing renegotiated loans, and property acquired through foreclosure or repossession. The level of our non-performing assets over the past five years is shown in the table below. Non-performing assets represented 1.18% of total assets as of December 31, 2013, compared to 1.13% at year-end 2012, primarily as a result of one large relationship being placed on non-accrual status in 2013.
|
December 31,
|
||||||||||||||||||||
|
(Dollars in Thousands)
|
2013
|
2012
|
2011
|
2010
|
2009
|
|||||||||||||||
|
Non-accrual loans
|
|
|
|
|
|
|
|
|
|
|
||||||||||
|
Residential real estate loans
|
$
|
10,520
|
|
$
|
10,584
|
|
$
|
9,503
|
|
$
|
7,225
|
|
$
|
6,161
|
|
|||||
|
Commercial real estate
|
7,799
|
|
6,719
|
|
7,830
|
|
6,072
|
|
6,476
|
|
||||||||||
|
Commercial loans
|
2,146
|
|
3,409
|
|
3,955
|
|
4,421
|
|
4,145
|
|
||||||||||
|
Consumer and home equity loans
|
2,012
|
|
1,771
|
|
2,822
|
|
1,721
|
|
1,158
|
|
||||||||||
|
Non-accrual loans
|
22,477
|
|
22,483
|
|
24,110
|
|
19,439
|
|
17,940
|
|
||||||||||
|
Accruing loans past due 90 days
|
455
|
|
611
|
|
236
|
|
711
|
|
1,135
|
|
||||||||||
|
Accruing renegotiated loans not included above
|
5,468
|
|
4,674
|
|
3,276
|
|
2,295
|
|
581
|
|
||||||||||
|
Total non-performing loans
|
28,400
|
|
27,768
|
|
27,622
|
|
22,445
|
|
19,656
|
|
||||||||||
|
Other real estate owned
|
2,195
|
|
1,313
|
|
1,682
|
|
2,387
|
|
5,479
|
|
||||||||||
|
Total non-performing assets
|
$
|
30,595
|
|
$
|
29,081
|
|
$
|
29,304
|
|
$
|
24,832
|
|
$
|
25,135
|
|
|||||
|
Non-performing loans to total loans
|
1.80
|
%
|
1.78
|
%
|
1.82
|
%
|
1.47
|
%
|
1.29
|
%
|
||||||||||
|
Allowance for credit losses to non-performing loans
|
76.09
|
%
|
83.15
|
%
|
83.38
|
%
|
99.44
|
%
|
103.26
|
%
|
||||||||||
|
Non-performing assets to total assets
|
1.18
|
%
|
1.13
|
%
|
1.27
|
%
|
1.08
|
%
|
1.13
|
%
|
||||||||||
|
Allowance for credit losses to non-performing assets
|
70.63
|
%
|
79.40
|
%
|
78.59
|
%
|
89.88
|
%
|
80.75
|
%
|
||||||||||
Generally, a loan is classified as non-accrual when interest and/or principal payments are 90 days past due or when management believes collecting all principal and interest owed is in doubt. All previously accrued but unpaid interest on non-accrual loans is reversed from interest income in the current period. Interest payments received on non-accrual loans (including impaired loans) are applied as a reduction of principal. A loan remains on non-accrual status until all principal and interest amounts contractually due are brought current, all future principal and interest payments are reasonably assured, and a consistent repayment record, generally six consecutive payments, has been demonstrated.
Non-accrual loans were $22.5 million at December 31, 2013 and 2012. While non-accrual loans balances appear relatively flat year-over-year, this is largely due to one significant real estate secured relationship totaling $4.1 million being placed on non-accruing status in 2013. Non-accrual loans at December 31, 2013, adjusted for this one significant relationship, decreased $4.1 million, or 18%, compared to December 31, 2012, and represented 1.17% of total loans compared to 1.44% at December 31, 2012. Our ratio of non-accrual loans to total loans at December 31, 2013, as adjusted, represents our lowest ratio of non-accruals to total loans since 2009. Adjusting for the one significant relationship, the decrease in our non-accrual loans balance and our ratio of non-accrual loans to total loans is reflective of an overall improvement in the financial condition of our borrowers combined with an increase in our auction activity in 2013 as foreclosures have reached their conclusion.
The OREO balance at December 31, 2013 consisted of 16 properties, including ten residential properties and six commercial/mixed use properties. At December 31, 2012, the OREO balance consisted of nine properties, including six residential properties and three commercial/mixed use properties. We experienced significant auction activity in 2013 as foreclosure actions, which can average up to two years in Maine, reached conclusion. In comparison to 2012, our 2013 auction activity was more than double that of 2012. Properties that do not sell to third parties at auction are purchased by the Bank and transferred from our loan portfolio to OREO. The December 31, 2013 OREO balance also includes a Bank property that has been listed for sale upon completion of the Branch Acquisition. Once a property is transferred to OREO, we periodically obtain updated third party appraisals to value the property, and, if the value has decreased, a subsequent write-down is recorded. During 2013, the Company recorded OREO write-downs of $170,000 related to five properties, compared to write-downs of $161,000 related to four properties in 2012.
39
During 2013, accruing renegotiated loans increased $794,000 compared to 2012, reflecting the Company’s commitment to work with borrowers as financial challenges arise.
Interest income that would have been recognized if loans on non-accrual status had been current in accordance with their original terms was approximately $990,000 in 2013 and $1.1 million in both 2012 and 2011. Interest income attributable to these loans included in the consolidated statements of income amounted to approximately $239,000, $186,000, and $141,000 in 2013, 2012 and 2011, respectively.
Potential Problem Loans
. Potential problem loans consist of classified accruing commercial and commercial real estate loans that were between 30 and 89 days past due. Such loans are characterized by weaknesses in the financial condition of our borrowers or collateral deficiencies. Based on historical experience, the credit quality of some of these loans may improve due to changes in collateral values or the financial condition of the borrowers, while the credit quality of other loans may deteriorate, resulting in some amount of loss. These loans are not included in the above analysis of non-accrual loans. At December 31, 2013, potential problem loans amounted to approximately $2.3 million, or 0.14% of total loans, compared to $2.2 million, or 0.14% of total loans, at December 31, 2012.
Past Due Loans
. Past due loans consist of accruing loans that were between 30 and 89 days past due. The following table sets presents past due loans at the dates indicated:
|
(Dollars in Thousands)
|
December 31, 2013
|
December 31, 2012
|
||||||
|
Loans 30 – 89 days past due:
|
|
|
|
|
||||
|
Residential real estate loans
|
$
|
1,551
|
|
$
|
1,658
|
|
||
|
Commercial real estate loans
|
2,595
|
|
2,618
|
|
||||
|
Commercial loans
|
313
|
|
1,043
|
|
||||
|
Consumer and home equity loans
|
1,571
|
|
2,721
|
|
||||
|
Total loans 30 – 89 days past due
|
$
|
6,030
|
|
$
|
8,040
|
|
||
|
Loans 30 – 89 days past due to total loans
|
0.38
|
%
|
0.51
|
%
|
||||
Allowance for Loan Losses
. We use a methodology to systematically measure the amount of estimated loan loss exposure inherent in the loan portfolio for purposes of establishing a sufficient ALL. The ALL is management’s best estimate of the probable loan losses as of the balance sheet date. The allowance is increased by provisions charged to earnings and by recoveries of amounts previously charged-off, and is reduced by charge-offs on loans.
Prior to 2013, we performed our annual assessment of the loss allocation factors for our various loan portfolios and pools during the first calendar quarter of the year. In 2013, we performed this assessment in the first quarter and, again, in the fourth quarter. We believe performing this assessment in advance of the Company's calendar year end and financial reporting is a best practice and, going forward, we will continue to perform annually in the fourth quarter of the calendar year. In conjunction with our fourth quarter assessment of the loss allocation factors, we eliminated a pool of smaller-balanced non-performing residential loans and released the related allowance. The net effect to the ALL was a $945,000 release of the allocated allowance. This pool was created prior to 2013 when the Company was experiencing significant increases in non-performing residential real estate secured loans as a result of post-recession consumer strain. The associated reserve was based on estimated fair value of the loans if sold as a group. While the loans in the pool shared certain characteristics, the qualifying pool composition varied period-over-period. We determined the sale of loans as a group was less likely and discontinued the use of a separate pool. Loans that were formerly part of this pooling methodology are now being evaluated for an allowance as part of the loss allocation factor analysis.
Reserve for Unfunded Commitments
. The reserve for unfunded commitments is based on management’s estimate of the amount required to reflect the probable inherent losses on outstanding letters and unused loan credit lines. Adequacy of the reserve is determined using a methodology similar to the one that analyzes the allowance for loan losses. Additionally, management must also estimate the likelihood that these commitments would be funded and become loans.
40
The following table sets forth information concerning the activity in our ALL during the periods indicated:
|
Years Ended December 31,
|
||||||||||||||||||||
|
(Dollars in Thousands)
|
2013
|
2012
|
2011
|
2010
|
2009
|
|||||||||||||||
|
Allowance for loan losses at the beginning of period
|
$
|
23,044
|
|
$
|
23,011
|
|
$
|
22,293
|
|
$
|
20,246
|
|
$
|
17,691
|
|
|||||
|
Provision for loan losses
|
2,052
|
|
3,791
|
|
4,741
|
|
6,325
|
|
8,162
|
|
||||||||||
|
Charge-offs:
|
|
|
|
|
|
|
|
|
|
|
||||||||||
|
Residential real estate loans
|
1,059
|
|
1,197
|
|
1,216
|
|
1,262
|
|
792
|
|
||||||||||
|
Commercial real estate loans
|
952
|
|
593
|
|
1,633
|
|
1,382
|
|
1,844
|
|
||||||||||
|
Commercial loans
|
1,426
|
|
1,393
|
|
1,256
|
|
1,502
|
|
2,640
|
|
||||||||||
|
Consumer and home equity loans
|
837
|
|
1,319
|
|
920
|
|
1,401
|
|
1,180
|
|
||||||||||
|
Total loan charge-offs
|
4,274
|
|
4,502
|
|
5,025
|
|
5,547
|
|
6,456
|
|
||||||||||
|
Recoveries:
|
|
|
|
|
|
|
|
|
|
|
||||||||||
|
Residential real estate loans
|
35
|
|
73
|
|
120
|
|
225
|
|
10
|
|
||||||||||
|
Commercial real estate loans
|
122
|
|
222
|
|
374
|
|
232
|
|
127
|
|
||||||||||
|
Commercial loans
|
495
|
|
406
|
|
296
|
|
553
|
|
306
|
|
||||||||||
|
Consumer and home equity loans
|
116
|
|
43
|
|
212
|
|
259
|
|
406
|
|
||||||||||
|
Total loan recoveries
|
768
|
|
744
|
|
1,002
|
|
1,269
|
|
849
|
|
||||||||||
|
Net charge-offs
|
3,506
|
|
3,758
|
|
4,023
|
|
4,278
|
|
5,607
|
|
||||||||||
|
Allowance for loan losses at the end of the period
|
$
|
21,590
|
|
$
|
23,044
|
|
$
|
23,011
|
|
$
|
22,293
|
|
$
|
20,246
|
|
|||||
|
Components of allowance for credit losses:
|
|
|
|
|
|
|
|
|
|
|
||||||||||
|
Allowance for loan losses
|
$
|
21,590
|
|
$
|
23,044
|
|
$
|
23,011
|
|
$
|
22,293
|
|
$
|
20,246
|
|
|||||
|
Liability for unfunded credit commitments
|
21
|
|
45
|
|
20
|
|
25
|
|
51
|
|
||||||||||
|
Balance of allowance for credit losses at end of the period
|
$
|
21,611
|
|
$
|
23,089
|
|
$
|
23,031
|
|
$
|
22,318
|
|
$
|
20,297
|
|
|||||
|
Average loans outstanding
|
$
|
1,580,859
|
|
$
|
1,535,648
|
|
$
|
1,530,640
|
|
$
|
1,534,069
|
|
$
|
1,508,204
|
|
|||||
|
Net charge-offs to average loans outstanding
|
0.22
|
%
|
0.24
|
%
|
0.26
|
%
|
0.28
|
%
|
0.37
|
%
|
||||||||||
|
Provision for credit losses to average loans outstanding
|
0.13
|
%
|
0.25
|
%
|
0.31
|
%
|
0.41
|
%
|
0.54
|
%
|
||||||||||
|
Allowance for loan losses to total loans
|
1.37
|
%
|
1.48
|
%
|
1.52
|
%
|
1.46
|
%
|
1.33
|
%
|
||||||||||
|
Allowance for credit losses to net charge-offs
|
616.57
|
%
|
613.20
|
%
|
572.59
|
%
|
521.61
|
%
|
361.99
|
%
|
||||||||||
|
Allowance for loan losses to non-performing loans
|
76.02
|
%
|
82.99
|
%
|
83.31
|
%
|
99.32
|
%
|
103.00
|
%
|
||||||||||
During 2013, the Company provided $2.1 million of expense to the ALL compared to $3.8 million for 2012. The decrease in the provision for loan losses was primarily a result of stabilized asset quality ratios and a decline in net loan charge-offs. Non-performing assets as a percentage of total assets was 1.18% at December 31, 2013 compared to 1.13% and 1.27% at December 31, 2012 and 2011, respectively. Overall, economic conditions in Maine experienced minimal change during 2013, with modest gains in the unemployment rate and real estate values. Weaknesses in the real estate markets persist, particularly in the residential real estate market, where consumers face employment uncertainty and increasing interest rates compared to 2012. Economic forecasts for Maine continue to push the state’s recovery out past 2015, lagging the national recovery by one to two years. As updated financial statements are being collected and analyzed, indications are of a slightly improved general financial condition among commercial customers. Auction activity has increased, resulting in more sales than transfers into OREO. We remain vigilant in the monitoring of asset quality and continue to be proactive in resolving credit issues and managing through the economic cycle. We believe the ALL of $21.6 million, or 1.37% of total loans outstanding and 76.02% of total non-performing loans at December 31, 2013, was appropriate given the current economic conditions in our service area
41
and the condition of the loan portfolio. The ALL was 1.48% of total loans outstanding and 82.99% of total non-performing loans at December 31, 2012.
For further discussion of the ALL, please refer to “Critical Accounting Policies” above and Notes 1 and 4 of the consolidated financial statements.
The following table sets forth information concerning the allocation of the ALL by loan categories at the dates indicated.
|
As of December 31,
|
|||||||||||||||||||||||||||||||||||
|
|
2013
|
2012
|
2011
|
2010
|
2009
|
||||||||||||||||||||||||||||||
|
(Dollars in Thousands)
|
Amount
|
Percent of Loans in Each Category to Total Loans
|
Amount
|
Percent of Loans in Each Category to Total Loans
|
Amount
|
Percent of Loans in Each Category to Total Loans
|
Amount
|
Percent of Loans in Each Category to Total Loans
|
Amount
|
Percent of Loans in Each Category to Total Loans
|
|||||||||||||||||||||||||
|
Balance at end of year applicable to:
|
|
|
|
|
|
|
|
|
|
|
|
|
|
|
|
|
|
|
|
|
|||||||||||||||
|
Residential real estate loans
|
$
|
5,603
|
|
36
|
%
|
$
|
6,996
|
|
37
|
%
|
$
|
6,398
|
|
38
|
%
|
$
|
3,273
|
|
39
|
%
|
$
|
2,693
|
|
41
|
%
|
||||||||||
|
Commercial real estate loans
|
4,374
|
|
34
|
%
|
4,549
|
|
32
|
%
|
5,702
|
|
31
|
%
|
8,198
|
|
30
|
%
|
6,930
|
|
28
|
%
|
|||||||||||||||
|
Commercial loans
|
6,220
|
|
11
|
%
|
5,933
|
|
12
|
%
|
4,846
|
|
12
|
%
|
5,633
|
|
12
|
%
|
5,015
|
|
13
|
%
|
|||||||||||||||
|
Consumer and home equity loans
|
2,722
|
|
19
|
%
|
2,704
|
|
19
|
%
|
3,124
|
|
19
|
%
|
2,253
|
|
19
|
%
|
1,957
|
|
18
|
%
|
|||||||||||||||
|
Unallocated
|
2,671
|
|
N/A
|
|
2,862
|
|
N/A
|
|
2,941
|
|
N/A
|
|
2,936
|
|
N/A
|
|
3,651
|
|
N/A
|
|
|||||||||||||||
|
|
$
|
21,590
|
|
100
|
%
|
$
|
23,044
|
|
100
|
%
|
$
|
23,011
|
|
100
|
%
|
$
|
22,293
|
|
100
|
%
|
$
|
20,246
|
|
100
|
%
|
||||||||||
Investment in Bank-Owned Life Insurance
BOLI amounted to $46.4 million and $45.1 million at December 31, 2013 and 2012, respectively, with the net increase due to normal increases in the cash surrender value. BOLI provides a means to mitigate increasing employee benefit costs. We expect to benefit from the BOLI contracts as a result of the tax-free growth in cash surrender value and death benefits that are expected to be generated over time. The largest risk to the BOLI program is credit risk of the insurance carriers. To mitigate this risk, annual financial condition reviews are completed on all carriers. BOLI is invested in the “general account” of quality insurance companies or in separate account products. All such general account carriers were rated “A-” or better by two of the three major rating agencies at December 31, 2013. BOLI is included in the consolidated statements of condition at its cash surrender value. Increases in BOLI’s cash surrender value are reported as a component of non-interest income in the consolidated statements of income.
Deposits
The Bank receives checking, savings and time deposits primarily from customers located within its geographic market area, from the brokered deposit market, and the Certificate of Deposit Account Registry System. Total deposits of $1.8 billion at December 31, 2013 decreased $115.6 million, or 6%, from 2012. The decrease is largely attributable to the Branch Divestiture that accounted for $80.4 million of the decrease in deposits, as well as a decrease in retail certificates of deposit of $52.7 million (adjusted for retail certificates of deposit sold as part of the Branch Divestiture).
Total deposits of $1.9 billion at December 31, 2012 increased $338.1 million from 2011 due to the Branch Acquisition that resulted in $287.6 million in deposits as well as our continued organic growth in core deposits. Brokered funds decreased $9.5 million, or 9%, as a result of the increase in core deposits.
42
Borrowings and Advances
In 2013, other borrowed funds increased $170.1 million from 2012 largely due to an increase in FHLBB less than 90 day advances of $230.0 million, partially offset by a decrease in our commercial repurchase agreements of $36.0 million. In 2012, borrowings decreased $96.1 million, or 21%, from 2011 primarily due to decreases in FHLBB short-term advances of $80.5 million and overnight borrowings of $17.2 million. The Company prepaid $35.0 million in wholesale borrowings in 2012, resulting in prepayment penalties totaling $2.0 million. These borrowings had an average cost of 3.22% and an average remaining maturity of 25 months.
The borrowings we utilized have primarily been short-term advances from the FHLBB. In addition, we use federal funds, treasury, tax and loan deposits and repurchase agreements secured by U.S. government or agency securities. The following table presents certain information regarding short-term borrowings included in other borrowed funds as of or for the years ended:
|
December 31,
|
||||||||||||
|
(Dollars in Thousands)
|
2013
|
2012
|
2011
|
|||||||||
|
Balance outstanding at end of year
|
$
|
398,932
|
|
$
|
192,681
|
|
$
|
247,928
|
|
|||
|
Average balance outstanding
|
271,281
|
|
261,335
|
|
220,847
|
|
||||||
|
Maximum amount outstanding at any month-end during the year
|
398,932
|
|
346,786
|
|
332,321
|
|
||||||
|
Weighted average interest rate during the year
|
0.19
|
%
|
0.21
|
%
|
0.34
|
%
|
||||||
|
Weighted average interest rate at end of year
|
0.16
|
%
|
0.18
|
%
|
0.19
|
%
|
||||||
FHLB advances at December 31, 2013 were $56.1 million, which is a decrease of $292,000 compared to December 31, 2012. FHLB advances are collateralized by a blanket lien on qualified collateral consisting primarily of loans with first mortgages secured by one- to four-family properties, certain commercial real estate loans, certain pledged investment securities and other qualified assets. The carrying value of residential real estate and commercial loans pledged as collateral was $742.8 million and $671.5 million at December 31, 2013 and 2012, respectively. The carrying value of securities pledged as collateral at the FHLB was $3.7 million and $7.0 million at December 31, 2013 and 2012, respectively.
Shareholders’ Equity
Total shareholders’ equity at December 31, 2013 was $231.1 million, which was a decrease of $2.7 million, or 1%, since December 31, 2012. The decrease in shareholders' equity at December 31, 2013 compared to 2012 is largely attributable to the following factors:
|
•
|
Net unrealized losses of $15.3 million, net of tax, on AFS securities, postretirement plans, and derivative instruments recorded within OCI. The net unrealized losses recorded within OCI during 2013 are primarily attributable to the increase in interest rates during 2013, which decreased the fair value of our investments, while increasing the fair value of our derivatives and postretirement benefits;
|
|
•
|
The repurchase of 68,145 shares of the Company's common stock during 2013 under the Company's 2013 Repurchase Plan. The Company paid $2.8 million for these shares at a weighted-average price of $40.78; and
|
|
•
|
Net income of $22.8 million for 2013, partially offset by dividends declared during the year of $8.3 million. The Company declared dividends payable for 2013 of $1.08 per share, which is an increase of $0.08 per share, or 8%;
|
The following table presents certain information regarding shareholders’ equity for the years ended:
|
December 31,
|
||||||||||||
|
|
2013
|
2012
|
2011
|
|||||||||
|
Return on average shareholders' equity
|
9.74
|
%
|
10.31
|
%
|
12.16
|
%
|
||||||
|
Average shareholders' equity to average assets
|
9.09
|
%
|
9.48
|
%
|
9.32
|
%
|
||||||
|
Dividend payout ratio
|
36.30
|
%
|
32.73
|
%
|
44.05
|
%
|
||||||
|
Dividends declared per share
|
$
|
1.08
|
|
$
|
1.00
|
|
$
|
1.50
|
|
|||
|
Book value per share
|
30.49
|
|
30.67
|
|
28.56
|
|
||||||
43
Liquidity
Our liquidity needs require the availability of cash to meet the withdrawal demands of depositors and credit commitments to borrowers. Liquidity is defined as our ability to maintain availability of funds to meet customer needs, as well as to support our asset base. The primary objective of liquidity management is to maintain a balance between sources and uses of funds to meet our cash flow needs in the most economical and expedient manner. Due to the potential for unexpected fluctuations in both deposits and loans, active management of liquidity is necessary. We maintain various sources of funding and levels of liquid assets in excess of regulatory guidelines in order to satisfy their varied liquidity demands. We monitor liquidity in accordance with internal guidelines and all applicable regulatory requirements. As of December 31, 2013 and 2012, our level of liquidity exceeded target levels. We believe that we currently have appropriate liquidity available to respond to liquidity demands. Sources of funds that we utilize consist of deposits, borrowings from the FHLBB and other sources, cash flows from operations, prepayments and maturities of outstanding loans, investments and mortgage-backed securities and the sales of mortgage loans.
Deposits continue to represent our primary source of funds. In 2013, average deposits (excluding brokered deposits) of $1.8 billion increased $230.5 million compared to 2012. The significant increase is reflective of a full year impact of the deposits acquired of $287.6 million as part of the Branch Acquisition in October 2012. With the continued low interest rate environment, we continue to be focused on providing products to our customers that meet their liquidity needs while providing competitive interest rates.
Included in our money market and interest checking deposit categories are deposits from our wealth management subsidiary, Acadia Trust, which represent client funds. The deposits in the Acadia Trust client accounts, which totaled $108.1 million at December 31, 2013, fluctuate with changes in the portfolios of the clients of Acadia Trust.
The maturity dates of certificates of deposit, including brokered certificates of deposit, in denominations of $100,000 or more are set forth in the following table. These deposits are generally considered to be more rate sensitive than other deposits and, therefore, more likely to be withdrawn to obtain higher yields elsewhere if available.
|
(Dollars in Thousands)
|
December 31, 2013
|
|||
|
Time remaining until maturity:
|
|
|
||
|
Less than 3 months
|
$
|
19,765
|
|
|
|
3 months through 6 months
|
17,737
|
|
||
|
6 months through 12 months
|
30,561
|
|
||
|
Over 12 months
|
95,852
|
|
||
|
|
$
|
163,915
|
|
|
Borrowings, including FHLBB advances, are used to supplement deposits as a source of liquidity. In addition to borrowings and advances from the FHLBB, we utilize brokered deposits, purchase federal funds, sell securities under agreements to repurchase and utilize treasury, tax, and loan accounts. Average borrowings, including FHLBB advances and brokered deposits, and long-term debt for 2013 were $523.2 million, a decrease of $52.9 million, or 9%, from 2012. We secure borrowings from the FHLBB, whose advances remain the largest non-deposit-related funding source, with qualified residential real estate loans, certain investment securities and certain other assets available to be pledged. Through the Bank, we have an available line of credit with the FHLBB of $9.9 million at December 31, 2013 and 2012. We had no outstanding balance on the line of credit with the FHLBB at December 31, 2013. Long-term borrowings represent securities sold under repurchase agreements with major brokerage firms and a note payable with a maturity date over one year. Both wholesale and retail repurchase agreements are secured by mortgage-backed securities and government sponsored enterprises. The Company has $10.0 million in other lines of credit with a maturity date of December 20, 2014. We had no outstanding balance on these lines of credit at December 31, 2013.
44
We believe the investment portfolio and residential loan portfolio provide a significant amount of contingent liquidity that could be accessed in a reasonable time period through sales of those portfolios. We also believe that we have additional untapped access to the brokered deposit market, commercial reverse repurchase transaction market and the FRB discount window. These sources are considered as liquidity alternatives in our contingent liquidity plan. We believe that the level of liquidity is sufficient to meet current and future funding requirements; however, changes in economic conditions, including consumer saving habits and the availability or access to the national brokered deposit and commercial repurchase markets, could significantly impact our liquidity position.
Loan demand also affects our liquidity position. Of the loans maturing over one year, approximately 52% are variable rate loans. The following table presents the maturities of loans at December 31, 2013:
|
(Dollars in Thousands)
|
< 1 Year
|
1 Through
5 Years
|
More than
5 Years
|
Total
|
||||||||||||
|
Maturity Distribution:
|
|
|
|
|
|
|
|
|
||||||||
|
Fixed Rate:
|
|
|
|
|
|
|
|
|
||||||||
|
Residential real estate
|
$
|
1,027
|
|
$
|
14,783
|
|
$
|
417,068
|
|
$
|
432,878
|
|
||||
|
Commercial real estate
|
23,058
|
|
56,367
|
|
55,619
|
|
135,044
|
|
||||||||
|
Commercial
|
6,973
|
|
31,073
|
|
22,559
|
|
60,605
|
|
||||||||
|
Consumer and home equity
|
1,865
|
|
15,576
|
|
105,782
|
|
123,223
|
|
||||||||
|
Total Fixed Rate
|
32,923
|
|
117,799
|
|
601,028
|
|
751,750
|
|
||||||||
|
Variable Rate:
|
|
|
|
|
|
|
|
|
||||||||
|
Residential real estate
|
18
|
|
802
|
|
136,121
|
|
$
|
136,941
|
|
|||||||
|
Commercial real estate
|
6,492
|
|
44,467
|
|
355,096
|
|
406,055
|
|
||||||||
|
Commercial
|
34,005
|
|
29,454
|
|
55,139
|
|
118,598
|
|
||||||||
|
Consumer and home equity
|
891
|
|
920
|
|
165,247
|
|
167,058
|
|
||||||||
|
Total Variable Rate
|
41,406
|
|
75,643
|
|
711,603
|
|
828,652
|
|
||||||||
|
|
$
|
74,329
|
|
$
|
193,442
|
|
$
|
1,312,631
|
|
$
|
1,580,402
|
|
||||
Capital Resources
Under FRB guidelines, we are required to maintain capital based on risk-adjusted assets. These capital requirements represent quantitative measures of our assets, liabilities and certain off-balance sheet items as calculated under regulatory accounting practices. Our capital classification is also subject to qualitative judgments by our regulators about components, risk weightings and other factors. Quantitative measures established by regulation to ensure capital adequacy require us to maintain minimum amounts and ratios of total and Tier I capital (as defined in the regulations) to risk-weighted assets (as defined in the regulations), and of Tier I capital to average assets (as defined in the regulations). These guidelines apply to us on a consolidated basis. Under the current guidelines, banking organizations must maintain a risk-based capital ratio of 8.0%, of which at least 4.0% must be in the form of core capital (as defined in the regulations). In addition to risk-based capital requirements, the FRB requires bank holding companies to maintain a minimum leverage capital ratio of core capital to total assets of 4.0%. Total assets for this purpose do not include goodwill and any other intangible assets and investments that the FRB determines should be deducted. The Company's actual capital ratios are presented in the following table:
|
At December 31,
|
Minimum Regulatory Capital Required
|
Minimum Regulatory Provision To Be Well Capitalized
|
||||||||||
|
2013
|
2012
|
|||||||||||
|
Total risk-based capital
|
16.45
|
%
|
15.56
|
%
|
8.00
|
%
|
10.00
|
%
|
||||
|
Tier I capital
|
15.20
|
%
|
14.31
|
%
|
4.00
|
%
|
6.00
|
%
|
||||
|
Tier I leverage capital ratio
|
9.43
|
%
|
8.94
|
%
|
4.00
|
%
|
5.00
|
%
|
||||
45
The increase in Tier I capital and Tier I leverage ratios at December 31, 2013 compared to December 31, 2012 were due to net income of $22.8 million in 2013, partially offset by dividends declared in 2013 of $8.3 million and the repurchase of 68,145 shares of the Company's common stock under the Company's 2013 Repurchase Plan in 2013 of $2.8 million.
Although the junior subordinated debentures are recorded as a liability on our consolidated statements of condition, we are permitted, in accordance with regulatory guidelines, to include, subject to certain limits, the trust preferred securities in our calculation of risk-based capital. At December 31, 2013, $43.0 million of the trust preferred securities was included in Tier I and total risk-based capital.
As part of our goal to operate a safe, sound and profitable financial organization, we are committed to maintaining a strong capital base. Shareholders’ equity totaled $231.1 million and $233.8 million at December 31, 2013 and 2012, respectively, which amounted to 8.9% and 9.1% of total assets at December 31, 2013 and 2012, respectively.
Our principal cash requirement is the payment of dividends on our common stock, as and when declared by the board of directors. We declared dividends payable to shareholders in the aggregate amount of $8.3 million and $7.7 million for 2013 and 2012, respectively. Our board of directors approves cash dividends on a quarterly basis after careful analysis and consideration of various factors, including the following: (i) capital position relative to total assets, (ii) risk-based assets, (iii) total classified assets, (iv) economic conditions, (v) growth rates for total assets and total liabilities, (vi) earnings performance and projections and (vii) strategic initiatives and related capital requirements. All dividends declared and distributed by the Company will be in compliance with applicable state corporate law and regulatory requirements.
We are primarily dependent upon the payment of cash dividends by our subsidiaries to service our commitments. We, as the sole shareholder of our subsidiaries, are entitled to dividends, when and as declared by each subsidiary’s respective board of directors from legally available funds. The Bank declared dividends in the aggregate amount of $13.5 million and $13.0 million for 2013 and 2012, respectively.
Contractual Obligations and Off-Balance Sheet Commitments
In the normal course of business, we are a party to credit related financial instruments with off-balance sheet risk, which are not reflected in the consolidated statements of condition. These financial instruments include lending commitments and letters of credit. Those instruments involve varying degrees of credit risk in excess of the amount recognized in the consolidated statements of condition. We follow the same credit policies in making commitments to extend credit and conditional obligations as we do for on-balance sheet instruments, including requiring similar collateral or other security to support financial instruments with credit risk. Our exposure to credit loss in the event of nonperformance by the customer is represented by the contractual amount of those instruments. Since many of the commitments are expected to expire without being drawn upon, the total amount does not necessarily represent future cash requirements. At
December 31, 2013
, we had the following levels of commitments to extend credit:
|
Total Amount Committed
|
Commitment Expires in:
|
|||||||||||||||||||
|
(Dollars in Thousand)
|
< 1 Year
|
1 – 3 Years
|
4 – 5 Years
|
> 5 Years
|
||||||||||||||||
|
Home equity line of credit commitments
|
$
|
276,671
|
|
$
|
84,900
|
|
$
|
9,837
|
|
$
|
17,686
|
|
$
|
164,248
|
|
|||||
|
Commercial commitment letters
|
26,688
|
|
26,688
|
|
—
|
|
—
|
|
—
|
|
||||||||||
|
Residential loan origination
|
6,408
|
|
6,408
|
|
—
|
|
—
|
|
—
|
|
||||||||||
|
Letters of credit
|
1,789
|
|
1,789
|
|
—
|
|
—
|
|
—
|
|
||||||||||
|
Other commitments to extend credit
|
437
|
|
437
|
|
—
|
|
—
|
|
—
|
|
||||||||||
|
Total
|
$
|
311,993
|
|
$
|
120,222
|
|
$
|
9,837
|
|
$
|
17,686
|
|
$
|
164,248
|
|
|||||
46
We are a party to several off-balance sheet contractual obligations through lease agreements on a number of branch facilities. We have an obligation and commitment to make future payments under these contracts. At
December 31, 2013
, we had the following levels of contractual obligations:
|
Total Amount Committed
|
Payments Due per Period
|
||||||||||||||||||||
|
(Dollars in Thousands)
|
< 1 Year
|
1 – 3 Years
|
4 – 5 Years
|
> 5 Years
|
|||||||||||||||||
|
Operating leases
|
$
|
5,519
|
|
$
|
1,102
|
|
$
|
1,671
|
|
$
|
1,171
|
|
$
|
1,575
|
|
||||||
|
Capital leases
|
1,575
|
|
129
|
|
256
|
|
252
|
|
938
|
|
(1)
|
||||||||||
|
FHLBB borrowings – overnight
|
38,800
|
|
38,800
|
|
—
|
|
—
|
|
—
|
|
|||||||||||
|
FHLBB borrowings – advances
|
286,112
|
|
230,000
|
|
36,112
|
|
20,000
|
|
—
|
|
|||||||||||
|
Commercial repurchase agreements
|
30,142
|
|
—
|
|
25,000
|
|
5,142
|
|
—
|
|
|||||||||||
|
Retail repurchase agreements
|
130,047
|
|
130,047
|
|
—
|
|
—
|
|
—
|
|
|||||||||||
|
Junior subordinated debentures
|
43,922
|
|
—
|
|
—
|
|
—
|
|
43,922
|
|
|||||||||||
|
Note payable
|
25
|
|
25
|
|
—
|
|
—
|
|
—
|
|
|||||||||||
|
Other contractual obligations
|
432
|
|
432
|
|
—
|
|
—
|
|
—
|
|
|||||||||||
|
Total
|
$
|
536,574
|
|
$
|
400,535
|
|
$
|
63,039
|
|
$
|
26,565
|
|
$
|
46,435
|
|
||||||
|
(1)
|
Includes contingent rentals, which are based on the Consumer Price Index and reset every five years. Total contingent rentals for year one through year five are $16,000.
|
Borrowings from the FHLBB consist of short- and long-term fixed and variable rate borrowings that are collateralized by all stock in the FHLBB and a blanket lien on qualified collateral consisting primarily of loans with first mortgages secured by one-to four-family properties, certain pledged investment securities and other qualified assets. Other borrowed funds include treasury, tax and loan deposits and securities sold under repurchase agreements. We have an obligation and commitment to repay all borrowings and debentures. These commitments, borrowings, junior subordinated debentures and the related payments are made during the normal course of business.
We may use derivative instruments as partial hedges against large fluctuations in interest rates. We may also use fixed-rate interest rate swap and floor instruments to partially hedge against potentially lower yields on the variable prime rate loan category in a declining rate environment. If rates were to decline, resulting in reduced income on the adjustable rate loans, there would be an increased income flow from the interest rate swap and floor instruments. We may also use variable-rate interest rate swap and cap instruments to partially hedge against increases in short-term borrowing rates. If rates were to rise, resulting in an increased interest cost, there would be an increased income flow from the interest rate swap and cap instruments. These financial instruments are factored into our overall interest rate risk position. We regularly review the credit quality of the counterparty from which the instruments have been purchased. At
December 31, 2013
, the Company had five variable-for-fixed interest rate swaps with a total notional value of $43.0 million related to the junior subordinated debentures. The table below provides details of each interest rate swap.
|
Notional Amount
|
Fixed Rate
|
Maturity Date
|
||||
|
$
|
10,000
|
|
5.09%
|
June 30, 2021
|
||
|
10,000
|
|
5.84%
|
June 30, 2029
|
|||
|
10,000
|
|
5.71%
|
June 30, 2030
|
|||
|
5,000
|
|
4.35%
|
March 30, 2031
|
|||
|
8,000
|
|
4.14%
|
July 7, 2031
|
|||
At
December 31, 2013
, the Company had a notional amount of $7.9 million in an interest rate swap agreements with commercial customers and an equal notional amount with a dealer bank related to the Company’s commercial loan level derivative program. This program allows the Company to retain variable-rate commercial loans while allowing the customer to synthetically fix the loan rate by entering into a variable-to-fixed interest rate swap. It is anticipated that, over time, customer interest rate derivatives will reduce the interest rate risk inherent in the longer-term, fixed-rate commercial business.
47
Loan Servicing
At December 31, 2013, we serviced $157.9 million and $614.4 million in loans for Freddie Mac and MaineHousing, respectively. Custodial escrow balances maintained in connection with the loans serviced totaled $518,000 and $5.3 million for Freddie Mac and MaineHousing, respectively, at December 31, 2013.
The servicing agreements with Freddie Mac and MaineHousing (collectively, the “Trustees”) generally provide broad rights for the Trustees. For example, each Trustee typically claims the right to demand that we repurchase loans that breach the seller’s representations and warranties made in connection with the initial sale of the loans. In addition, the Trustees’ servicer guides impose certain timelines for resolving delinquent loans through workout efforts or liquidation and impose compensatory fees on us if those deadlines are not satisfied other than for reasons beyond our control. The Trustees also have a contractual right to demand indemnification or loan repurchase for certain servicing breaches. For example, we would be required to indemnify the Trustees for or against failures by us to perform our servicing obligations or acts or omissions that involve willful malfeasance, bad faith or gross negligence in the performance of, or reckless disregard of, our duties. We record expenses for servicing-related claims and loan repurchases when it is probable that such claims or repurchases will be made and the amounts are reasonably estimable.
Market Risk
Market risk is the risk of loss in a financial instrument arising from adverse changes in market rates/prices, such as interest rates, foreign currency exchange rates, commodity prices and equity prices. Our primary market risk exposure is interest rate risk. The ongoing monitoring and management of this risk is an important component of our asset and liability management process, which is governed by policies established by the Bank’s board of directors that are reviewed and approved annually. The Board ALCO delegates responsibility for carrying out the asset/liability management policies to Management ALCO. In this capacity, Management ALCO develops guidelines and strategies impacting our asset/liability management-related activities based upon estimated market risk sensitivity, policy limits and overall market interest rate levels/trends. Management ALCO and Board ALCO jointly meet on a quarterly basis to review strategies, policies, economic conditions and various activities as part of the management of these risks.
Interest Rate Risk
Interest rate risk represents the sensitivity of earnings to changes in market interest rates. As interest rates change, the interest income and expense streams associated with our financial instruments also change, thereby impacting net interest income, the primary component of our earnings. The Board and Management ALCO utilize the results of a detailed and dynamic simulation model to quantify the estimated exposure of net interest income to sustained interest rate changes. While the Board and Management ALCO routinely monitor simulated net interest income sensitivity over a rolling two-year horizon, they also utilize additional tools to monitor potential longer-term interest rate risk.
The simulation model captures the impact of changing interest rates on the interest income received and interest expense paid on all interest-earning assets and interest-bearing liabilities reflected on our consolidated statements of condition, as well as for derivative financial instruments, if any. None of the assets used in the simulation were held for trading purposes. This sensitivity analysis is compared to ALCO policy limits, which specify a maximum tolerance level for net interest income exposure over a one-year horizon, assuming no balance sheet growth, given a 200 basis points upward and 200 basis points downward shift in interest rates. Although our policy specifies a downward shift of 200 basis points, this could result in negative rates if benchmark rates are below 2.00%, which has been the case recently. A parallel and pro rata shift in rates over a 12-month period is assumed. Using this approach, we are able to produce reports that illustrate the effect that both a gradual change of rates (Year 1) and a “rate shock” (and beyond) has on margin expectations. In the down 100 bp scenario, Federal Funds and Treasury yields are floored at 0.01% while Prime is floored at 3.00%. All other market rates are floored at 0.25%.
During the fourth quarter of 2013 and 2012, our net interest income sensitivity analysis reflected the following changes to net interest income assuming no balance sheet growth and a parallel shift in interest rates over a one-year horizon. Rate changes were “ramped” over the first 12-month period (24-month period for the 400 basis points upward shift in interest rates) and then maintained at those levels over the remainder of the ALCO simulation horizon.
48
|
Estimated Changes in
|
||||||
|
Net Interest Income
|
||||||
|
Rate Change from Year 1 – Base
|
2013
|
2012
|
||||
|
Year 1
|
|
|
|
|
||
|
+400 bp
|
(5.10
|
)%
|
(1.74
|
)%
|
||
|
+200 bp
|
(5.10
|
)%
|
(1.78
|
)%
|
||
|
-100 bp
|
(0.50
|
)%
|
(1.13
|
)%
|
||
|
Year 2
|
|
|
|
|
||
|
Base
|
(1.20
|
)%
|
(5.06
|
)%
|
||
|
+400 bp
|
(10.50
|
)%
|
(5.04
|
)%
|
||
|
+200 bp
|
(5.70
|
)%
|
(3.27
|
)%
|
||
|
-100 bp
|
(4.60
|
)%
|
(10.43
|
)%
|
||
The preceding sensitivity analysis does not represent a forecast and should not be relied upon as being indicative of expected operating results. These hypothetical estimates are based upon numerous assumptions including, among others, the nature and timing of interest rate levels, yield curve shape, prepayments on loans and securities, deposit decay rates, pricing decisions on loans and deposits and reinvestment/replacement of asset and liability cash flows. While assumptions are developed based upon current economic and local market conditions, we cannot make any assurances as to the predictive nature of these assumptions, including how customer preferences or competitor influences might change.
The most significant factors affecting the changes in market risk exposure during 2013 were the accumulation of longer term assets funded primarily with shorter-term borrowings plus the continued repricing/replacement of cash flows of our assets at today’s lower rate levels at a faster pace than the decrease in overall funding costs. If rates remain at or near current levels, a gradual downward trend is projected in the near term as a result of the ongoing repricing and replacement of loan and investment cash flows at today's lower rate levels while the current cost of funds remain relatively unchanged. Beyond the first year, net interest income levels off as asset and funding cost rollovers are nearly offsetting. If rates decrease further, net interest income is projected to decrease as assets reprice into lower-interest products (driven by prepayments on mortgage-related assets), while there is limited ability to reduce cost of funds. In a rising interest rate environment, net interest income is projected to decrease initially, due to the repricing of short-term funding positions, but will improve as assets reprice into higher-interest products. As funding maturities slow and asset cash flows continue to reset upwards, net interest income improves and trends higher over the remainder of the five year simulation.
Periodically, if deemed appropriate, we use interest rate swaps, floors and caps, which are common derivative financial instruments, to hedge our interest rate risk position. The board of directors has approved hedging policy statements governing the use of these instruments. As of December 31, 2013, we had a notional principal amount of $43.0 million in interest rate swap agreements related to the junior subordinated debentures, and $15.7 million in interest rate swaps related to our commercial loan level derivative program. The Board and Management ALCO monitor derivative activities relative to their expectations and our hedging policies.
Other Market Risk(s)
We are also subject to other market risks, including but not limited to, operational risks, actions of government agencies, solvency of counter-parties, changes in investment markets, and changes in consumer demand. For further descriptions of these additional market risks, refer to Item 1A. “Risk Factors.”
Recent Accounting Pronouncements
See Note 1 to the consolidated financial statements for details of recently issued accounting pronouncements and their expected impact on our financial statements.
49
Related Party Transactions
The Bank is permitted, in its normal course of business, to make loans to certain officers and directors of the Company and its subsidiaries under terms that are consistent with the Bank’s lending policies and regulatory requirements. In addition to extending loans to certain officers and directors of the Company and its subsidiaries on terms consistent with the Bank’s lending policies, federal banking regulations also require training, audit and examination of the adherence to this policy by representatives of the federal and national regulators (also known as “Regulation O” requirements). Notes 4 and 9 to the consolidated financial statements provide related party lending and deposit information, respectively. We have not entered into significant non-lending related party transactions.
The information contained in the Market Risk section of Item 7. "Management’s Discussion and Analysis of Financial Condition and Results of Operations" is incorporated herein by reference.
50
CONSOLIDATED STATEMENTS OF CONDITION
|
December 31,
|
||||||||
|
(In Thousands, Except Number of Shares)
|
2013
|
2012
|
||||||
|
ASSETS
|
|
|
|
|
||||
|
Cash and due from banks
|
$
|
51,355
|
|
$
|
58,290
|
|
||
|
Securities
|
|
|
||||||
|
Available-for-sale securities, at fair value
|
808,477
|
|
781,050
|
|
||||
|
Federal Home Loan Bank and Federal Reserve Bank stock, at cost
|
19,724
|
|
21,034
|
|
||||
|
Total securities
|
828,201
|
|
802,084
|
|
||||
|
Trading account assets
|
2,488
|
|
2,300
|
|
||||
|
Loans
|
1,580,402
|
|
1,563,866
|
|
||||
|
Less: allowance for loan losses
|
(21,590
|
)
|
(23,044
|
)
|
||||
|
Net loans
|
1,558,812
|
|
1,540,822
|
|
||||
|
Goodwill and other intangible assets
|
49,319
|
|
53,299
|
|
||||
|
Bank-owned life insurance
|
46,363
|
|
45,053
|
|
||||
|
Premises and equipment, net
|
25,727
|
|
28,059
|
|
||||
|
Deferred tax asset
|
16,047
|
|
7,663
|
|
||||
|
Interest receivable
|
5,808
|
|
6,215
|
|
||||
|
Other real estate owned
|
2,195
|
|
1,313
|
|
||||
|
Other assets
|
17,514
|
|
19,659
|
|
||||
|
Total assets
|
$
|
2,603,829
|
|
$
|
2,564,757
|
|
||
|
LIABILITIES AND SHAREHOLDERS’ EQUITY
|
|
|
|
|
||||
|
Deposits
|
|
|
|
|
||||
|
Demand
|
$
|
243,269
|
|
$
|
240,749
|
|
||
|
Interest checking
|
450,163
|
|
478,060
|
|
||||
|
Savings and money market
|
678,022
|
|
691,088
|
|
||||
|
Retail certificates of deposit
|
343,034
|
|
418,442
|
|
||||
|
Brokered deposits
|
99,336
|
|
101,130
|
|
||||
|
Total deposits
|
1,813,824
|
|
1,929,469
|
|
||||
|
Federal Home Loan Bank advances
|
56,112
|
|
56,404
|
|
||||
|
Other borrowed funds
|
430,058
|
|
259,940
|
|
||||
|
Junior subordinated debentures
|
43,922
|
|
43,819
|
|
||||
|
Accrued interest and other liabilities
|
28,817
|
|
41,310
|
|
||||
|
Total liabilities
|
2,372,733
|
|
2,330,942
|
|
||||
|
Commitments and Contingencies (Notes 6, 14, 15, 17 and 19)
|
|
|
|
|
||||
|
Shareholders’ Equity
|
||||||||
|
Common stock, no par value; authorized 20,000,000 shares, issued and outstanding 7,579,913 and 7,622,750 shares on December 31, 2013 and 2012, respectively
|
47,783
|
|
49,667
|
|
||||
|
Retained earnings
|
195,660
|
|
181,151
|
|
||||
|
Accumulated other comprehensive income (loss)
|
|
|
||||||
|
Net unrealized (losses) gains on available-for-sale securities, net of tax
|
(7,964
|
)
|
12,943
|
|
||||
|
Net unrealized losses on derivative instruments, at fair value, net of tax
|
(2,542
|
)
|
(7,205
|
)
|
||||
|
Net unrecognized losses on postretirement plans, net of tax
|
(1,841
|
)
|
(2,741
|
)
|
||||
|
Total accumulated other comprehensive (loss) income
|
(12,347
|
)
|
2,997
|
|
||||
|
Total shareholders’ equity
|
231,096
|
|
233,815
|
|
||||
|
Total liabilities and shareholders’ equity
|
$
|
2,603,829
|
|
$
|
2,564,757
|
|
||
The accompanying notes are an integral part of these consolidated financial statements.
51
|
Years Ended December 31,
|
||||||||||||
|
(In Thousands, Except Number of Shares and per Share Data)
|
2013
|
2012
|
2011
|
|||||||||
|
Interest Income
|
|
|
|
|
|
|
||||||
|
Interest and fees on loans
|
$
|
70,262
|
|
$
|
72,859
|
|
$
|
78,174
|
|
|||
|
Interest on U.S. government and sponsored enterprise obligations
|
16,587
|
|
16,452
|
|
18,342
|
|
||||||
|
Interest on state and political subdivision obligations
|
1,170
|
|
1,385
|
|
1,662
|
|
||||||
|
Interest on federal funds sold and other investments
|
198
|
|
251
|
|
194
|
|
||||||
|
Total interest income
|
88,217
|
|
90,947
|
|
98,372
|
|
||||||
|
Interest Expense
|
|
|
|
|
|
|
||||||
|
Interest on deposits
|
7,073
|
|
9,293
|
|
11,591
|
|
||||||
|
Interest on borrowings
|
3,137
|
|
5,363
|
|
8,948
|
|
||||||
|
Interest on junior subordinated debentures
|
2,532
|
|
2,546
|
|
2,614
|
|
||||||
|
Total interest expense
|
12,742
|
|
17,202
|
|
23,153
|
|
||||||
|
Net interest income
|
75,475
|
|
73,745
|
|
75,219
|
|
||||||
|
Provision for credit losses
|
2,028
|
|
3,816
|
|
4,735
|
|
||||||
|
Net interest income after provision for credit losses
|
73,447
|
|
69,929
|
|
70,484
|
|
||||||
|
Non-Interest Income
|
|
|
|
|
|
|
||||||
|
Service charges on deposit accounts
|
6,740
|
|
5,557
|
|
5,134
|
|
||||||
|
Other service charges and fees
|
5,971
|
|
4,061
|
|
3,577
|
|
||||||
|
Income from fiduciary services
|
4,751
|
|
5,038
|
|
6,027
|
|
||||||
|
Brokerage and insurance commissions
|
1,697
|
|
1,491
|
|
1,363
|
|
||||||
|
Mortgage banking income, net
|
1,406
|
|
588
|
|
729
|
|
||||||
|
Bank-owned life insurance
|
1,310
|
|
1,382
|
|
2,173
|
|
||||||
|
Gain on Branch Divestiture
|
2,742
|
|
—
|
|
—
|
|
||||||
|
Net gain on sale of securities and other-than-temporary impairment of securities
|
785
|
|
2,498
|
|
2,076
|
|
||||||
|
Other income
|
2,399
|
|
2,797
|
|
1,974
|
|
||||||
|
Total non-interest income
|
27,801
|
|
23,412
|
|
23,053
|
|
||||||
|
Non-Interest Expenses
|
|
|
|
|
|
|
||||||
|
Salaries and employee benefits
|
32,609
|
|
29,689
|
|
28,627
|
|
||||||
|
Furniture, equipment and data processing
|
7,051
|
|
5,079
|
|
4,773
|
|
||||||
|
Net occupancy
|
5,449
|
|
4,365
|
|
3,949
|
|
||||||
|
Other real estate owned and collection costs
|
2,162
|
|
2,284
|
|
2,104
|
|
||||||
|
Consulting and professional fees
|
2,337
|
|
1,818
|
|
2,629
|
|
||||||
|
Regulatory assessments
|
1,997
|
|
1,793
|
|
1,955
|
|
||||||
|
Amortization of intangible assets
|
1,150
|
|
657
|
|
577
|
|
||||||
|
Goodwill impairment
|
2,830
|
|
—
|
|
50
|
|
||||||
|
Branch Acquisition and Divestiture costs
|
374
|
|
2,324
|
|
—
|
|
||||||
|
Prepayment fees on borrowings
|
—
|
|
2,030
|
|
2,318
|
|
||||||
|
Other expenses
|
10,374
|
|
8,992
|
|
8,597
|
|
||||||
|
Total non-interest expenses
|
66,333
|
|
59,031
|
|
55,579
|
|
||||||
|
Income before income taxes
|
34,915
|
|
34,310
|
|
37,958
|
|
||||||
|
Income Taxes
|
12,132
|
|
10,882
|
|
11,781
|
|
||||||
|
Net Income
|
$
|
22,783
|
|
$
|
23,428
|
|
$
|
26,177
|
|
|||
|
Per Share Data:
|
|
|
|
|
|
|
||||||
|
Basic earnings per share
|
$
|
2.98
|
|
$
|
3.06
|
|
$
|
3.41
|
|
|||
|
Diluted earnings per share
|
$
|
2.97
|
|
$
|
3.05
|
|
$
|
3.40
|
|
|||
|
Weighted average number of common shares outstanding
|
7,634,455
|
|
7,646,861
|
|
7,672,126
|
|
||||||
|
Diluted weighted average number of common shares outstanding
|
7,653,270
|
|
7,661,273
|
|
7,679,895
|
|
||||||
The accompanying notes are an integral part of these consolidated financial statements.
52
CONSOLIDATED STATEMENTS OF COMPREHENSIVE INCOME
|
Years Ended December 31,
|
||||||||||||
|
(In Thousands)
|
2013
|
2012
|
2011
|
|||||||||
|
Net Income
|
$
|
22,783
|
|
$
|
23,428
|
|
$
|
26,177
|
|
|||
|
Other comprehensive income (loss):
|
|
|
|
|
|
|
||||||
|
Net change in unrealized gains (losses) on available-for-sale securities:
|
|
|
|
|
|
|
||||||
|
Net change in unrealized gain (loss) on available-for-sale securities, net of tax of $10,982, $(1,851), and $(3,365)
|
(20,397
|
)
|
3,439
|
|
6,248
|
|
||||||
|
Net reclassification adjustment for gains included in net income, net of tax of $275, $874, and $727
|
(510
|
)
|
(1,624
|
)
|
(1,349
|
)
|
||||||
|
Net change in unrealized gains (losses) on available-for-sale securities, net of tax
|
(20,907
|
)
|
1,815
|
|
4,899
|
|
||||||
|
Net change in unrealized gains (losses) on cash flow hedging derivatives, net of tax of $(2,510), $(32), and $3,530
|
4,663
|
|
59
|
|
(6,555
|
)
|
||||||
|
Postretirement plans:
|
|
|
|
|
|
|
||||||
|
Net actuarial gain (loss), net of tax of $(391), $563, and $361
|
726
|
|
(1,046
|
)
|
(671
|
)
|
||||||
|
Reclassification of amortization of net unrecognized actuarial (gain) loss and of prior service cost included in net periodic cost, net of tax of $(94), $(56), and $(32)
|
174
|
|
108
|
|
59
|
|
||||||
|
Net gain (loss) on postretirement plans, net of tax
|
900
|
|
(938
|
)
|
(612
|
)
|
||||||
|
Other comprehensive income (loss)
|
(15,344
|
)
|
936
|
|
(2,268
|
)
|
||||||
|
Comprehensive Income
|
$
|
7,439
|
|
$
|
24,364
|
|
$
|
23,909
|
|
|||
The accompanying notes are an integral part of these consolidated financial statements.
53
CONSOLIDATED STATEMENTS OF CHANGES IN SHAREHOLDERS’ EQUITY
|
Common Stock
|
Retained Earnings
|
Accumulated Other Comprehensive Income (Loss)
|
Total Shareholders’ Equity
|
||||||||||||||||
|
(In Thousands, Except Number of Shares and Per Share Data)
|
Shares Outstanding
|
Amount
|
|||||||||||||||||
|
Balance at December 31, 2010
|
7,658,496
|
|
$
|
50,936
|
|
$
|
150,730
|
|
$
|
4,329
|
|
$
|
205,995
|
|
|||||
|
Net income for 2011
|
—
|
|
—
|
|
26,177
|
|
—
|
|
26,177
|
|
|||||||||
|
Other comprehensive loss, net of tax
|
—
|
|
—
|
|
—
|
|
(2,268
|
)
|
(2,268
|
)
|
|||||||||
|
Stock-based compensation expense
|
—
|
|
1,025
|
|
—
|
|
—
|
|
1,025
|
|
|||||||||
|
Exercise of stock options and issuance of restricted stock, net of repurchase for tax withholdings and tax benefit
|
19,723
|
|
(134
|
)
|
—
|
|
—
|
|
(134
|
)
|
|||||||||
|
Common stock repurchased
|
(13,244
|
)
|
(389
|
)
|
—
|
|
—
|
|
(389
|
)
|
|||||||||
|
Cash dividends declared ($1.50 per share)
|
—
|
|
—
|
|
(11,530
|
)
|
—
|
|
(11,530
|
)
|
|||||||||
|
Balance at December 31, 2011
|
7,664,975
|
|
51,438
|
|
165,377
|
|
2,061
|
|
218,876
|
|
|||||||||
|
Net income for 2012
|
—
|
|
—
|
|
23,428
|
|
—
|
|
23,428
|
|
|||||||||
|
Other comprehensive income, net of tax
|
—
|
|
—
|
|
—
|
|
936
|
|
936
|
|
|||||||||
|
Stock-based compensation expense
|
—
|
|
538
|
|
—
|
|
—
|
|
538
|
|
|||||||||
|
Exercise of stock options and issuance of restricted stock, net of repurchase for tax withholdings and tax benefit
|
23,355
|
|
(212
|
)
|
—
|
|
—
|
|
(212
|
)
|
|||||||||
|
Common stock repurchased
|
(65,580
|
)
|
(2,097
|
)
|
—
|
|
—
|
|
(2,097
|
)
|
|||||||||
|
Cash dividends declared ($1.00 per share)
|
—
|
|
(7,654
|
)
|
—
|
|
(7,654
|
)
|
|||||||||||
|
Balance at December 31, 2012
|
7,622,750
|
|
49,667
|
|
181,151
|
|
2,997
|
|
233,815
|
|
|||||||||
|
Net income for 2013
|
—
|
|
—
|
|
22,783
|
|
—
|
|
22,783
|
|
|||||||||
|
Other comprehensive loss, net of tax
|
—
|
|
—
|
|
—
|
|
(15,344
|
)
|
(15,344
|
)
|
|||||||||
|
Stock-based compensation expense
|
—
|
|
596
|
|
—
|
|
—
|
|
596
|
|
|||||||||
|
Exercise of stock options and issuance of restricted stock, net of repurchase for tax withholdings and tax benefit
|
25,308
|
|
300
|
|
—
|
|
—
|
|
300
|
|
|||||||||
|
Common stock repurchased
|
(68,145
|
)
|
(2,780
|
)
|
—
|
|
—
|
|
(2,780
|
)
|
|||||||||
|
Cash dividends declared ($1.08 per share)
|
—
|
|
—
|
|
(8,274
|
)
|
—
|
|
(8,274
|
)
|
|||||||||
|
Balance at December 31, 2013
|
7,579,913
|
|
$
|
47,783
|
|
$
|
195,660
|
|
$
|
(12,347
|
)
|
$
|
231,096
|
|
|||||
The accompanying notes are an integral part of these consolidated financial statements.
54
|
Years Ended December 31,
|
||||||||||||
|
(In Thousands)
|
2013
|
2012
|
2011
|
|||||||||
|
Operating Activities
|
|
|
|
|
|
|
||||||
|
Net income
|
$
|
22,783
|
|
$
|
23,428
|
|
$
|
26,177
|
|
|||
|
Adjustments to reconcile net income to net cash provided by operating activities:
|
|
|
|
|
|
|
||||||
|
Provision for credit losses
|
2,028
|
|
3,816
|
|
4,735
|
|
||||||
|
Depreciation and amortization expense
|
3,004
|
|
2,500
|
|
2,605
|
|
||||||
|
Investment securities amortization and accretion, net
|
2,166
|
|
2,207
|
|
1,098
|
|
||||||
|
Stock-based compensation expense
|
596
|
|
538
|
|
1,025
|
|
||||||
|
Amortization of intangible assets
|
1,150
|
|
657
|
|
577
|
|
||||||
|
Net gains on sale and other-than-temporary impairment of investment securities
|
(785
|
)
|
(2,498
|
)
|
(2,076
|
)
|
||||||
|
Net increase in other real estate owned valuation allowance and loss on disposition
|
130
|
|
479
|
|
188
|
|
||||||
|
Originations of mortgage loans held for sale
|
(33,254
|
)
|
(10,886
|
)
|
(29,126
|
)
|
||||||
|
Proceeds from the sale of mortgage loans
|
33,982
|
|
17,215
|
|
28,885
|
|
||||||
|
Gain on sale of mortgage loans
|
(728
|
)
|
(268
|
)
|
(292
|
)
|
||||||
|
Gain on Branch Divestiture
|
(2,742
|
)
|
—
|
|
—
|
|
||||||
|
Goodwill impairment
|
2,830
|
|
—
|
|
50
|
|
||||||
|
Gain on sale of branch facility
|
—
|
|
(479
|
)
|
—
|
|
||||||
|
(Increase) decrease in trading assets
|
(188
|
)
|
(56
|
)
|
60
|
|
||||||
|
Decrease (increase) in other assets
|
193
|
|
1,556
|
|
(1,434
|
)
|
||||||
|
(Decrease) increase in other liabilities
|
(1,433
|
)
|
4,120
|
|
951
|
|
||||||
|
Net cash provided by operating activities
|
29,732
|
|
42,329
|
|
33,423
|
|
||||||
|
Investing Activities
|
|
|
|
|
|
|
||||||
|
Net cash settlement in Branch Acquisition and Branch Divestiture
|
(39,648
|
)
|
267,689
|
|
—
|
|
||||||
|
Proceeds from sales and maturities of available-for-sale securities
|
147,373
|
|
274,621
|
|
227,003
|
|
||||||
|
Proceeds from sale and maturities of securities held to maturity
|
—
|
|
—
|
|
251
|
|
||||||
|
Purchase of available-for-sale securities
|
(208,344
|
)
|
(462,552
|
)
|
(219,092
|
)
|
||||||
|
Net (increase) decrease in loans
|
(67,826
|
)
|
(50,194
|
)
|
2,992
|
|
||||||
|
Purchase of premises and equipment
|
(1,490
|
)
|
(3,403
|
)
|
(1,516
|
)
|
||||||
|
Proceeds from sale of FHLB stock
|
1,310
|
|
928
|
|
—
|
|
||||||
|
Proceeds from sale of other real estate owned
|
946
|
|
2,070
|
|
2,506
|
|
||||||
|
Recoveries of previously charged-off loans
|
768
|
|
744
|
|
1,002
|
|
||||||
|
Proceeds from sale of building
|
—
|
|
2,235
|
|
—
|
|
||||||
|
Proceeds from bank-owned life insurance
|
—
|
|
—
|
|
1,656
|
|
||||||
|
Net cash (used) provided by investing activities
|
(166,911
|
)
|
32,138
|
|
14,802
|
|
||||||
|
Financing Activities
|
|
|
|
|
|
|
||||||
|
Net (decrease) increase in deposits
|
(29,380
|
)
|
50,544
|
|
75,559
|
|
||||||
|
Repayments on Federal Home Loan Bank long-term advances
|
(289
|
)
|
(80,456
|
)
|
(312,355
|
)
|
||||||
|
Proceeds from Federal Home Loan Bank long-term advances
|
—
|
|
—
|
|
235,000
|
|
||||||
|
Net increase (decrease) in other borrowed funds
|
170,194
|
|
(15,614
|
)
|
(26,066
|
)
|
||||||
|
Common stock repurchase
|
(2,460
|
)
|
(2,097
|
)
|
(389
|
)
|
||||||
|
Exercise of stock options and issuance of restricted stock, net of repurchase for tax withholdings and tax benefit
|
300
|
|
(212
|
)
|
(134
|
)
|
||||||
|
Cash dividends paid on common stock
|
(8,121
|
)
|
(7,667
|
)
|
(11,524
|
)
|
||||||
|
Net cash provided (used) by financing activities
|
130,244
|
|
(55,502
|
)
|
(39,909
|
)
|
||||||
|
Net (decrease) increase in cash and cash equivalents
|
(6,935
|
)
|
18,965
|
|
8,316
|
|
||||||
|
Cash and cash equivalents at beginning of year
|
58,290
|
|
39,325
|
|
31,009
|
|
||||||
|
Cash and cash equivalents at end of year
|
$
|
51,355
|
|
$
|
58,290
|
|
$
|
39,325
|
|
|||
|
Supplemental information:
|
|
|
|
|
|
|
||||||
|
Interest paid
|
$
|
13,014
|
|
$
|
17,456
|
|
$
|
23,901
|
|
|||
|
Income taxes paid
|
10,640
|
|
6,363
|
|
12,097
|
|
||||||
|
Transfer of loans and premises and equipment to other real estate owned
|
1,958
|
|
1,767
|
|
1,989
|
|
||||||
|
Common stock repurchased not yet settled
|
320
|
|
—
|
|
|
—
|
|
|||||
|
Branch acquisition – allocation of purchase price to assets and liabilities
|
—
|
|
See Note 2
|
—
|
|
|||||||
The accompanying notes are an integral part of these consolidated financial statements.
55
CAMDEN NATIONAL CORPORATION
NOTES TO THE CONSOLIDATED FINANCIAL STATEMENTS
(Amounts in Tables Expressed in Thousands, Except Number of Shares and per Share Data)
1. Summary of Significant Accounting Policies
The acronyms and abbreviations identified below are used in the notes to the consolidated financial statements as well as in Item 7. "Management's Discussion and Analysis of Financial Condition and Results of Operations". The following is provided to aid the reader and provide a reference page when reviewing the consolidated financial statements.
|
Acadia Trust:
|
Acadia Trust, N.A., a wholly-owned subsidiary of Camden National Corporation
|
Freddie Mac:
|
Federal Home Loan Mortgage Corporation
|
|
|
Act:
|
Medicare Prescription Drug, Improvement and Modernization Act
|
GAAP:
|
Generally accepted accounting principles in the United States
|
|
|
AFS:
|
Available-for-sale
|
IRS:
|
Internal Revenue Service
|
|
|
ALCO:
|
Asset/Liability Committee
|
LIBOR:
|
London Interbank Offered Rate
|
|
|
ALL:
|
Allowance for loan losses
|
LTIP:
|
Long-Term Performance Share Plan
|
|
|
AOCI:
|
Accumulated other comprehensive income (loss)
|
MaineHousing:
|
Maine State Housing Authority
|
|
|
ASC:
|
Accounting Standards Codification
|
Management ALCO:
|
Management Asset/Liability Committee
|
|
|
ASU:
|
Accounting Standards Update
|
MSPP:
|
Management Stock Purchase Plan
|
|
|
Bank:
|
Camden National Bank, a wholly-owned subsidiary of Camden National Corporation
|
MSRs:
|
Mortgage servicing rights
|
|
|
BOLI:
|
Bank-owned life insurance
|
Non-Agency or Non-Agencies:
|
Non-agency private issue collateralized mortgage obligation(s)
|
|
|
Board ALCO:
|
Board of directors' Asset/Liability Committee
|
OCC:
|
Office of the Comptroller of the Currency
|
|
|
Branch Acquisition:
|
The acquisition of 14 branches from Bank of America, N.A. in 2012, after divesting of one branch as required by the Department of Justice
|
OCI:
|
Other comprehensive income (loss)
|
|
|
Branch Divestiture:
|
The divestiture of five Franklin County branches in 2013
|
OFAC:
|
Office of Foreign Assets Control
|
|
|
BSA:
|
Bank Secrecy Act
|
OREO:
|
Other real estate owned
|
|
|
CCTA:
|
Camden Capital Trust A, an unconsolidated entity formed by Camden National Corporation
|
OTTI:
|
Other-than-temporary impairment
|
|
|
CSV:
|
Cash surrender value
|
SERP:
|
Supplemental executive retirement plans
|
|
|
Company:
|
Camden National Corporation
|
TDR:
|
Troubled-debt restructuring
|
|
|
DCRP:
|
Defined Contribution Retirement Plan
|
UBCT:
|
Union Bankshares Capital Trust I, an unconsolidated entity formed by Union Bankshares Company that was subsequently acquired by Camden National Corporation
|
|
|
EPS:
|
Earnings per share
|
U.S.:
|
United States of America
|
|
|
FASB:
|
Financial Accounting Standards Board
|
2003 Plan
|
2003 Stock Option and Incentive Plan
|
|
|
FDIC:
|
Federal Deposit Insurance Corporation
|
2012 Plan
|
2012 Equity and Incentive Plan
|
|
|
FHLB:
|
Federal Home Loan Bank
|
2013 Repurchase Plan:
|
2013 Common Stock Repurchase Program, approved by the Company's board of directors
|
|
|
FHLBB:
|
Federal Home Loan Bank of Boston
|
2012 Repurchase Plan:
|
2012 Common Stock Repurchase Program, approved by the Company's board of directors
|
|
|
FRB:
|
Federal Reserve Bank
|
|||
56
Camden National Corporation, a Maine corporation, is the bank holding company for Camden National Bank and Acadia Trust, N.A. The Bank serves individuals, businesses, municipalities and non-profits through a network of
44
banking offices and ATMs in Maine. Acadia Trust provides trust and investment management services to its clients, who are primarily located in the Maine, and to clients of the Bank.
The accounting and reporting policies conform to GAAP and to general practice within the banking industry. The following is a summary of the significant accounting and reporting policies.
Principles of Consolidation
. The accompanying consolidated financial statements include the accounts of the Company, the Bank, and Acadia Trust. All intercompany accounts and transactions have been eliminated in consolidation. Assets held by the non-bank subsidiary in a fiduciary capacity are not assets of the Company and, therefore, are not included in the consolidated statements of condition. The Company also owns
100%
of the common stock of CCTA and UBCT. These entities are unconsolidated subsidiaries of the Company.
Reclassifications
. Certain reclassifications have been made to prior year amounts to conform to the current year presentation.
Use of Estimates in the Preparation of Financial Statements
. The preparation of the financial statements in conformity with GAAP requires management to make estimates and assumptions that affect the reported amounts of assets and liabilities and disclosure of contingent assets and liabilities at the date of the financial statements and the reported amounts of revenues and expenses during the reporting periods. Actual results could vary from these estimates. Several estimates are particularly critical and are susceptible to significant near-term change, including the allowance for loan losses, other real estate owned, postretirement benefits and asset impairment judgments including other-than-temporary declines in the value of investment securities and the recoverability of goodwill, other intangible assets and deferred tax assets.
Subsequent Events
. The Company has evaluated events and transactions subsequent to December 31, 2013 for potential recognition or disclosure as required by GAAP.
Significant Concentration of Credit Risk.
The Bank grants loans primarily to customers in Maine. Although the Bank has a diversified loan portfolio, a large portion of the Bank's loans are secured by commercial or residential real estate located in Maine and is subject to volatility within Maine's real estate market. Furthermore, the debtors' ability to honor their contractors is highly dependent upon other economic factors throughout Maine. The Bank does not generally engage in non-recourse lending and typically will require the principals of any commercial borrower to obligate themselves personally on the loan.
Cash and Cash Equivalents
. For the purposes of reporting cash flows, cash and cash equivalents consist of cash on hand and amounts due from banks. The Bank is required by the FRB to maintain non-interest bearing cash reserves equal to a percentage of deposits. The Company maintains the reserve balances in cash on hand or at the FRB.
Securities
. The Company's marketable equity and debt securities are classified as AFS securities and carried at fair value. Management determines the classification of investment securities at the time of its purchase (i.e. trading securities, AFS securities or held-to-maturity). As of December 31, 2013 and 2012, the Company held only AFS securities within its investment portfolio.
Unrealized gains and temporary unrealized losses on AFS securities are reported on an after-tax basis in shareholders' equity as AOCI on the consolidated statements of condition. FHLB and FRB stocks are non-marketable equity securities and are reported at cost and evaluated for impairment.
Premiums and discounts are recognized in interest income using the interest method over the period to maturity. Security transactions are recorded on the trade date. Realized gains and losses are determined using the specific identification method and are reported in non-interest income on the consolidated statements of income.
Management conducts a periodic review and evaluation of the securities portfolio to determine if the decline in fair value of any security appears to be other-than-temporary. The factors considered by management in its periodic review include, but are not limited to: the length of time and the extent to which the fair value has been less than cost, the financial condition and near-term prospects of the issuer, the ratings of the security, whether the decline in fair value appears to be issuer specific or, alternatively, a reflection of general market or industry conditions, and the Company’s intent and ability to hold the security for a period of time sufficient to allow for a recovery in fair value.
57
Declines in the fair value of individual equity securities that are deemed to be other-than-temporary are reflected in non-interest income on the consolidated statements of income when identified. For individual debt securities where the Company does not intend to sell the security and it is not more-likely-than-not that the Company will be required to sell the security before recovery of its amortized cost basis, the other-than-temporary decline in the fair value of the debt security related to (i) credit loss is recognized in not-interest income on the consolidated statements of income and (ii) other factors is recognized in OCI. For individual debt securities where the Company intends to sell the security or more-likely-than-not will be required to sell the security before recovery of its amortized cost, the other-than-temporary impairment is recognized in earnings equal to the entire difference between the security’s cost basis and its fair value at the date of the consolidated statement of condition.
The Company is a member of the FHLBB. As a requirement of membership, the Company must own a minimum amount of FHLB stock based on the level of its FHLB advances. No market exists for shares of the FHLB and therefore they are carried at par value. FHLB stock may be redeemed at par value
five
years following termination of FHLB membership, subject to limitations which may be imposed by the FHLB or its regulator, the Federal Housing Finance Agency, to maintain capital adequacy of the FHLB. While the Company currently has no intentions to terminate its FHLB membership, the ability to redeem its investment in FHLB stock would be subject to the conditions imposed by the FHLB.
Loans and Allowance for Loan Losses
. The Company reports loans held for sale at fair value and as such the fair value for loans held for sale is determined using quoted secondary market prices or executed sales agreements. At December 31, 2013 and 2012, the Company did not hold any loans held for sale. All other loans in the aggregate are reported at amortized cost adjusted for any charge-offs, the ALL and any deferred fees or costs. From time to time, management identifies and designates certain residential mortgage loans (either newly originated mortgage loans or held in the loan portfolio) for sale, and, accordingly, these loans are transferred to loans held for sale.
The ALL is established through provisions for credit losses charged to income. Losses on loans, including impaired loans, are charged to the ALL when all or a portion of a loan is deemed to be uncollectible. Recoveries of loans previously charged off are credited to the ALL when realized.
In determining the appropriate level of ALL, the Company uses a methodology to systematically measure the amount of estimated loan loss exposure inherent in the loan portfolio. The methodology includes four elements: (1) identification of loss allocations for certain specific loans, (2) loss allocation factors for certain loan types based on credit grade and loss experience, (3) general loss allocations for other environmental factors, and (4) the unallocated portion of the allowance. The specific component relates to loans that are classified as substandard or doubtful. For such loans that are also classified as impaired, an allowance is established when the discounted cash flows (or collateral value or observable market price) of the impaired loan is lower than the carrying value of that loan. The methodology is in accordance with GAAP.
The Company uses a risk rating system to determine the credit quality of loans and applies the related loss allocation factors. In assessing the risk rating of a particular loan, the Company considers, among other factors, the obligor’s debt capacity, financial condition, the level of the obligor’s earnings, the amount and sources of repayment, the performance with respect to loan terms, the adequacy of collateral, the level and nature of contingent liabilities, management strength, and the industry in which the obligor operates. These factors are based on an evaluation of historical information, as well as subjective assessment and interpretation of current conditions. Emphasizing one factor over another, or considering additional factors that may be relevant in determining the risk rating of a particular loan but which are not currently an explicit part of our methodology, could impact the risk rating assigned to that loan. The Company at least annually reassesses and revises the loss allocation factors used in the assignment of loss exposure to appropriately reflect the analysis of loss experience. Portfolios of more homogenous populations of loans including home equity and consumer loans are analyzed as groups taking into account delinquency rates and other economic conditions which may affect the ability of borrowers to meet debt service requirements, including interest rates and energy costs. The Company also considers the results of regulatory examinations, historical loss ranges, portfolio composition, and other changes in the portfolio. An additional allocation is determined based on a judgmental process whereby management considers qualitative and quantitative assessments of other environmental factors. An unallocated portion of the total allowance is maintained to allow for shifts in portfolio composition and to account for uncertainty in the economic environment.
Since the methodology is based upon historical experience and trends as well as management’s judgment, factors may arise that result in different estimations. Significant factors that could give rise to changes in these estimates may include, but are not limited to, changes in economic conditions in the Company’s market area, concentration of risk, declines in local property values, and results of regulatory examinations.
58
Loans past due 30 days or more are considered delinquent. In general, consumer loans will be charged off if the loan is delinquent for 90 consecutive days. Commercial and real estate loans may be charged off in part or in full if they appear uncollectible.
A loan is considered impaired when, based on current information and events, it is probable that the Company will be unable to collect all principal and interest due according to the contractual terms of the loan. Impairment is measured on a loan by loan basis for commercial, commercial real estate, and construction loans by one of three measures: the present value of expected future cash flows discounted at the loan’s pre-modified effective interest rate; the loan’s observable market price; or the fair value of the collateral if the loan is collateral-dependent. Large groups of homogeneous loans are collectively evaluated for impairment. As such, the Company does not typically identify individual loans within these groupings as impaired loans for impairment evaluation and disclosure.
Interest and Fees on Loans
. Interest on loans is accrued at the contractual rate and credited to income based upon the principal amount outstanding. Loan origination fees received and certain direct loan origination costs are deferred and recognized in interest income as an adjustment of loan yield over the expected life of the loan (typically, the over the contractual life of the loan). A loan is classified as non-accrual generally when it becomes 90 days past due as to interest or principal payments. All previously accrued but unpaid interest on non-accrual loans is reversed from interest income in the current period. Interest payments received on non-accrual loans (including impaired loans) are applied as a reduction of principal. A loan remains on non-accrual status until all principal and interest amounts contractually due are brought current and future payments are reasonably assured.
Goodwill and Core Deposit Intangible
. Goodwill represents the excess cost of an acquisition over the fair value of the net assets acquired. Goodwill is not subject to amortization but rather is evaluated at least annually for impairment, or as events and circumstances dictate, at the reporting unit level. The Company's
two
reporting unit levels are: (i) banking and (ii) financial services. The banking reporting unit is representative of the Company's core banking business line, while the financial services reporting unit is representative of the Company's wealth management, trust and services business line. Any impairment write-down is charged to non-interest expense on the consolidated statements of income. Goodwill impairment is evaluated by the Company utilizing several standard valuation techniques, including discounted cash flow analyses, comparable transaction market multiples, and an estimation of the impact of business conditions and investor activities on the long-term value of the goodwill.
The Company tests goodwill for impairment utilizing the two-step process and fair value guidance outlined in GAAP. Step 1 compares the fair value of the reporting unit to its carrying value. If the fair value of the reporting unit is greater than its carrying value, then the reporting unit is not deemed to be impaired and no further assessment is required. However, if the fair value of the reporting unit is below its carrying value, GAAP requires that step 2 of the goodwill impairment test be performed. Step 2 involves a process similar to business combination accounting in which fair value is assigned to all assets, liabilities and other (non-goodwill) intangibles. The result of step 2 is calculating the implied fair value of goodwill for the reporting unit. If the implied fair value of goodwill for the reporting unit is greater than its carrying value, then the reporting unit’s goodwill is not impaired. However, if the reporting unit’s implied fair value of goodwill is below its carrying value, an impairment charge is recorded to mark the carrying value of goodwill to fair value.
Core deposit intangible represents the estimated value of acquired customer relationships and is amortized on a straight-line basis over the estimated life of those relationships (
5
to
10 years
from the acquisition dates). On an ongoing basis, management reviews the valuation and amortization of intangible assets to determine possible impairment.
BOLI
. BOLI represents the CSV of life insurance policies on the lives of certain active and retired employees where the Company is the beneficiary. The CSV of the policies is recorded as an asset. Increases in the CSV of the policies, as well as death benefits received, net of any CSV, are recorded in non-interest income on the consolidated statements of income, and are not subject to income taxes.
Premises and Equipment
. Premises and equipment are stated at cost, less accumulated depreciation and amortization, and fair value adjustments. Depreciation and amortization are computed on the straight-line method over the estimated useful lives of the related assets. Leasehold improvements are amortized over the lesser of the term of the respective lease or the estimated life of the improvement.
OREO
. OREO properties acquired through foreclosure or deed-in-lieu of foreclosure are recorded initially at estimated fair value less estimated costs to sell. Any write-down of the recorded investment in the related loan is charged to the ALL upon transfer to OREO. Thereafter, any further declines in the property’s values are recorded against current earnings. Upon acquisition of a property, a current appraisal or a broker’s opinion is used to substantiate fair value of the property.
59
Mortgage Servicing
. Servicing assets are recognized as separate assets when servicing rights are acquired through the sale of residential mortgage loans with servicing retained. Capitalized servicing rights, which are reported in other assets, are initially recorded at fair value and are amortized in proportion to, and over the period of, the estimated future servicing of the underlying mortgages (typically, the contractual life of the mortgage). Servicing assets are evaluated for impairment based upon the fair value of the rights as compared to amortized cost. Impairment is determined by stratifying rights by predominant characteristics, such as interest rates and terms. Fair value is determined using prices for similar assets with similar characteristics, when available, or based upon discounted cash flows using market-based assumptions. Impairment for an individual stratum is recognized through earnings to the extent that fair value is less than the capitalized amount for the stratum.
Other Borrowed Funds
. Other borrowed funds consist of commercial and retail repurchase agreements, FHLB overnight and short-term borrowings, federal funds purchased, line of credit advances, notes payable, and treasury, tax and loan deposits. Retail repurchase agreements generally mature within 30 days and are reflected at the amount of cash received in connection with the transaction. Commercial repurchase agreements are callable quarterly, generally
6
to
24 months
after issuance, and mature within
five years
. The Company may be required to provide additional collateral based on the fair value of the underlying securities. Treasury, tax and loan deposits generally do not have fixed maturity dates.
Income Taxes
. Income taxes are accounted for using the asset and liability method. Under this method, deferred tax assets and liabilities are recognized for the future tax implications attributable to differences between the financial statement carrying amounts of existing assets and liabilities and their respective tax bases. If current available information raises doubt as to the realization of the deferred tax assets, a valuation allowance is established. Deferred tax assets and liabilities are measured using enacted tax rates expected to apply to taxable income in the years in which those temporary differences are expected to be recovered or settled. The effect on deferred tax assets and liabilities of a change in tax rates is recognized in income in the period that includes the enactment date.
EPS
. Basic EPS excludes dilution and is computed by dividing net income applicable to common stock by the weighted average number of common shares outstanding for the year. Diluted EPS reflects the potential dilution that could occur if certain securities or other contracts to issue common stock (such as stock options) were exercised or converted into additional common shares that would then share in the earnings of the Company. Diluted EPS is computed by dividing net income applicable to common stock by the weighted average number of common shares outstanding for the year, plus an incremental number of common-equivalent shares computed using the treasury stock method.
Unvested share-based payment awards which include the right to receive non-forfeitable dividends are considered to participate with common stock in undistributed earnings for purposes of computing EPS. Restricted share grants and management stock purchase grants are considered participating securities for this purpose. Accordingly, the Company is required to calculate basic and diluted EPS amounts under the two-class method. Calculations of EPS under the two-class method (i) exclude any dividends paid or owed on participating securities and any undistributed earnings considered to be attributable to participating securities from the numerator and (ii) exclude the dilutive impact of the participating securities from the denominator.
Postretirement and Supplemental Retirement Plans
. The Company sponsors a postretirement health care plan and life insurance to certain eligible retired employees. The cost of providing postretirement benefits is accrued during the active service period of the employee. A supplemental retirement plan is also maintained for certain officers of the Company. The supplemental retirement plan is accrued on a current basis and recognizes costs over the estimated employee service period.
Stock-Based Compensation
. The fair value of restricted stock and stock options is determined on the date of grant and amortized to compensation expense, with a corresponding increase in common stock, over the longer of the service period or performance period, but in no event beyond an employee’s retirement date. For performance-based restricted stock, the Company estimates the degree to which performance conditions will be met to determine the number of shares that will vest and the related compensation expense. Compensation expense is adjusted in the period such estimates change. Non-forfeitable dividends, if any, paid on shares of restricted stock are recorded to retained earnings for shares that are expected to vest and to compensation expense for shares that are not expected to vest.
Off-Balance Sheet Credit Related Financial Instruments
. In the ordinary course of business, the Company enters into commitments to extend credit, including commercial letters of credit and standby letters of credit. Such financial instruments are recorded as loans when they are funded.
60
Derivative Financial Instruments Designated as Hedges
. The Company recognizes all derivatives in the consolidated statements of condition at fair value. On the date the Company enters into the derivative contract, the Company designates the derivative as a hedge of either a forecasted transaction or the variability of cash flows to be received or paid related to a recognized asset or liability (“cash flow hedge”), a hedge of the fair value of a recognized asset or liability or of an unrecognized firm commitment (“fair value hedge”), or a held for trading instrument (“trading instrument”). The Company formally documents relationships between hedging instruments and hedged items, as well as its risk management objectives and strategy for undertaking various hedge transactions. The Company also assesses, both at the hedge’s inception and on an ongoing basis, whether the derivatives that are used in hedging transactions are effective in offsetting changes in cash flows or fair values of hedged items. Changes in fair value of a derivative that is effective and that qualifies as a cash flow hedge are recorded in OCI and are reclassified into earnings when the forecasted transaction or related cash flows affect earnings. Changes in fair value of a derivative that qualifies as a fair value hedge and the change in fair value of the hedged item are both recorded in earnings and offset each other when the transaction is effective. Those derivatives that are classified as trading instruments are recorded at fair value with changes in fair value recorded in earnings. The Company discontinues hedge accounting when it determines that the derivative is no longer effective in offsetting changes in the cash flows of the hedged item, that it is unlikely that the forecasted transaction will occur, or that the designation of the derivative as a hedging instrument is no longer appropriate.
Segment Reporting
. The Company, through its bank and non-bank subsidiaries, provides a broad range of financial services to individuals and companies in Maine. These services include lending, checking, savings and time deposits, cash management, brokerage and trust services. While the Company’s management monitors operations of each subsidiary, substantially all revenues, profits, and assets of the Company are derived by the Bank from banking products and services and, therefore, the Company's management did not provide the segment reporting disclosures within the year ended December 31, 2013 Form 10-K as such was determined to be immaterial.
Recent Accounting Pronouncements
. In January 2013, the FASB issued ASU No. 2013-01, Balance Sheet (Topic 210): Clarifying the Scope of Disclosures about Offsetting Assets and Liabilities. This ASU clarifies that the scope of Update 2011-11 applies to derivatives accounted for in accordance with Topic 815, Derivatives and Hedging, including bifurcated embedded derivatives, repurchase agreements and reverse repurchase agreements, and securities borrowing and securities lending transactions that are either offset in accordance with Section 210-20-45 or Section 815-10-45 or subject to an enforceable master netting arrangement or similar agreement. This guidance is effective for fiscal years beginning on or after January 1, 2013, and interim periods within those annual periods. The clarifications provided in ASU No. 2013-01 did not have a material effect on the Company’s consolidated financial statements.
In February 2013, the FASB issued ASU No. 2013-02, Comprehensive Income (Topic 220): Reporting of Amounts Reclassified out of Accumulated Other Comprehensive Income. This ASU improves the reporting of reclassifications out of AOCI. The amendments in the ASU seek to attain that objective by requiring an entity to report the effect of significant reclassifications out of AOCI on the respective line items in net income if the amount being reclassified is required under GAAP to be reclassified in its entirety to net income. For other amounts that are not required under GAAP to be reclassified in their entirety to net income in the same reporting period, an entity is required to cross-reference other disclosures required under GAAP that provide additional detail about those amounts. This guidance is effective for reporting periods beginning after December 15, 2012, with early adoption permitted. Other than matters of presentation, the adoption of this new guidance did not have a material effect on the Company’s consolidated financial statements.
In July 2013, the FASB issued ASU No. 2013-10, Derivatives and Hedging (Topic 815): Inclusion of the Fed Funds Effective Swap Rate (or Overnight Index Swap Rate) as a Benchmark Interest Rate for Hedge Accounting Purposes. This ASU amends Topic 815 to permit the Fed Funds Effective Swap Rate to be used as a United States benchmark interest rate for hedge accounting purposes. The ASU seeks to provide another acceptable United States benchmark interest rate to provide risk managers with a more comprehensive spectrum of interest rate resets to utilize as the designated benchmark interest rate when applying the guidance of Topic 815. The amendments are effectively prospectively for qualifying new or redesignated hedging relationships entered into on or after July 17, 2013. The amendments provided in ASU No. 2013-10 did not have a material effect on the Company's consolidated financial statements.
61
In January 2014, the FASB issued ASU No. 2014-01, Investments - Equity Method and Joint Ventures (Topic 323): Accounting for Investments in Qualified Affordable Housing Projects. The ASU amends current guidance to permit reporting entities to make an accounting policy election to account for their investments in qualified affordable housing projects using the proportional amortization method if certain conditions are met. The amendments in this ASU are to be applied retrospectively to all periods presented. A reporting entity that uses the effective yield method to account for its investments in qualified affordable housing projects before the date of adoption may continue to apply such method to those preexisting investments. The ASU is effective for annual periods, and interim periods within those annual periods, beginning after December 15, 2014. The Company does not believe the ASU will have a material effect on the Company's consolidated financial statements.
In January 2014, the FASB issued ASU No. 2014-04, Receivables - Troubled Debt Restructurings by Creditors (Subtopic 310-40): Reclassification of Residential Real Estate Collateralized Consumer Mortgage Loans upon Foreclosure. The ASU was issued to clarify that an in substance repossession or foreclosure occurs, and a credit is considered to have received physical possession of residential real estate property collateralizing a consumer mortgage loan, upon either (1) the credit obtaining legal title to the residential real estate property upon completion of a foreclosure or (2) the borrower conveying all interest in the residential real estate property to the creditor to satisfy that loan through completion of a deed in lieu of foreclosure or through a similar legal agreement. Additionally, the ASU amendments require interim and annual disclosure of both (1) the amount of foreclosed residential real estate property held by the creditor and (2) the recorded investment in consumer mortgage loans collateralized by residential real estate property that are in the process of foreclosure according to local requirements of the applicable jurisdiction. The ASU is effective for annual periods, and interim periods within those annual periods, beginning after December 15, 2014, and the ASU is to be adopted using either a modified retrospective transition method or a prospective transition method. The Company does not believe the ASU will have a material effect on the Company's consolidated financial statements, other than the additional disclosures required.
2. Branch Divestiture and Acquisition
On October 4, 2013, the Bank completed its divestiture of its Franklin County branches, including the Farmington, Kingfield, Phillips, Rangeley and Stratton branches. Included in the transaction are branch deposits and borrowings of
$85.9 million
, business loans and certain consumer loans of
$46.0 million
and real estate and equipment of
$602,000
. The sales price represents a
3.5%
premium on deposits, par value on the loan portfolio and book value for the real estate. The Company recognized a pre-tax gain on the sale of
$2.7 million
. The Company incurred costs of
$374,000
related to the Branch Divestiture.
On October 26, 2012, the Bank acquired
15
full-service branches from Bank of America, National Association, pursuant to the terms and conditions of the Purchase and Assumption Agreement, dated April 23, 2012. The purchase price was
$12.0 million
less the premium received upon the sale of one of these branches of
$3.3 million
as agreed with the U.S. Department of Justice. While the Branch Acquisition is considered a purchase of a business for accounting purposes, revenues and expenses of the acquired branches and pro forma income statement information are not presented as the effect would not be material.
The following table summarizes the estimated fair values of the assets acquired and liabilities assumed at the date of acquisition:
|
Recognized amounts of identifiable assets acquired and (liabilities assumed), at fair value:
|
Fair Value
|
|||
|
Cash and cash equivalents
(1)
|
$
|
267,689
|
|
|
|
Loans
|
5,664
|
|
||
|
Premises and equipment
|
5,177
|
|
||
|
Core deposit intangible
|
2,856
|
|
||
|
Other assets
|
45
|
|
||
|
Total assets acquired
|
281,431
|
|
||
|
Deposits
|
(287,559
|
)
|
||
|
Other liabilities
|
(54
|
)
|
||
|
Total liabilities acquired
|
(287,613
|
)
|
||
|
Goodwill
|
$
|
(6,182
|
)
|
|
(1) Amount is net of
$8.7 million
deposit premium paid.
62
In 2013, the Company finalized its accounting for the Branch Acquisition. There were no material changes to the Company's initial estimates of fair value for the identifiable assets and liabilities assumed as previously recorded and disclosed as a result.
The Company estimated the fair value of loans acquired by utilizing a methodology which approximates the projected cash flows for each aggregated loan pool by estimating future credit losses and the rate of prepayments and discounting to present value based on a market rate for similar loans. There was no allowance for loan losses recorded for the acquired loans as the loans were initially recorded at fair value. The Company acquired
$6.0 million
in performing commercial loans and recorded a fair value mark of
$317,000
.
The
$2.9 million
core deposit intangible asset recognized as part of the Branch Acquisition is being amortized over its estimated useful life of five years using a straight-line method. The goodwill, which is not amortized for financial statement purposes, is deductible for tax purposes.
The fair value of savings and transaction deposit accounts acquired was assumed to approximate the carrying value as these accounts have no stated maturity and are payable on demand. Certificates of deposit were valued by projecting the expected cash flows based on the remaining contractual terms of the certificate of deposit. These cash flows were discounted based on a market rate for a certificate of deposit with a corresponding remaining maturity. The Company acquired
$286.7 million
of deposits and recorded a fair value mark of
$900,000
.
Direct costs related to the Branch Acquisition were expensed as incurred and amounted to
$2.3 million
for 2012. These acquisition integration expenses included technology costs related to system conversions, customer communications and professional fees.
The Company completed the Branch Acquisition to provide additional business opportunities in these acquired branch locations by increasing the Bank’s presence in these key growth markets. Future revenue opportunities include providing commercial and retail loans within the local communities and expanding our wealth management and investment advisory services.
3. Securities
The following tables summarize the amortized costs and estimated fair values of AFS securities, as of the dates indicated:
|
Amortized Cost
|
Unrealized Gains
|
Unrealized Losses
|
Fair
Value
|
||||||||||||
|
December 31, 2013:
|
|
|
|
|
|
|
|
|
|||||||
|
Obligations of states and political subdivisions
|
$
|
30,143
|
|
$
|
1,075
|
|
$
|
(11
|
)
|
$
|
31,207
|
|
|||
|
Mortgage-backed securities issued or guaranteed by U.S. government sponsored enterprises
|
397,409
|
|
5,528
|
|
(7,034
|
)
|
395,903
|
|
|||||||
|
Collateralized mortgage obligations issued or guaranteed by U.S. government sponsored enterprises
|
385,847
|
|
912
|
|
(12,324
|
)
|
374,435
|
|
|||||||
|
Private issue collateralized mortgage obligations
|
7,329
|
|
10
|
|
(407
|
)
|
6,932
|
|
|||||||
|
Total available-for-sale securities
|
$
|
820,728
|
|
$
|
7,525
|
|
$
|
(19,776
|
)
|
$
|
808,477
|
|
|||
|
December 31, 2012:
|
|
|
|
|
|
|
|
|
|||||||
|
Obligations of states and political subdivisions
|
$
|
31,112
|
|
$
|
1,928
|
|
$
|
—
|
|
$
|
33,040
|
|
|||
|
Mortgage-backed securities issued or guaranteed by U.S. government sponsored enterprises
|
345,528
|
|
12,699
|
|
(79
|
)
|
358,148
|
|
|||||||
|
Collateralized mortgage obligations issued or guaranteed by U.S. government sponsored enterprises
|
375,627
|
|
6,181
|
|
(120
|
)
|
381,688
|
|
|||||||
|
Private issue collateralized mortgage obligations
|
8,871
|
|
—
|
|
(697
|
)
|
8,174
|
|
|||||||
|
Total available-for-sale securities
|
$
|
761,138
|
|
$
|
20,808
|
|
$
|
(896
|
)
|
$
|
781,050
|
|
|||
At December 31, 2013, net unrealized losses on AFS securities included in AOCI amounted to
$8.0 million
, net of a deferred tax benefit of
$4.3 million
. At December 31, 2012, net unrealized gains on AFS securities included in AOCI amounted to
$12.9 million
, net of a deferred tax liability of
$7.0 million
.
63
Impaired Securities
Management periodically reviews the Company’s investment portfolio to determine the cause, magnitude and duration of declines in the fair value of each security. Thorough evaluations of the causes of the unrealized losses are performed to determine whether the impairment is temporary or other-than-temporary in nature. Considerations such as the ability of the securities to meet cash flow requirements, levels of credit enhancements, risk of curtailment, recoverability of invested amount over a reasonable period of time and the length of time the security is in a loss position, for example, are applied in determining OTTI. Once a decline in value is determined to be other-than-temporary, the value of the security is permanently reduced and a corresponding charge to earnings is recognized.
The following table presents the estimated fair values and gross unrealized losses of investment securities that were in a continuous loss position at December 31, 2013 and 2012, by length of time that individual securities in each category have been in a continuous loss position:
|
Less Than 12 Months
|
12 Months or More
|
Total
|
|||||||||||||||||||||
|
|
Fair Value
|
Unrealized Losses
|
Fair Value
|
Unrealized Losses
|
Fair Value
|
Unrealized Losses
|
|||||||||||||||||
|
December 31, 2013:
|
|
|
|
|
|
|
|
|
|
|
|
|
|||||||||||
|
Obligations of states and political subdivisions
|
$
|
2,143
|
|
$
|
(11
|
)
|
$
|
—
|
|
$
|
—
|
|
$
|
2,143
|
|
$
|
(11
|
)
|
|||||
|
Mortgage-backed securities issued or guaranteed by U.S. government sponsored enterprises
|
145,424
|
|
(4,189
|
)
|
43,915
|
|
(2,845
|
)
|
189,339
|
|
(7,034
|
)
|
|||||||||||
|
Collateralized mortgage obligations issued or guaranteed by U.S. government sponsored enterprises
|
239,278
|
|
(7,738
|
)
|
73,376
|
|
(4,586
|
)
|
312,654
|
|
(12,324
|
)
|
|||||||||||
|
Private issue collateralized mortgage obligations
|
122
|
|
(4
|
)
|
4,945
|
|
(403
|
)
|
5,067
|
|
(407
|
)
|
|||||||||||
|
Total
|
$
|
386,967
|
|
$
|
(11,942
|
)
|
$
|
122,236
|
|
$
|
(7,834
|
)
|
$
|
509,203
|
|
$
|
(19,776
|
)
|
|||||
|
December 31, 2012:
|
|
|
|
|
|
|
|
|
|
|
|
|
|||||||||||
|
Mortgage-backed securities issued or guaranteed by U.S. government sponsored enterprises
|
$
|
42,782
|
|
$
|
(79
|
)
|
$
|
—
|
|
$
|
—
|
|
$
|
42,782
|
|
$
|
(79
|
)
|
|||||
|
Collateralized mortgage obligations issued or guaranteed by U.S. government sponsored enterprises
|
73,098
|
|
(120
|
)
|
—
|
|
—
|
|
73,098
|
|
(120
|
)
|
|||||||||||
|
Private issue collateralized mortgage obligations
|
—
|
|
—
|
|
8,174
|
|
(697
|
)
|
8,174
|
|
(697
|
)
|
|||||||||||
|
Total
|
$
|
115,880
|
|
$
|
(199
|
)
|
$
|
8,174
|
|
$
|
(697
|
)
|
$
|
124,054
|
|
$
|
(896
|
)
|
|||||
At December 31, 2013, the Company held
93
investment securities with a fair value of
$509.2 million
with unrealized losses totaling $
19.8 million
that are considered temporary. Of these,
27
investment securities with a fair value of
$122.2 million
have been an unrealized loss position for 12 months or more. The decline in the fair value of the securities is reflective of an increase in interest rates during 2013 and is not indicative of an overall credit deterioration or other factors with the Company's investment securities portfolio. Specifically, included in the unrealized losses were Non-Agencies with a fair value of
$5.1 million
and unrealized losses of $
407,000
. The Company's management believes the unrealized losses for the Non-Agencies are the result of current market illiquidity and the underestimation of value in the market. Management currently has the intent and ability to retain these investment securities with unrealized losses until the decline in value has recovered. Stress tests are performed regularly on the higher risk bonds in the Company's investment portfolio using current statistical data to determine expected cash flows and forecast potential losses. The results of the stress tests throughout 2013 including at December 31, 2013, indicated that
no
OTTI write-downs were necessary during 2013.
64
At December 31, 2012,
$124.1 million
of the Company’s investment securities had unrealized losses that were primarily considered temporary. A large portion of the unrealized loss was related to the Non-Agencies, which includes
$7.5 million
that have been downgraded to non-investment grade. Including the Non-Agencies, there were
11
securities with a fair value of
$8.2 million
in the portfolio which had unrealized losses for twelve months or longer. The results of the stress tests during 2012, including at December 31, 2012, indicated potential future credit losses in the most likely scenario on
two
securities for which the Company recorded $
39,000
in OTTI write-downs during 2012.
Security Gains and Losses and OTTI of Securities
The following table details the Company’s sales of AFS investment securities, the gross realized gains and losses, and OTTI of securities:
|
Years Ended December 31,
|
|||||||||||
|
|
2013
|
2012
|
2011
|
||||||||
|
Proceeds from sales of securities
|
$
|
17,613
|
|
$
|
115,493
|
|
$
|
54,600
|
|
||
|
Gross realized gains
|
785
|
|
2,826
|
|
2,258
|
|
|||||
|
Gross realized losses
|
—
|
|
(289
|
)
|
(73
|
)
|
|||||
|
OTTI
|
—
|
|
(39
|
)
|
(109
|
)
|
|||||
During 2013, the Company sold certain investment securities with a total carrying value of
$16.8 million
in order to manage its liquidity and interest rate risk. The securities that were sold were primarily selected based on an assessment of their prepayment speed.
During 2012, the Company sold certain investment securities with a total carrying value of
$113.0 million
in order to manage its liquidity and interest rate risk. The securities that were sold were primarily selected based on an assessment of their prepayment speed.
One
Non-Agency investment security, which had previously recorded
$176,000
in OTTI, was sold due to the recent deterioration in its credit quality.
During 2011, the Company sold
16
municipal bonds totaling
$7.3 million
that the Company was monitoring that either had below “A” ratings, split ratings, withdrawn ratings, negative outlooks or were revenue bonds. Due to continued pressure on state and local government revenues around the country as municipalities struggle with a weak economy, management decided to sell these securities. The Company also sold
one
$10.2 million
agency security,
31
pass through securities totaling
$29.3 million
, and
three
Non-Agencies totaling
$7.8 million
. The Company had not recorded any OTTI on these securities; however, it did record OTTI of $
109,000
on
two
Non-Agency investment securities as the stress tests performed indicated potential future credit losses.
Securities Pledged
At December 31, 2013 and 2012, securities with an amortized cost of
$479.2 million
and
$465.0 million
, respectively, and estimated fair values of
$474.7 million
and
$482.4 million
, respectively, were pledged to secure FHLBB advances, public deposits, and securities sold under agreements to repurchase, and for other purposes required or permitted by law.
Contractual Maturities
The amortized cost and estimated fair values of AFS debt securities by contractual maturity at December 31, 2013 are shown below. Expected maturities will differ from contractual maturities because borrowers may have the right to call or prepay obligations with or without call or prepayment penalties.
|
Amortized Cost
|
Fair
Value
|
||||||
|
Due in one year or less
|
$
|
1,654
|
|
$
|
1,667
|
|
|
|
Due after one year through five years
|
29,753
|
|
30,433
|
|
|||
|
Due after five years through ten years
|
155,014
|
|
155,315
|
|
|||
|
Due after ten years
|
634,307
|
|
621,062
|
|
|||
|
|
$
|
820,728
|
|
$
|
808,477
|
|
|
65
4. Loans and Allowance for Loan Losses
The composition of the Company’s loan portfolio, excluding residential loans held for sale, at December 31, 2013 and 2012 was as follows:
|
December 31,
|
|||||||
|
|
2013
|
2012
|
|||||
|
Residential real estate loans
|
$
|
570,391
|
|
$
|
572,768
|
|
|
|
Commercial real estate loans
|
541,099
|
|
506,231
|
|
|||
|
Commercial loans
|
179,203
|
|
190,454
|
|
|||
|
Home equity loans
|
272,630
|
|
278,375
|
|
|||
|
Consumer loans
|
17,651
|
|
16,633
|
|
|||
|
Deferred loan fees net of costs
|
(572
|
)
|
(595
|
)
|
|||
|
Total loans
|
$
|
1,580,402
|
|
$
|
1,563,866
|
|
|
The Company’s lending activities are primarily conducted in Maine. The Company originates single family and multi-family residential loans, commercial real estate loans, business loans, municipal loans and a variety of consumer loans. In addition, the Company makes loans for the construction of residential homes, multi-family properties and commercial real estate properties. The ability and willingness of borrowers to honor their repayment commitments is generally dependent on the level of overall economic activity within the geographic area and the general economy. For the years ended December 31, 2013, 2012, and 2011, the Company sold
$33.3 million
,
$16.9 million
, and
$28.6 million
of fixed rate residential mortgage loans on the secondary market, which resulted in a net gain on sale of loans of
$728,000
,
$268,000
, and
$292,000
, respectively.
In 2012, the Company acquired
$6.0 million
in performing commercial loans in connection with the Branch Acquisition. The loans were recorded at fair value, which was determined by estimating the amount and timing of principal and interest cash flows expected to be collected on the loans and discounting those cash flows at a market rate of interest. As a result of this analysis, the Company recorded a fair value mark of
$317,000
, which will amortize over the estimated life of the loan. Additionally, the acquired loans did not have any related ALL as they were recorded at fair value; however, an ALL will be established should the credit quality of these loans deteriorate subsequent to the acquisition. As the acquired loans and fair value mark are immaterial to the Company's financial position, additional disclosures related to the acquired loans are not required.
The Company, in the normal course of business, has made loans to its subsidiaries, and certain officers, directors, and their associated companies, under terms that are consistent with the Company’s lending policies and regulatory requirements. Loans, including any unused lines of credit, to related parties were as follows:
|
December 31,
|
|||||||
|
|
2013
|
2012
|
|||||
|
Balance at beginning of year
|
$
|
14,590
|
|
$
|
15,361
|
|
|
|
Loans made/advanced and additions
|
4,317
|
|
350
|
|
|||
|
Repayments and reductions
|
(1,479
|
)
|
(1,121
|
)
|
|||
|
Balance at end of year
|
$
|
17,428
|
|
$
|
14,590
|
|
|
The ALL is management’s best estimate of the inherent risk of loss in the Company’s loan portfolio as of the consolidated statement of condition date. Management makes various assumptions and judgments about the collectability of the loan portfolio and provides an allowance for potential losses based on a number of factors including historical losses. If those assumptions are incorrect, the ALL may not be sufficient to cover losses and may cause an increase in the allowance in the future. Among the factors that could affect the Company’s ability to collect loans and require an increase to the allowance in the future are: (i) general real estate and economic conditions; (ii) regional credit concentration; (iii) industry concentration, for example in the hospitality, tourism and recreation industries; and (iv) a requirement by federal and state regulators to increase the provision for loan losses or recognize additional charge-offs.
66
Prior to 2013, the Company performed its annual assessment of the loss allocation factors for its various loan portfolios and pools during the first calendar quarter of the year. In 2013, the Company performed this assessment in the first quarter and, again, in the fourth quarter. The Company believes performing this assessment in advance of its calendar year end and financial reporting is a best practice and, going forward, will continue to perform annually in the fourth quarter of the calendar year. In conjunction with the fourth quarter assessment of the loss allocation factors, the Company eliminated a pool of smaller-balanced non-performing residential loans and released the related allowance. The net effect to the ALL was a
$945,000
release of the allocated allowance. This pool was created prior to 2013 when the Company was experiencing significant increases in non-performing residential real estate secured loans as a result of post-recession consumer strain. The associated reserve was based on estimated fair value of the loans if sold as a group. While the loans in the pool shared certain characteristics, the qualifying pool composition varied. The Company determined the sale of loans as a group was less likely and discontinued the use of a separate pool. Loans that were formerly part of this pooling methodology are now being evaluated for an allowance as part of the loss allocation factor analysis.
During 2012, the Company modified its process to base historical loss factors on the net rather than gross charge-offs. The effect of the change was to reduce the historical loss factor component of the ALL by
$325,000
.
The board of directors monitors credit risk through the Directors’ Loan Review Committee, which reviews large credit exposures, monitors the external loan review reports, reviews the lending authority for individual loan officers when required, and has approval authority and responsibility for all matters regarding the loan policy and other credit-related policies, including reviewing and monitoring asset quality trends, concentration levels, and the ALL methodology. The Corporate Risk Management Group and the Credit Risk Policy Committee oversee the Company's systems and procedures to monitor the credit quality of its loan portfolio, conduct a loan review program, maintain the integrity of the loan rating system, determine the adequacy of the ALL, and support the oversight efforts of the Directors' Loan Review Committee and the board of directors. The Company's practice is to proactively manage the portfolio such that management can identify problem credits early, assess and implement effective work-out strategies, and take charge-offs as promptly as practical. In addition, the Company continuously reassesses its underwriting standards in response to credit risk posed by changes in economic conditions. For purposes of determining the ALL, the Company disaggregates its loans into portfolio segments, which include residential real estate, commercial real estate, commercial, home equity, and consumer.
The following table presents the activity in the ALL and select loan information by portfolio segment for the year ended December 31, 2013:
|
Residential Real Estate
|
Commercial Real Estate
|
Commercial
|
Home
Equity
|
Consumer
|
Unallocated
|
Total
|
|||||||||||||||||||||
|
ALL:
|
|
|
|
|
|
|
|
|
|
|
|
|
|
|
|||||||||||||
|
Beginning balance
|
$
|
6,996
|
|
$
|
4,549
|
|
$
|
5,933
|
|
$
|
2,520
|
|
$
|
184
|
|
$
|
2,862
|
|
$
|
23,044
|
|
||||||
|
Loans charged off
|
(1,059
|
)
|
(952
|
)
|
(1,426
|
)
|
(647
|
)
|
(190
|
)
|
—
|
|
(4,274
|
)
|
|||||||||||||
|
Recoveries
|
35
|
|
121
|
|
495
|
|
56
|
|
61
|
|
—
|
|
768
|
|
|||||||||||||
|
Provision (reduction)
|
(369
|
)
|
656
|
|
1,218
|
|
474
|
|
264
|
|
(191
|
)
|
2,052
|
|
|||||||||||||
|
Ending balance
|
$
|
5,603
|
|
$
|
4,374
|
|
$
|
6,220
|
|
$
|
2,403
|
|
$
|
319
|
|
$
|
2,671
|
|
$
|
21,590
|
|
||||||
|
ALL balance attributable loans:
|
|||||||||||||||||||||||||||
|
Individually evaluated for impairment
|
$
|
1,750
|
|
$
|
526
|
|
$
|
132
|
|
$
|
433
|
|
$
|
140
|
|
$
|
—
|
|
$
|
2,981
|
|
||||||
|
Collectively evaluated for impairment
|
3,853
|
|
3,848
|
|
6,088
|
|
1,970
|
|
179
|
|
2,671
|
|
18,609
|
|
|||||||||||||
|
Total ending ALL
|
$
|
5,603
|
|
$
|
4,374
|
|
$
|
6,220
|
|
$
|
2,403
|
|
$
|
319
|
|
$
|
2,671
|
|
$
|
21,590
|
|
||||||
|
Loans:
|
|
|
|
|
|
|
|
|
|
|
|
|
|
|
|||||||||||||
|
Individually evaluated for impairment
|
$
|
14,435
|
|
$
|
8,864
|
|
$
|
2,635
|
|
$
|
1,571
|
|
$
|
442
|
|
$
|
—
|
|
$
|
27,947
|
|
||||||
|
Collectively evaluated for impairment
|
555,384
|
|
532,235
|
|
176,568
|
|
271,059
|
|
17,209
|
|
—
|
|
1,552,455
|
|
|||||||||||||
|
Total ending loans balance
|
$
|
569,819
|
|
$
|
541,099
|
|
$
|
179,203
|
|
$
|
272,630
|
|
$
|
17,651
|
|
$
|
—
|
|
$
|
1,580,402
|
|
||||||
67
The following table presents activity in the ALL and select loan information by portfolio segment for the year ended December 31, 2012:
|
Residential Real Estate
|
Commercial Real Estate
|
Commercial
|
Home Equity
|
Consumer
|
Unallocated
|
Total
|
|||||||||||||||||||||
|
ALL:
|
|
|
|
|
|
|
|
|
|
|
|
|
|
|
|||||||||||||
|
Beginning balance
|
$
|
6,398
|
|
$
|
5,702
|
|
$
|
4,846
|
|
$
|
2,704
|
|
$
|
420
|
|
$
|
2,941
|
|
$
|
23,011
|
|
||||||
|
Loans charged off
|
(1,197
|
)
|
(593
|
)
|
(1,393
|
)
|
(1,234
|
)
|
(85
|
)
|
—
|
|
(4,502
|
)
|
|||||||||||||
|
Recoveries
|
73
|
|
222
|
|
406
|
|
23
|
|
20
|
|
—
|
|
744
|
|
|||||||||||||
|
Provision (reduction)
|
1,722
|
|
(782
|
)
|
2,074
|
|
1,027
|
|
(171
|
)
|
(79
|
)
|
3,791
|
|
|||||||||||||
|
Ending balance
|
$
|
6,996
|
|
$
|
4,549
|
|
$
|
5,933
|
|
$
|
2,520
|
|
$
|
184
|
|
$
|
2,862
|
|
$
|
23,044
|
|
||||||
|
ALL balance attributable loans:
|
|||||||||||||||||||||||||||
|
Individually evaluated for impairment
|
$
|
2,255
|
|
$
|
265
|
|
$
|
286
|
|
$
|
261
|
|
$
|
39
|
|
$
|
—
|
|
$
|
3,106
|
|
||||||
|
Collectively evaluated for impairment
|
4,741
|
|
4,284
|
|
5,647
|
|
2,259
|
|
145
|
|
2,862
|
|
19,938
|
|
|||||||||||||
|
Total ending ALL
|
$
|
6,996
|
|
$
|
4,549
|
|
$
|
5,933
|
|
$
|
2,520
|
|
$
|
184
|
|
$
|
2,862
|
|
$
|
23,044
|
|
||||||
|
Loans:
|
|
|
|
|
|
|
|
|
|
|
|
|
|
|
|||||||||||||
|
Individually evaluated for impairment
|
$
|
13,805
|
|
$
|
7,968
|
|
$
|
3,610
|
|
$
|
1,515
|
|
$
|
259
|
|
$
|
—
|
|
$
|
27,157
|
|
||||||
|
Collectively evaluated for impairment
|
558,368
|
|
498,263
|
|
186,844
|
|
276,860
|
|
16,374
|
|
—
|
|
1,536,709
|
|
|||||||||||||
|
Total ending loans balance
|
$
|
572,173
|
|
$
|
506,231
|
|
$
|
190,454
|
|
$
|
278,375
|
|
$
|
16,633
|
|
$
|
—
|
|
$
|
1,563,866
|
|
||||||
The ALL for the Company's portfolio segments is determined based on loan balances and the historical performance factor of each portfolio segment. The significant change in the ALL at December 31, 2013 compared to December 31, 2012 was within the residential real estate portfolio segment. As previously discussed, the decrease in the ALL for the residential real estate portfolio segment is primarily the result of a change in the allowance related to the pool of residential real estate loans for which a separate reserve was previously established.
The Company focuses on maintaining a well-balanced and diversified loan portfolio. Despite such efforts, it is recognized that credit concentrations may occasionally emerge as a result of economic conditions, changes in local demand, natural loan growth and runoff. To ensure that credit concentrations can be effectively identified, all commercial and commercial real estate loans are assigned Standard Industrial Classification codes, North American Industry Classification System codes, and state and county codes. Shifts in portfolio concentrations are monitored by the Corporate Risk Management Group. As of December 31, 2013, the
two
most significant industry exposures within the commercial real estate loan portfolio were non-residential building operators (operators of commercial and industrial buildings, retail establishments, theaters, banks and insurance buildings) and lodging (inns, bed & breakfasts, ski lodges, tourist cabins, hotels, and motels). At December 31, 2013, exposure to these
two
industries, as a percentage of total commercial real estate loans was
28%
and
25%
, respectively.
To further identify loans with similar risk profiles, the Company categorizes each portfolio segment into classes by credit risk characteristic and applies a credit quality indicator to each portfolio segment. The indicators for commercial, commercial real estate and residential real estate loans are represented by Grades 1 through 10 as outlined below. In general, risk ratings are adjusted periodically throughout the year as updated analysis and review warrants. This process may include, but is not limited to annual credit and loan reviews, periodic reviews of loan performance metrics such as delinquency rates, and quarterly reviews of adversely risk rated loans. The Company uses the following definitions when assessing grades for the purpose of evaluating the risk and adequacy of the ALL:
|
•
|
Grade 1 through 6 — Grades 1 through 6 represent loans that are not subject to adverse criticism as defined in regulatory guidance. Loans in these groups exhibit characteristics that represent low to moderate risks, which is measured using a variety of credit risk criteria, such as cash flow coverage, debt service coverage, balance sheet leverage, liquidity, management experience, industry position, prevailing economic conditions, support from secondary sources of repayment and other credit factors that may be relevant to a specific loan. In general, these loans are support by properly margined collateral and guarantees of principal parties.
|
|
•
|
Grade 7 — Loans with potential weakness (Special Mention). Loans in this category are currently protected based on collateral and repayment capacity and do not constitute undesirable credit risk, but have potential weakness that may result in deterioration of the repayment process at some future date. This classification is used if a negative trend is evident in the obligor’s financial situation. Special mention loans do not sufficiently expose the Company to warrant adverse classification.
|
68
|
•
|
Grade 8 — Loans with definite weakness (Substandard). Loans classified as substandard are inadequately protected by the current sound worth and paying capacity of the obligor or by collateral pledged. Borrowers experience difficulty in meeting debt repayment requirements. Deterioration is sufficient to cause the Company to look to the sale of collateral.
|
|
•
|
Grade 9 — Loans with potential loss (Doubtful). Loans classified as doubtful have all the weaknesses inherent in the substandard grade with the added characteristic that the weaknesses make collection or liquidation of the loan in full highly questionable and improbable. The possibility of some loss is extremely high, but because of specific pending factors that may work to the advantage and strengthening of the asset, its classification as an estimated loss is deferred until its more exact status may be determined.
|
|
•
|
Grade 10 — Loans with definite loss (Loss). Loans classified as loss are considered uncollectible. The loss classification does not mean that the asset has absolutely no recovery or salvage value, but rather that it is not practical or desirable to defer writing off the asset because recovery and collection time may be protracted.
|
Asset quality indicators are periodically reassessed to appropriately reflect the risk composition of the Company’s loan portfolio. Home equity and consumer loans are not individually risk rated, but rather analyzed as groups taking into account delinquency rates and other economic conditions which may affect the ability of borrowers to meet debt service requirements, including interest rates and energy costs. Performing loans include loans that are current and loans that are past due less than 90 days. Loans that are past due over 90 days and non-accrual loans are considered non-performing loans.
The following table summarizes credit risk exposure indicators by portfolio segment as of the following dates:
|
Residential Real Estate
|
Commercial Real Estate
|
Commercial
|
Home Equity
|
Consumer
|
Total
|
||||||||||||||||||
|
December 31, 2013:
|
|||||||||||||||||||||||
|
Pass (Grades 1 – 6)
|
$
|
551,035
|
|
$
|
496,257
|
|
$
|
155,851
|
|
$
|
—
|
|
$
|
—
|
|
$
|
1,203,143
|
|
|||||
|
Performing
|
—
|
|
—
|
|
—
|
|
271,059
|
|
17,210
|
|
288,269
|
|
|||||||||||
|
Special Mention (Grade 7)
|
3,196
|
|
7,749
|
|
11,315
|
|
—
|
|
—
|
|
22,260
|
|
|||||||||||
|
Substandard (Grade 8)
|
15,588
|
|
37,093
|
|
12,037
|
|
—
|
|
—
|
|
64,718
|
|
|||||||||||
|
Non-performing
|
—
|
|
—
|
|
—
|
|
1,571
|
|
441
|
|
2,012
|
|
|||||||||||
|
Total
|
$
|
569,819
|
|
$
|
541,099
|
|
$
|
179,203
|
|
$
|
272,630
|
|
$
|
17,651
|
|
$
|
1,580,402
|
|
|||||
|
December 31, 2012:
|
|||||||||||||||||||||||
|
Pass (Grades 1 – 6)
|
$
|
555,444
|
|
$
|
440,610
|
|
$
|
165,460
|
|
$
|
—
|
|
$
|
—
|
|
$
|
1,161,514
|
|
|||||
|
Performing
|
—
|
|
—
|
|
—
|
|
276,742
|
|
16,376
|
|
293,118
|
|
|||||||||||
|
Special Mention (Grade 7)
|
1,291
|
|
17,069
|
|
7,449
|
|
—
|
|
—
|
|
25,809
|
|
|||||||||||
|
Substandard (Grade 8)
|
15,438
|
|
48,552
|
|
17,545
|
|
—
|
|
—
|
|
81,535
|
|
|||||||||||
|
Non-performing
|
—
|
|
—
|
|
—
|
|
1,633
|
|
257
|
|
1,890
|
|
|||||||||||
|
Total
|
$
|
572,173
|
|
$
|
506,231
|
|
$
|
190,454
|
|
$
|
278,375
|
|
$
|
16,633
|
|
$
|
1,563,866
|
|
|||||
The Company closely monitors the performance of its loan portfolio. A loan is placed on non-accrual status when the financial condition of the borrower is deteriorating, payment in full of both principal and interest is not expected as scheduled or principal or interest has been in default for 90 days or more. Exceptions may be made if the asset is well-secured by collateral sufficient to satisfy both the principal and accrued interest in full and collection is assured by a specific event such as the closing of a pending sale contract. When one loan to a borrower is placed on non-accrual status, all other loans to the borrower are re-evaluated to determine if they should also be placed on non-accrual status. All previously accrued and unpaid interest is reversed at this time. A loan may be returned to accrual status when collection of principal and interest is assured and the borrower has demonstrated timely payments of principal and interest for a reasonable period. Unsecured loans, however, are not normally placed on non-accrual status because they are charged-off once their collectability is in doubt.
69
The following is a loan aging analysis by portfolio segment (including loans past due over 90 days and non-accrual loans) and a summary of non-accrual loans, which include TDRs, and loans past due over 90 days and accruing as of the following dates:
|
30 – 59 Days Past Due
|
60 – 89 Days Past Due
|
Greater Than 90 Days
|
Total Past Due
|
Current
|
Total Loans Outstanding
|
Loans > 90 Days Past Due and Accruing
|
Non-Accrual Loans
|
||||||||||||||||||||||||
|
December 31, 2013:
|
|||||||||||||||||||||||||||||||
|
Residential real estate
|
$
|
3,218
|
|
$
|
684
|
|
$
|
7,269
|
|
$
|
11,171
|
|
$
|
558,648
|
|
569,819
|
|
$
|
—
|
|
$
|
10,520
|
|
||||||||
|
Commercial real estate
|
926
|
|
2,036
|
|
3,301
|
|
6,263
|
|
534,836
|
|
541,099
|
|
257
|
|
7,799
|
|
|||||||||||||||
|
Commercial
|
159
|
|
237
|
|
1,980
|
|
2,376
|
|
176,827
|
|
179,203
|
|
198
|
|
2,146
|
|
|||||||||||||||
|
Home equity
|
1,395
|
|
388
|
|
1,007
|
|
2,790
|
|
269,840
|
|
272,630
|
|
—
|
|
1,571
|
|
|||||||||||||||
|
Consumer
|
63
|
|
21
|
|
418
|
|
502
|
|
17,149
|
|
17,651
|
|
—
|
|
441
|
|
|||||||||||||||
|
Total
|
$
|
5,761
|
|
$
|
3,366
|
|
$
|
13,975
|
|
$
|
23,102
|
|
$
|
1,557,300
|
|
$
|
1,580,402
|
|
$
|
455
|
|
$
|
22,477
|
|
|||||||
|
December 31, 2012:
|
|||||||||||||||||||||||||||||||
|
Residential real estate
|
$
|
1,459
|
|
$
|
850
|
|
$
|
8,410
|
|
$
|
10,719
|
|
$
|
561,454
|
|
$
|
572,173
|
|
$
|
193
|
|
$
|
10,584
|
|
|||||||
|
Commercial real estate
|
896
|
|
2,227
|
|
5,380
|
|
8,503
|
|
497,728
|
|
506,231
|
|
138
|
|
6,719
|
|
|||||||||||||||
|
Commercial
|
1,079
|
|
68
|
|
2,969
|
|
4,116
|
|
186,338
|
|
190,454
|
|
160
|
|
3,409
|
|
|||||||||||||||
|
Home equity
|
2,230
|
|
355
|
|
1,105
|
|
3,690
|
|
274,685
|
|
278,375
|
|
118
|
|
1,514
|
|
|||||||||||||||
|
Consumer
|
342
|
|
199
|
|
259
|
|
800
|
|
15,833
|
|
16,633
|
|
2
|
|
257
|
|
|||||||||||||||
|
Total
|
$
|
6,006
|
|
$
|
3,699
|
|
$
|
18,123
|
|
$
|
27,828
|
|
$
|
1,536,038
|
|
$
|
1,563,866
|
|
$
|
611
|
|
$
|
22,483
|
|
|||||||
Interest income that would have been recognized if loans on non-accrual status had been current in accordance with their original terms was approximately
$990,000
for 2013 and
$1.1 million
for both 2012 and 2011.
The Company takes a conservative approach in credit risk management and remains focused on community lending and reinvesting. The Company works closely with borrowers experiencing credit problems to assist in loan repayment or term modifications. TDR loans consist of loans where the Company, for economic or legal reasons related to the borrower’s financial difficulties, granted a concession to the borrower that it would not otherwise consider. TDRs involve term modifications or a reduction of either interest or principal. Once such an obligation has been restructured, it will continue to remain in a restructured status until paid in full.
At December 31, 2013 and 2012, the allowance related to TDRs was
$656,000
and
$494,000
, respectively. The specific reserve component was determined by discounting the total expected future cash flows from the borrower, or if the loan is currently collateral-dependent, using the fair value of the underlying collateral, which was obtained through independent appraisals and internal evaluations. At December 31, 2013, the Company did not have any commitments to lend additional funds to borrowers with loans classified as TDRs.
For 2013, the Company modified
fourteen
loans as TDRs, which had current balances of
$1.7 million
at December 31, 2013. For 2012, the Company modified
nine
loans with current balances of
$1.9 million
at December 31, 2012. The modification of these loans as TDRs did not have a material financial effect on the Company. Loans restructured due to credit difficulties that are now performing were
$5.5 million
at December 31, 2013 and
$4.7 million
at December 31, 2012. The Company had
three
TDRs that subsequently defaulted during 2013, which had current balances of
$765,000
at December 31, 2013. The Company had
one
TDR that subsequently defaulted during 2012, which had a current balance of
$65,000
at December 31, 2012.
70
The following is a summary of accruing and non-accruing TDR loans by portfolio segment as of December 31, 2013 and 2012:
|
Number of Contracts
|
Pre-Modification Outstanding Recorded Investment
|
Post-Modification Outstanding Recorded Investment
|
Current Balance
|
||||||||||||||||||||||||||
|
2013
|
2012
|
2013
|
2012
|
2013
|
2012
|
2013
|
2012
|
||||||||||||||||||||||
|
Residential real estate
|
26
|
|
20
|
|
$
|
4,140
|
|
$
|
3,305
|
|
$
|
4,311
|
|
$
|
3,434
|
|
$
|
4,089
|
|
$
|
3,286
|
|
|||||||
|
Commercial real estate
|
10
|
|
6
|
|
3,031
|
|
2,602
|
|
3,074
|
|
2,649
|
|
2,558
|
|
2,344
|
|
|||||||||||||
|
Commercial
|
7
|
|
3
|
|
504
|
|
303
|
|
504
|
|
303
|
|
488
|
|
236
|
|
|||||||||||||
|
Consumer and home equity
|
1
|
|
1
|
|
3
|
|
3
|
|
3
|
|
3
|
|
1
|
|
2
|
|
|||||||||||||
|
Total
|
44
|
|
30
|
|
$
|
7,678
|
|
$
|
6,213
|
|
$
|
7,892
|
|
$
|
6,389
|
|
$
|
7,136
|
|
$
|
5,868
|
|
|||||||
The following is a summary of TDR loans that subsequently defaulted by portfolio segment as of December 31, 2013 and 2012:
|
2013
|
2012
|
||||||||||||
|
Number of Contracts
|
Recorded Investment
|
Number of Contracts
|
Recorded Investment
|
||||||||||
|
Residential real estate
|
1
|
|
$
|
109
|
|
1
|
|
$
|
65
|
|
|||
|
Commercial real estate
|
2
|
|
656
|
|
—
|
|
—
|
|
|||||
|
Total
|
3
|
|
$
|
765
|
|
1
|
|
$
|
65
|
|
|||
Impaired loans consist of non-accrual and TDR loans. All impaired loans are allocated a portion of the allowance to cover potential losses.
The following is a summary of impaired loan balances and the associated allowance by portfolio segment as of December 31, 2013:
|
Recorded Investment
|
Unpaid Principal Balance
|
Related Allowance
|
Average Recorded Investment
|
Interest Income Recognized
|
|||||||||||||||
|
With related allowance recorded:
|
|
|
|
|
|
|
|
|
|
|
|||||||||
|
Residential real estate
|
$
|
11,902
|
|
$
|
11,902
|
|
$
|
1,750
|
|
$
|
10,411
|
|
$
|
118
|
|
||||
|
Commercial real estate
|
6,805
|
|
6,805
|
|
526
|
|
5,517
|
|
20
|
|
|||||||||
|
Commercial
|
1,876
|
|
1,876
|
|
132
|
|
2,543
|
|
10
|
|
|||||||||
|
Home equity
|
1,228
|
|
1,228
|
|
433
|
|
1,291
|
|
—
|
|
|||||||||
|
Consumer
|
425
|
|
425
|
|
140
|
|
460
|
|
—
|
|
|||||||||
|
Ending Balance
|
$
|
22,236
|
|
$
|
22,236
|
|
$
|
2,981
|
|
$
|
20,222
|
|
$
|
148
|
|
||||
|
Without related allowance recorded:
|
|
|
|
|
|
|
|
|
|
|
|||||||||
|
Residential real estate
|
$
|
2,533
|
|
$
|
3,846
|
|
$
|
—
|
|
$
|
2,925
|
|
$
|
28
|
|
||||
|
Commercial real estate
|
2,059
|
|
2,782
|
|
—
|
|
3,362
|
|
55
|
|
|||||||||
|
Commercial
|
759
|
|
871
|
|
—
|
|
765
|
|
8
|
|
|||||||||
|
Home equity
|
343
|
|
479
|
|
—
|
|
334
|
|
—
|
|
|||||||||
|
Consumer
|
17
|
|
37
|
|
—
|
|
11
|
|
—
|
|
|||||||||
|
Ending Balance
|
$
|
5,711
|
|
$
|
8,015
|
|
$
|
—
|
|
$
|
7,397
|
|
$
|
91
|
|
||||
|
Total impaired loans
|
$
|
27,947
|
|
$
|
30,251
|
|
$
|
2,981
|
|
$
|
27,619
|
|
$
|
239
|
|
||||
71
The following is a summary of impaired loan balances and the associated allowance by portfolio segment as of December 31, 2012:
|
Recorded Investment
|
Unpaid Principal Balance
|
Related Allowance
|
Average Recorded Investment
|
Interest Income Recognized
|
|||||||||||||||
|
With related allowance recorded:
|
|
|
|
|
|
|
|
|
|
|
|||||||||
|
Residential real estate
|
$
|
11,021
|
|
$
|
11,021
|
|
$
|
2,255
|
|
$
|
10,585
|
|
$
|
114
|
|
||||
|
Commercial real estate
|
4,296
|
|
4,296
|
|
265
|
|
5,551
|
|
—
|
|
|||||||||
|
Commercial
|
2,971
|
|
2,971
|
|
286
|
|
3,927
|
|
—
|
|
|||||||||
|
Home equity
|
1,236
|
|
1,236
|
|
261
|
|
1,289
|
|
—
|
|
|||||||||
|
Consumer
|
257
|
|
257
|
|
39
|
|
239
|
|
—
|
|
|||||||||
|
Ending Balance
|
$
|
19,781
|
|
$
|
19,781
|
|
$
|
3,106
|
|
$
|
21,591
|
|
$
|
114
|
|
||||
|
Without related allowance recorded:
|
|
|
|
|
|
|
|
|
|
|
|||||||||
|
Residential real estate
|
$
|
2,784
|
|
$
|
3,841
|
|
$
|
—
|
|
$
|
2,548
|
|
$
|
26
|
|
||||
|
Commercial real estate
|
3,672
|
|
4,127
|
|
—
|
|
2,056
|
|
33
|
|
|||||||||
|
Commercial
|
639
|
|
956
|
|
—
|
|
389
|
|
13
|
|
|||||||||
|
Home equity
|
279
|
|
550
|
|
—
|
|
617
|
|
—
|
|
|||||||||
|
Consumer
|
2
|
|
2
|
|
—
|
|
6
|
|
—
|
|
|||||||||
|
Ending Balance
|
$
|
7,376
|
|
$
|
9,476
|
|
$
|
—
|
|
$
|
5,616
|
|
$
|
72
|
|
||||
|
Total impaired loans
|
$
|
27,157
|
|
$
|
29,257
|
|
$
|
3,106
|
|
$
|
27,207
|
|
$
|
186
|
|
||||
5. Goodwill and Other Intangible Assets
In 2012, the Company recorded
$6.2 million
of goodwill and
$2.9 million
of core deposit intangible related to the Branch Acquisition.
The changes in goodwill for the years ended December 31, 2013 and 2012 are shown in the table below:
|
|
Banking
|
Financial Services
|
Total
|
||||||||
|
December 31, 2011:
|
|
|
|
|
|
|
|||||
|
Goodwill
|
$
|
34,720
|
|
$
|
7,750
|
|
$
|
42,470
|
|
||
|
Accumulated impairment losses
|
—
|
|
(740
|
)
|
(740
|
)
|
|||||
|
Reported goodwill
|
34,720
|
|
7,010
|
|
41,730
|
|
|||||
|
2012 activity
|
6,182
|
|
(276
|
)
|
5,906
|
|
|||||
|
December 31, 2012:
|
|
|
|
|
|
|
|||||
|
Goodwill
|
40,902
|
|
7,474
|
|
48,376
|
|
|||||
|
Accumulated impairment losses
|
—
|
|
(740
|
)
|
(740
|
)
|
|||||
|
Reported goodwill
|
40,902
|
|
6,734
|
|
47,636
|
|
|||||
|
2013 activity
|
—
|
|
(2,830
|
)
|
(2,830
|
)
|
|||||
|
December 31, 2013:
|
|||||||||||
|
Goodwill
|
40,902
|
|
7,474
|
|
48,376
|
|
|||||
|
Accumulated impairment losses
|
—
|
|
(3,570
|
)
|
(3,570
|
)
|
|||||
|
Reported goodwill
|
$
|
40,902
|
|
$
|
3,904
|
|
$
|
44,806
|
|
||
The Company performs its annual goodwill impairment assessment as of November 30 and at interim periods if indicators of potential impairment exist. At December 31, 2013, the carrying value of goodwill was
$44.8 million
, consisting of goodwill of
$40.9 million
associated with the banking reporting unit and
$3.9 million
attributable to the financial services reporting unit.
The annual impairment evaluation of goodwill associated with the banking reporting unit did not identify any impairment in 2013. The Company engaged an independent valuation firm to assist with the goodwill impairment assessment for the
72
financial services reporting unit as of November 30, 2013 as qualitative factors suggested that it was more-likely-than-not that the fair value of the reporting unit was less than its carrying amount. These qualitative factors included a decline in the revenue base as the result of (i) a decision to focus on the Company’s core business of managing assets and administering trusts for families and local nonprofit organizations resulting in a lower revenue base by increasing account minimums and transferring smaller relationships to affiliates; and (ii) divesting the employee benefits product line. Also in the fourth quarter of 2013, new information became available resulting in the Company refining its approach of who represents a market participant for the financial services reporting unit and reassessing the valuation implications imposed by the required regulatory capital requirements.
The Company performed the two-step goodwill impairment test in accordance with GAAP. In performing step 1, two separate valuation methodologies were used to determine the fair value of the financial services reporting unit: (i) a discounted cash flow valuation technique (income approach); and (ii) a comparison of the price to revenue and assets under management of comparable market participant transactions (market approach). Both methods indicated the fair value of the financial services reporting unit was less than its carrying value. The step 2 analysis was then performed, and the results indicated the financial services reporting unit goodwill was impaired as the implied fair value of goodwill was less than its carrying value. As a result, the Company recorded a non-cash goodwill impairment charge of
$2.8 million
related to the financial services reporting unit included within non-interest expense in the consolidated statements of income for the year ended December 31, 2013. The impairment was caused by lower forecasted revenue, an increase in the discount rate, the anticipated market participants and increased regulatory driven operating costs and capital levels required by potential market participants which impacts the valuation metrics.
The fair value of goodwill for the financial services reporting unit as of November 30, 2013 was determined by evenly weighting the income and market approach. The income approach utilized a discounted cash flow method, which is based on the expected future cash flows of the reporting unit. The key assumptions within the discounted cash flow model include projected assets under management and revenue growth, projected margin, and the discount rate. The market approach measures fair value based on what other market participants have paid for assets that can be considered reasonably similar to those being valued. The following table presents the key Level 3 unobservable inputs used within the discounted cash flow model to measure fair value of the financial services reporting unit at November 30, 2013:
|
Valuation Methodology
|
Unobservable Input
|
Input Used
|
||
|
Discounted cash flow
|
Revenue growth rate
|
5.0%
|
||
|
Margin percentage
|
8.3%
|
|||
|
Discount rate
|
16.5%
|
|||
|
Fair value weighting
|
50.0%
|
|||
|
Market approach
|
Fair value weighting
|
50.0%
|
||
The annual impairment evaluation of goodwill did not identify any impairment for 2012. During 2012, the Company exited its employee benefits line resulting in a reduction of financial services reporting unit goodwill of
$276,000
.
73
The changes in core deposit intangible and trust relationship intangible assets for the years ended December 31, 2013 and 2012 are shown in the table below:
|
Core Deposit Intangible
|
Trust Relationship Intangible
|
||||||||||||||||||||||
|
|
Total
|
Accumulated Amortization
|
Net
|
Total
|
Accumulated Amortization
|
Net
|
|||||||||||||||||
|
Balance at December 31, 2011
|
$
|
14,444
|
|
$
|
(11,432
|
)
|
$
|
3,012
|
|
$
|
753
|
|
$
|
(301
|
)
|
$
|
452
|
|
|||||
|
2012 activity
|
2,856
|
|
(582
|
)
|
2,274
|
|
—
|
|
(75
|
)
|
(75
|
)
|
|||||||||||
|
Balance at December 31, 2012
|
17,300
|
|
(12,014
|
)
|
5,286
|
|
753
|
|
(376
|
)
|
377
|
|
|||||||||||
|
2013 activity
|
—
|
|
(1,074
|
)
|
(1,074
|
)
|
—
|
|
(76
|
)
|
(76
|
)
|
|||||||||||
|
Balance at December 31, 2013
|
$
|
17,300
|
|
$
|
(13,088
|
)
|
$
|
4,212
|
|
$
|
753
|
|
$
|
(452
|
)
|
$
|
301
|
|
|||||
It is estimated that core deposit and trust relationship intangible assets will be fully amortized as of December 31, 2017. The following table reflects the expected amortization schedule for intangible assets at December 31, 2013.
|
Core Deposit Intangible
|
Trust Relationship Intangible
|
||||||
|
2014
|
$
|
1,073
|
|
$
|
75
|
|
|
|
2015
|
1,073
|
|
75
|
|
|||
|
2016
|
1,073
|
|
75
|
|
|||
|
2017
|
993
|
|
76
|
|
|||
|
Total unamortized intangible
|
$
|
4,212
|
|
$
|
301
|
|
|
6. Premises and Equipment
Details of premises and equipment, at cost, at December 31 were as follows:
|
2013
|
2012
|
||||||
|
Land and land improvements
|
$
|
3,019
|
|
$
|
3,310
|
|
|
|
Buildings and leasehold improvements
|
29,772
|
|
31,195
|
|
|||
|
Furniture, fixtures and equipment
|
19,792
|
|
19,572
|
|
|||
|
Total cost
|
52,583
|
|
54,077
|
|
|||
|
Accumulated depreciation and amortization
|
(26,856
|
)
|
(26,018
|
)
|
|||
|
Net premises and equipment
|
$
|
25,727
|
|
$
|
28,059
|
|
|
Depreciation and amortization expense on premises and equipment was
$2.7 million
,
$2.2 million
and
$2.3 million
for 2013, 2012 and 2011, respectively. At December 31, 2013 and 2012, the Company has capitalized software costs of $
3.2 million
and
$3.0 million
, respectively, and related accumulated depreciation expense of
$2.7 million
and
$2.4 million
, respectively. Capitalized software costs are presented within other assets on the consolidated statement of condition. Depreciation and amortization expense on capitalized software costs for 2013, 2012, and 2011 were
$296,000
,
$301,000
, and
$273,000
, respectively.
Lease expense was approximately
$1.3 million
,
$997,000
and
$918,000
for 2013, 2012 and 2011, respectively. The Company has a capital lease for a branch facility with payments that extend until
2026
at an interest rate of
9.75%
per year. The related asset, recorded in premises and equipment, has a cost basis of
$855,000
and accumulated depreciation of
$331,000
. At December 31, 2013, under current operating and capital lease contracts, the Company had the following schedule of future minimum lease payments:
74
|
Operating
|
Capital
|
||||||
|
2014
|
$
|
1,102
|
|
$
|
129
|
|
|
|
2015
|
908
|
|
129
|
|
|||
|
2016
|
763
|
|
127
|
|
|||
|
2017
|
682
|
|
126
|
|
|||
|
2018
|
489
|
|
126
|
|
|||
|
Thereafter
|
1,575
|
|
938
|
|
|||
|
|
$
|
5,519
|
|
$
|
1,575
|
|
|
During 2012, the Company recorded a gain of
$479,000
on the sale of a branch facility and is presented within other income on the consolidated statements of income. There were no recorded gains or losses from the sale of premises or equipment in 2013.
7. OREO
OREO properties acquired through foreclosure or deed-in-lieu of foreclosure are recorded at the fair value of the real estate, less estimated costs to sell. Any write-down of the recorded investment in the related loan is charged to the allowance for loan losses upon transfer to OREO. Subsequent write-downs required for declines in value are recorded through a valuation allowance and charged to other non-interest expense. During 2013, the Company consolidated
two
branches in Lewiston, Maine and transferred
one
of those branches to OREO at fair value, less estimated costs to sell, of $
305,000
. Also during 2013, the Company sold
one
of its branch facilities that was carried within OREO at fair value, less estimated costs to sell, of
$360,000
at December 31, 2012 and recorded a gain of $
27,000
. The Company recorded a net gain of
$40,000
on the sale of OREO properties in 2013, including the
$27,000
gain on sale of one of its branch facilities. In 2012 and 2011, the Company recorded a net loss on the sale of OREO properties of
$318,000
and
$119,000
, respectively. The gain or loss recorded on sale of OREO properties is presented within other real estate owned and collection costs on the consolidated statements of income.
The activity in OREO for the years presented below was as follows:
|
2013
|
2012
|
2011
|
|||||||||
|
Balance at beginning of year
|
$
|
1,313
|
|
$
|
1,682
|
|
$
|
2,387
|
|
||
|
Additions
|
1,958
|
|
2,180
|
|
1,989
|
|
|||||
|
Disposals
|
(906
|
)
|
(2,388
|
)
|
(2,506
|
)
|
|||||
|
Write-downs
|
(170
|
)
|
(161
|
)
|
(188
|
)
|
|||||
|
Balance at end of year
|
$
|
2,195
|
|
$
|
1,313
|
|
$
|
1,682
|
|
||
8. Mortgage Servicing
Residential real estate mortgages are originated by the Company both for its portfolio and for sale into the secondary market. The Company may sell its loans to institutional investors such as Freddie Mac. Under loan sale and servicing agreements with the investor, the Company generally continues to service the residential real estate mortgages. The Company pays the investor an agreed-upon rate on the loan, which is less than the interest rate received from the borrower. The Company retains the difference as a fee for servicing the residential real estate mortgages. The Company capitalizes MSRs at their fair value upon sale of the related loans, amortizes the asset over the estimated life of the serviced loan, and periodically assesses the asset for impairment. The balance of capitalized MSRs, net of a valuation allowance, included in other assets on the consolidated statements of condition at December 31, 2013, and 2012 was
$726,000
and
$542,000
, respectively. For the same periods, the fair value of MSRs was
$1.5 million
and
$879,000
, respectively. In evaluating the reasonableness of the carrying values of the MSRs, the Company obtains third party valuations based on loan level data including note rate, type and term of the underlying loans. The model utilizes a variety of assumptions, the most significant of which are loan prepayment assumptions and the discount rate used to discount future cash flows. Prepayment assumptions, which are impacted by loan rates and terms, are calculated using a three-month moving average of weekly prepayment data published by the Public Securities Association and modeled against the serviced loan portfolio by the third party valuation specialist. The discount rate is the quarterly average 10-year U.S. Treasury rate plus
4.91%
. Other assumptions include delinquency rates, foreclosure rates, servicing cost inflation, and annual unit loan cost. All assumptions are adjusted periodically to reflect current circumstances. Amortization of the mortgage servicing rights, as well as write-offs of capitalized rights due to prepayments of the related mortgage loans, are recorded as a charge against mortgage servicing fee income. Mortgage servicing fee income, net of
75
amortization and write-offs, for the years ended December 31, 2013, 2012, and 2011 was
$679,000
,
$320,000
, and
$437,000
, respectively. Mortgage servicing fee income is presented in mortgage banking income, net on the consolidated statements of income. Also included within mortgage banking income, net on the consolidated statements of income is the net gains or losses recognized upon the sale of originated mortgage loans to Freddie Mac. For the years ended December 31, 2013, 2012, and 2011, the Company recognized gains upon the sale of loans of
$728,000
,
$268,000
, and
$292,000
, respectively.
The following summarizes MSRs capitalized and amortized, along with the activity in the related valuation allowance:
|
2013
|
2012
|
2011
|
|||||||||
|
Mortgage Servicing Rights:
|
|
|
|
|
|
|
|||||
|
Balance at beginning of year
|
$
|
542
|
|
$
|
768
|
|
$
|
898
|
|
||
|
Capitalized upon sale
|
466
|
|
153
|
|
204
|
|
|||||
|
Amortization charged against mortgage servicing fee income
|
(340
|
)
|
(349
|
)
|
(310
|
)
|
|||||
|
Valuation adjustment
|
58
|
|
(30
|
)
|
(24
|
)
|
|||||
|
Balance at end of year
|
$
|
726
|
|
$
|
542
|
|
$
|
768
|
|
||
|
Valuation Allowance:
|
|
|
|
|
|
|
|||||
|
Balance at beginning of year
|
$
|
(73
|
)
|
$
|
(43
|
)
|
$
|
(19
|
)
|
||
|
Increase in impairment reserve
|
(34
|
)
|
(174
|
)
|
(33
|
)
|
|||||
|
Reduction of impairment reserve
|
92
|
|
144
|
|
9
|
|
|||||
|
Balance at end of year
|
$
|
(15
|
)
|
$
|
(73
|
)
|
$
|
(43
|
)
|
||
|
Fair value, beginning of year
(1)
|
879
|
|
1,138
|
|
973
|
|
|||||
|
Fair value, end of year
(1)
|
1,494
|
|
879
|
|
1,138
|
|
|||||
(1) Reported fair value represents all MSRs currently being serviced by the Company, regardless of carrying amount.
Mortgage loans serviced for Freddie Mac are not included in the accompanying consolidated statements of condition. Mortgage loans serviced for Freddie Mac totaled
$157.9 million
,
$156.1 million
and
$178.0 million
at December 31, 2013, 2012 and 2011, respectively. Custodial escrow balances maintained in connection with the foregoing loan servicing for Freddie Mac, and included in demand deposits, were
$518,000
and
$449,000
at December 31, 2013 and 2012, respectively.
While not capitalized as MSRs, the Company serves as the primary servicer of loans originated by MaineHousing. The Company has entered into a contract with MaineHousing to perform loan servicing on the MaineHousing portfolio for a fee. For the years ended December 31, 2013, 2012, and 2011, the Company earned fees of $
1.1 million
,
$1.2 million
, and
$1.1 million
, respectively, for the servicing of MaineHousing loans included in other income on the consolidated statements of income. The MaineHousing loans serviced by the Company, which are not included in the accompanying consolidated statements of condition, totaled
$614.4 million
,
$650.6 million
, and $
709.6 million
at December 31, 2013, 2012 and 2011, respectively. Custodial escrow balances maintained in connection with the foregoing loan servicing for MaineHousing and included in demand deposits were
$5.3 million
and
$5.4 million
at December 31, 2013 and 2012, respectively.
76
9. Deposits
The following is a summary of scheduled maturities of certificates of deposit as of December 31, 2013:
|
Retail
|
Brokered
|
Total
|
|||||||||
|
2014
|
$
|
203,236
|
|
$
|
2,576
|
|
$
|
205,812
|
|
||
|
2015
|
84,525
|
|
17,033
|
|
101,558
|
|
|||||
|
2016
|
23,835
|
|
28,622
|
|
52,457
|
|
|||||
|
2017
|
11,428
|
|
6,545
|
|
17,973
|
|
|||||
|
2018
|
7,288
|
|
—
|
|
7,288
|
|
|||||
|
Thereafter
|
12,722
|
|
—
|
|
12,722
|
|
|||||
|
Total certificates of deposit
|
$
|
343,034
|
|
$
|
54,776
|
|
$
|
397,810
|
|
||
Certificates of deposit issued in amounts of $100,000 or more totaled
$163.9 million
and
$190.0 million
at December 31, 2013 and 2012, respectively, including brokered certificates of deposit of
$39.2 million
for both December 31, 2013 and 2012.
At December 31, 2013 and 2012, the Company, in the normal course of business, had deposits from certain officers, directors, and their associated companies totaling
$48.6 million
and
$58.8 million
, respectively.
10. Borrowings
Other Borrowed Funds
Short-term borrowings consist of retail repurchase agreements, FHLBB advances due in less than 90 days, FHLBB and correspondent bank overnight borrowings, and other short-term borrowings due within one year. The Company, through its bank subsidiary, had an available line of credit with the FHLBB of
$9.9 million
at December 31, 2013 and 2012. The Company had
no
outstanding balance on the line of credit with the FHLBB at December 31, 2013 or 2012. Long-term borrowings represent securities sold under repurchase agreements with major brokerage firms and notes payable with maturity dates over one year. Both wholesale and retail repurchase agreements are secured by mortgage-backed securities and securities of government sponsored enterprises. The Company has a
$10.0 million
line of credit with a maturity date of
December 20, 2014
.
The following table summarizes other borrowed funds outstanding at December 31:
|
2013
|
2012
|
||||||
|
Short-Term Borrowings:
|
|
|
|
|
|||
|
Securities sold under repurchase agreements – retail
|
$
|
130,047
|
|
$
|
151,035
|
|
|
|
FHLBB advances less than 90 days
|
230,000
|
|
—
|
|
|||
|
FHLBB and correspondent bank overnight borrowings
|
38,800
|
|
41,500
|
|
|||
|
Capital lease obligation
|
60
|
|
57
|
|
|||
|
Notes payable
|
25
|
|
89
|
|
|||
|
Total short-term borrowings
|
398,932
|
|
192,681
|
|
|||
|
Long-Term Borrowings:
|
|
|
|
|
|||
|
Securities sold under repurchase agreements – commercial
|
30,142
|
|
66,187
|
|
|||
|
Capital lease obligation
|
984
|
|
1,044
|
|
|||
|
Notes payable
|
—
|
|
28
|
|
|||
|
Total long-term borrowings
|
31,126
|
|
67,259
|
|
|||
|
Total other borrowed funds
|
$
|
430,058
|
|
$
|
259,940
|
|
|
77
Information on the amounts outstanding and interest rates of short-term borrowings for each of the three years in the period ended December 31 are as follows:
|
2013
|
2012
|
2011
|
|||||||||
|
Balance outstanding at end of year
|
$
|
398,932
|
|
$
|
192,681
|
|
$
|
247,928
|
|
||
|
Average daily balance outstanding
|
271,281
|
|
261,335
|
|
220,847
|
|
|||||
|
Maximum balance outstanding at any month end
|
398,932
|
|
346,786
|
|
332,321
|
|
|||||
|
Weighted average interest rate for the year
|
0.19
|
%
|
0.21
|
%
|
0.34
|
%
|
|||||
|
Weighted average interest rate at end of year
|
0.16
|
%
|
0.18
|
%
|
0.19
|
%
|
|||||
The securities sold under repurchase agreements – commercial are fixed rate borrowings, which are callable quarterly, with the following schedule of maturities, rate and year in which the instrument becomes callable, as of December 31, 2013:
|
Amount
|
Rate
|
Callable
|
||||||
|
2016
|
$
|
25,000
|
|
2.61
|
%
|
2014
|
||
|
2017
|
5,142
|
|
4.67
|
%
|
2014
|
|||
|
Total
|
$
|
30,142
|
|
2.96
|
%
|
|||
FHLB Advances
FHLB advances are collateralized by a blanket lien on qualified collateral consisting primarily of loans with first mortgages secured by one- to four-family properties, certain commercial real estate loans, certain pledged investment securities and other qualified assets. The carrying value of residential real estate and commercial loans pledged as collateral was
$742.8 million
and
$671.5 million
at December 31, 2013 and 2012, respectively. The carrying value of securities pledged as collateral at the FHLB was
$3.7 million
and
$7.0 million
at December 31, 2013 and 2012, respectively.
The advances payable to the FHLB are summarized as follows:
|
December 31, 2013
|
December 31, 2012
|
||||||||||||||
|
|
Total Outstanding
|
Callable
|
Total Outstanding
|
Callable
|
|||||||||||
|
Fixed Rate:
|
|
|
|
|
|
|
|
|
|||||||
|
0.28% – 6.15% due in 2013
|
$
|
—
|
|
$
|
—
|
|
$
|
222
|
|
$
|
—
|
|
|||
|
2.75% – 4.75% due in 2015
|
11,112
|
|
10,000
|
|
11,182
|
|
10,000
|
|
|||||||
|
1.80% – 1.95% due in 2016
|
25,000
|
|
—
|
|
25,000
|
|
—
|
|
|||||||
|
3.99% – 4.06% due in 2017
|
20,000
|
|
20,000
|
|
20,000
|
|
20,000
|
|
|||||||
|
Total FHLB advances
|
$
|
56,112
|
|
$
|
30,000
|
|
$
|
56,404
|
|
$
|
30,000
|
|
|||
Junior Subordinated Debentures
In April 2006, the Company formed CCTA, which issued and sold trust preferred securities to the public. The Company received
$36.1 million
from the issuance of the trust preferred securities in return for junior subordinated debentures issued by the Company to CCTA. The Company owns all of the
$1.1 million
of outstanding common securities of CCTA. The interest rate of the trust preferred securities was fixed at
6.71%
through June 2011 and now floats at the 3 month LIBOR plus 140 basis points. The proceeds from the offering were used to repurchase Company common stock under the tender offer completed in May 2006. The trust preferred securities, which pay interest quarterly at the same rate as the junior subordinated debentures held by CCTA, are mandatorily redeemable on June 30, 2036, or may be redeemed by CCTA at par any time on or after June 30, 2011.
In connection with the acquisition of Union Bankshares Company in 2008, the Company assumed
$8.0 million
of trust preferred securities, held through a Delaware trust affiliate, UBCT. In 2006, Union Bankshares Company issued an aggregate principal amount of
$8.2 million
of 30-year junior subordinated deferrable interest debt securities to UBCT. The Company owns all of the
$248,000
of outstanding common securities of UBCT. The debt securities obligate the Company to pay interest
78
on their principal sum quarterly in arrears on January 7, April 7, July 7, and October 7 of each year.
The interest rate of the trust preferred securities until April 7, 2011 was a blended rate equal to the sum of (1) the product of 50% times the average three-month LIBOR plus 1.42%, plus (2) the product of 50% times 6.4725%. The rate is now the average three-month LIBOR plus 1.42%.
The debt securities mature on April 7, 2036, but may be redeemed by the Company, in whole or in part, beginning on April 7, 2011, on any interest payment date. The debt securities may also be redeemed by the Company in whole or in part, within 90 days of the occurrence of certain special redemption events as defined in the Indenture.
CCTA and UBCT are Delaware statutory trusts created for the sole purpose of issuing trust preferred securities and investing the proceeds in junior subordinated debentures of the Company. The junior subordinated debentures are the sole assets of the trusts. The Company is the owner of all of the common securities of CCTA and UBCT and fully and unconditionally guarantees each trust’s securities obligations. In accordance with GAAP, CCTA and UBCT are treated as unconsolidated subsidiaries. The common stock investment in the statutory trusts is included in other assets on the consolidated statements of condition. Interest expense on the junior subordinated debentures totaled
$2.5 million
during 2013,
$2.5 million
during 2012 and
$2.6 million
during 2011. At December 31, 2013,
$43.0 million
of the trust preferred securities were included in the Company’s total Tier I capital and amounted to
18.1%
of Tier I capital of the Company.
The Company has a notional amount of
$43.0 million
in interest rate swap agreements on its junior subordinated debentures. Further discussion on the terms and accounting for the interest rate swap agreements is included within Note 17 to the consolidated financial statements.
11. Income Taxes
The current and deferred components of income tax expense on the consolidated statements of income were as follows:
|
2013
|
2012
|
2011
|
|||||||||
|
Current:
|
|
|
|
|
|
|
|||||
|
Federal
|
$
|
11,853
|
|
$
|
5,107
|
|
$
|
11,301
|
|
||
|
State
|
400
|
|
457
|
|
463
|
|
|||||
|
|
12,253
|
|
5,564
|
|
11,764
|
|
|||||
|
Deferred:
|
|
|
|
|
|
|
|||||
|
Federal
|
(121
|
)
|
5,318
|
|
17
|
|
|||||
|
Income tax expense
|
$
|
12,132
|
|
$
|
10,882
|
|
$
|
11,781
|
|
||
The income tax expense differs from the amount computed by applying the statutory federal income tax rate as a result of the following:
|
2013
|
2012
|
2011
|
|||||||||
|
Computed tax expense
|
$
|
12,220
|
|
$
|
12,008
|
|
$
|
13,285
|
|
||
|
Increase (reduction) in income taxes resulting from:
|
|
|
|
|
|
|
|||||
|
Tax exempt income
|
(510
|
)
|
(623
|
)
|
(753
|
)
|
|||||
|
State taxes, net of federal benefit
|
260
|
|
297
|
|
301
|
|
|||||
|
Goodwill impairment
|
991
|
|
—
|
|
18
|
|
|||||
|
Income from life insurance
|
(459
|
)
|
(484
|
)
|
(760
|
)
|
|||||
|
Low income housing credits
|
(299
|
)
|
(328
|
)
|
(393
|
)
|
|||||
|
Other
|
(71
|
)
|
12
|
|
83
|
|
|||||
|
Income tax expense
|
$
|
12,132
|
|
$
|
10,882
|
|
$
|
11,781
|
|
||
79
Temporary differences between the financial statements carrying amounts and the tax bases of assets and liabilities gave rise to the following deferred tax assets and liabilities:
|
2013
|
2012
|
||||||||||||||
|
|
Asset
|
Liability
|
Asset
|
Liability
|
|||||||||||
|
Allowance for possible losses on loans
|
$
|
7,564
|
|
$
|
—
|
|
$
|
8,081
|
|
$
|
—
|
|
|||
|
Net unrealized losses and gains on available-for-sale securities
|
4,288
|
|
—
|
|
—
|
|
6,969
|
|
|||||||
|
Pension and other benefits
|
3,900
|
|
—
|
|
3,715
|
|
—
|
|
|||||||
|
Net unrealized losses on derivative instruments
|
1,369
|
|
—
|
|
3,879
|
|
—
|
|
|||||||
|
Net unrealized losses on postretirement plans
|
992
|
|
—
|
|
1,476
|
|
—
|
|
|||||||
|
Deferred compensation and benefits
|
963
|
|
—
|
|
904
|
|
—
|
|
|||||||
|
Purchase accounting and deposit premium
|
321
|
|
—
|
|
—
|
|
147
|
|
|||||||
|
Allowance for OTTI of investments
|
71
|
|
—
|
|
71
|
|
—
|
|
|||||||
|
Allowance for OREO valuation
|
59
|
|
—
|
|
149
|
|
—
|
|
|||||||
|
Depreciation
|
—
|
|
1,765
|
|
—
|
|
2,073
|
|
|||||||
|
Deferred loan origination fees
|
—
|
|
1,390
|
|
—
|
|
1,256
|
|
|||||||
|
Prepaid expenses
|
—
|
|
766
|
|
—
|
|
683
|
|
|||||||
|
Mortgage servicing rights
|
—
|
|
254
|
|
—
|
|
190
|
|
|||||||
|
Other
|
695
|
|
—
|
|
706
|
|
—
|
|
|||||||
|
|
$
|
20,222
|
|
$
|
4,175
|
|
$
|
18,981
|
|
$
|
11,318
|
|
|||
The related income taxes have been calculated using a rate of
35%
. No valuation allowance is deemed necessary for the deferred tax assets.
Although not currently under review, income tax returns for the years ended December 31, 2010 through 2012 are open to audit by federal and Maine authorities. If the Company, as a result of an audit, were assessed interest and penalties, the amounts would be recorded through other non-interest expense on the consolidated statements of income.
12. Shareholders’ Equity
Dividends
The primary source of funds available to the Company for the payment of dividends to its shareholders is dividends paid to the Company by its subsidiaries. The Company’s subsidiaries are subject to certain requirements imposed by federal banking laws and regulations. These requirements, among other things, establish minimum levels of capital and restrict the amount of dividends that may be distributed by the subsidiaries to the Company. Under regulations prescribed by the OCC, without prior OCC approval, a bank subsidiary may not declare dividends in any year in excess of the bank’s (i) net income for the current year, (ii) plus its retained net income for the prior two years. The Company declared
$8.3 million
,
$7.7 million
and
$11.5 million
in dividends to shareholders for the years ended December 31, 2013, 2012 and 2011, respectively.
Common Stock Repurchase
On September 24, 2013, the board of directors authorized the 2013 Repurchase Plan. The 2013 Repurchase Plan allows for the repurchase of up to
250,000
shares of the Company’s outstanding common stock. This program is expected to continue until the authorized number of shares is repurchased, or the Company’s board terminates the program. As of December 31, 2013, the Company repurchased
68,145
shares at a weighted-average price of $
40.78
, or
27%
of the program’s total allotment and
1%
of total outstanding shares.
On September 25, 2012, the board of directors authorized the 2012 Repurchase Plan. The 2012 Repurchase Plan authorized management to repurchase up to
500,000
shares of the Company's outstanding common stock over a one-year term which expired on
October 1, 2013
. The Company did not repurchase any shares under the 2012 Repurchase Plan.
80
13. EPS
The following is an analysis of basic and diluted EPS, reflecting the application of the two-class method, as described below:
|
2013
|
2012
|
2011
|
|||||||||
|
Net income
|
$
|
22,783
|
|
$
|
23,428
|
|
$
|
26,177
|
|
||
|
Dividends and undistributed earnings allocated to participating securities
(1)
|
(64
|
)
|
(60
|
)
|
(42
|
)
|
|||||
|
Net income available to common shareholders
|
$
|
22,719
|
|
$
|
23,368
|
|
$
|
26,135
|
|
||
|
Weighted-average common shares outstanding for basic EPS
|
7,634,455
|
|
7,646,861
|
|
7,672,126
|
|
|||||
|
Dilutive effect of stock-based awards
( 2)
|
18,815
|
|
14,412
|
|
7,769
|
|
|||||
|
Weighted-average common and potential common shares for diluted EPS
|
7,653,270
|
|
7,661,273
|
|
7,679,895
|
|
|||||
|
Earnings per common share:
|
|
|
|
|
|
|
|||||
|
Basic EPS
|
$
|
2.98
|
|
$
|
3.06
|
|
$
|
3.41
|
|
||
|
Diluted EPS
|
2.97
|
|
3.05
|
|
3.40
|
|
|||||
(1)
Represents dividends paid and undistributed earnings allocated to nonvested stock-based awards that contain non-forfeitable rights to dividends.
(2) Represents the effect of the assumed exercise of stock options, vesting of restricted shares, vesting of restricted stock units, and vesting of LTIP awards that have met the performance criteria, utilizing the treasury stock method.
Nonvested stock-based payment awards that contain non-forfeitable rights to dividends are participating securities and are included in the computation of EPS pursuant to the two-class method. The two-class method is an earnings allocation formula that determines EPS for each class of common stock and participating security according to dividends declared (or accumulated) and participation rights in undistributed earnings. Certain of the Company’s nonvested stock-based awards qualify as participating securities.
Net income is allocated between the common stock and participating securities pursuant to the two-class method. Basic EPS is computed by dividing net income available to common shareholders by the weighted average number of common shares outstanding during the period, excluding participating nonvested stock-based awards.
Diluted EPS is computed in a similar manner, except that first the denominator is increased to include the number of additional common shares that would have been outstanding if potentially dilutive common shares were issued using the treasury stock method.
At December 31, 2013, 2012, and 2011, options to purchase
15,250
,
49,500
, and
102,000
shares, respectively, of common stock were not considered in the computation of potential common shares for purposes of diluted EPS, since the exercise prices of the options were greater than the average market price of the common stock for the respective periods.
14. Employee Benefit Plans
401(k)/Profit Sharing Plan
The Company has a 401(k)/profit sharing plan and the majority of employees participate in the plan. Employees may contribute pre-tax contributions to the 401(k)/profit sharing plan up to the maximum amount allowed by federal tax laws. The Company makes matching contributions of up to
4%
of an employee’s eligible compensation. The Company may make additional matching contributions subject to the discretion of the board of directors. For the years ended December 31, 2013, 2012, and 2011, these contributions amounted to
3%
of pre-tax compensation each year. For the years ended December 31, 2013, 2012 and 2011, expenses under the 401(k)/Profit Sharing plan amounted to
$1.4 million
,
$1.2 million
, and
$1.1 million
, respectively.
81
SERP and Other Postretirement Benefit Plan
The Company sponsors unfunded, non-qualified SERPs for certain officers. These agreements are designed to make up the shortfall (when compared to a non-highly compensated employee) in replacing income at retirement due to IRS compensation and benefit limits under the 401(k) plan and Social Security. With a SERP in place, participants should be able to replace
65
–
75%
of their final average compensation. For those eligible for benefits, the SERP provides for a minimum
15
-year guaranteed benefit for all vested participants. In addition, the Company provides medical and life insurance to certain eligible retired employees under the other postretirement benefit plan.
The following table summarizes changes in the benefit obligation and plan assets for (i) the supplemental executive retirement plan and (ii) the other postretirement benefit plan as of December 31, 2013 and 2012:
|
SERP
|
Other Postretirement
Benefits
|
||||||||||||||
|
|
2013
|
2012
|
2013
|
2012
|
|||||||||||
|
Benefit obligations:
|
|
|
|
|
|
|
|||||||||
|
Beginning of year
|
$
|
10,346
|
|
$
|
8,868
|
|
$
|
3,536
|
|
$
|
3,187
|
|
|||
|
Service cost
|
326
|
|
269
|
|
42
|
|
70
|
|
|||||||
|
Interest cost
|
377
|
|
408
|
|
173
|
|
148
|
|
|||||||
|
Actuarial (gain) loss
|
(579
|
)
|
1,334
|
|
(538
|
)
|
275
|
|
|||||||
|
Benefits paid
|
(543
|
)
|
(533
|
)
|
(119
|
)
|
(144
|
)
|
|||||||
|
End of year
|
9,927
|
|
10,346
|
|
3,094
|
|
3,536
|
|
|||||||
|
Fair value of plan assets:
|
|
|
|
|
|||||||||||
|
Beginning of year
|
—
|
|
—
|
|
—
|
|
—
|
|
|||||||
|
Employer contributions
|
543
|
|
533
|
|
119
|
|
144
|
|
|||||||
|
Benefits paid
|
(543
|
)
|
(533
|
)
|
(119
|
)
|
(144
|
)
|
|||||||
|
End of year
|
—
|
|
—
|
|
—
|
|
—
|
|
|||||||
|
Funded status at end of year, included in other liabilities
|
$
|
9,927
|
|
$
|
10,346
|
|
$
|
3,094
|
|
$
|
3,536
|
|
|||
|
Amounts recognized in AOCI, net of tax:
|
|
|
|
|
|||||||||||
|
Net actuarial loss
|
$
|
1,539
|
|
$
|
2,061
|
|
$
|
458
|
|
$
|
639
|
|
|||
|
Prior service cost (credit)
|
29
|
|
41
|
|
(185
|
)
|
—
|
|
|||||||
|
Total
|
$
|
1,568
|
|
$
|
2,102
|
|
$
|
273
|
|
$
|
639
|
|
|||
The accumulated benefit obligation for the SERP was
$8.0 million
and
$7.9 million
at December 31, 2013 and 2012, respectively. In 2014, approximately
$140,000
and
$19,000
in net actuarial losses and prior service cost, respectively, are expected to be recognized as components of net period benefit cost for the SERP, and approximately
$10,000
and
$22,000
in net actuarial loss and prior service credit, respectively, are expected to be recognized for the other postretirement benefit plan.
82
The components of net period benefit cost and other amounts recognized in OCI, before taxes, were as follows:
|
SERP
|
Other Postretirement
Benefits
|
||||||||||||||||||||||
|
|
2013
|
2012
|
2011
|
2013
|
2012
|
2011
|
|||||||||||||||||
|
Net period benefit cost:
|
|
|
|
|
|
|
|
|
|
|
|
|
|||||||||||
|
Service cost
|
$
|
326
|
|
$
|
269
|
|
$
|
232
|
|
$
|
42
|
|
$
|
70
|
|
$
|
65
|
|
|||||
|
Interest cost
|
377
|
|
408
|
|
431
|
|
173
|
|
148
|
|
150
|
|
|||||||||||
|
Recognized net actuarial loss
|
224
|
|
114
|
|
67
|
|
48
|
|
31
|
|
5
|
|
|||||||||||
|
Amortization of prior service cost (credit)
|
19
|
|
19
|
|
19
|
|
(23
|
)
|
—
|
|
—
|
|
|||||||||||
|
Net period benefit cost
|
946
|
|
810
|
|
749
|
|
240
|
|
249
|
|
220
|
|
|||||||||||
|
Changes in funded status recognized in OCI, before taxes:
|
|
|
|
|
|
|
|
|
|
|
|||||||||||||
|
Net actuarial (gain) loss
|
(579
|
)
|
1,334
|
|
615
|
|
(538
|
)
|
275
|
|
417
|
|
|||||||||||
|
Reclassifications to net period benefit cost:
|
|
|
|
|
|
|
|
|
|||||||||||||||
|
Amortization of net unrecognized actuarial loss
|
(224
|
)
|
(114
|
)
|
(67
|
)
|
(48
|
)
|
(31
|
)
|
(5
|
)
|
|||||||||||
|
Amortization of prior service (cost) credit
|
(19
|
)
|
(19
|
)
|
(19
|
)
|
23
|
|
—
|
|
—
|
|
|||||||||||
|
Total recognized in OCI, before taxes
|
(822
|
)
|
1,201
|
|
529
|
|
(563
|
)
|
244
|
|
412
|
|
|||||||||||
|
Total recognized in net period benefit cost and OCI, before taxes
|
$
|
124
|
|
$
|
2,011
|
|
$
|
1,278
|
|
$
|
(323
|
)
|
$
|
493
|
|
$
|
632
|
|
|||||
The following assumptions were used in determining benefit obligations and net period benefit costs:
|
SERP
|
Other Postretirement
Benefits
|
||||||||||||||||
|
|
2013
|
2012
|
2011
|
2013
|
2012
|
2011
|
|||||||||||
|
Weighted-average assumptions as of end of year:
|
|
|
|
|
|
|
|
|
|
|
|
|
|||||
|
Discount rate for benefit obligation
|
4.75
|
%
|
3.75
|
%
|
4.75
|
%
|
5.02
|
%
|
4.05
|
%
|
4.75
|
%
|
|||||
|
Discount rate for net period benefit cost
|
3.75
|
%
|
4.75
|
%
|
5.50
|
%
|
4.05
|
%
|
4.75
|
%
|
5.45
|
%
|
|||||
|
Rate of compensation increase
|
4.50
|
%
|
4.50
|
%
|
4.50
|
%
|
—
|
|
—
|
|
—
|
|
|||||
|
Health care cost trend rate assumed for future years
|
—
|
|
—
|
|
—
|
|
7.00
|
%
|
7.00
|
%
|
7.00
|
%
|
|||||
A 1.0% increase in the assumed health care cost trend rate would increase the accumulated postretirement benefit obligation and the related service and interest cost
$378,000
and
$28,000
, respectively, while a 1.0% decrease in the assumed health care cost trend rate would decrease the accumulated postretirement benefit obligation and the related service and interest cost
$345,000
and
$26,000
, respectively. The postretirement plan has a built-in cap on annual benefits to participants and, thus, the accumulated postretirement benefit obligation and the assumed health care cost trend are relatively stable each period.
83
In 2014, the expected contribution is
$594,000
for the SERP and
$145,000
for the other postretirement benefit plan. The expected benefit payments for the next ten years are presented in the following table:
|
SERP
|
Other Postretirement Benefits
|
||||||
|
2014
|
$
|
594
|
|
$
|
145
|
|
|
|
2015
|
480
|
|
140
|
|
|||
|
2016
|
487
|
|
137
|
|
|||
|
2017
|
471
|
|
134
|
|
|||
|
2018
|
471
|
|
130
|
|
|||
|
2019-2023
|
3,021
|
|
775
|
|
|||
In December 2003, the Act was signed into law. The Act introduces a prescription drug benefit under Medicare as well as a federal subsidy to sponsors of retiree health care plans that provide a benefit that is at least actuarially equivalent to Medicare Part D. The effects of the Act on the accumulated projected benefit obligation or net period post-retirement benefit cost are not reflected in the financial statements or accompanying notes because the Company has not concluded whether the benefits provided by the plan are actuarially equivalent to Medicare Part D under the Act.
15. Stock-Based Compensation Plans
Stock-Based Compensation
On April 29, 2003 and May 1, 2012, the shareholders of the Company approved the 2003 Plan and 2012 Plan, respectively. The maximum number of shares of stock reserved and available for issuance under each the 2003 Plan and 2012 Plan is
800,000
shares. Awards may be granted in the form of incentive stock options, non-qualified stock options, stock appreciation rights, restricted stock, deferred stock, unrestricted stock, performance shares and dividend equivalent rights, or any combination of the preceding, and the exercise price shall not be less than
100%
of the fair market value on the date of grant in the case of incentive stock options, or
85%
of the fair market value on the date of grant in the case of non-qualified stock options. No stock options are exercisable more than ten years after the date the stock option is granted. The exercise price of all options equaled the market price of the Company's stock on the date of grant.
Stock Option Awards
Stock options granted under the 2003 Plan and the 2012 Plan have been incentive stock options. Options granted vest pro rata over a
5
year period and have a contractual life of
10
years.
On the date of each grant, the fair value of each award is derived using the Black-Scholes option pricing model based on assumptions made by the Company as follows:
|
•
|
Dividend yield is based on the dividend rate of the Company’s stock at the date of grant.
|
|
•
|
Risk-free interest rate is based on the U.S. Treasury bond rate with a term equaling the expected life of the granted options.
|
|
•
|
Expected volatility is based on the historical volatility of the Company’s stock price.
|
|
•
|
Expected life represents the period of time that granted options are expected to be outstanding based on historical trends.
|
The following table presents the option pricing assumptions and the estimated fair value of the options using these assumptions:
84
|
2013
|
2012
|
2011
|
|||||||||
|
Dividend yield
|
1.00
|
%
|
2.20
|
%
|
3.04
|
%
|
|||||
|
Weighted average risk-free interest rate
|
1.60
|
%
|
0.79
|
%
|
1.95
|
%
|
|||||
|
Weighted average expected volatility
|
52.32
|
%
|
53.31
|
%
|
51.90
|
%
|
|||||
|
Weighted average expected life in years
|
5.30
|
|
5.30
|
|
5.12
|
|
|||||
|
Weighted average fair value of options granted
|
$
|
15.97
|
|
$
|
13.00
|
|
$
|
12.30
|
|
||
Compensation expense is recognized on a straight-line basis over the option vesting period and totaled
$134,000
,
$99,000
and
$204,000
for the years ended December 31, 2013, 2012 and 2011, respectively. Unrecognized compensation cost for nonvested stock options, which reflects an estimated annualized average forfeiture rate of approximately
3%
per year over the vesting period, totaled
$190,000
at December 31, 2013, and is expected to be recognized over the remaining weighted-average vesting period of
2.4
years. The total intrinsic value of options exercised during the years ended December 31, 2013, 2012, and 2011 was
$153,000
,
$146,000
, and
$16,000
, respectively.
Stock option activity for 2013 is as follows:
|
Number of Shares
|
Weighted- Average Exercise Price
|
Weighted- Average Remaining Contractual Term
|
Aggregate Intrinsic Value
|
|||||||||
|
Options outstanding at January 1, 2013
|
139,400
|
|
$
|
32.97
|
|
|
||||||
|
Granted
|
1,000
|
|
41.11
|
|
|
|
|
|||||
|
Exercised
|
(22,100
|
)
|
31.24
|
|
|
|
|
|||||
|
Forfeited and expired
|
(6,350
|
)
|
33.23
|
|
||||||||
|
Options outstanding at December 31, 2013
|
111,950
|
|
$
|
33.36
|
|
4.9
|
$
|
987
|
|
|||
|
Options exercisable at December 31, 2013
|
77,000
|
|
$
|
34.06
|
|
4.0
|
$
|
637
|
|
|||
A summary of the status of the Company’s nonvested stock options as of December 31, 2013 and changes during the year then ended is presented below:
|
Awards
|
Weighted- Average
Grant Date Fair Value
|
|||||
|
Nonvested at January 1, 2013
|
59,500
|
|
$
|
9.67
|
|
|
|
Granted
|
1,000
|
|
15.97
|
|
||
|
Vested
|
(20,400
|
)
|
9.64
|
|
||
|
Forfeited
|
(5,150
|
)
|
11.41
|
|
||
|
Nonvested at December 31, 2013
|
34,950
|
|
$
|
11.23
|
|
|
Restricted Stock Awards and Management Stock Purchase Plan
The Company issues restricted stock awards to certain key employees. Employees' shares vest pro-rata over three years, with requisite service conditions and no performance-based conditions to such vesting. The Company provides a MSPP to provide an opportunity for management employees to receive restricted shares of the Company’s common stock in lieu of their annual incentive bonus. Restricted shares under the MSPP are granted at a discount of one-third of the fair market value of the stock on the date of grant and cliff vests
two
years after the grant date. During the vesting period, dividends are accrued on the restricted stock and the recipients are entitled to vote these restricted shares.
85
Compensation expense recognized in connection with the restricted stock awards and MSPP is presented in the following table:
|
Year Ended December 31,
|
|||||||||||
|
|
2013
|
2012
|
2011
|
||||||||
|
Restricted stock awards
|
$
|
149
|
|
$
|
163
|
|
$
|
92
|
|
||
|
Management stock purchase plan grants
|
73
|
|
65
|
|
37
|
|
|||||
|
Total compensation expense
|
$
|
222
|
|
$
|
228
|
|
$
|
129
|
|
||
|
Related income tax benefit
|
$
|
78
|
|
$
|
80
|
|
$
|
45
|
|
||
|
Fair value of grants vested
|
$
|
229
|
|
$
|
121
|
|
$
|
106
|
|
||
The following table presents a summary of the activity related to restricted stock awards and the MSPP for the period indicated:
|
Restricted Stock
|
MSPP
|
||||||||||||
|
|
Number of Shares
|
Weighted Average Grant Date Fair Value
|
Number of Shares
|
Weighted Average
Grant Date Fair Value
|
|||||||||
|
Nonvested at January 1, 2013
|
10,017
|
|
$
|
34.84
|
|
12,052
|
|
$
|
10.69
|
|
|||
|
Granted
|
6,325
|
|
33.72
|
|
7,801
|
|
11.75
|
|
|||||
|
Vested
|
(4,965
|
)
|
34.12
|
|
(5,395
|
)
|
11.03
|
|
|||||
|
Forfeited
|
(897
|
)
|
34.51
|
|
(238
|
)
|
11.32
|
|
|||||
|
Nonvested at December 31, 2013
|
10,480
|
|
$
|
34.53
|
|
14,220
|
|
$
|
11.14
|
|
|||
At December 31, 2013, unrecognized compensation cost related to nonvested restricted stock awards and MSPP was
$251,000
which is expected to be recognized over a weighted average period of
1.6
years.
Long-Term Performance Share Plan
The LTIP is intended to attract and retain executives who will contribute to the Company’s future success. The long-term performance period is a period of three consecutive years beginning on January 1 of the first year and ending on December 31 of the third year. Awards are based upon the attainment of certain performance targets on specific performance measures selected by the Compensation Committee and approved by the board of directors. The performance-based share units granted will vest only if certain revenue and expense goals or service conditions, as defined under the LTIP, are achieved. Failure to achieve the goals and service conditions will result in all or a portion of the shares being forfeited.
Compensation expense recognized in connection with the LTIP is presented in the following table:
|
Year Ended December 31,
|
|||||||||||
|
|
2013
|
2012
|
2011
|
||||||||
|
Compensation expense
|
$
|
200
|
|
$
|
174
|
|
$
|
672
|
|
||
|
Related income tax benefit
|
$
|
70
|
|
$
|
61
|
|
$
|
235
|
|
||
|
Fair value of grants vested
|
$
|
497
|
|
$
|
609
|
|
$
|
570
|
|
||
86
The following table presents a summary of the activity related to LTIP for the period indicated:
|
|
Number of Shares
|
Weighted Average Grant Date
Fair Value
|
||||
|
Nonvested at January 1, 2013
|
61,623
|
|
$
|
35.25
|
|
|
|
Granted
|
22,165
|
|
36.81
|
|
||
|
Vested
|
(13,978
|
)
|
35.65
|
|
||
|
Forfeited
|
(25,018
|
)
|
35.47
|
|
||
|
Nonvested at December 31, 2013
|
44,792
|
|
$
|
35.78
|
|
|
Based on current performance levels, unrecognized stock compensation expense for the performance share awards was
$338,000
with a weighted-average remaining amortization period of
0.9
years at December 31, 2013.
Defined Contribution Retirement Plan
The DCRP is an unfunded deferred compensation plan for the benefit of certain senior management employees of the Company. The Company’s Compensation Committee determines eligibility in the DCRP and annually, participants will receive a credit to an account administered by the Company of
10%
of each participant’s annual base salary and bonus for the prior performance period. Annual credits to a participant’s account will be denominated in Deferred Stock Awards (the right to receive a share of common stock of the Company upon the satisfaction of certain restrictions) based on the fair market value of the common stock of the Company on the date of grant. Vesting occurs ratably from the date of participation until the participant reaches the age of 65, at which time the participant is
100%
vested. Upon retirement or termination of employment, the participant will receive shares of common stock equal to the Deferred Stock Awards in the account multiplied by the vested percentage, reduced by the amount to be withheld for income taxes. The Company granted
2,304
,
2,322
, and
2,135
of Deferred Stock Awards during 2013, 2012 and 2011, respectively under the DCRP. Compensation expense totaled
$40,000
, $
$37,000
, and
$20,000
for the years ended December 31, 2013, 2012, and 2011, respectively. Unrecognized stock compensation expense for the Deferred Stock Awards was
$216,000
with a weighted-average remaining amortization period of
12.9
years at December 31, 2013.
16. Other Non-Interest Expenses
Detail of other expenses included in the consolidated statements of income is as follows:
|
Year Ended December 31,
|
|||||||||||
|
|
2013
|
2012
|
2011
|
||||||||
|
Debit and ATM-related costs
|
$
|
2,118
|
|
$
|
1,792
|
|
$
|
1,714
|
|
||
|
Donations and marketing
|
1,561
|
|
1,949
|
|
1,347
|
|
|||||
|
Postage, freight, and courier
|
1,284
|
|
1,012
|
|
971
|
|
|||||
|
Employee-related costs
(1)
|
1,217
|
|
1,113
|
|
981
|
|
|||||
|
Office supplies and forms
|
997
|
|
1,067
|
|
767
|
|
|||||
|
Other expenses
|
3,197
|
|
2,059
|
|
2,817
|
|
|||||
|
Total
|
$
|
10,374
|
|
$
|
8,992
|
|
$
|
8,597
|
|
||
(1) Employee related costs include hiring, training, education, meeting and business travel costs.
87
17. Commitments and Contingencies
Legal Contingencies
In the normal course of business, the Company and its subsidiaries are subject to pending and threatened legal actions. Although the Company is not able to predict the outcome of such actions, after reviewing pending and threatened actions with counsel, management believes that based on the information currently available the outcome of such actions, individually or in the aggregate, will not have a material adverse effect on the Company’s consolidated financial position as a whole.
Reserves are established for legal claims only when losses associated with the claims are judged to be probable, and the loss can be reasonably estimated. In many lawsuits and arbitrations, it is not possible to determine whether a liability has been incurred or to estimate the ultimate or minimum amount of that liability until the case is close to resolution, in which case a reserve will not be recognized until that time.
As of
December 31, 2013
, the Company did not have any loss contingencies that were both probable and reasonably estimable and, therefore, no accrued liability has been recognized.
Financial Instruments
In the normal course of business, the Company is a party to both on-and off-balance sheet financial instruments involving, to varying degrees, elements of credit risk and interest rate risk in addition to the amounts recognized in the consolidated statements of condition.
The following is a summary of the contractual and notional amounts of the Company’s financial instruments:
|
December 31,
|
|||||||
|
|
2013
|
2012
|
|||||
|
Lending-Related Instruments:
|
|
|
|
|
|||
|
Loan origination commitments and unadvanced lines of credit:
|
|
|
|
|
|||
|
Home equity
|
$
|
276,671
|
|
$
|
277,373
|
|
|
|
Commercial and commercial real estate
|
26,688
|
|
20,016
|
|
|||
|
Residential
|
6,408
|
|
9,497
|
|
|||
|
Letters of credit
|
1,789
|
|
1,836
|
|
|||
|
Other commitments
|
437
|
|
16,845
|
|
|||
|
Derivative Financial Instruments:
|
|
|
|
|
|||
|
Customer loan swaps
|
15,702
|
|
16,093
|
|
|||
|
Interest rate swaps
|
43,000
|
|
43,000
|
|
|||
Lending-Related Instruments
The contractual amounts of the Company’s lending-related financial instruments do not necessarily represent future cash requirements since certain of these instruments may expire without being funded and others may not be fully drawn upon. These instruments are subject to the Company’s credit approval process, including an evaluation of the customer’s creditworthiness and related collateral requirements. Commitments generally have fixed expiration dates or other termination clauses.
Derivative Financial Instruments
The Company uses derivative financial instruments for risk management purposes (primarily interest rate risk) and not for trading or speculative purposes. The Company controls the credit risk of these instruments through collateral, credit approvals and monitoring procedures.
88
Interest Rate Swaps:
The Company’s interest rate swap arrangements contain provisions that require the Company to post cash collateral with the counterparty for contracts that are in a net liability position based on their fair values and the Company’s credit rating. The Company had a notional amount of
$43.0 million
in interest rate swap agreements on its junior subordinated debentures and
$5.3 million
in cash held as collateral. The Company swapped its variable interest rate for a fixed interest rate and the terms of the interest rate swap agreements are as follows:
|
Notional Amount
|
Fixed Rate
|
Maturity Date
|
||||
|
$
|
10,000
|
|
5.09%
|
June 30, 2021
|
||
|
10,000
|
|
5.84%
|
June 30, 2029
|
|||
|
10,000
|
|
5.71%
|
June 30, 2030
|
|||
|
5,000
|
|
4.35%
|
March 30, 2031
|
|||
|
8,000
|
|
4.14%
|
July 7, 2031
|
|||
The fair value of the swap agreements on the Company’s junior subordinated debentures at
December 31, 2013
was a liability of
$3.9 million
and is presented within accrued interest and other liabilities on the consolidated statements of condition. As each instrument qualifies as a highly effective cash flow hedge, the change in fair value of the interest rate swaps during 2013 of
$4.7 million
was recorded in OCI, net of tax. Net payments to the counterparty for 2013 were
$1.6 million
and have been classified as cash flows from operating activities in the consolidated statements of cash flows. The Company would reclassify unrealized gains or losses accounted for within AOCI into earnings if the interest rate swaps were to become ineffective or the arrangements were to terminate. In the next 12 months, the Company does not believe it will reclassify any related unrealized gains or losses accounted for within AOCI into earnings.
At December 31, 2012
, the Company had interest rate swap arrangements with a notional amount of
$43.0 million
. The fair value of the swap agreements on its junior subordinated debentures at December 31, 2012 was a liability of
$11.1 million
and is presented within accrued interest and other liabilities on the consolidated statements of condition. As each instrument qualified as a highly effective cash flow hedge, the change in fair value of the interest rate swaps during 2012 of
$60,000
was recorded in OCI, net of tax. Net payments to the counterparty for 2012 were
$1.6 million
and have been classified as cash flows from operating activities in the consolidated statements of cash flows.
Customer Derivatives
At December 31, 2013 and 2012, the Company had a notional amount of
$7.9 million
in interest rate swap agreements with commercial customers and interest rate swap agreements of equal notional amounts with a dealer bank related to the Company’s commercial loan level derivative program. As the two swap agreements have substantially equivalent and offsetting terms, they do not materially change the Company’s interest rate risk or present any material exposure to the Company's consolidated statements of income for either of 2013 or 2012.
Forward Commitments to Sell Residential Mortgage Loans
From time to time, the Company enters into forward commitments to sell residential mortgages in order to reduce the market risk associated with originating loans for sale in the secondary market. At December 31, 2013 and 2012, there were
no
commitments to sell residential mortgages.
Interest Rate Locks and Mortgage Loan Commitments
As part of originating residential mortgage and commercial loans, the Company may enter into rate lock agreements with customers, and may issue commitment letters to customers, which are considered interest rate lock or forward commitments. At December 31, 2013 and 2012, based upon the pipeline of mortgage loans with rate lock commitments and commercial loans with commitment letters, and the change in fair value of those commitments due to changes in market interest rates, the Company determined the impact on the consolidated financial statements was not material.
89
18. Fair Value
Fair value is the price that would be received to sell an asset or paid to transfer a liability in an orderly transaction between market participants at the measurement date. Fair value is best determined using quoted market prices. However, in many instances, quoted market prices are not available. In such instances, fair values are determined using various valuation techniques. Various assumptions and observable inputs must be relied upon in applying these techniques. GAAP establishes a fair value hierarchy for valuation inputs that gives the highest priority to quoted prices in active markets for identical assets or liabilities and the lowest priority to unobservable inputs.
GAAP permits an entity to choose to measure certain eligible financial instruments and other items at fair value. The Company elected the fair value option for its loans held for sale. Electing the fair value option for loans held for sale enables the Company’s financial position to more clearly align with the economic value of the actively traded asset. The Company did not have any loans held for sale at December 31, 2013 or 2012.
The fair value hierarchy for valuation of an asset or liability is as follows:
|
Level 1:
|
Valuation is based upon unadjusted quoted prices in active markets for identical assets and liabilities that the entity has the ability to access as of the measurement date.
|
|
Level 2:
|
Valuation is determined from quoted prices for similar assets or liabilities in active markets, from quoted prices for identical or similar instruments in markets that are not active or by model-based techniques in which all significant inputs are observable in the market.
|
|
Level 3:
|
Valuation is derived from model-based and other techniques in which at least one significant input is unobservable and which may be based on the Company’s own estimates about the assumptions that market participants would use to value the asset or liability.
|
In general, fair value is based upon quoted market prices, where available. If such quoted market prices are not available, fair value is based upon model-based techniques incorporating various assumptions including interest rates, prepayment speeds and credit losses. Assets and liabilities valued using model-based techniques are classified as either Level 2 or Level 3, depending on the lowest level classification of an input that is considered significant to the overall valuation. A description of the valuation methodologies used for instruments measured at fair value, as well as the general classification of such instruments pursuant to the valuation hierarchy, is set forth below.
Financial Instruments Recorded at Fair Value on a Recurring Basis
AFS Securities
: The fair value of debt AFS securities is reported utilizing prices provided by an independent pricing service based on recent trading activity and other observable information including, but not limited to, dealer quotes, market spreads, cash flows, market interest rate curves, market consensus prepayment speeds, credit information, and the bond’s terms and conditions. The fair value of debt securities are classified as Level 2.
Trading Account Assets
: Trading account assets are invested in mutual funds and classified as Level 1 based upon quoted prices.
Derivatives
: The fair value of interest rate swaps is determined using inputs that are observable in the market place obtained from third parties including yield curves, publicly available volatilities, and floating indexes and, accordingly, are classified as Level 2 inputs. The credit value adjustments associated with derivatives utilize Level 3 inputs, such as estimates of current credit spreads to evaluate the likelihood of default by the Company and its counterparties. As of December 31, 2013 and December 31, 2012, the Company has assessed the significance of the impact of the credit valuation adjustments on the overall valuation of its derivative positions and has determined that the credit valuation adjustments are not significant to the overall valuation of its derivatives due to collateral postings.
90
The following table summarizes financial assets and financial liabilities measured at fair value on a recurring basis as of December 31, 2013 and December 31, 2012, segregated by the level of the valuation inputs within the fair value hierarchy utilized to measure fair value:
|
Fair Value
|
Readily Available Market Prices
(Level 1)
|
Observable Market Data
(Level 2)
|
Company Determined Fair Value
(Level 3)
|
||||||||||||
|
At December 31, 2013:
|
|
|
|
|
|
|
|||||||||
|
Financial Assets:
|
|
|
|
|
|
|
|||||||||
|
AFS debt securities:
|
|
|
|
|
|
|
|||||||||
|
Obligations of states and political subdivisions
|
$
|
31,207
|
|
$
|
—
|
|
$
|
31,207
|
|
$
|
—
|
|
|||
|
Mortgage-backed securities issued or guaranteed by U.S. government sponsored enterprises
|
395,903
|
|
—
|
|
395,903
|
|
—
|
|
|||||||
|
Collateralized mortgage obligations issued or guaranteed by U.S. government sponsored enterprises
|
374,435
|
|
—
|
|
374,435
|
|
—
|
|
|||||||
|
Private issue collateralized mortgage obligations
|
6,932
|
|
—
|
|
6,932
|
|
—
|
|
|||||||
|
Trading account assets
|
2,488
|
|
2,488
|
|
—
|
|
—
|
|
|||||||
|
Customer interest rate swap agreement
|
114
|
|
—
|
|
114
|
|
—
|
|
|||||||
|
Financial Liabilities:
|
|
|
|
|
|
|
|||||||||
|
Interest rate swap agreements
|
3,911
|
|
—
|
|
3,911
|
|
—
|
|
|||||||
|
Customer interest rate swap agreement
|
114
|
|
—
|
|
114
|
|
—
|
|
|||||||
|
At December 31, 2012:
|
|
|
|
|
|
|
|||||||||
|
Financial Assets:
|
|
|
|
|
|
|
|||||||||
|
AFS debt securities:
|
|
|
|
|
|
|
|||||||||
|
Obligations of states and political subdivisions
|
$
|
33,040
|
|
$
|
—
|
|
$
|
33,040
|
|
$
|
—
|
|
|||
|
Mortgage-backed securities issued or guaranteed by U.S. government sponsored enterprises
|
358,148
|
|
—
|
|
358,148
|
|
—
|
|
|||||||
|
Collateralized mortgage obligations issued or guaranteed by U.S. government sponsored enterprises
|
381,688
|
|
—
|
|
381,688
|
|
—
|
|
|||||||
|
Private issue collateralized mortgage obligations
|
8,174
|
|
—
|
|
8,174
|
|
—
|
|
|||||||
|
Trading account assets
|
2,300
|
|
2,300
|
|
—
|
|
—
|
|
|||||||
|
Customer interest rate swap agreement
|
496
|
|
—
|
|
496
|
|
—
|
|
|||||||
|
Financial Liabilities:
|
|
|
|
|
|
|
|||||||||
|
Interest rate swap agreements
|
11,580
|
|
—
|
|
11,580
|
|
—
|
|
|||||||
|
Customer interest rate swap agreement
|
496
|
|
—
|
|
496
|
|
—
|
|
|||||||
The Company did not have any transfers between Level 1 and Level 2 of the fair value hierarchy during 2013. The Company’s policy for determining transfers between levels occurs at the end of the reporting period when circumstances in the underlying valuation criteria change and result in transfer between levels.
91
Financial Instruments Recorded at Fair Value on a Nonrecurring Basis
The Company may be required, from time to time, to measure certain financial assets and financial liabilities at fair value on a nonrecurring basis in accordance with GAAP. These include assets that are measured at the lower of cost or market value that were recognized at fair value below cost at the end of the period.
Collateral-Dependent Impaired Loans
: Loans for which it is probable that payment of interest and principal will not be made in accordance with the contractual terms of the loan agreement are considered impaired. The Company's policy is to individually evaluate for impairment loans with a principal balance greater than $250,000 and are risk rated 8 or above or are on non-accrual status. Once the population of loans are identified for individual impairment assessment, the Company measures these loans for impairment using one of three methods: (i) the present value of expected future cash flows discounted at the loan’s effective interest rate; (ii) the loan’s observable market price; or (iii) the fair value of the collateral if the loan is collateral-dependent. If the measure is less than the loan's net carrying value, then a loss is recognized as part of the ALL to adjust the loan's net carrying value to fair value. Accordingly, certain impaired loans may be subject to measurement at fair value on a non-recurring basis. Management has estimated the fair values of these assets using Level 2 inputs, such as the fair value of collateral based on independent third-party market approach appraisals for collateral-dependent loans, and Level 3 inputs where circumstances warrant an adjustment to the appraised value based on the age of the appraisal and/or comparable sales, condition of the collateral, and market conditions.
MSRs
: The Company accounts for mortgage servicing assets at cost, subject to impairment testing. When the carrying value exceeds fair value, a valuation allowance is established to reduce the carrying cost to fair value. Fair value is based on a valuation model that calculates the present value of estimated net servicing income. The Company obtains a third-party valuation based upon loan level data including note rate, type and term of the underlying loans. The model utilizes a variety of observable inputs for its assumptions, the most significant of which are loan prepayment assumptions and the discount rate used to discount future cash flows. Other assumptions include delinquency rates, servicing cost inflation and annual unit loan cost. MSRs are classified within Level 2 of the fair value hierarchy.
Non-Financial Assets and Non-Financial Liabilities Recorded at Fair Value on a Nonrecurring Basis
The Company has no non-financial assets or non-financial liabilities measured at fair value on a recurring basis. Non-financial assets measured at fair value on a non-recurring basis consist of OREO and goodwill.
OREO
: OREO properties acquired through foreclosure or deed in lieu of foreclosure are recorded at the fair value of the real estate, less costs to sell. Any write-down of the recorded investment in the related loan is charged to the allowance for loan losses upon transfer to OREO. Upon acquisition of a property, a current appraisal or a broker’s opinion is used to substantiate fair value for the property. After foreclosure, management periodically obtains updated valuations of the OREO assets and, if additional impairments are deemed necessary, the subsequent write-downs for declines in value are recorded through a valuation allowance and a provision for losses charged to other non-interest expense. Certain assets require assumptions, such as expected future cash flows, that are not observable in an active market in determination of fair value and are classified as Level 3.
Goodwill
: Goodwill represents the excess of the cost of an acquisition over the fair value of the net assets acquired. The fair value of goodwill is estimated by utilizing several standard valuation techniques, including discounted cash flow analyses, bank merger multiples, and an estimation of the impact of business conditions and investor activities on the long-term value of the goodwill.
In 2013, the Company recorded a goodwill impairment of
$2.8 million
to write-down the financial services reporting unit to fair value of $
3.9 million
. Refer to Note 5 of the consolidated financial statements for discussion of goodwill impairment analysis and related significant inputs used, including Level 3 inputs. Additionally, the banking reporting unit was not deemed impaired.
There was
no
goodwill write-down during 2012 for either the financial services or banking reporting units, and thus the December 31, 2012 goodwill balances are recorded at their carrying amount.
92
The table below highlights financial and non-financial assets measured and recorded at fair value on a non-recurring basis as of December 31, 2013 and December 31, 2012. Not included in the table below because they are not recorded at fair value are: (i) impaired loans of
$19.4 million
and
$22.3 million
at December 31, 2013 and 2012, respectively; (ii) MSR's reported of
$322,000
and
$60,000
at December 31, 2013 and 2012, respectively; and (iii) OREO properties of
$612,000
at December 31, 2013 (all OREO properties were carried at fair value at December 31, 2012).
|
Fair Value
|
Readily Available Market Prices
(Level 1)
|
Observable Market Data
(Level 2)
|
Company Determined Fair Value
(Level 3)
|
||||||||||||
|
At December 31, 2013:
|
|
|
|
|
|
|
|||||||||
|
Financial assets:
|
|
|
|
|
|
|
|||||||||
|
Collateral-dependent impaired loans
|
$
|
8,557
|
|
$
|
—
|
|
$
|
—
|
|
$
|
8,557
|
|
|||
|
MSRs
(1)
|
404
|
|
|
|
404
|
|
|
|
|||||||
|
Non-financial assets:
|
|||||||||||||||
|
Other real estate owned
|
1,583
|
|
—
|
|
—
|
|
1,583
|
|
|||||||
|
At December 31, 2012:
|
|
|
|
|
|
|
|||||||||
|
Financial assets:
|
|
|
|
|
|
|
|||||||||
|
Collateral-dependent impaired loans
|
$
|
4,862
|
|
$
|
—
|
|
$
|
—
|
|
$
|
4,862
|
|
|||
|
MSRs
(1)
|
482
|
|
—
|
|
482
|
|
—
|
|
|||||||
|
Non-financial assets:
|
|||||||||||||||
|
Other real estate owned
|
1,313
|
|
—
|
|
—
|
|
1,313
|
|
|||||||
(1) Represents MSRs deemed to be impaired and a valuation allowance was established to carry at fair value at December 31, 2013 and 2012.
The fair value of Level 3 assets carried at fair value as a percentage of total assets carried at fair value was 1% at December 31, 2013 and 2012.
93
The following table presents the valuation methodology and unobservable inputs for Level 3 assets measured at fair value on a non-recurring basis at December 31, 2013 and 2012:
|
Fair Value
|
Valuation Methodology
|
Unobservable input
|
Discount Range (Weighted-Average)
|
||||||||
|
December 31, 2013:
|
|||||||||||
|
Collateral-dependent impaired loans:
|
|
|
|
|
|
|
|||||
|
Partially charged-off
|
$
|
1,874
|
|
Market approach appraisal of collateral
|
Management adjustment
of appraisal
|
0 - 85%
|
(14%)
|
|
|||
|
Specifically reserved
(1)
|
6,683
|
|
Market approach appraisal of collateral
|
Management adjustment
of appraisal
|
7 - 90%
|
(22%)
|
|
||||
|
Other real estate owned
|
1,583
|
|
Market approach appraisal of collateral
|
Management adjustment
of appraisal
|
0 - 41%
|
(16%)
|
|
||||
|
Estimated selling costs
|
6 - 10%
|
(10%)
|
|
||||||||
|
December 31, 2012:
|
|||||||||||
|
Collateral-dependent impaired loans:
|
|
|
|
|
|
|
|||||
|
Partially charged-off
|
$
|
2,767
|
|
Market approach appraisal of collateral
|
Management adjustment
of appraisal
|
0 - 37%
|
(10%)
|
|
|||
|
Specifically reserved
(1)
|
2,095
|
|
Market approach appraisal of collateral
|
Management adjustment
of appraisal
|
19 - 63%
|
(44%)
|
|
||||
|
Other real estate owned
|
1,313
|
|
Market approach appraisal of collateral
|
Management adjustment
of appraisal
|
0 - 42%
|
(19%)
|
|
||||
|
Estimated selling costs
|
10%
|
—
|
|
||||||||
(1) The specific reserve for collateral-dependent impaired loans is determined by any loan-to-value ratio in excess of 80% for consumer loans and any loan-to-value ratio in excess of
75%
for commercial loans. Appraisals are received on impaired loans in accordance with the Company's internal policy. As such, adjustments to the appraised fair value are made, as necessary, should the appraisal not be current. Adjustments are made to the appraised fair value to reflect changes in known factors, including, but not limited to, property condition, property location, and costs to sell the collateral.
GAAP requires disclosure of the fair value of financial assets and financial liabilities, including those financial assets and financial liabilities that are not measured and reported at fair value on a recurring basis or non-recurring basis. The methodologies for estimating the fair value of financial assets and financial liabilities that are measured at fair value on a recurring or non-recurring basis are discussed above. The following methods and assumptions were used by the Company in estimating the fair values of its other financial instruments.
Cash and Due from Banks
: The carrying amounts reported in the consolidated statements of condition approximate fair value.
FHLB and FRB Stock and Investments in CCTA AND UBCT
: The carrying amounts reported in the consolidated statements of condition approximate fair value.
Loans
: For variable rate loans that reprice frequently and have no significant change in credit risk, fair values are based on carrying values. The fair value of other loans is estimated by discounting the future cash flows using the current rates at which similar loans would be made to borrowers with similar credit ratings and for the same remaining maturities.
Interest Receivable and Payable
: The carrying amounts reported in the consolidated statements of condition approximate fair value.
Deposits
: The fair value of deposits with no stated maturity is equal to the carrying amount. The fair value of certificates of deposit is estimated using a discounted cash flow calculation that applies interest rates and remaining maturities for currently offered certificates of deposit.
94
Borrowings
: The carrying amounts of short-term borrowings from the FHLB, securities sold under repurchase agreements, notes payable and other short-term borrowings approximate fair value. The fair values of long-term borrowings and commercial repurchase agreements are based on the discounted cash flows using current rates for advances of similar remaining maturities.
Junior Subordinated Debentures
: The carrying amounts reported in the consolidated statements of condition approximate fair value.
The following table presents the carrying amounts and estimated fair value for financial instrument assets and liabilities at December 31, 2013:
|
Fair Value Measurement
at December 31, 2013
|
|||||||||||||||||||
|
|
Carrying Amount
|
Fair Value
|
Readily Available Market Prices
(Level 1)
|
Observable Market Prices
(Level 2)
|
Company Determined Market Prices
(Level 3)
|
||||||||||||||
|
Financial assets:
|
|
|
|
|
|
|
|
|
|||||||||||
|
Cash and due from banks
|
$
|
51,355
|
|
$
|
51,355
|
|
$
|
51,355
|
|
$
|
—
|
|
$
|
—
|
|
||||
|
AFS securities
|
808,477
|
|
808,477
|
|
—
|
|
808,477
|
|
—
|
|
|||||||||
|
FHLB and FRB stock
|
19,724
|
|
19,724
|
|
19,724
|
|
—
|
|
—
|
|
|||||||||
|
Trading account assets
|
2,488
|
|
2,488
|
|
2,488
|
|
—
|
|
—
|
|
|||||||||
|
Residential real estate loans
|
563,425
|
|
577,153
|
|
—
|
|
—
|
|
577,153
|
|
|||||||||
|
Commercial real estate loans
|
536,107
|
|
535,961
|
|
—
|
|
—
|
|
535,961
|
|
|||||||||
|
Commercial loans
|
172,105
|
|
171,432
|
|
—
|
|
—
|
|
171,432
|
|
|||||||||
|
Home equity loans
|
269,888
|
|
271,041
|
|
—
|
|
—
|
|
271,041
|
|
|||||||||
|
Consumer loans
|
17,287
|
|
17,662
|
|
—
|
|
—
|
|
17,662
|
|
|||||||||
|
MSRs
(1)
|
726
|
|
1,494
|
|
—
|
|
1,494
|
|
—
|
|
|||||||||
|
Interest receivable
|
5,808
|
|
5,808
|
|
—
|
|
5,808
|
|
—
|
|
|||||||||
|
Investment in CCTA and UBCT
|
1,331
|
|
1,331
|
|
—
|
|
—
|
|
1,331
|
|
|||||||||
|
Customer interest rate swap agreement
|
114
|
|
114
|
|
—
|
|
114
|
|
—
|
|
|||||||||
|
Financial liabilities:
|
|
|
|
|
|
|
|
|
|||||||||||
|
Deposits
|
$
|
1,813,824
|
|
$
|
1,817,199
|
|
$
|
1,324,221
|
|
$
|
492,978
|
|
$
|
—
|
|
||||
|
FHLB advances
|
56,112
|
|
59,118
|
|
—
|
|
59,118
|
|
—
|
|
|||||||||
|
Commercial repurchase agreements
|
30,142
|
|
32,038
|
|
—
|
|
32,038
|
|
—
|
|
|||||||||
|
Other borrowed funds
|
399,916
|
|
400,144
|
|
400,144
|
|
—
|
|
—
|
|
|||||||||
|
Junior subordinated debentures
|
43,922
|
|
43,922
|
|
—
|
|
43,922
|
|
—
|
|
|||||||||
|
Interest payable
|
567
|
|
567
|
|
567
|
|
—
|
|
—
|
|
|||||||||
|
Interest rate swap agreements
|
3,911
|
|
3,911
|
|
—
|
|
3,911
|
|
—
|
|
|||||||||
|
Customer interest rate swap agreement
|
114
|
|
114
|
|
—
|
|
114
|
|
—
|
|
|||||||||
(1) Reported fair value represents all MSRs currently being serviced by the Company at December 31, 2013, regardless of carrying amount.
95
The following table presents the carrying amounts and estimated fair value for financial instrument assets and liabilities at December 31, 2012:
|
Fair Value Measurement
at December 31, 2012
|
|||||||||||||||||||
|
|
Carrying Amount
|
Fair Value
|
Readily Available Market Prices
(Level 1)
|
Observable Market Prices
(Level 2)
|
Company Determined Market Prices
(Level 3)
|
||||||||||||||
|
Financial assets:
|
|
|
|
|
|
|
|
|
|||||||||||
|
Cash and due from banks
|
$
|
58,290
|
|
$
|
58,290
|
|
$
|
58,290
|
|
$
|
—
|
|
$
|
—
|
|
||||
|
AFS securities
|
781,050
|
|
781,050
|
|
—
|
|
781,050
|
|
—
|
|
|||||||||
|
FHLB and FRB stock
|
21,034
|
|
21,034
|
|
21,034
|
|
—
|
|
—
|
|
|||||||||
|
Trading account assets
|
2,300
|
|
2,300
|
|
2,300
|
|
—
|
|
—
|
|
|||||||||
|
Residential real estate loans
|
564,184
|
|
591,139
|
|
—
|
|
—
|
|
591,139
|
|
|||||||||
|
Commercial real estate loans
|
501,037
|
|
492,602
|
|
—
|
|
—
|
|
492,602
|
|
|||||||||
|
Commercial loans
|
183,680
|
|
179,519
|
|
—
|
|
—
|
|
179,519
|
|
|||||||||
|
Home equity loans
|
275,498
|
|
277,194
|
|
—
|
|
—
|
|
277,194
|
|
|||||||||
|
Consumer loans
|
16,423
|
|
16,866
|
|
—
|
|
—
|
|
16,866
|
|
|||||||||
|
MSRs
(1)
|
542
|
|
879
|
|
—
|
|
879
|
|
—
|
|
|||||||||
|
Interest receivable
|
6,215
|
|
6,215
|
|
—
|
|
6,215
|
|
—
|
|
|||||||||
|
Investment in CCTA and UBCT
|
1,331
|
|
1,331
|
|
—
|
|
—
|
|
1,331
|
|
|||||||||
|
Customer interest rate swap agreement
|
496
|
|
496
|
|
—
|
|
496
|
|
—
|
|
|||||||||
|
Financial liabilities:
|
|||||||||||||||||||
|
Deposits
|
$
|
1,929,469
|
|
$
|
1,936,446
|
|
$
|
1,339,290
|
|
$
|
597,156
|
|
$
|
—
|
|
||||
|
FHLB advances
|
56,404
|
|
60,813
|
|
—
|
|
60,813
|
|
—
|
|
|||||||||
|
Commercial repurchase agreements
|
66,187
|
|
69,067
|
|
—
|
|
69,067
|
|
—
|
|
|||||||||
|
Other borrowed funds
|
193,753
|
|
193,753
|
|
193,753
|
|
—
|
|
—
|
|
|||||||||
|
Junior subordinated debentures
|
43,819
|
|
43,819
|
|
—
|
|
43,819
|
|
—
|
|
|||||||||
|
Interest payable
|
905
|
|
905
|
|
905
|
|
—
|
|
—
|
|
|||||||||
|
Interest rate swap agreements
|
11,580
|
|
11,580
|
|
—
|
|
11,580
|
|
—
|
|
|||||||||
|
Customer interest rate swap agreement
|
496
|
|
496
|
|
—
|
|
496
|
|
—
|
|
|||||||||
(1) Reported fair value represents all MSRs currently being serviced by the Company at December 31, 2012, regardless of carrying amount.
19. Regulatory Capital Requirements
The Company and its bank subsidiary are subject to various regulatory capital requirements administered by the FRB and the OCC. Failure to meet minimum capital requirements can result in mandatory and possible additional discretionary actions by regulators that, if undertaken, could have a direct material effect on the Company’s consolidated financial statements. These capital requirements represent quantitative measures of the Company’s assets, liabilities and certain off-balance sheet items as calculated under regulatory accounting practices. The Company’s capital classification is also subject to qualitative judgments by its regulators about components, risk weightings and other factors.
Quantitative measures established by regulation to ensure capital adequacy require the Company to maintain minimum amounts and ratios of total and Tier I capital (as defined in the applicable regulations) to risk-weighted assets (as defined in the applicable regulations) and of Tier I capital to average assets (as defined in the applicable regulations). In addition, the OCC requires a minimum level of $
2.5 million
of Tier I capital to be maintained at Acadia Trust. Management believes that, as of December 31, 2013, the Company and its subsidiaries meet all capital requirements to which they are subject.
96
As of December 31, 2013, the Company and the Bank were categorized by its supervisory regulatory agencies as "well capitalized". To be categorized as "well capitalized", the Company and Bank must maintain minimum total risk-based, Tier I risk-based and Tier I leverage ratios as set forth in the table below. There are no conditions or events that management believes have changed the Company or Bank’s respective capital categories.
The Bank’s actual capital amounts and ratios are presented in the following table:
|
Actual
Regulatory Capital
|
Minimum Regulatory
Capital Required
|
Minimum Regulatory
Provision To Be
"Well Capitalized"
|
||||||||||||||||||
|
|
Amount
|
Ratio
|
Amount
|
Ratio
|
Amount
|
Ratio
|
||||||||||||||
|
As of December 31, 2013:
|
|
|
|
|
|
|
|
|
|
|
||||||||||
|
Total risk-based capital
|
$
|
228,375
|
|
14.80
|
%
|
$
|
123,421
|
|
8.00
|
%
|
$
|
154,276
|
|
10.00
|
%
|
|||||
|
Tier I capital
|
209,062
|
|
13.55
|
%
|
61,710
|
|
4.00
|
%
|
92,566
|
|
6.00
|
%
|
||||||||
|
Tier I leverage capital ratio
|
209,062
|
|
8.39
|
%
|
101,439
|
|
4.00
|
%
|
126,798
|
|
5.00
|
%
|
||||||||
|
As of December 31, 2012:
|
|
|
|
|
|
|
|
|
|
|
||||||||||
|
Total risk-based capital
|
$
|
213,435
|
|
14.04
|
%
|
$
|
121,625
|
|
8.00
|
%
|
$
|
152,031
|
|
10.00
|
%
|
|||||
|
Tier I capital
|
194,381
|
|
12.79
|
%
|
60,812
|
|
4.00
|
%
|
91,219
|
|
6.00
|
%
|
||||||||
|
Tier I leverage capital ratio
|
194,381
|
|
7.97
|
%
|
99,347
|
|
4.00
|
%
|
124,184
|
|
5.00
|
%
|
||||||||
The Company’s actual capital amounts and ratios are presented in the following table:
|
Actual
Regulatory Capital
|
Minimum Regulatory
Capital Required
|
Minimum Regulatory
Provision To Be
"Well Capitalized"
|
||||||||||||||||||
|
|
Amount
|
Ratio
|
Amount
|
Ratio
|
Amount
|
Ratio
|
||||||||||||||
|
As of December 31, 2013:
|
|
|
|
|
|
|
|
|
|
|
|
|
||||||||
|
Total risk-based capital
|
$
|
256,648
|
|
16.45
|
%
|
$
|
124,787
|
|
8.00
|
%
|
$
|
155,983
|
|
10.00
|
%
|
|||||
|
Tier I capital
|
237,124
|
|
15.20
|
%
|
62,393
|
|
4.00
|
%
|
93,590
|
|
6.00
|
%
|
||||||||
|
Tier I leverage capital ratio
|
237,124
|
|
9.43
|
%
|
102,551
|
|
4.00
|
%
|
128,188
|
|
5.00
|
%
|
||||||||
|
As of December 31, 2012:
|
|
|
|
|
|
|
|
|
|
|
|
|
||||||||
|
Total risk-based capital
|
$
|
239,831
|
|
15.56
|
%
|
$
|
123,293
|
|
8.00
|
%
|
$
|
154,116
|
|
10.00
|
%
|
|||||
|
Tier I capital
|
220,519
|
|
14.31
|
%
|
61,646
|
|
4.00
|
%
|
92,469
|
|
6.00
|
%
|
||||||||
|
Tier I leverage capital ratio
|
220,519
|
|
8.94
|
%
|
100,770
|
|
4.00
|
%
|
125,963
|
|
5.00
|
%
|
||||||||
97
20. Parent Company Financial Statements
Following are the condensed statements of condition, income and cash flows for the Company (parent company only):
STATEMENTS OF CONDITION
|
December 31,
|
|||||||
|
|
2013
|
2012
|
|||||
|
ASSETS
|
|
|
|
|
|||
|
Cash
|
$
|
21,788
|
|
$
|
19,510
|
|
|
|
Trading assets
|
2,488
|
|
2,300
|
|
|||
|
Premises and equipment
|
4,797
|
|
4,846
|
|
|||
|
Investment in subsidiaries:
|
|
|
|
|
|||
|
Bank subsidiary
|
246,213
|
|
253,512
|
|
|||
|
Other subsidiary
|
8,733
|
|
11,108
|
|
|||
|
Amounts receivable from subsidiaries
|
2,062
|
|
2,643
|
|
|||
|
Investments in CCTA and UBCT
|
1,331
|
|
1,331
|
|
|||
|
Other assets
|
7,278
|
|
9,765
|
|
|||
|
Total assets
|
$
|
294,690
|
|
$
|
305,015
|
|
|
|
LIABILITIES AND SHAREHOLDERS’ EQUITY
|
|
|
|
|
|||
|
Amounts due to subsidiaries
|
$
|
5
|
|
$
|
88
|
|
|
|
Junior subordinated debentures
|
43,922
|
|
43,819
|
|
|||
|
Accrued interest and other liabilities
|
19,667
|
|
27,293
|
|
|||
|
Shareholders’ equity
|
231,096
|
|
233,815
|
|
|||
|
Total liabilities and shareholders’ equity
|
$
|
294,690
|
|
$
|
305,015
|
|
|
98
STATEMENTS OF INCOME
|
Years Ended December 31,
|
|||||||||||
|
|
2013
|
2012
|
2011
|
||||||||
|
Operating Income
|
|
|
|
|
|||||||
|
Dividend income from subsidiaries
|
$
|
13,500
|
|
$
|
13,400
|
|
$
|
15,400
|
|
||
|
Fees from subsidiaries
|
20,930
|
|
20,070
|
|
18,048
|
|
|||||
|
Other income
|
270
|
|
170
|
|
13
|
|
|||||
|
Total operating income
|
34,700
|
|
33,640
|
|
33,461
|
|
|||||
|
Operating Expenses
|
|
|
|
|
|
|
|||||
|
Salaries and employee benefits
|
13,354
|
|
13,007
|
|
11,417
|
|
|||||
|
Furniture, equipment and data processing
|
4,570
|
|
3,971
|
|
3,296
|
|
|||||
|
Interest on borrowings
|
2,532
|
|
2,546
|
|
2,614
|
|
|||||
|
Depreciation and amortization
|
1,197
|
|
1,196
|
|
1,194
|
|
|||||
|
Stock-based compensation expense
|
596
|
|
538
|
|
1,025
|
|
|||||
|
Net occupancy
|
523
|
|
492
|
|
473
|
|
|||||
|
Other operating expenses
|
1,454
|
|
1,056
|
|
822
|
|
|||||
|
Total operating expenses
|
24,226
|
|
22,806
|
|
20,841
|
|
|||||
|
Income before equity in undistributed earnings of subsidiaries and income taxes
|
10,474
|
|
10,834
|
|
12,620
|
|
|||||
|
Equity in undistributed earnings of subsidiaries
|
11,233
|
|
11,647
|
|
12,441
|
|
|||||
|
Income before income taxes
|
21,707
|
|
22,481
|
|
25,061
|
|
|||||
|
Income tax benefit
|
1,076
|
|
947
|
|
1,116
|
|
|||||
|
Net Income
|
$
|
22,783
|
|
$
|
23,428
|
|
$
|
26,177
|
|
||
99
STATEMENTS OF CASH FLOWS
|
Years Ended December 31,
|
|||||||||||
|
|
2013
|
2012
|
2011
|
||||||||
|
Operating Activities
|
|
|
|
|
|
|
|||||
|
Net income
|
$
|
22,783
|
|
$
|
23,428
|
|
$
|
26,177
|
|
||
|
Adjustments to reconcile net income to net cash provided by operating activities:
|
|
|
|
|
|
|
|||||
|
Equity in undistributed earnings of subsidiaries
|
(11,233
|
)
|
(11,647
|
)
|
(12,441
|
)
|
|||||
|
Depreciation and amortization
|
1,197
|
|
1,196
|
|
1,194
|
|
|||||
|
Stock-based compensation expense
|
596
|
|
538
|
|
1,025
|
|
|||||
|
Decrease (increase) in amount receivable from subsidiaries
|
498
|
|
(983
|
)
|
(22
|
)
|
|||||
|
Increase in other assets
|
(845
|
)
|
(1,334
|
)
|
(35
|
)
|
|||||
|
Increase in accrued expenses
|
459
|
|
636
|
|
3,522
|
|
|||||
|
Net cash provided by operating activities
|
13,455
|
|
11,834
|
|
19,420
|
|
|||||
|
Investing Activities
|
|
|
|
|
|
|
|||||
|
Purchase of premises and equipment
|
(896
|
)
|
(1,009
|
)
|
(1,286
|
)
|
|||||
|
Net cash used by investing activities
|
(896
|
)
|
(1,009
|
)
|
(1,286
|
)
|
|||||
|
Financing Activities
|
|
|
|
|
|
|
|||||
|
Exercise of stock options and issuance of restricted stock, net of repurchase for tax withholdings and tax benefit
|
300
|
|
(212
|
)
|
(134
|
)
|
|||||
|
Common stock repurchase
|
(2,460
|
)
|
(2,097
|
)
|
(389
|
)
|
|||||
|
Cash dividends paid on common stock
|
(8,121
|
)
|
(7,667
|
)
|
(11,524
|
)
|
|||||
|
Net cash used by financing activities
|
(10,281
|
)
|
(9,976
|
)
|
(12,047
|
)
|
|||||
|
Net increase in cash
|
2,278
|
|
849
|
|
6,087
|
|
|||||
|
Cash at beginning of year
|
19,510
|
|
18,661
|
|
12,574
|
|
|||||
|
Cash at end of year
|
$
|
21,788
|
|
$
|
19,510
|
|
$
|
18,661
|
|
||
|
Supplemental information
|
|||||||||||
|
Common stock repurchased not yet settled
|
$
|
320
|
|
$
|
—
|
|
$
|
—
|
|
||
21. Quarterly Results of Operations (Unaudited)
The following table presents a summary of the quarterly results of operations for 2013 and 2012:
|
2013
|
2012
|
||||||||||||||||||||||||||||||
|
|
First
|
Second
|
Third
|
Fourth
|
First
|
Second
|
Third
|
Fourth
|
|||||||||||||||||||||||
|
Interest income
|
$
|
22,426
|
|
$
|
22,481
|
|
$
|
21,891
|
|
$
|
21,419
|
|
$
|
22,965
|
|
$
|
22,797
|
|
$
|
22,636
|
|
$
|
22,549
|
|
|||||||
|
Interest expense
|
3,258
|
|
3,231
|
|
3,184
|
|
3,069
|
|
4,594
|
|
4,431
|
|
4,189
|
|
3,988
|
|
|||||||||||||||
|
Net interest income
|
19,168
|
|
19,250
|
|
18,707
|
|
18,350
|
|
18,371
|
|
18,366
|
|
18,447
|
|
18,561
|
|
|||||||||||||||
|
Provision for (release of) credit losses
|
674
|
|
695
|
|
665
|
|
(6
|
)
|
1,005
|
|
835
|
|
868
|
|
1,108
|
|
|||||||||||||||
|
Non-interest income
|
6,336
|
|
6,376
|
|
6,475
|
|
8,614
|
|
5,228
|
|
5,754
|
|
5,038
|
|
7,392
|
|
|||||||||||||||
|
Non-interest expense
|
16,500
|
|
15,648
|
|
15,199
|
|
18,986
|
|
12,919
|
|
13,979
|
|
13,370
|
|
18,763
|
|
|||||||||||||||
|
Income before income taxes
|
8,330
|
|
9,283
|
|
9,318
|
|
7,984
|
|
9,675
|
|
9,306
|
|
9,247
|
|
6,082
|
|
|||||||||||||||
|
Income tax expense
|
2,668
|
|
2,952
|
|
2,952
|
|
3,560
|
|
3,092
|
|
2,894
|
|
2,992
|
|
1,904
|
|
|||||||||||||||
|
Net income
|
$
|
5,662
|
|
$
|
6,331
|
|
$
|
6,366
|
|
$
|
4,424
|
|
$
|
6,583
|
|
$
|
6,412
|
|
$
|
6,255
|
|
$
|
4,178
|
|
|||||||
|
Per common share:
|
|
|
|
|
|
|
|
|
|||||||||||||||||||||||
|
Basic
|
$
|
0.74
|
|
$
|
0.83
|
|
$
|
0.83
|
|
$
|
0.58
|
|
$
|
0.86
|
|
$
|
0.83
|
|
$
|
0.82
|
|
$
|
0.55
|
|
|||||||
|
Diluted
|
$
|
0.74
|
|
$
|
0.82
|
|
$
|
0.83
|
|
$
|
0.58
|
|
$
|
0.86
|
|
$
|
0.83
|
|
$
|
0.82
|
|
$
|
0.55
|
|
|||||||
100
REPORT OF INDEPENDENT REGISTERED PUBLIC ACCOUNTING FIRM
The Shareholders and Board of Directors
Camden National Corporation
We have audited the accompanying consolidated statements of condition of Camden National Corporation and Subsidiaries as of December 31, 2013 and 2012, and the related consolidated statements of income, comprehensive income, changes in shareholders’ equity, and cash flows for each of the three years in the period ended December 31, 2013. We have also audited Camden National Corporation’s internal control over financial reporting as of December 31, 2013, based on criteria established in
Internal Control — Integrated Framework
(1992) issued by the Committee of Sponsoring Organizations of the Treadway Commission (COSO). Camden National Corporation’s management is responsible for these financial statements, for maintaining effective internal control over financial reporting, and for its assessment of the effectiveness of internal control over financial reporting, included in the accompanying Management’s Annual Report on Internal Control over Financial Reporting. Our responsibility is to express an opinion on these financial statements and an opinion on the Company’s internal control over financial reporting based on our audits.
We conducted our audits in accordance with the standards of the Public Company Accounting Oversight Board (United States). Those standards require that we plan and perform the audits to obtain reasonable assurance about whether the financial statements are free of material misstatement and whether effective internal control over financial reporting was maintained in all material respects. Our audits of the financial statements included examining, on a test basis, evidence supporting the amounts and disclosures in the financial statements, assessing the accounting principles used and significant estimates made by management, and evaluating the overall financial statement presentation. Our audit of internal control over financial reporting included obtaining an understanding of internal control over financial reporting, assessing the risk that a material weakness exists, and testing and evaluating the design and operating effectiveness of internal control based on the assessed risk. Our audits also included performing such other procedures as we considered necessary in the circumstances. We believe that our audits provide a reasonable basis for our opinions.
A company’s internal control over financial reporting is a process designed to provide reasonable assurance regarding the reliability of financial reporting and the preparation of financial statements for external purposes in accordance with U.S. generally accepted accounting principles. A company’s internal control over financial reporting includes those policies and procedures that (1) pertain to the maintenance of records that, in reasonable detail, accurately and fairly reflect the transactions and dispositions of the assets of the company; (2) provide reasonable assurance that transactions are recorded as necessary to permit preparation of financial statements in accordance with U.S. generally accepted accounting principles, and that receipts and expenditures of the company are being made only in accordance with authorizations of management and directors of the company; and (3) provide reasonable assurance regarding prevention or timely detection of unauthorized acquisition, use, or disposition of the company’s assets that could have a material effect on the financial statements.
Because of its inherent limitations, internal control over financial reporting may not prevent or detect misstatements. Also, projections of any evaluation of effectiveness to future periods are subject to the risk that controls may become inadequate because of changes in conditions, or that the degree of compliance with the policies or procedures may deteriorate.
In our opinion, the financial statements referred to above present fairly, in all material respects, the consolidated financial position of Camden National Corporation and Subsidiaries as of December 31, 2013 and 2012, and the consolidated results of their operations and their consolidated cash flows for each of the three years in the period ended December 31, 2013, in conformity with accounting principles generally accepted in the United States of America. Also, in our opinion, Camden National Corporation maintained, in all material respects, effective internal control over financial reporting as of December 31, 2013, based on criteria established in COSO.
/s/ Berry Dunn McNeil & Parker, LLC
Berry Dunn McNeil & Parker, LLC
Bangor, Maine
March 12,
2014
101
During the past two fiscal years, the Company has not made changes in, and has not had disagreements with, its independent accountant on accounting and financial disclosures.
As required by Rule 13a-15 under the Securities Exchange Act of 1934, as amended (the “Exchange Act”), the Company’s management conducted an evaluation with the participation of the Company’s Chief Executive Officer and Chief Financial Officer & Principal Financial and Accounting Officer, regarding the effectiveness of the Company’s disclosure controls and procedures, as of the end of the last fiscal year. In designing and evaluating the Company’s disclosure controls and procedures, the Company and its management recognize that any controls and procedures, no matter how well designed and operated, can provide only a reasonable assurance of achieving the desired control objectives, and management necessarily was required to apply its judgment in evaluating and implementing possible controls and procedures. Based upon that evaluation, the Chief Executive Officer and Chief Financial Officer & Principal Financial and Accounting Officer concluded that they believe the Company’s disclosure controls and procedures are effective to ensure that information required to be disclosed by the Company in the reports it files or submits under the Exchange Act is recorded, processed, summarized and reported within the time periods specified in the SEC’s rules and forms. We intend to continue to review and document our disclosure controls and procedures, including our internal controls and procedures for financial reporting, and we may from time to time make changes to the disclosure controls and procedures to enhance their effectiveness and to ensure that our systems evolve with our business.
There was no change in our internal control over financial reporting that occurred during the period covered by this Annual Report on Form 10-K that has materially affected, or is reasonably likely to materially affect, our internal control over financial reporting.
MANAGEMENT’S ANNUAL REPORT
ON INTERNAL CONTROL OVER FINANCIAL REPORTING
The Management of the Company is responsible for the preparation and fair presentation of the financial statements and other financial information contained in this Form 10-K. Management is also responsible for establishing and maintaining adequate internal control over financial reporting and for identifying the framework used to evaluate its effectiveness. Management has designed processes, internal controls and a business culture that foster financial integrity and accurate reporting. The Company’s comprehensive system of internal control over financial reporting was designed to provide reasonable assurance regarding the reliability of financial reporting and the preparation of the consolidated financial statements of the Company in accordance with accounting principles generally accepted in the United States of America. The Company’s accounting policies and internal control over financial reporting, established and maintained by management, is under the general oversight of the Company’s board of directors, including the board of directors’ Audit Committee.
Management has made a comprehensive review, evaluation, and assessment of the Company’s internal control over financial reporting as of December 31, 2013. The standard measures adopted by management in making its evaluation are the measures in
Internal Control — Integrated Framework
(1992)
published by the Committee of Sponsoring Organizations of the Treadway Commission. Based upon its review and evaluation, management concluded that, as of December 31, 2013, the Company’s internal control over financial reporting was effective and that there were no material weaknesses. However, Management recognizes a control system, no matter how well designed and operated, has inherent limitations and can provide only reasonable, not absolute, assurance that the control system’s objectives will be met and may not prevent or detect all error and fraud. Therefore, even a system determined to be effective can provide only reasonable assurance with respect to financial statement preparation and presentation.
Berry Dunn McNeil & Parker, LLC, an independent registered public accounting firm, which has audited and reported on the consolidated financial statements contained in this Form 10-K, has issued its written attestation report on management’s assessment of the Company’s internal control over financial reporting which precedes this report.
A meeting of the Board of Directors was held on
March 11,
2014 to consider and vote upon a proposed amendment to the Corporation’s Amended and Restated Bylaws that would eliminate the requirement that the Board of Directors consist of an odd number of Directors. The Board voted to approve the amendment and a copy of the Amended and Restated Bylaws, as amended, are filed with this Annual Report on Form 10-K.
102
The information required by this item is incorporated by reference from the material responsive to such item in the Company’s Proxy Statement for the 2014 Annual Meeting of Shareholders to be held on April 29, 2014.
The information required by this item is incorporated by reference from the material responsive to such item in the Company’s Proxy Statement for the 2014 Annual Meeting of Shareholders to be held on April 29, 2014.
Securities authorized for issuance under equity compensation plans are as follows:
|
Number of Securities to Be Issued Upon Exercise of Outstanding Options, Warrants and Rights
(a)
|
Weighted Average Exercise Price of Outstanding Options, Warrants and Rights
(b)
|
Number of Securities Remaining Available for Future Issuance (Excluding Securities in Column (a))
(c)
|
||||||||
|
Equity compensation plans approved by shareholders
|
191,620
|
|
$
|
21.16
|
|
809,006
|
|
(1)
|
||
|
Equity compensation plans not approved by shareholders
|
—
|
|
—
|
|
—
|
|
||||
|
Total
|
191,620
|
|
$
|
21.16
|
|
809,006
|
|
|||
(1) Represents the 800,000 shares available under the 2012 Equity and Incentive Plan less awards granted plus shares added back due to the forfeiture, cancellation or reacquisition by the Company for the settlement of an award to cover the exercise price or tax withholding under the current and previous plans.
Refer to Notes 1 and 15 to the consolidated financial statements within Item 8. “Financial Statements and Supplementary Data” for further information related to the Company’s equity compensation plans.
Other information required by this item is incorporated by reference from the material responsive to such item in the Company’s Proxy Statement for the 2014 Annual Meeting of Shareholders to be held on April 29, 2014.
The information required by this item is incorporated by reference from the material responsive to such item in the Company’s Proxy Statement for the 2014 Annual Meeting of Shareholders to be held on April 29, 2014.
The information required by this item is incorporated by reference from the material responsive to such item in the Company’s Proxy Statement for the 2014 Annual Meeting of Shareholders to be held on April 29, 2014.
103
(a) 1. Index to Financial Statements:
The consolidated financial statements of the Company and report of the Company’s independent registered public accounting firm incorporated herein are included in Item 8 of this Report, as follows:
|
Page
|
|
2. Financial Statement Schedules:
Schedules have been omitted because they are not applicable or are not required under the instructions contained in Regulation S-X or because the information required to be set forth therein is included in the consolidated financial statements or notes thereto.
3. Exhibits:
|
Exhibit
No.
|
Definition
|
|
|
2.1
|
Purchase and Assumption Agreement, dated April 23, 2012, by and between Bank of America, National Association and Camden National Bank (incorporated herein by reference to Exhibit 2.1 to the Company’s Form 8-K filed with the Commission on April 24, 2012).
|
|
|
3.1
|
Articles of Incorporation of Camden National Corporation, as amended (incorporated herein by reference to Exhibit 3.i.1 to the Company’s Form 10-K filed with the Commission on March 2, 2011).
|
|
|
3.2*
|
Amended and Restated Bylaws of Camden National Corporation.
|
|
|
10.1+
|
Camden National Corporation 2003 Stock Option and Incentive Plan (incorporated by reference to Exhibit 10.1 to the Company’s Form 10-Q filed with the Commission on August 8, 2008).
|
|
|
10.2+
|
Form of Incentive Stock Option Agreement under the Camden National Corporation 2003 Stock Option and Incentive Plan (incorporated herein by reference to Exhibit 10.4 to the Company’s Form 10-K filed with the Commission on March 2, 2011).
|
|
|
10.3+
|
Form of Restricted Stock Award Agreement under the Camden National Corporation 2003 Stock Option and Incentive Plan (incorporated herein by reference to Exhibit 10.5 to the Company’s Form 10-K filed with the Commission on March 2, 2011).
|
|
|
10.4+
|
Camden National Corporation Management Stock Purchase Plan under the Camden National Corporation 2003 Stock Option and Incentive Plan (incorporated herein by reference to Exhibit 10.3 to the Company’s Form 8-K filed with the Commission on May 1, 2008).
|
|
|
10.5+
|
Camden National Corporation 2012 Equity and Incentive Plan (incorporated herein by reference to Exhibit 10.1 to the Company’s Form 8-K filed with the Commission on May 8, 2012).
|
|
|
10.6+
|
Form of Incentive Stock Option Agreement under the Camden National Corporation 2012 Equity and Incentive Plan (incorporated herein by reference to Exhibit 10.6 to the Company's Form 10-K filed with the Commission on February 28, 2013).
|
|
|
10.7+
|
Form of Restricted Stock Award Agreement under the Camden National Corporation 2012 Equity and Incentive Plan (incorporated herein by reference to Exhibit 10.7 to the Company's Form 10-K filed with the Commission on February 28, 2013).
|
|
104
|
Exhibit
No.
|
Definition
|
|
|
10.8+
|
Camden National Corporation Management Stock Purchase Plan under the Camden National Corporation 2012 Equity and Incentive Plan (incorporated herein by reference to Exhibit 10.8 to the Company's Form 10-K filed with the Commission on February 28, 2013).
|
|
|
10.9+
|
Camden National Corporation Amended and Restated Defined Contribution Retirement Plan (incorporated herein by reference to Exhibit 99.1 to the Company’s Form 8-K filed with the Commission on February 4, 2008).
|
|
|
10.10+
|
Supplemental Executive Retirement Program (incorporated herein by reference to Exhibit 99.1 to the Company’s Form 8-K filed with the Commission on February 4, 2008).
|
|
|
10.11+
|
Union Trust Company’s Amended and Restated Deferred Compensation Agreement (incorporated herein by reference to Exhibit 10.1 to the Company’s Form 10-Q filed with the Commission on May 12, 2008).
|
|
|
10.12+
|
Camden National Corporation Executive Deferred Compensation Plan (incorporated herein by reference to Exhibit 10.9 to the Company’s Form 10-K filed with the Commission on March 17, 2008).
|
|
|
10.13+
|
Amendment to Executive Deferred Compensation Plan, dated as of February 26, 2013 (incorporated herein by reference to Exhibit 10.13 to the Company's Form 10-K filed with the Commission on February 28, 2013).
|
|
|
10.14+
|
Amendment and Restatement of Camden National Corporation Director Deferred Compensation Plan (incorporated herein by reference to Exhibit 10.4 to the Company’s Form 10-K filed with the Commission on March 9, 2007).
|
|
|
10.15+
|
2007 Amendment to the Camden National Corporation Director Deferred Compensation Plan (incorporated by reference to Exhibit 10.10 to the Company’s Form 10-K filed with the Commission on March 17, 2008).
|
|
|
10.16
|
Camden National Corporation Audit Committee Complaint Procedures (incorporated herein by reference to Exhibit 10.12 to the Company’s Form 10-K filed with the Commission on March 2, 2011).
|
|
|
10.17+
|
2010 Executive Incentive Compensation Program (incorporated herein by reference to Exhibit 10.19 to the Company’s Form 10-K filed with the Commission on March 12, 2010).
|
|
|
10.18+
|
Form of Change in Control Agreement for chief executive officer (incorporated herein by reference to Exhibit 10.1 to the Company’s Form 8-K filed with the Commission on April 14, 2009).
|
|
|
10.19+
|
Form of Change in Control Agreement for named executive officers (incorporated herein by reference to Exhibit 10.2 to the Company’s Form 8-K filed with the Commission on April 14, 2009).
|
|
|
10.20+
|
Amended and Restated Employment Agreement, dated as of April 29, 2008, by and between Camden National Corporation and Robert W. Daigle (incorporated herein by reference to Exhibit 10.1 to the Company’s Form 8-K filed with the Commission on May 1, 2008).
|
|
|
10.21+
|
Camden National Corporation 2011-2013 Long-Term Performance Share Plan (incorporated herein by reference to Exhibit 10.17 to the Company’s Form 8-K filed with the Commission on March 30, 2011).
|
|
|
10.22+
|
Camden National Corporation 2012-2014 Long-Term Performance Plan (incorporated herein by reference to Exhibit 10.17 to the Company’s Form 8-K filed with the Commission on March 27, 2012).
|
|
|
10.23+
|
Camden National Corporation 2013-2015 Amended and Restated Long-Term Performance Share Plan (incorporated herein by reference to Exhibit 10.23 to the Company's Form 8-K filed with the Commission on March 26, 2013).
|
|
|
11.1
|
Statement regarding computation of per share earnings (incorporated herein by reference to Note 13 to the Notes to Consolidated Financial Statements in this report.)
|
|
|
14
|
Camden National Corporation Code of Business Conduct and Ethics (incorporated herein by reference to Exhibit 14 to the Company’s Form 10-K filed with the Commission on March 2, 2011).
|
|
|
21*
|
Subsidiaries of the Company.
|
|
|
23*
|
Consent of Berry Dunn McNeil & Parker, LLC.
|
|
105
|
Exhibit
No.
|
Definition
|
|
|
31.1*
|
Certification of President and Chief Executive Officer required by Section 302 of the Sarbanes- Oxley Act of 2002.
|
|
|
31.2*
|
Certification of Principal Financial and Accounting Officer required by Section 302 of the Sarbanes-Oxley Act of 2002.
|
|
|
32.1**
|
Certification of Chief Executive Officer pursuant to 18 U.S.C. Section 1350, as required by Section 906 of the Sarbanes-Oxley Act of 2002.
|
|
|
32.2**
|
Certification of Principal Financial and Accounting Officer pursuant to 18 U.S.C. Section 1350, as required by Section 906 of the Sarbanes-Oxley Act of 2002.
|
|
|
101***
|
The following materials from the Company’s Annual Report on Form 10-K for the year ended December 31, 2013 formatted in XBRL (eXtensible Business Reporting Language): (i) the Consolidated Balance Sheets, (ii) the Consolidated Statements of Operations, (iii) the Consolidated Statements of Stockholders’ Equity, (iv) the Consolidated Statements of Comprehensive Income (v) the Consolidated Statements of Cash Flows, and (vi) related notes to these financial statements.
|
|
|
*
|
Filed herewith
|
|
**
|
Furnished herewith
|
|
***
|
Pursuant to Rule 406T of Regulation S-T, the XBRL-related information in Exhibit 101 to this Annual Report on Form 10-K is furnished and not filed for purposes of Sections 11 and 12 of the Securities Act of 1933 and Section 18 of the Securities Exchange Act of 1934.
|
|
+
|
Management contract or a compensatory plan or arrangement.
|
106
SIGNATURES
Pursuant to the requirement of Section 13 or 15(d) of the Securities Exchange Act of 1934, the Registrant has duly caused this report to be signed on its behalf by the undersigned, thereunto duly authorized.
|
Date: March 12, 2014
|
|
CAMDEN NATIONAL CORPORATION
/s/ Gregory A. Dufour
Gregory A. Dufour
President and Chief Executive Officer
|
Pursuant to the requirements of the Securities Exchange Act of 1934, this report has been signed below by the persons on behalf of the Registrant and in the capacities and on the dates indicated.
|
Name
|
|
Position
|
|
Date
|
|
/s/ Gregory A. Dufour
|
President, Director and Chief Executive Officer
|
March 12, 2014
|
||
|
Gregory A. Dufour
|
|
|
||
|
/s/ Deborah A. Jordan
|
Chief Financial Officer and Principal Financial and Accounting Officer
|
March 12, 2014
|
||
|
Deborah A. Jordan
|
|
|
||
|
/s/ Karen W. Stanley
|
|
Chairman and Director
|
|
March 12, 2014
|
|
Karen W. Stanley
|
||||
|
/s/ Ann W. Bresnahan
|
|
Director
|
|
March 12, 2014
|
|
Ann W. Bresnahan
|
||||
|
/s/ Robert J. Campbell
|
|
Director
|
|
March 12, 2014
|
|
Robert J. Campbell
|
||||
|
/s/ David C. Flanagan
|
|
Director
|
|
March 12, 2014
|
|
David C. Flanagan
|
||||
|
/s/ Craig S. Gunderson
|
|
Director
|
|
March 12, 2014
|
|
Craig S. Gunderson
|
||||
|
/s/ John W. Holmes
|
|
Director
|
|
March 12, 2014
|
|
John W. Holmes
|
||||
|
/s/ James H. Page
|
|
Director
|
|
March 12, 2014
|
|
James H. Page
|
||||
|
/s/ John M. Rohman
|
|
Director
|
|
March 12, 2014
|
|
James M. Rohman
|
||||
|
/s/ Robin A. Sawyer
|
|
Director
|
|
March 12, 2014
|
|
Robin A. Sawyer
|
||||
107
Exhibit Index
|
Exhibit
No.
|
Definition
|
|
|
2.1
|
Purchase and Assumption Agreement, dated April 23, 2012, by and between Bank of America, National Association and Camden National Bank (incorporated herein by reference to Exhibit 2.1 to the Company’s Form 8-K filed with the Commission on April 24, 2012).
|
|
|
3.1
|
Articles of Incorporation of Camden National Corporation, as amended (incorporated herein by reference to Exhibit 3.i.1 to the Company’s Form 10-K filed with the Commission on March 2, 2011).
|
|
|
3.2*
|
Amended and Restated Bylaws of Camden National Corporation.
|
|
|
10.1+
|
Camden National Corporation 2003 Stock Option and Incentive Plan (incorporated by reference to Exhibit 10.1 to the Company’s Form 10-Q filed with the Commission on August 8, 2008).
|
|
|
10.2+
|
Form of Incentive Stock Option Agreement under the Camden National Corporation 2003 Stock Option and Incentive Plan (incorporated herein by reference to Exhibit 10.4 to the Company’s Form 10-K filed with the Commission on March 2, 2011).
|
|
|
10.3+
|
Form of Restricted Stock Award Agreement under the Camden National Corporation 2003 Stock Option and Incentive Plan (incorporated herein by reference to Exhibit 10.5 to the Company’s Form 10-K filed with the Commission on March 2, 2011).
|
|
|
10.4+
|
Camden National Corporation Management Stock Purchase Plan under the Camden National Corporation 2003 Stock Option and Incentive Plan (incorporated herein by reference to Exhibit 10.3 to the Company’s Form 8-K filed with the Commission on May 1, 2008).
|
|
|
10.5+
|
Camden National Corporation 2012 Equity and Incentive Plan (incorporated herein by reference to Exhibit 10.1 to the Company’s Form 8-K filed with the Commission on May 8, 2012).
|
|
|
10.6+
|
Form of Incentive Stock Option Agreement under the Camden National Corporation 2012 Equity and Incentive Plan (incorporated herein by reference to Exhibit 10.6 to the Company's Form 10-K filed with the Commission on February 28, 2013).
|
|
|
10.7+
|
Form of Restricted Stock Award Agreement under the Camden National Corporation 2012 Equity and Incentive Plan (incorporated herein by reference to Exhibit 10.7 to the Company's Form 10-K filed with the Commission on February 28, 2013).
|
|
|
10.8+
|
Camden National Corporation Management Stock Purchase Plan under the Camden National Corporation 2012 Equity and Incentive Plan (incorporated herein by reference to Exhibit 10.8 to the Company's Form 10-K filed with the Commission on February 28, 2013).
|
|
|
10.9+
|
Camden National Corporation Amended and Restated Defined Contribution Retirement Plan (incorporated herein by reference to Exhibit 99.1 to the Company’s Form 8-K filed with the Commission on February 4, 2008).
|
|
|
10.10+
|
Supplemental Executive Retirement Program (incorporated herein by reference to Exhibit 99.1 to the Company’s Form 8-K filed with the Commission on February 4, 2008).
|
|
|
10.11+
|
Union Trust Company’s Amended and Restated Deferred Compensation Agreement (incorporated herein by reference to Exhibit 10.1 to the Company’s Form 10-Q filed with the Commission on May 12, 2008).
|
|
|
10.12+
|
Camden National Corporation Executive Deferred Compensation Plan (incorporated herein by reference to Exhibit 10.9 to the Company’s Form 10-K filed with the Commission on March 17, 2008).
|
|
|
10.13+
|
Amendment to Executive Deferred Compensation Plan, dated as of February 26, 2013 (incorporated herein by reference to Exhibit 10.13 to the Company's Form 10-K filed with the Commission on February 28, 2013).
|
|
|
10.14+
|
Amendment and Restatement of Camden National Corporation Director Deferred Compensation Plan (incorporated herein by reference to Exhibit 10.4 to the Company’s Form 10-K filed with the Commission on March 9, 2007).
|
|
|
10.15+
|
2007 Amendment to the Camden National Corporation Director Deferred Compensation Plan (incorporated by reference to Exhibit 10.10 to the Company’s Form 10-K filed with the Commission on March 17, 2008).
|
|
|
Exhibit
No.
|
Definition
|
|
|
10.16
|
Camden National Corporation Audit Committee Complaint Procedures (incorporated herein by reference to Exhibit 10.12 to the Company’s Form 10-K filed with the Commission on March 2, 2011).
|
|
|
10.17+
|
2010 Executive Incentive Compensation Program (incorporated herein by reference to Exhibit 10.19 to the Company’s Form 10-K filed with the Commission on March 12, 2010).
|
|
|
10.18+
|
Form of Change in Control Agreement for chief executive officer (incorporated herein by reference to Exhibit 10.1 to the Company’s Form 8-K filed with the Commission on April 14, 2009).
|
|
|
10.19+
|
Form of Change in Control Agreement for named executive officers (incorporated herein by reference to Exhibit 10.2 to the Company’s Form 8-K filed with the Commission on April 14, 2009).
|
|
|
10.20+
|
Amended and Restated Employment Agreement, dated as of April 29, 2008, by and between Camden National Corporation and Robert W. Daigle (incorporated herein by reference to Exhibit 10.1 to the Company’s Form 8-K filed with the Commission on May 1, 2008).
|
|
|
10.21+
|
Camden National Corporation 2011-2013 Long-Term Performance Share Plan (incorporated herein by reference to Exhibit 10.17 to the Company’s Form 8-K filed with the Commission on March 30, 2011).
|
|
|
10.22+
|
Camden National Corporation 2012-2014 Long-Term Performance Plan (incorporated herein by reference to Exhibit 10.17 to the Company’s Form 8-K filed with the Commission on March 27, 2012).
|
|
|
10.23+
|
Camden National Corporation 2013-2015 Amended and Restated Long-Term Performance Share Plan (incorporated herein by reference to Exhibit 10.23 to the Company's Form 8-K filed with the Commission on March 26, 2013).
|
|
|
11.1
|
Statement regarding computation of per share earnings (incorporated herein by reference to Note 13 to the Notes to Consolidated Financial Statements in this report.)
|
|
|
14
|
Camden National Corporation Code of Business Conduct and Ethics (incorporated herein by reference to Exhibit 14 to the Company’s Form 10-K filed with the Commission on March 2, 2011).
|
|
|
21*
|
Subsidiaries of the Company.
|
|
|
23*
|
Consent of Berry Dunn McNeil & Parker, LLC.
|
|
|
31.1*
|
Certification of President and Chief Executive Officer required by Section 302 of the Sarbanes- Oxley Act of 2002.
|
|
|
31.2*
|
Certification of Principal Financial and Accounting Officer required by Section 302 of the Sarbanes-Oxley Act of 2002.
|
|
|
32.1**
|
Certification of Chief Executive Officer pursuant to 18 U.S.C. Section 1350, as required by Section 906 of the Sarbanes-Oxley Act of 2002.
|
|
|
32.2**
|
Certification of Principal Financial and Accounting Officer pursuant to 18 U.S.C. Section 1350, as required by Section 906 of the Sarbanes-Oxley Act of 2002.
|
|
|
101***
|
The following materials from the Company’s Annual Report on Form 10-K for the year ended December 31, 2013 formatted in XBRL (eXtensible Business Reporting Language): (i) the Consolidated Balance Sheets, (ii) the Consolidated Statements of Operations, (iii) the Consolidated Statements of Stockholders’ Equity, (iv) the Consolidated Statements of Comprehensive Income (v) the Consolidated Statements of Cash Flows, and (vi) related notes to these financial statements.
|
|
|
*
|
Filed herewith
|
|
**
|
Furnished herewith
|
|
***
|
Pursuant to Rule 406T of Regulation S-T, the XBRL-related information in Exhibit 101 to this Annual Report on Form 10-K is furnished and not filed for purposes of Sections 11 and 12 of the Securities Act of 1933 and Section 18 of the Securities Exchange Act of 1934.
|
|
+
|
Management contract or a compensatory plan or arrangement.
|
TABLE OF CONTENTS
Part IItem 1. BusinessItem 1A. Risk FactorsItem 1B. Unresolved Staff CommentsItem 2. PropertiesItem 3. Legal ProceedingsItem 4. Mine Safety DisclosuresPart IIItem 5. Market For Registrant S Common Equity, Related Stockholder Matters and Issuer Purchases Of Equity SecuritiesItem 6. Selected Financial DataItem 7. Management S Discussion and Analysis Of Financial Condition and Results Of OperationsItem 7A. Quantitative and Qualitative Disclosures About Market RiskItem 8. Financial Statements and Supplementary DataItem 9. Changes in and Disagreements with Accountants on Accounting and Financial DisclosureItem 9A. Controls and ProceduresItem 9B. Other InformationPart IIIItem 10. Directors, Executive Officers and Corporate GovernanceItem 11. Executive CompensationItem 12. Security Ownership Of Certain Beneficial Owners and Management and Related Stockholder MattersItem 13. Certain Relationships, Related Transactions and Director IndependenceItem 14. Principal Accounting Fees and ServicesPart IVItem 15. Exhibits and Financial Statement Schedules