CAMDEN NATIONAL CORP
10-Ks and 10-Qs
|
|
|
|
|
|
|
|
|
|
|
|
|
|
|
|
|
|
|
|
|
|
|
|
|
|
|
|
|
|
|
|
|
|
|
|
|
|
|
|
|
|
|
|
|
|
|
|
|
|
|
|
|
|
|
|
|
|
|
UNITED STATES
SECURITIES AND EXCHANGE COMMISSION
Washington, D.C. 20549
FORM 10-K
|
x
|
ANNUAL REPORT PURSUANT TO SECTION 13 OR 15(d)
OF THE SECURITIES EXCHANGE ACT OF 1934
|
|
For the Fiscal Year Ended December 31, 2016
|
o
|
TRANSITION REPORT PURSUANT TO SECTION 13 OR 15(d)
OF THE SECURITIES EXCHANGE ACT OF 1934
|
|
Commission File No. 0-28190
CAMDEN NATIONAL CORPORATION
(Exact Name of Registrant As Specified in Its Charter)
|
Maine
|
|
01-0413282
|
|
(State or Other Jurisdiction of
Incorporation or Organization)
|
|
(I.R.S. Employer
Identification No.)
|
|
2 Elm Street, Camden, ME
|
04843
|
|
|
(Address of Principal Executive Offices)
|
(Zip Code)
|
|
Registrant’s Telephone Number, Including Area Code:
(207) 236-8821
Securities registered pursuant to Section 12(b) of the Act:
|
Title of Each Class
|
Name of Exchange on Which Registered
|
|
|
Common Stock, without par value
|
The NASDAQ Stock Market LLC
|
|
Securities registered pursuant to Section 12(g) of the Act:
None
Indicate by check mark if the registrant is a well-known seasoned issuer, as defined in Rule 405 of the Securities Act. Yes
o
No
x
Indicate by check mark if the registrant is not required to file reports pursuant to Section 13 or Section 15(d) of the Act. Yes
o
No
x
Indicate by check mark whether the registrant (1) has filed all reports required to be filed by Section 13 or 15(d) of the Securities Exchange Act of 1934 during the preceding 12 months (or for such shorter periods that the registrant was required to file such reports), and (2) has been subject to such filing requirements for the past 90 days. Yes
x
No
o
Indicate by check mark whether the registrant has submitted electronically and posted on its corporate Website, if any, every Interactive Data File required to be submitted and posted pursuant to Rule 405 of Regulation S-T during the preceding 12 months (or for such shorter period that the registrant was required to submit and post such files). Yes
x
No
o
Indicate by check mark if disclosure of delinquent filers pursuant to Item 405 of Regulation S-K is not contained herein, and will not be contained, to the best of registrant’s knowledge, in definitive proxy or information statements incorporated by reference in Part III of this Form 10-K or any amendment to this Form 10-K.
o
Indicate by check mark whether the registrant is a large accelerated filer, an accelerated filer, a non-accelerated filer or a smaller reporting company. See definitions of “large accelerated filer,” “accelerated filer” and “smaller reporting company” in Rule 12b-2 of the Exchange Act. (Check one):
|
Large accelerated filer
o
|
|
Accelerated filer
x
|
|
Non-accelerated filer
o
|
|
Smaller reporting company
o
|
|
|
|
|
|
(Do not check if a smaller reporting company)
|
|
|
Indicate by check mark whether the registrant is a shell company (as defined in Rule 12b-2 of the Exchange Act). Yes
o
No
x
The aggregate market value of the voting and non-voting common equity held by non-affiliates computed by reference to the price at which the common equity was last sold, or the average bid and asked price of such common equity, as of the last business day of the Registrant’s most recently completed second fiscal quarter: $316,376,401. Shares of the Registrant’s common stock held by each executive officer, director and person who beneficially own 5% or more of the Registrant’s outstanding common stock have been excluded, in that such persons may be deemed to be affiliates. This determination of affiliate status is not necessarily a conclusive determination for other purposes.
The number of shares outstanding of each of the registrant’s classes of common stock as of March 1, 2017 was 15,493,927.
Certain information required in response to Items 10, 11, 12, 13 and 14 of Part III of this Form 10-K is incorporated by reference from Camden National Corporation’s Definitive Proxy Statement for the 2017 Annual Meeting of Shareholders pursuant to Regulation 14A of the General Rules and Regulations of the Commission.
CAMDEN NATIONAL CORPORATION
2016 FORM 10-K ANNUAL REPORT
TABLE OF CONTENTS
|
Page
|
||
|
PART I
|
||
|
PART II
|
||
|
PART III
|
||
|
PART IV
|
||
i
FORWARD-LOOKING STATEMENTS
The discussions set forth below and in the documents we incorporate by reference herein contain certain statements that may be considered forward-looking statements under the Private Securities Litigation Reform Act of 1995, including certain plans, exceptions, goals, projections, and statements, which are subject to numerous risks, assumptions, and uncertainties. Forward-looking statements can be identified by the use of the words “believe,” “expect,” “anticipate,” “intend,” “estimate,” “assume,” “plan,” “target,” or “goal” or future or conditional verbs such as “will,” “may,” “might,” “should,” “could” and other expressions which predict or indicate future events or trends and which do not relate to historical matters. Forward-looking statements should not be relied on, because they involve known and unknown risks, uncertainties and other factors, some of which are beyond the control of the Company. These risks, uncertainties and other factors may cause the actual results, performance or achievements of the Company to be materially different from the anticipated future results, performance or achievements expressed or implied by the forward-looking statements.
The following factors, among others, could cause the Company’s financial performance to differ materially from the Company’s goals, plans, objectives, intentions, expectations and other forward-looking statements:
|
•
|
weakness in the United States economy in general and the regional and local economies within the New England region and Maine, which could result in a deterioration of credit quality, an increase in the allowance for loan losses or a reduced demand for the Company’s credit or fee-based products and services;
|
|
•
|
changes in trade, monetary, and fiscal policies and laws, including interest rate policies of the Board of Governors of the Federal Reserve System;
|
|
•
|
inflation, interest rate, market, and monetary fluctuations;
|
|
•
|
competitive pressures, including continued industry consolidation and the increased financial services provided by non-banks;
|
|
•
|
volatility in the securities markets that could adversely affect the value or credit quality of the Company’s assets, impairment of goodwill, the availability and terms of funding necessary to meet the Company’s liquidity needs, and could lead to impairment in the value of securities in the Company's investment portfolio;
|
|
•
|
changes in information technology that require increased capital spending;
|
|
•
|
changes in consumer spending and savings habits;
|
|
•
|
changes in tax, banking, securities and insurance laws and regulations; and
|
|
•
|
changes in accounting policies, practices and standards, as may be adopted by the regulatory agencies as well as the Financial Accounting Standards Board ("FASB"), and other accounting standard setters.
|
You should carefully review all of these factors, and be aware that there may be other factors that could cause differences, including the risk factors listed in Part I, Item 1A, “Risk Factors,” beginning on page
11
. Readers should carefully review the risk factors described therein and should not place undue reliance on our forward-looking statements.
These forward-looking statements were based on information, plans and estimates at the date of this report, and we do not promise to update any forward-looking statements to reflect changes in underlying assumptions or factors, new information, future events or other changes.
1
Overview
.
Camden National Corporation (hereafter referred to as “we,” “our,” “us,” or the “Company”) is a publicly-held bank holding company, with $3.9 billion in assets, 61 banking centers, 84 ATMs, and three lending offices at December 31, 2016, incorporated under the laws of the State of Maine and headquartered in Camden, Maine. The Company, as a diversified financial services provider, pursues the objective of achieving long-term sustainable growth by balancing growth opportunities against profit, while mitigating risks inherent in the financial services industry. The primary business of the Company and its subsidiary, Camden National Bank (the "Bank"), is to attract deposits from, and to extend loans to, consumer, institutional, municipal, non-profit and commercial customers. The Company, through the Bank, offers commercial and consumer banking products and services, and through Camden Financial Consultants and Camden National Wealth Management, divisions of the Bank, brokerage and insurance services as well as investment management and fiduciary services.
The Company acquired SBM Financial, Inc. ("SBM"), the parent company of The Bank of Maine, on October 16, 2015. Healthcare Professional Funding Corporation ("HPFC"), a wholly-owned subsidiary of The Bank of Maine, became a wholly-owned subsidiary of the Bank. Effective February 19, 2016, the Company ceased ongoing operations of HPFC and it is no longer originating loans. The Company will continue to earn revenues from HPFC's loan portfolio as it naturally runs off.
The consolidated financial statements of the Company accompanying this Form 10-K include the accounts of the Company, the Bank and its subsidiaries and divisions. All inter-company accounts and transactions have been eliminated in consolidation.
The Company is committed to the philosophy of serving the financial needs of customers in local communities, as described in its core purpose:
Through each interaction, we will enrich the lives of people, help businesses succeed and vitalize communities.
The Company has achieved a five-year compounded annual asset growth rate of 11%, resulting in $3.9 billion in total assets at December 31, 2016. The following is a chronological timeline of significant events and factors contributing to the Company's asset growth over the past five years:
|
•
|
2012 —
The acquisition of 14 branches, including $287.6 million in deposits and $5.7 million in small business loans, from Bank of America, National Association, in October 2012.
|
|
•
|
2013 —
The divestiture of our five Franklin County branches, including $46.0 million in loans and $85.9 million in deposits and borrowings, in October 2013.
|
|
•
|
2014 —
The Company had $192.2 million of organic loan growth, primarily within the commercial real estate and commercial loan portfolios. Also, in 2014, we expanded our franchise outside of Maine by opening a commercial loan office in Manchester, New Hampshire, providing us with a wider reach across northern New England.
|
|
•
|
2015 —
The Company achieved organic asset growth of $80.0 million, fueled by organic loan growth of $102.4 million. The Company completed the acquisition of SBM on October 16, 2015. SBM was approximately one-third the size of the Company pre-acquisition with total assets of $840.1 million, total loans of $615.2 million and total deposits of $687.0 million. The acquisition provided the Company with an expanded presence in Southern and Central Maine, significant low cost deposits, and strengthened its mortgage banking platform, including two additional lending offices in Falmouth, Maine and Braintree, Massachusetts.
|
|
•
|
2016 —
The Company had $104.4 million of organic loan growth, primarily within the commercial real estate and commercial loan portfolios. In 2016, the Company originated approximately $370.0 million of residential mortgages and sold approximately 65% of its production. This resulted in gains from loan sales of $6.2 million, compared to $1.3 million for 2015.
|
The financial services industry continues to experience consolidations through mergers that could create opportunities for the Company to promote its value proposition to customers. The Company evaluates the possibility of expansion into new markets through both de novo expansion and acquisitions. In addition, the Company is focused on maximizing the potential for growth in existing markets, especially in markets where the Company has less of a presence. Further details on the Company's financial information can be found within the consolidated financial statements within Item 8 of this report.
2
Camden National Bank
.
The Bank is a national banking association chartered under the laws of the United States headquartered in Camden, Maine. Originally founded in 1875, the Bank became a direct, wholly-owned subsidiary of the Company as a result of a corporate reorganization in 1984. The Bank offers its products and services across Maine, and focuses primarily on attracting deposits from the general public through its branches, and then leveraging this relationship to originate residential mortgage loans, commercial business loans, commercial real estate loans and a variety of consumer loans across New England. The Company has locations within 13 of Maine's 16 counties. Customers may also access the Bank’s products and services using other channels, including online at
www.CamdenNational.com.
Camden Financial Consultants
.
Camden Financial Consultants is a full-service brokerage and insurance division of the Bank in the business of helping clients meet all of their financial needs by using a total wealth management approach. Its financial offerings include college, retirement, and estate planning, mutual funds, strategic asset management accounts, and variable and fixed annuities.
Camden National Wealth Management.
Effective as of close of business November 30, 2016, the Company's wholly-owned subsidiary, Acadia Trust, N.A., merged into the Bank, and was rebranded as Camden National Wealth Management. Prior to the merger, Acadia Trust, N.A. was a limited purpose national banking association chartered under the laws of the U.S. headquartered in Portland, Maine. Now operating as Camden National Wealth Management, a division of the Bank, it continues to provide a broad range of trust, trust-related, investment and wealth management services to both individual and institutional clients. The financial services provided by Camden National Wealth Management complement the services provided by the Bank by offering high net worth individuals, businesses and non-profit institutional customers investment management services, as well as serving as trustee.
Healthcare Professional Funding Corporation.
HPFC is a wholly-owned subsidiary of the Bank and, prior to the closing of ongoing operations on February 19, 2016, it provided specialized lending to dentists, optometrists and veterinarians across the U.S. HPFC was acquired in connection with the acquisition of SBM. HPFC's website address is
www.healthprofunding.com
.
The Company’s Investor Relations information can be obtained through the Bank’s internet address,
www.CamdenNational.com
. The Company makes available on or through its Investor Relations page, without charge, its annual reports on Form 10-K, quarterly reports on Form 10-Q, and current reports on Form 8-K and amendments to those reports filed or furnished pursuant to Section 13(a) or 15(d) of the Securities Exchange Act of 1934, as amended, as soon as reasonably practicable after such reports are electronically filed with, or furnished to, the SEC. The Company’s reports filed with, or furnished to, the SEC are also available at the SEC’s website at
www.sec.gov
. In addition, the Company makes available, free of charge, its press releases and Code of Ethics through the Company’s Investor Relations page. Information on our website is not incorporated by reference into this document and should not be considered part of this report.
Competition
.
Through the Bank and its subsidiaries and division of, the Company competes throughout Maine, New Hampshire and Massachusetts. Our primary markets within Maine run along Maine's coast — from Calais to Kittery — and mid-interior (along Interstate 95) through Bangor, Maine. We operate and manage the Bank's business within Maine's various regions, including Mid Coast, Southern, Central, Bangor and Downeast. Many of these markets that we operate in are characterized as rural areas. Major competitors in the Company’s primary market area include local branches of large regional and national banking organizations and brokerage houses, as well as local independent banks, financial advisors, thrift institutions and credit unions. Other competitors for deposits and loans within the Bank’s primary market area include insurance companies, money market funds, consumer finance companies and financing affiliates of consumer durable goods manufacturers.
The Company and the Bank generally have effectively competed with other financial institutions by emphasizing customer service, which is branded as the Camden National Experience, highlighted by local decision-making, establishing long-term customer relationships, building customer loyalty and providing products and services designed to meet the needs of customers. The Company, through Camden National Wealth Management and Camden Financial Consultants, competes for trust, trust-related, investment management, individual retirement, foundation and endowment management services and brokerage services with local banks and non-banks, which may now, or in the future, offer a similar range of services, as well as with a number of brokerage firms and investment advisors with offices in the Company’s market area. In addition, most of these services are widely available to the Company’s customers by telephone and over the internet through firms located outside the Company’s market area.
Employees
.
The Company employed 631 people on a full- or part-time basis as of
December 31, 2016
through the Bank, and its divisions.
3
Supervision and Regulation
The following discussion addresses elements of the regulatory framework applicable to bank holding companies and their subsidiaries. This regulatory framework is intended primarily for the protection of the safety and soundness of depository institutions, the federal deposit insurance system, and depositors, rather than the protection of shareholders of a bank holding company such as the Company.
As a bank holding company, the Company is subject to regulation, supervision and examination by the Board of Governors of the Federal Reserve System (the “FRB”) under the Bank Holding Company Act of 1956, as amended (the “BHCA”). The Bank is subject to regulation, supervision and examination by the Office of the Comptroller of the Currency (the “OCC”).
The following is a summary of certain aspects of various statutes and regulations applicable to the Company and its direct and indirect subsidiaries. This summary is not a comprehensive analysis of all applicable law, however, and you should refer to the applicable statutes and regulations for more information.
Regulation of the Company
The Company is subject to regulation, supervision and examination by the FRB, which has the authority, among other things, to order bank holding companies to cease and desist from unsafe or unsound banking practices; to assess civil money penalties; and to order termination of non-banking activities or termination of ownership and control of a non-banking subsidiary by a bank holding company.
Source of Strength.
Under the BHCA, as amended by the Dodd-Frank Wall Street Reform and Consumer Protection Act (the “Dodd-Frank Act”), the Company is required to serve as a source of financial strength for the Bank. This support may be required at times when the bank holding company may not have the resources to provide support to the Bank. In the event of a bank holding company’s bankruptcy, any commitment by the bank holding company to a federal bank regulatory agency to maintain the capital of a bank subsidiary will be assumed by the bankruptcy trustee and entitled to a priority of payment.
Acquisitions and Activities.
The BHCA prohibits a bank holding company, without prior approval of the FRB, from acquiring all or substantially all the assets of a bank, acquiring control of a bank, merging or consolidating with another bank holding company, or acquiring direct or indirect ownership or control of any voting shares of another bank or bank holding company if, after such acquisition, the acquiring bank holding company would control more than 5% of any class of the voting shares of such other bank or bank holding company. The BHCA also prohibits a bank holding company from engaging directly or indirectly in activities other than those of banking, managing or controlling banks or furnishing services to its subsidiary banks. However, a bank holding company may engage in and may own shares of companies engaged in certain activities that the FRB has determined to be closely related to banking or managing and controlling banks.
Limitations on Acquisitions of Company Common Stock.
The Change in Bank Control Act prohibits a person or group of persons from acquiring “control” of a bank holding company unless the FRB has been notified and has not objected to the transaction. Under a rebuttable presumption established by the FRB, the acquisition of 10% or more of a class of voting securities of a bank holding company with a class of securities registered under Section 12 of the Exchange Act would constitute the acquisition of control of a bank holding company. In addition, the BHCA prohibits any company from acquiring control of a bank or bank holding company without first having obtained the approval of the FRB. Among other circumstances, under the BHCA, a company has control of a bank or bank holding company if the company owns, controls or holds with power to vote 25% or more of a class of voting securities of the bank or bank holding company, controls in any manner the election of a majority of directors or trustees of the bank or bank holding company, or the FRB has determined, after notice and opportunity for hearing, that the company has the power to exercise a controlling influence over the management or policies of the bank or bank holding company.
Regulation of the Bank
The Bank is subject to regulation, supervision, and examination by the OCC. Additionally, the Federal Deposit Insurance Corporation (the “FDIC”) has secondary supervisory authority as the insurer of the Bank’s deposits. Pursuant to the Dodd-Frank Act, the FRB may directly examine the subsidiaries of the Company, including the Bank. The enforcement powers available to the federal banking regulators include, among other things, the ability to issue cease and desist or removal orders; to terminate insurance of deposits; to assess civil money penalties; to issue directives to increase capital; to place the Bank into receivership; and to initiate injunctive actions against banking organizations and institution-affiliated parties.
4
Deposit Insurance.
The deposit obligations of the Bank are insured up to applicable limits by the FDIC’s Deposit Insurance Fund (“DIF”) and are subject to deposit insurance assessments to maintain the DIF. The Dodd-Frank Act permanently increased the FDIC deposit insurance limit to $250,000 per depositor for deposits maintained in the same right and capacity at a particular insured depository institution. The Federal Deposit Insurance Act (the “FDIA”), as amended by the Federal Deposit Insurance Reform Act and the Dodd-Frank Act, requires the FDIC to take steps as may be necessary to cause the ratio of deposit insurance reserves to estimated insured deposits — the designated reserve ratio — to reach 1.35% by September 30, 2020, and it mandates that the reserve ratio designated by the FDIC for any year may not be less than 1.35%. Further, the Dodd-Frank Act required that, in setting assessments, the FDIC offset the effect of the increase in the minimum reserve ratio from 1.15% to 1.35% on banks with less than $10 billion in assets.
To satisfy these requirements, on March 15, 2016, the FDIC’s Board of Directors approved a final rule to increase the DIF’s reserve ratio to the statutorily required minimum ratio of 1.35% of estimated insured deposits. The final rule imposes on large banks a surcharge of 4.5 basis points of their assessment base, after making certain adjustments. Large banks will pay quarterly surcharges in addition to their regular risk-based assessments. Overall regular risk-based assessment rates will decline once the reserve ratio reaches 1.15%. Small banks, such as the Bank, will receive credits to offset the portion of their assessments that help to raise the reserve ratio from 1.15% to 1.35%. After the reserve ratio reaches 1.38%, the FDIC will automatically apply a small bank’s credits to reduce its regular assessment up to the entire amount of the assessment. The final rule provided that these changes would become effective July 1, 2016 if the reserve ratio reached 1.15% prior to that date. On June 30, 2016, the reserve ratio rose to 1.17%, which resulted in the revised deposit insurance assessment pricing becoming effective on July 1, 2016.
Deposit premiums are based on assets. To determine its deposit insurance premium, the Bank computes the base amount of its average consolidated assets less its average tangible equity (defined as the amount of Tier 1 capital) and the applicable assessment rate. On April 26, 2016, the FDIC’s Board of Directors adopted a final rule that changed the manner in which deposit insurance assessment rates are calculated for established small banks, generally those banks with less than $10 billion of assets that have been insured for at least five years. The rule updated the data and methodology that the FDIC uses to determine risk-based assessment rates for these institutions with the intent of better reflecting risks and ensuring that banks that take on greater risks pay more for deposit insurance than their less risky counterparts. The rule revised the financial ratios method used to determine assessment rates for these banks so that it is based on a statistical model that estimates the probability of failure over three years. The rule eliminated risk categories for established small banks and uses the financial ratios method. Under this method each of seven financial ratios and a weighted average of CAMELS component ratings will be multiplied by a corresponding pricing multiplier. The sum of these products will be added to a uniform amount, with the resulting sum being an institution’s initial base assessment rate (subject to minimum or maximum assessment rates based on a bank’s CAMELS composite rating). This method takes into account various measures that are similar to the factors that the FDIC previously considered in assigning institutions to risk categories, including an institution’s leverage ratio, brokered deposit ratio, one year asset growth, the ratio of net income before taxes to total assets and considerations related to asset quality. Under the small bank pricing rule, beginning the first assessment period after June 30, 2016, where the DIF’s reserve ratio has reached 1.15%, assessments for established small banks with a CAMELS rating of 1 or 2 will range from 1.5 to 16 basis points, after adjustments, while assessment rates for established small banks with a CAMELS composite rating of 4 or 5 may range from 11 to 30 basis points, after adjustments. Assessments for established small banks with a CAMLES rating of 3 will range from 3 to 30 basis points.
The FDIC has the power to adjust deposit insurance assessment rates at any time. In addition, under the FDIA, the FDIC may terminate deposit insurance upon a finding that the institution has engaged in unsafe and unsound practices, is in an unsafe or unsound condition to continue operations, or has violated any applicable law, regulation, rule, order or condition imposed by the FDIC. The Bank’s FDIC insurance expense for the year ended December 31, 2016 was $2.0 million.
Acquisitions and Branching.
The Bank must seek prior regulatory approval from the OCC to acquire another bank or establish a new branch office. Well capitalized and well managed banks may acquire other banks in any state, subject to certain deposit concentration limits and other conditions, pursuant to the Riegle-Neal Interstate Banking and Branching Efficiency Act of 1994, as amended by the Dodd-Frank Act. In addition, the Dodd-Frank Act authorizes a state-chartered bank, such as the Bank, to establish new branches on an interstate basis to the same extent a bank chartered by the host state may establish branches.
Activities and Investments of National Banking Associations.
National banking associations must comply with the National Bank Act and the regulations promulgated thereunder by the OCC, which limit the activities of national banking associations to those that are deemed to be part of, or incidental to, the “business of banking.” Activities that are part of, or incidental to, the business of banking include taking deposits, borrowing and lending money and discounting or negotiating promissory notes, drafts, bills of exchange, and other evidences of debt. Subsidiaries of national banking associations generally may only engage
5
in activities permissible for the parent national bank. The Dodd-Frank Act bars the Bank from engaging in proprietary trading and from sponsoring and investing in hedge funds and private equity funds, except as permitted under certain limited circumstances.
Lending Restrictions.
Federal law limits a bank’s authority to extend credit to its directors, executive officers and 10% shareholders, as well as to entities controlled by such persons. Among other things, extensions of credit to insiders are required to be made on terms that are substantially the same as, and follow credit underwriting procedures that are not less stringent than, those prevailing for comparable transactions with unaffiliated persons. Also, the terms of such extensions of credit may not involve more than the normal risk of repayment or present other unfavorable features and may not exceed certain limitations on the amount of credit extended to such persons, individually and in the aggregate, which limits are based, in part, on the amount of the bank’s capital. The Dodd-Frank Act explicitly provides that an extension of credit to an insider includes credit exposure arising from a derivatives transaction, repurchase agreement, reverse repurchase agreement, securities lending transaction or securities borrowing transaction. Additionally, the Dodd-Frank Act requires that asset sale transactions with insiders must be on market terms, and if the transaction represents more than 10% of the capital and surplus of the Bank, be approved by a majority of the disinterested directors of the Bank.
Brokered Deposits.
Section 29 of the FDIA and FDIC regulations generally limit the ability of an insured depository institution to accept, renew or roll over any brokered deposit unless the institution’s capital category is “well capitalized” or, with the FDIC’s approval, “adequately capitalized.” Depository institutions that have brokered deposits in excess of 10% of total assets will be subject to increased FDIC deposit insurance premium assessments. However, for institutions that are well capitalized and have a CAMELS composite rating of 1 or 2, reciprocal deposits are deducted from brokered deposits.
Community Reinvestment Act
. The Community Reinvestment Act (the “CRA”) requires the OCC to evaluate the Bank’s performance in helping to meet the credit needs of the entire communities it serves, including low and moderate-income neighborhoods, consistent with its safe and sound banking operations, and to take this record into consideration when evaluating certain applications. The FDIC’s CRA regulations are generally based upon objective criteria of the performance of institutions under three key assessment tests: (i) a lending test, to evaluate the institution’s record of making loans in its service areas; (ii) an investment test, to evaluate the institution’s record of investing in community development projects, affordable housing, and programs benefiting low or moderate income individuals and businesses; and (iii) a service test, to evaluate the institution’s delivery of services through its branches, ATMs, and other offices. Failure of an institution to receive at least a “Satisfactory” rating could inhibit the Bank or the Company from undertaking certain activities, including engaging in activities permitted as a financial holding company under the Gramm-Leach-Bliley Act of 1999 (the “GLBA”) and acquisitions of other financial institutions. The Bank currently has an “Outstanding” CRA rating.
Capital Adequacy and Safety and Soundness
Regulatory Capital Requirements.
The FRB and the OCC have issued substantially similar risk-based and leverage capital guidelines applicable to United States banking organizations. These rules are intended to reflect the relationship between the banking organization’s capital and the degree of risk associated with its operations based on transactions recorded on-balance sheet as well as off-balance sheet items. The FRB and the OCC may from time to time require that a banking organization maintain capital above the minimum levels discussed below, due to the banking organization’s financial condition or actual or anticipated growth.
The capital adequacy rules define qualifying capital instruments and specify minimum amounts of capital as a percentage of assets that banking organizations are required to maintain. Common equity Tier I capital generally includes common stock and related surplus, retained earnings and, in certain cases and subject to certain limitations, minority interest in consolidated subsidiaries, less goodwill, other non-qualifying intangible assets and certain other deductions. Tier I capital for banks and bank holding companies generally consists of the sum of common equity Tier I capital, non-cumulative perpetual preferred stock, and related surplus and, in certain cases and subject to limitations, minority interest in consolidated subsidiaries that does not qualify as common equity Tier I capital, less certain deductions. Tier II capital generally consists of hybrid capital instruments, perpetual debt and mandatory convertible debt securities, cumulative perpetual preferred stock, term subordinated debt and intermediate-term preferred stock, and, subject to limitations, allowances for loan losses. The sum of Tier I and Tier II capital less certain required deductions represents qualifying total risk-based capital. Prior to the effectiveness of certain provisions of the Dodd-Frank Act, bank holding companies were permitted to include trust preferred securities and cumulative perpetual preferred stock in Tier I capital, subject to limitations. However, the FRB’s capital rule applicable to bank holding companies permanently grandfathers non-qualifying capital instruments, including trust preferred securities, issued before May 19, 2010 by depository institution holding companies with less than $15 billion in total assets as of December 31, 2009, subject to a limit of 25% of Tier I capital. In addition, under rules that became effective January 1, 2015, accumulated other comprehensive income (positive or negative) must be reflected in Tier I capital; however, the Company was permitted to make a one-time,
6
permanent election to continue to exclude accumulated other comprehensive income from capital. The Company has made this election.
Under the capital rules, risk-based capital ratios are calculated by dividing common equity Tier I, Tier I and total risk-based capital, respectively, by risk-weighted assets. Assets and off-balance sheet credit equivalents are assigned a risk weight based primarily on relative credit risk.
Under the FRB's capital rules applicable to the Company and the OCC's capital rules applicable to the Bank, the Company and the Bank are each required to maintain a minimum common equity Tier I capital to risk-weighted assets ratio of 4.5%, a minimum Tier I capital to risk-weighted assets ratio of 6%, a minimum total capital to risk-weighted assets ratio of 8% and a minimum leverage ratio of 4%. Additionally, subject to a transition schedule, these rules require an institution to establish a capital conservation buffer of common equity Tier I capital in an amount above the minimum risk-based capital requirements for “adequately capitalized” institutions equal to 2.5% of total risk weighted assets, or face restrictions on the ability to pay dividends, pay discretionary bonuses, and to engage in share repurchases.
Under the FRB's rules, a bank holding company, such as the Company, is considered “well capitalized” if the bank holding company (i) has a total risk based capital ratio of at least 10%, (ii) has a Tier I risk-based capital ratio of at least 6%, and (iii) is not subject to any written agreement order, capital directive or prompt corrective action directive to meet and maintain a specific capital level for any capital measure. Under the OCC’s rules, an OCC supervised institution is considered “well capitalized” if it (i) has a total risk-based capital ratio of 10.0% or greater; (ii) a Tier I risk-based capital ratio of 8.0% or greater; (iii) a common Tier I equity ratio of at least 6.5% or greater, (iv) a leverage capital ratio of 5.0% or greater; and (v) is not subject to any written agreement, order, capital directive, or prompt corrective action directive to meet and maintain a specific capital level for any capital measure.
Generally, a bank, upon receiving notice that it is not adequately capitalized (i.e., that it is “undercapitalized”), becomes subject to the prompt corrective action provisions of Section 38 of FDIA that, for example, (i) restrict payment of capital distributions and management fees, (ii) require that is federal bank regulator monitor the condition of the institution and its efforts to restore its capital, (iii) require submission of a capital restoration plan, (iv) restrict the growth of the institution’s assets and (v) require prior regulatory approval of certain expansion proposals. A bank that is required to submit a capital restoration plan must concurrently submit a performance guarantee by each company that controls the bank. A bank that is “critically undercapitalized” (i.e., has a ratio of tangible equity to total assets that is equal to or less than 2.0%) will be subject to further restrictions, and generally will be placed in conservatorship or receivership within 90 days.
Information concerning the Company and the Bank with respect to capital requirements is incorporated by reference
from Item 7. "Management’s Discussion and Analysis of Financial Condition and Results of Operations—Capital
Resources,” and Item 8. "Financial Statements and Supplementary Data", in the section entitled “Note 20, Regulatory Capital
Requirements.”
The Company and the Bank are considered “well capitalized” under all regulatory definitions.
Safety and Soundness Standards.
The FDIA requires the federal bank regulatory agencies to prescribe standards, by regulations or guidelines, relating to internal controls, information systems and internal audit systems, loan documentation, credit underwriting, interest rate risk exposure, asset growth, asset quality, earnings, stock valuation and compensation, fees and benefits, and such other operational and managerial standards as the agencies deem appropriate. Guidelines adopted by the federal bank regulatory agencies establish general standards relating to internal controls and information systems, internal audit systems, loan documentation, credit underwriting, interest rate exposure, asset growth, asset quality, earnings and compensation, fees and benefits. In general, these guidelines require, among other things, appropriate systems and practices to identify and manage the risk and exposures specified in the guidelines. The guidelines prohibit excessive compensation as an unsafe and unsound practice and describe compensation as excessive when the amounts paid are unreasonable or disproportionate to the services performed by an executive officer, employee, director or principal stockholder. In addition, the federal banking agencies adopted regulations that authorize, but do not require, an agency to order an institution that has been given notice by an agency that it is not satisfying any of such safety and soundness standards to submit a compliance plan. If, after being so notified, an institution fails to submit an acceptable compliance plan or fails in any material respect to implement an acceptable compliance plan, the agency must issue an order directing action to correct the deficiency and may issue an order restricting asset growth, requiring an institution to increase its ratio of tangible equity to assets or directing other actions of the types to which an undercapitalized institution is subject under the “prompt corrective action” provisions of the FDIA. See “— Regulatory Capital Requirements” above. If an institution fails to comply with such an order, the agency may seek to enforce such order in judicial proceedings and to impose civil money penalties.
7
Dividend Restrictions
The Company is a legal entity separate and distinct from its subsidiaries. The revenue of the Company (on a parent-only basis) is derived primarily from interest and dividends paid to it by the Bank. The right of the Company, and consequently the right of shareholders of the Company, to participate in any distribution of the assets or earnings of the Bank through the payment of such dividends or otherwise is necessarily subject to the prior claims of creditors of the Bank (including depositors), except to the extent that certain claims of the Company in a creditor capacity may be recognized.
Restrictions on Bank Holding Company Dividends.
The FRB has the authority to prohibit bank holding companies from paying dividends if such payment is deemed to be an unsafe or unsound practice. The FRB has indicated generally that it may be an unsafe or unsound practice for bank holding companies to pay dividends unless the bank holding company’s net income over the preceding year is sufficient to fund the dividends and the expected rate of earnings retention is consistent with the organization’s capital needs, asset quality and overall financial condition. Further, the Company’s ability to pay dividends is restricted if it does not maintain the capital conservation buffer. See “—Capital Adequacy and Safety and Soundness—Regulatory Capital Requirements” above.
Under Maine law, a corporation’s Board of Directors may declare, and the corporation may pay, dividends on its outstanding shares, in cash or other property, generally only out of the corporation’s unreserved and unrestricted earned surplus, or out of the unreserved and unrestricted net earnings of the current fiscal year and the next preceding fiscal year taken as a single period, except under certain circumstances, including when the corporation is insolvent, or when the payment of the dividend would render the corporation insolvent or when the declaration would be contrary to the corporation’s charter.
Restrictions on Bank Dividends
. National banks generally may not declare a dividend in excess of the bank’s undivided profits and, absent OCC approval, if the total amount of dividends declared by the national bank in any calendar year exceeds the total of the national bank’s retained net income of that year to date combined with its retained net income for the preceding two years. National banks also are prohibited from declaring or paying any dividend if, after making the dividend, the national bank would be considered “undercapitalized” (as defined by reference to other OCC regulations). The OCC has the authority to use its enforcement powers to prohibit a national bank, such as the Bank, from paying dividends if, in its opinion, the payment of dividends would constitute an unsafe or unsound practice.
Certain Transactions by Bank Holding Companies with their Affiliates
There are various statutory restrictions on the extent to which bank holding companies and their non-bank subsidiaries may borrow, obtain credit from or otherwise engage in “covered transactions” with their insured depository institution subsidiaries. The Dodd-Frank Act amended the definition of affiliate to include an investment fund for which the depository institution or one of its affiliates is an investment adviser. An insured depository institution (and its subsidiaries) may not lend money to, or engage in covered transactions with, its non-depository institution affiliates if the aggregate amount of covered transactions outstanding involving the bank, plus the proposed transaction exceeds the following limits: (i) in the case of any one such affiliate, the aggregate amount of covered transactions of the insured depository institution and its subsidiaries cannot exceed 10% of the capital stock and surplus of the insured depository institution; and (ii) in the case of all affiliates, the aggregate amount of covered transactions of the insured depository institution and its subsidiaries cannot exceed 20% of the capital stock and surplus of the insured depository institution. For this purpose, “covered transactions” are defined by statute to include a loan or extension of credit to an affiliate, a purchase of or investment in securities issued by an affiliate, a purchase of assets from an affiliate unless exempted by the FRB, the acceptance of securities issued by an affiliate as collateral for a loan or extension of credit to any person or company, the issuance of a guarantee, acceptance or letter of credit on behalf of an affiliate, securities borrowing or lending transactions with an affiliate that creates a credit exposure to such affiliate, or a derivatives transaction with an affiliate that creates a credit exposure to such affiliate. Covered transactions are also subject to certain collateral security requirements. Covered transactions as well as other types of transactions between a bank and a bank holding company must be on market terms and not otherwise unduly favorable to the holding company or an affiliate of the holding company. Moreover, the Bank Holding Company Act Amendments of 1970 provide that, to further competition, a bank holding company and its subsidiaries are prohibited from engaging in certain tying arrangements in connection with any extension of credit, lease or sale of property of any kind, or furnishing of any service.
Consumer Protection Regulation
The Company and the Bank are subject to federal and state laws designed to protect consumers and prohibit unfair or deceptive business practices, including the Equal Credit Opportunity Act, the Fair Housing Act, the Home Ownership Protection Act, the Fair Credit Reporting Act, as amended by the Fair and Accurate Credit Transactions Act of 2003 (the “FACT Act”), the GLBA, the Truth in Lending Act, the CRA, the Home Mortgage Disclosure Act, the Real Estate Settlement
8
Procedures Act, the National Flood Insurance Act and various state law counterparts. These laws and regulations mandate certain disclosure requirements and regulate the manner in which financial institutions must interact with customers when taking deposits, making loans, collecting loans and providing other services. Further, the Dodd-Frank Act established the CFPB, which has the responsibility for making rules and regulations under the federal consumer protection laws relating to financial products and services. The CFPB also has a broad mandate to prohibit unfair, deceptive or abusive acts and practices and is specifically empowered to require certain disclosures to consumers and draft model disclosure forms. Failure to comply with consumer protection laws and regulations can subject financial institutions to enforcement actions, fines and other penalties. The OCC examines the Bank for compliance with CFPB rules and enforces CFPB rules with respect to the Bank.
Mortgage Reform.
The Dodd-Frank Act prescribes certain standards that mortgage lenders must consider before making a residential mortgage loan, including verifying a borrower’s ability to repay such mortgage loan, and allows borrowers to assert violations of certain provisions of the Truth in Lending Act as a defense to foreclosure proceedings. Under the Dodd-Frank Act, prepayment penalties are prohibited for certain mortgage transactions and creditors are prohibited from financing insurance policies in connection with a residential mortgage loan or home equity line of credit. In addition, the Dodd-Frank Act prohibits mortgage originators from receiving compensation based on the terms of residential mortgage loans and generally limits the ability of a mortgage originator to be compensated by others if compensation is received from a consumer. The Dodd-Frank Act requires mortgage lenders to make additional disclosures prior to the extension of credit, in each billing statement and for negative amortization loans and hybrid adjustable rate mortgages.
Privacy and Customer Information Security.
The GLBA requires financial institutions to implement policies and procedures regarding the disclosure of nonpublic personal information about consumers to nonaffiliated third parties. In general, the Bank must provide its customers with an initial and annual disclosure that explains its policies and procedures regarding the disclosure of such nonpublic personal information, and, except as otherwise required or permitted by law, the Bank is prohibited from disclosing such information except as provided in such policies and procedures. However, an annual disclosure is not required to be provided by a financial institution if the financial institution only discloses information under exceptions from GLBA that do not require an opt out to be provided and if there has been no change in its privacy policies and practices since its most recent disclosure provided to consumers. The GLBA also requires that the Bank develop, implement and maintain a comprehensive written information security program designed to ensure the security and confidentiality of customer information (as defined under GLBA), to protect against anticipated threats or hazards to the security or integrity of such information; and to protect against unauthorized access to or use of such information that could result in substantial harm or inconvenience to any customer. The Bank is also required to send a notice to customers whose sensitive information has been compromised if unauthorized use of this information is reasonably possible. Most states, including the states where the Bank operates, have enacted legislation concerning breaches of data security and Congress is considering federal legislation that would require consumer notice of data security breaches. Pursuant to the FACT Act, the Bank must develop and implement a written identity theft prevention program to detect, prevent, and mitigate identity theft in connection with the opening of certain accounts or certain existing accounts. Additionally, the FACT Act amends the Fair Credit Reporting Act to generally prohibit a person from using information received from an affiliate to make a solicitation for marketing purposes to a consumer, unless the consumer is given notice and a reasonable opportunity and a reasonable and simple method to opt out of the making of such solicitations.
Anti-Money Laundering
The Bank Secrecy Act.
Under the Bank Secrecy Act (“BSA”), a financial institution, is required to have systems in place to detect certain transactions, based on the size and nature of the transaction. Financial institutions are generally required to report to the United States Treasury any cash transactions involving more than $10,000. In addition, financial institutions are required to file suspicious activity reports for any transaction or series of transactions that involve more than $5,000 and which the financial institution knows, suspects or has reason to suspect involves illegal funds, is designed to evade the requirements of the BSA or has no lawful purpose. The Uniting and Strengthening America by Providing Appropriate Tools Required to Intercept and Obstruct Terrorism Act of 2001 (the “USA PATRIOT Act”), which amended the BSA, together with the implementing regulations of various federal regulatory agencies, has caused financial institutions, such as the Bank, to adopt and implement additional policies or amend existing policies and procedures with respect to, among other things, anti-money laundering compliance, suspicious activity, currency transaction reporting, customer identity verification and customer risk analysis. In evaluating an application under Section 3 of the BHCA to acquire a bank or an application under the Bank Merger Act to merge banks or affect a purchase of assets and assumption of deposits and other liabilities, the applicable federal banking regulator must consider the anti-money laundering compliance record of both the applicant and the target. In addition, under the USA PATRIOT Act financial institutions are required to take steps to monitor their correspondent banking and private banking relationships as well as, if applicable, their relationships with “shell banks.”
9
OFAC.
The U.S. has imposed economic sanctions that affect transactions with designated foreign countries, nationals and others. These sanctions, which are administered by the U.S. Treasury’s Office of Foreign Assets Control (“OFAC”), take many different forms. Generally, however, they contain one or more of the following elements: (i) restrictions on trade with or investment in a sanctioned country, including prohibitions against direct or indirect imports from and exports to a sanctioned country and prohibitions on “U.S. persons” engaging in financial or other transactions relating to a sanctioned country or with certain designated persons and entities; (ii) a blocking of assets in which the government or specially designated nationals of the sanctioned country have an interest, by prohibiting transfers of property subject to U.S. jurisdiction (including property in the possession or control of U.S. persons); and (iii) restrictions on transactions with or involving certain persons or entities. Blocked assets (for example, property and bank deposits) cannot be paid out, withdrawn, set off or transferred in any manner without a license from OFAC. Failure to comply with these sanctions could have serious legal and reputational consequences for the Company.
Regulation of Other Activities
Volcker Rule Restrictions on Proprietary Trading and Sponsorship of Hedge Funds and Private Equity Funds.
The Dodd-Frank Act bars banking organizations, such as the Company and the Bank, from engaging in proprietary trading and from sponsoring and investing in hedge funds and private equity funds, except as permitted under certain circumstances, in a provision commonly referred to as the “Volcker Rule.” Under the Dodd-Frank Act, proprietary trading generally means trading by a banking entity or its affiliate for its trading account. Hedge funds and private equity funds are described by the Dodd-Frank Act as funds that would be registered under the 1940 Act but for certain enumerated exemptions. The Volcker Rule restrictions apply to the Company, the Bank and all of their subsidiaries and affiliates.
Legal Contingencies
In the normal course of business, the Company and its subsidiaries are subject to pending and threatened legal actions. Although the Company is not able to predict the outcome of such actions, after reviewing pending and threatened actions with counsel, management believes that based on the information currently available the outcome of such actions, individually or in the aggregate, will not have a material adverse effect on the Company’s consolidated financial position as a whole.
Reserves are established for legal claims only when losses associated with the claims are judged to be probable, and the loss can be reasonably estimated. In many lawsuits and arbitrations, it is not possible to determine whether a liability has been incurred or to estimate the ultimate or minimum amount of that liability until the case is close to resolution, in which case a reserve will not be recognized until that time.
If our allowance for loan losses is not adequate to cover actual loan losses, our earnings could decrease.
We make various assumptions and judgments about the collectability of our loan portfolio and provide an allowance for probable loan losses based on a number of factors. On a monthly basis, management reviews the allowance for loan losses to assess recent asset quality trends and impact on the Company's financial condition. On a quarterly basis, the allowance for loan losses is brought before the Bank's Board of Directors for discussion, review, and approval. If our assumptions are incorrect, the allowance for loan losses may not be sufficient to cover the losses we could experience, which would have an adverse effect on operating results, and may also cause us to increase the allowance for loan losses in the future. In addition, bank regulators periodically review our allowance for loan losses and may require us to increase our provisions for credit losses or recognize further loan charge-offs. Any increase in our allowance for loan losses or loan charge-offs as required by regulatory authorities could have a material adverse effect on our consolidated results of operations and financial condition. If additional amounts are provided to the allowance for loan losses, our earnings could decrease.
Our loans are concentrated in certain areas of Maine and adverse conditions in those markets could adversely affect our operations.
We are exposed to real estate and economic factors throughout Maine, as 85% of our loan portfolio is concentrated among borrowers in Maine, with higher concentrations of exposure in Cumberland, Hancock, Kennebec, Knox, and Penobscot counties. Further, because a substantial portion of the loan portfolio is secured by real estate in this area, the value of the associated collateral is also subject to regional real estate market conditions. Adverse economic, political or business developments or natural hazards may affect these areas and the ability of property owners in these areas to make payments of principal and interest on the underlying mortgages. If these regions experience adverse economic, political or business
10
conditions, we would likely experience higher rates of loss and delinquency on these loans than if the loans were more geographically diverse.
We experience strong competition within our markets, which may impact our profitability.
Competition in the banking and financial services industry is strong. In our market areas, we compete for loans, deposits and other financial products and services with large financial companies, local independent banks, thrift institutions, savings institutions, mortgage brokerage firms, credit unions, finance companies, mutual funds, insurance companies and brokerage and investment banking firms operating locally as well as nationally. Some of these competitors have substantially greater resources and lending limits than those of the Bank and may offer services that the Bank does not or cannot provide. There is also increased competition by out-of-market competitors through the internet. Our long-term success depends on the ability of our subsidiaries to compete successfully with other financial institutions in their service areas. Because we maintain a smaller staff and have fewer financial and other resources than larger institutions with which we compete, we may be limited in our ability to attract customers. If we are unable to attract and retain customers, we may be unable to achieve growth in the loan and core deposit portfolios, and our results of operations and financial condition may be negatively impacted.
Interest rate volatility may reduce our profitability.
Our profitability depends to a large extent upon our net interest income, which is the difference between interest income on interest-earning assets, such as loans and investments, and interest expense related to interest-bearing liabilities, such as deposits and borrowed funds. Net interest income can be affected significantly by changes in market interest rates. In particular, changes in relative interest rates may reduce our net interest income as the difference between interest income and interest expense decreases. As a result, we have adopted asset and liability management policies to minimize the potential adverse effects of changes in interest rates on net interest income, primarily by altering the mix and maturity of loans, investments and funding sources. However, there can be no assurance that a change in interest rates will not negatively impact our results of operations or financial condition. Because market interest rates may change by differing magnitudes and at different times, significant changes in interest rates over an extended period of time could reduce overall net interest income. An increase in interest rates could also have a negative impact on our results of operations by reducing the ability of borrowers to repay their current loan obligations, which could not only result in increased loan defaults, foreclosures and write-offs, but also necessitate further increases to our allowance for loan losses.
Our cost of funds for banking operations may increase as a result of general economic conditions, interest rates and competitive pressures.
The Bank has traditionally obtained funds principally through deposits and borrowings. As a general matter, deposits are a less costly source of funds than borrowings because interest rates paid for deposits are typically less than interest rates paid for borrowings. If, as a result of general economic conditions, market interest rates, competitive pressures or otherwise, total deposits at the Bank decrease relative to our overall banking operations, we may have to rely more heavily on borrowings as a source of funds in the future.
Potential downgrades of U.S. government securities by one or more of the credit ratings agencies could have a material adverse effect on our operations, earnings and financial condition.
A possible future downgrade of the sovereign credit ratings of the U.S. government and a decline in the perceived creditworthiness of U.S. government-related obligations could impact our ability to obtain funding that is collateralized by affected instruments, as well as affect the pricing of that funding when it is available. A downgrade may also adversely affect the market value of such instruments. We cannot predict if, when or how any changes to the credit ratings or perceived creditworthiness of these organizations will affect economic conditions. Such ratings actions could result in a significant adverse impact on us. Among other things, a further downgrade in the U.S. government’s credit rating could adversely impact the value of our securities portfolio and may trigger requirements that the Company post additional collateral for trades relative to these securities. A downgrade of the sovereign credit ratings of the U.S. government or the credit ratings of related institutions, agencies or instruments would significantly exacerbate the other risks to which we are subject and any related adverse effects on the business, financial condition and results of operations.
We are subject to liquidity risk.
Liquidity risk is the risk of potential loss if we are unable to meet our funding requirements at a reasonable cost. Our liquidity could be impaired by an inability to access the capital markets or by unforeseen outflows of cash. This situation may
11
arise due to circumstances that we may be unable to control, such as a general market disruption or an operational problem that affects third parties or us.
Market changes may adversely affect demand for our services and impact results of operations.
Channels for servicing our customers are evolving rapidly, with less reliance on traditional branch facilities, more use of online and mobile banking, and increased demand for universal bankers and other relationship managers who can service multiples product lines. We compete with larger providers that are rapidly evolving their service offerings and escalating the costs of evolving the Bank’s efforts to keep pace. We have a process for evaluating the profitability of our branch system and other office and operational facilities. The identification of unprofitable operations and facilities can lead to restructuring charges and introduce the risk of disruptions to revenues and customer relationships.
Prepayments of loans may negatively impact our business.
Generally, our customers may prepay the principal amount of their outstanding loans at any time. The speeds at which such prepayments occur, as well as the size of such prepayments, are within our customers’ discretion. Fluctuations in interest rates, in certain circumstances, may also lead to high levels of loan prepayments, which may also have an adverse impact on our net interest income. If customers prepay the principal amount of their loans, and we are unable to lend those funds to other borrowers or invest the funds at the same or higher interest rates, our interest income will be reduced. A significant reduction in interest income could have a negative impact on our results of operations and financial condition.
Our banking business is highly regulated, and we may be adversely affected by changes in law and regulation.
We are subject to regulation and supervision by the FRB, and the Bank is subject to regulation and supervision by the OCC and the FDIC. Federal laws and regulations govern numerous matters affecting us, including changes in the ownership or control of banks and bank holding companies, maintenance of adequate capital and the financial condition of a financial institution, permissible types, amounts and terms of extensions of credit and investments, permissible nonbanking activities, the level of reserves against deposits and restrictions on dividend payments. The OCC possesses the power to issue cease and desist orders to prevent or remedy unsafe or unsound practices or violations of law by banks subject to their regulation, and the FRB possesses similar powers with respect to bank holding companies. These and other restrictions limit the manner in which we may conduct business and obtain financing.
Our business is highly regulated and the laws, rules, regulations, and supervisory guidance and policies applicable to us are subject to regular modification and change. These changes could adversely and materially impact us. The Dodd-Frank Act instituted major changes to the banking and financial institutions regulatory regimes in light of the performance of and government intervention in the financial services sector. Other changes to statutes, regulations, or regulatory policies, including changes in interpretation or implementation of statutes, regulations, or policies, could subject us to additional costs, limit the types of financial services and products we may offer, and/or increase the ability of non-banks to offer competing financial services and products, among other things. Failure to comply with laws, regulations, policies or supervisory guidance could result in enforcement and other legal actions by federal or state authorities, including criminal and civil penalties, the loss of FDIC insurance, revocation of a banking charter, other sanctions by regulatory agencies, civil money penalties, and/or reputational damage, which could have a material adverse effect on our business, financial condition, and results of operations. See Item 1. “Business-Supervision and Regulation.”
We have become subject to new capital and liquidity standards that require banks and bank holding companies to maintain more and higher quality capital and greater liquidity that has historically been the case.
We became subject to new capital requirements in 2015. These new standards, which now apply and will be fully phased-by 2018, force bank holding companies and their bank subsidiaries to maintain substantially higher levels of capital as a percentage of their assets, with a greater emphasis on common equity as opposed to other components of capital. The need to maintain more and higher quality capital, as well as greater liquidity, and generally increased regulatory scrutiny with respect to capital levels, may at some point limit our business activities, including lending, and our ability to expand. It could also result in our being required to take steps to increase our regulatory capital and may dilute shareholder value or limit our ability to pay dividends or otherwise return capital to our investors through stock repurchases. Pursuant to the Dodd-Frank Act, we were permitted to make a one-time, permanent election to continue to exclude accumulated other comprehensive income from capital. We made this election.
12
We face significant legal risks, both from regulatory investigations and proceedings and from private actions brought against us.
From time to time, we are named as a defendant or are otherwise involved in various legal proceedings, including class actions and other litigation or disputes with third parties. There is no assurance that litigation with private parties will not increase in the future. Future actions against us may result in judgments, settlements, fines, penalties or other results adverse to us, which could materially adversely affect our business, financial condition or results of operations, or cause serious reputational harm to us. As a participant in the financial services industry, we are exposed to a high level of potential litigation related to our businesses and operations. Although we maintain insurance, the scope of this coverage may not provide us with full, or even partial, coverage in any particular case. As a result, a judgment against us in any such litigation could have a material adverse effect on our financial condition and results of operation.
Our businesses and operations are also subject to increasing regulatory oversight and scrutiny, which may lead to additional regulatory investigations or enforcement actions. These and other initiatives from federal and state officials may subject us to further judgments, settlements, fines or penalties, or cause us to be required to restructure our operations and activities, all of which could lead to reputational issues, or higher operational costs, thereby reducing our revenue.
We may incur fines, penalties and other negative consequences from regulatory violations, possibly even inadvertent or unintentional violations.
The financial services industry is subject to intense scrutiny from bank supervisors in the examination process and aggressive enforcement of federal and state regulations, particularly with respect to mortgage-related practices and other consumer compliance matters, and compliance with anti-money laundering, Bank Secrecy Act and Office of Foreign Assets Control regulations, and economic sanctions against certain foreign countries and nationals. Enforcement actions may be initiated for violations of laws and regulations and unsafe or unsound practices. We maintain systems and procedures designed to ensure that we comply with applicable laws and regulations; however, some legal/regulatory frameworks provide for the imposition of fines or penalties for noncompliance even though the noncompliance was inadvertent or unintentional and even though there were systems and procedures designed to ensure compliance in place at the time. Failure to comply with these and other regulations, and supervisory expectations related thereto, may result in fines, penalties, lawsuits, regulatory sanctions, reputation damage, or restrictions on our business.
We are subject to numerous laws designed to protect consumers, including the Community Reinvestment Act and fair lending laws, and failure to comply with these laws could lead to a wide variety of sanctions.
The Community Reinvestment Act, the Equal Credit Opportunity Act, the Fair Housing Act and other fair lending laws and regulations impose community investment and nondiscriminatory lending requirements on financial institutions. The Consumer Financial Protection Bureau, the Department of Justice and other federal agencies are responsible for enforcing these laws and regulations. A successful regulatory challenge to an institution’s performance under the Community Reinvestment Act, the Equal Credit Opportunity Act, the Fair Housing Act or other fair lending laws and regulations could result in a wide variety of sanctions, including damages and civil money penalties, injunctive relief, restrictions on mergers and acquisitions, restrictions on expansion and restrictions on entering new business lines. Private parties may also have the ability to challenge an institution’s performance under fair lending laws in private class action litigation. Such actions could have a material adverse effect on our business, financial condition and results of operations.
Our loan portfolio includes commercial real estate and commercial loans, which are generally riskier than other types of loans.
At December 31, 2016, our commercial real estate and commercial loan portfolios comprised 56% of our total loan balances. Commercial loans generally carry larger loan balances and involve a higher risk of nonpayment or late payment than residential mortgage loans. These loans may lack standardized terms and may include a balloon payment feature. The ability of a borrower to make or refinance a balloon payment may be affected by a number of factors, including the financial condition of the borrower, prevailing economic conditions and prevailing interest rates. Repayment of these loans is generally more dependent on the economy and the successful operation of a business. Because of the risks associated with commercial loans, we may experience higher rates of default than if the portfolio were more heavily weighted toward residential mortgage loans. Higher rates of default could have an adverse effect on our financial condition and results of operations.
As of December 31, 2016, the most significant industry concentration within our loan portfolio was non-residential building operators (operators of commercial and industrial buildings, retail establishments, theaters, banks and insurance
13
buildings), which was 12% of our total loans and 31% of our total commercial real estate portfolio. As of December 31, 2016, we had no other industry concentrations in excess of 10% of total loans.
We may incur significant losses as a result of ineffective risk management processes and strategies.
We seek to monitor and control our risk exposure through a risk and control framework encompassing a variety of separate but complementary financial, credit, operational, compliance and legal reporting systems, internal controls, management review processes and other mechanisms. While we employ a broad and diversified set of risk monitoring and risk mitigation techniques, those techniques and the judgments that accompany their application may not be effective and may not anticipate every economic and financial outcome in all market environments or the specifics and timing of such outcomes. Market conditions over the last several years have involved unprecedented dislocations and highlight the limitations inherent in using historical data to manage risk.
We may be unable to attract and retain key personnel.
Our success depends, in large part, on our ability to attract and retain key personnel. Competition for qualified personnel in the financial services industry can be intense and we may not be able to hire or retain the key personnel that we depend upon for success. The unexpected loss of services of one or more of our key personnel could have a material adverse impact on our business because of their skills, knowledge of the markets in which we operate, years of industry experience and the difficulty of promptly finding qualified replacement personnel.
We have credit and counterparty risk inherent in our securities portfolio and the soundness of other financial institutions that could adversely affect us.
Our ability to engage in routine funding transactions could be adversely affected by the actions and commercial soundness of other financial institutions. Financial services institutions are interrelated as a result of trading, clearing, counterparty and other relationships. We maintain a diversified securities portfolio and have exposure to many different counterparties, and we routinely execute transactions with counterparties in the financial industry, including brokers and dealers, other commercial banks, investment banks, mutual and hedge funds, and other financial institutions. As a result, defaults by, or even rumors or questions about, one or more financial services institutions, or the financial services industry generally, could lead to market-wide liquidity problems and losses or defaults by us or by other institutions and organizations. Many of these transactions expose us to credit risk in the event of default of our counterparty or client. Furthermore, our credit risk may be exacerbated when the collateral held by us cannot be liquidated or is liquidated at prices not sufficient to recover the full amount of the financial instrument exposure due to us. There is no assurance that any such losses would not materially and adversely affect our results of operations.
We believe that we have adequately reviewed our investment securities for impairment and we did not recognize any other-than-temporary impairments on our investment securities portfolio in 2016. However, over time, the economic and market environment may provide additional insight regarding the fair value of certain securities, which could change our judgment regarding impairment. In addition, if the counter-party should default, become insolvent, declare bankruptcy, or otherwise cease to exist, the value of our investment may be impaired. This could result in realized losses relating to other-than-temporary declines being charged against future income. Given the significant judgments involved, there is risk that material other-than-temporary impairments may be charged to income in future periods, resulting in realized losses.
We could be held responsible for environmental liabilities of properties we acquired through foreclosure.
In the course of business, we may acquire, through foreclosure, properties securing loans originated or purchased that are in default. Particularly in commercial real estate lending, there is a risk that material environmental violations could be discovered on these properties. In this event, we might be required to remedy these violations at the affected properties at our sole cost and expense. The cost of remedial action could substantially exceed the value of affected properties. We may not have adequate remedies against the prior owner or other responsible parties and could find it difficult or impossible to sell the affected properties. These events could have an adverse effect on our financial condition and results of operations.
We are subject to reputational risk.
We are dependent on our reputation within our market area, as a trusted and responsible financial company, for all aspects of our relationships with customers, employees, vendors, third-party service providers, and others, with whom we conduct business or potential future business. Our actual or perceived failure to (a) identify and address potential conflicts of interest, ethical issues, money-laundering, or privacy issues; (b) meet legal and regulatory requirements applicable to the Bank and to
14
the Company; (c) maintain the privacy of customer and accompanying personal information; (d) maintain adequate record keeping; (e) engage in proper sales and trading practices; and (f) identify the legal, reputational, credit, liquidity and market risks inherent in our products could give rise to reputational risk that could cause harm to the Bank and our business prospects. If we fail to address any of these issues in an appropriate manner, we could be subject to additional legal risks, which, in turn, could increase the size and number of litigation claims and damages asserted or subject us to enforcement actions, fines and penalties and cause us to incur related costs and expenses. Our ability to attract and retain customers and employees could be adversely affected to the extent our reputation is damaged.
We may be required to write down goodwill and other identifiable intangible assets.
When we acquire a business, a portion of the purchase price of the acquisition may be allocated to goodwill and other identifiable intangible assets. The excess of the purchase price over the fair value of the net identifiable tangible and intangible assets acquired determines the amount of the purchase price that is allocated to goodwill acquired. At December 31, 2016, our goodwill and other identifiable intangible assets totaled $101.5 million, which included goodwill and core deposit intangible assets created in connection with the SBM acquisition on October 16, 2015 of $49.9 million and $6.6 million, respectively. Under current accounting standards, if we determine goodwill or intangible assets are impaired, we would be required to write down the value of these assets to fair value. We conduct an annual review, or more frequently if events or circumstances warrant such, to determine whether goodwill is impaired. We recently completed our goodwill impairment analysis as of November 30, 2016 and concluded goodwill was not impaired. We conduct a review of our other intangible assets for impairment should events or circumstances warrant such. There were no triggers for such review for impairment for other intangible assets for the year ended December 31, 2016. We cannot provide assurance that we will not be required to take an impairment charge in the future. Any impairment charge would have a negative effect on our shareholders’ equity and financial results and may cause a decline in our stock price.
Systems failures, interruptions or breaches of security concerning our
information base, including the information we maintain relating to our customers, could have an adverse effect on our financial condition and results of operations.
In the ordinary course of business, we rely on electronic communications and information systems to conduct our business and to store sensitive data, including financial information regarding customers. We are subject to certain operational risks, including, but not limited to, data processing system failures and errors, inadequate or failed internal processes, customer or employee fraud, cyberattacks, hacking, identity theft and catastrophic failures resulting from terrorist acts or natural disasters. We depend upon data processing, software, communication, and information exchange on a variety of computing platforms and networks and over the internet, and we rely on the services of a variety of vendors to meet our data processing and communication needs. Despite instituted safeguards, we cannot be certain that all of our systems are entirely free from vulnerability to attack or other technological difficulties or failures. Information security risks have increased significantly due to the use of online, telephone and mobile banking channels by customers and the increased sophistication and activities of organized crime, hackers, terrorists and other external parties. Our technologies, systems, networks and our customers’ devices may be the target of, cyber-attacks, computer viruses, malicious code, phishing attacks or information security breaches that could result in the unauthorized release, gathering, monitoring, misuse, loss or destruction of our or our customers’ confidential, proprietary and other information, the theft of customer assets through fraudulent transactions or disruption of our or our customers’ or other third parties’ business operations. If information security is breached or other technology difficulties or failures occur, information may be lost or misappropriated, services and operations may be interrupted and we could be exposed to claims from customers. While we maintain a system of internal controls and procedures, any of these results could have a material adverse effect on our business, financial condition, results of operations or liquidity.
We regularly assess and test our security systems and disaster preparedness, including back-up systems, but the risks are substantially escalating. As a result, cybersecurity and the continued enhancement of our controls and processes to protect our systems, data and networks from attacks, unauthorized access or significant damage remain a priority. Accordingly, we may be required to expend additional resources to enhance our protective measures or to investigate and remediate any information security vulnerabilities or exposures. Any breach of our system security could result in disruption of our operations, unauthorized access to confidential customer information, significant regulatory costs, litigation exposure and other possible damages, loss or liability. Such costs or losses could exceed the amount of available insurance coverage, if any, and would adversely affect our earnings. Also, any failure to prevent a security breach or to quickly and effectively deal with such a breach could negatively impact customer confidence, damaging our reputation and undermining our ability to attract and keep customers.
15
We must adapt to information technology changes in the financial services industry, which could present operational issues, require significant capital spending, or impact our reputation.
The financial services industry is constantly undergoing technological changes, with frequent introductions of new technology-driven products and services. We invest significant resources in information technology system enhancements in order to provide functionality and security at an appropriate level. The effective use of technology increases efficiency and enables financial institutions to better serve customers and reduce costs. Our future success will depend, in part, upon our ability to address the needs of our customers by using technology to provide products and services that will satisfy customer demands for convenience, as well as to create additional efficiencies in our operations. We may not be able to effectively implement new technology-driven products and services or be successful in marketing these products and services to our customers. Failure to successfully implement and integrate future system enhancements could adversely impact the ability to provide timely and accurate financial information in compliance with legal and regulatory requirements, which could result in sanctions from regulatory authorities. Such sanctions could include fines and suspension of trading in our stock, among others. In addition, future system enhancements could have higher than expected costs and/or result in operating inefficiencies, which could increase the costs associated with the implementation as well as ongoing operations.
Failure to properly utilize system enhancements that are implemented in the future could result in impairment charges that adversely impact our financial condition and results of operations and could result in significant costs to remediate or replace the defective components. In addition, we may incur significant training, licensing, maintenance, consulting and amortization expenses during and after systems implementations, and any such costs may continue for an extended period of time.
We rely on other companies to provide key components of our business infrastructure.
Third party vendors provide key components of our business infrastructure such as internet connections, network access and core application processing. While we have selected these third party vendors carefully, we do not control their actions. Any problems caused by these third parties, including as a result of their not providing us their services for any reason or their performing their services poorly, could adversely affect our ability to deliver products and services to our customers or otherwise conduct our business efficiently and effectively. Replacing these third party vendors could also entail significant delay and expense.
The market value of wealth management assets under administration may be negatively affected by changes in economic and market conditions.
A substantial portion of income from fiduciary services is dependent on the market value of wealth management assets under administration, which are primarily marketable securities. Changes in domestic and foreign economic conditions, volatility in financial markets, and general trends in business and finance, all of which are beyond our control, could adversely impact the market value of these assets and the fee revenues derived from the management of these assets.
We may not be able to attract and retain wealth management clients at current levels.
Due to strong competition, our wealth management division may not be able to attract and retain clients at current levels. Competition is strong as there are numerous well-established and successful investment management and wealth advisory firms including commercial banks and trust companies, investment advisory firms, mutual fund companies, stock brokerage firms, and other financial companies. Our ability to attract and retain wealth management clients is dependent upon our ability to compete with competitors’ investment products, level of investment performance, client services, and marketing and distribution capabilities. If we are not successful, our results of operations and financial condition may be negatively impacted.
If we do not maintain net income growth, the market price of our common stock could be adversely affected.
Our return on shareholders’ equity and other measures of profitability, which affect the market price of our common stock, depend in part on our continued growth and expansion. Our growth strategy has two principal components: internal growth and external growth. Our ability to generate internal growth is affected by the competitive factors described below as well as by the primarily rural characteristics and related demographic features of the markets we serve. Our ability to continue to identify and invest in suitable acquisition candidates on acceptable terms is an important component of our external growth strategy. In pursuing acquisition opportunities, we may be in competition with other companies having similar growth strategies. As a result, we may not be able to identify or acquire promising acquisition candidates on acceptable terms. Competition for these acquisitions could result in increased acquisition prices and a diminished pool of acquisition opportunities. An inability to find suitable acquisition candidates at reasonable prices could slow our growth rate and have a negative effect on the market price of our common stock.
16
We are a holding company and dependent upon our subsidiary for dividends, distributions and other payments.
We are a legal entity separate and distinct from our direct and indirect subsidiaries. Our revenue (on a parent-only basis) is derived primarily from interest and dividends paid to us by the Bank. Our right, and consequently the right of our shareholders, to participate in any distribution of the assets or earnings of the Bank through the payment of such dividends or otherwise is necessarily subject to the prior claims of creditors of the Bank (including depositors), except to the extent that certain claims of us in a creditor capacity may be recognized.
Holders of our common stock are entitled to receive dividends only when, and if declared by our Board of Directors. Although we have historically declared cash dividends on our common stock, we are not required to do so and our Board of Directors may reduce or eliminate our common stock dividend in the future. The FRB has authority to prohibit bank holding companies from paying dividends if such payment is deemed to be an unsafe or unsound practice. Additionally, the OCC has the authority to use its enforcement powers to prohibit a bank from paying dividends if, in its opinion, the payment of dividends would constitute an unsafe or unsound practice. Further, our ability to pay dividends would be restricted under current regulatory capital rules if we do not maintain a capital conservation buffer. A reduction or elimination of dividends could adversely affect the market price of our common stock. See Part I, Item 1. “Business-Supervision and Regulation-Dividend Restrictions” and “Business-Supervision and Regulation-Regulatory Capital Requirements.”
Changes in accounting standards can be difficult to predict and can materially impact how we record and report our financial condition and results of operations.
Our accounting policies and methods are fundamental to how we record and report our financial condition and results of operations. From time to time, the FASB changes the financial accounting and reporting standards that govern the preparation of our financial statements. These changes can be hard to anticipate and implement and can materially impact how we record and report our financial condition and results of operations. For example, the FASB’s recently issued financial instruments standard will, among other things, significantly change how loan loss provisions are determined once effective from an incurred loss model to an expected loss model.
Differences in interpretation of tax laws and regulations and any potential resulting litigation may adversely impact our financial statements.
Local, state or federal tax authorities may interpret tax laws and regulations differently than we do and challenge tax positions that we have taken on tax returns. This may result in differences in the treatment of revenues, deductions, credits and/or differences in the timing of these items. The differences in treatment may result in payment of additional taxes, interest or penalties that could have a material adverse effect on our results.
Our financial statements are based in part on assumptions and estimates, which, if wrong, could cause unexpected losses in the future.
Pursuant to U.S. generally accepted accounting principles, we are required to use certain assumptions and estimates in preparing our financial statements, including in determining credit loss reserves, reserves related to litigation and the fair value of certain assets and liabilities, among other items. If assumptions or estimates underlying our financial statements are incorrect, we may experience material losses. For additional information, see Item 7. “Management’s Discussion and Analysis of Financial Condition and Results of Operations—Critical Accounting Policies.”
Our financial condition and results of operations have been adversely affected, and may continue to be adversely affected, by the U.S. and international financial market and economic conditions.
We have been, and continue to be, impacted by general business and economic conditions in the United States and, to a lesser extent, abroad. These conditions include short-term and long-term interest rates, inflation, money supply, political issues, legislative and regulatory changes, fluctuations in both debt and equity capital markets, broad trends in industry and finance, unemployment and investor confidence, all of which are beyond our control. While in recent years there has been gradual improvement in the U.S. economy, deterioration in any of these conditions could result in increases in loan delinquencies and non-performing assets, decreases in loan collateral values, the value of our investment portfolio and demand for our products and services. Furthermore, while the U.S. economy is improving, the recovery has been slow and there continues to be some uncertainty regarding the sustainability.
17
Continued market volatility may impact our business and the value of our common stock.
Our business performance and the trading price of shares of our common stock may be affected by many factors affecting financial institutions, including volatility in the credit, mortgage and housing markets, the markets for securities relating to mortgages or housing, and the value of debt and mortgage-backed and other securities that we hold in our investment portfolio. Government action and legislation may also impact us and the value of our common stock. We cannot predict what impact, if any, volatility will have on our business or share price and for these and other reasons our shares of common stock may trade at a price lower than that at which they were purchased.
None.
At
December 31, 2016
, the Company owns or leases a total of 65 facilities, excluding any properties designated other real estate owned. All facilities are fully utilized and considered suitable and adequate for the purposes intended. The Company owns 42 of its facilities, none of which are subject to a mortgage, and the remaining branches are leased by the Company. The Company has a 61 branch network located throughout Maine, and two loan production offices located in New Hampshire and Massachusetts.
The following table presents the Company's materially important locations and properties as of
December 31, 2016
:
|
Facility Name
|
Location
|
General
Character of the Physical Property
|
Primary Business Segment
|
Property
Status
|
Property
Square Feet
(1)
|
|||||||
|
Main Office
|
Camden, Maine
|
3 story building
|
Principal executive office
|
Owned
|
15,500
|
|
||||||
|
Canal Plaza
|
Portland, Maine
|
2 floors
|
Branch and executive office
|
Leased
|
16,355
|
|
||||||
|
Hanley Center
|
Rockport, Maine
|
2 story building
|
Service center
|
Owned
|
32,360
|
|
||||||
|
Gardiner
|
Gardiner, Maine
|
3 story building
|
Branch and service center
|
Owned
|
17,497
|
|
||||||
|
Kennebunk
|
Kennebunk, Maine
|
2 story building
|
Branch and service center
|
Owned
|
9,982
|
|
||||||
|
Auburn
|
Auburn, Maine
|
3 story building
|
Branch
|
Owned
|
13,000
|
|
||||||
|
Bangor
|
Bangor, Maine
|
1 floor
|
Branch
|
Leased
|
17,432
|
|
||||||
|
Ellsworth
|
Ellsworth, Maine
|
3 story building
|
Branch
|
Owned
|
44,000
|
|
(2)
|
|||||
|
Rockland
|
Rockland, Maine
|
3 story building
|
Branch
|
Owned
|
21,600
|
|
||||||
|
Waterville
|
Waterville, Maine
|
3 story building
|
Branch
|
Owned
|
17,099
|
|
||||||
|
(1)
|
Total square footage for leased locations represents the amount of space the Company occupies.
|
|
(2)
|
Includes space leased to third parties.
|
For additional information regarding the Company's premises and equipment and lease obligations see Note 7 of the consolidated financial statements included in Item 8 hereof.
Various legal claims arise from time to time in the normal course of the Company’s business, which in our opinion, are not expected to have a material effect on our consolidated financial statements.
Not applicable.
18
The Company’s common stock is currently traded on the NASDAQ Global Market (“NASDAQ”) under the ticker symbol “CAC.” The Company has paid quarterly dividends since its foundation in 1984. The high and low closing sales prices (as quoted by NASDAQ for
2016
and
2015
) and cash dividends declared per share of the Company’s common stock, by calendar quarter for the past two years, were as follows:
|
2016
|
2015
|
||||||||||||||||||||||
|
|
Market Price
|
Dividends Declared per Share
|
Market Price
|
Dividends Declared per Share
|
|||||||||||||||||||
|
|
High
|
Low
|
High
|
Low
|
|||||||||||||||||||
|
First Quarter
(1)
|
$
|
28.87
|
|
$
|
25.09
|
|
$
|
0.20
|
|
$
|
26.56
|
|
$
|
24.42
|
|
$
|
0.20
|
|
|||||
|
Second Quarter
(1)
|
$
|
29.17
|
|
$
|
26.97
|
|
$
|
0.20
|
|
$
|
27.57
|
|
$
|
25.03
|
|
$
|
0.20
|
|
|||||
|
Third Quarter
(1)
|
$
|
32.32
|
|
$
|
27.91
|
|
$
|
0.20
|
|
$
|
27.25
|
|
$
|
25.26
|
|
$
|
0.20
|
|
|||||
|
Fourth Quarter
(1)
|
$
|
45.24
|
|
$
|
29.70
|
|
$
|
0.23
|
|
$
|
30.23
|
|
$
|
26.06
|
|
$
|
0.20
|
|
|||||
|
(1)
|
Per share data has been adjusted to reflect the three-for-two split effective September 30, 2016, for all periods presented. Refer to Note 13 of the consolidated financial statement within Item 8 for further details.
|
As of March 1, 2017, there were 15,493,927 shares of the Company’s common stock outstanding by approximately 1,200 shareholders, as obtained through our transfer agent. Such number of shareholders does not reflect the number of persons or entities holding stock in nominee name through banks, brokerage firms and other nominees, which is estimated to be 3,700 shareholders.
Although the Company has historically paid quarterly dividends on its common stock, the Company’s ability to pay such dividends depends on a number of factors, including restrictions under federal laws and regulations on the Company’s ability to pay dividends, and as a result, there can be no assurance that dividends will be paid in the future. For further information on dividend restrictions, refer to Item 7. “Management’s Discussion and Analysis of Financial Condition and Results of Operations—Capital Resources."
The following graph illustrates the annual percentage change in the cumulative total shareholder return of the Company’s common stock for the period December 31, 2011 through
December 31, 2016
. For purposes of comparison, the graph illustrates comparable shareholder returns of the SNL $1B – $5B Bank Index and the Russell 2000 Stock Index. The graph assumes a $100 investment on December 31, 2011 in each case and measures the amount by which the market value, assuming reinvestment of dividends, has changed as of
December 31, 2016
.
Stock Performance Graph
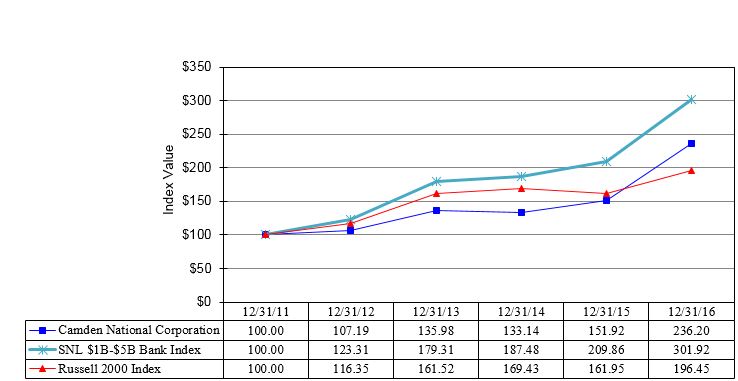
19
On September 24, 2013, the Board of Directors authorized a common stock repurchase program (the "2013 Repurchase Plan"). The 2013 Repurchase Plan allows for the repurchase of up to 375,000 shares of the Company’s outstanding common stock. This program is expected to continue until the authorized number of shares is repurchased, or the Company’s Board of Directors terminates the program. There is no specified expiration date of the 2013 Repurchase Plan. As of
December 31, 2016
, the Company had repurchased 374,250 shares at an average price of $26.55, or 99.8% of the program’s total allotment and 2.4% of total outstanding shares. The Company did not repurchase any shares of Company common stock for the year ended
December 31, 2016
.
|
Issuer's Purchases of Equity Securities
|
|||||||||||||
|
Period
|
Total
number of
shares (or units)
purchased
|
Average
price paid
per share (or unit)
|
Total number of
shares (or units) purchased
as part of publicly
announced plans or programs
|
Maximum number (or appropriate dollar value) of shares (or units) that may yet be purchased under the plans or programs
|
|||||||||
|
01/01/2016 to 12/31/2016
|
—
|
|
—
|
|
—
|
|
750
|
|
|||||
|
Total
|
—
|
|
$
|
—
|
|
—
|
|
750
|
|
||||
Other information required by this item is incorporated by reference to Item 12. “Security Ownership of Certain Beneficial Owners and Management and Related Stockholder Matters.”
20
The selected consolidated financial and other data of the Company set forth below does not purport to be complete and should be read in conjunction with, and is qualified in its entirety by, the more detailed information, including the consolidated financial statements and related notes, appearing elsewhere herein.
|
At or For The Year Ended
December 31,
|
||||||||||||||||||||
|
(In Thousands, Except per Share Data)
|
2016
|
2015
|
2014
|
2013
|
2012
|
|||||||||||||||
|
Financial Condition Data
|
|
|
|
|
|
|
|
|
|
|
||||||||||
|
Investments
|
$
|
897,679
|
|
$
|
855,995
|
|
$
|
803,633
|
|
$
|
828,201
|
|
$
|
802,084
|
|
|||||
|
Loans and loans held for sale
|
2,609,400
|
|
2,501,164
|
|
1,772,610
|
|
1,580,402
|
|
1,563,866
|
|
||||||||||
|
Allowance for loan losses
|
(23,116
|
)
|
(21,166
|
)
|
(21,116
|
)
|
(21,590
|
)
|
(23,044
|
)
|
||||||||||
|
Total assets
|
3,864,230
|
|
3,709,344
|
|
2,789,853
|
|
2,603,829
|
|
2,564,757
|
|
||||||||||
|
Deposits
|
2,828,529
|
|
2,726,379
|
|
1,932,097
|
|
1,813,824
|
|
1,929,469
|
|
||||||||||
|
Borrowings
|
599,675
|
|
572,362
|
|
577,002
|
|
530,092
|
|
360,163
|
|
||||||||||
|
Shareholders’ equity
|
391,547
|
|
363,190
|
|
245,109
|
|
231,096
|
|
233,815
|
|
||||||||||
|
Operating Data
|
|
|
||||||||||||||||||
|
Net interest income
|
$
|
113,072
|
|
$
|
86,452
|
|
$
|
76,257
|
|
$
|
75,441
|
|
$
|
73,745
|
|
|||||
|
Provision for credit losses
|
5,258
|
|
1,936
|
|
2,220
|
|
2,028
|
|
3,816
|
|
||||||||||
|
Non-interest income
|
39,621
|
|
27,482
|
|
24,370
|
|
27,835
|
|
23,412
|
|
||||||||||
|
Non-interest expense
|
89,896
|
|
81,139
|
|
62,397
|
|
66,333
|
|
59,031
|
|
||||||||||
|
Income before income taxes
|
57,539
|
|
30,859
|
|
36,010
|
|
34,915
|
|
34,310
|
|
||||||||||
|
Income taxes
|
17,472
|
|
9,907
|
|
11,440
|
|
12,132
|
|
10,882
|
|
||||||||||
|
Net income
|
$
|
40,067
|
|
$
|
20,952
|
|
$
|
24,570
|
|
$
|
22,783
|
|
$
|
23,428
|
|
|||||
|
Ratios
|
|
|
|
|
|
|
||||||||||||||
|
Return on average assets
|
1.04
|
%
|
0.70
|
%
|
0.92
|
%
|
0.88
|
%
|
0.98
|
%
|
||||||||||
|
Return on average equity
|
10.47
|
%
|
7.54
|
%
|
10.37
|
%
|
9.74
|
%
|
10.31
|
%
|
||||||||||
|
Net interest margin (fully-taxable equivalent)
|
3.32
|
%
|
3.19
|
%
|
3.11
|
%
|
3.20
|
%
|
3.36
|
%
|
||||||||||
|
Tier I leverage capital ratio
(1)
|
8.83
|
%
|
8.74
|
%
|
9.26
|
%
|
9.43
|
%
|
8.94
|
%
|
||||||||||
|
Total risk-based capital ratio
(1)
|
14.04
|
%
|
12.98
|
%
|
15.16
|
%
|
16.45
|
%
|
15.56
|
%
|
||||||||||
|
Non-performing assets to total assets
|
0.67
|
%
|
0.66
|
%
|
0.82
|
%
|
1.18
|
%
|
1.13
|
%
|
||||||||||
|
Dividend payout ratio
|
32.22
|
%
|
50.60
|
%
|
33.73
|
%
|
36.30
|
%
|
32.73
|
%
|
||||||||||
|
Per common share data
(2)
|
|
|
||||||||||||||||||
|
Basic earnings per share
|
$
|
2.59
|
|
$
|
1.73
|
|
$
|
2.19
|
|
$
|
1.98
|
|
$
|
2.04
|
|
|||||
|
Diluted earnings per share
|
2.57
|
|
1.73
|
|
2.19
|
|
1.98
|
|
2.03
|
|
||||||||||
|
Dividends declared per share
|
0.83
|
|
0.80
|
|
0.74
|
|
0.72
|
|
0.67
|
|
||||||||||
|
Book value per share
|
25.30
|
|
23.69
|
|
22.00
|
|
20.33
|
|
20.45
|
|
||||||||||
|
Non-GAAP measures
(3)
|
||||||||||||||||||||
|
Adjusted net income
|
$
|
40,597
|
|
$
|
28,186
|
|
$
|
24,277
|
|
$
|
23,564
|
|
$
|
24,324
|
|
|||||
|
Adjusted diluted earnings per share
(2)
|
2.61
|
|
2.33
|
|
2.16
|
|
2.05
|
|
2.11
|
|
||||||||||
|
Tangible book value per share
(2)
|
18.74
|
|
16.89
|
|
17.68
|
|
15.99
|
|
15.79
|
|
||||||||||
|
Efficiency ratio
|
57.53
|
%
|
61.13
|
%
|
61.58
|
%
|
62.78
|
%
|
57.45
|
%
|
||||||||||
|
Adjusted return on average assets
|
1.06
|
%
|
0.94
|
%
|
0.90
|
%
|
0.92
|
%
|
1.02
|
%
|
||||||||||
|
Return on average tangible equity
|
14.76
|
%
|
9.91
|
%
|
13.46
|
%
|
14.55
|
%
|
13.19
|
%
|
||||||||||
|
Adjusted return on average tangible equity
|
14.95
|
%
|
13.20
|
%
|
13.30
|
%
|
13.42
|
%
|
13.68
|
%
|
||||||||||
|
Tangible common equity ratio
|
7.71
|
%
|
7.18
|
%
|
7.18
|
%
|
7.12
|
%
|
7.19
|
%
|
||||||||||
|
(1)
|
Effective January 1, 2015, the Company reported regulatory capital ratios in accordance with the Basel III regulatory capital rule and framework.
|
|
(2)
|
Per share data has been adjusted to reflect the three-for-two split effective September 30, 2016, for all periods presented. Refer to Note 13 within the consolidated financial statements.
|
|
(3)
|
Refer to Item 7. "Management's Discussion and Analysis of Financial Condition and Results of Operations—Non-GAAP Financial Measures and Reconciliation to GAAP" for discussion and reconciliations of non-GAAP measures.
|
21
The discussion below focuses on the factors affecting our consolidated results of operations for the year ended
December 31, 2016
,
2015
and
2014
and financial condition at
December 31, 2016
and
2015
and, where appropriate, factors that may affect our future financial performance, unless stated otherwise. The dollar amounts within the tables are presented in thousands, except per share data. This discussion should be read in conjunction with the consolidated financial statements, notes to the consolidated financial statements and selected consolidated financial data.
22
Acronyms and Abbreviations
The acronyms and abbreviations identified below are used throughout Item 7. "Management's Discussion and Analysis of Financial Condition and Results of Operations." The following is provided to aid the reader and provide a reference page when reviewing this section of the Form 10-K.
|
Acadia Trust:
|
Acadia Trust, N.A. was a wholly-owned subsidiary of Camden National Corporation until its merger with Camden National Bank, a wholly-owned subsidiary of Camden National Corporation, on November 30, 2016.
|
IRS:
|
Internal Revenue Service
|
|
|
AFS:
|
Available-for-sale
|
LIBOR:
|
London Interbank Offered Rate
|
|
|
ALCO:
|
Asset/Liability Committee
|
LTIP:
|
Long-Term Performance Share Plan
|
|
|
ALL:
|
Allowance for loan losses
|
Management ALCO:
|
Management Asset/Liability Committee
|
|
|
AOCI:
|
Accumulated other comprehensive income (loss)
|
MBS:
|
Mortgage-backed security
|
|
|
ASC:
|
Accounting Standards Codification
|
Merger:
|
On October 16, 2015, the two-step merger of Camden National Corporation, SBM Financial, Inc. and Atlantic Acquisitions, LLC, a wholly-owned subsidiary of Camden National Corporation, was completed
|
|
|
ASU:
|
Accounting Standards Update
|
Merger Agreement:
|
Plan of Merger, dated as of March 29, 2015, by and among Camden National Corporation, SBM Financial, Inc. and Atlantic Acquisitions, LLC, a wholly-owned subsidiary of Camden National Corporation
|
|
|
Bank:
|
Camden National Bank, a wholly-owned subsidiary of Camden National Corporation
|
MSHA:
|
Maine State Housing Authority
|
|
|
BOLI:
|
Bank-owned life insurance
|
MSRs:
|
Mortgage servicing rights
|
|
|
Board ALCO:
|
Board of Directors' Asset/Liability Committee
|
MSPP:
|
Management Stock Purchase Plan
|
|
|
BSA:
|
Bank Secrecy Act
|
OTTI:
|
Other-than-temporary impairment
|
|
|
CCTA:
|
Camden Capital Trust A, an unconsolidated entity formed by Camden National Corporation
|
NIM:
|
Net interest margin on a fully-taxable basis
|
|
|
CDARS:
|
Certificate of Deposit Account Registry System
|
N.M.:
|
Not meaningful
|
|
|
CDs:
|
Certificate of deposits
|
Non-Agency:
|
Non-agency private issue collateralized mortgage obligation
|
|
|
Company:
|
Camden National Corporation
|
NRV:
|
Net realizable value
|
|
|
CMO:
|
Collateralized mortgage obligation
|
OCC:
|
Office of the Comptroller of the Currency
|
|
|
DCRP:
|
Defined Contribution Retirement Plan
|
OCI:
|
Other comprehensive income (loss)
|
|
|
EPS:
|
Earnings per share
|
OFAC:
|
Office of Foreign Assets Control
|
|
|
FASB:
|
Financial Accounting Standards Board
|
OREO:
|
Other real estate owned
|
|
|
FDIC:
|
Federal Deposit Insurance Corporation
|
SBM:
|
SBM Financial, Inc., the parent company of The Bank of Maine
|
|
|
FHLB:
|
Federal Home Loan Bank
|
SERP:
|
Supplemental executive retirement plans
|
|
|
FHLBB:
|
Federal Home Loan Bank of Boston
|
TDR:
|
Troubled-debt restructured loan
|
|
|
FRB:
|
Federal Reserve System Board of Governors
|
UBCT:
|
Union Bankshares Capital Trust I, an unconsolidated entity formed by Union Bankshares Company that was subsequently acquired by Camden National Corporation
|
|
|
FRBB:
|
Federal Reserve Bank of Boston
|
U.S.:
|
United States of America
|
|
|
GAAP:
|
Generally accepted accounting principles in the United States
|
2003 Plan:
|
2003 Stock Option and Incentive Plan
|
|
|
HPFC:
|
Healthcare Professional Funding Corporation, a wholly-owned subsidiary of Camden National Bank
|
2012 Plan:
|
2012 Equity and Incentive Plan
|
|
|
HTM:
|
Held-to-maturity
|
2013 Repurchase Program:
|
2013 Common Stock Repurchase Program, approved by the Company's Board of Directors
|
|
23
Executive Overview
In the fourth quarter of 2015, we completed the acquisition of SBM, the parent company of The Bank of Maine, and much of our attention for 2016 was focused on executing the merger strategies, integrating the two banks, and delivering on the commitments we had made to our shareholders and stakeholders. Through the successful execution of our merger strategies and the ongoing hard work and efforts of all our employees and the Board of Directors, we were able to meet our commitments and report solid financial results for the year ended December 31, 2016, including net income of $40.1 million and diluted EPS of $2.57 per share; return on average assets and equity of 1.04% and 10.47%, respectively; and an efficiency ratio (non-GAAP) of 57.53%.
Our strong financial and operating results for the year ended December 31, 2016 was largely due to the culmination of the Merger, which provided us with a larger presence in Southern and Central Maine, as well as an established mortgage banking business, but also our focus and commitment on driving organic growth through consistent delivery of our value proposition across all of our delivery channels. Total assets at December 31, 2016 were $3.9 billion, representing an increase over last year of 4%. Our asset growth in 2016 was driven by solid loan growth (excluding loans held for sale) of 4% and higher investment balances of 5%. Total deposits at December 31, 2016 were $2.8 billion, representing an increase over last year of 4%, which was driven by core deposit growth (demand, interest checking, savings and money market) of 4%.
Our asset quality at December 31, 2016 continues to remain strong with non-performing assets to total assets of 0.67% and non-performing loans to total loans of 0.97%, representing slight increases over last year of 1 basis point and 4 basis points, respectively. Our ratio of loans 30-89 days past due to total loans at December 31, 2016 was 0.24%, compared to 0.40% last year. Our provision for credit losses for the year ended December 31, 2016 was $5.3 million compared to $1.9 million last year. The increase was driven by our aforementioned loan growth year-over-year, as well as the credit deterioration of two significant loan relationships during 2016: (i) a syndication relationship we acquired as part of the Merger that resulted in incremental provision expense in 2016 of $1.4 million; and (ii) a large commercial real estate loan that was downgraded from passing to substandard in 2016 that resulted in incremental provision expense for 2016 of $1.3 million.
In the third and fourth quarter of 2016, we took certain steps to provide our shareholders with additional returns, including increasing our stock liquidity through completion of a three-for-two stock split effective September 30, 2016, and through a 15% increase in our quarterly cash dividend effective for the January 31, 2017 payout to our shareholders.
At December 31, 2016, the Company and the Bank, maintained risk-based capital ratios in excess of the regulatory levels required for an institution to be considered “well capitalized".
24
OPERATING RESULTS
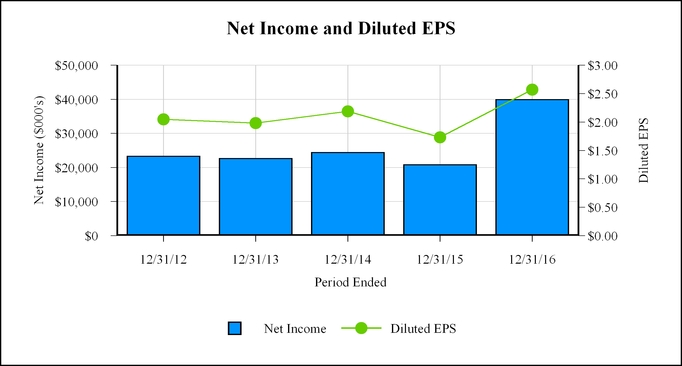
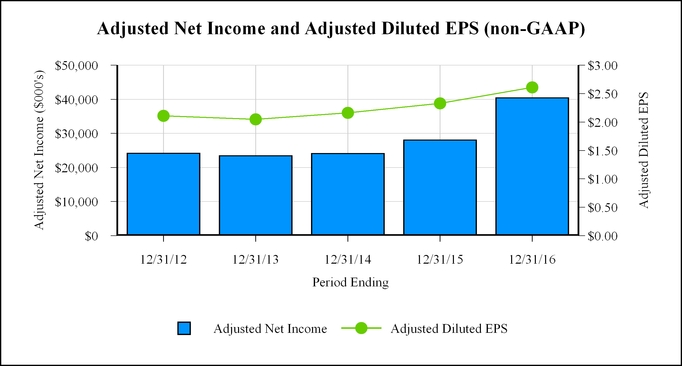
Net income for the year ended December 31, 2016 was $40.1 million compared to $21.0 million last year. Adjusted net income (non-GAAP) for the year ended December 31, 2016 was $40.6 million compared to $28.2 million last year.
Diluted EPS for the year ended December 31, 2016 was $2.57 per share compared to $1.73 per share last year. Adjusted diluted EPS (non-GAAP) for the year ended December 31, 2016 was $2.61 compared to $2.33 per share last year, representing an increase of 12% over last year.
25
The increase in adjusted net income (non-GAAP) of 44% and adjusted diluted EPS (non-GAAP) of 12% in 2016 compared to 2015 highlights the benefits of the Merger and our successful execution of our merger strategies, including an efficiency ratio of 57.53%, a return on average assets ratio of 1.04%, and a return on average equity of 10.47%.
FINANCIAL CONDITION

Total assets at
December 31, 2016
of $3.9 billion increased $154.9 million, or 4%, since
December 31, 2015
driven by organic loan growth of $104.4 million, or 4%, for the year.
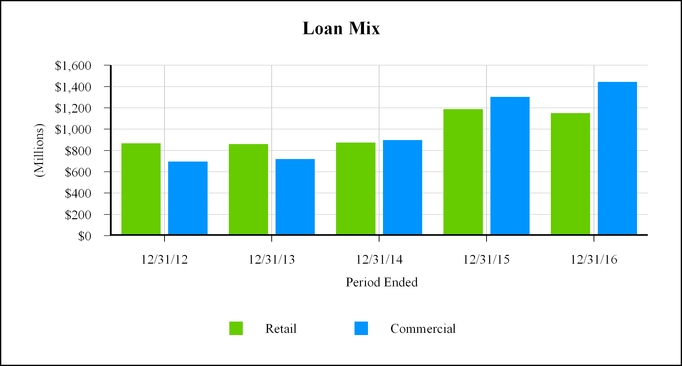
Our 2016 loan growth was centered in commercial real estate loans and commercial loans of 13% and 12%, resulting in a loan mix of 56% commercial and 44% retail.
26
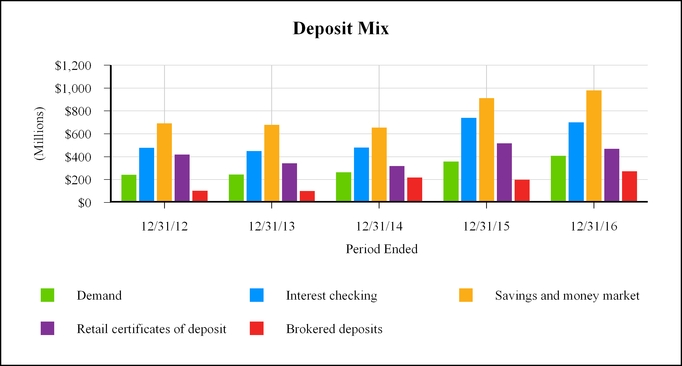
Total deposits at December 31, 2016 grew 4% over last year to $2.8 billion. Core deposits (demand, interest checking, saving and money market) increased 4% over last year to $2.1 billion. Our CD balances at December 31, 2016 decreased $48.7 million since last year and was supplemented by an increase in brokered deposits of $73.5 million. Total borrowings increased 5% over last year to $599.7 million at December 31, 2016.
Critical Accounting Policies
Critical accounting policies are defined as those that are reflective of significant judgments and uncertainties, and could potentially result in materially different results under different assumptions and conditions. In preparing the Company’s consolidated financial statements, management is required to make significant estimates and assumptions that affect assets, liabilities, revenues, and expenses reported. Actual results could materially differ from our current estimates, as a result of changing conditions and future events. Several estimates are particularly critical and are susceptible to significant near-term change, including (i) the allowance for loan losses; (ii) accounting for acquisitions and the subsequent review of goodwill and core deposit intangible assets generated in an acquisition for impairment; (iii) OTTI of investments; (iv) accounting for postretirement plans; and (v) income taxes.
Allowance for Loan Losses.
Management is committed to maintaining an ALL that is appropriate to absorb likely loss exposure in the loan portfolio. Evaluating the appropriateness of the ALL is a key management function and one that requires the most significant amount of management estimates and assumptions. The ALL, which is established through a charge to the provision for credit losses, consists of two components: (i) a reduction to total gross loans in the asset section of the consolidated statements of condition, and (ii) the reserve for unfunded commitments included in other liabilities on the consolidated statements of condition. We regularly evaluate the ALL for adequacy by taking into consideration, among other factors, historical trends in charge-offs and delinquencies, overall risk characteristics and size of the portfolios, ongoing review of significant individual loans, trends in levels of watched or criticized assets, business and economic conditions, local industry trends, regulatory guidance, and other relevant factors.
In determining the appropriate level of ALL, we use a methodology to systematically measure the amount of estimated loan loss exposure inherent in the loan portfolio. The methodology focuses on three key elements: (i) identification of loss allocations for specific loans, (ii) loss allocation factors for certain loan types based on credit grade and loss experience, and (iii) general loss allocations for other qualitative and environmental factors.
27
Loans for which a specific loss allocation may be required are identified and assessed at least quarterly by reviewing individual loans with a principal balance of $250,000 or more that are risk rated as substandard or doubtful and are on non-accrual status in accordance with Bank policy. We believe loans that meet the above criteria most often demonstrate the qualities and characteristics of an impaired loan and are individually significant enough to the Company to warrant individual assessment. An allowance is established for each of these loans to reduce the net carrying value when the discounted cash flows (or collateral value or observable market) of the impaired loan is lower than the recorded investment of the loan. Subsequent to December 31, 2016, we amended our internal policy for assessing individual loans for impairment by increasing the principal balance threshold to $500,000. The qualitative factors for assessing a loan individually for impairment remain unchanged. The change in our internal policy will be effective for periods beginning on January 1, 2017.
The remaining loan portfolio is separated into risk pools by portfolio segment and subject to a general reserve factor. At least annually, we reassess and revise the loss allocation factor used in constructing the reserve for each risk pool. The factors we consider in constructing each risk pool include: (i) risk rating; (ii) historical losses; (iii) market conditions; and (iv) other environmental factors.
In assessing the risk rating of a particular loan, we consider, among other factors, the obligor’s debt capacity, financial condition, the level of the obligor’s earnings, the amount and sources of repayment, the performance with respect to loan terms, the adequacy of collateral, the level and nature of contingent liabilities, management strength, and the industry in which the obligor operates. These factors are based on an evaluation of historical information, as well as a subjective assessment and interpretation of current conditions. Emphasizing one factor over another, or considering additional factors that may be relevant in determining the risk rating of a particular loan but which are not currently an explicit part of our methodology, could impact the risk rating assigned to that loan.
Three times a year, management conducts a thorough review of adversely risk rated commercial and commercial real estate exposures exceeding certain thresholds to re-evaluate the risk rating and identify impaired loans. This extensive review takes into account the obligor’s repayment history and financial condition, collateral value, guarantor support, local economic and industry trends, and other factors relevant to the particular loan relationship.
Because the methodology is based upon historical experience and trends as well as management’s judgment, factors may arise that result in different estimations. Significant factors that could give rise to changes in these estimates may include, but are not limited to, changes in economic conditions in our market area, concentration of risk, declines in local property values, and the results of regulatory examinations. While management’s evaluation of the ALL as of December 31, 2016 determined it to be appropriate, under adversely different conditions or assumptions, we may need to increase the ALL. Monthly, management reviews the ALL to assess recent asset quality trends and impact on the Company's financial condition. Quarterly, the ALL is brought before the Bank's Board of Directors for discussion, review, and approval.
The adequacy of the reserve for unfunded commitments is determined in a similar manner as the ALL, with the exception that management must also estimate the likelihood of these commitments being funded and becoming loans. This is accomplished by evaluating the historical utilization of each type of unfunded commitment and estimating the likelihood that the historical utilization rates could change in the future.
Purchase Price Allocation and Impairment of Goodwill and Identifiable Intangible Assets.
We record all acquired assets and liabilities at fair value, which is an estimate determined by the use of internal valuation techniques. We also may engage external valuation services to assist with the valuation of material assets and liabilities acquired, including, but not limited to, loans, core deposit intangibles, real estate and time deposits. As part of purchase accounting, we typically acquire goodwill and other intangible assets as part of the purchase price. These assets are subject to ongoing periodic impairment tests under differing accounting models. On October 16, 2015, we completed the acquisition of SBM, the parent company of The Bank of Maine. We did not acquire any other company or assets in 2016.
Goodwill impairment evaluations are required to be performed at least annually, but may be required more frequently if certain conditions indicate a potential impairment may exist. Our policy is to perform the goodwill impairment analysis annually as of November 30
th
, or more frequently as warranted. The goodwill impairment evaluation is required to be performed at the reporting unit level - (i) banking and (ii) financial services - and is performed using the two-step process outlined in GAAP. The banking reporting unit is representative of our core banking business line, while the financial services reporting unit is representative of our wealth management and trust services business line.
For the year ended
December 31, 2016
and
2015
, we performed step one of the annual goodwill impairment test for each reporting unit and in doing so, we concluded that the estimated fair value of each reporting unit exceeded its respective carrying value. As such, we concluded that goodwill was not impaired as of November 30,
2016
and
2015
. Furthermore, we are not
28
aware of any indications and/or triggers subsequent to our goodwill impairment analysis performed as of November 30,
2016
that would lead us to believe there may be subsequent impairment of goodwill.
Core deposit intangible assets have a finite life and are amortized over their estimated useful lives. Core deposit intangible assets are subject to impairment tests if events or circumstances indicate a possible inability to realize the carrying amount. Core deposit intangible assets are measured for impairment utilizing a cost recovery model. We did not identify any events or circumstances that occurred for the year ended
December 31, 2016
or
2015
that would indicate that our core deposit intangible assets may be impaired and should be evaluated for such.
OTTI of Investments
.
We record an investment impairment charge at the point we believe an investment has experienced a decline in value that is other-than-temporary. In determining whether an OTTI has occurred, we review information about the underlying investment that is publicly available, analysts’ reports, applicable industry data and other pertinent information, and assess our intent and ability to hold the security for the foreseeable future until recovered. The investment is written down to its current fair value at the time the impairment is deemed to have occurred. Future adverse changes in market conditions, continued poor operating results of underlying investments or other factors could result in further losses that may not be reflected in an investment’s current carrying value, possibly requiring an additional impairment charge in the future.
Accounting for Postretirement Plans
.
We use a December 31
st
measurement date to determine the expenses for our postretirement plans and related financial disclosure information. Postretirement plan expense is sensitive to changes in the number of eligible employees (and their related demographics), changes in the discount rate, mortality rate, and other expected rates, such as medical cost trends rates and salary scale assumptions.
Income Taxes
.
We account for income taxes by deferring income taxes based on the estimated future tax effects of differences between the book and tax bases of assets and liabilities considering the provisions of enacted tax laws. These differences result in deferred tax assets and liabilities, which are included in the consolidated statements of condition. We must also assess the likelihood that any deferred tax assets will be recovered from future taxable income and establish a valuation allowance for those assets determined not likely to be recoverable. Judgment is required in determining the amount and timing of recognition of the resulting deferred tax assets and liabilities, including projections of future taxable income. Although we have determined a valuation allowance is not required for all deferred tax assets, there is no guarantee that these assets will be realized. Income tax returns for the year ended December 31,
2013
, 2014 and
2015
are open to audit by federal and various state authorities and currently our federal income tax returns for 2013 and 2014 are undergoing an IRS examination. If we, as a result of an audit, were assessed interest and penalties, the amounts would be recorded through other non-interest expense on the consolidated statements of income.
Non-GAAP Financial Measures and Reconciliation to GAAP
In addition to evaluating the Company’s results of operations in accordance with GAAP, management supplements this evaluation with an analysis of certain non-GAAP financial measures, such as the efficiency ratio; tax equivalent net interest income; tangible book value per share; tangible common equity ratio; adjusted net income, adjusted diluted EPS, adjusted return on average assets, adjusted return on average equity and average tangible equity, and adjusted NIM; and return on average tangible equity. We utilize these non-GAAP financial measures for purposes of measuring our performance against our peer group and other financial institutions and analyzing our internal performance. We also believe these non-GAAP financial measures help investors better understand the Company’s operating performance and trends and allow for better performance comparisons to other banks. In addition, these non-GAAP financial measures remove the impact of unusual items that may obscure trends in the Company’s underlying performance. These disclosures should not be viewed as a substitute for GAAP operating results, nor are they necessarily comparable to non-GAAP performance measures that may be presented by other financial institutions.
29
Efficiency Ratio
.
The efficiency ratio represents an approximate measure of the cost required for the Company to generate a dollar of revenue. This is a common measure within our industry and is a key ratio for evaluating Company performance. The efficiency ratio is calculated as the ratio of (i) total non-interest expense, adjusted for certain operating expenses to (ii) net interest income on a tax equivalent basis (assumed 35% tax rate) plus total non-interest income, adjusted for certain other income items.
|
For The Year Ended
December 31,
|
||||||||||||||||||||
|
2016
|
2015
|
2014
|
2013
|
2012
|
||||||||||||||||
|
Non-interest expense, as presented
|
$
|
89,896
|
|
$
|
81,139
|
|
$
|
62,397
|
|
$
|
66,333
|
|
$
|
59,031
|
|
|||||
|
Less: merger and acquisition costs, and divestiture cost
|
(866
|
)
|
(10,415
|
)
|
—
|
|
(374
|
)
|
(2,324
|
)
|
||||||||||
|
Less: goodwill impairment
|
—
|
|
—
|
|
—
|
|
(2,830
|
)
|
—
|
|
||||||||||
|
Less: prepayment penalties on borrowings
|
—
|
|
—
|
|
—
|
|
—
|
|
(2,030
|
)
|
||||||||||
|
Adjusted non-interest expense
|
$
|
89,030
|
|
$
|
70,724
|
|
$
|
62,397
|
|
$
|
63,129
|
|
$
|
54,677
|
|
|||||
|
Net interest income, as presented
|
$
|
113,072
|
|
$
|
86,452
|
|
$
|
76,257
|
|
$
|
75,441
|
|
$
|
73,745
|
|
|||||
|
Add: effect of tax-exempt income
|
2,121
|
|
1,763
|
|
1,157
|
|
808
|
|
988
|
|
||||||||||
|
Non-interest income
|
39,621
|
|
27,482
|
|
24,370
|
|
27,835
|
|
23,412
|
|
||||||||||
|
Less: net gains on sale of securities, net of OTTI
|
(51
|
)
|
(4
|
)
|
(451
|
)
|
(785
|
)
|
(2,498
|
)
|
||||||||||
|
Less: gain on branch divestiture and branch sale
|
—
|
|
—
|
|
—
|
|
(2,742
|
)
|
(479
|
)
|
||||||||||
|
Adjusted net interest income plus non-interest income
|
$
|
154,763
|
|
$
|
115,693
|
|
$
|
101,333
|
|
$
|
100,557
|
|
$
|
95,168
|
|
|||||
|
Efficiency ratio
|
57.53
|
%
|
61.13
|
%
|
61.58
|
%
|
62.78
|
%
|
57.45
|
%
|
||||||||||
|
Non-interest expense, as presented, to total revenues
(1)
|
58.87
|
%
|
71.22
|
%
|
62.01
|
%
|
64.23
|
%
|
60.76
|
%
|
||||||||||
|
(1)
|
Revenue is defined as net interest income plus non-interest income.
|
Tax Equivalent Net Interest Income
.
Tax-equivalent net interest income is net interest income plus the taxes that would have been paid had tax-exempt securities been taxable (assuming a 35% tax rate). This number attempts to enhance the comparability of the performance of assets that have different tax liabilities.
|
For The Year Ended
December 31,
|
||||||||||||||||||||
|
2016
|
2015
|
2014
|
2013
|
2012
|
||||||||||||||||
|
Net interest income, as presented
|
$
|
113,072
|
|
$
|
86,452
|
|
$
|
76,257
|
|
$
|
75,441
|
|
$
|
73,745
|
|
|||||
|
Effect of tax-exempt income
|
2,121
|
|
1,763
|
|
1,157
|
|
808
|
|
988
|
|
||||||||||
|
Net interest income, tax equivalent
|
$
|
115,193
|
|
$
|
88,215
|
|
$
|
77,414
|
|
$
|
76,249
|
|
$
|
74,733
|
|
|||||
30
Tangible Book Value per Share
.
Tangible book value per share is the ratio of (i) shareholders’ equity less goodwill, premium on deposits and other acquisition-related intangibles (the numerator) to (ii) total common shares outstanding at period end. The following table reconciles tangible book value per share to book value per share. Tangible book value per share is a common measure within our industry when assessing the value of a Company as it removes goodwill and other intangible assets generated within purchase accounting upon a business combination.
Tangible Common Equity Ratio.
Tangible common equity is the ratio of (i) shareholders’ equity less goodwill and other intangible assets (the numerator) to (ii) total assets less goodwill and other intangible assets. This ratio is a measure used within our industry to assess whether or not a company is highly leveraged.
|
December 31,
|
||||||||||||||||||||
|
2016
|
2015
|
2014
|
2013
|
2012
|
||||||||||||||||
|
Tangible Book Value Per Share:
|
||||||||||||||||||||
|
Shareholders' equity, as presented
|
$
|
391,547
|
|
$
|
363,190
|
|
$
|
245,109
|
|
$
|
231,096
|
|
$
|
233,815
|
|
|||||
|
Less: goodwill and other intangible assets
|
(101,461
|
)
|
(104,324
|
)
|
(48,171
|
)
|
(49,319
|
)
|
(53,299
|
)
|
||||||||||
|
Tangible equity
|
$
|
290,086
|
|
$
|
258,866
|
|
$
|
196,938
|
|
$
|
181,777
|
|
$
|
180,516
|
|
|||||
|
Shares outstanding at period end
(1)
|
15,476,379
|
|
15,330,717
|
|
11,139,333
|
|
11,369,870
|
|
11,434,125
|
|
||||||||||
|
Tangible book value per share
(1)
|
$
|
18.74
|
|
$
|
16.89
|
|
$
|
17.68
|
|
$
|
15.99
|
|
$
|
15.79
|
|
|||||
|
Book value per share
(1)
|
$
|
25.30
|
|
$
|
23.69
|
|
$
|
22.00
|
|
$
|
20.33
|
|
$
|
20.45
|
|
|||||
|
Tangible Common Equity Ratio:
|
||||||||||||||||||||
|
Total assets
|
$
|
3,864,230
|
|
$
|
3,709,344
|
|
$
|
2,789,853
|
|
$
|
2,603,829
|
|
$
|
2,564,757
|
|
|||||
|
Less: goodwill and other intangibles
|
(101,461
|
)
|
(104,324
|
)
|
(48,171
|
)
|
(49,319
|
)
|
(53,299
|
)
|
||||||||||
|
Tangible assets
|
$
|
3,762,769
|
|
$
|
3,605,020
|
|
$
|
2,741,682
|
|
$
|
2,554,510
|
|
$
|
2,511,458
|
|
|||||
|
Tangible common equity ratio
|
7.71
|
%
|
7.18
|
%
|
7.18
|
%
|
7.12
|
%
|
7.19
|
%
|
||||||||||
|
Shareholders' equity to total assets
|
10.13
|
%
|
9.79
|
%
|
8.79
|
%
|
8.88
|
%
|
9.12
|
%
|
||||||||||
|
(1)
|
Share and per share amounts have been adjusted to reflect the three-for-two split effective September 30, 2016, for all periods presented. Refer to Item 8. "Financial Statements and Supplementary Data—Note 13,
Shareholders' Equity.
"
|
31
Adjusted Net Income, Adjusted Diluted EPS, Adjusted Return on Average Assets and Adjusted Return on Average Equity and Average Tangible Equity:
The following tables provide a reconciliation of net income, diluted EPS, return on average assets and average shareholders' equity to exclude the financial impact of certain transactions. The following adjusted financial ratios assist users of our financial statements with their financial analysis period-over-period as it adjusts for certain non-recurring items.
|
For The Year Ended
December 31,
|
||||||||||||||||||||
|
2016
|
2015
|
2014
|
2013
|
2012
|
||||||||||||||||
|
Adjusted Net Income:
|
||||||||||||||||||||
|
Net income, as presented
|
$
|
40,067
|
|
$
|
20,952
|
|
$
|
24,570
|
|
$
|
22,783
|
|
$
|
23,428
|
|
|||||
|
Add: mergers and acquisition costs and divestiture costs, net of tax
(1)
|
563
|
|
7,237
|
|
—
|
|
243
|
|
1,511
|
|
||||||||||
|
Add: goodwill impairment
(1)
|
—
|
|
—
|
|
—
|
|
2,830
|
|
—
|
|
||||||||||
|
Add: prepayment penalties on borrowings
(1)
|
—
|
|
—
|
|
—
|
|
—
|
|
1,320
|
|
||||||||||
|
Less: net gains on sale of securities, net of OTTI
(1)
|
(33
|
)
|
(3
|
)
|
(293
|
)
|
(510
|
)
|
(1,624
|
)
|
||||||||||
|
Less: gain on branch divestiture and branch sale
(1)
|
—
|
|
—
|
|
—
|
|
(1,782
|
)
|
(311
|
)
|
||||||||||
|
Adjusted net income
|
$
|
40,597
|
|
$
|
28,186
|
|
$
|
24,277
|
|
$
|
23,564
|
|
$
|
24,324
|
|
|||||
|
Adjusted Diluted EPS:
|
||||||||||||||||||||
|
Diluted EPS, as presented
(2)
|
$
|
2.57
|
|
$
|
1.73
|
|
$
|
2.19
|
|
$
|
1.98
|
|
$
|
2.03
|
|
|||||
|
Impact of adjustments to arrive at adjusted net income
(2)
|
0.04
|
|
0.60
|
|
(0.03
|
)
|
0.07
|
|
0.08
|
|
||||||||||
|
Adjusted diluted EPS
(2)
|
$
|
2.61
|
|
$
|
2.33
|
|
$
|
2.16
|
|
$
|
2.05
|
|
$
|
2.11
|
|
|||||
|
Adjusted Return on Average Assets:
|
||||||||||||||||||||
|
Return on average assets, as presented
|
1.04
|
%
|
0.70
|
%
|
0.92
|
%
|
0.88
|
%
|
0.98
|
%
|
||||||||||
|
Impact of adjustments to arrive at adjusted net income
|
0.02
|
%
|
0.24
|
%
|
(0.02
|
)%
|
0.04
|
%
|
0.04
|
%
|
||||||||||
|
Adjusted return on average assets
|
1.06
|
%
|
0.94
|
%
|
0.90
|
%
|
0.92
|
%
|
1.02
|
%
|
||||||||||
|
(1)
|
Assumed a 35% tax rate for deductible expenses, with the exception of goodwill impairment as this was a non-taxable event.
|
|
(2)
|
Per share data has been adjusted to reflect the three-for-two split effective September 30, 2016, for all periods presented. Refer to Note 13 in the consolidated financial statements.
|
32
Return on Average Tangible Equity:
Return on average tangible equity is the ratio of (i) net income, adjusted for tax effected amortization of intangible assets and goodwill impairment (the numerator) to (ii) average shareholders' equity, adjusted for average goodwill and other intangible assets. This adjusted financial ratio reflects a shareholders' return on tangible capital deployed in our business and is a common measure within our industry.
|
For The Year Ended
December 31,
|
||||||||||||||||||||
|
2016
|
2015
|
2014
|
2013
|
2012
|
||||||||||||||||
|
Net income, as presented
|
$
|
40,067
|
|
$
|
20,952
|
|
$
|
24,570
|
|
$
|
22,783
|
|
$
|
23,428
|
|
|||||
|
Add: amortization of intangible assets, net of tax
(1)
|
1,237
|
|
849
|
|
746
|
|
747
|
|
427
|
|
||||||||||
|
Add: goodwill impairment
(1)
|
—
|
|
—
|
|
—
|
|
2,830
|
|
—
|
|
||||||||||
|
Net income, adjusted for amortization of intangible assets and goodwill impairment
|
41,304
|
|
21,801
|
|
25,316
|
|
26,360
|
|
23,855
|
|
||||||||||
|
Add: merger and acquisition costs and divestiture costs, net of tax
(1)
|
563
|
|
7,237
|
|
—
|
|
243
|
|
1,511
|
|
||||||||||
|
Add: prepayment penalties on borrowings
(1)
|
—
|
|
—
|
|
—
|
|
—
|
|
1,320
|
|
||||||||||
|
Less: net gains on sale of securities, net of OTTI
(1)
|
(33
|
)
|
(3
|
)
|
(293
|
)
|
(510
|
)
|
(1,624
|
)
|
||||||||||
|
Less: gain on branch divestiture and branch sale
(1)
|
—
|
|
—
|
|
—
|
|
(1,782
|
)
|
(311
|
)
|
||||||||||
|
Adjusted tangible net income
|
$
|
41,834
|
|
$
|
29,035
|
|
$
|
25,023
|
|
$
|
24,311
|
|
$
|
24,751
|
|
|||||
|
Average equity
|
$
|
382,507
|
|
$
|
277,716
|
|
$
|
236,849
|
|
$
|
233,888
|
|
$
|
227,129
|
|
|||||
|
Less: average goodwill and other intangible assets
|
(102,711
|
)
|
(57,833
|
)
|
(48,735
|
)
|
(52,708
|
)
|
(46,253
|
)
|
||||||||||
|
Average tangible equity
|
$
|
279,796
|
|
$
|
219,883
|
|
$
|
188,114
|
|
$
|
181,180
|
|
$
|
180,876
|
|
|||||
|
Adjusted return on average tangible equity
|
14.95
|
%
|
13.20
|
%
|
|
13.30
|
%
|
13.42
|
%
|
13.68
|
%
|
|||||||||
|
Return on average tangible equity
|
14.76
|
%
|
9.91
|
%
|
13.46
|
%
|
14.55
|
%
|
13.19
|
%
|
||||||||||
|
Adjusted return on average equity
|
10.94
|
%
|
10.45
|
%
|
10.56
|
%
|
10.39
|
%
|
10.90
|
%
|
||||||||||
|
Return on average equity
|
10.47
|
%
|
7.54
|
%
|
10.37
|
%
|
9.74
|
%
|
10.31
|
%
|
||||||||||
|
(1)
|
Assumed a 35.0% tax rate for deductible expenses, with the exception of goodwill impairment as this was a non-taxable event.
|
Adjusted Net Interest Margin:
The following tables provide a reconciliation of NIM on a fully-taxable basis as presented within "—Results and Operations—Net Interest Income" to NIM on a fully-taxable basis, adjusted for fair value mark accretion from purchase accounting and recoveries on previously charged-off acquired loans. We believe this measure is meaningful as our NIM on fully-taxable basis as reported benefits from these items and they are not representative of how we manage our business and our balance sheet.
Prior to the Merger in the fourth quarter of 2015, fair value mark accretion from purchase accounting and recoveries on previously charged-off loans were not material to our consolidated financial condition or operating results, and, thus, non-GAAP reconciliations for the year ended December 31, 2012, 2013 and 2014 were not provided.
|
For The Year Ended
December 31,
|
||||||||
|
2016
|
2015
|
|||||||
|
Net interest income, tax equivalent, as presented
|
$
|
115,193
|
|
$
|
88,215
|
|
||
|
Less: fair value mark accretion from purchase accounting
|
(5,082
|
)
|
(812
|
)
|
||||
|
Less: collection of previously charged-off acquired loans
|
(1,078
|
)
|
(52
|
)
|
||||
|
Adjusted net interest income, tax equivalent
|
$
|
109,033
|
|
$
|
87,351
|
|
||
|
Average total interest-earnings assets
|
$
|
3,466,601
|
|
$
|
2,764,568
|
|
||
|
Net interest margin (fully-taxable equivalent)
|
3.32
|
%
|
3.19
|
%
|
||||
|
Adjusted net interest margin (fully-taxable equivalent)
|
3.15
|
%
|
3.16
|
%
|
||||
33
Results of Operations
For the year ended
December 31, 2016
, we reported net income of $40.1 million compared to $21.0 million for the year ended
December 31, 2015
, and $24.6 million for the year ended
December 31, 2014
. Diluted EPS for each of these years were $2.57, $1.73, and $2.19, respectively. The major components of these results, which include net interest income, provision for credit losses, non-interest income, non-interest expense, and income tax expense, are discussed below.
Net Interest Income
Net interest income is interest earned on loans, securities, and other interest-earning assets, plus net loan fees, origination costs and fair value marks on loans and/or time deposits created in purchase accounting, less the interest paid on interest-bearing deposits and borrowings. Net interest income, which is our largest source of revenue accounting for approximately 74% of total revenues, is affected by factors including, but not limited to: changes in interest rates, loan and deposit pricing strategies and competitive conditions, loan prepayment speeds, the volume and mix of interest-earning assets and interest-bearing liabilities, and the level of non-performing assets. NIM is calculated as net interest income on a fully-taxable equivalent basis as a percentage of average interest-earning assets. Our NIM on a fully-taxable equivalent basis for the year ended
December 31, 2016
,
2015
, and
2014
was 3.32%, 3.19%, and 3.11%.
2016
vs.
2015
Net Interest Income.
Net interest income was $115.2 million on a fully-taxable equivalent basis for
2016
, compared to $88.2 million for
2015
, representing an increase of $27.0 million, or 31%.
Interest income on a fully-taxable equivalent basis for 2016 was $131.7 million, representing an increase over 2015 of $30.8 million, or 31%. Our interest income growth for 2016 was primarily driven by an increase in average interest-earning assets of $702.0 million, or 25%, over last year. We also benefited from a higher yield on interest-earning assets of 15 basis points in 2016 compared to last year.
Average interest-earning assets totaled $3.5 billion for 2016, and our growth of 25% over last year was fueled by higher average loan balance of $618.5 million, or 32%. The increase in average loan balances was due to the Merger in the fourth quarter of 2015, in which we acquired $615.4 million of loan balances, as well 4% organic loan growth during 2016.
Our yield on interest-earning assets for 2016 was 3.80% compared to 3.65% last year. The increase reflects that benefits of the Merger as our loan yield increased 8 basis points in 2016 over last year. As part of the Merger, we acquired HPFC and it earned an average yield of 8.82% for 2016. However, effective February 19, 2016, we ceased HPFC's operations and loans are no longer being originated by HPFC and expect this loan portfolio to run off over the next several years. Also, due to the Merger, we benefited from higher loan and CD net fair value mark accretion of $4.3 million compared to last year and one-time recoveries on previously charged-off acquired SBM loans of $1.1 million for 2016. Our commercial real estate loan yield decreased 34 basis points in 2016 compared to 2015 due to the combination of (i) the competitive landscape across northern New England for strong credit commercial real estate loans, (ii) our strategy over the past two years to utilize back-to-back customer loan swaps on originated commercial real estate loans to protect us in a rising rate environment, and (iii) the low interest rate environment.
For 2016, our average deposits (excluding brokered deposits) totaled $2.6 billion, representing an increase of $656.4 million, or 35%, over last year. Our average core deposits (demand, interest checking, savings and money market) for 2016 were $2.1 billion, representing an increase of $525.4 million, or 34%, over last year. The increase in average deposits (excluding brokered deposits) was primarily due to the Merger in the fourth quarter of 2015, in which we acquired $687.0 million of deposit balances. Our cost of funds of 0.49% for 2016 increased 2 basis points over last year, which was driven by higher deposit and overnight borrowings costs and $15.0 million of subordinated debentures we issued in the fourth quarter of 2015 at a fixed interest rate of 5.50% per annum.
Our NIM on a fully-taxable equivalent basis for
2016
was 3.32%, representing an increase of 13 basis points over
2015
. Our adjusted NIM (non-GAAP) for 2016, which excludes fair value mark accretion generated in purchase accounting and one-time recoveries on previously charged-off acquired loans, was 3.15%, representing a decrease of 1 basis point compared to last year.
2015 vs. 2014 Net Interest Income.
Net interest income was $88.2 million on a fully-taxable equivalent basis for 2015, compared to $77.4 million for 2014, representing an increase of $10.8 million, or 14%. The increase was driven by higher average loan balance of $267.3 million, or 16%, and lower funding costs of 3 basis points. Our NIM on a fully-taxable equivalent basis for 2015 was 3.19%, representing an increase of 8 basis points over 2014. Our 2015 NIM on a fully-taxable
34
equivalent basis benefited from certain transactions. Our adjusted NIM (non-GAAP) on a fully-taxable equivalent basis for 2015 was 3.16%
For 2015, our interest income on fully-taxable equivalent basis reached $100.9 million, compared to $89.5 million for 2014. The increase of $11.4 million was driven by an increase in our average loan balances during 2015, which was a result of (i) organic loan growth during 2015 of $102.4 million, or 6%, and (ii) the acquisition of SBM on October 16, 2015, which included $615.4 million of loans on the acquisition date. The Merger not only provided us with higher average balances and interest income balances, but also improved our interest rate risk position in a rising rate environment due to the level of floating rate loans within the acquired loan portfolio as well as total deposits acquired of $687.0 million. Additionally, in 2015, we increased our use of customer loans swaps within our commercial real estate loan portfolio to improve our interest rate risk position in a rising rate environment by swapping fixed rate for variable rate. At December 31, 2015, our total notional on customer loan swaps with our borrowers totaled $142.9 million compared to $29.1 million at December 31, 2014 (we have matching notional agreements with a counterparty).
For 2015, our interest expense associated with deposits and borrowings totaled $12.7 million, compared to $12.1 million for 2014, representing an increase of $564,000, or 5%. The increase in total interest expense was due to higher cost average balances on our total deposits, excluding brokered deposits, as well higher borrowing costs, primarily associated with the issuance of $15.0 million of ten-year subordinated debentures bearing interest at an annual rate of 5.50% on October 8, 2015. Throughout 2015, we were able to effectively manage our borrowings by utilizing brokered deposits at lower interest rates than other borrowing means to aid the funding of our loan growth throughout the year.
35
The following table presents, for the years noted, average balances, interest income, interest expense, and the corresponding average yields earned and rates paid, as well as net interest income, net interest rate spread and net interest margin:
|
Average Balance, Interest and Yield/Rate Analysis
|
|||||||||||||||||||||||||||||||||
|
For The Year Ended
December 31,
|
|||||||||||||||||||||||||||||||||
|
|
2016
|
2015
|
2014
|
||||||||||||||||||||||||||||||
|
Average Balance
|
Interest
|
Yield/Rate
|
Average Balance
|
Interest
|
Yield/Rate
|
Average Balance
|
Interest
|
Yield/Rate
|
|||||||||||||||||||||||||
|
ASSETS
|
|
|
|
|
|
|
|
|
|
|
|
|
|
|
|
|
|
|
|||||||||||||||
|
Interest-earning assets:
|
|
|
|
|
|
|
|
|
|
|
|
|
|
|
|
|
|
|
|||||||||||||||
|
Securities – taxable
|
$
|
796,423
|
|
$
|
17,566
|
|
2.21
|
%
|
$
|
739,168
|
|
$
|
15,715
|
|
2.13
|
%
|
$
|
770,202
|
|
$
|
16,474
|
|
2.14
|
%
|
|||||||||
|
Securities – nontaxable
(1)
|
103,086
|
|
4,363
|
|
4.23
|
%
|
76,779
|
|
3,397
|
|
4.42
|
%
|
37,499
|
|
1,932
|
|
5.15
|
%
|
|||||||||||||||
|
Loans
(2)
:
|
|||||||||||||||||||||||||||||||||
|
Residential real estate
|
822,690
|
|
34,366
|
|
4.18
|
%
|
636,516
|
|
26,505
|
|
4.16
|
%
|
571,593
|
|
24,036
|
|
4.21
|
%
|
|||||||||||||||
|
Commercial real estate
(3)
|
1,004,169
|
|
41,228
|
|
4.11
|
%
|
716,112
|
|
31,859
|
|
4.45
|
%
|
594,224
|
|
26,976
|
|
4.54
|
%
|
|||||||||||||||
|
Commercial
(1)
|
292,709
|
|
12,350
|
|
4.22
|
%
|
254,514
|
|
9,726
|
|
3.82
|
%
|
211,722
|
|
8,346
|
|
3.94
|
%
|
|||||||||||||||
|
Municipal
(1)
|
19,238
|
|
572
|
|
2.97
|
%
|
13,698
|
|
471
|
|
3.44
|
%
|
13,794
|
|
486
|
|
3.52
|
%
|
|||||||||||||||
|
Consumer
|
358,098
|
|
15,111
|
|
4.22
|
%
|
310,664
|
|
12,053
|
|
3.88
|
%
|
289,964
|
|
11,292
|
|
3.89
|
%
|
|||||||||||||||
|
HPFC
|
70,188
|
|
6,191
|
|
8.82
|
%
|
17,117
|
|
1,181
|
|
6.90
|
%
|
—
|
|
—
|
|
—
|
%
|
|||||||||||||||
|
Total loans
|
2,567,092
|
|
109,818
|
|
4.28
|
%
|
1,948,621
|
|
81,795
|
|
4.20
|
%
|
1,681,297
|
|
71,136
|
|
4.23
|
%
|
|||||||||||||||
|
Total interest-earning assets
|
3,466,601
|
|
131,747
|
|
3.80
|
%
|
2,764,568
|
|
100,907
|
|
3.65
|
%
|
2,488,998
|
|
89,542
|
|
3.60
|
%
|
|||||||||||||||
|
Cash and due from banks
|
87,319
|
|
|
|
|
|
55,256
|
|
|
|
|
|
44,276
|
|
|
|
|
|
|||||||||||||||
|
Other assets
|
305,440
|
|
|
|
|
|
200,857
|
|
|
|
|
|
171,204
|
|
|
|
|
|
|||||||||||||||
|
Less: ALL
|
(22,663
|
)
|
(21,281
|
)
|
(21,691
|
)
|
|||||||||||||||||||||||||||
|
Total assets
|
$
|
3,836,697
|
|
$
|
2,999,400
|
|
$
|
2,682,787
|
|
||||||||||||||||||||||||
|
LIABILITIES & SHAREHOLDERS’ EQUITY
|
|
|
|
|
|
|
|
|
|
|
|
|
|
|
|
|
|
|
|||||||||||||||
|
Deposits:
|
|
|
|
|
|
|
|
|
|
|
|
|
|
|
|
|
|
|
|||||||||||||||
|
Demand
|
$
|
386,189
|
|
$
|
—
|
|
—
|
%
|
$
|
292,776
|
|
$
|
—
|
|
—
|
%
|
$
|
251,609
|
|
$
|
—
|
|
—
|
%
|
|||||||||
|
Interest checking
|
724,222
|
|
921
|
|
0.13
|
%
|
543,330
|
|
427
|
|
0.08
|
%
|
465,740
|
|
325
|
|
0.07
|
%
|
|||||||||||||||
|
Savings
|
461,794
|
|
278
|
|
0.06
|
%
|
306,536
|
|
180
|
|
0.06
|
%
|
250,148
|
|
142
|
|
0.06
|
%
|
|||||||||||||||
|
Money market
|
490,155
|
|
2,053
|
|
0.42
|
%
|
394,367
|
|
1,283
|
|
0.33
|
%
|
413,712
|
|
1,206
|
|
0.29
|
%
|
|||||||||||||||
|
Certificates of deposit
|
489,040
|
|
3,793
|
|
0.78
|
%
|
357,972
|
|
3,126
|
|
0.87
|
%
|
328,887
|
|
3,116
|
|
0.95
|
%
|
|||||||||||||||
|
Total deposits
|
2,551,400
|
|
7,045
|
|
0.28
|
%
|
1,894,981
|
|
5,016
|
|
0.26
|
%
|
1,710,096
|
|
4,789
|
|
0.28
|
%
|
|||||||||||||||
|
Borrowings:
|
|
|
|
|
|
|
|
|
|
|
|
|
|
|
|
|
|
|
|||||||||||||||
|
Brokered deposits
|
231,610
|
|
1,588
|
|
0.69
|
%
|
229,079
|
|
1,495
|
|
0.65
|
%
|
157,265
|
|
1,478
|
|
0.94
|
%
|
|||||||||||||||
|
Subordinated debentures
|
58,718
|
|
3,415
|
|
5.82
|
%
|
47,569
|
|
2,724
|
|
5.73
|
%
|
43,973
|
|
2,532
|
|
5.76
|
%
|
|||||||||||||||
|
Other borrowings
|
557,684
|
|
4,506
|
|
0.81
|
%
|
511,632
|
|
3,457
|
|
0.68
|
%
|
504,803
|
|
3,329
|
|
0.66
|
%
|
|||||||||||||||
|
Total borrowings
|
848,012
|
|
9,509
|
|
1.12
|
%
|
788,280
|
|
7,676
|
|
0.97
|
%
|
706,041
|
|
7,339
|
|
1.04
|
%
|
|||||||||||||||
|
Total funding liabilities
|
3,399,412
|
|
16,554
|
|
0.49
|
%
|
2,683,261
|
|
12,692
|
|
0.47
|
%
|
2,416,137
|
|
12,128
|
|
0.50
|
%
|
|||||||||||||||
|
Other liabilities
|
54,778
|
|
|
|
|
|
38,423
|
|
|
|
|
|
29,801
|
|
|
|
|
|
|||||||||||||||
|
Shareholders’ equity
|
382,507
|
|
277,716
|
|
236,849
|
|
|||||||||||||||||||||||||||
|
Total liabilities and shareholders’ equity
|
$
|
3,836,697
|
|
|
$
|
2,999,400
|
|
$
|
2,682,787
|
|
|||||||||||||||||||||||
|
Net interest income
(fully-taxable equivalent)
|
|
|
115,193
|
|
|
|
|
|
88,215
|
|
|
|
|
|
77,414
|
|
|
|
|||||||||||||||
|
Less: fully-taxable
equivalent adjustment
|
(2,121
|
)
|
(1,763
|
)
|
(1,157
|
)
|
|||||||||||||||||||||||||||
|
Net interest income
|
$
|
113,072
|
|
|
|
$
|
86,452
|
|
$
|
76,257
|
|
||||||||||||||||||||||
|
Net interest rate spread
(fully-taxable equivalent)
|
3.31
|
%
|
|
3.18
|
%
|
3.10
|
%
|
||||||||||||||||||||||||||
|
Net interest margin
(fully-taxable equivalent)
|
3.32
|
%
|
3.19
|
%
|
3.11
|
%
|
|||||||||||||||||||||||||||
|
(1) Reported on tax-equivalent basis calculated using a tax rate of 35%, including certain commercial loans.
|
|||||||||||||||||||||||||||||||||
|
(2) Non-accrual loans and loans held for sale are included in total average loans.
|
|||||||||||||||||||||||||||||||||
|
(3) For the year ended December 31, 2015, one loan paid-off that was on non-accrual status and resulted in interest income of $734,000.
|
|||||||||||||||||||||||||||||||||
36
The following table presents certain information on a fully-taxable equivalent basis regarding changes in interest income and interest expense for the periods indicated. For each category of interest-earning assets and interest-bearing liabilities, information is provided with respect to changes attributable to rate and volume. The changes in volume (change in volume multiplied by prior year's rate), (b) changes in rates (change in rate multiplied prior year's volume), and (c) changes in rate/volume (change in rate multiplied by the change in volume), which is allocated to the change due to rate column.
|
December 31, 2016 vs. 2015
Increase (Decrease) Due to:
|
December 31, 2015 vs. 2014
Increase (Decrease) Due to:
|
|||||||||||||||||||||||
|
Volume
|
Rate
|
Net
|
Volume
|
Rate
|
Net
|
|||||||||||||||||||
|
Interest-earning assets:
|
|
|
|
|
|
|
|
|
|
|
|
|
||||||||||||
|
Securities – taxable
|
$
|
1,220
|
|
$
|
631
|
|
$
|
1,851
|
|
$
|
(664
|
)
|
$
|
(95
|
)
|
$
|
(759
|
)
|
||||||
|
Securities – nontaxable
|
1,163
|
|
(197
|
)
|
966
|
|
2,023
|
|
(558
|
)
|
1,465
|
|
||||||||||||
|
Residential real estate
|
7,745
|
|
116
|
|
7,861
|
|
2,733
|
|
(264
|
)
|
2,469
|
|
||||||||||||
|
Commercial real estate
(1)
|
12,819
|
|
(3,450
|
)
|
9,369
|
|
5,611
|
|
(728
|
)
|
4,883
|
|
||||||||||||
|
Commercial
|
1,459
|
|
1,165
|
|
2,624
|
|
1,709
|
|
(329
|
)
|
1,380
|
|
||||||||||||
|
Municipal
|
191
|
|
(90
|
)
|
101
|
|
(3
|
)
|
(12
|
)
|
(15
|
)
|
||||||||||||
|
Consumer
|
1,840
|
|
1,218
|
|
3,058
|
|
805
|
|
(44
|
)
|
761
|
|
||||||||||||
|
HPFC
|
3,662
|
|
1,348
|
|
5,010
|
|
1,181
|
|
—
|
|
1,181
|
|
||||||||||||
|
Total interest income
|
30,099
|
|
741
|
|
30,840
|
|
13,395
|
|
(2,030
|
)
|
11,365
|
|
||||||||||||
|
Interest-bearing liabilities:
|
||||||||||||||||||||||||
|
Interest checking
|
145
|
|
349
|
|
494
|
|
54
|
|
48
|
|
102
|
|
||||||||||||
|
Savings
|
93
|
|
5
|
|
98
|
|
34
|
|
4
|
|
38
|
|
||||||||||||
|
Money market
|
316
|
|
454
|
|
770
|
|
(56
|
)
|
133
|
|
77
|
|
||||||||||||
|
Certificates of deposit
|
1,140
|
|
(473
|
)
|
667
|
|
276
|
|
(266
|
)
|
10
|
|
||||||||||||
|
Brokered deposits
|
16
|
|
77
|
|
93
|
|
675
|
|
(658
|
)
|
17
|
|
||||||||||||
|
Subordinated debentures
|
639
|
|
52
|
|
691
|
|
206
|
|
(14
|
)
|
192
|
|
||||||||||||
|
Other borrowings
|
313
|
|
736
|
|
1,049
|
|
45
|
|
83
|
|
128
|
|
||||||||||||
|
Total interest expense
|
2,662
|
|
1,200
|
|
3,862
|
|
1,234
|
|
(670
|
)
|
564
|
|
||||||||||||
|
Net interest income (fully-taxable equivalent)
|
$
|
27,437
|
|
$
|
(459
|
)
|
$
|
26,978
|
|
$
|
12,161
|
|
$
|
(1,360
|
)
|
$
|
10,801
|
|
||||||
|
(1)
|
For the year ended December 31, 2016 and 2015, we executed customer loan swaps for many of our large commercial real estate borrowers that qualified, which lowered our loan yield for our commercial real estate portfolio. These commercial loan swaps have strengthened our interest rate position in a rising interest rate environment as we receive a variable interest rate, while simultaneously meeting the needs of our borrowers. Refer to "—Contractual Obligations and Off-Balance Sheet Commitments—Derivatives—Customer Loan Swaps" for further discussion.
|
For the period indicated, we recognized within net interest income the following:
|
Income Statement Location
|
For The Year Ended
December 31,
|
|||||||||||||
|
2016
|
2015
|
2014
|
||||||||||||
|
Loan fees (cost)
|
Interest income
|
$
|
(394
|
)
|
$
|
735
|
|
$
|
255
|
|
||||
|
Net fair value mark accretion from purchase accounting
|
Interest income and Interest expense
|
5,082
|
|
812
|
|
161
|
|
|||||||
|
Recoveries on previously charged-off acquired loans
|
Interest income
|
1,078
|
|
52
|
|
—
|
|
|||||||
|
Total
|
$
|
5,766
|
|
$
|
1,599
|
|
$
|
416
|
|
|||||
37
Provision for Credit Losses
The provision for credit losses is made up of our provision for loan losses and the provision for unfunded commitments.
The provision for loan losses, which makes up the vast majority of the provision for credit losses, is a recorded expense determined by management that adjusts the ALL to a level that, in management’s best estimate, is necessary to absorb probable losses within the existing loan portfolio. The provision for loan losses reflects loan quality trends, including, among other factors, the levels of and trends related to non-accrual loans, past due loans, potential problem loans, criticized loans, net charge-offs or recoveries and growth in the loan portfolio. Accordingly, the amount of the provision for loan losses reflects both the necessary increases in the ALL related to newly identified criticized loans, as well as the actions taken related to other loans including, among other things, any necessary increases or decreases in required allowances for specific loans or loan pools. The provision for loan losses for the year ended
December 31, 2016
was $5.3 million, or 0.21% of average loans, compared to $1.9 million, or 0.10% of average loans, and $2.2 million, or 0.13% of average loans, for the year ended
December 31, 2015
and
2014
, respectively.
The increase in the provision for loan losses of $3.3 million in
2016
compared to
2015
was driven by our loan growth of $104.4 million year-over-year, as well as the credit deterioration of two large loan relationships: (i) a syndication relationship we acquired as part of the Merger that resulted in incremental provision expense in 2016 of $1.4 million; and (ii) a large commercial real estate loan that was downgraded from passing to substandard in 2016 that resulted in incremental provision expense for 2016 of $1.3 million. Our net charge-offs to average loans ratio for the year ended December 31, 2016 increased to 0.13% compared to 0.10% last year.
The decrease in the provision for credit losses of $284,000 in
2015
compared to
2014
was driven by (i) continued asset quality improvement, highlighted by a 6 basis points improvement in our net charge-offs to average loans ratio between 2015 and 2014 and (ii) acquired loans in the fourth quarter of 2015 of $615.4 million in connection with the Merger for which no provision was provided for the year ended December 31, 2015 as the fair value mark on the acquired loan portion was sufficient. Please see “—Financial Condition—Asset Quality” for additional discussion regarding the ALL.
The provision for unfunded commitments represents management's estimate of the amount required to reflect the probable inherent losses on outstanding letters and unused lines of credit. The reserve for unfunded commitments is presented within accrued interest and other liabilities on the consolidated statement of condition.
Non-Interest Income
The following table presents the components of non-interest income for the year ended December 31, 2016, 2015, and 2014:
|
For The Year Ended
December 31,
|
||||||||||||||||||||||||||
|
2016
|
2015
|
Change from
|
2014
|
Change from
|
||||||||||||||||||||||
|
2016 to 2015
|
2015 to 2014
|
|||||||||||||||||||||||||
|
$
|
%
|
$
|
%
|
|||||||||||||||||||||||
|
Debit card income
|
$
|
7,578
|
|
$
|
5,277
|
|
$
|
2,301
|
|
44
|
%
|
$
|
4,675
|
|
$
|
602
|
|
13
|
%
|
|||||||
|
Service charges on deposit accounts
|
7,210
|
|
6,423
|
|
787
|
|
12
|
%
|
6,229
|
|
194
|
|
3
|
%
|
||||||||||||
|
Mortgage banking income, net
|
6,258
|
|
2,031
|
|
4,227
|
|
208
|
%
|
282
|
|
1,749
|
|
620
|
%
|
||||||||||||
|
Income from fiduciary services
|
4,960
|
|
4,918
|
|
42
|
|
1
|
%
|
4,989
|
|
(71
|
)
|
(1
|
)%
|
||||||||||||
|
Bank-owned life insurance
|
2,594
|
|
1,680
|
|
914
|
|
54
|
%
|
1,437
|
|
243
|
|
17
|
%
|
||||||||||||
|
Brokerage and insurance commissions
|
2,074
|
|
1,699
|
|
375
|
|
22
|
%
|
1,766
|
|
(67
|
)
|
(4
|
)%
|
||||||||||||
|
Other service charges and fees
|
1,962
|
|
1,573
|
|
389
|
|
25
|
%
|
1,461
|
|
112
|
|
8
|
%
|
||||||||||||
|
Net gain on sale of securities
|
51
|
|
4
|
|
47
|
|
1,175
|
%
|
451
|
|
(447
|
)
|
(99
|
)%
|
||||||||||||
|
Other income
|
6,934
|
|
3,877
|
|
3,057
|
|
79
|
%
|
3,080
|
|
797
|
|
26
|
%
|
||||||||||||
|
Total non-interest income
|
$
|
39,621
|
|
$
|
27,482
|
|
$
|
12,139
|
|
44
|
%
|
$
|
24,370
|
|
$
|
3,112
|
|
13
|
%
|
|||||||
|
Non-interest income as a percentage of total revenues
(1)
|
26
|
%
|
24
|
%
|
24
|
%
|
||||||||||||||||||||
|
(1)
|
Revenue is defined as net interest income plus non-interest income.
|
38
2016
vs.
2015
Non-Interest Income.
The significant changes in non-interest income for the year ended
December 31, 2016
compared to the same period of
2015
include:
|
•
|
An increase in mortgage banking income of $4.2 million from the sale of $232.0 million of residential mortgages in
2016
that generated net gains on sale of $6.2 million compared to $61.2 million of residential mortgage sales in 2015 that generated net gains on sale of $1.3 million. The increase reflects our shift in our retail loan strategy and build-out of our mortgage banking team after the Merger in the fourth quarter of 2015. In 2016, we sold approximately 65% of our residential mortgage loan production.
|
|
•
|
An increase in other income of $3.1 million was driven by legal settlement proceeds of $638,000 related to a previously charged-off acquired loan, higher income on customer loan swaps of $590,000, one-time proceeds of $577,000 upon liquidation of a mortgage insurance exchange, and an increase in third party loan servicing income of $514,000.
|
|
•
|
An increase in debit card income of $2.3 million, and an increase in service charges on deposit accounts of $787,000 and other service charges and fees of $389,000 was primarily due to the addition of new customer accounts in connection with the Merger in the fourth quarter of 2015.
|
|
•
|
An increase in BOLI income due an additional investment of $16.7 million made during 2016 and death benefit proceeds received of $507,000.
|
2015 vs. 2014 Non-Interest Income.
The significant changes in non-interest income for the year ended December 31, 2015 compared to the same period of 2014 include:
|
•
|
An increase in mortgage banking income of $1.7 million from the sale of $61.2 million of residential mortgages in 2015, which generated gains on sale of $1.4 million, compared to $31,000 in 2014. The increase reflects our change in strategy in 2015, as well as the expansion of our mortgage banking platform in the fourth quarter of 2015 through the addition of SBM's mortgage banking platform.
|
|
•
|
An increase in debit card income, service charges on deposit accounts and other service charges and fees of $908,000, was driven by higher debit card income of $602,000 and overdraft fees of $288,000. In the fourth quarter of 2015, debit card income, service charges and other service charges revenues experienced increases due to the addition of approximately 55,000 new customer accounts in connection with the Merger.
|
|
•
|
An increase in other income of $797,000 was driven by higher income on customer loan swaps of $1.0 million, partially offset by lower third party loan servicing income of $113,000.
|
|
•
|
An increase in bank-owned life insurance of $243,000 due to the additional $10.0 million investment made in the third quarter of 2014.
|
39
Non-Interest Expenses
The following table presents the components of non-interest expense for the year ended
December 31, 2016
,
2015
, and
2014
:
|
For The Year Ended
December 31,
|
||||||||||||||||||||||||||
|
2016
|
2015
|
Change from
|
2014
|
Change from
|
||||||||||||||||||||||
|
2016 to 2015
|
2015 to 2014
|
|||||||||||||||||||||||||
|
$
|
%
|
$
|
%
|
|||||||||||||||||||||||
|
Salaries and employee benefits
|
$
|
48,072
|
|
$
|
37,220
|
|
$
|
10,852
|
|
29
|
%
|
$
|
32,669
|
|
$
|
4,551
|
|
14
|
%
|
|||||||
|
Furniture, equipment and data processing
|
9,557
|
|
8,057
|
|
1,500
|
|
19
|
%
|
7,316
|
|
741
|
|
10
|
%
|
||||||||||||
|
Net occupancy
|
7,088
|
|
5,695
|
|
1,393
|
|
24
|
%
|
5,055
|
|
640
|
|
13
|
%
|
||||||||||||
|
Consulting and professional fees
|
3,234
|
|
2,625
|
|
609
|
|
23
|
%
|
2,368
|
|
257
|
|
11
|
%
|
||||||||||||
|
OREO and collection costs
|
3,128
|
|
2,491
|
|
637
|
|
26
|
%
|
2,289
|
|
202
|
|
9
|
%
|
||||||||||||
|
Regulatory assessments
|
2,777
|
|
2,184
|
|
593
|
|
27
|
%
|
1,982
|
|
202
|
|
10
|
%
|
||||||||||||
|
Debit card expense
|
2,584
|
|
1,936
|
|
648
|
|
33
|
%
|
1,725
|
|
211
|
|
12
|
%
|
||||||||||||
|
Amortization of intangible assets
|
1,903
|
|
1,306
|
|
597
|
|
46
|
%
|
1,148
|
|
158
|
|
14
|
%
|
||||||||||||
|
Merger and acquisition costs
|
866
|
|
10,415
|
|
(9,549
|
)
|
(92
|
)%
|
—
|
|
10,415
|
|
N.M.
|
|
||||||||||||
|
Other expenses
|
10,687
|
|
9,210
|
|
1,477
|
|
16
|
%
|
7,845
|
|
1,365
|
|
17
|
%
|
||||||||||||
|
Total non-interest expenses
|
$
|
89,896
|
|
$
|
81,139
|
|
$
|
8,757
|
|
11
|
%
|
$
|
62,397
|
|
$
|
18,742
|
|
30
|
%
|
|||||||
|
Efficiency ratio (non-GAAP)
(1)
|
57.53
|
%
|
61.13
|
%
|
61.58
|
%
|
||||||||||||||||||||
|
(1)
|
Refer to "—Non-GAAP Financial Measures and Reconciliation to GAAP" for details of calculation.
|
2016
vs.
2015
Non-Interest Expense.
The significant changes in non-interest expense for the year ended
December 31, 2016
compared to the same period of
2015
was primarily due to the incremental costs associated with operating a larger organization upon completion of the Merger in the fourth quarter of 2015, including, but not limited to, higher salary and employee costs due to an increase in headcount; higher costs associated with furniture, equipment and data processing as well as net occupancy costs due to the addition of over 20 new locations and facilities; higher regulatory fees due to an increase in average assets; and incremental intangible amortization as we capitalized $6.6 million of core deposit intangible assets through purchase accounting. In addition, we make note of the following changes in non-interest expenses in 2016 compared to 2015:
|
•
|
A decrease in merger and acquisition costs associated with the Merger of $9.5 million as the Merger occurred in the fourth quarter of 2015.
|
|
•
|
An increase in OREO and collections costs due to an increase in third party servicing costs and collection-related costs of $1.1 million, partially offset by lower OREO-related costs of $446,000 as our inventory of OREO properties decreased from nine at December 31, 2015 to six at December 31, 2016.
|
|
•
|
An increase in bonuses and incentives of $931,000 due to the successful integration of SBM, and a strong financial performance for 2016.
|
2015 vs. 2014 Non-Interest Expense.
The significant changes in non-interest expense for the year ended December 31, 2015 compared to the same period of 2014 include:
|
•
|
An increase in merger and acquisition costs associated with the Merger of $10.4 million.
|
|
•
|
An increase in salaries and employee benefits of $4.6 million due to the addition of 168 employees associated with the Merger, normal annual merit increases, and higher bonuses and incentives due to the successful completion and integration of SBM and a strong financial performance for 2015 (assessed based on core operating earnings).
|
|
•
|
An increase in furniture, equipment and data processing and net occupancy costs of $1.4 million primarily due to the Merger, which included 24 additional banking centers, two lending offices, and the associated furniture and equipment within each.
|
40
Income Tax Expense
Income tax expense for the year ended
December 31, 2016
,
2015
and
2014
was $17.5 million, $9.9 million, and $11.4 million, respectively. Our effective income tax rate was 30.4%, 32.1%, and 31.8% in each of the past three years, respectively. Our effective tax rates differ from our marginal tax rate of 35.7% (federal tax rate and state tax rate, net of federal tax benefit) largely due to our non-taxable interest income from our municipal bonds and certain qualifying loans, non-taxable life insurance income, tax credits received, and, effective January 1, 2016, the benefit (or detriment) from windfall tax benefits (or shortfall) upon vesting of restricted stock awards and exercise of non-qualified stock options as we elected to early adopt the provisions of ASU 2016-09,
Compensation - Stock Compensation
(Topic 718):
Improvements to Employee Share-Based Payment Accounting
("ASU 2016-09").
For 2016, our effective tax rate of 30.4% was lower than our marginal tax rate due to a tax benefit of $2.2 million from tax exempt income on municipal bonds and BOLI income, a tax benefit of $701,000 upon adoption of ASU 2016-09 and tax credits of $376,000. Our 2016 effective tax rate was 1.7% lower than last year's effective tax rate primarily due to an increase in BOLI income of $914,000, of which $507,000 was related to death benefit proceeds, the adoption of ASU 2016-09 which was prospectively applied as of January 1, 2016, partially offset by certain non-deductible expenses incurred in 2015 associated with the Merger that increased our income tax expense by $467,000.
In 2015, our effective tax rate of 32.1% was lower than our marginal tax rate due to a tax benefit of $1.7 million from tax exempt income on municipal bonds and BOLI income, and tax credits of $359,000. However, we did incur certain non-deductible expenses in 2015 associated with the Merger that increased our income tax expense by $467,000, which was also the driver of the increase in our effective tax rate for 2015 compared to 2014.
In connection with the Merger, we acquired certain net operating losses and tax credit carryforwards as of the acquisition date, including federal net operating losses of $71.2 million and State of Maine net operating losses of $213,000. We determined we would not be able to utilize $6.8 million of the acquired federal net operating losses by the expiration date and wrote-off this amount within purchase accounting. Due to Internal Revenue Code Section 382(g) limitations, our use of the federal net operating losses acquired is limited to $3.9 million annually (and $803,000 for fiscal year 2015), which was determined using the applicable federal rate and the fair value of consideration paid for the acquisition at the acquisition date. The acquired federal net operating losses will expire between 2030 and 2034. We continuously monitor and assess the need for a valuation allowance on the acquired federal net operating losses and, at December 31, 2016, we determined that no valuation allowance was necessary.
At December 31, 2016 and 2015, the Company had net deferred tax assets of $39.3 million and $39.7 million, respectively, that are determined and reported utilizing a deferred tax rate of 35.0% based on current enacted tax rates. Should a change in the federal and/or state enacted tax rate occur, we would be required to record our net deferred tax assets at the newly issued enacted tax rate at that time, and a corresponding immediate benefit (assuming an increase in tax rates) or charge (assuming a decrease in tax rates) to income tax expenses would be recorded.
Impact of Inflation and Changing Prices
The consolidated financial statements and the notes to the consolidated financial statements presented in Item 8. “Financial Statements and Supplementary Data,” have been prepared in accordance with GAAP, which require the measurement of the financial position and operating results in terms of historical dollars and, in some case, current fair values without considering changes in the relative purchasing power of money over time due to inflation. Unlike many industrial companies, substantially all of our assets and virtually all of our liabilities are monetary in nature. As a result, interest rates have a more significant impact on our performance than the general level of inflation. Over short periods of time, interest rates and the yield curve may not necessarily move in the same direction or in the same magnitude as inflation.
41
Financial Condition
Investment Securities
We purchase and hold investment securities including municipal bonds, MBS (pass through securities and CMOs), subordinated corporate bonds and FHLB and FRB stock to diversify our revenues, interest rate and credit risk, and to provide for liquidity and funding needs. At
December 31, 2016
, our total holdings in investment securities were $897.7 million, an increase of $41.7 million since
December 31, 2015
. Total securities compared to total assets amounted to 23% at
December 31, 2016
and
2015
.
In
2016
, we purchased $231.2 million of debt investment securities; we had sales of $28.8 million; maturities, calls and principal pay-downs of $155.7 million; and net amortization of $3.1 million. For the year ended
December 31, 2016
and
2015
, we recognized net gains on the sale of investment securities of $51,000 and $4,000, respectively. The investment securities sold in
2016
and
2015
were designated as AFS securities.
Of the investment securities purchased during
2016
, we classified municipal bonds totaling $11.0 million as HTM securities. These investments are carried at amortized cost, and at
December 31, 2016
and
2015
, they were carried on our consolidated statements of condition at $94.6 million and $84.1 million, respectively. We have the positive intent and ability, evidenced by our strong capital and liquidity ratios, to hold these investments to maturity. The remaining investments purchased during
2016
were categorized as AFS securities and are carried at fair value on the consolidated statements of condition with the associated unrealized gains or losses recorded in AOCI, net of tax. At
December 31, 2016
, we had $6.1 million of net unrealized losses on AFS securities, net of tax, compared to $3.8 million of net unrealized losses, net of tax, at December 31,
2015
. The increase in our unrealized losses on AFS securities was due to an increase in long-term interest rates.
Our AFS securities portfolio is primarily invested in residential mortgage-backed securities, which comprised 98% of our total AFS portfolio at
December 31, 2016
and 97% of our total AFS portfolio at December 31,
2015
. During
2016
, we purchased $215.7 million of mortgage-backed securities ($162.8 million of pass-through securities and $52.9 million CMOs) and sold $23.7 million. We continuously monitor and evaluate our AFS portfolio to identify and assess risks within our portfolio, including, but not limited to, the impact of the current rate environment and the related prepayment risk and review credit ratings. The overall mix of securities within our AFS portfolio at
December 31, 2016
compared to December 31,
2015
remains relatively unchanged and well positioned to provide a stable source of cash flow. The duration of our AFS securities at
December 31, 2016
was 4.08 years as compared to last year of 3.74 years. We continue to invest in debt securities with a short period until maturity or call option to limit prepayment risk.
Our AFS portfolio of residential MBS securities is directly impacted by the interest rate environment and yield curve. A low interest rate environment directly affects the interest income earned on our MBS investment portfolio by accelerating prepayments and, consequently, the acceleration of our premium amortization. Additionally, a low rate environment and a flatter yield curve also decrease the yield earned upon reinvestment of the prepayment proceeds back into MBS securities, impacting our net interest income and margin. As of
December 31, 2016
, the amount of net premiums on our investment securities to be recognized in future periods totaled $12.7 million, which equated to a weighted-average premium above par of approximately 1%. Subsequent changes to the interest rate environment will continue to impact our yield.
At
December 31, 2016
and
2015
, we held 209 and 109 investment securities with a fair value of $658.5 million and $546.0 million that were in an unrealized loss position totaling $13.2 million and $10.2 million, respectively, that we concluded was temporary. Of these, MBS and CMOs with a fair value of $103.7 million and $192.8 million were in an unrealized loss position totaling $3.9 million and $6.7 million at
December 31, 2016
and
2015
, respectively, for 12 months or more. The decline in the fair value of the debt securities was reflective of current interest rates in excess of the yield received on investments and was not indicative of an overall credit deterioration or other factors within our investment portfolio. At
December 31, 2016
and
2015
, gross unrealized losses on our AFS and HTM securities were 1% of amortized cost.
We review our investment securities portfolio quarterly for impairment, which includes our municipal bonds portfolio, pass-through and collateralized mortgage obligations securities portfolios, and obligations of U.S. sponsored government-enterprises, in accordance with our internal policy. Our assessment includes, but is not limited to, reviewing available financial data, assessing credit rating changes, if any, and consideration of our intent and ability to hold temporarily impaired investment securities until we expect them to recover. We concluded that our investment securities in an unrealized loss position at
December 31, 2016
and
2015
were temporarily impaired and we have the intent and ability to hold these securities until they recover.
42
The following table sets forth the carrying value of AFS securities and HTM securities along with the percentage distribution:
|
December 31,
|
|||||||||||||||||||||
|
2016
|
2015
|
2014
|
|||||||||||||||||||
|
Carrying Value
|
Percent of Reported Balance
|
Carrying Value
|
Percent of Reported Balance
|
Carrying Value
|
Percent of Reported Balance
|
||||||||||||||||
|
AFS Securities:
|
|||||||||||||||||||||
|
Obligations of U.S. government sponsored enterprises
|
$
|
—
|
|
—
|
%
|
$
|
5,040
|
|
1
|
%
|
$
|
5,027
|
|
1
|
%
|
||||||
|
Obligations of states and political subdivisions
|
9,001
|
|
1
|
%
|
17,694
|
|
2
|
%
|
26,777
|
|
3
|
%
|
|||||||||
|
Mortgage-backed securities issued or guaranteed by U.S. government-sponsored enterprises
|
480,622
|
|
62
|
%
|
419,046
|
|
56
|
%
|
381,308
|
|
50
|
%
|
|||||||||
|
Collateralized mortgage obligations issued or guaranteed by U.S. government-sponsored enterprises
|
283,890
|
|
36
|
%
|
306,857
|
|
41
|
%
|
343,897
|
|
45
|
%
|
|||||||||
|
Private issue collateralized mortgage obligations
|
—
|
|
—
|
%
|
—
|
|
—
|
%
|
6,054
|
|
1
|
%
|
|||||||||
|
Subordinated corporate bonds
|
5,613
|
|
1
|
%
|
996
|
|
—
|
%
|
—
|
|
—
|
%
|
|||||||||
|
Total AFS debt securities
|
779,126
|
|
100
|
%
|
749,633
|
|
100
|
%
|
763,063
|
|
|
100
|
%
|
||||||||
|
Equity securities
|
741
|
|
—
|
%
|
705
|
|
—
|
%
|
—
|
|
—
|
%
|
|||||||||
|
Total AFS securities
|
779,867
|
|
100
|
%
|
750,338
|
|
100
|
%
|
763,063
|
|
100
|
%
|
|||||||||
|
HTM Securities:
|
|||||||||||||||||||||
|
Obligations of states and political subdivisions
|
94,609
|
|
100
|
%
|
84,144
|
|
100
|
%
|
20,179
|
|
100
|
%
|
|||||||||
|
Total HTM securities
|
94,609
|
|
100
|
%
|
84,144
|
|
100
|
%
|
20,179
|
|
100
|
%
|
|||||||||
|
Total
|
$
|
874,476
|
|
$
|
834,482
|
|
$
|
783,242
|
|
||||||||||||
43
The following table presents the book value (i.e. amortized cost) and fully-taxable equivalent weighted-average yields of debt investment securities by contractual maturity for the periods indicated. Actual maturities will differ from contractual maturities because borrowers may have the right to call or prepay obligations with or without call or prepayment penalties.
|
December 31,
|
||||||||||||||||||||||||||||
|
2016
|
2015
|
2014
|
||||||||||||||||||||||||||
|
|
Due in
1 year or less
|
Due in
1 – 5 years
|
Due in
5 – 10 years
|
Due in
over 10 years
|
Book Value
|
Book Value
|
Book Value
|
|||||||||||||||||||||
|
Debt securities:
|
||||||||||||||||||||||||||||
|
Obligations of U.S. government sponsored enterprises
|
$
|
—
|
|
$
|
—
|
|
$
|
—
|
|
$
|
—
|
|
$
|
—
|
|
$
|
4,971
|
|
$
|
4,962
|
|
|||||||
|
Obligations of states and political subdivisions
|
920
|
|
11,738
|
|
4,339
|
|
86,460
|
|
103,457
|
|
101,499
|
|
46,259
|
|
||||||||||||||
|
Mortgage-backed securities issued or guaranteed by U.S. government-sponsored enterprises
|
48,205
|
|
54,819
|
|
61,396
|
|
320,802
|
|
485,222
|
|
419,429
|
|
377,657
|
|
||||||||||||||
|
Collateralized mortgage obligations issued or guaranteed by U.S. government-sponsored enterprises
|
25,081
|
|
67,954
|
|
103,558
|
|
92,453
|
|
289,046
|
|
312,719
|
|
348,855
|
|
||||||||||||||
|
Private issue collateralized mortgage obligations
|
—
|
|
—
|
|
—
|
|
—
|
|
—
|
|
—
|
|
5,999
|
|
||||||||||||||
|
Subordinated corporate bonds
|
—
|
|
—
|
|
981
|
|
4,500
|
|
5,481
|
|
1,000
|
|
—
|
|
||||||||||||||
|
Total debt securities
|
$
|
74,206
|
|
$
|
134,511
|
|
$
|
170,274
|
|
$
|
504,215
|
|
$
|
883,206
|
|
$
|
839,618
|
|
$
|
783,732
|
|
|||||||
|
Weighted-average yield on debt securities
|
2.45
|
%
|
2.20
|
%
|
2.26
|
%
|
2.36
|
%
|
2.33
|
%
|
2.36
|
%
|
2.25
|
%
|
||||||||||||||
FHLBB and FRBB Stock
The Bank is a member of the FHLBB and FRBB, and as a member, the Bank is required to hold a certain amount of FHLBB and FRBB common stock. This stock is a non-marketable equity security and, is reported at cost.
We are required to maintain a level of investment in FHLBB stock based on the level of our FHLBB advances. As of
December 31, 2016
and
2015
, our investment in FHLBB stock totaled $17.8 million and $20.6 million, respectively. We currently have no intention to terminate our FHLBB membership.
At
December 31, 2016
and
2015
, our investment in FRB stock was $5.4 million and $908,000, respectively.
Loans
We provide loans primarily to customers located within our geographic market area. Our primary market continues to be in Maine, making up 85% of our loan portfolio at December 31, 2016. In 2015, through the acquisition of SBM, we expanded our geographic footprint to Massachusetts with a lending office located in Braintree, Massachusetts. Additionally, in connection with the Merger, we acquired HPFC. Shortly after the Merger, we reached a decision to close the operations of HPFC, effective February 19, 2016 and HPFC is no longer originating loans. We continue to hold HPFC's loans and will naturally run-off over the contract terms or as prepayments occur.
At December 31, 2016, total loans increased $104.4 million, or 4%, to $2.6 billion from $2.5 billion at December 31, 2015. Our 2016 loan growth was centered in commercial real estate loans and commercial loans with growth of 13% and 12%, respectively, driving commercial real estate loans to $1.1 billion and commercial loans to $333.6 million at December 31, 2016. Our retail portfolio at December 31, 2016 decreased 3% since last year to $1.1 billion. The decrease in our retail portfolio in 2016 was the result of our home equity portfolio declining by 5% and residential mortgages decreasing 2%. In 2016, we committed to selling the majority of our residential mortgage production, which for the year ended December 31, 2016 translated into selling approximately 65% of our $370.0 million residential mortgage originations.
44
The following table sets forth the composition of our loan portfolio at the dates indicated.
|
December 31,
|
|||||||||||||||||||||||||||||||||||
|
2016
|
2015
|
2014
|
2013
|
2012
|
|||||||||||||||||||||||||||||||
|
Residential real estate
|
$
|
802,494
|
|
31
|
%
|
$
|
820,617
|
|
33
|
%
|
$
|
585,468
|
|
33
|
%
|
$
|
569,819
|
|
36
|
%
|
$
|
572,173
|
|
37
|
%
|
||||||||||
|
Commercial real estate
|
1,050,780
|
|
41
|
%
|
927,951
|
|
37
|
%
|
640,661
|
|
36
|
%
|
541,099
|
|
34
|
%
|
506,231
|
|
32
|
%
|
|||||||||||||||
|
Commercial
|
333,639
|
|
13
|
%
|
297,721
|
|
12
|
%
|
257,515
|
|
15
|
%
|
179,203
|
|
11
|
%
|
190,454
|
|
12
|
%
|
|||||||||||||||
|
Consumer and home equity
|
347,239
|
|
13
|
%
|
366,587
|
|
15
|
%
|
288,966
|
|
|
16
|
%
|
290,281
|
|
19
|
%
|
295,008
|
|
19
|
%
|
||||||||||||||
|
HPFC
|
60,412
|
|
2
|
%
|
77,330
|
|
3
|
%
|
—
|
|
—
|
%
|
—
|
|
—
|
%
|
—
|
|
—
|
%
|
|||||||||||||||
|
Total loans
|
$
|
2,594,564
|
|
100
|
%
|
$
|
2,490,206
|
|
100
|
%
|
$
|
1,772,610
|
|
100
|
%
|
$
|
1,580,402
|
|
100
|
%
|
$
|
1,563,866
|
|
100
|
%
|
||||||||||
|
Loan portfolio mix:
|
|||||||||||||||||||||||||||||||||||
|
Retail
|
1,149,733
|
|
44
|
%
|
1,187,204
|
|
48
|
%
|
874,434
|
|
49
|
%
|
860,100
|
|
55
|
%
|
867,181
|
|
56
|
%
|
|||||||||||||||
|
Commercial
|
1,444,831
|
|
56
|
%
|
1,303,002
|
|
52
|
%
|
898,176
|
|
51
|
%
|
720,302
|
|
45
|
%
|
696,685
|
|
44
|
%
|
|||||||||||||||
As discussed previously, on October 16, 2015, we completed our acquisition of SBM. The following table presents the composition of the acquired loan portfolio from SBM as of October 16, 2015 (at fair value) and the calculated organic loan growth in 2015 (excluding measurement-period adjustments of $137,000 recorded in 2016 as purchase accounting was finalized):
|
December 31,
|
Change
|
SBM
Acquisition
|
Year Ended
December 31, 2015
Organic Growth
|
|||||||||||||||||||||||
|
2015
|
2014
|
($)
|
(%)
|
|||||||||||||||||||||||
|
Residential
|
$
|
820,617
|
|
$
|
585,468
|
|
$
|
235,149
|
|
40
|
%
|
$
|
234,619
|
|
$
|
530
|
|
—
|
%
|
|||||||
|
Commercial real estate
|
927,951
|
|
640,661
|
|
287,290
|
|
45
|
%
|
193,883
|
|
93,407
|
|
15
|
%
|
||||||||||||
|
Commercial
|
297,721
|
|
257,515
|
|
40,206
|
|
16
|
%
|
35,417
|
|
4,789
|
|
2
|
%
|
||||||||||||
|
Home equity
|
348,634
|
|
271,709
|
|
76,925
|
|
28
|
%
|
71,005
|
|
5,920
|
|
2
|
%
|
||||||||||||
|
Consumer
|
17,953
|
|
17,257
|
|
696
|
|
4
|
%
|
2,526
|
|
(1,830
|
)
|
(11
|
)%
|
||||||||||||
|
HPFC
|
77,330
|
|
—
|
|
77,330
|
|
N.M.
|
|
77,773
|
|
(443
|
)
|
N.M.
|
|
||||||||||||
|
Total loans
|
$
|
2,490,206
|
|
$
|
1,772,610
|
|
$
|
717,596
|
|
40
|
%
|
$
|
615,223
|
|
$
|
102,373
|
|
6
|
%
|
|||||||
Residential Real Estate Loans
.
Residential real estate loans consist of loans secured by one-to four-family residences. We generally retain in our portfolio adjustable rate mortgages and fixed rate mortgages with original terms of 20 years or less. At December 31, 2016, our residential real estate loans totaled $802.5 million, representing a decrease of $18.1 million since December 31, 2015. The decrease reflects our decision to sell approximately 65% of our $370.0 million in residential mortgage originations in 2016, and the natural run-off and amortization of residential mortgage loans.
Commercial Real Estate Loans
.
Commercial real estate loans consist of loans secured by income and non-income producing commercial real estate. We focus on lending to financially sound business customers primarily within our geographic marketplace, as well as offering loans for the acquisition, development and construction of commercial real estate. At December 31, 2016, our commercial real estate loans totaled $1.1 billion, representing an increase of $122.8 million, or 13%, over last year.
The most significant industry concentration within our commercial real estate loan portfolio at December 31, 2016 was the non-residential building operators industry (operators of commercial and industrial buildings, retail establishments, theaters, banks and insurance buildings). At December 31, 2016, the non-residential building operators' industry concentration was 31% of our total commercial real estate portfolio and 12% of our total loan portfolio. There were no other industry concentrations within our loan portfolio at December 31, 2016 that exceeded 10% of total loans.
Commercial Loans
.
Commercial loans consist of loans secured by various corporate assets, as well as loans to provide working capital in the form of lines of credit, which may be secured or unsecured. Municipal loans primarily consist of short-term tax anticipation notes made to municipalities for fixed asset or construction-related purposes and are included in commercial loans. We focus on lending to financially sound business customers and municipalities within our geographic marketplace. At December 31, 2016, our commercial loans totaled $333.6 million, representing an increase of $35.9 million, or 12%, over last year.
45
Consumer Loans and Home Equity Loans
.
Consumer loans and home equity loans are originated for a wide variety of purposes designed to meet the needs of our customers. Consumer loans include overdraft protection, automobile, boat, recreational vehicle, and mobile home loans, home equity loans and lines, and secured and unsecured personal loans. At December 31, 2016, our consumer and home equity loans totaled $347.2 million, representing a decrease of $19.3 million, or 5%, since December 31, 2015.
HPFC.
HPFC is a wholly-owned subsidiary of the Bank that provided commercial lending to dentists, optometrists and veterinarians, many of which are start-up companies. HPFC's loan portfolio consists of term loan obligations extended for the purpose of financing working capital and/or purchase of equipment. Collateral may consist of pledges of business assets including, but not limited to, accounts receivable, inventory, and/or equipment. These loans are primarily paid by the operating cash flow of the borrower and the terms range from seven to ten years. At December 31, 2016, our HPFC commercial loan portfolio totaled $60.4 million, representing a decrease of $16.9 million, or 22%, since December 31, 2015. The HPFC loan portfolio will continue to decrease until all loans have matured as we ceased operations of HPFC effective February 19, 2016.
Asset Quality
The Bank's Board of Directors monitors credit risk through the Directors’ Loan Review Committee, which reviews large credit exposures, monitors the external loan review reports, reviews the lending authority for individual loan officers when required, and has approval authority and responsibility for all matters regarding the loan policy and other credit-related policies, including reviewing and monitoring asset quality trends, concentration levels, and the ALL methodology. Credit Risk Administration and the Credit Risk Policy Committee oversee management’s systems and procedures to monitor the credit quality of the loan portfolio, conduct a loan review program, maintain the integrity of the loan rating system, determine the adequacy of the ALL, and support the oversight efforts of the Directors' Loan Review Committee and the Board of Directors. Our practice is to proactively manage the portfolio such that management can identify problem credits early, assess and implement effective work-out strategies, and take charge-offs as promptly as practical. In addition, management continuously reassesses its underwriting standards in response to credit risk posed by changes in economic conditions.
46
Non-Performing Assets
.
Non-performing assets include non-accrual loans, accruing loans 90 days or more past due, accruing renegotiated loans, and OREO. The level of our non-performing assets over the past five years is shown in the table below.
|
December 31,
|
||||||||||||||||||||
|
2016
|
2015
|
2014
|
2013
|
2012
|
||||||||||||||||
|
Non-accrual loans:
|
|
|
|
|
|
|
|
|
||||||||||||
|
Residential real estate loans
|
$
|
3,945
|
|
$
|
7,253
|
|
$
|
6,056
|
|
$
|
10,520
|
|
$
|
10,584
|
|
|||||
|
Commercial real estate
|
12,849
|
|
4,529
|
|
7,043
|
|
7,799
|
|
6,719
|
|
||||||||||
|
Commercial loans
|
2,088
|
|
4,489
|
|
1,529
|
|
2,146
|
|
3,409
|
|
||||||||||
|
Consumer and home equity loans
|
1,624
|
|
2,051
|
|
2,011
|
|
2,012
|
|
1,771
|
|
||||||||||
|
HPFC
|
207
|
|
—
|
|
—
|
|
—
|
|
—
|
|
||||||||||
|
Non-accrual loans
|
20,713
|
|
18,322
|
|
16,639
|
|
22,477
|
|
22,483
|
|
||||||||||
|
Accruing loans past due 90 days
|
—
|
|
—
|
|
—
|
|
455
|
|
611
|
|
||||||||||
|
Accruing TDRs (not included above)
|
4,338
|
|
4,861
|
|
4,539
|
|
5,468
|
|
4,674
|
|
||||||||||
|
Total non-performing loans
|
25,051
|
|
23,183
|
|
21,178
|
|
28,400
|
|
27,768
|
|
||||||||||
|
Other real estate owned
|
922
|
|
1,304
|
|
1,587
|
|
2,195
|
|
1,313
|
|
||||||||||
|
Total non-performing assets
|
$
|
25,973
|
|
$
|
24,487
|
|
$
|
22,765
|
|
$
|
30,595
|
|
$
|
29,081
|
|
|||||
|
Total loans, excluding loans held for sale
|
$
|
2,594,564
|
|
$
|
2,490,206
|
|
$
|
1,772,610
|
|
$
|
1,563,866
|
|
$
|
1,514,028
|
|
|||||
|
Total assets
|
$
|
3,864,230
|
|
$
|
3,709,344
|
|
$
|
2,789,853
|
|
$
|
2,603,829
|
|
$
|
2,564,757
|
|
|||||
|
Allowance for loan losses
|
$
|
23,116
|
|
$
|
21,166
|
|
$
|
21,116
|
|
$
|
21,590
|
|
$
|
23,044
|
|
|||||
|
Non-accrual loans to total loans
|
0.80
|
%
|
0.74
|
%
|
0.94
|
%
|
1.44
|
%
|
1.48
|
%
|
||||||||||
|
Non-performing loans to total loans
|
0.97
|
%
|
0.93
|
%
|
1.19
|
%
|
1.82
|
%
|
1.83
|
%
|
||||||||||
|
Allowance for loan losses to non-performing loans
|
92.28
|
%
|
91.30
|
%
|
99.71
|
%
|
76.02
|
%
|
82.99
|
%
|
||||||||||
|
Non-performing assets to total assets
|
0.67
|
%
|
0.66
|
%
|
0.82
|
%
|
1.18
|
%
|
1.13
|
%
|
||||||||||
|
Allowance for loan losses to non-performing assets
|
89.00
|
%
|
86.44
|
%
|
92.76
|
%
|
70.57
|
%
|
79.24
|
%
|
||||||||||
Generally, a loan is classified as non-accrual when interest and/or principal payments are 90 days past due or when management believes collecting all principal and interest owed is in doubt. All previously accrued but unpaid interest on non-accrual loans is reversed from interest income in the current period. Interest payments received on non-accrual loans (including impaired loans) are applied as a reduction of principal. A loan remains on non-accrual status until all principal and interest amounts contractually due are brought current, all future principal and interest payments are reasonably assured, and a consistent repayment record, generally six consecutive payments, has been demonstrated. At this time, we may reclassify the loan to performing. For loans that qualify as TDRs, we will classify the interest collected as interest income once the aforementioned criteria for non-accrual loans is met and demonstrated. However, loans classified as TDRs remain classified as such for the life of the loan, except in limited circumstances, when it is determined that the borrower is performing under the modified terms and the loan is subsequently restructured and re-written in a new agreement at an (i) interest rate greater than or equal to an acceptable market rate for a comparable new loan at the time of the restructuring, and (ii) there has been no principal forgiveness.
At December 31, 2016, non-accrual loans were $20.7 million, representing an increase of $2.4 million, or 13%, since December 31, 2015. The increase was driven by one significant loan within commercial real estate that had a recorded investment balance at December 31, 2016 of $11.3 million. Excluding this one commercial real estate loan, non-accrual for the loans at December 31, 2016 were $9.4 million, which would have represented a decrease of $9.0 million, or 51%, since December 31, 2015. Overall, our asset quality at December 31, 2016 continues to remain strong with non-performing assets to total assets of 0.67% and non-performing loans to total loans of 0.97%.
At December 31, 2015, non-performing loans were $23.2 million, or 0.93% of total loans, representing an increase of $2.0 million, or 9%, since December 31, 2014. The increase in non-performing loans was due to the classification of $10.6 million of acquired loans (at fair value) as non-accrual as of the acquisition date. Excluding these acquired loans designated as non-accrual, our total non-performing loans decreased $8.9 million at December 31, 2015 compared to December 31, 2014 due to the ongoing resolution of non-performing loans.
47
The following table highlights the interest income that would have been recognized if loans on non-accrual status had been current in accordance with their original terms ("foregone interest income") and the interest income recognized on non-performing loans and performing TDRs for the periods indicated.
|
For The Year Ended
December 31,
|
||||||||||||
|
2016
|
2015
|
2014
|
||||||||||
|
Foregone interest income
|
$
|
888
|
|
$
|
586
|
|
$
|
842
|
|
|||
|
Interest income recognized on non-performing loans and performing TDRs
|
182
|
|
204
|
|
191
|
|
||||||
Potential Problem Loans
.
Potential problem loans consist of classified accruing commercial and commercial real estate loans that were between 30 and 89 days past due. Such loans are characterized by weaknesses in the financial condition of our borrowers or collateral deficiencies. Based on historical experience, the credit quality of some of these loans may improve due to changes in collateral values or the financial condition of the borrowers, while the credit quality of other loans may deteriorate, resulting in some amount of loss. These loans are not included in the above analysis of non-accrual loans. At December 31, 2016 potential problem loans amounted to $808,000, or 0.03% of total loans.
Past Due Loans
.
Past due loans consist of accruing loans that were between 30 and 89 days past due. The following table presents the recorded investment of past due loans at the dates indicated:
|
December 31,
|
||||||||
|
2016
|
2015
|
|||||||
|
Loans 30 – 89 days past due:
|
|
|
|
|
||||
|
Residential real estate loans
|
$
|
2,470
|
|
$
|
3,590
|
|
||
|
Commercial real estate loans
|
971
|
|
4,295
|
|
||||
|
Commercial loans
|
851
|
|
637
|
|
||||
|
Consumer and home equity loans
|
1,018
|
|
1,255
|
|
||||
|
HPFC
|
1,029
|
|
165
|
|
||||
|
Total loans 30 – 89 days past due
|
$
|
6,339
|
|
$
|
9,942
|
|
||
|
Loans 30 – 89 days past due to total loans
|
0.24
|
%
|
0.40
|
%
|
||||
ALL
.
We use a methodology to systematically measure the amount of estimated loan loss exposure inherent in the loan portfolio for purposes of establishing a sufficient ALL. The ALL is management’s best estimate of the probable loan losses as of the balance sheet date. The allowance is increased by provisions charged to earnings and by recoveries of amounts previously charged-off, and is reduced by charge-offs on loans.
As part of normal course, we continuously monitor, and, at least annually, update our factors used to determine the general allowance for each loan portfolio segment. To derive our general allowance loss factors we utilize: (i) our historical loss data for each respective loan portfolio segment; (ii) identify other inherent risks within each portfolio segment, including, but not limited to, concentration risks, loans approved by the Company's Board of Directors that are an exception to our internal loan policy, and construction loans; and (iii) consider certain qualitative factors that may influence a borrower's ability to repay their loan.
Our policy is to individually evaluate for impairment loans with a principal balance greater than $250,000 or more and are classified as substandard or doubtful and are on non-accrual status. Loans are deemed impaired if it is probable that payment of interest and principal will not be made in accordance with the contractual terms of the loan agreement are considered impaired. Loans that are individually-evaluated for impairment in accordance with our policy are excluded from allocation of any general loss factor.
We did not have any ALL methodology changes in during 2016. In the fourth quarter of 2015, we revised our methodology for the ALL whereby we no longer provided for an unallocated reserve, but, instead, incorporated the qualitative factors into our general reserve. Historically, the unallocated reserve served as a method to account for qualitative risks, including general economic and market risks, within our portfolio without specifically assigning to any one or more portfolio segments. At December 31, 2015 and 2014, our reported unallocated reserve was $0 and $2.4 million, respectively. The change in
48
methodology did not have any impact on our reported ALL or provision for loan losses at or for the year ended December 31, 2015.
Reserve for Unfunded Commitments
.
The reserve for unfunded commitments is based on management’s estimate of the amount required to reflect the probable inherent losses on outstanding letters and unused loan credit lines. Adequacy of the reserve is determined using a methodology similar to the one that analyzes the allowance for loan losses. Additionally, management must also estimate the likelihood that these commitments would be funded and become loans.
The following table sets forth information concerning the activity in our ALL during the periods indicated:
|
At or For the Year Ended
December 31,
|
||||||||||||||||||||
|
2016
|
2015
|
2014
|
2013
|
2012
|
||||||||||||||||
|
ALL at the beginning of period
|
$
|
21,166
|
|
$
|
21,116
|
|
$
|
21,590
|
|
$
|
23,044
|
|
$
|
23,011
|
|
|||||
|
Provision for loan losses
|
5,269
|
|
1,938
|
|
2,224
|
|
2,052
|
|
3,791
|
|
||||||||||
|
Charge-offs:
|
|
|
|
|
|
|
|
|
||||||||||||
|
Residential real estate
|
356
|
|
801
|
|
785
|
|
1,059
|
|
1,197
|
|
||||||||||
|
Commercial real estate
|
315
|
|
481
|
|
361
|
|
952
|
|
593
|
|
||||||||||
|
Commercial
|
2,218
|
|
655
|
|
1,544
|
|
1,426
|
|
1,393
|
|
||||||||||
|
Consumer and home equity
|
409
|
|
679
|
|
754
|
|
837
|
|
1,319
|
|
||||||||||
|
HPFC
|
507
|
|
—
|
|
—
|
|
—
|
|
—
|
|
||||||||||
|
Total loan charge-offs
|
3,805
|
|
2,616
|
|
3,444
|
|
4,274
|
|
4,502
|
|
||||||||||
|
Recoveries:
|
|
|
|
|
|
|
|
|
|
|
||||||||||
|
Residential real estate
|
95
|
|
55
|
|
165
|
|
35
|
|
73
|
|
||||||||||
|
Commercial real estate
|
50
|
|
74
|
|
135
|
|
121
|
|
222
|
|
||||||||||
|
Commercial
|
332
|
|
389
|
|
395
|
|
495
|
|
406
|
|
||||||||||
|
Consumer and home equity
|
9
|
|
210
|
|
51
|
|
117
|
|
43
|
|
||||||||||
|
HPFC
|
—
|
|
—
|
|
—
|
|
—
|
|
—
|
|
||||||||||
|
Total loan recoveries
|
486
|
|
728
|
|
746
|
|
768
|
|
744
|
|
||||||||||
|
Net charge-offs
|
3,319
|
|
1,888
|
|
2,698
|
|
3,506
|
|
3,758
|
|
||||||||||
|
ALL at the end of the period
|
$
|
23,116
|
|
$
|
21,166
|
|
$
|
21,116
|
|
$
|
21,590
|
|
$
|
23,044
|
|
|||||
|
Components of allowance for credit losses:
|
|
|
|
|
|
|
|
|
|
|
||||||||||
|
ALL
|
$
|
23,116
|
|
$
|
21,166
|
|
$
|
21,116
|
|
$
|
21,590
|
|
$
|
23,044
|
|
|||||
|
Liability for unfunded credit commitments
|
11
|
|
22
|
|
17
|
|
21
|
|
45
|
|
||||||||||
|
Balance of allowance for credit losses at end of the period
|
$
|
23,127
|
|
$
|
21,188
|
|
$
|
21,133
|
|
$
|
21,611
|
|
$
|
23,089
|
|
|||||
|
Total loans, excluding loans held for sale
|
$
|
2,594,564
|
|
$
|
2,490,206
|
|
$
|
1,772,610
|
|
$
|
1,563,866
|
|
$
|
1,514,028
|
|
|||||
|
Average loans outstanding
|
$
|
2,567,092
|
|
$
|
1,948,621
|
|
$
|
1,681,297
|
|
$
|
1,580,859
|
|
$
|
1,535,648
|
|
|||||
|
Net charge-offs to average loans outstanding
|
0.13
|
%
|
0.10
|
%
|
0.16
|
%
|
0.22
|
%
|
0.24
|
%
|
||||||||||
|
Provision for loan losses to average loans outstanding
|
0.21
|
%
|
0.10
|
%
|
0.13
|
%
|
0.13
|
%
|
0.25
|
%
|
||||||||||
|
ALL to total loans
|
0.89
|
%
|
0.85
|
%
|
1.19
|
%
|
1.38
|
%
|
1.52
|
%
|
||||||||||
|
Allowance for credit losses to net charge-offs
|
696.81
|
%
|
1,122.25
|
%
|
783.28
|
%
|
616.40
|
%
|
614.40
|
%
|
||||||||||
For the year ended December 31, 2016, 2015 and 2014, we provided $5.3 million, $1.9 million and $2.2 million, respectively, of provision expense to the ALL. The increase in provision expense of $3.3 million in 2016 compared to 2015 was driven by loan growth year-over-year of $104.4 million, as well as the credit deterioration of two large loan relationships: (i) a syndication relationship we acquired as part of the Merger that resulted in incremental provision expense in 2016 of $1.4 million; and (ii) a
49
large commercial real estate loan that was downgraded from passing to substandard in 2016 that resulted in incremental provision expense for 2016 of $1.3 million. As of December 31, 2016, we had charged-off the entire syndication relationship, except for $1.5 million, which resulted in an increase in our net charge-offs to average loans ratio in the third quarter of 2016 and a modest increase of 3 basis points in our net charge-offs to average loans ratio to 0.13% for the year ended December 31, 2016 compared to last year. We have provided for a specific reserve of $1.3 million on the aforementioned commercial real estate loan for which the recorded investment balances was $11.3 million at December 31, 2016. We have not charged-off any of the aforementioned commercial real estate loan as of December 31, 2016.
The decrease in the provision for loan losses in 2015 was primarily attributable to the continued improvement in the general economic condition of our borrowers supported by a decrease in annualized net charge-offs to average loans of 6 basis points for 2015 compared to 2014. Furthermore, our asset quality metrics have continued to show favorable trends as non-performing loans to total loans at December 31, 2015 was 0.93%, representing a decrease of 26 basis points since December 31, 2014, and non-performing assets to total assets at December 31, 2015 was 0.66%, representing a decrease of 16 basis points. The improving asset quality metrics was reflective of the resolution of problem loans over recent years.
For further discussion of the ALL, please refer to “—Critical Accounting Policies” within Item 7 hereof, as well as Notes 1 and 4 of the consolidated financial statements within Item 8 of this report.
The following table sets forth information concerning the allocation of the ALL by loan categories at the dates indicated.
|
December 31,
|
|||||||||||||||||||||||||||||||||||
|
|
2016
|
2015
|
2014
|
2013
|
2012
|
||||||||||||||||||||||||||||||
|
Amount
|
Percent of Loans in Each Category to Total Loans
|
Amount
|
Percent of Loans in Each Category to Total Loans
|
Amount
|
Percent of Loans in Each Category to Total Loans
|
Amount
|
Percent of Loans in Each Category to Total Loans
|
Amount
|
Percent of Loans in Each Category to Total Loans
|
||||||||||||||||||||||||||
|
Residential real estate loans
|
$
|
4,160
|
|
31
|
%
|
$
|
4,545
|
|
33
|
%
|
$
|
4,899
|
|
33
|
%
|
$
|
5,603
|
|
36
|
%
|
$
|
6,996
|
|
37
|
%
|
||||||||||
|
Commercial real estate loans
|
12,154
|
|
41
|
%
|
10,432
|
|
37
|
%
|
7,951
|
|
36
|
%
|
4,374
|
|
34
|
%
|
4,549
|
|
32
|
%
|
|||||||||||||||
|
Commercial loans
|
3,755
|
|
13
|
%
|
3,241
|
|
12
|
%
|
3,354
|
|
15
|
%
|
6,220
|
|
11
|
%
|
5,933
|
|
12
|
%
|
|||||||||||||||
|
Consumer and home equity loans
|
2,375
|
|
13
|
%
|
2,924
|
|
15
|
%
|
2,528
|
|
16
|
%
|
2,722
|
|
19
|
%
|
2,704
|
|
19
|
%
|
|||||||||||||||
|
HPFC
|
672
|
|
2
|
%
|
24
|
|
3
|
%
|
—
|
|
—
|
%
|
—
|
|
—
|
%
|
—
|
|
—
|
%
|
|||||||||||||||
|
Unallocated
|
—
|
|
—
|
%
|
—
|
|
—
|
%
|
2,384
|
|
—
|
%
|
2,671
|
|
—
|
%
|
2,862
|
|
—
|
%
|
|||||||||||||||
|
|
$
|
23,116
|
|
100
|
%
|
$
|
21,166
|
|
100
|
%
|
$
|
21,116
|
|
100
|
%
|
$
|
21,590
|
|
100
|
%
|
$
|
23,044
|
|
100
|
%
|
||||||||||
Refer to Note 4 of the consolidated financial statements within Item 8 of this report for discussion of the risk characteristics for each portfolio segment considered when evaluating the ALL.
Investment in BOLI
Our BOLI asset totaled $78.1 million and $59.9 million at
December 31, 2016
and
2015
, respectively. The increase year-over-year reflects additional purchases in 2016 of $16.7 million. BOLI provides a means to mitigate increasing employee benefit costs. We expect to benefit from the BOLI contracts as a result of the tax-free growth in cash surrender value and death benefits that are expected to be generated over time. The largest risk to the BOLI program is credit risk of the insurance carriers. To mitigate this risk, annual financial condition reviews are completed on all carriers. BOLI is invested in the “general account” of quality insurance companies or in separate account products. Each insurance carrier had an A.M. Best rating of "A-" or better at
December 31, 2016
. BOLI is included in the consolidated statements of condition at its cash surrender value. Increases in BOLI’s cash surrender value are reported as a component of non-interest income in the consolidated statements of income.
Deposits
The Company, through the Bank, receives checking, savings and time deposits primarily from customers located within its geographic market area. Other forms of deposits include brokered deposits and CDARS. Total deposits at
December 31, 2016
were $2.8 billion, which included brokered deposits of $272.6 million. Total deposits at
December 31, 2016
increased $102.2 million over December 31,
2015
.
50
The following table presents certain deposit information for the periods indicated.
|
For the Year Ended
December 31,
|
|||||||||||||||||||||
|
2016
|
2015
|
2014
|
|||||||||||||||||||
|
Average
Balance
|
Average
Rate Paid
|
Average
Balance
|
Average
Rate Paid
|
Average
Balance
|
Average
Rate Paid
|
||||||||||||||||
|
Deposits:
|
|||||||||||||||||||||
|
Demand
|
$
|
386,189
|
|
—
|
%
|
$
|
292,776
|
|
—
|
%
|
$
|
251,609
|
|
—
|
%
|
||||||
|
Interest checking
|
724,222
|
|
0.13
|
%
|
543,330
|
|
0.08
|
%
|
465,740
|
|
0.07
|
%
|
|||||||||
|
Savings
|
461,794
|
|
0.06
|
%
|
306,536
|
|
0.06
|
%
|
250,148
|
|
0.06
|
%
|
|||||||||
|
Money market
|
490,155
|
|
0.42
|
%
|
394,367
|
|
0.33
|
%
|
413,712
|
|
0.29
|
%
|
|||||||||
|
Total core deposits
|
2,062,360
|
|
0.16
|
%
|
1,537,009
|
|
0.12
|
%
|
1,381,209
|
|
0.12
|
%
|
|||||||||
|
Certificates of deposit
|
489,040
|
|
0.78
|
%
|
357,972
|
|
0.87
|
%
|
328,887
|
|
0.95
|
%
|
|||||||||
|
Total deposits
|
2,551,400
|
|
0.28
|
%
|
1,894,981
|
|
0.26
|
%
|
1,710,096
|
|
0.28
|
%
|
|||||||||
|
Brokered deposits
|
231,610
|
|
0.69
|
%
|
229,079
|
|
0.65
|
%
|
157,265
|
|
0.94
|
%
|
|||||||||
|
Total deposits, including brokered deposits
|
$
|
2,783,010
|
|
0.31
|
%
|
$
|
2,124,060
|
|
0.31
|
%
|
$
|
1,867,361
|
|
0.34
|
%
|
||||||
Borrowings and Advances
We utilize a variety of funding sources to manage our borrowings, including, but not limited to, FHLBB and correspondent bank overnight borrowings, FHLBB advances due in less than 90 days and more than 90 days, customer and wholesale repurchase agreements, and subordinated debentures. We pro-actively monitor our borrowings through Management and Board ALCO as part of prudent balance sheet, earnings, and liquidity management. We manage and designate our borrowings internally, and manage to such, through use of short-term borrowings and long-term borrowings. Short-term borrowings include, but are not limited to, FHLBB and correspondent bank overnight borrowings, FHLBB advances due in less than 90 days, and customer repurchase agreements. Long-term borrowings include, but are not limited to, FHLBB advances greater than 90 days, wholesale repurchase agreements, and subordinated debentures.
At
December 31, 2016
, our total borrowings were $599.7 million, representing an increase since December 31,
2015
of $27.3 million. Our borrowing strategy has been primarily to remain short given our current interest rate risk position. We continue to assess the need to extend funding advances based on the likelihood and timing of interest rates rising as part of Management and Board ALCO.
We issued $15.0 million of subordinated debt on October 8, 2015, which qualifies as Tier II regulatory capital. The interest rate on the subordinated debt was 5.50% per annum, fixed for the ten-year term and payable semi-annually on April 15 and October 15 each year. We may redeem the subordinated debt at par starting on October 15, 2020 plus accrued and unpaid interest, or earlier if (i) they no longer qualify as Tier II capital for regulatory capital purposes; (ii) a change in law that prevents us from deducting interest payable for U.S. federal income tax purposes, or (iii) we are required to register as an investment company pursuant to the Investment Company Act of 1940. The subordinated debt is schedule to mature on October 15, 2025.
51
The following table below provides certain information on our short-term borrowings (as described for managing borrowings) at and for the period ended:
|
December 31,
|
|||||||||||
|
2016
|
2015
|
2014
|
|||||||||
|
FHLBB and correspondent bank overnight borrowings:
|
|||||||||||
|
Balance outstanding at end of year
|
$
|
89,450
|
|
$
|
12,800
|
|
$
|
43,100
|
|
||
|
Average daily balance outstanding
|
36,492
|
|
18,229
|
|
21,368
|
|
|||||
|
Maximum balance outstanding at any month end
|
157,197
|
|
70,000
|
|
50,700
|
|
|||||
|
Weighted average interest rate for the year
|
0.57
|
%
|
0.35
|
%
|
0.31
|
%
|
|||||
|
Weighted average interest rate at end of year
|
0.80
|
%
|
0.51
|
%
|
0.30
|
%
|
|||||
|
FHLBB advances less than 90 days:
|
|||||||||||
|
Balance outstanding at end of year
|
$
|
190,000
|
|
$
|
230,000
|
|
$
|
245,000
|
|
||
|
Average daily balance outstanding
|
258,713
|
|
253,679
|
|
253,719
|
|
|||||
|
Maximum balance outstanding at any month end
|
370,000
|
|
285,000
|
|
295,000
|
|
|||||
|
Weighted average interest rate for the year
|
0.71
|
%
|
0.25
|
%
|
0.20
|
%
|
|||||
|
Weighted average interest rate at end of year
|
0.76
|
%
|
0.46
|
%
|
0.24
|
%
|
|||||
|
Customer repurchase agreements:
|
|||||||||||
|
Balance outstanding at end of year
|
$
|
225,605
|
|
$
|
184,989
|
|
$
|
157,757
|
|
||
|
Average daily balance outstanding
|
198,403
|
|
153,101
|
|
142,497
|
|
|||||
|
Maximum balance outstanding at any month end
|
239,862
|
|
194,625
|
|
175,060
|
|
|||||
|
Weighted average interest rate for the year
|
0.28
|
%
|
0.20
|
%
|
0.16
|
%
|
|||||
|
Weighted average interest rate at end of year
|
0.31
|
%
|
0.24
|
%
|
0.17
|
%
|
|||||
FHLBB short-term and long-term borrowings are collateralized by a blanket lien on qualified collateral consisting primarily of loans with first mortgages secured by one- to four-family properties, certain commercial real estate loans, certain pledged investment securities and other qualified assets. The carrying value of residential real estate and commercial loans pledged as collateral was $1.1 billion at December 31, 2016 and 2015. The carrying value of securities pledged as collateral at the FHLBB was $400,000 and $544,000 at
December 31, 2016
and
2015
, respectively.
Shareholders’ Equity
Total shareholders’ equity at December 31, 2016 was $391.5 million, which was an increase of $28.4 million, or 8%, since December 31, 2015. The increase in our shareholders' equity was driven by normal operating activity, including, but not limited to, net income of $40.1 million for the year ended December 31, 2016, partially offset by dividends declared to our shareholders of $12.9 million.
On August 30, 2016, the Company's Board of Directors declared a three-for-two stock split for shareholders of record on September 15, 2016 to be issued on September 30, 2016. The three-for-two stock split was completed to increase liquidity in our common stock. At December 31, 2016, issued and outstanding shares of Company common stock totaled 15.5 million shares of the total 20.0 million authorized.
In the fourth quarter, the Company's Board of Directors approved an increase of $0.03 per share, or 15%, to $0.23 per share in its fourth quarter dividend declared to shareholders of record on January 17, 2017 and payable on January 31, 2017. For the year ended December 31, 2016, we issued dividends to our shareholders of $0.83 per share, compared to $0.80 per share and $0.74 per share for the years ended December 31, 2015 and 2014, respectively.
52
The following table presents certain information regarding shareholders’ equity for the year ended:
|
December 31,
|
||||||||||||
|
|
2016
|
2015
|
2014
|
|||||||||
|
Return on average assets
|
1.04
|
%
|
0.70
|
%
|
0.92
|
%
|
||||||
|
Return on average equity
|
10.47
|
%
|
7.54
|
%
|
10.37
|
%
|
||||||
|
Average equity to average assets
|
9.97
|
%
|
9.26
|
%
|
8.83
|
%
|
||||||
|
Dividend payout ratio
(1)
|
32.22
|
%
|
50.60
|
%
|
33.73
|
%
|
||||||
|
Book value per share
(2)
|
$
|
25.30
|
|
$
|
23.69
|
|
$
|
22.00
|
|
|||
|
Tangible book value per share
(non-GAAP)
(2)
|
$
|
18.74
|
|
$
|
16.89
|
|
$
|
17.68
|
|
|||
|
Dividends declared per share
(2)
|
$
|
0.83
|
|
$
|
0.80
|
|
$
|
0.74
|
|
|||
|
(1)
|
The increase in 2015 reflects an increase in shares outstanding of 4.1 million issued in connection with the Merger, combined with merger and acquisition costs of $10.4 million associated with the Merger that reduced 2015 net income.
|
|
(2)
|
Per share data has been adjusted to reflect the three-for-two split effective September 30, 2016, for all periods presented. Refer to Note 13 within Item 8.
|
Liquidity
Our liquidity needs require the availability of cash to meet the withdrawal demands of depositors and credit commitments to borrowers. Liquidity is defined as our ability to maintain availability of funds to meet customer needs, as well as to support our asset base. The primary objective of liquidity management is to maintain a balance between sources and uses of funds to meet our cash flow needs in the most economical and expedient manner. Due to the potential for unexpected fluctuations in both deposits and loans, active management of liquidity is necessary. We maintain various sources of funding and levels of liquid assets in excess of regulatory guidelines in order to satisfy their varied liquidity demands. We monitor liquidity in accordance with internal guidelines and all applicable regulatory requirements. At
December 31, 2016
and
2015
, our level of liquidity exceeded target levels. We believe that we currently have appropriate liquidity available to respond to liquidity demands. Sources of funds that we utilize consist of deposits, borrowings from the FHLBB and other sources, cash flows from operations, prepayments and maturities of outstanding loans, investments and mortgage-backed securities and the sale of mortgage loans.
Deposits continue to represent our primary source of funds. For the year ended
December 31, 2016
, average deposits (excluding brokered deposits) of $2.6 billion increased $656.4 million, or 35%, compared to the same period of
2015
. The increase in average deposit balances (excluding brokered deposits) reflects our strong organic deposit growth during
2016
, as well as the full year impact of the deposits acquired in connection with the Merger. Included within our money market deposits at
December 31, 2016
and
2015
were $72.1 million and $59.6 million, respectively, of deposits from Camden National Wealth Management which represent client funds. These deposits fluctuate with changes in the portfolios of the clients of Camden National Wealth Management.
Borrowings are used to supplement deposits as a source of liquidity. In addition to borrowings and advances from the FHLBB, we utilize brokered deposits, purchase federal funds, and sell securities under agreements to repurchase. For the year ended
December 31, 2016
and
2015
average total borrowings (including brokered deposits) were $848.0 million and $788.3 million, respectively. The increase in average borrowings was driven by an increase of $45.3 million in retail repurchase agreements due to the Merger. We secure borrowings from the FHLBB, whose advances remain the largest non-deposit-related funding source, with qualified residential real estate loans, certain investment securities and certain other assets available to be pledged. Through the Bank, we have available lines of credit with the FHLBB of $9.9 million, with PNC Bank of $50.0 million, and with the FRB Discount Window of $72.3 million at
December 31, 2016
. We had no outstanding balances on these lines of credit at
December 31, 2016
. Long-term borrowings represent securities sold under repurchase agreements with major brokerage firms. Both wholesale and customer repurchase agreements are secured by mortgage-backed securities and government-sponsored enterprises. The Company also has a $10.0 million line of credit with a maturity date of December 20, 2017. We had no outstanding balance on these lines of credit at
December 31, 2016
.
53
We believe the investment portfolio and residential loan portfolio provide a significant amount of contingent liquidity that could be accessed in a reasonable time period through sales of those portfolios. We also believe that we have additional untapped access to the brokered deposit market, wholesale reverse repurchase transaction market and the FRB discount window. These sources are considered as liquidity alternatives in our contingent liquidity plan. We believe that the level of liquidity is sufficient to meet current and future funding requirements; however, changes in economic conditions, including consumer saving habits and the availability or access to the national brokered deposit and wholesale repurchase markets, could significantly impact our liquidity position.
The maturity dates of CDs, including brokered CDs, in denominations of $100,000 or more as of
December 31, 2016
are set forth in the following table. We did not hold any other time deposits in denominations of $100,000 or more at
December 31, 2016
. These deposits are generally considered to be more rate sensitive than other deposits and, therefore, more likely to be withdrawn to obtain higher yields elsewhere if available.
|
Time remaining until maturity:
|
December 31, 2016
|
|||
|
Less than 3 months
|
$
|
55,314
|
|
|
|
3 months through 6 months
|
40,587
|
|
||
|
6 months through 12 months
|
35,865
|
|
||
|
Over 12 months
|
125,476
|
|
||
|
|
$
|
257,242
|
|
|
Loan demand also affects our liquidity position. Of the loans maturing over one year, 57% were variable rate loans. The following table presents the maturities of loans at
December 31, 2016
:
|
< 1 Year
|
1 - 5 Years
|
More than
5 Years
|
Total
|
|||||||||||||
|
Maturity Distribution:
|
|
|
|
|
|
|
|
|
||||||||
|
Fixed Rate:
|
|
|
|
|
|
|
||||||||||
|
Residential real estate
|
$
|
532
|
|
$
|
6,206
|
|
$
|
467,604
|
|
$
|
474,342
|
|
||||
|
Commercial real estate
|
17,728
|
|
77,788
|
|
107,915
|
|
203,431
|
|
||||||||
|
Commercial
|
15,267
|
|
57,539
|
|
71,823
|
|
144,629
|
|
||||||||
|
Consumer and home equity
|
2,085
|
|
13,478
|
|
260,706
|
|
276,269
|
|
||||||||
|
Total fixed rate
|
35,612
|
|
155,011
|
|
908,048
|
|
1,098,671
|
|
||||||||
|
Variable Rate:
|
|
|
|
|
|
|
|
|
||||||||
|
Residential real estate
|
2,048
|
|
2,075
|
|
324,029
|
|
328,152
|
|
||||||||
|
Commercial real estate
|
11,180
|
|
50,794
|
|
785,375
|
|
847,349
|
|
||||||||
|
Commercial
|
55,990
|
|
87,312
|
|
106,120
|
|
249,422
|
|
||||||||
|
Consumer and home equity
|
39
|
|
2,505
|
|
68,426
|
|
70,970
|
|
||||||||
|
Total variable rate
|
69,257
|
|
142,686
|
|
1,283,950
|
|
1,495,893
|
|
||||||||
|
|
$
|
104,869
|
|
$
|
297,697
|
|
$
|
2,191,998
|
|
$
|
2,594,564
|
|
||||
54
Capital Resources
As part of our goal to operate a safe, sound and profitable financial organization, we are committed to maintaining a strong capital base. Shareholders’ equity totaled $391.5 million and $363.2 million at
December 31, 2016
and
December 31, 2015
, respectively, which amounted to 10% of total assets as of the respective dates. Refer to "— Financial Condition — Liabilities and Shareholders' Equity" for discussion regarding changes in shareholders' equity since
December 31, 2015
.
Our principal cash requirement is the payment of dividends on our common stock, as and when declared by the Company's Board of Directors. We paid dividends to shareholders in the aggregate amount of $12.9 million, $10.6 million and $8.3 million for the year ended
December 31, 2016
,
2015
and 2014, respectively. The Company's Board of Directors approves cash dividends on a quarterly basis after careful analysis and consideration of various factors, including the following: (i) capital position relative to total assets, (ii) risk-based assets, (iii) total classified assets, (iv) economic conditions, (v) growth rates for total assets and total liabilities, (vi) earnings performance and projections and (vii) strategic initiatives and related capital requirements. All dividends declared and distributed by the Company will be in compliance with applicable state corporate law and regulatory requirements.
We are primarily dependent upon the payment of cash dividends by the Bank, our wholly-owned subsidiary, to service our commitments. We, as the sole shareholder of the Bank, are entitled to dividends, when and as declared by the Bank's Board of Directors from legally available funds. For the year ended December 31, 2016, 2015, and 2014, the Bank declared dividends payable to the Company in the amount of $16.0 million, $39.2 million, which included a $30.0 million special dividend that was paid in connection with the Merger, and $12.8 million, respectively. Under regulations prescribed by the OCC, without prior OCC approval, the Bank may not declare dividends in any year in excess of the Bank’s (i) net income for the current year, (ii) plus its retained net income for the prior two years. If we are required to use dividends from the Bank to service unforeseen commitments in the future, we may be required to reduce the dividends paid to our shareholders going forward.
Please refer to Note 20 of the consolidated financial statements for discussion and details of the Company and Bank's capital regulatory requirements. At
December 31, 2016
and
2015
, the Company and Bank met all regulatory capital requirements and the Bank continues to be classified as "Well Capitalized" under the prompt correction action provisions.
Contractual Obligations and Off-Balance Sheet Commitments
In the normal course of business, we are a party to credit related financial instruments with off-balance sheet risk, which are not reflected in the consolidated statements of condition. These financial instruments include lending commitments and letters of credit. Those instruments involve varying degrees of credit risk in excess of the amount recognized in the consolidated statements of condition. We follow the same credit policies in making commitments to extend credit and conditional obligations as we do for on-balance sheet instruments, including requiring similar collateral or other security to support financial instruments with credit risk. Our exposure to credit loss in the event of nonperformance by the customer is represented by the contractual amount of those instruments. Since many of the commitments are expected to expire without being drawn upon, the total amount does not necessarily represent future cash requirements. At
December 31, 2016
, we had the following levels of commitments to extend credit:
|
Total Amount Committed
|
Commitment Expires in:
|
|||||||||||||||||||
|
< 1 Year
|
1 – 3 Years
|
4 – 5 Years
|
> 5 Years
|
|||||||||||||||||
|
Home equity line of credit commitments
|
$
|
454,225
|
|
$
|
181,473
|
|
$
|
31,220
|
|
$
|
9,046
|
|
$
|
232,486
|
|
|||||
|
Commercial commitment letters
|
83,103
|
|
83,103
|
|
—
|
|
—
|
|
—
|
|
||||||||||
|
Residential loan origination
|
17,795
|
|
17,795
|
|
—
|
|
—
|
|
—
|
|
||||||||||
|
Letters of credit
|
2,580
|
|
2,580
|
|
—
|
|
—
|
|
—
|
|
||||||||||
|
Other commitments to extend credit
|
432
|
|
432
|
|
—
|
|
—
|
|
—
|
|
||||||||||
|
Total
|
$
|
558,135
|
|
$
|
285,383
|
|
$
|
31,220
|
|
$
|
9,046
|
|
$
|
232,486
|
|
|||||
55
We are a party to several off-balance sheet contractual obligations through lease agreements on a number of branch facilities. Additionally, we enter into agreements routinely as part of our normal business to manage deposits and borrowings. At December 31, 2016, we had an obligation and commitment to make future payments under each of these contracts as follows:
|
Total Amount Committed
|
Payments Due Per Period
|
|||||||||||||||||||
|
< 1 Year
|
1 – 3 Years
|
4 – 5 Years
|
> 5 Years
|
|||||||||||||||||
|
Operating leases
|
$
|
6,632
|
|
$
|
1,427
|
|
$
|
2,331
|
|
$
|
1,091
|
|
$
|
1,783
|
|
|||||
|
Capital leases
|
1,189
|
|
126
|
|
252
|
|
256
|
|
555
|
|
||||||||||
|
FHLBB borrowings – overnight
|
89,450
|
|
89,450
|
|
—
|
|
—
|
|
—
|
|
||||||||||
|
FHLBB advances less than 90 days
|
190,000
|
|
190,000
|
|
—
|
|
—
|
|
—
|
|
||||||||||
|
FHLBB advances – other
|
30,000
|
|
20,000
|
|
—
|
|
10,000
|
|
—
|
|
||||||||||
|
Commercial repurchase agreements
|
5,007
|
|
5,007
|
|
—
|
|
—
|
|
—
|
|
||||||||||
|
Retail repurchase agreements
|
225,605
|
|
225,605
|
|
—
|
|
—
|
|
—
|
|
||||||||||
|
Junior subordinated debentures
|
44,229
|
|
—
|
|
—
|
|
—
|
|
44,229
|
|
||||||||||
|
Subordinated debentures
|
14,526
|
|
—
|
|
—
|
|
—
|
|
14,526
|
|
||||||||||
|
Other contractual obligations
|
2,106
|
|
2,106
|
|
—
|
|
—
|
|
—
|
|
||||||||||
|
Total
|
$
|
608,744
|
|
$
|
533,721
|
|
$
|
2,583
|
|
$
|
11,347
|
|
$
|
61,093
|
|
|||||
Borrowings from the FHLBB consist of short- and long-term fixed and variable rate borrowings that are collateralized by all stock in the FHLBB and a blanket lien on qualified collateral consisting primarily of loans with first mortgages secured by one-to four-family properties, certain pledged investment securities and other qualified assets.
We have an obligation and commitment to repay all short- and long-term borrowings. These commitments and borrowings and the related payments are made during the normal course of business.
Derivatives
Hedge Instruments.
From time to time, we may enter into derivative instruments as partial hedges against large fluctuations in interest rates. We may also enter into fixed-rate interest rate swaps and floor instruments to partially hedge against potentially lower yields on the variable prime rate loan category in a declining rate environment. If interest rates were to decline, resulting in reduced income on the adjustable rate loans, there would be an increased income flow from the interest rate swap and floor instrument. We may also enter into variable rate interest rate swaps and cap instruments to partially hedge against increases in short-term borrowing rates. If interest rates were to rise, resulting in an increased interest cost, there would be an increased income flow from the interest rate swaps and cap instruments. These financial instruments are factored into our overall interest rate risk position. We regularly review the credit quality of the counterparty from which the instruments have been purchased.
At
December 31, 2016
, we had $43.0 million of notional in interest rate swaps on our junior subordinated debentures that have been designated as hedges in accordance with GAAP. The arrangement allowed us to fix our floating rate debentures and mitigate our interest exposure in a rising rate environment. Quarterly, in conjunction with financial reporting, we assess the hedge relationship for effectiveness. At December 31, 2016 and 2015, we concluded that each individual hedge on our remaining cash flows continues to be effective and no ineffectiveness on the hedge relationship has been recorded within our consolidated statements of income for the year ended December 31, 2016, 2015 or 2014. At December 31, 2016 and 2015, our hedge on the aforementioned junior subordinated debentures was in an unrealized loss position of $8.4 million and $9.2 million, respectively. As these hedge was an effective hedge at December 31, 2016 and 2015, the unrealized loss was recorded within AOCI, net of taxes.
At December 31, 2016 and 2015, we had $50.0 million of notional on two tranches interest rate swaps on 30-day FHLBB advances. One $25.0 million tranche has an expiration date of February 25, 2018 at a fixed interest rate of 1.54%, while the other $25.0 million tranche has an expiration date of February 25, 2019 at a fixed rate of 1.74%. We entered into these interest rate swaps to help mitigate our interest rate exposure on short-term borrowings in a rising interest rate environment. At December 31, 2016 and 2015, we concluded that each individual hedge on our remaining cash flows continues to be effective and no ineffectiveness on the hedge relationship has been recorded within our consolidated statements of income for the year ended December 31, 2016 and 2015 (that interest rate swap was not in effect at December 31, 2014). At December 31, 2016 and 2015, our hedge on the aforementioned 30-day FHLBB advances was in an unrealized loss position of $389,000 and
56
$576,000, respectively. As these hedge was an effective hedge at December 31, 2016 and 2015, the unrealized loss was recorded within AOCI, net of taxes.
We are required, as part of contractual arrangements with our interest rate swap counterparties, to pledge collateral should our interest rate swap positions be in a net unrealized loss position, or receive collateral from the counterparty if their interest rate swap positions are in a net unrealized loss position. We maintain a master netting agreement with the counterparty and thus post collateral (or receive collateral) based on the net position of the interest rate swaps. At December 31, 2016, we had pledged total cash collateral to the counterparty of $10.2 million.
Refer to Note 18 of the consolidated financial statements within Item 8 for further discussion.
Customer Loan Swaps.
In our normal course of lending with commercial real estate customers, we enter into interest rate swaps with qualifying commercial customers, from time to time, to provide them with a means to lock into a long-term fixed rate, while simultaneously entering into an arrangement with a counterparty to swap the long-term fixed rate loan to variable rate to allow us to effectively manage our interest rate exposure. Unlike the aforementioned cash flow hedges above, these arrangements are not designated as hedges and provide little risk to us as the interest rate swap agreements have substantially equivalent and offsetting terms. We mitigate our commercial customer counterparty credit risk exposure through our loan policy and underwriting process, which includes credit approval limits, monitoring procedures, and obtaining collateral, where appropriate. We mitigate our institutional counterparty credit risk exposure by limiting the institutions for which we will enter into interest swap arrangements through an approved listing by the Company's board of directors.
At December 31, 2016 and 2015, we had a notional amount of $266.3 million and $142.9 million, respectively, in interest rate swap agreements with commercial customers and an equal notional amount with a counterparty related to our commercial loan swap program. We did not elect to account for this derivative program as a hedge in accordance with GAAP. At December 31, 2016 and 2015, the fair value of these arrangements were $1.9 million and $3.2 million, respectively, and were recorded gross on our consolidated statements of condition as assets and liabilities. As the interest rate swap agreements have substantially equivalent and offsetting terms, they do not materially change our interest rate risk or present any material exposure to our consolidated statements of income.
We are required, as part of contractual arrangements with our interest rate swap counterparties, to pledge collateral should our interest rate swap positions be in a net unrealized loss position, or receive collateral from the counterparty if their interest rate swap positions are in a net unrealized loss position. We maintain a master netting agreement with the counterparty and thus post collateral (or receive collateral) based on the net position of the interest rate swaps. At December 31, 2016, our customer loan swap position with the counterparty was in an unrealized gain position, as such, we had not posted any cash as collateral. The borrower's (customer) commercial property serves as collateral for the swap agreement.
Refer to Note 18 of the consolidated financial statements within Item 8 for further discussion.
Interest Rate Locks and Forward Delivery Commitments.
As part of our normal mortgage origination process, we provide potential borrowers with the option to lock their interest rate based on current market prices. During the period from commitment date to the loan closing date, we are subject to interest rate risk as market rates fluctuate. In an effort to mitigate such risk, we may enter into forward delivery sales commitments, typically on a "best-efforts" basis, with certain approved investors. We account for our interest rate locks for which we intend to sell in the secondary market as derivatives. Furthermore, we do not account for the forward delivery commitment to the secondary market investor as a derivative until the loan has been originated.
At December 31, 2016 and 2015, we had a notional amount of $15.2 million and $20.7 million, respectively, of interest rate lock commitments on mortgages within our loan pipeline for which we intend to sell. At December 31, 2016 and 2015, the fair value of our interest rate locks was $187,000 and $139,000, respectively. For the year ended December 31, 2016, 2015 and 2014, we recorded the change in unrealized gains on these interest rate lock commitments of $48,000, $139,000, and $0, respectively, within mortgage banking income, net within our consolidated statements of income.
At December 31, 2016 and 2015, we had a notional amount of $15.1 million and $0, respectively, of forward delivery commitments to secondary market investors accounted for as a derivative. At December 31, 2016 and 2015, the fair value of our forward delivery commitments was $278,000 and $0, respectively. For the year ended December 31, 2016, 2015 and 2014, we recorded the change in unrealized gains on these forward delivery commitments of $278,000, $0, and $0, respectively, within mortgage banking income, net within our consolidated statements of income.
Refer to Note 18 of the consolidated financial statements for further details.
57
Loan Servicing
At December 31, 2016 and 2015, as sub-servicer, we serviced loans for other third party investors totaling $938.8 million and $963.0 million, respectively. At December 31, 2016 and 2015, custodial escrow balances maintained in connection with the loans serviced totaled $11.1 million and $7.1 million, respectively.
For the year ended December 31, 2016, 2015 and 2014, we served as the primary sub-servicer of loans originated by MSHA. The Company entered into a contract with MSHA to perform loan servicing on the MSHA portfolio for a fee. For the year ended December 31, 2016, 2015 and 2014, the Company earned fees of $1.7 million, $1.2 million, and $1.2 million, respectively, for the servicing of MSHA loans and was presented within other income on the consolidated statements of income. Custodial escrow balances maintained in connection with the foregoing loan servicing for MSHA, and included in demand deposits on the consolidated statements of condition, were $6.3 million and $4.3 million at December 31, 2016 and 2015, respectively. Effective close of business on December 31, 2016, we exited our sub-servicer relationship with MSHA and all custodial escrow balances maintained in connection with the MSHA sub-servicing relationship were paid out in January 2017.
The servicing agreements with our third party investors, generally, provide broad rights for them. For example, each investor typically claims the right to demand that we repurchase loans that breach the seller’s representations and warranties made in connection with the initial sale of the loans. In addition, as the servicer of the loans, the servicer guides impose certain time-lines for resolving delinquent loans through workout efforts or liquidation and impose compensatory fees on us if those deadlines are not satisfied other than for reasons beyond our control. The investors also have a contractual right to demand indemnification or loan repurchase for certain servicing breaches. For example, we would be required to indemnify them for or against failures by us to perform our servicing obligations or acts or omissions that involve willful malfeasance, bad faith or gross negligence in the performance of, or reckless disregard of, our duties. We record expenses for servicing-related claims and loan repurchases when it is probable that such claims or repurchases will be made and the amounts are reasonably estimable.
Market Risk
Market risk is the risk of loss in a financial instrument arising from adverse changes in market rates/prices, such as interest rates, foreign currency exchange rates, commodity prices and equity prices. Our primary market risk exposure is interest rate risk. The ongoing monitoring and management of this risk is an important component of our asset and liability management process, which is governed by policies established by the Bank’s Board of Directors that are reviewed and approved annually. The Board ALCO delegates responsibility for carrying out the asset/liability management policies to Management ALCO. In this capacity, Management ALCO develops guidelines and strategies impacting our asset/liability management-related activities based upon estimated market risk sensitivity, policy limits and overall market interest rate levels/trends. Management ALCO and Board ALCO jointly meet on a quarterly basis to review strategies, policies, economic conditions and various activities as part of the management of these risks.
Interest Rate Risk
Interest rate risk represents the sensitivity of earnings to changes in market interest rates. As interest rates change, the interest income and expense streams associated with our financial instruments also change, thereby impacting net interest income, the primary component of our earnings. Board ALCO and Management ALCO utilize the results of a detailed and dynamic simulation model to quantify the estimated exposure of net interest income to sustained interest rate changes. While Board ALCO and Management ALCO routinely monitor simulated net interest income sensitivity over a rolling two-year horizon, they also utilize additional tools to monitor potential longer-term interest rate risk.
The simulation model captures the impact of changing interest rates on the interest income received and interest expense paid on all interest-earning assets and interest-bearing liabilities reflected on our consolidated statements of condition, as well as for derivative financial instruments. This sensitivity analysis is compared to ALCO policy limits, which specify a maximum tolerance level for net interest income exposure over a one- and two-year horizon, assuming no balance sheet growth, given a 200 basis point upward and downward shift in interest rates. Although our policy specifies a downward shift of 200 basis points, this would results in negative rates as many deposit and funding rates are now below 2.00%. Our current downward shift is 100 basis points. A parallel and pro rata shift in rates over a 12-month period is assumed. Using this approach, we are able to produce simulation results that illustrate the effect that both a gradual change of rates and a “rate shock” have on earnings expectations. In the down 100 basis points scenario, Federal Funds and Treasury yields are floored at 0.01% while Prime is floored at 3.00%. All other market rates are floored at 0.25%.
58
For the year ended
December 31, 2016
and
2015
, our net interest income sensitivity analysis reflected the following changes to net interest income assuming no balance sheet growth and a parallel shift in interest rates. All rate changes were “ramped” over the first 12-month period and then maintained at those levels over the remainder of the ALCO simulation horizon.
|
Estimated Changes in
Net Interest Income
|
||||||
|
Rate Change from Year 1 – Base
|
2016
|
2015
|
||||
|
Year 1
|
|
|
|
|
||
|
+200 basis points
|
(0.93
|
)%
|
(1.27
|
)%
|
||
|
-100 basis points
|
(1.45
|
)%
|
(1.39
|
)%
|
||
|
Year 2
|
|
|
||||
|
+200 basis points
|
3.63
|
%
|
2.46
|
%
|
||
|
-100 basis points
|
(7.73
|
)%
|
(7.74
|
)%
|
||
The preceding sensitivity analysis does not represent a forecast and should not be relied upon as being indicative of expected operating results. These hypothetical estimates are based upon numerous assumptions including, among others, the nature and timing of interest rate levels, yield curve shape, prepayments on loans and securities, deposit decay rates, pricing decisions on loans and deposits and reinvestment/replacement of asset and liability cash flows. While assumptions are developed based upon current economic and local market conditions, we cannot make any assurances as to the predictive nature of these assumptions, including how customer preferences or competitor influences might change.
If rates remain at or near current levels, net interest income is projected to be virtually flat as loan rates have repriced to current rates and the cost of funds remains unchanged. Beyond the first year, net interest income decreases slightly. If rates decrease 100 basis points, net interest income is projected to decrease as loans reprice into lower yields and funding costs have limited capacity to reduce the cost of funds in the first year. In the second year, net interest income is projected to continue to decrease as loans and investment cash flow reprice into lower yields as prepayments increase while reduction in the cost of funds become limited. If rates increase 200 basis points, net interest income is projected to decrease in the first year due to the repricing of short-term funding. In the second year, net interest income is projected to increase as loan and investment yields continue to reprice/reset into higher yields and the cost of funds lags.
The economic value of equity at risk simulation is conducted in tandem with the net interest income simulations, to determine a longer term view of the Company’s interest rate risk position by capturing longer-term re-pricing risk and option-risk embedded in the balance sheet. It measures the sensitivity of economic value of equity to changes in interest rates. The economic value of equity at risk simulation values only the current balance sheet. As with net interest income modeling, this simulation captures product characteristics such as loan resets, re-pricing terms, maturity dates, rate caps and floors. Key assumptions include loan prepayment speeds, deposit pricing betas and non-maturity deposit decay rates. These assumptions can have significant impacts on valuation results as the assumptions remain in effect for the entire life of each asset and liability. All key assumptions are subject to a periodic review.
59
Our base case economic value of equity at risk is calculated by estimating the net present value of all future cash flows from existing assets and liabilities using current interest rates. The base case scenario assumes that future interest rates remain unchanged.
|
|
Economic Value of Equity
|
|||||
|
December 31,
|
||||||
|
2016
|
2015
|
|||||
|
+200 basis points
|
9.91
|
%
|
9.92
|
%
|
||
|
+100 basis points
|
10.15
|
%
|
10.18
|
%
|
||
|
Base
|
10.29
|
%
|
10.32
|
%
|
||
|
-100 basis points
|
9.78
|
%
|
9.42
|
%
|
||
Periodically, if deemed appropriate, we use interest rate swaps, floors and caps, which are common derivative financial instruments, to hedge our interest rate risk position. The Board of Directors has approved hedging policy statements governing the use of these instruments. As of
December 31, 2016
, we had $43.0 million notional principal amount of interest rate swap agreements related to the junior subordinated debentures, $50.0 million notional principal amount of forward-starting interest swap agreements related to our short-term funding and $266.3 million notional principal amount of interest rate swap agreements related to our commercial loan level derivative program. The Board and Management ALCO monitor derivative activities relative to their expectations and our hedging policies.
Other Market Risk(s)
We are also subject to other market risks, including but not limited to, operational risks, actions of government agencies, solvency of counter-parties, changes in investment markets, and changes in consumer demand. For further descriptions of these additional market risks, refer to Item 1A. “Risk Factors.”
Recent Accounting Pronouncements
See Note 1 to the consolidated financial statements for details of recently issued accounting pronouncements and their expected impact on our financial statements.
Related Party Transactions
The Bank is permitted, in its normal course of business, to make loans to certain officers and directors of the Company and its subsidiaries under terms that are consistent with the Bank’s lending policies and regulatory requirements. In addition to extending loans to certain officers and directors of the Company and its subsidiaries on terms consistent with the Bank’s lending policies, federal banking regulations also require training, audit and examination of the adherence to this policy by representatives of the federal and national regulators (also known as “Regulation O” requirements). Notes 4 and 9 to the consolidated financial statements with Item 8 provide related party lending and deposit information, respectively. We have not entered into significant non-lending related party transactions.
The information contained in the Market Risk section of Item 7. "Management’s Discussion and Analysis of Financial Condition and Results of Operations" is incorporated herein by reference.
60
CONSOLIDATED STATEMENTS OF CONDITION
|
December 31,
|
||||||||
|
(In thousands, except number of shares)
|
2016
|
2015
|
||||||
|
ASSETS
|
|
|
|
|
||||
|
Cash and due from banks
|
$
|
87,707
|
|
$
|
79,488
|
|
||
|
Securities:
|
||||||||
|
Available-for-sale, at fair value
|
779,867
|
|
750,338
|
|
||||
|
Held to maturity, at amortized cost
|
94,609
|
|
84,144
|
|
||||
|
Federal Home Loan Bank and Federal Reserve Bank stock, at cost
|
23,203
|
|
21,513
|
|
||||
|
Total securities
|
897,679
|
|
855,995
|
|
||||
|
Loans held for sale, at fair value
|
14,836
|
|
10,958
|
|
||||
|
Loans
|
2,594,564
|
|
2,490,206
|
|
||||
|
Less: allowance for loan losses
|
(23,116
|
)
|
(21,166
|
)
|
||||
|
Net loans
|
2,571,448
|
|
2,469,040
|
|
||||
|
Goodwill
|
94,697
|
|
95,657
|
|
||||
|
Other intangible assets
|
6,764
|
|
8,667
|
|
||||
|
Bank-owned life insurance
|
78,119
|
|
59,917
|
|
||||
|
Premises and equipment, net
|
42,873
|
|
45,959
|
|
||||
|
Deferred tax assets
|
39,263
|
|
39,716
|
|
||||
|
Interest receivable
|
8,654
|
|
7,985
|
|
||||
|
Other real estate owned
|
922
|
|
1,304
|
|
||||
|
Other assets
|
21,268
|
|
34,658
|
|
||||
|
Total assets
|
$
|
3,864,230
|
|
$
|
3,709,344
|
|
||
|
LIABILITIES AND SHAREHOLDERS’ EQUITY
|
|
|
|
|
||||
|
Liabilities
|
||||||||
|
Deposits:
|
|
|
|
|
||||
|
Demand
|
$
|
406,934
|
|
$
|
357,673
|
|
||
|
Interest checking
|
701,494
|
|
740,084
|
|
||||
|
Savings and money market
|
979,263
|
|
912,668
|
|
||||
|
Retail certificates of deposit
|
468,203
|
|
516,867
|
|
||||
|
Brokered deposits
|
272,635
|
|
199,087
|
|
||||
|
Total deposits
|
2,828,529
|
|
2,726,379
|
|
||||
|
Short-term borrowings
|
530,129
|
|
477,852
|
|
||||
|
Long-term borrowings
|
10,791
|
|
35,911
|
|
||||
|
Subordinated debentures
|
58,755
|
|
58,599
|
|
||||
|
Accrued interest and other liabilities
|
44,479
|
|
47,413
|
|
||||
|
Total liabilities
|
3,472,683
|
|
3,346,154
|
|
||||
|
Commitments and Contingencies
|
|
|
|
|
||||
|
Shareholders’ Equity
|
||||||||
|
Common stock, no par value: authorized 20,000,000 shares, issued and outstanding 15,476,379 and 15,330,717 on December 31, 2016 and 2015, respectively
|
156,041
|
|
153,083
|
|
||||
|
Retained earnings
|
249,415
|
|
222,329
|
|
||||
|
Accumulated other comprehensive loss:
|
||||||||
|
Net unrealized losses on available-for-sale securities, net of tax
|
(6,085
|
)
|
(3,801
|
)
|
||||
|
Net unrealized losses on cash flow hedging derivative instruments, net of tax
|
(5,694
|
)
|
(6,374
|
)
|
||||
|
Net unrecognized losses on postretirement plans, net of tax
|
(2,130
|
)
|
(2,047
|
)
|
||||
|
Total accumulated other comprehensive loss
|
(13,909
|
)
|
(12,222
|
)
|
||||
|
Total shareholders’ equity
|
391,547
|
|
363,190
|
|
||||
|
Total liabilities and shareholders’ equity
|
$
|
3,864,230
|
|
$
|
3,709,344
|
|
||
The accompanying notes are an integral part of these consolidated financial statements.
61
|
For The Year Ended
December 31,
|
||||||||||||
|
(In thousands, except number of shares and per share data)
|
2016
|
2015
|
2014
|
|||||||||
|
Interest Income
|
|
|
|
|
|
|
||||||
|
Interest and fees on loans
|
$
|
109,224
|
|
$
|
81,221
|
|
$
|
70,654
|
|
|||
|
Interest on U.S. government and sponsored enterprise obligations
|
16,082
|
|
15,091
|
|
16,118
|
|
||||||
|
Interest on state and political subdivision obligations
|
2,836
|
|
2,208
|
|
1,256
|
|
||||||
|
Interest on federal funds sold and other investments
|
1,484
|
|
624
|
|
357
|
|
||||||
|
Total interest income
|
129,626
|
|
99,144
|
|
88,385
|
|
||||||
|
Interest Expense
|
|
|
|
|
|
|
||||||
|
Interest on deposits
|
8,633
|
|
6,511
|
|
6,267
|
|
||||||
|
Interest on borrowings
|
4,506
|
|
3,457
|
|
3,329
|
|
||||||
|
Interest on subordinated debentures
|
3,415
|
|
2,724
|
|
2,532
|
|
||||||
|
Total interest expense
|
16,554
|
|
12,692
|
|
12,128
|
|
||||||
|
Net interest income
|
113,072
|
|
86,452
|
|
76,257
|
|
||||||
|
Provision for credit losses
|
5,258
|
|
1,936
|
|
2,220
|
|
||||||
|
Net interest income after provision for credit losses
|
107,814
|
|
84,516
|
|
74,037
|
|
||||||
|
Non-Interest Income
|
|
|
|
|
|
|
||||||
|
Debit card income
|
7,578
|
|
5,277
|
|
4,675
|
|
||||||
|
Service charges on deposit accounts
|
7,210
|
|
6,423
|
|
6,229
|
|
||||||
|
Mortgage banking income, net
|
6,258
|
|
2,031
|
|
282
|
|
||||||
|
Income from fiduciary services
|
4,960
|
|
4,918
|
|
4,989
|
|
||||||
|
Bank-owned life insurance
|
2,594
|
|
1,680
|
|
1,437
|
|
||||||
|
Brokerage and insurance commissions
|
2,074
|
|
1,699
|
|
1,766
|
|
||||||
|
Other service charges and fees
|
1,962
|
|
1,573
|
|
1,461
|
|
||||||
|
Net gain on sale of securities
|
51
|
|
4
|
|
451
|
|
||||||
|
Other income
|
6,934
|
|
3,877
|
|
3,080
|
|
||||||
|
Total non-interest income
|
39,621
|
|
27,482
|
|
24,370
|
|
||||||
|
Non-Interest Expense
|
|
|
|
|
|
|
||||||
|
Salaries and employee benefits
|
48,072
|
|
37,220
|
|
32,669
|
|
||||||
|
Furniture, equipment and data processing
|
9,557
|
|
8,057
|
|
7,316
|
|
||||||
|
Net occupancy costs
|
7,088
|
|
5,695
|
|
5,055
|
|
||||||
|
Consulting and professional fees
|
3,234
|
|
2,625
|
|
2,368
|
|
||||||
|
Other real estate owned and collection costs
|
3,128
|
|
2,491
|
|
2,289
|
|
||||||
|
Regulatory assessments
|
2,777
|
|
2,184
|
|
1,982
|
|
||||||
|
Debit card expense
|
2,584
|
|
1,936
|
|
1,725
|
|
||||||
|
Amortization of intangible assets
|
1,903
|
|
1,306
|
|
1,148
|
|
||||||
|
Merger and acquisition costs
|
866
|
|
10,415
|
|
—
|
|
||||||
|
Other expenses
|
10,687
|
|
9,210
|
|
7,845
|
|
||||||
|
Total non-interest expense
|
89,896
|
|
81,139
|
|
62,397
|
|
||||||
|
Income before income tax expense
|
57,539
|
|
30,859
|
|
36,010
|
|
||||||
|
Income Tax Expense
|
17,472
|
|
9,907
|
|
11,440
|
|
||||||
|
Net income
|
$
|
40,067
|
|
$
|
20,952
|
|
$
|
24,570
|
|
|||
|
Per Share Data:
|
|
|
|
|
|
|
||||||
|
Basic earnings per share
|
$
|
2.59
|
|
$
|
1.73
|
|
$
|
2.19
|
|
|||
|
Diluted earnings per share
|
$
|
2.57
|
|
$
|
1.73
|
|
$
|
2.19
|
|
|||
|
Weighted average number of common shares outstanding
|
15,422,160
|
|
12,031,294
|
|
11,176,468
|
|
||||||
|
Diluted weighted average number of common shares outstanding
|
15,504,239
|
|
12,074,579
|
|
11,205,888
|
|
||||||
The accompanying notes are an integral part of these consolidated financial statements.
62
CONSOLIDATED STATEMENTS OF COMPREHENSIVE INCOME
|
For The Year Ended
December 31,
|
||||||||||||
|
(In thousands)
|
2016
|
2015
|
2014
|
|||||||||
|
Net income
|
$
|
40,067
|
|
$
|
20,952
|
|
$
|
24,570
|
|
|||
|
Other comprehensive income (loss):
|
|
|
|
|
|
|
||||||
|
Net change in unrealized gains (losses) on available-for-sale securities:
|
|
|
|
|
|
|
||||||
|
Net change in unrealized gains (losses) on available-for-sale securities, net of tax of $1,212, $1,873, and ($4,275), respectively
|
(2,251
|
)
|
(3,479
|
)
|
7,938
|
|
||||||
|
Net reclassification adjustment for gains included in net income, net of tax of $18, $1, and $158, respectively
(1)
|
(33
|
)
|
(3
|
)
|
(293
|
)
|
||||||
|
Net change in unrealized gains (losses) on available-for-sale securities, net of tax
|
(2,284
|
)
|
(3,482
|
)
|
7,645
|
|
||||||
|
Net change in unrealized gains (losses) on cash flow hedging derivatives:
|
||||||||||||
|
Net change in unrealized gains (losses) on cash flow hedging derivatives, net of tax of $343, $825, and $2,431, respectively
|
(637
|
)
|
(1,533
|
)
|
(4,515
|
)
|
||||||
|
Net reclassification adjustment for effective portion of cash flow hedges included in interest expense, net of tax of ($709), ($593), and ($600), respectively
(2)
|
1,317
|
|
1,102
|
|
1,114
|
|
||||||
|
Net change in unrealized gains (losses) on cash flow hedging derivatives, net of tax
|
680
|
|
(431
|
)
|
(3,401
|
)
|
||||||
|
Postretirement plans:
|
||||||||||||
|
Net actuarial loss, net of tax of $127, $21, and $225, respectively
|
(235
|
)
|
(39
|
)
|
(418
|
)
|
||||||
|
Reclassification of amortization of net unrecognized actuarial loss and of net prior service cost included in net periodic cost, net of tax of ($83), ($84), and ($51), respectively
(3)
|
152
|
|
155
|
|
96
|
|
||||||
|
Net gain (loss) on postretirement plans, net of tax
|
(83
|
)
|
116
|
|
(322
|
)
|
||||||
|
Other comprehensive income (loss)
|
(1,687
|
)
|
(3,797
|
)
|
3,922
|
|
||||||
|
Comprehensive income
|
$
|
38,380
|
|
$
|
17,155
|
|
$
|
28,492
|
|
|||
|
(1)
|
Reclassified into the consolidated statements of income within net gain on sale of securities.
|
|
(2)
|
Reclassified into the consolidated statements of income within interest on subordinated debentures.
|
|
(3)
|
Reclassified into the consolidated statements of income within salaries and employee benefits.
|
The accompanying notes are an integral part of these consolidated financial statements.
63
CONSOLIDATED STATEMENTS OF CHANGES IN SHAREHOLDERS’ EQUITY
|
Common Stock
|
Retained Earnings
|
Accumulated Other Comprehensive Loss
|
Total Shareholders’ Equity
|
||||||||||||||||
|
(In thousands, except number of shares and per share data)
|
Shares Outstanding
(1)
|
Amount
|
|||||||||||||||||
|
Balance at December 31, 2013
|
11,369,870
|
|
$
|
47,783
|
|
$
|
195,660
|
|
$
|
(12,347
|
)
|
$
|
231,096
|
|
|||||
|
2014 net income
|
—
|
|
—
|
|
24,570
|
|
—
|
|
24,570
|
|
|||||||||
|
Other comprehensive income, net of tax
|
—
|
|
—
|
|
—
|
|
3,922
|
|
3,922
|
|
|||||||||
|
Stock-based compensation expense
|
—
|
|
599
|
|
—
|
|
—
|
|
599
|
|
|||||||||
|
Exercise of stock options and issuance of vested share awards, net of repurchase for tax withholdings and tax benefit
|
41,496
|
|
328
|
|
—
|
|
—
|
|
328
|
|
|||||||||
|
Common stock repurchased
|
(272,033
|
)
|
(7,155
|
)
|
—
|
|
—
|
|
(7,155
|
)
|
|||||||||
|
Cash dividends declared ($0.74 per share)
(1)
|
—
|
|
—
|
|
(8,251
|
)
|
—
|
|
(8,251
|
)
|
|||||||||
|
Balance at December 31, 2014
|
11,139,333
|
|
41,555
|
|
211,979
|
|
(8,425
|
)
|
245,109
|
|
|||||||||
|
2015 net income
|
—
|
|
—
|
|
20,952
|
|
—
|
|
20,952
|
|
|||||||||
|
Other comprehensive loss, net of tax
|
—
|
|
—
|
|
—
|
|
(3,797
|
)
|
(3,797
|
)
|
|||||||||
|
Stock-based compensation expense
|
—
|
|
836
|
|
—
|
|
—
|
|
836
|
|
|||||||||
|
Exercise of stock options and issuance of vested share awards, net of repurchase for tax withholdings and tax benefit
|
66,741
|
|
753
|
|
—
|
|
—
|
|
753
|
|
|||||||||
|
Equity issuance costs
|
—
|
|
(612
|
)
|
—
|
|
—
|
|
(612
|
)
|
|||||||||
|
SBM acquisition common stock issuance
|
4,124,643
|
|
108,561
|
|
—
|
|
—
|
|
108,561
|
|
|||||||||
|
SBM acquisition non-qualified stock option awards
|
—
|
|
1,990
|
|
—
|
|
—
|
|
1,990
|
|
|||||||||
|
Cash dividends declared ($0.80 per share)
(1)
|
—
|
|
—
|
|
(10,602
|
)
|
—
|
|
(10,602
|
)
|
|||||||||
|
Balance at December 31, 2015
|
15,330,717
|
|
153,083
|
|
222,329
|
|
(12,222
|
)
|
363,190
|
|
|||||||||
|
Cumulative effect adjustment (Note 1)
|
—
|
|
72
|
|
(72
|
)
|
—
|
|
—
|
|
|||||||||
|
Cash in lieu for fractional shares paid due to the stock split (Note 13)
|
(173
|
)
|
(5
|
)
|
—
|
|
—
|
|
(5
|
)
|
|||||||||
|
2016 net income
|
—
|
|
—
|
|
40,067
|
|
—
|
|
40,067
|
|
|||||||||
|
Other comprehensive loss, net of tax
|
—
|
|
—
|
|
—
|
|
(1,687
|
)
|
(1,687
|
)
|
|||||||||
|
Stock-based compensation expense
|
—
|
|
1,997
|
|
—
|
|
—
|
|
1,997
|
|
|||||||||
|
Exercise of stock options and issuance of vested share awards, net of repurchase for tax withholdings and tax benefit
|
145,835
|
|
894
|
|
—
|
|
—
|
|
894
|
|
|||||||||
|
Cash dividends declared ($0.83 per share)
(1)
|
—
|
|
—
|
|
(12,909
|
)
|
—
|
|
(12,909
|
)
|
|||||||||
|
Balance at December 31, 2016
|
15,476,379
|
|
$
|
156,041
|
|
$
|
249,415
|
|
$
|
(13,909
|
)
|
$
|
391,547
|
|
|||||
|
(1)
|
Share and per share amounts have been adjusted to reflect the three-for-two stock split effective September 30, 2016, for all periods presented. Refer to Note 13 for further discussion.
|
The accompanying notes are an integral part of these consolidated financial statements.
64
|
For The Year Ended
December 31,
|
||||||||||||
|
(In thousands)
|
2016
|
2015
|
2014
|
|||||||||
|
Operating Activities
|
|
|
|
|
|
|
||||||
|
Net income
|
$
|
40,067
|
|
$
|
20,952
|
|
$
|
24,570
|
|
|||
|
Adjustments to reconcile net income to net cash provided by operating activities:
|
|
|
|
|
||||||||
|
Provision for credit losses
|
5,258
|
|
1,936
|
|
2,220
|
|
||||||
|
Depreciation and amortization expense
|
4,426
|
|
3,614
|
|
3,051
|
|
||||||
|
Purchase accounting accretion, net
|
(5,048
|
)
|
(367
|
)
|
(554
|
)
|
||||||
|
Investment securities amortization and accretion, net
|
3,135
|
|
2,244
|
|
1,784
|
|
||||||
|
Stock-based compensation expense
|
1,997
|
|
836
|
|
599
|
|
||||||
|
Amortization of intangible assets
|
1,903
|
|
1,306
|
|
1,148
|
|
||||||
|
Net gains on sale of securities
|
(51
|
)
|
(4
|
)
|
(451
|
)
|
||||||
|
Net increase in other real estate owned valuation allowance and (gain) loss on disposition
|
35
|
|
362
|
|
215
|
|
||||||
|
Originations of mortgage loans held for sale
|
(236,450
|
)
|
(72,032
|
)
|
(799
|
)
|
||||||
|
Proceeds from the sale of mortgage loans
|
238,351
|
|
62,485
|
|
830
|
|
||||||
|
Gain on sale of mortgage loans, net of origination costs
|
(6,201
|
)
|
(1,278
|
)
|
(31
|
)
|
||||||
|
Cost of fixed assets disposals associated with the SBM acquisition
|
—
|
|
1,130
|
|
—
|
|
||||||
|
(Increase) decrease in other assets
|
11,329
|
|
(7,062
|
)
|
(3,349
|
)
|
||||||
|
Increase (decrease) in other liabilities
|
(1,333
|
)
|
1,796
|
|
653
|
|
||||||
|
Net cash provided by operating activities
|
57,418
|
|
15,918
|
|
29,886
|
|
||||||
|
Investing Activities
|
|
|
|
|
|
|
||||||
|
Cash received in SBM acquisition, net of cash paid
|
—
|
|
59,917
|
|
—
|
|
||||||
|
Proceeds from sales and maturities of available-for-sale securities
|
184,564
|
|
156,434
|
|
134,358
|
|
||||||
|
Purchase of available-for-sale securities
|
(220,169
|
)
|
(111,170
|
)
|
(78,355
|
)
|
||||||
|
Purchase of securities held-to-maturity
|
(10,986
|
)
|
(64,355
|
)
|
(20,338
|
)
|
||||||
|
Net increase in loans
|
(103,699
|
)
|
(94,811
|
)
|
(196,670
|
)
|
||||||
|
Proceeds from the sale of premises and equipment
|
90
|
|
—
|
|
—
|
|
||||||
|
Purchase of premises and equipment
|
(1,671
|
)
|
(3,189
|
)
|
(1,316
|
)
|
||||||
|
Purchase of Federal Home Loan Bank and Federal Reserve Bank stock
|
(7,342
|
)
|
(1,594
|
)
|
(718
|
)
|
||||||
|
Proceeds from sale of Federal Home Loan Bank and Federal Reserve Bank stock
|
5,652
|
|
471
|
|
51
|
|
||||||
|
Proceeds from sale of other real estate owned
|
730
|
|
2,825
|
|
1,730
|
|
||||||
|
Recoveries of previously charged-off loans
|
486
|
|
728
|
|
746
|
|
||||||
|
Purchase of bank-owned life insurance, net of death benefit proceeds
|
(15,608
|
)
|
—
|
|
(10,000
|
)
|
||||||
|
Net cash used in investing activities
|
(167,953
|
)
|
(54,744
|
)
|
(170,512
|
)
|
||||||
|
Financing Activities
|
|
|
|
|
|
|
||||||
|
Net increase in deposits
|
103,027
|
|
71,825
|
|
118,435
|
|
||||||
|
Net proceeds from (repayments of) borrowings less than 90 days
|
77,227
|
|
(18,105
|
)
|
46,954
|
|
||||||
|
Repayments on Federal Home Loan Bank long-term advances
|
(25,000
|
)
|
(11,039
|
)
|
(60,073
|
)
|
||||||
|
Proceeds from Federal Home Loan Bank long-term advances
|
—
|
|
10,000
|
|
60,000
|
|
||||||
|
Repayments of wholesale repurchase agreements
|
(25,000
|
)
|
—
|
|
—
|
|
||||||
|
Issuance of subordinated debt, net of costs
|
—
|
|
14,464
|
|
—
|
|
||||||
|
Common stock repurchases
|
—
|
|
—
|
|
(7,475
|
)
|
||||||
|
Equity issuance costs
|
—
|
|
(612
|
)
|
—
|
|
||||||
|
Exercise of stock options and issuance of restricted stock, net of repurchase for tax withholdings and tax benefit
|
894
|
|
753
|
|
328
|
|
||||||
|
Cash dividends paid on common stock and cash in lieu for fractional shares paid due to stock split
|
(12,394
|
)
|
(9,785
|
)
|
(8,085
|
)
|
||||||
|
Net cash provided by financing activities
|
118,754
|
|
57,501
|
|
150,084
|
|
||||||
|
Net increase in cash and cash equivalents
|
8,219
|
|
18,675
|
|
9,458
|
|
||||||
|
Cash and cash equivalents at beginning of year
|
79,488
|
|
60,813
|
|
51,355
|
|
||||||
|
Cash and cash equivalents at end of year
|
$
|
87,707
|
|
$
|
79,488
|
|
$
|
60,813
|
|
|||
The accompanying notes are an integral part of these consolidated financial statements.
65
CONSOLIDATED STATEMENTS OF CASH FLOWS
(CONTINUED)
|
For The Year Ended
December 31,
|
||||||||||||
|
(In thousands)
|
2016
|
2015
|
2014
|
|||||||||
|
Supplemental information
|
|
|
|
|
|
|
||||||
|
Interest paid
|
$
|
16,661
|
|
$
|
12,588
|
|
$
|
12,158
|
|
|||
|
Income taxes paid
|
10,647
|
|
12,205
|
|
13,365
|
|
||||||
|
Transfer of loans and premises to other real estate owned
|
383
|
|
2,175
|
|
1,337
|
|
||||||
|
Measurement-period adjustments (Note 2)
|
960
|
|
—
|
|
—
|
|
||||||
|
Assets acquired in SBM acquisition, excluding net cash received (not adjusted for measurement-period adjustments)
|
—
|
|
729,283
|
|
—
|
|
||||||
|
Liabilities assumed in SBM acquisition (not adjusted for measurement-period adjustments)
|
—
|
|
729,500
|
|
—
|
|
||||||
|
Common stock and stock options issued for SBM acquisition
|
—
|
|
110,551
|
|
—
|
|
||||||
The accompanying notes are an integral part of these consolidated financial statements.
66
CAMDEN NATIONAL CORPORATION
NOTES TO THE CONSOLIDATED FINANCIAL STATEMENTS
(Dollar Amounts in Tables Expressed in Thousands, Except Per Share Data)
1. Business and Summary of Significant Accounting Policies
Acronyms and Abbreviations.
The acronyms and abbreviations identified below are used in the notes to the consolidated financial statements. The following is provided to aid the reader and provide a reference page when reviewing these notes to the consolidated financial statements.
|
Acadia Trust:
|
Acadia Trust, N.A. was a wholly-owned subsidiary of Camden National Corporation until its merger with Camden National Bank, a wholly-owned subsidiary of Camden National Corporation, on November 30, 2016.
|
IRS:
|
Internal Revenue Service
|
|
|
AFS:
|
Available-for-sale
|
LIBOR:
|
London Interbank Offered Rate
|
|
|
ALCO:
|
Asset/Liability Committee
|
LTIP:
|
Long-Term Performance Share Plan
|
|
|
ALL:
|
Allowance for loan losses
|
Management ALCO:
|
Management Asset/Liability Committee
|
|
|
AOCI:
|
Accumulated other comprehensive income (loss)
|
MBS:
|
Mortgage-backed security
|
|
|
ASC:
|
Accounting Standards Codification
|
Merger:
|
On October 16, 2015, the two-step merger of Camden National Corporation, SBM Financial, Inc. and Atlantic Acquisitions, LLC, a wholly-owned subsidiary of Camden National Corporation, was completed
|
|
|
ASU:
|
Accounting Standards Update
|
Merger Agreement:
|
Plan of Merger, dated as of March 29, 2015, by and among Camden National Corporation, SBM Financial, Inc. and Atlantic Acquisitions, LLC, a wholly-owned subsidiary of Camden National Corporation
|
|
|
Bank:
|
Camden National Bank, a wholly-owned subsidiary of Camden National Corporation
|
MSHA:
|
Maine State Housing Authority
|
|
|
BOLI:
|
Bank-owned life insurance
|
MSRs:
|
Mortgage servicing rights
|
|
|
Board ALCO:
|
Board of Directors' Asset/Liability Committee
|
MSPP:
|
Management Stock Purchase Plan
|
|
|
BSA:
|
Bank Secrecy Act
|
OTTI:
|
Other-than-temporary impairment
|
|
|
CCTA:
|
Camden Capital Trust A, an unconsolidated entity formed by Camden National Corporation
|
NIM:
|
Net interest margin on a fully-taxable basis
|
|
|
CDARS:
|
Certificate of Deposit Account Registry System
|
N.M.:
|
Not meaningful
|
|
|
CDs:
|
Certificate of deposits
|
Non-Agency:
|
Non-agency private issue collateralized mortgage obligation
|
|
|
Company:
|
Camden National Corporation
|
NRV:
|
Net realizable value
|
|
|
CMO:
|
Collateralized mortgage obligation
|
OCC:
|
Office of the Comptroller of the Currency
|
|
|
DCRP:
|
Defined Contribution Retirement Plan
|
OCI:
|
Other comprehensive income (loss)
|
|
|
EPS:
|
Earnings per share
|
OFAC:
|
Office of Foreign Assets Control
|
|
|
FASB:
|
Financial Accounting Standards Board
|
OREO:
|
Other real estate owned
|
|
|
FDIC:
|
Federal Deposit Insurance Corporation
|
SBM:
|
SBM Financial, Inc., the parent company of The Bank of Maine
|
|
|
FHLB:
|
Federal Home Loan Bank
|
SERP:
|
Supplemental executive retirement plans
|
|
|
FHLBB:
|
Federal Home Loan Bank of Boston
|
TDR:
|
Troubled-debt restructured loan
|
|
|
FRB:
|
Federal Reserve System Board of Governors
|
UBCT:
|
Union Bankshares Capital Trust I, an unconsolidated entity formed by Union Bankshares Company that was subsequently acquired by Camden National Corporation
|
|
|
FRBB:
|
Federal Reserve Bank of Boston
|
U.S.:
|
United States of America
|
|
|
GAAP:
|
Generally accepted accounting principles in the United States
|
2003 Plan:
|
2003 Stock Option and Incentive Plan
|
|
|
HPFC:
|
Healthcare Professional Funding Corporation, a wholly-owned subsidiary of Camden National Bank
|
2012 Plan:
|
2012 Equity and Incentive Plan
|
|
|
HTM:
|
Held-to-maturity
|
2013 Repurchase Program:
|
2013 Common Stock Repurchase Program, approved by the Company's Board of Directors
|
|
67
General Business.
Camden National Corporation, a Maine corporation, is the bank holding company for Camden National Bank. The Bank serves individuals, businesses, municipalities and non-profits through a network of
61
banking offices and
84
ATMs across Maine, and
two
lending offices in New Hampshire and Massachusetts. Effective the close of business, November 30, 2016, Acadia Trust merged into the Bank. Upon completion of the Acadia Trust merger into the Bank, Camden National Wealth Management was created to operate as a division of the Bank and provide trust and investment management services to its clients, who are primarily located in Maine. The Company's primary source of income is from providing loans to individuals and small- to mid-sized companies through its market area. The Bank's deposits are insured by the FDIC, subject to regulatory limits.
Principles of Consolidation
.
The accompanying consolidated financial statements include the accounts of the Company and the Bank (which includes the consolidated accounts of HPFC, Property A, Inc. and Property P, Inc.). All intercompany accounts and transactions have been eliminated in consolidation. Assets held by the Bank in a fiduciary capacity, through Camden National Wealth Management, are not assets of the Company and, therefore, are not included in the consolidated statements of condition. The Company also owns
100%
of the common stock of CCTA and UBCT. These entities are unconsolidated subsidiaries of the Company.
Reclassifications
.
Certain reclassifications have been made to prior year amounts to conform to the current year's presentation.
Use of Estimates
.
The preparation of the financial statements in conformity with GAAP requires management to make estimates and assumptions that affect the reported amounts of assets and liabilities and disclosure of contingent assets and liabilities at the date of the financial statements and the reported amounts of revenues and expenses during the reporting periods. Actual results could vary from these estimates. Several estimates are particularly critical and are susceptible to significant near-term change, including the ALL, the accounting for business combinations including subsequent impairment analyses for goodwill and other intangible assets, accounting for income taxes, postretirement benefits and asset impairment judgments, including OTTI of investment securities.
Subsequent Events
.
The Company has evaluated events and transactions subsequent to
December 31, 2016
for potential recognition or disclosure as required by GAAP.
Significant Concentration of Credit Risk.
The Bank grants loans primarily to customers in Maine. Although the Bank has a diversified loan portfolio, a large portion of the Bank's loans are secured by commercial or residential real estate located in Maine and is subject to volatility within Maine's real estate market. Furthermore, the debtors' ability to honor their contracts is highly dependent upon other economic factors throughout Maine. The Bank does not generally engage in non-recourse lending and typically will require the principals of any commercial borrower to obligate themselves personally on the loan.
Cash and Cash Equivalents
.
For the purposes of reporting cash flows, cash and cash equivalents consist of cash on hand and amounts due from banks. The Bank is required by the FRB to maintain cash reserves equal to a percentage of deposits. The Company maintains the reserve balances in cash on hand or at the FRB.
At December 31, 2016 and 2015, the Company had
$50.3 million
and
$42.9 million
, respectively, of cash on hand and in non-interest bearing accounts with other banks. At December 31, 2016 and 2015, the Company had
$37.4 million
and
$36.6 million
, respectively, of cash held in interest-bearing accounts with other banks.
Investment Securities.
Investment securities are classified at the time of purchase as AFS, HTM, or trading. The classification of investment securities are constantly re-evaluated for consistency with corporate goals and objectives.
Trading securities are carried at fair value on the consolidated statements of condition with subsequent changes to fair value recorded in earnings. At December 31, 2016 and 2015, the Company did
no
t have any investment securities classified as trading securities on its consolidated statements of condition.
Debt securities for which the Company has the positive intent and ability to hold to maturity are classified as HTM and recorded at amortized cost on the consolidated statements of condition. At December 31, 2016 and 2015, the Company had investment securities of
$94.6 million
and
$84.1 million
, respectively, classified as HTM and carried at amortized cost on its consolidated statements of condition.
68
Investment securities that are not classified as HTM or trading securities are classified as AFS and are carried at fair value on the Company's consolidated statements of condition with subsequent changes to fair value recorded within AOCI, net of tax. At December 31, 2016 and 2015, the Company had investment securities of
$779.9 million
and
$750.3 million
, respectively, classified as AFS and carried at fair value on its consolidated statements of condition.
Purchase premiums and discounts are recognized in interest income on the consolidated statements of income using the interest method over the period to maturity (or issuer call option date, if earlier) and are recorded on the trade date. Gains and losses on the sale of investment securities are recognized within non-interest income on the consolidated statements of income and are recorded on the trade date using the specific identification method.
Management conducts a quarterly review and evaluation of its debt and equity securities portfolio to determine if the decline in fair value of any security appears to be other-than-temporary. The factors considered by management in its review include, but are not limited to: the length of time and the extent to which the fair value has been less than cost, the financial condition and near-term prospects of the issuer, the credit ratings of the security or issuer, whether the decline in fair value appears to be issuer specific or, alternatively, a reflection of general market or industry conditions, and the Company’s intent and ability to hold the security for a period of time sufficient to allow for a recovery in fair value.
Should the Company determine that the decline in the fair value of an equity security was other-than-temporary, the Company recognizes the impairment on the equity security within non-interest income on the consolidated statements of income when identified. For debt securities where the Company does not intend to sell the security and it is not more-likely-than-not that the Company will be required to sell the security before recovery of its amortized cost basis, the other-than-temporary decline in the fair value of the debt security related to: (i) credit loss is recognized in non-interest income on the consolidated statements of income; and (ii) other factors is recognized in AOCI, net of tax. For debt securities where the Company intends to sell the security or more-likely-than-not will be required to sell the security before recovery of its amortized cost, the Company recognizes the OTTI equal to the entire difference between the security’s cost basis and its fair value within non-interest income on the consolidated statements of income.
The Bank is a member of the FHLBB and FRBB, and as a member, the Bank is required to hold a certain amount of FHLBB and FRBB common stock. This stock is a non-marketable equity security and, is reported at cost.
Loans Held for Sale.
The Company has elected the fair value option for loans classified as held for sale on the consolidated statements of condition. Designation of loans as held for sale is determined based on the Company's intent and is, typically, completed as the loans are underwritten. The fair value for loans held for sale is determined using quoted secondary market prices or executed sales agreements. Management constantly evaluates its loan portfolio, in conjunction with asset/liability management practices, and will opt to sell certain loans, typically new
30
-year residential mortgages, to manage the Company's interest rate exposure and for other business purposes, including generating fee income through mortgage sale gains. At December 31, 2016 and 2015, the Company had designated
$14.8 million
and
$11.0 million
, respectively, of loans designated as held for sale on its consolidated statements of condition.
Originated Loans and Acquired Loans
.
Loans are reported at amortized cost, or amortized acquired fair value in the case of acquired loans, adjusted for any partial charge-offs and net of any deferred loan fees or costs. For originated loans, interest income is accrued based upon the daily principal amount outstanding except for loans on non-accrual status. For acquired loans, interest income is also accrued based upon the daily principal amount outstanding and is then further adjusted by the accretion of any discount or amortization of any premium associated with the loan.
For originated loans, loan fees and certain direct origination costs are deferred and amortized into interest income over the contractual term of the loan using the level-yield method. When a loan is paid off, the unamortized portion is recognized in interest income.
A loan is classified as non-accrual generally when it becomes 90 days past due as to interest or principal payments, or sooner if management considers such action to be prudent. All previously accrued but unpaid interest on non-accrual loans is reversed from interest income in the period in which the loan is considered delinquent and the amortization of any unamortized net deferred origination loan fees/costs stops. Interest payments received on non-accrual loans, including impaired loans, are applied as a reduction of principal. A loan remains on non-accrual status until all principal and interest amounts contractually due are brought current and future payments are reasonably assured. Should a loan transition from non-accrual status back to accrual status, the unrecognized interest earned during the period the loan was on non-accrual status and unamortized deferred origination fees and costs are recognized over the remaining contractual life of the loan using the level-yield method.
69
ALL.
The ALL is established through provisions for loan losses charged to income. Losses on loans, including impaired loans, are charged to the ALL when all or a portion of a loan is deemed to be uncollectible. Recoveries of loans previously charged off are credited to the ALL when realized.
In determining the appropriate level of ALL, the Company uses a methodology to systematically measure the amount of estimated loan loss exposure inherent in the loan portfolio. The methodology includes three elements: (1) identification of loss allocations for certain specific loans, (2) loss allocation factors for certain loan types based on credit risk and loss experience, and (3) general loss allocations for other qualitative and environmental factors.
The allocations for specific loans component relates to loans that have a principal balance of
$250,000
or more that are classified as substandard or doubtful and are on non-accrual status. For such loans that are also classified as impaired, an allowance is established when the discounted expected future cash flows (or collateral value or observable market price) of the impaired loan is lower than the recorded investment of that loan. Loans that do not meet the above criteria are separated into risk pools by portfolio segment and risk ratings. The Company then evaluates each risk pool collectively for impairment through loss allocation factors. Subsequent to December 31, 2016, the Company amended its internal policy for assessing individual loans for impairment by increasing the principal balance threshold to
$500,000
. The qualitative factors for assessing a loan individually for impairment remain unchanged. The change in the Company's internal policy will be effective for periods beginning on January 1, 2017.
The Company uses a risk rating system for certain loan segments to determine the credit quality of these loan pools and applies the related loss allocation factors. In assessing the risk rating of a particular loan, the Company considers, among other factors, the obligor’s debt capacity, financial condition, the level of the obligor’s earnings, the amount and sources of repayment, the performance with respect to loan terms, the adequacy of collateral, the level and nature of contingent liabilities, management strength, and the industry in which the obligor operates. These factors are based on an evaluation of historical information, as well as subjective assessment and interpretation of current conditions. Emphasizing one factor over another, or considering additional factors that may be relevant in determining the risk rating of a particular loan but which are not currently an explicit part of the Company's methodology, could impact the risk rating assigned to that loan.
The Company at least annually, and more frequently as deemed prudent by management, reassesses and revises the loss allocation factors used in the assignment of loss exposure to appropriately reflect the analysis of loss experience. Portfolios of more homogenous populations of loans including home equity and consumer loans are analyzed as groups taking into account delinquency rates and other economic conditions which may affect the ability of borrowers to meet debt service requirements, including interest rates and energy costs. The Company also considers regulatory guidance, historical loss ranges, portfolio composition, and other changes in the portfolio. An additional allocation is determined based on a judgmental process whereby management considers qualitative and quantitative assessments of other environmental factors.
Since the methodology is based upon historical experience and trends, as well as management’s judgment, factors may arise that result in different estimations. Significant factors that could give rise to changes in these estimates may include, but are not limited to, changes in economic conditions in the Company’s market areas, concentration of risk, declines in local property values, and regulatory guidance.
Loans past due 30 days or more are considered delinquent. In general, secured loans that are delinquent for 90 consecutive days are placed on non-accrual status, and are subject to impairment and/or loss assessment in accordance with established internal policy. In general, unsecured loans that are delinquent for 90 consecutive days are charged off.
In cases where a borrower experiences financial difficulties and the Company makes certain concessionary modifications to contractual terms, the loan is classified as a TDR. Modifications may include adjustments to interest rates, extensions of maturity, and other actions intended to minimize economic loss and avoid foreclosure or repossession of collateral. An allowance is established on a loan classified as a TDR if the present value of expected future cash flows (or, alternatively, the observable market price of the loan or the fair value of the collateral if the loan is collateral-dependent) is less than the recorded investment of the loan. Non-accrual loans that are restructured as TDRs remain on non-accrual status for a period of at least six months to demonstrate that the borrower can meet the restructured terms. If the restructured loan is on accrual status prior to being modified, it is reviewed to determine if the modified loan should remain on accrual status. If the borrower’s ability to meet the revised payment schedule is not reasonably assured, the loan is classified as a non-accrual loan. Loans classified as TDRs remain classified as such for the life of the loan, except in limited circumstances, when it is determined that the borrower is performing under the modified terms and the restructuring agreement specified an interest rate greater than or equal to an acceptable market rate for a comparable new loan at the time of the restructuring.
70
Goodwill and Core Deposit Intangible Assets
.
Goodwill represents the excess cost of an acquisition over the fair value of the net assets acquired. Goodwill is not subject to amortization but rather is evaluated at least annually for impairment, or as events and circumstances dictate, at the reporting unit level. The Company's
two
reporting unit levels are (i) banking and (ii) financial services. The banking reporting unit is representative of the Company's core banking business line, while the financial services reporting unit is representative of the Company's wealth management and trust services business line. Any impairment is charged to non-interest expense on the consolidated statements of income. Goodwill is evaluated for impairment by the Company utilizing several standard valuation techniques, including, but not limited to discounted cash flow analyses and comparable transaction market multiples.
The Company tests goodwill for impairment annually as of November 30
th
utilizing the two-step process and fair value guidance outlined in GAAP. Step one compares the fair value of the reporting unit to its carrying value. If the fair value of the reporting unit is greater than its carrying value, then the reporting unit is not deemed to be impaired and no further assessment is required. However, if the fair value of the reporting unit is below its carrying value, GAAP requires that step two of the goodwill impairment test be performed. Step two involves a process similar to business combination accounting in which fair value is assigned to all assets, liabilities and other identified intangibles to derive an implied fair value of goodwill for the reporting unit. If the implied fair value of goodwill for the reporting unit is greater than its carrying value, then the reporting unit’s goodwill is not impaired. However, if the reporting unit’s implied fair value of goodwill is below its carrying value, an impairment charge is recorded to mark the carrying value of goodwill to the calculated implied fair value. The Company completed its annual goodwill impairment testing as of November 30,
2016
,
2015
and
2014
for each reporting unit and passed step one. As such, step two of the goodwill impairment test was not performed and
no
goodwill impairment was recognized for the year ended December 31, 2016, 2015 or 2014.
Core deposit intangible assets represents the estimated value of acquired customer relationships and is amortized on a straight-line basis over the estimated life of those relationships (
5
to
10 years
from the acquisition dates). Core deposit intangibles are reviewed for impairment whenever events or changes in circumstances indicate that the carrying amount may not be recoverable. If necessary, management will test the core deposit intangibles for impairment by comparing its carrying value to the expected undiscounted cash flows of the assets. If the undiscounted cash flows of the intangible assets exceed its carrying value then the intangible assets are deemed to be fully recoverable and not impaired. However, if the undiscounted cash flows of the intangible assets are less than its carrying value then management must compare the fair value of the intangible assets to its carrying value. If the fair value of the intangible assets exceeds its carrying value then the intangible assets are not impaired. If the fair value of the intangible assets is less than its carrying value then an impairment charge is recorded to mark the carrying value of the intangible assets to fair value. For the year ended December 31,
2016
,
2015
or
2014
, there were no events or changes in circumstances that indicated the carrying amount may not be recoverable.
BOLI
.
BOLI represents the cash surrender value of life insurance policies on the lives of certain active and retired employees where the Company is the beneficiary and is recorded as an asset on the Company's consolidated statements of condition. Increases in the cash surrender values of the policies, as well as death benefits received, net of any cash surrender value, are recorded in non-interest income on the consolidated statements of income, and are not subject to income taxes. The Company reviews the financial strength of the insurance carriers prior to the purchase of life insurance policies and no less than annually thereafter. A life insurance policy with any individual carrier is limited to
15%
of Tier I capital (as defined for regulatory purposes) and the total cash surrender value of life insurance policies is limited to
25%
of Tier I capital.
Premises and Equipment
.
Premises and equipment are stated at cost less accumulated depreciation. Acquired premises and equipment (through the acquisition of a company or branch acquisition) are stated at their estimated fair values as of the acquisition date less accumulated depreciation that occurred subsequent to the acquisition date. Depreciation and amortization are computed on the straight-line method over the estimated useful lives of the related assets. Leasehold improvements are amortized over the lesser of the term of the respective lease or the estimated life of the improvement. Land is carried at cost.
OREO
.
OREO properties acquired through foreclosure or deed-in-lieu of foreclosure are recorded initially at estimated fair value less estimated costs to sell. Any write-down of the recorded investment in the related loan is charged to the ALL upon transfer to OREO. Upon acquisition of a property, a current appraisal is used or an internal valuation is prepared to substantiate fair value of the property. Any subsequent declines in the fair value of a property are recorded as a valuation allowance on the asset. Any subsequent increases in the fair value of a property are recorded as reductions of the valuation allowance, but not below zero. Upon a sale of an OREO property, any excess of the carrying value over the sale proceeds is recognized as a loss on sale. Any excess of sale proceeds over the carrying value of the OREO property is first applied as a recovery to the valuation allowance, if any, with the remainder being recognized as a gain on sale. Operating expenses, including legal and other direct expenses, and changes in the valuation allowance relating to foreclosed assets are included in other non-interest expense on the consolidated statements of income.
71
Mortgage Servicing
.
Servicing assets are recognized as separate assets when servicing rights are acquired through the sale of residential mortgage loans with servicing rights retained. Capitalized servicing rights, which are reported in other assets on the consolidated statements of condition, are initially recorded at fair value and are amortized in proportion to, and over the period of, the estimated future servicing of the underlying mortgages (typically, the contractual life of the mortgage). Servicing assets are evaluated for impairment based upon the fair value of the rights as compared to amortized cost. Impairment is determined by stratifying rights by predominant characteristics, such as interest rates and terms. Fair value is determined using prices for similar assets with similar characteristics, when available, or based upon discounted cash flows using market-based assumptions. Impairment is recognized through a valuation allowance to the extent that fair value is less than the capitalized amount. If it is later determined that all or a portion of the impairment no longer exists, a reduction of the allowance may be recorded increasing income, but not below zero.
Servicing fee income is recorded for fees earned for servicing loans for investors. The fees are based on a contractual percentage of the outstanding principal or a fixed amount per loan and are recorded as income within non-interest income on the consolidated statements of income when earned. The amortization of mortgage servicing rights is recorded as a reduction of loan servicing fee income within non-interest income on the consolidated statements of income.
Short-Term and Long-Term Borrowings.
Short-term borrowings consist of borrowings maturing within one year of the consolidated statement of condition date, while long-term borrowings consist of borrowings maturing in one or more years. The Company's borrowings include retail and wholesale repurchase agreements, FHLBB overnight and short-term borrowings, federal funds purchased, a capital lease, and line of credit advances. The Company is required to post collateral for certain borrowings, for which it, generally, posts loans and/or investment securities as collateral.
Income Taxes
.
Income taxes are accounted for using the asset and liability method. Under this method, deferred tax assets and liabilities are recognized for the future tax implications attributable to differences between the financial statement carrying amounts of existing assets and liabilities and their respective tax bases. If current information suggests that it is not more likely than not that the Company will be able to realize the deferred tax assets, a valuation allowance is established. Deferred tax assets and liabilities are measured using enacted tax rates expected to apply to taxable income in the years in which those temporary differences are expected to be recovered or settled. The effect on deferred tax assets and liabilities of a change in tax rates is recognized in income in the period that includes the enactment date.
The Company assesses quarterly whether or not a valuation allowance on its deferred tax assets is necessary. If it is more likely than not that the Company will not be able to realize the benefit of the deferred tax assets then a valuation allowance is established on the deferred tax asset not expected to be realized. At December 31, 2016 and 2015, the Company did not carry a valuation allowance on its deferred tax assets.
EPS
.
Basic EPS excludes dilution and is computed by dividing net income applicable to common stock by the weighted-average number of common shares outstanding for the period. Diluted EPS reflects the potential dilution that could occur if certain securities or other contracts to issue common stock (such as stock options) were exercised or converted into additional common shares that would then share in the earnings of the Company. Diluted EPS is computed by dividing net income applicable to common stock by the weighted-average number of common shares outstanding for the period, plus an incremental number of common-equivalent shares computed using the treasury stock method.
Unvested share-based payment awards which include the right to receive non-forfeitable dividends are considered to participate with common stock in undistributed earnings for purposes of computing EPS. Restricted share grants and management stock purchase grants are considered participating securities for this purpose. Accordingly, the Company is required to calculate basic and diluted EPS using the two-class method. The calculation of EPS using the two-class method (i) excludes any dividends paid or owed on participating securities and any undistributed earnings considered to be attributable to participating securities from the numerator and (ii) excludes the dilutive impact of the participating securities from the denominator.
Effective September 30, 2016, the Company completed a three-for-two split of its common stock for shareholders of record as of September 15, 2016. As a result, the Company has adjusted its weighted-average shares outstanding, and basic and diluted EPS for the year ended December 31, 2015 and 2014 as presented within Note 14 of the consolidated financial statements to account for the stock split. Refer to Note 13 of the consolidated financial statements for further details of the three-for-two stock split.
Postretirement Plans
.
The Company sponsors various retirement plans for current and former employees, including a postretirement health care plan and life insurance to certain eligible retired employees and a SERP for certain officers of the Company. The cost of providing postretirement health care and life insurance benefits is accrued during the active service
72
period of the employee. The SERP is accrued on a current basis and recognizes costs over the estimated employee service period.
Stock-Based Compensation
.
The fair value of restricted stock and stock options is determined on the grant date. For restricted stock awards and units, compensation is recognized ratably over the requisite service period equal to the fair value of the award. For stock option awards, the fair value is determined using the Black-Scholes option-pricing model. Compensation expense for stock option awards is recognized ratably over the requisite service period equal to the fair value of the award. For performance-based share awards, the Company estimates the degree to which performance conditions will be met to determine the number of shares that will vest and the related compensation expense. Compensation expense is adjusted in the period such estimates change. Non-forfeitable dividends, if any, paid on shares of restricted stock are recorded to retained earnings.
In the second quarter of 2016, the Company elected to early adopt ASU No. 2016-09,
Compensation - Stock Compensation
(Topic 718):
Improvements to Employee Share-Based Payment Accounting
("ASU 2016-09"), issued by the FASB in March 2016. The Company applied the provisions of ASU 2016-09 effective as of January 1, 2016. Two of the more significant provisions of ASU 2016-09 that impacted the Company's consolidated financial statements were (i) the accounting for windfall tax benefits or shortfalls within income tax expense as a discrete period item in the quarter the event occurred and (ii) a policy election to not estimate the forfeiture rate on unvested share-based compensation awards. As a result of the ASU adoption, net income for the year ended December 31, 2016 increased
$697,000
, and basic and diluted EPS both increased
$0.05
and
$0.04
per share, respectively.
In accordance with ASU 2016-09, the Company applied the provisions to account for windfall tax benefits or shortfalls within income tax expense on a prospective basis as of January 1, 2016. In accordance with the ASU, the Company applied its policy election to not estimate the forfeiture rate on unvested share-based compensation awards on a modified-retrospective basis. The impact of such resulted in a reclassification of
$72,000
from retained earnings to common stock shown as a cumulative effect adjustment on the consolidated statements of changes in shareholders' equity for the year ended December 31, 2016. The other provisions of ASU 2016-09 did not have a material effect on the Company's consolidated financial statements.
Off-Balance Sheet Credit Related Financial Instruments
.
In the ordinary course of business, the Company enters into commitments to extend credit, including commercial letters of credit and standby letters of credit. Such financial instruments are recorded as loans when they are funded.
Derivative Financial Instruments Designated as Hedges
.
The Company recognizes all derivatives in the consolidated statements of condition at fair value. On the date the Company enters into the derivative contract, the Company designates the derivative as a hedge of either a forecasted transaction or the variability of cash flows to be received or paid related to a recognized asset or liability (“cash flow hedge”), a hedge of the fair value of a recognized asset or liability or of an unrecognized firm commitment (“fair value hedge”), or a held for trading instrument (“trading instrument”). The Company formally documents relationships between hedging instruments and hedged items, as well as its risk management objectives and strategy for undertaking various hedge transactions. The Company also assesses, both at the hedge’s inception and on an ongoing basis, whether the derivatives that are used in hedging transactions are effective in offsetting changes in cash flows or fair values of hedged items. Changes in fair value of a derivative that is effective and that qualifies as a cash flow hedge are recorded in OCI and are reclassified into earnings when the forecasted transaction or related cash flows affect earnings. Changes in fair value of a derivative that qualifies as a fair value hedge and the change in fair value of the hedged item are both recorded in earnings and offset each other when the transaction is effective. Those derivatives that are classified as trading instruments are recorded at fair value with changes in fair value recorded in earnings. The Company discontinues hedge accounting when it determines that the derivative is no longer effective in offsetting changes in the cash flows of the hedged item, that it is unlikely that the forecasted transaction will occur, or that the designation of the derivative as a hedging instrument is no longer appropriate.
Segment Reporting
.
The Company, through its bank subsidiary, provides a broad range of financial services to individuals and companies primarily in Maine. These services include lending, checking, savings and time deposits, cash management, brokerage, wealth management and trust services. Substantially all of the Company's revenues, profits, and assets are derived by the Bank from banking products and services and, therefore, the Company's management did not provide the segment reporting disclosures as such was determined to be immaterial.
Recent Accounting Pronouncements
.
In January 2017, the FASB issued ASU No. 2017-04,
Intangibles - Goodwill and Other
(Topic 350):
Simplifying the Test for Goodwill Impairment
("ASU 2017-04"). ASU 2017-04 was issued to reduce the cost and complexity of the goodwill impairment test. To simplify the subsequent measurement of goodwill, step two of the goodwill impairment test was eliminated. Instead, in accordance with ASU 2017-04, a Company will recognize an impairment of
73
goodwill should the carrying value of a reporting unit exceed its fair value (i.e. step one). ASU 2017-04 will be effective for the Company on January 1, 2020 and will be applied prospectively.
In June 2016, the FASB issued ASU No. 2016-13,
Financial Instruments - Credit Losses
(Topic 326):
Measurement of Credit Losses on Financial Instruments
("ASU 2016-13"). ASU 2016-13 was issued to require timelier recording of credit losses on loans and other financial instruments held by financial institutions and other organizations. ASU 2016-13 is effective for annual periods beginning after December 15, 2019, including interim periods within those fiscal years, for public companies. Early adoption is permitted for annual periods beginning after December 15, 2018, including interim periods within that fiscal year.
While the Company continues to prepare for the adoption of ASU 2016-13 on January 1, 2020, it anticipates the standard will have a material impact on the Company's consolidated financial statements upon adoption as it will require a change in the Company's assessment of its ALL and allowance on unused commitments as it will transition from an incurred loss model to an expected loss model, which will likely result in an increase in the ALL upon adoption and may negatively impact the Company and Bank's regulatory capital ratios. Additionally, ASU 2016-13 may reduce the carrying value of the Company's HTM investment securities as it will require an allowance on the expected losses over the life of these securities to be recorded upon adoption.
In February 2016, the FASB issued ASU No. 2016-02,
Leases
(Topic 842) ("ASU 2016-02"). ASU 2016-02 was issued to increase transparency and comparability among organizations by recognizing lease assets and liabilities (including operating leases) on the balance sheet and disclosing key information about leasing arrangements. Current lease accounting does not require the inclusion of operating leases in the balance sheet. ASU 2016-02 is effective for fiscal years beginning after December 15, 2018, including interim periods within those fiscal years, early application is permitted. The Company expects ASU 2016-02 will have a material effect on its consolidated financial statements primarily due to the Bank's existing lease agreements for its banking centers. The Company continues to evaluate the impact of adoption of this standard.
In January 2016, the FASB issued ASU No. 2016-01,
Income Statement - Financial Instruments - Overall
(Subtopic 825-10):
Recognition and Measurement of Financial Assets and Liabilities
("ASU 2016-01"). ASU 2016-01 was issued to enhance the reporting model for financial instruments to provide the users of financial statements with more useful information for decisions. ASU 2016-01 is effective for fiscal years beginning after December 15, 2017, including interim periods within those fiscal years.
The Company will adopt ASU 2016-01 effective January 1, 2018. Upon adoption, the Company will be required to recognize unrealized gains and losses on its equity securities directly through the Company's consolidated statements of income, whereas these equity securities currently are designated as AFS and unrealized gains and losses are recognized within AOCI. At December 31, 2016, the fair value of the Company's equity securities was
$741,000
with a cost basis of
$632,000
. The Company does not anticipate that portion of ASU 2016-01 will materially impact the Company's financial position upon adoption. ASU 2016-01 also requires Companies to utilize an "exit price" fair value methodology for purposes of disclosing the fair value of financial assets and liabilities not measured and reported at fair value on a recurring or non-recurring basis. The Company currently discloses the fair value of its loan portfolio segments using an "entry price" fair value methodology (as disclosed within Note 19). The Company does not believe ASU 2016-01 will materially affect its consolidated financial statements.
In August 2015, the FASB issued ASU No. 2015-14,
Revenue from Contracts with Customers
(Topic 606)
: Deferral of the Effective Date
("ASU 2015-14"). ASU 2015-14 was issued to defer the effective date of ASU 2014-09,
Revenue from Contracts with Customers
(Topic 606) ("ASU 2014-09"), for all entities by one year. ASU 2014-09 was issued to clarify the principles for recognizing revenue and to develop a common revenue standard. ASU 2014-09 is now effective for annual reporting periods beginning after December 15, 2017, including interim reporting periods within that reporting period.
Effective January 1, 2018, the Company will adopt ASU 2014-09 and, while it continues to evaluate the potential impact of ASU 2014-09, it does not expect ASU 2014-09 will have a material effect on its consolidated financial statements.
74
2. Mergers and Acquisitions
2016 Activity
On November 30, 2016, the Company completed its merger of Acadia Trust, the Company's wholly-owned subsidiary, into the Bank, also the Company's wholly-owned subsidiary, and created a new wealth management and trust division of the Bank, Camden National Wealth Management. The merger did not qualify as a business combination and did not have any effect on the Company's consolidated financial condition.
2015 Activity (share, stock option and share price data have been adjusted for the three-for-two stock split completed by the Company on September 30, 2016 — refer to Note 13)
On October 16, 2015, the Company completed its acquisition of
100%
of SBM's common stock. The Merger qualified as a tax-free reorganization for federal income tax purposes and, pursuant to the terms and Merger Agreement, each share of SBM common stock outstanding at the effective time of the acquisition was converted into the right to receive, at the election of the stockholder and subject to the allocation and proration procedures described in the Merger Agreement, either: (1)
$206.00
in cash, without interest or (2)
8.132
shares of common stock of the Company; provided that
80%
of the SBM shares outstanding immediately prior to the effective time of the acquisition were converted into the right to receive common stock of the Company and the remaining SBM shares were converted into the right to receive cash. The total consideration paid by the Company was
$136.7 million
, consisting of (i)
$26.1 million
in cash; (ii)
4,124,643
shares of Camden common stock valued at
$108.6 million
, based on the October 16, 2015 closing price of the Company's common stock of
$26.32
per share; and (iii) the fair value of
139,032
non-qualified stock options issued under the 2012 Plan of
$2.0 million
. Pursuant to the Merger Agreement, all unexercised non-qualified stock options held by SBM option holders immediately vested upon completion of the acquisition and were to roll into the Company's non-qualified stock options using the
8.132
share conversion ratio (rounded down to the nearest whole share). The non-qualified stock options issued under the Company's 2012 Plan maintained the same terms and conditions as previously held under SBM's equity plan. The fair value of the non-qualified stock options approximated the intrinsic value of the non-qualified stock options at acquisition date.
The Merger complimented the Company's existing footprint within Maine, while expanding its presence in the higher growth Southern Maine market and into Massachusetts. In addition to providing incremental market share and increasing its presence within Southern Maine, the acquisition improved the Company's interest rate risk exposure in a rising rate environment through a larger mix of variable rate loans as percentage of total loans and additional core deposits (non-interest checking, interest checking, savings and money market accounts).
The Company accounted for the Merger using the acquisition method. The acquisition method requires the acquirer to recognize the assets acquired and the liabilities assumed at their fair values as of the acquisition date (with limited exceptions), and does not provide for acquisition expenses to be capitalized as part of the transaction.
75
For the year ended December 31, 2016, 2015 and 2014, the Company incurred
$866,000
,
$10.4 million
and
$0
, respectively, of acquisition-related costs as detailed below:
|
For The Year Ended
December 31,
|
||||||||||||
|
2016
|
2015
|
2014
|
||||||||||
|
Salaries and employee benefits
(1)
|
$
|
8
|
|
$
|
3,240
|
|
$
|
—
|
|
|||
|
Furniture, equipment and data processing
|
279
|
|
1,531
|
|
—
|
|
||||||
|
Net occupancy
|
439
|
|
1,237
|
|
—
|
|
||||||
|
Consulting and professional fees
(2)
|
80
|
|
2,453
|
|
—
|
|
||||||
|
Other expenses
(3)
|
60
|
|
1,954
|
|
—
|
|
||||||
|
Total merger and acquisition costs
|
$
|
866
|
|
$
|
10,415
|
|
$
|
—
|
|
|||
|
(1)
|
Includes the costs associated with pre-existing change-in-control agreements in place at the time of the Merger and employee termination costs, including severance.
|
|
(2)
|
Includes the cost of a negotiated non-compete arrangement entered into in connection with the Merger of
$400,000
in 2015.
|
|
(3)
|
Other expenses include marketing and insurance costs, certain contract termination costs, various printing and mailing costs associated with various customer communications, and travel-related costs associated with the integration of the
two
companies in 2015.
|
Also in connection with the Merger, the Company incurred certain equity issuance costs totaling
$612,000
related to the registration of additional shares of the Company's common stock. These costs have been accounted for as a reduction to shareholders' equity and have been presented as such within the Company's consolidated statements of changes in shareholders' equity for the year ended December 31, 2015.
76
The following table summarizes the estimated fair value of the assets acquired and liabilities assumed as of the date of the acquisition:
|
As Acquired
|
Fair Value Adjustments
(Previously Reported)
|
Measurement-Period Adjustments
|
As Recorded at Acquisition
|
|||||||||||||
|
Consideration Paid:
|
||||||||||||||||
|
Cash
|
$
|
26,125
|
|
|||||||||||||
|
Company common stock
(4,124,643 shares at $26.32 per share)
|
108,561
|
|
||||||||||||||
|
Non-qualified stock options
|
1,990
|
|
||||||||||||||
|
Total consideration paid
|
136,676
|
|
||||||||||||||
|
Recognized identifiable assets acquired and liabilities assumed,
at fair value:
|
||||||||||||||||
|
Loans and loans held for sale
|
$
|
639,390
|
|
$
|
(11,497
|
)
|
$
|
137
|
|
628,030
|
|
|||||
|
Cash and due from banks
|
86,042
|
|
—
|
|
—
|
|
86,042
|
|
||||||||
|
Investments
|
39,716
|
|
26
|
|
—
|
|
39,742
|
|
||||||||
|
Deferred tax assets
|
26,293
|
|
(1,177
|
)
|
666
|
|
25,782
|
|
||||||||
|
Premises and equipment
|
16,851
|
|
7,093
|
|
—
|
|
23,944
|
|
||||||||
|
OREO
|
2,530
|
|
(1,801
|
)
|
—
|
|
729
|
|
||||||||
|
Core deposit intangible assets
|
—
|
|
6,608
|
|
—
|
|
6,608
|
|
||||||||
|
Other assets
|
5,421
|
|
(170
|
)
|
157
|
|
5,408
|
|
||||||||
|
Deposits and borrowings
|
719,640
|
|
1,546
|
|
—
|
|
721,186
|
|
||||||||
|
Other liabilities
|
8,512
|
|
(198
|
)
|
—
|
|
8,314
|
|
||||||||
|
Total identified assets acquired and liabilities assumed,
at fair value
|
$
|
88,091
|
|
$
|
(2,266
|
)
|
$
|
960
|
|
86,785
|
|
|||||
|
Goodwill
|
$
|
49,891
|
|
|||||||||||||
The Company completed its purchase accounting for the Merger by June 30, 2016. In connection with completion of its accounting for the acquisition, the Company made certain measurement-period adjustments that decreased goodwill reported at December 31, 2015 by
$960,000
. The measurement-period adjustments did not have a material effect on current year's net income nor will it have a material effect on future years' net income. The Company accounted for the measurement period adjustment prospectively in 2016 in accordance with ASU No. 2015-16,
Business Combinations
(Topic 805):
Simplifying the Accounting for Measurement-Period Adjustments
. Upon completion of purchase accounting, the Company recorded
$49.9 million
of goodwill in connection with the Merger, which was allocated to the Company's banking reporting unit. The goodwill generated represents the synergies expected from combining operations of the
two
organizations, including, but not limited to, systems conversion, consolidation of bank locations and operation centers, and reduced headcount across operation teams. The goodwill generated from the transaction is not deductible for tax purposes.
Fair value adjustments to assets acquired and liabilities assumed are generally amortized using an effective yield, straight-line basis, or other reasonable method consistent with the expected benefit over periods consistent with the estimated useful life or contractual term of the related assets and liabilities.
77
3. Securities
The following tables summarize the amortized costs and estimated fair values of AFS and HTM securities, as of the dates indicated:
|
Amortized Cost
|
Unrealized Gains
|
Unrealized Losses
|
Fair
Value
|
||||||||||||
|
December 31, 2016:
|
|
|
|
|
|
|
|
|
|||||||
|
AFS Securities:
|
|||||||||||||||
|
Obligations of states and political subdivisions
|
$
|
8,848
|
|
$
|
153
|
|
$
|
—
|
|
$
|
9,001
|
|
|||
|
Mortgage-backed securities issued or guaranteed by U.S. government-sponsored enterprises
|
485,222
|
|
2,515
|
|
(7,115
|
)
|
480,622
|
|
|||||||
|
Collateralized mortgage obligations issued or guaranteed by U.S. government-sponsored enterprises
|
289,046
|
|
265
|
|
(5,421
|
)
|
283,890
|
|
|||||||
|
Subordinated corporate bonds
|
5,481
|
|
132
|
|
—
|
|
5,613
|
|
|||||||
|
Total AFS debt securities
|
788,597
|
|
3,065
|
|
(12,536
|
)
|
779,126
|
|
|||||||
|
Equity securities
|
632
|
|
109
|
|
—
|
|
741
|
|
|||||||
|
Total AFS securities
|
$
|
789,229
|
|
$
|
3,174
|
|
$
|
(12,536
|
)
|
$
|
779,867
|
|
|||
|
HTM Securities:
|
|||||||||||||||
|
Obligations of states and political subdivisions
|
$
|
94,609
|
|
$
|
618
|
|
$
|
(631
|
)
|
$
|
94,596
|
|
|||
|
Total HTM securities
|
$
|
94,609
|
|
$
|
618
|
|
$
|
(631
|
)
|
$
|
94,596
|
|
|||
|
December 31, 2015:
|
|
|
|
|
|
|
|
|
|||||||
|
AFS Securities:
|
|||||||||||||||
|
Obligations of U.S. government-sponsored enterprises
|
$
|
4,971
|
|
$
|
69
|
|
$
|
—
|
|
$
|
5,040
|
|
|||
|
Obligations of states and political subdivisions
|
17,355
|
|
339
|
|
—
|
|
17,694
|
|
|||||||
|
Mortgage-backed securities issued or guaranteed by U.S. government-sponsored enterprises
|
419,429
|
|
3,474
|
|
(3,857
|
)
|
419,046
|
|
|||||||
|
Collateralized mortgage obligations issued or guaranteed by U.S. government-sponsored enterprises
|
312,719
|
|
409
|
|
(6,271
|
)
|
306,857
|
|
|||||||
|
Subordinated corporate bonds
|
1,000
|
|
—
|
|
(4
|
)
|
996
|
|
|||||||
|
Total AFS debt securities
|
755,474
|
|
4,291
|
|
(10,132
|
)
|
749,633
|
|
|||||||
|
Equity securities
|
712
|
|
2
|
|
(9
|
)
|
705
|
|
|||||||
|
Total AFS securities
|
$
|
756,186
|
|
$
|
4,293
|
|
$
|
(10,141
|
)
|
$
|
750,338
|
|
|||
|
HTM Securities:
|
|
|
|
|
|
|
|
|
|||||||
|
Obligations of states and political subdivisions
|
$
|
84,144
|
|
$
|
1,564
|
|
$
|
(61
|
)
|
$
|
85,647
|
|
|||
|
Total HTM securities
|
$
|
84,144
|
|
$
|
1,564
|
|
$
|
(61
|
)
|
$
|
85,647
|
|
|||
At
December 31, 2016
and
2015
, net unrealized losses on AFS securities included in AOCI amounted to
$6.1 million
, net of a deferred tax benefit of
$3.3 million
, and
$3.8 million
, net of a deferred tax benefit of
$2.0 million
, respectively.
Impaired Investment Securities
Management periodically reviews the Company’s investment portfolio to determine the cause, magnitude and duration of declines in the fair value of each security. Thorough evaluations of the causes of the unrealized losses are performed to determine whether the impairment is temporary or other-than-temporary in nature. Considerations such as the ability of the securities to meet cash flow requirements, levels of credit enhancements, risk of curtailment, and recoverability of invested amount over a reasonable period of time, and the length of time the security is in a loss position, for example, are applied in determining OTTI. Once a decline in value is determined to be other-than-temporary, the cost basis of the security is permanently reduced and a corresponding charge to earnings is recognized.
78
The following table presents the estimated fair values and gross unrealized losses of investment securities that were in a continuous loss position at
December 31, 2016
and
2015
, by length of time that individual securities in each category have been in a continuous loss position:
|
Less Than 12 Months
|
12 Months or More
|
Total
|
|||||||||||||||||||||
|
|
Fair Value
|
Unrealized Losses
|
Fair Value
|
Unrealized Losses
|
Fair Value
|
Unrealized Losses
|
|||||||||||||||||
|
December 31, 2016:
|
|
|
|
|
|
|
|
|
|
|
|
|
|||||||||||
|
AFS Securities:
|
|||||||||||||||||||||||
|
Mortgage-backed securities issued or guaranteed by U.S. government-sponsored enterprises
|
$
|
348,579
|
|
$
|
(5,780
|
)
|
$
|
29,496
|
|
$
|
(1,335
|
)
|
$
|
378,075
|
|
$
|
(7,115
|
)
|
|||||
|
Collateralized mortgage obligations issued or guaranteed by U.S. government-sponsored enterprises
|
163,412
|
|
(2,906
|
)
|
74,212
|
|
(2,515
|
)
|
237,624
|
|
(5,421
|
)
|
|||||||||||
|
Total AFS securities
|
$
|
511,991
|
|
$
|
(8,686
|
)
|
$
|
103,708
|
|
$
|
(3,850
|
)
|
$
|
615,699
|
|
$
|
(12,536
|
)
|
|||||
|
HTM Securities:
|
|||||||||||||||||||||||
|
Obligations of states and political subdivisions
|
$
|
42,805
|
|
$
|
(631
|
)
|
$
|
—
|
|
$
|
—
|
|
$
|
42,805
|
|
$
|
(631
|
)
|
|||||
|
Total HTM securities
|
$
|
42,805
|
|
$
|
(631
|
)
|
$
|
—
|
|
$
|
—
|
|
$
|
42,805
|
|
$
|
(631
|
)
|
|||||
|
December 31, 2015:
|
|
|
|
|
|
|
|
|
|
|
|
|
|||||||||||
|
AFS Securities:
|
|||||||||||||||||||||||
|
Mortgage-backed securities issued or guaranteed by U.S. government-sponsored enterprises
|
$
|
234,897
|
|
$
|
(2,351
|
)
|
$
|
45,629
|
|
$
|
(1,506
|
)
|
$
|
280,526
|
|
$
|
(3,857
|
)
|
|||||
|
Collateralized mortgage obligations issued or guaranteed by U.S. government-sponsored enterprises
|
111,143
|
|
(1,068
|
)
|
147,180
|
|
(5,203
|
)
|
258,323
|
|
(6,271
|
)
|
|||||||||||
|
Subordinated corporate bonds
|
996
|
|
(4
|
)
|
—
|
|
—
|
|
996
|
|
(4
|
)
|
|||||||||||
|
Equity securities
|
615
|
|
(9
|
)
|
—
|
|
—
|
|
615
|
|
(9
|
)
|
|||||||||||
|
Total AFS securities
|
$
|
347,651
|
|
$
|
(3,432
|
)
|
$
|
192,809
|
|
$
|
(6,709
|
)
|
$
|
540,460
|
|
$
|
(10,141
|
)
|
|||||
|
HTM Securities:
|
|
|
|
|
|
|
|
|
|
|
|
|
|||||||||||
|
Obligations of states and political subdivisions
|
$
|
5,507
|
|
$
|
(61
|
)
|
$
|
—
|
|
$
|
—
|
|
$
|
5,507
|
|
$
|
(61
|
)
|
|||||
|
Total HTM securities
|
$
|
5,507
|
|
$
|
(61
|
)
|
$
|
—
|
|
$
|
—
|
|
$
|
5,507
|
|
$
|
(61
|
)
|
|||||
At
December 31, 2016
and
2015
, the Company held
209
and
109
investment securities with a fair value of
$658.5 million
and
$546.0 million
that were in an unrealized loss position totaling
$13.2 million
and
$10.2 million
, respectively, that are considered temporary. Of these, MBS and CMOs with a fair value of
$103.7 million
and
$192.8 million
were in an unrealized loss position, and have been in an unrealized loss position for 12 months or more totaling
$3.9 million
and
$6.7 million
at
December 31, 2016
and
2015
, respectively. The decline in the fair value of the debt securities is reflective of current interest rates in excess of the yield received on investments and was not indicative of an overall credit deterioration or other factors with the Company's investment portfolio. At December 31, 2016 and 2015, gross unrealized losses on the Company's AFS and HTM securities were
2%
of the respective investment securities fair value.
The Company has the intent and ability to retain its investment securities in an unrealized loss position at
December 31, 2016
until the decline in value has recovered.
79
Security Gains and Losses and OTTI of Securities
The following table details the Company’s sales of AFS investment securities, the gross realized gains and losses, and OTTI of securities:
|
For The Year Ended
December 31,
|
|||||||||||
|
|
2016
|
2015
|
2014
|
||||||||
|
Proceeds from sales of securities
|
$
|
28,850
|
|
$
|
12,426
|
|
$
|
25,695
|
|
||
|
Gross realized gains
|
125
|
|
221
|
|
451
|
|
|||||
|
Gross realized losses
|
(74
|
)
|
(217
|
)
|
—
|
|
|||||
|
Previously recorded OTTI
|
—
|
|
204
|
|
—
|
|
|||||
For the year ended
December 31, 2016
,
2015
, and
2014
, the Company sold certain AFS investment securities with a total carrying value of
$28.8 million
,
$12.4 million
, and
$25.2 million
, respectively, to manage its liquidity and interest rate risk, and recorded net gains on the sale of AFS securities of
$51,000
,
$4,000
, and
$451,000
, respectively, within non-interest income in the consolidated statements of income. The investments securities that were sold were primarily selected based on an assessment of their prepayment speed.
FHLBB and FRB Stock
As of
December 31, 2016
and
2015
, the Company's investment in FHLBB stock was
$17.8 million
and
$20.6 million
, respectively. At
December 31, 2016
and
2015
, the Company's investment in FRB stock was
$5.4 million
and
$908,000
, respectively.
Securities Pledged
At
December 31, 2016
and
2015
, securities with an amortized cost of
$597.3 million
and
$577.6 million
, respectively, and estimated fair values of
$589.7 million
and
$570.9 million
, respectively, were pledged to secure FHLBB advances, public deposits, and securities sold under agreements to repurchase, and for other purposes required or permitted by law.
Contractual Maturities
The amortized cost and estimated fair values of securities by contractual maturity at
December 31, 2016
are shown below. Expected maturities will differ from contractual maturities because borrowers may have the right to call or prepay obligations with or without call or prepayment penalties.
|
Amortized Cost
|
Fair
Value
|
||||||
|
AFS Securities
|
|||||||
|
Due in one year or less
|
$
|
1,034
|
|
$
|
1,039
|
|
|
|
Due after one year through five years
|
86,362
|
|
86,299
|
|
|||
|
Due after five years through ten years
|
129,521
|
|
129,248
|
|
|||
|
Due after ten years
|
571,680
|
|
562,540
|
|
|||
|
|
$
|
788,597
|
|
$
|
779,126
|
|
|
|
HTM Securities
|
|||||||
|
Due after one year through five years
|
$
|
5,599
|
|
$
|
5,650
|
|
|
|
Due after five years through ten years
|
4,210
|
|
4,221
|
|
|||
|
Due after ten years
|
84,800
|
|
84,725
|
|
|||
|
|
$
|
94,609
|
|
$
|
94,596
|
|
|
80
4. Loans and Allowance for Loan Losses
The composition of the Company’s loan portfolio, excluding residential loans held for sale, at
December 31, 2016
and
2015
was as follows:
|
December 31,
|
|||||||
|
|
2016
|
2015
|
|||||
|
Residential real estate loans
|
$
|
802,494
|
|
$
|
820,617
|
|
|
|
Commercial real estate loans
|
1,050,780
|
|
927,951
|
|
|||
|
Commercial loans
|
333,639
|
|
297,721
|
|
|||
|
Home equity loans
|
329,907
|
|
348,634
|
|
|||
|
Consumer loans
|
17,332
|
|
17,953
|
|
|||
|
HPFC
|
60,412
|
|
77,330
|
|
|||
|
Total loans
|
$
|
2,594,564
|
|
$
|
2,490,206
|
|
|
The loan balances for each portfolio segment presented above are net of their respective unamortized fair value mark discount on acquired loans and net of unamortized loan origination (costs) fees totaling:
|
December 31,
|
||||||||
|
2016
|
2015
|
|||||||
|
Net unamortized fair value mark discount on acquired loans
|
$
|
8,810
|
|
$
|
13,083
|
|
||
|
Net unamortized loan origination (costs) fees
|
(66
|
)
|
370
|
|
||||
|
Total
|
$
|
8,744
|
|
$
|
13,453
|
|
||
The Bank’s lending activities are primarily conducted in Maine, and its footprint continues to expand into other New England states, including New Hampshire and Massachusetts. The Company originates single family and multi-family residential loans, commercial real estate loans, business loans, municipal loans and a variety of consumer loans. In addition, the Company makes loans for the construction of residential homes, multi-family properties and commercial real estate properties. The ability and willingness of borrowers to honor their repayment commitments is generally dependent on the level of overall economic activity within the geographic area and the general economy.
The HPFC loan portfolio consists of niche commercial lending to the small business medical field, including dentists, optometrists and veterinarians across the U.S. The ability and willingness of borrowers to honor their repayment commitments is generally dependent on the success of the borrower's business. Unlike the Bank's loan portfolio, there is, generally, little to no indication of credit quality issues and/or concerns of borrowers honoring their commitments until a payment is delinquent. Generally, once a payment is delinquent, if the payment is not received shortly thereafter to bring the loan current, the loan is deemed impaired (typically within
45
days). Effective February 19, 2016, the Company closed HPFC's operations and is no longer originating loans.
The Bank, in the normal course of business, has made loans to certain officers, directors and their associated companies, under terms that are consistent with the Company’s lending policies and regulatory requirements. Loans, including any unused lines of credit, to related parties were as follows:
|
December 31,
|
|||||||
|
|
2016
|
2015
|
|||||
|
Balance at beginning of year
|
$
|
16,628
|
|
$
|
17,469
|
|
|
|
Loans made/advanced and additions
|
434
|
|
374
|
|
|||
|
Repayments and reductions
|
(1,120
|
)
|
(1,215
|
)
|
|||
|
Balance at end of year
|
$
|
15,942
|
|
$
|
16,628
|
|
|
The ALL is management’s best estimate of the inherent risk of loss in the Company’s loan portfolio as of the consolidated statement of condition date. Management makes various assumptions and judgments about the collectability of the loan portfolio and provides an allowance for potential losses based on a number of factors including historical losses. If those assumptions are incorrect, the ALL may not be sufficient to cover losses and may cause an increase in the allowance in the future. Among the factors that could affect the Company’s ability to collect loans and require an increase to the allowance in the
81
future are: (i) financial condition of borrowers; (ii) real estate market changes; (iii) state, regional, and national economic conditions; and (iv) a requirement by federal and state regulators to increase the provision for loan losses or recognize additional charge-offs.
The Board of Directors monitors credit risk through the Directors' Loan Review Committee, which reviews large credit exposures, monitors the external loan review reports, reviews the lending authority for individual loan officers when required, and has approval authority and responsibility for all matters regarding the loan policy and other credit-related policies, including reviewing and monitoring asset quality trends, concentration levels, and the ALL methodology. Credit Risk Administration and the Credit Risk Policy Committee oversee the Company's systems and procedures to monitor the credit quality of its loan portfolio, conduct a loan review program, maintain the integrity of the loan rating system, determine the adequacy of the ALL and support the oversight efforts of the Directors' Loan Review Committee and the Board of Directors. The Company's practice is to proactively manage the portfolio such that management can identify problem credits early, assess and implement effective work-out strategies, and take charge-offs as promptly as practical. In addition, the Company continuously reassesses its underwriting standards in response to credit risk posed by changes in economic conditions. For purposes of determining the ALL, the Company disaggregates its loans into portfolio segments, which include residential real estate, commercial real estate, commercial, home equity, consumer and HPFC. Each portfolio segment possesses unique risk characteristics that are considered when determining the appropriate level of allowance. These risk characteristics unique to each portfolio segment include:
Residential Real Estate
.
Residential real estate loans held in the Company's loan portfolio are made to borrowers who demonstrate the ability to make scheduled payments with full consideration to underwriting factors. Borrower qualifications include favorable credit history combined with supportive income requirements and combined loan-to-value ratios within established policy guidelines. Collateral consists of mortgage liens on one- to four-family residential properties.
Commercial Real Estate.
Commercial real estate loans consist of mortgage loans to finance investments in real property such as multi-family residential, commercial/retail, office, industrial, hotels, educational, health care facilities and other specific use properties. Commercial real estate loans are typically written with amortizing payment structures. Collateral values are determined based upon appraisals and evaluations in accordance with established policy guidelines. Loan-to-value ratios at origination are governed by established policy and regulatory guidelines. Commercial real estate loans are primarily paid by the cash flow generated from the real property, such as operating leases, rents, or other operating cash flows from the borrower.
Commercial.
Commercial loans consist of revolving and term loan obligations extended to business and corporate enterprises for the purpose of financing working capital and/or capital investment. Collateral generally consists of pledges of business assets including, but not limited to, accounts receivable, inventory, plant and equipment, and/or real estate, if applicable. Commercial loans are primarily paid by the operating cash flow of the borrower. Commercial loans may be secured or unsecured.
Home Equity.
Home equity loans and lines are made to qualified individuals for legitimate purposes secured by senior or junior mortgage liens on owner-occupied one- to four-family homes, condominiums, or vacation homes. The home equity loan has a fixed rate and is billed as equal payments comprised of principal and interest. The home equity line of credit has a variable rate and is billed as interest-only payments during the draw period. At the end of the draw period, the home equity line of credit is billed as a percentage of the principal balance plus all accrued interest. Borrower qualifications include favorable credit history combined with supportive income requirements and combined loan-to-value ratios within established policy guidelines.
Consumer.
Consumer loan products including personal lines of credit and amortizing loans made to qualified individuals for various purposes such as education, auto loans, debt consolidation, personal expenses or overdraft protection. Borrower qualifications include favorable credit history combined with supportive income and collateral requirements within established policy guidelines. Consumer loans may be secured or unsecured.
HPFC.
Prior to the Company's closing of HPFC's operations, effective February 19, 2016, it provided commercial lending to dentists, optometrists and veterinarians, many of which were start-up companies. HPFC's loan portfolio consists of term loan obligations extended for the purpose of financing working capital and/or purchase of equipment. Collateral consists of pledges of business assets including, but not limited to, accounts receivable, inventory, and/or equipment. These loans are primarily paid by the operating cash flow of the borrower and the terms range from
seven
to
ten
years.
82
The following table presents the activity in the ALL and select loan information by portfolio segment for the year ended
December 31, 2016
,
2015
, and
2014
:
|
Residential Real Estate
|
Commercial Real Estate
|
Commercial
|
Home
Equity
|
Consumer
|
HPFC
|
Unallocated
|
Total
|
||||||||||||||||||||||||
|
For The Year Ended
December 31, 2016:
|
|||||||||||||||||||||||||||||||
|
ALL:
|
|
|
|
|
|
|
|
|
|
|
|
|
|
|
|||||||||||||||||
|
Beginning balance
|
$
|
4,545
|
|
$
|
10,432
|
|
$
|
3,241
|
|
$
|
2,731
|
|
$
|
193
|
|
$
|
24
|
|
$
|
—
|
|
$
|
21,166
|
|
|||||||
|
Loans charged off
|
(356
|
)
|
(315
|
)
|
(2,218
|
)
|
(308
|
)
|
(101
|
)
|
(507
|
)
|
—
|
|
(3,805
|
)
|
|||||||||||||||
|
Recoveries
|
95
|
|
50
|
|
332
|
|
2
|
|
7
|
|
—
|
|
—
|
|
486
|
|
|||||||||||||||
|
Provision (credit)
(1)
|
(124
|
)
|
1,987
|
|
2,400
|
|
(231
|
)
|
82
|
|
1,155
|
|
—
|
|
5,269
|
|
|||||||||||||||
|
Ending balance
|
$
|
4,160
|
|
$
|
12,154
|
|
$
|
3,755
|
|
$
|
2,194
|
|
$
|
181
|
|
$
|
672
|
|
$
|
—
|
|
$
|
23,116
|
|
|||||||
|
ALL balance attributable loans:
|
|||||||||||||||||||||||||||||||
|
Individually evaluated for impairment
|
$
|
483
|
|
$
|
1,373
|
|
$
|
—
|
|
$
|
86
|
|
$
|
—
|
|
$
|
65
|
|
$
|
—
|
|
$
|
2,007
|
|
|||||||
|
Collectively evaluated for impairment
|
3,677
|
|
10,781
|
|
3,755
|
|
2,108
|
|
181
|
|
607
|
|
—
|
|
21,109
|
|
|||||||||||||||
|
Total ending ALL
|
$
|
4,160
|
|
$
|
12,154
|
|
$
|
3,755
|
|
$
|
2,194
|
|
$
|
181
|
|
$
|
672
|
|
$
|
—
|
|
$
|
23,116
|
|
|||||||
|
Loans:
|
|
|
|
|
|
|
|
|
|
|
|
|
|
|
|||||||||||||||||
|
Individually evaluated for impairment
|
$
|
4,348
|
|
$
|
13,317
|
|
$
|
2,028
|
|
$
|
457
|
|
$
|
7
|
|
$
|
97
|
|
$
|
—
|
|
$
|
20,254
|
|
|||||||
|
Collectively evaluated for impairment
|
798,146
|
|
1,037,463
|
|
331,611
|
|
329,450
|
|
17,325
|
|
60,315
|
|
—
|
|
2,574,310
|
|
|||||||||||||||
|
Total loan balances
|
$
|
802,494
|
|
$
|
1,050,780
|
|
$
|
333,639
|
|
$
|
329,907
|
|
$
|
17,332
|
|
$
|
60,412
|
|
$
|
—
|
|
$
|
2,594,564
|
|
|||||||
|
For The Year Ended
December 31, 2015:
|
|||||||||||||||||||||||||||||||
|
ALL:
|
|
|
|
|
|
|
|
|
|
|
|
|
|
|
|||||||||||||||||
|
Beginning balance
|
$
|
4,899
|
|
$
|
7,951
|
|
$
|
3,354
|
|
$
|
2,247
|
|
$
|
281
|
|
$
|
—
|
|
$
|
2,384
|
|
$
|
21,116
|
|
|||||||
|
Loans charged off
|
(801
|
)
|
(481
|
)
|
(655
|
)
|
(525
|
)
|
(154
|
)
|
—
|
|
—
|
|
(2,616
|
)
|
|||||||||||||||
|
Recoveries
|
55
|
|
74
|
|
389
|
|
188
|
|
22
|
|
—
|
|
—
|
|
728
|
|
|||||||||||||||
|
Provision (credit)
(1)
|
392
|
|
2,888
|
|
153
|
|
821
|
|
44
|
|
24
|
|
(2,384
|
)
|
1,938
|
|
|||||||||||||||
|
Ending balance
|
$
|
4,545
|
|
$
|
10,432
|
|
$
|
3,241
|
|
$
|
2,731
|
|
$
|
193
|
|
$
|
24
|
|
$
|
—
|
|
$
|
21,166
|
|
|||||||
|
ALL balance attributable loans:
|
|||||||||||||||||||||||||||||||
|
Individually evaluated for impairment
|
$
|
544
|
|
$
|
644
|
|
$
|
92
|
|
$
|
89
|
|
$
|
—
|
|
$
|
—
|
|
$
|
—
|
|
$
|
1,369
|
|
|||||||
|
Collectively evaluated for impairment
|
4,001
|
|
9,788
|
|
3,149
|
|
2,642
|
|
193
|
|
24
|
|
—
|
|
19,797
|
|
|||||||||||||||
|
Total ending ALL
|
$
|
4,545
|
|
$
|
10,432
|
|
$
|
3,241
|
|
$
|
2,731
|
|
$
|
193
|
|
$
|
24
|
|
$
|
—
|
|
$
|
21,166
|
|
|||||||
|
Loans:
|
|
|
|
|
|
|
|
|
|
|
|
|
|
|
|||||||||||||||||
|
Individually evaluated for impairment
|
$
|
6,026
|
|
$
|
4,610
|
|
$
|
3,937
|
|
$
|
588
|
|
$
|
74
|
|
$
|
—
|
|
$
|
—
|
|
$
|
15,235
|
|
|||||||
|
Collectively evaluated for impairment
|
814,591
|
|
923,341
|
|
293,784
|
|
348,046
|
|
17,879
|
|
77,330
|
|
—
|
|
2,474,971
|
|
|||||||||||||||
|
Total loan balances
|
$
|
820,617
|
|
$
|
927,951
|
|
$
|
297,721
|
|
$
|
348,634
|
|
$
|
17,953
|
|
$
|
77,330
|
|
$
|
—
|
|
$
|
2,490,206
|
|
|||||||
83
|
For The Year Ended December 31, 2014:
|
Residential Real Estate
|
Commercial Real Estate
|
Commercial
|
Home
Equity
|
Consumer
|
HPFC
|
Unallocated
|
Total
|
|||||||||||||||||||||||
|
ALL:
|
|
|
|
|
|
|
|
|
|
|
|
|
|
|
|||||||||||||||||
|
Beginning balance
|
$
|
5,603
|
|
$
|
7,206
|
|
$
|
3,388
|
|
$
|
2,403
|
|
$
|
319
|
|
$
|
—
|
|
$
|
2,671
|
|
$
|
21,590
|
|
|||||||
|
Loans charged off
|
(785
|
)
|
(361
|
)
|
(1,544
|
)
|
(611
|
)
|
(143
|
)
|
—
|
|
—
|
|
(3,444
|
)
|
|||||||||||||||
|
Recoveries
|
165
|
|
136
|
|
394
|
|
19
|
|
32
|
|
—
|
|
—
|
|
746
|
|
|||||||||||||||
|
Provision (credit)
(1)
|
(84
|
)
|
970
|
|
1,116
|
|
436
|
|
73
|
|
—
|
|
(287
|
)
|
2,224
|
|
|||||||||||||||
|
Ending balance
|
$
|
4,899
|
|
$
|
7,951
|
|
$
|
3,354
|
|
$
|
2,247
|
|
$
|
281
|
|
$
|
—
|
|
$
|
2,384
|
|
$
|
21,116
|
|
|||||||
|
ALL balance attributable loans:
|
|||||||||||||||||||||||||||||||
|
Individually evaluated for impairment
|
$
|
787
|
|
$
|
78
|
|
$
|
10
|
|
$
|
—
|
|
$
|
78
|
|
$
|
—
|
|
$
|
—
|
|
$
|
953
|
|
|||||||
|
Collectively evaluated for impairment
|
4,112
|
|
7,873
|
|
3,344
|
|
2,247
|
|
203
|
|
—
|
|
2,384
|
|
20,163
|
|
|||||||||||||||
|
Total ending ALL
|
$
|
4,899
|
|
$
|
7,951
|
|
$
|
3,354
|
|
$
|
2,247
|
|
$
|
281
|
|
$
|
—
|
|
$
|
2,384
|
|
$
|
21,116
|
|
|||||||
|
Loans:
|
|
|
|
|
|
|
|
|
|
|
|
|
|
|
|||||||||||||||||
|
Individually evaluated for impairment
|
$
|
6,411
|
|
$
|
5,379
|
|
$
|
646
|
|
$
|
331
|
|
$
|
157
|
|
$
|
—
|
|
$
|
—
|
|
$
|
12,924
|
|
|||||||
|
Collectively evaluated for impairment
|
579,057
|
|
635,282
|
|
256,869
|
|
271,378
|
|
17,100
|
|
—
|
|
—
|
|
1,759,686
|
|
|||||||||||||||
|
Total loan balances
|
$
|
585,468
|
|
$
|
640,661
|
|
$
|
257,515
|
|
$
|
271,709
|
|
$
|
17,257
|
|
$
|
—
|
|
$
|
—
|
|
$
|
1,772,610
|
|
|||||||
|
(1)
|
The provision (credit) for loan losses excludes any impact for the change in the reserve for unfunded commitments, which represents management's estimate of the amount required to reflect the probable inherent losses on outstanding letters of credit and unused lines of credit. The reserve for unfunded commitments is presented within accrued interest and other liabilities on the consolidated statements of condition. At
December 31, 2016
,
2015
, and
2014
, the reserve for unfunded commitments was
$11,000
,
$22,000
and
$17,000
, respectively.
|
The following table reconciles the year ended
December 31, 2016
,
2015
, and
2014
provision for loan losses to the provision for credit losses as presented on the consolidated statement of income:
|
For the Year Ended
December 31,
|
|||||||||||||
|
2016
|
2015
|
2014
|
|||||||||||
|
Provision for loan losses
|
$
|
5,269
|
|
$
|
1,938
|
|
$
|
2,224
|
|
||||
|
Change in reserve for unfunded commitments
|
(11
|
)
|
(2
|
)
|
(4
|
)
|
|||||||
|
Provision for credit losses
|
$
|
5,258
|
|
$
|
1,936
|
|
$
|
2,220
|
|
||||
The Company did not have any significant changes to its ALL methodology for the year ended December 31, 2016. In the fourth quarter of 2015, the Company revised its methodology for the ALL whereby it no longer provided for an unallocated reserve, but, instead, incorporated the qualitative factors into the Company's general reserve. Historically, the unallocated reserve served as a method to account for qualitative risks, including general economic and market risks, within its portfolio without specifically assigning to any one or more portfolio segments. At December 31, 2016 and 2015, the Company’s reported unallocated reserve was
$0
. The change in methodology did not have any impact on the Company's reported ALL or provision for loan losses at or for the year ended December 31, 2015.
The Company focuses on maintaining a well-balanced and diversified loan portfolio. Despite such efforts, it is recognized that credit concentrations may occasionally emerge as a result of economic conditions, changes in local demand, natural loan growth and runoff. To ensure that credit concentrations can be effectively identified, all commercial and commercial real estate loans are assigned Standard Industrial Classification codes, North American Industry Classification System codes, and state and county codes. Shifts in portfolio concentrations are monitored by Credit Risk Administration. As of
December 31, 2016
, the non-residential building operators' industry concentration was
12%
of the Company's total loan portfolio and
31%
of the total commercial real estate portfolio. There were
no
other industry concentrations exceeding
10%
of the Company's total loan portfolio as of
December 31, 2016
.
84
To further identify loans with similar risk profiles, the Company categorizes each portfolio segment into classes by credit risk characteristic and applies a credit quality indicator to each portfolio segment. The indicators for commercial, commercial real estate and residential real estate loans are represented by Grades 1 through 10 as outlined below. In general, risk ratings are adjusted periodically throughout the year as updated analysis and review warrants. This process may include, but is not limited to, annual credit and loan reviews, periodic reviews of loan performance metrics, such as delinquency rates, and quarterly reviews of adversely risk rated loans. The Company uses the following definitions when assessing grades for the purpose of evaluating the risk and adequacy of the ALL:
|
•
|
Grade 1 through 6 — Grades 1 through 6 represent groups of loans that are not subject to adverse criticism as defined in regulatory guidance. Loans in these groups exhibit characteristics that represent low to moderate risks, which is measured using a variety of credit risk criteria, such as cash flow coverage, debt service coverage, balance sheet leverage, liquidity, management experience, industry position, prevailing economic conditions, support from secondary sources of repayment and other credit factors that may be relevant to a specific loan. In general, these loans are supported by properly margined collateral and guarantees of principal parties.
|
|
•
|
Grade 7 — Loans with potential weakness (Special Mention). Loans in this category are currently protected based on collateral and repayment capacity and do not constitute undesirable credit risk, but have potential weakness that may result in deterioration of the repayment process at some future date. This classification is used if a negative trend is evident in the obligor’s financial situation. Special mention loans do not sufficiently expose the Company to warrant adverse classification.
|
|
•
|
Grade 8 — Loans with definite weakness (Substandard). Loans classified as substandard are inadequately protected by the current sound worth and paying capacity of the obligor or by collateral pledged. Borrowers experience difficulty in meeting debt repayment requirements. Deterioration is sufficient to cause the Company to look to the sale of collateral.
|
|
•
|
Grade 9 — Loans with potential loss (Doubtful). Loans classified as doubtful have all the weaknesses inherent in the substandard grade with the added characteristic that the weaknesses make collection or liquidation of the loan in full highly questionable and improbable. The possibility of some loss is extremely high, but because of specific pending factors that may work to the advantage and strengthening of the asset, its classification as an estimated loss is deferred until its more exact status may be determined.
|
|
•
|
Grade 10 — Loans with definite loss (Loss). Loans classified as loss are considered uncollectible. The loss classification does not mean that the asset has absolutely no recovery or salvage value, but rather that it is not practical or desirable to defer writing off the asset because recovery and collection time may be protracted.
|
Asset quality indicators are periodically reassessed to appropriately reflect the risk composition of the Company’s loan portfolio. Home equity and consumer loans are not individually risk rated, but rather analyzed as groups taking into account delinquency rates and other economic conditions which may affect the ability of borrowers to meet debt service requirements, including interest rates and energy costs. Performing loans include loans that are current and loans that are past due less than 90 days. Loans that are past due over 90 days and non-accrual loans, including TDRs, are considered non-performing.
85
The following table summarizes credit risk exposure indicators by portfolio segment as of the following dates:
|
Residential Real Estate
|
Commercial Real Estate
|
Commercial
|
Home Equity
|
Consumer
|
HPFC
|
Total
|
||||||||||||||||||||||
|
December 31, 2016:
|
||||||||||||||||||||||||||||
|
Pass (Grades 1 – 6)
|
$
|
789,554
|
|
$
|
1,003,386
|
|
$
|
321,148
|
|
$
|
—
|
|
$
|
—
|
|
$
|
58,943
|
|
$
|
2,173,031
|
|
|||||||
|
Performing
|
—
|
|
—
|
|
—
|
|
328,287
|
|
17,328
|
|
—
|
|
345,615
|
|
||||||||||||||
|
Special Mention (Grade 7)
|
2,387
|
|
5,724
|
|
5,598
|
|
—
|
|
—
|
|
257
|
|
13,966
|
|
||||||||||||||
|
Substandard (Grade 8)
|
10,553
|
|
41,670
|
|
5,437
|
|
—
|
|
—
|
|
1,212
|
|
58,872
|
|
||||||||||||||
|
Doubtful (Grade 9)
|
—
|
|
—
|
|
1,456
|
|
—
|
|
—
|
|
—
|
|
1,456
|
|
||||||||||||||
|
Non-performing
|
—
|
|
—
|
|
—
|
|
1,620
|
|
4
|
|
—
|
|
1,624
|
|
||||||||||||||
|
Total
|
$
|
802,494
|
|
$
|
1,050,780
|
|
$
|
333,639
|
|
$
|
329,907
|
|
$
|
17,332
|
|
$
|
60,412
|
|
$
|
2,594,564
|
|
|||||||
|
December 31, 2015:
|
||||||||||||||||||||||||||||
|
Pass (Grades 1 – 6)
|
$
|
802,873
|
|
$
|
868,664
|
|
$
|
281,553
|
|
$
|
—
|
|
$
|
—
|
|
$
|
70,173
|
|
$
|
2,023,263
|
|
|||||||
|
Performing
|
—
|
|
—
|
|
—
|
|
346,701
|
|
17,835
|
|
—
|
|
364,536
|
|
||||||||||||||
|
Special Mention (Grade 7)
|
3,282
|
|
20,732
|
|
7,527
|
|
—
|
|
—
|
|
3,179
|
|
34,720
|
|
||||||||||||||
|
Substandard (Grade 8)
|
14,462
|
|
38,555
|
|
8,641
|
|
—
|
|
—
|
|
3,978
|
|
65,636
|
|
||||||||||||||
|
Non-performing
|
—
|
|
—
|
|
—
|
|
1,933
|
|
118
|
|
—
|
|
2,051
|
|
||||||||||||||
|
Total
|
$
|
820,617
|
|
$
|
927,951
|
|
$
|
297,721
|
|
$
|
348,634
|
|
$
|
17,953
|
|
$
|
77,330
|
|
$
|
2,490,206
|
|
|||||||
The Company closely monitors the performance of its loan portfolio for both the Bank and HPFC. A loan is placed on non-accrual status when the financial condition of the borrower is deteriorating, payment in full of both principal and interest is not expected as scheduled or principal or interest has been in default for 90 days or more. Exceptions may be made if the asset is well-secured by collateral sufficient to satisfy both the principal and accrued interest in full and collection is reasonably assured. When one loan to a borrower is placed on non-accrual status, all other loans to the borrower are re-evaluated to determine if they should also be placed on non-accrual status. All previously accrued and unpaid interest is reversed at this time. A loan will return to accrual status when collection of principal and interest is assured and the borrower has demonstrated timely payments of principal and interest for a reasonable period. Unsecured loans, however, are not normally placed on non-accrual status because they are charged-off once their collectability is in doubt.
The following is a loan aging analysis by portfolio segment (including loans past due over 90 days and non-accrual loans) and a summary of non-accrual loans, which include TDRs, and loans past due over 90 days and accruing as of the following dates:
|
30 – 59 Days Past Due
|
60 – 89 Days Past Due
|
Greater Than 90 Days
|
Total Past Due
|
Current
|
Total Loans Outstanding
|
Loans > 90 Days Past Due and Accruing
|
Non-Accrual Loans
|
||||||||||||||||||||||||
|
December 31, 2016:
|
|||||||||||||||||||||||||||||||
|
Residential real estate
|
$
|
1,783
|
|
$
|
924
|
|
$
|
2,904
|
|
$
|
5,611
|
|
$
|
796,883
|
|
802,494
|
|
$
|
—
|
|
$
|
3,945
|
|
||||||||
|
Commercial real estate
|
855
|
|
223
|
|
12,625
|
|
13,703
|
|
1,037,077
|
|
1,050,780
|
|
—
|
|
12,849
|
|
|||||||||||||||
|
Commercial
|
633
|
|
218
|
|
1,675
|
|
2,526
|
|
331,113
|
|
333,639
|
|
—
|
|
2,088
|
|
|||||||||||||||
|
Home equity
|
892
|
|
134
|
|
1,321
|
|
2,347
|
|
327,560
|
|
329,907
|
|
—
|
|
1,620
|
|
|||||||||||||||
|
Consumer
|
38
|
|
—
|
|
4
|
|
42
|
|
17,290
|
|
17,332
|
|
—
|
|
4
|
|
|||||||||||||||
|
HPFC
|
438
|
|
688
|
|
110
|
|
1,236
|
|
59,176
|
|
60,412
|
|
—
|
|
207
|
|
|||||||||||||||
|
Total
|
$
|
4,639
|
|
$
|
2,187
|
|
$
|
18,639
|
|
$
|
25,465
|
|
$
|
2,569,099
|
|
$
|
2,594,564
|
|
$
|
—
|
|
$
|
20,713
|
|
|||||||
|
December 31, 2015:
|
|||||||||||||||||||||||||||||||
|
Residential real estate
|
$
|
3,325
|
|
$
|
571
|
|
$
|
6,077
|
|
$
|
9,973
|
|
$
|
810,644
|
|
$
|
820,617
|
|
$
|
—
|
|
$
|
7,253
|
|
|||||||
|
Commercial real estate
|
4,219
|
|
2,427
|
|
1,584
|
|
8,230
|
|
919,721
|
|
927,951
|
|
—
|
|
4,529
|
|
|||||||||||||||
|
Commercial
|
267
|
|
550
|
|
1,002
|
|
1,819
|
|
295,902
|
|
297,721
|
|
—
|
|
4,489
|
|
|||||||||||||||
|
Home equity
|
643
|
|
640
|
|
1,505
|
|
2,788
|
|
345,846
|
|
348,634
|
|
—
|
|
1,933
|
|
|||||||||||||||
|
Consumer
|
112
|
|
7
|
|
118
|
|
237
|
|
17,716
|
|
17,953
|
|
—
|
|
118
|
|
|||||||||||||||
|
HPFC
|
165
|
|
—
|
|
—
|
|
165
|
|
77,165
|
|
77,330
|
|
—
|
|
—
|
|
|||||||||||||||
|
Total
|
$
|
8,731
|
|
$
|
4,195
|
|
$
|
10,286
|
|
$
|
23,212
|
|
$
|
2,466,994
|
|
$
|
2,490,206
|
|
$
|
—
|
|
$
|
18,322
|
|
|||||||
86
Interest income that would have been recognized if loans on non-accrual status had been current in accordance with their original terms for the year ended
December 31, 2016
,
2015
, and
2014
was
$888,000
,
$586,000
, and
$842,000
, respectively.
TDRs:
The Company takes a conservative approach with credit risk management and remains focused on community lending and reinvesting. The Company works closely with borrowers experiencing credit problems to assist in loan repayment or term modifications. TDR loans consist of loans where the Company, for economic or legal reasons related to the borrower’s financial difficulties, granted a concession to the borrower that it would not otherwise consider. TDRs, typically, involve term modifications or a reduction of either interest or principal. Once such an obligation has been restructured, it will remain a TDR until paid in full, or until the loan is again restructured at current market rates and no concessions are granted.
The specific reserve allowance was determined by discounting the total expected future cash flows from the borrower at the original loan interest rate, or if the loan is currently collateral-dependent, using the NRV, which was obtained through independent appraisals and internal evaluations. The following is a summary of TDRs, by portfolio segment, and the associated specific reserve included within the ALL as of December 31:
|
Number of Contracts
|
Recorded Investment
|
Specific Reserve
|
||||||||||||||||||||
|
2016
|
2015
|
2016
|
2015
|
2016
|
2015
|
|||||||||||||||||
|
Residential real estate
|
21
|
|
22
|
|
$
|
3,221
|
|
$
|
3,398
|
|
$
|
483
|
|
$
|
544
|
|
||||||
|
Commercial real estate
|
3
|
|
6
|
|
1,008
|
|
1,459
|
|
—
|
|
48
|
|
||||||||||
|
Commercial
|
10
|
|
9
|
|
1,502
|
|
399
|
|
—
|
|
11
|
|
||||||||||
|
Consumer and home equity
|
1
|
|
1
|
|
16
|
|
21
|
|
—
|
|
—
|
|
||||||||||
|
Total
|
35
|
|
38
|
|
$
|
5,747
|
|
$
|
5,277
|
|
$
|
483
|
|
$
|
603
|
|
||||||
At
December 31, 2016
, the Company had performing and non-performing TDRs with a recorded investment balance of
$4.3 million
and
$1.4 million
, respectively. At December 31,
2015
, the Company had performing and non-performing TDRs with a recorded investment balance of
$4.8 million
and
$446,000
, respectively.
The following represents loan modifications that occurred for the year ended
December 31, 2016
,
2015
and
2014
that qualify as TDRs and the type of loan modification made by portfolio segment at December 31:
|
Number of Contracts
|
Pre-Modification
Outstanding
Recorded Investment
|
Post-Modification
Outstanding
Recorded Investment
|
Specific Reserve
|
||||||||||||||||||||||||||||||||||||||||||
|
2016
|
2015
|
2014
|
2016
|
2015
|
2014
|
2016
|
2015
|
2014
|
2016
|
2015
|
2014
|
||||||||||||||||||||||||||||||||||
|
Residential real estate:
|
|
|
|
|
|
|
|
|
|
|
|
|
|
|
|
|
|||||||||||||||||||||||||||||
|
Maturity concession
|
—
|
|
—
|
|
1
|
|
$
|
—
|
|
$
|
—
|
|
$
|
136
|
|
$
|
—
|
|
$
|
—
|
|
$
|
149
|
|
$
|
—
|
|
$
|
—
|
|
$
|
43
|
|
||||||||||||
|
Court ordered
|
—
|
|
1
|
|
—
|
|
—
|
|
74
|
|
—
|
|
—
|
|
78
|
|
—
|
|
—
|
|
27
|
|
—
|
|
|||||||||||||||||||||
|
Commercial real estate:
|
|
|
|
|
|
|
|
|
|
|
|
|
|
|
|
|
|||||||||||||||||||||||||||||
|
Maturity concession
|
—
|
|
—
|
|
1
|
|
—
|
|
—
|
|
235
|
|
—
|
|
—
|
|
235
|
|
—
|
|
—
|
|
—
|
|
|||||||||||||||||||||
|
Commercial:
|
|
|
|
|
|
|
|
|
|
|
|
|
|
|
|
|
|||||||||||||||||||||||||||||
|
Maturity concession
|
6
|
|
—
|
|
—
|
|
2,973
|
|
—
|
|
—
|
|
2,973
|
|
—
|
|
—
|
|
1,400
|
|
—
|
|
—
|
|
|||||||||||||||||||||
|
Court ordered
|
—
|
|
—
|
|
3
|
|
—
|
|
—
|
|
77
|
|
—
|
|
—
|
|
77
|
|
—
|
|
—
|
|
6
|
|
|||||||||||||||||||||
|
Home equity:
|
|
|
|
|
|
|
|
|
|
|
|
|
|
|
|
|
|||||||||||||||||||||||||||||
|
Principal forgiveness and maturity
|
—
|
|
—
|
|
1
|
|
—
|
|
—
|
|
40
|
|
—
|
|
—
|
|
30
|
|
—
|
|
—
|
|
—
|
|
|||||||||||||||||||||
|
Total
|
6
|
|
1
|
|
6
|
|
$
|
2,973
|
|
$
|
74
|
|
$
|
488
|
|
$
|
2,973
|
|
$
|
78
|
|
|
$
|
491
|
|
$
|
1,400
|
|
$
|
27
|
|
$
|
49
|
|
|||||||||||
During the third quarter of 2016, the Company completed the restructure of
one
commercial relationship for which there were
six
individual commercial loans. The Company had a specific reserve on these loans totaling
$1.4 million
that was charged-off subsequent to the loan modification. Additionally, as part of the restructure, the Company committed to lend additional funds of up to
$280,000
, and, at December 31, 2016, the Company had loaned
$47,000
on its commitment. The Company did
no
t have any other commitments to lend additional funds to borrowers with loans classified as TDRs as of December 31, 2016.
87
For the year ended December 31, 2016, 2015 and 2014, the Company did
no
t have any loans that had been modified as a TDR within the previous 12 months and for which the borrower subsequently defaulted for the periods indicated.
Impaired Loans:
Impaired loans consist of non-accrual and TDR loans that are individually evaluated for impairment in accordance with the Company's policy. The following is a summary of impaired loan balances and the associated allowance by portfolio segment as of and for the year ended
December 31, 2016
,
2015
and
2014
:
|
Recorded Investment
|
Unpaid Principal Balance
|
Related Allowance
|
Average Recorded Investment
|
Interest Income Recognized
|
||||||||||||||||
|
December 31, 2016:
|
||||||||||||||||||||
|
With related allowance recorded:
|
|
|
|
|
|
|
|
|
|
|
||||||||||
|
Residential real estate
|
$
|
3,019
|
|
$
|
3,019
|
|
$
|
483
|
|
$
|
3,088
|
|
$
|
106
|
|
|||||
|
Commercial real estate
|
11,443
|
|
11,443
|
|
1,373
|
|
5,165
|
|
—
|
|
||||||||||
|
Commercial
|
—
|
|
—
|
|
—
|
|
762
|
|
—
|
|
||||||||||
|
Home equity
|
299
|
|
299
|
|
86
|
|
305
|
|
—
|
|
||||||||||
|
Consumer
|
—
|
|
—
|
|
—
|
|
—
|
|
—
|
|
||||||||||
|
HPFC
|
97
|
|
97
|
|
65
|
|
98
|
|
—
|
|
||||||||||
|
Ending Balance
|
14,858
|
|
14,858
|
|
2,007
|
|
9,418
|
|
106
|
|
||||||||||
|
Without related allowance recorded:
|
|
|
|
|
|
|
|
|
|
|
||||||||||
|
Residential real estate
|
1,329
|
|
1,800
|
|
—
|
|
2,057
|
|
9
|
|
||||||||||
|
Commercial real estate
|
1,874
|
|
2,369
|
|
—
|
|
2,214
|
|
51
|
|
||||||||||
|
Commercial
|
2,028
|
|
3,209
|
|
—
|
|
2,507
|
|
16
|
|
||||||||||
|
Home equity
|
158
|
|
368
|
|
—
|
|
180
|
|
—
|
|
||||||||||
|
Consumer
|
7
|
|
10
|
|
—
|
|
12
|
|
—
|
|
||||||||||
|
HPFC
|
—
|
|
—
|
|
—
|
|
—
|
|
—
|
|
||||||||||
|
Ending Balance
|
5,396
|
|
7,756
|
|
—
|
|
6,970
|
|
76
|
|
||||||||||
|
Total impaired loans
|
$
|
20,254
|
|
$
|
22,614
|
|
$
|
2,007
|
|
$
|
16,388
|
|
$
|
182
|
|
|||||
|
December 31, 2015:
|
||||||||||||||||||||
|
With related allowance recorded:
|
|
|
|
|
|
|
|
|
|
|
||||||||||
|
Residential real estate
|
$
|
3,191
|
|
$
|
3,191
|
|
$
|
544
|
|
$
|
6,064
|
|
$
|
112
|
|
|||||
|
Commercial real estate
|
1,825
|
|
1,857
|
|
644
|
|
1,753
|
|
—
|
|
||||||||||
|
Commercial
|
156
|
|
156
|
|
92
|
|
945
|
|
2
|
|
||||||||||
|
Home equity
|
303
|
|
303
|
|
89
|
|
900
|
|
—
|
|
||||||||||
|
Consumer
|
—
|
|
—
|
|
—
|
|
195
|
|
—
|
|
||||||||||
|
HPFC
|
—
|
|
—
|
|
—
|
|
—
|
|
—
|
|
||||||||||
|
Ending Balance
|
5,475
|
|
5,507
|
|
1,369
|
|
9,857
|
|
114
|
|
||||||||||
|
Without related allowance recorded:
|
|
|
|
|
|
|
|
|
|
|
||||||||||
|
Residential real estate
|
2,835
|
|
4,353
|
|
—
|
|
2,175
|
|
8
|
|
||||||||||
|
Commercial real estate
|
2,785
|
|
3,426
|
|
—
|
|
2,719
|
|
65
|
|
||||||||||
|
Commercial
|
3,781
|
|
4,325
|
|
—
|
|
1,412
|
|
17
|
|
||||||||||
|
Home equity
|
285
|
|
688
|
|
—
|
|
369
|
|
—
|
|
||||||||||
|
Consumer
|
74
|
|
150
|
|
—
|
|
20
|
|
—
|
|
||||||||||
|
HPFC
|
—
|
|
—
|
|
—
|
|
—
|
|
—
|
|
||||||||||
|
Ending Balance
|
9,760
|
|
12,942
|
|
—
|
|
6,695
|
|
90
|
|
||||||||||
|
Total impaired loans
|
$
|
15,235
|
|
$
|
18,449
|
|
$
|
1,369
|
|
$
|
16,552
|
|
$
|
204
|
|
|||||
88
|
Recorded Investment
|
Unpaid Principal Balance
|
Related Allowance
|
Average Recorded Investment
|
Interest Income Recognized
|
||||||||||||||||
|
December 31, 2014:
|
||||||||||||||||||||
|
With related allowance recorded:
|
|
|
|
|
|
|
|
|
|
|
||||||||||
|
Residential real estate
|
$
|
4,468
|
|
$
|
4,468
|
|
$
|
787
|
|
$
|
9,254
|
|
$
|
125
|
|
|||||
|
Commercial real estate
|
1,140
|
|
1,140
|
|
78
|
|
4,721
|
|
—
|
|
||||||||||
|
Commercial
|
183
|
|
183
|
|
10
|
|
2,366
|
|
8
|
|
||||||||||
|
Home equity
|
—
|
|
—
|
|
—
|
|
1,428
|
|
—
|
|
||||||||||
|
Consumer
|
140
|
|
140
|
|
78
|
|
348
|
|
—
|
|
||||||||||
|
Ending Balance
|
5,931
|
|
5,931
|
|
953
|
|
18,117
|
|
133
|
|
||||||||||
|
Without related allowance recorded:
|
|
|
|
|
|
|
|
|
|
|
||||||||||
|
Residential real estate
|
1,943
|
|
2,604
|
|
—
|
|
2,257
|
|
7
|
|
||||||||||
|
Commercial real estate
|
4,239
|
|
4,502
|
|
—
|
|
2,869
|
|
40
|
|
||||||||||
|
Commercial
|
463
|
|
606
|
|
—
|
|
791
|
|
11
|
|
||||||||||
|
Home equity
|
331
|
|
581
|
|
—
|
|
399
|
|
—
|
|
||||||||||
|
Consumer
|
17
|
|
37
|
|
—
|
|
21
|
|
—
|
|
||||||||||
|
Ending Balance
|
6,993
|
|
8,330
|
|
—
|
|
6,337
|
|
58
|
|
||||||||||
|
Total impaired loans
|
$
|
12,924
|
|
$
|
14,261
|
|
$
|
953
|
|
$
|
24,454
|
|
$
|
191
|
|
|||||
The impaired loan information presented above as of and for the year ended December 31, 2015 and 2014 has been revised to disclose only those impaired loans that are individually evaluated for impairment in accordance with the Company's policy, which includes (i) loans with a principal balance greater than
$250,000
or more and are classified as substandard or doubtful and are on non-accrual status and (ii) all TDRs. Previously, the Company's impaired loan disclosures included certain non-accrual loans which were collectively evaluated under ASC 450-20. The revision of prior period information had no impact on the Company's ALL, provision for loan losses, or its asset quality ratios as of and for the year ended December 31, 2015 and 2014.
In-Process Foreclosure Proceedings:
At
December 31, 2016
and
2015
, the Company had
$1.4 million
and
$2.9 million
of consumer mortgage loans secured by residential real estate properties for which foreclosure proceedings were in process. The Company continues to be focused on working these consumer mortgage loans through the foreclosure process to resolution; however, the foreclosure process, typically, will take
18
to
24
months due to the State of Maine foreclosure laws.
89
5. Goodwill
The changes in goodwill for the year ended
December 31, 2016
and
2015
for each reporting unit are shown in the table below:
|
|
Banking
|
Financial Services
|
Total
|
||||||||
|
December 31, 2014:
|
|
|
|
|
|
|
|||||
|
Goodwill
|
$
|
40,902
|
|
$
|
7,474
|
|
$
|
48,376
|
|
||
|
Accumulated impairment losses
|
—
|
|
(3,570
|
)
|
(3,570
|
)
|
|||||
|
Reported goodwill
|
40,902
|
|
3,904
|
|
44,806
|
|
|||||
|
2015 activity
(1)
|
50,851
|
|
—
|
|
50,851
|
|
|||||
|
December 31, 2015:
|
|||||||||||
|
Goodwill
|
91,753
|
|
7,474
|
|
99,227
|
|
|||||
|
Accumulated impairment losses
|
—
|
|
(3,570
|
)
|
(3,570
|
)
|
|||||
|
Reported goodwill
|
91,753
|
|
3,904
|
|
95,657
|
|
|||||
|
2016 activity
(1)
|
(960
|
)
|
—
|
|
(960
|
)
|
|||||
|
December 31, 2016:
|
|||||||||||
|
Goodwill
|
90,793
|
|
7,474
|
|
98,267
|
|
|||||
|
Accumulated impairment losses
|
—
|
|
(3,570
|
)
|
(3,570
|
)
|
|||||
|
Reported goodwill
|
$
|
90,793
|
|
$
|
3,904
|
|
$
|
94,697
|
|
||
|
(1)
|
On October 16, 2015, the Company completed the Merger and goodwill of
$49.9 million
after recording a measurement-period adjustment decreasing goodwill of
$960,000
in 2016 upon completion of purchase accounting. Refer to Note 2 for additional details and discussion.
|
The Company performs its annual goodwill impairment assessment as of November 30
th
, and at interim periods if indicators of potential impairment exist. The Company completed its annual goodwill impairment test as of November 30,
2016
,
2015
and 2014 for each reporting unit and determined there was
no
goodwill impairment.
6. Other Intangible Assets
The changes in core deposit intangible and trust relationship intangible assets for the year ended
December 31, 2016
and
2015
are shown in the table below:
|
Core Deposit Intangible
|
Trust Relationship Intangible
|
|||||||||||||||||||||||||||
|
|
Gross
|
Accumulated Amortization
|
Net
|
Gross
|
Accumulated Amortization
|
Net
|
Total
|
|||||||||||||||||||||
|
Balance at December 31, 2014
|
$
|
17,300
|
|
$
|
(14,161
|
)
|
$
|
3,139
|
|
$
|
753
|
|
$
|
(527
|
)
|
$
|
226
|
|
$
|
3,365
|
|
|||||||
|
2015 activity
|
6,608
|
|
(1,231
|
)
|
5,377
|
|
—
|
|
(75
|
)
|
(75
|
)
|
5,302
|
|
||||||||||||||
|
Balance at December 31, 2015
|
23,908
|
|
(15,392
|
)
|
8,516
|
|
753
|
|
(602
|
)
|
151
|
|
8,667
|
|
||||||||||||||
|
2016 activity
|
—
|
|
(1,828
|
)
|
(1,828
|
)
|
—
|
|
(75
|
)
|
(75
|
)
|
(1,903
|
)
|
||||||||||||||
|
Balance at December 31, 2016
|
$
|
23,908
|
|
$
|
(17,220
|
)
|
$
|
6,688
|
|
$
|
753
|
|
$
|
(677
|
)
|
$
|
76
|
|
$
|
6,764
|
|
|||||||
On October 16, 2015, the Company completed the Merger and, in doing so, recorded core deposit intangible assets of
$6.6 million
. The core deposit intangible assets will amortize over a
10
year period using an accelerated depreciation method that aligns with the estimated economic benefit of the asset.
For the year ended
December 31, 2016
,
2015
and
2014
, the Company recorded amortization expense of
$1.9 million
,
$1.3 million
and
$1.1 million
, respectively.
90
The following table reflects the expected amortization schedule for intangible assets over the period of estimated economic benefit (assuming no additional intangible assets are created or impaired):
|
Core Deposit
Intangible
|
Trust Relationship
Intangible
|
Total
|
|||||||||
|
2017
|
$
|
1,735
|
|
$
|
76
|
|
$
|
1,811
|
|
||
|
2018
|
725
|
|
—
|
|
725
|
|
|||||
|
2019
|
705
|
|
—
|
|
705
|
|
|||||
|
2020
|
682
|
|
—
|
|
682
|
|
|||||
|
2021
|
655
|
|
—
|
|
655
|
|
|||||
|
Thereafter
|
2,186
|
|
—
|
|
2,186
|
|
|||||
|
Total
|
$
|
6,688
|
|
$
|
76
|
|
$
|
6,764
|
|
||
7. Premises and Equipment
Details of premises and equipment, at cost, at December 31, were as follows:
|
2016
|
2015
|
||||||
|
Land and land improvements
|
$
|
3,012
|
|
$
|
3,102
|
|
|
|
Buildings and leasehold improvements
|
36,958
|
|
37,926
|
|
|||
|
Furniture, fixtures and equipment
|
34,043
|
|
35,083
|
|
|||
|
Total cost
|
74,013
|
|
76,111
|
|
|||
|
Accumulated depreciation and amortization
|
(31,140
|
)
|
(30,152
|
)
|
|||
|
Net premises and equipment
|
$
|
42,873
|
|
$
|
45,959
|
|
|
Depreciation and amortization expense for the Company for periods indicated were as follows:
|
For The Year Ended
December 31,
|
||||||||||||||
|
Fixed Asset Type
|
Income Statement Line Item
|
2016
|
2015
|
2014
|
||||||||||
|
Equipment and data
|
Furniture, equipment and data processing
|
$
|
1,942
|
|
$
|
1,620
|
|
$
|
1,713
|
|
||||
|
Premises
|
Net occupancy costs
|
1,757
|
|
1,140
|
|
1,003
|
|
|||||||
|
Software
|
Furniture, equipment and data processing
|
275
|
|
337
|
|
335
|
|
|||||||
|
Equipment, data and premises
|
Merger and acquisition costs
|
452
|
|
517
|
|
—
|
|
|||||||
|
Total
|
$
|
4,426
|
|
$
|
3,614
|
|
$
|
3,051
|
|
|||||
At
December 31, 2016
and
2015
, the Company has capitalized software costs of $
3.6 million
and
$3.8 million
, respectively, and related accumulated depreciation expense of
$3.2 million
and
$3.3 million
, respectively, and was presented within other assets on the consolidated statements of condition.
Included in merger and acquisition costs on the consolidated statements of income for the year ended December 31, 2015 was
$1.1 million
of fixed asset disposal costs incurred as a result of the Merger.
The Company did
no
t have any material gains or losses from the sale of premises and equipment for the year ended December 31, 2016, 2015 or 2014.
The Company enters into noncancellable lease arrangements primarily for its office buildings and branch facilities. Certain lease arrangements contain clauses requiring increasing rental payments over the lease term, which may be indexed to an index (commonly the Consumer Price Index) or the increases may be contractually stipulated. Furthermore, many of these lease arrangements provide the Company with the option to renew the lease arrangement after the initial lease term. The Company incurred expenses of
$1.8 million
,
$1.7 million
and
$1.2 million
for the year ended
December 31, 2016
,
2015
and
2014
, respectively, associated with its operating lease arrangements.
The Company has
one
capital lease for a branch facility with payments that extend until
2026
at an interest rate of
9.75%
per year. The capital lease, recorded in premises and equipment, has a cost basis of
$855,000
at
December 31, 2016
and
2015
91
and accumulated depreciation of
$459,000
and
$416,000
at
December 31, 2016
and
2015
, respectively. The associated depreciation expense was reported within net occupancy costs on the consolidated statements of income.
In connection with the Merger, the Company assumed a lease arrangement between SBM's wholly-owned subsidiary, The Bank of Maine, and
two
of its employees. The lease is for a period of
five
years with an expiration date of
December 1, 2019
with
two
consecutive
five
year extension periods available at the option of the Company. The lease arrangement contains certain termination clauses whereby the Company has the right to terminate the lease arrangement should the employees be terminated and/or certain mortgage loan production metrics not be met over a consecutive 12 month period.
At
December 31, 2016
, under current operating and capital lease contracts, the Company had the following schedule of future minimum lease payments:
|
Operating
|
Capital
|
||||||
|
2017
|
$
|
1,427
|
|
$
|
126
|
|
|
|
2018
|
1,186
|
|
126
|
|
|||
|
2019
|
1,144
|
|
126
|
|
|||
|
2020
|
644
|
|
126
|
|
|||
|
2021
|
447
|
|
130
|
|
|||
|
Thereafter
|
1,783
|
|
555
|
|
|||
|
Total minimum lease payments
|
$
|
6,631
|
|
1,189
|
|
||
|
Less: amount representing interest
(1)
|
331
|
|
|||||
|
Present value of net minimum lease payments
(2)
|
$
|
858
|
|
||||
|
(1)
|
Amount necessary to reduce net minimum lease payments to present value calculated at the Company's incremental borrowing rate at lease inception.
|
|
(2)
|
Reflects the liability reported within short- and long-term borrowings on the consolidated statements of condition. At
December 31, 2016
and
2015
, the capital lease liability was
$858,000
and
$922,000
, respectively.
|
8. Mortgage Banking
Residential real estate mortgages are originated by the Company both for its portfolio and for sale into the secondary market. The transfer of these financial assets is accounted for as sales when control over the assets has been surrendered. Control over transferred assets is deemed to be surrendered when (i) the assets have been isolated from the Company, (ii) the transferee obtains the right (free of conditions that constrain it from taking advantage of that right) to pledge or exchange the transferred assets, and (ii) the Company does not maintain effective control over the transferred assets through an agreement to repurchase them before their maturity. The Company may sell its loans to institutional investors and may do so on either a servicing rights released basis or servicing rights retained basis. Should the Company enter into an agreement with the investor to retain or acquire the servicing rights, the Company will record a servicing asset. The Company will enter into an agreement with the investor to pay an agreed-upon rate on the loan, which is less than the interest rate received from the borrower. The Company will retain the difference as a fee for servicing the loan. The Company will capitalize the MSR at fair value within other assets on the statements of condition upon sale of the related loan, and subsequently amortize the asset over the estimated life of the serviced loan and assesses quarterly the asset for impairment. For the year ended December 31, 2016, 2015 and 2014, the Company earned servicing fee income for its servicing assets of
$1.1 million
,
$597,000
and
$484,000
, respectively, and was presented in mortgage banking income, net on the consolidated statements of income.
For the year ended December 31, 2016, 2015 and 2014, the Company sold
$232.2 million
,
$61.2 million
and
$799,000
, respectively, of residential mortgage loans on the secondary market, which resulted in a net gain on sale of loans (net of costs, including direct and indirect origination costs) of
$6.2 million
,
$1.3 million
, and
$31,000
, respectively. Additionally, at December 31, 2016 and 2015, the Company had identified and designated loans with an unpaid principal balance of
$15.1 million
and
$10.8 million
, respectively, as held for sale. The Company elected the fair value option for its loans designated as held for sale, and at December 31, 2016, the unrealized loss was
$289,000
and at December 31, 2015 the unrealized gain was
$133,000
. The unrealized gain or loss on its loans held for sale portfolio is driven by changes in market interest rates and is not impacted by credit quality risks associated with the borrower due to the short-term duration between time of closing and funding of the loan and sale. Included within the Company's mortgage banking income, net on its consolidated statements of income for the year ended December 31, 2016, 2015 and 2014 was the change in unrealized gains (losses) on loans held for sale of
($422,000)
,
$133,000
and
$0
, respectively. The Company mitigates its interest rate exposure on its loans designated as held for sale through forward delivery commitments with investors at the onset of the mortgage origination process, typically
92
on a "best-efforts" basis, with certain approved investors. Refer to Note 18 for further discussion of the Company's forward delivery commitments at December 31, 2016 and 2015 and the offsetting gain (losses) recorded on loans held for sale.
The Company's MSRs, net of a valuation allowance, included in other assets on the consolidated statements of condition at
December 31, 2016
and
2015
was
$1.2 million
and
$2.2 million
, respectively.
The Company obtains third party valuations based on loan level data stratified by note rate, type and term of the underlying loans to determine MSR amortization and valuation. The model utilizes a variety of assumptions, the most significant of which are loan prepayment assumptions and the discount rate used to discount future cash flows. Prepayment assumptions, which are impacted by loan rates and terms, are calculated using a three-month moving average of weekly prepayment data published by the Public Securities Association and modeled against the serviced loan portfolio by the third party valuation specialist. The discount rate is the quarterly average
10
-year U.S. Treasury rate plus a risk premium. At
December 31, 2016
and
2015
, the prepayment assumption used within the model was
14.6%
and
11.0%
, respectively, and the discount rate was
7.8%
and
7.5%
. The estimated effect of a 10% and 20% adverse change to the prepayment assumption at
December 31, 2016
was a decrease of
$97,000
and
$185,000
, respectively, while a 10% and 20% adverse change to the discount rate assumption was a decrease of
$57,000
and
$111,000
. Other assumptions include delinquency rates, foreclosure rates, servicing cost inflation, and annual unit loan cost. All assumptions are adjusted periodically to reflect current circumstances.
The following summarizes MSRs capitalized and amortized, along with the activity in the related valuation allowance:
|
As of and For The Year Ended
December 31,
|
|||||||||||
|
2016
|
2015
|
2014
|
|||||||||
|
MSRs:
|
|
|
|
|
|
|
|||||
|
Balance at beginning of year
|
$
|
2,161
|
|
$
|
493
|
|
$
|
726
|
|
||
|
Capitalized servicing right fees upon sale
(1)
|
9
|
|
294
|
|
15
|
|
|||||
|
Acquired in connection with SBM acquisition, at fair value
|
—
|
|
1,608
|
|
—
|
|
|||||
|
Amortization charged against mortgage servicing fee income
(1)
|
(734
|
)
|
(231
|
)
|
(262
|
)
|
|||||
|
Valuation adjustment
|
(226
|
)
|
(3
|
)
|
14
|
|
|||||
|
Balance at end of year
|
$
|
1,210
|
|
$
|
2,161
|
|
$
|
493
|
|
||
|
Valuation Allowance:
|
|
|
|
|
|
|
|||||
|
Balance at beginning of year
|
$
|
(4
|
)
|
$
|
(1
|
)
|
$
|
(15
|
)
|
||
|
(Increase) decrease in impairment reserve
(1)
|
(226
|
)
|
(3
|
)
|
14
|
|
|||||
|
Balance at end of year
|
$
|
(230
|
)
|
$
|
(4
|
)
|
$
|
(1
|
)
|
||
|
Fair value, beginning of year
(2)
|
$
|
2,947
|
|
$
|
1,447
|
|
$
|
1,494
|
|
||
|
Fair value, end of year
(2)
|
$
|
1,701
|
|
$
|
2,947
|
|
$
|
1,447
|
|
||
|
(1)
|
Reported within mortgage banking income, net on the Company's consolidated statements of income.
|
|
(2)
|
Reported fair value represents all MSRs currently being serviced by the Company.
|
Mortgage loans serviced for third party investors, including mortgage loans where the Company serves as the sub-servicer for which it does not have a corresponding servicing right asset, are not included within the Company's loan portfolio on its consolidated statements of condition. The unpaid principal balance on mortgage loans serviced for investors at
December 31, 2016
and
2015
was
$930.8 million
and
$963.0 million
, respectively. Custodial escrow balances maintained in connection with the foregoing loan servicing for investors, and included in demand deposits on the Company's consolidated statements of condition, were
$11.9 million
and
$7.1 million
at
December 31, 2016
and
2015
, respectively.
For the year ended December 31, 2016, 2015 and 2014, the Company served as the primary sub-servicer of loans originated by MSHA. The Company entered into a contract with MSHA to perform loan servicing on the MSHA portfolio for a fee. For the year ended
December 31, 2016
,
2015
and
2014
, the Company earned fees of
$1.7 million
, $
1.2 million
, and
$1.2 million
, respectively, for the servicing of MSHA loans and was presented within other income on the consolidated statements of income. The MSHA unpaid principal balances of loans serviced by the Company, which are not included in the Company's portfolio loan balance within its consolidated statements of condition, totaled
$619.1 million
and
$612.1 million
at
December 31, 2016
and
2015
, respectively. Custodial escrow balances maintained in connection with the foregoing loan servicing for MSHA, and included in demand deposits on the consolidated statements of condition, were
$6.3 million
and
$4.3
93
million
at
December 31, 2016
and
2015
, respectively. Effective close of business on December 31, 2016, the Company exited its sub-servicer relationship with MSHA and all custodial escrow balances maintained in connection with the MSHA sub-servicing relationship were paid out in January 2017.
As part of its agreement to service loans for investors and its own loan portfolio, the Company is required to ensure the good-standing and priority lien position of the collateral for its mortgage loans. In doing so, the Company will advance borrower escrows and incur certain costs that are reimbursable by the borrowers, investors or other means, including mortgage insurance companies and governmental-backed agencies. At December 31, 2016 and 2015, the Company advanced escrow balances of
$2.0 million
and
$4.9 million
, respectively, and had a receivable of
$2.7 million
and
$5.7 million
, respectively, for the aforementioned services. At December 31, 2016 and 2015, the Company carried an allowance on the aforementioned receivable of
$829,000
and
$489,000
, respectively. The Company estimated the allowance on its receivable utilizing historical claim and reimbursement information, as well as information through ongoing negotiations with its investors. The Company has presented its advanced escrows and aforementioned net receivable within other assets on the Company's consolidated statements of condition.
In addition to fees earned for servicing the portfolios of investors, servicer guides impose certain time-lines for resolving delinquent loans through workout efforts or liquidation and impose compensatory fees on the Company if those deadlines are not satisfied other than for reasons beyond our control. The investors also have a contractual right to demand indemnification or loan repurchase for certain servicing breaches. For example, the Company would be required to indemnify the investors for or against failures by the Company to perform its servicing obligations or acts or omissions that involve willful malfeasance, bad faith or gross negligence in the performance of, or reckless disregard of, its duties. The Company records expenses for servicing-related claims and loan repurchases when it is probable that such claims or repurchases will be made and the amounts are reasonably estimable.
9. Deposits
The following is a summary of scheduled maturities of CDs as of
December 31, 2016
:
|
Retail
|
Brokered
|
Total
|
|||||||||
|
2017
|
$
|
230,853
|
|
$
|
34,939
|
|
$
|
265,792
|
|
||
|
2018
|
89,497
|
|
—
|
|
89,497
|
|
|||||
|
2019
|
54,453
|
|
—
|
|
54,453
|
|
|||||
|
2020
|
47,776
|
|
7,000
|
|
54,776
|
|
|||||
|
2021
|
32,260
|
|
—
|
|
32,260
|
|
|||||
|
Thereafter
|
13,364
|
|
—
|
|
13,364
|
|
|||||
|
Total
|
$
|
468,203
|
|
$
|
41,939
|
|
$
|
510,142
|
|
||
CDs issued in amounts that meet or exceed the FDIC insurance limit of
$250,000
totaled
$104.5 million
and
$136.6 million
at
December 31, 2016
and
2015
, respectively.
At
December 31, 2016
and
2015
, the Company, in the normal course of business, had deposits from certain officers, directors, and their associated companies totaling
$14.4 million
and
$15.7 million
, respectively.
The amount of overdraft deposits that were reclassified as loans at
December 31, 2016
and
2015
was
$986,000
and
$663,000
, respectively.
10. Borrowings
Short-term borrowings consist of customer repurchase agreements, FHLBB advances due in less than 90 days, FHLBB and correspondent bank overnight borrowings, and other short-term borrowings due within one year. The Bank had an available line of credit with the FHLBB of
$9.9 million
at
December 31, 2016
and
2015
. This line of credit serves as overdraft protection should the Company overdraw its account with the FHLBB. The interest rate for this line of credit is set daily by the FHLBB. The Company had
no
outstanding balance on the line of credit with the FHLBB at
December 31, 2016
or
2015
.
Long-term borrowings represent securities sold under repurchase agreements with major brokerage firms and notes payable with maturity dates over one year. Both wholesale and retail repurchase agreements are secured by mortgage-backed securities and securities of government sponsored enterprises.
94
At December 31, 2016, the Company has the following lines of credit available to it, for which it had no outstanding balances:
|
•
|
The Company has an unsecured
$10.0 million
line of credit with PNC Bank that has a maturity date of
December 20, 2017
for which the interest rate is LIBOR-based and is set daily by PNC Bank.
|
|
•
|
The Company, through the Bank, has an unsecured
$50.0 million
line of credit with PNC Bank for which the interest rate is set daily by PNC Bank.
|
|
•
|
The Company, through the Bank, has a secured line of credit of
$72.3 million
through the FRB's Discount Window for which the interest rate is set by the FRB daily. At December 31, 2016, the Bank pledged commercial loans with a carrying value of
$115.0 million
and investment securities of
$73,000
.
|
The following table summarizes short term and long term borrowings as presented on the consolidated statements of condition at:
|
December 31,
|
|||||||
|
2016
|
2015
|
||||||
|
Short-Term Borrowings (mature within one year):
|
|
|
|
|
|||
|
Customer repurchase agreements
|
$
|
225,605
|
|
$
|
184,989
|
|
|
|
FHLBB borrowings
|
210,000
|
|
255,000
|
|
|||
|
FHLBB and correspondent bank overnight borrowings
|
89,450
|
|
12,800
|
|
|||
|
Wholesale repurchase agreements
|
5,007
|
|
25,000
|
|
|||
|
Capital lease obligation
|
67
|
|
63
|
|
|||
|
Total short-term borrowings
|
$
|
530,129
|
|
$
|
477,852
|
|
|
|
Long-Term Borrowings (maturity greater than one year) :
|
|
|
|
|
|||
|
FHLBB borrowings
|
$
|
10,000
|
|
$
|
30,000
|
|
|
|
Capital lease obligation
|
791
|
|
859
|
|
|||
|
Wholesale repurchase agreements
|
—
|
|
5,052
|
|
|||
|
Total long-term borrowings
|
$
|
10,791
|
|
$
|
35,911
|
|
|
The table below provides information on the Company's borrowings classified as short-term for the dates indicated:
|
December 31,
|
|||||||
|
2016
|
2015
|
||||||
|
Balance outstanding at end of year
|
$
|
530,129
|
|
$
|
477,852
|
|
|
|
Weighted average interest rate
|
0.74
|
%
|
0.57
|
%
|
|||
At December 31, 2016, the terms of the Company's outstanding FHLBB borrowings were as follows:
|
|
Outstanding Balance
|
Maturity Date
|
Interest Rate Range
|
Next Call Date
|
Call Amount
|
|||||||||
|
Short-Term Borrowings
|
$
|
190,000
|
|
January 2017
|
0.73% - 0.84%
|
N/A
|
—
|
|
||||||
|
Short-Term Borrowings
|
20,000
|
|
July 2017
|
3.99% - 4.06%
|
January 2017
|
$
|
20,000
|
|
||||||
|
Long-Term Borrowings
|
$
|
10,000
|
|
April 2020
|
1.87%
|
N/A
|
—
|
|
||||||
FHLBB borrowings are collateralized by a blanket lien on qualified collateral consisting primarily of loans with first mortgages secured by one- to four-family properties, certain commercial real estate loans, certain pledged investment securities and other qualified assets. The carrying value of residential real estate and commercial loans pledged as collateral was
$1.1 billion
at
December 31, 2016
and
2015
. The carrying value of securities pledged as collateral at the FHLBB was
$400,000
and
$544,000
at
December 31, 2016
and
2015
, respectively.
95
At December 31, 2016 and 2015, the Company had
one
outstanding wholesale repurchase agreement totaling
$5.0 million
with a maturity date of March 1, 2017 at an interest rate of
4.67%
per annum. There are no remaining call dates prior to maturity.
Subordinated Debentures
The Company issued
$15.0 million
of subordinated debt on October 8, 2015, which qualifies as Tier II regulatory capital. The interest rate on the subordinated debt is
5.50%
per annum, fixed for the
ten
-year term and payable
semi-annually
on April 15 and October 15 each year. The Company can redeem the subordinated debt at par starting on
October 15, 2020
plus accrued and unpaid interest, or earlier if (i) they no longer qualify as Tier II capital for regulatory capital purposes; (ii) a change in law that prevents the Company from deducting interest payable for U.S. federal income tax purposes, or (iii) the Company is required to register as an investment company pursuant to the Investment Company Act of 1940. The subordinated debt is schedule to mature on
October 15, 2025
.
The Company incurred issuance costs of
$536,000
associated with this debt issuance. The Company capitalized these costs and they have been presented within subordinated debentures on the consolidated statements of condition. The Company will amortize the issuance costs over the
ten
-year term of the subordinated debt. The amortization costs incurred for the year ended
December 31, 2016
and 2015 associated with the debt issuance were
$54,000
and
$9,000
, respectively, and was recognized as an increase to interest expense within the consolidated statements of income.
In April 2006, the Company formed CCTA, which issued and sold trust preferred securities to the public. The Company received
$36.1 million
from the issuance of the trust preferred securities in return for junior subordinated debentures issued by the Company to CCTA. The Company owns all of the
$1.1 million
of outstanding common securities of CCTA. The interest rate of the trust preferred securities was fixed at
6.71%
through June 2011 and
now floats at the 3 month LIBOR plus 140 basis points
. The proceeds from the offering were used to repurchase Company common stock under the tender offer completed in May 2006. The trust preferred securities, which pay interest quarterly at the same rate as the junior subordinated debentures held by CCTA, are mandatorily redeemable on June 30, 2036, or may be redeemed by CCTA at par any time on or after June 30, 2011.
In connection with the acquisition of Union Bankshares Company in 2008, the Company assumed
$8.0 million
of trust preferred securities, held through a Delaware trust affiliate, UBCT. In 2006, Union Bankshares Company issued an aggregate principal amount of
$8.2 million
of
30
-year junior subordinated deferrable interest debt securities to UBCT. The Company owns all of the
$248,000
of outstanding common securities of UBCT. The debt securities obligate the Company to pay interest on their principal sum quarterly in arrears on January 7, April 7, July 7, and October 7 of each year.
The interest rate of the trust preferred securities until April 7, 2011 was a blended rate equal to the sum of (1) the product of 50% times the average three-month LIBOR plus 1.42%, plus (2) the product of 50% times 6.4725%. The rate is now the average three-month LIBOR plus 1.42%.
The debt securities mature on April 7, 2036, but may be redeemed by the Company, in whole or in part, beginning on April 7, 2011, on any interest payment date. The debt securities may also be redeemed by the Company in whole or in part, within 90 days of the occurrence of certain special redemption events as defined in the Indenture.
CCTA and UBCT are Delaware statutory trusts created for the sole purpose of issuing trust preferred securities and investing the proceeds in junior subordinated debentures of the Company. The junior subordinated debentures are the sole assets of the trusts. The Company is the owner of all of the common securities of CCTA and UBCT and fully and unconditionally guarantees each trust’s securities obligations. In accordance with GAAP, CCTA and UBCT are treated as unconsolidated subsidiaries. The common stock investment in the statutory trusts is included in other assets on the consolidated statements of condition. At
December 31, 2016
,
$43.0 million
of the trust preferred securities were included in the Company’s total Tier I capital and amounted to
13.0%
of Tier I capital of the Company.
The Company has a notional amount of
$43.0 million
in interest rate swap agreements on its junior subordinated debentures. Further discussion on the terms and accounting for the interest rate swap agreements is included within Note 18 of the consolidated financial statements.
Interest expense on the subordinated debentures, including the effective portion of the associated interest rate swaps on these debt instruments reclassified from OCI into earnings, totaled
$3.4 million
,
$2.7 million
and
$2.5 million
for the year ended
December 31, 2016
,
2015
and
2014
, respectively. Refer to Note 18 of the consolidated financial statements for information pertaining to the reclassification of OCI into earnings on the interest rate swaps.
96
11. Repurchase Agreements
The Company can raise additional liquidity by entering into repurchase agreements at its discretion. In a security repurchase agreement transaction, the Company will generally sell a security, agreeing to repurchase either the same or substantially identical security on a specified later date, at a greater price than the original sales price. The difference between the sale price and purchase price is the cost of the proceeds, which is recorded as interest expense on the consolidated statement of income. The securities underlying the agreements are delivered to counterparties as security for the repurchase obligations. Since the securities are treated as collateral and the agreement does not qualify for a full transfer of effective control, the transactions does not meet the criteria to be classified as a sale, and is therefore considered a secured borrowing transaction for accounting purposes. Payments on such borrowings are interest only until the scheduled repurchase date. In a repurchase agreement the Company is subject to the risk that the purchaser may default at maturity and not return the securities underlying the agreements. In order to minimize this potential risk, the Company either deals with established firms when entering into these transactions or with customers whose agreements stipulate that the securities underlying the agreement are not delivered to the customer and instead are held in segregated safekeeping accounts by the Company's safekeeping agents.
The tables below sets forth information regarding the Company’s repurchase agreements accounted for as secured borrowings and types of collateral at
December 31, 2016
and
2015
:
|
Remaining Contractual Maturity of the Agreements
|
||||||||||||||||||||
|
Overnight and Continuous
|
Up to 30 Days
|
30 - 90 Days
|
Greater than 90 Days
|
Total
|
||||||||||||||||
|
December 31, 2016
|
||||||||||||||||||||
|
Customer Repurchase Agreements:
|
||||||||||||||||||||
|
Mortgage-backed securities issued or guaranteed by U.S. government-sponsored enterprises
|
$
|
117,784
|
|
$
|
—
|
|
$
|
—
|
|
$
|
—
|
|
$
|
117,784
|
|
|||||
|
Collateralized mortgage obligations issued or guaranteed by U.S. government-sponsored enterprises
|
107,821
|
|
—
|
|
—
|
|
—
|
|
107,821
|
|
||||||||||
|
Total Customer Repurchase Agreements
|
225,605
|
|
—
|
|
—
|
|
—
|
|
225,605
|
|
||||||||||
|
Wholesale Repurchase Agreements:
|
||||||||||||||||||||
|
Mortgage-backed securities issued or guaranteed by U.S. government-sponsored enterprises
|
—
|
|
—
|
|
3,715
|
|
—
|
|
3,715
|
|
||||||||||
|
Collateralized mortgage obligations issued or guaranteed by U.S. government-sponsored enterprises
|
—
|
|
—
|
|
1,292
|
|
—
|
|
1,292
|
|
||||||||||
|
Total Wholesale Repurchase Agreements
|
—
|
|
—
|
|
5,007
|
|
—
|
|
5,007
|
|
||||||||||
|
Total Repurchase Agreements
(1)
|
$
|
225,605
|
|
$
|
—
|
|
$
|
5,007
|
|
$
|
—
|
|
$
|
230,612
|
|
|||||
|
(1)
|
Total repurchase agreements are presented within short-term borrowings on the consolidated statements of condition.
|
97
|
Remaining Contractual Maturity of the Agreements
|
||||||||||||||||||||
|
Overnight and Continuous
|
Up to 30 Days
|
30 - 90 Days
|
Greater than 90 Days
|
Total
|
||||||||||||||||
|
December 31, 2015
|
||||||||||||||||||||
|
Customer Repurchase Agreements:
|
||||||||||||||||||||
|
Obligations of states and political subdivisions
|
$
|
556
|
|
$
|
—
|
|
$
|
—
|
|
$
|
—
|
|
$
|
556
|
|
|||||
|
Mortgage-backed securities issued or guaranteed by U.S. government-sponsored enterprises
|
95,967
|
|
—
|
|
—
|
|
—
|
|
95,967
|
|
||||||||||
|
Collateralized mortgage obligations issued or guaranteed by U.S. government-sponsored enterprises
|
88,466
|
|
—
|
|
—
|
|
—
|
|
88,466
|
|
||||||||||
|
Total Customer Repurchase Agreements
|
184,989
|
|
—
|
|
—
|
|
—
|
|
184,989
|
|
||||||||||
|
Wholesale Repurchase Agreements:
|
||||||||||||||||||||
|
Mortgage-backed securities issued or guaranteed by U.S. government-sponsored enterprises
|
—
|
|
—
|
|
—
|
|
22,016
|
|
22,016
|
|
||||||||||
|
Collateralized mortgage obligations issued or guaranteed by U.S. government-sponsored enterprises
|
—
|
|
—
|
|
—
|
|
8,036
|
|
8,036
|
|
||||||||||
|
Total Wholesale Repurchase Agreements
|
—
|
|
—
|
|
—
|
|
30,052
|
|
30,052
|
|
||||||||||
|
Total Repurchase Agreements
(1)
|
$
|
184,989
|
|
$
|
—
|
|
$
|
—
|
|
$
|
30,052
|
|
$
|
215,041
|
|
|||||
|
(1)
|
Total repurchase agreements are presented within short- and long-term borrowings on the consolidated statements of condition.
|
Certain customers held CDs totaling
$917,000
and
$914,000
with the Bank at
December 31, 2016
and 2015, respectively, that were collateralized by CMO and MBS securities that were overnight repurchase agreements.
Certain counterparties monitor collateral, and may request additional collateral to be posted from time to time.
12. Income Taxes
The current and deferred components of income tax expense on the consolidated statements of income were as follows:
|
For The Year Ended
December 31,
|
|||||||||||
|
2016
|
2015
|
2014
|
|||||||||
|
Current:
|
|
|
|
|
|
|
|||||
|
Federal
|
$
|
17,854
|
|
$
|
7,956
|
|
$
|
11,435
|
|
||
|
State
|
930
|
|
71
|
|
505
|
|
|||||
|
|
18,784
|
|
8,027
|
|
11,940
|
|
|||||
|
Deferred:
|
|
|
|
|
|
|
|||||
|
Federal
|
(1,258
|
)
|
1,356
|
|
(500
|
)
|
|||||
|
State
|
(54
|
)
|
524
|
|
—
|
|
|||||
|
(1,312
|
)
|
1,880
|
|
(500
|
)
|
||||||
|
Income tax expense
|
$
|
17,472
|
|
$
|
9,907
|
|
$
|
11,440
|
|
||
98
The income tax expense differs from the amount computed by applying the statutory federal income tax rate as a result of the following:
|
For The Year Ended
December 31,
|
|||||||||||
|
2016
|
2015
|
2014
|
|||||||||
|
Computed tax expense
|
$
|
20,139
|
|
$
|
10,801
|
|
$
|
12,604
|
|
||
|
Increase (reduction) in income taxes resulting from:
|
|
|
|
|
|||||||
|
Tax exempt income
|
(1,312
|
)
|
(1,092
|
)
|
(704
|
)
|
|||||
|
Income from life insurance
|
(908
|
)
|
(588
|
)
|
(503
|
)
|
|||||
|
Share-based awards
(1)
|
(701
|
)
|
—
|
|
—
|
|
|||||
|
State taxes, net of federal benefit
|
565
|
|
373
|
|
328
|
|
|||||
|
Low income housing credits
|
(376
|
)
|
(359
|
)
|
(286
|
)
|
|||||
|
Non-deductible acquisition-related costs
|
—
|
|
467
|
|
—
|
|
|||||
|
Other
|
65
|
|
305
|
|
1
|
|
|||||
|
Income tax expense
|
$
|
17,472
|
|
$
|
9,907
|
|
$
|
11,440
|
|
||
|
Income before income taxes
|
$
|
57,539
|
|
$
|
30,859
|
|
$
|
36,010
|
|
||
|
Effective tax rate
|
30.4
|
%
|
32.1
|
%
|
31.8
|
%
|
|||||
(1) Prior to the adoption of ASU 2016-09, the Company accounted for its windfall tax benefits or shortfalls generated upon exercise of a non-qualified stock option or a disqualifying incentive stock option, or upon vesting of its restricted shares through shareholders' equity (or as income tax expense to the extent the Company did not have a windfall tax benefit surplus). Upon adoption, the Company has accounted for its windfall tax benefits and shortfalls generated within income tax expense on the consolidated statements of income as a discrete period item in the quarter generated.
Temporary differences between the financial statements carrying amounts and the tax bases of assets and liabilities gave rise to the following deferred tax assets and liabilities:
|
December 31,
|
|||||||||||||||
|
2016
|
2015
|
||||||||||||||
|
(Calculated using a 35% deferred income tax rate)
|
Asset
|
Liability
|
Asset
|
Liability
|
|||||||||||
|
Net operating loss and tax credit carryforward
|
$
|
20,977
|
|
$
|
—
|
|
$
|
22,282
|
|
$
|
—
|
|
|||
|
Allowance for loan losses
|
8,094
|
|
—
|
|
7,416
|
|
—
|
|
|||||||
|
Pension and other benefits
|
5,141
|
|
—
|
|
4,488
|
|
—
|
|
|||||||
|
Net unrealized losses on AFS securities
|
3,227
|
|
—
|
|
2,047
|
|
—
|
|
|||||||
|
Net unrealized losses on derivative instruments
|
3,066
|
|
—
|
|
3,432
|
|
—
|
|
|||||||
|
Purchase accounting and deposit premium
|
1,430
|
|
—
|
|
2,856
|
|
—
|
|
|||||||
|
Deferred compensation and benefits
|
1,791
|
|
—
|
|
2,129
|
|
—
|
|
|||||||
|
Net unrealized losses on postretirement plans
|
1,147
|
|
—
|
|
1,102
|
|
—
|
|
|||||||
|
Depreciation
|
—
|
|
(4,520
|
)
|
—
|
|
(4,298
|
)
|
|||||||
|
Deferred loan origination fees
|
—
|
|
(2,046
|
)
|
—
|
|
(1,815
|
)
|
|||||||
|
Other
|
956
|
|
—
|
|
77
|
|
—
|
|
|||||||
|
|
45,829
|
|
(6,566
|
)
|
45,829
|
|
(6,113
|
)
|
|||||||
|
Valuation allowance on deferred tax assets
|
—
|
|
—
|
|
|||||||||||
|
Net deferred tax assets
|
$
|
39,263
|
|
$
|
39,716
|
|
|||||||||
In connection with the Merger, the Company acquired certain net operating losses and tax credit carryforwards as of the acquisition date, including federal net operating losses of
$71.2 million
and State of Maine net operating losses of
$213,000
. The Company determined it would not be able to utilize
$6.8 million
of the acquired federal net operating losses and wrote-off this amount within purchase accounting. Due to Internal Revenue Code of 1986, as amended, Section 382(g) limitations, the Company's use of the federal net operating losses acquired is limited to
$3.9 million
annually (and
$803,000
for fiscal year 2015), which was determined using the applicable federal rate and the fair value of consideration paid for the acquisition at the acquisition date. The acquired federal net operating losses will expire between
2030
and
2034
. The Company has assessed the need for a valuation allowance on the acquired federal net operating losses and determined that there was a high likelihood that it will be able to utilize all of the acquired allowable federal net operating losses prior to expiration as the Company has a history of generating taxable income well in excess of the limitation. As such, there was
no
valuation allowance established on any of the deferred tax assets acquired as part of the Merger.
99
Income tax returns for the year ended December 31,
2013
through
2015
are open to audit by federal and various state authorities and currently the Company's federal income tax returns for
2013
and
2014
are undergoing an IRS examination. If the Company, as a result of this audit or any future audit, was assessed interest and penalties, the amounts would be recorded within non-interest expense on the consolidated statements of income.
13. Shareholders’ Equity
Dividends
The primary source of funds available to the Company for the payment of dividends to its shareholders is dividends paid to the Company by its subsidiary, the Bank. The Bank is subject to certain requirements imposed by federal banking laws and regulations. These requirements, among other things, establish minimum levels of capital and restrict the amount of dividends that a bank subsidiary may distribute. Under regulations prescribed by the OCC, without prior OCC approval, a bank subsidiary may not declare dividends in any year in excess of the bank’s (i) net income for the current year, (ii) plus its retained net income for the prior
two
years. For the year ended
December 31, 2016
,
2015
, and 2014, the Bank declared dividends for payment to the Company in the amount of
$16.0 million
,
$39.2 million
, which included a
$30.0 million
special dividend that was paid in connection with the Merger, and
$12.8 million
, respectively. Prior to Acadia Trust's merger into the Bank effective close of business November 30, 2016, Acadia Trust did
no
t declare any dividends for payment to the Company for the period January 1, 2016 to November 30, 2016. Furthermore, Acadia Trust had
no
t declared a dividend to the Company for the year ended December 31, 2015 or 2014. For the year ended December 31, 2016, 2015 and 2014, the Company declared
$12.9 million
,
$10.6 million
and
$8.3 million
, respectively, in dividends payable to its shareholders.
Common Stock Split
On August 30, 2016, the Company's Board of Directors declared a
three
-for-
two
stock split, effected in the form of a stock dividend, on the Company's common stock. Each shareholder of record on September 15, 2016, received
one
additional share of common stock for every
two
shares of common stock owned. The stock was issued September 30, 2016.
The Company paid shareholders cash in lieu of fractional shares of common stock in connection with the split, at a price of
$31.75
per share, the closing price of the Company’s common stock on September 14, 2016. The total cash paid for fractional shares was
$5,000
, and was accounted for as a reduction of capital stock.
Common Stock Repurchase (adjusted for the three-for-two common stock split)
On September 24, 2013, the Board of Directors authorized the 2013 Repurchase Plan. The 2013 Repurchase Plan allows for the repurchase of up to
375,000
shares of the Company’s outstanding common stock. This program is expected to continue until the authorized number of shares is repurchased, or the Company’s board terminates the program. As of
December 31, 2016
, the Company had repurchased
374,250
shares at a weighted-average price of $
26.55
, or
99.8%
of the program’s total allotment, and
2.4%
of total outstanding shares. The Company did
no
t repurchase any of its outstanding common stock for the year ended
December 31, 2016
.
100
14. EPS
The following is an analysis of basic and diluted EPS, reflecting the application of the two-class method, as described below:
|
For The Year Ended
December 31,
|
|||||||||||
|
2016
|
2015
|
2014
|
|||||||||
|
Net income
|
$
|
40,067
|
|
$
|
20,952
|
|
$
|
24,570
|
|
||
|
Dividends and undistributed earnings allocated to participating securities
(1)
|
(189
|
)
|
(59
|
)
|
(75
|
)
|
|||||
|
Net income available to common shareholders
|
$
|
39,878
|
|
$
|
20,893
|
|
$
|
24,495
|
|
||
|
Weighted-average common shares outstanding for basic EPS
(2)
|
15,422,160
|
|
12,031,294
|
|
11,176,468
|
|
|||||
|
Dilutive effect of stock-based awards
(2)(3)
|
82,079
|
|
43,285
|
|
29,420
|
|
|||||
|
Weighted-average common and potential common shares for diluted EPS
(2)
|
15,504,239
|
|
12,074,579
|
|
11,205,888
|
|
|||||
|
Earnings per common share
(2)
:
|
|
|
|
|
|
|
|||||
|
Basic EPS
|
$
|
2.59
|
|
$
|
1.73
|
|
$
|
2.19
|
|
||
|
Diluted EPS
|
$
|
2.57
|
|
$
|
1.73
|
|
$
|
2.19
|
|
||
|
Awards excluded from the calculation of diluted EPS
(2)
(4)
:
|
|||||||||||
|
Stock options
|
—
|
|
19,875
|
|
20,625
|
|
|||||
|
(1)
|
Represents dividends paid and undistributed earnings allocated to nonvested stock-based awards that contain non-forfeitable rights to dividends.
|
|
(2)
|
Share and per share amounts have been adjusted to reflect the three-for-two split effective September 30, 2016, for all periods presented. Refer to Note 13.
|
|
(3)
|
Represents the effect of the assumed exercise of stock options, vesting of restricted shares, vesting of restricted stock units, and vesting of LTIP awards that have met the performance criteria, utilizing the treasury stock method.
|
|
(4)
|
Represents stock-based awards not included in the computation of potential common shares for purposes of calculating diluted EPS as the exercise prices were greater than the average market price of the Company's common stock, and, therefore, are considered anti-dilutive.
|
Nonvested stock-based payment awards that contain non-forfeitable rights to dividends are participating securities and are included in the computation of EPS pursuant to the two-class method. The two-class method is an earnings allocation formula that determines EPS for each class of common stock and participating security according to dividends declared (or accumulated) and participation rights in undistributed earnings. Certain of the Company’s nonvested stock-based awards qualify as participating securities.
Net income is allocated between the common stock and participating securities pursuant to the two-class method. Basic EPS is computed by dividing net income available to common shareholders by the weighted average number of common shares outstanding during the period, excluding participating nonvested stock-based awards.
Diluted EPS is computed in a similar manner, except that the denominator includes the number of additional common shares that would have been outstanding if potentially dilutive common shares were issued using the treasury stock method.
15. Stock-Based Compensation Plans
Stock-Based Compensation
On April 29, 2003 and May 1, 2012, the shareholders of the Company approved the 2003 Plan and 2012 Plan, respectively. The maximum number of shares of stock reserved and available for issuance under each the 2003 Plan and 2012 Plan is
1.2 million
shares. Awards may be granted in the form of incentive stock options, non-qualified stock options, stock appreciation rights, restricted stock, restricted stock units, unrestricted stock, performance shares and dividend equivalent rights, or any combination of the preceding, and the exercise price shall not be less than
100%
of the fair market value on the date of grant in the case of incentive stock options, or
85%
of the fair market value on the date of grant in the case of non-qualified stock options. No stock options are exercisable more than
ten
years after the date the stock option is granted. The exercise price of all
101
options granted equaled the market price of the Company's stock on the date of grant, except for the non-qualified stock options issued in conjunction with the Merger. Refer to Note 2 for additional details.
Stock Option Awards
Stock options granted under the 2003 Plan and the 2012 Plan have been both incentive stock options and non-qualified stock options. All incentive stock options and non-qualified stock options granted vest pro rata over a
five
year period and have a contractual life of
ten
years.
On the date of each grant, the fair value of each award is derived using the Black-Scholes option pricing model based on assumptions made by the Company as follows:
|
•
|
Dividend yield is based on the dividend rate of the Company’s stock at the date of grant.
|
|
•
|
Risk-free interest rate is based on the U.S. Treasury bond rate with a term equaling the expected life of the granted options.
|
|
•
|
Expected volatility is based on the historical volatility of the Company’s stock price calculated over the expected life of the option.
|
|
•
|
Expected life represents the period of time that granted options are expected to be outstanding based on historical trends.
|
The following table presents the option pricing assumptions and the estimated fair value of the options using these assumptions for grants made for the year ended:
|
December 31,
|
|||||||||||
|
2016
|
2015
|
2014
|
|||||||||
|
Weighted-average dividend yield
|
3.12
|
%
|
3.01
|
%
|
2.90
|
%
|
|||||
|
Weighted-average risk-free interest rate
|
1.52
|
%
|
1.50
|
%
|
1.65
|
%
|
|||||
|
Weighted-average expected volatility
|
29.64
|
%
|
31.85
|
%
|
35.39
|
%
|
|||||
|
Weighted-average expected life (in years)
|
5.3
|
|
5.3
|
|
5.3
|
|
|||||
|
Weighted-average fair value of options granted
|
$
|
5.17
|
|
$
|
5.87
|
|
$
|
5.95
|
|
||
Compensation expense is recognized on a straight-line basis over the option vesting period. For the year ended December 31, 2016, 2015 and 2014, the Company issued only incentive stock options and the associated compensation expense recognized was
$30,000
,
$51,000
and
$81,000
, respectively. The Company does not receive any tax benefit on its issuance of incentive stock options, unless upon exercise a disqualifying disposition is made. The total tax benefit to the Company upon exercise of incentive stock options for the year ended
December 31, 2016
,
2015
and
2014
was
$36,000
,
$59,000
, and
$19,000
, respectively. Additionally, for the year ended December 31, 2016, the Company received a tax benefit upon the exercise of non-qualified stock options that were issued as consideration in the Merger of
$378,000
.
Unrecognized compensation expense for nonvested stock options totaled
$48,000
at
December 31, 2016
. Effective January 1, 2016, the Company early adopted ASU 2016-09 and made a policy election to not apply a forfeiture rate to account for its share-based compensation expense. This accounting policy change was applied retrospectively, the cumulative-effect of such adjustment for prior periods totaled
$72,000
and was recorded within shareholders' equity for the year ended December 31, 2016. Unrecognized compensation expense on stock options is expected to be recognized over the remaining weighted-average vesting period of
3.1
years. The total intrinsic value of options exercised for the year ended
December 31, 2016
,
2015
and
2014
was
$2.5 million
,
$573,000
, and
$134,000
, respectively.
102
Stock option activity for the year ended
December 31, 2016
is as follows:
|
Number of Shares
(1)
|
Weighted-Average
Exercise Price
|
Weighted-Average
Remaining
Contractual Term
|
Aggregate Intrinsic Value
|
||||||||||
|
Options outstanding at January 1, 2016
|
219,399
|
|
$
|
16.93
|
|
|
|||||||
|
Granted
|
3,000
|
|
25.64
|
|
|
|
|
||||||
|
Exercised
|
(157,956
|
)
|
15.53
|
|
|
|
|
||||||
|
Forfeited and expired
|
(5,700
|
)
|
22.93
|
|
|||||||||
|
Options outstanding at December 31, 2016
|
58,743
|
|
$
|
20.38
|
|
3.82
|
$
|
1,558
|
|
||||
|
Options exercisable at December 31, 2016
|
49,293
|
|
$
|
19.62
|
|
3.91
|
$
|
1,224
|
|
||||
|
(1)
|
Options outstanding at January 1, 2016 included
118,299
of non-qualified stock options issued in conjunction with the Merger. Of these,
109,356
were exercised during 2016. At December 31, 2016,
8,943
non-qualified stock options issued in conjunction with the Merger were outstanding and exercisable.
|
A summary of the status of the Company’s nonvested stock options as of
December 31, 2016
and changes during the year then ended is presented below:
|
Awards
|
Weighted-Average
Grant Date
Fair Value
|
|||||
|
Nonvested at January 1, 2016
|
17,351
|
|
$
|
7.40
|
|
|
|
Granted
|
3,000
|
|
5.17
|
|
||
|
Vested
|
(7,751
|
)
|
8.13
|
|
||
|
Forfeited
|
(3,150
|
)
|
5.92
|
|
||
|
Nonvested at December 31, 2016
|
9,450
|
|
$
|
6.59
|
|
|
For the year ended
December 31, 2016
and
2015
, the Company received cash from the exercise of stock options of
$1.3 million
and
$736,000
, respectively.
Restricted Stock, Restricted Stock Units and MSPP
The Company issued restricted stock awards to certain executives, directors, and employees. Restricted stock awards are issued to certain employees and vest pro-rata over the requisite service period, which is typically three or five years, and may contain certain performance-based conditions. The vesting period for restricted stock awards issued to directors under the Independent Directors' Equity Compensation Program is determined when granted. Restricted stock awards issued to directors and employees participate in dividends and recipients are entitled to vote these restricted shares during the vesting period.
The Company issued restricted stock units to certain Company directors who make a valid election to defer under the Independent Directors' Equity Compensation Program, a component of the 2012 Plan. These units are deferred and have no voting or dividend rights until termination or retirement, at which time shares will be issued based on the grant date fair value of the awards issued. The vesting period for these awards is determined when granted. The Company did not issue restricted stock units to directors under the Independent Directors' Equity Compensation Program for the year ended
December 31, 2016
.
The Company offers the MSPP to provide an opportunity for certain executives and employees to receive restricted shares of the Company’s common stock in lieu of their annual incentive bonus. Restricted shares issued under the MSPP are granted at a discount of one-third of the fair market value of the stock on the date of grant and cliff vests
two
years after the grant date. Restricted stock issued under the MSPP to executives and employees participate in dividends and are entitled to vote these restricted shares during the vesting period.
103
Compensation expense recognized in connection with the restricted stock units, restricted stock awards, and MSPP is presented in the following table:
|
For The Year Ended
December 31, |
|||||||||||
|
|
2016
|
2015
|
2014
|
||||||||
|
Restricted stock and restricted stock units
|
$
|
703
|
|
$
|
327
|
|
$
|
254
|
|
||
|
MSPP
|
102
|
|
66
|
|
67
|
|
|||||
|
Total compensation expense
|
$
|
805
|
|
$
|
393
|
|
$
|
321
|
|
||
|
Related income tax benefit
|
$
|
282
|
|
$
|
137
|
|
$
|
112
|
|
||
|
Fair value of grants vested
|
$
|
660
|
|
$
|
433
|
|
$
|
332
|
|
||
The following table presents a summary of the activity related to restricted stock, restricted stock units and MSPP for the period indicated:
|
Restricted Stock and Restricted Stock Units
|
MSPP
|
||||||||||||
|
|
Number of Shares
|
Weighted-Average
Grant Date
Fair Value
|
Number of Shares
|
Weighted-Average
Grant Date
Fair Value
|
|||||||||
|
Nonvested at January 1, 2016
|
38,391
|
|
$
|
27.09
|
|
18,800
|
|
$
|
7.85
|
|
|||
|
Granted
|
32,016
|
|
28.88
|
|
16,000
|
|
8.02
|
|
|||||
|
Vested
|
(22,000
|
)
|
27.40
|
|
(6,988
|
)
|
8.21
|
|
|||||
|
Forfeited
|
(894
|
)
|
26.55
|
|
(1,113
|
)
|
8.10
|
|
|||||
|
Nonvested at December 31, 2016
|
47,513
|
|
$
|
28.16
|
|
26,699
|
|
$
|
7.85
|
|
|||
At
December 31, 2016
, unrecognized compensation cost related to nonvested restricted stock awards and MSPP was
$1.1 million
, which is expected to be recognized over a weighted-average period of
2.6
years.
LTIP
The LTIP is intended to attract and retain executives who will contribute to the Company’s future success. The long-term performance period is a period of
three
consecutive years beginning on January 1 of the first year and ending on December 31 of the third year. Awards are based upon either: (i) the attainment of certain performance targets on specific performance measures selected by the Compensation Committee and approved by the Board of Directors; or (ii) 50% weighted on the attainment of certain performance targets on specific performance measures selected by the Compensation Committee and approved by the Board of Directors and 50% weighted on meeting the requisite service period. The performance-based share units granted will vest only if specific performance measures, as defined under the LTIP, are achieved. Failure to achieve the specific performance measures will result in all or a portion of the shares being forfeited. The service-based share units granted vest annually pro-rata over the three year period.
Compensation expense recognized in connection with the LTIP is presented in the following table:
|
For The Year Ended
December 31, |
|||||||||||
|
|
2016
|
2015
|
2014
|
||||||||
|
Compensation expense
(1)
|
$
|
1,080
|
|
$
|
330
|
|
$
|
151
|
|
||
|
Related income tax benefit
|
$
|
378
|
|
$
|
116
|
|
$
|
53
|
|
||
|
Fair value of grants vested
|
$
|
725
|
|
$
|
412
|
|
$
|
—
|
|
||
|
(1)
|
For the year ended December 31, 2016,
$84,000
of compensation expense associated with the LTIP for the plan year January 1, 2016 to December 31, 2018 was accounted for within total compensation expense for restricted stock and restricted stock units above as this plan contains both performance- and service-based conditions.
|
104
The following table presents a summary of the activity related to LTIP for the period indicated:
|
|
Number of Shares
|
Weighted-Average
Grant Date
Fair Value
|
||||
|
Nonvested at January 1, 2016
|
64,165
|
|
$
|
26.71
|
|
|
|
Granted
|
17,385
|
|
28.87
|
|
||
|
Vested
|
(26,396
|
)
|
27.45
|
|
||
|
Forfeited
|
(2,417
|
)
|
27.45
|
|
||
|
Nonvested at December 31, 2016
|
52,737
|
|
$
|
27.01
|
|
|
Based on current performance levels, unrecognized stock compensation expense for the performance share awards was
$417,000
with a weighted-average remaining amortization period of
1.4
years at
December 31, 2016
.
DCRP
The DCRP is an unfunded deferred compensation plan for the benefit of certain Company executives. The Company’s Compensation Committee determines eligibility in the DCRP and annually, participants will receive a credit to an account administered by the Company of
10%
of each participant’s annual base salary and bonus for the prior performance period. Annual credits to a participant’s account will be denominated in deferred stock awards (the right to receive a share of common stock of the Company upon the satisfaction of certain restrictions) based on the fair market value of the common stock of the Company on the date of grant. Vesting occurs ratably from the date of participation until the participant reaches the age of 65, at which time the participant is
100%
vested. Upon retirement or termination of employment, the participant will receive shares of common stock equal to the Deferred Stock Awards in the account multiplied by the vested percentage, reduced by the amount to be withheld for income taxes. The Company granted
4,094
,
3,609
, and
3,030
of deferred stock awards for the years ended
December 31, 2016
,
2015
and
2014
, respectively under the DCRP. Compensation expense totaled
$81,000
,
$62,000
, and
$46,000
for the years ended
December 31, 2016
,
2015
and
2014
, respectively. Unrecognized stock compensation expense for the deferred stock awards was
$308,000
with a weighted-average remaining amortization period of
10.4
years at
December 31, 2016
.
16. Employee Benefit Plans
401(k)/Profit Sharing Plan
The Company has a 401(k)/profit sharing plan and the majority of employees participate in the plan. Employees may contribute pre-tax contributions to the 401(k)/profit sharing plan up to the maximum amount allowed by federal tax laws. The Company makes matching contributions of up to
4%
of an employee’s eligible compensation. The Company may make additional matching contributions subject to the discretion of the Board of Directors. For the year ended
December 31, 2016
,
2015
and
2014
, these contributions amounted to
3%
of pre-tax compensation. For the year ended
December 31, 2016
,
2015
and
2014
, expenses under the 401(k)/Profit Sharing plan amounted to
$2.2 million
,
$1.5 million
, and
$1.4 million
, respectively.
SERP and Other Postretirement Benefit Plan
The Company sponsors unfunded, non-qualified SERPs for certain officers. These agreements are designed to make up the shortfall (when compared to a non-highly compensated employee) in replacing income at retirement due to IRS compensation and benefit limits under the 401(k) plan and Social Security. With a SERP in place, participants should be able to replace
65
–
75%
of their final average compensation. For those eligible for benefits, the SERP provides for a minimum
15
-year guaranteed benefit for all vested participants. In addition, the Company provides medical and life insurance to certain eligible retired employees under the other postretirement benefit plan.
105
The following table summarizes changes in the benefit obligation and plan assets for (i) SERP and (ii) the other postretirement benefit plan as of
December 31, 2016
and
2015
:
|
SERP
|
Other Postretirement
Benefits
|
||||||||||||||
|
|
2016
|
2015
|
2016
|
2015
|
|||||||||||
|
Benefit obligations:
|
|
|
|
|
|
|
|
||||||||
|
Beginning of year
|
$
|
11,052
|
|
$
|
10,834
|
|
$
|
3,447
|
|
$
|
2,997
|
|
|||
|
Service cost
|
308
|
|
307
|
|
59
|
|
62
|
|
|||||||
|
Interest cost
|
432
|
|
424
|
|
151
|
|
117
|
|
|||||||
|
Actuarial (gain) loss
|
219
|
|
(32
|
)
|
143
|
|
92
|
|
|||||||
|
Business combinations
(1)
|
—
|
|
—
|
|
—
|
|
312
|
|
|||||||
|
Benefits paid
|
(488
|
)
|
(481
|
)
|
(165
|
)
|
(133
|
)
|
|||||||
|
End of year
|
11,523
|
|
11,052
|
|
3,635
|
|
3,447
|
|
|||||||
|
Fair value of plan assets:
|
|||||||||||||||
|
Beginning of year
|
—
|
|
—
|
|
—
|
|
—
|
|
|||||||
|
Employer contributions
|
488
|
|
481
|
|
165
|
|
133
|
|
|||||||
|
Benefits paid
|
(488
|
)
|
(481
|
)
|
(165
|
)
|
(133
|
)
|
|||||||
|
End of year
|
—
|
|
—
|
|
—
|
|
—
|
|
|||||||
|
Funded status at end of year
(2)
|
$
|
11,523
|
|
$
|
11,052
|
|
$
|
3,635
|
|
$
|
3,447
|
|
|||
|
Amounts recognized in AOCI, net of tax:
|
|||||||||||||||
|
Net actuarial loss
|
$
|
1,791
|
|
$
|
1,789
|
|
$
|
495
|
|
$
|
423
|
|
|||
|
Prior service cost (credit)
|
—
|
|
5
|
|
(156
|
)
|
(170
|
)
|
|||||||
|
Total
|
$
|
1,791
|
|
$
|
1,794
|
|
$
|
339
|
|
$
|
253
|
|
|||
|
(1)
|
In connection with the Merger, the Company assumed its post-retirement benefits for certain former employees and their spouses whereby the Company will cover 100% of healthcare premiums.
|
|
(2)
|
Reported within other liabilities on the consolidated statements of condition.
|
The accumulated benefit obligation for the SERP was
$8.5 million
at
December 31, 2016
and
2015
. In
2017
, approximately
$247,000
in net actuarial losses and no prior service costs, are expected to be recognized as components of net period benefit cost for the SERP, and approximately
$41,000
and
$24,000
in net actuarial losses and prior service credits, respectively, are expected to be recognized for the other postretirement benefit plan.
106
The components of net period benefit cost and other amounts recognized in OCI, before taxes, were as follows:
|
SERP
|
Other Postretirement
Benefits
|
||||||||||||||||||||||
|
|
2016
|
2015
|
2014
|
2016
|
2015
|
2014
|
|||||||||||||||||
|
Net period benefit cost:
|
|
|
|
|
|
|
|
|
|
|
|
|
|||||||||||
|
Service cost
|
$
|
308
|
|
$
|
307
|
|
$
|
270
|
|
$
|
59
|
|
$
|
62
|
|
$
|
45
|
|
|||||
|
Interest cost
|
432
|
|
424
|
|
456
|
|
151
|
|
117
|
|
132
|
|
|||||||||||
|
Recognized net actuarial loss
|
220
|
|
218
|
|
140
|
|
30
|
|
24
|
|
10
|
|
|||||||||||
|
Amortization of prior service cost (credit)
|
7
|
|
19
|
|
19
|
|
(22
|
)
|
(22
|
)
|
(22
|
)
|
|||||||||||
|
Net period benefit cost
|
967
|
|
968
|
|
885
|
|
218
|
|
181
|
|
165
|
|
|||||||||||
|
Changes in funded status recognized in OCI, before taxes:
|
|
|
|
|
|
|
|||||||||||||||||
|
Net actuarial (gain) loss
|
219
|
|
(32
|
)
|
777
|
|
143
|
|
92
|
|
(134
|
)
|
|||||||||||
|
Reclassifications to net period benefit cost:
|
|||||||||||||||||||||||
|
Amortization of net unrecognized actuarial loss
|
(220
|
)
|
(218
|
)
|
(140
|
)
|
(30
|
)
|
(24
|
)
|
(10
|
)
|
|||||||||||
|
Amortization of prior service (cost) credit
|
(7
|
)
|
(19
|
)
|
(19
|
)
|
22
|
|
22
|
|
22
|
|
|||||||||||
|
Total recognized in OCI, before taxes
|
(8
|
)
|
(269
|
)
|
618
|
|
135
|
|
90
|
|
(122
|
)
|
|||||||||||
|
Total recognized in net period benefit cost and OCI, before taxes
|
$
|
959
|
|
$
|
699
|
|
$
|
1,503
|
|
$
|
353
|
|
$
|
271
|
|
$
|
43
|
|
|||||
In the first quarter of 2014, the Company amended the terms of its other postretirement benefit plan impacting the eligibility of employees. The amendment to the plan reduced the Company's benefit obligation by
$308,000
at December 31, 2014 and is reflected within the year ended December 31, 2014 other postretirement benefits plan net actuarial gain.
The following assumptions were used in determining benefit obligations and net period benefit costs:
|
SERP
|
Other Postretirement
Benefits
|
||||||||||||||||
|
|
2016
|
2015
|
2014
|
2016
|
2015
|
2014
|
|||||||||||
|
Weighted-average assumptions as of end of year:
|
|
|
|
|
|
|
|
|
|
|
|
|
|||||
|
Discount rate for benefit obligation
|
4.00
|
%
|
4.00
|
%
|
4.00
|
%
|
4.00
|
%
|
4.50
|
%
|
4.00
|
%
|
|||||
|
Discount rate for net period benefit cost
|
4.00
|
%
|
4.00
|
%
|
4.75
|
%
|
4.50
|
%
|
4.00
|
%
|
5.02
|
%
|
|||||
|
Rate of compensation increase for benefit obligation
|
4.00
|
%
|
4.00
|
%
|
4.00
|
%
|
—
|
|
—
|
|
—
|
|
|||||
|
Rate of compensation increase for net periodic benefit cost
|
4.00
|
%
|
4.00
|
%
|
4.50
|
%
|
—
|
|
—
|
|
—
|
|
|||||
|
Health care cost trend rate assumed for future years
|
—
|
|
—
|
|
—
|
|
7.00
|
%
|
7.00
|
%
|
7.00
|
%
|
|||||
A
1.0%
increase or decrease in the assumed health care cost trend rate would not materially increase or decrease the Company's accumulated postretirement benefit obligation and the related service and interest cost at
December 31, 2016
. The postretirement plan has a built-in cap on annual benefits to participants and, thus, the accumulated postretirement benefit obligation and the assumed health care cost trend are relatively stable each period.
107
In 2017, the expected contribution is
$475,000
for the SERP and
$156,000
for the other postretirement benefits plan. The expected benefit payments for the next ten years are presented in the following table:
|
SERP
|
Other Postretirement Benefits
|
||||
|
2017
|
475
|
|
156
|
|
|
|
2018
|
473
|
|
163
|
|
|
|
2019
|
477
|
|
166
|
|
|
|
2020
|
486
|
|
169
|
|
|
|
2021
|
542
|
|
182
|
|
|
|
2022-2026
|
3,127
|
|
1,043
|
|
|
17. Other Non-Interest Income and Expenses
Detail of other income included in the consolidated statements of income is as follows:
|
For The Year Ended
December 31,
|
|||||||||||
|
|
2016
|
2015
|
2014
|
||||||||
|
Customer loan swap fee income
(1)
|
$
|
2,104
|
|
$
|
1,514
|
|
$
|
480
|
|
||
|
Other income
|
4,830
|
|
2,363
|
|
2,600
|
|
|||||
|
Total
|
$
|
6,934
|
|
$
|
3,877
|
|
$
|
3,080
|
|
||
|
(1)
|
Fee income recognized upon completion of customer loan swaps. Refer to Note 18 for further discussion.
|
Detail of other expenses included in the consolidated statements of income is as follows:
|
For The Year Ended
December 31,
|
|||||||||||
|
|
2016
|
2015
|
2014
|
||||||||
|
Postage, freight, and courier
|
$
|
1,754
|
|
$
|
1,430
|
|
$
|
1,236
|
|
||
|
Donations and marketing
|
1,660
|
|
1,841
|
|
1,587
|
|
|||||
|
Employee-related costs
(1)
|
1,616
|
|
1,437
|
|
1,287
|
|
|||||
|
Other expenses
|
5,657
|
|
4,502
|
|
3,735
|
|
|||||
|
Total
|
$
|
10,687
|
|
$
|
9,210
|
|
$
|
7,845
|
|
||
|
(1)
|
Employee-related costs include hiring, training, education, meeting and business travel costs.
|
18. Commitments, Contingencies and Derivatives
Legal Contingencies
In the normal course of business, the Company and its subsidiaries are subject to pending and threatened legal actions. Although the Company is not able to predict the outcome of such actions, after reviewing pending and threatened actions with counsel, management believes that based on the information currently available the outcome of such actions, individually or in the aggregate, will not have a material adverse effect on the Company’s consolidated financial position as a whole.
Reserves are established for legal claims only when losses associated with the claims are judged to be probable, and the loss can be reasonably estimated. In many lawsuits and arbitrations, it is not possible to determine whether a liability has been incurred or to estimate the ultimate or minimum amount of that liability until the case is close to resolution, in which case a reserve will not be recognized until that time.
As of
December 31, 2016
and
2015
, the Company did
no
t have any material loss contingencies that were provided for and/or disclosure was necessary.
108
Financial Instruments
In the normal course of business, the Company is a party to both on- and off-balance sheet financial instruments involving, to varying degrees, elements of credit risk and interest rate risk in addition to the amounts recognized in the consolidated statements of condition.
The following is a summary of the contractual and notional amounts of the Company’s financial instruments:
|
December 31,
|
|||||||
|
|
2016
|
2015
|
|||||
|
Lending-Related Instruments:
|
|
|
|
|
|||
|
Loan origination commitments and unadvanced lines of credit:
|
|
|
|
|
|||
|
Home equity
|
$
|
454,225
|
|
$
|
464,701
|
|
|
|
Commercial and commercial real estate
|
83,103
|
|
94,791
|
|
|||
|
Residential
|
17,795
|
|
16,256
|
|
|||
|
Letters of credit
|
2,580
|
|
4,468
|
|
|||
|
Other commitments
|
432
|
|
433
|
|
|||
|
Derivative Financial Instruments:
|
|||||||
|
Customer loan swaps
|
532,526
|
|
285,888
|
|
|||
|
FHLBB advance interest rate swaps
|
50,000
|
|
50,000
|
|
|||
|
Junior subordinated debt interest rate swaps
|
43,000
|
|
43,000
|
|
|||
|
Interest rate lock commitments
|
15,249
|
|
20,735
|
|
|||
|
Forward delivery commitments
|
15,125
|
|
—
|
|
|||
Lending-Related Instruments
The contractual amounts of the Company’s lending-related financial instruments do not necessarily represent future cash requirements since certain of these instruments may expire without being funded and others may not be fully drawn upon. These instruments are subject to the Company’s credit approval process, including an evaluation of the customer’s creditworthiness and related collateral requirements. Commitments generally have fixed expiration dates or other termination clauses.
Derivative Financial Instruments
The Company uses derivative financial instruments for risk management purposes (primarily interest rate risk) and not for trading or speculative purposes. The Company controls the credit risk of these instruments through collateral, credit approvals and monitoring procedures. Additionally, as part of Company's normal mortgage origination process, it provides the borrower with the option to lock their interest rate based on current market prices. During the period from commitment date to the loan closing date, the Company is subject to the risk of interest rate change. In an effort to mitigate such risk the Company may enter into forward delivery commitments, typically on a "best-efforts" basis, with certain approved investors. The Company accounts for its interest rate lock commitments on loans within the normal origination process for which it intends to sell as a derivative instrument. Furthermore, the Company records a derivative for its "best-effort" forward delivery commitments upon origination of a loan identified as held for sale. Should the Company enter into a forward delivery commitment on a mandatory delivery arrangement with an investor it accounts for the forward delivery commitment upon execution of the contract.
Derivative instruments are carried at fair value in the Company’s financial statements. The accounting for changes in the fair value of a derivative instrument is dependent upon whether or not it qualifies and has been designated as a hedge for accounting purposes, and further, by the type of hedging relationship.
The Company has designated its interest rate swaps on its junior subordinated debentures and its interest rate swaps on forecasted 30-day FHLBB borrowings as cash flow hedges. The change in the fair value of the Company's cash flow hedges is accounted for within OCI, net of tax. Quarterly, in conjunction with financial reporting, the Company assesses each cash flow hedge for ineffectiveness. To the extent any significant ineffectiveness is identified, this amount is recorded within the consolidated statements of income. Furthermore, the Company will reclassify the gain or loss on the effective portion of the
109
cash flow hedge from OCI into interest within the consolidated statements of income in the period the hedged transaction affects earnings.
The change in fair value of the Company's other derivative instruments, not designated and qualifying as hedges, are accounted for within the consolidated statements of income.
Junior Subordinated Debt Interest Rate Swaps:
The Company, from time to time, will enter into an interest rate swap agreement with a counterparty to manage interest rate risk associated with its variable rate borrowings. The Company has entered into a master netting arrangement with its counterparty and settles payments with the counterparty quarterly on a net basis. The interest rate swap agreements contain provisions that require the Company to post cash collateral with the counterparty for contracts that are in a net liability position based on their fair values and the Company’s credit rating. If the interest rate swaps are in a net asset position based on their fair value, the counterparty is required to post cash collateral to the Company. The collateral posted by the Company was not readily available and has been presented within cash and due from banks on the consolidated statements of condition. At
December 31, 2016
and
2015
, the Company had a notional amount of
$43.0 million
in variable-for-fixed interest rate swap agreements on its junior subordinated debentures and posted
$9.7 million
of cash as collateral at
December 31, 2016
. The details of its interest rate swap agreements are outlined in the table below:
|
December 31,
|
||||||||||||||||||
|
2016
|
2015
|
|||||||||||||||||
|
Notional
Amount
|
Trade
Date
|
Maturity Date
|
Variable Index
Received
|
Fixed Rate
Paid
|
Fair Value
(1)
|
Fair Value
(1)
|
||||||||||||
|
$
|
10,000
|
|
3/18/2009
|
6/30/2021
|
3-Month USD LIBOR
|
5.09%
|
$
|
(806
|
)
|
$
|
(1,038
|
)
|
||||||
|
10,000
|
|
7/8/2009
|
6/30/2029
|
3-Month USD LIBOR
|
5.84%
|
(2,321
|
)
|
(2,537
|
)
|
|||||||||
|
10,000
|
|
5/6/2010
|
6/30/2030
|
3-Month USD LIBOR
|
5.71%
|
(2,290
|
)
|
(2,477
|
)
|
|||||||||
|
5,000
|
|
3/14/2011
|
3/30/2031
|
3-Month USD LIBOR
|
4.35%
|
(1,211
|
)
|
(1,301
|
)
|
|||||||||
|
8,000
|
|
5/4/2011
|
7/7/2031
|
3-Month USD LIBOR
|
4.14%
|
(1,744
|
)
|
(1,876
|
)
|
|||||||||
|
$
|
43,000
|
|
$
|
(8,372
|
)
|
$
|
(9,229
|
)
|
||||||||||
(1) Presented within accrued interest and other liabilities on the consolidated statements of condition.
For the years ended
December 31, 2016
,
2015
or
2014
, the Company did
no
t record any ineffectiveness on these cash flow hedges within the consolidated statements of income.
Net payments to the counterparty for the year ended
December 31, 2016
and
2015
were
$1.5 million
and
$1.7 million
, respectively, and have been classified as cash flows from operating activities in the consolidated statements of cash flows.
FHLBB Advance Interest Rate Swaps:
The Bank has two interest rate swap arrangements with a counterparty on
two
tranches of 30-day FHLBB advances with a total notional amount of
$50.0 million
. Each derivative arrangement commenced on February 25, 2016, with one contract set to expire on February 25, 2018 and the other on February 25, 2019. The Bank entered into these interest rate swaps to mitigate its interest rate exposure on borrowings in a rising interest rate environment. The Bank has designated each arrangement as a cash flow hedge in accordance with GAAP, and, therefore, the change in unrealized gains or losses on the derivative instruments is recorded within AOCI, net of tax. Also, quarterly, in conjunction with financial reporting, the Company assesses each derivative instrument for ineffectiveness. To the extent any significant ineffectiveness is identified this amount would be recorded within the consolidated statements of income. For the year ended December 31, 2016, the Company did
no
t record any ineffectiveness on these cash flow hedges within the consolidated statements of income.
The Bank has entered into a master netting arrangement with its counterparty and settles payments with the counterparty quarterly on a net basis. The Bank's arrangement with the counterparty requires it to post cash collateral for contracts in a net liability position based on their fair values and the Bank's credit rating. If the interest rate swaps are in a net asset position based on their fair value, the counterparty is required to post collateral to the Company. The collateral posted by the Company (or counterparty) is not readily available and is presented within cash and due from banks on the consolidated statements of condition. At December 31, 2016, the Bank posted cash collateral to the counterparty of
$474,000
.
110
The details of the interest rate swap agreements are as follows:
|
December 31,
|
||||||||||||||||||
|
2016
|
2015
|
|||||||||||||||||
|
Notional
Amount |
Trade
Date |
Maturity Date
|
Variable Index
Received |
Fixed Rate
Paid |
Fair Value
(1)
|
Fair Value
(1)
|
||||||||||||
|
$
|
25,000
|
|
2/25/2015
|
2/25/2018
|
1-Month USD LIBOR
|
1.54%
|
$
|
(152
|
)
|
$
|
(230
|
)
|
||||||
|
25,000
|
|
2/25/2015
|
2/25/2019
|
1-Month USD LIBOR
|
1.74%
|
(237
|
)
|
(346
|
)
|
|||||||||
|
$
|
50,000
|
|
$
|
(389
|
)
|
$
|
(576
|
)
|
||||||||||
|
(1)
|
Presented within accrued interest and other liabilities on the consolidated statements of condition.
|
Net payments to the counterparty for the year ended December 31, 2016 were
$490,000
and have been classified as cash flows from operating activities in the consolidated statements of cash flows.
Customer Loan Swaps
The Bank will enter into interest rate swaps with its commercial customers, from time to time, to provide them with a means to lock into a long-term fixed rate, while simultaneously the Bank enters into an arrangement with a counterparty to swap the fixed rate to a variable rate to allow it to effectively manage its interest rate exposure.
The Bank's customer loan level derivative program is not designated as a hedge for accounting purposes. As the interest rate swap agreements have substantially equivalent and offsetting terms, they do not materially change the Bank's interest rate risk or present any material exposure to the Company's consolidated statements of income. The Company records its customer loan swaps at fair value and presents such on a gross basis within other assets and accrued interest and other liabilities on the consolidated statements of condition.
The following table presents the total positions, notional and fair value of the Bank's customer loans swaps with its commercial customers and the corresponding interest rate swap agreements with counterparty for the periods indicated:
|
December 31,
|
||||||||||||||||||||||||
|
2016
|
2015
|
|||||||||||||||||||||||
|
Balance Sheet Location
|
Number of Positions
|
Notional
|
Fair Value
|
Number of Positions
|
Notional
|
Fair Value
|
||||||||||||||||||
|
Receive fixed, pay variable
|
Other assets / (accrued interest and other liabilities)
|
50
|
|
$
|
266,263
|
|
$
|
(1,945
|
)
|
28
|
|
$
|
142,944
|
|
$
|
3,166
|
|
|||||||
|
Pay fixed, received variable
|
Other assets / (accrued interest and other liabilities)
|
50
|
|
266,263
|
|
1,945
|
|
28
|
|
142,944
|
|
(3,166
|
)
|
|||||||||||
|
Total
|
100
|
|
$
|
532,526
|
|
$
|
—
|
|
56
|
|
$
|
285,888
|
|
$
|
—
|
|
||||||||
The Bank seeks to mitigate its customer counterparty credit risk exposure through its loan policy and underwriting process, which includes credit approval limits, monitoring procedures, and obtaining collateral, where appropriate. The Bank seeks to mitigate its institutional counterparty credit risk exposure by limiting the institutions for which it will enter into interest swap arrangements through an approved listing by the Company's Board of Directors. The Company has entered into a master netting arrangement with its counterparty and settles payments with the counterparty quarterly on a net basis. The Bank's arrangement with an institutional counterparty requires it to post cash collateral for contracts in a net liability position based on their fair values and the Bank's credit rating or receive cash collateral for contracts in a net asset position. At
December 31, 2016
, the Company did
no
t have any cash posted as collateral with the counterparty.
111
Interest Rate Locks Commitments:
As part of the origination process of a residential loan, the Company may enter into rate lock agreement with its borrower, which is considered an interest rate lock commitment. If the Company has the intention to sell the loan upon origination, it will account for the interest rate lock commitment as a derivative. Our pipeline of mortgage loans with fixed-rate interest rate lock commitments were as follows for the periods indicated:
|
December 31,
|
||||||||||||||||||
|
2016
|
2015
|
|||||||||||||||||
|
Balance Sheet Location
|
Notional
|
Fair
Value
|
Notional
|
Fair
Value
|
||||||||||||||
|
Fixed-rate mortgage interest rate locks
|
Other assets
|
$
|
12,310
|
|
$
|
202
|
|
$
|
12,669
|
|
$
|
229
|
|
|||||
|
Fixed-rate mortgage interest rate locks
|
Accrued interest and other liabilities
|
2,939
|
|
(15
|
)
|
8,066
|
|
(90
|
)
|
|||||||||
|
Total
|
$
|
15,249
|
|
$
|
187
|
|
$
|
20,735
|
|
$
|
139
|
|
||||||
For the year ended December 31, 2016, 2015 and 2014, the unrealized gains from the change in fair value on the Company's fixed-rate mortgage interest rate locks reported within mortgage banking income, net, on the consolidated statements of income were
$48,000
,
$139,000
, and
$0
, respectively.
Forward Delivery Commitments:
The Company typically enters into a forward delivery commitment with a secondary market investor, which has been approved by the Company within its normal governance process, at the onset of the loan origination process. The Company may enter into these arrangements with the secondary market investors on a "best effort" or "mandatory delivery" basis. The Company's normal practice is to typically enter into these arrangements on a "best effort" basis. The Company enters into these arrangements with the secondary market investors to manage its interest rate exposure. The Company accounts for the forward delivery commitment as a derivative (but does not designate as a hedge) upon origination of a loan for which it intends to sell. The Company's forward delivery commitments on loans held for sale was as follows for the periods indicated:
|
December 31,
|
||||||||||||||||||
|
2016
|
2015
|
|||||||||||||||||
|
Balance Sheet Location
|
Notional
|
Fair
Value
|
Notional
|
Fair
Value
|
||||||||||||||
|
Forward delivery commitments ("best-effort")
|
Other assets
|
$
|
14,250
|
|
$
|
587
|
|
$
|
—
|
|
$
|
—
|
|
|||||
|
Forward delivery commitments ("best-effort")
|
Accrued interest and other liabilities
|
875
|
|
(309
|
)
|
—
|
|
—
|
|
|||||||||
|
Total
|
$
|
15,125
|
|
$
|
278
|
|
$
|
—
|
|
$
|
—
|
|
||||||
For the year ended December 31, 2016, 2015 and 2014, the unrealized gains from the change in fair value on the Company's forward delivery commitments reported within mortgage banking income, net on the consolidated statements of income were
$278,000
,
$0
, and
$0
, respectively.
112
The table below presents the effect of the Company’s derivative financial instruments included in OCI and current earnings for the periods indicated:
|
For The Year Ended
December 31, |
||||||||||||
|
2016
|
2015
|
2014
|
||||||||||
|
Derivatives designated as cash flow hedges
|
||||||||||||
|
Effective portion of unrealized losses recognized within AOCI during the period, net of tax
|
$
|
(637
|
)
|
$
|
(1,533
|
)
|
$
|
(4,515
|
)
|
|||
|
Net reclassification adjustment for effective portion of cash flow hedges included in interest expense, gross
(1)
|
$
|
2,026
|
|
$
|
1,695
|
|
$
|
1,714
|
|
|||
|
(1)
|
Reclassified into the consolidated statements of income within interest on subordinated debentures.
|
The Company expects approximately
$1.6 million
(pre-tax) to be reclassified to interest expense from OCI, related to the Company’s cash flow hedges, in the next twelve months. This reclassification is due to anticipated payments that will be made and/or received on the swaps based upon the forward curve as of
December 31, 2016
.
19. Fair Value
Fair value is the price that would be received to sell an asset or paid to transfer a liability in an orderly transaction between market participants at the measurement date. Fair value is best determined using quoted market prices. However, in many instances, quoted market prices are not available. In such instances, fair values are determined using various valuation techniques. Various assumptions and observable inputs must be relied upon in applying these techniques. GAAP establishes a fair value hierarchy for valuation inputs that gives the highest priority to quoted prices in active markets for identical assets or liabilities and the lowest priority to unobservable inputs.
GAAP permits an entity to choose to measure certain eligible financial instruments and other items at fair value. The Company elected the fair value option for its loans held for sale. Electing the fair value option for loans held for sale enables the Company’s financial position to more clearly align with the economic value of the actively traded asset.
The fair value hierarchy for valuation of an asset or liability is as follows:
|
Level 1:
|
Valuation is based upon unadjusted quoted prices in active markets for identical assets and liabilities that the entity has the ability to access as of the measurement date.
|
|
Level 2:
|
Valuation is determined from quoted prices for similar assets or liabilities in active markets, from quoted prices for identical or similar instruments in markets that are not active or by model-based techniques in which all significant inputs are observable in the market.
|
|
Level 3:
|
Valuation is derived from model-based and other techniques in which at least one significant input is unobservable and which may be based on the Company’s own estimates about the assumptions that market participants would use to value the asset or liability.
|
In general, fair value is based upon quoted market prices, where available. If such quoted market prices are not available, fair value is based upon model-based techniques incorporating various assumptions including interest rates, prepayment speeds and credit losses. Assets and liabilities valued using model-based techniques are classified as either Level 2 or Level 3, depending on the lowest level classification of an input that is considered significant to the overall valuation. A description of the valuation methodologies used for instruments measured at fair value, as well as the general classification of such instruments pursuant to the valuation hierarchy, is set forth below.
113
Financial Instruments Recorded at Fair Value on a Recurring Basis
Loans Held For Sale:
The fair value of loans held for sale is determined using quoted secondary market prices or executed sales agreements and is classified as Level 2.
AFS Securities
: The fair value of debt AFS securities is reported utilizing prices provided by an independent pricing service based on recent trading activity and other observable information including, but not limited to, dealer quotes, market spreads, cash flows, market interest rate curves, market consensus prepayment speeds, credit information, and the bond’s terms and conditions. The fair value of debt securities are classified as Level 2.
The fair value of equity AFS securities is reported utilizing market prices based on recent trading activity. The equity securities are traded on inactive markets and are classified as Level 2.
Derivatives
: The fair value of the Company's interest rate swaps, including its junior subordinated debt interest rate swaps, FHLBB advance interest rate swaps and customer loan swaps, are determined using inputs that are observable in the market place obtained from third parties including yield curves, publicly available volatilities, and floating indexes and, accordingly, are classified as Level 2 inputs. The credit value adjustments associated with derivatives utilize Level 3 inputs, such as estimates of current credit spreads to evaluate the likelihood of default by the Company and its counterparties. As of
December 31, 2016
and
2015
, the Company has assessed the significance of the impact of the credit valuation adjustments on the overall valuation of its derivative positions and has determined that the credit valuation adjustments are not significant to the overall valuation of its derivatives due to collateral postings.
The fair value of the Company's fixed rate interest rate lock commitments are determined using secondary market pricing for loans with similar structures, including term, rate and borrower credit quality, adjusted for the Company's pull-through rate estimate (i.e. estimate of loans within its pipeline that will ultimately complete the origination process and be funded). The Company has classified its fixed rate interest rate lock commitments as Level 2 as the quoted secondary market prices are the more significant input, and while the Company's internal pull-through rate estimate is a Level 3 estimate it is not as critical to the ultimate valuation.
The fair value of the Company's forward delivery commitments are determined using secondary market pricing for loans with similar structures, including term, rate and borrower credit quality, and the locked and agreed to price with the secondary market investor. The Company has classified its fixed rate interest rate lock commitments as Level 2.
114
The following table summarizes financial assets and financial liabilities measured at fair value on a recurring basis as of
December 31, 2016
and
2015
, segregated by the level of the valuation inputs within the fair value hierarchy utilized to measure fair value:
|
Fair Value
|
Readily Available Market Prices
(Level 1)
|
Observable Market Data
(Level 2)
|
Company Determined Fair Value
(Level 3)
|
||||||||||||
|
December 31, 2016
|
|
|
|
|
|
|
|||||||||
|
Financial assets:
|
|
|
|
|
|
|
|||||||||
|
Loans held for sale
|
$
|
14,836
|
|
$
|
—
|
|
$
|
14,836
|
|
$
|
—
|
|
|||
|
AFS securities:
|
|
|
|
|
|||||||||||
|
Obligations of states and political subdivisions
|
9,001
|
|
—
|
|
9,001
|
|
—
|
|
|||||||
|
Mortgage-backed securities issued or guaranteed by U.S. government-sponsored enterprises
|
480,622
|
|
—
|
|
480,622
|
|
—
|
|
|||||||
|
Collateralized mortgage obligations issued or guaranteed by U.S. government-sponsored enterprises
|
283,890
|
|
—
|
|
283,890
|
|
—
|
|
|||||||
|
Subordinated corporate bonds
|
5,613
|
|
—
|
|
5,613
|
|
—
|
|
|||||||
|
Equity securities
|
741
|
|
—
|
|
741
|
|
—
|
|
|||||||
|
Customer loan swaps
|
1,945
|
|
—
|
|
1,945
|
|
—
|
|
|||||||
|
Fixed-rate interest rate lock commitments
|
202
|
|
—
|
|
202
|
|
—
|
|
|||||||
|
Forward delivery commitments
|
587
|
|
—
|
|
587
|
|
—
|
|
|||||||
|
Financial liabilities:
|
|
|
|
|
|||||||||||
|
Junior subordinated debt interest rate swaps
|
8,372
|
|
—
|
|
8,372
|
|
—
|
|
|||||||
|
FHLBB advance interest rate swaps
|
389
|
|
—
|
|
389
|
|
—
|
|
|||||||
|
Customer loan swaps
|
1,945
|
|
—
|
|
1,945
|
|
—
|
|
|||||||
|
Fixed-rate interest rate lock commitments
|
15
|
|
—
|
|
15
|
|
—
|
|
|||||||
|
Forward delivery commitments
|
309
|
|
—
|
|
309
|
|
—
|
|
|||||||
|
December 31, 2015
|
|
|
|
|
|
|
|||||||||
|
Financial assets:
|
|
|
|
|
|
|
|||||||||
|
Loans held for sale
|
$
|
10,958
|
|
$
|
—
|
|
$
|
10,958
|
|
$
|
—
|
|
|||
|
AFS securities:
|
|
|
|
|
|
|
|
|
|||||||
|
Obligations of U.S. government-sponsored enterprises
|
5,040
|
|
—
|
|
5,040
|
|
—
|
|
|||||||
|
Obligations of states and political subdivisions
|
17,694
|
|
—
|
|
17,694
|
|
—
|
|
|||||||
|
Mortgage-backed securities issued or guaranteed by U.S. government-sponsored enterprises
|
419,046
|
|
—
|
|
419,046
|
|
—
|
|
|||||||
|
Collateralized mortgage obligations issued or guaranteed by U.S. government-sponsored enterprises
|
306,857
|
|
—
|
|
306,857
|
|
—
|
|
|||||||
|
Subordinated corporate bonds
|
996
|
|
—
|
|
996
|
|
—
|
|
|||||||
|
Equity securities
|
705
|
|
—
|
|
705
|
|
—
|
|
|||||||
|
Customer loan swaps
|
3,166
|
|
—
|
|
3,166
|
|
—
|
|
|||||||
|
Fixed-rate interest rate lock commitments
|
229
|
|
—
|
|
229
|
|
—
|
|
|||||||
|
Financial liabilities:
|
|
|
|
|
|
|
|
|
|||||||
|
Junior subordinated debt interest rate swaps
|
9,229
|
|
—
|
|
9,229
|
|
—
|
|
|||||||
|
FHLBB advance interest rate swaps
|
576
|
|
—
|
|
576
|
|
—
|
|
|||||||
|
Customer loan swaps
|
3,166
|
|
—
|
|
3,166
|
|
—
|
|
|||||||
|
Fixed-rate interest rate lock commitments
|
90
|
|
—
|
|
90
|
|
—
|
|
|||||||
115
The Company did not have any transfers between Level 1 and Level 2 of the fair value hierarchy for the year ended
December 31, 2016
. The Company’s policy for determining transfers between levels occurs at the end of the reporting period when circumstances in the underlying valuation criteria change and result in transfer between levels.
Financial Instruments Recorded at Fair Value on a Nonrecurring Basis
The Company may be required, from time to time, to measure certain financial assets and financial liabilities at fair value on a nonrecurring basis in accordance with GAAP. These include assets that are measured at the lower of cost or fair value that were recognized at fair value below cost at the end of the period.
Collateral-Dependent Impaired Loans
: Loans for which it is probable that payment of interest and principal will not be made in accordance with the contractual terms of the loan agreement are considered impaired. The Company's policy is to individually evaluate for impairment loans with a principal balance greater than
$250,000
or more and are classified as substandard or doubtful and are on non-accrual status. Once the population of loans is identified for individual impairment assessment, the Company measures these loans for impairment by comparing NRV, which is the fair value of the collateral, less estimated costs to sell, to the carrying value of the loan. If the NRV of the loan is less than the carrying value of the loan, then a loss is recognized as part of the ALL to adjust the loan's carrying value to NRV. Accordingly, certain collateral-dependent impaired loans are subject to measurement at fair value on a non-recurring basis. Management has estimated the fair values of these assets using Level 2 inputs, such as the fair value of collateral based on independent third-party market approach appraisals for collateral-dependent loans, and Level 3 inputs where circumstances warrant an adjustment to the appraised value based on the age of the appraisal and/or comparable sales, condition of the collateral, and market conditions.
MSRs
: The Company accounts for mortgage servicing assets at cost, subject to impairment testing. When the carrying value of a tranche exceeds fair value, a valuation allowance is established to reduce the carrying cost to fair value. Fair value is based on a valuation model that calculates the present value of estimated net servicing income. The Company obtains a third-party valuation based upon loan level data including note rate, type and term of the underlying loans. The model utilizes a variety of observable inputs for its assumptions, the most significant of which are loan prepayment assumptions and the discount rate used to discount future cash flows. Other assumptions include delinquency rates, servicing cost inflation and annual unit loan cost. MSRs are classified within Level 2 of the fair value hierarchy.
Non-Financial Assets and Non-Financial Liabilities Recorded at Fair Value on a Nonrecurring Basis
The Company has
no
non-financial assets or non-financial liabilities measured at fair value on a recurring basis. Non-financial assets measured at fair value on a non-recurring basis consist of OREO and goodwill.
OREO
:
OREO properties acquired through foreclosure or deed in lieu of foreclosure are recorded at NRV, which is the fair value of the real estate, less estimated costs to sell. Any write-down of the recorded investment in the related loan is charged to the ALL upon transfer to OREO. Upon acquisition of a property, a current appraisal is used or an internal valuation is prepared to substantiate fair value of the property. After foreclosure, management periodically, but at least annually, obtains updated valuations of the OREO properties and, if additional impairments are deemed necessary, the subsequent write-downs for declines in value are recorded through a valuation allowance and a provision for losses charged to other non-interest expense within the consolidated statements of income. As management considers appropriate, adjustments are made to the appraisal obtained for the OREO property to account for recent sales activity of comparable properties, changes in the condition of the property, and changes in market conditions. These adjustments are not observable in an active market and are classified as Level 3.
Goodwill and Other Intangible Assets
: Goodwill represents the excess cost of an acquisition over the fair value of the net assets acquired. The fair value of goodwill is estimated by utilizing several standard valuation techniques, including discounted cash flow analyses, bank merger multiples, and/or an estimation of the impact of business conditions and investor activities on the long-term value of the goodwill. Should an impairment of either reporting unit's goodwill occur, the associated goodwill is written-down to fair value and the impairment charge is recorded within non-interest expense in the consolidated statements of income. The Company conducts an annual impairment test of goodwill in the fourth quarter each year, or more frequently as necessary. There were no indications or triggering events for the year ended
December 31, 2016
or
2015
for which management believed that it was more likely than not that goodwill is impaired.
The Company's core deposit intangible assets represent the estimated value of acquired customer relationships and are amortized on a straight-line basis over the estimated life of those relationships. Core deposit intangibles are reviewed for impairment whenever events or changes in circumstances indicate that the carrying amount may not be recoverable. If necessary, management will test the core deposit intangibles for impairment by comparing its carrying value to the expected
116
undiscounted cash flows of the assets. If the undiscounted cash flows of the intangible assets exceed its carrying value then the intangible assets are deemed to be fully recoverable and not impaired. However, if the undiscounted cash flows of the intangible assets are less than its carrying value than an impairment charge is recorded to mark the carrying value of the intangible assets to fair value. There were no indications or triggering events for the year ended
December 31, 2016
or
2015
for which management believes that the carrying amount may not be recoverable.
The table below highlights financial and non-financial assets measured and recorded at fair value on a non-recurring basis as of
December 31, 2016
and
2015
:
|
Fair Value
|
Readily Available Market Prices
(Level 1)
|
Observable Market Data
(Level 2)
|
Company Determined
Fair Value
(Level 3)
|
||||||||||||
|
December 31, 2016
|
|
|
|
|
|
|
|||||||||
|
Financial assets:
|
|
|
|
|
|
|
|||||||||
|
Collateral-dependent impaired loans
|
$
|
500
|
|
$
|
—
|
|
$
|
—
|
|
$
|
500
|
|
|||
|
MSRs
(1)
|
1,090
|
|
—
|
|
1,090
|
|
—
|
|
|||||||
|
Non-financial assets:
|
|||||||||||||||
|
OREO
|
922
|
|
—
|
|
—
|
|
922
|
|
|||||||
|
December 31, 2015
|
|
|
|
|
|
|
|||||||||
|
Financial assets:
|
|
|
|
|
|
|
|||||||||
|
Collateral-dependent impaired loans
|
$
|
1,971
|
|
$
|
—
|
|
$
|
—
|
|
$
|
1,971
|
|
|||
|
MSRs
(1)
|
440
|
|
—
|
|
440
|
|
—
|
|
|||||||
|
Non-financial assets:
|
|||||||||||||||
|
OREO
|
1,304
|
|
—
|
|
—
|
|
1,304
|
|
|||||||
|
(1)
|
Represents MSRs deemed to be impaired and a valuation allowance was established to carry at fair value at
December 31, 2016
and
2015
.
|
117
The following table presents the valuation methodology and unobservable inputs for Level 3 assets measured at fair value on a non-recurring basis at
December 31, 2016
and
2015
:
|
Fair Value
|
Valuation Methodology
|
Unobservable input
|
Discount Range (Weighted-Average)
|
|||||||
|
December 31, 2016
|
||||||||||
|
Collateral-dependent impaired loans:
|
|
|
|
|
|
|
||||
|
Partially charged-off
|
$
|
166
|
|
Market approach appraisal of collateral
|
Management adjustment
of appraisal
|
0%
|
(0%)
|
|||
|
Estimated selling costs
|
0 - 10%
|
(5%)
|
||||||||
|
Specifically reserved
|
334
|
|
Market approach appraisal of collateral
|
Management adjustment
of appraisal
|
0 - 50%
|
(13%)
|
||||
|
Estimated selling costs
|
10%
|
(10%)
|
||||||||
|
OREO
|
922
|
|
Market approach appraisal of collateral
|
Management adjustment
of appraisal
|
0 - 73%
|
(7%)
|
||||
|
Estimated selling costs
|
10%
|
(10%)
|
||||||||
|
December 31, 2015
|
||||||||||
|
Collateral-dependent impaired loans:
|
|
|
|
|
|
|
||||
|
Partially charged-off
|
$
|
399
|
|
Market approach appraisal of collateral
|
Management adjustment
of appraisal
|
0%
|
(0%)
|
|||
|
|
|
Estimated selling costs
|
0 - 10%
|
(7%)
|
||||||
|
Specifically reserved
|
1,572
|
|
Market approach appraisal of collateral
|
Management adjustment
of appraisal
|
0 - 57%
|
(45%)
|
||||
|
Estimated selling costs
|
10%
|
(10%)
|
||||||||
|
OREO
|
1,304
|
|
Market approach appraisal of collateral
|
Management adjustment
of appraisal
|
0 - 43%
|
(18%)
|
||||
|
Estimated selling costs
|
10%
|
(10%)
|
||||||||
GAAP requires disclosure of the fair value of financial assets and financial liabilities, including those financial assets and financial liabilities that are not measured and reported at fair value on a recurring basis or non-recurring basis. The methodologies for estimating the fair value of financial assets and financial liabilities that are measured at fair value on a recurring or non-recurring basis are discussed above. The following methods and assumptions were used by the Company in estimating the fair values of its other financial instruments.
Cash and Due from Banks
: The carrying amounts reported in the consolidated statements of condition approximate fair value that have original maturities of ninety days or less.
HTM securities
: The fair value is estimated utilizing prices provided by an independent pricing service based on recent trading activity and other observable information including, but not limited to, dealer quotes, market spreads, cash flows, market interest rate curves, market consensus prepayment speeds, credit information, and the bond’s terms and conditions. The fair value is classified as Level 2.
Loans
: For variable rate loans that reprice frequently and have no significant change in credit risk, fair values are based on carrying values. The fair value of other loans is estimated by discounting the future cash flows using the current rates at which similar loans would be made to borrowers with similar credit ratings and for the same remaining maturities.
Interest Receivable and Payable
: The carrying amounts reported in the consolidated statements of condition approximate fair value.
Deposits
: The fair value of demand, non-interest checking, savings and money market deposits is determined as the amount payable on demand at the reporting date. The fair value of time deposits is estimated by discounting the estimated future cash flows using market rates offered for deposits of similar remaining maturities.
118
Borrowings
: The carrying amounts of short-term borrowings from the FHLB, securities sold under repurchase agreements, notes payable and other short-term borrowings approximate fair value. The fair values of long-term borrowings and commercial repurchase agreements are based on the discounted cash flows using current rates for advances of similar remaining maturities.
Subordinated Debentures
: The fair values of are based on quoted prices from similar instruments in inactive markets.
The following table presents the carrying amounts and estimated fair value for financial instrument assets and liabilities at
December 31, 2016
:
|
|
Carrying Amount
|
Fair Value
|
Readily Available Market Prices
(Level 1)
|
Observable Market Prices
(Level 2)
|
Company Determined Market Prices
(Level 3)
|
||||||||||||||
|
Financial assets:
|
|
|
|
|
|
|
|
|
|||||||||||
|
Cash and due from banks
|
$
|
87,707
|
|
$
|
87,707
|
|
$
|
87,707
|
|
$
|
—
|
|
$
|
—
|
|
||||
|
AFS securities
|
779,867
|
|
779,867
|
|
—
|
|
779,867
|
|
—
|
|
|||||||||
|
HTM securities
|
94,609
|
|
94,596
|
|
—
|
|
94,596
|
|
—
|
|
|||||||||
|
Loans held for sale
|
14,836
|
|
14,836
|
|
—
|
|
14,836
|
|
—
|
|
|||||||||
|
Residential real estate loans
(1)
|
798,334
|
|
800,122
|
|
—
|
|
—
|
|
800,122
|
|
|||||||||
|
Commercial real estate loans
(1)
|
1,038,626
|
|
1,006,249
|
|
—
|
|
—
|
|
1,006,249
|
|
|||||||||
|
Commercial loans
(1)(2)
|
389,624
|
|
391,493
|
|
—
|
|
—
|
|
391,493
|
|
|||||||||
|
Home equity loans
(1)
|
327,713
|
|
327,292
|
|
—
|
|
—
|
|
327,292
|
|
|||||||||
|
Consumer loans
(1)
|
17,151
|
|
16,845
|
|
—
|
|
—
|
|
16,845
|
|
|||||||||
|
MSRs
(3)
|
1,210
|
|
1,701
|
|
—
|
|
1,701
|
|
—
|
|
|||||||||
|
Interest receivable
|
8,654
|
|
8,654
|
|
—
|
|
8,654
|
|
—
|
|
|||||||||
|
Customer loan swaps
|
1,945
|
|
1,945
|
|
—
|
|
1,945
|
|
—
|
|
|||||||||
|
Fixed-rate interest rate lock commitments
|
202
|
|
202
|
|
—
|
|
202
|
|
—
|
|
|||||||||
|
Forward delivery commitments
|
587
|
|
587
|
|
—
|
|
587
|
|
—
|
|
|||||||||
|
Financial liabilities:
|
|
|
|
|
|
|
|
|
|||||||||||
|
Deposits
|
$
|
2,828,529
|
|
$
|
2,826,484
|
|
$
|
—
|
|
$
|
2,826,484
|
|
$
|
—
|
|
||||
|
Short-term borrowings
|
530,129
|
|
530,435
|
|
—
|
|
530,435
|
|
—
|
|
|||||||||
|
Long-term borrowings
|
10,791
|
|
10,836
|
|
—
|
|
10,836
|
|
—
|
|
|||||||||
|
Subordinated debentures
|
58,755
|
|
41,660
|
|
—
|
|
41,660
|
|
—
|
|
|||||||||
|
Interest payable
|
534
|
|
534
|
|
—
|
|
534
|
|
—
|
|
|||||||||
|
Junior subordinated debt interest rate swaps
|
8,372
|
|
8,372
|
|
—
|
|
8,372
|
|
—
|
|
|||||||||
|
Forward-starting interest rate swaps
|
389
|
|
389
|
|
—
|
|
389
|
|
—
|
|
|||||||||
|
Customer loan swaps
|
1,945
|
|
1,945
|
|
—
|
|
1,945
|
|
—
|
|
|||||||||
|
Fixed-rate interest rate lock commitments
|
15
|
|
15
|
|
—
|
|
15
|
|
—
|
|
|||||||||
|
Forward delivery commitments
|
309
|
|
309
|
|
—
|
|
309
|
|
—
|
|
|||||||||
|
(1)
|
The presented carrying amount is net of the allocated ALL.
|
|
(2)
|
Includes the HPFC loan portfolio.
|
|
(3)
|
Reported fair value represents all MSRs currently being serviced by the Company at
December 31, 2016
.
|
119
The following table presents the carrying amounts and estimated fair value for financial instrument assets and liabilities at December 31,
2015
:
|
|
Carrying Amount
|
Fair Value
|
Readily Available Market Prices
(Level 1)
|
Observable Market Prices
(Level 2)
|
Company Determined Market Prices
(Level 3)
|
||||||||||||||
|
Financial assets:
|
|
|
|
|
|
|
|
|
|||||||||||
|
Cash and due from banks
|
$
|
79,488
|
|
$
|
79,488
|
|
$
|
79,488
|
|
$
|
—
|
|
$
|
—
|
|
||||
|
AFS securities
|
750,338
|
|
750,338
|
|
—
|
|
750,338
|
|
—
|
|
|||||||||
|
HTM securities
|
84,144
|
|
85,647
|
|
—
|
|
85,647
|
|
—
|
|
|||||||||
|
Loans held for sale
|
10,958
|
|
10,958
|
|
—
|
|
10,958
|
|
—
|
|
|||||||||
|
Residential real estate loans
(1)
|
808,180
|
|
820,774
|
|
—
|
|
—
|
|
820,774
|
|
|||||||||
|
Commercial real estate loans
(1)
|
922,257
|
|
911,316
|
|
—
|
|
—
|
|
911,316
|
|
|||||||||
|
Commercial loans
(1)(2)
|
371,684
|
|
371,854
|
|
—
|
|
—
|
|
371,854
|
|
|||||||||
|
Home equity loans
(1)
|
349,215
|
|
348,963
|
|
—
|
|
—
|
|
348,963
|
|
|||||||||
|
Consumer loans
(1)
|
17,704
|
|
18,163
|
|
—
|
|
—
|
|
18,163
|
|
|||||||||
|
MSRs
(3)
|
2,161
|
|
2,947
|
|
—
|
|
2,947
|
|
—
|
|
|||||||||
|
Interest receivable
|
7,985
|
|
7,985
|
|
—
|
|
7,985
|
|
—
|
|
|||||||||
|
Customer loan swaps
|
3,166
|
|
3,166
|
|
—
|
|
3,166
|
|
—
|
|
|||||||||
|
Fixed-rate interest rate lock commitments
|
229
|
|
229
|
|
—
|
|
229
|
|
—
|
|
|||||||||
|
Financial liabilities:
|
|
|
|
|
|
|
|
|
|
||||||||||
|
Deposits
|
$
|
2,726,379
|
|
$
|
2,726,300
|
|
$
|
—
|
|
$
|
2,726,300
|
|
$
|
—
|
|
||||
|
Short-term borrowings
|
477,852
|
|
479,403
|
|
—
|
|
479,403
|
|
—
|
|
|||||||||
|
Long-term borrowings
|
35,911
|
|
36,307
|
|
—
|
|
36,307
|
|
—
|
|
|||||||||
|
Subordinated debentures
|
58,599
|
|
42,950
|
|
—
|
|
42,950
|
|
—
|
|
|||||||||
|
Interest payable
|
641
|
|
641
|
|
—
|
|
641
|
|
—
|
|
|||||||||
|
Junior subordinated debt interest rate swaps
|
9,229
|
|
9,229
|
|
—
|
|
9,229
|
|
—
|
|
|||||||||
|
Forward-starting interest rate swaps
|
576
|
|
576
|
|
—
|
|
576
|
|
—
|
|
|||||||||
|
Customer loan swaps
|
3,166
|
|
3,166
|
|
—
|
|
3,166
|
|
—
|
|
|||||||||
|
Fixed-rate interest rate lock commitments
|
90
|
|
90
|
|
—
|
|
90
|
|
—
|
|
|||||||||
|
(1)
|
The presented carrying amount is net of the allocated ALL.
|
|
(2)
|
Includes the HPFC loan portfolio.
|
|
(3)
|
Reported fair value represents all MSRs currently being serviced by the Company at December 31,
2015
.
|
20. Regulatory Capital Requirements
The Company and Bank are subject to various regulatory capital requirements administered by the FRB and the OCC. Failure to meet minimum capital requirements can result in mandatory and possible additional discretionary actions by regulators that, if undertaken, could have a direct material effect on the Company’s consolidated financial statements.
The Company and the Bank are required to maintain certain levels of capital based on risk-adjusted assets. These capital requirements represent quantitative measures of their assets, liabilities and certain off-balance sheet items as calculated under regulatory accounting practices. The Company and the Bank's capital classification is also subject to qualitative judgments by our regulators about components, risk weightings and other factors. The quantitative measures established to ensure capital adequacy require us to maintain minimum amounts and ratios of total, Tier I capital, and common equity Tier I to risk-weighted assets, and of Tier I capital to average assets, or leverage ratio. These guidelines apply to the Company on a consolidated basis.
120
Under the current guidelines, banking organizations must have a minimum total risk-based capital ratio of
8.0%
, a minimum Tier I risk-based capital ratio of
6.0%
, a minimum common equity Tier I risk-based capital ratio of
4.5%
, and a minimum leverage ratio of
4.0%
in order to be "adequately capitalized." In addition to these requirements, banking organizations must maintain a
2.5%
capital conservation buffer consisting of common Tier I equity, subject to a transition schedule with a full phase-in by 2019. Effective January 1, 2016, the Company and the Bank were required to establish a capital conservation buffer of
0.625%
, increasing the minimum required total risk-based capital, Tier I risk-based and common equity Tier I capital to risk-weighted assets they must maintain to avoid limits on capital distributions and certain bonus payments to executive officers and similar employees.
The Company and Bank's risk-based capital ratios exceeded regulatory guidelines at
December 31, 2016
and
2015
, and, specifically, the Bank was "well capitalized" under prompt correct action provisions for each period. There were no conditions or events that occurred subsequent to December 31, 2016 that would change the Company or Bank's regulatory capital categorization. The following table presents the Company and Bank's regulatory capital ratios at the periods indicated:
|
December 31,
2016 |
Minimum Regulatory Capital Required for Capital Adequacy plus Capital Conservation Buffer
|
Minimum Regulatory Provision To Be "Well Capitalized" Under Prompt Corrective Action Provisions
|
December 31,
2015 |
Minimum Regulatory Capital Required For Capital Adequacy Purposes
|
Minimum Regulatory Provision To Be "Well Capitalized" Under Prompt Corrective Action Provisions
|
|||||||||||||||||||||
|
Amount
|
Ratio
|
Amount
|
Ratio
|
|||||||||||||||||||||||
|
Camden National Corporation:
|
||||||||||||||||||||||||||
|
Total risk-based capital ratio
|
$
|
368,856
|
|
|
14.04
|
%
|
|
8.63
|
%
|
|
N/A
|
|
$
|
335,740
|
|
|
12.98
|
%
|
|
8.00
|
%
|
|
N/A
|
|
||
|
Tier I risk-based capital ratio
|
330,729
|
|
|
12.59
|
%
|
|
6.63
|
%
|
|
N/A
|
|
299,552
|
|
|
11.58
|
%
|
|
6.00
|
%
|
|
N/A
|
|
||||
|
Common equity Tier I risk-based capital ratio
|
296,120
|
|
|
11.27
|
%
|
|
5.13
|
%
|
|
N/A
|
|
269,350
|
|
|
10.42
|
%
|
|
4.50
|
%
|
|
N/A
|
|
||||
|
Tier I leverage capital ratio
|
330,729
|
|
8.83
|
%
|
4.00
|
%
|
N/A
|
|
299,552
|
|
8.74
|
%
|
4.00
|
%
|
N/A
|
|
||||||||||
|
Camden National Bank:
|
|
|
|
|
|
|
||||||||||||||||||||
|
Total risk-based capital ratio
|
$
|
340,908
|
|
|
12.92
|
%
|
|
8.63
|
%
|
|
10.00
|
%
|
$
|
304,847
|
|
|
11.75
|
%
|
|
8.00
|
%
|
|
10.00
|
%
|
||
|
Tier I risk-based capital ratio
|
317,782
|
|
|
12.05
|
%
|
|
6.63
|
%
|
|
8.00
|
%
|
283,659
|
|
|
10.93
|
%
|
|
6.00
|
%
|
|
8.00
|
%
|
||||
|
Common equity Tier I risk-based capital ratio
|
317,782
|
|
12.05
|
%
|
5.13
|
%
|
6.50
|
%
|
283,659
|
|
10.93
|
%
|
4.50
|
%
|
6.50
|
%
|
||||||||||
|
Tier I leverage capital ratio
|
317,782
|
|
8.54
|
%
|
4.00
|
%
|
5.00
|
%
|
283,659
|
|
8.33
|
%
|
4.00
|
%
|
5.00
|
%
|
||||||||||
On October 8, 2015, the Company issued
$15.0 million
of
10
year subordinated debentures bearing interest at an annual rate of
5.50%
. In addition,
$43.0 million
of junior subordinated debentures were issued in connection with the issuance of trust preferred securities in 2006 and 2008. Although the subordinated debentures and the junior subordinated debentures are recorded as liabilities on the Company's consolidated statements of condition, the Company is permitted, in accordance with regulatory guidelines, to include, subject to certain limits, each within its calculation of risk-based capital. At December 31, 2016 and 2015,
$15.0 million
of subordinated debentures were included as Tier II capital and were included in the calculation of the Company's total risk-based capital, and, at December 31, 2016 and December 31, 2015,
$43.0 million
of the junior subordinated debentures were included in Tier I and total risk-based capital for the Company.
The Company and Bank's regulatory capital and risk-weighted assets fluctuate due to normal business, including profits and losses generated by the Company and Bank as well as changes to their asset mix. Of particular significance are changes within the Company and Bank's loan portfolio mix due to the difference in regulatory risk-weighting differences between retail and commercial loans. Furthermore, the Company and Bank's regulatory capital and risk-weighted assets are subject to change due to changes in GAAP and regulatory capital standards. The Company and Bank proactively monitor their regulatory capital and risk-weighted assets, and the impact of changes to their asset mix, and impact of proposed and pending changes as a result of new and/or amended GAAP standards and regulatory changes.
121
21. Parent Company Financial Statements
Following are the condensed statements of condition, income and cash flows for the Company's parent company:
STATEMENTS OF CONDITION
|
December 31,
|
|||||||
|
|
2016
|
2015
|
|||||
|
ASSETS
|
|
|
|
|
|||
|
Cash
|
$
|
29,905
|
|
$
|
26,581
|
|
|
|
Investment in subsidiaries:
|
|
|
|||||
|
Bank
|
429,100
|
|
394,404
|
|
|||
|
Acadia Trust
(1)
|
—
|
|
10,232
|
|
|||
|
Receivable from subsidiaries
|
107
|
|
1,926
|
|
|||
|
Other assets
|
12,420
|
|
13,939
|
|
|||
|
Total assets
|
$
|
471,532
|
|
$
|
447,082
|
|
|
|
LIABILITIES AND SHAREHOLDERS’ EQUITY
|
|
|
|
|
|||
|
Subordinated debentures
|
$
|
58,755
|
|
$
|
58,590
|
|
|
|
Due to subsidiaries
|
37
|
|
1,216
|
|
|||
|
Other liabilities
|
21,193
|
|
24,086
|
|
|||
|
Shareholders’ equity
|
391,547
|
|
363,190
|
|
|||
|
Total liabilities and shareholders’ equity
|
$
|
471,532
|
|
$
|
447,082
|
|
|
|
(1)
|
Effective at the close of business November 30, 2016, Acadia Trust merged into Camden National Bank.
|
STATEMENTS OF INCOME
|
For The Year Ended
December 31,
|
|||||||||||
|
|
2016
|
2015
|
2014
|
||||||||
|
Operating Income
|
|
|
|
|
|
|
|||||
|
Dividend income from subsidiaries
|
$
|
16,000
|
|
$
|
39,200
|
|
$
|
12,800
|
|
||
|
Other income (loss)
|
239
|
|
(18
|
)
|
104
|
|
|||||
|
Total operating income
|
16,239
|
|
39,182
|
|
12,904
|
|
|||||
|
Operating Expenses
|
|
|
|
|
|
|
|||||
|
Interest on borrowings
|
3,415
|
|
2,734
|
|
2,532
|
|
|||||
|
Fees to Bank
|
160
|
|
160
|
|
160
|
|
|||||
|
Other operating expenses
|
748
|
|
469
|
|
453
|
|
|||||
|
Total operating expenses
|
4,323
|
|
3,363
|
|
3,145
|
|
|||||
|
Income before equity in undistributed earnings of subsidiaries and income taxes
|
11,916
|
|
35,819
|
|
9,759
|
|
|||||
|
Equity in undistributed income (losses) of subsidiaries
|
26,773
|
|
(15,999
|
)
|
13,799
|
|
|||||
|
Income before income taxes
|
38,689
|
|
19,820
|
|
23,558
|
|
|||||
|
Income tax benefit
|
1,378
|
|
1,132
|
|
1,012
|
|
|||||
|
Net Income
|
$
|
40,067
|
|
$
|
20,952
|
|
$
|
24,570
|
|
||
122
STATEMENTS OF CASH FLOWS
|
For The Year Ended
December 31,
|
|||||||||||
|
|
2016
|
2015
|
2014
|
||||||||
|
Operating Activities
|
|
|
|
|
|
|
|||||
|
Net income
|
$
|
40,067
|
|
$
|
20,952
|
|
$
|
24,570
|
|
||
|
Adjustments to reconcile net income to net cash provided by operating activities:
|
|
|
|
|
|||||||
|
Equity in undistributed (income) losses of subsidiaries
|
(26,651
|
)
|
4,573
|
|
(13,799
|
)
|
|||||
|
Gain on sale of investment securities
|
(4
|
)
|
—
|
|
—
|
|
|||||
|
(Increase) decrease in receivable from subsidiaries
|
1,819
|
|
(1,901
|
)
|
2,037
|
|
|||||
|
(Increase) decrease in other assets
|
1,213
|
|
(2,175
|
)
|
165
|
|
|||||
|
Increase (decrease) in due to subsidiaries
|
(1,179
|
)
|
1,216
|
|
—
|
|
|||||
|
Increase (decrease) in other liabilities
|
(2,519
|
)
|
320
|
|
(2,106
|
)
|
|||||
|
Net cash provided by operating activities
|
12,746
|
|
22,985
|
|
10,867
|
|
|||||
|
Investing Activities
|
|
|
|
|
|
|
|||||
|
Acquisition of SBM, net of cash acquired
|
—
|
|
(25,319
|
)
|
—
|
|
|||||
|
Proceeds from sale of investment securities
|
80
|
|
—
|
|
—
|
|
|||||
|
Proceeds from sale of assets
|
—
|
|
—
|
|
5,237
|
|
|||||
|
Net cash provided by (used in) investing activities
|
80
|
|
(25,319
|
)
|
5,237
|
|
|||||
|
Financing Activities
|
|
|
|
|
|
|
|||||
|
Issuance of subordinated debt, net of issuance costs
|
—
|
|
14,464
|
|
—
|
|
|||||
|
Exercise of stock options and issuance of restricted stock, net of repurchase for tax withholdings and tax benefit
|
894
|
|
753
|
|
328
|
|
|||||
|
Capital contribution from subsidiaries
|
1,997
|
|
836
|
|
599
|
|
|||||
|
Equity issuance costs
|
—
|
|
(612
|
)
|
—
|
|
|||||
|
Common stock repurchase
|
—
|
|
—
|
|
(7,475
|
)
|
|||||
|
Cash dividends paid on common stock and cash in-lieu paid for fractional shares due to stock split
|
(12,393
|
)
|
(9,785
|
)
|
(8,085
|
)
|
|||||
|
Net cash provided by (used in) financing activities
|
(9,502
|
)
|
5,656
|
|
(14,633
|
)
|
|||||
|
Net increase in cash
|
3,324
|
|
3,322
|
|
1,471
|
|
|||||
|
Cash at beginning of year
|
26,581
|
|
23,259
|
|
21,788
|
|
|||||
|
Cash at end of year
|
$
|
29,905
|
|
$
|
26,581
|
|
$
|
23,259
|
|
||
123
22. Quarterly Results of Operations (Unaudited)
The following table presents a summary of the quarterly results of operations for the year ended:
|
December 31,
|
||||||||||||||||||||||||||||||||
|
2016
|
2015
|
|||||||||||||||||||||||||||||||
|
|
First
Quarter
(1)
|
Second
Quarter
|
Third
Quarter
|
Fourth
Quarter
|
First
Quarter
|
Second
Quarter
|
Third
Quarter
|
Fourth
Quarter
(2)
|
||||||||||||||||||||||||
|
Interest income
|
$
|
31,981
|
|
$
|
32,775
|
|
$
|
32,594
|
|
$
|
32,276
|
|
$
|
22,448
|
|
$
|
23,657
|
|
$
|
23,056
|
|
$
|
29,983
|
|
||||||||
|
Interest expense
|
4,029
|
|
4,271
|
|
4,222
|
|
4,032
|
|
3,014
|
|
3,022
|
|
3,044
|
|
3,612
|
|
||||||||||||||||
|
Net interest income
|
27,952
|
|
28,504
|
|
28,372
|
|
28,244
|
|
19,434
|
|
20,635
|
|
20,012
|
|
26,371
|
|
||||||||||||||||
|
Provision for credit losses
|
872
|
|
2,852
|
|
1,279
|
|
255
|
|
446
|
|
254
|
|
279
|
|
957
|
|
||||||||||||||||
|
Non-interest income
|
7,917
|
|
10,552
|
|
11,001
|
|
10,151
|
|
6,147
|
|
6,310
|
|
6,561
|
|
8,464
|
|
||||||||||||||||
|
Non-interest expense
|
22,909
|
|
22,330
|
|
22,149
|
|
22,508
|
|
16,801
|
|
16,157
|
|
16,711
|
|
31,470
|
|
||||||||||||||||
|
Income before income taxes
|
12,088
|
|
13,874
|
|
15,945
|
|
15,632
|
|
8,334
|
|
10,534
|
|
9,583
|
|
2,408
|
|
||||||||||||||||
|
Income tax expense
|
3,442
|
|
4,258
|
|
5,042
|
|
4,730
|
|
2,723
|
|
3,341
|
|
3,127
|
|
716
|
|
||||||||||||||||
|
Net income
|
$
|
8,646
|
|
$
|
9,616
|
|
$
|
10,903
|
|
$
|
10,902
|
|
$
|
5,611
|
|
$
|
7,193
|
|
$
|
6,456
|
|
$
|
1,692
|
|
||||||||
|
Per common share
(3)
:
|
||||||||||||||||||||||||||||||||
|
Basic
|
$
|
0.56
|
|
$
|
0.62
|
|
$
|
0.70
|
|
$
|
0.70
|
|
$
|
0.50
|
|
$
|
0.64
|
|
$
|
0.58
|
|
$
|
0.11
|
|
||||||||
|
Diluted
|
$
|
0.56
|
|
$
|
0.62
|
|
$
|
0.70
|
|
$
|
0.70
|
|
$
|
0.50
|
|
$
|
0.64
|
|
$
|
0.57
|
|
$
|
0.11
|
|
||||||||
|
(1)
|
In the second quarter of 2016, the Company adopted ASU 2016-09 effective as of January 1, 2016. As such, first quarter 2016 financial results have been restated from previously reported within Form 10-Q.
|
|
(2)
|
On October 16, 2015, the Company completed its acquisition of SBM. Fourth quarter 2015 results of operations include revenues and expenses incurred as a combined organization from the acquisition date through December 31, 2015. The decrease in basic and diluted EPS in the fourth quarter of 2015 was due to acquisition costs and the issuance of
4.1 million
shares of Company common stock (as adjusted for the three-for-two common stock split effective September 30, 2016) in connection with the acquisition. Refer to Note 2 for additional details of the acquisition.
|
|
(3)
|
Earnings per share amounts have been adjusted to reflect the three-for-two split effective September 30, 2016, for all periods presented. Refer to Note 13.
|
124
Report of Independent Registered Public Accounting Firm
To the Shareholders and Board of Directors
Camden National Corporation
We have audited the accompanying consolidated statements of condition of Camden National Corporation and Subsidiary (the Company) as of December 31, 2016 and 2015, and the related consolidated statements of income, comprehensive income, changes in shareholders' equity and cash flows for the years then ended. These financial statements are the responsibility of the Company's management. Our responsibility is to express an opinion on these financial statements based on our audits.
We conducted our audits in accordance with the standards of the Public Company Accounting Oversight Board (United States). Those standards require that we plan and perform the audit to obtain reasonable assurance about whether the financial statements are free of material misstatement. An audit includes examining, on a test basis, evidence supporting the amounts and disclosures in the financial statements. An audit also includes assessing the accounting principles used and significant estimates made by management, as well as evaluating the overall financial statement presentation. We believe that our audits provide a reasonable basis for our opinion.
In our opinion, the consolidated financial statements referred to above present fairly, in all material respects, the financial position of the Company as of December 31, 2016 and 2015, and the results of its operations and its cash flows for the years then ended, in conformity with U.S. generally accepted accounting principles.
We have also audited, in accordance with the standards of the Public Company Accounting Oversight Board (United States), the Company’s internal control over financial reporting as of December 31, 2016, based on criteria established in Internal Control - Integrated Framework issued by the Committee of Sponsoring Organizations of the Treadway Commission in 2013, and our report dated March 7, 2017 expressed an unqualified opinion on the effectiveness of the Company’s internal control over financial reporting.
/s/ RSM US LLP
New York, New York
March 7, 2017
125
Report of Independent Registered Public Accounting Firm
To the Shareholders and Board of Directors
Camden National Corporation
We have audited Camden National Corporation and Subsidiary’s (the Company) internal control over financial reporting as of December 31, 2016, based on criteria established in Internal Control - Integrated Framework issued by the Committee of Sponsoring Organizations of the Treadway Commission in 2013. The Company’s management is responsible for maintaining effective internal control over financial reporting and for its assessment of the effectiveness of internal control over financial reporting included in the accompanying Management’s Annual Report on Internal Control over Financial Reporting. Our responsibility is to express an opinion on the Company's internal control over financial reporting based on our audit.
We conducted our audit in accordance with the standards of the Public Company Accounting Oversight Board (United States). Those standards require that we plan and perform the audit to obtain reasonable assurance about whether effective internal control over financial reporting was maintained in all material respects. Our audit included obtaining an understanding of internal control over financial reporting, assessing the risk that a material weakness exists, and testing and evaluating the design and operating effectiveness of internal control based on the assessed risk. Our audit also included performing such other procedures as we considered necessary in the circumstances. We believe that our audit provides a reasonable basis for our opinion.
A company's internal control over financial reporting is a process designed to provide reasonable assurance regarding the reliability of financial reporting and the preparation of financial statements for external purposes in accordance with generally accepted accounting principles. A company's internal control over financial reporting includes those policies and procedures that (a) pertain to the maintenance of records that, in reasonable detail, accurately and fairly reflect the transactions and dispositions of the assets of the company; (b) provide reasonable assurance that transactions are recorded as necessary to permit preparation of financial statements in accordance with generally accepted accounting principles, and that receipts and expenditures of the company are being made only in accordance with authorizations of management and directors of the company; and (c) provide reasonable assurance regarding prevention or timely detection of unauthorized acquisition, use, or disposition of the company's assets that could have a material effect on the financial statements.
Because of its inherent limitations, internal control over financial reporting may not prevent or detect misstatements. Also, projections of any evaluation of effectiveness to future periods are subject to the risk that controls may become inadequate because of changes in conditions, or that the degree of compliance with the policies or procedures may deteriorate.
In our opinion, the Company maintained, in all material respects, effective internal control over financial reporting as of December 31, 2016, based on criteria established in Internal Control - Integrated Framework issued by the Committee of Sponsoring Organizations of the Treadway Commission in 2013.
We have also audited, in accordance with the standards of the Public Company Accounting Oversight Board (United States), the consolidated statements of condition of the Company as of December 31, 2016 and 2015, and the related consolidated statements of income, comprehensive income, changes in shareholders’ equity and cash flows for the years then ended, and our report dated March 7, 2017 expressed an unqualified opinion.
/s/ RSM US LLP
New York, New York
March 7, 2017
126
REPORT OF INDEPENDENT REGISTERED PUBLIC ACCOUNTING FIRM
The Shareholders and Board of Directors
Camden National Corporation
We have audited the accompanying consolidated statements of income, comprehensive income, changes in shareholders' equity, and cash flows of Camden National Corporation and Subsidiaries (the Company) for the year ended December 31, 2014. These consolidated financial statements are the responsibility of the Company’s management. Our responsibility is to express an opinion on these financial statements based on our audit.
We conducted our audit in accordance with the standards of the Public Company Accounting Oversight Board (United States). Those standards require that we plan and perform the audit to obtain reasonable assurance about whether the financial statements are free of material misstatement. An audit includes examining, on a test basis, evidence supporting the amounts and disclosures in the financial statements. An audit also includes assessing the accounting principles used and significant estimates made by management, as well as evaluating the overall financial statement presentation. We believe that our audit provides a reasonable basis for our opinion.
In our opinion, the consolidated financial statements referred to above present fairly, in all material respects, the consolidated results of operations and consolidated cash flows of Camden National Corporation and Subsidiaries for the year ended December 31, 2014, in conformity with accounting principles generally accepted in the United States of America.
/s/ Berry Dunn McNeil & Parker, LLC
Portland, Maine
March 10, 2015
127
Not applicable.
As required by Rule 13a-15 under the Securities Exchange Act of 1934, as amended (the “Exchange Act”), the Company’s management conducted an evaluation with the participation of the Company’s Chief Executive Officer and Chief Operating Officer and Chief Financial Officer & Principal Financial and Accounting Officer, regarding the effectiveness of the Company’s disclosure controls and procedures, as of the end of the last fiscal year. In designing and evaluating the Company’s disclosure controls and procedures, the Company and its management recognize that any controls and procedures, no matter how well designed and operated, can provide only a reasonable assurance of achieving the desired control objectives, and management necessarily was required to apply its judgment in evaluating and implementing possible controls and procedures. Based upon that evaluation, the Chief Executive Officer and Chief Operating Officer and Chief Financial Officer & Principal Financial and Accounting Officer concluded that they believe the Company’s disclosure controls and procedures are effective to ensure that information required to be disclosed by the Company in the reports it files or submits under the Exchange Act is recorded, processed, summarized and reported within the time periods specified in the SEC’s rules and forms. We intend to continue to review and document our disclosure controls and procedures, including our internal controls and procedures for financial reporting, and we may from time to time make changes to the disclosure controls and procedures to enhance their effectiveness and to ensure that our systems evolve with our business.
There was no change in our internal control over financial reporting that occurred during the period covered by this Annual Report on Form 10-K that has materially affected, or is reasonably likely to materially affect, our internal control over financial reporting.
MANAGEMENT’S ANNUAL REPORT
ON INTERNAL CONTROL OVER FINANCIAL REPORTING
The Management of the Company is responsible for the preparation and fair presentation of the financial statements and other financial information contained in this Form 10-K. Management is also responsible for establishing and maintaining adequate internal control over financial reporting and for identifying the framework used to evaluate its effectiveness. Management has designed processes, internal controls and a business culture that foster financial integrity and accurate reporting. The Company’s comprehensive system of internal control over financial reporting was designed to provide reasonable assurance regarding the reliability of financial reporting and the preparation of the consolidated financial statements of the Company in accordance with accounting principles generally accepted in the United States of America. The Company’s accounting policies and internal control over financial reporting, established and maintained by management, is under the general oversight of the Company’s Board of Directors, including the Board of Directors’ Audit Committee.
Management has made a comprehensive review, evaluation, and assessment of the Company’s internal control over financial reporting as of
December 31, 2016
. The standard measures adopted by management in making its evaluation are the measures in
Internal Control — Integrated Framework
(2013) published by the Committee of Sponsoring Organizations of the Treadway Commission. Based upon its review and evaluation, management concluded that, as of
December 31, 2016
, the Company’s internal control over financial reporting was effective and that there were no material weaknesses. However, Management recognizes a control system, no matter how well designed and operated, has inherent limitations and can provide only reasonable, not absolute, assurance that the control system’s objectives will be met and may not prevent or detect all error and fraud. Therefore, even a system determined to be effective can provide only reasonable assurance with respect to financial statement preparation and presentation.
RSM US LLP, an independent registered public accounting firm, which has audited and reported on the consolidated financial statements contained in this Form 10-K, has issued its written attestation report on management’s assessment of the Company’s internal control over financial reporting which precedes this report.
128
None.
129
The information required by this item is incorporated by reference from the material responsive to such item in the Company’s Proxy Statement for the 2017 Annual Meeting of Shareholders to be held on April 25, 2017.
The information required by this item is incorporated by reference from the material responsive to such item in the Company’s Proxy Statement for the 2017 Annual Meeting of Shareholders to be held on April 25, 2017.
Securities authorized for issuance under equity compensation plans are as follows:
|
Number of Securities to Be Issued Upon Exercise of Outstanding Options, Warrants and Rights
(a)
|
Weighted Average Exercise Price of Outstanding Options, Warrants and Rights
(b)
|
Number of Securities Remaining Available for Future Issuance (Excluding Securities in Column (a))
(c)
(2)
|
||||||||
|
Equity compensation plans approved by shareholders
(1)
|
211,691
|
|
$
|
7.80
|
|
978,436
|
|
|||
|
Equity compensation plans not approved by shareholders
|
—
|
|
—
|
|
—
|
|
||||
|
Total
|
211,691
|
|
$
|
7.80
|
|
978,436
|
|
|||
|
(1)
|
Share and per share amounts have been adjusted to reflect the three-for-two split effective September 30, 2016. Refer to Note 13 for further discussion.
|
|
(2)
|
Represents the 1.2 million shares available under the 2012 Equity and Incentive Plan less awards granted plus shares added back due to the forfeiture, cancellation or reacquisition by the Company for the settlement of an award to cover the exercise price or tax withholding under the current and previous plans.
|
Refer to Notes 1 and 15 to the consolidated financial statements within Item 8. “Financial Statements and Supplementary Data” for further information related to the Company’s equity compensation plans.
The information required by this item is incorporated by reference from the material responsive to such item in the Company’s Proxy Statement for the 2017 Annual Meeting of Shareholders to be held on April 25, 2017.
The information required by this item is incorporated by reference from the material responsive to such item in the Company’s Proxy Statement for the 2017 Annual Meeting of Shareholders to be held on April 25, 2017.
The information required by this item is incorporated by reference from the material responsive to such item in the Company’s Proxy Statement for the 2017 Annual Meeting of Shareholders to be held on April 25, 2017.
130
(a) 1. Index to Financial Statements:
The consolidated financial statements of the Company and report of the Company’s independent registered public accounting firm incorporated herein are included in Item 8 of this Report, as follows:
|
Page
|
|
2. Financial Statement Schedules:
Schedules have been omitted because they are not applicable or are not required under the instructions contained in Regulation S-X or because the information required to be set forth therein are included in the consolidated financial statements or notes thereto.
3. Exhibits:
|
Exhibit
No.
|
Definition
|
|
|
2.1
|
Purchase and Assumption Agreement, dated April 23, 2012, by and between Bank of America, National Association and Camden National Bank (incorporated herein by reference to Exhibit 2.1 to the Company’s Form 8-K filed with the Commission on April 24, 2012).
|
|
|
2.2
|
Agreement and Plan of Merger dated as of March 29, 2015 by and among Camden National Corporation, Atlantic Acquisitions, LLC, and SBM Financial, Inc. (incorporated herein by reference to Exhibit 2.1 to the Company’s Form 8-K filed with the Commission on March 30, 2015).
|
|
|
3.1
|
Articles of Incorporation of Camden National Corporation, as amended (incorporated herein by reference to Exhibit 3.i.1 to the Company’s Form 10-K filed with the Commission on March 2, 2011).
|
|
|
3.2
|
Amended and Restated Bylaws of Camden National Corporation (incorporated herein by reference to Exhibit 3.2 to the Company's Form 8-K/A filed with the Commission on December 23, 2016).
|
|
|
10.1+
|
Camden National Corporation 2003 Stock Option and Incentive Plan (incorporated by reference to Exhibit 10.1 to the Company’s Form 10-Q filed with the Commission on August 8, 2008).
|
|
|
10.2+
|
Form of Incentive Stock Option Agreement under the Camden National Corporation 2003 Stock Option and Incentive Plan (incorporated herein by reference to Exhibit 10.4 to the Company’s Form 10-K filed with the Commission on March 2, 2011).
|
|
|
10.3+
|
Form of Restricted Stock Award Agreement under the Camden National Corporation 2003 Stock Option and Incentive Plan (incorporated herein by reference to Exhibit 10.5 to the Company’s Form 10-K filed with the Commission on March 2, 2011).
|
|
|
10.4+
|
Camden National Corporation Management Stock Purchase Plan under the Camden National Corporation 2003 Stock Option and Incentive Plan (incorporated herein by reference to Exhibit 10.3 to the Company’s Form 8-K filed with the Commission on May 1, 2008).
|
|
|
10.5+
|
Camden National Corporation 2012 Equity and Incentive Plan (incorporated herein by reference to Exhibit 10.1 to the Company’s Form 8-K filed with the Commission on May 8, 2012).
|
|
131
|
Exhibit
No.
|
Definition
|
|
|
10.6+
|
Amendment to Camden National Corporation 2012 Equity and Incentive Plan, dated as of March 9, 2015 (incorporated herein by reference to Exhibit 10.6 to the Company's Form 10-K filed with the Commission on March 10, 2015).
|
|
|
10.7+
|
Second Amendment to Camden National Corporation 2012 Equity and Incentive Plan, dated as of March 31, 2015 (incorporated herein by reference to Exhibit 10.1 to the Company’s Form 10-Q filed with the Commission on August 7, 2015).
|
|
|
10.8+
|
Form of Incentive Stock Option Agreement under the Camden National Corporation 2012 Equity and Incentive Plan (incorporated herein by reference to Exhibit 10.6 to the Company's Form 10-K filed with the Commission on February 28, 2013).
|
|
|
10.9+
|
Form of Restricted Stock Award Agreement under the Camden National Corporation 2012 Equity and Incentive Plan (incorporated herein by reference to Exhibit 10.7 to the Company's Form 10-K filed with the Commission on February 28, 2013).
|
|
|
10.10+
|
Camden National Corporation Management Stock Purchase Plan under the Camden National Corporation 2012 Equity and Incentive Plan (incorporated herein by reference to Exhibit 10.8 to the Company's Form 10-K filed with the Commission on February 28, 2013).
|
|
|
10.11+
|
Camden National Corporation Amended and Restated Defined Contribution Retirement Plan (incorporated herein by reference to Exhibit 10.10 to the Company's Form 10-K filed with the Commission on March 10, 2015).
|
|
|
10.12+
|
Form of Confidentiality, Non-Competition and Non-Solicitation Agreement by and between Camden National Corporation and certain executives (incorporated herein by reference to Exhibit 11 to the Company’s Form 10-K filed with the Commission on March 10, 2015).
|
|
|
10.13+
|
Amendment to Camden National Corporation Defined Contribution Retirement Plan, dated as of March 9, 2015 (incorporated herein by reference to Exhibit 10.12 to the Company’s Form 10-K filed with the Commission on March 10, 2015).
|
|
|
10.14+
|
Supplemental Executive Retirement Program (incorporated herein by reference to Exhibit 99.1 to the Company’s Form 8-K filed with the Commission on February 4, 2008).
|
|
|
10.15+
|
Union Trust Company’s Amended and Restated Deferred Compensation Agreement (incorporated herein by reference to Exhibit 10.1 to the Company’s Form 10-Q filed with the Commission on May 12, 2008).
|
|
|
10.16+
|
Camden National Corporation Executive Deferred Compensation Plan (incorporated herein by reference to Exhibit 10.9 to the Company’s Form 10-K filed with the Commission on March 17, 2008).
|
|
|
10.17+
|
Amendment to Camden National Corporation Executive Deferred Compensation Plan, dated as of February 26, 2013 (incorporated herein by reference to Exhibit 10.13 to the Company's Form 10-K filed with the Commission on February 28, 2013).
|
|
|
10.18+
|
Amendment to Camden National Corporation Defined Contribution Retirement Plan, dated as of March 31, 2015 (incorporated herein by reference to Exhibit 10.9 to the Company’s Form 10-Q filed with the Commission on August 7, 2015).
|
|
|
10.19+
|
Amendment and Restatement of Camden National Corporation Director Deferred Compensation Plan (incorporated herein by reference to Exhibit 10.9 to the Company’s Form 10-K filed with the Commission on March 9, 2007).
|
|
|
10.20+
|
2007 Amendment to the Camden National Corporation Director Deferred Compensation Plan (incorporated by reference to Exhibit 10.10 to the Company’s Form 10-K filed with the Commission on March 17, 2008).
|
|
|
10.21
|
Camden National Corporation Audit Committee Complaint Procedures (incorporated herein by reference to Exhibit 10.12 to the Company’s Form 10-K filed with the Commission on March 2, 2011).
|
|
|
10.22+
|
2010 Executive Incentive Compensation Program (incorporated herein by reference to Exhibit 10.19 to the Company’s Form 10-K filed with the Commission on March 12, 2010).
|
|
|
10.23+
|
Form of Change in Control Agreement for chief executive officer and other executive officers (incorporated herein by reference to Exhibit 10.21 in the Company’s Form 10-K filed with the Commission on March 10, 2015).
|
|
|
10.24+
|
Camden National Corporation 2014-2016 Amended and Restated Long-Term Performance Share Plan (incorporated herein by reference to Exhibit 10.24 to the Company's Form 8-K filed with the Commission on March 25, 2014).
|
|
|
10.25+
|
Camden National Corporation 2015-2017 Amended and Restated Long-Term Performance Share Plan (incorporated herein by reference to Exhibit 10.27 to the Company's Form 8-K filed with the Commission on July 6, 2015).
|
|
|
10.26+
|
Camden National Corporation 2016-2018 Amended and Restated Long-Term Performance Share Plan (incorporated herein by reference to Exhibit 10.26 to the Company's Form 8-K filed with the Commission on March 29, 2016).
|
|
132
|
Exhibit
No.
|
Definition
|
|
|
11.1
|
Statement regarding computation of per share earnings (incorporated herein by reference to Note 14 to the Notes to Consolidated Financial Statements in this report.)
|
|
|
14
|
Camden National Corporation Code of Business Conduct and Ethics (incorporated herein by reference to Exhibit 14 to the Company’s Form 10-K filed with the Commission on March 2, 2011).
|
|
|
21*
|
Subsidiaries of the Company.
|
|
|
23.1*
|
Consent of RSM US LLP.
|
|
|
23.2*
|
Consent of Berry Dunn McNeil & Parker, LLC.
|
|
|
31.1*
|
Certification of President and Chief Executive Officer required by Section 302 of the Sarbanes- Oxley Act of 2002.
|
|
|
31.2*
|
Certification of Principal Financial and Accounting Officer required by Section 302 of the Sarbanes-Oxley Act of 2002.
|
|
|
32.1**
|
Certification of Chief Executive Officer pursuant to 18 U.S.C. Section 1350, as required by Section 906 of the Sarbanes-Oxley Act of 2002.
|
|
|
32.2**
|
Certification of Principal Financial and Accounting Officer pursuant to 18 U.S.C. Section 1350, as required by Section 906 of the Sarbanes-Oxley Act of 2002.
|
|
|
101
|
The following materials from the Company’s Annual Report on Form 10-K for the year ended December 31, 2016 formatted in XBRL (eXtensible Business Reporting Language): (i) the Consolidated Balance Sheets, (ii) the Consolidated Statements of Operations, (iii) the Consolidated Statements of Stockholders’ Equity, (iv) the Consolidated Statements of Comprehensive Income (v) the Consolidated Statements of Cash Flows, and (vi) related notes to these financial statements.
|
|
|
*
|
Filed herewith
|
|
**
|
Furnished herewith
|
|
+
|
Management contract or a compensatory plan or arrangement.
|
None.
133
SIGNATURES
Pursuant to the requirement of Section 13 or 15(d) of the Securities Exchange Act of 1934, the Registrant has duly caused this report to be signed on its behalf by the undersigned, thereunto duly authorized.
|
Date: March 7, 2017
|
CAMDEN NATIONAL CORPORATION
|
|
|
/s/ Gregory A. Dufour
|
||
|
Gregory A. Dufour
President and Chief Executive Officer
|
||
Pursuant to the requirements of the Securities Exchange Act of 1934, this report has been signed below by the persons on behalf of the Registrant and in the capacities and on the dates indicated.
|
Name
|
|
Position
|
|
Date
|
|
/s/ Gregory A. Dufour
|
President, Director and Chief Executive Officer
|
March 7, 2017
|
||
|
Gregory A. Dufour
|
|
|
||
|
/s/ Deborah A. Jordan
|
Chief Operating Officer, Chief Financial Officer, and Principal Financial and Accounting Officer
|
March 7, 2017
|
||
|
Deborah A. Jordan
|
|
|
||
|
/s/ Karen W. Stanley
|
|
Chair and Director
|
|
March 7, 2017
|
|
Karen W. Stanley
|
||||
|
/s/ Ann W. Bresnahan
|
|
Director
|
|
March 7, 2017
|
|
Ann W. Bresnahan
|
||||
|
/s/ David C. Flanagan
|
|
Director
|
|
March 7, 2017
|
|
David C. Flanagan
|
||||
|
/s/ Craig S. Gunderson
|
|
Director
|
|
March 7, 2017
|
|
Craig S. Gunderson
|
||||
|
/s/ John W. Holmes
|
|
Director
|
|
March 7, 2017
|
|
John W. Holmes
|
||||
|
/s/ S. Catherine Longley
|
|
Director
|
|
March 7, 2017
|
|
S. Catherine Longley
|
||||
|
/s/ David J. Ott
|
|
Director
|
|
March 7, 2017
|
|
David J. Ott
|
||||
|
/s/ James H. Page
|
|
Director
|
|
March 7, 2017
|
|
James H. Page
|
||||
|
/s/ John M. Rohman
|
|
Director
|
|
March 7, 2017
|
|
John M. Rohman
|
||||
|
/s/ Carl J. Soderberg
|
|
Director
|
|
March 7, 2017
|
|
Carl J. Soderberg
|
||||
|
/s/ Lawrence J. Sterrs
|
|
Director
|
|
March 7, 2017
|
|
Lawrence J. Sterrs
|
||||
134
TABLE OF CONTENTS
Part IItem 1. BusinessItem 1A. Risk FactorsItem 1B. Unresolved Staff CommentsItem 2. PropertiesItem 3. Legal ProceedingsItem 4. Mine Safety DisclosuresPart IIItem 5. Market For Registrant S Common Equity, Related Stockholder Matters and Issuer Purchases Of Equity SecuritiesItem 6. Selected Financial DataItem 7. Management S Discussion and Analysis Of Financial Condition and Results Of OperationsItem 7A. Quantitative and Qualitative Disclosures About Market RiskItem 8. Financial Statements and Supplementary DataItem 9. Changes in and Disagreements with Accountants on Accounting and Financial DisclosureItem 9A. Controls and ProceduresItem 9B. Other InformationPart IIIItem 10. Directors, Executive Officers and Corporate GovernanceItem 11. Executive CompensationItem 12. Security Ownership Of Certain Beneficial Owners and Management and Related Stockholder MattersItem 13. Certain Relationships, Related Transactions and Director IndependenceItem 14. Principal Accounting Fees and ServicesPart IVItem 15. Exhibits and Financial Statement SchedulesItem 16. Form 10-k Summary