CREDIT ACCEPTANCE CORP
10-Ks and 10-Qs
|
|
|
|
|
|
|
|
|
|
|
|
|
|
|
|
|
|
|
|
|
|
|
|
|
|
|
|
|
|
|
|
|
|
|
|
|
|
|
|
|
|
|
|
|
|
|
|
|
|
|
|
|
|
|
|
|
|
|
UNITED STATES
SECURITIES AND EXCHANGE COMMISSION
WASHINGTON, D.C. 20549
FORM 10-K
(Mark One)
|
[X]
|
ANNUAL REPORT PURSUANT TO SECTION 13 OR 15(d) OF THE SECURITIES EXCHANGE ACT OF 1934
|
|
For the Fiscal Year Ended December 31, 2013
|
OR
|
[ ]
|
TRANSITION REPORT PURSUANT TO SECTION 13 OR 15(d) OF THE SECURITIES EXCHANGE ACT OF 1934
|
|
For the Transition Period from ______ to ________
|
Commission File Number 000-20202
CREDIT ACCEPTANCE CORPORATION
(Exact Name of Registrant as Specified in its Charter)
|
Michigan
|
38-1999511
|
|
|
(State or other jurisdiction of incorporation or organization)
|
(I.R.S. Employer Identification No.)
|
|
|
25505 W. Twelve Mile Road
|
||
|
Southfield, Michigan
|
48034-8339
|
|
|
(Address of Principal Executive Offices)
|
(Zip Code)
|
Registrant’s telephone number, including area code:
(248) 353-2700
Securities Registered Pursuant to Section 12(b) of the Act:
|
Title of each class
|
Name of each exchange on which registered
|
|
|
Common Stock
|
NASDAQ
|
Securities Registered Pursuant to Section 12(g) of the Act:
None
Indicate by check mark if the registrant is a well-known seasoned issuer, as defined in Rule 405 of the Securities Act. Yes [ X ] No [ ]
Indicate by check mark if the registrant is not required to file reports pursuant to Section 13 or Section 15(d) of the Act. Yes [ ] No [ X ]
Indicate by check mark whether the registrant (1) has filed all reports required to be filed by Section 13 or 15(d) of the Securities Exchange Act of 1934 during the preceding 12 months (or for such shorter period that the registrant was required to file such reports), and (2) has been subject to such filing requirements for the past 90 days. Yes [ X ] No [ ]
Indicate by check mark whether the registrant has submitted electronically and posted on its corporate Website, if any, every Interactive Data File required to be submitted and posted pursuant to Rule 405 of Regulation S-T (Section 232.405 of this chapter) during the preceding 12 months (or for such shorter period that the registrant was required to submit and post such files). Yes [ X ] No [ ]
Indicate by check mark if disclosure of delinquent filers pursuant to Item 405 of Regulation S-K (Section 229.405 of this chapter) is not contained herein, and will not be contained, to the best of registrant's knowledge, in definitive proxy or information statements incorporated by reference in Part III of this Form 10-K or any amendment to this Form 10-K. [ X ]
Indicate by check mark whether the registrant is a large accelerated filer, an accelerated filer, a non-accelerated filer, or a smaller reporting company. See definitions of “large accelerated filer,” “accelerated filer” and “smaller reporting company” in Rule 12b-2 of the Exchange Act.
|
Large accelerated filer [ X ]
|
Accelerated filer [ ]
|
Non-accelerated filer [ ]
|
Smaller reporting company [ ]
|
|
(Do not check if a smaller reporting company)
|
Indicate by check mark whether the registrant is a shell company (as defined in Rule 12b-2 of the Act). Yes [ ] No [ X ]
The aggregate market value of 8,719,007 shares of the Registrant's common stock held by non-affiliates on June 30, 2013 was approximately $915.9 million. For purposes of this computation all officers, directors and 10% beneficial owners of the Registrant are assumed to be affiliates. Such determination should not be deemed an admission that such officers, directors and beneficial owners are, in fact, affiliates of the Registrant.
At February 7, 2014, there were 22,947,170 shares of the Registrant's common stock issued and outstanding.
DOCUMENTS INCORPORATED BY REFERENCE
Portions of the Registrant's definitive Proxy Statement pertaining to the 2014 Annual Meeting of Shareholders (the "Proxy Statement") filed pursuant to Regulation 14A are incorporated herein by reference into Part III of this Annual Report on Form 10-K (this “Form 10-K”).
CREDIT
ACCEPTANCE CORPORATION
YEAR ENDED DECEMBER 31, 2013
|
Item
|
Description
|
Page
|
|||||
|
PART I
|
|||||||
|
3
|
|||||||
|
13
|
|||||||
|
19
|
|||||||
|
20
|
|||||||
|
20
|
|||||||
|
20
|
|||||||
|
PART II
|
|||||||
|
21
|
|||||||
|
23
|
|||||||
|
24
|
|||||||
|
38
|
|||||||
|
39
|
|||||||
|
80
|
|||||||
|
80
|
|||||||
|
82
|
|||||||
|
PART III
|
|||||||
|
82
|
|||||||
|
82
|
|||||||
|
82
|
|||||||
|
83
|
|||||||
|
83
|
|||||||
|
PART IV
|
|||||||
|
83
|
|||||||
|
84
|
|||||||
General
Since 1972, Credit Acceptance Corporation (referred to as the “Company”, “Credit Acceptance”, “we”, “our” or “us”) has offered automobile dealers financing programs that enable them to sell vehicles to consumers, regardless of their credit history. Our financing programs are offered through a nationwide network of automobile dealers who benefit from sales of vehicles to consumers who otherwise could not obtain financing; from repeat and referral sales generated by these same customers; and from sales to customers responding to advertisements for our product, but who actually end up qualifying for traditional financing.
Credit Acceptance was founded to collect retail installment contracts (referred to as “Consumer Loans”) originated by automobile dealerships owned by Donald Foss, our Chairman, founder, and significant shareholder. During the 1980s, we began to market this service to non-affiliated dealers and, at the same time, began to offer dealers a non-recourse cash payment (referred to as an “advance”) against anticipated future collections on Consumer Loans serviced for that dealer.
We refer to automobile dealers who participate in our programs and who share our commitment to changing consumers’ lives as “Dealers”. Upon enrollment in our financing programs, the Dealer enters into a Dealer servicing agreement with us that defines the legal relationship between Credit Acceptance and the Dealer. The Dealer servicing agreement assigns the responsibilities for administering, servicing, and collecting the amounts due on Consumer Loans from the Dealers to us. We are an indirect lender from a legal perspective, meaning the Consumer Loan is originated by the Dealer and assigned to us.
Consumers and Dealers benefit from our programs as follows:
Consumers
.
We help change the lives of consumers who do not qualify for conventional automobile financing by helping them obtain quality transportation. Without our financing programs, consumers are often unable to purchase a vehicle or they purchase an unreliable one. Further, as we report to the three national credit reporting agencies, an important ancillary benefit of our programs is that we provide a significant number of our consumers with an opportunity to improve their lives by improving their credit score and move on to more traditional sources of financing.
Dealers.
Our programs increase Dealers’ profits in the following ways:
|
·
|
Enables Dealers to sell cars to consumers who may not be able to obtain financing without our programs. In addition, consumers often become repeat customers by financing future vehicle purchases either through our programs or, after they have successfully established or reestablished their credit, through conventional financing.
|
|
·
|
Allows Dealers to share in the profit, not only from the sale of the vehicle, but also from its financing.
|
|
·
|
Enables Dealers to attract consumers by advertising “guaranteed credit approval”, where allowed by law. The consumers will often use other services of the Dealers and refer friends and relatives to them.
|
|
·
|
Enables Dealers to attract consumers who mistakenly assume they do not qualify for conventional financing.
|
Business Segment Information
We currently operate in one reportable segment which represents our core business of offering Dealers financing programs and related products and services that enable them to sell vehicles to consumers, regardless of their credit history. For information regarding our one reportable segment and related entity-wide disclosures, see Note 16 to the consolidated financial statements contained in Item 8 of this Form 10-K, which is incorporated herein by reference.
Principal Business
We have two programs: the Portfolio Program and the Purchase Program. Under the Portfolio Program, we advance money to Dealers (referred to as a “Dealer Loan”) in exchange for the right to service the underlying Consumer Loans. Under the Purchase Program, we buy the Consumer Loans from the Dealers (referred to as a “Purchased Loan”) and keep all amounts collected from the consumer. Dealer Loans and Purchased Loans are collectively referred to as “Loans”. The following table shows the percentage of Consumer Loans assigned to us based on unit volumes under each of the programs for each of the last three years:
|
For the Years Ended December 31,
|
Portfolio Program
|
Purchase Program
|
||||||
|
2011
|
92.5
|
%
|
7.5
|
%
|
||||
|
2012
|
93.7
|
%
|
6.3
|
%
|
||||
|
2013
|
93.5
|
%
|
6.5
|
%
|
||||
Portfolio Program
As payment for the vehicle, the Dealer generally receives the following:
|
·
|
a down payment from the consumer;
|
|
·
|
a cash advance from us; and
|
|
·
|
after the advance has been recovered by us, the cash from payments made on the Consumer Loan, net of certain collection costs and our servicing fee (“Dealer Holdback”).
|
We record the amount advanced to the Dealer as a Dealer Loan, which is classified within Loans receivable in our consolidated balance sheets. Cash advanced to the Dealer is automatically assigned to the Dealer’s open pool of advances. We generally require Dealers to group advances into pools of at least 100 Consumer Loans. At the Dealer’s option, a pool containing at least 100 Consumer Loans can be closed and subsequent advances assigned to a new pool. All advances within a Dealer’s pool are secured by the future collections on the related Consumer Loans assigned to the pool. For Dealers with more than one pool, the pools are cross-collateralized so the performance of other pools is considered in determining eligibility for Dealer Holdback. We perfect our security interest in the Dealer Loans by taking possession of the Consumer Loans, which list us as lien holder on the vehicle title.
The Dealer servicing agreement provides that collections received by us during a calendar month on Consumer Loans assigned by a Dealer are applied on a pool-by-pool basis as follows:
|
·
|
First, to reimburse us for certain collection costs;
|
|
·
|
Second, to pay us our servicing fee, which generally equals 20% of collections;
|
|
·
|
Third, to reduce the aggregate advance balance and to pay any other amounts due from the Dealer to us; and
|
|
·
|
Fourth, to the Dealer as payment of Dealer Holdback.
|
If the collections on Consumer Loans from a Dealer’s pool are not sufficient to repay the advance balance and any other amounts due to us, the Dealer will not receive Dealer Holdback.
Dealers have an opportunity to receive an accelerated Dealer Holdback payment each time 100 Consumer Loans have been assigned to us. The amount paid to the Dealer is calculated using a formula that considers the forecasted collections and the advance balance on the related Consumer Loans.
Since typically the combination of the advance and the consumer’s down payment provides the Dealer with a cash profit at the time of sale, the Dealer’s risk in the Consumer Loan is limited. We cannot demand repayment of the advance from the Dealer except in the event the Dealer is in default of the Dealer servicing agreement. Advances are made only after the consumer and Dealer have signed a Consumer Loan contract, we have received the original Consumer Loan contract and supporting documentation, and we have approved all of the related stipulations for funding. The Dealer can also opt to repurchase Consumer Loans that have been assigned to us under the Portfolio Program, at their discretion, for a fee.
For accounting purposes, the transactions described under the Portfolio Program are not considered to be loans to consumers. Instead, our accounting reflects that of a lender to the Dealer. The classification as a Dealer Loan for accounting purposes is primarily a result of (1) the Dealer’s financial interest in the Consumer Loan and (2) certain elements of our legal relationship with the Dealer.
Purchase Program
The Purchase Program differs from our Portfolio Program in that the Dealer receives a one-time payment from us at the time of assignment to purchase the Consumer Loan instead of a cash advance at the time of assignment and future Dealer Holdback payments. For accounting purposes, the transactions described under the Purchase Program are considered to be originated by the Dealer and then purchased by us.
Program Enrollment
Dealers may enroll in our program by choosing one of our two enrollment options (referred to as “Option A” and “Option B”). In recent years, the terms of Option A have remained consistent while the terms of Option B have varied. The following table summarizes the terms of our enrollment options for the three year period ending December 31, 2013:
|
Effective Period
|
Option A
|
Option B
|
|||||
|
Since June 1, 2011
|
Upfront, one-time fee of $9,850
|
Agreement to allow us to retain 50% of their first accelerated Dealer Holdback payment
|
|||||
|
Prior to June 1, 2011
|
Upfront, one-time fee of $9,850
|
Upfront, one-time fee of $1,950 and agreement to allow us to retain 50% of their first accelerated Dealer Holdback payment
|
|||||
Dealers are granted access to the Portfolio Program upon enrollment. Access to the Purchase Program is limited and is typically only granted to Dealers that either have received their first accelerated Dealer Holdback payment under the Portfolio Program or are franchise dealerships.
Revenue Sources
Credit Acceptance derives its revenues from the following principal sources:
|
·
|
Finance charges, which are comprised of: (1) servicing fees earned as a result of servicing Consumer Loans assigned to us by Dealers under the Portfolio Program, (2) finance charge income from Purchased Loans, (3) fees earned from our third party ancillary product offerings, (4) monthly program fees of $599, charged to Dealers under the Portfolio Program; and (5) fees associated with certain Loans;
|
|
·
|
Premiums earned on the reinsurance of vehicle service contracts; and
|
|
·
|
Other income, which primarily consists of: vendor fees, Dealer support products and services, ancillary product profit sharing income and Dealer enrollment fees. For additional information, see Note 2 to the consolidated financial statements contained in Item 8 to this Form 10-K, which is incorporated herein by reference.
|
The following table sets forth the percent relationship to total revenue of each of these sources:
|
For the Years Ended December 31,
|
||||||||||||
|
Percent of Total Revenue
|
2013
|
2012
|
2011
|
|||||||||
|
Finance charges
|
86.6
|
%
|
88.3
|
%
|
87.7
|
%
|
||||||
|
Premiums earned
|
7.5
|
%
|
7.7
|
%
|
7.6
|
%
|
||||||
|
Other income
|
5.9
|
%
|
4.0
|
%
|
4.7
|
%
|
||||||
|
Total revenue
|
100.0
|
%
|
100.0
|
%
|
100.0
|
%
|
||||||
Our business is seasonal with peak Consumer Loan acceptances and collections occurring during the first quarter of the year. However, this seasonality does not have a material impact on our interim results.
Operations
Sales and Marketing
. Our target market is approximately 56,000 independent and franchised automobile dealers in the United States. We have market area managers located throughout the United States that market our programs to prospective Dealers, enroll new Dealers, and support active Dealers. The number of Dealer enrollments and active Dealers for each of the last three years are presented in the table below:
|
For the Years Ended December 31,
|
Dealer Enrollments
|
Active Dealers (1)
|
||||||
|
2011
|
1,953
|
3,998
|
||||||
|
2012
|
2,519
|
5,319
|
||||||
|
2013
|
2,761
|
6,394
|
||||||
|
(1)
|
Active Dealers are Dealers who have received funding for at least one Loan during the period.
|
Once Dealers have enrolled in our programs, the market area managers work closely with the newly enrolled Dealers to help them successfully launch our programs within their dealerships. Market area managers also provide active Dealers with ongoing support and consulting focused on improving the Dealers’ success on our programs, including assistance with increasing the volume and performance of Consumer Loan assignments.
Dealer Servicing Agreement.
As a part of the enrollment process, a new Dealer is required to enter into a Dealer servicing agreement with Credit Acceptance that defines the legal relationship between Credit Acceptance and the Dealer. The Dealer servicing agreement assigns the responsibilities for administering, servicing, and collecting the amounts due on Consumer Loans from the Dealers to us. Under the typical Dealer servicing agreement, a Dealer represents that it will only assign Consumer Loans to us that satisfy criteria established by us, meet certain conditions with respect to their binding nature and the status of the security interest in the purchased vehicle, and comply with applicable state and federal laws and regulations.
The typical Dealer servicing agreement may be terminated by us or by the Dealer upon written notice. We may terminate the Dealer servicing agreement immediately in the case of an event of default by the Dealer. Events of default include, among other things:
|
·
|
the Dealer's refusal to allow us to audit its records relating to the Consumer Loans assigned to us;
|
|
·
|
the Dealer, without our consent, is dissolved; merges or consolidates with an entity not affiliated with the Dealer; or sells a material part of its assets outside the course of its business to an entity not affiliated with the Dealer; or
|
|
·
|
the appointment of a receiver for, or the bankruptcy or insolvency of, the Dealer.
|
While a Dealer can cease assigning Consumer Loans to us at any time without terminating the Dealer servicing agreement, if the Dealer elects to terminate the Dealer servicing agreement or in the event of a default, we have the right to require that the Dealer immediately pay us:
|
·
|
any unreimbursed collection costs on Dealer Loans;
|
|
·
|
any unpaid advances and all amounts owed by the Dealer to us; and
|
|
·
|
a termination fee equal to 15% of the then outstanding amount of the Consumer Loans assigned to us.
|
Upon receipt of such amounts in full, we reassign the Consumer Loans and our security interest in the financed vehicles to the Dealer.
In the event of a termination of the Dealer servicing agreement by us, we may continue to service Consumer Loans assigned by Dealers accepted prior to termination in the normal course of business without charging a termination fee.
Consumer Loan Assignment.
Once a Dealer has enrolled in our programs, the Dealer may begin assigning Consumer Loans to us. For accounting and financial reporting purposes, a Consumer Loan is considered to have been assigned to us after all of the following has occurred:
|
·
|
the consumer and Dealer have signed a Consumer Loan contract;
|
|
·
|
we have received the original Consumer Loan contract and supporting documentation;
|
|
·
|
we have approved all of the related stipulations for funding; and
|
|
·
|
we have provided funding to the Dealer in the form of either an advance under the Portfolio Program or one-time purchase payment under the Purchase Program.
|
A Consumer Loan is originated by the Dealer when a consumer enters into a contract with a Dealer that sets forth the terms of the agreement between the consumer and the Dealer for the payment of the purchase price of the vehicle. The amount of the Consumer Loan consists of the total principal and interest that the consumer is required to pay over the term of the Consumer Loan. Consumer Loans are written on a contract form provided by us. Although the Dealer is named in the Consumer Loan contract, the Dealer generally does not have legal ownership of the Consumer Loan for more than a moment and we, not the Dealer, are listed as lien holder on the vehicle title. Consumers are obligated to make payments on the Consumer Loan directly to us, and any failure to make such payments will result in us pursuing payment through collection efforts.
All Consumer Loans submitted to us for assignment are processed through our Credit Approval Processing System (“CAPS”). CAPS allows Dealers to input a consumer’s credit application and view the response from us via the Internet. CAPS allows Dealers to: (1) receive a quick approval from us; (2) interact with our proprietary credit scoring system to optimize the structure of each transaction prior to delivery; and (3) create and print Consumer Loan documents. All responses include the amount of funding (advance for a Dealer Loan or purchase price for a Purchased Loan), as well as any stipulations required for funding. The amount of funding is determined using a formula which considers a number of factors including the timing and amount of cash flows expected on the related Consumer Loan and our target return on capital at the time the Consumer Loan is submitted to us for assignment. The estimated future cash flows are determined based upon our proprietary credit scoring system, which considers numerous variables, including attributes contained in the consumer’s credit bureau report, data contained in the consumer’s credit application, the structure of the proposed transaction, vehicle information and other factors, to calculate a composite credit score that corresponds to an expected collection rate. Our proprietary credit scoring system forecasts the collection rate based upon the historical performance of Consumer Loans in our portfolio that share similar characteristics. The performance of our proprietary credit scoring system is evaluated monthly by comparing projected to actual Consumer Loan performance. Adjustments are made to our proprietary credit scoring system as necessary. For additional information on adjustments to forecasted collection rates, please see the Critical Accounting Estimates section in Item 7 of this Form 10-K, which is incorporated herein by reference.
While a Dealer can submit any legally compliant Consumer Loan to us for assignment, the decision whether to provide funding to the Dealer and the amount of any funding is made solely by us. Through our Dealer Service Center (“DSC”) department, we perform all significant functions relating to the processing of the Consumer Loan applications and bear certain costs of Consumer Loan assignment, including the cost of assessing the adequacy of Consumer Loan documentation, compliance with underwriting and legal guidelines and the cost of verifying employment, residence and other information provided by the Dealer. We used a company in India to support the DSC in reviewing Consumer Loan documentation for legal compliance until February 2013.
We audit Consumer Loan files for legal and underwriting guidelines on a daily basis in order to assess whether our Dealers are operating in accordance with the terms and conditions of our Dealer servicing agreement. We occasionally identify breaches of the Dealer servicing agreement and depending upon the circumstances, and at our discretion, we may change pricing or charge the Dealer fees for future Consumer Loan assignments; require the Consumer Loan(s) to be repurchased; or terminate our relationship with the Dealer.
Our business model allows us to share the risk and reward of collecting on the Consumer Loans with the Dealers. Such sharing is intended to motivate the Dealer to assign better quality Consumer Loans, follow our underwriting guidelines, comply with various legal regulations, meet our credit compliance requirements, and provide appropriate service and support to the consumer after the sale. In addition, the DSC works closely with Dealers to assist them in resolving any documentation deficiencies or funding stipulations. We believe this arrangement aligns our interests with the interests of the Dealer and the consumer.
We measure various criteria for each Dealer against other Dealers in their area as well as the top performing Dealers. Dealers are assigned a Dealer rating based upon the performance of their Consumer Loans in both the Portfolio and Purchase Programs as well as other criteria. The Dealer rating is one of the factors used to determine the amount paid to Dealers as an advance or to acquire a Purchased Loan. We provide each Dealer a monthly statement summarizing all activity that occurred on their Consumer Loan assignments.
Information on our Consumer Loans is presented in the following table:
|
For the Years Ended December 31,
|
|||||||||||
|
Average Consumer Loan Data
|
2013
|
2012
|
2011
|
||||||||
|
Average size of Consumer Loan accepted
|
$
|
15,445
|
$
|
15,468
|
$
|
15,686
|
|||||
|
Percentage change in average size of Consumer Loan
|
-0.1
|
%
|
-1.4
|
%
|
8.3
|
%
|
|||||
|
Average initial term (in months)
|
47
|
47
|
46
|
||||||||
Servicing.
Our largest group of collectors services Consumer Loans that are in the early stages of delinquency. Collection efforts typically consist of placing a call to the consumer within one day of the missed payment due date, although efforts may begin later for some segments of accounts. Consumer Loans are segmented into dialing pools by various phone contact profiles in an effort to maximize contact with the consumer. Our collectors work with consumers to attempt to reach a solution that will help them avoid becoming further past due and get them current where possible.
The decision to repossess a vehicle is based on statistical models or policy based criteria. When a Consumer Loan is approved for repossession, the account is transferred to our repossession team. Repossession personnel continue to service the Consumer Loan as it is being assigned to a third party repossession contractor, who works on a contingency fee basis. Once a vehicle has been repossessed, the consumer can negotiate to redeem the vehicle, whereupon the vehicle is returned to the consumer in exchange for paying off the Consumer Loan balance; or, where appropriate or if required by law, the vehicle is returned to the consumer and the Consumer Loan is reinstated in exchange for a payment that reduces or eliminates the past due balance. If this process is unsuccessful, the vehicle is sold at a wholesale automobile auction. Prior to sale, the vehicle is typically inspected by a representative at the auction who provides repair and reconditioning recommendations. Alternatively, our remarketing representatives may inspect the vehicle directly. Our remarketing representatives then authorize any repair and reconditioning work in order to maximize the net sale proceeds at auction.
If the vehicle sale proceeds are not sufficient to satisfy the balance owing on the Consumer Loan, the Consumer Loan is serviced by either: (1) our internal collection team, in the event the consumer is willing to make payments on the deficiency balance; or (2) where permitted by law, our external collection team, if it is believed that legal action is required to reduce the deficiency balance owing on the Consumer Loan. Our external collection team generally assigns Consumer Loans to third party collection attorneys who work on a contingency fee basis.
Collectors rely on two systems; the Collection System (“CS”) and the Loan Servicing System (“LSS”). The CS interfaces with a predictive dialer and records all activity on a Consumer Loan, including details of past phone conversations with the consumer, collection letters sent, promises to pay, broken promises, repossession orders and collection attorney activity. The LSS maintains a record of all transactions relating to Consumer Loan assignments and is a primary source of data utilized to:
|
·
|
determine the outstanding balance of the Consumer Loans;
|
|
·
|
forecast future collections;
|
|
·
|
establish the amount of revenue recognized by us;
|
|
·
|
calculate Dealer Holdback payments;
|
|
·
|
analyze the profitability of our program; and
|
|
·
|
evaluate our proprietary credit scoring system.
|
We outsourced a portion of our collection function to a company in India until February 2013. These outsourced collectors serviced accounts using the CS and typically serviced accounts that were less than sixty days past due.
Ancillary Products
We provide Dealers the ability to offer vehicle service contracts to consumers through our relationships with Third Party Providers (“TP
P
s”). A vehicle service contract provides the consumer protection by paying for the repair or replacement of certain components of the vehicle in the event of a mechanical failure. We provide Dealers with an additional advance based on the retail price of the vehicle service contract. TPPs process claims on vehicle service contracts that are underwritten by third party insurers. We receive a fee for all vehicle service contracts sold by our Dealers when the vehicle is financed by us. The fee is included in the retail price of the vehicle service contract which is added to the Consumer Loan. We recognize our fee from the vehicle service contracts as part of finance charges on a level-yield basis based upon forecasted cash flows. We bear the risk of loss for claims on certain vehicle service contracts that are reinsured by us. We market the vehicle service contracts directly to our Dealers. During 2012, we entered into an agreement with one of our TPPs that allows us to receive profit sharing payments depending on the performance of the vehicle service contracts. Profit sharing payments from the TPP are received twice a year, if eligible.
VSC Re Company (“VSC Re”), our wholly-owned subsidiary, is engaged in the business of reinsuring coverage under vehicle service contracts sold to consumers by Dealers on vehicles financed by us. VSC Re currently reinsures vehicle service contracts that are underwritten by one of our third party insurers. Vehicle service contract premiums, which represent the selling price of the vehicle service contract to the consumer, less fees and certain administrative costs, are contributed to trust accounts controlled by VSC Re. These premiums are used to fund claims covered under the vehicle service contracts. VSC Re is a bankruptcy remote entity. As such, our exposure to fund claims is limited to the trust assets
controlled by VSC Re and our net investment in VSC Re.
We provide Dealers the ability to offer a Guaranteed Asset Protection (“GAP”) product to consumers through our relationships with TPPs. GAP provides the consumer protection by paying the difference between the loan balance and the amount covered by the consumer's insurance policy in the event of a total loss of the vehicle due to severe damage or theft. We provide Dealers with an additional advance based on the retail price of the GAP contract. TPPs process claims on GAP contracts that are underwritten by third party insurers. We receive a fee for all GAP contracts sold by our Dealers when the vehicle is financed by us, and do not bear any risk of loss for claims. The fee is included in the retail price of the GAP contract which is added to the Consumer Loan. We recognize our fee from the GAP contracts as part of finance charges on a level-yield basis based upon forecasted cash flows. Our agreement with one of our TPPs allows us to receive profit sharing payments depending on the performance of the GAP program. Profit sharing payments from the TPP are received once a year, if eligible.
We provide Dealers in certain states the ability to purchase Global Positioning Systems (“GPS”) with Starter Interrupt Devices (“SID”) through our relationships with TPPs. Through this program, Dealers can install a GPS-based SID (“GPS-SID”) on vehicles financed by us that can be activated if the consumer fails to make payments on their account, and can result in the prompt repossession of the vehicle. Dealers purchase the GPS-SID directly from the TPPs. The TPPs pay us a fee for each device sold, at which time the fee revenue is recognized in other income within our consolidated statements of income.
Competition
The market for consumers who do not qualify for conventional automobile financing is large and highly competitive. The market is currently served by “buy here, pay here” dealerships, banks, captive finance affiliates of automobile manufacturers, credit unions and independent finance companies both publicly and privately owned. Many of these companies are much larger and have greater resources than us. We compete by offering a profitable and efficient method for Dealers to finance consumers who would be more difficult or less profitable to finance through other methods. In addition, we compete on the basis of the level of service provided by our DSC and sales personnel.
Customer and Geographic Concentrations
No single Dealer accounted for more than 10% of total revenues during any of the last three years. Additionally, no single Dealer’s Loans receivable balance accounted for more than 10% of total Loans receivable balance as of December 31, 2013 or 2012. The following tables provide information regarding the five states that were responsible for the largest dollar volume of Consumer Loan assignments and the related number of active Dealers during 2013, 2012 and 2011:
|
For the Year Ended December 31, 2013
|
||||||||||||||
|
(Dollars in millions)
|
Consumer Loan Assignments
|
Active Dealers (2)
|
||||||||||||
|
Dollar Volume (1)
|
% of Total
|
Number
|
% of Total
|
|||||||||||
|
Michigan
|
$
|
154.1
|
10.4
|
%
|
502
|
7.9
|
%
|
|||||||
|
New York
|
147.9
|
10.0
|
%
|
460
|
7.2
|
%
|
||||||||
|
Texas
|
81.5
|
5.5
|
%
|
392
|
6.1
|
%
|
||||||||
|
Ohio
|
73.9
|
5.0
|
%
|
359
|
5.6
|
%
|
||||||||
|
Pennsylvania
|
68.9
|
4.7
|
%
|
306
|
4.8
|
%
|
||||||||
|
All other states
|
954.3
|
64.4
|
%
|
4,375
|
68.4
|
%
|
||||||||
|
Total
|
$
|
1,480.6
|
100.0
|
%
|
6,394
|
100.0
|
%
|
|||||||
|
For the Year Ended December 31, 2012
|
||||||||||||||
|
(Dollars in millions)
|
Consumer Loan Assignments
|
Active Dealers (2)
|
||||||||||||
|
Dollar Volume (1)
|
% of Total
|
Number
|
% of Total
|
|||||||||||
|
Michigan
|
$
|
145.7
|
10.7
|
%
|
406
|
7.6
|
%
|
|||||||
|
New York
|
112.4
|
8.2
|
%
|
352
|
6.6
|
%
|
||||||||
|
Texas
|
84.3
|
6.2
|
%
|
376
|
7.1
|
%
|
||||||||
|
Ohio
|
76.0
|
5.6
|
%
|
303
|
5.7
|
%
|
||||||||
|
Pennsylvania
|
73.6
|
5.4
|
%
|
251
|
4.7
|
%
|
||||||||
|
All other states
|
870.4
|
63.9
|
%
|
3,631
|
68.3
|
%
|
||||||||
|
Total
|
$
|
1,362.4
|
100.0
|
%
|
5,319
|
100.0
|
%
|
|||||||
|
For the Year Ended December 31, 2011
|
||||||||||||||
|
(Dollars in millions)
|
Consumer Loan Assignments
|
Active Dealers (2)
|
||||||||||||
|
Dollar Volume (1)
|
% of Total
|
Number
|
% of Total
|
|||||||||||
|
Michigan
|
$
|
135.3
|
10.6
|
%
|
282
|
7.1
|
%
|
|||||||
|
New York
|
98.6
|
7.7
|
%
|
228
|
5.7
|
%
|
||||||||
|
Texas
|
80.9
|
6.3
|
%
|
313
|
7.8
|
%
|
||||||||
|
Ohio
|
73.8
|
5.8
|
%
|
243
|
6.1
|
%
|
||||||||
|
Pennsylvania
|
66.9
|
5.3
|
%
|
184
|
4.6
|
%
|
||||||||
|
All other states
|
819.2
|
64.3
|
%
|
2,748
|
68.7
|
%
|
||||||||
|
Total
|
$
|
1,274.7
|
100.0
|
%
|
3,998
|
100.0
|
%
|
|||||||
|
(1)
|
Represents advances paid to Dealers on Consumer Loans assigned under our Portfolio Program and one-time payments made to Dealers to purchase Consumer Loans assigned under our Purchase Program. Payments of Dealer Holdback and accelerated Dealer Holdback are not included.
|
|
(2)
|
Active Dealers are Dealers who have received funding for at least one Loan during the year.
|
Geographic Financial Information
For the three years ended December 31, 2013, 2012 and 2011, all of our revenues were derived from the United States. As of December 31, 2013 and 2012, all of our long-lived assets were located in the United States.
Regulation
Our business is subject to laws and regulations, including the Truth in Lending Act, the Equal Credit Opportunity Act, the Fair Credit Reporting Act and various other state and federal laws and regulations. These laws and regulations, among other things, require licensing and qualification; limit interest rates, fees and other charges associated with the Consumer Loans assigned to us; require specified disclosures by Dealers to consumers; govern the sale and terms of ancillary products; and define the rights to repossess and sell collateral. Failure to comply with these laws or regulations could have a material adverse effect on us by, among other things, limiting the jurisdictions in which we may operate, restricting our ability to realize the value of the collateral securing the Consumer Loans, making it more costly or burdensome to do business or resulting in potential liability. The volume of new or modified laws and regulations has increased in recent years and has increased significantly in response to issues arising with respect to consumer lending. From time to time, legislation and regulations are enacted which increase the cost of doing business, limit or expand permissible activities or affect the competitive balance among financial services providers. Proposals to change the laws and regulations governing the operations and taxation of financial institutions and financial services providers are frequently made in the U.S. Congress, in the state legislatures and by various regulatory agencies. This legislation may change our operating environment in substantial and unpredictable ways and may have a material adverse effect on our business.
In July 2010 the Dodd-Frank Wall Street Reform and Consumer Protection Act (the “Dodd-Frank Act”) was enacted and a number of its provisions became effective in July 2011. The Dodd-Frank Act restructured and enhanced the regulation and supervision of the financial services industry and created the Consumer Financial Protection Bureau (the “CFPB”). The CFPB has rulemaking and enforcement authority over certain non-depository institutions, including us. The CFPB is specifically authorized, among other things, to take actions to prevent companies providing consumer financial products or services and their service providers from engaging in unfair, deceptive or abusive acts or practices in connection with consumer financial products and services, and to issue rules requiring enhanced disclosures for
consum
er financial products or services. Under the Dodd-Frank Act, the CFPB also may restrict the use of pre-dispute mandatory arbitration clauses in contracts between covered persons and consumers for a consumer financial product or service. The CFPB also has authority to interpret, enforce, and issue regulations implementing enumerated consumer laws, including certain laws that apply to our business. Further, the CFPB has issued rules allowing it to supervise non-depository “larger participants” in certain markets for consumer financial services and products, and may in the future issue rules to supervise non-depository larger participants in the indirect auto lending business, which may include us.
The Dodd-Frank Act and regulations promulgated thereunder, including by the CFPB, are likely to affect our cost of doing business, may limit or expand our permissible activities, may affect the competitive balance within our industry and market areas and could have a material adverse effect on us. For example, on March 21, 2013, the CFPB issued Bulletin 2013-02 addressing Indirect Auto Lending and Compliance with the Equal Credit Opportunity Act, in which the CFPB stated that policies of indirect auto lenders that allow auto dealers to mark up lender-established buy rates and that compensate dealers for those markups in the form of dealer reserve could present a risk that they will result in impermissible pricing disparities on the basis of race, national origin, and potentially other prohibited bases. On November 14, 2013, the CFPB hosted a public forum on indirect auto lending fair lending compliance with the Equal Credit Opportunity Act. Our management continues to assess the Dodd-Frank Act’s probable impact on our business, financial condition and results of operations, and to monitor developments involving the entities charged with promulgating regulations thereunder. However, the ultimate effect of the Dodd-Frank Act on the financial services industry in general, and on us in particular, is uncertain at this time.
In addition, governmental regulations which would deplete the supply of used vehicles, such as environmental protection regulations governing emissions or fuel consumption, could have a material adverse effect on us.
Our Dealers must also comply with credit and trade practice statutes and regulations. Failure of our Dealers to comply with these statutes and regulations could result in consumers having rights of rescission and other remedies that could have a material adverse effect on us.
The sale of vehicle service contracts and GAP product by Dealers in connection with Consumer Loans assigned to us from Dealers is also subject to state laws and regulations. As we are the holder of the Consumer Loans that may, in part, finance these products, some of these state laws and regulations may apply to our servicing and collection of the Consumer Loans. Although these laws and regulations do not significantly affect our business, there can be no assurance that insurance or other regulatory authorities in the jurisdictions in which these products are offered by Dealers will not seek to regulate or restrict the operation of our business in these jurisdictions. Any regulation or restriction of our business in these jurisdictions could materially adversely affect the income received from these products.
We believe that we maintain all material licenses and permits required for our current operations and are in substantial compliance with all applicable laws and regulations. Our agreements with Dealers provide that the Dealer shall indemnify us with respect to any loss or expense we incur as a result of the Dealer’s failure to comply with applicable laws and regulations.
Team Members
Our team members are organized into three operating functions: Originations, Servicing, and Support.
Originations.
The originations function includes team members that are responsible for marketing our programs to prospective Dealers, enrolling new Dealers, and supporting active Dealers. Originations also includes team members responsible for processing new Consumer Loan assignments.
Servicing
. The servicing function includes team members that are responsible for servicing the Consumer Loans. The majority of these team members are responsible for collection activities on delinquent Consumer Loans.
Support
. The support function includes team members that are responsible for information technology, finance, corporate legal, quality assurance, analytics, training & development and human resources activities.
As of December 31, 2013, we had 1,317 full and part-time team members. Our team members have no union affiliations and we believe our relationship with our team members is in good standing. The table below presents team members by operating function:
|
Number of Team Members
|
||||||||||
|
As of December 31,
|
||||||||||
|
Operating Function
|
2013
|
2012
|
2011
|
|||||||
|
Originations
|
376
|
386
|
306
|
|||||||
|
Servicing
|
663
|
622
|
491
|
|||||||
|
Support
|
278
|
256
|
240
|
|||||||
|
Total
|
1,317
|
1,264
|
1,037
|
|||||||
Available Information
Our Internet address is
creditacceptance.com
. We make available, free of charge on the web site, copies of reports we file with or furnish to the Securities and Exchange Commission (“SEC”) as soon as reasonably practicable after we electronically file or furnish such reports.
|
ITEM 1A.
|
RISK
FACTORS
|
Our inability to accurately forecast and estimate the amount and timing of future collections could have a material adverse effect on results of operations.
Substantially all of the Consumer Loans assigned to us are made to individuals with impaired or limited credit histories or higher debt-to-income ratios than are permitted by traditional lenders. Consumer Loans made to these individuals generally entail a higher risk of delinquency, default and repossession and higher losses than loans made to consumers with better credit. Since most of our revenue and cash flows from operations are generated from these Consumer Loans, our ability to accurately forecast Consumer Loan performance is critical to our business and financial results. At the time of assignment, we forecast future expected cash flows from the Consumer Loan. Based on these forecasts, which include estimates for wholesale vehicle prices in the event of vehicle repossession and sale, we make an advance or one-time purchase payment to the related Dealer at a level designed to achieve an acceptable return on capital. We continue to forecast the expected collection rate of each Consumer Loan subsequent to assignment. These forecasts also serve as a critical assumption in our accounting for recognizing finance charge income and determining our allowance for credit losses. Please see the Critical Accounting Estimates – Finance Charge Revenue & Allowance for Credit Losses section in Item 7 of this Form 10-K, which is incorporated herein by reference. If Consumer Loan performance equals or exceeds original expectations, it is likely our target return on capital will be achieved. However, actual cash flows from any individual Consumer Loan are often different than cash flows estimated at the time of assignment. There can be no assurance that our forecasts will be accurate or that Consumer Loan performance will be as expected. Recent economic conditions have made forecasts regarding the performance of Consumer Loans more difficult. In the event that our forecasts are not accurate, our financial position, liquidity and results of operations could be materially adversely affected.
We may be unable to execute our business strategy due to current economic conditions.
Our financial position, liquidity and results of operations depend on management’s ability to execute our business strategy. Key factors involved in the execution of our business strategy include achieving our desired Consumer Loan assignment volume, continued and successful use of CAPS and pricing strategy, the use of effective credit risk management techniques and servicing strategies, continued investment in technology to support operating efficiency and continued access to funding and liquidity sources. Although our pricing strategy is intended to maximize the amount of economic profit we generate, within the confines of capital and infrastructure constraints, there can be no assurance that this strategy will have its intended effect. Please see the Consumer Loan Volume section in Item 7 of this Form 10-K, which is incorporated herein by reference. Our failure or inability to execute any element of our business strategy could materially adversely affect our financial position, liquidity and results of operations.
We may be unable to continue to access or renew funding sources and obtain capital needed to maintain and grow our business.
We use debt financing to fund new Loans and pay Dealer Holdback. We currently utilize the following primary forms of debt financing: (1) a revolving secured line of credit; (2) revolving secured warehouse (“Warehouse”) facilities; (3) asset-backed secured financings (“Term ABS”); and (4) senior notes. We cannot guarantee that the revolving secured line of credit or the Warehouse facilities will continue to be available beyond their current maturity dates, on acceptable terms, or at all, or that we will be able to obtain additional financing on acceptable terms or at all. The availability of additional financing will depend on a variety of factors such as market conditions, the general availability of credit, our financial position, our results of operations, and the capacity for additional borrowing under our existing financing arrangements. If our various financing alternatives were to become limited or unavailable, we may be unable to maintain or grow Consumer Loan volume at the level that we anticipate and our operations could be materially adversely affected.
The terms of our debt limit how we conduct our business.
The agreements that govern our debt contain covenants that restrict our ability to, among other things:
|
·
|
incur and guarantee debt;
|
|
·
|
pay dividends or make other distributions on or redeem or repurchase our stock;
|
|
·
|
make investments or acquisitions;
|
|
·
|
create liens on our assets;
|
|
·
|
sell assets;
|
|
·
|
merge with or into other companies; and
|
|
·
|
enter into transactions with stockholders and other affiliates.
|
Some of our debt agreements also impose requirements that we maintain specified financial measures not in excess of, or not below, specified levels. In particular, our revolving credit facility requires, among other things, that we maintain (i) as of the end of each fiscal quarter, a ratio of consolidated funded debt to consolidated tangible net worth at or below a specified maximum; (ii) as of the end of each fiscal quarter calculated for the two fiscal quarters then ending, consolidated net income of not less than a specified minimum; and (iii) as of the end of each fiscal quarter, a ratio of consolidated income available for fixed charges for the period of four consecutive fiscal quarters most recently ended to consolidated fixed charges for that period of not less than a specified minimum. These covenants limit the manner in which we can conduct our business and could prevent us from engaging in favorable business activities or financing future operations and capital needs and impair our ability to successfully execute our strategy and operate our business.
A breach of any of the covenants in our debt instruments would result in an event of default thereunder if not promptly cured or waived. Any continuing default would permit the creditors to accelerate the related debt, which could also result in the acceleration of other debt containing a cross-acceleration or cross-default provision. In addition, an event of default under our revolving credit facility would permit the lenders thereunder to terminate all commitments to extend further credit under our revolving credit facility. Furthermore, if we were unable to repay the amounts due and payable under our revolving credit facility or other secured debt, the lenders thereunder could cause the collateral agent to proceed against the collateral securing that debt. In the event our creditors accelerate the repayment of our debt, there can be no assurance that we would have sufficient assets to repay that debt, and our financial condition, liquidity and results of operations would suffer.
A violation of the terms of our Term ABS facilities or Warehouse facilities could have a materially adverse impact on our operations.
Under our Term ABS facilities and our Warehouse facilities, (1) we have various obligations and covenants as servicer and custodian of the Consumer Loans contributed thereto and in our individual capacity and (2) the special purpose subsidiaries to which we contribute Consumer Loans have various obligations and covenants. A violation of any of these obligations or covenants by us or the special purpose subsidiaries, respectively, may result in our being unable to obtain additional funding under our Warehouse facilities, the termination of our servicing rights and the loss of servicing fees, and may result in amounts outstanding under our Term ABS financings and our Warehouse facilities becoming immediately due and payable. In addition, the violation of any financial covenant under our revolving secured line of credit facility is an event of default or termination event under the Term ABS facilities and our Warehouse facilities. The lack of availability from any or all of these Term ABS facilities and Warehouse facilities may have a material adverse effect on our financial position, liquidity, and results of operations.
The conditions of the U.S. and international capital markets may adversely affect lenders with which we have relationships, causing us to incur additional costs and reducing our sources of liquidity, which may adversely affect our financial position, liquidity and results of operations.
In recent years, there has been turbulence in the global capital markets and the overall economy. Such turbulence can result in disruptions in the financial sector and affect lenders with which we have relationships. Disruptions in the financial sector may increase our exposure to credit risk and adversely affect the ability of lenders to perform under the terms of their lending arrangements with us. Failure by our lenders to perform under the terms of our lending arrangements could cause us to incur additional costs that may adversely affect our liquidity, financial condition and results of operations. While overall market conditions have improved, there can be no assurance that future disruptions in the financial sector will not occur that could have similar adverse effects on our business.
Our substantial debt could negatively impact our business, prevent us from satisfying our debt obligations and adversely affect our financial condition.
We have a substantial amount of debt. The substantial amount of our debt could have important consequences, including the following:
|
·
|
our ability to obtain additional financing for Consumer Loan assignments, working capital, debt refinancing or other purposes could be impaired;
|
|
·
|
a substantial portion of our cash flows from operations will be dedicated to paying principal and interest on our debt, reducing funds available for other purposes;
|
|
·
|
we may be vulnerable to interest rate increases, as some of our borrowings, including those under our revolving credit facility, bear interest at variable rates;
|
|
·
|
we could be more vulnerable to adverse developments in our industry or in general economic conditions;
|
|
·
|
we may be restricted from taking advantage of business opportunities or making strategic acquisitions; and
|
|
·
|
we may be limited in our flexibility in planning for, or reacting to, changes in our business and the industries in which we operate.
|
Due to competition from traditional financing sources and non-traditional lenders, we may not be able to compete successfully.
The automobile finance market for consumers who do not qualify for conventional automobile financing is large and highly competitive. The market is served by a variety of companies including "buy here, pay here" dealerships. The market is also currently served by banks, captive finance affiliates of automobile manufacturers, credit unions and independent finance companies both publicly and privately owned. Many of these companies are much larger and have greater financial resources than are available to us, and many have long standing relationships with automobile dealerships. Providers of automobile financing have traditionally competed based on the interest rate charged, the quality of credit accepted, the flexibility of loan terms offered and the quality of service provided to dealers and consumers. Due to increasing competition in the automobile finance market, the average loan volume per our active Dealers declined 11.5% for the year ended December 31, 2013. During 2012, we also increased the advance rate on Dealer Loans as a result of increased competition. We may be unable to compete successfully in the automobile finance market or, due to the intense competition in this market, our results of operations, cash flows and financial condition may be adversely affected as we adjust our business in response to competitive pressures. Increasing advance rates on Dealer Loans has the impact of reducing the return on capital we expect to earn on Loans. Additionally, if we are unsuccessful in maintaining and expanding our relationships with Dealers, we may be unable to accept Consumer Loans in the volume and on the terms that we anticipate.
We may not be able to generate sufficient cash flows to service our outstanding debt and fund operations and may be forced to take other actions to satisfy our obligations under such debt.
Our ability to make payments of principal and interest on indebtedness will depend in part on our cash flows from operations, which are subject to economic, financial, competitive and other factors beyond our control. We cannot assure you that we will maintain a level of cash flows from operations sufficient to permit us to meet our debt service obligations. If we are unable to generate sufficient cash flows from operations to service our debt, we may be required to sell assets, refinance all or a portion of our existing debt or obtain additional financing. There can be no assurance that any refinancing will be possible or that any asset sales or additional financing can be completed on acceptable terms or at all.
Interest rate fluctuations may adversely affect our borrowing costs, profitability and liquidity.
Our profitability may be directly affected by the level of and fluctuations in interest rates, whether caused by changes in economic conditions or other factors, which affect our borrowing costs. Our profitability and liquidity could be materially adversely affected during any period of higher interest rates. We monitor the interest rate environment and employ strategies designed to mitigate the impact of increases in interest rates. We can provide no assurance, however, that our strategies will mitigate the impact of increases in interest rates.
Reduction in our credit rating could increase the cost of our funding from, and restrict our access to, the capital markets and adversely affect our liquidity, financial condition and results of operations.
Credit rating agencies evaluate us, and their ratings of our debt and creditworthiness are based on a number of factors. These factors include our financial strength and other factors not entirely within our control, including conditions affecting the financial services industry generally. In light of the difficulties that faced the financial services industry and the financial markets in recent years, there can be no assurance that we will maintain our current ratings. Failure to maintain those ratings could, among other things, adversely limit our access to the capital markets and affect the cost and other terms upon which we are able to obtain financing.
We may incur substantially more debt and other liabilities. This could exacerbate further the risks associated with our current debt levels.
We may be able to incur substantial additional debt in the future. Although the terms of our debt instruments contain restrictions on our ability to incur additional debt, these restrictions are subject to exemptions that could permit us to incur a substantial amount of additional debt. In addition, our debt instruments do not prevent us from incurring liabilities that do not constitute indebtedness as defined for purposes of those debt instruments. If new debt or other liabilities are added to our current debt levels, the risks associated with our having substantial debt could intensify.
The regulation to which we are or may become subject could result in a material adverse effect on our business.
Reference should be made to Item 1. Business “Regulation” for a discussion of regulatory risk factors.
Adverse changes in economic conditions, the automobile or finance industries, or the non-prime consumer market could adversely affect our financial position, liquidity and results of operations, the ability of key vendors that we depend on to supply us with services, and our ability to enter into future financing transactions.
We are subject to general economic conditions which are beyond our control. During periods of economic slowdown or recession, delinquencies, defaults, repossessions and losses may increase on our Consumer Loans and Consumer Loan prepayments may decline. These periods are also typically accompanied by decreased consumer demand for automobiles and declining values of automobiles securing outstanding Consumer Loans, which weakens collateral coverage and increases the amount of a loss in the event of default. Significant increases in the inventory of used automobiles during periods of economic recession may also depress the prices at which repossessed automobiles may be sold or delay the timing of these sales. Additionally, higher gasoline prices, declining stock market values, unstable real estate values, resets of adjustable rate mortgages to higher interest rates, increasing unemployment levels, general availability of consumer credit or other factors that impact consumer confidence or disposable income could increase loss frequency and decrease consumer demand for automobiles as well as weaken collateral values of automobiles. Because our business is focused on consumers who do not qualify for conventional automobile financing, the actual rates of delinquencies, defaults, repossessions and losses on these Consumer Loans could be higher than that of those experienced in the general automobile finance industry, and could be more dramatically affected by a general economic downturn.
We rely on Dealers to originate Consumer Loans for assignment under our programs. High levels of Dealer attrition, due to a general economic downturn or otherwise, could materially adversely affect our operations. In addition, we rely on vendors to provide us with services we need to operate our business. Any disruption in our operations due to the untimely or discontinued supply of these services could substantially adversely affect our operations. Finally, during an economic slowdown or recession, our servicing costs may increase without a corresponding increase in finance charge revenue. Any sustained period of increased delinquencies, defaults, repossessions or losses or increased servicing costs could also materially adversely affect our financial position, liquidity and results of operations and our ability to enter into future financing transactions.
Litigation we are involved in from time to time may adversely affect our financial condition, results of operations and cash flows.
As a result of the consumer-oriented nature of the industry in which we operate and uncertainties with respect to the application of various laws and regulations in some circumstances, we are subject to various consumer claims and litigation seeking damages and statutory penalties, based upon, among other things, usury, disclosure inaccuracies, wrongful repossession, violations of bankruptcy stay provisions, certificate of title disputes, fraud and breach of contract. As the assignee of Consumer Loans originated by Dealers, we may also be named as a co-defendant in lawsuits filed by consumers principally against Dealers. We may also have disputes and litigation with Dealers. The claims may allege, among other theories of liability, that we breached our Dealer servicing agreement. The damages and penalties that may be claimed by consumers or Dealers in these types of matters can be substantial. The relief requested by plaintiffs varies but may include requests for compensatory, statutory and punitive damages, and plaintiffs may seek treatment as purported class actions. A significant judgment against us in connection with any litigation or arbitration could have a material adverse effect on our financial position, liquidity and results of operations.
Changes in tax laws and the resolution of uncertain income tax matters could have a material adverse effect on our results of operations and cash flows from operations.
We are subject to income tax in many of the various jurisdictions in which we operate. Increases in statutory income tax rates and other adverse changes in applicable law in these jurisdictions could have an adverse effect on our results of operations. In the ordinary course of business, there are transactions and calculations where the ultimate tax determination is uncertain. At any one time, multiple tax years are subject to audit by various taxing jurisdictions. We provide reserves for potential payments of tax to various tax authorities related to
uncertain
tax
positions. Please see the Critical Accounting Estimates – Uncertain Tax Positions section in Item 7 of this Form 10-K, which is incorporated herein by reference. We adjust these liabilities as a result of changing facts and circumstances; however, due to the complexity of some of these uncertainties, the ultimate resolution may result in a payment that is materially different from our current estimate of the tax liabilities. Such payments could have a material adverse effect on our results of operations and cash flows from operations.
Our dependence on technology could have a material adverse effect on our business.
All Consumer Loans submitted to us for assignment are processed through our internet-based CAPS application, which enables our Dealers to interact with our proprietary credit scoring system. Our Consumer Loan servicing platform is also technology based. We rely on these systems to record and process significant amounts of data quickly and accurately and believe that these systems provide us with a competitive advantage. All of these systems are dependent upon computer and telecommunications equipment, software systems and Internet access. The temporary or permanent loss of any components of these systems through hardware failures, software errors, operating malfunctions, the vulnerability of the Internet or otherwise could interrupt our business operations, harm our business and adversely affect our competitive advantage. In addition, our competitors could create or acquire systems similar to ours, which would adversely affect our competitive advantage.
Our systems, and the equipment, software and Internet access on which they depend, may be subject to cyber attacks, security breaches and other cybersecurity incidents. Although the cybersecurity incidents we have experienced to date have not had a material effect on our business, financial condition or results of operations, there can be no assurance that cybersecurity incidents will not have a material adverse effect on us in the future.
We rely on a variety of measures to protect our technology and proprietary information, including copyrights, trade secrets and patents. However, these measures may not prevent misappropriation or infringement of our intellectual property or proprietary information, which would adversely affect us. In addition, our competitors or other third parties may allege that our systems, processes or technologies infringe their intellectual property rights.
Our ability to integrate computer and telecommunications technologies into our business is essential to our success. Computer and telecommunications technologies are evolving rapidly and are characterized by short product life cycles. We may not be successful in anticipating, managing or adopting technological changes on a timely basis. While we believe that our existing information systems are sufficient to meet our current demands and continued expansion, our future growth may require additional investment in these systems. We cannot assure that adequate capital resources will be available to us at the appropriate time.
Reliance on third parties to administer our ancillary product offerings could adversely affect our business and financial results.
We have relationships with TPPs to administer vehicle service contract and GAP products underwritten by third party insurers and financed by us. We depend on these TPPs to evaluate and pay claims in an accurate and timely manner. We also have relationships with TPPs to sell and administer GPS-SID. If our relationships with these TPPs were modified, disrupted, or terminated, we would need to obtain these services from an alternative administrator or provide them using our internal resources. We may be unable to replace these TPPs with a suitable alternative in a timely and efficient manner on terms we consider acceptable, or at all. In the event we were unable to effectively administer our ancillary products offerings, we may need to eliminate or suspend our ancillary product offerings from our future business, we may experience a decline in the performance of our Consumer Loans, our reputation in the marketplace could be undermined, and our financial position, liquidity and results of operations could be adversely affected.
We are dependent on our senior management and the loss of any of these individuals or an inability to hire additional team members could adversely affect our ability to operate profitably.
Our senior management average over 12 years of experience with us. Our success is dependent upon the management and the leadership skills of this team. In addition, competition from other companies to hire our team members possessing the necessary skills and experience required could contribute to an increase in team member turnover. The loss of any of these individuals or an inability to attract and retain additional qualified team members could adversely affect us. There can be no assurance that we will be able to retain our existing senior management or attract additional qualified team members.
Our reputation is a key asset to our business, and our business may be affected by how we are perceived in the marketplace.
Our reputation is a key asset to our business. Our ability to attract consumers through our Dealers is highly dependent upon external perceptions of our level of service, trustworthiness, business practices and financial condition. Negative publicity regarding these matters could damage our reputation among existing and potential consumers and Dealers, which could make it difficult for us to attract new consumers and Dealers and maintain existing Dealers. Adverse developments with respect to our industry may also, by association, negatively impact our reputation or result in greater regulatory or legislative scrutiny or litigation against us.
The concentration of our Dealers in several states could adversely affect us.
Dealers are located throughout the United States. During the year ended December 31, 2013, our five largest states (measured by advances paid to Dealers on Consumer Loans assigned under our Portfolio Program and one-time payments made to Dealers to purchase Consumer Loans assigned under our Purchase Program) contained 31.6% of our Dealers. While we believe we have a diverse geographic presence, for the near term, we expect that significant amounts of Consumer Loan assignments will continue to be generated by Dealers in these five states due to the number of Dealers in these states and currently prevailing economic, demographic, regulatory, competitive and other conditions in these states. Changes to conditions in these states could lead to an increase in Dealer attrition or a reduction in demand for our service that could materially adversely affect our financial position, liquidity and results of operations.
Failure to properly safeguard confidential consumer information could subject us to liability, decrease our profitability and damage our reputation.
In the ordinary course of our business, we collect and store sensitive data, including our proprietary business information and personally identifiable information of our customers and employees, on our computer networks. The secure processing, maintenance and transmission of this information is critical to our operations and business strategy.
If third parties or our team members are able to breach our network security, the network security of a third party that we share information with or otherwise misappropriate our customers’ personal information, or if we give third parties or our team members improper access to our customers’ personal information, we could be subject to liability. This liability could include identity theft or other similar fraud-related claims. This liability could also include claims for other misuses or losses of personal information, including for unauthorized marketing purposes. Other liabilities could include claims alleging misrepresentation of our privacy and data security practices.
We rely on encryption and authentication technology licensed from third parties to provide the security and authentication necessary to secure online transmission of confidential consumer information. Advances in computer capabilities, new discoveries in the field of cryptography or other events or developments may result in a compromise or breach of the algorithms that we use to protect sensitive customer transaction data. A party who is able to circumvent our security measures could misappropriate proprietary information or cause interruptions in our operations. We may be required to expend capital and other resources to protect against, or alleviate problems caused by, security breaches or other cybersecurity incidents. Although we have experienced cybersecurity incidents from time to time that have not had a material effect on our business, financial condition or results of operations, there can be no assurance that a cyber attack, security breach or other cybersecurity incident will not have a material adverse effect on us in the future. Our security measures are designed to protect against security breaches, but our failure to prevent security breaches could subject us to liability, decrease our profitability and damage our reputation.
A small number of our shareholders have the ability to significantly influence matters requiring shareholder approval and such shareholders have interests which may conflict with the interests of our other security holders.
As of December 31, 2013, based on filings made with the SEC and other information made available to us, our Chairman and founder beneficially owned 19.0% of our common stock, his former spouse and their daughter beneficially owned 10.9% and 24.5%, respectively, of our common stock, and Prescott General Partners, LLC and its affiliates beneficially owned 14.2% of our common stock. As a result, these few shareholders are able to significantly influence matters presented to shareholders, including the election and removal of directors, the approval of significant corporate transactions, such as any reclassification, reorganization, merger, consolidation or sale of all or substantially all of our assets, and the control of our management and affairs, including executive compensation arrangements. Their interests may conflict with the interests of our other security holders.
Reliance on our outsourced business functions could adversely affect our business.
We outsource certain business functions to third party service providers, which increases our operational complexity and decreases our control. We rely on these service providers to provide a high level of service and support, which subjects us to risks associated with inadequate or untimely service. In addition, if these outsourcing arrangements were not renewed or were terminated or the services provided to us were otherwise disrupted, we would have to obtain these services from an alternative provider or provide them using our internal resources. We may be unable to replace, or be delayed in replacing these sources and there is a risk that we would be unable to enter into a similar agreement with an alternate provider on terms that we consider favorable or in a timely manner. In the future, we may outsource additional business functions. If any of these or other risks related to outsourcing were realized, our financial position, liquidity and results of operations could be adversely affected.
Natural disasters, acts of war, terrorist attacks and threats or the escalation of military activity in response to these attacks or otherwise may negatively affect our business, financial condition and results of operations.
Natural disasters, acts of war, terrorist attacks and the escalation of military activity in response to these attacks or otherwise may have negative and significant effects, such as imposition of increased security measures, changes in applicable laws, market disruptions and job losses. These events may have an adverse effect on the economy in general. Moreover, the potential for future terrorist attacks and the national and international responses to these threats could affect the business in ways that cannot be predicted. The effect of any of these events or threats could have a material adverse effect on our business, financial condition and results of operations.
|
|
|
ITEM 1B.
|
UNRESOLVED
STAFF COMMENTS
|
None.
Our headquarters is located at 25505 West Twelve Mile Road, Southfield, Michigan 48034. We purchased the office building in 1993 and have a mortgage loan from a commercial bank that is secured by a first mortgage lien on the property. The office building includes approximately 136,000 square feet of space on five floors. We occupy approximately 125,000 square feet of the building, with most of the remainder of the building leased to various tenants.
We lease approximately 52,000 square feet of office space in Southfield, Michigan and approximately 31,000 square feet of office space in Henderson, Nevada. The multiple leases for the Southfield, Michigan space expire in September 2018, April 2019 and July 2019. The lease for the Henderson, Nevada space expires in December 2017.
In the normal course of business and as a result of the consumer-oriented nature of the industry in which we operate, industry participants are frequently subject to various consumer claims and litigation seeking damages and statutory penalties. The claims allege, among other theories of liability, violations of state, federal and foreign truth-in-lending, credit availability, credit reporting, consumer protection, warranty, debt collection, insurance and other consumer-oriented laws and regulations, including claims seeking damages for physical and mental damages relating to our repossession and sale of the consumer’s vehicle and other debt collection activities. As the assignee of Consumer Loans originated by Dealers, we may also be named as a co-defendant in lawsuits filed by consumers principally against Dealers. We may also have disputes and litigation with Dealers. The claims may allege, among other theories of liability, that we breached our Dealer servicing agreement. The damages and penalties that may be claimed by consumers or Dealers in these types of matters can be substantial. The relief requested by plaintiffs varies but may include requests for compensatory, statutory and punitive damages, and plaintiffs may seek treatment as purported class actions. A significant judgment against us in connection with any litigation or arbitration could have a material adverse effect on our financial position, liquidity and results of operations.
For a description of significant litigation to which we are a party, see Note 17 to the consolidated financial statements contained in Item 8 of this Form 10-K, which is incorporated herein by reference.
Not applicable.
|
MARKET FOR REGISTRANT’S COMMON EQUITY, RELATED STOCKHOLDER MATTERS AND ISSUER PURCHASES OF EQUITY SECURITIES
|
Stock Price
During the year ended December 31, 2013 our common stock was traded on The Nasdaq Global Market® (“Nasdaq”) under the symbol “CACC”. The following table sets forth the high and low sale prices as reported by the Nasdaq for the common stock for the relevant periods during 2013, 2012 and 2011.
|
2013
|
2012
|
2011
|
||||||||||||||||||
|
Quarters Ended
|
High
|
Low
|
High
|
Low
|
High
|
Low
|
||||||||||||||
|
March 31
|
$
|
128.90
|
$
|
95.54
|
$
|
107.09
|
$
|
76.95
|
$
|
72.55
|
$
|
53.04
|
||||||||
|
June 30
|
121.85
|
95.71
|
101.81
|
80.00
|
84.50
|
71.00
|
||||||||||||||
|
September 30
|
115.65
|
101.26
|
104.97
|
83.82
|
86.87
|
56.55
|
||||||||||||||
|
December 31
|
132.20
|
107.25
|
102.58
|
80.40
|
93.10
|
60.09
|
||||||||||||||
As of February 7, 2014, we had 155 shareholders of record and approximately 5,600 beneficial holders of our common stock based upon securities position listings furnished to us.
Dividends
We have not paid any cash dividends during the periods presented. Our debt agreements contain financial covenants which may indirectly limit the payment of dividends on common stock.
Stock Performance Graph
The following graph compares the percentage change in the cumulative total shareholder return on our common stock during the period beginning January 1, 2009 and ending on December 31, 2013 with the cumulative total return on the Nasdaq Market Index and a peer group index based upon approximately 100 companies included in the Dow Jones – US General Financial Index. The comparison assumes that $100 was invested on January 1, 2009 in our common stock and in the foregoing indices and assumes the reinvestment of dividends.
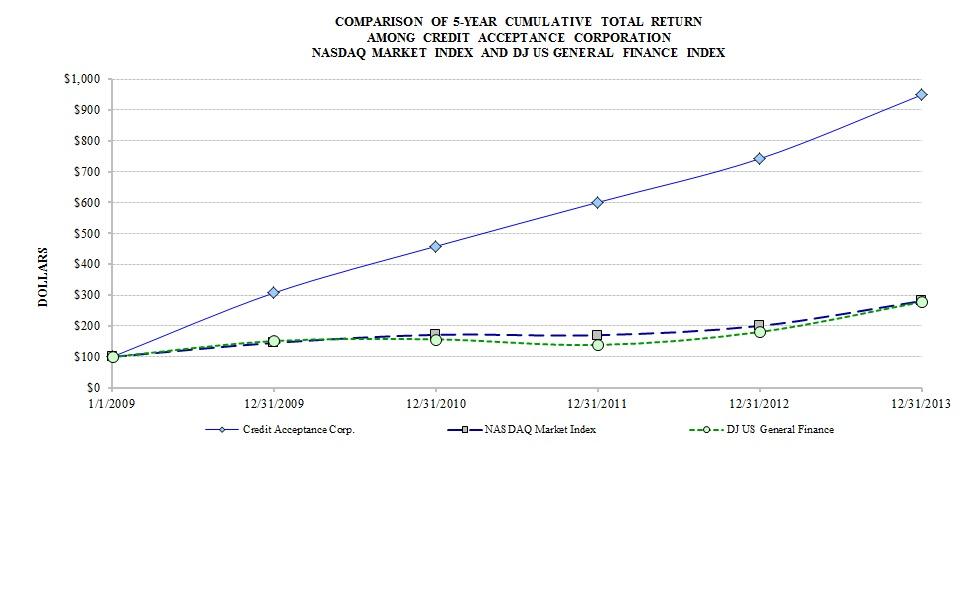
Stock Repurchases
On August 5, 1999, our board of directors approved a stock repurchase program which authorizes us to repurchase common shares in the open market or in privately negotiated transactions at price levels we deem attractive. On March 7, 2013, the board of directors authorized the repurchase of up to one million shares of our common stock in addition to the board’s prior authorizations. As of December 31, 2013, we had authorization to repurchase 324,456 shares of our common stock.
The following table summarizes our stock repurchases for the three months ended December 31, 2013:
|
Period
|
Total Number of Shares Purchased
|
Average Price Paid per Share
|
Total Number of Shares Purchased as Part of Publicly Announced Plans or Programs
|
Maximum Number of Shares that May Yet Be Purchased Under the Plans or Programs
|
|||||||||
|
October 1 through October 31, 2013
|
48,229
|
$
|
110.11
|
48,229
|
346,541
|
||||||||
|
November 1 through November 30, 2013
|
22,085
|
120.48
|
22,085
|
324,456
|
|||||||||
|
December 1 through December 31, 2013
|
–
|
–
|
–
|
324,456
|
|||||||||
|
70,314
|
$
|
113.37
|
70,314
|
||||||||||
The selected income statement and balance sheet data presented below are derived from our audited consolidated financial statements and should be read in conjunction with our consolidated financial statements as of and for the years ended December 31, 2013, 2012 and 2011, and notes thereto and Item 7. Management's Discussion and Analysis of Financial Condition and Results of Operations, included elsewhere in this Form 10-K, which is incorporated herein by reference.
|
(In millions, except share and per share data)
|
Years Ended December 31,
|
|||||||||||||||
|
2013
|
2012
|
2011
|
2010
|
2009
|
||||||||||||
|
Income Statement Data:
|
||||||||||||||||
|
Revenue
|
$
|
682.1
|
$
|
609.2
|
$
|
525.2
|
$
|
442.1
|
$
|
380.7
|
||||||
|
Costs and expenses:
|
||||||||||||||||
|
Salaries and wages
|
87.3
|
82.2
|
63.0
|
61.3
|
66.9
|
|||||||||||
|
General and administrative
|
34.4
|
30.5
|
25.6
|
26.4
|
30.4
|
|||||||||||
|
Sales and marketing
|
34.5
|
31.2
|
23.6
|
19.7
|
14.8
|
|||||||||||
|
Provision for credit losses
|
21.9
|
24.0
|
29.0
|
10.0
|
(12.2
|
)
|
||||||||||
|
Interest
|
65.0
|
63.4
|
57.2
|
47.8
|
32.4
|
|||||||||||
|
Provision for claims
|
40.8
|
34.8
|
30.4
|
23.4
|
19.3
|
|||||||||||
|
Total costs and expenses
|
283.9
|
266.1
|
228.8
|
188.6
|
151.6
|
|||||||||||
|
Income from continuing operations before provision for income taxes
|
398.2
|
343.1
|
296.4
|
253.5
|
229.1
|
|||||||||||
|
Provision for income taxes
|
145.1
|
123.4
|
108.4
|
83.4
|
83.0
|
|||||||||||
|
Income from continuing operations
|
253.1
|
219.7
|
188.0
|
170.1
|
146.1
|
|||||||||||
|
Gain from discontinued operations
|
–
|
–
|
–
|
–
|
0.2
|
|||||||||||
|
Net income
|
$
|
253.1
|
$
|
219.7
|
$
|
188.0
|
$
|
170.1
|
$
|
146.3
|
||||||
|
Net income per share:
|
||||||||||||||||
|
Basic
|
$
|
10.61
|
$
|
8.65
|
$
|
7.15
|
$
|
5.79
|
$
|
4.78
|
||||||
|
Diluted
|
$
|
10.54
|
$
|
8.58
|
$
|
7.07
|
$
|
5.67
|
$
|
4.62
|
||||||
|
Income from continuing operations per share:
|
||||||||||||||||
|
Basic
|
$
|
10.61
|
$
|
8.65
|
$
|
7.15
|
$
|
5.79
|
$
|
4.77
|
||||||
|
Diluted
|
$
|
10.54
|
$
|
8.58
|
$
|
7.07
|
$
|
5.67
|
$
|
4.61
|
||||||
|
Gain from discontinued operations per share:
|
||||||||||||||||
|
Basic
|
$
|
–
|
$
|
–
|
$
|
–
|
$
|
–
|
$
|
0.01
|
||||||
|
Diluted
|
$
|
–
|
$
|
–
|
$
|
–
|
$
|
–
|
$
|
0.01
|
||||||
|
Weighted average shares outstanding:
|
||||||||||||||||
|
Basic
|
23,850,789
|
25,409,655
|
26,302,289
|
29,393,309
|
30,590,142
|
|||||||||||
|
Diluted
|
24,009,593
|
25,598,956
|
26,600,855
|
29,984,819
|
31,668,895
|
|||||||||||
|
Balance Sheet Data:
|
||||||||||||||||
|
Loans receivable, net
|
$
|
2,212.8
|
$
|
1,933.5
|
$
|
1,598.6
|
$
|
1,218.0
|
$
|
1,050.0
|
||||||
|
All other assets
|
220.6
|
199.7
|
160.0
|
125.5
|
126.2
|
|||||||||||
|
Total assets
|
$
|
2,433.4
|
$
|
2,133.2
|
$
|
1,758.6
|
$
|
1,343.5
|
$
|
1,176.2
|
||||||
|
Total debt
|
$
|
1,392.4
|
$
|
1,250.8
|
$
|
997.9
|
$
|
685.6
|
$
|
507.0
|
||||||
|
Other liabilities
|
290.9
|
260.5
|
220.7
|
183.4
|
171.0
|
|||||||||||
|
Total liabilities
|
1,683.3
|
1,511.3
|
1,218.6
|
869.0
|
678.0
|
|||||||||||
|
Shareholders' equity (A)
|
750.1
|
621.9
|
540.0
|
474.5
|
498.2
|
|||||||||||
|
Total liabilities and shareholders' equity
|
$
|
2,433.4
|
$
|
2,133.2
|
$
|
1,758.6
|
$
|
1,343.5
|
$
|
1,176.2
|
||||||
|
(A)
|
No dividends were paid during the periods presented.
|
The following discussion and analysis should be read in conjunction with the consolidated financial statements and related notes contained in Item 8 of this Form 10-K, which is incorporated herein by reference.
Overview
We offer automobile dealers financing programs that enable them to sell vehicles to consumers regardless of their credit history. Our financing programs are offered through a nationwide network of automobile dealers who benefit from sales of vehicles to consumers who otherwise could not obtain financing; from repeat and referral sales generated by these same customers; and from sales to customers responding to advertisements for our product, but who actually end up qualifying for traditional financing.
For the year ended December 31, 2013, consolidated net income was $253.1 million, or $10.54 per diluted share, compared to $219.7 million, or $8.58 per diluted share, for the same period in 2012 and $188.0 million, or $7.07 per diluted share, for the same period in 2011. The growth in 2013 and 2012 consolidated net income was primarily due to an increase in the average balance of our Loan portfolio.
Critical Success Factors
Critical success factors include our ability to accurately forecast Consumer Loan performance, access capital on acceptable terms, and maintain or grow Consumer Loan volume at the level and on the terms that we anticipate, with an objective to maximize economic profit. Economic profit is a financial metric we use to evaluate our financial results and determine incentive compensation. Economic profit measures how efficiently we utilize our total capital, both debt and equity, and is a function of the return on capital in excess of the cost of capital and the amount of capital invested in the business.
Consumer Loan Performance
At the time a Consumer Loan is submitted to us for assignment, we forecast future expected cash flows from the Consumer Loan. Based on the amount and timing of these forecasts and expected expense levels, an advance or one-time purchase payment is made to the related Dealer at a price designed to achieve an acceptable return on capital. If Consumer Loan performance equals or exceeds our initial expectation, it is likely our target return on capital will be achieved.
We use a statistical model to estimate the expected collection rate for each Consumer Loan at the time of assignment. We continue to evaluate the expected collection rate of each Consumer Loan subsequent to assignment. Our evaluation becomes more accurate as the Consumer Loans age, as we use actual performance data in our forecast. By comparing our current expected collection rate for each Consumer Loan with the rate we projected at the time of assignment, we are able to assess the accuracy of our initial forecast. The following table compares our forecast of Consumer Loan collection rates as of December 31, 2013, with the forecasts as of December 31, 2012, as of December 31, 2011, and at the time of assignment, segmented by year of assignment:
|
Forecasted Collection Percentage as of
|
Variance in Forecasted Collection
Percentage from
|
|||||||||||||||||||||
|
Consumer Loan Assignment Year
|
December 31, 2013
|
December 31, 2012
|
December 31, 2011
|
Initial
Forecast
|
December 31, 2012
|
December 31, 2011
|
Initial
Forecast
|
|||||||||||||||
|
2004
|
73.0
|
%
|
73.0
|
%
|
73.0
|
%
|
73.0
|
%
|
0.0
|
%
|
0.0
|
%
|
0.0
|
%
|
||||||||
|
2005
|
73.7
|
%
|
73.6
|
%
|
73.6
|
%
|
74.0
|
%
|
0.1
|
%
|
0.1
|
%
|
-0.3
|
%
|
||||||||
|
2006
|
70.0
|
%
|
69.9
|
%
|
70.0
|
%
|
71.4
|
%
|
0.1
|
%
|
0.0
|
%
|
-1.4
|
%
|
||||||||
|
2007
|
67.9
|
%
|
68.0
|
%
|
68.1
|
%
|
70.7
|
%
|
-0.1
|
%
|
-0.2
|
%
|
-2.8
|
%
|
||||||||
|
2008
|
70.1
|
%
|
70.3
|
%
|
70.0
|
%
|
69.7
|
%
|
-0.2
|
%
|
0.1
|
%
|
0.4
|
%
|
||||||||
|
2009
|
79.2
|
%
|
79.5
|
%
|
79.4
|
%
|
71.9
|
%
|
-0.3
|
%
|
-0.2
|
%
|
7.3
|
%
|
||||||||
|
2010
|
77.0
|
%
|
77.3
|
%
|
76.8
|
%
|
73.6
|
%
|
-0.3
|
%
|
0.2
|
%
|
3.4
|
%
|
||||||||
|
2011
|
74.1
|
%
|
74.1
|
%
|
73.2
|
%
|
72.5
|
%
|
0.0
|
%
|
0.9
|
%
|
1.6
|
%
|
||||||||
|
2012
|
73.5
|
%
|
72.2
|
%
|
–
|
71.4
|
%
|
1.3
|
%
|
–
|
2.1
|
%
|
||||||||||
|
2013
|
73.3
|
%
|
–
|
–
|
72.0
|
%
|
–
|
–
|
1.3
|
%
|
||||||||||||
Consumer Loans assigned in 2009 through 2013 have yielded forecasted collection results materially better than our initial estimates, while Consumer Loans assigned in 2006 and 2007 have yielded forecasted collection results materially worse than our initial estimates. For all other assignment years presented, actual results have been very close to our initial estimates.
For the year ended December 31, 2013, forecasted collection rates improved for Consumer Loans assigned in 2012 and 2013 , declined for Consumer Loans assigned in 2008 through 2010 and were generally consistent with expectations at the start of the period for all other assignment years presented. During the second quarter of 2013, we implemented an enhanced forecasting methodology that contributed to these collection rate variances.
Forecasting collection rates accurately at Loan inception is difficult. With this in mind, we establish advance rates that are intended to allow us to achieve acceptable levels of profitability, even if collection rates are less than we currently forecast.
The following table presents forecasted Consumer Loan collection rates, advance rates, the spread (the forecasted collection rate less the advance rate), and the percentage of the forecasted collections that had been realized as of December 31, 2013. All amounts, unless otherwise noted, are presented as a percentage of the initial balance of the Consumer Loan (principal + interest). The table includes both Dealer Loans and Purchased Loans.
|
As of December 31, 2013
|
||||||||||||||||
|
Consumer Loan Assignment Year
|
Forecasted
Collection % |
Advance % (1)
|
Spread %
|
% of Forecast
Realized (2)
|
||||||||||||
|
2004
|
73.0
|
%
|
44.0
|
%
|
29.0
|
%
|
99.9
|
%
|
||||||||
|
2005
|
73.7
|
%
|
46.9
|
%
|
26.8
|
%
|
99.7
|
%
|
||||||||
|
2006
|
70.0
|
%
|
46.6
|
%
|
23.4
|
%
|
99.3
|
%
|
||||||||
|
2007
|
67.9
|
%
|
46.5
|
%
|
21.4
|
%
|
98.8
|
%
|
||||||||
|
2008
|
70.1
|
%
|
44.6
|
%
|
25.5
|
%
|
98.4
|
%
|
||||||||
|
2009
|
79.2
|
%
|
43.9
|
%
|
35.3
|
%
|
98.3
|
%
|
||||||||
|
2010
|
77.0
|
%
|
44.7
|
%
|
32.3
|
%
|
93.0
|
%
|
||||||||
|
2011
|
74.1
|
%
|
45.5
|
%
|
28.6
|
%
|
76.1
|
%
|
||||||||
|
2012
|
73.5
|
%
|
46.3
|
%
|
27.2
|
%
|
50.8
|
%
|
||||||||
|
2013
|
73.3
|
%
|
47.6
|
%
|
25.7
|
%
|
17.1
|
%
|
||||||||
|
(1)
|
Represents advances paid to Dealers on Consumer Loans assigned under our Portfolio Program and one-time payments made to Dealers to purchase Consumer Loans assigned under our Purchase Program as a percentage of the initial balance of the Consumer Loans. Payments of Dealer Holdback and accelerated Dealer Holdback are not included.
|
|
(2)
|
Presented as a percentage of total forecasted collections.
|
The risk of a material change in our forecasted collection rate declines as the Consumer Loans age. For 2010 and prior Consumer Loan assignments, the risk of a material forecast variance is modest, as we have currently realized in excess of 90% of the expected collections. Conversely, the forecasted collection rates for more recent Consumer Loan assignments are less certain as a significant portion of our forecast has not been realized.
The spread between the forecasted collection rate and the advance rate declined during the 2005 through 2007 period as we increased advance rates during this period in response to a more difficult competitive environment. During 2008 and 2009, the spread increased as the competitive environment improved and we reduced advance rates. In addition, during 2009, the spread was positively impacted by better than expected Consumer Loan performance. During the 2010 through 2013 period, the spread decreased as we again increased advance rates in response to the competitive environment.
The following table presents forecasted Consumer Loan collection rates, advance rates, and the spread (the forecasted collection rate less the advance rate) as of December 31, 2013 for Dealer Loans and Purchased Loans separately. All amounts are presented as a percentage of the initial balance of the Consumer Loan (principal + interest).
|
Consumer Loan Assignment Year
|
Forecasted
Collection %
|
Advance % (1)
|
Spread %
|
||||||||||
|
Dealer Loans
|
2007
|
67.9 | % | 45.8 | % | 22.1 | % | ||||||
|
2008
|
70.6 | % | 43.3 | % | 27.3 | % | |||||||
|
2009
|
79.2 | % | 43.5 | % | 35.7 | % | |||||||
|
2010
|
77.0 | % | 44.4 | % | 32.6 | % | |||||||
|
2011
|
74.0 | % | 45.2 | % | 28.8 | % | |||||||
|
2012
|
73.5 | % | 46.1 | % | 27.4 | % | |||||||
|
2013
|
73.2 | % | 47.2 | % | 26.0 | % | |||||||
|
Purchased Loans
|
2007
|
68.2 | % | 49.1 | % | 19.1 | % | ||||||
|
2008
|
69.4 | % | 46.7 | % | 22.7 | % | |||||||
|
2009
|
79.3 | % | 45.2 | % | 34.1 | % | |||||||
|
2010
|
76.9 | % | 46.2 | % | 30.7 | % | |||||||
|
2011
|
74.5 | % | 47.5 | % | 27.0 | % | |||||||
|
2012
|
74.1 | % | 48.0 | % | 26.1 | % | |||||||
|
2013
|
74.0 | % | 51.4 | % | 22.6 | % | |||||||
|
(1)
|
Represents advances paid to Dealers on Consumer Loans assigned under our Portfolio Program and one-time payments made to Dealers to purchase Consumer Loans assigned under our Purchase Program as a percentage of the initial balance of the Consumer Loans. Payments of Dealer Holdback and accelerated Dealer Holdback are not included.
|
The advance rates presented for each Consumer Loan assignment year change over time due to the impact of transfers between Dealer and Purchased Loans. Under our Portfolio Program, certain events may result in Dealers forfeiting their rights to Dealer Holdback. We transfer the Dealer’s Consumer Loans from the Dealer Loan portfolio to the Purchased Loan portfolio in the period this forfeiture occurs.
Although the advance rate on Purchased Loans is higher as compared to the advance rate on Dealer Loans, Purchased Loans do not require us to pay Dealer Holdback.
Access to Capital
Our strategy for accessing capital on acceptable terms needed to maintain and grow the business is to: (1) maintain consistent financial performance; (2) maintain modest financial leverage; and (3) maintain multiple funding sources. Our funded debt to equity ratio is 1.9:1 as of December 31, 2013. We currently utilize the following primary forms of debt financing: (1) a revolving secured line of credit; (2) Warehouse facilities; (3) Term ABS financings; and (4) senior notes.
Consumer Loan Volume
The following table summarizes changes in Consumer Loan assignment volume in each of the last three years as compared to the same period in the previous year:
|
Year over Year Percent Change
|
||||||||
|
For the Year Ended December 31,
|
Unit Volume
|
Dollar Volume (1)
|
||||||
|
2011
|
30.2
|
%
|
43.5
|
%
|
||||
|
2012
|
6.7
|
%
|
7.1
|
%
|
||||
|
2013
|
6.4
|
%
|
8.7
|
%
|
||||
|
(1)
|
Represents advances paid to Dealers on Consumer Loans assigned under our Portfolio Program and one-time payments made to Dealers to purchase Consumer Loans assigned under our Purchase Program. Payments of Dealer Holdback and accelerated Dealer Holdback are not included.
|
Consumer Loan assignment volumes depend on a number of factors including (1) the overall demand for our product, (2) the amount of capital available to fund new Loans, and (3) our assessment of the volume that our infrastructure can support. Our pricing strategy is intended to maximize the amount of economic profit we generate, within the confines of capital and infrastructure constraints
Unit and dollar volumes grew 6.4% and 8.7%, respectively, during 2013 as the number of active Dealers grew 20.2% and average volume per active Dealer declined 11.5%. We believe the decline in volume per Dealer is the result of increased competition.
The following table summarizes the changes in Consumer Loan unit volume and active Dealers:
|
For the Years Ended December 31,
|
% Change
|
|||||||||||||||
|
2013
|
2012
|
2011
|
2013 to 2012
|
2012 to 2011
|
||||||||||||
|
Consumer Loan unit volume
|
202,250
|
190,023
|
178,074
|
6.4
|
%
|
6.7
|
%
|
|||||||||
|
Active Dealers (1)
|
6,394
|
5,319
|
3,998
|
20.2
|
%
|
33.0
|
%
|
|||||||||
|
Average volume per active Dealer
|
31.6
|
35.7
|
44.5
|
-11.5
|
%
|
-19.8
|
%
|
|||||||||
|
|
(1)
|
Active Dealers are Dealers who have received funding for at least one Loan during the period.
|
The following table provides additional information on the changes in Consumer Loan unit volume and active Dealers:
|
For the Years Ended December 31,
|
For the Years Ended December 31,
|
||||||||||||||||||
|
2013
|
2012
|
% Change
|
2012
|
2011
|
% Change
|
||||||||||||||
|
Consumer Loan unit volume from Dealers active both periods
|
170,219
|
176,680
|
-3.7
|
%
|
157,735
|
168,314
|
-6.3
|
%
|
|||||||||||
|
Dealers active both periods
|
3,965
|
3,965
|
–
|
3,192
|
3,192
|
–
|
|||||||||||||
|
Average volume per Dealers active both periods
|
42.9
|
44.6
|
-3.7
|
%
|
49.4
|
52.7
|
-6.3
|
%
|
|||||||||||
|
Consumer Loan unit volume from new Dealers
|
31,414
|
31,705
|
-0.9
|
%
|
31,705
|
22,419
|
41.4
|
%
|
|||||||||||
|
New active Dealers (1)
|
2,382
|
2,070
|
15.1
|
%
|
2,070
|
1,403
|
47.5
|
%
|
|||||||||||
|
Average volume per new active Dealers
|
13.2
|
15.3
|
-13.7
|
%
|
15.3
|
16.0
|
-4.4
|
%
|
|||||||||||
|
Attrition (2)
|
-7.0
|
%
|
-5.5
|
%
|
-5.5
|
%
|
-6.0
|
%
|
|||||||||||
|
|
(1)
|
New active Dealers are Dealers who enrolled in our program and have received funding for their first Loan from us during the period.
|
|
|
(2)
|
Attrition is measured according to the following formula: decrease in Consumer Loan unit volume from Dealers who have received funding for at least one Loan during the comparable period of the prior year but did not receive funding for any Loans during the current period divided by prior year comparable period Consumer Loan unit volume.
|
Consumer Loans
a
re assigned to us as either Dealer Loans through our Portfolio Program or Purchased Loans through our Purchase Program. The following table summarizes the portion of our Consumer Loan volume that was assigned to us as Dealer Loans:
|
For the Years Ended December 31,
|
||||||||||
|
2013
|
2012
|
2011
|
||||||||
|
Dealer Loan unit volume as a percentage of total unit volume
|
93.5
|
%
|
93.7
|
%
|
92.5
|
%
|
||||
|
Dealer Loan dollar volume as a percentage of total dollar volume (1)
|
91.6
|
%
|
92.0
|
%
|
90.4
|
%
|
||||
|
(1)
|
Represents advances paid to Dealers on Consumer Loans assigned under our Portfolio Program and one-time payments made to Dealers to purchase Consumer Loans assigned under our Purchase Program. Payments of Dealer Holdback and accelerated Dealer Holdback are not included.
|
For the year ended December 31, 2013, Dealer Loan unit and dollar volume as a percentage of total unit and dollar volume were generally consistent with the same periods in 2012 and 2011.
As of December 31, 2013 and 2012, the net Dealer Loans receivable balance was 89.0% and 88.0%, respectively, of the total net Loans receivable balance.
Results of Operations
The following is a discussion of our results of operations and income statement data on a consolidated basis:
|
(In millions, except share and per share data)
|
% Change
|
|||||||||||||||
|
For the Years Ended December 31,
|
2013 to
|
2012 to
|
||||||||||||||
|
2013
|
2012
|
2011
|
2012
|
2011
|
||||||||||||
|
Revenue:
|
||||||||||||||||
|
Finance charges
|
$
|
590.4
|
$
|
538.2
|
$
|
460.6
|
9.7
|
%
|
16.8
|
%
|
||||||
|
Premiums earned
|
51.5
|
47.1
|
40.0
|
9.3
|
%
|
17.8
|
%
|
|||||||||
|
Other income
|
40.2
|
23.9
|
24.6
|
68.2
|
%
|
-2.8
|
%
|
|||||||||
|
Total revenue
|
682.1
|
609.2
|
525.2
|
12.0
|
%
|
16.0
|
%
|
|||||||||
|
Costs and expenses:
|
||||||||||||||||
|
Salaries and wages
|
87.3
|
82.2
|
63.0
|
6.2
|
%
|
30.5
|
%
|
|||||||||
|
General and administrative
|
34.4
|
30.5
|
25.6
|
12.8
|
%
|
19.1
|
%
|
|||||||||
|
Sales and marketing
|
34.5
|
31.2
|
23.6
|
10.6
|
%
|
32.2
|
%
|
|||||||||
|
Provision for credit losses
|
21.9
|
24.0
|
29.0
|
-8.8
|
%
|
-17.2
|
%
|
|||||||||
|
Interest
|
65.0
|
63.4
|
57.2
|
2.5
|
%
|
10.8
|
%
|
|||||||||
|
Provision for claims
|
40.8
|
34.8
|
30.4
|
17.2
|
%
|
14.5
|
%
|
|||||||||
|
Total costs and expenses
|
283.9
|
266.1
|
228.8
|
6.7
|
%
|
16.3
|
%
|
|||||||||
|
Income before provision for income taxes
|
398.2
|
343.1
|
296.4
|
16.1
|
%
|
15.8
|
%
|
|||||||||
|
Provision for income taxes
|
145.1
|
123.4
|
108.4
|
17.6
|
%
|
13.8
|
%
|
|||||||||
|
Net income
|
$
|
253.1
|
$
|
219.7
|
$
|
188.0
|
15.2
|
%
|
16.9
|
%
|
||||||
|
Net income per share:
|
||||||||||||||||
|
Basic
|
$
|
10.61
|
$
|
8.65
|
$
|
7.15
|
22.7
|
%
|
21.0
|
%
|
||||||
|
Diluted
|
$
|
10.54
|
$
|
8.58
|
$
|
7.07
|
22.8
|
%
|
21.4
|
%
|
||||||
|
Weighted average shares outstanding:
|
||||||||||||||||
|
Basic
|
23,850,789
|
25,409,655
|
26,302,289
|
-6.1
|
%
|
-3.4
|
%
|
|||||||||
|
Diluted
|
24,009,593
|
25,598,956
|
26,600,855
|
-6.2
|
%
|
-3.8
|
%
|
|||||||||
Year Ended December 31, 2013 Compared to Year Ended December 31, 2012
The following table highlights changes in net income for the year ended December 31, 2013, as compared to 2012:
|
(In millions)
|
Change
|
|||
|
Net income for the year ended December 31, 2012
|
$
|
219.7
|
||
|
Increase in finance charges
|
52.2
|
|||
|
Increase in premiums earned
|
4.4
|
|||
|
Increase in other income
|
16.3
|
|||
|
Increase in operating expenses (1)
|
(12.3
|
)
|
||
|
Decrease in provision for credit losses
|
2.1
|
|||
|
Increase in interest
|
(1.6
|
)
|
||
|
Increase in provision for claims
|
(6.0
|
)
|
||
|
Increase in provision for income taxes
|
(21.7
|
)
|
||
|
Net income for the year ended December 31, 2013
|
$
|
253.1
|
||
(1)
Operating expenses consist of salaries and wages, general and administrative, and sales and marketing expenses.
Finance Charges.
For the year ended December 31, 2013, finance charges increased $52.2 million, or 9.7%, as compared to 2012. The increase was primarily the result of an increase in the average net Loans receivable balance partially offset by a decrease in the average yield on our Loan portfolio, as follows:
|
(Dollars in millions)
|
For the Years Ended December 31,
|
|||||||||
|
2013
|
2012
|
Change
|
||||||||
|
Average net Loans receivable balance
|
$
|
2,088.4
|
$
|
1,797.0
|
$
|
291.4
|
||||
|
Average yield on our Loan portfolio
|
28.3
|
%
|
30.0
|
%
|
-1.7
|
%
|
||||
The following table summarizes the impact each component had on the overall increase in finance charges for the year ended December 31, 2013:
|
(In millions)
|
For the Year Ended
|
|||
|
Impact on finance charges:
|
December 31, 2013
|
|||
|
Due to an increase in the average net Loans receivable balance
|
$
|
87.3
|
||
|
Due to a decrease in the average yield
|
(35.1
|
)
|
||
|
Total increase in finance charges
|
$
|
52.2
|
||
The increase in the average net Loans receivable balance was primarily due to growth in new Consumer Loan assignments in recent years, which resulted in the dollar volume of new Consumer Loan assignments exceeding the principal collected on Loans throughout 2012 and 2013. The growth in new Consumer Loan assignments in recent years was the result of an increase in active Dealers, partially offset by a decline in volume per active Dealer. The average yield on our Loan portfolio for the year ended December 31, 2013 decreased as compared to the same period in 2012 due to higher advance rates on new Consumer Loan assignments, partially offset by improvements in forecasted collection rates throughout 2012 and 2013.
Premiums Earned.
For the year ended December 31, 2013, premiums earned increased $4.4 million, or 9.3%, as compared to 2012. The increase was primarily due to growth in the size of our reinsurance portfolio, which was the result of premiums written on vehicle service contracts from new Consumer Loan assignments throughout 2012 and 2013.
Other Income.
For the year ended December 31, 2013, other income increased $16.3 million, or 68.2%, as compared to 2012. The increase was primarily due to:
|
·
|
A $7.6 million increase in GPS-SID fee income due to an increase in the fee earned per unit purchased by Dealers from TPPs.
|
|
·
|
A $6.0 million increase in vehicle service contract profit sharing income primarily as a result of a new profit sharing arrangement we entered into with one of our TPPs during 2012.
|
Operating Expenses.
For the year ended December 31, 2013, operating expenses increased $12.3 million, or 8.5%, as compared to 2012. The change in operating expenses was primarily due to the following:
|
·
|
An increase in salaries and wages expense of $5.1 million, or 6.2%, comprised of the following:
|
|
·
|
An increase of $8.8 million, excluding stock-based compensation, primarily related to increases of $4.9 million for our servicing function and $4.2 million for our support function.
|
|
·
|
A decrease of $3.7 million in stock-based compensation expense
primarily due to a change in the expected vesting period of performance-based stock awards.
|
|
·
|
An increase in general and administrative expenses of $3.9 million, or 12.8%, primarily as a result of an increase related to legal fees.
|
|
·
|
An increase in sales and marketing expense of $3.3 million, or 10.6%, primarily as a result of an increase in the size of our field sales force and an increase in Dealer support products and services.
|
Provision for Credit Losses
. For the year ended December 31, 2013, the provision for credit losses decreased $2.1 million, or 8.8%, as compared to 2012. Under accounting principles generally accepted in the United States of America (“GAAP”), when the present value of forecasted future cash flows decline relative to our expectations at the time of assignment, a provision for credit losses is recorded immediately as a current period expense and a corresponding allowance for credit losses is established. For purposes of calculating the required allowance, Dealer Loans are grouped by Dealer and Purchased Loans are grouped by month of purchase. As a result, regardless of the overall performance of the portfolio of Consumer Loans, a provision can be required if any individual Loan pool performs worse than expected. Conversely, a previously recorded provision can be reversed if any previously impaired individual Loan pool experiences an improvement in performance.
During the year ended December 31, 2013, overall Consumer Loan performance exceeded our expectations at the start of the year. However, the performance of certain Loan pools declined from our expectations during the year, resulting in a provision for credit losses of $21.9 million for the year ended December 31, 2013, of which $21.3 million related to Dealer Loans and $0.6 million related to Purchased Loans. The provision for credit losses included $3.0 million in expense related to our implementation of an enhanced forecasting methodology during the second quarter of 2013, of which $1.2 million related to Dealer Loans and $1.8 million related to Purchased Loans. For additional information, see Note 5 to the consolidated financial statements contained in Item 8 of this Form 10-K, which is incorporated herein by reference. During the year ended December 31, 2012 overall Consumer Loan performance exceeded our expectations at the start of the year. However, the performance of certain Loan pools declined from our expectations during the year, resulting in a provision for credit losses of $24.0 million for the year ended December 31, 2012, of which $27.1 million related to Dealer Loans partially offset by a reversal of provision of $3.1 million related to Purchased Loans. The provision for credit losses related to Dealer Loans includes $2.8 million in expense related to an enhancement made to the computations used to account for Dealer Loans during the fourth quarter of 2012. For additional information, see Note 5 to the consolidated financial statements contained in Item 8 of this Form 10-K, which is incorporated herein by reference.
Interest.
For the year ended December 31, 2013, interest expense increased $1.6 million, or 2.5%, as compared to 2012. The following table shows interest expense, the average outstanding debt balance, and the average cost of debt for the years ended December 31, 2013 and 2012:
|
(Dollars in millions)
|
For the Years Ended December 31,
|
||||||
|
2013
|
2012
|
||||||
|
Interest expense
|
$
|
65.0
|
$
|
63.4
|
|||
|
Average outstanding debt balance
|
1,372.3
|
1,150.4
|
|||||
|
Average cost of debt
|
4.7
|
%
|
5.5
|
%
|
|||
For the year ended December 31, 2013, the increase in interest expense was primarily due to an increase in the average outstanding debt balance partially offset by a decrease in our average cost of debt. The average outstanding debt balance increased compared to the same period in 2012 due to the use of the debt proceeds to fund the growth in new Consumer Loan assignments and stock repurchases. The decrease in our average cost of debt was primarily a result of a change in the mix of our outstanding debt.
Provision for Claims.
For the year ended December 31, 2013, provision for claims increased $6.0 million, or 17.2%, as compared to 2012. The increase was due to an increase in the size of our reinsurance portfolio, as well as an increase in the amount of claims paid per reinsured vehicle service contract.
Provision for Income Taxes.
For the year ended December 31, 2013, the effective tax rate of 36.4% was generally consistent with the effective tax rate of 36.0% in 2012.
Year Ended December 31, 2012 Compared to Year Ended December 31, 2011
The following table highlights changes in net income for the year ended December 31, 2012, as compared to 2011:
|
(In millions)
|
Change
|
|||
|
Net income for the year ended December 31, 2011
|
$
|
188.0
|
||
|
Increase in finance charges
|
77.6
|
|||
|
Increase in premiums earned
|
7.1
|
|||
|
Decrease in other income
|
(0.7
|
)
|
||
|
Increase in operating expenses (1)
|
(31.7
|
)
|
||
|
Decrease in provision for credit losses
|
5.0
|
|||
|
Increase in interest
|
(6.2
|
)
|
||
|
Increase in provision for claims
|
(4.4
|
)
|
||
|
Increase in provision for income taxes
|
(15.0
|
)
|
||
|
Net income for the year ended December 31, 2012
|
$
|
219.7
|
||
|
(1)
|
Operating expenses consist of salaries and wages, general and administrative, and sales and marketing expenses.
|
Finance Charges.
For the year ended December 31, 2012, finance charges increased $77.6 million, or 16.8%, as compared to 2011. The increase was primarily the result of an increase in the average net Loans receivable balance partially offset by a decrease in the average yield on our Loan portfolio, as follows:
|
(Dollars in millions)
|
For the Years Ended December 31,
|
|||||||||
|
2012
|
2011
|
Change
|
||||||||
|
Average net Loans receivable balance
|
$
|
1,797.0
|
$
|
1,425.1
|
$
|
371.9
|
||||
|
Average yield on our Loan portfolio
|
30.0
|
%
|
32.3
|
%
|
-2.3
|
%
|
||||
The following table summarizes the impact each component had on the increase in finance charges for the year ended December 31, 2012:
|
(In millions)
|
For the Year Ended
|
|||
|
Impact on finance charges:
|
December 31, 2012
|
|||
|
Due to an increase in the average net Loans receivable balance
|
$
|
120.2
|
||
|
Due to a decrease in the average yield
|
(42.6
|
)
|
||
|
Total increase in finance charges
|
$
|
77.6
|
||
The increase in the average net Loans receivable balance was primarily due to growth in new Consumer Loan assignments in recent years, which resulted in the dollar volume of new Consumer Loan assignments exceeding the principal collected on Loans throughout 2011 and 2012. The growth in new Consumer Loan assignments in recent years was the result of an increase in active Dealers, partially offset by a decline in volume per active Dealer. The average yield on our Loan portfolio for the year ended December 31, 2012 decreased as compared to the same period in 2011 due to higher advance rates on new Consumer Loan assignments, partially offset by improvements in forecasted collection rates throughout 2011 and 2012.
Premiums Earned.
For the year ended December 31, 2012, premiums earned increased $7.1 million, or 17.8%, as compared to 2011. The increase is primarily due to growth in the size of our reinsurance portfolio which resulted from growth in new Consumer Loan assignments throughout 2011 and 2012.
Other Income.
For the year ended December 31, 2012, other income decreased $0.7 million, or 2.8%, as compared to 2011. The decrease in other income was primarily the result of the following:
|
·
|
A $5.5 million decrease in GAP profit sharing income, which was a result of the following:
|
|
·
|
Additional income recognized during 2011 as a result of a change we made to our revenue recognition during 2011 to begin recognizing this income as earned over the life of the GAP contracts.
|
|
·
|
A change made to our profit sharing income arrangement during 2012 that increased the total amount of income earned per GAP contract but reduced the amount recognized as other income. This reduction was more than offset by a higher fee per GAP contract that is recognized as finance charges.
|
|
·
|
A $3.9 million increase in GPS-SID fee income due to increases in both the fee earned per unit and the number of units purchased by dealers from TPPs.
|
|
·
|
A $1.1 million increase in vehicle service contract profit sharing income as a result of a new profit sharing arrangement we entered into with one of our TPPs during 2012.
|
Operating Expenses.
For the year ended December 31, 2012, operating expenses increased $31.7 million, or 28.3%, as compared to the same period in 2011. The change in operating expenses is due to the following:
|
·
|
An increase in salaries and wages expense of $19.2 million, or 30.5%, comprised of the following:
|
|
·
|
An increase of $10.3 million in stock-based compensation expense primarily attributable to the 15 year stock award granted to our Chief Executive Officer during the first quarter of 2012.
|
|
·
|
An increase of $6.9 million in salaries and wages, excluding the increase in stock-based compensation and fringe benefits, related to increases of $4.2 million for our servicing function, $2.2 million for our support function and $0.5 million for our originations function.
|
|
·
|
An increase of $2.0 million in fringe benefits, primarily related to medical claims.
|
|
·
|
An increase in sales and marketing expense of $7.6 million, or 32.2%, primarily as a result of the increase in the size of the field sales force.
|
|
·
|
An increase in general and administrative expense of $4.9 million, or 19.1%, primarily due to an increase in information technology expenses, an expense incurred related to the termination of our relationship with a TPP during the fourth quarter of 2012, an increase in legal fees and higher taxes primarily as a result of a property tax refund recognized in the first quarter of 2011.
|
Provision for Credit Losses
. For the year ended December 31, 2012, the provision for credit losses decreased $5.0 million, or 17.2%, as compared to 2011. During the year ended December 31, 2012, overall Consumer Loan performance exceeded our expectations at the start of the year. However, the performance of certain Loan pools declined from our expectations during the year, resulting in a provision for credit losses of $24.0 million for the year ended December 31, 2012, of which $27.1 million related to Dealer Loans partially offset by a reversal of provision of $3.1 million related to Purchased Loans. The provision for credit losses related to Dealer Loans includes $2.8 million in expense related to an enhancement made to the computations used to account for Dealer Loans during the fourth quarter of 2012. For additional information, see Note 5 to the consolidated financial statements contained in Item 8 of this Form 10-K, which is incorporated herein by reference. During the year ended December 31, 2011 overall Consumer Loan performance exceeded our expectations at the start of the year. However, the performance of certain Loan pools declined from our expectations during the year, resulting in a provision for credit losses of $29.0 million for the year ended December 31, 2011, of which $29.7 million related to Dealer Loans partially offset by a reversal of provision of $0.7 million related to Purchased Loans.
Interest.
For the year ended December 31, 2012, interest expense increased $6.2 million, or 10.8%, as compared to 2011. The following table shows interest expense, the average outstanding debt balance, and the average cost of debt for the year ended December 31, 2012:
|
(Dollars in millions)
|
For the Years Ended December 31,
|
|||||||
|
2012
|
2011
|
|||||||
|
Interest expense
|
$
|
63.4
|
$
|
57.2
|
||||
|
Average outstanding debt balance
|
1,150.4
|
892.3
|
||||||
|
Average cost of debt
|
5.5
|
%
|
6.4
|
%
|
||||
For the year ended December 31, 2012, the increase in interest expense is primarily due to the increase in the average outstanding debt balance, partially offset by a decline in our average cost of debt. The average outstanding debt balance increased compared to the same period in 2011 due to the use of the debt proceeds to fund the growth in new Consumer Loan assignments and stock repurchases. The decline in our average cost of debt was primarily a result of a change in the mix of our outstanding debt.
Provision for Claims.
For the year ended December 31, 2012, provision for claims increased $4.4 million, or 14.5%, as compared to 2011. The increase was due to an increase in the size of our reinsurance portfolio partially offset by a decrease in claims paid per reinsured vehicle service contract.
Provision for Income Taxes.
For the year ended December 31, 2012, the effective tax rate of 36.0% was generally consistent with the effective tax rate of 36.6% in 2011.
Critical Accounting Estimates
Our consolidated financial statements are prepared in accordance with GAAP. The preparation of these financial statements requires management to make estimates and judgments that affect the reported amounts of assets and liabilities and disclosure of contingent assets and liabilities at the date of the financial statements and the reported amounts of revenues and expenses during the reporting period. On an ongoing basis, we review our accounting policies, assumptions, estimates and judgments to ensure that our financial statements are presented fairly and in accordance with GAAP.
Our significant accounting policies are discussed in Note 2 to the consolidated financial statements contained in Item 8 of this Form 10-K, which is incorporated herein by reference. We believe that the following accounting estimates are the most critical to aid in fully understanding and evaluating our reported financial results, and involve a high degree of subjective or complex judgment, and the use of different estimates or assumptions could produce materially different financial results.
Finance Charge Revenue & Allowance for Credit Losses
Nature of Estimates Required.
We estimate the amount and timing of future collections and Dealer Holdback payments. These estimates impact loans receivable and allowance for credit losses on our balance sheet and finance charges and provision for credit losses on our income statement.
Assumptions and Approaches Used.
For accounting purposes, we are not considered to be an originator of Consumer Loans, but instead are considered to be a lender to our Dealers for Consumer Loans assigned under our Portfolio Program, and a purchaser of Consumer Loans assigned under our Purchase Program. As a result of this classification, our accounting policies for recognizing finance charge revenue and determining our allowance for credit losses may be different from other lenders in our market, who, based on their different business models, may be considered to be a direct lender to consumers for accounting purposes. For additional information regarding our classification as a lender to our Dealers for accounting purposes, see Note 1 to the consolidated financial statements contained in Item 8 of this Form 10-K, which is incorporated herein by reference.
We recognize finance charges under the interest method such that revenue is recognized on a level-yield basis based upon forecasted cash flows. For Dealer Loans, finance charge revenue and the allowance for credit losses are calculated after first aggregating Dealer Loans outstanding for each Dealer. For the same purpose, Purchased Loans are aggregated according to the month the Loan was purchased. An allowance for credit losses is maintained at an amount that reduces the net asset value (Loan balance less the allowance) to the value of forecasted future cash flows discounted at the yield established at the time of assignment. The discounted value of future cash flows is comprised of estimated future collections on the Loans, less any estimated Dealer Holdback payments related to Dealer Loans. We write off Loans once there are no forecasted future collections on any of the associated Consumer Loans.
Actual cash flows from any individual Dealer Loan or pool of Purchased Loans are often different than estimated cash flows at the time of assignment. If such difference is favorable, the difference is recognized prospectively into income over the remaining life of the Dealer Loan or pool of Purchased Loans through a yield adjustment. If such difference is unfavorable, a provision for credit losses is recorded immediately as a current period expense and a corresponding allowance for credit losses is established. Because differences between estimated cash flows at the time of assignment and actual cash flows occur often, an allowance is required for a significant portion of our Loan portfolio. An allowance for credit losses does not necessarily indicate that a Dealer Loan or pool of Purchased Loans is unprofitable, and in recent years, very seldom are cash flows from a Dealer Loan or pool of Purchased Loans insufficient to repay the initial amounts advanced or paid to the Dealer.
Future collections on Dealer and Purchased Loans are forecasted based on the historical performance of Consumer Loans with similar characteristics, adjusted for recent trends in payment patterns. Dealer Holdback is forecasted based on the expected future collections and current advance balance of each Dealer Loan.
During the fourth quarter of 2012, we enhanced the computations used to account for Dealer Loans. The enhanced computations utilize a more sophisticated approach for determining the yields established at the time of assignment, future net cash flow streams and the present value of future cash flow streams. While the enhanced computations did not change these estimates significantly at the overall Dealer Loan portfolio level, we believe they improved the precision of these estimates at the individual Dealer level. Implementation of the enhanced computations reduced 2012 net income by $1.2 million.
During the second quarter of 2013, we enhanced our methodology for forecasting future collections on Loans through the utilization of more recent data, different segmentations and new forecast variables. Implementation of the enhanced forecasting methodology reduced net income by $2.1 million for the second quarter of 2013.
Key Factors.
Variances in the amount and timing of future net cash flows from current estimates could materially impact earnings in future periods. A 1% decline in the forecasted future net cash flows on Loans as of December 31, 2013 would have reduced 2013 net income by approximately $8.9 million.
Premiums Earned
Nature of Estimates Required.
We estimate the pattern of future claims on vehicle service contracts. These estimates impact accounts payable and accrued liabilities on our balance sheet and premiums earned on our income statement.
Assumptions and Approaches Used.
Premiums from the reinsurance of vehicle service contracts are recognized over the life of the policy in proportion to the expected costs of servicing those contracts. Expected costs are determined based on our historical claims experience. In developing our cost expectations, we stratify our historical claims experience into groupings based on contractual term, as this characteristic has led to different patterns of cost incurrence in the past. We will continue to update our analysis of historical costs under the vehicle service contract program as appropriate, including the consideration of other characteristics that may have led to different patterns of cost incurrence, and revise our revenue recognition timing for any changes in the pattern of our expected costs as they are identified.
Key Factors.
Variances in the pattern of future claims from our current estimates would impact the timing of premiums recognized in future periods. A 10% change in premiums earned for the year ended December 31, 2013 would have affected 2013 net income by approximately $3.2 million.
Stock-Based Compensation Expense
Nature of Estimates Required.
Stock-based compensation expense is based on the fair value on the date the equity instrument is granted or awarded by us, and is recognized over the expected vesting period of the equity instrument. We also estimate expected forfeiture rates of restricted stock awards. These estimates impact paid in capital on our balance sheet and salaries and wages on our income statement.
Assumptions and Approaches Used.
In recognizing restricted stock-based compensation expense, we make assumptions regarding the expected forfeiture rates of the restricted stock awards. We also make assumptions regarding the expected vesting dates of performance-based restricted stock awards.
The fair value of restricted stock awards are estimated as if they were vested and issued on the grant date and are recognized over the expected vesting period of the restricted stock award. For additional information, see Notes 2 and 14 to the consolidated financial statements contained in Item 8 of this Form 10-K, which are incorporated herein by reference.
Key Factors.
Changes in the expected vesting dates of performance-based restricted stock awards and expected forfeiture rates would impact the amount and timing of stock-based compensation expense recognized in future periods. A 10% change in stock-based compensation expense for the year ended December 31, 2013 would have affected 2013 net income by approximately $0.5 million.
Litigation and Contingent Liabilities
Nature of Estimates Required.
We estimate the likelihood of adverse legal judgments and any resulting damages owed. These estimates impact accounts payable and accrued liabilities on our balance sheet and are general and administrative expenses on our income statement.
Assumptions and Approaches Used.
With assistance from our legal counsel, we determine if the likelihood of an adverse judgment for various claims and litigation is remote, reasonably possible, or probable. To the extent we believe an adverse judgment is probable and the amount of the judgment is estimable, we recognize a liability. For information regarding the potential various claims against us, see Note 17 to the consolidated financial statements contained in Item 8 of this Form 10-K, which is incorporated herein by reference.
Key Factors.
Negative variances in the ultimate disposition of claims and litigation outstanding from current estimates could result in additional expense in future periods.
Uncertain Tax Positions
Nature of Estimates Required.
We estimate the impact of an uncertain income tax position on the income tax return. These estimates impact income taxes receivable and accounts payable and accrued liabilities on our balance sheet and provision for income taxes on our income statement.
Assumptions and Approaches Used.
We follow a two-step approach for recognizing uncertain tax positions. First, we evaluate the tax position for recognition by determining if the weight of available evidence indicates it is more-likely-than-not that the position will be sustained upon examination, including resolution of related appeals or litigation processes, if any. Second, for positions that we determine are more-likely-than-not to be sustained, we recognize the tax benefit as the largest benefit that has a greater than 50% likelihood of being sustained. We establish a reserve for uncertain tax positions liability that is comprised of unrecognized tax benefits and related interest. We adjust this liability in the period in which an uncertain tax position is effectively settled, the statute of limitations expires for the relevant taxing authority to examine the tax position, or more information becomes available.
Key Factors.
To the extent we prevail in matters for which a liability has been established or are required to pay amounts in excess of our established liability, our effective income tax rate in future periods could be materially affected. Our 2011 federal income tax return is currently under audit by the Internal Revenue Service.
Liquidity and Capital Resources
We need capital to maintain and grow our business. Our primary sources of capital are cash flows from operating activities, collections of Consumer Loans and borrowings under: (1) a revolving secured line of credit; (2) Warehouse facilities; (3) Term ABS financings; and (4) senior notes. There are various restrictive debt covenants for each financing arrangement and we are in compliance with those covenants as of December 31, 2013. For information regarding these financings and the covenants included in the related documents, see Note 8 to the consolidated financial statements contained in Item 8 of this Form 10-K, which is incorporated herein by reference.
During the second quarter of 2013, we extended the date on which Warehouse IV will cease to revolve from February 19, 2014 to April 5, 2016. The interest rate on borrowings under the facility was decreased from LIBOR plus 275 basis points to LIBOR plus 225 basis points. During the fourth quarter of 2013, the interest rate on borrowings under Warehouse IV was decreased from LIBOR plus 225 basis points to LIBOR plus 200 basis points. There were no other material changes to the terms of the facility.
During the second quarter of 2013, we completed a $140.3 million Term ABS financing, which was used to repay outstanding indebtedness. The financing has an expected annualized cost of approximately 1.7% (including the initial purchaser’s fees and other costs), and it will revolve for 24 months, after which it will amortize based upon the cash flows on the contributed loans.
During the second quarter of 2013, we extended the maturity of our revolving secured line of credit facility from June 22, 2015 to June 23, 2016. There were no other material changes to the terms of the facility.
During the fourth quarter of 2013, we completed a $197.8 million Term ABS financing, which was used to repay outstanding indebtedness. The financing has an expected annualized cost of approximately 2.1% (including the initial purchaser’s fees and other costs), and it will revolve for 24 months, after which it will amortize based upon the cash flows on the contributed loans.
During January 2014, we issued $300 million of 6.125% senior notes due 2021 (the “2021 senior notes”) in a private offering exempt from registration under the Securities Act of 1933. We intend to use the net proceeds from the 2021 senior notes, together with borrowings under our revolving credit facility, to redeem in full the $350.0 million outstanding principal amount of our 9.125% senior notes due 2017 (the “2017 senior notes”). In accordance with the terms of the indenture governing the 2017 senior notes, we have provided an irrevocable notice of our election to redeem all of the outstanding 2017 senior notes on February 21, 2014 (the “Redemption Date”). We expect that the 2017 senior notes will be redeemed on the Redemption Date at a redemption price equal to 104.563% of the principal amount thereof, plus accrued and unpaid interest to but excluding the Redemption Date. For the quarter ended March 31, 2014, we expect to recognize a pre-tax loss on the extinguishment of debt of $21.7 million related to the redemption of the 2017 senior notes.
Cash and cash equivalents decreased to $4.2 million as of December 31, 2013 from $9.0 million as of December 31, 2012. Our total balance sheet indebtedness increased to $1,392.4 million as of December 31, 2013 from $1,250.8 million as of December 31, 2012 due to the growth in new Consumer Loan assignments and stock repurchases.
Restricted cash and cash equivalents increased to $111.3 million as of December 31, 2013 from $92.4 million as of December 31, 2012. The following table summarizes restricted cash and cash equivalents:
|
(In millions)
|
As of December 31,
|
|||||
|
2013
|
2012
|
|||||
|
Cash related to secured financings
|
$ | 110.1 | $ | 90.2 | ||
|
Cash held in VSC Re trusts for future vehicle service contract claims (1)
|
1.2 | 2.2 | ||||
|
Total restricted cash and cash equivalents
|
$ | 111.3 | $ | 92.4 | ||
|
(1)
|
The unearned premium and claims reserve associated with the trusts are included in accounts payable and accrued liabilities in the consolidated balance sheets.
|
As of December 31, 2013 and 2012, restricted securities available for sale were $53.6 million and $46.1 million, respectively. Restricted securities available for sale consist of amounts held in accordance with vehicle service contract trust agreements.
Contractual Obligations
A summary of the total future contractual obligations requiring repayments as of December 31, 2013 is as follows:
|
(In millions)
|
Payments Due by Period
|
||||||||||||||||||
|
Total
|
Less than
1 Year
|
1-3 Years
|
3-5 Years
|
More than
5 Years
|
Other
|
||||||||||||||
|
Long-term debt, including current maturities (1)(2)
|
$
|
1,392.2
|
$
|
362.0
|
$
|
680.2
|
$
|
350.0
|
$
|
–
|
$
|
–
|
|||||||
|
Dealer Holdback (3)
|
639.5
|
114.2
|
274.5
|
168.0
|
82.8
|
–
|
|||||||||||||
|
Operating lease obligations
|
6.3
|
1.4
|
2.7
|
2.0
|
0.2
|
–
|
|||||||||||||
|
Purchase obligations (4)
|
3.8
|
1.9
|
0.8
|
0.8
|
0.3
|
–
|
|||||||||||||
|
Other future obligations (5)
|
13.2
|
–
|
–
|
–
|
–
|
13.2
|
|||||||||||||
|
Total contractual obligations
|
$
|
2,055.0
|
$
|
479.5
|
$
|
958.2
|
$
|
520.8
|
$
|
83.3
|
$
|
13.2
|
|||||||
|
(1)
|
Long-term debt obligations included in the above table consist solely of principal repayments. The amounts are presented on a gross basis to exclude the net unamortized debt premium of $0.2 million. We are also obligated to make interest payments at the applicable interest rates, as discussed in Note 8 to the consolidated financial statements contained in Item 8 of this Form 10-K, which is incorporated herein by reference. Based on the actual amounts outstanding under our revolving secured line of credit, our Warehouse facilities, and our senior notes as of December 31, 2013, the forecasted amounts outstanding on all other debt and the actual interest rates in effect as of December 31, 2013, interest is expected to be approximately $48.9 million during 2014; $40.5 million during 2015; and $50.5 million during 2016 and thereafter.
|
|
(2)
|
For subsequent event information affecting the maturity of senior notes, see Note 18 to the consolidated financial statements contained in Item 8 of this Form 10-K, which is incorporated herein by reference.
|
|
(3)
|
We have contractual obligations to pay Dealer Holdback to our Dealers. Payments of Dealer Holdback are contingent upon the receipt of consumer payments and the repayment of advances. The amounts presented represent our forecast as of December 31, 2013.
|
|
(4)
|
Purchase obligations consist primarily of contractual obligations related to our information system and facility needs.
|
|
(5)
|
Other future obligations included in the above table consist solely of reserves for uncertain tax positions. Payments are contingent upon examination and would occur in the periods in which the uncertain tax positions are settled.
|
Based upon anticipated cash flows, management believes that cash flows from operations and its various financing alternatives will provide sufficient financing for debt maturities and for future operations. Our ability to borrow funds may be impacted by economic and financial market conditions. If the various financing alternatives were to become limited or unavailable to us, our operations and liquidity could be materially and adversely affected.
Off-Balance Sheet Arrangements
We do not have any off-balance sheet arrangements that have or are reasonably likely to have a material current or future effect on our financial condition, revenues or expenses, results of operations, liquidity, capital expenditures or capital resources.
Market Risk
We are exposed primarily to market risks associated with movements in interest rates. Our policies and procedures prohibit the use of financial instruments for speculative purposes. A discussion of our accounting policies for derivative instruments is included in Note 2 to the consolidated financial statements contained in Item 8 of this Form 10-K, which is incorporated herein by reference.
Interest Rate Risk.
We rely on various sources of financing, some of which contain floating rates of interest and expose us to risks associated with increases in interest rates. We manage such risk primarily by entering into interest rate cap and interest rate swap agreements.
As of December 31, 2013, we had $102.8 million of floating rate debt outstanding on our revolving secured line of credit, without interest rate protection. For every 1.0% increase in rates on our revolving secured line of credit, annual after-tax earnings would decrease by approximately $0.6 million, assuming we maintain a level amount of floating rate debt.
As of December 31, 2013, we had an interest rate cap agreement outstanding to manage the interest rate risk on Warehouse Facility II. However, as of December 31, 2013, there was no floating debt outstanding under this facility.
As of December 31, 2013, we had an interest rate cap agreement outstanding to manage the interest rate risk on Warehouse Facility III. However, as of December 31, 2013, there was no floating debt outstanding under this facility.
As of December 31, 2013, we had an interest rate cap agreement outstanding to manage the interest rate risk on Warehouse Facility IV. However, as of December 31, 2013, there was no floating debt outstanding under this facility.
New Accounting Updates
See Note 2 to the consolidated financial statements contained in Item 8 of this Form 10-K, which is incorporated herein by reference, for information concerning the following new accounting updates and the impact of the implementation of these updates on our financial statements:
|
·
|
Accounting for Costs Associated with Acquiring or Renewing Insurance Contracts
|
|
·
|
Amendments to Achieve Common Fair Value Measurement and Disclosure Requirements in U.S. GAAP and IFRSs
|
|
·
|
Reporting of Amounts Reclassified Out of Accumulated Other Comprehensive Income
|
|
·
|
Presentation of an Unrecognized Tax Benefit When a Net Operating Loss Carryforward, a Similar Tax Loss, or a Tax Credit Carryforward Exists
|
Forward-Looking Statements
We make forward-looking statements in this report and may make such statements in future filings with the SEC. We may also make forward-looking statements in our press releases or other public or shareholder communications. Our forward-looking statements are subject to risks and uncertainties and include information about our expectations and possible or assumed future results of operations. When we use any of the words "may," "will," "should," "believe," "expect," "anticipate," "assume," "forecast," "estimate," "intend," "plan," “target” or similar expressions, we are making forward-looking statements.
We claim the protection of the safe harbor for forward-looking statements contained in the Private Securities Litigation Reform Act of 1995 for all of our forward-looking statements. These forward-looking statements represent our outlook only as of the date of this report. While we believe that our forward-looking statements are reasonable, actual results could differ materially since the statements are based on our current expectations, which are subject to risks and uncertainties. Factors that might cause such a difference include, but are not limited to, the factors set forth under Item 1A of this Form 10-K, which is incorporated herein by reference, elsewhere in this report and the risks and uncertainties discussed in our other reports filed or furnished from time to time with the SEC.
The information called for by Item 7A is incorporated herein by reference from the information in Item 7 under the caption "Market Risk" in this Form 10-K.
INDEX TO CONSOLIDATED FINANCIAL STATEMENTS
|
Page
|
||||
|
Report of Independent Registered Public Accounting Firm
|
40
|
|||
|
Consolidated Balance Sheets as of December 31, 2013 and 2012
|
41
|
|||
|
Consolidated Statements of Income for the years ended December 31, 2013, 2012 and 2011
|
42
|
|||
|
Consolidated Statements of Comprehensive Income for the years ended December 31, 2013, 2012 and 2011
|
43
|
|||
|
Consolidated Statements of Shareholders' Equity for the years ended December 31, 2013, 2012 and 2011
|
44
|
|||
|
Consolidated Statements of Cash Flows for the years ended December 31, 2013, 2012 and 2011
|
45
|
|||
|
Notes to Consolidated Financial Statements
|
46
|
|||
Board of Directors and Shareholders of
Credit Acceptance Corporation
We have audited the accompanying consolidated balance sheets of Credit Acceptance Corporation (a Michigan corporation) and subsidiaries (the “Company”) as of December 31, 2013 and 2012, and the related consolidated statements of income, comprehensive income, shareholders’ equity, and cash flows for each of the three years in the period ended December 31, 2013. These financial statements are the responsibility of the Company’s management. Our responsibility is to express an opinion on these financial statements based on our audits.
We conducted our audits in accordance with the standards of the Public Company Accounting Oversight Board (United States). Those standards require that we plan and perform the audit to obtain reasonable assurance about whether the financial statements are free of material misstatement. An audit includes examining, on a test basis, evidence supporting the amounts and disclosures in the financial statements. An audit also includes assessing the accounting principles used and significant estimates made by management, as well as evaluating the overall financial statement presentation. We believe that our audits provide a reasonable basis for our opinion.
In our opinion, the consolidated financial statements referred to above present fairly, in all material respects, the financial position of Credit Acceptance Corporation and subsidiaries as of December 31, 2013 and 2012, and the results of their operations and their cash flows for each of the three years in the period ended December 31, 2013 in conformity with accounting principles generally accepted in the United States of America.
We also have audited, in accordance with the standards of the Public Company Accounting Oversight Board (United States), the Company’s internal control over financial reporting as of December 31, 2013 based on criteria established in the 1992 Internal Control—Integrated Framework issued by the Committee of Sponsoring Organizations of the Treadway Commission (COSO), and our report dated February 14, 2014 expressed an unqualified opinion on the effectiveness of the Company’s internal control over financial reporting.
/s/ GRANT THORNTON LLP
Southfield, Michigan
February 14, 2014
|
(In millions, except share and per share data)
|
As of December 31,
|
||||||
|
2013
|
2012
|
||||||
|
ASSETS:
|
|||||||
|
Cash and cash equivalents
|
$
|
4.2
|
$
|
9.0
|
|||
|
Restricted cash and cash equivalents
|
111.3
|
92.4
|
|||||
|
Restricted securities available for sale
|
53.6
|
46.1
|
|||||
|
Loans receivable (including $7.5 and $5.9 from affiliates as of
December 31, 2013 and December 31, 2012, respectively)
|
2,408.2
|
2,109.9
|
|||||
|
Allowance for credit losses
|
(195.4
|
)
|
(176.4
|
)
|
|||
|
Loans receivable, net
|
2,212.8
|
1,933.5
|
|||||
|
Property and equipment, net
|
22.3
|
22.2
|
|||||
|
Income taxes receivable
|
1.1
|
1.1
|
|||||
|
Other assets
|
28.1
|
28.9
|
|||||
|
Total Assets
|
$
|
2,433.4
|
$
|
2,133.2
|
|||
|
LIABILITIES AND SHAREHOLDERS' EQUITY:
|
|||||||
|
Liabilities:
|
|||||||
|
Accounts payable and accrued liabilities
|
$
|
113.8
|
$
|
105.8
|
|||
|
Revolving secured line of credit
|
102.8
|
43.5
|
|||||
|
Secured financing
|
935.6
|
853.0
|
|||||
|
Mortgage note
|
3.8
|
4.0
|
|||||
|
Senior notes
|
350.2
|
350.3
|
|||||
|
Deferred income taxes, net
|
157.2
|
148.4
|
|||||
|
Income taxes payable
|
19.9
|
6.3
|
|||||
|
Total Liabilities
|
1,683.3
|
1,511.3
|
|||||
|
Commitments and Contingencies - See Note 17
|
|||||||
|
Shareholders' Equity:
|
|||||||
|
Preferred stock, $.01 par value, 1,000,000 shares authorized, none issued
|
–
|
–
|
|||||
|
Common stock, $.01 par value, 80,000,000 shares authorized, 22,943,078 and 24,114,896 shares issued and outstanding as of December 31, 2013 and December 31, 2012, respectively
|
0.2
|
0.2
|
|||||
|
Paid-in capital
|
63.2
|
53.4
|
|||||
|
Retained earnings
|
686.9
|
568.4
|
|||||
|
Accumulated other comprehensive loss
|
(0.2
|
)
|
(0.1
|
)
|
|||
|
Total Shareholders' Equity
|
750.1
|
621.9
|
|||||
|
Total Liabilities and Shareholders' Equity
|
$
|
2,433.4
|
$
|
2,133.2
|
|||
See accompanying notes to consolidated financial statements.
|
(In millions, except share and per share data)
|
For the Years Ended December 31,
|
|||||||||
|
2013
|
2012
|
2011
|
||||||||
|
Revenue:
|
||||||||||
|
Finance charges
|
$
|
590.4
|
$
|
538.2
|
$
|
460.6
|
||||
|
Premiums earned
|
51.5
|
47.1
|
40.0
|
|||||||
|
Other income
|
40.2
|
23.9
|
24.6
|
|||||||
|
Total revenue
|
682.1
|
609.2
|
525.2
|
|||||||
|
Costs and expenses:
|
||||||||||
|
Salaries and wages
|
87.3
|
82.2
|
63.0
|
|||||||
|
General and administrative
|
34.4
|
30.5
|
25.6
|
|||||||
|
Sales and marketing
|
34.5
|
31.2
|
23.6
|
|||||||
|
Provision for credit losses
|
21.9
|
24.0
|
29.0
|
|||||||
|
Interest
|
65.0
|
63.4
|
57.2
|
|||||||
|
Provision for claims
|
40.8
|
34.8
|
30.4
|
|||||||
|
Total costs and expenses
|
283.9
|
266.1
|
228.8
|
|||||||
|
Income before provision for income taxes
|
398.2
|
343.1
|
296.4
|
|||||||
|
Provision for income taxes
|
145.1
|
123.4
|
108.4
|
|||||||
|
Net income
|
$
|
253.1
|
$
|
219.7
|
$
|
188.0
|
||||
|
Net income per share:
|
||||||||||
|
Basic
|
$
|
10.61
|
$
|
8.65
|
$
|
7.15
|
||||
|
Diluted
|
$
|
10.54
|
$
|
8.58
|
$
|
7.07
|
||||
|
Weighted average shares outstanding:
|
||||||||||
|
Basic
|
23,850,789
|
25,409,655
|
26,302,289
|
|||||||
|
Diluted
|
24,009,593
|
25,598,956
|
26,600,855
|
|||||||
See accompanying notes to consolidated financial statements.
CONSOLIDATED STATEMENTS OF COMPREHENSIVE INCOME
|
(In millions)
|
For the Years Ended December 31,
|
|||||||||
|
2013
|
2012
|
2011
|
||||||||
|
Net income
|
$
|
253.1
|
$
|
219.7
|
$
|
188.0
|
||||
|
Other comprehensive income (loss):
|
||||||||||
|
Unrealized gain on cash flow hedge, net of tax of $(0.1) for 2011
|
–
|
–
|
0.1
|
|||||||
|
Unrealized loss on securities, net of tax of $0.1 for 2012
|
(0.1
|
)
|
(0.1
|
)
|
–
|
|||||
|
Other comprehensive income (loss)
|
(0.1
|
)
|
(0.1
|
)
|
0.1
|
|||||
|
Comprehensive income
|
$
|
253.0
|
$
|
219.6
|
$
|
188.1
|
||||
See accompanying notes to consolidated financial statements.
CONSOLIDATED STATEMENTS OF SHAREHOLDERS' EQUITY
|
(In millions, except share data)
|
|||||||||||||||||||
|
Common Stock
|
|||||||||||||||||||
|
Number
|
Amount
|
Paid-In Capital
|
Retained Earnings
|
Accumulated Other Comprehensive Income (Loss)
|
Total Shareholders' Equity
|
||||||||||||||
|
Balance, January 1, 2011
|
27,303,946
|
$
|
0.3
|
$
|
31.0
|
$
|
443.3
|
$
|
(0.1
|
)
|
$
|
474.5
|
|||||||
|
Net income
|
–
|
–
|
–
|
188.0
|
–
|
188.0
|
|||||||||||||
|
Other comprehensive income
|
–
|
–
|
–
|
–
|
0.1
|
0.1
|
|||||||||||||
|
Stock-based compensation
|
–
|
–
|
1.9
|
–
|
–
|
1.9
|
|||||||||||||
|
Restricted stock awards, net of forfeitures
|
(842
|
)
|
–
|
–
|
–
|
–
|
–
|
||||||||||||
|
Repurchase of common stock
|
(1,979,444
|
)
|
–
|
(0.4
|
)
|
(130.4
|
)
|
–
|
(130.8
|
)
|
|||||||||
|
Stock options exercised
|
300,024
|
–
|
2.9
|
–
|
–
|
2.9
|
|||||||||||||
|
Tax benefits from stock-based compensation plans
|
–
|
–
|
3.4
|
–
|
–
|
3.4
|
|||||||||||||
|
Balance, December 31, 2011
|
25,623,684
|
0.3
|
38.8
|
500.9
|
–
|
540.0
|
|||||||||||||
|
Net income
|
–
|
–
|
–
|
219.7
|
–
|
219.7
|
|||||||||||||
|
Other comprehensive income (loss)
|
–
|
–
|
–
|
–
|
(0.1
|
)
|
(0.1
|
)
|
|||||||||||
|
Stock-based compensation
|
–
|
–
|
12.2
|
–
|
–
|
12.2
|
|||||||||||||
|
Restricted stock awards, net of forfeitures
|
195,679
|
–
|
–
|
–
|
–
|
–
|
|||||||||||||
|
Repurchase of common stock
|
(1,740,372
|
)
|
(0.1
|
)
|
(0.2
|
)
|
(152.2
|
)
|
–
|
(152.5
|
)
|
||||||||
|
Stock options exercised
|
35,905
|
–
|
0.6
|
–
|
–
|
0.6
|
|||||||||||||
|
Tax benefits from stock-based compensation plans
|
–
|
–
|
2.0
|
–
|
–
|
2.0
|
|||||||||||||
|
Balance, December 31, 2012
|
24,114,896
|
0.2
|
53.4
|
568.4
|
(0.1
|
)
|
621.9
|
||||||||||||
|
Net income
|
–
|
–
|
–
|
253.1
|
–
|
253.1
|
|||||||||||||
|
Other comprehensive income (loss)
|
–
|
–
|
–
|
–
|
(0.1
|
)
|
(0.1
|
)
|
|||||||||||
|
Stock-based compensation
|
–
|
–
|
8.5
|
–
|
–
|
8.5
|
|||||||||||||
|
Restricted stock awards, net of forfeitures
|
8,349
|
–
|
–
|
–
|
–
|
–
|
|||||||||||||
|
Repurchase of common stock
|
(1,216,015
|
)
|
–
|
(0.6
|
)
|
(134.6
|
)
|
–
|
(135.2
|
)
|
|||||||||
|
Restricted stock units converted to common stock
|
848
|
–
|
–
|
–
|
–
|
–
|
|||||||||||||
|
Stock options exercised
|
35,000
|
–
|
0.6
|
–
|
–
|
0.6
|
|||||||||||||
|
Tax benefits from stock-based compensation plans
|
–
|
–
|
1.3
|
–
|
–
|
1.3
|
|||||||||||||
|
Balance, December 31, 2013
|
22,943,078
|
$
|
0.2
|
$
|
63.2
|
$
|
686.9
|
$
|
(0.2
|
)
|
$
|
750.1
|
|||||||
See accompanying notes to consolidated financial statements.
|
(In millions)
|
For the Years Ended December 31,
|
|||||||||
|
2013
|
2012
|
2011
|
||||||||
|
Cash Flows From Operating Activities:
|
||||||||||
|
Net income
|
$
|
253.1
|
$
|
219.7
|
$
|
188.0
|
||||
|
Adjustments to reconcile cash provided by operating activities:
|
||||||||||
|
Provision for credit losses
|
21.9
|
24.0
|
29.0
|
|||||||
|
Depreciation
|
5.4
|
5.1
|
4.1
|
|||||||
|
Amortization
|
7.8
|
7.1
|
5.9
|
|||||||
|
Loss on retirement of property and equipment
|
0.1
|
–
|
–
|
|||||||
|
Provision for deferred income taxes
|
8.8
|
25.0
|
15.3
|
|||||||
|
Stock-based compensation
|
8.5
|
12.2
|
1.9
|
|||||||
|
Change in operating assets and liabilities:
|
||||||||||
|
Increase in accounts payable and accrued liabilities
|
8.0
|
10.0
|
20.7
|
|||||||
|
(Increase) decrease in income taxes receivable
|
–
|
(0.6
|
)
|
11.5
|
||||||
|
Increase in income taxes payable
|
13.6
|
4.8
|
1.5
|
|||||||
|
(Increase) decrease in other assets
|
(1.5
|
)
|
1.3
|
(2.2
|
)
|
|||||
|
Net cash provided by operating activities
|
325.7
|
308.6
|
275.7
|
|||||||
|
Cash Flows From Investing Activities:
|
||||||||||
|
(Increase) decrease in restricted cash and cash equivalents
|
(18.9
|
)
|
12.3
|
(38.1
|
)
|
|||||
|
Purchases of restricted securities available for sale
|
(105.7
|
)
|
(57.1
|
)
|
(0.5
|
)
|
||||
|
Proceeds from sale of restricted securities available for sale
|
11.6
|
2.0
|
0.1
|
|||||||
|
Maturities of restricted securities available for sale
|
86.2
|
9.6
|
0.4
|
|||||||
|
Principal collected on Loans receivable
|
1,334.4
|
1,162.8
|
996.9
|
|||||||
|
Advances to Dealers
|
(1,356.6
|
)
|
(1,253.6
|
)
|
(1,152.5
|
)
|
||||
|
Purchases of Consumer Loans
|
(124.0
|
)
|
(108.8
|
)
|
(122.2
|
)
|
||||
|
Accelerated payments of Dealer Holdback
|
(40.4
|
)
|
(43.7
|
)
|
(47.4
|
)
|
||||
|
Payments of Dealer Holdback
|
(114.2
|
)
|
(115.7
|
)
|
(85.2
|
)
|
||||
|
Net (increase) decrease in other loans
|
(0.4
|
)
|
0.1
|
0.8
|
||||||
|
Purchases of property and equipment
|
(5.6
|
)
|
(8.8
|
)
|
(6.3
|
)
|
||||
|
Net cash used in investing activities
|
(333.6
|
)
|
(400.9
|
)
|
(454.0
|
)
|
||||
|
Cash Flows From Financing Activities:
|
||||||||||
|
Borrowings under revolving secured line of credit
|
2,816.6
|
2,507.4
|
2,384.9
|
|||||||
|
Repayments under revolving secured line of credit
|
(2,757.3
|
)
|
(2,507.8
|
)
|
(2,477.7
|
)
|
||||
|
Proceeds from secured financing
|
1,004.7
|
1,742.0
|
1,164.5
|
|||||||
|
Repayments of secured financing
|
(922.1
|
)
|
(1,488.3
|
)
|
(865.3
|
)
|
||||
|
Principal payments under mortgage note
|
(0.2
|
)
|
(0.3
|
)
|
(0.3
|
)
|
||||
|
Proceeds from sale of senior notes
|
–
|
–
|
106.0
|
|||||||
|
Payments of debt issuance costs
|
(5.3
|
)
|
(6.5
|
)
|
(8.4
|
)
|
||||
|
Repurchase of common stock
|
(135.2
|
)
|
(152.5
|
)
|
(130.8
|
)
|
||||
|
Proceeds from stock options exercised
|
0.6
|
0.6
|
2.9
|
|||||||
|
Tax benefits from stock-based compensation plans
|
1.3
|
2.0
|
3.4
|
|||||||
|
Net cash provided by financing activities
|
3.1
|
96.6
|
179.2
|
|||||||
|
Net (decrease) increase in cash and cash equivalents
|
(4.8
|
)
|
4.3
|
0.9
|
||||||
|
Cash and cash equivalents, beginning of period
|
9.0
|
4.7
|
3.8
|
|||||||
|
Cash and cash equivalents, end of period
|
$
|
4.2
|
$
|
9.0
|
$
|
4.7
|
||||
|
Supplemental Disclosure of Cash Flow Information:
|
||||||||||
|
Cash paid during the period for interest
|
$
|
57.5
|
$
|
56.2
|
$
|
51.4
|
||||
|
Cash paid during the period for income taxes
|
$
|
119.6
|
$
|
92.4
|
$
|
76.5
|
||||
See accompanying notes to consolidated financial statements.
|
|
|
1.
|
DESCRIPTION OF BUSINESS
|
Principal Business.
Since 1972, Credit Acceptance Corporation (referred to as the “Company”, “Credit Acceptance”, “we”, “our” or “us”) has offered automobile dealers financing programs that enable them to sell vehicles to consumers, regardless of their credit history. Our financing programs are offered through a nationwide network of automobile dealers who benefit from sales of vehicles to consumers who otherwise could not obtain financing; from repeat and referral sales generated by these same customers; and from sales to customers responding to advertisements for our product, but who actually end up qualifying for traditional financing.
We refer to automobile dealers who participate in our programs and who share our commitment to changing consumers’ lives as “Dealers”. Upon enrollment in our financing programs, the Dealer enters into a Dealer servicing agreement with us that defines the legal relationship between Credit Acceptance and the Dealer. The Dealer servicing agreement assigns the responsibilities for administering, servicing, and collecting the amounts due on retail installment contracts (referred to as “Consumer Loans”) from the Dealers to us. We are an indirect lender from a legal perspective, meaning the Consumer Loan is originated by the Dealer and assigned to us.
We have two programs: the Portfolio Program and the Purchase Program. Under the Portfolio Program, we advance money to Dealers (referred to as a “Dealer Loan”) in exchange for the right to service the underlying Consumer Loans. Under the Purchase Program, we buy the Consumer Loans from the Dealers (referred to as a “Purchased Loan”) and keep all amounts collected from the consumer. Dealer Loans and Purchased Loans are collectively referred to as “Loans”. The following table shows the percentage of Consumer Loans assigned to us based on unit volumes under each of the programs for each of the last three years:
|
For the Years Ended December 31,
|
Portfolio Program
|
Purchase Program
|
||||||
|
2011
|
92.5
|
%
|
7.5
|
%
|
||||
|
2012
|
93.7
|
%
|
6.3
|
%
|
||||
|
2013
|
93.5
|
%
|
6.5
|
%
|
||||
Portfolio Program
As payment for the vehicle, the Dealer generally receives the following:
|
·
|
a down payment from the consumer;
|
|
·
|
a non-recourse cash payment (“advance”) from us; and
|
|
·
|
after the advance has been recovered by us, the cash from payments made on the Consumer Loan, net of certain collection costs and our servicing fee (“Dealer Holdback”).
|
We record the amount advanced to the Dealer as a Dealer Loan, which is classified within Loans receivable in our consolidated balance sheets. Cash advanced to the Dealer is automatically assigned to the Dealer’s open pool of advances. We generally require Dealers to group advances into pools of at least 100 Consumer Loans. At the Dealer’s option, a pool containing at least 100 Consumer Loans can be closed and subsequent advances assigned to a new pool. All advances within a Dealer’s pool are secured by the future collections on the related Consumer Loans assigned to the pool. For Dealers with more than one pool, the pools are cross-collateralized so the performance of other pools is considered in determining eligibility for Dealer Holdback. We perfect our security interest in the Dealer Loans by taking possession of the Consumer Loans, which list us as lien holder on the vehicle title.
The Dealer servicing agreement provides that collections received by us during a calendar month on Consumer Loans assigned by a Dealer are applied on a pool-by-pool basis as follows:
|
·
|
First, to reimburse us for certain collection costs;
|
|
·
|
Second, to pay us our servicing fee, which generally equals 20% of collections;
|
|
·
|
Third, to reduce the aggregate advance balance and to pay any other amounts due from the Dealer to us; and
|
|
·
|
Fourth, to the Dealer as payment of Dealer Holdback.
|
If the collections on Consumer Loans from a Dealer’s pool are not sufficient to repay the advance balance and any other amounts due to us, the Dealer will not receive Dealer Holdback.
|
1.
|
DESCRIPTION OF BUSINESS – (Concluded)
|
Dealers have an opportunity to receive an accelerated Dealer Holdback payment each time 100 Consumer Loans have been assigned to us. The amount paid to the Dealer is calculated using a formula that considers the forecasted collections and the advance balance on the related Consumer Loans.
Since typically the combination of the advance and the consumer’s down payment provides the Dealer with a cash profit at the time of sale, the Dealer’s risk in the Consumer Loan is limited. We cannot demand repayment of the advance from the Dealer except in the event the Dealer is in default of the Dealer servicing agreement. Advances are made only after the consumer and Dealer have signed a Consumer Loan contract, we have received the original Consumer Loan contract and supporting documentation, and we have approved all of the related stipulations for funding. The Dealer can also opt to repurchase Consumer Loans that have been assigned to us under the Portfolio Program, at their discretion, for a fee.
For accounting purposes, the transactions described under the Portfolio Program are not considered to be loans to consumers. Instead, our accounting reflects that of a lender to the Dealer. The classification as a Dealer Loan for accounting purposes is primarily a result of (1) the Dealer’s financial interest in the Consumer Loan and (2) certain elements of our legal relationship with the Dealer.
Purchase Program
The Purchase Program differs from our Portfolio Program in that the Dealer receives a one-time payment from us at the time of assignment to purchase the Consumer Loan instead of a cash advance at the time of assignment and future Dealer Holdback payments. For accounting purposes, the transactions described under the Purchase Program are considered to be originated by the Dealer and then purchased by us.
Program Enrollment
Dealers may enroll in our program by choosing one of our two enrollment options (referred to as “Option A” and “Option B”). In recent years, the terms of Option A have remained consistent while the terms of Option B have varied. The following table summarizes the terms of our enrollment options for the three year period ending December 31, 2013:
|
Effective Period
|
Option A
|
Option B
|
||
|
Since June 1, 2011
|
Upfront, one-time fee of $9,850
|
Agreement to allow us to retain 50% of their first accelerated Dealer Holdback payment
|
||
|
Prior to June 1, 2011
|
Upfront, one-time fee of $9,850
|
Upfront, one-time fee of $1,950 and agreement to allow us to retain 50% of their first accelerated Dealer Holdback payment
|
Dealers are granted access to the Portfolio Program upon enrollment. Access to the Purchase Program is limited and is typically only granted to Dealers that either have received their first accelerated Dealer Holdback payment under the Portfolio Program or are franchise dealerships.
|
2.
|
SUMMARY OF SIGNIFICANT ACCOUNTING POLICIES
|
Principles of Consolidation
The consolidated financial statements include our accounts and our wholly-owned subsidiaries. All significant intercompany transactions have been eliminated. Our primary subsidiaries as of December 31, 2013 are: Buyer’s Vehicle Protection Plan, Inc. (“BVPP”), Vehicle Remarketing Services, Inc. (“VRS”), VSC Re Company (“VSC Re”), CAC Warehouse Funding Corp. II, CAC Warehouse Funding III, LLC, CAC Warehouse Funding LLC IV, Credit Acceptance Funding LLC 2011-1, Credit Acceptance Funding LLC 2012-1, Credit Acceptance Funding LLC 2012-2, Credit Acceptance Funding LLC 2013-1 and Credit Acceptance Funding LLC 2013-2.
|
2.
|
SUMMARY OF SIGNIFICANT ACCOUNTING POLICIES – (Continued)
|
Business Segment Information
We currently operate in one reportable segment which represents our core business of offering Dealers financing programs and related products and services that enable them to sell vehicles to consumers regardless of their credit history. For information regarding our one reportable segment and related entity wide disclosures, see Note 16 to the consolidated financial statements.
Use of Estimates
The preparation of financial statements in conformity with accounting principles generally accepted in the United States of America (“GAAP”) requires us to make estimates and assumptions that affect the reported amounts of assets and liabilities and disclosure of contingent assets and liabilities at the date of the financial statements and the reported amounts of revenues and expenses during the reporting period. The accounts which are subject to significant estimation include the allowance for credit losses, finance charge revenue, premiums earned, stock-based compensation expense, contingencies, and uncertain tax positions. Actual results could materially differ from those estimates.
Cash and Cash Equivalents
Cash equivalents consist of readily marketable securities with original maturities at the date of acquisition of three months or less. As of December 31, 2013 and 2012, we had $3.6 million and $4.8 million, respectively, in cash and cash equivalents that were not insured by the Federal Deposit Insurance Corporation (“FDIC”).
Restricted Cash and Cash Equivalents
The following table summarizes restricted cash and cash equivalents:
|
(In millions)
|
As of December 31,
|
||||||
|
2013
|
2012
|
||||||
|
Cash related to secured financings
|
$
|
110.1
|
$
|
90.2
|
|||
|
Cash held in VSC Re trusts for future vehicle service contract claims (1)
|
1.2
|
2.2
|
|||||
|
Total restricted cash and cash equivalents
|
$
|
111.3
|
$
|
92.4
|
|||
|
(1)
|
The unearned premium and claims reserve associated with the trusts are included in accounts payable and accrued liabilities in the consolidated balance sheets.
|
As of December 31, 2013 and 2012, we had $109.5 million and $82.0 million, respectively, in restricted cash and cash equivalents that were not insured by the FDIC.
Restricted Securities Available for Sale
Restricted securities available for sale consist of amounts held in trusts related to VSC Re. We determine the appropriate classification of our investments in debt securities at the time of purchase and reevaluate such determinations at each balance sheet date. Debt securities for which we do not have the intent or ability to hold to maturity are classified as available for sale, and stated at fair value with unrealized gains and losses, net of income taxes included in the determination of comprehensive income and reported as a component of shareholders’ equity.
|
2.
|
SUMMARY OF SIGNIFICANT ACCOUNTING POLICIES – (Continued)
|
Finance Charges
Finance charges is comprised of: (1) servicing fees earned as a result of servicing Consumer Loans assigned to us by Dealers under the Portfolio Program; (2) finance charge income from Purchased Loans; (3) fees earned from our third party ancillary product offerings; (4) monthly program fees charged to Dealers under the Portfolio Program; and (5) fees associated with certain Loans. We recognize finance charges under the interest method such that revenue is recognized on a level-yield basis based upon forecasted cash flows. For Dealer Loans only, certain direct origination costs such as salaries and credit reports are deferred and the net costs are recognized as an adjustment to finance charges over the life of the related Dealer Loan on a level-yield basis.
We provide Dealers the ability to offer vehicle service contracts to consumers through our relationships with Third Party Providers (“TPPs”). A vehicle service contract provides the consumer protection by paying for the repair or replacement of certain components of the vehicle in the event of a mechanical failure. We provide Dealers with an additional advance based on the retail price of the vehicle service contract. TPPs process claims on vehicle service contracts that are underwritten by third party insurers. We receive a fee for all vehicle service contracts sold by our Dealers when the vehicle is financed by us. The fee is included in the retail price of the vehicle service contract which is added to the Consumer Loan. We recognize our fee from the vehicle service contracts as part of finance charges on a level-yield basis based upon forecasted cash flows. We bear the risk of loss for claims on certain vehicle service contracts that are reinsured by us. We market the vehicle service contracts directly to our Dealers.
We provide Dealers the ability to offer a Guaranteed Asset Protection (“GAP”) product to consumers through our relationships with TPPs. GAP provides the consumer protection by paying the difference between the loan balance and the amount covered by the consumer’s insurance policy in the event of a total loss of the vehicle due to severe damage or theft. We provide Dealers with an additional advance based on the retail price of the GAP contract. TPPs process claims on GAP contracts that are underwritten by third party insurers. We receive a fee for all GAP contracts sold by our Dealers when the vehicle is financed by us, and do not bear any risk of loss for claims. The fee is included in the retail price of the GAP contract which is added to the Consumer Loan. We recognize our fee from the GAP contracts as part of finance charges on a level-yield basis based upon forecasted cash flows.
Program fees represent monthly fees charged to Dealers for access to our Credit Approval Processing System (“CAPS”); administration, servicing and collection services offered by us; documentation related to or affecting our program; and all tangible and intangible property owned by Credit Acceptance. We charge a monthly fee of $599 to Dealers participating in our Portfolio Program and we collect it from future Dealer Holdback payments. As a result, we record program fees under the Portfolio Program as a yield adjustment, recognizing these fees as finance charge revenue over the forecasted net cash flows of the Dealer Loan.
Reinsurance
VSC Re, our wholly-owned subsidiary, is engaged in the business of reinsuring coverage under vehicle service contracts sold to consumers by Dealers on vehicles financed by us. VSC Re currently reinsures vehicle service contracts that are underwritten by one of our third party insurers. Vehicle service contract premiums, which represent the selling price of the vehicle service contract to the consumer, less fees and certain administrative costs, are contributed to trust accounts controlled by VSC Re. These premiums are used to fund claims covered under the vehicle service contracts. VSC Re is a bankruptcy remote entity. As such, our exposure to fund claims is limited to the trust assets
controlled by VSC Re and our net investment in VSC Re.
|
2.
|
SUMMARY OF SIGNIFICANT ACCOUNTING POLICIES – (Continued)
|
Premiums from the reinsurance of vehicle service contracts are recognized over the life of the policy in proportion to expected costs of servicing those contracts. Expected costs are determined based on our historical claims experience. Claims are expensed through a provision for claims in the period the claim was incurred. Capitalized acquisition costs are comprised of premium taxes and are amortized as general and administrative expense over the life of the contracts in proportion to premiums earned. A summary of reinsurance activity is as follows:
|
(In millions)
|
For the Years Ended December 31,
|
|||||||||
|
2013
|
2012
|
2011
|
||||||||
|
Net assumed written premiums
|
$
|
58.2
|
$
|
50.5
|
$
|
47.6
|
||||
|
Net premiums earned
|
51.5
|
47.1
|
40.0
|
|||||||
|
Provision for claims
|
40.8
|
34.8
|
30.4
|
|||||||
|
Amortization of capitalized acquisition costs
|
1.3
|
1.3
|
1.0
|
|||||||
We are considered the primary beneficiary of the trusts and as a result, the trusts have been consolidated on our balance sheet. The trust assets and related reinsurance liabilities are as follows:
|
(In millions)
|
As of December 31,
|
|||||||
|
Balance Sheet location
|
2013
|
2012
|
||||||
|
Trust assets
|
Restricted cash and cash equivalents
|
$
|
1.2
|
$
|
2.2
|
|||
|
Trust assets
|
Restricted securities available for sale
|
53.6
|
46.1
|
|||||
|
Unearned premium
|
Accounts payable and accrued liabilities
|
42.4
|
35.7
|
|||||
|
Claims reserve (1)
|
Accounts payable and accrued liabilities
|
1.7
|
1.4
|
|||||
(1)
The claims reserve is estimated based on historical claims experience.
Our determination to consolidate the VSC Re trusts was based on the following:
|
·
|
First, we determined that the trusts qualified as variable interest entities. The trusts have insufficient equity at risk as no parties to the trusts were required to contribute assets that provide them with any ownership interest.
|
|
·
|
Next, we determined that we have variable interests in the trusts. We have a residual interest in the assets of the trusts, which is variable in nature, given that it increases or decreases based upon the actual loss experience of the related service contracts. In addition, VSC Re is required to absorb any losses in excess of the trusts’ assets.
|
|
·
|
Next, we evaluated the purpose and design of the trusts. The primary purpose of the trusts is to provide TPPs with funds to pay claims on vehicle service contracts and to accumulate and provide us with proceeds from investment income and residual funds.
|
|
·
|
Finally, we determined that we are the primary beneficiary of the trusts. We control the amount of premium written and placed in the trusts through Consumer Loan assignments under our Programs, which is the activity that most significantly impacts the economic performance of the trusts. We have the right to receive benefits from the trusts that could potentially be significant. In addition, VSC Re has the obligation to absorb losses of the trusts that could potentially be significant.
|
Other Income
Other income consists of the following:
|
(In millions)
|
For the Years Ended December 31,
|
|||||||||
|
2013
|
2012
|
2011
|
||||||||
|
Vendor fees
|
$
|
15.0
|
$
|
7.8
|
$
|
4.2
|
||||
|
Dealer support products and services
|
9.8
|
8.0
|
7.3
|
|||||||
|
Ancillary product profit sharing income
|
8.3
|
3.4
|
7.8
|
|||||||
|
Dealer enrollment fees
|
4.5
|
4.0
|
3.5
|
|||||||
|
Other
|
2.6
|
0.7
|
1.8
|
|||||||
|
Total
|
$
|
40.2
|
$
|
23.9
|
$
|
24.6
|
||||
|
2.
|
SUMMARY OF SIGNIFICANT ACCOUNTING POLICIES – (Continued)
|
Vendor fees primarily consist of fees we receive from TPPs for providing Dealers in certain states the ability to purchase Global Positioning Systems (“GPS”) with Starter Interrupt Devices (“SID”). Through this program, Dealers can install a GPS-based SID (“GPS-SID”) on vehicles financed by us that can be activated if the consumer fails to make payments on their account, and can result in the prompt repossession of the vehicle. Dealers purchase the GPS-SID directly from TPPs and the TPPs pay us a vendor fee for each device sold. GPS-SID income is recognized when the unit is sold. Vendor fees also include fee payments received on a monthly basis from vendors that process payments. We recognize these fees as income in the period the services are provided.
Dealer support products and services revenue primarily consists of remarketing fees retained from the sale of repossessed vehicles by VRS, our wholly-owned subsidiary that is responsible for remarketing vehicles for Credit Acceptance. VRS coordinates vehicle repossessions with a nationwide network of repossession agents, the redemption of the vehicle by the consumer, or the sale of the vehicle through a nationwide network of vehicle auctions. VRS recognizes income from the retained fees at the time of the sale and does not retain a fee if a repossessed vehicle is redeemed by the consumer prior to the sale. Dealer support products and services revenue also includes income from products and services provided to Dealers to assist with their vehicle inventory and is recognized in the period the service is provided.
Ancillary product profit sharing income consists of payments received from TPPs based upon the performance of GAP and vehicle service contract products. GAP profit sharing payments are received once a year, if eligible. Prior to the second quarter of 2011, we received and recognized GAP profit sharing payments annually in the first quarter of each year as the payments were not estimable. During the second quarter of 2011, we began recognizing this income over the life of the GAP contracts. During 2012, we entered into a new profit sharing arrangement with one of our vehicle service contract TPPs. Vehicle service contract profit sharing payments are received twice a year, if eligible, and are recognized as income over the life of the vehicle service contracts.
Dealer enrollment fees include fees from Dealers that enroll in our programs. Depending on the enrollment option selected by the Dealer and the date of enrollment, Dealers may have enrolled by paying us an upfront, one-time fee, agreeing to allow us to retain 50% of their first accelerated Dealer Holdback payment, or both. For additional information regarding program enrollment, see Note 1 to the consolidated financial statements. A portion of the $9,850 upfront, one-time fee and all of the $1,950 upfront, one-time fee are considered to be Dealer support products and services revenue. The remaining portion of the $9,850 fee is considered to be a Dealer enrollment fee, which is amortized on a straight-line basis over the estimated life of the Dealer relationship. The 50% portion of the first accelerated Dealer Holdback payment is also considered to be a Dealer enrollment fee. We do not recognize any of this Dealer enrollment fee until the Dealer has met the eligibility requirements to receive an accelerated Dealer Holdback payment and the amount of the first payment, if any, has been calculated. Once the accelerated Dealer Holdback payment has been calculated, we defer the 50% portion that we keep and recognize it on a straight-line basis over the remaining estimated life of the Dealer relationship.
Loans Receivable and Allowance for Credit Losses
Consumer Loan Assignment.
For accounting and financial reporting purposes, a Consumer Loan is considered to have been assigned to us after all of the following has occurred:
|
·
|
the consumer and Dealer have signed a Consumer Loan contract;
|
|
·
|
we have received the original Consumer Loan contract and supporting documentation;
|
|
·
|
we have approved all of the related stipulations for funding; and
|
|
·
|
we have provided funding to the Dealer in the form of either an advance under the Portfolio Program or one-time purchase payment under the Purchase Program.
|
Portfolio Segments and Classes.
We are considered to be a lender to our Dealers for Consumer Loans assigned under our Portfolio Program and a purchaser of Consumer Loans assigned under our Purchase Program. As a result, our Loan portfolio consists of two portfolio segments: Dealer Loans and Purchased Loans. Each portfolio segment is comprised of one class of Consumer Loan assignments, which is Consumer Loans with deteriorated credit quality that were originated by Dealers to finance consumer purchases of vehicles and related ancillary products.
|
2.
|
SUMMARY OF SIGNIFICANT ACCOUNTING POLICIES – (Continued)
|
Dealer Loans
. Amounts advanced to Dealers for Consumer Loans assigned under the Portfolio Program are recorded as Dealer Loans and are aggregated by Dealer for purposes of recognizing revenue and evaluating impairment. We account for Dealer Loans in a manner consistent with loans acquired with deteriorated credit quality. The outstanding balance of each Dealer Loan included in Loans receivable is comprised of the following:
|
·
|
the aggregate amount of all cash advances paid;
|
|
·
|
finance charges;
|
|
·
|
Dealer Holdback payments;
|
|
·
|
accelerated Dealer Holdback payments; and
|
|
·
|
recoveries.
|
Less:
|
·
|
collections (net of certain collection costs); and
|
|
·
|
write-offs.
|
An allowance for credit losses is maintained at an amount that reduces the net asset value (Dealer Loan balance less the allowance) to the value of forecasted future cash flows discounted at the yield established at the time of assignment. This allowance calculation is completed for each individual Dealer. The discounted value of future cash flows is comprised of estimated future collections on the Consumer Loans, less any estimated Dealer Holdback payments. We write off Dealer Loans once there are no forecasted future cash flows on any of the associated Consumer Loans, which generally occurs 120 months after the last Consumer Loan assignment.
Future collections on Dealer Loans are forecasted based on the historical performance of Consumer Loans with similar characteristics, adjusted for recent trends in payment patterns. Dealer Holdback is forecasted based on the expected future collections and current advance balance of each Dealer Loan. Cash flows from any individual Dealer Loan are often different than estimated cash flows at the time of assignment. If such difference is favorable, the difference is recognized prospectively into income over the remaining life of the Dealer Loan through a yield adjustment. If such difference is unfavorable, a provision for credit losses is recorded immediately as a current period expense and a corresponding allowance for credit losses is established. Because differences between estimated cash flows at the time of assignment and actual cash flows occur often, an allowance is required for a significant portion of our Dealer Loan portfolio. An allowance for credit losses does not necessarily indicate that a Dealer Loan is unprofitable, and seldom are cash flows from a Dealer Loan insufficient to repay the initial amounts advanced to the Dealer.
Purchased Loans
. Amounts paid to Dealers for Consumer Loans assigned under the Purchase Program are recorded as Purchased Loans and are aggregated into pools based on the month of purchase for purposes of recognizing revenue and evaluating impairment. We account for Purchased Loans as loans acquired with deteriorated credit quality. The outstanding balance of each Purchased Loan pool included in Loans receivable is comprised of the following:
|
·
|
the aggregate amount of all amounts paid during the month of purchase to purchase Consumer Loans from Dealers;
|
|
·
|
finance charges; and
|
|
·
|
recoveries.
|
Less:
|
·
|
collections (net of certain collection costs); and
|
|
·
|
write-offs.
|
An allowance for credit losses is maintained at an amount that reduces the net asset value (Purchased Loan pool balance less the allowance) to the value of forecasted future cash flows discounted at the yield established at the time of assignment. This allowance calculation is completed for each individual monthly pool of Purchased Loans. The discounted value of future cash flows is comprised of estimated future collections on the pool of Purchased Loans. We write off pools of Purchased Loans once there are no forecasted future cash flows on any of the Purchased Loans included in the pool, which generally occurs 120 months after the month of purchase.
|
2.
|
SUMMARY OF SIGNIFICANT ACCOUNTING POLICIES – (Continued)
|
Future collections on Purchased Loans are forecasted based on the historical performance of Consumer Loans with similar characteristics, adjusted for recent trends in payment patterns. Cash flows from any individual pool of Purchased Loans are often different than estimated cash flows at the time of assignment. If such difference is favorable, the difference is recognized prospectively into income over the remaining life of the pool of Purchased Loans through a yield adjustment. If such difference is unfavorable, a provision for credit losses is recorded immediately as a current period expense and a corresponding allowance for credit losses is established.
Credit Quality.
Substantially all of the Consumer Loans assigned to us are made to individuals with impaired or limited credit histories or higher debt-to-income ratios than are permitted by traditional lenders. Consumer Loans made to these individuals generally entail a higher risk of delinquency, default and repossession and higher losses than loans made to consumers with better credit. Since most of our revenue and cash flows are generated from these Consumer Loans, our ability to accurately forecast Consumer Loan performance is critical to our business and financial results. At the time the Consumer Loan is submitted to us for assignment, we forecast future expected cash flows from the Consumer Loan. Based on these forecasts, an advance or one-time purchase payment is made to the related Dealer at a price designed to achieve an acceptable return on capital.
We monitor and evaluate the credit quality of Consumer Loans on a monthly basis by comparing our current forecasted collection rates to our initial expectations. We use a statistical model that considers a number of credit quality indicators to estimate the expected collection rate for each Consumer Loan at the time of assignment. The credit quality indicators considered in our model include attributes contained in the consumer’s credit bureau report, data contained in the consumer’s credit application, the structure of the proposed transaction, vehicle information and other factors. We continue to evaluate the expected collection rate of each Consumer Loan subsequent to assignment primarily through the monitoring of consumer payment behavior. Our evaluation becomes more accurate as the Consumer Loans age, as we use actual performance data in our forecast. Since all known, significant credit quality indicators have already been factored into our forecasts and pricing, we are not able to use any specific credit quality indicators to predict or explain variances in actual performance from our initial expectations. Any variances in performance from our initial expectations are the result of Consumer Loans performing differently than historical Consumer Loans with similar characteristics. We periodically adjust our statistical pricing model for new trends that we identify though our evaluation of these forecasted collection rate variances.
When overall forecasted collection rates underperform our initial expectations, the decline in forecasted collections has a more adverse impact on the profitability of the Purchased Loans than on the profitability of the Dealer Loans. For Purchased Loans, the decline in forecasted collections is absorbed entirely by us. For Dealer Loans, the decline in the forecasted collections is substantially offset by a decline in forecasted payments of Dealer Holdback.
Methodology Changes.
For the year ended December 31, 2012, we enhanced the computations used to account for Dealer Loans and for the year ended December 31, 2013, we enhanced our methodology for forecasting future collections on Loans, both of which are described more fully in Note 5 to the consolidated financial statements. For the three year period ended December 31, 2013, we did not make any other methodology changes for Loans that had a material impact on our financial results.
Property and Equipment
Purchases of property and equipment are recorded at cost. Depreciation is provided on a straight-line basis over the estimated useful life of the asset. Estimated useful lives are generally as follows: buildings – 40 years, building improvements – 10 years, data processing equipment – 3 years, software – 5 years, office furniture and equipment – 7 years, and leasehold improvements – the lesser of the lease term or 7 years. The cost of assets sold or retired and the related accumulated depreciation are removed from the balance sheet at the time of disposition and any resulting gain or loss is included in operations. Maintenance, repairs and minor replacements are charged to operations as incurred; major replacements and improvements are capitalized. We evaluate long-lived assets for impairment whenever events or changes in circumstances indicate that the carrying amount of an asset may not be recoverable.
Costs incurred during the application development stage of software developed for internal use are capitalized and generally depreciated on a straight-line basis over five years. Costs incurred to maintain existing product offerings are expensed as incurred. For additional information regarding our property and equipment, see Note 7 to the consolidated financial statements.
|
2.
|
SUMMARY OF SIGNIFICANT ACCOUNTING POLICIES – (Continued)
|
As of December 31, 2013 and 2012, deferred debt issuance costs were $15.1 million and $17.5 million, respectively, and are included in other assets in the consolidated balance sheets. Expenses associated with the issuance of debt instruments are capitalized and amortized as interest expense over the term of the debt instrument using the effective interest method for asset-backed secured financings (“Term ABS”) and senior notes and the straight-line method for lines of credit and revolving secured warehouse (“Warehouse”) facilities.
Income Taxes
Provisions for federal, state and foreign income taxes are calculated on reported pre-tax earnings based on current tax law and also include, in the current period, the cumulative effect of any changes in tax rates from those used previously in determining deferred tax assets and liabilities. Such provisions differ from the amounts currently receivable or payable because certain items of income and expense are recognized in different time periods for financial reporting purposes than for income tax purposes.
Deferred income tax balances reflect the effects of temporary differences between the carrying amounts of assets and liabilities and their tax bases and are stated at enacted tax rates expected to be in effect when taxes are actually paid or recovered.
We follow a two-step approach for recognizing uncertain tax positions. First, we evaluate the tax position for recognition by determining if the weight of available evidence indicates it is more-likely-than-not that the position will be sustained upon examination, including resolution of related appeals or litigation processes, if any. Second, for positions that we determine are more-likely-than-not to be sustained, we recognize the tax benefit as the largest benefit that has a greater than 50% likelihood of being sustained. We establish a reserve for uncertain tax positions liability that is comprised of unrecognized tax benefits and related interest. We consider many factors when evaluating and estimating our tax positions and tax benefits, which may require periodic adjustments and which may not accurately anticipate actual outcomes. We recognize interest and penalties related to uncertain tax positions in the provision for income taxes. For additional information regarding our income taxes, see Note 11 to the consolidated financial statements.
Derivative and Hedging Instruments
We rely on various sources of financing, some of which contain floating rates of interest and expose us to risks associated with increases in interest rates. We manage such risk primarily by entering into interest rate cap and interest rate swap agreements (“derivative instruments”).
For derivative instruments that are designated and qualify as hedging instruments, we formally document all relationships between the hedging instruments and hedged items, as well as their risk-management objective and strategy for undertaking various hedge transactions. This process includes linking all derivative instruments that are designated as cash flow hedges to specific assets and liabilities on the balance sheet. We also formally assess (both at the hedge’s inception and on a quarterly basis) whether the derivative instruments that are used in hedging transactions have been highly effective in offsetting changes in the cash flows of hedged items and whether those derivative instruments may be expected to remain highly effective in the future periods. The effective portion of changes in the fair value of the derivative instruments is recorded in other comprehensive income, net of income taxes. If it is determined that a derivative instrument is not (or has ceased to be) highly effective as a hedge, we would discontinue hedge accounting prospectively and the ineffective portion of changes in fair value would be recorded in interest expense. For derivative instruments not designated as hedges, changes in the fair value of these agreements increase or decrease interest expense.
We recognize derivative instruments as either other assets or accounts payable and accrued liabilities on our consolidated balance sheets. For additional information regarding our derivative and hedging instruments, see Note 9 to the consolidated financial statements.
|
2.
|
SUMMARY OF SIGNIFICANT ACCOUNTING POLICIES – (Continued)
|
Stock-Based Compensation Plans
We have stock-based compensation plans for team members and non-employee directors, which are described more fully in Note 14 to the consolidated financial statements. We apply a fair-value-based measurement method in accounting for stock-based compensation plans and recognize stock-based compensation expense over the requisite service period of the grant as salaries and wages expense.
Employee Benefit Plan
We sponsor a 401(k) plan that covers substantially all of our team members. We offer matching contributions to the 401(k) plan based on each enrolled team members’ eligible annual gross pay (subject to statutory limitations). Our matching contribution rate is equal to 100% of the first 1% participants contribute and an additional 50% of the next 5% participants contribute, for a maximum matching contribution of 3.5% of each participant’s eligible annual gross pay. For the years ended December 31, 2013, 2012 and 2011, we recognized compensation expense of $2.2 million, $1.8 million, and $1.6 million, respectively, for our matching contributions to the plan.
Advertising Costs
Advertising costs are expensed as incurred. For the years ended December 31, 2013, 2012 and 2011, advertising expenses were $0.2 million, in each year.
New Accounting Updates
Accounting for Costs Associated with Acquiring or Renewing Insurance Contracts
. In October 2010, the Financial Accounting Standards Board (“FASB”) issued Accounting Standards Update (“ASU”) No. 2010-26, which amends Topic 944 (Financial Services – Insurance). ASU No. 2010-26 is intended to address diversity in practice regarding the interpretation of which costs relating to the acquisition of new or renewal insurance contracts qualify for deferral. The amendments specify which costs incurred in the acquisition of new and renewal contracts should be capitalized. ASU No. 2010-26 is effective for fiscal years beginning after December 15, 2011. While the guidance in this ASU is required to be applied prospectively upon adoption, retrospective application is also permitted (to all prior periods presented). Early adoption is also permitted, but only at the beginning of an entity’s annual reporting period. The adoption of ASU No. 2010-26 on January 1, 2012 did not have a material impact on our consolidated financial statements.
Amendments to Achieve Common Fair Value Measurement and Disclosure Requirements in U.S. GAAP and IFRSs
. In May 2011, the FASB issued ASU No. 2011-04 which amends Topic 820 (Fair Value Measurement). ASU No. 2011-04 is intended to provide a consistent definition of fair value and common requirements for measurement of and disclosure about fair value between U.S. GAAP and IFRS. The amendments in ASU No. 2011-04 include changes regarding how and when the valuation premise of highest and best use applies, the application of premiums and discounts, and new required disclosures. ASU No. 2011-04 is to be applied prospectively upon adoption and is effective for interim and annual periods beginning after December 15, 2011 with early adoption prohibited. The adoption of ASU No. 2011-04 on January 1, 2012 did not have a material impact on our consolidated financial statements, but expanded our disclosures related to fair value measurements.
Reporting of Amounts Reclassified Out of Accumulated Other Comprehensive Income.
In February 2013, the FASB issued ASU No. 2013-2 which requires an entity to provide information about the amounts reclassified out of accumulated other comprehensive income by component. The new guidance requires an entity to disaggregate the total change of each component of other comprehensive income either on the face of the income statement or as a separate disclosure in the notes to the financial statements. The amendments in ASU 2013-02 do not change the current requirements for reporting net income or other comprehensive income in financial statements. ASU 2013-02 is effective for fiscal years beginning after December 15, 2012. The adoption of ASU No. 2013-2 on January 1, 2013 did not have a material impact on our consolidated financial statements.
|
2.
|
SUMMARY OF SIGNIFICANT ACCOUNTING POLICIES – (Concluded)
|
Presentation of an Unrecognized Tax Benefit When a Net Operating Loss Carryforward, a Similar Tax Loss, or a Tax Credit Carryforward Exists.
In July 2013, the FASB issued ASU No. 2013-11 which requires an entity to net its liability for unrecognized tax positions against a net operating loss carryforward, a similar tax loss or a tax credit carryforward when settlement in this manner is available under the tax law. ASU 2013-11 is effective for fiscal years, and interim periods, beginning after December 15, 2013, with early adoption permitted. The adoption of ASU No. 2013-11 is not expected to have a material impact on our consolidated financial statements.
Subsequent Events
We have evaluated events and transactions occurring subsequent to the consolidated balance sheet date of December 31, 2013 for items that could potentially be recognized or disclosed in these financial statements. For additional information regarding subsequent events, see Note 18 to the consolidated financial statements.
3. FAIR VALUE OF FINANCIAL INSTRUMENTS
The following methods and assumptions were used to estimate the fair value of each class of financial instruments for which it is practicable to estimate their value.
Cash and Cash Equivalents and Restricted Cash and Cash Equivalents.
The carrying amount of cash and cash equivalents and restricted cash and cash equivalents approximate their fair value due to the short maturity of these instruments.
Restricted Securities Available for Sale.
Restricted securities consist of amounts held in trusts by TPPs to pay claims on vehicle service contracts. Securities for which we do not have the intent or ability to hold to maturity are classified as available for sale and stated at fair value. The fair value of restricted securities are generally based on quoted market values in active markets. For commercial paper and certificates of deposit, we use model-based valuation techniques for which all significant assumptions are observable in the market.
Net Investment in Loans Receivable.
Loans receivable, net represents our net investment in Loans. The fair value is determined by calculating the present value of future Loan payment inflows and Dealer Holdback outflows estimated by us utilizing a discount rate comparable with the rate used to calculate our allowance for credit losses.
Liabilities.
The fair value of our senior notes is determined using quoted market prices in an active market. The fair value of our Term ABS financings is also determined using quoted market prices, however, these instruments trade in a market with much lower trading volume. For our revolving secured line of credit, our Warehouse Facilities and our mortgage note, the fair values are calculated using the estimated value of each debt instrument based on current rates for debt with similar risk profiles and maturities.
A comparison of the carrying value and estimated fair value of these financial instruments is as follows:
|
(In millions)
|
As of December 31,
|
||||||||||||
|
2013
|
2012
|
||||||||||||
|
Carrying
Amount
|
Estimated
Fair Value
|
Carrying
Amount
|
Estimated
Fair Value
|
||||||||||
|
Assets
|
|||||||||||||
|
Cash and cash equivalents
|
$
|
4.2
|
$
|
4.2
|
$
|
9.0
|
$
|
9.0
|
|||||
|
Restricted cash and cash equivalents
|
111.3
|
111.3
|
92.4
|
92.4
|
|||||||||
|
Restricted securities available for sale
|
53.6
|
53.6
|
46.1
|
46.1
|
|||||||||
|
Net investment in Loans receivable
|
2,212.8
|
2,226.7
|
1,933.5
|
1,951.4
|
|||||||||
|
Liabilities
|
|||||||||||||
|
Revolving secured line of credit
|
$
|
102.8
|
$
|
102.8
|
$
|
43.5
|
$
|
43.5
|
|||||
|
Secured financing
|
935.6
|
938.9
|
853.0
|
863.0
|
|||||||||
|
Mortgage note
|
3.8
|
3.8
|
4.0
|
4.0
|
|||||||||
|
Senior notes
|
350.2
|
367.1
|
350.3
|
381.9
|
|||||||||
|
3.
|
FAIR VALUE OF FINANCIAL INSTRUMENTS – (Concluded)
|
Fair value is an exit price, representing the amount that would be received to sell an asset or paid to transfer a liability in an orderly transaction between market participants. As such, fair value is a market-based measurement that should be determined based on assumptions that market participants would use in pricing an asset or liability. We group assets and liabilities at fair value in three levels, based on the markets in which the assets and liabilities are traded and the reliability of the assumptions used to determine fair value. These levels are:
|
Level 1
|
Valuation is based upon quoted prices for identical instruments traded in active markets.
|
|
Level 2
|
Valuation is based upon quoted prices for similar instruments in active markets, quoted prices for identical or similar instruments in markets that are not active, and model-based valuation techniques for which all significant assumptions are observable in the market.
|
|
Level 3
|
Valuation is generated from model-based techniques that use at least one significant assumption not observable in the market. These unobservable assumptions reflect estimates or assumptions that market participants would use in pricing the asset or liability.
|
The following table provides the level of measurement used to determine the fair value for each of our financial instruments on a recurring basis, as of December 31, 2013 and 2012:
|
(In millions)
|
||||||||||||
|
As of December 31, 2013
|
||||||||||||
|
Level 1
|
Level 2
|
Level 3
|
Total Fair Value
|
|||||||||
|
Assets
|
||||||||||||
|
Cash and cash equivalents
|
$
|
4.2
|
$
|
–
|
$
|
–
|
$
|
4.2
|
||||
|
Restricted cash and cash equivalents
|
111.3
|
–
|
–
|
111.3
|
||||||||
|
Restricted securities available for sale
|
25.1
|
28.5
|
–
|
53.6
|
||||||||
|
Net investment in Loans receivable
|
–
|
–
|
2,226.7
|
2,226.7
|
||||||||
|
Liabilities
|
||||||||||||
|
Revolving secured line of credit
|
$
|
–
|
$
|
102.8
|
$
|
–
|
$
|
102.8
|
||||
|
Secured financing
|
–
|
938.9
|
–
|
938.9
|
||||||||
|
Mortgage note
|
–
|
3.8
|
–
|
3.8
|
||||||||
|
Senior notes
|
367.1
|
–
|
–
|
367.1
|
||||||||
|
(In millions)
|
||||||||||||
|
As of December 31, 2012
|
||||||||||||
|
Level 1
|
Level 2
|
Level 3
|
Total Fair Value
|
|||||||||
|
Assets
|
||||||||||||
|
Cash and cash equivalents
|
$
|
9.0
|
$
|
–
|
$
|
–
|
$
|
9.0
|
||||
|
Restricted cash and cash equivalents
|
92.4
|
–
|
–
|
92.4
|
||||||||
|
Restricted securities available for sale (1)
|
24.0
|
22.1
|
–
|
46.1
|
||||||||
|
Net investment in Loans receivable
|
–
|
–
|
1,951.4
|
1,951.4
|
||||||||
|
Liabilities
|
||||||||||||
|
Revolving secured line of credit
|
$
|
–
|
$
|
43.5
|
$
|
–
|
$
|
43.5
|
||||
|
Secured financing
|
–
|
863.0
|
–
|
863.0
|
||||||||
|
Mortgage note
|
–
|
4.0
|
–
|
4.0
|
||||||||
|
Senior notes
|
381.9
|
–
|
–
|
381.9
|
||||||||
(1)
Certificates of deposit totaling $3.3 million were reclassified from Level 1 to Level 2 to agree with current year presentation.
4. RESTRICTED SECURITIES AVAILABLE FOR SALE
Restricted securities available for sale consist of the following:
|
(In millions)
|
As of December 31, 2013
|
|||||||||||||||
|
Cost
|
Gross Unrealized Gains
|
Gross Unrealized Losses
|
Estimated
Fair Value
|
|||||||||||||
|
Commercial paper
|
$ | 23.9 | $ | – | $ | – | $ | 23.9 | ||||||||
|
US Government and agency securities
|
22.3 | – | (0.2 | ) | 22.1 | |||||||||||
|
Certificates of deposit
|
4.6 | – | – | 4.6 | ||||||||||||
|
Corporate bonds
|
3.1 | – | (0.1 | ) | 3.0 | |||||||||||
|
Total restricted securities available for sale
|
$ | 53.9 | $ | – | $ | (0.3 | ) | $ | 53.6 | |||||||
|
(In millions)
|
As of December 31, 2012
|
|||||||||||||||
|
Cost
|
Gross Unrealized Gains
|
Gross Unrealized Losses
|
Estimated
Fair Value
|
|||||||||||||
|
US Government and agency securities
|
$ | 20.6 | $ | – | $ | (0.1 | ) | $ | 20.5 | |||||||
|
Commercial paper
|
18.9 | – | (0.1 | ) | 18.8 | |||||||||||
|
Corporate bonds
|
3.3 | – | – | 3.3 | ||||||||||||
|
Certificates of deposit
|
3.3 | – | – | 3.3 | ||||||||||||
|
Foreign Government bonds
|
0.2 | – | – | 0.2 | ||||||||||||
|
Total restricted securities available for sale
|
$ | 46.3 | $ | – | $ | (0.2 | ) | $ | 46.1 | |||||||
The fair value and gross unrealized losses for restricted securities available for sale, aggregated by investment category and length of time that individual securities have been in a continuous unrealized loss position, are as follows:
|
(In millions)
|
Securities Available for Sale with Gross Unrealized Losses
as of December 31, 2013
|
||||||||||||||||||
|
Less than 12 Months
|
12 Months or More
|
||||||||||||||||||
|
Estimated
Fair Value
|
Gross
Unrealized
Losses
|
Estimated
Fair Value
|
Gross
Unrealized
Losses
|
Total Estimated
Fair Value
|
Total
Gross
Unrealized Losses
|
||||||||||||||
|
Commercial paper
|
$
|
10.0
|
$
|
–
|
$
|
–
|
$
|
–
|
$
|
10.0
|
$
|
–
|
|||||||
|
US Government and agency securities
|
11.8
|
(0.2
|
)
|
–
|
–
|
11.8
|
(0.2
|
)
|
|||||||||||
|
Certificates of deposit
|
1.9
|
–
|
–
|
–
|
1.9
|
–
|
|||||||||||||
|
Corporate bonds
|
2.3
|
(0.1
|
)
|
–
|
–
|
2.3
|
(0.1
|
)
|
|||||||||||
|
Total restricted securities available for sale
|
$
|
26.0
|
$
|
(0.3
|
)
|
$
|
–
|
$
|
–
|
$
|
26.0
|
$
|
(0.3
|
)
|
|||||
|
(In millions)
|
Securities Available for Sale with Gross Unrealized Losses
as of December 31, 2012
|
||||||||||||||||||
|
Less than 12 Months
|
12 Months or More
|
||||||||||||||||||
|
Estimated
Fair Value
|
Gross
Unrealized
Losses
|
Estimated
Fair Value
|
Gross
Unrealized
Losses
|
Total Estimated
Fair Value
|
Total
Gross
Unrealized Losses
|
||||||||||||||
|
US Government and agency securities
|
$
|
16.7
|
$
|
(0.1
|
)
|
$
|
–
|
$
|
–
|
$
|
16.7
|
$
|
(0.1
|
)
|
|||||
|
Commercial paper
|
2.8
|
(0.1
|
)
|
–
|
–
|
2.8
|
(0.1
|
)
|
|||||||||||
|
Corporate bonds
|
2.3
|
–
|
–
|
–
|
2.3
|
–
|
|||||||||||||
|
Certificates of deposit
|
1.5
|
–
|
–
|
–
|
1.5
|
–
|
|||||||||||||
|
Foreign Government bonds
|
0.1
|
–
|
–
|
–
|
0.1
|
–
|
|||||||||||||
|
Total restricted securities available for sale
|
$
|
23.4
|
$
|
(0.2
|
)
|
$
|
–
|
$
|
–
|
$
|
23.4
|
$
|
(0.2
|
)
|
|||||
4. RESTRICTED SECURITIES AVAILABLE FOR SALE – (Concluded)
The cost and estimated fair values of debt securities by contractual maturity were as follows (securities with multiple maturity dates are classified in the period of final maturity). Expected maturities will differ from contractual maturities because borrowers may have the right to call or prepay obligations with or without call or prepayment penalties.
|
(In millions)
|
As of December 31,
|
||||||||||||
|
2013
|
2012
|
||||||||||||
|
Cost
|
Estimated Fair Value
|
Cost
|
Estimated Fair Value
|
||||||||||
|
Contractual Maturity
|
|||||||||||||
|
Within one year
|
$
|
41.6
|
$
|
41.6
|
$
|
33.8
|
$
|
33.7
|
|||||
|
Over one year to five years
|
7.8
|
7.8
|
8.6
|
8.6
|
|||||||||
|
Over five years to ten years
|
4.5
|
4.2
|
3.9
|
3.8
|
|||||||||
|
Total restricted securities available for sale
|
$
|
53.9
|
$
|
53.6
|
$
|
46.3
|
$
|
46.1
|
|||||
|
5.
|
LOANS RECEIVABLE
|
Loans receivable consists of the following:
|
(In millions)
|
As of December 31, 2013
|
|||||||||
|
Dealer Loans
|
Purchased Loans
|
Total
|
||||||||
|
Loans receivable
|
$
|
2,155.5
|
$
|
252.7
|
$
|
2,408.2
|
||||
|
Allowance for credit losses
|
(185.7
|
)
|
(9.7
|
)
|
(195.4
|
)
|
||||
|
Loans receivable, net
|
$
|
1,969.8
|
$
|
243.0
|
$
|
2,212.8
|
||||
|
(In millions)
|
As of December 31, 2012
|
|||||||||
|
Dealer Loans
|
Purchased Loans
|
Total
|
||||||||
|
Loans receivable
|
$
|
1,869.4
|
$
|
240.5
|
$
|
2,109.9
|
||||
|
Allowance for credit losses
|
(167.4
|
)
|
(9.0
|
)
|
(176.4
|
)
|
||||
|
Loans receivable, net
|
$
|
1,702.0
|
$
|
231.5
|
$
|
1,933.5
|
||||
|
5.
|
LOANS RECEIVABLE – (Continued)
|
A summary of changes in Loans receivable is as follows:
|
(In millions)
|
For the Year Ended December 31, 2013
|
|||||||||
|
Dealer Loans
|
Purchased Loans
|
Total
|
||||||||
|
Balance, beginning of period
|
$
|
1,869.4
|
$
|
240.5
|
$
|
2,109.9
|
||||
|
New Consumer Loan assignments (1)
|
1,356.6
|
124.0
|
1,480.6
|
|||||||
|
Principal collected on Loans receivable
|
(1,204.6
|
)
|
(129.8
|
)
|
(1,334.4
|
)
|
||||
|
Accelerated Dealer Holdback payments
|
40.4
|
–
|
40.4
|
|||||||
|
Dealer Holdback payments
|
114.2
|
–
|
114.2
|
|||||||
|
Transfers (2)
|
(17.9
|
)
|
17.9
|
–
|
||||||
|
Write-offs
|
(5.2
|
)
|
(0.1
|
)
|
(5.3
|
)
|
||||
|
Recoveries (3)
|
2.2
|
0.2
|
2.4
|
|||||||
|
Net change in other loans
|
0.4
|
–
|
0.4
|
|||||||
|
Balance, end of period
|
$
|
2,155.5
|
$
|
252.7
|
$
|
2,408.2
|
||||
|
(In millions)
|
For the Year Ended December 31, 2012
|
|||||||||
|
Dealer Loans
|
Purchased Loans
|
Total
|
||||||||
|
Balance, beginning of period
|
$
|
1,506.5
|
$
|
246.4
|
$
|
1,752.9
|
||||
|
New Consumer Loan assignments (1)
|
1,253.6
|
108.8
|
1,362.4
|
|||||||
|
Principal collected on Loans receivable
|
(1,024.8
|
)
|
(138.0
|
)
|
(1,162.8
|
)
|
||||
|
Accelerated Dealer Holdback payments
|
43.7
|
–
|
43.7
|
|||||||
|
Dealer Holdback payments
|
115.7
|
–
|
115.7
|
|||||||
|
Transfers (2)
|
(23.8
|
)
|
23.8
|
–
|
||||||
|
Write-offs
|
(3.6
|
)
|
(0.6
|
)
|
(4.2
|
)
|
||||
|
Recoveries (3)
|
2.2
|
0.1
|
2.3
|
|||||||
|
Net change in other loans
|
(0.1
|
)
|
–
|
(0.1
|
)
|
|||||
|
Balance, end of period
|
$
|
1,869.4
|
$
|
240.5
|
$
|
2,109.9
|
||||
|
(In millions)
|
For the Year Ended December 31, 2011
|
|||||||||
|
Dealer Loans
|
Purchased Loans
|
Total
|
||||||||
|
Balance, beginning of period
|
$
|
1,082.0
|
$
|
262.9
|
$
|
1,344.9
|
||||
|
New Consumer Loan assignments (1)
|
1,152.5
|
122.2
|
1,274.7
|
|||||||
|
Principal collected on Loans receivable
|
(843.1
|
)
|
(153.8
|
)
|
(996.9
|
)
|
||||
|
Accelerated Dealer Holdback payments
|
47.4
|
–
|
47.4
|
|||||||
|
Dealer Holdback payments
|
85.2
|
–
|
85.2
|
|||||||
|
Transfers (2)
|
(15.5
|
)
|
15.5
|
–
|
||||||
|
Write-offs
|
(3.0
|
)
|
(0.5
|
)
|
(3.5
|
)
|
||||
|
Recoveries (3)
|
1.8
|
0.1
|
1.9
|
|||||||
|
Net change in other loans
|
(0.8
|
)
|
–
|
(0.8
|
)
|
|||||
|
Balance, end of period
|
$
|
1,506.5
|
$
|
246.4
|
$
|
1,752.9
|
||||
|
(1)
|
The Dealer Loans amount represents advances paid to Dealers on Consumer Loans assigned under our Portfolio Program. The Purchased Loans amount represents one-time payments made to Dealers to purchase Consumer Loans assigned under our Purchase Program.
|
|
(2)
|
Under our Portfolio Program, certain events may result in Dealers forfeiting their rights to Dealer Holdback. We transfer the Dealer’s outstanding Dealer Loan balance to Purchased Loans in the period this forfeiture occurs.
|
|
(3)
|
Represents collections received on previously written off Loans.
|
Contractual net cash flows are comprised of the contractual repayments of the underlying Consumer Loans for Dealer and Purchased Loans, less the related Dealer Holdback payments for Dealer Loans. The difference between the contractual net cash flows and the expected net cash flows is referred to as the nonaccretable difference. This difference is neither accreted into income nor recorded in our balance sheets. We do not believe that the contractual net cash flows of our Loan portfolio are relevant in assessing our financial position. We are contractually owed repayments on many Consumer Loans, primarily those older than 120 months, where we are not forecasting any future net cash flows.
|
5.
|
LOANS RECEIVABLE – (Continued)
|
The excess of expected net cash flows over the carrying value of the Loans is referred to as the accretable yield and is recognized on a level-yield basis as finance charge income over the remaining lives of the Loans. A summary of changes in the accretable yield is as follows:
|
(In millions)
|
For the Year Ended December 31, 2013
|
|||||||||
|
Dealer Loans
|
Purchased Loans
|
Total
|
||||||||
|
Balance, beginning of period
|
$
|
602.9
|
$
|
115.2
|
$
|
718.1
|
||||
|
New Consumer Loan assignments (1)
|
564.9
|
50.3
|
615.2
|
|||||||
|
Finance charge income
|
(517.7
|
)
|
(72.7
|
)
|
(590.4
|
)
|
||||
|
Forecast changes
|
24.9
|
|
7.6
|
|
32.5
|
|||||
|
Transfers (2)
|
(7.5
|
)
|
12.4
|
4.9
|
||||||
|
Balance, end of period
|
$
|
667.5
|
$
|
112.8
|
$
|
780.3
|
||||
|
(In millions)
|
For the Year Ended December 31, 2012
|
|||||||||
|
Dealer Loans
|
Purchased Loans
|
Total
|
||||||||
|
Balance, beginning of period
|
$
|
508.0
|
$
|
120.1
|
$
|
628.1
|
||||
|
New Consumer Loan assignments (1)
|
538.7
|
47.8
|
586.5
|
|||||||
|
Finance charge income
|
(458.7
|
)
|
(79.5
|
)
|
(538.2
|
)
|
||||
|
Forecast changes
|
25.6
|
|
10.0
|
|
35.6
|
|||||
|
Transfers (2)
|
(10.7
|
)
|
16.8
|
6.1
|
||||||
|
Balance, end of period
|
$
|
602.9
|
$
|
115.2
|
$
|
718.1
|
||||
|
(In millions)
|
For the Year Ended December 31, 2011
|
|||||||||
|
Dealer Loans
|
Purchased Loans
|
Total
|
||||||||
|
Balance, beginning of period
|
$
|
351.6
|
$
|
124.5
|
$
|
476.1
|
||||
|
New Consumer Loan assignments (1)
|
508.9
|
59.5
|
568.4
|
|||||||
|
Finance charge income
|
(374.9
|
)
|
(85.7
|
)
|
(460.6
|
)
|
||||
|
Forecast changes
|
30.0
|
|
9.6
|
39.6
|
||||||
|
Transfers (2)
|
(7.6
|
)
|
12.2
|
4.6
|
||||||
|
Balance, end of period
|
$
|
508.0
|
$
|
120.1
|
$
|
628.1
|
||||
|
(1)
|
The Dealer Loans amount represents the net cash flows expected at the time of assignment on Consumer Loans assigned under our Portfolio Program, less the related advances paid to Dealers. The Purchased Loans amount represents the net cash flows expected at the time of assignment on Consumer Loans assigned under our Purchase Program, less the related one-time payments made to Dealers.
|
|
(2)
|
Under our Portfolio Program, certain events may result in Dealers forfeiting their rights to Dealer Holdback. We transfer the Dealer’s outstanding Dealer Loan balance and related expected future net cash flows to Purchased Loans in the period this forfeiture occurs.
|
|
5.
|
LOANS RECEIVABLE – (Continued)
|
Additional information related to new Consumer Loan assignments is as follows:
|
(In millions)
|
For the Year Ended December 31, 2013
|
|||||||||
|
Dealer Loans
|
Purchased Loans
|
Total
|
||||||||
|
Contractual net cash flows at the time of assignment (1)
|
$
|
2,079.8
|
$
|
241.6
|
$
|
2,321.4
|
||||
|
Expected net cash flows at the time of assignment (2)
|
1,921.5
|
174.3
|
2,095.8
|
|||||||
|
Fair value at the time of assignment (3)
|
1,356.6
|
124.0
|
1,480.6
|
|||||||
|
(In millions)
|
For the Year Ended December 31, 2012
|
|||||||||
|
Dealer Loans
|
Purchased Loans
|
Total
|
||||||||
|
Contractual net cash flows at the time of assignment (1)
|
$
|
1,935.1
|
$
|
217.6
|
$
|
2,152.7
|
||||
|
Expected net cash flows at the time of assignment (2)
|
1,792.3
|
156.5
|
1,948.8
|
|||||||
|
Fair value at the time of assignment (3)
|
1,253.6
|
108.8
|
1,362.4
|
|||||||
|
(In millions)
|
For the Year Ended December 31, 2011
|
|||||||||
|
Dealer Loans
|
Purchased Loans
|
Total
|
||||||||
|
Contractual net cash flows at the time of assignment (1)
|
$
|
1,786.5
|
$
|
248.0
|
$
|
2,034.5
|
||||
|
Expected net cash flows at the time of assignment (2)
|
1,661.4
|
181.7
|
1,843.1
|
|||||||
|
Fair value at the time of assignment (3)
|
1,152.5
|
122.2
|
1,274.7
|
|||||||
|
(1)
|
The Dealer Loans amount represents the repayments that we were contractually owed at the time of assignment on Consumer Loans assigned under our Portfolio Program, less the related Dealer Holdback payments that we would be required to make if we collected all of the contractual repayments. The Purchased Loans amount represents the repayments that we were contractually owed at the time of assignment on Consumer Loans assigned under our Purchase Program.
|
|
(2)
|
The Dealer Loans amount represents the repayments that we expected to collect at the time of assignment on Consumer Loans assigned under our Portfolio Program, less the related Dealer Holdback payments that we expected to make. The Purchased Loans amount represents the repayments that we expected to collect at the time of assignment on Consumer Loans assigned under our Purchase Program.
|
|
(3)
|
The Dealer Loans amount represents advances paid to Dealers on Consumer Loans assigned under our Portfolio Program. The Purchased Loans amount represents one-time payments made to Dealers to purchase Consumer Loans assigned under our Purchase Program.
|
Credit Quality
We monitor and evaluate the credit quality of Consumer Loans assigned under our Portfolio and Purchase Programs on a monthly basis by comparing our current forecasted collection rates to our initial expectations. For additional information regarding credit quality, see Note 2 to the consolidated financial statements. The following table compares our forecast of Consumer Loan collection rates as of December 31, 2013, with the forecasts as of December 31, 2012, as of December 31, 2011, and at the time of assignment, segmented by year of assignment:
|
Forecasted Collection Percentage as of (1)
|
Variance in Forecasted Collection
Percentage from
|
|||||||||||||||||||||
|
Consumer Loan Assignment Year
|
December 31, 2013
|
December 31, 2012
|
December 31, 2011
|
Initial
Forecast
|
December 31, 2012
|
December 31, 2011
|
Initial
Forecast
|
|||||||||||||||
|
2004
|
73.0
|
%
|
73.0
|
%
|
73.0
|
%
|
73.0
|
%
|
0.0
|
%
|
0.0
|
%
|
0.0
|
%
|
||||||||
|
2005
|
73.7
|
%
|
73.6
|
%
|
73.6
|
%
|
74.0
|
%
|
0.1
|
%
|
0.1
|
%
|
-0.3
|
%
|
||||||||
|
2006
|
70.0
|
%
|
69.9
|
%
|
70.0
|
%
|
71.4
|
%
|
0.1
|
%
|
0.0
|
%
|
-1.4
|
%
|
||||||||
|
2007
|
67.9
|
%
|
68.0
|
%
|
68.1
|
%
|
70.7
|
%
|
-0.1
|
%
|
-0.2
|
%
|
-2.8
|
%
|
||||||||
|
2008
|
70.1
|
%
|
70.3
|
%
|
70.0
|
%
|
69.7
|
%
|
-0.2
|
%
|
0.1
|
%
|
0.4
|
%
|
||||||||
|
2009
|
79.2
|
%
|
79.5
|
%
|
79.4
|
%
|
71.9
|
%
|
-0.3
|
%
|
-0.2
|
%
|
7.3
|
%
|
||||||||
|
2010
|
77.0
|
%
|
77.3
|
%
|
76.8
|
%
|
73.6
|
%
|
-0.3
|
%
|
0.2
|
%
|
3.4
|
%
|
||||||||
|
2011
|
74.1
|
%
|
74.1
|
%
|
73.2
|
%
|
72.5
|
%
|
0.0
|
%
|
0.9
|
%
|
1.6
|
%
|
||||||||
|
2012
|
73.5
|
%
|
72.2
|
%
|
–
|
71.4
|
%
|
1.3
|
%
|
–
|
2.1
|
%
|
||||||||||
|
2013
|
73.3
|
%
|
–
|
–
|
72.0
|
%
|
–
|
–
|
1.3
|
%
|
||||||||||||
|
(1)
|
Represents the total forecasted collections we expect to collect on the Consumer Loans as a percentage of the repayments that we were contractually owed on the Consumer Loans at the time of assignment. Contractual repayments include both principal and interest.
|
5. LOANS RECEIVABLE – (Continued)
Advances paid to Dealers on Consumer Loans assigned under our Portfolio Program and one-time payments made to Dealers to purchase Consumer Loans assigned under our Purchase Program are aggregated into pools for purposes of recognizing revenue and evaluating impairment. As a result of this aggregation, we are not able to segment the carrying value of the majority of our Loan portfolio by year of assignment. We are able to segment our Loan portfolio by the performance of the Loan pools. Performance considers both the amount and timing of expected net cash flows and is measured by comparing the balance of the Loan pool to the discounted value of the expected future net cash flows of each Loan pool using the yield established at the time of assignment. The following table segments our Loan portfolio by the performance of the Loan pools:
|
(In millions)
|
As of December 31, 2013
|
||||||||||||||||||
|
Loan Pool Performance
Meets or Exceeds Initial Estimates
|
Loan Pool Performance
Less than Initial Estimates
|
||||||||||||||||||
|
Dealer Loans
|
Purchased Loans
|
Total
|
Dealer Loans
|
Purchased Loans
|
Total
|
||||||||||||||
|
Loans receivable
|
$
|
681.4
|
$
|
227.3
|
$
|
908.7
|
$
|
1,474.1
|
$
|
25.4
|
$
|
1,499.5
|
|||||||
|
Allowance for credit losses
|
–
|
–
|
–
|
(185.7
|
)
|
(9.7
|
)
|
(195.4
|
)
|
||||||||||
|
Loans receivable, net
|
$
|
681.4
|
$
|
227.3
|
$
|
908.7
|
$
|
1,288.4
|
$
|
15.7
|
$
|
1,304.1
|
|||||||
|
(In millions)
|
As of December 31, 2012
|
||||||||||||||||||
|
Loan Pool Performance
Meets or Exceeds Initial Estimates
|
Loan Pool Performance
Less than Initial Estimates
|
||||||||||||||||||
|
Dealer Loans
|
Purchased Loans
|
Total
|
Dealer Loans
|
Purchased Loans
|
Total
|
||||||||||||||
|
Loans receivable
|
$
|
564.1
|
$
|
205.8
|
$
|
769.9
|
$
|
1,305.3
|
$
|
34.7
|
$
|
1,340.0
|
|||||||
|
Allowance for credit losses
|
–
|
–
|
–
|
(167.4
|
)
|
(9.0
|
)
|
(176.4
|
)
|
||||||||||
|
Loans receivable, net
|
$
|
564.1
|
$
|
205.8
|
$
|
769.9
|
$
|
1,137.9
|
$
|
25.7
|
$
|
1,163.6
|
|||||||
A summary of changes in the allowance for credit losses is as follows:
|
(In millions)
|
For the Year Ended December 31, 2013
|
|||||||||
|
Dealer Loans
|
Purchased Loans
|
Total
|
||||||||
|
Balance, beginning of period
|
$
|
167.4
|
$
|
9.0
|
$
|
176.4
|
||||
|
Provision for credit losses
|
21.3
|
0.6
|
21.9
|
|||||||
|
Write-offs
|
(5.2
|
)
|
(0.1
|
)
|
(5.3
|
)
|
||||
|
Recoveries (1)
|
2.2
|
0.2
|
2.4
|
|||||||
|
Balance, end of period
|
$
|
185.7
|
$
|
9.7
|
$
|
195.4
|
||||
|
(In millions)
|
For the Year Ended December 31, 2012
|
|||||||||
|
Dealer Loans
|
Purchased Loans
|
Total
|
||||||||
|
Balance, beginning of period
|
$
|
141.7
|
$
|
12.6
|
$
|
154.3
|
||||
|
Provision for credit losses
|
27.1
|
(3.1
|
)
|
24.0
|
||||||
|
Write-offs
|
(3.6
|
)
|
(0.6
|
)
|
(4.2
|
)
|
||||
|
Recoveries (1)
|
2.2
|
0.1
|
2.3
|
|||||||
|
Balance, end of period
|
$
|
167.4
|
$
|
9.0
|
$
|
176.4
|
||||
|
(In millions)
|
For the Year Ended December 31, 2011
|
|||||||||
|
Dealer Loans
|
Purchased Loans
|
Total
|
||||||||
|
Balance, beginning of period
|
$
|
113.2
|
$
|
13.7
|
$
|
126.9
|
||||
|
Provision for credit losses
|
29.7
|
(0.7
|
)
|
29.0
|
||||||
|
Write-offs
|
(3.0
|
)
|
(0.5
|
)
|
(3.5
|
)
|
||||
|
Recoveries (1)
|
1.8
|
0.1
|
1.9
|
|||||||
|
Balance, end of period
|
$
|
141.7
|
$
|
12.6
|
$
|
154.3
|
||||
|
(1)
|
Represents collections received on previously written off Loans.
|
5. LOANS RECEIVABLE – (Concluded)
During the fourth quarter of 2012, we enhanced the computations used to account for Dealer Loans. The enhanced computations utilize a more sophisticated approach for determining the yields established at the time of assignment, future net cash flow streams and the present value of future cash flow streams. While the enhanced computations did not change these estimates significantly at the overall Dealer Loan portfolio level, we believe they improved the precision of these estimates at the individual Dealer level. Implementation of the enhanced computations increased the provision for credit losses and finance charges by $2.8 million and $0.8 million, respectively, for the year ended December 31, 2012.
During the second quarter of 2013, we enhanced our methodology for forecasting future collections on Loans through the utilization of more recent data, different segmentations and new forecast variables. Implementation of the enhanced forecasting methodology increased the provision for credit losses by $3.0 million for the second quarter of 2013, of which $1.2 million related to Dealer Loans and $1.8 million related to Purchased Loans.
6. LEASED PROPERTIES
We lease office space and office equipment. We expect that in the normal course of business, leases will be renewed or replaced by other leases. Total rental expense on all operating leases was $1.1 million, $0.9 million and $0.9 million for 2013, 2012 and 2011, respectively. Contingent rentals under the operating leases were insignificant. Our total minimum future lease commitments under operating leases as of December 31, 2013 are as follows:
|
(In millions)
|
||||
|
Year
|
Minimum Future
Lease Commitments
|
|||
|
2014
|
$
|
1.4
|
||
|
2015
|
1.4
|
|||
|
2016
|
1.3
|
|||
|
2017
|
1.3
|
|||
|
2018
|
0.7
|
|||
|
Thereafter
|
0.2
|
|||
|
Total
|
$
|
6.3
|
||
|
7.
|
PROPERTY AND EQUIPMENT
|
Property and equipment consists of the following:
|
(In millions)
|
As of December 31,
|
||||||
|
2013
|
2012
|
||||||
|
Land and land improvements
|
$
|
2.3
|
$
|
2.3
|
|||
|
Building and improvements
|
14.0
|
13.4
|
|||||
|
Data processing equipment and software
|
25.5
|
42.4
|
|||||
|
Office furniture and equipment
|
4.1
|
3.6
|
|||||
|
Leasehold improvements
|
0.7
|
0.1
|
|||||
|
Total property and equipment
|
46.6
|
61.8
|
|||||
|
Less: Accumulated depreciation on property and equipment
|
(24.3
|
)
|
(39.6
|
)
|
|||
|
Total property and equipment, net
|
$
|
22.3
|
$
|
22.2
|
|||
Depreciation expense on property and equipment was $5.4 million, $5.1 million and $4.1 million for the years ended December 31, 2013, 2012 and 2011, respectively.
For the years ended December 31, 2013, 2012 and 2011, we capitalized software developed for internal use of $0.8 million, $4.4 million and $1.8 million, respectively. As of December 31, 2013 and 2012, capitalized software costs, net of accumulated depreciation, totaled $4.0 million and $5.4 million, respectively.
|
8.
|
DEBT
|
We currently utilize the following primary forms of debt financing: (1) a revolving secured line of credit; (2) Warehouse facilities; (3) Term ABS financings; and (4) senior notes. General information for each of our financing transactions in place as of December 31, 2013 is as follows:
| (Dollars in millions) | |||||||||||||||
|
Financings
|
Wholly-owned Subsidiary
|
Close Date
|
Maturity Date
|
Financing Amount
|
Interest Rate as of
December 31, 2013
|
||||||||||
|
Revolving Secured
Line of Credit
|
n/a | 12/09/2013 | 06/23/2016 | $ | 235.0 | At our option, either LIBOR plus 187.5 basis points or the prime rate plus 87.5 basis points | |||||||||
|
Warehouse Facility II (1)
|
CAC Warehouse Funding Corp. II
|
12/02/2013
|
12/27/2015
|
(2) | $ | 325.0 |
Commercial paper rate or LIBOR plus 200 basis points (3)
|
||||||||
|
Warehouse Facility III (1)
|
CAC Warehouse Funding III, LLC
|
08/16/2013
|
09/10/2015
|
(4) | $ | 75.0 |
LIBOR plus 160 basis points (3)
|
||||||||
|
Warehouse Facility IV (1)
|
CAC Warehouse Funding LLC IV
|
12/04/2013
|
04/05/2016
|
(2) | $ | 75.0 |
LIBOR plus 200 basis points (3)
|
||||||||
|
Term ABS 2011-1 (1)
|
Credit Acceptance Funding LLC 2011-1
|
10/06/2011
|
09/16/2013
|
(2) | $ | 200.5 |
Fixed rate
|
||||||||
|
Term ABS 2012-1 (1)
|
Credit Acceptance Funding LLC 2012-1
|
03/29/2012
|
03/17/2014
|
(2) | $ | 201.3 |
Fixed rate
|
||||||||
|
Term ABS 2012-2 (1)
|
Credit Acceptance Funding LLC 2012-2
|
09/20/2012
|
09/15/2014
|
(2) | $ | 252.0 |
Fixed rate
|
||||||||
|
Term ABS 2013-1 (1)
|
Credit Acceptance Funding LLC 2013-1
|
04/25/2013
|
04/15/2015
|
(2) | $ | 140.3 |
Fixed rate
|
||||||||
|
Term ABS 2013-2 (1)
|
Credit Acceptance Funding LLC 2013-2
|
10/31/2013
|
10/15/2015
|
(2) | $ | 197.8 |
Fixed rate
|
||||||||
| 2017 Senior Notes | n/a | (5) | 02/01/2017 | $ | 350.0 | Fixed rate | |||||||||
|
(1)
|
Financing made available only to a specified subsidiary of the Company.
|
|
(2)
|
Represents the revolving maturity date. The outstanding balance will amortize after the maturity date based on the cash flows of the pledged assets.
|
|
(3)
|
Interest rate cap agreements are in place to limit the exposure to increasing interest rates.
|
|
(4)
|
Represents the revolving maturity date. The outstanding balance will amortize after the revolving maturity date and any amounts remaining on September 10, 2017 will be due.
|
|
(5)
|
The close dates associated with the issuance of $250.0 million and $100.0 million of the senior notes were on February 1, 2010 and March 3, 2011, respectively.
|
Additional information related to the amounts outstanding on each facility is as follows:
|
(In millions)
|
For the Years Ended December 31,
|
||||||
|
2013
|
2012
|
||||||
|
Revolving Secured Line of Credit
|
|||||||
|
Maximum outstanding balance
|
$
|
195.1
|
$
|
187.3
|
|||
|
Average outstanding balance
|
97.9
|
96.2
|
|||||
|
Warehouse Facility II
|
|||||||
|
Maximum outstanding balance
|
$
|
169.1
|
$
|
177.2
|
|||
|
Average outstanding balance
|
81.8
|
99.8
|
|||||
|
Warehouse Facility III
|
|||||||
|
Maximum outstanding balance
|
$
|
60.0
|
$
|
73.0
|
|||
|
Average outstanding balance
|
23.3
|
45.5
|
|||||
|
Warehouse Facility IV
|
|||||||
|
Maximum outstanding balance
|
$
|
39.6
|
$
|
39.6
|
|||
|
Average outstanding balance
|
11.8
|
37.8
|
|||||
8. DEBT – (Continued)
|
(Dollars in millions)
|
As of December 31,
|
||||||
|
2013
|
2012
|
||||||
|
Revolving Secured Line of Credit
|
|||||||
|
Balance outstanding
|
$
|
102.8
|
$
|
43.5
|
|||
|
Amount available for borrowing (1)
|
132.2
|
191.5
|
|||||
|
Interest rate
|
2.04
|
%
|
2.08
|
%
|
|||
|
Warehouse Facility II
|
|||||||
|
Balance outstanding
|
$
|
–
|
$
|
81.3
|
|||
|
Amount available for borrowing (1)
|
325.0
|
243.7
|
|||||
|
Loans pledged as collateral
|
–
|
105.2
|
|||||
|
Restricted cash and cash equivalents pledged as collateral
|
1.2
|
3.0
|
|||||
|
Interest rate
|
2.17
|
%
|
2.22
|
%
|
|||
|
Warehouse Facility III
|
|||||||
|
Balance outstanding
|
$
|
–
|
$
|
–
|
|||
|
Amount available for borrowing (1)
|
75.0
|
75.0
|
|||||
|
Loans pledged as collateral
|
–
|
–
|
|||||
|
Restricted cash and cash equivalents pledged as collateral
|
0.3
|
0.4
|
|||||
|
Interest rate
|
1.77
|
%
|
1.82
|
%
|
|||
|
Warehouse Facility IV
|
|||||||
|
Balance outstanding
|
$
|
–
|
$
|
37.6
|
|||
|
Amount available for borrowing (1)
|
75.0
|
37.4
|
|||||
|
Loans pledged as collateral
|
–
|
47.7
|
|||||
|
Restricted cash and cash equivalents pledged as collateral
|
0.2
|
2.5
|
|||||
|
Interest rate
|
2.17
|
%
|
2.96
|
%
|
|||
|
Term ABS 2010-1
|
|||||||
|
Balance outstanding
|
$
|
–
|
$
|
80.3
|
|||
|
Loans pledged as collateral
|
–
|
111.6
|
|||||
|
Restricted cash and cash equivalents pledged as collateral
|
–
|
12.5
|
|||||
|
Interest rate
|
–
|
2.44
|
%
|
||||
|
Term ABS 2011-1
|
|||||||
|
Balance outstanding
|
$
|
144.2
|
$
|
200.5
|
|||
|
Loans pledged as collateral
|
215.3
|
243.8
|
|||||
|
Restricted cash and cash equivalents pledged as collateral
|
23.2
|
23.5
|
|||||
|
Interest rate
|
3.01
|
%
|
2.90
|
%
|
|||
|
Term ABS 2012-1
|
|||||||
|
Balance outstanding
|
$
|
201.3
|
$
|
201.3
|
|||
|
Loans pledged as collateral
|
240.4
|
244.7
|
|||||
|
Restricted cash and cash equivalents pledged as collateral
|
23.5
|
22.3
|
|||||
|
Interest rate
|
2.38
|
%
|
2.38
|
%
|
|||
|
Term ABS 2012-2
|
|||||||
|
Balance outstanding
|
$
|
252.0
|
$
|
252.0
|
|||
|
Loans pledged as collateral
|
303.8
|
311.9
|
|||||
|
Restricted cash and cash equivalents pledged as collateral
|
27.7
|
26.0
|
|||||
|
Interest rate
|
1.63
|
%
|
1.63
|
%
|
|||
|
Term ABS 2013-1
|
|||||||
|
Balance outstanding
|
$
|
140.3
|
$
|
–
|
|||
|
Loans pledged as collateral
|
184.3
|
–
|
|||||
|
Restricted cash and cash equivalents pledged as collateral
|
15.3
|
–
|
|||||
|
Interest rate
|
1.31
|
%
|
–
|
||||
|
Term ABS 2013-2
|
|||||||
|
Balance outstanding
|
$
|
197.8
|
$
|
–
|
|||
|
Loans pledged as collateral
|
250.5
|
–
|
|||||
|
Restricted cash and cash equivalents pledged as collateral
|
18.7
|
–
|
|||||
|
Interest rate
|
1.67
|
%
|
–
|
||||
|
2017 Senior Notes
|
|||||||
|
Balance outstanding (2)
|
$
|
350.2
|
$
|
350.3
|
|||
|
Interest rate
|
9.13
|
%
|
9.13
|
%
|
|||
|
(1)
|
Availability may be limited by the amount of assets pledged as collateral.
|
|
(2)
|
As of December 31, 2013 and 2012, the outstanding balance presented for the senior notes includes a net unamortized debt premium of $0.2 million and $0.3 million, respectively.
|
|
8.
|
DEBT – (Continued)
|
Revolving Secured Line of Credit Facility
We have a $235.0 million revolving secured line of credit facility with a commercial bank syndicate.
During the second quarter of 2013, we extended the maturity of our revolving secured line of credit facility from June 22, 2015 to June 23, 2016. There were no other material changes to the terms of the facility.
Borrowings under the revolving secured line of credit facility, including any letters of credit issued under the facility, are subject to a borrowing-base limitation. This limitation equals 80% of the net book value of Loans, less a hedging reserve (not exceeding $1.0 million), and the amount of other debt secured by the collateral which secures the revolving secured line of credit facility. Borrowings under the revolving secured line of credit facility agreement are secured by a lien on most of our assets.
Warehouse Facilities
We have three Warehouse facilities with total borrowing capacity of $475.0 million. Each of the facilities are with different institutional investors, and the facility limit is $325.0 million for Warehouse Facility II and $75.0 million for both Warehouse Facility III and IV.
During the second quarter of 2013, we extended the date on which Warehouse IV will cease to revolve from February 19, 2014 to April 5, 2016. The interest rate on borrowings under the facility was decreased from LIBOR plus 275 basis points to LIBOR plus 225 basis points. During the fourth quarter of 2013, the interest rate on borrowings under Warehouse IV was decreased from LIBOR plus 225 basis points to LIBOR plus 200 basis points. There were no other material changes to the terms of the facility.
Under each Warehouse facility, we can contribute Loans to our wholly-owned subsidiaries in return for cash and equity in each subsidiary. In turn, each subsidiary pledges the Loans as collateral to institutional investors to secure financing that will fund the cash portion of the purchase price of the Loans. The financing provided to each subsidiary under the applicable facility is limited to the lesser of 80% of the net book value of the contributed Loans plus the cash collected on such Loans or the facility limit.
The financings create indebtedness for which the subsidiaries are liable and which is secured by all the assets of each subsidiary. Such indebtedness is non-recourse to us, even though we are consolidated for financial reporting purposes with the subsidiaries. Because the subsidiaries are organized as legal entities separate from us, their assets (including the contributed Loans) are not available to our creditors.
The subsidiaries pay us a monthly servicing fee equal to 6% of the collections received with respect to the contributed Loans. The fee is paid out of the collections. Except for the servicing fee and holdback payments due to Dealers, if a facility is amortizing, we do not have any rights in any portion of such collections until all outstanding principal, accrued and unpaid interest, fees and other related costs have been paid in full. If a facility is not amortizing, the applicable subsidiary may be entitled to retain a portion of such collections provided that the borrowing base requirements of the facility are satisfied.
Term ABS Financings
In 2010, 2011, 2012 and 2013, our wholly-owned subsidiaries (the “Funding LLCs”), completed secured financing transactions with qualified institutional investors. In connection with these transactions, we contributed Loans on an arms-length basis to each Funding LLC for cash and the sole membership interest in that Funding LLC. In turn, each Funding LLC contributed the Loans to a respective trust that issued notes to qualified institutional investors. The Term ABS 2011-1, 2012-1, 2012-2, 2013-1 and 2013-2 transactions each consist of three classes of notes. The Class A and Class B Notes for each Term ABS financing bear interest. The Class C Notes for each Term ABS financing do not bear interest and have been retained by us.
|
8.
|
DEBT – (Continued)
|
Each financing at the time of issuance has a specified revolving period during which we may be required, and are likely, to contribute additional Loans to each Funding LLC. Each Funding LLC will then contribute the Loans to their respective trust. At the end of the revolving period, the debt outstanding under each financing will begin to amortize.
The financings create indebtedness for which the trusts are liable and which is secured by all the assets of each trust. Such indebtedness is non-recourse to us, even though we are consolidated for financial reporting purposes with the trusts and the Funding LLCs. Because the Funding LLCs are organized as legal entities separate from us, their assets (including the contributed Loans) are not available to our creditors. We receive a monthly servicing fee on each financing equal to 6% of the collections received with respect to the contributed Loans. The fee is paid out of the collections. Except for the servicing fee and Dealer Holdback payments due to Dealers, if a facility is amortizing, we do not have any rights in any portion of such collections until all outstanding principal, accrued and unpaid interest, fees and other related costs have been paid in full. If a facility is not amortizing, the applicable subsidiary may be entitled to retain a portion of such collections provided that the borrowing base requirements of the facility are satisfied. However, in our capacity as servicer of the Loans, we do have a limited right to exercise a “clean-up call” option to purchase Loans from the Funding LLCs and/or the trusts under certain specified circumstances. Alternatively, when a trust’s underlying indebtedness is paid in full, either through collections or through a prepayment of the indebtedness, the trust is to pay any remaining collections over to its Funding LLC as the sole beneficiary of the trust. The collections will then be available to be distributed to us as the sole member of the respective Funding LLC.
The table below sets forth certain additional details regarding the outstanding Term ABS Financings:
|
(Dollars in millions)
|
|||||||
|
Term ABS Financings
|
Close Date
|
Net Book Value of Loans
Contributed at Closing
|
24 Month Revolving Period
|
||||
|
Term ABS 2011-1
|
October 6, 2011
|
$
|
250.8
|
Through September 16, 2013
|
|||
|
Term ABS 2012-1
|
March 29, 2012
|
$
|
251.7
|
Through March 17, 2014
|
|||
|
Term ABS 2012-2
|
September 20, 2012
|
$
|
315.1
|
Through September 15, 2014
|
|||
|
Term ABS 2013-1
|
April 25, 2013
|
$
|
187.8
|
Through April 15, 2015
|
|||
|
Term ABS 2013-2
|
October 31, 2013
|
$
|
250.1
|
Through October 15, 2015
|
|||
Senior Notes
We have outstanding $350.0 million aggregate principal amount of our 9.125% first priority senior secured notes due 2017 (the “2017 senior notes”), $100.0 million of which we issued on March 3, 2011 and $250.0 million of which we issued on February 1, 2010. The 2017 senior notes are governed by an indenture, dated as of February 1, 2010, as amended and supplemented (the “Indenture”), among us, as the issuer; our subsidiaries Buyers Vehicle Protection Plan, Inc. and Vehicle Remarketing Services, Inc., as guarantors (the “Guarantors”); and U.S. Bank National Association, as trustee. The 2017 senior notes issued on March 3, 2011 have the same terms as the previously issued 2017 senior notes, other than issue price and issue date, and all of the 2017 senior notes are treated as a single class under the Indenture.
The 2017 senior notes mature on February 1, 2017 and bear interest at a rate of 9.125% per annum, computed on the basis of a 360-day year comprised of twelve 30-day months and payable semi-annually on February 1 and August 1 of each year. The 2017 senior notes issued on March 3, 2011 were issued at a price of 106.0% of their aggregate principal amount, resulting in gross proceeds of $106.0 million, and a yield to maturity of 7.83% per annum. The 2017 senior notes issued on February 1, 2010 were issued at a price of 97.495% of their aggregate principal amount, resulting in gross proceeds of $243.7 million, and a yield to maturity of 9.625% per annum. The premium with respect to the 2017 senior notes issued on March 3, 2011 and the discount with respect to the 2017 senior notes issued on February 1, 2010 are being amortized over the life of the 2017 senior notes using the effective interest method.
|
8.
|
DEBT – (Concluded)
|
The 2017 senior notes are guaranteed on a senior secured basis by the Guarantors, which are also guarantors of obligations under our revolving secured line of credit facility. Other existing and future subsidiaries of ours may become guarantors of the 2017 senior notes. The 2017 senior notes and the Guarantors’ senior note guarantees are secured on a first-priority basis (subject to specified exceptions and permitted liens), together with all indebtedness outstanding from time to time under the revolving secured line of credit facility and, under certain circumstances, certain future indebtedness, by a security interest in substantially all of our assets and those of the Guarantors, subject to certain exceptions such as real property, cash (except to the extent it is deposited with the collateral agent), certain leases, and equity interests of our subsidiaries (other than those of specified subsidiaries including the Guarantors). Our assets and those of the Guarantors securing the 2017 senior notes and the senior note guarantees will not include our assets transferred to special purpose subsidiaries in connection with Warehouse facilities and Term ABS financings and will generally be the same as the collateral securing indebtedness under the revolving secured line of credit facility and, under certain circumstances, certain future indebtedness, subject to certain limited exceptions as provided in the security and intercreditor agreements related to the revolving secured line of credit facility.
Mortgage Loan
During 2009, the mortgage note on our Southfield headquarters was amended to extend the maturity date from June 9, 2009 to June 22, 2014. Additionally, the interest rate on the note was increased from 5.35% to 5.70%. There was $3.8 million and $4.0 million outstanding on this loan as of December 31, 2013 and 2012, respectively.
Principal Debt Maturities
The scheduled principal maturities of our debt as of December 31, 2013 are as follows:
|
(In millions)
|
|||||||||||||||||||
|
Year
|
Revolving Secured Line of Credit Facility
|
Warehouse Facilities
|
Term ABS Financings (1)
|
Senior Notes (2)(3)
|
Mortgage Note
|
Total
|
|||||||||||||
|
2014
|
$
|
–
|
$
|
–
|
$
|
358.2
|
$
|
–
|
$
|
3.8
|
$
|
362.0
|
|||||||
|
2015
|
–
|
–
|
365.8
|
–
|
–
|
365.8
|
|||||||||||||
|
2016
|
102.8
|
–
|
211.6
|
–
|
–
|
314.4
|
|||||||||||||
|
2017
|
–
|
–
|
–
|
350.0
|
–
|
350.0
|
|||||||||||||
|
Total
|
$
|
102.8
|
$
|
–
|
$
|
935.6
|
$
|
350.0
|
$
|
3.8
|
$
|
1,392.2
|
|||||||
|
(1)
|
The principal maturities of the Term ABS transactions are estimated based on forecasted collections.
|
|
(2)
|
The amounts are presented on a gross basis to exclude the net unamortized debt premium of $0.2 million.
|
|
(3)
|
For subsequent event information affecting the maturity of senior notes, see Note 18 to the consolidated financial statements.
|
Debt Covenants
As of December 31, 2013, we were in compliance with all our debt covenants relating to the revolving secured line of credit facility, including those that require the maintenance of certain financial ratios and other financial conditions. These covenants require a minimum ratio of our earnings before interest, taxes and non-cash expenses to fixed charges. These covenants also limit the maximum ratio of our funded debt to tangible net worth. Additionally, we must maintain consolidated net income of not less than $1 for the two most recently ended fiscal quarters. Some of these debt covenants may indirectly limit the repurchase of common stock or payment of dividends on common stock.
Our Warehouse facilities and Term ABS financings also contain covenants that measure the performance of the contributed assets. As of December 31, 2013, we were in compliance with all such covenants. As of the end of the year, we were also in compliance with our covenants under the Indenture. The Indenture includes covenants that limit the maximum ratio of our funded debt to tangible net worth and also require a minimum collateral coverage ratio.
9. DERIVATIVE AND HEDGING INSTRUMENTS
Interest Rate Caps.
We utilize interest rate cap agreements to manage the interest rate risk on our Warehouse facilities. The following tables provide the terms of our interest
rate cap agreements that were in effect as of December 31, 2013 and 2012:
|
(Dollars in millions)
|
||||||||||||||||
|
As of December 31, 2013
|
||||||||||||||||
|
Facility
|
Facility Name
|
Purpose
|
Start
|
End
|
Notional
|
Cap Interest Rate (1)
|
||||||||||
|
$
|
325.0
|
Warehouse Facility II
|
Cap Floating Rate
|
06/2013
|
12/2014
|
$
|
325.0
|
5.50
|
%
|
|||||||
|
75.0
|
Warehouse Facility III
|
Cap Floating Rate
|
06/2012
|
07/2015
|
56.3
|
5.00
|
%
|
|||||||||
|
75.0
|
Warehouse Facility IV
|
Cap Floating Rate
|
08/2011
|
09/2015
|
75.0
|
5.50
|
%
|
|||||||||
|
(Dollars in millions)
|
||||||||||||||||
|
As of December 31, 2012
|
||||||||||||||||
|
Facility
|
Facility Name
|
Purpose
|
Start
|
End
|
Notional
|
Cap Interest Rate (1)
|
||||||||||
|
$
|
325.0
|
Warehouse Facility II
|
Cap Floating Rate
|
07/2011
|
06/2013
|
$
|
325.0
|
6.75
|
%
|
|||||||
|
75.0
|
Warehouse Facility III
|
Cap Floating Rate
|
09/2010
|
09/2013
|
37.5
|
6.75
|
%
|
|||||||||
|
75.0
|
Warehouse Facility III
|
Cap Floating Rate
|
06/2012
|
07/2015
|
18.8
|
(2)
|
5.00
|
%
|
||||||||
|
75.0
|
Warehouse Facility IV
|
Cap Floating Rate
|
08/2011
|
09/2015
|
75.0
|
5.50
|
%
|
|||||||||
|
(1)
|
Rate excludes the spread over the LIBOR rate or the commercial paper rate, as applicable.
|
|
(2)
|
The notional amount increased to $56.3 million in September 2013 when the original Warehouse Facility III interest rate cap for $37.5 million ended.
|
The interest rate caps have not been designated as hedging instruments. As of December 31, 2013 and 2012, the interest rate caps had a fair value of less than $0.1 million as the capped rates were significantly above market rates.
Information related to the effect of derivative instruments designated as hedging instruments on our consolidated financial statements for the years ended December 31, 2013, 2012 and 2011 is as follows:
|
(In millions)
|
|||||||||||||||||||||||||
|
Derivatives in Cash Flow Hedging Relationships
|
(Loss) / Gain
Recognized in OCI on Derivative
(Effective Portion)
|
(Loss) / Gain
Reclassified from Accumulated
OCI into Income
(Effective Portion)
|
|||||||||||||||||||||||
|
For the Years Ended December 31,
|
For the Years Ended December 31,
|
||||||||||||||||||||||||
|
2013
|
2012
|
2011
|
Location
|
2013
|
2012
|
2011
|
|||||||||||||||||||
|
Interest rate swap
|
$
|
–
|
$
|
–
|
$
|
–
|
Interest expense
|
$
|
–
|
$
|
–
|
$
|
(0.2
|
)
|
|||||||||||
Information related to the effect of derivative instruments not designated as hedging instruments on our consolidated statements of income for the years ended December 31, 2013, 2012 and 2011 is as follows:
|
(In millions)
|
||||||||||||||
|
Derivatives Not Designated as
Hedging Instruments
|
Amount of (Loss)/ Gain
Recognized in Income
on Derivatives
|
|||||||||||||
|
For the Years Ended December 31,
|
||||||||||||||
|
Location
|
2013
|
2012
|
2011
|
|||||||||||
|
Interest rate caps
|
Interest expense
|
$
|
(0.1
|
)
|
$
|
(0.1
|
)
|
$
|
(0.2
|
)
|
||||
10. RELATED PARTY TRANSACTIONS
In the normal course of our business, affiliated Dealers assign Consumer Loans to us under the Portfolio and Purchase Programs. Dealer Loans and Purchased Loans with affiliated Dealers are on the same terms as those with non-affiliated Dealers. Affiliated Dealers are comprised of Dealers owned or controlled by: (1) our Chairman and significant shareholder; and (2) a member of the Chairman’s immediate family.
Affiliated Dealer Loan balances were $7.5 million and $5.9 million as of December 31, 2013 and 2012, respectively. As of December 31, 2013 and 2012, affiliated Dealer Loan balances were 0.3% of total consolidated Dealer Loan balances. A summary of related party Loan activity is as follows:
|
(Dollars in millions)
|
For the Years Ended December 31,
|
||||||||||||||||||
|
2013
|
2012
|
2011
|
|||||||||||||||||
|
Affiliated
Dealer
activity
|
% of
consolidated
|
Affiliated
Dealer
activity
|
% of
consolidated
|
Affiliated
Dealer
activity
|
% of
consolidated
|
||||||||||||||
|
Dealer Loan revenue
|
$
|
1.5
|
0.3
|
%
|
$
|
1.2
|
0.3
|
%
|
$
|
1.6
|
0.4
|
%
|
|||||||
|
New Consumer Loan assignments (1)
|
4.3
|
0.3
|
%
|
3.6
|
0.3
|
%
|
1.3
|
0.1
|
%
|
||||||||||
|
Accelerated Dealer Holdback payments
|
0.1
|
0.2
|
%
|
0.1
|
0.2
|
%
|
–
|
0.1
|
%
|
||||||||||
|
Dealer Holdback payments
|
2.2
|
1.9
|
%
|
3.2
|
2.8
|
%
|
2.4
|
2.8
|
%
|
||||||||||
|
(1)
|
Represents advances paid to Dealers on Consumer Loans assigned under our Portfolio Program and one-time payments made to Dealers to purchase Consumer Loans assigned under our Purchase Program.
|
Our Chairman and significant shareholder has indirect control over entities that, in the past, offered secured lines of credit to automobile dealers, and has the right or obligation to reacquire these entities under certain circumstances until December 31, 2014 or the repayment of the related purchase money note.
|
11.
|
INCOME TAXES
|
The income tax provision consists of the following:
|
(In millions)
|
For the Years Ended December 31,
|
|||||||||
|
2013
|
2012
|
2011
|
||||||||
|
Income before provision for income taxes:
|
$
|
398.2
|
$
|
343.1
|
$
|
296.4
|
||||
|
Current provision for income taxes:
|
||||||||||
|
Federal
|
$
|
128.4
|
$
|
94.9
|
$
|
87.7
|
||||
|
State
|
7.4
|
3.5
|
6.3
|
|||||||
|
135.8
|
98.4
|
94.0
|
||||||||
|
Deferred provision for income taxes:
|
||||||||||
|
Federal
|
8.7
|
23.6
|
13.3
|
|||||||
|
State
|
0.1
|
1.4
|
2.0
|
|||||||
|
8.8
|
25.0
|
15.3
|
||||||||
|
Interest and penalties expense (benefit):
|
||||||||||
|
Interest
|
0.5
|
–
|
(0.7
|
)
|
||||||
|
Penalties
|
–
|
–
|
(0.2
|
)
|
||||||
|
0.5
|
|
–
|
(0.9
|
)
|
||||||
|
Provision for income taxes
|
$
|
145.1
|
$
|
123.4
|
$
|
108.4
|
||||
|
11.
|
INCOME TAXES – (Continued)
|
The tax effects of temporary differences that give rise to significant portions of the deferred tax assets and deferred tax liabilities consist of the following:
|
(In millions)
|
As of December 31,
|
||||||
|
2013
|
2012
|
||||||
|
Deferred tax assets:
|
|||||||
|
Allowance for credit losses
|
$
|
71.5
|
$
|
64.2
|
|||
|
Stock-based compensation
|
12.6
|
10.0
|
|||||
|
Deferred state net operating loss
|
3.0
|
1.9
|
|||||
|
Other, net
|
7.9
|
6.6
|
|||||
|
Total deferred tax assets
|
95.0
|
82.7
|
|||||
|
Deferred tax liabilities:
|
|||||||
|
Valuation of Loans receivable
|
242.3
|
220.5
|
|||||
|
Deferred Loan origination costs
|
3.3
|
3.7
|
|||||
|
Other, net
|
6.6
|
6.9
|
|||||
|
Total deferred tax liabilities
|
252.2
|
231.1
|
|||||
|
Net deferred tax liability
|
$
|
157.2
|
$
|
148.4
|
|||
The deferred state net operating loss tax asset arising from the operating loss carry forward for state income tax purposes is expected to expire at various times beginning in 2019, if not utilized. We do not anticipate expiration of the net operating loss carry forwards prior to their utilization.
A reconciliation of the U.S. federal statutory rate to our effective tax rate is as follows:
|
For the Years Ended December 31,
|
||||||||||
|
2013
|
2012
|
2011
|
||||||||
|
U.S. federal statutory rate
|
35.0
|
%
|
35.0
|
%
|
35.0
|
%
|
||||
|
State income taxes
|
1.4
|
%
|
1.4
|
%
|
2.1
|
%
|
||||
|
Changes in reserve for uncertain tax positions as a result of settlements and lapsed statutes and related interest
|
-0.3
|
%
|
-0.6
|
%
|
-0.5
|
%
|
||||
|
Other
|
0.3
|
%
|
0.2
|
%
|
–
|
%
|
||||
|
Effective tax rate
|
36.4
|
%
|
36.0
|
%
|
36.6
|
%
|
||||
The differences between the U.S. federal statutory rate and our effective tax rates for 2013, 2012 and 2011 are primarily due to state income taxes and reserves for uncertain tax positions and related interest and penalties that are included in the provision for income taxes.
The state income taxes for the years ended December 31, 2013, 2012 and 2011 fluctuate due to variability in the amount of income taxable in various state tax jurisdictions with differing statutory tax rates and changes in state statutory tax rates.
|
11.
|
INCOME TAXES – (Concluded)
|
The following table is a summary of changes in gross unrecognized tax benefits:
|
(In millions)
|
For the Years Ended December 31,
|
|||||||||
|
2013
|
2012
|
2011
|
||||||||
|
Unrecognized tax benefits at January 1,
|
$
|
11.0
|
$
|
10.0
|
$
|
7.8
|
||||
|
Additions based on tax positions related to current year
|
3.6
|
3.1
|
2.7
|
|||||||
|
Additions in tax positions of prior years
|
–
|
–
|
0.4
|
|||||||
|
Reductions for tax positions of prior years
|
–
|
(0.4
|
)
|
–
|
||||||
|
Settlements
|
–
|
(0.2
|
)
|
–
|
||||||
|
Reductions as a result of a lapse of the statute of limitations
|
(1.4
|
)
|
(1.5
|
)
|
(0.9
|
)
|
||||
|
Unrecognized tax benefits at December 31,
|
$
|
13.2
|
$
|
11.0
|
$
|
10.0
|
||||
The total amount of gross unrecognized tax benefit that, if recognized, would favorably affect our effective income tax rate in future periods, was $13.2 million as of December 31, 2013. Accrued interest related to uncertain tax positions was $2.7 million and $2.1 million as of December 31, 2013 and 2012, respectively.
We are subject to income tax in federal and state jurisdictions. Our federal income tax return for 2011 is currently under audit by the Internal Revenue Service (“IRS”). The IRS has completed their federal tax examinations for years prior to 2009. With respect to state jurisdictions, we are generally no longer subject to tax examinations on returns filed for years prior to 2007.
|
12.
|
NET INCOME PER SHARE
|
Basic net income per share has been computed by dividing net income by the basic number of weighted average shares outstanding. Diluted net income per share has been computed by dividing net income by the diluted number of weighted average shares outstanding using the treasury stock method. The share effect is as follows:
|
For the Years Ended December 31,
|
||||||||||
|
2013
|
2012
|
2011
|
||||||||
|
Weighted average shares outstanding:
|
||||||||||
|
Common shares
|
23,180,633
|
24,850,830
|
25,890,521
|
|||||||
|
Vested restricted stock units
|
670,156
|
558,825
|
411,768
|
|||||||
|
Basic number of weighted average shares outstanding
|
23,850,789
|
25,409,655
|
26,302,289
|
|||||||
|
Dilutive effect of stock options
|
31,180
|
48,005
|
102,651
|
|||||||
|
Dilutive effect of restricted stock and restricted stock units
|
127,624
|
141,296
|
195,915
|
|||||||
|
Dilutive number of weighted average shares outstanding
|
24,009,593
|
25,598,956
|
26,600,855
|
|||||||
For the years ended December 31, 2013, 2012 and 2011, there were no stock options, restricted stock or restricted stock units that would have been anti-dilutive.
13. STOCK REPURCHASES
Our board of directors approved a stock repurchase program which authorizes us to repurchase common shares in the open market or in privately negotiated transactions at price levels we deem attractive. On March 7, 2013, the board of directors authorized the repurchase of up to one million shares of our common stock in addition to the board’s prior authorizations. As of December 31, 2013, we had authorization to repurchase 324,456 shares of our common stock.
13. STOCK REPURCHASES – (Concluded)
The following table summarizes our stock repurchases for the years ended December 31, 2013, 2012, and 2011:
|
(Dollars in millions)
|
For the Years Ended December 31,
|
|||||||||||||||
|
2013
|
2012
|
2011
|
||||||||||||||
|
Stock Repurchases
|
Number of Shares Repurchased
|
Cost
|
Number of Shares Repurchased
|
Cost (1)
|
Number of Shares Repurchased
|
Cost (1)
|
||||||||||
|
Open Market
|
1,209,756
|
$
|
134.5
|
727,319
|
$
|
66.5
|
55,133
|
$
|
4.2
|
|||||||
|
Tender Offer
|
–
|
–
|
1,000,000
|
84.8
|
1,904,761
|
125.2
|
||||||||||
|
Other (2)
|
6,259
|
0.7
|
13,053
|
1.2
|
19,550
|
1.4
|
||||||||||
|
Total
|
1,216,015
|
$
|
135.2
|
1,740,372
|
$
|
152.5
|
1,979,444
|
$
|
130.8
|
|||||||
|
(1)
|
Tender Offer Cost amounts include offering costs of $0.3 million and $0.2 million for 2012 and 2011, respectively.
|
|
(2)
|
Represents shares of common stock released to us by team members as payment of tax withholdings due to us upon the vesting of restricted stock and restricted stock units.
|
14. STOCK-BASED COMPENSATION PLANS
Pursuant to our Amended and Restated Incentive Compensation Plan (the “Incentive Plan”), we can grant stock based awards in the form of restricted stock, restricted stock units and stock options to team members, officers, directors, and contractors at any time prior to March 26, 2022. On March 26, 2012, our board of directors approved an amendment to our Incentive Plan, increasing the number of shares authorized for issuance by 500,000 shares, to 2 million shares. The shares available for future grants under the Incentive Plan totaled 314,777 as of December 31, 2013.
On March 26, 2012, the compensation committee of our board of directors approved an award of 310,000 restricted stock units and 190,000 shares of restricted stock to our Chief Executive Officer. The 310,000 restricted stock units and 90,000 shares of restricted stock are eligible to vest over a ten year period beginning in 2012 based on the cumulative improvement in our annual adjusted economic profit, a non-GAAP financial measure. The remaining 100,000 shares of restricted stock are eligible to vest in equal annual installments over a five year period beginning in 2022 based on the attainment of annual adjusted economic profit targets.
Restricted Stock
In addition to the 190,000 shares of restricted stock awarded to our Chief Executive Officer in March 2012, we grant time-based shares of restricted stock annually to team members based on attaining certain individual and Company performance criteria in accordance with our Incentive Plan. Based on the terms of individual restricted stock grant agreements, these time-based shares generally vest over a period of three to five years, based on continuous employment. The grant-date fair value per share is estimated to equal the market price of our common stock on the date of grant.
A summary of the non-vested restricted stock activity under the Incentive Plan for the year ended December 31, 2013 is presented below:
|
Restricted Stock
|
Number of Shares
|
Weighted Average Grant-Date Fair Value Per Share
|
||||
|
Non-vested as of December 31, 2012
|
206,674
|
$
|
103.99
|
|||
|
Granted
|
9,119
|
113.56
|
||||
|
Vested
|
(16,341
|
)
|
83.63
|
|||
|
Forfeited
|
(770
|
)
|
103.41
|
|||
|
Non-vested as of December 31, 2013
|
198,682
|
$
|
106.11
|
|||
The grant-date weighted average fair value of shares granted in 2013, 2012 and 2011 was $113.56, $105.96, and $70.40, respectively. The total fair value of shares vested in 2013, 2012 and 2011 was $1.9 million, $3.6 million and $4.4 million, respectively.
|
14.
|
STOCK-BASED COMPENSATION PLANS – (Continued)
|
Restricted Stock Units
In addition to the 310,000 restricted stock units awarded to our Chief Executive Officer in March 2012, we grant performance-based restricted stock units to team members as part of our Incentive Plan. These restricted stock units are earned over a five year period based upon the compounded annual growth rate in our adjusted economic profit, a non-GAAP financial measure. Each restricted stock unit represents and has a value equal to one share of common stock. The grant-date fair value per share is estimated to equal the market price of our common stock on the date of grant.
A summary of the restricted stock unit activity under the Incentive Plan for the year ended December 31, 2013, is presented below:
|
Restricted Stock Units
|
Number of Restricted Stock Units
|
Weighted Average Grant-Date Fair Value Per Share
|
Aggregate Intrinsic Value
(2)
|
Weighted Average Remaining Contractual Term (in Years)
|
|||||||||
|
Outstanding as of December 31, 2012
|
1,096,910
|
$
|
47.88
|
||||||||||
|
Granted
|
8,095
|
122.81
|
|||||||||||
|
Converted
|
(848
|
)
|
106.50
|
||||||||||
|
Forfeited
|
(5,000
|
)
|
83.36
|
||||||||||
|
Outstanding as of December 31, 2013
(1)
|
1,099,157
|
$
|
48.23
|
$
|
142.9
|
4.3
|
|||||||
|
Vested as of December 31, 2013
|
680,926
|
$
|
24.87
|
$
|
88.5
|
1.6
|
|||||||
|
(1)
|
No RSUs outstanding at December 31, 2013 were convertible to shares of common stock.
|
|
(2)
|
The intrinsic value of RSUs is measured by applying the closing stock price as of December 31, 2013 to the applicable number of units.
|
The grant-date weighted average fair value of RSUs granted in 2013, 2012 and 2011 was $122.81, $105.74, and $63.73, respectively.
The total intrinsic value of RSUs converted to common stock during 2013 was $0.1 million. No RSUs were converted to shares of common stock during 2012 and 2011.
Stock Options
Pursuant to our 1992 Stock Option Plan (the “1992 Plan”), we had reserved 8.0 million shares of our common stock for the future granting of options to officers and other team members. Pursuant to our Director Stock Option Plan (the “Director Plan”), we had reserved 200,000 shares of our common stock for future granting of options to members of our Board of Directors. The exercise price of the options is no less than the fair market value on the date of the grant. Options expire ten years from the date of grant. The 1992 Plan had no options outstanding as of December 31, 2013 and 2012. The 1992 Plan and the Director Plan were terminated as to future grants on May 13, 2004, with shareholder approval of the Incentive Plan. All options outstanding as of December 31, 2013 are vested.
Additional stock option information relating to the Director Plan is as follows:
|
(Dollars in millions, except per share data)
|
|||||||||||||
|
Number of Options
|
Weighted Average Exercise Per Share
|
Aggregate Intrinsic Value
|
Weighted Average Remaining Contractual Term (in Years)
|
||||||||||
|
Outstanding as of December 31, 2012
|
70,000 | $ | 17.25 | ||||||||||
|
Options exercised
|
35,000 | $ | 17.25 | ||||||||||
|
Outstanding as of December 31, 2013
|
35,000 | $ | 17.25 | $ | 3.9 | 0.2 | |||||||
|
Exercisable as of December 31, 2013
|
35,000 | $ | 17.25 | $ | 3.9 | 0.2 | |||||||
The total intrinsic value of stock options exercised in 2013, 2012 and 2011 was $3.2 million, $3.0 million, and $15.8 million, respectively.
|
14.
|
STOCK-BASED COMPENSATION PLANS – (Concluded)
|
Stock-based compensation expense
Stock-based compensation expense consists of the following:
|
(In millions)
|
For the Years Ended December 31,
|
|||||||||
|
2013
|
2012
|
2011
|
||||||||
|
Restricted stock
|
$
|
3.0
|
$
|
3.4
|
$
|
0.6
|
||||
|
Restricted stock units
|
5.5
|
8.8
|
1.3
|
|||||||
|
Total
|
$
|
8.5
|
$
|
12.2
|
$
|
1.9
|
||||
While the restricted stock units and shares of restricted stock are often expected to vest in equal, annual installments over the corresponding requisite service periods of the grants, the related stock-based compensation expense is not recognized on a straight-line basis over the same periods. Each installment is accounted for as a separate award and as a result, the fair value of each installment is recognized as stock-based compensation expense on a straight-line basis over the related vesting period. The following table details how the expenses associated with restricted stock and restricted stock units, which are expected to be recognized over a weighted average period of 3.6 years, will be recorded assuming performance targets are achieved in the periods currently estimated:
|
(In millions)
|
||||||||||
|
For the Years Ended December 31,
|
Restricted Stock Units
|
Restricted Stock
|
Total Projected Expense
|
|||||||
|
2014
|
$
|
4.9
|
$
|
2.5
|
$
|
7.4
|
||||
|
2015
|
4.0
|
2.1
|
6.1
|
|||||||
|
2016
|
3.7
|
1.8
|
5.5
|
|||||||
|
2017
|
3.1
|
1.7
|
4.8
|
|||||||
|
2018
|
2.4
|
1.5
|
3.9
|
|||||||
|
Thereafter
|
3.8
|
6.2
|
10.0
|
|||||||
|
Total
|
$
|
21.9
|
$
|
15.8
|
$
|
37.7
|
||||
|
15.
|
ACCUMULATED OTHER COMPREHENSIVE INCOME (LOSS)
|
There were no reclassifications out of accumulated other comprehensive income in 2013 and 2012. Reclassifications out of accumulated other comprehensive income in 2011 were as follows:
|
(In millions)
|
||||||
|
Details about accumulated other comprehensive income components
|
Amount reclassified from accumulated other comprehensive income
|
Affected line item in the income statement
where net income is presented |
||||
|
Gain (Loss) on derivatives qualifying as hedges
|
||||||
|
Interest rate contracts
|
$
|
(0.2
|
)
|
Interest income (expense)
|
||
|
Total reclassifications before tax
|
(0.2
|
)
|
||||
|
0.1
|
Tax (expense) benefit
|
|||||
|
Reclassifications for the period ended December 31, 2011
|
$
|
(0.1
|
)
|
Net of tax
|
||
|
16.
|
BUSINESS SEGMENT AND OTHER INFORMATION
|
Business Segment Overview
We identify operating segments as components of our business for which separate financial information is regularly evaluated by the chief operating decision-maker (“CODM”) in making decisions regarding resource allocation and assessing performance. We periodically review and redefine our segment reporting as internal management reporting practices evolve and the components of our business change. Currently, the CODM reviews consolidated financial statements and metrics to allocate resources and assess performance. Thus, we have determined that we operate in one reportable operating segment. The consolidated financial statements reflect the financial results of our one reportable operating segment.
Geographic Information
For the three years ended December 31, 2013, 2012 and 2011, all of our revenues were derived from the United States. As of December 31, 2013 and 2012, all of our long-lived assets were located in the United States.
Products and Services Information
Our primary product consists of offering automobile dealers financing programs that enable them to sell vehicles to consumers, regardless of their credit history, through our network of Dealers within the United States. We also provide Dealers the ability to offer vehicle service contracts and a GAP product to consumers on vehicles financed by us.
Major Customer Information
We did not have any Dealers that provided 10% or more of our revenue during 2013, 2012, or 2011. Additionally, no single Dealer’s Loans receivable balance accounted for more than 10% of total Loans receivable as of December 31, 2013 or 2012.
17. LITIGATION AND CONTINGENT LIABILITIES
In the normal course of business and as a result of the consumer-oriented nature of the industry in which we operate, industry participants are frequently subject to various consumer claims and litigation seeking damages and statutory penalties. The claims allege, among other theories of liability, violations of state, federal and foreign truth-in-lending, credit availability, credit reporting, consumer protection, warranty, debt collection, insurance and other consumer-oriented laws and regulations, including claims seeking damages for physical and mental damages relating to our repossession and sale of the consumer’s vehicle and other debt collection activities. As the assignee of Consumer Loans originated by Dealers, we may also be named as a co-defendant in lawsuits filed by consumers principally against Dealers. We may also have disputes and litigation with Dealers. The claims may allege, among other theories of liability, that we breached our Dealer servicing agreement. Many of these cases are filed as purported class actions and seek damages in large dollar amounts. Current actions to which we are a party include the following matter.
17. LITIGATION AND CONTINGENT LIABILITIES – (Concluded)
On February 1, 2013, six Dealers, who had previously commenced a putative consolidated arbitration proceeding against the Company before the American Arbitration Association ("AAA") that was deemed not properly filed by the AAA on October 9, 2012, filed individual arbitrations against the Company before the AAA in Southfield, Michigan. These arbitration demands seek unspecified money damages for claims relating to the Dealer servicing agreements of these Dealers. The Company intends to vigorously defend itself against these arbitrations.
An adverse ultimate disposition in any action to which we are a party or otherwise subject could have a material adverse impact on our financial position, liquidity and results of operations.
18. SUBSEQUENT EVENTS
During January 2014, we issued $300 million of 6.125% senior notes due 2021 (the “2021 senior notes”) in a private offering exempt from registration under the Securities Act of 1933. We intend to use the net proceeds from the 2021 senior notes, together with borrowings under our revolving credit facility, to redeem in full the $350.0 million outstanding principal amount of our 2017 senior notes. In accordance with the terms of the indenture governing the 2017 senior notes, we have provided an irrevocable notice of our election to redeem all of the outstanding 2017 senior notes on February 21, 2014 (the “Redemption Date”). We expect the 2017 senior notes will be redeemed on the Redemption Date at a redemption price equal to 104.563% of the principal amount thereof, plus accrued and unpaid interest to but excluding the Redemption Date. For the quarter ended March 31, 2014, we expect to recognize a pre-tax loss on the extinguishment of debt of $21.7 million related to the redemption of the 2017 senior notes.
|
19.
|
QUARTERLY FINANCIAL DATA (unaudited)
|
The following is a summary of the quarterly financial position and results of operations as of and for the years ended December 31, 2013 and 2012, which have been prepared in accordance with GAAP.
|
(In millions, except share and per share data)
|
2013
|
||||||||||||
|
Quarters Ended
|
|||||||||||||
|
March 31
|
June 30
|
September 30
|
December 31
|
||||||||||
|
Balance Sheets
|
|||||||||||||
|
Loans receivable, net
|
$
|
2,028.6
|
$
|
2,092.7
|
$
|
2,163.4
|
$
|
2,212.8
|
|||||
|
All other assets
|
219.7
|
222.6
|
221.8
|
220.6
|
|||||||||
|
Total assets
|
$
|
2,248.3
|
$
|
2,315.3
|
$
|
2,385.2
|
$
|
2,433.4
|
|||||
|
Total debt
|
$
|
1,356.0
|
$
|
1,407.2
|
$
|
1,434.0
|
$
|
1,392.4
|
|||||
|
Other liabilities
|
267.7
|
254.2
|
261.4
|
290.9
|
|||||||||
|
Total liabilities
|
1,623.7
|
1,661.4
|
1,695.4
|
1,683.3
|
|||||||||
|
Shareholders' equity (1)
|
624.6
|
653.9
|
689.8
|
750.1
|
|||||||||
|
Total liabilities and shareholders' equity
|
$
|
2,248.3
|
$
|
2,315.3
|
$
|
2,385.2
|
$
|
2,433.4
|
|||||
|
Income Statements
|
|||||||||||||
|
Revenue
|
$
|
164.7
|
$
|
169.4
|
$
|
172.7
|
$
|
175.3
|
|||||
|
Costs and expenses
|
69.6
|
72.0
|
70.5
|
71.8
|
|||||||||
|
Income before provision for income taxes
|
95.1
|
97.4
|
102.2
|
103.5
|
|||||||||
|
Provision for income taxes
|
34.5
|
35.9
|
37.1
|
37.6
|
|||||||||
|
Net income
|
$
|
60.6
|
$
|
61.5
|
$
|
65.1
|
$
|
65.9
|
|||||
|
Net income per share:
|
|||||||||||||
|
Basic
|
$
|
2.49
|
$
|
2.57
|
$
|
2.75
|
$
|
2.81
|
|||||
|
Diluted
|
$
|
2.48
|
$
|
2.56
|
$
|
2.75
|
$
|
2.80
|
|||||
|
Weighted average shares outstanding:
|
|||||||||||||
|
Basic
|
24,330,027
|
23,974,099
|
23,672,635
|
23,438,153
|
|||||||||
|
Diluted
|
24,426,127
|
24,017,273
|
23,708,043
|
23,575,786
|
|||||||||
|
(1)
|
No dividends were paid during the periods presented.
|
|
19.
|
QUARTERLY FINANCIAL DATA (unaudited) – (Concluded)
|
|
(In millions, except share and per share data)
|
2012
|
||||||||||||
|
Quarters Ended
|
|||||||||||||
|
March 31
|
June 30
|
September 30
|
December 31
|
||||||||||
|
Balance Sheets
|
|||||||||||||
|
Loans receivable, net
|
$
|
1,737.8
|
$
|
1,815.9
|
$
|
1,876.7
|
$
|
1,933.5
|
|||||
|
All other assets
|
217.2
|
187.0
|
226.6
|
199.7
|
|||||||||
|
Total assets
|
$
|
1,955.0
|
$
|
2,002.9
|
$
|
2,103.3
|
$
|
2,133.2
|
|||||
|
Total debt
|
$
|
1,132.7
|
$
|
1,132.0
|
$
|
1,262.1
|
$
|
1,250.8
|
|||||
|
Other liabilities
|
249.7
|
330.5
|
243.4
|
260.5
|
|||||||||
|
Total liabilities
|
1,382.4
|
1,462.5
|
1,505.5
|
1,511.3
|
|||||||||
|
Shareholders' equity (1)
|
572.6
|
540.4
|
597.8
|
621.9
|
|||||||||
|
Total liabilities and shareholders' equity
|
$
|
1,955.0
|
$
|
2,002.9
|
$
|
2,103.3
|
$
|
2,133.2
|
|||||
|
Income Statements
|
|||||||||||||
|
Revenue
|
$
|
142.4
|
$
|
151.8
|
$
|
155.7
|
$
|
159.3
|
|||||
|
Costs and expenses
|
63.6
|
62.6
|
71.9
|
68.0
|
|||||||||
|
Income before provision for income taxes
|
78.8
|
89.2
|
83.8
|
91.3
|
|||||||||
|
Provision for income taxes
|
28.5
|
32.6
|
30.9
|
31.4
|
|||||||||
|
Net income
|
$
|
50.3
|
$
|
56.6
|
$
|
52.9
|
$
|
59.9
|
|||||
|
Net income per share:
|
|||||||||||||
|
Basic
|
$
|
1.92
|
$
|
2.18
|
$
|
2.13
|
$
|
2.42
|
|||||
|
Diluted
|
$
|
1.92
|
$
|
2.18
|
$
|
2.12
|
$
|
2.40
|
|||||
|
Weighted average shares outstanding:
|
|||||||||||||
|
Basic
|
26,157,672
|
25,925,627
|
24,908,247
|
24,756,286
|
|||||||||
|
Diluted
|
26,283,801
|
25,979,872
|
24,962,054
|
24,926,004
|
|||||||||
|
(1)
|
No dividends were paid during the periods presented.
|
Not applicable.
Evaluation of disclosure controls and procedures.
(a)
Disclosure Controls and Procedures.
Our management, with the participation of our Chief Executive Officer and Chief Financial Officer, has evaluated the effectiveness of our disclosure controls and procedures (as such term is defined in Rules 13a-15(e) and 15d-15(e) under the Securities Exchange Act of 1934, as amended (the "Exchange Act")) as of the end of the period covered by this report. Based on such evaluation, our Chief Executive Officer and Chief Financial Officer have concluded that, as of the end of such period, our disclosure controls and procedures are effective in recording, processing, summarizing and reporting, on a timely basis, information required to be disclosed by us in the reports that we file or submit under the Exchange Act and are effective in ensuring that information required to be disclosed by us in the reports that we file or submit under the Exchange Act is accumulated and communicated to our management, including our Chief Executive Officer and Chief Financial Officer, as appropriate to allow timely decisions regarding required disclosure.
(b)
Internal Control Over Financial Reporting.
There have not been any changes in our internal control over financial reporting (as such term is defined in Rules 13a-15(f) and 15d-15(f) under the Exchange Act) during the quarter ended December 31, 2013 that have materially affected, or are reasonably likely to materially affect, our internal control over financial reporting.
Management’s Report on Internal Control over Financial Reporting.
We are responsible for establishing and maintaining adequate internal control over financial reporting as defined in Rules 13a-15(f) and 15d-15(f) under the Securities Exchange Act of 1934. Our internal control over financial reporting is designed to provide reasonable assurance regarding the reliability of financial reporting and the preparation of financial statements for external purposes in accordance with generally accepted accounting principles. Internal control over financial reporting includes those policies and procedures that:
|
·
|
pertain to the maintenance of records that, in reasonable detail, accurately and fairly reflect the transactions and dispositions of our assets;
|
|
·
|
provide reasonable assurance that transactions are recorded as necessary to permit preparation of financial statements in accordance with generally accepted accounting principles, and that our receipts and expenditures are being made only in accordance with authorizations of our management and directors; and
|
|
·
|
provide reasonable assurance regarding prevention or timely detection of unauthorized acquisition, use or disposition of our assets that could have a material effect on our consolidated financial statements.
|
Because of its inherent limitations, internal control over financial reporting may not prevent or detect misstatements. In addition, projections of any evaluation of effectiveness to future periods are subject to the risk that controls may become inadequate because of changes in conditions and that the degree of compliance with the policies or procedures may deteriorate.
We assessed the effectiveness of our internal control over financial reporting as of December 31, 2013. In making this assessment, we used the criteria set forth in Internal Control-Integrated Framework (1992) issued by the Committee of Sponsoring Organizations of the Treadway Commission (COSO). Based on our assessment, we believe that as of December 31, 2013, our internal control over financial reporting is effective based on those criteria.
Our independent registered public accounting firm, Grant Thornton LLP, audited our internal control over financial reporting as of December 31, 2013 and their report dated February 14, 2014 expressed an unqualified opinion on our internal control over financial reporting and is included in this Item 9A.
Board of Directors and Shareholders of
Credit Acceptance Corporation
We have audited the internal control over financial reporting of Credit Acceptance Corporation (a Michigan corporation) and subsidiaries (the “Company”) as of December 31, 2013, based on criteria established in the 1992 Internal Control—Integrated Framework issued by the Committee of Sponsoring Organizations of the Treadway Commission (COSO). The Company’s management is responsible for maintaining effective internal control over financial reporting and for its assessment of the effectiveness of internal control over financial reporting, included in the accompanying Management’s Report on Internal Control over Financial Reporting. Our responsibility is to express an opinion on the Company’s internal control over financial reporting based on our audit.
We conducted our audit in accordance with the standards of the Public Company Accounting Oversight Board (United States). Those standards require that we plan and perform the audit to obtain reasonable assurance about whether effective internal control over financial reporting was maintained in all material respects. Our audit included obtaining an understanding of internal control over financial reporting, assessing the risk that a material weakness exists, testing and evaluating the design and operating effectiveness of internal control based on the assessed risk, and performing such other procedures as we considered necessary in the circumstances. We believe that our audit provides a reasonable basis for our opinion.
A company’s internal control over financial reporting is a process designed to provide reasonable assurance regarding the reliability of financial reporting and the preparation of financial statements for external purposes in accordance with generally accepted accounting principles. A company’s internal control over financial reporting includes those policies and procedures that (1) pertain to the maintenance of records that, in reasonable detail, accurately and fairly reflect the transactions and dispositions of the assets of the company; (2) provide reasonable assurance that transactions are recorded as necessary to permit preparation of financial statements in accordance with generally accepted accounting principles, and that receipts and expenditures of the company are being made only in accordance with authorizations of management and directors of the company; and (3) provide reasonable assurance regarding prevention or timely detection of unauthorized acquisition, use, or disposition of the company’s assets that could have a material effect on the financial statements.
Because of its inherent limitations, internal control over financial reporting may not prevent or detect misstatements. Also, projections of any evaluation of effectiveness to future periods are subject to the risk that controls may become inadequate because of changes in conditions, or that the degree of compliance with the policies or procedures may deteriorate.
In our opinion, the Company maintained, in all material respects, effective internal control over financial reporting as of December 31, 2013, based on criteria established in the 1992 Internal Control—Integrated Framework issued by COSO.
We also have audited, in accordance with the standards of the Public Company Accounting Oversight Board (United States), the consolidated financial statements of the Company as of and for the year ended December 31, 2013, and our report dated February 14, 2014 expressed an unqualified opinion on those financial statements.
/s/ GRANT THORNTON LLP
Southfield, Michigan
February 14, 2014
None.
|
|
|
Information is contained under the captions “Election of Directors” (excluding the “Report of the Audit Committee”) and “Section 16 (a) Beneficial Ownership Reporting Compliance” in our Proxy Statement and is incorporated herein by reference.
Information is contained under the caption “Compensation of Executive Officers” (excluding the “Report of the Executive Compensation Committee”) in our Proxy Statement and is incorporated herein by reference.
|
SECURITY OWNERSHIP OF CERTAIN BENEFICIAL OWNERS AND MANAGEMENT AND RELATED STOCKHOLDER MATTERS
|
Information is contained under the caption “Common Stock Ownership of Certain Beneficial Owners and Management” in our Proxy Statement and is incorporated herein by reference.
Our Incentive Compensation Plan (the “Incentive Plan”), which was approved by shareholders on May 13, 2004, provides for the granting of restricted stock, restricted stock units and stock options to team members, officers, and directors. Our Director Stock Option Plan (the “Director Plan”), which was approved by shareholders in 2002 and was terminated as to future grants on May 13, 2004, provided for the granting of stock options with time or performance-based vesting requirements to directors.
The following table sets forth (1) the number of shares of common stock to be issued upon the exercise of outstanding options or restricted stock units, (2) the weighted average exercise price of outstanding options, and (3) the number of shares remaining available for future issuance, as of December 31, 2013:
|
Plan Category
|
Number of shares to be issued upon exercise of outstanding options, warrants and rights
|
Weighted-average exercise price of outstanding options
|
Number of shares
remaining available for future issuance under equity compensation plans (a)
|
|||||||
|
Equity compensation plans approved by shareholders:
|
||||||||||
|
Director Plan
|
35,000
|
$
|
17.25
|
–
|
||||||
|
Incentive Plan
|
1,099,157
|
314,777
|
||||||||
|
Total
|
1,134,157
|
$
|
17.25
|
314,777
|
||||||
|
(a)
|
For additional information regarding our equity compensation plans, see Note 14 to the consolidated financial statements contained in Item 8 of this Form 10-K, which is incorporated herein by reference.
|
Information is contained under the caption “Certain Relationships and Transactions” and “Election of Directors – Meetings and Committees of the Board of Directors” in our Proxy Statement and is incorporated herein by reference.
Information is contained under the caption “Independent Accountants” in our Proxy Statement and is incorporated herein by reference.
|
(a)(1)
|
The following consolidated financial statements of the Company and Report of Independent Public Accountants are contained in Item 8 — Financial Statements and Supplementary Data of this Form 10-K, which is incorporated herein by reference.
|
|
Report of Independent Public Accountants
|
|
|
Consolidated Financial Statements:
|
|
|
— Consolidated Balance Sheets as of December 31, 2013 and 2012
|
|
|
— Consolidated Statements of Income for the years ended December 31, 2013, 2012 and 2011
|
|
|
— Consolidated Statements of Comprehensive Income for the years ended December 31, 2013, 2012 and 2011
|
|
|
— Consolidated Statements of Shareholders' Equity for the years ended December 31, 2013, 2012 and 2011
|
|
|
— Consolidated Statements of Cash Flows for the years ended December 31, 2013, 2012 and 2011
|
|
|
Notes to Consolidated Financial Statements
|
|
|
(2)
|
Financial Statement Schedules have been omitted because they are not applicable or are not required or the information required to be set forth therein is included in the Consolidated Financial Statements or Notes thereto.
|
|
(3)
|
The Exhibits filed in response to Item 601 of Regulation S-K are listed in the Exhibit Index, which is incorporated herein by reference.
|
Pursuant to the requirements of Section 13 or 15(d) of the Securities Exchange Act of 1934, the registrant has duly caused this report to be signed on its behalf by the undersigned, thereunto duly authorized.
|
CREDIT ACCEPTANCE CORPORATION
|
|||
|
By:
|
/s/ BRETT A. ROBERTS
|
||
|
Brett A. Roberts
|
|||
|
Chief Executive Officer
|
|||
|
(Principal Executive Officer)
|
|||
|
Date: February 14, 2014
|
|||
Pursuant to the requirements of the Securities Exchange Act of 1934, this report has been signed
below
by the following persons on
February
14, 2014
on behalf of the registrant and in the capacities indicated.
|
Signature
|
Title
|
|||
|
/s/ BRETT A. ROBERTS
|
Chief Executive Officer and Director
|
|||
|
Brett A. Roberts
|
(Principal Executive Officer)
|
|||
|
/s/ KENNETH S. BOOTH
|
Chief Financial Officer
|
|||
|
Kenneth S. Booth
|
(Principal Financial Officer and Principal Accounting Officer)
|
|||
|
/s/ GLENDA J. FLANAGAN
|
Director
|
|||
|
Glenda J. Flanagan
|
||||
|
/s/ DONALD A. FOSS
|
Director and Chairman of the Board
|
|||
|
Donald A. Foss
|
||||
|
/s/ THOMAS N. TRYFOROS
|
Director
|
|||
|
Thomas N. Tryforos
|
||||
|
/s/ SCOTT J. VASSALLUZZO
|
Director
|
|||
|
Scott J. Vassalluzzo
|
EXHIBIT INDEX
The following documents are filed as part of this report. Those exhibits previously filed and incorporated herein by reference are identified below. Exhibits not required for this report have been omitted. Unless otherwise noted, the Company’s commission file number for all exhibits incorporated by reference herein is 000-20202.
|
Exhibit No.
|
Description
|
|
|
3.1
|
Articles of Incorporation, as amended July 1, 1997 (incorporated by reference to an exhibit to the Company's Form 10-Q for the quarterly period ended June 30, 1997)
|
|
|
3.2
|
Amended and Restated Bylaws of the Company, as amended, February 24, 2005 (incorporated by reference to an exhibit to the Company’s Annual Report on Form 10-K for the year ended December 31, 2004)
|
|
|
4.26
|
Backup Servicing Agreement dated May 23, 2008 among the Company, CAC Warehouse Funding III, LLC, Fifth Third Bank and Systems & Services Technologies, Inc. (incorporated by reference to an exhibit to the Company’s Current Report on Form 8-K, dated June 2, 2008)
|
|
|
4.38
|
Indenture, dated as of February 1, 2010, among the Company, the Guarantors named therein and U.S. Bank National Association, as trustee (incorporated by reference to an exhibit to the Company’s Current Report on Form 8-K, dated February 5, 2010)
|
|
|
4.40
|
Fourth Amended and Restated Security Agreement, dated as of February 1, 2010, among the Company, the other Debtors party thereto and Comerica Bank, as collateral agent (incorporated by reference to an exhibit to the Company’s Current Report on Form 8-K, dated February 5, 2010)
|
|
|
4.50
|
First Supplemental Indenture, dated as of March 3, 2011, among the Company, the Guarantors named therein and U.S. Bank National Association, as trustee (incorporated by reference to an exhibit to the Company's Current Report on Form 8-K, dated March 3, 2011)
|
|
|
4.52
|
Fifth Amended and Restated Credit Agreement, dated as of June 17, 2011, among the Company, the Banks which are parties thereto from time to time, and Comerica Bank as Administrative Agent and Collateral Agent for the Banks (incorporated by reference to an exhibit to the Company's Current Report on Form 8-K, dated June 22, 2011)
|
|
|
4.54
|
Loan and Security Agreement dated as of August 19, 2011 among the Company, CAC Warehouse Funding LLC IV, BMO Capital Markets Corp., Bank of Montreal and Wells Fargo Bank, National Association (incorporated by reference to an exhibit to the Company's Current Report on Form 8-K, dated August 24, 2011)
|
|
|
4.55
|
Backup Servicing Agreement dated as of August 19, 2011 among the Company, CAC Warehouse Funding LLC IV, Wells Fargo Bank, National Association, Bank of Montreal and BMO Capital Markets Corp. (incorporated by reference to an exhibit to the Company's Current Report on Form 8-K, dated August 24, 2011)
|
|
|
4.57
|
Indenture dated October 6, 2011, between Credit Acceptance Auto Loan Trust 2011-1 and Wells Fargo Bank, National Association (incorporated by reference to an exhibit to the Company's Current Report on Form 8-K, dated October 12, 2011)
|
|
|
4.58
|
Sale and Servicing Agreement dated October 6, 2011, among the Company, Credit Acceptance Auto Loan Trust 2011-1, Credit Acceptance Funding LLC 2011-1, and Wells Fargo Bank, National Association (incorporated by reference to an exhibit to the Company's Current Report on Form 8-K, dated October 12, 2011)
|
|
|
4.59
|
Backup Servicing Agreement dated October 6, 2011, among the Company, Credit Acceptance Funding LLC 2011-1, Credit Acceptance Auto Loan Trust 2011-1, and Wells Fargo Bank, National Association (incorporated by reference to an exhibit to the Company's Current Report on Form 8-K, dated October 12, 2011)
|
|
|
4.60
|
Amended and Restated Trust Agreement dated October 6, 2011, between Credit Acceptance Funding LLC 2011-1 and U.S. Bank Trust National Association (incorporated by reference to an exhibit to the Company's Current Report on Form 8-K, dated October 12, 2011)
|
|
|
4.61
|
Sale and Contribution Agreement dated October 6, 2011, between the Company and Credit Acceptance Funding LLC 2011-1 (incorporated by reference to an exhibit to the Company's Current Report on Form 8-K, dated October 12, 2011)
|
|
|
4.65
|
Amended and Restated Intercreditor Agreement, dated as of February 1, 2010, among Credit Acceptance Corporation, the other Grantors party thereto, representatives of the Secured Parties thereunder and Comerica Bank, as administrative agent under the Original Credit Agreement (as defined therein) and as collateral agent (incorporated by reference to an exhibit to the Company’s Current Report on Form 8-K, dated February 5, 2010)
|
|
|
4.66
|
Indenture dated as of March 29, 2012, between Credit Acceptance Auto Loan Trust 2012-1 and Wells Fargo Bank, National Association (incorporated by reference to an exhibit to the Company’s Current Report on Form 8-K, dated April 4, 2012)
|
|
|
4.67
|
Sale and Servicing Agreement dated as of March 29, 2012, among the Company, Credit Acceptance Auto Loan Trust 2012-1, Credit Acceptance Funding LLC 2012-1, and Wells Fargo Bank, National Association (incorporated by reference to an exhibit to the Company’s Current Report on Form 8-K, dated April 4, 2012)
|
|
|
4.68
|
Backup Servicing Agreement dated as of March 29, 2012, among the Company, Credit Acceptance Funding LLC 2012-1, Credit Acceptance Auto Loan Trust 2012-1, and Wells Fargo Bank, National Association (incorporated by reference to an exhibit to the Company’s Current Report on Form 8-K, dated April 4, 2012)
|
|
|
4.69
|
Amended and Restated Trust Agreement dated as of March 29, 2012, between Credit Acceptance Funding LLC 2012-1 and U.S. Bank Trust National Association (incorporated by reference to an exhibit to the Company’s Current Report on Form 8-K, dated April 4, 2012)
|
|
|
4.70
|
Sale and Contribution Agreement dated as of March 29, 2012, between the Company and Credit Acceptance Funding LLC 2012-1 (incorporated by reference to an exhibit to the Company’s Current Report on Form 8-K, dated April 4, 2012)
|
|
|
4.72
|
First Amendment to the Fifth Amended and Restated Credit Agreement, dated as of June 15, 2012, among the Company, the Banks which are parties thereto from time to time, and Comerica Bank as Administrative Agent and Collateral Agent for the Banks (incorporated by reference to an exhibit to the Company’s Current Report on Form 8-K, dated June 15, 2012)
|
|
|
4.73
|
Amended and Restated Loan and Security Agreement, dated as of June 29, 2012 among the Company, CAC Warehouse Funding III, LLC, Fifth Third Bank and Systems & Services Technologies, Inc. (incorporated by reference to an exhibit to the Company’s Current Report on Form 8-K, dated July 6, 2012)
|
|
|
4.74
|
Amended and Restated Contribution Agreement, dated as of June 29, 2012 between the Company and CAC Warehouse Funding III, LLC (incorporated by reference to an exhibit to the Company’s Current Report on Form 8-K, dated July 6, 2012)
|
|
|
4.75
|
Indenture dated as of September 20, 2012, between Credit Acceptance Auto Loan Trust 2012-2 and Wells Fargo Bank, National Association (incorporated by reference to an exhibit to the Company’s Current Report on Form 8-K, dated September 20, 2012)
|
|
|
4.76
|
Sale and Servicing Agreement dated as of September 20, 2012, among the Company, Credit Acceptance Auto Loan Trust 2012-2, Credit Acceptance Funding LLC 2012-2, and Wells Fargo Bank, National Association (incorporated by reference to an exhibit to the Company’s Current Report on Form 8-K, dated September 25, 2012)
|
|
|
4.77
|
Backup Servicing Agreement dated as of September 20, 2012, among the Company, Credit Acceptance Funding LLC 2012-2, Credit Acceptance Auto Loan Trust 2012-2, and Wells Fargo Bank, National Association (incorporated by reference to an exhibit to the Company’s Current Report on Form 8-K, dated September 25, 2012)
|
|
|
4.78
|
Amended and Restated Trust Agreement dated as of September 20, 2012, between Credit Acceptance Funding LLC 2012-2 and U.S. Bank Trust National Association (incorporated by reference to an exhibit to the Company’s Current Report on Form 8-K, dated September 25, 2012)
|
|
|
4.79
|
Sale and Contribution Agreement dated as of September 20, 2012, between the Company and Credit Acceptance Funding LLC 2012-2 (incorporated by reference to an exhibit to the Company’s Current Report on Form 8-K, dated September 25, 2012)
|
|
|
4.81
|
Fifth Amended and Restated Loan and Security Agreement dated as of December 27, 2012 among the Company, CAC Warehouse Funding Corporation II, Variable Funding Capital Company LLC, Wells Fargo Securities, LLC, and Wells Fargo Bank, National Association (incorporated by reference to an exhibit to the Company’s Current Report on Form 8-K, dated January 3, 2013)
|
|
4.82
|
Amended and Restated Backup Servicing Agreement dated as of December 27, 2012 among the Company, CAC Warehouse Funding Corporation II, Wells Fargo Securities, LLC, and Wells Fargo Bank, National Association (incorporated by reference to an exhibit to the Company’s Current Report on Form 8-K, dated January 3, 2013)
|
||
|
4.83
|
Third Amended and Restated Sale and Contribution Agreement dated as of December 27, 2012 between the Company and CAC Warehouse Funding Corporation II (incorporated by reference to an exhibit to the Company’s Current Report on Form 8-K, dated January 3, 2013)
|
||
|
4.84
|
First Amendment to Loan and Security Agreement dated as of April 5, 2013 among the Company, CAC Warehouse Funding LLC IV, Bank of Montreal, BMO Capital Markets Corp., and Wells Fargo Bank, National Association (incorporated by reference to an exhibit to the Company’s Current Report on Form 8-K, dated April 5, 2013)
|
||
|
4.85
|
Amended and Restated Sale and Contribution Agreement dated as of April 5, 2013 between the Company and CAC Warehouse Funding LLC IV (incorporated by reference to an exhibit to the Company’s Current Report on Form 8-K, dated April 5, 2013)
|
||
|
4.86
|
Indenture dated as of April 25, 2013, between Credit Acceptance Auto Loan Trust 2013-1 and Wells Fargo Bank, National Association (incorporated by reference to an exhibit to the Company’s Current Report on Form 8-K, dated April 29, 2013)
|
||
|
4.87
|
Sale and Servicing Agreement dated as of April 25, 2013 among the Company, Credit Acceptance Auto Loan Trust 2013-1, Credit Acceptance Funding LLC 2013-1, and Wells Fargo Bank, National Association (incorporated by reference to an exhibit to the Company’s Current Report on Form 8-K, dated April 29, 2013)
|
||
|
4.88
|
Backup Servicing Agreement dated as of April 25, 2013, among the Company, Credit Acceptance Funding LLC 2013-1, Credit Acceptance Auto Loan Trust 2013-1, and Wells Fargo Bank, National Association (incorporated by reference to an exhibit to the Company’s Current Report on Form 8-K, dated April 29, 2013)
|
||
|
4.89
|
Amended and Restated Trust Agreement dated as of April 25, 2013, between Credit Acceptance Funding LLC 2013-1 and U.S. Bank Trust National Association (incorporated by reference to an exhibit to the Company’s Current Report on Form 8-K, dated April 29, 2013)
|
||
|
4.90
|
Sale and Contribution Agreement dated as of April 25, 2013, between the Company and Credit Acceptance Funding LLC 2013-1 (incorporated by reference to an exhibit to the Company’s Current Report on Form 8-K, dated April 29, 2013)
|
||
|
4.92
|
Second Amendment to the Fifth Amended and Restated Credit Agreement, dated as of June 20, 2013, among the Company, the Banks which are parties thereto from time to time, and Comerica Bank as Administrative Agent and Collateral Agent for the Banks (incorporated by reference to an exhibit to the Company’s Current Report on Form 8-K, dated June 24, 2013)
|
||
|
4.93
|
First Amendment to Amended and Restated Loan and Security Agreement, dated as of August 16, 2013, among the Company, CAC Warehouse Funding III, LLC, Fifth Third Bank and Systems & Services Technologies, Inc. (incorporated by reference to an exhibit to the Company’s Form 10-Q, for the quarterly period ended September 30, 2013)
|
||
|
4.94
|
First Amendment to Amended and Restated Contribution Agreement, dated as of August 16, 2013, among the Company and CAC Warehouse Funding III, LLC (incorporated by reference to an exhibit to the Company’s Form 10-Q, for the quarterly period ended September 30, 2013)
|
||
|
4.95
|
Indenture dated as of October 31, 2013, between Credit Acceptance Auto Loan Trust 2013-2 and Wells Fargo Bank, National Association (incorporated by reference to an exhibit to the Company’s Current Report on Form 8-K, dated November 5, 2013)
|
||
|
4.96
|
Sale and Servicing Agreement dated as of October 31, 2013 among the Company, Credit Acceptance Auto Loan Trust 2013-2, Credit Acceptance Funding LLC 2013-2, and Wells Fargo Bank, National Association (incorporated by reference to an exhibit to the Company’s Current Report on Form 8-K, dated November 5, 2013)
|
||
|
4.97
|
Backup Servicing Agreement dated as of October 31, 2013, among the Company, Credit Acceptance Funding LLC 2013-2, Credit Acceptance Auto Loan Trust 2013-2, and Wells Fargo Bank, National Association (incorporated by reference to an exhibit to the Company’s Current Report on Form 8-K, dated November 5, 2013)
|
|
4.98
|
Amended and Restated Trust Agreement dated as of October 31, 2013, between Credit Acceptance Funding LLC 2013-2 and U.S. Bank Trust National Association (incorporated by reference to an exhibit to the Company’s Current Report on Form 8-K, dated November 5, 2013)
|
||
|
4.99
|
Sale and Contribution Agreement dated as of October 31, 2013, between the Company and Credit Acceptance Funding LLC 2013-2 (incorporated by reference to an exhibit to the Company’s Current Report on Form 8-K, dated November 5, 2013)
|
||
|
4.100
|
Amended and Restated Intercreditor Agreement dated October 31, 2013, among the Company, CAC Warehouse Funding Corporation II, CAC Warehouse Funding III, LLC, CAC Warehouse Funding LLC IV, Credit Acceptance Funding LLC 2013-2, Credit Acceptance Funding LLC 2013-1, Credit Acceptance Funding LLC 2012-2, Credit Acceptance Funding LLC 2012-1, Credit Acceptance Funding LLC 2011-1, Credit Acceptance Auto Loan Trust 2013-2, Credit Acceptance Auto Loan Trust 2013-1, Credit Acceptance Auto Loan Trust 2012-2, Credit Acceptance Auto Loan Trust 2012-1, Credit Acceptance Auto Loan Trust 2011-1, Fifth Third Bank, as agent, Wells Fargo Bank, National Association, as agent, Bank of Montreal, as agent and Comerica Bank, as agent (incorporated by reference to an exhibit to the Company’s Current Report on Form 8-K, dated November 5, 2013)
|
||
|
4.101
|
Indenture, dated as of January 22, 2014, among Credit Acceptance Corporation, the Guarantors named therein and U.S. Bank National Association, as trustee (incorporated by reference to an exhibit to the Company’s Current Report on Form 8-K, dated January 27, 2014)
|
||
|
4.102
|
Registration Rights Agreement, dated January 22, 2014, among Credit Acceptance Corporation, Buyers Vehicle Protection Plan, Inc., Vehicle Remarketing Services, Inc. and the representative of the initial purchasers of the Company’s 6.125% Senior Notes due 2021 (incorporated by reference to an exhibit to the Company’s Current Report on Form 8-K, dated January 27, 2014)
|
||
|
4.103
|
Third Amendment to the Fifth Amended and Restated Credit Agreement, dated as of December 9, 2013, among the Company, the Banks which are parties thereto from time to time, and Comerica Bank as Administrative Agent and Collateral Agent for the Banks
|
||
|
4.104
|
Amendment No. 1 to Fifth Amended and Restated Loan and Security Agreement, dated as of December 2, 2013, among the Company, CAC Warehouse Funding Corporation II, Variable Funding Capital Company LLC, Wells Fargo Securities, LLC, and Wells Fargo Bank, National Association
|
||
|
4.105
|
Amendment No. 1 to the Third Amended and Restated Sale and Contribution Agreement, dated as of December 2, 2013 between the Company and CAC Warehouse Funding Corporation II
|
||
|
4.106
|
Second Amendment to Loan and Security Agreement, dated as of December 4, 2013, among the Company, CAC Warehouse Funding LLC IV, Bank of Montreal, BMO Capital Markets Corp., and Wells Fargo Bank, National Association
|
||
|
4.107
|
First Amendment to Amended and Restated Sale and Contribution Agreement, dated as of December 4, 2013, between the Company and CAC Warehouse Funding LLC IV
|
||
|
4.108
|
Supplemental Indenture No. 1, dated as of December 20, 2013, between Credit Acceptance Auto Loan Trust 2011-1 and Wells Fargo Bank, National Association
|
||
|
4.109
|
Amendment No. 1 to Sale and Servicing Agreement, dated December 20, 2013, among the Company, Credit Acceptance Auto Loan Trust 2011-1, Credit Acceptance Funding LLC 2011-1, and Wells Fargo Bank, National Association
|
||
|
4.110
|
Amendment No. 1 to Sale and Contribution Agreement, dated December 20, 2013, between the Company and Credit Acceptance Funding LLC 2011-1
|
||
|
4.111
|
Supplemental Indenture No. 1, dated as of December 20, 2013, between Credit Acceptance Auto Loan Trust 2012-1 and Wells Fargo Bank, National Association
|
||
|
4.112
|
Amendment No. 1 to Sale and Servicing Agreement, dated as of December 20, 2013, among the Company, Credit Acceptance Auto Loan Trust 2012-1, Credit Acceptance Funding LLC 2012-1, and Wells Fargo Bank, National Association
|
||
|
4.113
|
Amendment No. 1 to Sale and Contribution Agreement, dated as of December 20, 2013, between the Company and Credit Acceptance Funding LLC 2012-1
|
||
|
4.114
|
Supplemental Indenture No. 1, dated as of December 20, 2013, between Credit Acceptance Auto Loan Trust 2012-2 and Wells Fargo Bank, National Association
|
||
|
4.115
|
Amendment No. 1 to Sale and Servicing Agreement, dated as of December 20, 2013, among the Company, Credit Acceptance Auto Loan Trust 2012-2, Credit Acceptance Funding LLC 2012-2, and Wells Fargo Bank, National Association
|
|
4.116
|
Amendment No. 1 to Sale and Contribution Agreement, dated as of December 20, 2013, between the Company and Credit Acceptance Funding LLC 2012-2
|
||
|
4.117
|
Fourth Amendment to the Fifth Amended and Restated Credit Agreement, dated as of January 15, 2014, by and among the Company, Comerica Bank and the other banks signatory thereto and Comerica Bank, as administrative agent for the Banks
|
||
|
Note:
|
Other instruments, notes or extracts from agreements defining the rights of holders of long-term debt of the Company or its subsidiaries have not been filed because (i) in each case the total amount of long-term debt permitted there under does not exceed 10% of the Company's consolidated assets and (ii) the Company hereby agrees that it will furnish such instruments, notes and extracts to the Securities and Exchange Commission upon its request.
|
||
|
10.1
|
Form of Servicing Agreement, as of April 2003 (incorporated by reference to an exhibit to the Company’s Form 10-Q for the quarterly period ended June 30, 2003)
|
||
|
10.2
|
Purchase Program Agreement Recitals, as of April 2007 (incorporated by reference to an exhibit to the Company’s Form 10-Q for the quarterly period ended March 31, 2007)
|
||
|
10.3
|
Credit Acceptance Corporation 1992 Stock Option Plan, as amended and restated May 1999 (incorporated by reference to an exhibit to the Company’s Form 10-Q for the quarterly period ended June 30, 1999)*
|
||
|
10.4
|
Credit Acceptance Corporation Director Stock Option Plan (incorporated by reference to an exhibit to the Company’s Form 10-K Annual Report for the year ended December 31, 2001)
|
||
|
10.5
|
Form of Restricted Stock Grant Agreement (incorporated by reference to an exhibit to the Company’s Current Report on Form 8-K dated March 2, 2005)*
|
||
|
10.6
|
Incentive Compensation Bonus Formula for 2005 (incorporated by reference to an exhibit to the Company’s Current Report on Form 8-K dated April 4, 2005)*
|
||
|
10.7
|
Form of Restricted Stock Grant Agreement, dated February 22, 2007 (incorporated by reference to an exhibit to the Company’s Current Report on Form 8-K, dated February 28, 2007)*
|
||
|
10.8
|
Credit Acceptance Corporation Restricted Stock Unit Award Agreement, dated February 22, 2007 (incorporated by reference to an exhibit to the Company’s Current Report on Form 8-K, dated February 28, 2007)*
|
||
|
10.9
|
Credit Acceptance Corporation Restricted Stock Unit Award Agreement, dated October 2, 2008 (incorporated by reference to an exhibit to the Company’s Current Report on Form 8-K, dated October 7, 2008)*
|
||
|
10.10
|
Credit Acceptance Corporation Restricted Stock Unit Award Agreement, dated November 13, 2008 (incorporated by reference to an exhibit to the Company’s Current Report on Form 8-K, dated November 19, 2008)*
|
||
|
10.11
|
Credit Acceptance Corporation Restricted Stock Unit Award Agreement, dated November 13, 2008 (incorporated by reference to an exhibit to the Company’s Current Report on Form 8-K, dated November 19, 2008)*
|
||
|
10.12
|
Credit Acceptance Corporation Restricted Stock Unit Award Agreement, dated March 27, 2009 (incorporated by reference to an exhibit to the Company’s Current Report on Form 8-K, dated April 2, 2009)*
|
||
|
10.13
|
Credit Acceptance Corporation Amended and Restated Incentive Compensation Plan, as amended, April 6, 2009 (incorporated by reference to Annex A to the Company’s Definitive Proxy Statement on Schedule 14A, dated April 10, 2009)*
|
||
|
10.14
|
Form of Credit Acceptance Corporation Restricted Stock Unit Award Agreement (incorporated by reference to an exhibit to the Company’s Form 10-Q for the quarterly period ended September 30, 2009)*
|
||
|
10.15
|
Form of Credit Acceptance Corporation Board of Directors Restricted Stock Unit Award Agreement (incorporated by reference to an exhibit to the Company’s Form 10-Q for the quarterly period ended September 30, 2009)*
|
||
|
10.16
|
Credit Acceptance Corporation Restricted Stock Unit Award Agreement, dated March 26, 2012 (incorporated by reference to an exhibit to the Company’s Form 10-Q for the quarterly period ended March 31, 2012)*
|
||
|
10.17
|
Credit Acceptance Corporation Restricted Stock Award Agreement, dated March 26, 2012 (incorporated by reference to an exhibit to the Company’s Form 10-Q for the quarterly period ended March 31, 2012)*
|
||
|
10.18
|
Credit Acceptance Corporation Amended and Restated Incentive Compensation Plan, as amended, March 26, 2012 (incorporated by reference to Annex A to the Company’s Definitive Proxy Statement on Schedule 14A, dated April 5, 2012) *
|
||
|
10.19
|
Form of Credit Acceptance Corporation Restricted Stock Unit Award Agreement *
|
||
|
21
|
Schedule of Credit Acceptance Corporation Subsidiaries.
|
||
|
23
|
Consent of Grant Thornton LLP.
|
||
|
31.1
|
Certification of Chief Executive Officer pursuant to Rule 13a-14(a) of the Securities Exchange Act.
|
||
|
31.2
|
Certification of Chief Financial Officer pursuant to Rule 13a-14(a) of the Securities Exchange Act.
|
||
|
32.1
|
Certification of Chief Executive Officer, Pursuant to 18 U.S.C. Section 1350, as adopted Pursuant to Section 906 of the Sarbanes-Oxley Act of 2002.
|
||
|
32.2
|
Certification of Chief Financial Officer, Pursuant to 18 U.S.C. Section 1350, as adopted Pursuant to Section 906 of the Sarbanes-Oxley Act of 2002.
|
||
|
101(INS)
|
XBRL Instance Document. **
|
||
|
101(SCH)
|
XBRL Taxonomy Extension Schema Document. **
|
||
|
101(CAL)
|
XBRL Taxonomy Extension Calculation Linkbase Document. **
|
||
|
101(DEF)
|
XBRL Taxonomy Extension Definition Linkbase Document. **
|
||
|
101(LAB)
|
XBRL Taxonomy Label Linkbase Document. **
|
||
|
101(PRE)
|
XBRL Taxonomy Extension Presentation Linkbase Document. **
|
||
|
*
|
Management compensatory contracts and arrangements
|
|
**
|
Users of this data are advised pursuant to Rule 406T of Regulation S-T that this interactive data file is deemed not filed or part of a registration statement or prospectus for purposes of sections 11 or 12 of the Securities Act of 1933, is deemed not filed for purposes of section 18 of the Securities Exchange Act of 1934, and otherwise is not subject to liability under these sections.
|
90
TABLE OF CONTENTS
Part IItem 1. BusinessItem 1A. Risk FactorsItem 1B. Unresolved Staff CommentsItem 2. PropertiesItem 3. Legal ProceedingsItem 4. Mine Safety DisclosuresPart IIItem 5. Market For Registrant S Common Equity, Related Stockholder Matters and Issuer Purchases Of Equity SecuritiesItem 6. Selected Financial DataItem 7. Management's Discussion and Analysis Of Financial Condition and Results Of OperationsItem 7A. Quantitative and Qualitative Disclosures About Market RiskItem 8. Financial Statements and Supplementary DataItem 9. Changes in and Disagreements with Accountants on Accounting and Financial DisclosureItem 9A. Controls and ProceduresItem 9B. Other InformationPart IIIItem 10. Directors, Executive Officers and Corporate GovernanceItem 11. Executive CompensationItem 12. Security Ownership Of Certain Beneficial Owners and Management and Related Stockholder MattersItem 13. Certain Relationships and Related Transactions, and Director IndependenceItem 14. Principal Accounting Fees and ServicesPart IVItem 15. Exhibits, Financial Statement Schedules