CARDINAL HEALTH INC
10-Ks and 10-Qs
|
|
|
|
|
|
|
|
|
|
|
|
|
|
|
|
|
|
|
|
|
|
|
|
|
|
|
|
|
|
|
|
|
|
|
|
|
|
|
|
|
|
|
|
|
|
|
|
|
|
|
|
|
|
|
|
|
|
|
UNITED STATES
SECURITIES AND EXCHANGE COMMISSION
Washington, D.C. 20549
Form
10-K
|
þ
|
ANNUAL REPORT PURSUANT TO SECTION 13 OR 15(d) OF THE SECURITIES EXCHANGE ACT OF 1934
|
For the fiscal year ended
June 30, 2012
or
|
¨
|
TRANSITION REPORT PURSUANT TO SECTION 13 OR 15(d) OF THE SECURITIES EXCHANGE ACT OF 1934
|
Commission File Number: 1-11373

CARDINAL HEALTH, INC.
(Exact name of registrant as specified in its charter)
|
OHIO
|
31-0958666
|
|
(State or other jurisdiction of
incorporation or organization)
|
(I.R.S. Employer
Identification No.)
|
|
7000 CARDINAL PLACE,
DUBLIN, OHIO
|
43017
|
|
(Address of principal executive offices)
|
(Zip Code)
|
(614) 757-5000
Registrant’s telephone number, including area code
Securities registered pursuant to Section 12(b) of the Act:
|
Title of Class
|
Name of Each Exchange on Which Registered
|
|
COMMON SHARES (WITHOUT PAR VALUE)
|
NEW YORK STOCK EXCHANGE
|
Securities registered pursuant to Section 12(g) of the Act:
None.
Indicate by check mark if the registrant is a well-known seasoned issuer, as defined in Rule 405 of the Securities Act. Yes
þ
No
¨
Indicate by check mark if the registrant is not required to file reports pursuant to Section 13 or Section 15(d) of the Act. Yes
¨
No
þ
Indicate by check mark whether the registrant (1) has filed all reports required to be filed by Section 13 or 15(d) of the Securities Exchange Act of 1934 during the preceding 12 months (or for such shorter period that the registrant was required to file such reports), and (2) has been subject to such filing requirements for the past 90 days. Yes
þ
No
¨
Indicate by check mark whether the registrant has submitted electronically and posted on its corporate Web site, if any, every Interactive Data File required to be submitted and posted pursuant to Rule 405 of Regulation S-T during the preceding 12 months (or for such shorter period that the registrant was required to submit and post such files). Yes
þ
No
¨
Indicate by check mark if disclosure of delinquent filers pursuant to Item 405 of Regulation S-K is not contained herein, and will not be contained, to the best of registrant’s knowledge, in definitive proxy or information statements incorporated by reference in Part III of this Form 10-K or any amendment to this Form 10-K.
þ
Indicate by check mark whether the registrant is a large accelerated filer, an accelerated filer, a non-accelerated filer, or a smaller reporting company. See the definitions of “large accelerated filer,” “accelerated filer” and “smaller reporting company” in Rule 12b-2 of the Exchange Act.
|
Large accelerated filer
þ
|
Accelerated filer
¨
|
|
Non-accelerated filer
¨
(Do not check if a smaller reporting company)
|
Smaller reporting company
¨
|
Indicate by check mark whether the registrant is a shell company (as defined in Rule 12b-2 of the Act). Yes
¨
No
þ
The aggregate market value of voting stock held by non-affiliates of the registrant on
December 31, 2011
, based on the closing price on
December 31, 2011
, was
$14,015,438,147
.
The number of registrant’s Common Shares outstanding as of
August 15, 2012
, was as follows: Common Shares, without par value:
341,083,853
.
Documents Incorporated by Reference:
Portions of the registrant’s Definitive Proxy Statement to be filed for its
2012
Annual Meeting of Shareholders are incorporated by reference into Part III of this Annual Report on Form 10-K.
Table of Contents
|
Item
|
|
Page
|
|
Part I
|
||
|
1
|
||
|
1A.
|
||
|
1B.
|
||
|
2
|
||
|
3
|
||
|
4
|
||
|
Part II
|
||
|
5
|
||
|
6
|
||
|
7
|
||
|
7A.
|
||
|
8
|
||
|
9
|
||
|
9A.
|
||
|
9B.
|
||
|
Part III
|
||
|
10
|
||
|
11
|
||
|
12
|
||
|
13
|
||
|
14
|
||
|
Part IV
|
||
|
15
|
||
Important Information Regarding Forward-Looking Statements
This Form 10-K (including information incorporated by reference) includes forward-looking statements, addressing expectations, prospects, estimates and other matters that are dependent upon future events or developments. Many forward-looking statements appear in “Item 7—Management’s Discussion and Analysis of Financial Condition and Results of Operations,” but there are others throughout this document, which may be identified by words such as “expect,” “anticipate,” “intend,” “plan,” “believe,” “will,” “should,” “could,” “would,” “project,” “continue,” “likely,” and similar expressions, and
include statements reflecting future results or guidance, statements of outlook and expense accruals. These matters are subject to risks and uncertainties that could cause actual results to differ materially from those projected, anticipated or implied. The most significant of these risks and uncertainties are described below in “Item 1A—Risk Factors” and in Exhibit 99.1 to this Form 10-K. Forward-looking statements in this document speak only as of the date of this document. Except to the extent required by applicable law, we undertake no obligation to update or revise any forward-looking statement.
1
General
Cardinal Health, Inc. is an Ohio corporation formed in 1979. As used in this report, “we,” “our,” “us” and similar pronouns refer to Cardinal Health, Inc. and its subsidiaries, unless the context requires otherwise. We are a healthcare services company providing pharmaceutical and medical products and services that help pharmacies, hospitals, surgery centers, physician offices and other healthcare providers focus on patient care while reducing costs, enhancing efficiency and improving quality.
Our fiscal year ends on June 30. References to fiscal 2012, 2011 and 2010 are to the fiscal years ended June 30, 2012, 2011 and 2010, respectively. Except as otherwise specified, information in this Form 10-K is provided as of June 30, 2012.
Pharmaceutical Segment
In the United States, including Puerto Rico, the Pharmaceutical segment:
|
•
|
distributes branded and generic pharmaceutical, over-the-counter healthcare, and consumer products through its pharmaceutical distribution business to retailers (including chain and independent drug stores and pharmacy departments of supermarkets and mass merchandisers), hospitals, and other healthcare providers (including mail order pharmacies). This business:
|
|
•
|
maintains prime vendor relationships that streamline the purchasing process resulting in greater efficiency and lower costs for our customers; and
|
|
•
|
renders services to pharmaceutical manufacturers including distribution, inventory management, data reporting, new product launch support, and contract pricing and chargeback administration.
|
|
•
|
operates nuclear pharmacies and cyclotron facilities that manufacture, prepare and deliver radiopharmaceuticals for use in nuclear imaging and other procedures in hospitals and clinics;
|
|
•
|
distributes specialty pharmaceutical products and provides services to pharmaceutical manufacturers, third-party payors and healthcare service providers supporting the marketing, distribution, and payment for specialty pharmaceutical products;
|
|
•
|
franchises retail pharmacies under the Medicine Shoppe
®
and Medicap
®
brands; and
|
|
•
|
provides pharmacy services to hospitals and other healthcare facilities.
|
In China, the Pharmaceutical segment distributes branded, generic and specialty pharmaceuticals, over-the-counter and consumer products as well as provides logistics, marketing and other services through Cardinal Health China.
Pharmaceutical Distribution
Our pharmaceutical distribution business generates gross margin primarily when the aggregate selling price to our customers exceeds the aggregate cost of products sold, net of cash discounts, generic manufacturer margin and margin under branded pharmaceutical agreements. Cash discounts are price reductions that manufacturers may offer to us for prompt payment of purchased products. Generic manufacturer margin refers to price discounts, rebates and other consideration that we receive under our agreements with manufacturers of generic pharmaceuticals. Our earnings on generic pharmaceuticals are generally highest during the period immediately following the initial launch of a generic product because generic pharmaceutical selling prices are generally highest during that period and tend to decline over time, although this may vary. Margin under branded pharmaceutical agreements refers primarily to fees we receive for rendering a range of distribution and related services to manufacturers. In addition, margin under branded pharmaceutical agreements may include benefits from pharmaceutical price appreciation, which occurs when a manufacturer increases its published price for a product after we have purchased that product for inventory.
Bulk and Non-Bulk Sales
The Pharmaceutical segment differentiates between bulk and non-bulk sales based on the nature of our customers’ operations. Bulk sales consist of sales to retail chain customers’ centralized warehouse operations and customers’ mail order businesses in the United States. All other sales are classified as non-bulk. Sales to a retail chain pharmacy customer are classified as bulk sales with respect to its warehouse operations and non-bulk sales with respect to its retail stores.
Substantially all bulk sales consist of products shipped in the same form that we receive them from the manufacturer; a small portion of bulk sales are broken down into smaller units prior to shipping. In contrast, non-bulk sales require more complex servicing. For non-bulk sales, we may receive inventory in large or full case quantities and break it down into smaller quantities, warehouse the product for a longer period of time, pick individual products specific to a customer’s order, and deliver that smaller order to a customer location.
Bulk sales generate significantly lower segment profit as a percentage of revenue than non-bulk sales. Customers receive lower pricing on bulk sales of the same products than non-bulk sales, as bulk sales require less services to be provided to these customers, and hence, less costs are incurred by us in providing these products. In addition, bulk sales in aggregate generate higher segment cost of products sold as a percentage of revenue than non-bulk sales, due to the mix of products sold within the bulk category. Segment distribution, selling, general and administrative (“SG&A”) expenses as a percentage of revenue from bulk sales are substantially lower than from non-bulk sales because bulk sales require substantially fewer services to be rendered by us than non-bulk sales.
2
The following table shows the revenues, segment expenses, segment profit and segment profit as a percentage of revenue for bulk and non-bulk sales for fiscal
2012
,
2011
and
2010
.
|
(in millions)
|
2012
|
2011
|
2010
|
||||||||
|
Non-bulk sales:
|
|||||||||||
|
Revenue from non-bulk sales
|
$
|
57,738
|
|
$
|
51,816
|
|
$
|
45,795
|
|
||
|
Segment expenses allocated to non-bulk sales (1)
|
56,334
|
|
50,622
|
|
44,899
|
|
|||||
|
Segment profit from non-bulk sales (1)
|
$
|
1,404
|
|
$
|
1,194
|
|
$
|
896
|
|
||
|
Segment profit from non-bulk sales as a percentage of revenue from non-bulk sales (1)
|
2.43
|
%
|
2.31
|
%
|
1.96
|
%
|
|||||
|
Bulk sales:
|
|||||||||||
|
Revenue from bulk sales
|
$
|
40,187
|
|
$
|
41,928
|
|
$
|
43,995
|
|
||
|
Segment expenses allocated to bulk sales (1)
|
40,033
|
|
41,793
|
|
43,880
|
|
|||||
|
Segment profit from bulk sales (1)
|
$
|
154
|
|
$
|
135
|
|
$
|
115
|
|
||
|
Segment profit from bulk sales as a percentage of revenue from bulk sales (1)
|
0.38
|
%
|
0.32
|
%
|
0.26
|
%
|
|||||
|
(1)
|
Segment expenses and profit required complex and subjective estimates and allocations based upon assumptions, past experience and judgment that we believe are reasonable.
|
Specialty Pharmaceutical Products and Services
We refer to products and services offered by our specialty solutions division as “specialty pharmaceutical products and services.” The specialty solutions division currently (1) distributes oncology, rheumatology and other pharmaceutical products to physician offices; (2) distributes human plasma products and some limited-distribution pharmaceutical products to hospitals and other healthcare providers; and (3) provides various consulting and other services to pharmaceutical manufacturers, third-party payors and healthcare providers primarily supporting the marketing, distribution and payment for these products. Our use of this terminology may not be comparable to the use by other industry participants.
Pharmaceutical Segment Financials
See Note 15 of the “Notes to Consolidated Financial Statements” for Pharmaceutical segment revenue, profit and assets for fiscal
2012
,
2011
and
2010
.
Medical Segment
The Medical segment distributes a broad range of medical, surgical and laboratory products to hospitals, surgery centers, laboratories, physician offices and other healthcare providers in the United States, Canada and China. This segment also manufactures, sources and develops its own line of private brand medical and surgical products. Manufactured products include: single-use surgical drapes, gowns and apparel; exam and surgical gloves; and fluid suction and collection systems. The segment also offers sterile and non-sterile procedure
kits. Our manufactured products are sold directly or through third-party distributors in the United States, Canada, Europe, South America and the Asia/Pacific region. In addition, the segment provides supply chain services, including spend management, distribution management, and inventory management services, to healthcare providers.
Medical Segment Financials
See Note 15 of the “Notes to Consolidated Financial Statements” for Medical segment revenue, profit and assets for fiscal
2012
,
2011
and
2010
.
Acquisitions and Divestitures
In the past five fiscal years, we completed the following three significant acquisitions apart from businesses spun-off as part of CareFusion Corporation (“CareFusion”), as presented below.
|
Date
|
Company
|
Location
|
Line
of Business
|
Acquisition Price
(in millions)
|
|||
|
July 15, 2010
|
Healthcare
Solutions Holding, LCC
("P4 Healthcare")
|
Ellicott City, Maryland
|
Specialty pharmaceutical services
|
$ 598 (1)
|
|||
|
November 29, 2010
|
Cardinal Health China
|
Shanghai, China
|
Pharmaceutical and medical products distribution
|
458 (2)
|
|||
|
December 21, 2010
|
Kinray, Inc. (“Kinray”)
|
Whitestone, New York
|
Pharmaceutical, generic, health and beauty, and home health care products distribution
|
1,336
|
|||
|
(1)
|
Includes $506 million in cash and $92 million for the acquisition date fair value of contingent consideration to be paid for the acquisition. We made cash payments of $14 million pursuant to the contingent consideration obligation, which included $10 million paid in fiscal 2011 and $4 million paid in July 2012 to settle the obligation.
|
|
(2)
|
Includes the assumption of approximately $57 million in debt.
|
In addition, we completed several smaller acquisitions during the last five fiscal years, including purchasing Borschow Hospital & Medical Supplies, Inc. in fiscal 2009 and Futuremed Healthcare Products Corporation in fiscal 2012.
During the past five fiscal years, we also completed several divestitures, including selling our United Kingdom-based Martindale injectable manufacturing business in fiscal 2010. In addition, effective August 31, 2009, we separated our clinical and medical products businesses through distribution to our shareholders of 81 percent of the then outstanding common stock of CareFusion (the “Spin-Off”). During fiscal 2010, we disposed of 11 million shares of CareFusion common stock, and during fiscal 2011, we disposed of the remaining 30 million shares. Enturia Inc., a significant acquisition that was made in fiscal 2008, was spun-off as part of CareFusion.
3
Customers
Our largest customers, CVS Caremark Corporation (“CVS”) and Walgreen Co. (“Walgreens”), accounted for approximately 22 percent and 21 percent, respectively, of our fiscal 2012 revenue. The aggregate of our five largest customers, including CVS and Walgreens, accounted for approximately 59 percent of our fiscal 2012 revenue. Our contracts with CVS and Walgreens are currently scheduled to expire in June 2013 and August 2013, respectively. In August 2012, Walgreens issued a request for proposal for pharmaceutical distribution services for the three-year period beginning after the expiration of our contract with Walgreens. In the ordinary course of our business, we frequently are in a competitive bid, or request for proposal, process for pharmaceutical distribution and other business of a customer or potential customer.
In April 2012, Express Scripts, Inc., one of our pharmaceutical distribution customers, merged with Medco Health Solutions, Inc., which was a pharmaceutical distribution customer of a competitor. In April 2012, the combined company issued a request for proposal for its combined pharmaceutical distribution business. In July, 2012, Express Scripts, Inc. informed us that it had not awarded the combined contract to us. Our current pharmaceutical distribution contract with Express Scripts, Inc. expires on September 30, 2012 and provided approximately $9.0 billion of revenue in fiscal 2012, all of which is classified as bulk sales. Express Scripts, Inc. was our third largest customer in fiscal 2012.
In addition, we have agreements with group purchasing organizations (“GPOs”) that act as agents to negotiate vendor contracts on behalf of their members. Our two largest GPO relationships in terms of member revenue are with Novation, LLC, and Premier Purchasing Partners, L.P. Sales to members of these two GPOs collectively accounted for 13 percent of our revenue in fiscal 2012.
Suppliers
We rely on many different suppliers. Products obtained from our five largest suppliers accounted for an aggregate of approximately 28 percent of our revenue during fiscal 2012, but no single supplier’s products accounted for more than 7 percent of that revenue. Overall, we believe our relationships with our suppliers are good.
The Pharmaceutical distribution business is a party to distribution service agreements with pharmaceutical manufacturers. These agreements generally have terms ranging from one year, with an automatic renewal feature, to five years. Generally, these agreements are terminable before they expire only if the parties mutually agree, if there is an uncured breach of the agreement, or if one party is the subject of a bankruptcy filing or similar insolvency event. Some agreements allow the manufacturer to terminate the agreement without cause within a defined notice period.
Competition
We operate in a highly competitive environment in the distribution of pharmaceuticals and related healthcare services. We also operate in a highly competitive environment in the development, manufacturing and distribution of medical and surgical products. We compete on many levels, including service offerings, support services, breadth of product lines, and price.
In the Pharmaceutical segment, we compete with national, full-line wholesale distributors (including McKesson Corporation and AmerisourceBergen Corporation), regional wholesale distributors (including H.D. Smith and Morris & Dickson Co., L.L.C.), self-warehousing chains, direct selling manufacturers, specialty distributors, third-party logistics companies (including United Parcel Service, Inc.), and nuclear pharmacies, among others. In addition, the Pharmaceutical segment has experienced competition from a number of organizations offering generic pharmaceuticals, including telemarketers.
In the Medical segment, we compete with many different distributors, including Owens & Minor, Inc., Thermo Fisher Scientific Inc., PSS World Medical, Inc., Henry Schein, Inc., and Medline Industries, Inc. In addition, we compete with regional medical products distributors, third-party logistics companies and manufacturers’ direct distribution. Competitors of the Medical segment’s manufacturing and procedural kit businesses include Kimberly-Clark Corporation, Ansell Limited, DeRoyal Industries Inc., Medline Industries, Inc., Professional Hospital Supply and Medical Action Industries.
Employees
As of June 30, 2012, we had approximately 23,300 employees in the United States and approximately 9,200 employees outside of the United States. Overall, we consider our employee relations to be good.
Intellectual Property
We rely on a combination of trade secret, patent, copyright and trademark laws, nondisclosure and other contractual provisions, and technical measures to protect our products, services and intangible assets. We hold patents relating to the distribution of our nuclear pharmacy products and service offerings, and relating to medical and surgical products, such as fluid suction and irrigation devices; surgical waste management systems; surgical and medical examination gloves; surgical drapes, gowns and facial protection products; and patient temperature management products. We also operate under licenses for certain proprietary technologies, and in certain instances we license our technologies to third parties.
We believe that we have taken all necessary steps to protect our proprietary rights, but no assurance can be given that we will be able to successfully enforce or protect our rights in the event that they are subject to third-party infringement claims. While all of these proprietary rights are important to our operations, we do not consider any particular patent, trademark, license, franchise or concession to be material to our overall business.
4
Regulatory Matters
Our business is highly regulated in the United States at both the federal and state level and in foreign countries. Depending upon their specific business, our subsidiaries may be subject to regulation by government entities including:
|
•
|
the United States Food and Drug Administration (the “FDA”);
|
|
•
|
the United States Drug Enforcement Administration (the “DEA”);
|
|
•
|
the United States Nuclear Regulatory Commission (the “NRC”);
|
|
•
|
the United States Department of Health and Human Services (“HHS”);
|
|
•
|
United States Customs and Border Protection;
|
|
•
|
state boards of pharmacy;
|
|
•
|
state-controlled substance agencies;
|
|
•
|
state health departments, insurance departments or other comparable state agencies; and
|
|
•
|
foreign agencies that are comparable to those listed above.
|
These regulatory agencies have a variety of civil, administrative and criminal sanctions at their disposal. They can suspend our ability to distribute products or can initiate product recalls; they can seize products or impose criminal, civil and administrative sanctions; and they can seek injunctions to halt the manufacture and distribution of products.
Distribution
The FDA, DEA and various state authorities regulate the marketing, purchase, storage and distribution of pharmaceutical and medical products under various state and federal statutes including the Prescription Drug Marketing Act of 1987 and the Federal Controlled Substances Act (the "CSA"). Wholesale distributors of controlled substances must hold valid DEA registrations and state-level licenses, meet various security and operating standards, and comply with the CSA which governs the sale, packaging, storage and distribution of controlled substances. As further discussed in Note 9 of the "Notes to Consolidated Financial Statements", on May 14, 2012, we entered into a settlement agreement with the DEA pursuant to which our Lakeland, Florida pharmaceutical distribution center's registration to distribute controlled substances will be suspended until May 15, 2014. During this suspension, our Lakeland facility will continue to distribute pharmaceutical products (other than controlled substances) while controlled substances will be shipped to customers from our other distribution centers.
Our Pharmaceutical segment’s China distribution operations are subject to similar national, regional and local regulations, including licensing and regulatory requirements of the China Ministry of Health, Ministry of Commerce, Ministry of Finance, the State Food and Drug Administration and the General Administration of Customs.
Manufacturing and Marketing
Our subsidiaries that manufacture and source medical devices are subject to regulation by the FDA and comparable foreign agencies including regulations regarding compliance with good manufacturing practices and quality systems.
The FDA and other domestic and foreign governmental agencies administer requirements that cover the design, testing, safety, effectiveness, manufacturing, labeling, promotion and advertising, distribution, importation and post-market surveillance of some of our manufactured products. We need specific approval or clearance from regulatory authorities before we can market and sell many of our products in particular countries. Even after we obtain approval or clearance to market a product, the product and our manufacturing processes are subject to continued regulatory review.
To assess and facilitate compliance with federal, state and foreign regulatory requirements, we routinely review our quality and compliance systems to evaluate their effectiveness and to identify areas for improvement or remediation. As part of our quality review, we assess the suppliers of raw materials, components and finished goods that are incorporated into the medical devices we manufacture. In addition, we conduct quality management reviews designed to highlight key issues that may affect the quality of our products and services.
From time to time, we may determine that products we manufacture or market do not meet our specifications, regulatory requirements, or published standards. When we or a regulatory agency identify a quality or regulatory issue, we investigate and take appropriate corrective action, such as withdrawing the product from the market, correcting the product at the customer location, revising product labeling, and notifying customers. For example, in August 2011, the FDA notified us that it was halting entry into the United States of all Presource® procedure kits that we assemble in Mexico and import through El Paso, Texas. The FDA indicated that we had not supplied adequate documentary support for certain components of these procedure kits, but did not indicate any concerns about patient safety. In response to the FDA's concerns we took remedial actions and have resumed importing procedure kits.
Nuclear Pharmacies and Related Businesses
Our nuclear pharmacies and cyclotron facilities require licenses or permits and must abide by regulations from the NRC, applicable state boards of pharmacy, and the radiologic health agency or department of health of each state in which we operate. In addition, our cyclotron facilities must comply with the FDA's good manufacturing practices regulations for positron emission tomography (“PET”) drugs that became effective in December 2011.
Prescription Drug Pedigree Tracking and Supply Chain Integrity
The FDA Amendments Act of 2007 requires the FDA to establish standards to identify and validate technologies for securing the pharmaceutical supply chain against counterfeit drugs. These standards may include track-and-trace or authentication technologies, such as radio frequency identification devices. In March 2010, the FDA issued guidance establishing standardized numerical identifiers for prescription pharmaceutical packages. Some states also have adopted or are considering adopting pedigree tracking laws. For example, effective July 2016, California will require that pharmaceutical wholesalers and repackagers implement electronic track-and-trace capabilities for pharmaceutical products.
5
Healthcare Fraud and Abuse Laws
We are subject to healthcare fraud and abuse laws. These laws generally prohibit companies from soliciting, offering, receiving or paying any compensation in order to induce someone to order or purchase items or services that are in any way paid for by Medicare, Medicaid or other United States government-sponsored healthcare programs. They also prohibit submitting or causing to be submitted any fraudulent claim for payment by the federal government. Violations of these laws may result in criminal or civil penalties, as well as claims under the federal False Claims Act and similar state acts under which private persons may file suit on behalf of the federal and state governments.
Health and Personal Information Practices
Services and products provided by some of our businesses, including some provided by our nuclear and pharmacy services and specialty solutions divisions, involve access to patient-identifiable healthcare information. The Health Insurance Portability and Accountability Act of 1996, as augmented by the Health Information Technology for Economic and Clinical Health Act, as well as some state laws, regulate the use and disclosure of patient identifiable health information, including requiring specified privacy and security measures. Federal and state officials have increasingly focused on how patient-identifiable healthcare information should be handled, secured and disclosed.
Some of our businesses collect and maintain other sensitive personal information that is subject to federal and state laws protecting such information. Security and disclosure of personal information is also highly regulated in many other countries in which we operate.
Environmental, Health and Safety Laws
In the United States and other countries, we are subject to various federal, state and local environmental laws, as well as laws relating to safe working conditions, laboratory and manufacturing practices.
Laws Relating to Foreign Trade and Operations
United States and international laws require us to abide by standards relating to the import and export of finished goods, raw materials and supplies and the handling of information. We also must comply with various export control and trade embargo laws, which may require licenses or other authorizations for transactions within some countries or with some counterparties.
Similarly, we are subject to laws concerning the conduct of our foreign operations, including the United States Foreign Corrupt Practices Act and foreign anti-bribery laws. These laws generally prohibit companies and their intermediaries from offering, promising or making payments to officials of foreign governments for the purpose of obtaining or retaining business.
Other Information
Although our agreements with manufacturers sometimes require us to maintain inventory levels within specified ranges, our distribution businesses are generally not required by our customers to maintain particular inventory levels other than as needed to meet service level requirements. Certain supply contracts with United States government entities require us to maintain sufficient inventory to meet emergency demands, but we do not believe those requirements materially affect inventory levels.
Our customer return policies generally require that the product be physically returned, subject to restocking fees. We only allow customers to return products that can be added back to inventory and resold at full value, or that can be returned to vendors for credit.
We offer market payment terms to our customers.
Revenue and Long-Lived Assets by Geographic Area
See Note 15 of the “Notes to Consolidated Financial Statements” for revenue and long-lived assets by geographic area.
Available Information
Our Annual Report on Form 10-K, Quarterly Reports on Form 10-Q, Current Reports on Form 8-K, and amendments to those reports are available free of charge on our website (www.cardinalhealth.com), under the “Investors—Financial information—SEC filings” caption, as soon as reasonably practicable after we electronically file them with, or furnish them to, the Securities and Exchange Commission (the “SEC”).
You may read and copy any materials we file with the SEC at the SEC’s Public Reference Room at 100 F Street, NE, Washington, DC 20549. You may obtain information on the operation of the Public Reference Room by calling the SEC at 1-800-SEC-0330. The SEC also maintains a website (www.sec.gov) where you can search for annual, quarterly and current reports, proxy and information statements, and other information regarding us and other public companies.
The risks described below could materially and adversely affect our results of operations, financial condition, liquidity and cash flows. These are not the only risks we face. Our businesses also could be affected by risks that we are not presently aware of or that we currently consider immaterial to our operations.
We could suffer the adverse effects of competitive pressures.
As described in greater detail in "Item 1-Business" above, we operate in markets that are highly competitive. Because of competition, our businesses face continued pricing pressure from our customers and suppliers. If we are unable to offset margin reductions caused by these pricing pressures through steps such as effective sourcing and enhanced cost control measures, our results of operations and financial condition could be adversely affected.
In addition, in recent years, the healthcare industry has continued to consolidate. Further consolidation among our customers and suppliers (including branded pharmaceutical manufacturers) could give the resulting enterprises greater bargaining power, which may adversely impact our results of operations.
We have a few large customers that generate a significant amount of our revenue.
Our sales and credit concentration is significant. CVS and Walgreens accounted for approximately 22 percent and 21 percent, respectively, of our fiscal 2012 revenue. The aggregate of our five largest customers, including CVS and Walgreens, accounted for approximately 59 percent of our fiscal 2012 revenue. In addition, Walgreens and CVS accounted for 25 percent and 19 percent,
6
respectively, of our gross trade receivable balance at June 30, 2012. Our contracts with CVS and Walgreens are scheduled to expire in June 2013 and August 2013, respectively. If CVS, Walgreens or one of our other large customers terminates or does not renew its contract, defaults in payment, or significantly reduces its purchases of our products, our results of operations and financial condition could be adversely affected. For example, in July 2012, Express Scripts, Inc. informed us that it had not awarded us the combined pharmaceutical distribution contract following its merger with Medco Health Solutions, Inc. Our contract with Express Scripts, Inc. expires on September 30, 2012 and provided approximately $9.0 billion of revenue in fiscal 2012, all of which was classified as bulk sales. The expiration of that contract will have an adverse effect on our results of operations and operating cash flow.
Our Pharmaceutical segment's margin may be affected by fewer or less profitable generic pharmaceutical launches, prices established by manufacturers and other factors that are beyond our control.
As described in greater detail in "Item 1-Business" above, margin in our Pharmaceutical segment consists, in part, of generic manufacturer margin and margin from branded pharmaceutical price appreciation.
The number of new generic pharmaceutical launches varies from year to year, and the margin impact of new launches varies from product to product. Fewer generic pharmaceutical launches or launches that are less profitable than those previously experienced will have an adverse effect on our year-over-year margins. Additionally, prices for existing generic pharmaceuticals generally decline over time, although this may vary. Price deflation on existing generic pharmaceuticals will have an adverse effect on our margins.
With respect to branded pharmaceutical price appreciation, if branded manufacturers increase prices less frequently or by amounts smaller than have been experienced historically, we will earn less margin on branded pharmaceuticals.
The United States healthcare environment is changing in many ways, some of which may not be favorable to us, including changes resulting from federal healthcare legislation.
The healthcare industry continues to undergo significant changes designed to increase access to medical care, improve safety and contain costs. Medicare and Medicaid reimbursement levels have declined; the use of managed care has increased; distributors, manufacturers, healthcare providers and pharmacy chains have consolidated; and large purchasing groups are prevalent.
In March 2010, the Patient Protection and Affordable Care Act and the Health Care and Education Reconciliation Act (collectively the “Healthcare Reform Acts”) were enacted. Among other things, the Healthcare Reform Acts seek to expand health insurance coverage to over 30 million uninsured Americans. Many of the significant changes in the Healthcare Reform Acts do not take effect until 2014, including a requirement that most Americans carry health insurance. We expect expansion of access to health insurance to increase the demand for our products and services, but other provisions of the Healthcare Reform Acts could affect us adversely.
The Healthcare Reform Acts contain many provisions designed to generate the revenues necessary to fund the coverage expansions, including, as discussed in "Item 7-Management's Discussion and Analysis of Financial Condition and Results of Operations” below, a tax to be paid by medical device manufacturers.
In addition, the Healthcare Reform Acts have provisions designed to reduce costs of Medicare and Medicaid, including changing the federal upper payment limit for Medicaid reimbursement to no less than 175 percent of the average weighted manufacturer's price ("AMP") from 250 percent of the lowest AMP for generic pharmaceuticals. The Centers for Medicare and Medicaid Services is also considering providing states with alternatives to traditional reimbursement metrics.
We could be adversely affected directly or indirectly (if our customers are adversely affected) by these and other changes in the delivery or pricing of, or reimbursement for, pharmaceuticals, medical devices or healthcare services.
Our business is subject to rigorous regulatory and licensing requirements.
The healthcare industry is highly regulated. As described in greater detail in "Item 1-Business" above, we are subject to regulation in the United States at both the federal and state level and in foreign countries. In addition, the United States federal and state governments are devoting greater resources to the enforcement of these laws. If we fail to comply with these regulatory requirements, or if allegations are made that we fail to comply, our results of operations and financial condition could be adversely affected.
To lawfully operate our businesses, we are required to hold permits, licenses and other regulatory approvals from, and to comply with operating and security standards of, governmental bodies. Failure to maintain or renew necessary permits, licenses or approvals, or to comply with required standards, could have an adverse effect on our results of operations and financial condition. For example, see Note 9 of the "Notes to Consolidated Financial Statements" for a discussion of regulatory matters relating to our distribution of controlled substances.
Products that we manufacture, source, distribute or market are required to comply with regulatory requirements. Noncompliance or concerns over noncompliance may result in suspension of our ability to distribute, import or manufacture products, product recalls or seizures, or criminal and civil sanctions.
We are required to comply with laws relating to healthcare fraud and abuse. If we fail to comply with them, we could be subject to federal or state government investigations, or false claims act proceedings initiated by private parties, which could result in civil and criminal sanctions, including the loss of licenses or the ability to participate in Medicare, Medicaid and other federal and state healthcare programs. The requirements of these laws are complicated and subject to interpretation and may be applied by a regulator, prosecutor or judge in a manner that could negatively impact us or require us to change our operations.
7
Our global operations are required to comply with the United States Foreign Corrupt Practices Act and similar anti-bribery laws in other jurisdictions and with United States and foreign export control, trade embargo and customs laws. If we fail to comply with them, we could suffer civil and criminal sanctions.
We could be subject to adverse changes in the tax laws or challenges to our tax positions.
We are a large multinational corporation with operations in the United States and many foreign countries. As a result, we are subject to the tax laws of many jurisdictions. From time to time, legislative initiatives are proposed, such as the repeal of last-in, first-out ("LIFO") treatment of inventory or the current U.S. taxation of income earned by foreign subsidiaries, that could adversely affect our tax positions, effective tax rate, tax payments or financial condition. Tax laws are extremely complex and subject to varying interpretations. Tax authorities have challenged some of our tax positions and it is possible that they will challenge others. These challenges may adversely affect our effective tax rate, tax payments or financial condition.
CareFusion may not satisfy its contractual obligations.
In August 2009, we entered into a tax matters agreement pursuant to which CareFusion is obligated to indemnify us for certain tax exposures and transaction taxes prior to the Spin-Off. The indemnification receivable was $265 million at June 30, 2012. The failure of CareFusion to perform its obligations under this agreement could have an adverse effect on our financial condition and results of operations.
The Spin-Off may have unexpected tax consequences.
In connection with the Spin-Off, we received a private letter ruling from the Internal Revenue Service (“IRS”) to the effect that the contribution by us of the assets of the clinical and medical products businesses to CareFusion and the distribution of CareFusion shares to our shareholders would qualify as a tax-free transaction under Sections 355 and 368(a)(1)(D) of the Internal Revenue Code (the “Code”). In addition, we received opinions of tax counsel to the effect that the Spin-Off would qualify as a transaction that is described in Sections 355(a) and 368(a)(1)(D) of the Code. The IRS private letter ruling and the opinions of counsel rely on certain facts, assumptions, representations and undertakings from us and CareFusion regarding the past and future conduct of the companies' respective businesses and other matters. If any of these facts, assumptions, representations or undertakings is incorrect or not otherwise satisfied, we and our shareholders may not be able to rely on the IRS ruling or the opinions of tax counsel. Similarly, the IRS could determine on audit that the Spin-Off is taxable if it determines that any of the facts, assumptions, representations or undertakings are not correct or have been violated or if the IRS disagrees with the conclusions in the opinions of counsel that are not covered by the private letter ruling or for other reasons. If the Spin-Off is determined to be taxable for United States federal income tax purposes, we and our shareholders that are subject to United States federal income tax could incur significant tax liabilities.
Our business and operations depend on the proper functioning of information systems and critical facilities.
We rely on information systems to obtain, rapidly process, analyze and manage data to:
|
•
|
facilitate the purchase and distribution of inventory items from numerous distribution centers;
|
|
•
|
receive, process and ship orders on a timely basis;
|
|
•
|
manage the accurate billing and collections for thousands of customers;
|
|
•
|
process payments to suppliers;
|
|
•
|
facilitate the manufacturing and assembly of medical products; and
|
|
•
|
generate financial information.
|
Our business also depends on the proper functioning of our critical facilities, including our national logistics center. Our results of operations could be adversely affected if these systems or facilities, or our customers' access to them, are interrupted, damaged by unforeseen events, cyber security incidents or other actions of third parties, or fail for any extended period of time. Any data security breach could adversely impact our operations, results of operations or our ability to satisfy legal requirements, including those related to patient-identifiable health information.
As further described below in "Item 9A-Controls and Procedures", the Medical segment has implemented a medical business transformation project, which includes a new information system for certain supply chain and financial processes. If the system fails to operate as intended, it could adversely affect Medical segment profit and the effectiveness of our internal control over financial reporting.
Because of the nature of our business, we may become involved in legal proceedings that could adversely impact our cash flows or results of operations.
Due to the nature of our businesses, which includes the manufacture and distribution of healthcare products, we may from time to time become involved in disputes or legal proceedings. For instance, some of the products we manufacture or distribute may be alleged to cause personal injury or violate the intellectual property rights of another party, subjecting us to product liability or infringement claims. While we generally obtain indemnity rights from the manufacturers of products we distribute and we carry product liability insurance, it is possible that liability from such claims could exceed those protections. Litigation is inherently unpredictable, and the unfavorable resolution of one or more of these legal proceedings could adversely affect our cash flows or results of operations.
Acquisitions are not always as successful as we expect them to be.
An important element of our growth strategy has been to acquire other businesses that expand or complement our existing businesses. Acquisitions involve risks: we may overpay for a business or fail to realize the synergies and other benefits we expect from the acquisition; or we may encounter unforeseen accounting, internal control, regulatory or compliance issues.
8
We depend on certain suppliers to make their raw materials and products available to us and are subject to fluctuations in costs of raw materials and products.
We depend on the availability of various components, compounds, raw materials (including radioisotopes) and energy supplied by others for our operations. Any of our supplier relationships could be interrupted due to events beyond our control, including natural disasters, or could be terminated. A sustained supply interruption could have an adverse effect on our business.
Our manufacturing businesses use oil-based resins, cotton, latex, and other commodities as raw materials in many products. Prices of oil and gas also affect our distribution and transportation costs. Prices of these commodities are volatile and have fluctuated significantly in recent years, so costs to produce and distribute our products also have fluctuated. Due to competitive dynamics and contractual limitations, we may be unable to pass along cost increases through higher prices. If we cannot fully offset cost increases through other cost reductions, or recover these costs through price increases or surcharges, our results of operations could be adversely affected.
Our global operations are subject to economic, political and currency risks.
Our global operations are affected by local economic environments, including inflation, recession, currency volatility and competition. Political changes also can disrupt our global operations, as well as our customers and suppliers, in a particular location. We may not be able to hedge or obtain insurance to protect us against these risks, and any hedges or insurance may be expensive and may not successfully mitigate these risks.
Economic conditions may adversely affect demand for our products and services
.
Deterioration in general economic conditions in the United States and other countries in which we do business could adversely affect the amount of prescriptions filled and the number of medical procedures undertaken and, therefore, reduce purchases of our products and services by our customers, which could adversely affect our results of operations.
Not applicable.
In the United States, as of June 30, 2012, the Pharmaceutical segment operated 22 primary pharmaceutical distribution facilities and one national logistics center; four specialty distribution facilities;
one specialty pharmacy and over 150 nuclear pharmacy laboratories, manufacturing and distribution facilities.
The Medical segment operated over 50 medical-surgical distribution, assembly, manufacturing, and research operation facilities. Our United States operating facilities are located in 44 states and in Puerto Rico.
Outside the United States, as of June 30, 2012, our Pharmaceutical segment operated two nuclear pharmacy laboratories in Canada and our Medical segment operated over 20 facilities in Canada, the Dominican Republic, Malaysia, Malta, Mexico, and Thailand that
engage in manufacturing, distribution or research. In addition, our
Pharmaceutical and Medical segments utilized various distribution facilities in China.
As of June 30, 2012, we owned over 70 operating facilities and leased more than 200 operating facilities. Our principal executive offices are headquartered in an owned building located at 7000 Cardinal Place in Dublin, Ohio.
We consider our operating properties to be in satisfactory condition and adequate to meet our present needs. However, we regularly evaluate operating properties and may make further additions and improvements or consolidate locations as we seek opportunities to expand our business.
In addition to the proceedings described below, the legal proceedings described in Note 9 of the "Notes to Consolidated Financial Statements" are incorporated in this "Item 3—Legal Proceedings" by reference.
In May and June 2012, Herman Kleid and Henry Stanley, Jr., each purported shareholders, filed derivative actions on behalf of Cardinal Health, Inc. in the United States District Court for the Southern District of Ohio against the current and certain former members of our Board of Directors. A similar action was filed by Daniel Himmel in the Common Pleas Court of Delaware County, Ohio and included certain of our officers as defendants (the "Himmel Action"). The complaints allege that the defendants breached their fiduciary duties in connection with the DEA's recent suspension of our Lakeland, Florida distribution center's registration to distribute controlled substances, and the suspension and reinstatement of such registrations at three of our facilities in 2007 and 2008. The Himmel Action also makes claims based on corporate waste and unjust enrichment. The complaints seek, among other things, unspecified money damages against the defendants and an award of attorney's fees. In July and August 2012, the defendants filed motions to dismiss all three complaints.
9
Not applicable.
Executive Officers of the Registrant
The following is a list of our executive officers as of August 15, 2012:
|
Name
|
Age
|
Position
|
|
George S. Barrett
|
57
|
Chairman and Chief Executive Officer
|
|
Jeffrey W. Henderson
|
47
|
Chief Financial Officer
|
|
Michael C. Kaufmann
|
49
|
Chief Executive Officer, Pharmaceutical segment
|
|
Donald M. Casey, Jr.
|
52
|
Chief Executive Officer, Medical segment
|
|
Craig S. Morford
|
53
|
Chief Legal and Compliance Officer
|
|
Carole S. Watkins
|
52
|
Chief Human Resources Officer
|
|
Mark R. Blake
|
41
|
Executive Vice President, Strategy and Corporate Development
|
|
Stephen T. Falk
|
47
|
Executive Vice President, General Counsel and Corporate Secretary
|
The business experience summaries provided below for our executive officers describe positions held during the last five years (unless otherwise indicated).
Mr. Barrett has served as Chairman and Chief Executive Officer since August 2009. From January 2008 to August 2009, he served as Vice Chairman of Cardinal Health and Chief Executive Officer, Healthcare Supply Chain Services. From 1999 until 2007, he held a number of executive positions with Teva Pharmaceutical Industries Limited, a generic and branded pharmaceutical manufacturer, including President and Chief Executive Officer of Teva North America, Corporate Executive Vice President—Global Pharmaceutical Markets and a member of the Office of the Chief Executive Officer, and President of Teva Pharmaceuticals USA.
Mr. Henderson has served as Chief Financial Officer since May 2005.
Mr. Kaufmann has served as Chief Executive Officer, Pharmaceutical segment, since August 2009. From April 2008 until August 2009, he served as Group President, Pharmaceutical Supply Chain, and from April 2007 to April 2008, he was Group President, Healthcare Supply Chain Services—Medical.
Mr. Casey has served as Chief Executive Officer, Medical segment, since April 2012. Before joining us, he served as Chief Executive Officer of the Gary and Mary West Wireless Health Institute, a non-profit research organization focused on lowering the cost of healthcare through novel technology solutions, from March 2010 to March 2012. Prior to that, he served as World Wide Franchise Chairman, Comprehensive Care at Johnson & Johnson, a developer and manufacturer of health care products, from 2007 to 2009.
Mr. Morford has served as Chief Legal and Compliance Officer since May 2009. From May 2008 to May 2009, he served as Chief Compliance Officer. Prior to joining us he held a number of positions in the U.S. Department of Justice including Acting Deputy Attorney General of the United States from August 2007 to March 2008.
Ms. Watkins has served as Chief Human Resources Officer since 2000.
Mr. Blake has served as Executive Vice President, Strategy and Corporate Development since October 2009. From August 2006 until October 2009, he held various business development positions with Medco Health Solutions, Inc., a pharmacy benefits management services company, including Vice President, Business Development and Senior Director, Business Development.
Mr. Falk has served as Executive Vice President, General Counsel and Corporate Secretary since May 2009. From April 2007 to May 2009, he served as Executive Vice President and General Counsel of Healthcare Supply Chain Services.
10
Our Common Shares are listed on the New York Stock Exchange under the symbol “CAH.” The following table reflects the range of the reported high and low closing prices of our Common Shares as reported on the New York Stock Exchange Composite Tape and the per share dividends declared for the fiscal years ended
June 30, 2012
and
2011
, and from July 1, 2012 through the period ended on August 15, 2012.
|
High
|
Low
|
Dividends
|
|||||||||
|
Fiscal 2011
|
|||||||||||
|
Quarter Ended:
|
|||||||||||
|
September 30, 2010
|
$
|
35.88
|
|
$
|
29.96
|
|
$
|
0.195
|
|
||
|
December 31, 2010
|
39.11
|
|
31.99
|
|
0.195
|
|
|||||
|
March 31, 2011
|
42.84
|
|
38.58
|
|
0.195
|
|
|||||
|
June 30, 2011
|
45.54
|
|
40.65
|
|
0.215
|
|
|||||
|
Fiscal 2012
|
|||||||||||
|
Quarter Ended:
|
|||||||||||
|
September 30, 2011
|
$
|
46.83
|
|
$
|
37.99
|
|
$
|
0.215
|
|
||
|
December 31, 2011
|
45.49
|
|
39.88
|
|
0.215
|
|
|||||
|
March 31, 2012
|
43.31
|
|
40.82
|
|
0.215
|
|
|||||
|
June 30, 2012
|
43.33
|
|
40.33
|
|
0.2375
|
|
|||||
|
Fiscal 2013
|
|||||||||||
|
Through August 15, 2012
|
$
|
43.50
|
|
$
|
39.12
|
|
$
|
0.2375
|
|
||
As of August 15, 2012 there were approximately 11,470 shareholders of record of our Common Shares.
We anticipate that we will continue to pay quarterly cash dividends in the future. The payment and amount of future dividends remain, however, within the discretion of our Board of Directors and will depend upon our future earnings, financial condition, capital requirements and other factors.
Issuer Purchases of Equity Securities
|
Period
|
Total Number
of Shares
Purchased (1)
|
Average Price Paid per Share
|
Total Number of Shares
Purchased
as Part of Publicly Announced Program (2)
|
Approximate Dollar
Value of Shares
That May Yet be
Purchased Under the
Program (2)(3) (in millions)
|
|||||||||
|
April 1 – 30, 2012
|
364
|
|
$
|
41.40
|
|
0
|
|
$
|
450
|
|
|||
|
May 1 – 31, 2012
|
1,342,833
|
|
41.56
|
|
1,342,172
|
|
394
|
|
|||||
|
June 1 – 30, 2012
|
2,287,651
|
|
41.19
|
|
2,286,165
|
|
300
|
|
|||||
|
Total
|
3,630,848
|
|
$
|
41.33
|
|
3,628,337
|
|
$
|
300
|
|
|||
|
(1)
|
Includes
218
,
332
and
220
Common Shares purchased in April, May and June 2012, respectively, through a rabbi trust as investments of participants in our Deferred Compensation Plan. Also includes
146
,
329
and
1,266
restricted shares surrendered in April, May and June 2012, respectively, by employees upon vesting to meet tax withholding.
|
|
(2)
|
On November 3, 2010, our Board of Directors approved a $750 million share repurchase program, which was to expire on November 30, 2013. During fiscal 2012, we repurchased 10.3 million Common Shares having an aggregate cost of $450 million under the plan.
|
|
(3)
|
On August 8, 2012, our Board of Directors approved a new $750 million share repurchase program, which expires on August 31, 2015, and canceled the share repurchase program which was to expire on November 30, 2013.
|
11
Performance Graphs
In the past we have presented line graphs comparing the cumulative total return of our Common Shares with the cumulative total return of the Standard & Poor’s Composite—500 Stock Index (the "S&P 500 Index") and the Value Line Healthcare Sector Index (the "Value Line Healthcare Sector Index"), an independently prepared index that includes more than 100 companies in the healthcare industry. This year we have also included a comparison against the Standard & Poor's Composite—500 Healthcare Index (the "S&P 500 Healthcare Index"), an independently prepared index that includes more than 50 companies in the healthcare industry. Next year we do not intend to include the Value Line Healthcare Index in our comparison of cumulative total return. We are changing to the S&P 500 Healthcare Index because we believe it to be a more commonly used index by large healthcare companies.
Five Year Performance Graph
The following graph assumes, in each case, an initial investment of $100 on June 30, 2007, based on the market prices at the end of each fiscal year through and including
June 30, 2012
, and reinvestment of dividends. The Value Line Healthcare Sector Index, the S&P 500 Healthcare Index and the S&P 500 Index investments are weighted on the basis of market capitalization at the beginning of each period. We have adjusted the market price of our Common Shares prior to August 31, 2009 to reflect the Spin-Off of CareFusion on August 31, 2009.
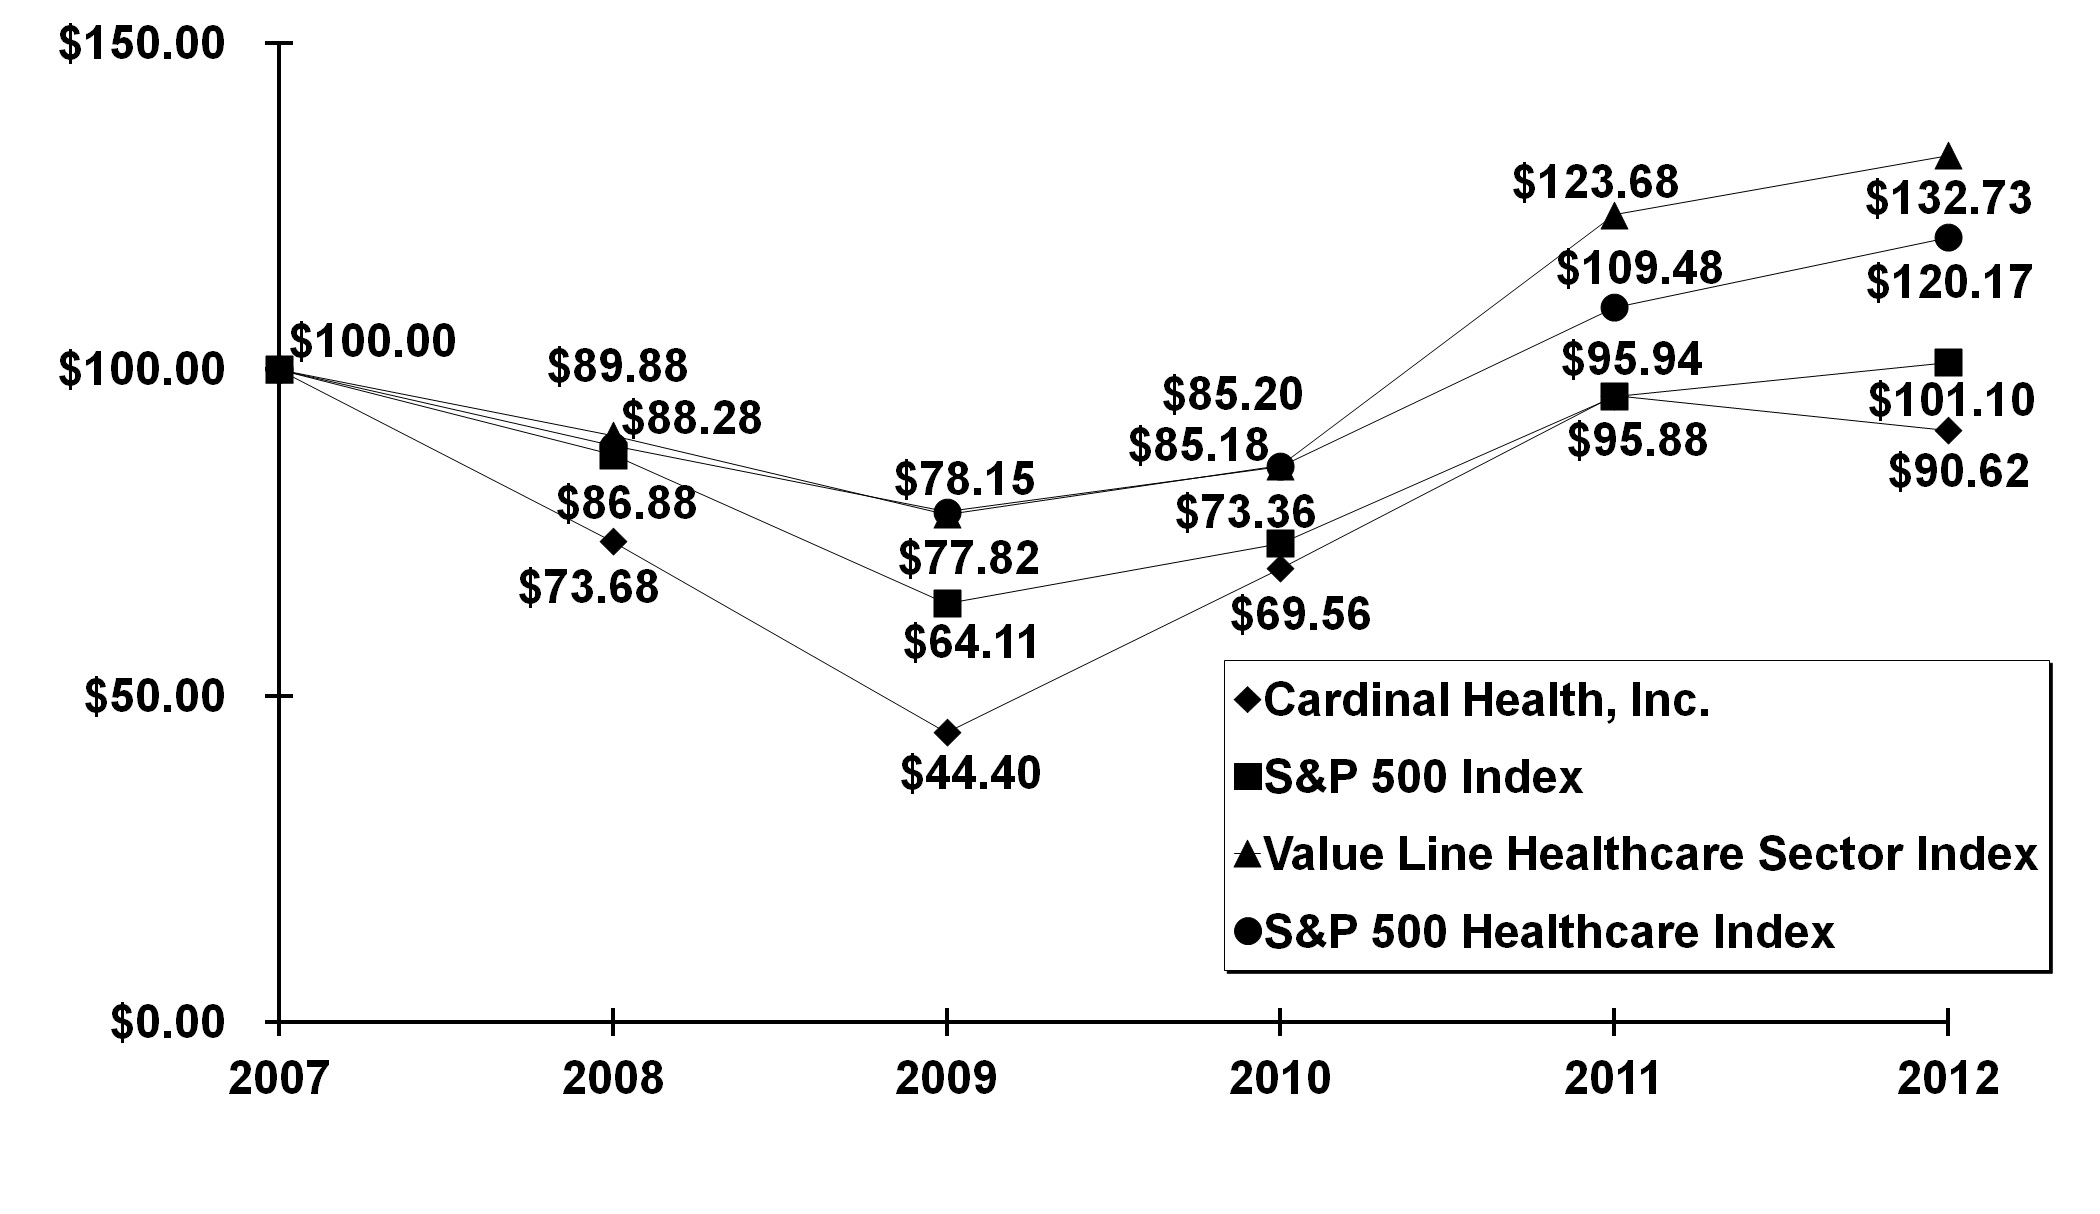
|
June 30,
|
|||||||||||||||||||||||
|
2007
|
2008
|
2009
|
2010
|
2011
|
2012
|
||||||||||||||||||
|
Cardinal Health, Inc.
|
$
|
100.00
|
|
$
|
73.68
|
|
$
|
44.40
|
|
$
|
69.56
|
|
$
|
95.94
|
|
$
|
90.62
|
|
|||||
|
S&P 500 Index
|
100.00
|
|
86.88
|
|
64.11
|
|
73.36
|
|
95.88
|
|
101.10
|
|
|||||||||||
|
Value Line Healthcare Sector Index
|
100.00
|
|
89.88
|
|
77.82
|
|
85.20
|
|
123.68
|
|
132.73
|
|
|||||||||||
|
S&P 500 Healthcare Index
|
100.00
|
|
88.28
|
|
78.15
|
|
85.18
|
|
109.48
|
|
120.17
|
|
|||||||||||
Post Spin-Off Graph
We have included a second graph below to show our cumulative total return compared with the cumulative total return of the S&P 500 Index, the Value Line Healthcare Sector Index and the S&P 500 Healthcare Index since the Spin-Off of our clinical and medical products business on August 31, 2009. The line graph assumes, in each case, an initial investment of $100 on August 31, 2009 through and including
June 30, 2012
, and reinvestment of dividends. We have adjusted the market price of our Common Shares on August 31, 2009 to reflect the Spin-Off.
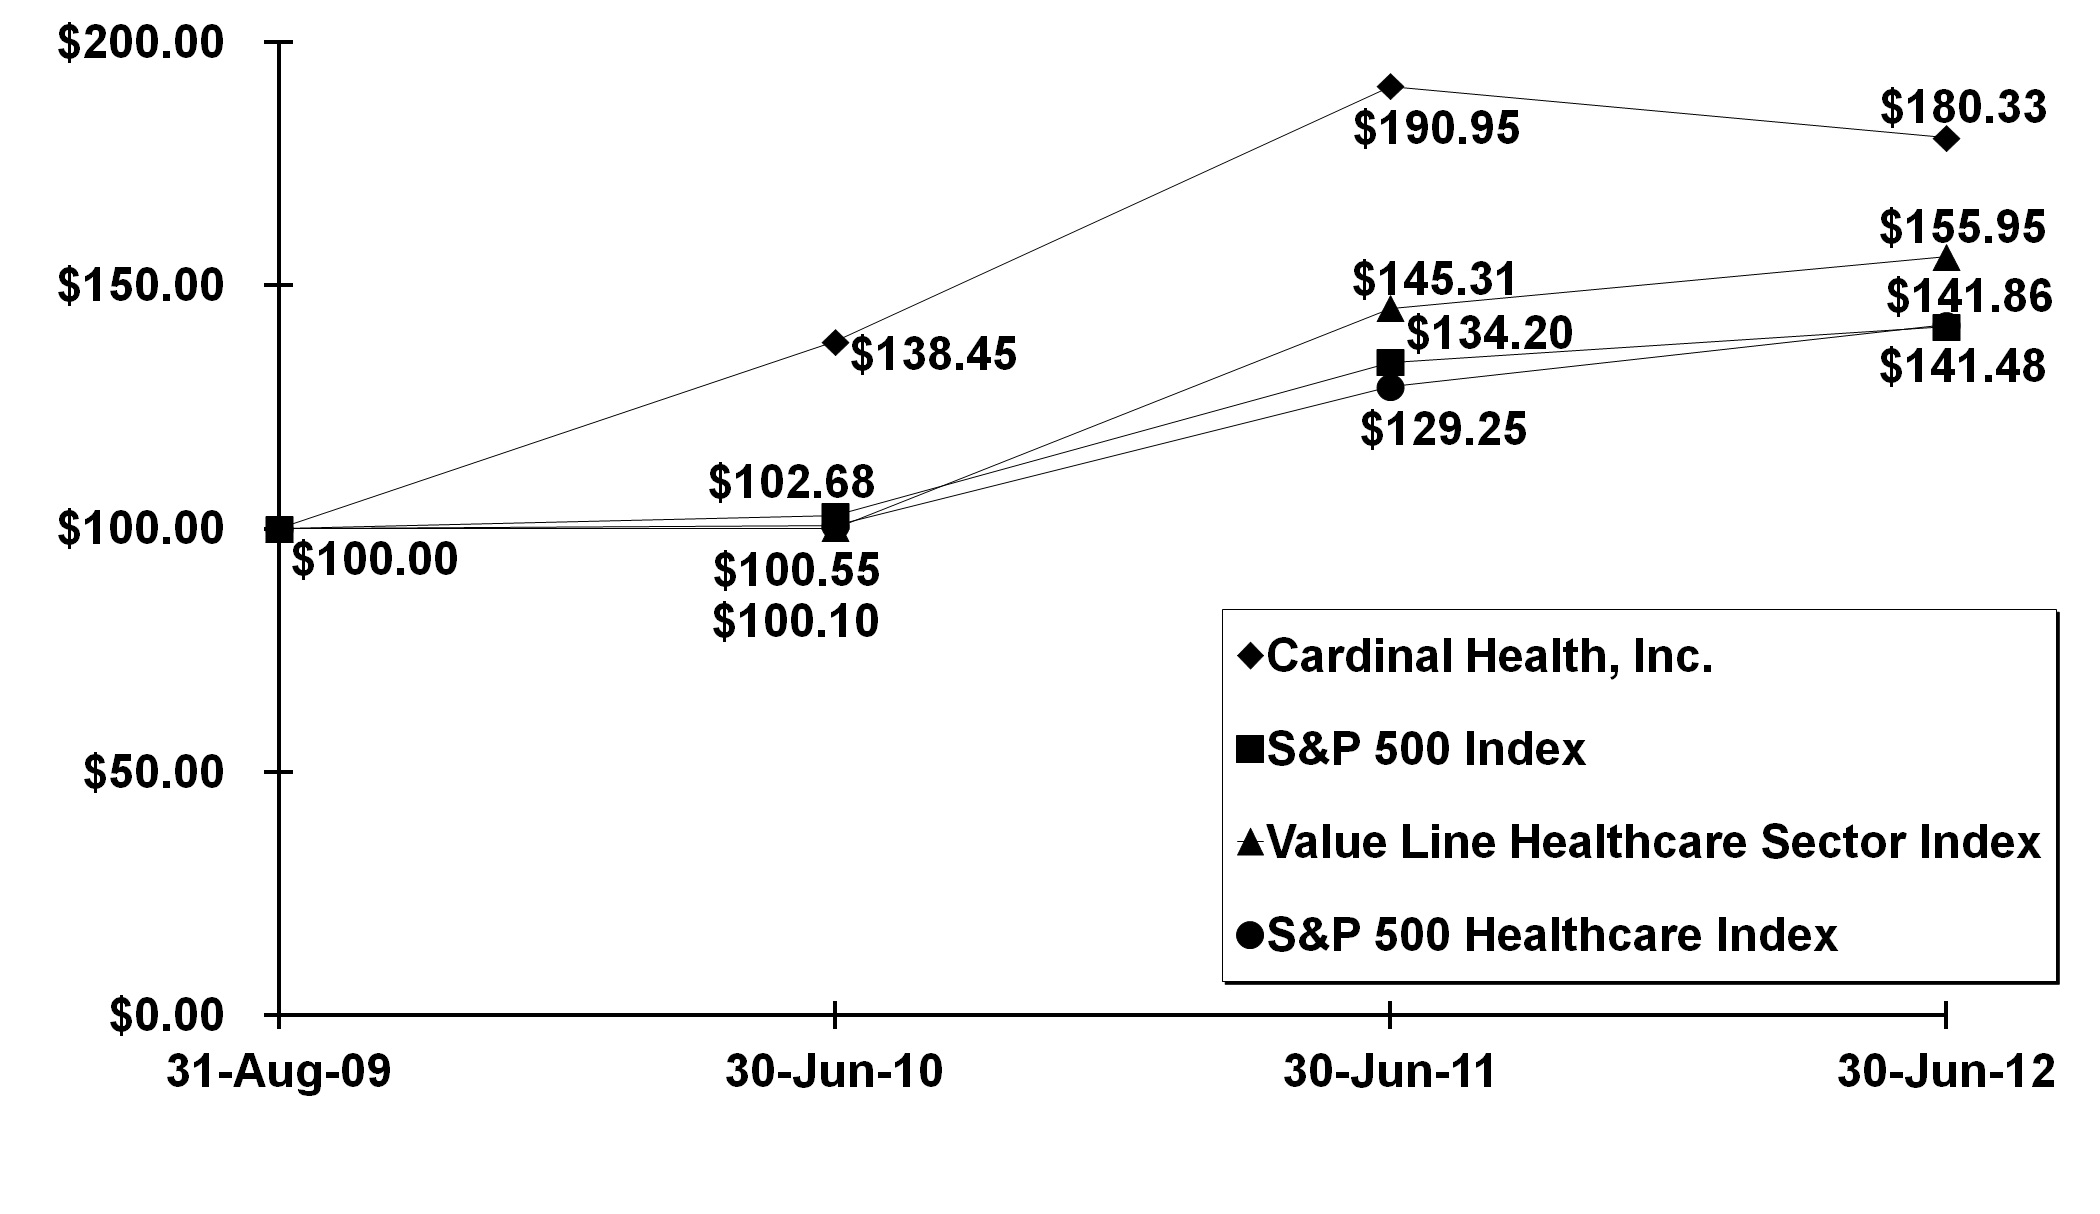
|
August 31,
2009
|
|
June 30,
2010
|
|
June 30,
2011
|
|
June 30,
2012
|
|||||||||
|
Cardinal Health, Inc.
|
$
|
100.00
|
|
$
|
138.45
|
|
$
|
190.95
|
|
$
|
180.33
|
|
|||
|
S&P 500 Index
|
100.00
|
|
102.68
|
|
134.20
|
|
141.48
|
|
|||||||
|
Value Line Healthcare Sector Index
|
100.00
|
|
100.10
|
|
145.31
|
|
155.95
|
|
|||||||
|
S&P 500 Healthcare Index
|
100.00
|
|
100.55
|
|
129.25
|
|
141.86
|
|
|||||||
12
The consolidated financial data below includes all business combinations as of the date of acquisition that occurred during these periods. The following selected consolidated financial data should be read in conjunction with the consolidated financial statements and related notes and “Item 7—Management’s Discussion and Analysis of Financial Condition and Results of Operations.”
|
(in millions, except per Common Share amounts)
|
2012
|
2011
|
2010
|
2009
|
2008
|
||||||||||||||
|
Earnings Data:
|
|||||||||||||||||||
|
Revenue
|
$
|
107,552
|
|
$
|
102,644
|
|
$
|
98,503
|
|
$
|
95,992
|
|
$
|
87,408
|
|
||||
|
Earnings from continuing operations
|
$
|
1,070
|
|
$
|
966
|
|
$
|
587
|
|
$
|
758
|
|
$
|
847
|
|
||||
|
Earnings/(loss) from discontinued operations (1)
|
(1
|
)
|
(7
|
)
|
55
|
|
394
|
|
454
|
|
|||||||||
|
Net earnings
|
$
|
1,069
|
|
$
|
959
|
|
$
|
642
|
|
$
|
1,152
|
|
$
|
1,301
|
|
||||
|
Basic earnings/(loss) per Common Share:
|
|||||||||||||||||||
|
Continuing operations
|
$
|
3.10
|
|
$
|
2.77
|
|
$
|
1.64
|
|
$
|
2.12
|
|
$
|
2.37
|
|
||||
|
Discontinued operations (1)
|
—
|
|
(0.02
|
)
|
0.15
|
|
1.10
|
|
1.26
|
|
|||||||||
|
Net basic earnings per Common Share
|
$
|
3.10
|
|
$
|
2.75
|
|
$
|
1.79
|
|
$
|
3.22
|
|
$
|
3.63
|
|
||||
|
Diluted earnings/(loss) per Common Share:
|
|||||||||||||||||||
|
Continuing operations
|
$
|
3.06
|
|
$
|
2.74
|
|
$
|
1.62
|
|
$
|
2.10
|
|
$
|
2.33
|
|
||||
|
Discontinued operations (1)
|
—
|
|
(0.02
|
)
|
0.15
|
|
1.08
|
|
1.24
|
|
|||||||||
|
Net diluted earnings per Common Share
|
$
|
3.06
|
|
$
|
2.72
|
|
$
|
1.77
|
|
$
|
3.18
|
|
$
|
3.57
|
|
||||
|
Cash dividends declared per Common Share
|
0.8825
|
|
0.800
|
|
0.720
|
|
0.595
|
|
0.500
|
|
|||||||||
|
Balance Sheet Data:
|
|||||||||||||||||||
|
Total assets
|
$
|
24,260
|
|
$
|
22,846
|
|
$
|
19,990
|
|
$
|
25,119
|
|
$
|
23,448
|
|
||||
|
Long-term obligations, less current portion
|
2,418
|
|
2,175
|
|
1,896
|
|
3,272
|
|
3,682
|
|
|||||||||
|
Shareholders’ equity (2)
|
6,244
|
|
5,849
|
|
5,276
|
|
8,725
|
|
7,748
|
|
|||||||||
|
(1)
|
On August 31, 2009, we separated the clinical and medical products businesses from our other businesses through a pro rata distribution to shareholders of 81 percent of the then outstanding common stock of CareFusion and met the criteria for classification of these businesses as discontinued operations. During the fourth quarter of fiscal 2009, we committed to plans to sell our United Kingdom-based Martindale injectable manufacturing business within our Pharmaceutical segment, and met the criteria for classification of this business as discontinued operations. For additional information regarding discontinued operations, see Note 5 of the “Notes to Consolidated Financial Statements.”
|
|
(2)
|
As noted above, on August 31, 2009, we completed the distribution to our shareholders of 81 percent of the then outstanding common stock of CareFusion and retained the remaining 41 million shares of CareFusion common stock. The distribution of CareFusion common stock to our shareholders resulted in the recognition of a $3.7 billion non-cash dividend.
|
13
The discussion and analysis presented below refers to, and should be read in conjunction with, the consolidated financial statements and related notes included in this Form 10-K. Unless otherwise indicated, throughout this Management’s Discussion and Analysis of Financial Condition and Results of Operations, we are referring to our continuing operations.
Overview
We are a healthcare services company providing pharmaceutical and medical products and services that help pharmacies, hospitals, surgery centers, physician offices and other healthcare providers focus on patient care while reducing costs, enhancing efficiency and improving quality. We report our financial results in two segments: Pharmaceutical and Medical.
During fiscal 2012, we achieved revenue of $107.6 billion and increased our operating earnings by 18 percent to $1.8 billion. Our growth in revenue was due to increased volume from existing customers ($2.4 billion) and acquisitions ($2.4 billion). The increase in operating earnings reflects strong performance in our Pharmaceutical segment generic programs, the positive impact of acquisitions, and a $71 million gain realized upon adjusting the contingent consideration obligation associated with the P4 Healthcare acquisition. Earnings from continuing operations were up 11 percent for the twelve months ended June 30, 2012 due to the factors discussed above.
Our cash and equivalents balance was
$2.3 billion
as of
June 30, 2012
, compared to
$1.9 billion
as of
June 30, 2011
. The increase in cash and equivalents was primarily attributable to net cash provided by operating activities of
$1.2 billion
, partially offset by share repurchases of
$450 million
and cash dividends of
$300 million
. We plan to continue to execute a balanced deployment of available capital to position ourselves for sustainable competitive advantage and to enhance shareholder value.
Trends
Within our Pharmaceutical segment, we expect revenue to decrease in fiscal 2013. The factors contributing to this decrease include reduced revenue as a result of branded-to-generic pharmaceutical conversions and the expiration on September 30, 2012 of our pharmaceutical distribution contract with Express Scripts, Inc. Branded-to-generic pharmaceutical conversions impact our revenues because generic pharmaceuticals generally sell at a lower price than the corresponding branded product and because some of our customers source generic products directly from manufacturers rather than purchasing from us. Our contract with Express Scripts, Inc. was not renewed in connection with the combined pharmaceutical distribution contract that was not awarded to us following that company's merger with Medco Health Solutions, Inc. We recognized approximately $9.0 billion of revenue from sales to Express Scripts, Inc. in fiscal 2012, all of which was classified as bulk sales.
In our Pharmaceutical segment, we also anticipate fewer significant new generic pharmaceutical product launches in fiscal 2013. However, the impact of these launches on our gross margin can vary depending on the timing, size and number of entrants.
Within our Medical segment, variability in the cost of commodities such as oil-based resins, cotton, latex, diesel fuel and other commodities can have a significant impact on the cost of products sold. Although commodity prices fluctuate, we do not expect changes in commodity prices to have a significant impact on our year-over-year results of operations in fiscal 2013.
The Healthcare Reform Acts include a tax to be paid by medical device manufacturers equal to 2.3 percent of the price for which manufacturers sell their products, which is scheduled to begin January 1, 2013. We manufacture and sell devices that, based on the currently proposed rules, will be subject to this tax. There have been proposals to repeal this tax and modify the proposed rules, which if adopted, may reduce the impact of this tax on us.
Acquisitions
We have completed several acquisitions since July 1, 2009, the largest of which were Kinray, P4 Healthcare and Cardinal Health China, each of which was completed in fiscal 2011. In this Management's Discussion and Analysis, we identify the contribution of an acquisition until the one-year anniversary of the acquisition. Using this definition, for fiscal 2012 and 2011, acquisitions contributed revenues of $2.4 billion and $2.9 billion, respectively, and operating earnings of $79 million and $61 million, respectively.
See Note 2 of the “Notes to Consolidated Financial Statements” for more information on acquisitions.
Spin-Off of CareFusion
Effective August 31, 2009, we separated our clinical and medical products business through the distribution to our shareholders of 81 percent of the then outstanding common stock of CareFusion and retained the remaining 41 million shares of CareFusion common stock. During fiscal
2011
and
2010
, we disposed of
30 million
and
11 million
shares of CareFusion common stock, respectively.
We entered into a separation agreement with CareFusion on July 22, 2009 to effect the Spin-Off and provide a framework for our relationship with CareFusion after the Spin-Off. In addition, on August 31, 2009, we entered into a transition services agreement, a tax matters agreement and an accounts receivable factoring agreement with CareFusion, among other agreements.
Under the transition services agreement, during fiscal
2012
,
2011
and
2010
, we recognized
$3 million
,
$65 million
and
$99 million
, respectively, in transition service fee income.
14
Under the tax matters agreement, CareFusion is obligated to indemnify us for certain tax exposures and transaction taxes prior to the Spin-Off. The indemnification receivable was
$265 million
and
$264 million
at
June 30, 2012
and
2011
, respectively, and is included in other long-term assets in the consolidated balance sheets.
Under the accounts receivable factoring agreement, during fiscal
2011
and 2010, we purchased
$460 million
and $606 million of CareFusion trade receivables, respectively. The accounts receivable factoring arrangement expired on April 1, 2011.
Results of Operations
Revenue
|
|
Change
|
Revenue
|
|||||||||||||||
|
(in millions)
|
2012
|
2011
|
2012
|
2011
|
2010
|
||||||||||||
|
Pharmaceutical
|
4
|
%
|
4
|
%
|
$
|
97,925
|
|
$
|
93,744
|
|
$
|
89,790
|
|
||||
|
Medical
|
8
|
%
|
2
|
%
|
9,642
|
|
8,922
|
|
8,750
|
|
|||||||
|
Total Segment
|
5
|
%
|
4
|
%
|
$
|
107,567
|
|
$
|
102,666
|
|
$
|
98,540
|
|
||||
|
Corporate
|
N.M.
|
|
N.M.
|
|
(15
|
)
|
(22
|
)
|
(37
|
)
|
|||||||
|
Consolidated
|
5
|
%
|
4
|
%
|
$
|
107,552
|
|
$
|
102,644
|
|
$
|
98,503
|
|
||||
Fiscal
2012
Compared to Fiscal
2011
Pharmaceutical Segment
Revenue was positively impacted during fiscal 2012 by acquisitions ($2.3 billion) and increased sales to existing customers ($2.0 billion).
Revenue from bulk sales was $40.2 billion and $41.9 billion for fiscal 2012 and 2011, respectively. During fiscal 2012, revenue from bulk sales decreased 4 percent as a result of the conversion of branded pharmaceuticals to generic pharmaceuticals as well as a shift in sales mix for certain retail chain pharmacy customers to non-bulk from bulk. Revenue from non-bulk sales was $57.7 billion and $51.8 billion for fiscal 2012 and 2011, respectively. Revenue from non-bulk sales increased 11 percent during fiscal 2012, primarily due to acquisitions and the previously mentioned shift in sales. See “Item 1-Business” for more information about bulk and non-bulk sales.
Medical Segment
Revenue was positively impacted during fiscal 2012 by increased volume from existing customers ($335 million), including the positive impact from sales of self-manufactured and private brand products and the transition during the fourth quarter of fiscal 2011 of our relationship with CareFusion from a fee-for-service arrangement to a traditional distribution model ($131 million). This transition had minimal impact on Medical segment profit.
Fiscal
2011
Compared to Fiscal
2010
Pharmaceutical Segment
During fiscal 2011, Pharmaceutical revenue was positively impacted by acquisitions, net of divestitures ($2.7 billion) and increased sales to existing customers ($1.8 billion). Revenue was negatively impacted by losses of customers in excess of gains ($584 million).
Medical Segment
Medical revenue was positively impacted during fiscal 2011 by increased volume from existing customers ($354 million). These revenue gains were partially offset by the impact of lost customers in excess of gains ($165 million) and decreased volume as a result of strong demand for flu-related products in the prior year ($51 million).
Cost of Products Sold
Consistent with the increases in revenue, our cost of products sold increased $4.5 billion, or 5 percent, during fiscal 2012 and increased by $3.8 billion, or 4 percent, during fiscal 2011. See the following gross margin discussion for additional drivers impacting cost of products sold.
Gross Margin
|
|
Change
|
Gross Margin
|
|||||||||||||||
|
(in millions)
|
2012
|
2011
|
2012
|
2011
|
2010
|
||||||||||||
|
Gross margin
|
9
|
%
|
10
|
%
|
$
|
4,541
|
|
$
|
4,162
|
|
$
|
3,781
|
|
||||
Fiscal
2012
Compared to Fiscal
2011
Pharmaceutical Segment
Gross margin increased $335 million in fiscal 2012.
Strong performance in our generic pharmaceutical programs, including the impact of new product launches, increased gross margin by $287 million.
Acquisitions positively impacted gross margin by $122 million.
Increased margin under branded and generic manufacturer agreements (exclusive of related volume impact) had a positive impact on gross margin of $49 million, due in part to price appreciation on a few specific generic pharmaceutical products.
Pharmaceutical distribution customer pricing changes, including rebates (exclusive of the related volume impact), adversely impacted gross margin by an estimated $179 million. The adverse impact of these customer pricing changes was partially offset by product mix, sourcing programs and other sources of margin.
Medical Segment
Gross margin increased $47 million in fiscal 2012.
Favorable product sales mix and increased sales volume resulted in a $100 million favorable impact to gross margin.
Increased cost of oil-based resins, cotton, latex, and other commodities used in our self-manufactured products decreased gross margin by $66 million.
15
Fiscal
2011
Compared to Fiscal
2010
Pharmaceutical Segment
Gross margin increased $446 million in fiscal 2011.
Strong performance in our generic pharmaceutical programs, including the impact of new product launches, increased gross margin by $239 million.
Acquisitions, net of divestitures, positively impacted gross margin by $198 million.
Increased margin from branded pharmaceutical agreements (exclusive of the related volume impact) had a positive impact on gross margin of $72 million. The increase was primarily due to our performance under distribution service agreements and the transition of certain vendors to distribution service agreements.
Pharmaceutical distribution customer pricing changes including rebates (exclusive of the related volume impact) adversely impacted gross margin by an estimated $99 million. The adverse impact of these customer pricing changes was partially offset by product mix, sourcing programs and other sources of margin.
Medical Segment
Gross margin decreased $59 million in fiscal 2011.
Increased cost of oil-based resins, cotton, latex, diesel fuel and other commodities used in our self-manufactured products decreased gross margin by $59 million.
Increased net sales volume resulted in a $22 million favorable impact to gross margin.
In the first quarter of fiscal 2010, we realized a one-time gain of $14 million as a result of the recognition of previously deferred intercompany revenue for sales to CareFusion.
Somewhat sluggish healthcare utilization disproportionately affected surgical procedures and consequently our higher-margin products.
Distribution, Selling, General and Administrative Expenses
|
|
Change
|
SG&A
|
|||||||||||||||
|
(in millions)
|
2012
|
2011
|
2012
|
2011
|
2010
|
||||||||||||
|
SG&A
|
6
|
%
|
5
|
%
|
$
|
2,677
|
|
$
|
2,528
|
|
$
|
2,397
|
|
||||
Increased SG&A in fiscal 2012 was primarily due to acquisitions ($65 million) and business system investments, including the Medical segment business transformation project. The increase in SG&A in fiscal 2011 was primarily due to acquisitions, net of divestitures ($90 million).
SG&A also included costs related to the Spin-Off of $2 million, $10 million and $11 million for fiscal 2012, 2011 and 2010, respectively.
Segment Profit and Consolidated Operating Earnings
|
|
Change
|
Segment Profit and Operating Earnings
|
|||||||||||||||
|
(in millions)
|
2012
|
2011
|
2012
|
2011
|
2010
|
||||||||||||
|
Pharmaceutical
|
17
|
%
|
31
|
%
|
$
|
1,558
|
|
$
|
1,329
|
|
$
|
1,011
|
|
||||
|
Medical
|
(11
|
)%
|
(13
|
)%
|
332
|
|
373
|
|
429
|
|
|||||||
|
Total segment profit
|
11
|
%
|
18
|
%
|
1,890
|
|
1,702
|
|
1,440
|
|
|||||||
|
Corporate
|
N.M.
|
|
N.M.
|
|
(98
|
)
|
(188
|
)
|
(133
|
)
|
|||||||
|
Total consolidated operating earnings
|
18
|
%
|
16
|
%
|
$
|
1,792
|
|
$
|
1,514
|
|
$
|
1,307
|
|
||||
Segment Profit
We evaluate the performance of the individual segments based upon, among other things, segment profit, which is segment revenue, less segment cost of products sold, less segment SG&A expenses. We do not allocate restructuring and employee severance, acquisition-related costs, impairments and (gain)/loss on sale of assets, litigation (recoveries)/charges, net, certain investment and other spending to our segments. These costs are retained at Corporate. Investment spending generally includes the first year spend for certain projects which require incremental strategic investments in the form of additional operating expenses. We encourage our segments to identify investment projects which will promote innovation and provide future returns. As approval decisions for such projects are dependent upon executive management, the expenses for such projects are often retained at Corporate. In addition, Spin-Off costs included within SG&A are not allocated to our segments. See Note 15 of the "Notes to Consolidated Financial Statements" for additional information on segment profit.
Pharmaceutical Segment Profit
The principal drivers for the increase in fiscal 2012 and 2011 were strong performance in our generic pharmaceutical programs, including the impact of new product launches, the positive impact of acquisitions, and increased margin under branded pharmaceutical agreements, offset by the unfavorable impact of pharmaceutical distribution customer pricing changes. See the discussion of gross margin above for further information on these drivers.
Segment profit from bulk sales increased $19 million in fiscal 2012 over fiscal 2011 and was 10 percent of Pharmaceutical segment profit in both years. Segment profit from non-bulk sales increased $210 million in fiscal 2012 over fiscal 2011 and was 90 percent of Pharmaceutical segment profit in both years. The generic pharmaceutical programs and acquisitions discussed above primarily impacted segment profit from non-bulk sales.
Medical Segment Profit
The principal drivers for the decrease in fiscal 2012 were the increased cost of commodities used in our self-manufactured products and an increase in SG&A expenditures, including the impact of business system investments. These items were partially offset by the favorable impact of product sales mix and increased net sales volume. See the discussion above for further information on these drivers.
16
Results for fiscal 2011 were adversely affected by increased cost of commodities used in our self-manufactured products partially offset by increased sales volume. Results also were impacted by the negative year-over-year impact of recognizing in fiscal 2010 a one-time gain related to previously deferred intercompany revenue for sales to CareFusion.
Consolidated Operating Earnings
In addition to revenue, gross margin and SG&A discussed above, operating earnings were impacted by the following:
|
(in millions)
|
2012
|
2011
|
2010
|
||||||||
|
Restructuring and employee severance
|
$
|
21
|
|
$
|
15
|
|
$
|
91
|
|
||
|
Acquisition-related costs
|
33
|
|
90
|
|
19
|
|
|||||
|
Impairments and loss on disposal of assets
|
21
|
|
9
|
|
29
|
|
|||||
|
Litigation (recoveries)/charges, net
|
(3
|
)
|
6
|
|
(62
|
)
|
|||||
Restructuring and Employee Severance
Fiscal 2011 and 2010 restructuring and employee severance charges included $7 million and $65 million, respectively, of costs arising from the Spin-Off.
Acquisition-Related Costs
Acquisition-related costs for fiscal 2012 included income realized upon adjusting the contingent consideration obligation incurred in connection with the P4 Healthcare acquisition. The former owners of P4 Healthcare had the right to receive certain contingent payments based on targeted earnings before interest, taxes, depreciation, and amortization ("EBITDA"). As a result of changes in our estimate of performance in future periods due in large part to the loss of revenue from a significant customer of the P4 Healthcare legacy business in fiscal 2012, we revised the timing and amount of EBITDA estimates and made changes in probability assumptions with respect to the likelihood of achieving the EBITDA targets. These changes, coupled with the progress of discussions with the former owners regarding an early termination and settlement of the contingent consideration obligation, resulted in a $71 million decrease in the fair value of the obligation to $4 million at June 30, 2012. In early July 2012, we reached final settlement and payment of the remaining contingent consideration liability for
$4 million
. See Note 2 of the "Notes to Consolidated Financial Statements" for additional information on this item.
Amortization of acquisition-related intangible assets was $78 million, $67 million and $10 million for fiscal 2012, 2011 and 2010, respectively.
Impairments and Loss on Disposal of Assets
During fiscal 2012, we recorded a charge of $16 million to write off an indefinite life intangible asset related to the P4 Healthcare trade name. We have rebranded P4 Healthcare under the Cardinal Health Specialty Solutions name.
During fiscal 2010, we recognized an impairment charge of $18 million related to the write-down of SpecialtyScripts, LLC ("Specialty Scripts"), a business within our Pharmaceutical segment. We sold SpecialtyScripts during the third quarter of fiscal 2010.
Litigation (Recoveries)/Charges, Net
During fiscal 2010, we recognized income of $41 million resulting from settlement of a class action antitrust claim in which we were a class member. In addition, we recognized $26 million of income for insurance proceeds released from escrow after litigation, commenced against certain directors and officers in 2004, was resolved.
Earnings Before Income Taxes and Discontinued Operations
In addition to items discussed above, earnings before income taxes and discontinued operations were impacted by the following:
|
|
Change
|
Earnings Before Income Taxes and Discontinued Operations
|
|||||||||||||||
|
(in millions)
|
2012
|
2011
|
2012
|
2011
|
2010
|
||||||||||||
|
Other income, net
|
N.M.
|
|
61
|
%
|
$
|
(1
|
)
|
$
|
(22
|
)
|
$
|
(13
|
)
|
||||
|
Interest expense, net
|
2
|
%
|
(18
|
)%
|
95
|
|
93
|
|
113
|
|
|||||||
|
Loss on extinguishment of debt
|
N.M.
|
|
N.M.
|
|
—
|
|
—
|
|
40
|
|
|||||||
|
Gain on sale of Investment in CareFusion common stock
|
N.M.
|
|
67
|
%
|
—
|
|
(75
|
)
|
(45
|
)
|
|||||||
Interest Expense, Net
The decrease in interest expense for fiscal 2011 was primarily due to favorable interest rate swaps.
Loss on Extinguishment of Debt
During fiscal 2010, we recognized a $40 million loss from the early retirement of over $1.1 billion of debt securities through a tender offer.
Gain on Sale of Investment in CareFusion Common Stock
We recognized $75 million and $45 million of income during fiscal 2011 and 2010, respectively, related to the sale of our investment in CareFusion common stock.
Provision for Income Taxes
Generally, fluctuations in the effective tax rate are due to changes within international and United States state effective tax rates resulting from our business mix and discrete items. A reconciliation of the provision based on the federal statutory income tax rate to our effective income tax rate from continuing operations is as follows for fiscal
2012
,
2011
and
2010
(see Note 8 of “Notes to Consolidated Financial Statements” for a detailed disclosure of the effective tax rate reconciliation):
|
|
2012
|
2011
|
2010
|
|||||
|
Provision at Federal statutory rate
|
35.0
|
%
|
35.0
|
%
|
35.0
|
%
|
||
|
State and local income taxes, net of federal benefit
|
2.3
|
|
2.6
|
|
4.2
|
|
||
|
Foreign tax rate differential
|
(2.3
|
)
|
(2.5
|
)
|
(3.3
|
)
|
||
|
Nondeductible/nontaxable items
|
—
|
|
0.6
|
|
0.2
|
|
||
|
Change in measurement of an uncertain tax position and an IRS settlement
|
0.9
|
|
2.4
|
|
1.3
|
|
||
|
Valuation allowances
|
0.1
|
|
(0.6
|
)
|
(2.3
|
)
|
||
|
Unremitted foreign earnings
|
(0.2
|
)
|
(0.1
|
)
|
13.9
|
|
||
|
Other
|
1.2
|
|
(1.0
|
)
|
2.6
|
|
||
|
Effective income tax rate
|
37.0
|
%
|
36.4
|
%
|
51.6
|
%
|
||
17
Fiscal
2012
Compared to Fiscal
2011
The fiscal 2012 effective tax rate was favorably impacted by a settlement of the fiscal 2001 and 2002 IRS audits ($40 million or 2.4 percentage points). The year-over-year comparison of the effective tax rate was unfavorably impacted by the release in fiscal 2011 of a previously established deferred tax valuation allowance.
Fiscal
2011
Compared to Fiscal
2010
The effective tax rate was favorably impacted by $28 million, or 1.9 percentage points, attributable to recognizing no income tax expense on the sale of CareFusion stock due to the release of a previously established deferred tax valuation allowance. An unfavorable charge of $168 million, or 13.9 percentage points, attributable to earnings no longer indefinitely invested offshore in fiscal 2010 favorably impacted the year-over-year comparison of the effective tax rate.
Ongoing Audits
During fiscal 2012, the IRS closed audits of fiscal 2001 and 2002, and is currently conducting audits of fiscal years 2003 through 2010. We have received proposed adjustments from the IRS for fiscal 2003 through 2007 related to our transfer pricing arrangements between foreign and domestic subsidiaries and the transfer of intellectual property among subsidiaries of an acquired entity prior to its acquisition by us. The IRS has proposed additional taxes of $849 million, excluding penalties and interest. If this tax ultimately must be paid, CareFusion is liable under the tax matters agreement for $592 million of the total amount. We disagree with these proposed adjustments, which we are contesting, and have accounted for the unrecognized tax benefits related to them.
Earnings/(Loss) from Discontinued Operations
CareFusion operating results are included within earnings from discontinued operations for all periods through the date of the Spin-Off, and had a significant impact on earnings from discontinued operations for fiscal 2010. See Note 5 in the “Notes to Consolidated Financial Statements” for additional information on discontinued operations.
Liquidity and Capital Resources
We currently believe that, based upon available capital resources (cash on hand), projected operating cash flow, and access to committed credit facilities, we have adequate capital resources to fund working capital needs; currently anticipated capital expenditures, business growth and expansion; contractual obligations; payments for tax settlements; and current and projected debt service requirements, dividends and share repurchases. During fiscal 2012, we completed several small acquisitions with cash on hand. If we decide to engage in one or more additional acquisitions, depending on the size and timing of such transactions, we may need supplemental funding.
Cash and Equivalents
Our cash and equivalents balance was
$2.3 billion
at
June 30, 2012
, compared to
$1.9 billion
at
June 30, 2011
. At
June 30, 2012
, our cash and cash equivalents were held in cash depository accounts with major banks or invested in high quality, short-term liquid investments. The increase in cash and equivalents during fiscal 2012 was primarily attributable to net cash provided by operating activities of
$1.2 billion
and net proceeds of $290 million from the sale and repayment of notes. During fiscal
2012
, we deployed $450 million of cash on share repurchases, $300 million on dividends, $263 million on capital expenditures, and $174 million on acquisitions.
During fiscal 2011, we deployed $2.3 billion of cash on acquisitions, $291 million on capital expenditures, $274 million on dividends and $270 million on share repurchases. During fiscal 2011, we received $706 million in proceeds from the sale of our remaining investment in CareFusion common stock.
During fiscal 2010, we deployed $350 million of cash to repay floating rate notes at maturity, $260 million on capital expenditures, $253 million on dividends and $230 million on share repurchases. During fiscal 2010, we completed a $1.1 billion debt tender using a portion of the $1.4 billion of cash distributed to us from CareFusion in connection with the Spin-Off. We also received $271 million in proceeds from the sale of our investment in CareFusion common stock and $154 million from divestitures.
18
We use days sales outstanding (“DSO”), days inventory on hand (“DIOH”) and days payable outstanding (“DPO”) to evaluate our working capital performance. DSO is calculated as trade receivables, net divided by average daily revenue during the last month of the reporting period. DIOH is calculated as inventories divided by average daily cost of products sold and chargeback billings during the last quarter of the reporting period. DPO is calculated as accounts payable divided by average daily cost of products sold and chargeback billings during the last quarter of the reporting period. Chargeback billings are the difference between a product’s wholesale acquisition cost and the contract price established between the vendors and the end customer.
|
|
2012
|
2011
|
2010
|
||
|
Days sales outstanding
|
22.3
|
20.3
|
18.6
|
||
|
Days inventory on hand
|
23.9
|
22.5
|
21.5
|
||
|
Days payable outstanding
|
35.6
|
34.8
|
32.1
|
||
Changes in working capital can vary significantly depending on factors such as the timing of inventory purchases, customer payments of accounts receivable, and payments to vendors in the regular course of business.
DSO increased in fiscal 2012 as a result of the Medical segment's business transformation project implementation, which led to an increase in trade receivables at June 30, 2012. DIOH increased in fiscal 2012 as a result of inventory increases related to on-boarding a new pharmaceutical customer and the Medical segment's business transformation project implementation.
The increase in DSO in fiscal 2011 was driven by the impact of acquisitions and the increase in DPO was due to the timing of payments to vendors in the regular course of business.
The cash and equivalents balance at the end of fiscal
2012
included $380 million of cash held by subsidiaries outside of the United States. Although the vast majority of this cash is available for repatriation, permanently bringing the money into the United States could trigger U.S. federal, state and local income tax obligations. As a U.S. parent company, we may temporarily access cash held by our foreign subsidiaries without becoming subject to U.S. federal income tax through intercompany loans.
In fiscal 2013, we expect two matters to adversely affect our operating cash flows by approximately $500 million compared to fiscal 2012. Specifically, we anticipate that we will make cash payments to the IRS as we work to reach resolution on audits of fiscal 2003 through 2005; however, we can provide no assurance regarding the likelihood or timing of reaching resolution.
We also expect a negative working capital impact from the expiration of our contract with Express Scripts, Inc.
Ownership of CareFusion Common Stock
During fiscal 2011 and 2010, we disposed of 30 million and 11 million shares of CareFusion common stock for cash proceeds of $706 million and $271 million, respectively. We have no remaining ownership in CareFusion.
Credit Facilities and Commercial Paper
Our sources of liquidity include a
$1.5 billion
revolving credit facility and a
$950 million
committed receivables sales facility program. At times, availability under our committed receivables sales facility program may be less than $950 million based on receivables concentration limits and our outstanding eligible receivables balance. Our revolving credit facility expires in
May 2016
and our committed receivables sales facility program expires in
November 2012
. We also have a commercial paper program of up to
$1.5 billion
, backed by the revolving credit facility.
We had no outstanding borrowings from the commercial paper program and no outstanding balance under the committed receivables sales facility program at June 30, 2012 and 2011. We also had no outstanding balance under the revolving credit facility at
June 30, 2012
and
2011
, except for
$44 million
of standby letters of credit in each fiscal year. Our revolving credit and committed receivables sales facility programs require us to maintain a consolidated interest coverage ratio, as of any fiscal quarter end, of at least
4-to-1
and a consolidated leverage ratio of no more than
3.25-to-1
. As of
June 30, 2012
, we were in compliance with these financial covenants.
Held-to-Maturity Investments
We held high quality investment grade held-to-maturity fixed income debt securities with an amortized cost basis of
$72 million
and
$142 million
as of June 30, 2012 and 2011, respectively. These investments vary in maturity date, ranging from one to six months, and pay interest semi-annually.
Long-Term Obligations
As of
June 30, 2012
, we had total long-term obligations of
$2.9 billion
compared to
$2.5 billion
at
June 30, 2011
. In
May 2012
, we sold
$250 million
aggregate principal amount of fixed rate notes due
2017
with interest at
1.900%
per year (“
1.900%
Notes”) in a registered offering. The
1.900%
Notes mature on
June 15, 2017
. In
May 2012
, we also sold
$250 million
aggregate principal amount of fixed rate notes due
2022
with interest at
3.200%
per year (“
3.200%
Notes”) in a registered offering. The
3.200%
Notes mature on
June 15, 2022
. These notes are unsecured and unsubordinated obligations and rank equally in right of payment with all of our existing and future unsecured and unsubordinated indebtedness. We used the proceeds to repay
$206 million
of our
5.65%
Notes due
June 15, 2012
. The remaining net proceeds will be used for general corporate purposes, which may include repayment of other indebtedness, including
$300 million
aggregate principal of our
5.50%
Notes due
June 15, 2013
.
19
Capital Expenditures
Capital expenditures during fiscal
2012
,
2011
and
2010
were
$263 million
,
$291 million
and
$260 million
, respectively, primarily related to information technology projects.
We expect capital expenditures in fiscal 2013 to be less than in fiscal 2012. We anticipate that we will be able to fund these expenditures through cash provided by operating activities. Fiscal 2013 capital expenditures will be largely focused on information technology projects.
Dividends
During fiscal
2012
, we paid quarterly dividends of
$0.215
per share, or
$0.86
per share on an annualized basis, an increase of 10 percent from fiscal 2011. On May 2, 2012, our Board of Directors approved a 10 percent increase in our quarterly dividend to $0.2375 per share, or $0.95 per share on an annualized basis, payable on July 15, 2012 to shareholders of record on July 1, 2012.
On August 8, 2012, our Board of Directors approved our 112th consecutive regular quarterly dividend, payable to shareholders of record on October 1, 2012.
Share Repurchases
During fiscal
2012
and 2011, we repurchased
$450 million
and $250 million of our Common Shares, respectively. At June 30, 2012, we had $300 million remaining under our then current repurchase authorization which was to expire November 30, 2013.
On August 8, 2012, our Board of Directors approved a new $750 million share repurchase program, which expires August 31, 2015, and canceled the share repurchase program which was to expire November 30, 2013.
Interest Rate and Currency Risk Management
We use foreign currency forward contracts, interest rate swaps and commodity swaps to manage our exposure to cash flow variability. We also use foreign currency forward contracts to protect the value of our existing foreign currency assets and liabilities and interest rate swaps to protect the value of our debt. See Item 7A below as well as Notes 1 and 11 of “Notes to Consolidated Financial Statements” for information regarding the use of financial instruments and derivatives as well as foreign currency, interest rate and commodity exposures.
Contractual Obligations
As of
June 30, 2012
, our contractual obligations, including estimated payments due by period, are as follows:
|
(in millions)
|
2013
|
2014 to 2015
|
2016 to 2017
|
There-after
|
Total
|
||||||||||||||
|
Long-term debt and short-term borrowings (1)
|
$
|
474
|
|
$
|
526
|
|
$
|
792
|
|
$
|
1,078
|
|
$
|
2,870
|
|
||||
|
Interest on long-term debt
|
106
|
|
184
|
|
143
|
|
205
|
|
638
|
|
|||||||||
|
Capital lease obligations (2)
|
2
|
|
1
|
|
21
|
|
—
|
|
24
|
|
|||||||||
|
Other long-term liabilities (3)
|
3
|
|
2
|
|
—
|
|
—
|
|
5
|
|
|||||||||
|
Operating leases (4)
|
83
|
|
112
|
|
60
|
|
45
|
|
300
|
|
|||||||||
|
Purchase obligations (5)
|
175
|
|
84
|
|
6
|
|
5
|
|
270
|
|
|||||||||
|
Total contractual obligations
|
$
|
843
|
|
$
|
909
|
|
$
|
1,022
|
|
$
|
1,333
|
|
$
|
4,107
|
|
||||
|
(1)
|
Represents maturities of our long-term debt obligations and other short-term borrowings excluding capital lease obligations described below. See Note 7 of “Notes to Consolidated Financial Statements” for further information.
|
|
(2)
|
Represents maturities of our capital lease obligations included within long-term debt on our consolidated balance sheet.
|
|
(3)
|
Represents cash outflows by period for certain of our long-term liabilities in which cash outflows could be reasonably estimated. Certain long-term liabilities, such as unrecognized tax benefits and deferred taxes, including those related to the audits of fiscal 2003 through 2005, have been excluded from the table above because of the inherent uncertainty of the underlying tax positions or because of the inability to reasonably estimate the timing of any cash outflows. See Note 8 of “Notes to Consolidated Financial Statements” for further discussion of income taxes.
|
|
(4)
|
Represents minimum rental payments and the related estimated future interest payments for operating leases having initial or remaining non-cancelable lease terms as described in Note 9 of “Notes to Consolidated Financial Statements.”
|
|
(5)
|
Purchase obligations are defined as an agreement to purchase goods or services that is enforceable and legally binding and specifying all significant terms, including the following: fixed or minimum quantities to be purchased; fixed, minimum or variable price provisions; and approximate timing of the transaction. The purchase obligation amounts disclosed above represent estimates of the minimum for which we are obligated and the time period in which cash outflows will occur. Purchase orders and authorizations to purchase that involve no firm commitment from either party are excluded from the above table. In addition, contracts that can be unilaterally canceled with no termination fee or with proper notice are excluded from our total purchase obligations except for the amount of the termination fee or the minimum amount of goods that must be purchased during the requisite notice period.
|
Recent Financial Accounting Standards
See Note 1 of “Notes to Consolidated Financial Statements” for a discussion of recent financial accounting standards.
20
Critical Accounting Policies and Sensitive Accounting Estimates
Critical accounting policies are those accounting policies that (i) can have a significant impact on our financial condition and results of operations for continuing operations and (ii) require use of complex and subjective estimates based upon past experience and management’s judgment. Other companies applying reasonable judgment to the same facts and circumstances could develop different estimates. Because estimates are inherently uncertain, actual results may differ. In this section, we describe the policies applied in preparing our consolidated financial statements that management believes are the most dependent on estimates and assumptions. For additional accounting policies, see Note 1 of “Notes to Consolidated Financial Statements.”
Allowance for Doubtful Accounts
Trade receivables are primarily comprised of amounts owed to us through our distribution businesses and are presented net of an allowance for doubtful accounts of $126 million and $134 million at June 30, 2012 and 2011, respectively. We also provide financing to various customers. Such financing arrangements range from 90 days to 10 years at interest rates that generally are subject to fluctuation. Interest income on these arrangements is recognized as it is earned. Financings may be collateralized, guaranteed by third parties or unsecured. Finance notes and accrued interest receivables are recorded net of an allowance for doubtful accounts of $16 million and $15 million at June 30, 2012 and 2011, respectively, and are included in other assets (current portion is included in prepaid expenses and other). We must use judgment when deciding whether to extend credit and when estimating the required allowance for doubtful accounts.
The allowance for doubtful accounts includes portfolio and specific reserves. We determine the appropriate allowance by reviewing accounts receivable aging, industry trends, customer financial strength and credit standing, historical write-off trends and payment history. We also regularly evaluate how changes in economic conditions may affect credit risks.
Our methodology for estimating the allowance for doubtful accounts is assessed annually based on historical losses and economic, business and market trends. In addition, the allowance is reviewed quarterly and updated if appropriate. We may adjust the allowance for doubtful accounts if changes in customers’ financial condition or general economic conditions make defaults more frequent or severe.
The following table gives information regarding the allowance for doubtful accounts over the past three fiscal years.
|
(in millions, except percentages)
|
2012
|
2011
|
2010
|
||||||||
|
Allowance for doubtful accounts
|
$
|
143
|
|
$
|
150
|
|
$
|
140
|
|
||
|
Allowance as a percentage of customer receivables
|
2.2
|
%
|
2.4
|
%
|
2.6
|
%
|
|||||
|
Allowance as a percentage of revenue
|
0.13
|
%
|
0.15
|
%
|
0.14
|
%
|
|||||
|
Reduction to allowance for customer deductions and write-offs
|
30
|
|
22
|
|
9
|
|
|||||
|
Addition to Allowance
|
22
|
|
27
|
|
27
|
|
|||||
A hypothetical 0.1 percent increase or decrease in the reserve as a percentage of trade receivables, sales-type leases and finance notes receivables at
June 30, 2012
, would result in an increase or decrease in bad debt expense of $6 million.
We believe the reserve maintained and expenses recorded in fiscal
2012
are appropriate. At this time, we are not aware of any analytical findings or customer issues that might lead to a significant future increase in the allowance for doubtful accounts as a percentage of net revenue.
Inventories
A substantial portion of inventories (
69
percent and
70
percent at
June 30, 2012
, and
2011
, respectively) are stated at the lower of cost, using the LIFO method, or market. These are primarily merchandise inventories at the core pharmaceutical distribution facilities within our Pharmaceutical segment. The LIFO impact on the consolidated statements of earnings in a given year depends on pharmaceutical price appreciation and the level of inventory. Prices for branded pharmaceuticals tend to rise, which results in an increase in cost of products sold, whereas prices for generic pharmaceuticals tend to decline, which results in a decrease in cost of products sold.
The LIFO method presumes that the most recent inventory purchases are the first items sold, so LIFO helps us better match current costs and revenue. Using LIFO, if branded pharmaceutical inventory levels decline, the result generally will be a decrease in future cost of products sold: prices for branded pharmaceuticals tend to rise over time, so our older inventory is held at a lower cost. Conversely, if generic pharmaceutical inventory levels decline, future cost of products sold generally will increase: prices for generic pharmaceuticals tend to decline over time, so our older inventory is held at a higher cost. We believe that the average cost method of inventory valuation reasonably approximates the current cost of replacing inventory within the core pharmaceutical distribution facilities. Accordingly, the LIFO reserve is the difference between (a) inventory at the lower of LIFO cost or market and (b) inventory at replacement cost determined using the average cost method of inventory valuation.
The remaining inventory is stated at the lower of cost, using the FIFO (“first in, first out”) method, or market. If we had used the average cost method of inventory valuation for all inventory within the Pharmaceutical distribution facilities, the value of our inventories would not have changed in fiscal
2012
or
2011
. Primarily because prices for our generic pharmaceutical inventories have continued to decline, inventories at LIFO were
$72 million
and
$8 million
higher than the average cost value as of
June 30, 2012
, and
2011
, respectively. We do not record inventories in excess of replacement cost. As such, we did not record any changes in our LIFO reserve in fiscal
2012
and
2011
.
Inventories recorded on the consolidated balance sheets are net of reserves for excess and obsolete inventory, which were
$37 million
and
$40 million
at
June 30, 2012
, and
2011
, respectively. We determine reserves for inventory obsolescence based on historical experience, sales trends, specific categories of inventory and age of on-hand inventory. If actual conditions are less favorable than our assumptions, additional inventory reserves may be required.
21
Business Combinations
The purchase price of an acquired business is allocated to the assets acquired and liabilities assumed based on their estimated fair values as of the date of acquisition, including identifiable intangible assets. The excess of the purchase price over the estimated fair value of the net tangible and identifiable intangible assets acquired is recorded as goodwill. We base the fair values of identifiable intangible assets on detailed valuations that require management to make significant judgments, estimates and assumptions. Critical estimates and assumptions include: expected future cash flows for trade names, customer relationships and other identifiable intangible assets; discount rates that reflect the risk factors associated with future cash flows; and estimates of useful lives. When an acquisition involves contingent consideration, we recognize a liability equal to the fair value of the contingent consideration obligation at the date of acquisition. The estimate of fair value of a contingent consideration obligation requires subjective assumptions to be made regarding future business results, discount rates and probabilities assigned to various potential business result scenarios. Subsequent revisions to these assumptions could materially change the estimate of the fair value of contingent consideration obligations and therefore could materially affect our financial position or results of operations. See Note 2 of the “Notes to Consolidated Financial Statements” for additional information regarding our acquisitions.
Goodwill and Other Intangibles
Purchased goodwill and intangible assets with indefinite lives are not amortized, but instead are tested for impairment annually or when indicators of impairment exist. Intangible assets with finite lives, primarily customer relationships, trademarks and patents, and non-compete agreements, are amortized over their useful lives.
Goodwill impairment testing involves a comparison of the estimated fair value of reporting units to the respective carrying amount. If estimated fair value exceeds the carrying amount, then no impairment exists. If the carrying amount exceeds the estimated fair value, then a second step is performed to determine the amount of impairment, if any, which would be recorded as an expense to our results of operations. Application of goodwill impairment testing involves judgment, including the identification of reporting units and estimating the fair value of each reporting unit. A reporting unit is defined as an operating segment or one level below an operating segment (also known as a component).
We have two operating segments which are the same as our reportable segments: Pharmaceutical and Medical. These operating segments are comprised of divisions (components), for which discrete financial information is available. Components are aggregated into reporting units for purposes of goodwill impairment testing to the extent that they share similar economic characteristics. Our reporting units are: Pharmaceutical operating segment (excluding our nuclear and pharmacy services division and Cardinal Health China - Pharmaceutical division); nuclear and pharmacy services division; Cardinal Health China - Pharmaceutical division; and Medical operating segment.
Fair value can be determined using market, income or cost-based approaches. Our determination of estimated fair value of the reporting units is based on a combination of the income-based and market-
based approaches. Under the market-based approach, we determine fair value by comparing our reporting units to similar businesses or guideline companies whose securities are actively traded in public markets. Under the income-based approach, we use a discounted cash flow model in which cash flows anticipated over several periods, plus a terminal value at the end of that time horizon, are discounted to their present value using an appropriate rate of return. To further confirm the fair value, we compare the aggregate fair value of our reporting units to our market capitalization. The use of alternate estimates and assumptions or changes in the industry or peer groups could materially affect the determination of fair value for each reporting unit and potentially result in goodwill impairment.
We performed annual impairment testing in fiscal
2012
,
2011
and
2010
and concluded that there were no impairments of goodwill as the fair value of each reporting unit exceeded its carrying value. For our fiscal 2012 testing, we elected to bypass the optional qualitative assessment, as permitted by the amended accounting guidance adopted during the year. See Note 6 of the “Notes to Consolidated Financial Statements” for additional information regarding goodwill and other intangible assets.
If we alter our impairment testing by increasing the discount rate in the discounted cash flow analysis by 1 percent, there still would not be any impairment indicated for any of our reporting units for fiscal
2012
,
2011
or
2010
.
Vendor Reserves
In the ordinary course of business, our vendors may dispute deductions taken against payments otherwise due to them or assert other billing disputes. These disputed transactions are researched and resolved based upon our policy and findings of the research performed. At any given time, there are outstanding items in various stages of research and resolution. In determining appropriate reserves for areas of exposure with our vendors, we assess historical experience and current outstanding claims. We have established various levels of reserves based on the type of claim and status of review. Though the transaction types are relatively consistent, we periodically refine our estimate methodology by updating the reserve estimate percentages to reflect actual historical experience. Changes to the estimate percentages affect the cost of products sold in the period in which the change was made.
Vendor reserves were
$55 million
and
$41 million
at
June 30, 2012
and
2011
, respectively. Approximately 72 percent of the vendor reserve at the end of fiscal
2012
pertained to the Pharmaceutical segment compared to 65 percent at the end of fiscal
2011
. The reserve balance will fluctuate due to variations of outstanding claims from period to period, timing of settlements, and specific vendor issues, such as bankruptcies.
The ultimate outcome of specific claims may be different than our original estimate and may require adjustment. We believe, however, that reserves recorded for such disputes are adequate based upon current facts and circumstances.
22
Provision for Income Taxes
Our income tax expense, deferred tax assets and liabilities, and unrecognized tax benefits reflect management’s assessment of estimated future taxes to be paid on items in the consolidated financial statements.
Deferred income taxes arise from temporary differences between financial reporting and tax reporting bases of assets and liabilities, as well as net operating loss and tax credit carryforwards for tax purposes. The following table presents information about our tax position:
|
(in millions)
|
2012
|
2011
|
|||||
|
Net deferred income tax assets
|
$
|
480
|
|
$
|
543
|
|
|
|
Net deferred income tax liabilities
|
1,462
|
|
1,352
|
|
|||
|
Net loss and credit carryforwards included in net deferred income tax assets
|
120
|
|
199
|
|
|||
|
Net valuation allowance against deferred tax assets (1)
|
86
|
|
158
|
|
|||
|
(1)
|
This valuation allowance primarily relates to federal, state and international loss carryforwards for which the ultimate realization of future benefits is uncertain.
|
Expiring carryforwards and the required valuation allowances are adjusted annually. After applying the valuation allowances, we do not anticipate any limitations on our use of any of the other net deferred income tax assets described above.
We believe that our estimates for the valuation allowances against deferred tax assets and unrecognized tax benefits are appropriate based on current facts and circumstances. However, other companies applying reasonable judgment to the same facts and circumstances could develop different estimates. The amount we ultimately pay when matters are resolved may differ from the amounts accrued.
Tax benefits from uncertain tax positions are recognized when it is more likely than not that the position will be sustained upon examination, including resolutions of any related appeals or litigation processes, based on the technical merits. The amount recognized is measured as the largest amount of tax benefit that is greater than 50 percent likely of being realized upon settlement. See Note 8 of “Notes to Consolidated Financial Statements” for a detailed disclosure of the unrecognized tax benefits.
If any of our assumptions or estimates were to change, an increase or decrease in our effective tax rate by 1 percent on earnings before income taxes and discontinued operations would have caused income tax expense to increase or decrease by $17 million for fiscal
2012
.
Share-Based Compensation
All share-based payments to employees, including grants of options, are recognized in the consolidated statements of earnings based on the grant date fair value of the award. The fair value of stock options is determined using a lattice valuation model. We believe the lattice model provides reasonable estimates because it has the ability to take into account employee exercise patterns based on changes in our stock price and other variables and it provides for a range of input assumptions.
We analyzed historical data to estimate option exercise behaviors and employee terminations to be used within the lattice model. The expected life of the options granted was calculated from the option valuation model and represents the length of time in years that the options granted are expected to be outstanding. Expected volatilities are based on implied volatility from traded options on our Common Shares and historical volatility over a period of time commensurate with the contractual term of the option grant (up to
ten years
). As required, the forfeiture estimates will be adjusted to reflect actual forfeitures when an award vests. The actual forfeitures in future reporting periods could be higher or lower than our current estimates. See Note 16 of "Notes to Consolidated Financial Statements" for additional information regarding share-based compensation.
23
Our businesses are exposed to cash flow and earnings fluctuations as a result of certain market risks. These market risks primarily relate to foreign exchange, interest rate and commodity price related changes. We maintain a hedging program to manage volatility related to these market exposures which employs operational, economic and derivative financial instruments in order to mitigate risk. See Notes 1 and 11 of “Notes to Consolidated Financial Statements” for further discussion regarding our use of derivative instruments.
Foreign Exchange Rate Sensitivity
By nature of our global operations, our businesses are exposed to cash flow and earnings fluctuations resulting from foreign exchange rate variation. These exposures are transactional and translational in nature. Principal drivers of this foreign exchange exposure include the Canadian dollar, Chinese renminbi, European euro, Japanese yen, Malaysian ringgit, Mexican peso, and Thai baht.
Transactional Exposure
Our businesses’ transactional exposure arises from the purchase and sale of goods and services in currencies other than our functional currency or the functional currency of our subsidiaries. As part of our risk management program, at the end of each fiscal year we perform a sensitivity analysis on our forecasted transactional exposure for the upcoming fiscal year. The fiscal
2012
and fiscal
2011
analyses utilized a currency portfolio model, encompassing both implied volatility and historical correlation to estimate the net potential gain or loss. These analyses included the estimated impact of our hedging program, which mitigates our transactional exposure. At each of
June 30, 2012
and
2011
, we had hedged approximately 45 percent of our businesses’ transactional exposures. The following table summarizes the analysis as it relates to our transactional exposure and the impact of a hypothetical 10 percent increase or decrease:
|
(in millions)
|
2012
|
2011
|
|||||
|
Net estimated transactional exposure
|
$
|
357
|
|
$
|
374
|
|
|
|
Sensitivity gain/loss
|
$
|
36
|
|
$
|
37
|
|
|
|
Estimated offsetting impact of hedges
|
(11
|
)
|
(14
|
)
|
|||
|
Estimated net gain/loss
|
$
|
25
|
|
$
|
23
|
|
|
Translational Exposure
We have exposure related to the translation of financial statements of our foreign operations into U.S. dollars, our functional currency. We perform a similar analysis as described above related to this translational exposure. We do not typically hedge any of our translational exposure and no hedging impact was included in our analysis at
June 30, 2012
and
2011
. The following table summarizes our translational exposure and the impact of a hypothetical 10 percent strengthening or weakening in the U.S. dollar:
|
(in millions)
|
2012
|
2011
|
|||||
|
Net estimated translational exposure
|
$
|
63
|
|
$
|
54
|
|
|
|
Sensitivity gain/loss
|
$
|
6
|
|
$
|
5
|
|
|
Interest Rate Sensitivity
We are exposed to changes in interest rates primarily as a result of our borrowing and investing activities to maintain liquidity and fund business operations. The nature and amount of our long-term and short-term debt can be expected to fluctuate as a result of business requirements, market conditions and other factors. Our policy is to manage exposures to interest rates using a mix of fixed and floating rate debt as deemed appropriate by management. We utilize interest rate swap instruments to mitigate our exposure to interest rate movements.
As part of our risk management program, we perform an annual sensitivity analysis on our forecasted exposure to interest rates for the following fiscal year. This analysis assumes a hypothetical 10 percent change in interest rates. At
June 30, 2012
and
2011
, the potential increase or decrease in net annual interest expense under this analysis as a result of this hypothetical change was $2 million and $1 million, respectively.
Commodity Price Sensitivity
We are exposed to market price changes for commodities, including oil-based resins, cotton, latex, and diesel fuel. We typically purchase raw materials at market prices and some finished goods at prices based in part on a commodity price index. As part of our risk management program, we perform sensitivity analysis on our forecasted commodity exposure for the following fiscal year. Our forecasted commodity exposure as of
June 30, 2012
decreased from the prior year primarily as a result of commodity prices and changes in purchasing volumes.
At
June 30, 2012
and
2011
, we had hedged a portion of these commodity exposures (see Note 11 of “Notes to Consolidated Financial Statements” for further discussion). The table below summarizes our analysis of these forecasted commodity exposures and a hypothetical 10 percent fluctuation in commodity prices as of
June 30, 2012
and
2011
:
|
(in millions)
|
2012
|
2011
|
|||||
|
Estimated commodity exposure
|
$
|
403
|
|
$
|
473
|
|
|
|
Sensitivity gain/loss
|
$
|
40
|
|
$
|
47
|
|
|
|
Estimated offsetting impact of hedges
|
(1
|
)
|
(2
|
)
|
|||
|
Estimated net gain/loss
|
$
|
39
|
|
$
|
45
|
|
|
We have additional exposure to commodities through the purchase of finished goods and various other energy-related commodities, including natural gas and electricity through our normal course of business where our contracts are not directly tied to a commodity index. We believe our total gross range of exposure to commodities, including the items listed in the table above, is $500 million to $600 million as of
June 30, 2012
.
24
|
Consolidated Financial Statements and Schedule:
|
|
25
Report of Independent Registered Public Accounting Firm
The Board of Directors and Shareholders of Cardinal Health, Inc.
We have audited the accompanying consolidated balance sheets of Cardinal Health, Inc. and subsidiaries as of
June 30, 2012
and
2011
, and the related consolidated statements of earnings, shareholders’ equity, and cash flows for each of the three years in the period ended
June 30, 2012
. Our audits also included the financial statement schedule listed in the Index at Item 15(a)(2). These financial statements and schedule are the responsibility of the Company’s management. Our responsibility is to express an opinion on these financial statements and schedule based on our audits.
We conducted our audits in accordance with the standards of the Public Company Accounting Oversight Board (United States). Those standards require that we plan and perform the audit to obtain reasonable assurance about whether the financial statements are free of material misstatement. An audit includes examining, on a test basis, evidence supporting the amounts and disclosures in the financial statements. An audit also includes assessing the accounting principles used and significant estimates made by management, as well as evaluating the overall financial statement presentation. We believe that our audits provide a reasonable basis for our opinion.
In our opinion, the financial statements referred to above present fairly, in all material respects, the consolidated financial position of Cardinal Health, Inc. and subsidiaries at
June 30, 2012
and
2011
, and the consolidated results of their operations and their cash flows for each of the three years in the period ended
June 30, 2012
, in conformity with U.S. generally accepted accounting principles. Also, in our opinion, the related financial statement schedule, when considered in relation to the basic financial statements taken as a whole, present fairly in all material respects the information set forth therein.
We also have audited, in accordance with the standards of the Public Company Accounting Oversight Board (United States), Cardinal Health, Inc. and subsidiaries' internal control over financial reporting as of
June 30, 2012
, based on criteria established in Internal Control-Integrated Framework issued by the Committee of Sponsoring Organizations of the Treadway Commission and our report dated
August 22, 2012
expressed an unqualified opinion thereon.
|
/s/ Ernst & Young LLP
|
|
Ernst & Young LLP
|
|
Columbus, Ohio
|
|
August 22, 2012
|
26
Cardinal Health, Inc. and Subsidiaries
|
(in millions, except per Common Share amounts)
|
2012
|
2011
|
2010
|
||||||||
|
Revenue
|
$
|
107,552
|
|
$
|
102,644
|
|
$
|
98,503
|
|
||
|
Cost of products sold
|
103,011
|
|
98,482
|
|
94,722
|
|
|||||
|
Gross margin
|
4,541
|
|
4,162
|
|
3,781
|
|
|||||
|
Operating expenses:
|
|||||||||||
|
Distribution, selling, general and administrative expenses
|
2,677
|
|
2,528
|
|
2,397
|
|
|||||
|
Restructuring and employee severance
|
21
|
|
15
|
|
91
|
|
|||||
|
Acquisition-related costs
|
33
|
|
90
|
|
19
|
|
|||||
|
Impairments and loss on disposal of assets
|
21
|
|
9
|
|
29
|
|
|||||
|
Litigation (recoveries)/charges, net
|
(3
|
)
|
6
|
|
(62
|
)
|
|||||
|
Operating earnings
|
1,792
|
|
1,514
|
|
1,307
|
|
|||||
|
Other income, net
|
(1
|
)
|
(22
|
)
|
(13
|
)
|
|||||
|
Interest expense, net
|
95
|
|
93
|
|
113
|
|
|||||
|
Loss on extinguishment of debt
|
—
|
|
—
|
|
40
|
|
|||||
|
Gain on sale of investment in CareFusion
|
—
|
|
(75
|
)
|
(45
|
)
|
|||||
|
Earnings before income taxes and discontinued operations
|
1,698
|
|
1,518
|
|
1,212
|
|
|||||
|
Provision for income taxes
|
628
|
|
552
|
|
625
|
|
|||||
|
Earnings from continuing operations
|
1,070
|
|
966
|
|
587
|
|
|||||
|
Earnings/(loss) from discontinued operations, net of tax
|
(1
|
)
|
(7
|
)
|
55
|
|
|||||
|
Net earnings
|
$
|
1,069
|
|
$
|
959
|
|
$
|
642
|
|
||
|
Basic earnings/(loss) per Common Share:
|
|||||||||||
|
Continuing operations
|
$
|
3.10
|
|
$
|
2.77
|
|
$
|
1.64
|
|
||
|
Discontinued operations
|
—
|
|
(0.02
|
)
|
0.15
|
|
|||||
|
Net basic earnings per Common Share
|
$
|
3.10
|
|
$
|
2.75
|
|
$
|
1.79
|
|
||
|
Diluted earnings/(loss) per Common Share:
|
|||||||||||
|
Continuing operations
|
$
|
3.06
|
|
$
|
2.74
|
|
$
|
1.62
|
|
||
|
Discontinued operations
|
—
|
|
(0.02
|
)
|
0.15
|
|
|||||
|
Net diluted earnings per Common Share
|
$
|
3.06
|
|
$
|
2.72
|
|
$
|
1.77
|
|
||
|
Weighted average number of Common Shares outstanding:
|
|||||||||||
|
Basic
|
345
|
|
349
|
|
359
|
|
|||||
|
Diluted
|
349
|
|
353
|
|
361
|
|
|||||
27
Cardinal Health, Inc. and Subsidiaries
|
(in millions)
|
June 30,
2012 |
June 30,
2011 |
|||||
|
Assets
|
|||||||
|
Current assets:
|
|||||||
|
Cash and equivalents
|
$
|
2,274
|
|
$
|
1,929
|
|
|
|
Trade receivables, net
|
6,355
|
|
6,156
|
|
|||
|
Inventories
|
7,864
|
|
7,334
|
|
|||
|
Prepaid expenses and other
|
1,017
|
|
897
|
|
|||
|
Total current assets
|
17,510
|
|
16,316
|
|
|||
|
Property and equipment, net
|
1,551
|
|
1,512
|
|
|||
|
Goodwill and other intangibles, net
|
4,392
|
|
4,259
|
|
|||
|
Other
|
807
|
|
759
|
|
|||
|
Total assets
|
$
|
24,260
|
|
$
|
22,846
|
|
|
|
Liabilities and Shareholders’ Equity
|
|||||||
|
Current liabilities:
|
|||||||
|
Accounts payable
|
$
|
11,726
|
|
$
|
11,332
|
|
|
|
Current portion of long-term obligations and other short-term borrowings
|
476
|
|
327
|
|
|||
|
Other accrued liabilities
|
1,972
|
|
1,711
|
|
|||
|
Total current liabilities
|
14,174
|
|
13,370
|
|
|||
|
Long-term obligations, less current portion
|
2,418
|
|
2,175
|
|
|||
|
Deferred income taxes and other liabilities
|
1,424
|
|
1,452
|
|
|||
|
Shareholders’ equity:
|
|||||||
|
Preferred Shares, without par value:
|
|||||||
|
Authorized—
500 thousand
shares, Issued—
none
|
—
|
|
—
|
|
|||
|
Common Shares, without par value:
|
|||||||
|
Authorized—
755 million
shares, Issued—
364 million
shares at
June 30, 2012
and 2011
|
2,930
|
|
2,898
|
|
|||
|
Retained earnings
|
4,093
|
|
3,331
|
|
|||
|
Common Shares in treasury, at cost:
21 million
shares and 12 million shares at
June 30, 2012
and 2011, respectively
|
(816
|
)
|
(457
|
)
|
|||
|
Accumulated other comprehensive income
|
37
|
|
77
|
|
|||
|
Total shareholders’ equity
|
6,244
|
|
5,849
|
|
|||
|
Total liabilities and shareholders’ equity
|
$
|
24,260
|
|
$
|
22,846
|
|
|
28
Cardinal Health, Inc. and Subsidiaries
Consolidated Statements of Shareholders' Equity
|
|
Common Shares
|
Treasury Shares
|
Accumulated
Other
Comprehensive
Income/(Loss)
|
Total
Shareholders’
Equity
|
|||||||||||||||||||||
|
(in millions)
|
Shares
Issued
|
Amount
|
Retained
Earnings
|
Shares
|
Amount
|
||||||||||||||||||||
|
Balance at June 30, 2009
|
364
|
|
$
|
3,032
|
|
$
|
5,954
|
|
(4
|
)
|
$
|
(343
|
)
|
$
|
82
|
|
$
|
8,725
|
|
||||||
|
Comprehensive income:
|
|
|
|
|
|
|
|
||||||||||||||||||
|
Net earnings
|
|
|
642
|
|
|
|
|
642
|
|
||||||||||||||||
|
Foreign currency translation adjustments
|
|
|
|
|
|
(97
|
)
|
(97
|
)
|
||||||||||||||||
|
Unrealized gain on derivatives, net of tax
|
|
|
|
|
|
24
|
|
24
|
|
||||||||||||||||
|
Unrealized gain on investment in CareFusion, net of tax
|
|
|
|
|
|
61
|
|
61
|
|
||||||||||||||||
|
Total comprehensive income
|
|
|
|
|
|
|
630
|
|
|||||||||||||||||
|
Employee stock plans activity, including tax impact of $16 million
|
—
|
|
(142
|
)
|
|
4
|
|
262
|
|
|
120
|
|
|||||||||||||
|
Treasury shares acquired
|
|
|
|
|
(7
|
)
|
(250
|
)
|
|
(250
|
)
|
||||||||||||||
|
Dividends declared
|
|
|
(260
|
)
|
|
|
|
(260
|
)
|
||||||||||||||||
|
Non-cash dividend issued in connection with Spin-off
|
|
|
(3,689
|
)
|
|
|
|
(3,689
|
)
|
||||||||||||||||
|
Balance at June 30, 2010
|
364
|
|
2,890
|
|
2,647
|
|
(7
|
)
|
(331
|
)
|
70
|
|
5,276
|
|
|||||||||||
|
Comprehensive income:
|
|
|
|
|
|
|
|
||||||||||||||||||
|
Net earnings
|
|
|
959
|
|
|
|
|
959
|
|
||||||||||||||||
|
Foreign currency translation adjustments
|
|
|
|
|
|
72
|
|
72
|
|
||||||||||||||||
|
Unrealized loss on derivatives, net of tax
|
|
|
|
|
|
(4
|
)
|
(4
|
)
|
||||||||||||||||
|
Reclassification of unrealized gain upon realization from sale of remaining investment in CareFusion, net of tax
|
|
|
|
|
|
(61
|
)
|
(61
|
)
|
||||||||||||||||
|
Total comprehensive income
|
|
|
|
|
|
|
966
|
|
|||||||||||||||||
|
Employee stock plans activity, including tax impact of $14 million
|
—
|
|
8
|
|
|
3
|
|
124
|
|
|
132
|
|
|||||||||||||
|
Treasury shares acquired
|
|
|
|
(8
|
)
|
(250
|
)
|
|
(250
|
)
|
|||||||||||||||
|
Dividends declared
|
|
|
(281
|
)
|
|
|
|
(281
|
)
|
||||||||||||||||
|
Other
|
|
|
6
|
|
|
|
|
6
|
|
||||||||||||||||
|
Balance at June 30, 2011
|
364
|
|
2,898
|
|
3,331
|
|
(12
|
)
|
(457
|
)
|
77
|
|
5,849
|
|
|||||||||||
|
Comprehensive income:
|
|
|
|
|
|
|
|
||||||||||||||||||
|
Net earnings
|
|
|
1,069
|
|
|
|
|
1,069
|
|
||||||||||||||||
|
Foreign currency translation adjustments
|
|
|
|
|
|
(34
|
)
|
(34
|
)
|
||||||||||||||||
|
Unrealized loss on derivatives, net of tax
|
|
|
|
|
|
(6
|
)
|
(6
|
)
|
||||||||||||||||
|
Total comprehensive income
|
|
|
|
|
|
|
1,029
|
|
|||||||||||||||||
|
Employee stock plans activity, including tax impact of $4 million
|
—
|
|
32
|
|
|
1
|
|
91
|
|
|
123
|
|
|||||||||||||
|
Treasury shares acquired
|
|
|
|
(10
|
)
|
(450
|
)
|
|
(450
|
)
|
|||||||||||||||
|
Dividends declared
|
|
|
(307
|
)
|
|
|
|
(307
|
)
|
||||||||||||||||
|
Balance at June 30, 2012
|
364
|
|
$
|
2,930
|
|
$
|
4,093
|
|
(21
|
)
|
$
|
(816
|
)
|
$
|
37
|
|
$
|
6,244
|
|
||||||
29
Cardinal Health, Inc. and Subsidiaries
|
(in millions)
|
2012
|
2011
|
2010
|
||||||||
|
Cash flows from operating activities:
|
|||||||||||
|
Net earnings
|
$
|
1,069
|
|
$
|
959
|
|
$
|
642
|
|
||
|
(Earnings)/loss from discontinued operations
|
1
|
|
7
|
|
(55
|
)
|
|||||
|
Earnings from continuing operations
|
1,070
|
|
966
|
|
587
|
|
|||||
|
Adjustments to reconcile earnings from continuing operations to net cash from operations:
|
|||||||||||
|
Depreciation and amortization
|
325
|
|
313
|
|
254
|
|
|||||
|
Loss on extinguishment of debt
|
—
|
|
—
|
|
40
|
|
|||||
|
Gain on sale of investment in CareFusion
|
—
|
|
(75
|
)
|
(45
|
)
|
|||||
|
Impairments and loss on disposal of assets
|
21
|
|
9
|
|
29
|
|
|||||
|
Share-based compensation
|
85
|
|
80
|
|
100
|
|
|||||
|
Provision for deferred income taxes
|
158
|
|
128
|
|
120
|
|
|||||
|
Provision for bad debts
|
22
|
|
27
|
|
27
|
|
|||||
|
Change in fair value of contingent consideration obligation
|
(71
|
)
|
(7
|
)
|
—
|
|
|||||
|
Change in operating assets and liabilities, net of effects from acquisitions:
|
|||||||||||
|
Decrease/(increase) in trade receivables
|
(129
|
)
|
(457
|
)
|
21
|
|
|||||
|
Decrease/(increase) in inventories
|
(495
|
)
|
(665
|
)
|
477
|
|
|||||
|
Increase in accounts payable
|
319
|
|
1,356
|
|
451
|
|
|||||
|
Other accrued liabilities and operating items, net
|
(129
|
)
|
(280
|
)
|
(74
|
)
|
|||||
|
Net cash provided by operating activities—continuing operations
|
1,176
|
|
1,395
|
|
1,987
|
|
|||||
|
Net cash provided by operating activities—discontinued operations
|
—
|
|
—
|
|
147
|
|
|||||
|
Net cash provided by operating activities
|
1,176
|
|
1,395
|
|
2,134
|
|
|||||
|
Cash flows from investing activities:
|
|||||||||||
|
Acquisition of subsidiaries, net of cash acquired
|
(174
|
)
|
(2,300
|
)
|
(32
|
)
|
|||||
|
Purchase of held-to-maturity securities and other investments
|
(35
|
)
|
(156
|
)
|
—
|
|
|||||
|
Additions to property and equipment
|
(263
|
)
|
(291
|
)
|
(260
|
)
|
|||||
|
Proceeds from divestitures and sale of property and equipment
|
3
|
|
3
|
|
158
|
|
|||||
|
Proceeds from sale of CareFusion common stock
|
—
|
|
706
|
|
271
|
|
|||||
|
Proceeds from maturities of held-to-maturity securities
|
92
|
|
10
|
|
—
|
|
|||||
|
Net cash provided by/(used in) investing activities—continuing operations
|
(377
|
)
|
(2,028
|
)
|
137
|
|
|||||
|
Net cash used in investing activities—discontinued operations
|
—
|
|
—
|
|
(10
|
)
|
|||||
|
Net cash provided by/(used in) investing activities
|
(377
|
)
|
(2,028
|
)
|
127
|
|
|||||
|
Cash flows from financing activities:
|
|||||||||||
|
Payment of contingent consideration
|
—
|
|
(10
|
)
|
—
|
|
|||||
|
Net change in short-term borrowings
|
13
|
|
46
|
|
—
|
|
|||||
|
Reduction of long-term obligations
|
(251
|
)
|
(229
|
)
|
(1,486
|
)
|
|||||
|
Proceeds from long-term obligations, net of issuance costs
|
496
|
|
495
|
|
—
|
|
|||||
|
Payment of premiums for debt extinguishment
|
—
|
|
—
|
|
(66
|
)
|
|||||
|
Proceeds from issuance of Common Shares
|
42
|
|
63
|
|
40
|
|
|||||
|
Tax disbursements from exercises of stock options
|
(4
|
)
|
(14
|
)
|
(16
|
)
|
|||||
|
Dividends on Common Shares
|
(300
|
)
|
(274
|
)
|
(253
|
)
|
|||||
|
Purchase of treasury shares
|
(450
|
)
|
(270
|
)
|
(230
|
)
|
|||||
|
Net cash used in financing activities—continuing operations
|
(454
|
)
|
(193
|
)
|
(2,011
|
)
|
|||||
|
Net cash provided by financing activities—discontinued operations
|
—
|
|
—
|
|
1,284
|
|
|||||
|
Net cash used in financing activities
|
(454
|
)
|
(193
|
)
|
(727
|
)
|
|||||
|
Net increase/(decrease) in cash and equivalents
|
345
|
|
(826
|
)
|
1,534
|
|
|||||
|
Cash and equivalents at beginning of year
|
1,929
|
|
2,755
|
|
1,221
|
|
|||||
|
Cash and equivalents at end of year
|
$
|
2,274
|
|
$
|
1,929
|
|
$
|
2,755
|
|
||
|
Supplemental information:
|
|||||||||||
|
Cash payments for interest
|
$
|
118
|
|
$
|
116
|
|
$
|
158
|
|
||
|
Cash payments for income taxes
|
$
|
513
|
|
$
|
588
|
|
$
|
514
|
|
||
|
Non-cash investing and financing transactions for:
|
|||||||||||
|
Retained investment in CareFusion at date of Spin-Off
|
$
|
—
|
|
$
|
—
|
|
$
|
863
|
|
||
|
Non-cash dividend in connection with Spin-Off
|
$
|
—
|
|
$
|
—
|
|
$
|
3,689
|
|
||
The accompanying notes are an integral part of these consolidated statements.
30
Cardinal Health, Inc. and Subsidiaries
Notes to Consolidated Financial Statements
1. Basis of Presentation and Summary of Significant Accounting Policies
Cardinal Health, Inc. is a healthcare services company providing pharmaceutical and medical products and services that help pharmacies, hospitals, surgery centers, physician offices and other healthcare providers focus on patient care while reducing costs, enhancing efficiency and improving quality. References to “we”, “our” and similar pronouns in these consolidated financial statements are to Cardinal Health, Inc. and its majority-owned and controlled subsidiaries unless the context otherwise requires.
Our fiscal year ends on June 30. References to fiscal
2012
,
2011
and
2010
in these consolidated financial statements are to the fiscal years ended June 30,
2012
,
2011
and
2010
, respectively.
Basis of Presentation
Our consolidated financial statements include the accounts of all majority-owned and controlled subsidiaries, and all significant intercompany transactions and amounts have been eliminated. To conform to the current year presentation certain prior year balances have been reclassified. The results of businesses acquired or disposed of are included in the consolidated financial statements from the effective date of the acquisition or up to the date of disposal, respectively.
Reclassification
As announced on August 4, 2011, we changed our definition of segment profit to exclude the amortization of acquisition-related intangible assets and revised the prior period segment profit disclosures accordingly. These costs also were reclassified from SG&A expenses to acquisition-related costs on the consolidated statements of earnings. All comparative prior period information has been reclassified and there was no impact to operating earnings or net earnings. See Notes 2 and 6 for further information regarding acquisition-related costs and Note 15 for further information regarding segment profit.
Use of Estimates
Our consolidated financial statements are prepared in accordance with accounting principles generally accepted in the United States (“GAAP”). The preparation of financial statements in accordance with GAAP requires us to make estimates, judgments and assumptions that affect the amounts reported in the consolidated financial statements and accompanying notes. Estimates, judgments and assumptions are used in the accounting and disclosure related to, among other items, allowance for doubtful accounts, inventory valuation, business combinations, goodwill and intangible asset impairment, vendor reserves, share-based compensation, and income taxes. Actual amounts could ultimately differ from these estimated amounts.
Spin-Off of CareFusion Corporation
Effective August 31, 2009, we separated our clinical and medical products businesses through a distribution to our shareholders of
81
percent of the then outstanding common stock of CareFusion and
retained the remaining
41 million
shares of CareFusion common stock (the “Spin-Off”). During fiscal
2011
and
2010
, we disposed of
30 million
and
11 million
shares of CareFusion common stock, respectively. While we are a party to a separation agreement and various other agreements relating to the separation, we have determined that we have no significant continuing involvement in the operations of CareFusion. Accordingly, the operating results of CareFusion are presented within discontinued operations for all periods presented.
Our Relationship with CareFusion
On July 22, 2009, we entered into a separation agreement with CareFusion to effect the Spin-Off and provide a framework for our relationship with CareFusion after the Spin-Off. In addition, on August 31, 2009, we entered into a transition services agreement, a tax matters agreement and an accounts receivable factoring agreement with CareFusion, among other agreements. These agreements, including the separation agreement, provide for allocation of assets, employees, liabilities, and obligations (including investments, property and employee benefits; and tax-related assets and liabilities) attributable to periods prior to, at and after the Spin-Off and govern certain relationships between CareFusion and us after the Spin-Off.
Under the transition services agreement, during fiscal
2012
,
2011
and
2010
, we recognized
$3 million
,
$65 million
and
$99 million
, respectively, in transition service fee income.
Under the tax matters agreement, CareFusion is obligated to indemnify us for certain tax exposures and transaction taxes prior to the Spin-Off. The indemnification receivable was
$265 million
and
$264 million
at
June 30, 2012
and
2011
, respectively, and is included in other long-term assets in the consolidated balance sheets.
Under the accounts receivable factoring agreement we purchased
$460 million
and
$606 million
of CareFusion trade receivables during fiscal
2011
and
2010
, respectively. The accounts receivable factoring arrangement expired on April 1, 2011.
Cash Equivalents
We consider liquid investments purchased with a maturity of three months or less to be cash equivalents. The carrying value of cash equivalents approximates fair value.
Receivables
Trade receivables are primarily comprised of amounts owed to us through our distribution businesses and are presented net of an allowance for doubtful accounts of
$126 million
and
$134 million
at
June 30, 2012
and
2011
, respectively. An account is considered past due on the first day after its due date. In accordance with contract terms, we generally have the ability to charge customers service fees or higher prices if an account is considered past due. We continuously monitor past due accounts and establish appropriate reserves to cover potential losses, which are based primarily on historical collection rates and the credit worthiness of the customer. We write off any amounts deemed uncollectible against the established allowance for doubtful accounts.
31
We provide financing to various customers. Such financing arrangements range from
90 days
to
10 years
, at interest rates that are generally subject to fluctuation. Interest income on these arrangements is recognized as it is earned. The financings may be collateralized, guaranteed by third parties or unsecured. Finance notes and accrued interest receivables were
$84 million
(current portion
$33 million
) and
$90 million
(current portion
$19 million
) at
June 30, 2012
and
2011
, respectively, and are included in other assets (current portion is included in prepaid expenses and other). Finance notes receivable are reported net of an allowance for doubtful accounts of
$16 million
and
$15 million
at
June 30, 2012
and
2011
, respectively. We estimate an allowance for these financing receivables based on historical collection rates and the credit worthiness of the customer.
Concentrations of Credit Risk
We maintain cash depository accounts with major banks and invest in high quality, short-term liquid instruments. Such investments are made only in instruments issued by highly rated institutions. These investments mature within three months and we have not incurred any related losses.
Our trade receivables, lease receivables, finance notes, and accrued interest receivables are exposed to a concentration of credit risk with customers in the retail and healthcare sectors. Credit risk can be affected by changes in reimbursement and other economic pressures impacting the healthcare industry. Such credit risk is limited due to supporting collateral and the diversity of the customer base, including its wide geographic dispersion. We perform ongoing credit evaluations of our customers’ financial conditions and maintain reserves for credit losses. Historically, such losses have been within our expectations.
Major Customers
The following table summarizes all of our customers that individually account for at least
10
percent of revenue and their corresponding percent of gross trade receivables. The customers in the table below are serviced through our Pharmaceutical segment.
|
|
Percent of Revenue
|
Percent of Gross Trade Receivables at June 30,
|
||||||||||||
|
|
2012
|
2011
|
2010
|
2012
|
2011
|
|||||||||
|
CVS Caremark Corporation
|
22
|
%
|
22
|
%
|
22
|
%
|
19
|
%
|
20
|
%
|
||||
|
Walgreen Co.
|
21
|
%
|
23
|
%
|
24
|
%
|
25
|
%
|
31
|
%
|
||||
Our pharmaceutical distribution contract with Express Scripts, Inc., which expires on
September 30, 2012
, was not renewed in connection with the combined pharmaceutical distribution contract that was not awarded to us following that company's merger with Medco Health Solutions, Inc. We recognized approximately
$9.0 billion
of revenue from sales to Express Scripts, Inc. in fiscal 2012.
We have entered into agreements with group purchasing organizations (“GPOs”) which act as purchasing agents that negotiate vendor contracts on behalf of their members. Novation, LLC and Premier Purchasing Partners, L.P. are our two largest GPO member relationships in terms of revenue. Sales to members of these two GPOs collectively accounted for
13 percent
,
14 percent
and
15 percent
, for fiscal
2012
,
2011
and
2010
, respectively. Our trade receivable balances are with individual members of the GPO, and therefore no significant concentration of credit risk exists with these types of arrangements.
Inventories
A substantial portion of our inventories (
69
percent and
70
percent at
June 30, 2012
and
2011
, respectively) are valued at the lower of cost, using the LIFO method, or market. These inventories are included within the core pharmaceutical distribution facilities of our Pharmaceutical segment (“distribution facilities”) and are primarily merchandise inventories. We believe that the average cost method of inventory valuation provides a reasonable approximation of the current cost of replacing inventory within the distribution facilities. As such, the LIFO reserve is the difference between (a) inventory at the lower of LIFO cost or market and (b) inventory at replacement cost determined using the average cost method of inventory valuation.
If we had used the average cost method of inventory valuation for all inventory within the distribution facilities, the value of our inventories would not have changed in fiscal
2012
or fiscal
2011
. Inventories valued at LIFO were
$72 million
and
$8 million
higher than the average cost value as of
June 30, 2012
and
2011
, respectively. We do not record inventories in excess of replacement cost. As such, we did not record any changes in our LIFO reserve in fiscal
2012
and
2011
. Our remaining inventory is primarily stated at the lower of cost, using the FIFO method, or market.
Inventories presented in the consolidated balance sheets are net of reserves for excess and obsolete inventory which were
$37 million
and
$40 million
at
June 30, 2012
and
2011
, respectively. We reserve for inventory obsolescence using estimates based on historical experience, sales trends, specific categories of inventory and age of on-hand inventory.
Cash Discounts
Manufacturer cash discounts are recorded as a component of inventory cost and recognized as a reduction of cost of products sold when the related inventory is sold.
Property and Equipment
Property and equipment are carried at cost less accumulated depreciation. Property and equipment held for sale are recorded at the lower of cost or fair value less cost to sell. When certain events or changes in operating conditions occur, an impairment assessment may be performed on the recoverability of the carrying amounts.
32
Depreciation expense is computed using the straight-line method over the estimated useful lives of the assets, including capital lease assets which are depreciated over the terms of their respective leases. We use the following range of useful lives for our property and equipment categories: buildings and improvements—
3
to
39
years; machinery and equipment—
3
to
20
years; and furniture and fixtures—
3
to
7
years. We recorded depreciation expense of
$241 million
,
$244 million
and
$233 million
, for fiscal
2012
,
2011
and
2010
, respectively.
The following table presents the components of property and equipment at
June 30, 2012
and
2011
.
|
(in millions)
|
2012
|
2011
|
|||||
|
Land, building and improvements
|
$
|
1,126
|
|
$
|
1,105
|
|
|
|
Machinery and equipment
|
2,291
|
|
2,055
|
|
|||
|
Furniture and fixtures
|
120
|
|
114
|
|
|||
|
Total property and equipment, at cost
|
$
|
3,537
|
|
$
|
3,274
|
|
|
|
Accumulated depreciation and amortization
|
(1,986
|
)
|
(1,762
|
)
|
|||
|
Property and equipment, net
|
$
|
1,551
|
|
$
|
1,512
|
|
|
Repairs and maintenance expenditures are expensed as incurred. Interest on long-term projects is capitalized using a rate that approximates the weighted average interest rate on long-term obligations, which was
4.49 percent
at
June 30, 2012
. The amount of capitalized interest was immaterial for all fiscal years presented.
Business Combinations
The purchase price of an acquired business is allocated to the assets acquired and liabilities assumed based on their estimated fair values as of the date of acquisition, including identifiable intangible assets. The excess of the purchase price over the estimated fair value of the net tangible and identifiable intangible assets acquired is recorded as goodwill. We base the fair values of identifiable intangible assets on detailed valuations that require management to make significant judgments, estimates and assumptions. Critical estimates and assumptions include: expected future cash flows for trade names, customer relationships and other identifiable intangible assets; discount rates that reflect the risk factors associated with future cash flows; and estimates of useful lives. When an acquisition involves contingent consideration, we recognize a liability equal to the fair value of the contingent consideration obligation at the date of acquisition. The estimate of fair value of a contingent consideration obligation requires subjective assumptions to be made regarding future business results, discount rates and probabilities assigned to various potential business result scenarios. Subsequent revisions to these assumptions could materially change the estimate of the fair value of contingent consideration obligations and therefore could materially affect our financial position or results of operations. See Note 2 for additional information regarding our acquisitions.
Goodwill and Other Intangibles
Purchased goodwill and intangible assets with indefinite lives are not amortized, but instead are tested for impairment annually or when indicators of impairment exist. Intangible assets with finite lives, primarily customer relationships, trademarks and patents, and non-compete agreements, are amortized over their useful lives.
Goodwill impairment testing involves a comparison of the estimated fair value of reporting units to the respective carrying amount. If estimated fair value exceeds the carrying amount, then no impairment exists. If the carrying amount exceeds the estimated fair value, then a second step is performed to determine the amount of impairment, if any, which would be recorded as an expense to our results of operations. Application of goodwill impairment testing involves judgment, including the identification of reporting units and estimating the fair value of each reporting unit. A reporting unit is defined as an operating segment or one level below an operating segment (also known as a component).
We have
two
operating segments which are the same as our reportable segments: Pharmaceutical and Medical. These operating segments are comprised of divisions (components), for which discrete financial information is available. Components are aggregated into reporting units for purposes of goodwill impairment testing to the extent that they share similar economic characteristics. Our reporting units are: Pharmaceutical operating segment (excluding our nuclear and pharmacy services division and Cardinal Health China - Pharmaceutical division); nuclear and pharmacy services division; Cardinal Health China - Pharmaceutical division; and Medical operating segment.
Fair value can be determined using market, income or cost-based approaches. Our determination of estimated fair value of the reporting units is based on a combination of the income-based and market-based approaches. Under the market-based approach, we determine fair value by comparing our reporting units to similar businesses or guideline companies whose securities are actively traded in public markets. Under the income-based approach, we use a discounted cash flow model in which cash flows anticipated over several periods, plus a terminal value at the end of that time horizon, are discounted to their present value using an appropriate rate of return. To further confirm the fair value, we compare the aggregate fair value of our reporting units to our market capitalization. The use of alternate estimates and assumptions or changes in the industry or peer groups could materially affect the determination of fair value for each reporting unit and potentially result in goodwill impairment.
We performed annual impairment testing in fiscal
2012
,
2011
and
2010
and concluded that there were no impairments of goodwill as the fair value of each reporting unit exceeded its carrying value. For our fiscal 2012 testing, we elected to bypass the optional qualitative assessment, as permitted by the amended accounting guidance adopted during the year. See Note 6 for additional information regarding goodwill and intangible assets.
Income Taxes
We account for income taxes using the asset and liability method. The asset and liability method requires recognition of deferred tax assets and liabilities for expected future tax consequences of temporary differences that currently exist between the tax bases and financial reporting bases of our assets and liabilities. Deferred tax assets and liabilities are measured using enacted tax rates in the respective jurisdictions in which we operate. Deferred taxes are not provided on the unremitted earnings of subsidiaries outside of the United States when it is expected that these earnings are permanently reinvested.
33
Tax benefits from uncertain tax positions are recognized when it is more likely than not that the position will be sustained upon examination, including resolutions of any related appeals or litigation processes, based on the technical merits. The amount recognized is measured as the largest amount of tax benefit that is greater than
50
percent likely of being realized upon settlement. See Note 8 for additional information regarding income taxes.
Vendor Reserves
In the ordinary course of business, our vendors may dispute deductions taken against payments otherwise due to them or assert other billing disputes. These disputed transactions are researched and resolved based upon our policy and findings of the research performed. At any given time, there are outstanding items in various stages of research and resolution. In determining appropriate reserves for areas of exposure with our vendors, we assess historical experience and current outstanding claims. We have established various levels of reserves based on the type of claim and status of review. Though the transaction types are relatively consistent, we periodically refine our methodology by updating the reserve estimate percentages to reflect actual historical experience. The ultimate outcome of certain claims may be different than our original estimate and may require an adjustment. All adjustments to vendor reserves are included in cost of products sold. In addition, the reserve balance will fluctuate due to variations of outstanding claims from period to period, timing of settlements and specific vendor issues, such as bankruptcies. Vendor reserves were
$55 million
and
$41 million
at
June 30, 2012
and
2011
, respectively, excluding third-party returns. See separate section in Note 1 for a description of third-party returns.
Vendor Incentives
Fees for services and other incentives received from vendors relating to the purchase or distribution of inventory are generally reported as a reduction of cost of products sold in the consolidated statements of earnings. We consider these fees and other incentives to represent product discounts, and as a result the amounts are recorded as a reduction of product cost and are recognized through cost of products sold upon sale of the related inventory.
Other Accrued Liabilities
Other accrued liabilities represent various current obligations, including certain accrued operating expenses and taxes payable.
Share-Based Compensation
All share-based compensation to employees, including grants of stock options, is recognized in the consolidated statements of earnings based on the grant date fair value of the awards. The fair value of stock options is determined using a lattice valuation model. The compensation expense recognized for all share-based awards is net of estimated forfeitures and is recognized ratably over the service period of the awards. We classify share-based compensation expense within SG&A expenses to correspond with the same line item as the majority of the cash compensation paid to employees. However, certain share-based compensation incurred in connection with the Spin-Off is classified within restructuring and employee severance. See Note 16 for additional information regarding share-based compensation.
Dividends
We paid cash dividends per Common Share of
$0.86
,
$0.78
and
$0.70
, for fiscal
2012
,
2011
and
2010
, respectively.
Revenue Recognition
We recognize revenue when persuasive evidence of an arrangement exists, product delivery has occurred or the services have been rendered, the price is fixed or determinable, and collectability is reasonably assured.
Pharmaceutical
This segment recognizes distribution revenue when title transfers to its customers and the business has no further obligation to provide services related to such merchandise.
Revenue for deliveries that are directly shipped to customer warehouses from the manufacturer whereby we act as an intermediary in the ordering and delivery of products is recorded gross in accordance with accounting standards addressing reporting revenue on a gross basis as a principal versus on a net basis as an agent. This revenue is recorded on a gross basis since we incur credit risk from the customer, bear the risk of loss for incomplete shipments and do not receive a separate fee or commission for the transaction and, as such, are the primary obligor. Revenue from these sales is recognized when title transfers to the customer and we have no further obligation to provide services related to such merchandise.
Radiopharmaceutical revenue is recognized upon delivery of the product to the customer and after the business has no further obligation to provide services related to such merchandise.
Medicine Shoppe International, Inc. and Medicap Pharmacies Incorporated earn franchise fees. Franchise fees represent monthly fees that are either fixed or based upon franchisees’ sales and are recognized as revenue when they are earned.
Medical
This segment recognizes distribution revenue when title transfers to its customers and the business has no further obligation to provide services related to such merchandise.
Sales Returns and Allowances
Revenue is recorded net of sales returns and allowances. We recognize sales returns as a reduction of revenue and cost of products sold for the sales price and cost, respectively, when products are returned. Our customer return policies generally require that the product be physically returned, subject to restocking fees, in a condition suitable to be added back to inventory and resold at full value, or returned to vendors for credit (“merchantable product”). Product returns are generally consistent throughout the year and typically are not specific to any particular product or customer. Amounts recorded in revenue and cost of products sold under this accounting policy closely approximate what would have been recorded had we accrued for estimated sales returns and allowances at the time of the sale transaction. Sales returns and allowances were
$1.8 billion
,
$1.7 billion
and
$1.5 billion
, for fiscal
2012
,
2011
and
2010
, respectively.
34
Third-Party Returns
Since we generally do not accept non-merchantable product returns from our customers, many of our customers return non-merchantable pharmaceutical products to our vendors through third parties. Since, our customers generally do not have a direct relationship with our vendors, our vendors pass the value of the returns to us (usually in the form of an accounts payable deduction). We in turn pass the value received, less an administrative fee, to our customer. In certain instances, we pass the estimated value of the return to our customer prior to processing the deduction with our vendors. Although we believe we have satisfactory protections, we could be subject to claims from customers or vendors if our administration of this overall process was deficient in some respect or our contractual terms with vendors are in conflict with our contractual terms with our customers. We have maintained reserves for some of these situations based on their nature and our historical experience with their resolution.
Distribution Service Agreement and Other Vendor Fees
Our Pharmaceutical segment recognizes fees received from its distribution service agreements and other fees received from vendors related to the purchase or distribution of the vendors’ inventory when those fees have been earned and we are entitled to payment. We recognize the fees as a reduction in the carrying value of the inventory that generated the fees, and as such, the fees are recognized as a reduction of cost of products sold in our statements of earnings when that inventory is sold.
Shipping and Handling
Shipping and handling costs are included in SG&A expenses in our consolidated statements of earnings. Shipping and handling costs include all delivery expenses as well as all costs to prepare the product for shipment to the end customer. Shipping and handling costs were
$360 million
,
$326 million
and
$294 million
, for fiscal
2012
,
2011
and
2010
, respectively. Revenue received for shipping and handling was immaterial for all periods presented.
Translation of Foreign Currencies
Financial statements of our subsidiaries outside the United States are generally measured using the local currency as the functional currency. Adjustments to translate the assets and liabilities of these foreign subsidiaries into U.S. dollars are accumulated in shareholders’ equity through accumulated other comprehensive income utilizing period-end exchange rates. Revenues and expenses of these foreign subsidiaries are translated using average exchange rates during the year.
The foreign currency translation gains/(losses) included in accumulated other comprehensive income/(loss) were
$37 million
and
$71 million
at
June 30, 2012
and
2011
, respectively. Foreign currency transaction gains and losses for the period are included in the consolidated statements of earnings in other (income)/expense, net, and were immaterial for fiscal
2012
,
2011
and
2010
.
Interest Rate, Currency and Commodity Risk
All derivative instruments are recognized at fair value on the balance sheets and all changes in fair value are recognized in net earnings or shareholders’ equity through accumulated other comprehensive income, net of tax.
For contracts that qualify for hedge accounting treatment, our policy requires that the hedge contracts must be effective at reducing the risk associated with the exposure being hedged and must be designated as a hedge at the inception of the contract. Hedge effectiveness is assessed periodically. Any contract not designated as a hedge, or so designated but ineffective, is adjusted to fair value and recognized in net earnings immediately. If a fair value or cash flow hedge ceases to qualify for hedge accounting, the contract would continue to be carried on the balance sheet at fair value until settled, and future adjustments to the contract’s fair value would be recognized in earnings immediately. If a forecasted transaction was no longer probable to occur, amounts previously deferred in accumulated other comprehensive income would be recognized immediately in earnings. See Note 11 for additional information regarding our derivative instruments, including the accounting treatment for instruments designated as fair value, cash flow and economic hedges.
Earnings per Common Share
Basic earnings per Common Share (“EPS”) is computed by dividing net earnings (the numerator) by the weighted average number of Common Shares outstanding during each period (the denominator). Diluted EPS is similar to the computation for Basic EPS, except that the denominator is increased by the dilutive effect of vested and unvested stock options, restricted shares and restricted share units as computed using the treasury stock method. The total number of Common Shares issued, less the Common Shares held in treasury, is used to determine the Common Shares outstanding. See Note 14 for additional information regarding EPS.
Recent Financial Accounting Standards
In January 2010, the Financial Accounting Standards Board (“FASB”) issued amended guidance regarding the disclosure of fair value measurements. This guidance improves the transparency of disclosures regarding the use of fair value measurements in financial statements. We adopted this guidance in fiscal 2010, except for certain disclosure requirements regarding gross changes in Level 3 measurements, which were effective for fiscal years beginning after December 15, 2010. We adopted this guidance in the first quarter of fiscal 2012. The adoption of this guidance did not impact our financial position or results of operations.
In May 2011, the FASB issued amended accounting guidance related to the accounting and disclosure requirements of fair value measurements. This guidance clarifies the application of existing fair value measurement requirements and expands the disclosure requirements of Level 3 inputs. We adopted this guidance during the third quarter of fiscal 2012. The adoption of this guidance did not impact our financial position or results of operations.
In June 2011, the FASB issued amended accounting guidance related to the presentation of comprehensive income. This guidance requires that comprehensive income, the components of net income and the components of other comprehensive income be presented either in a single continuous statement of comprehensive income or in two separate but consecutive statements. In December 2011, the FASB deferred the effective date of the specific requirement to present items that are reclassified out of accumulated other comprehensive income to net income alongside their respective components of net income and other comprehensive income. All other provisions of this guidance
35
will be effective for us and applied retrospectively beginning in the first quarter of fiscal 2013. The adoption of this guidance will not impact our financial position or results of operations.
In September 2011, the FASB issued amended accounting guidance related to testing goodwill for impairment. This guidance permits a company to assess qualitative factors to determine whether it is necessary to perform the two-step quantitative goodwill impairment test. A company is no longer required to calculate the fair value of a reporting unit unless the company determines, based on the qualitative assessment, that it is more likely than not that its estimated fair value is less than its carrying amount. We adopted this guidance during fiscal 2012, and for our fiscal 2012 annual impairment testing we elected to bypass the optional qualitative assessment, as permitted by the amended accounting guidance. The adoption of this guidance did not impact our financial position or results of operations.
In December 2011, the FASB issued amended accounting guidance related to the disclosures about financial instruments and related arrangements that have been offset in the statements of financial position. Companies will be required to provide both net (offset amounts) and gross information in the notes to the financial statements for relevant assets and liabilities that are offset. This guidance will be effective for us and applied retrospectively in the first quarter of fiscal 2014. The adoption of this guidance will not impact our financial position or results of operations.
In July 2012, the FASB issued amended accounting guidance related to testing indefinite-lived intangible assets for impairment. Similar to the amended accounting guidance related to goodwill impairment, a company is no longer required to calculate the fair value of an indefinite-lived intangible asset unless the company determines, based on a qualitative assessment, that it is more likely than not that its estimated fair value is less than its carrying amount. This guidance will be effective for us in fiscal 2014, with early adoption permitted. The adoption of this guidance will not impact our financial position or results of operations.
2. Acquisitions
We have completed several acquisitions since July 1, 2009, including the fiscal 2011 acquisitions described below. The pro forma results of operations and the results of operations for acquisitions since the acquisition date have not been separately disclosed because the effects were not significant enough to the consolidated financial statements, individually or in the aggregate.
Kinray
On
December 21, 2010
, we completed the acquisition of privately held Kinray for
$1.3 billion
in an all-cash transaction. Kinray is a wholesale pharmaceutical distribution company which primarily serves retail independent pharmacies in the New York metropolitan area. The valuation of the acquired assets and liabilities resulted in goodwill of
$984 million
and identifiable intangible assets of
$133 million
.
Cardinal Health China
On
November 29, 2010
, we completed the acquisition of Cardinal Health China for
$458 million
, including the assumption of
$57 million
in debt. Cardinal Health China is a healthcare distribution
business headquartered in Shanghai, China. The valuation of the acquired assets and liabilities resulted in goodwill of
$240 million
and identifiable intangible assets of
$56 million
.
P4 Healthcare
On July 15, 2010, we completed the acquisition of privately held Healthcare Solutions Holding, LLC (“P4 Healthcare”) for
$506 million
in cash and certain contingent consideration. The valuation of the acquired assets and liabilities resulted in goodwill of
$368 million
and identifiable intangible assets of
$226 million
.
In accordance with the acquisition agreement, as amended, the former owners of P4 Healthcare had the right to receive certain contingent payments based on targeted EBITDA. The contingent consideration was limited to
$100 million
and to be earned over four measurement periods, ending in fiscal 2014, and each measurement period had specific targets and payout amounts. After completion of the first measurement period, in fiscal 2011, we paid
$10 million
in accordance with the agreement. As a result of changes in our estimate of performance in future periods due in large part to the loss of revenue from a significant customer of the P4 Healthcare legacy business that occurred in fiscal 2012, we revised the timing and amount of EBITDA estimates and made changes in probability assumptions with respect to the likelihood of achieving the EBITDA targets. These changes, coupled with the progress of discussions with the former owners regarding an early termination and settlement of the contingent consideration obligation, resulted in a
$71 million
decrease in the fair value of the obligation to
$4 million
at June 30, 2012. In early July 2012, we reached final settlement and payment of the remaining contingent consideration liability for
$4 million
. See Note 12 for an explanation of the fair value measurement for the contingent consideration obligation.
Acquisition-Related Costs
We classify costs incurred in connection with acquisitions as acquisition-related costs in our consolidated statements of earnings. These costs consist primarily of transaction costs, integration costs, changes in the fair value of contingent consideration obligations and amortization of acquisition-related intangible assets. Transaction costs are incurred during the initial evaluation of a potential targeted acquisition and primarily relate to costs to analyze, negotiate and consummate the transaction as well as due diligence activities. Integration costs relate to activities needed to combine the operations of an acquired enterprise into our operations. We record changes in the fair value of contingent consideration obligations relating to acquisitions as income or expense in acquisition-related costs. See Note 6 for additional information regarding amortization of acquisition-related intangible assets and Note 12 for additional information regarding changes in the fair value of contingent consideration obligations.
36
3. Restructuring and Employee Severance
We consider restructuring activities to be programs whereby we fundamentally change our operations such as closing and consolidating certain manufacturing and distribution facilities, moving manufacturing of a product to another location, outsourcing production, employee severance (including rationalizing headcount or other significant changes in personnel) and realigning operations (including substantial realignment of the management structure of a business unit in response to changing market conditions).
The following table summarizes our restructuring and employee severance costs during fiscal
2012
,
2011
and
2010
:
|
(in millions)
|
2012
|
2011
|
2010
|
||||||||
|
Employee-related costs (1)
|
$
|
20
|
|
$
|
7
|
|
$
|
33
|
|
||
|
Facility exit and other costs (2)
|
1
|
|
8
|
|
58
|
|
|||||
|
Total (3)
|
$
|
21
|
|
$
|
15
|
|
$
|
91
|
|
||
|
(1)
|
Employee-related costs primarily consist of termination benefits provided to employees who have been involuntarily terminated and duplicate payroll costs during transition periods.
|
|
(2)
|
Facility exit and other costs consist of accelerated depreciation, equipment relocation costs, project consulting fees and costs associated with restructuring our delivery of information technology infrastructure services.
|
|
(3)
|
We incurred restructuring expenses related to the Spin-Off of
$7 million
and
$65 million
for fiscal
2011
and
2010
, respectively.
|
The following table summarizes activity related to liabilities associated with our restructuring and employee severance activities during fiscal
2012
,
2011
and
2010
:
|
(in millions)
|
Employee
Related
Costs
|
Facility Exit
and Other Costs
|
Total
|
||||||||
|
Balance at June 30, 2009
|
$
|
13
|
|
$
|
12
|
|
$
|
25
|
|
||
|
Additions
|
33
|
|
58
|
|
91
|
|
|||||
|
Payments and other adjustments
|
(37
|
)
|
(63
|
)
|
(100
|
)
|
|||||
|
Balance at June 30, 2010
|
9
|
|
7
|
|
16
|
|
|||||
|
Additions
|
7
|
|
8
|
|
15
|
|
|||||
|
Payments and other adjustments
|
(10
|
)
|
(11
|
)
|
(21
|
)
|
|||||
|
Balance at June 30, 2011
|
6
|
|
4
|
|
10
|
|
|||||
|
Additions
|
22
|
|
1
|
|
23
|
|
|||||
|
Payments and other adjustments
|
(12
|
)
|
(3
|
)
|
(15
|
)
|
|||||
|
Balance at June 30, 2012
|
$
|
16
|
|
$
|
2
|
|
$
|
18
|
|
||
4. Impairments and Loss on Disposal of Assets
During fiscal
2012
, we recorded a charge of $
16 million
to write off an indefinite life intangible asset related to the P4 Healthcare trade name, an asset within our Pharmaceutical segment. We rebranded P4 Healthcare under the Cardinal Health Specialty Solutions name.
During fiscal
2010
, we recognized an $
18 million
impairment charge related to the write-down of SpecialtyScripts, a business within the Pharmaceutical segment, to net expected fair value less costs to sell. See Note 5 for further information regarding the sale of SpecialtyScripts.
5. Discontinued Operations and Assets Held for Sale
As discussed in Note 1, during the first quarter of fiscal 2010, we completed the spin-off of CareFusion. During the fourth quarter of fiscal
2010
, we completed the sale of the United Kingdom-based Martindale injectable manufacturing business ("Martindale") within our Pharmaceutical segment, for
$141 million
, resulting in a pre-tax gain of
$36 million
. There were no assets and liabilities from businesses held for sale at
June 30, 2012
and
2011
. Cash flows from discontinued operations are presented separately in the consolidated statements of cash flows.
The results included in discontinued operations for fiscal
2012
,
2011
and
2010
are summarized as follows:
|
(in millions)
|
2012 (1)
|
2011 (1)
|
2010 (2)
|
||||||||
|
Revenue
|
$
|
—
|
|
$
|
—
|
|
$
|
691
|
|
||
|
Earnings before income taxes
|
$
|
—
|
|
$
|
1
|
|
$
|
91
|
|
||
|
Income tax expense
|
(1
|
)
|
(8
|
)
|
(36
|
)
|
|||||
|
Earnings/(loss) from discontinued operations
|
$
|
(1
|
)
|
$
|
(7
|
)
|
$
|
55
|
|
||
|
(1)
|
Primarily reflects subsequent changes in certain estimates made at the time of the Spin-Off.
|
|
(2)
|
Reflects the results of Martindale through the date of the sale, the results of CareFusion through August 31, 2009, the date the Spin-Off was completed and subsequent changes in certain estimates made at the time of the Spin-Off.
|
During the third quarter of fiscal 2010, we completed the sale of SpecialtyScripts and it met the criteria for classification as held for sale in our financial statements. The results of SpecialtyScripts are reported within earnings from continuing operations in the consolidated statements of earnings through the date of sale because it did not satisfy the criteria for classification as discontinued operations.
6. Goodwill and Other Intangible Assets
Goodwill
The following table summarizes the changes in the carrying amount of goodwill, in total and by segment, during fiscal
2012
and
2011
. The increase in the Pharmaceutical segment in fiscal 2011 is primarily due to the acquisition of Kinray, Cardinal Health China and P4 Healthcare. Goodwill recognized in connection with these acquisitions primarily represents the expected benefit from synergies of integrating these businesses as well as the existing workforce of the acquired entities. See Note 2 for further discussion of these acquisitions.
|
(in millions)
|
Pharmaceutical
|
Medical
|
Total
|
||||||||
|
Balance at June 30, 2010
|
$
|
1,248
|
|
$
|
957
|
|
$
|
2,205
|
|
||
|
Goodwill acquired, net of purchase price adjustments
|
1,599
|
|
33
|
|
1,632
|
|
|||||
|
Foreign currency translation adjustments and other
|
6
|
|
3
|
|
9
|
|
|||||
|
Balance at June 30, 2011
|
2,853
|
|
993
|
|
3,846
|
|
|||||
|
Goodwill acquired, net of purchase price adjustments
|
16
|
|
114
|
|
130
|
|
|||||
|
Foreign currency translation adjustments and other
|
7
|
|
(5
|
)
|
2
|
|
|||||
|
Balance at June 30, 2012
|
$
|
2,876
|
|
$
|
1,102
|
|
$
|
3,978
|
|
||
37
Other Intangible Assets
Intangible assets with definite lives are amortized over their useful lives, which range from
two
to
twenty years
. The following table summarizes other intangible assets by class as of
June 30, 2012
. The decrease in indefinite life intangible assets during fiscal 2012 is primarily due to the write-off of the P4 Healthcare trade name. See Note 4 for further discussion of this write-off.
|
(in millions)
|
Gross
Intangible
|
Accumulated
Amortization
|
Net
Intangible
|
||||||||
|
Indefinite life intangibles:
|
|||||||||||
|
Trademarks
|
$
|
17
|
|
$
|
—
|
|
$
|
17
|
|
||
|
Total indefinite life intangibles
|
17
|
|
—
|
|
17
|
|
|||||
|
Definite life intangibles:
|
|||||||||||
|
Customer relationships
|
473
|
|
141
|
|
332
|
|
|||||
|
Trademarks and patents
|
45
|
|
36
|
|
9
|
|
|||||
|
Non-compete agreements
|
14
|
|
8
|
|
6
|
|
|||||
|
Other
|
93
|
|
43
|
|
50
|
|
|||||
|
Total definite life intangibles
|
625
|
|
228
|
|
397
|
|
|||||
|
Total intangibles
|
$
|
642
|
|
$
|
228
|
|
$
|
414
|
|
||
The following table summarizes other intangible assets by class as of
June 30, 2011
:
|
(in millions)
|
Gross
Intangible
|
Accumulated
Amortization
|
Net
Intangible
|
||||||||
|
Indefinite life intangibles:
|
|||||||||||
|
Trademarks
|
$
|
27
|
|
$
|
—
|
|
$
|
27
|
|
||
|
Total indefinite life intangibles
|
27
|
|
—
|
|
27
|
|
|||||
|
Definite life intangibles:
|
|||||||||||
|
Customer relationships
|
393
|
|
89
|
|
304
|
|
|||||
|
Trademarks and patents
|
43
|
|
25
|
|
18
|
|
|||||
|
Non-compete agreements
|
14
|
|
6
|
|
8
|
|
|||||
|
Other
|
86
|
|
30
|
|
56
|
|
|||||
|
Total definite life intangibles
|
536
|
|
150
|
|
386
|
|
|||||
|
Total intangibles
|
$
|
563
|
|
$
|
150
|
|
$
|
413
|
|
||
The following table summarizes amortization during fiscal
2012
,
2011
and
2010
:
|
(in millions)
|
2012
|
2011
|
2010
|
||||||||
|
Amortization of acquisition-related intangible assets
|
$
|
78
|
|
$
|
67
|
|
$
|
10
|
|
||
|
Amortization of other intangible assets
|
1
|
|
1
|
|
1
|
|
|||||
|
Total amortization of intangible assets
|
$
|
79
|
|
$
|
68
|
|
$
|
11
|
|
||
Estimated annual amortization of intangible assets is as follows:
$77 million
,
$67 million
,
$51 million
,
$43 million
and
$35 million
for fiscal
2013
through
2017
.
7. Long-Term Obligations and Other Short-Term Borrowings
The following table summarizes long-term obligations and other short-term borrowings as of
June 30, 2012
and
2011
:
|
(in millions)
|
2012
|
2011
|
|||||
|
1.900% Notes due 2017
|
$
|
250
|
|
$
|
—
|
|
|
|
3.200% Notes due 2022
|
250
|
|
—
|
|
|||
|
4.00% Notes due 2015
|
536
|
|
537
|
|
|||
|
4.625% Notes due 2020
|
538
|
|
500
|
|
|||
|
5.50% Notes due 2013
|
304
|
|
307
|
|
|||
|
5.65% Notes due 2012
|
—
|
|
212
|
|
|||
|
5.80% Notes due 2016
|
305
|
|
307
|
|
|||
|
5.85% Notes due 2017
|
160
|
|
158
|
|
|||
|
6.00% Notes due 2017
|
206
|
|
210
|
|
|||
|
7.00% Debentures due 2026
|
125
|
|
124
|
|
|||
|
7.80% Debentures due 2016
|
37
|
|
37
|
|
|||
|
Other obligations
|
183
|
|
110
|
|
|||
|
Total
|
2,894
|
|
2,502
|
|
|||
|
Less: current portion and other short-term borrowings
|
476
|
|
327
|
|
|||
|
Long-term obligations, less current portion
|
$
|
2,418
|
|
$
|
2,175
|
|
|
Maturities of long-term obligations and other short-term borrowings are as follows:
$476 million
,
$1 million
,
$526 million
,
$21 million
,
$792 million
for fiscal
2013
through
2017
, and
$1,078 million
thereafter.
The
1.900%
,
3.200%
,
4.00%
,
4.625%
,
5.50%
,
5.80%
,
5.85%
, and
6.00%
Notes represent unsecured obligations. The
7.00%
and
7.80%
Debentures represent unsecured obligations of Allegiance Corporation (a wholly-owned subsidiary), which Cardinal Health, Inc. has guaranteed. None of these obligations are subject to a sinking fund and the Allegiance obligations are not redeemable prior to maturity. Interest is paid pursuant to the terms of the obligations. These notes are effectively subordinated to the liabilities of our subsidiaries, including trade payables of
$11.7 billion
.
In
May 2012
, we sold
$250 million
aggregate principal amount of fixed rate notes due
2017
with interest at
1.900%
per year in a registered offering. The
1.900%
Notes mature on
June 15, 2017
. In
May 2012
, we also sold
$250 million
aggregate principal amount of fixed rate notes due
2022
with interest at
3.200%
per year in a registered offering. The
3.200%
Notes mature on
June 15, 2022
. These notes are unsecured and unsubordinated obligations and rank equally in right of payment with all of our existing and future unsecured and unsubordinated indebtedness.
In
December 2010
, we sold
$500 million
aggregate principal amount of fixed rate notes due 2020 with interest at
4.625%
per year (“
4.625%
Notes”) in a registered offering. The
4.625%
Notes mature on
December 15, 2020
. These notes are unsecured and unsubordinated obligations and rank equally in right of payment with all of our existing and future unsecured and unsubordinated indebtedness.
38
The
5.50%
Notes due
2013
,
6.00%
Notes due
2017
,
1.900%
Notes due
2017
,
4.625%
Notes due
2020
, and
3.200%
Notes due
2022
require us to offer to purchase the notes at
101%
of the principal amount plus accrued and unpaid interest, if we have a defined change of control and specified ratings below investment grade by S&P, Moody’s, and Fitch.
On
September 24, 2009
, we completed a debt tender announced on
August 27, 2009
for an aggregate purchase price, including an early tender premium but excluding accrued interest, fees and expenses, of
$1.1 billion
. In connection with this transaction, we incurred a pre-tax loss for the early extinguishment of debt of
$40 million
. The debt tender was completed using a portion of the
$1.4 billion
of cash distributed to us from CareFusion in connection with the Spin-Off.
Other Financing Arrangements
In addition to cash and equivalents, at
June 30, 2012
and
2011
, our sources of liquidity included a
$1.5 billion
commercial paper program backed by a
$1.5 billion
revolving credit facility that expires in
May 2016
. The revolving credit facility exists largely to support issuances of commercial paper as well as other short-term borrowings for general corporate purposes.
We also maintain a
$950 million
committed receivables sales facility program that expires in
November 2012
. The committed receivables sales facility program exists largely to provide liquidity by selling interests in our receivables.
We had no outstanding borrowings from the commercial paper program and no outstanding balance under the committed receivables sales facility program at
June 30, 2012
and
2011
. We also had no outstanding balance under the revolving credit facility at
June 30, 2012
and
2011
, except for
$44 million
of standby letters of credit in each fiscal year. Our revolving credit and committed receivables sales facility programs require us to maintain a consolidated interest coverage ratio, as of any fiscal quarter end, of at least
4-to-1
and a consolidated leverage ratio of no more than
3.25-to-1
. As of
June 30, 2012
, we were in compliance with these financial covenants.
We also maintain other short-term credit facilities and an unsecured line of credit that allowed for borrowings up to
$218 million
and
$174 million
at
June 30, 2012
and
2011
, respectively. The
$183 million
and
$110 million
balance of other obligations at
June 30, 2012
and
2011
, respectively, consisted primarily of additional notes, loans and capital leases.
8. Income Taxes
Earnings before income taxes and discontinued operations are as follows for fiscal
2012
,
2011
and
2010
:
|
(in millions)
|
2012
|
2011
|
2010
|
||||||||
|
U.S. Operations
|
$
|
1,514
|
|
$
|
1,299
|
|
$
|
980
|
|
||
|
Non-U.S. Operations
|
184
|
|
219
|
|
232
|
|
|||||
|
Earnings before income taxes and discontinued operations
|
$
|
1,698
|
|
$
|
1,518
|
|
$
|
1,212
|
|
||
The provision for income taxes from continuing operations consists of the following for fiscal
2012
,
2011
and
2010
:
|
(in millions)
|
2012
|
2011
|
2010
|
||||||||
|
Current:
|
|||||||||||
|
Federal
|
$
|
430
|
|
$
|
387
|
|
$
|
430
|
|
||
|
State and local
|
27
|
|
20
|
|
63
|
|
|||||
|
Non-U.S.
|
13
|
|
17
|
|
12
|
|
|||||
|
Total current
|
$
|
470
|
|
$
|
424
|
|
$
|
505
|
|
||
|
Deferred:
|
|
|
|
||||||||
|
Federal
|
124
|
|
92
|
|
103
|
|
|||||
|
State and local
|
28
|
|
29
|
|
18
|
|
|||||
|
Non-U.S.
|
6
|
|
7
|
|
(1
|
)
|
|||||
|
Total deferred
|
$
|
158
|
|
$
|
128
|
|
$
|
120
|
|
||
|
Provision for income taxes
|
$
|
628
|
|
$
|
552
|
|
$
|
625
|
|
||
A reconciliation of the provision based on the federal statutory income tax rate to our effective income tax rate from continuing operations is as follows for fiscal
2012
,
2011
and
2010
:
|
|
2012
|
2011
|
2010
|
|||||
|
Provision at Federal statutory rate
|
35.0
|
%
|
35.0
|
%
|
35.0
|
%
|
||
|
State and local income taxes, net of federal benefit
|
2.3
|
|
2.6
|
|
4.2
|
|
||
|
Foreign tax rate differential
|
(2.3
|
)
|
(2.5
|
)
|
(3.3
|
)
|
||
|
Nondeductible/nontaxable items
|
—
|
|
0.6
|
|
0.2
|
|
||
|
Change in measurement of an uncertain tax position and an IRS settlement
|
0.9
|
|
2.4
|
|
1.3
|
|
||
|
Valuation allowances
|
0.1
|
|
(0.6
|
)
|
(2.3
|
)
|
||
|
Unremitted foreign earnings
|
(0.2
|
)
|
(0.1
|
)
|
13.9
|
|
||
|
Other
|
1.2
|
|
(1.0
|
)
|
2.6
|
|
||
|
Effective income tax rate
|
37.0
|
%
|
36.4
|
%
|
51.6
|
%
|
||
39
As of
June 30, 2012
, we had
$2.2 billion
of total undistributed earnings from non-U.S. subsidiaries, of which
$1.5 billion
are intended to be permanently reinvested in non-U.S. operations. We recorded a charge of
$168 million
during fiscal
2010
to reflect the anticipated repatriation of certain foreign earnings. With respect to the earnings that are considered permanently reinvested, no U.S. tax provision has been accrued related to the repatriation of these earnings. It is not practicable to estimate the amount of U.S. tax that might be payable on the eventual remittance of such earnings.
Deferred income taxes arise from temporary differences between financial reporting and tax reporting bases of assets and liabilities and operating loss and tax credit carryforwards for tax purposes. The components of the deferred income tax assets and liabilities as of
June 30, 2012
and
2011
are as follows:
|
(in millions)
|
2012
|
2011
|
|||||
|
Deferred income tax assets:
|
|||||||
|
Receivable basis difference
|
$
|
46
|
|
$
|
46
|
|
|
|
Accrued liabilities
|
107
|
|
105
|
|
|||
|
Share-based compensation
|
90
|
|
97
|
|
|||
|
Loss and tax credit carryforwards
|
120
|
|
199
|
|
|||
|
Deferred tax assets related to uncertain tax positions
|
118
|
|
157
|
|
|||
|
Other
|
85
|
|
97
|
|
|||
|
Total deferred income tax assets
|
$
|
566
|
|
$
|
701
|
|
|
|
Valuation allowance for deferred income tax assets
|
(86
|
)
|
(158
|
)
|
|||
|
Net deferred income tax assets
|
$
|
480
|
|
$
|
543
|
|
|
|
Deferred income tax liabilities:
|
|||||||
|
Inventory basis differences
|
$
|
(1,067
|
)
|
$
|
(980
|
)
|
|
|
Property-related
|
(180
|
)
|
(159
|
)
|
|||
|
Goodwill and other intangibles
|
(146
|
)
|
(70
|
)
|
|||
|
Unremitted foreign earnings
|
(64
|
)
|
(140
|
)
|
|||
|
Other
|
(5
|
)
|
(3
|
)
|
|||
|
Total deferred income tax liabilities
|
$
|
(1,462
|
)
|
$
|
(1,352
|
)
|
|
|
Net deferred income tax liability
|
$
|
(982
|
)
|
$
|
(809
|
)
|
|
Deferred tax assets and liabilities in the preceding table, after netting by taxing jurisdiction, are in the following captions in the consolidated balance sheet at
June 30, 2012
and
2011
:
|
(in millions)
|
2012
|
2011
|
|||||
|
Current deferred income tax asset (1)
|
$
|
27
|
|
$
|
29
|
|
|
|
Noncurrent deferred income tax asset (2)
|
6
|
|
10
|
|
|||
|
Current deferred income tax liability (3)
|
(858
|
)
|
(763
|
)
|
|||
|
Noncurrent deferred income tax liability (4)
|
(157
|
)
|
(85
|
)
|
|||
|
Net deferred income tax liability
|
$
|
(982
|
)
|
$
|
(809
|
)
|
|
|
(1)
|
Included in Prepaid expenses and other in the consolidated balance sheets.
|
|
(2)
|
Included in Other assets in the consolidated balance sheets.
|
|
(3)
|
Included in Other accrued liabilities in the consolidated balance sheets.
|
|
(4)
|
Included in Deferred income taxes and other liabilities in the consolidated balance sheets.
|
At
June 30, 2012
, we had gross federal, state and international loss and credit carryforwards of
$37 million
,
$523 million
and
$135 million
, respectively, the tax effect of which is an aggregate deferred tax asset of
$120 million
. Substantially all of these carryforwards are available for at least three years or have an indefinite carryforward period. Approximately
$74 million
of the valuation allowance at
June 30, 2012
applies to certain federal, state and international loss carryforwards that, in our opinion, are more likely than not to expire unutilized. However, to the extent that tax benefits related to these carryforwards are realized in the future, the reduction in the valuation allowance would reduce income tax expense.
We had
$654 million
,
$747 million
and
$731 million
of unrecognized tax benefits at
June 30, 2012
,
2011
and
2010
, respectively. The
June 30, 2012
,
2011
and
2010
balances include
$337 million
,
$332 million
and
$311 million
, respectively, of unrecognized tax benefits that, if recognized, would have an impact on the effective tax rate. The remaining unrecognized tax benefits relate to tax positions for which ultimate deductibility is highly certain but for which there is uncertainty as to the timing of such deductibility. Recognition of these tax benefits would not affect our effective tax rate. We include the full amount of unrecognized tax benefits in deferred income taxes and other liabilities in the consolidated balance sheets. A reconciliation of the beginning and ending amounts of unrecognized tax benefits for fiscal
2012
,
2011
and
2010
is as follows:
|
(in millions)
|
2012
|
2011
|
2010
|
||||||||
|
Balance at beginning of fiscal year
|
$
|
747
|
|
$
|
731
|
|
$
|
849
|
|
||
|
Additions for tax positions of the current year
|
16
|
|
16
|
|
43
|
|
|||||
|
Additions for tax positions of prior years
|
68
|
|
58
|
|
90
|
|
|||||
|
Reductions for tax positions of prior years
|
(3
|
)
|
(20
|
)
|
(240
|
)
|
|||||
|
Settlements with tax authorities
|
(172
|
)
|
(36
|
)
|
(10
|
)
|
|||||
|
Expiration of the statute of limitations
|
(2
|
)
|
(2
|
)
|
(1
|
)
|
|||||
|
Balance at end of fiscal year
|
$
|
654
|
|
$
|
747
|
|
$
|
731
|
|
||
We recognize accrued interest and penalties related to unrecognized tax benefits in income tax expense. As of
June 30, 2012
,
2011
and
2010
, we had
$209 million
,
$267 million
and
$233 million
, respectively, accrued for the payment of interest and penalties. These balances are gross amounts before any tax benefits and are included in deferred income taxes and other liabilities in the consolidated balance sheet. For fiscal
2012
, we recognized
$28 million
of benefit for interest and penalties in income tax expense. For fiscal
2011
and
2010
, we recognized
$36 million
and
$35 million
of interest and penalties in income tax expense, respectively.
40
We file income tax returns in the U.S. federal jurisdiction, various U.S. state jurisdictions and various foreign jurisdictions. With few exceptions, we are subject to audit by taxing authorities for fiscal 2003 through the current fiscal year.
The IRS closed its audits of fiscal 2001 and 2002 during fiscal 2012 and is currently conducting audits of fiscal 2003 through 2010. We have received proposed adjustments from the IRS for fiscal years 2003 through 2007 related to our transfer pricing arrangements between foreign and domestic subsidiaries and the transfer of intellectual property among subsidiaries of an acquired entity prior to its acquisition by us. The IRS has proposed additional taxes of
$849 million
, excluding penalties and interest. If this tax ultimately must be paid, CareFusion is liable under the tax matters agreement for
$592 million
of the total amount. We disagree with these proposed adjustments, which we are contesting, and have accounted for the unrecognized tax benefits related to them.
It is reasonably possible that there could be a change in the amount of unrecognized tax benefits within the next 12 months due to activities of the IRS or other taxing authorities, including proposed assessments of additional tax, possible settlement of audit issues (primarily IRS audits of fiscal 2003 through 2005), or the expiration of applicable statutes of limitations. We estimate that the range of the possible change in unrecognized tax benefits within the next 12 months is a decrease of approximately
zero
to
$275 million
, exclusive of penalties and interest.
9. Commitments, Contingent Liabilities and Litigation
Commitments
The future minimum rental payments for operating leases having initial or remaining non-cancelable lease terms in excess of one year at
June 30, 2012
are as follows:
$83 million
,
$64 million
,
$48 million
,
$35 million
,
$25 million
for fiscal
2013
through
2017
, and
$45 million
thereafter. Rental expense relating to operating leases was
$86 million
,
$79 million
and
$80 million
in fiscal
2012
,
2011
and
2010
, respectively. Sublease rental income was not material for any period presented.
Legal Proceedings
We become involved from time-to-time in disputes, litigation and regulatory matters incidental to our business, including governmental investigations and enforcement actions, personal injury claims, employment matters, commercial disputes, intellectual property matters, government contract compliance matters, disputes regarding environmental clean-up costs, litigation in connection with acquisitions and divestitures, and other matters arising out of the normal conduct of our business. We intend to vigorously defend ourselves in such litigation. We do not believe that the outcome of any pending litigation will have a material adverse effect on our financial position or results of operations.
Occasionally, we may suspect that products we manufacture, market or distribute do not meet product specifications, published standards or regulatory requirements. In such circumstances, we investigate and take appropriate corrective action. Such actions can lead to product recalls, costs to repair or replace affected products, temporary interruptions in product sales, and action by regulators.
We accrue for contingencies related to litigation and regulatory matters. We accrue an estimated loss contingency in our consolidated financial statements if it is probable that a liability has been incurred and the amount of the loss can be reasonably estimated. Because litigation is inherently unpredictable and unfavorable developments or resolutions can occur, assessing contingencies is highly subjective and requires judgments about future events. We regularly review contingencies to determine whether our accruals and related disclosures are adequate. The amount of ultimate loss may differ from these estimates.
We recognize income from the favorable outcome of litigation when we receive the associated cash or assets.
We recognize estimated loss contingencies for litigation and regulatory matters and income from favorable resolution of litigation in litigation (recoveries)/charges, net in our consolidated statements of earnings.
On February 3, 2012 the DEA issued an order to show cause and immediate suspension of our Lakeland, Florida distribution center's registration to distribute controlled substances. In the order, the DEA asserted that we failed to maintain required controls against the diversion of controlled substances. We filed a complaint and motion for a temporary restraining order in the U.S. District Court for the District of Columbia to enjoin the suspension of the Lakeland facility's registration. The court granted the temporary restraining order restoring the DEA registration but denied our motion for a preliminary injunction on February 29, 2012, and the immediate suspension was reinstated. We appealed that decision to the U.S. Court of Appeals for the D.C. Circuit. On May 14, 2012, we entered into a settlement agreement with the DEA. Upon entering into the agreement, we withdrew our appeal of the U.S. District Court's decision not to grant us a preliminary injunction.
Under the settlement agreement with the DEA: (i) our Lakeland registration will remain suspended until May 15, 2014; (ii) we agreed to enhance certain procedures designed to detect and prevent the diversion of controlled substances; and (iii) the DEA confirmed that it was planning no further administrative actions at any of our other facilities based on conduct prior to the settlement. The settlement agreement did not foreclose the possibility of the U.S. Department of Justice seeking civil fines for historical conduct covered by the settlement agreement. In that regard, we are responding to civil subpoenas from two local offices within the DEA and the U.S. Department of Justice related to our distribution of controlled substances. Due to the early state of these matters, it is not possible to reasonably estimate a range of possible loss.
41
On June 26, 2012, the West Virginia Attorney General filed complaints against fourteen pharmaceutical wholesale distributors, including us, in the Circuit Court of Boone County, West Virginia alleging, among other things, that the distributors failed to maintain effective controls to guard against diversion of controlled substances in West Virginia, failed to report suspicious orders of controlled substances in accordance with the West Virginia Uniform Controlled Substances Act, were negligent in distributing controlled substances to pharmacies that serve individuals who abuse controlled substances, were unjustly enriched by such conduct, violated consumer credit and protection laws, created a public nuisance, and violated state antitrust laws in connection with the distribution of controlled substances. In addition to injunctive and other equitable relief, the attorney general is seeking monetary damages and the creation of a court-supervised fund, to be financed by the defendants in these actions, for a medical monitoring program focused on prescription drug abuse. Motions have been filed to remove the cases from the Circuit Court of Boone County, West Virginia to the United States District Court for the Southern District of West Virginia. Because this matter only recently commenced, it is not possible to reasonably estimate a range of possible loss.
Insurance and Antitrust Litigation Proceeds
During fiscal
2010
, we recognized
$27 million
of income related to insurance proceeds released from escrow following the resolution of previously disclosed and settled securities and derivative litigation against certain of our directors and officers. This amount is comprised of
$26 million
received from directors’ and officers’ insurance policies recognized in litigation (recoveries)/charges, net and
$1 million
of accrued interest income recognized in interest expense, net.
During fiscal
2010
, we recognized
$41 million
of income resulting from settlement of a class action antitrust claim in which we were a class member. This amount is recognized in litigation (recoveries)/charges, net in the consolidated statements of earnings.
Income Taxes
See Note 8 for discussion of contingencies related to our income taxes.
10. Guarantees
In the ordinary course of business, we agree to indemnify certain other parties under acquisition and disposition agreements, customer agreements, intellectual property licensing agreements, and other agreements. Such indemnification obligations vary in scope and, when defined, in duration. In many cases, a maximum obligation is not explicitly stated, and therefore the overall maximum amount of the liability under such indemnification obligations cannot be reasonably estimated. Where appropriate, such indemnification obligations are recorded as a liability. Historically, we have not, individually or in the aggregate, made payments under these indemnification obligations in any material amounts. In certain circumstances, we believe that existing insurance arrangements, subject to the general deduction and exclusion provisions, would cover portions of the liability that may arise from these indemnification obligations. In addition, we believe that the likelihood of a material liability being triggered under these indemnification obligations is not significant.
We enter into agreements that obligate us to make fixed payments upon the occurrence of certain events. Such obligations primarily relate to obligations arising under acquisition transactions, where we have agreed to make payments based upon the achievement of certain financial performance measures by the acquired business. Generally, the obligation is capped at an explicit amount. See Note 2 for detail regarding the P4 Healthcare contingent consideration obligation.
11. Financial Instruments
We utilize derivative financial instruments to manage exposure to certain risks related to our ongoing operations. The primary risks managed through the use of derivative instruments include interest rate risk, currency exchange risk and commodity price risk. We do not use derivative instruments for trading or speculative purposes. While the majority of our derivative instruments are designated as hedging instruments, we also enter into derivative instruments that are designed to hedge a risk, but are not designated as hedging instruments. These derivative instruments are adjusted to current fair value through earnings at the end of each period.
We are exposed to counterparty credit risk on all of our derivative instruments. Accordingly, we have established and maintain strict counterparty credit guidelines and enter into derivative instruments only with major financial institutions that are investment grade or better. We do not have significant exposure to any one counterparty; management believes the risk of loss is remote. Additionally, we do not require collateral under these agreements.
Interest Rate Risk Management
We are exposed to the impact of interest rate changes. Our objective is to manage the impact of interest rate changes on cash flows and the market value of our borrowings. We utilize a mix of debt maturities along with both fixed-rate and variable-rate debt to manage changes in interest rates. In addition, we enter into interest rate swaps to further manage our exposure to interest rate variations related to our borrowings and to lower our overall borrowing costs.
Currency Exchange Risk Management
We conduct business in several major international currencies and are subject to risks associated with changing foreign exchange rates. Our objective is to reduce earnings and cash flow volatility associated with foreign exchange rate changes to allow management to focus its attention on business operations. Accordingly, we enter into various contracts that change in value as foreign exchange rates change to protect the value of existing foreign currency assets and liabilities, commitments and anticipated foreign currency revenue and expenses.
42
Commodity Price Risk Management
We are exposed to changes in the price of certain commodities. Our objective is to reduce earnings and cash flow volatility associated with forecasted purchases of these commodities to allow management to focus its attention on business operations. Accordingly, we enter into derivative contracts to manage the price risk associated with these forecasted purchases.
The following table summarizes the fair value of our assets and liabilities related to derivative financial instruments, and the respective line items in which they were recorded in the consolidated balance sheets as of
June 30, 2012
and
2011
:
|
(in millions)
|
June 30,
2012 |
June 30,
2011 |
|||||
|
Assets:
|
|||||||
|
Derivatives designated as hedging instruments:
|
|||||||
|
Pay-floating interest rate swaps (1)
|
$
|
49
|
|
$
|
32
|
|
|
|
Foreign currency contracts (1)
|
2
|
|
1
|
|
|||
|
Commodity contracts (1)
|
—
|
|
3
|
|
|||
|
Total assets
|
$
|
51
|
|
$
|
36
|
|
|
|
Liabilities:
|
|||||||
|
Derivatives designated as hedging instruments:
|
|||||||
|
Foreign currency contracts (2)
|
$
|
1
|
|
$
|
3
|
|
|
|
Derivatives not designated as hedging instruments:
|
|||||||
|
Commodity contracts (3)
|
1
|
|
1
|
|
|||
|
Total liabilities
|
$
|
2
|
|
$
|
4
|
|
|
|
(1)
|
Included in Prepaid expenses and other on the consolidated balance sheets.
|
|
(2)
|
Included in Deferred income taxes and other liabilities on the consolidated balance sheets.
|
|
(3)
|
Included in Other accrued liabilities on the consolidated balance sheets.
|
Fair Value Hedges
We enter into pay-floating interest rate swaps to hedge the changes in the fair value of fixed-rate debt resulting from fluctuations in interest rates. These contracts are designated and qualify as fair value hedges. Accordingly, the gain or loss recorded on the pay-floating interest rate swaps is directly offset by the change in fair value of the underlying debt. Both the derivative instrument and the underlying debt are adjusted to market value at the end of each period with any resulting gain or loss recorded in interest expense, net in the consolidated statements of earnings.
During fiscal
2012
and
2011
, we entered into pay-floating interest rate swaps with total notional values of
$363 million
and
$250 million
, respectively. The fair value of these pay-floating interest rate swaps is included in the consolidated balance sheets as of
June 30, 2012
and
2011
. In
August 2011
, we terminated
$640 million
(notional amount) of pay-floating interest rate swaps and received net settlement proceeds of
$34 million
. In
June 2012
,
$206 million
(notional amount) of pay-floating interest rate swaps matured.
The following tables summarize the interest rate swaps designated as fair value hedges outstanding as of
June 30, 2012
and
2011
:
|
|
June 30, 2012
|
||||||
|
(in millions)
|
Notional
Amount |
Maturity Date
|
|||||
|
Pay-floating interest rate swaps
|
$
|
773
|
|
Jun 2013
|
-
|
Jun 2022
|
|
|
June 30, 2011
|
|||||||
|
(in millions)
|
Notional
Amount |
Maturity Date
|
|||||
|
Pay-floating interest rate swaps
|
$
|
1,256
|
|
Jun 2012
|
-
|
Dec 2020
|
|
43
The following table summarizes the gain/(loss) recognized in earnings for interest rate swaps designated as fair value hedges for fiscal
2012
,
2011
and
2010
:
|
(in millions)
|
2012
|
2011
|
2010
|
||||||||
|
Pay-floating interest rate swaps (1)
|
$
|
38
|
|
$
|
36
|
|
$
|
47
|
|
||
|
Fixed-rate debt (1)
|
(38
|
)
|
(36
|
)
|
(47
|
)
|
|||||
|
(1)
|
Included in Interest expense, net on the consolidated statements of earnings.
|
There was no ineffectiveness associated with these derivative instruments.
Cash Flow Hedges
We enter into derivative instruments to hedge our exposure to changes in cash flows attributable to currency, interest rate and commodity price fluctuations associated with certain forecasted transactions. These derivative instruments are designated and qualify as cash flow hedges. Accordingly, the effective portion of the gain or loss on the derivative instrument is reported as a component of other comprehensive income (“OCI”) and reclassified into earnings in the same line item associated with the forecasted transaction and in the same period during which the hedged transaction affects earnings. The ineffective portion of the gain or loss on the derivative instrument is recognized in earnings immediately.
We enter into foreign currency contracts to protect the value of anticipated foreign currency revenues and expenses. At
June 30, 2012
and
2011
, we held contracts to hedge probable, but not firmly committed, revenue and expenses. The principal currencies hedged are the Canadian dollar, European euro, Mexican peso, Thai baht, and Japanese yen.
We enter into commodity contracts to manage the price risk associated with forecasted purchases of certain commodities used in our Medical segment.
The following tables summarize the outstanding cash flow hedges as of
June 30, 2012
and
2011
:
|
|
June 30, 2012
|
||||||
|
(in millions)
|
Notional
Amount |
Maturity Date
|
|||||
|
Foreign currency contracts
|
$
|
158
|
|
Jul 2012
|
-
|
Jun 2013
|
|
|
Commodity contracts
|
23
|
|
Jul 2012
|
-
|
Mar 2015
|
||
|
|
June 30, 2011
|
||||||
|
(in millions)
|
Notional
Amount |
Maturity Date
|
|||||
|
Foreign currency contracts
|
$
|
163
|
|
Jul 2011
|
-
|
Jun 2012
|
|
|
Commodity contracts
|
22
|
|
Jul 2011
|
-
|
Mar 2014
|
||
The following table summarizes the accumulated gain/(loss) included in OCI for derivative instruments designated as cash flow hedges as of
June 30, 2012
and
2011
:
|
(in millions)
|
2012
|
2011
|
|||||
|
Foreign currency contracts
|
$
|
—
|
|
$
|
(2
|
)
|
|
|
Commodity contracts
|
(1
|
)
|
2
|
|
|||
The following table summarizes the gain/(loss) reclassified from accumulated OCI into earnings for derivative instruments designated as cash flow hedges for fiscal
2012
,
2011
and
2010
:
|
(in millions)
|
2012
|
2011
|
2010
|
||||||||
|
Pay-fixed interest rate swaps (1)
|
$
|
—
|
|
$
|
—
|
|
$
|
(2
|
)
|
||
|
Foreign currency contracts (2)
|
1
|
|
—
|
|
—
|
|
|||||
|
Foreign currency contracts (3)
|
(1
|
)
|
(3
|
)
|
(11
|
)
|
|||||
|
Foreign currency contracts (4)
|
(1
|
)
|
3
|
|
1
|
|
|||||
|
Commodity contracts (4)
|
2
|
|
2
|
|
—
|
|
|||||
|
(1)
|
Included in Interest expense, net on the consolidated statements of earnings.
|
|
(2)
|
Included in Revenue on the consolidated statements of earnings.
|
|
(3)
|
Included in Cost of products sold on the consolidated statements of earnings.
|
|
(4)
|
Included in SG&A expenses on the consolidated statements of earnings.
|
The amount of ineffectiveness associated with these derivative instruments was not material.
Economic (Non-Designated) Hedges
We enter into foreign currency contracts to manage our foreign exchange exposure related to intercompany financing transactions and other balance sheet items subject to revaluation that do not meet the requirements for hedge accounting treatment. Accordingly, these derivative instruments are adjusted to current market value at the end of each period through earnings. The gain or loss recorded on these instruments is substantially offset by the remeasurement adjustment on the foreign currency denominated asset or liability. The settlement of the derivative instrument and the remeasurement adjustment on the foreign currency denominated asset or liability are both recorded in other (income)/expense, net at the end of each period. During fiscal
2010
, we received cash receipts from a cross currency swap settlement totaling
$43 million
. These proceeds are classified as cash provided by operating activities in the consolidated statement of cash flows.
During fiscal
2011
, we entered into swap contracts of certain commodities to mitigate price volatility for materials we purchase or use in our manufacturing and distribution businesses. These instruments do not qualify for hedge accounting and as such fair value changes as well as periodic settlements of these contracts are recorded within other (income)/expense, net in our consolidated statements of earnings.
44
The following tables summarize the economic (non-designated) derivative instruments outstanding as of
June 30, 2012
and
2011
:
|
|
June 30, 2012
|
||||||
|
(in millions)
|
Notional
Amount |
Maturity Date
|
|||||
|
Foreign currency contracts
|
$
|
500
|
|
Jul 2012
|
-
|
Sep 2012
|
|
|
June 30, 2011
|
|||||||
|
(in millions)
|
Notional
Amount |
Maturity Date
|
|||||
|
Foreign currency contracts
|
$
|
392
|
|
Jul 2011
|
|||
|
Commodity contracts
|
10
|
|
Jul 2011
|
-
|
Jun 2012
|
||
The following table summarizes the gain/(loss) recognized in earnings for economic (non-designated) derivative instruments for fiscal
2012
,
2011
and
2010
:
|
(in millions)
|
2012
|
2011
|
2010
|
||||||||
|
Foreign currency contracts (1)
|
$
|
(39
|
)
|
$
|
36
|
|
$
|
24
|
|
||
|
Commodity contracts (1)
|
(1
|
)
|
(1
|
)
|
—
|
|
|||||
|
(1)
|
Included in Other income, net on the consolidated statements of earnings.
|
Fair Value of Financial Instruments
The carrying amounts of cash and equivalents, trade receivables, accounts payable, other short-term borrowings, and other accrued liabilities at
June 30, 2012
and
2011
approximate fair value due to their short-term maturities.
Cash balances are invested in accordance with our investment policy. These investments are exposed to market risk from interest rate fluctuations and credit risk from the underlying issuers, although this is mitigated through diversification.
We have investments in fixed income corporate debt securities, which are classified as held-to-maturity as we have the intent and ability to hold these investments until maturity. These investments are held at amortized cost, which approximates fair value. The fair value is estimated based on either the quoted market prices for the same or similar issues or other inputs derived from available market information, which represents a Level 2 measurement. The current portion of
$72 million
and
$93 million
at
June 30, 2012
and
2011
, respectively, is included within prepaid expenses and other in the consolidated balance sheets. The long-term portion of
$49 million
at
June 30, 2011
is included within other assets in the consolidated balance sheets. The investments that we currently hold vary in maturity date, ranging from
one
to
six months
, and pay interest semi-annually.
The following table summarizes the estimated fair value of our long-term obligations and other short-term borrowings compared to the respective carrying amounts at
June 30, 2012
and
2011
:
|
(in millions)
|
2012
|
2011
|
|||||
|
Long-term obligations and other short-term borrowings
|
$
|
3,075
|
|
$
|
2,619
|
|
|
|
Carrying amount
|
2,894
|
|
2,502
|
|
|||
The fair value of our long-term obligations and other short-term borrowings is estimated based on either the quoted market prices for the same or similar issues or other inputs derived from available market information, which represents a Level 2 measurement.
The following is a summary of the fair value gain/(loss) of our derivative instruments, based upon the estimated amount that we would receive (or pay) to terminate the contracts as of
June 30, 2012
and
2011
. The fair values are based on quoted market prices for the same or similar instruments. See Note 12 for further information regarding fair value measurements.
|
|
June 30, 2012
|
June 30, 2011
|
|||||||||||||
|
(in millions)
|
Notional
Amount |
Fair Value
Gain/(Loss) |
Notional
Amount |
Fair Value
Gain/(Loss) |
|||||||||||
|
Interest rate swaps
|
$
|
773
|
|
$
|
49
|
|
$
|
1,256
|
|
$
|
32
|
|
|||
|
Foreign currency contracts
|
658
|
|
1
|
|
555
|
|
(2
|
)
|
|||||||
|
Commodity contracts
|
23
|
|
(1
|
)
|
32
|
|
2
|
|
|||||||
45
12. Fair Value Measurements
Fair value is defined as the price that would be received upon selling an asset or the price paid to transfer a liability on the measurement date. It focuses on the exit price in the principal or most advantageous market for the asset or liability in an orderly transaction between willing market participants. A three-tier fair value hierarchy is established as a basis for considering such assumptions and for inputs used in the valuation methodologies in measuring fair value. This hierarchy requires entities to maximize the use of observable inputs and minimize the use of unobservable inputs. The three levels of inputs used to measure fair values are as follows:
|
Level 1 -
|
Observable prices in active markets for identical assets and liabilities.
|
|
Level 2 -
|
Observable inputs other than quoted prices in active markets for identical assets and liabilities.
|
|
Level 3 -
|
Unobservable inputs that are supported by little or no market activity and that are significant to the fair value of the assets and liabilities.
|
Recurring Fair Value Measurements
The following table presents the fair values for those assets and (liabilities) measured on a recurring basis at
June 30, 2012
:
|
|
Fair Value Measurements
|
||||||||||||||
|
(in millions)
|
Level 1
|
Level 2
|
Level 3
|
Total
|
|||||||||||
|
Cash Equivalents (1)
|
$
|
997
|
|
$
|
—
|
|
$
|
—
|
|
$
|
997
|
|
|||
|
Forward Contracts (2)
|
—
|
|
49
|
|
—
|
|
49
|
|
|||||||
|
Other Investments (3)
|
78
|
|
—
|
|
—
|
|
78
|
|
|||||||
|
Contingent Consideration Obligation (4)
|
—
|
|
—
|
|
(4
|
)
|
(4
|
)
|
|||||||
|
Total
|
$
|
1,075
|
|
$
|
49
|
|
$
|
(4
|
)
|
$
|
1,120
|
|
|||
The following table presents the fair values for those assets and (liabilities) measured on a recurring basis at
June 30, 2011
:
|
|
Fair Value Measurements
|
||||||||||||||
|
(in millions)
|
Level 1
|
Level 2
|
Level 3
|
Total
|
|||||||||||
|
Cash Equivalents (1)
|
$
|
1,066
|
|
$
|
—
|
|
$
|
—
|
|
$
|
1,066
|
|
|||
|
Forward Contracts (2)
|
—
|
|
32
|
|
—
|
|
32
|
|
|||||||
|
Other Investments (3)
|
80
|
|
—
|
|
—
|
|
80
|
|
|||||||
|
Contingent Consideration Obligation (4)
|
—
|
|
—
|
|
(75
|
)
|
(75
|
)
|
|||||||
|
Total
|
$
|
1,146
|
|
$
|
32
|
|
$
|
(75
|
)
|
$
|
1,103
|
|
|||
|
(1)
|
Cash equivalents are comprised of highly liquid investments purchased with a maturity of three months or less. The carrying value of these cash equivalents approximates fair value due to their short-term maturities.
|
|
(2)
|
The fair value of foreign currency contracts, commodity contracts and interest rate swaps is determined based on the present value of expected future cash flows considering the risks involved, including non-performance risk, and using discount rates appropriate for the respective maturities. Observable Level 2 inputs are used to determine the present value of expected future cash flows.
|
|
(3)
|
The other investments balance includes investments in mutual funds, which are used to offset fluctuations in deferred compensation liabilities. These mutual funds primarily invest in the equity securities of companies with large market capitalization and high quality fixed income debt securities. The fair value of these investments is determined using quoted market prices.
|
|
(4)
|
The contingent consideration obligation was incurred in connection with the acquisition of P4 Healthcare. See Note 2 for additional information regarding the contingent consideration obligation related to the P4 Healthcare acquisition including an explanation of the reduction in the estimated fair value during fiscal
2012
. The fair value of the contingent consideration obligation was determined based on a probability-weighted income approach derived from EBITDA estimates and probability assessments with respect to the likelihood of achieving the various EBITDA targets. The fair value measurement was based on significant inputs unobservable in the market and thus represents a Level 3 measurement. At each reporting date, we revalued the contingent consideration obligation to estimated fair value. Changes in the fair value of the contingent consideration obligation resulted from changes in the terms of the contingent payments, changes in discount periods and rates, changes in the timing and amount of EBITDA estimates, and changes in probability assumptions with respect to the timing and likelihood of achieving the EBITDA targets. As a result of changes in our estimate of performance in future periods due in large part to the loss of revenue from a significant customer of the P4 Healthcare legacy business in fiscal 2012, we revised the timing and amount of EBITDA estimates and made changes in probability assumptions with respect to the likelihood of achieving the EBITDA targets.
|
The following table presents a reconciliation of those liabilities measured at fair value on a recurring basis using unobservable inputs (Level 3):
|
(in millions)
|
Contingent Consideration Obligation
|
||
|
Carrying value at June 30, 2011
|
$
|
75
|
|
|
Realized gain, net (1)
|
(71
|
)
|
|
|
Carrying value at June 30, 2012
|
$
|
4
|
|
|
(1)
|
Reflects changes in our estimate of performance in future measurement periods offset by implied interest for the period. Amount is included in acquisition-related costs in the consolidated statements of earnings.
|
13. Shareholders' Equity
At
June 30, 2012
and
2011
, authorized capital shares consisted of the following:
750 million
Class A common shares, without par value;
5 million
Class B common shares, without par value; and
500 thousand
non-voting preferred shares, without par value. The Class A common shares and Class B common shares are collectively referred to below as “Common Shares”. Holders of Common Shares are entitled to share equally in any dividends declared by the Board of Directors and to participate equally in all distributions of assets upon liquidation. Generally, the holders of Class A common shares are entitled to
one vote
per share, and the holders of Class B common shares are entitled to
one-fifth of one vote
per share on proposals presented to shareholders for vote. Under certain circumstances, the holders of Class B common shares are entitled to vote as a separate class. Only Class A common shares were outstanding as of
June 30, 2012
and
2011
.
We repurchased
$950 million
of our Common Shares, in aggregate, through share repurchase programs during fiscal
2012
,
2011
and
2010
, as described below. We funded the repurchases through available cash. The Common Shares repurchased are held in treasury to be used for general corporate purposes.
46
Fiscal 2012
During fiscal 2012, we repurchased
10.3 million
Common Shares having an aggregate cost of
$450 million
. The average price paid per Common Share for all Common Shares repurchased during fiscal 2012 was
$43.64
.
Fiscal 2011
During the three months ended
September 30, 2010
, we repurchased
7.5 million
Common Shares having an aggregate cost of
$250 million
. The average price paid per Common Share for all Common Shares repurchased during fiscal 2011 was
$33.22
.
Fiscal 2010
During fiscal 2010, we repurchased
7.4 million
Common Shares having an aggregate cost of
$250 million
, of which
$20 million
cash settled in fiscal 2011. The average price paid per Common Share for all Common Shares repurchased during fiscal 2010 was
$33.85
.
14. Earnings Per Share
The following table reconciles the number of Common Shares used to compute Basic EPS and Diluted EPS for fiscal
2012
,
2011
and
2010
:
|
(in millions)
|
2012
|
2011
|
2010
|
|||||
|
Weighted-average Common Shares–basic
|
345
|
|
349
|
|
359
|
|
||
|
Effect of dilutive securities:
|
||||||||
|
Employee stock options, restricted shares and restricted share units
|
4
|
|
4
|
|
2
|
|
||
|
Weighted-average Common Shares–diluted
|
349
|
|
353
|
|
361
|
|
||
The potentially dilutive employee stock options that were antidilutive for fiscal
2012
,
2011
and
2010
were approximately
10 million
,
11 million
and
19 million
, respectively.
15. Segment Information
Our operations are principally managed on a products and services basis and are comprised of
two
operating segments which are the same as our reportable segments: Pharmaceutical and Medical. The factors for determining the reportable segments include the manner in which management evaluates our performance combined with the nature of the individual business activities. The accounting policies of the segments are the same as those described in Note 1.
Effective the first quarter of fiscal 2012, we began reporting the operating results of certain operations previously reported within the Pharmaceutical segment, including portions of our Cardinal Health China and Cardinal Health Puerto Rico subsidiaries, within the Medical segment to better align reported results with the nature of the services provided. Prior period financial results have not been adjusted because the change in reporting was not significant to previously reported segment results.
The Pharmaceutical segment distributes branded and generic pharmaceutical, specialty pharmaceutical, over-the-counter healthcare and consumer products. It also operates nuclear pharmacies and cyclotron facilities that prepare and deliver radiopharmaceuticals for use in nuclear imaging and other procedures in hospitals and clinics. In addition, this segment franchises retail pharmacies and provides pharmacy services to hospitals and other healthcare facilities. Through our Cardinal Health China business, this segment imports and distributes pharmaceuticals, over-the-counter and consumer products as well as provides services in China.
The Medical segment develops, manufactures, sources and distributes medical, surgical and laboratory products. Our medical and surgical products are sold directly or through third-party distributors in the United States, Canada, Europe, South America, China and other parts of the Asia/Pacific region.
The following table includes revenue for each reportable segment and reconciling items necessary to agree to amounts reported in the consolidated financial statements:
|
(in millions)
|
2012
|
2011
|
2010
|
||||||||
|
Pharmaceutical
|
$
|
97,925
|
|
$
|
93,744
|
|
$
|
89,790
|
|
||
|
Medical
|
9,642
|
|
8,922
|
|
8,750
|
|
|||||
|
Total segment revenue
|
107,567
|
|
102,666
|
|
98,540
|
|
|||||
|
Corporate (1)
|
(15
|
)
|
(22
|
)
|
(37
|
)
|
|||||
|
Total consolidated revenue
|
$
|
107,552
|
|
$
|
102,644
|
|
$
|
98,503
|
|
||
|
(1)
|
Corporate revenue consists of the elimination of inter-segment revenue.
|
We evaluate segment performance based upon segment profit, among other measures. Segment profit is segment revenue, less segment cost of products sold, less segment SG&A expense. Segment SG&A expenses include equity share-based compensation expense as well as allocated corporate expenses for shared functions, including corporate management, corporate finance, financial shared services, human resources, information technology, legal and an integrated hospital sales organization. Corporate expenses are allocated to the segments based upon headcount, level of benefit provided and ratable allocation. Information about interest income and expense and income taxes is not provided at the segment level.
47
Restructuring and employee severance, acquisition-related costs, impairments and loss on disposal of assets, litigation (recoveries)/charges, net, certain investment and other spending are not allocated to the segments. See Notes 2, 3, 4 and 9, respectively for further discussion of our acquisition-related costs, restructuring and employee severance, impairments and loss on disposal of assets and litigation (recoveries)/charges, net and Note 1 for a discussion of the reclassification of amortization of acquisition-related intangible assets. Investment spending generally includes the first year spend for certain projects that require incremental strategic investments in the form of additional operating expenses. We encourage our segments to identify investment projects that will promote innovation and provide future returns. As approval decisions for such projects are dependent upon executive management, the expenses for such projects are often retained at Corporate. Investment spending within Corporate was
$21 million
,
$14 million
and
$26 million
for fiscal
2012
,
2011
and
2010
, respectively. Spin-Off costs included in SG&A expenses of
$2 million
,
$10 million
and
$11 million
for fiscal
2012
,
2011
and
2010
, respectively, are not allocated to our segments.
The following table includes segment profit by reportable segment and reconciling items necessary to agree to amounts reported in the consolidated financial statements:
|
(in millions)
|
2012
|
2011
|
2010
|
||||||||
|
Pharmaceutical
|
$
|
1,558
|
|
$
|
1,329
|
|
$
|
1,011
|
|
||
|
Medical
|
332
|
|
373
|
|
429
|
|
|||||
|
Total segment profit
|
1,890
|
|
1,702
|
|
1,440
|
|
|||||
|
Corporate
|
(98
|
)
|
(188
|
)
|
(133
|
)
|
|||||
|
Total consolidated operating earnings
|
$
|
1,792
|
|
$
|
1,514
|
|
$
|
1,307
|
|
||
The following tables include depreciation and amortization and capital expenditures for fiscal
2012
,
2011
and
2010
for each segment:
|
(in millions)
|
2012
|
2011
|
2010
|
||||||||
|
Pharmaceutical
|
$
|
42
|
|
$
|
42
|
|
$
|
41
|
|
||
|
Medical
|
72
|
|
62
|
|
63
|
|
|||||
|
Corporate
|
211
|
|
209
|
|
150
|
|
|||||
|
Total depreciation and amortization
|
$
|
325
|
|
$
|
313
|
|
$
|
254
|
|
||
|
(in millions)
|
2012
|
2011
|
2010
|
||||||||
|
Pharmaceutical
|
$
|
44
|
|
$
|
55
|
|
$
|
33
|
|
||
|
Medical
|
100
|
|
123
|
|
81
|
|
|||||
|
Corporate
|
119
|
|
113
|
|
146
|
|
|||||
|
Total capital expenditures
|
$
|
263
|
|
$
|
291
|
|
$
|
260
|
|
||
The following table includes total assets at
June 30, 2012
,
2011
and
2010
for each segment as well as reconciling items necessary to total the amounts reported in the consolidated financial statements:
|
(in millions)
|
2012
|
2011
|
2010
|
||||||||
|
Pharmaceutical
|
$
|
16,642
|
|
$
|
16,126
|
|
$
|
12,103
|
|
||
|
Medical
|
4,399
|
|
3,895
|
|
3,868
|
|
|||||
|
Corporate
|
3,219
|
|
2,825
|
|
4,019
|
|
|||||
|
Total consolidated assets
|
$
|
24,260
|
|
$
|
22,846
|
|
$
|
19,990
|
|
||
The following tables present revenue and net property and equipment for fiscal
2012
,
2011
and
2010
by geographic area:
|
(in millions)
|
2012
|
2011
|
2010
|
||||||||
|
United States
|
$
|
105,205
|
|
$
|
101,080
|
|
$
|
97,663
|
|
||
|
International
|
2,347
|
|
1,564
|
|
840
|
|
|||||
|
Total consolidated revenue
|
$
|
107,552
|
|
$
|
102,644
|
|
$
|
98,503
|
|
||
|
(in millions)
|
2012
|
2011
|
2010
|
||||||||
|
United States
|
$
|
1,425
|
|
$
|
1,398
|
|
$
|
1,355
|
|
||
|
International
|
126
|
|
114
|
|
114
|
|
|||||
|
Total consolidated property and equipment, net
|
$
|
1,551
|
|
$
|
1,512
|
|
$
|
1,469
|
|
||
16. Share-Based Compensation and Savings Plans
Share-Based Compensation Plans
We maintain stock incentive plans (collectively, the “Plans”) for the benefit of certain of our officers, directors and employees. At June 30, 2012,
42 million
shares remain available for future issuances under the Plans. This amount includes
33 million
shares available under the Cardinal Health, Inc. 2011 Long-Term Incentive Plan (“2011 LTIP”),
1 million
shares available under the Cardinal Health, Inc. 2007 Nonemployee Directors Equity Incentive Plan and
8 million
shares available under our employee stock purchase plans which were indefinitely suspended in May 2009. The number of shares authorized for issuance under the 2011 LTIP will increase by shares that are not issued under outstanding equity awards. The 2011 LTIP contains fungible share counting provisions. Under these provisions, stock options are counted against the plan as
one share
for every share issued; awards other than stock options are counted against the plan as
two and one-half shares
for every share issued. This means that only
13 million
shares could be issued under awards other than stock options while
33 million
shares could be issued under stock options.
48
The following table provides total share-based compensation expense from continuing operations by type of award for fiscal
2012
,
2011
and
2010
:
|
(in millions)
|
2012
|
2011
|
2010 (1)
|
||||||||
|
Restricted share and share unit expense
|
$
|
55
|
|
$
|
52
|
|
$
|
57
|
|
||
|
Employee stock option expense
|
25
|
|
26
|
|
41
|
|
|||||
|
Performance share unit expense
|
6
|
|
—
|
|
—
|
|
|||||
|
Employee stock purchase plan expense
|
—
|
|
—
|
|
1
|
|
|||||
|
Stock appreciation right (income)/expense
|
(1
|
)
|
2
|
|
1
|
|
|||||
|
Total share-based compensation expense from continuing operations
|
$
|
85
|
|
$
|
80
|
|
$
|
100
|
|
||
|
(1)
|
Excludes share-based compensation expense charged to discontinued operations, which was approximately
$2 million
, net of tax, during fiscal 2010. Share-based compensation expense charged to restructuring and employee severance related to the Spin-Off was approximately
$10 million
, net of tax, during fiscal 2010.
|
The total tax benefit from continuing operations related to share-based compensation was
$31 million
,
$29 million
and
$36 million
for fiscal
2012
,
2011
and
2010
, respectively.
Stock Options
Employee stock options granted under the Plans generally vest in equal annual installments over
three years
and are exercisable for periods ranging from
seven
to
ten years
from the date of grant. All employee stock options are exercisable at a price equal to the market value of the Common Shares underlying the option at the date of grant.
The following summarizes all stock option transactions under the Plans from
June 30, 2010
through
June 30, 2012
:
|
(in millions, except per share amounts)
|
Stock Options
Outstanding
|
Weighted Average
Exercise Price per
Common Share
|
||||
|
Balance at June 30, 2010
|
24
|
|
$
|
37.88
|
|
|
|
Granted
|
4
|
|
31.07
|
|
||
|
Exercised
|
(3
|
)
|
30.16
|
|
||
|
Canceled and forfeited
|
(2
|
)
|
43.34
|
|
||
|
Balance at June 30, 2011
|
23
|
|
$
|
37.02
|
|
|
|
Granted
|
2
|
|
41.58
|
|
||
|
Exercised
|
(2
|
)
|
30.26
|
|
||
|
Canceled and forfeited
|
(2
|
)
|
47.19
|
|
||
|
Balance at June 30, 2012
|
21
|
|
$
|
37.29
|
|
|
|
Exercisable at June 30, 2012
|
15
|
|
$
|
38.80
|
|
|
The following table provides data related to all stock option activity for fiscal
2012
,
2011
and
2010
:
|
(in millions, except per share amounts)
|
2012
|
2011
|
2010
|
||||||||
|
Weighted-average grant date fair value per stock option
|
$
|
9.26
|
|
$
|
6.40
|
|
$
|
6.44
|
|
||
|
Aggregate intrinsic value of exercised options
|
27
|
|
26
|
|
7
|
|
|||||
|
Aggregate intrinsic value of outstanding options at period end
|
137
|
|
217
|
|
57
|
|
|||||
|
Cash received upon exercise
|
42
|
|
63
|
|
40
|
|
|||||
|
Cash tax disbursements realized related to exercise
|
(4
|
)
|
(14
|
)
|
(16
|
)
|
|||||
|
Total compensation cost, net of estimated forfeitures, related to unvested stock options not yet recognized, pre-tax
|
25
|
|
29
|
|
32
|
|
|||||
|
Weighted-average period over which stock option compensation cost is expected to be recognized in years
|
2
|
|
2
|
|
2
|
|
|||||
|
Weighted-average remaining contractual life in years
|
3
|
|
4
|
|
4
|
|
|||||
The fair values of the stock options granted to our employees and directors during fiscal
2012
,
2011
and
2010
were estimated on the date of grant using a lattice valuation model. We believe the lattice model provides reasonable estimates because it has the ability to take into account individual exercise patterns based on changes in our stock price and other variables and it provides for a range of input assumptions, which are disclosed in the table below. The risk-free rate is based on the United States Treasury yield curve at the time of the grant. We analyzed historical data to estimate option exercise behaviors and employee terminations to be used within the lattice model. The expected life of the options granted was calculated from the option valuation model and represents the length of time in years that the options granted are expected to be outstanding. Expected volatilities are based on implied volatility from traded options on our Common Shares and historical volatility over a period of time commensurate with the contractual term of the option grant (up to
ten years
). The following table provides the range of assumptions used for options valued during fiscal
2012
,
2011
and
2010
:
|
2012
|
2011
|
2010
|
|||||||||
|
Risk-free interest rate
|
1.2%
|
-
|
1.3%
|
1.2%
|
-
|
1.7%
|
1.9%
|
-
|
2.5%
|
||
|
Expected volatility
|
29%
|
27%
|
-
|
32%
|
32%
|
||||||
|
Dividend yield
|
2.0%
|
-
|
2.1%
|
2.2%
|
-
|
2.5%
|
2.0%
|
-
|
2.8%
|
||
|
Expected life in years
|
6
|
5
|
4
|
-
|
5
|
||||||
49
Restricted Shares and Restricted Share Units
Restricted shares and restricted share units granted under the Plans generally vest in equal installments over
three years
. The fair value is determined by the grant date market price of our Common Shares. Restricted shares and restricted share units accrue dividends or cash dividend equivalents that are payable upon vesting of the awards.
The following table summarizes all transactions related to restricted shares and restricted share units under the Plans from
June 30, 2010
through
June 30, 2012
:
|
(in millions, except per share amounts)
|
Shares
|
Weighted Average
Grant Date Fair
Value per Share
|
||||
|
Nonvested at June 30, 2010
|
3
|
|
$
|
33.33
|
|
|
|
Granted
|
2
|
|
31.42
|
|
||
|
Vested
|
(1
|
)
|
36.11
|
|
||
|
Canceled and forfeited
|
—
|
|
—
|
|
||
|
Nonvested at June 30, 2011
|
4
|
|
$
|
31.31
|
|
|
|
Granted
|
2
|
|
41.67
|
|
||
|
Vested
|
(2
|
)
|
32.50
|
|
||
|
Canceled and forfeited
|
—
|
|
—
|
|
||
|
Nonvested at June 30, 2012
|
4
|
|
$
|
35.46
|
|
|
The following table provides data related to all restricted share and restricted share unit activity for fiscal
2012
,
2011
and
2010
:
|
(in millions)
|
2012
|
2011
|
2010
|
||||||||
|
Total compensation cost, net of estimated forfeitures, related to nonvested restricted share and share unit awards not yet recognized, pre-tax
|
$
|
67
|
|
$
|
56
|
|
$
|
58
|
|
||
|
Weighted-average period in years over which restricted share and share unit cost is expected to be recognized
|
2
|
|
2
|
|
2
|
|
|||||
Performance Share Units
Beginning in fiscal
2012
, performance share units were granted under the Plans, which represent Common Shares potentially issuable in the future. Performance share units generally vest over
two
-year and
three
-year performance periods based on achievement of specific performance goals. Based on the extent to which the targets are achieved, vested shares may range from
0 percent
to
200 percent
of the target award amount. The fair value of performance share units is determined by the grant date market price of our Common Shares and the compensation expense associated with nonvested performance share units is dependent on our periodic assessment of the probability of the targets being achieved and our estimate of the number of shares that will ultimately be issued. Performance share units accrue cash dividend equivalents that are payable upon vesting of the awards.
The following table summarizes information related to performance share units under the Plans (based on target award amounts) from
June 30, 2011
through
June 30, 2012
:
|
(in millions, except per share amounts)
|
Performance
Share Units |
Weighted Average
Grant Date Fair
Value per Share
|
||||
|
Nonvested at June 30, 2011
|
—
|
|
$
|
—
|
|
|
|
Granted
|
1
|
|
42.60
|
|
||
|
Vested
|
—
|
|
—
|
|
||
|
Canceled and forfeited
|
—
|
|
—
|
|
||
|
Nonvested at June 30, 2012 (1)
|
1
|
|
$
|
42.60
|
|
|
The following table provides data related to all performance share unit activity for fiscal
2012
,
2011
and
2010
:
|
(in millions)
|
2012
|
||
|
Total compensation cost, net of estimated forfeitures, related to nonvested performance share units not yet recognized, pre-tax
|
$
|
12
|
|
|
Weighted-average period in years over which performance share unit cost is expected to be recognized
|
2
|
|
|
Adjustments to Stock Incentive Plans
In connection with the Spin-Off, on August 31, 2009, we adjusted share-based compensation awards granted under the Plans into awards based on our Common Shares and/or CareFusion common stock, as applicable. For purposes of the vesting of these equity awards, continued employment or service with us or with CareFusion is treated as continued employment for purposes of both our and CareFusion’s equity awards.
The adjustments to stock incentive plans were treated as a modification in accordance with share-based compensation accounting guidance and resulted in a total incremental compensation cost of
$1 million
.
The following table summarizes the stock options outstanding as of
June 30, 2012
:
|
(in millions)
|
Our Awards
|
CareFusion Awards
|
|||
|
Held by our employees and former employees
|
20
|
|
5
|
|
|
|
Held by CareFusion employees
|
1
|
|
|||
|
Total
|
21
|
|
|||
Employee Savings Plans
Substantially all of our domestic non-union employees are eligible to be enrolled in our company-sponsored contributory retirement savings plans, which include features under Section 401(k) of the Internal Revenue Code of 1986, as amended, and provide for matching and profit sharing contributions by us. Our contributions to the plans are determined by the Board of Directors subject to certain minimum requirements as specified in the plans. The total expense for our employee retirement savings plans was
$53 million
,
$70 million
and
$84 million
for fiscal
2012
,
2011
and
2010
, respectively.
50
17. Selected Quarterly Financial Data (Unaudited)
The following is selected quarterly financial data for fiscal
2012
and
2011
. The sum of the quarters may not equal year-to-date due to rounding.
|
(in millions, except per Common Share amounts)
|
First Quarter
|
Second Quarter
|
Third Quarter
|
Fourth Quarter
|
|||||||||||
|
Fiscal 2012
|
|||||||||||||||
|
Revenue
|
$
|
26,792
|
|
$
|
27,078
|
|
$
|
26,918
|
|
$
|
26,764
|
|
|||
|
Gross margin
|
1,084
|
|
1,114
|
|
1,207
|
|
1,136
|
|
|||||||
|
Distribution, selling, general and administrative expenses
|
644
|
|
640
|
|
683
|
|
712
|
|
|||||||
|
Earnings from continuing operations
|
237
|
|
264
|
|
332
|
|
236
|
|
|||||||
|
Earnings/(loss) from discontinued operations
|
—
|
|
(2
|
)
|
1
|
|
—
|
|
|||||||
|
Net earnings
|
237
|
|
262
|
|
333
|
|
236
|
|
|||||||
|
Earnings from continuing operations per Common Share:
|
|||||||||||||||
|
Basic
|
$
|
0.69
|
|
$
|
0.77
|
|
$
|
0.96
|
|
$
|
0.68
|
|
|||
|
Diluted
|
0.68
|
|
0.76
|
|
0.95
|
|
0.68
|
|
|||||||
|
(in millions, except per Common Share amounts)
|
First Quarter
|
Second Quarter
|
Third Quarter
|
Fourth Quarter
|
|||||||||||
|
Fiscal 2011
|
|||||||||||||||
|
Revenue
|
$
|
24,438
|
|
$
|
25,372
|
|
$
|
26,071
|
|
$
|
26,764
|
|
|||
|
Gross margin
|
962
|
|
994
|
|
1,162
|
|
1,044
|
|
|||||||
|
Distribution, selling, general and administrative expenses
|
581
|
|
607
|
|
670
|
|
671
|
|
|||||||
|
Earnings from continuing operations
|
294
|
|
215
|
|
250
|
|
207
|
|
|||||||
|
Earnings/(loss) from discontinued operations
|
1
|
|
—
|
|
(4
|
)
|
(4
|
)
|
|||||||
|
Net earnings
|
295
|
|
215
|
|
246
|
|
203
|
|
|||||||
|
Earnings from continuing operations per Common Share:
|
|||||||||||||||
|
Basic
|
$
|
0.84
|
|
$
|
0.62
|
|
$
|
0.72
|
|
$
|
0.59
|
|
|||
|
Diluted
|
0.84
|
|
0.61
|
|
0.71
|
|
0.58
|
|
|||||||
18. Subsequent Events
On
August 8, 2012
, our Board of Directors approved a new
$750 million
share repurchase program, which expires
August 31, 2015
, and canceled the share repurchase program which was to expire
November 30, 2013
.
51
None.
Evaluation of Disclosure Controls and Procedures
We evaluated, with the participation of our principal executive officer and principal financial officer, the effectiveness of our disclosure controls and procedures (as defined in Rule 13a-15(e) under the Securities Exchange Act of 1934 (the “Exchange Act”)) as of June 30, 2012. Based on this evaluation, our principal executive officer and principal financial officer have concluded that our disclosure controls and procedures were effective as of
June 30, 2012
, to provide reasonable assurance that information required to be disclosed in our reports under the Exchange Act is recorded, processed, summarized and reported within the time periods specified in the SEC rules and forms and that such information is accumulated and communicated to management to allow timely decisions regarding required disclosure.
Management’s Report on Internal Control Over Financial Reporting
Management is responsible for establishing and maintaining adequate internal control over financial reporting as defined in Rule 13a-15(f) under the Exchange Act. Our internal control system is designed to provide reasonable assurance regarding the reliability of financial reporting and the preparation of financial statements for external purposes in accordance with generally accepted accounting principles. Because of its inherent limitations, internal control over financial reporting may not prevent or detect misstatements. Also controls deemed effective now may become inadequate in the future because of changes in conditions, or because compliance with the policies or procedures has deteriorated or been circumvented.
Management assessed the effectiveness of our internal control over financial reporting as of
June 30, 2012
. In making this assessment, management used the criteria established in Internal Control-Integrated Framework issued by the Committee of Sponsoring Organizations of the Treadway Commission (the “COSO criteria”). Based on management’s assessment and the COSO criteria, management believes that our internal control over financial reporting was effective as of
June 30, 2012
.
Our independent registered public accounting firm, Ernst & Young LLP, has issued a report on our internal control over financial reporting. Ernst & Young LLP’s report appears following Item 9A and expresses an unqualified opinion on the effectiveness of our internal control over financial reporting.
Changes in Internal Control Over Financial Reporting
During fiscal 2012, the Medical segment began implementing a business transformation project, which includes a new information system for certain supply chain and financial processes. The Medical segment plans to continue to transition selected processes to the new system in fiscal 2013. We have made, and will continue to make, changes to our internal control over financial reporting in connection with this project. During the quarter ended June 30, 2012, we established additional temporary compensating controls that are expected to support our internal control over financial reporting while the implementation and operation of the new information system is finalized. Except for those made in connection with the new information system, there were no other changes in our internal control over financial reporting during the quarter ended June 30, 2012 that have materially affected, or are reasonably likely to materially affect, our internal control over financial reporting.
52
Report of Independent Registered Public Accounting Firm
The Board of Directors and Shareholders of Cardinal Health, Inc.
We have audited Cardinal Health, Inc. and subsidiaries' internal control over financial reporting as of
June 30, 2012
, based on criteria established in Internal Control-Integrated Framework issued by the Committee of Sponsoring Organizations of the Treadway Commission (the COSO criteria). Cardinal Health, Inc.
and subsidiaries' management is responsible for maintaining effective internal control over financial reporting, and for its assessment of the effectiveness of internal control over financial reporting included in the accompanying “Management's Report on Internal Control Over Financial Reporting.” Our responsibility is to express an opinion on the company's internal control over financial reporting based on our audit.
We conducted our audit in accordance with the standards of the Public Company Accounting Oversight Board (United States). Those standards require that we plan and perform the audit to obtain reasonable assurance about whether effective internal control over financial reporting was maintained in all material respects. Our audit included obtaining an understanding of internal control over financial reporting, assessing the risk that a material weakness exists, testing and evaluating the design and operating effectiveness of internal control based on the assessed risk, and performing such other procedures as we considered necessary in the circumstances. We believe that our audit provides a reasonable basis for our opinion.
A company's internal control over financial reporting is a process designed to provide reasonable assurance regarding the reliability of financial reporting and the preparation of financial statements for external purposes in accordance with generally accepted accounting principles. A company's internal control over financial reporting includes those policies and procedures that (1) pertain to the maintenance of records that, in reasonable detail, accurately and fairly reflect the transactions and dispositions of the assets of the company; (2) provide reasonable assurance that transactions are recorded as necessary to permit preparation of financial statements in accordance with generally accepted accounting principles, and that receipts and expenditures of the company are being made only in accordance with authorizations of management and directors of the company; and (3) provide reasonable assurance regarding prevention or timely detection of unauthorized acquisition, use or disposition of the company's assets that could have a material effect on the financial statements.
Because of its inherent limitations, internal control over financial reporting may not prevent or detect misstatements. Also, projections of any evaluation of effectiveness to future periods are subject to the risk that controls may become inadequate because of changes in conditions, or that the degree of compliance with the policies or procedures may deteriorate.
In our opinion, Cardinal Health, Inc.
and subsidiaries maintained, in all material respects, effective internal control over financial reporting as of
June 30, 2012
, based on
the COSO criteria
.
We also have audited, in accordance with the standards of the Public Company Accounting Oversight Board (United States), the consolidated balance sheets of Cardinal Health, Inc. and subsidiaries
as of
June 30, 2012
and
2011
and the related consolidated statements of earnings, shareholders' equity and cash flows for each of the three years in the period ended
June 30, 2012
of Cardinal Health, Inc. and subsidiaries and our report dated
August 22, 2012
expressed an unqualified opinion thereon.
|
/s/ Ernst & Young, LLP
|
|
Ernst & Young LLP
|
|
Columbus, Ohio
|
|
August 22, 2012
|
53
54
In addition to the information set forth under the caption “Executive Officers of the Registrant” in Part I of this Form 10-K and set forth below regarding our Standards of Business Conduct, the information called for in this Item 10 is incorporated by reference to our Definitive Proxy Statement (which will be filed with the SEC pursuant to Regulation 14A under the Exchange Act) relating to
2012
Annual Meeting of Shareholders (our “
2012
Proxy Statement”) under the captions “Proposal 1—Election of Directors,” “Section 16(a) Beneficial Ownership Reporting Compliance” and “Board of Directors and Committees of the Board.”
We have adopted Standards of Business Conduct that apply to all of our directors, officers and employees. The Standards of Business Conduct outline our corporate values and standards of integrity and behavior and are designed to protect and promote our reputation. The full text of the Standards of Business Conduct is posted on the Investors page of our website at www.cardinalhealth.com.
Any waiver of the Standards of Business Conduct for directors or executive officers must be approved by the Audit Committee. We will disclose future amendments to our Standards of Business Conduct and waivers from the Standards of Business Conduct for our principal executive officer, principal financial officer, and principal accounting officer, or persons performing similar functions, and our other executive officers and directors on our website within four business days following the date of the amendment or waiver.
The information called for by this Item 11 is incorporated by reference to our
2012
Proxy Statement under the captions “Compensation Discussion and Analysis,” “Executive Compensation,” and “Director Compensation.”
The information related to Security Ownership of Certain Beneficial Owners called for by this Item 12 is incorporated by reference to our
2012
Proxy Statement under the caption “Security Ownership of Certain Beneficial Owners and Management.”
Certain of our equity compensation plans are subject to shareholder approval and other plans have been authorized solely by the Board. The following is a description of plans that have not been approved by shareholders.
Broadly-Based Equity Incentive Plan
The Cardinal Health, Inc. Broadly-based Equity Incentive Plan (the “BEIP”) was originally adopted by the Board in 1999. The term of the BEIP expired in 2005, and no new awards are being granted under it. The BEIP provided for grants in the form of nonqualified stock options, restricted shares, and restricted share units to employees except for those employees who were subject to Section 16 of the Exchange Act. The aggregate number of Common Shares authorized for issuance under the BEIP was 36 million.
Amended and Restated Outside Directors Equity Incentive Plan
The Cardinal Health, Inc. Amended and Restated Outside Directors Equity Incentive Plan (the “ODEIP”) was originally adopted by the Board in 2000. Our shareholders have approved a new director equity plan, the Cardinal Health, Inc. 2007 Nonemployee Directors Equity Incentive Plan (the "Director EIP"), and no new awards may be granted under the ODEIP. The ODEIP provided for grants in the form of nonqualified stock options, restricted shares, and restricted share units to members of the Board who were not employees. The aggregate number of Common Shares authorized for issuance under the ODEIP was 1.5 million.
55
Global Employee Stock Purchase Plan
The Global Employee Stock Purchase Plan (the “GESPP”) was originally adopted by the Board in 2000. The GESPP permits certain international employees to purchase Common Shares through payroll deductions. The total number of Common Shares made available for purchase under the GESPP was 4.5 million. In May 2009, the GESPP was indefinitely suspended. The table below summarizes information relating to our equity compensation plans at June 30, 2012.
|
Equity Compensation Plan Information
|
||||||
|
Plan Category
|
Common Shares
to be Issued
Upon Exercise of Outstanding Options and Rights
|
Weighted Average
Exercise Price of Outstanding Options
|
Common Shares
Remaining Available
for Future Issuance
Under Equity
Compensation Plans(excluding securities
reflected in column (a))
|
|||
|
(a)
|
(b)
|
(c)
|
||||
|
Equity compensation plans approved by shareholders
|
21,509,121
(1)
|
$37.48
(1)
|
37,944,721
(2)(3)
|
|||
|
Equity compensation plans not approved by shareholders
(4)
|
3,149,024
(5)
|
$39.54
(5)
|
4,082,309
(6)
|
|||
|
Total at June 30, 2012
|
24,658,145
|
$37.79
|
42,027,030
|
|||
|
(1)
|
In addition to stock options outstanding under the Cardinal Health, Inc. 2011 Long-Term Incentive Plan (the “2011 LTIP”), the Cardinal Health, Inc. 2005 Long Term Incentive Plan, as amended (the “2005 LTIP”), Amended and Restated Equity Incentive Plan (the “EIP”), and the Director EIP, also includes 70,595 stock rights outstanding under the 2011 LTIP, 3,176,914 stock rights outstanding under the 2005 LTIP, 8,605 stock rights outstanding under the EIP, and 127,878 stock rights outstanding under the Director EIP that are payable solely in Common Shares. Stock rights do not have an exercise price, and therefore were not included for purposes of computing the weighted-average exercise price.
|
|
(2)
|
Includes 32,536,394 Common Shares available under the 2011 LTIP in the form of stock options and other stock-based awards. The number of shares authorized for issuance under the 2011 LTIP will increase by shares that are not issued under outstanding equity awards. The 2011 LTIP contains fungible share counting provisions. Under these provisions, stock options are counted against the plan as one share for every Common Share issued; awards other than stock options are counted against the plan as two and one-half shares for every Common Share issued. This means that only 13,014,557 shares could be issued under awards other than stock options while 32,536,394 shares could be issued under stock options.
|
|
(3)
|
In addition to Common Shares remaining available under the 2011 LTIP, this also includes 800,452 Common Shares remaining available for future issuance under the Director EIP in the form of stock options and other stock-based awards and 4,607,875 Common Shares remaining available for future issuance under the Employee Stock Purchase Plan. In May 2009, the Employee Stock Purchase Plan was indefinitely suspended.
|
|
(4)
|
Does not include stock options to purchase 96,416 Common Shares at a weighted-average exercise price of $33.80 that we assumed in connection with acquisition transactions.
|
|
(5)
|
In addition to stock options outstanding under the BEIP and ODEIP, also includes 9,891 stock rights outstanding under the ODEIP that are payable solely in Common Shares. Stock rights do not have an exercise price, and therefore were not included for purposes of computing the weighted-average exercise price.
|
|
(6)
|
Solely consists of 4,082,309 Common Shares remaining available for future issuance under the GESPP. In May 2009, the GESPP was indefinitely suspended.
|
The information called for by this Item 13 is incorporated by reference to our
2012
Proxy Statement under the captions “Certain Relationships and Related Transactions” and “Corporate Governance.”
The information called for by this Item 14 is incorporated by reference to our
2012
Proxy Statement under the captions “Independent Accountants.”
56
(
a)(1) The following financial statements are included in Item 8 of this report:
|
|
Page
|
|
Financial Statements:
|
|
(a)(2) The following Supplemental Schedule is included in this report:
All other schedules not listed above have been omitted as not applicable or because the required information is included in the Consolidated Financial Statements or in notes thereto.
(a)(3) Exhibits required by Item 601 of Regulation S-K:
|
Exhibit
Number
|
Exhibit Description
|
|
2.1
|
Stock Purchase Agreement, dated November 17, 2010, by and among Kinray, Inc., Stewart J. Rahr Revocable Trust and Cardinal Health, Inc. (incorporated by reference to Exhibit 2.1 to Cardinal Health’s Current Report on Form 8-K, filed on November 18, 2010, File No. 1-11373)
|
|
3.1
|
Amended and Restated Articles of Incorporation of Cardinal Health, Inc., as amended (incorporated by reference to Exhibit 3.1 to Cardinal Health’s Quarterly Report on Form 10-Q for the quarter ended September 30, 2008, File No. 1-11373)
|
|
3.2
|
Cardinal Health, Inc. Restated Code of Regulations, as amended (incorporated by reference to Exhibit 3.2 to Cardinal Health’s Current Report on Form 8-K filed on August 10, 2012, File No. 1-11373)
|
|
4.1
|
Specimen Certificate for Common Shares of Cardinal Health, Inc. (incorporated by reference to Exhibit 4.01 to Cardinal Health’s Annual Report on Form 10-K for the fiscal year ended June 30, 2001, File No. 1-11373)
|
|
4.2.1
|
Indenture, dated as of April 18, 1997, between Cardinal Health, Inc. and Bank One, Columbus, NA, Trustee (incorporated by reference to Exhibit 1 to Cardinal Health’s Current Report on Form 8-K filed on April 21, 1997, File No. 1-11373)
|
|
4.2.2
|
Supplemental Indenture, dated October 3, 2006, between Cardinal Health, Inc. and The Bank of New York Trust Company, N.A., (successor to J.P. Morgan Trust Company, National Association, successor to Bank One, N.A., formerly known as Bank One, Columbus, N.A.), as trustee (incorporated by reference to Exhibit 4.3 to Cardinal Health’s Current Report on Form 8-K filed on October 4, 2006, File No. 1-11373)
|
|
4.2.3
|
Second Supplemental Indenture, dated June 8, 2007, between Cardinal Health, Inc. and The Bank of New York Trust Company, N.A., (successor to J.P. Morgan Trust Company, National Association, successor to Bank One, N.A., formerly known as Bank One, Columbus, N.A.), as trustee (incorporated by reference to Exhibit 4.01 to Cardinal Health’s Current Report on Form 8-K filed on June 8, 2007, File No. 1-11373)
|
|
4.2.4
|
4.00% Notes due 2015 (incorporated by reference to Exhibit 4.2.8 to Cardinal Health’s Annual Report on Form 10-K for the fiscal year ended June 30, 2008, File No. 1-11373)
|
|
4.2.5
|
5.85% Notes due 2017 (incorporated by reference to Exhibit 4.2.9 to Cardinal Health’s Annual Report on Form 10-K for the fiscal year ended June 30, 2008, File No. 1-11373)
|
|
4.2.6
|
5.80% Notes due 2016 (incorporated by reference to Exhibit 4.2.11 to Cardinal Health’s Annual Report on Form 10-K for the fiscal year ended June 30, 2008, File No. 1-11373)
|
|
4.2.7
|
6.00% Notes due 2017 (incorporated by reference to Exhibit 4.2.12 to Cardinal Health’s Annual Report on Form 10-K for the fiscal year ended June 30, 2008, File No. 1-11373)
|
|
4.3.1
|
Indenture, dated as of June 2, 2008, between Cardinal Health, Inc. and The Bank of New York Trust Company, N.A. (incorporated by reference to Exhibit 4.1 to Cardinal Health’s Current Report on Form 8-K filed on June 2, 2008, File No. 1-11373)
|
|
4.3.2
|
5.50% Notes due 2013 (incorporated by reference to Exhibit 4.2 to Cardinal Health’s Current Report on Form 8-K filed on June 2, 2008, File No. 1-11373)
|
|
4.3.3
|
4.625% Notes due 2020 (incorporated by reference to Exhibit 4.1 to Cardinal Health’s Current Report on Form 8-K filed on December 14, 2010, File No. 1-11373)
|
|
4.3.4
|
1.900% Notes due 2017 (incorporated by reference to Exhibit 4.1 to Cardinal Health's Current Report on Form 8-K filed on May 21, 2012, File No. 1-11373)
|
57
|
Exhibit
Number
|
Exhibit Description
|
|
4.3.5
|
3.200% Notes due 2022 (incorporated by reference to Exhibit 4.2 to Cardinal Health's Current Report on Form 8-K filed on May 21, 2012, File No. 1-11373)
|
|
4.4
|
Agreement to furnish to the Securities and Exchange Commission upon request a copy of instruments defining the rights of holders of certain long-term debt of Cardinal Health, Inc. and consolidated subsidiaries (incorporated by reference to Exhibit 4.07 to Cardinal Health’s Annual Report on Form 10-K for the fiscal year ended June 30, 2005, File No. 1-11373)
|
|
10.1.1
|
Cardinal Health, Inc. 2011 Long-Term Incentive Plan (incorporated by reference to Exhibit 10.1 to the Company’s Current Report on Form 8-K/A filed on November 4, 2011, File No. 1-11373)*
|
|
10.1.2
|
Form of Nonqualified Stock Option Agreement under the Cardinal Health, Inc. 2011 Long-Term Incentive Plan (grants made to executive officers in April 2012 and thereafter) (incorporated by reference to Exhibit 10.2 to the Company’s Current Report on Form 8-K/A filed on November 4, 2011, File No. 1-11373)*
|
|
10.1.3
|
Form of Nonqualified Stock Option Agreement under the Cardinal Health, Inc. 2011 Long-Term Incentive Plan (grants made to executive officers in August 2012 and thereafter)*
|
|
10.1.4
|
Form of Restricted Share Units Agreement under the Cardinal Health, Inc. 2011 Long-Term Incentive Plan (incorporated by reference to Exhibit 10.3 to the Company’s Current Report on Form 8-K/A filed on November 4, 2011, File No. 1-11373)*
|
|
10.1.5
|
Form of Performance Share Units Agreement under the Cardinal Health, Inc. 2011 Long-Term Incentive Plan (incorporated by reference to Exhibit 10.4 to the Company’s Current Report on Form 8-K/A filed on November 4, 2011, File No. 1-11373)*
|
|
10.2.1
|
Cardinal Health, Inc. 2005 Long-Term Incentive Plan, as amended (incorporated by reference to Exhibit 10.1 to Cardinal Health’s Quarterly Report on Form 10-Q for the quarter ended September 30, 2008, File No. 1-11373)*
|
|
10.2.2
|
First Amendment to Cardinal Health, Inc. 2005 Long-Term Incentive Plan, as amended (incorporated by reference to Exhibit 10.1.1 to Cardinal Health’s Quarterly Report on Form 10-Q for the quarter ended September 30, 2009, File No. 1-11373)*
|
|
10.2.3
|
Second Amendment to Cardinal Health, Inc. 2005 Long-Term Incentive Plan, as amended (incorporated by reference to Exhibit 10.1.2 to Cardinal Health’s Quarterly Report on Form 10-Q for the quarter ended September 30, 2009, File No. 1-11373)*
|
|
10.2.4
|
Form of Nonqualified Stock Option Agreement under the Cardinal Health, Inc. 2005 Long-Term Incentive Plan, as amended (grants made to executive officers in August 2006) (incorporated by reference to Exhibit 10.03 to Cardinal Health’s Current Report on Form 8-K filed on August 7, 2006, File No. 1-11373)*
|
|
10.2.5
|
Form of Nonqualified Stock Option Agreement under the Cardinal Health, Inc. 2005 Long-Term Incentive Plan, as amended (grants made to executive officers in August 2007) (incorporated by reference to Exhibit 10.2 to Cardinal Health’s Current Report on Form 8-K/A filed on August 13, 2007, File No. 1-11373)*
|
|
10.2.6
|
Form of Nonqualified Stock Option Agreement under the Cardinal Health, Inc. 2005 Long-Term Incentive Plan, as amended (grants made to executive officers in February and August 2008) (incorporated by reference to Exhibit 10.1 to Cardinal Health’s Quarterly Report on Form 10-Q for the quarter ended December 31, 2007, File No. 1-11373)*
|
|
10.2.7
|
Form of Nonqualified Stock Option Agreement under the Cardinal Health, Inc. 2005 Long-Term Incentive Plan, as amended (Stock Option Exchange Program grants made to executive officers in July 2009) (incorporated by reference to Exhibit 99(d)(2) to Cardinal Health’s Schedule TO-I filed on June 19, 2009)*
|
|
10.2.8
|
Form of Nonqualified Stock Option Agreement under the Cardinal Health, Inc. 2005 Long-Term Incentive Plan, as amended (grants made to executive officers in September 2009) (incorporated by reference to Exhibit 10.1.3 to Cardinal Health’s Quarterly Report on Form 10-Q for the quarter ended September 30, 2009, File No. 1-11373)*
|
|
10.2.9
|
Form of Nonqualified Stock Option Agreement under the Cardinal Health, Inc. 2005 Long-Term Incentive Plan, as amended (grants made to executive officers in August 2010 and August 2011) (incorporated by reference to Exhibit 10.1.11 to Cardinal Health’s Annual Report on Form 10-K for the fiscal year ended June 30, 2010, File No. 1-11373)*
|
|
10.2.10
|
Form of Restricted Share Units Agreement under the Cardinal Health, Inc. 2005 Long-Term Incentive Plan, as amended (grants made to executive officers in September 2009) (incorporated by reference to Exhibit 10.1.4 to Cardinal Health’s Quarterly Report on Form 10-Q for the quarter ended September 30, 2009, File No. 1-11373)*
|
|
10.2.11
|
Form of Restricted Share Units Agreement under the Cardinal Health, Inc. 2005 Long-Term Incentive Plan, as amended (grants made to executive officers in August 2010 (incorporated by reference to Exhibit 10.1.17 to Cardinal Health’s Annual Report on Form 10-K for the fiscal year ended June 30, 2010, File No. 1-11373)*
|
|
10.2.12
|
Form of Restricted Share Units Agreement under the Cardinal Health, Inc. 2005 Long-Term Incentive Plan, as amended (grants made to executive officers in August 2011) (incorporated by reference to Exhibit 10.1.12 to Cardinal Health's Annual Report on Form 10-K for the fiscal year ended June 30, 2011, File No. 1-11373)*
|
|
10.2.13
|
Form of Performance Share Units Agreement under the Cardinal Health, Inc. 2005 Long-Term Incentive Plan, as amended (grants made to executive officers in August 2011) (incorporated by reference to Exhibit 10.1 to Cardinal Health’s Current Report on Form 8-K filed on August 4, 2011, File No. 1-11373)*
|
|
10.2.14
|
Copy of resolutions adopted by the Human Resources and Compensation Committee of the Board of Directors on August 7, 2007 amending outstanding Nonqualified Stock Option Agreements under the Cardinal Health, Inc. 2005 Long-Term Incentive Plan, as amended (incorporated by reference to Exhibit 10.1.10 to Cardinal Health’s Annual Report on Form 10-K for the fiscal year ended June 30, 2007, File No. 1-11373)*
|
|
10.2.15
|
Copy of resolutions adopted by the Human Resources and Compensation Committee of the Board of Directors on November 6, 2007 amending outstanding Nonqualified Stock Option Agreements under the Cardinal Health, Inc. 2005 Long-Term Incentive Plan, as amended, the Cardinal Health, Inc. Amended and Restated Equity Incentive Plan, as amended, and the Cardinal Health, Inc. Broadly-based Equity Incentive Plan, as amended (incorporated by reference to Exhibit 10.3 to Cardinal Health’s Quarterly Report on Form 10-Q for the quarter ended December 31, 2007, File No. 1-11373)*
|
58
|
Exhibit
Number
|
Exhibit Description
|
|
10.2.16
|
Copy of resolutions adopted by the Human Resources and Compensation Committee of the Board of Directors on September 26, 2008 amending outstanding Nonqualified Stock Option Agreements under the Cardinal Health, Inc. 2005 Long-Term Incentive Plan, as amended, the Cardinal Health, Inc. Amended and Restated Equity Incentive Plan, as amended, and the Cardinal Health, Inc. Broadly-based Equity Incentive Plan, as amended (incorporated by reference to Exhibit 10.2 to Cardinal Health’s Quarterly Report on Form 10-Q for the quarter ended September 30, 2008, File No. 1-11373)*
|
|
10.3.1
|
Cardinal Health, Inc. Amended and Restated Equity Incentive Plan, as amended (incorporated by reference to Exhibit 10.02 to Cardinal Health’s Quarterly Report on Form 10-Q for the quarter ended September 30, 2005, File No. 1-11373)*
|
|
10.3.2
|
Copy of resolutions adopted by the Human Resources and Compensation Committee of the Board of Directors on May 7, 2002 amending the Cardinal Health, Inc. Amended and Restated Equity Incentive Plan, as amended, and the Cardinal Health, Inc. Broadly-based Equity Incentive Plan, as amended (incorporated by reference to Exhibit 10.2.3 to Cardinal Health’s Annual Report on Form 10-K for the fiscal year ended June 30, 2007, File No. 1-11373)*
|
|
10.3.3
|
Third Amendment to the Cardinal Health, Inc. Amended and Restated Equity Incentive Plan, as amended (incorporated by reference to Exhibit 10.2.4 to Cardinal Health’s Annual Report on Form 10-K for the fiscal year ended June 30, 2007, File No. 1-11373)*
|
|
10.3.4
|
Fourth Amendment to Cardinal Health, Inc. Amended and Restated Equity Incentive Plan, as amended (incorporated by reference to Exhibit 10.6 to Cardinal Health’s Quarterly Report on Form 10-Q for the quarter ended December 31, 2009, File No. 1-11373)*
|
|
10.3.5
|
Form of Nonqualified Stock Option Agreement under the Cardinal Health, Inc. Amended and Restated Equity Incentive Plan, as amended (grant made to executive officer in November 2001) (incorporated by reference to Exhibit 10.01 to Cardinal Health’s Quarterly Report on Form 10-Q for the quarter ended December 31, 2001, File No. 1-11373)*
|
|
10.3.6
|
Form of Nonqualified Stock Option Agreement under the Cardinal Health, Inc. Amended and Restated Equity Incentive Plan, as amended (grants made to executive officer in November 2002 and November 2003) (incorporated by reference to Exhibit 10.01 to Cardinal Health’s Quarterly Report on Form 10-Q for the quarter ended December 31, 2003, File No. 1-11373)*
|
|
10.3.7
|
Form of Nonqualified Stock Option Agreement under the Cardinal Health, Inc. Amended and Restated Equity Incentive Plan, as amended (grants made to executive officers in August 2004) (incorporated by reference to Exhibit 10.04 to Cardinal Health’s Quarterly Report on Form 10-Q for the quarter ended December 31, 2004, File No. 1-11373)*
|
|
10.3.8
|
Form of Nonqualified Stock Option Agreement under the Cardinal Health, Inc. Amended and Restated Equity Incentive Plan, as amended (grants made to executive officers in September 2005) (incorporated by reference to Exhibit 10.03 to Cardinal Health’s Quarterly Report on Form 10-Q for the quarter ended March 31, 2005, File No. 1-11373)*
|
|
10.3.9
|
Copy of resolutions adopted by the Human Resources and Compensation Committee of the Board of Directors on August 7, 2007 amending outstanding Nonqualified Stock Option Agreements under the Cardinal Health, Inc. Amended and Restated Equity Incentive Plan, as amended, and the Cardinal Health, Inc. Broadly-based Equity Incentive Plan, as amended (incorporated by reference to Exhibit 10.2.17 to Cardinal Health’s Annual Report on Form 10-K for the fiscal year ended June 30, 2007, File No. 1-11373)*
|
|
10.3.10
|
Form of Directors’ Stock Option Agreement under the Cardinal Health, Inc. Amended and Restated Equity Incentive Plan, as amended (grants made in November 2001 and May and November 2002) (incorporated by reference to Exhibit 10.02 to Cardinal Health’s Quarterly Report on Form 10-Q for the quarter ended December 31, 2001, File No. 1-11373)*
|
|
10.3.11
|
Form of Directors’ Stock Option Agreement under the Cardinal Health, Inc. Amended and Restated Equity Incentive Plan, as amended (grants made in November 2003 and December 2004) (incorporated by reference to Exhibit 10.03 to Cardinal Health’s Quarterly Report on Form 10-Q for the quarter ended December 31, 2003, File No. 1-11373)*
|
|
10.3.12
|
Form of Directors’ Stock Option Agreement under the Cardinal Health, Inc. Amended and Restated Equity Incentive Plan, as amended (grants made in November 2005) (incorporated by reference to Exhibit 10.07 to Cardinal Health’s Current Report on Form 8-K filed on November 7, 2005, File No. 1-11373)*
|
|
10.4.1
|
Cardinal Health, Inc. Amended and Restated Outside Directors Equity Incentive Plan (incorporated by reference to Exhibit 10.23 to Cardinal Health’s Annual Report on Form 10-K for the fiscal year ended June 30, 2005, File No. 1-11373)*
|
|
10.4.2
|
First Amendment to Cardinal Health, Inc. Amended and Restated Outside Directors Equity Incentive Plan (incorporated by reference to Exhibit 10.02 to Cardinal Health’s Quarterly Report on Form 10-Q for the quarter ended March 31, 2006, File No. 1-11373)*
|
|
10.4.3
|
Form of Directors’ Stock Option Agreement under the Cardinal Health, Inc. Outside Directors Equity Incentive Plan (grants made in November 2001 and May and November 2002) (incorporated by reference to Exhibit 10.03 to Cardinal Health’s Quarterly Report on Form 10-Q for the quarter ended December 31, 2001, File No. 1-11373)*
|
|
10.4.4
|
Form of Directors’ Stock Option Agreement under the Cardinal Health, Inc. Outside Directors Equity Incentive Plan (grants made in November 2003 and December 2004) (incorporated by reference to Exhibit 10.04 to Cardinal Health’s Quarterly Report on Form 10-Q for the quarter ended December 31, 2003, File No. 1-11373)*
|
|
10.4.5
|
Form of Directors’ Stock Option Agreement under the Cardinal Health, Inc. Amended and Restated Outside Directors Equity Incentive Plan (grants made in November 2005 and December 2006) (incorporated by reference to Exhibit 10.08 to Cardinal Health’s Current Report on Form 8-K filed on November 7, 2005, File No. 1-11373)*
|
|
10.4.6
|
Form of Directors’ Stock Option Agreement under the Cardinal Health, Inc. Amended and Restated Outside Directors Equity Incentive Plan, as amended (grants made in November and December 2006 and August and November 2007) (incorporated by reference to Exhibit 10.03 to Cardinal Health’s Current Report on Form 8-K filed on November 13, 2006, File No. 1-11373)*
|
|
10.5.1
|
Cardinal Health, Inc. 2007 Nonemployee Directors Equity Incentive Plan (incorporated by reference to Exhibit 10.4 to Cardinal Health’s Quarterly Report on Form 10-Q for the quarter ended December 31, 2007, File No. 1-11373)*
|
|
10.5.2
|
First Amendment to Cardinal Health, Inc. 2007 Nonemployee Directors Equity Incentive Plan (incorporated by reference to Exhibit 10.2.1 to Cardinal Health’s Quarterly Report on Form 10-Q for the quarter ended September 30, 2009, File No. 1-11373)*
|
|
10.5.3
|
Second Amendment to the Cardinal Health, Inc. 2007 Nonemployee Directors Equity Incentive Plan (incorporated by reference to Exhibit 10.5 to Cardinal Health's Quarterly Report on Form 10-Q for the Quarter ended December 31, 2011, File No. 1-11373)*
|
59
|
Exhibit
Number
|
Exhibit Description
|
|
10.5.4
|
Form of Directors’ Stock Option Agreement under the Cardinal Health, Inc. 2007 Nonemployee Directors Equity Incentive Plan (grants made in November 2008) (incorporated by reference to Exhibit 10.5 to Cardinal Health’s Quarterly Report on Form 10-Q for the quarter ended December 31, 2007, File No. 1-11373)*
|
|
10.5.5
|
Form of Directors’ Restricted Share Units Agreement under the Cardinal Health, Inc. 2007 Nonemployee Directors Equity Incentive Plan (grants made in November 2010 and thereafter) (incorporated by reference to Exhibit 10.3 to Cardinal Health’s Quarterly Report on Form 10-Q for the quarter ended December 31, 2010, File No. 1-11373)*
|
|
10.5.6
|
Form of Directors’ Restricted Share Units Agreement under the Cardinal Health, Inc. 2007 Nonemployee Directors Equity Incentive Plan (for grants made in November 2011 and thereafter) (incorporated by reference to Exhibit 10.6 to Cardinal Health's Quarterly Report on Form 10-Q for the quarter ended December 31, 2011, File No. 1-11373)*
|
|
10.6.1
|
Term Sheet for Adjustments to Cardinal Health Stock Options and Terms of CareFusion Stock Options (For current and former U.S. Cardinal Health employees) (incorporated by reference to Exhibit 10.2 to Cardinal Health’s Current Report on Form 8-K filed on September 1, 2009, File No. 1-11373)*
|
|
10.6.2
|
Term Sheet for Adjustments to Cardinal Health Stock Options and Terms of CareFusion Stock Options (For Directors) (incorporated by reference to Exhibit 10.5.4 to Cardinal Health’s Annual Report on Form 10-K for the fiscal year ended June 30, 2010, File No. 1-11373)*
|
|
10.7.1
|
Cardinal Health, Inc. Broadly-based Equity Incentive Plan, as amended (incorporated by reference to Exhibit 10.52 to Cardinal Health’s Annual Report on Form 10-K for the fiscal year ended June 30, 2002, File No. 1-11373)*
|
|
10.7.2
|
Second Amendment to the Cardinal Health, Inc. Broadly-based Equity Incentive Plan, as amended (incorporated by reference to Exhibit 10.4.2 to Cardinal Health’s Annual Report on Form 10-K for the fiscal year ended June 30, 2007, File No. 1-11373)*
|
|
10.7.3
|
Third Amendment to the Cardinal Health, Inc. Broadly-based Equity Incentive Plan, as amended (incorporated by reference to Exhibit 10.5 to Cardinal Health’s Quarterly Report on Form 10-Q for the quarter ended December 31, 2009, File No. 1-11373)*
|
|
10.7.4
|
Form of Nonqualified Stock Option Agreement under the Cardinal Health, Inc. Broadly-based Equity Incentive Plan, as amended (grants made to executive officers in November 2003) (incorporated by reference to Exhibit 10.6.4 to Cardinal Health's Annual Report on Form 10-K for the fiscal year ended June 30, 2011, File No. 1-11373)*
|
|
10.8.1
|
Cardinal Health Deferred Compensation Plan, amended and restated effective January 1, 2009 (incorporated by reference to Exhibit 10.6.5 to Cardinal Health’s Annual Report on Form 10-K for the fiscal year ended June 30, 2008, File No. 1-11373)*
|
|
10.8.2
|
First Amendment to Cardinal Health Deferred Compensation Plan, amended and restated effective January 1, 2009 (incorporated by reference to Exhibit 10.4 to Cardinal Health’s Quarterly Report on Form 10-Q for the quarter ended September 30, 2008, File No. 1-11373)*
|
|
10.8.3
|
Second Amendment to Cardinal Health Deferred Compensation Plan, as amended and restated effective January 1, 2009 (incorporated by reference to Exhibit 10.1 to Cardinal Health’s Quarterly Report on Form 10-Q for the quarter ended March 31, 2010, File No. 1-11373)*
|
|
10.8.4
|
Third Amendment to Cardinal Health Deferred Compensation Plan, as amended and restated effective January 1, 2009 (incorporated by reference to Exhibit 10.1 to Cardinal Health’s Quarterly Report on Form 10-Q for the quarter ended September 30, 2010, File No. 1-11373)*
|
|
10.8.5
|
Fourth Amendment to the Cardinal Health Deferred Compensation Plan, as amended and restated effective January 1, 2009 (incorporated by reference to Exhibit 10.1 to Cardinal Health’s Quarterly Report on Form 10-Q for the quarter ended March 31, 2011, File No. 1-11373)*
|
|
10.8.6
|
Fifth Amendment to the Cardinal Health Deferred Compensation Plan, as amended and restated effective January 1, 2009 (incorporated by reference to Exhibit 10.1 to Cardinal Health's Quarterly Report on Form 10-Q for the quarter ended March 31, 2012, File No. 1-11373)*
|
|
10.9.1
|
Cardinal Health, Inc. Amended and Restated Management Incentive Plan (incorporated by reference to Exhibit 10.02 to Cardinal Health’s Current Report on Form 8-K filed on November 13, 2006, File No. 1-11373)*
|
|
10.9.2
|
First Amendment to the Cardinal Health, Inc. Amended and Restated Management Incentive (incorporated by reference to Exhibit 10.7.2 to Cardinal Health’s Annual Report on Form 10-K for the fiscal year ended June 30, 2007, File No. 1-11373)*
|
|
10.10
|
Cardinal Health, Inc. Policy Regarding Shareholder Approval of Severance Agreements (incorporated by reference to Exhibit 10.09 to Cardinal Health’s Current Report on Form 8-K filed on August 7, 2006, File No. 1-11373)*
|
|
10.11.1
|
Employment Agreement, dated August 5, 2009, between Cardinal Health, Inc. and George S. Barrett (incorporated by reference to Exhibit 10.1 to Cardinal Health’s Current Report on Form 8-K/A filed on August 10, 2009, File No. 1-11373)*
|
|
10.11.2
|
Form of amended and restated Aircraft Time Sharing Agreement between Cardinal Health, Inc. and George S. Barrett (incorporated by reference to Exhibit 10.4.2 to Cardinal Health’s Quarterly Report on Form 10-Q for the quarter ended September 30, 2009, File No. 1-11373)*
|
|
10.12
|
Confidentiality and Business Protection Agreement, effective as of February 15, 2010, between Cardinal Health, Inc. and Michael C. Kaufmann (incorporated by reference to Exhibit 10.15 to Cardinal Health’s Annual Report on Form 10-K for the fiscal year ended June 30, 2010, File No. 1-11373)*
|
|
10.13.1
|
Confidentiality and Business Protection Agreement, effective as of September 29, 2008, between Cardinal Health, Inc. and Michael A. Lynch (incorporated by reference to Exhibit 10.16 to Cardinal Health’s Annual Report on Form 10-K for the fiscal year ended June 30, 2010, File No. 1-11373)*
|
|
10.13.2
|
Separation Letter, dated as of April 9, 2012, between Cardinal Health, Inc. and Michael A. Lynch (incorporated by reference to Exhibit 10.1 to Cardinal Health's Current Report on Form 8-K filed on April 10, 2012, File No. 1-11373)*
|
|
10.14.1
|
Confidentiality and Business Protection Agreement, effective as of April 9, 2012, between Cardinal Health, Inc. and Donald M. Casey, Jr.*
|
|
10.14.2
|
Offer Letter to Donald M. Casey, Jr. dated April 9, 2012*
|
|
10.15.1
|
Form of Indemnification Agreement between Cardinal Health, Inc. and certain individual directors (incorporated by reference to Exhibit 10.38 to Cardinal Health’s Annual Report on Form 10-K for the fiscal year ended June 30, 2004, File No. 1-11373)
|
|
10.15.2
|
Form of Indemnification Agreement between Cardinal Health, Inc. and certain individual executive officers (incorporated by reference to Exhibit 10.39 to Cardinal Health’s Annual Report on Form 10-K for the fiscal year ended June 30, 2004, File No. 1-11373)
|
60
|
Exhibit
Number
|
Exhibit Description
|
|
10.16.1
|
Description of Nonemployee Directors Compensation effective November 1, 2009 until November 1, 2011(incorporated by reference to Exhibit 10.23.2 to Cardinal Health’s Annual Report on Form 10-K for the fiscal year ended June 30, 2009, File No. 1-11373)*
|
|
10.16.2
|
Description of Nonemployee Directors Compensation effective November 2, 2011 (incorporated by reference to Exhibit 10.14.2 to Cardinal Health's Annual Report on Form 10-K for the fiscal year ended June 30, 2011, File No. 1-11373)*
|
|
10.17.1
|
Issuing and Paying Agency Agreement, dated August 9, 2006, between Cardinal Health, Inc. and The Bank of New York (incorporated by reference to Exhibit 10.01 to Cardinal Health’s Annual Report on Form 10-K for the fiscal year ended June 30, 2006, File No. 1-11373)
|
|
10.17.2
|
First Amendment to Issuing and Paying Agency Agreement, dated February 28, 2007, between Cardinal Health, Inc. and The Bank of New York (incorporated by reference to Exhibit 10.01 to Cardinal Health’s Current Report on Form 8-K filed on March 6, 2007, File No. 1-11373)
|
|
10.17.3
|
Commercial Paper Dealer Agreement, dated August 9, 2006, between Cardinal Health, Inc. and J.P. Morgan Securities Inc. (incorporated by reference to Exhibit 10.02 to Cardinal Health’s Annual Report on Form 10-K for the fiscal year ended June 30, 2006, File No. 1-11373)
|
|
10.17.4
|
First Amendment to Commercial Paper Dealer Agreement, dated February 28, 2007, between Cardinal Health, Inc. and J.P. Morgan Securities Inc. (incorporated by reference to Exhibit 10.02 to Cardinal Health’s Current Report on Form 8-K filed on March 6, 2007, File No. 1-11373)
|
|
10.17.5
|
Commercial Paper Dealer Agreement, dated August 9, 2006, between Cardinal Health, Inc. and Banc of America Securities LLC (incorporated by reference to Exhibit 10.03 to Cardinal Health’s Annual Report on Form 10-K for the fiscal year ended June 30, 2006, File No. 1-11373)
|
|
10.17.6
|
First Amendment to Commercial Paper Dealer Agreement, dated February 28, 2007, between Cardinal Health, Inc. and Banc of America Securities LLC (incorporated by reference to Exhibit 10.03 to Cardinal Health’s Current Report on Form 8-K filed on March 6, 2007, File No. 1-11373)
|
|
10.17.7
|
Commercial Paper Dealer Agreement, dated August 9, 2006, between Cardinal Health, Inc. and Wachovia Capital Markets, LLC (incorporated by reference to Exhibit 10.04 to Cardinal Health’s Annual Report on Form 10-K for the fiscal year ended June 30, 2006, File No. 1-11373)
|
|
10.17.8
|
First Amendment to Commercial Paper Dealer Agreement, dated February 28, 2007, between Cardinal Health, Inc. and Wachovia Capital Markets, LLC (incorporated by reference to Exhibit 10.04 to Cardinal Health’s Current Report on Form 8-K filed on March 6, 2007, File No. 1-11373)
|
|
10.17.9
|
Commercial Paper Dealer Agreement, dated August 9, 2006, between Cardinal Health, Inc. and Goldman, Sachs & Co. (incorporated by reference to Exhibit 10.05 to Cardinal Health’s Annual Report on Form 10-K for the fiscal year ended June 30, 2006, File No. 1-11373)
|
|
10.17.10
|
First Amendment to Commercial Paper Dealer Agreement, dated February 28, 2007, between Cardinal Health, Inc. and Goldman, Sachs & Co. (incorporated by reference to Exhibit 10.05 to Cardinal Health’s Current Report on Form 8-K filed on March 6, 2007, File No. 1-11373)
|
|
10.17.11
|
Form of Commercial Paper Dealer Agreement (incorporated by reference to Exhibit 10.2 to Cardinal Health’s Current Report on Form 8-K filed on April 21, 2009, File No. 1-11373)
|
|
10.18
|
Five-Year Credit Agreement, dated as of May 12, 2011, among the Company, certain lenders, JPMorgan Chase Bank, N.A. as Administrative Agent, Bank of America, N.A. and Morgan Stanley Senior Funding, Inc. as Syndication Agents, Barclays Bank PLC and Deutsche Bank Securities Inc. as Documentation Agents, and J.P. Morgan Securities, LLC, Merrill Lynch, Pierce, Fenner & Smith Incorporated and Morgan Stanley Senior Funding, Inc. as Joint Lead Arrangers and Book Managers (incorporated by reference to Exhibit 10.1 to Cardinal Health’s Current Report on Form 8-K filed on May 13, 2011, File No. 1-11373)
|
|
10.19.1
|
Third Amended and Restated Receivables Purchase Agreement, dated as of November 19, 2007, among Cardinal Health Funding, LLC, Griffin Capital, LLC, each entity signatory thereto as a Conduit, each entity signatory thereto as a Financial Institution, each entity signatory thereto as a Managing Agent and Wachovia Capital Markets, LLC, as the Agent (incorporated by reference to Exhibit 10.1 to Cardinal Health’s Current Report on Form 8-K filed on November 26, 2007, File No. 1-11373)
|
|
10.19.2
|
First Amendment, dated as of November 13, 2008, to the Third Amended and Restated Receivables Purchase Agreement, dated as of November 19, 2007, among Cardinal Health Funding, LLC, Griffin Capital, LLC, each entity signatory thereto as a Conduit, each entity signatory thereto as a Financial Institution, each entity signatory thereto as a Managing Agent and Wachovia Capital Markets, LLC, as the Agent (incorporated by reference to Exhibit 10.1 to Cardinal Health’s Current Report on Form 8-K filed on November 18, 2008, File No. 1-11373)
|
|
10.19.3
|
Second Amendment and Joinder to the Third Amended and Restated Receivables Purchase Agreement and Amendment to the Performance Guaranty, dated as of May 1, 2009 (incorporated by reference to Exhibit 10.1 to Cardinal Health’s Quarterly Report on Form 10-Q for the quarter ended March 31, 2009, File No. 1-11373)
|
|
10.19.4
|
Third Amendment, dated as of November 10, 2009, to the Third Amended and Restated Receivables Purchase Agreement, dated as of November 19, 2007 (incorporated by reference to exhibit 10.1 to Cardinal Health’s Current Report on Form 8-K filed on November 16, 2009, File No. 1-11373)
|
|
10.19.5
|
Fourth Amendment, dated as of March 25, 2010, to the Third Amended and Restated Receivables Purchase Agreement and Waiver, dated as of November 19, 2007 (incorporated by reference to Exhibit 10.2 to Cardinal Health’s Quarterly Report on Form 10-Q for the quarter ended March 31, 2010, File No. 1-11373)
|
|
10.19.6
|
Fifth Amendment, dated as of August 30, 2010, to the Third Amended and Restated Receivables Purchase Agreement, dated as of November 19, 2007 (incorporated by reference to Exhibit 10.2 to the Company’s Quarterly Report on Form 10-Q for the quarter ended September 30, 2010, File No. 1-11373)
|
|
10.19.7
|
Sixth Amendment, dated as of November 9, 2010, to the Third Amended and Restated Receivables Purchase Agreement, dated as of November 19, 2007 (incorporated by reference to Exhibit 10.1 to the Company’s Current Report on Form 8-K filed on November 12, 2010, File No. 1-11373)
|
|
10.19.8
|
Third Amended and Restated Performance Guaranty, dated as of March 25, 2010, executed by Cardinal Health, Inc. in favor of Cardinal Health Funding, LLC (incorporated by reference to Exhibit 10.3 to Cardinal Health’s Quarterly Report on Form 10-Q for the quarter ended March 31, 2010, File No. 1-11373)
|
|
10.19.9
|
Omnibus Amendment and Waiver, dated as of December 15, 2009, to the Third Amended and Restated Receivables Purchase Agreement and Waiver, dated as of November 19, 2007 (incorporated by reference to Exhibit 10.23.8 to the Company’s Annual Report on Form 10-K for the fiscal year ended June 30, 2010, File No. 1-11373)
|
61
|
Exhibit
Number
|
Exhibit Description
|
|
10.20.1
|
Tax Matters Agreement, dated as of August 31, 2009, by and between Cardinal Health, Inc. and CareFusion Corporation (incorporated by reference to Exhibit 10.3 to Cardinal Health’s Current Report on Form 8-K filed on September 4, 2009, File No. 1-11373)
|
|
10.20.2
|
First Amendment to Tax Matters Agreement, dated as of May 28, 2012, by and between Cardinal Health, Inc. and CareFusion Corporation
|
|
10.20.3
|
Separation Agreement, dated July 22, 2009, by and between Cardinal Health, Inc. and CareFusion Corporation (incorporated by reference to Exhibit 2.1 to Cardinal Health’s Current Report on Form 8-K filed on July 22, 2009, File No. 1-11373)
|
|
10.20.4
|
CareFusion Corporation 2009 Long-Term Incentive Plan (incorporated by reference to Exhibit 99.1 to CareFusion’s Registration Statement on Form S-8 (File No. 333-161615) filed with the Securities and Exchange Commission on August 28, 2009)*
|
|
12.1
|
Computation of Ratio of Earnings to Fixed Charges
|
|
21.1
|
List of Subsidiaries of Cardinal Health, Inc.
|
|
23.1
|
Consent of Independent Registered Public Accounting Firm
|
|
31.1
|
Certification of Chief Executive Officer pursuant to Section 302 of the Sarbanes-Oxley Act of 2002
|
|
31.2
|
Certification of Chief Financial Officer pursuant to Section 302 of the Sarbanes-Oxley Act of 2002
|
|
32.1
|
Certification of Chief Executive Officer pursuant to 18 U.S.C. Section 1350, as adopted pursuant to Section 906 of the Sarbanes-Oxley Act of 2002
|
|
32.2
|
Certification of Chief Financial Officer pursuant to 18 U.S.C. Section 1350, as adopted pursuant to Section 906 of the Sarbanes-Oxley Act of 2002
|
|
99.1
|
Statement Regarding Forward-Looking Information
|
|
101.INS
|
XBRL Instance Document
|
|
101.SCH
|
XBRL Taxonomy Extension Schema Document
|
|
101.CAL
|
XBRL Taxonomy Extension Calculation Linkbase Document
|
|
101.DEF
|
XBRL Taxonomy Definition Linkbase Document
|
|
101.LAB
|
XBRL Taxonomy Extension Label Linkbase Document
|
|
101.PRE
|
XBRL Taxonomy Extension Presentation Linkbase Document
|
* Management contract or compensation plan or arrangement.
Cardinal Health Website
We use our website as a channel of distribution for material information about us. Important information, including news releases, earnings and analyst presentations and financial information is routinely posted and accessible on the Investors page at www.cardinalhealth.com. In addition, our website allows investors and other interested persons to sign up to automatically receive email alerts when we post news releases, SEC filings and certain other information on our website.
62
Signatures
Pursuant to the requirements of Section 13 or 15(d) of the Securities Exchange Act of 1934, the Registrant has duly caused this report to be signed on its behalf by the undersigned, thereunto duly authorized, on
August 22, 2012
.
|
Cardinal Health, Inc.
|
|
|
By:
|
/s/ GEORGE S. BARRETT
|
|
George S. Barrett
|
|
|
Chairman and Chief Executive Officer
|
|
Pursuant to the requirements of the Securities Exchange Act of 1934, this report has been signed below by the following persons on behalf of the Registrant and in the capacities indicated on
August 22, 2012
.
|
Name
|
Title
|
|
/s/ GEORGE S. BARRETT
|
Chairman and Chief Executive Officer and Director (principal executive officer)
|
|
George S. Barrett
|
|
|
/s/ JEFFREY W. HENDERSON
|
Chief Financial Officer (principal financial officer)
|
|
Jeffrey W. Henderson
|
|
|
/s/ STUART G. LAWS
|
Senior Vice President and Chief Accounting Officer (principal accounting officer)
|
|
Stuart G. Laws
|
|
|
/s/ COLLEEN F. ARNOLD
|
Director
|
|
Colleen F. Arnold
|
|
|
/s/ GLENN A. BRITT
|
Director
|
|
Glenn A. Britt
|
|
|
/s/ CARRIE S. COX
|
Director
|
|
Carrie S. Cox
|
|
|
/s/ CALVIN DARDEN
|
Director
|
|
Calvin Darden
|
|
|
/s/ BRUCE L. DOWNEY
|
Director
|
|
Bruce L. Downey
|
|
|
/s/ JOHN F. FINN
|
Director
|
|
John F. Finn
|
|
|
/s/ GREGORY B. KENNY
|
Director
|
|
Gregory B. Kenny
|
|
|
/s/ DAVID P. KING
|
Director
|
|
David P. King
|
|
|
/s/ RICHARD C. NOTEBAERT
|
Director
|
|
Richard C. Notebaert
|
|
|
/s/ DAVID W. RAISBECK
|
Director
|
|
David W. Raisbeck
|
|
|
/s/ JEAN G. SPAULDING, M.D.
|
Director
|
|
Jean G. Spaulding, M.D.
|
|
63
Cardinal Health, Inc. and Subsidiaries
Schedule II - Valuation and Qualifying Accounts (3)
|
(in millions)
|
Balance at Beginning of Period
|
Charged to Costs and Expenses
|
Charged to Other Accounts (1)
|
Deductions (2)
|
Balance at End of Period
|
||||||||||||||
|
Fiscal 2012
|
|||||||||||||||||||
|
Accounts receivable
|
$
|
134
|
|
$
|
22
|
|
$
|
1
|
|
$
|
(31
|
)
|
$
|
126
|
|
||||
|
Finance notes receivable
|
15
|
|
—
|
|
—
|
|
1
|
|
16
|
|
|||||||||
|
Net investment in sales-type leases
|
1
|
|
—
|
|
—
|
|
—
|
|
1
|
|
|||||||||
|
$
|
150
|
|
$
|
22
|
|
$
|
1
|
|
$
|
(30
|
)
|
$
|
143
|
|
|||||
|
Fiscal 2011
|
|
||||||||||||||||||
|
Accounts receivable
|
$
|
123
|
|
$
|
23
|
|
$
|
5
|
|
$
|
(17
|
)
|
$
|
134
|
|
||||
|
Finance notes receivable
|
16
|
|
4
|
|
—
|
|
(5
|
)
|
15
|
|
|||||||||
|
Net investment in sales-type leases
|
1
|
|
—
|
|
—
|
|
—
|
|
1
|
|
|||||||||
|
$
|
140
|
|
$
|
27
|
|
$
|
5
|
|
$
|
(22
|
)
|
$
|
150
|
|
|||||
|
Fiscal 2010
|
|
||||||||||||||||||
|
Accounts receivable
|
$
|
103
|
|
$
|
25
|
|
$
|
4
|
|
$
|
(9
|
)
|
$
|
123
|
|
||||
|
Finance notes receivable
|
14
|
|
2
|
|
—
|
|
—
|
|
16
|
|
|||||||||
|
Net investment in sales-type leases
|
1
|
|
—
|
|
—
|
|
—
|
|
1
|
|
|||||||||
|
$
|
118
|
|
$
|
27
|
|
$
|
4
|
|
$
|
(9
|
)
|
$
|
140
|
|
|||||
|
(1)
|
During fiscal
2012
and
2010
recoveries of amounts provided for or written off in prior years were $
1 million
and $
4 million
, respectively.
|
|
(2)
|
Write-off of uncollectible accounts.
|
|
(3)
|
Amounts included herein pertain to the continuing operations of the Company.
|
64
TABLE OF CONTENTS
Part IItem 1: BusinessItem 1A: Risk FactorsItem 1B: Unresolved Staff CommentsItem 2: PropertiesItem 3: Legal ProceedingsItem 4: Mine Safety DisclosuresPart IIItem 5: Market For Registrant S Common Equity, Related Stockholder Matters and Issuer Purchases Of Equity SecuritiesItem 6: Selected Financial DataItem 7: Management S Discussion and Analysis Of Financial Condition and Results Of OperationsItem 7A: Quantitative and Qualitative Disclosures About Market RiskItem 8: Financial Statements and Supplementary DataItem 9: Changes in and Disagreements with Accountants on Accounting and Financial DisclosureItem 9A: Controls and ProceduresItem 9B: Other InformationnoneItem 9B: Other InformationPart IIIItem 10: Directors, Executive Officers and Corporate GovernanceItem 11: Executive CompensationItem 12: Security Ownership Of Certain Beneficial Owners and Management and Related Stockholder MattersItem 13: Certain Relationships and Related Transactions, and Director IndependenceItem 14: Principal Accounting Fees and ServicesPart IVItem 15: Exhibits and Financial Statement Schedules