CARDINAL HEALTH INC
10-Ks and 10-Qs
|
|
|
|
|
|
|
|
|
|
|
|
|
|
|
|
|
|
|
|
|
|
|
|
|
|
|
|
|
|
|
|
|
|
|
|
|
|
|
|
|
|
|
|
|
|
|
|
|
|
|
|
|
|
|
|
|
|
|
UNITED STATES
SECURITIES AND EXCHANGE COMMISSION
Washington, D.C. 20549
Form 10-K
|
þ
|
ANNUAL REPORT PURSUANT TO SECTION 13 OR 15(d) OF THE SECURITIES EXCHANGE ACT OF 1934
|
For the fiscal year ended
June 30, 2018
or
|
o
|
TRANSITION REPORT PURSUANT TO SECTION 13 OR 15(d) OF THE SECURITIES EXCHANGE ACT OF 1934
|
For the transition period from ________ to ________
Commission File Number: 1-11373
Cardinal Health, Inc.
(Exact name of registrant as specified in its charter)
|
Ohio
|
31-0958666
|
|
(State or other jurisdiction of
incorporation or organization)
|
(IRS Employer
Identification No.)
|
|
7000 Cardinal Place, Dublin, Ohio
|
43017
|
|
(Address of principal executive offices)
|
(Zip Code)
|
|
(614) 757-5000
|
|
|
(Registrant’s telephone number, including area code)
|
|
|
Securities registered pursuant to Section 12(b) of the Act:
|
|
|
Title of each class
|
Name of each exchange on which registered
|
|
Common shares (without par value)
|
New York Stock Exchange
|
|
Securities registered pursuant to Section 12(g) of the Act: None
|
|
Indicate by check mark if the registrant is a well-known seasoned issuer, as defined in Rule 405 of the Securities Act. Yes
þ
No
o
Indicate by check mark if the registrant is not required to file reports pursuant to Section 13 or Section 15(d) of the Act. Yes
o
No
þ
Indicate by check mark whether the registrant (1) has filed all reports required to be filed by Section 13 or 15(d) of the Securities Exchange Act of 1934 during the preceding 12 months (or for such shorter period that the registrant was required to file such reports), and (2) has been subject to such filing requirements for the past 90 days. Yes
þ
No
o
Indicate by check mark whether the registrant has submitted electronically every Interactive Data File required to be submitted and posted pursuant to Rule 405 of Regulation S-T (§232.405 of this chapter) during the preceding 12 months (or for such shorter period that the registrant was required to submit and post such files). Yes
þ
No
o
Indicate by check mark if disclosure of delinquent filers pursuant to Item 405 of Regulation S-K (§229.405 of this chapter) is not contained herein, and will not be contained, to the best of registrant’s knowledge, in definitive proxy or information statements incorporated by reference in Part III of the Form 10-K or any amendment to the Form 10-K.
þ
Indicate by check mark whether the registrant is a large accelerated filer, an accelerated filer, a non-accelerated filer, smaller reporting company, or an emerging growth company. See the definitions of “large accelerated filer,” “accelerated filer,” “smaller reporting company,” and "emerging growth company" in Rule 12b-2 of the Exchange Act.
|
Large accelerated filer
þ
|
Accelerated filer
o
|
|
Non-accelerated filer
o
(Do not check if a smaller reporting company)
|
Smaller reporting company
o
|
|
Emerging growth company
o
|
|
|
If an emerging growth company, indicate by check mark if the registrant has elected not to use the extended transition period for complying with any new or revised financial accounting standards provided pursuant to Section 13(a) of the Exchange Act
o
|
|
Indicate by check mark whether the registrant is a shell company (as defined in Rule 12b-2 of the Exchange Act). Yes
o
No
þ
The aggregate market value of voting stock held by non-affiliates or registrant on
December 31, 2017
, was the following:
$19,248,647,885
.
The number of the registrant’s common shares, without par value, outstanding as of
July 31, 2018
, was the following:
308,828,810
.
Documents Incorporated by Reference:
Portions of the registrant’s Definitive Proxy Statement to be filed for its
2018
Annual Meeting of Shareholders are incorporated by reference into the sections of this Form 10-K addressing the requirements of Part III of Form 10-K.
|
Cardinal Health
Fiscal 2018 Form 10-K
|
Table of Contents
|
Page
|
|
|
1
|
Cardinal Health
|
Fiscal 2018 Form 10-K
|
|
|
Introduction
|
||
Introduction
References to Cardinal Health and Fiscal Years
As used in this report, "we," "our," "us," "Cardinal Health" and similar pronouns refer to Cardinal Health, Inc. and its majority-owned subsidiaries, unless the context requires otherwise. Our fiscal year ends on June 30. References to fiscal
2019
,
2018
,
2017
,
2016
,
2015
and
2014
and to the fiscal years ended
June 30, 2019
,
2018
,
2017
,
2016
,
2015
and
2014
, respectively. Except as otherwise specified, information in this report is provided as of
June 30, 2018
.
Non-GAAP Financial Measures
In this report, including in the "Fiscal
2018
Overview" section of Management's Discussion and Analysis of Financial Condition and Results of Operations ("MD&A"), we use financial measures that are derived from consolidated financial data but are not presented in our financial statements that are prepared in accordance with U.S. generally accepted accounting principles (“GAAP”). These measures are considered “non-GAAP financial measures” under the Securities and Exchange Commission (“SEC”) rules. The reasons we use these non-GAAP financial measures and the reconciliations to their most directly comparable GAAP financial measures are included in the “Explanation and Reconciliation of Non-GAAP Financial Measures” section following MD&A in this report.
Important Information Regarding Forward-Looking Statements
This report (including information incorporated by reference) includes forward-looking statements addressing expectations, prospects, estimates and other matters that are dependent upon future events or developments. Many forward-looking statements appear in MD&A, but there are others throughout this report, which may be identified by words such as “expect,” “anticipate,” “intend,” “plan,” “believe,” “will,” “should,” “could,” “would,” “project,” “continue,” “likely,” and similar expressions, and include statements reflecting future results or guidance, statements of outlook and expense accruals. These matters are subject to risks and uncertainties that could cause actual results to differ materially from those projected, anticipated or implied. The most significant of these risks and uncertainties are described in “Risk Factors” in this report and in Exhibit 99.1 to the Form 10-K included in this report. Forward-looking statements in this report speak only as of the date of this document. Except to the extent required by applicable law, we undertake no obligation to update or revise any forward-looking statement.
Available Information
Our Annual Report on Form 10-K, Quarterly Reports on Form 10-Q, Current Reports on Form 8-K, and amendments to those reports are available free of charge on our website (www.cardinalhealth.com), under the “Investors — Financial Reporting — SEC Filings” caption, as soon as reasonably practicable after we electronically file them with, or furnish them to, the SEC. You may read and copy any materials we file with the SEC at the SEC’s Public Reference Room at 100 F Street, NE, Washington, DC 20549. You may obtain information on the operation of the Public Reference Room by calling the SEC at 1-800-SEC-0330. The SEC also maintains a website (www.sec.gov) where you can search for annual, quarterly and current reports, proxy and information statements, and other information regarding us and other public companies.
|
Cardinal Health
|
Fiscal 2018 Form 10-K
|
2
|
|
|
MD&A
|
Results of Operations
|
|
Management's Discussion and Analysis of Financial Condition and Results of Operations (MD&A)
About Cardinal Health
Cardinal Health, Inc. is an Ohio corporation formed in 1979 and is a global, integrated healthcare services and products company providing customized solutions for hospitals, healthcare systems, pharmacies, ambulatory surgery centers, clinical laboratories and physician offices. We provide medical products and pharmaceuticals and cost-effective solutions that enhance supply chain efficiency. We manage our business and report our financial results in two segments: Pharmaceutical and Medical.
Pharmaceutical Segment
Our Pharmaceutical segment distributes branded and generic pharmaceutical, specialty pharmaceutical, and over-the-counter healthcare and consumer products in the United States. This segment also provides services to pharmaceutical manufacturers and healthcare providers to support the development, marketing, and distribution of specialty pharmaceutical products; operates nuclear pharmacies and radiopharmaceutical manufacturing facilities; provides pharmacy management services to hospitals, as well as medication therapy management and patient outcomes services to hospitals, other healthcare providers and payers; and repackages generic pharmaceuticals and over-the-counter healthcare products.
Medical Segment
Our Medical segment manufactures, sources and distributes Cardinal Health branded medical, surgical and laboratory products, which are sold in the United States, Canada, Europe, Asia and other markets. In addition to distributing Cardinal Health branded products, this segment also distributes a broad range of national brand products and provides supply chain services and solutions to hospitals, ambulatory surgery centers, clinical laboratories and other healthcare providers in the United States and Canada. This segment also distributes medical products to patients' homes in the United States through our Cardinal Health at Home division.
|
3
|
Cardinal Health
|
Fiscal 2018 Form 10-K
|
|
|
MD&A
|
Results of Operations
|
|
Consolidated Results

Fiscal
2018
Overview
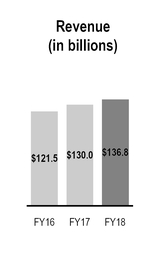
Revenue
Revenue for fiscal
2018
was
$136.8 billion
, a
5 percent
increase from the prior year, due primarily to sales growth from pharmaceutical distribution and specialty pharmaceutical customers. The Patient Recovery Business acquisition also contributed to the increase in revenue in fiscal 2018.
GAAP and Non-GAAP Operating Earnings
|
(in millions)
|
2018
|
2017
|
Change
|
|||||||
|
GAAP
|
$
|
126
|
|
$
|
2,120
|
|
(94
|
)%
|
||
|
Restructuring and employee severance
|
176
|
|
56
|
|
||||||
|
Amortization and other acquisition-related costs
|
707
|
|
527
|
|
||||||
|
Impairments and (gain)/loss on disposal of assets
|
1,417
|
|
18
|
|
||||||
|
Litigation (recoveries)/charges, net
|
159
|
|
48
|
|
||||||
|
Non-GAAP
|
$
|
2,585
|
|
$
|
2,769
|
|
(7
|
)%
|
||
The sum of the components may not equal the total due to rounding.
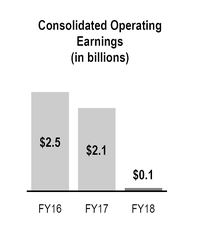
During fiscal
2018
, GAAP operating earnings decreased
94 percent
to
$126 million
and non-GAAP operating earnings decreased
7 percent
to
$2.6 billion
.
The decrease in GAAP operating earnings was primarily due to a non-cash goodwill impairment charge related to our Medical segment; increased amortization of acquisition-related intangible assets as a result of the Patient Recovery Business acquisition; contract termination restructuring costs to transition the distribution of our Medical segment's surgeon gloves in certain international markets from a third-party distribution arrangement to a direct distribution model; performance from Cardinal Health Brand products, primarily Cordis; performance from our Pharmaceutical segment generics program; litigation charges associated with inferior vena cava (IVC) filter product liability claims; and the adverse impact of pharmaceutical customer contract renewals. These factors were partially offset by contributions from the Patient Recovery Business acquisition.
The decrease in non-GAAP operating earnings was primarily due to performance from Cardinal Health Brand products, primarily Cordis; performance from our Pharmaceutical segment generics program; and the adverse impact of pharmaceutical customer contract renewals. These factors were partially offset by contributions from the Patient Recovery Business acquisition.
|
Cardinal Health
|
Fiscal 2018 Form 10-K
|
4
|
|
|
MD&A
|
Results of Operations
|
|
GAAP and Non-GAAP Diluted EPS
|
($ per share)
|
2018
|
2017
|
Change
|
|||||||
|
GAAP
|
$
|
0.81
|
|
$
|
4.03
|
|
(80
|
)%
|
||
|
Restructuring and employee severance
|
0.48
|
|
0.11
|
|
||||||
|
Amortization and other acquisition-related costs
|
1.69
|
|
1.13
|
|
||||||
|
Impairments and (gain)/loss on disposal of assets
|
4.64
|
|
0.04
|
|
||||||
|
Litigation (recoveries)/charges, net
|
0.35
|
|
0.09
|
|
||||||
|
Transitional tax benefit, net
|
(2.97
|
)
|
$
|
—
|
|
|||||
|
Non-GAAP
|
$
|
5.00
|
|
$
|
5.40
|
|
(7
|
)%
|
||
The sum of the components may not equal the total due to rounding.
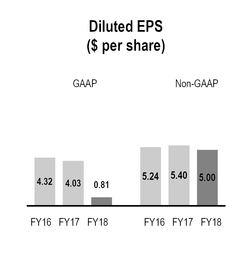
During fiscal
2018
, GAAP diluted earnings per share attributable to Cardinal Health, Inc. ("diluted EPS") decreased
80 percent
to
$0.81
and non-GAAP diluted EPS decreased
7 percent
to
$5.00
.
Fiscal 2018 GAAP diluted EPS decreased primarily due to the factors impacting GAAP operating earnings and increased interest expense. These were partially offset by the net benefit from the U.S. Tax Cuts and Jobs Act ("Tax Act"), which includes a provisional transitional tax benefit of
$936 million
as well as the benefit from applying a lower federal tax rate to our U.S. pre-tax earnings.
Fiscal 2018 non-GAAP diluted EPS decreased primarily due to the factors impacting non-GAAP operating earnings and an increase in interest expense, partially offset by the benefit of applying a lower U.S. federal statutory tax rate under the Tax Act to U.S. pre-tax non-GAAP earnings.
Cash and Equivalents
Our cash and equivalents balance was
$1.8 billion
at
June 30, 2018
compared to
$6.9 billion
at
June 30, 2017
. The decrease in cash and equivalents during fiscal
2018
was due to
$6.1 billion
paid for acquisitions,
$954 million
paid for debt repayments,
$581 million
paid in dividends,
$550 million
paid for share repurchases and
$384 million
paid for capital expenditures. These cash decreases were offset in part by
$2.8 billion
of net cash provided by operating activities and
$861 million
of cash proceeds from the sale of our China distribution business.
|
5
|
Cardinal Health
|
Fiscal 2018 Form 10-K
|
|
|
MD&A
|
Results of Operations
|
|
Significant Developments in Fiscal
2018
and Trends
Acquisitions and Divestitures
Patient Recovery Business Acquisition
On July 29, 2017, we acquired the Patient Care, Deep Vein Thrombosis, and Nutritional Insufficiency businesses (the "Patient Recovery Business") from Medtronic plc for $6.1 billion in cash. The acquisition further expanded the Medical segment's portfolio of Cardinal Health Brand products.
China Distribution Business Divestiture
During fiscal 2018 we completed the divestiture of our pharmaceutical and medical products distribution business in China (the "China distribution business") to Shanghai Pharmaceuticals Holding Co., Ltd. for proceeds of $861 million (after adjusting for third party indebtedness and preliminary transaction adjustments). The proceeds are not reflective of tax obligations due in connection with the sale, for which we have recorded a liability of
$59 million
. We recognized a pre-tax loss of $41 million related to this divestiture.
naviHealth Divestiture
In June 2018, we signed a securities purchase agreement and a contribution and rollover agreement with investor entities controlled by Clayton, Dubilier & Rice ("CD&R") to sell our ownership interest in naviHealth for proceeds of
$736 million
(after adjusting for certain fees and expenses) and a
44%
equity interest in a partnership that owns naviHealth. We also have certain call rights to reacquire naviHealth. We do not expect a cash tax impact from this transaction because the capital gain will be offset by capital loss carry-forwards
.
The transaction closed on August 1, 2018. We expect to record a pre-tax gain of more than $500 million in the first quarter of fiscal 2019.
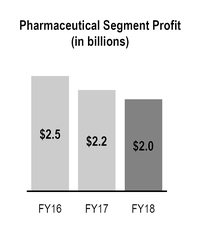
Trends
Within our Pharmaceutical segment, we expect fiscal 2019 segment profit to be less than our fiscal 2018 segment profit due to the adverse impact of customer contract renewals, generics program performance, and the previously announced loss of a large pharmaceutical distribution customer. Our generics program performance includes the negative impact of generic pharmaceutical customer pricing changes partially offset by the benefits of Red Oak Sourcing. As is generally the case, the frequency, timing, magnitude and profit impact of pharmaceutical customer pricing changes and branded and generic pharmaceutical manufacturer pricing changes remain uncertain and their impact on Pharmaceutical segment profit and consolidated operating earnings in fiscal 2019 could be more or less than we expect.
The acquisition of the Patient Recovery Business increased Medical segment revenue and profit during fiscal 2018. We expect the acquisition to increase Medical segment profit further during fiscal 2019 due to the one additional month of results and the fiscal 2018 negative impact of the inventory fair value step up. We also expect the acquisition will increase amortization and acquisition-related costs in fiscal 2019 due to the size and complexity of the acquisition.
The performance of our Cordis business within our Medical segment declined significantly due to inventory challenges and increased operating costs in fiscal 2018. We expect Cordis performance to stabilize in fiscal 2019.
In early fiscal 2019, we implemented certain enterprise-wide cost-saving measures, which we expect to reduce our future operating expenses.
Tax Cuts and Jobs Act
The Tax Act was enacted in December 2017. The Tax Act, among other things, reduced the U.S. federal corporate tax rate from 35 percent to 21 percent and required companies to pay a one-time tax to repatriate, for U.S. purposes, earnings of certain foreign subsidiaries that were previously deferred for tax purposes. The rate change was effective at the beginning of calendar year 2018 and the application of the lower federal tax rate to our U.S. pre-tax earnings resulted in a significant favorable impact to our tax provision in fiscal 2018. Additionally, we recognized a $936 million provisional net transitional tax benefit during fiscal 2018, consisting of the remeasurement of our U.S. deferred tax assets and liabilities at the lower tax rate partially offset by the expense for the repatriation tax. We expect the lower federal statutory rate to be more beneficial in fiscal 2019 than in 2018; however, beginning in fiscal 2019, the Tax Act limits certain deductions and creates new taxes on certain foreign sourced earnings, which will offset some of the additional benefit.
We are still completing our accounting for the tax effects of the Tax Act because all of the necessary information is not currently available, prepared, or analyzed. As such, the amounts we have recorded are provisional estimates and, as permitted by the SEC, we will continue to assess the impact of enactment of the Tax Act and we may record additional provisional amounts or adjustments to provisional amounts during the first half of fiscal 2019.
|
Cardinal Health
|
Fiscal 2018 Form 10-K
|
6
|
|
|
MD&A
|
Results of Operations
|
|
Results of Operations
Revenue
|
Revenue
|
Change
|
||||||||||||||||
|
(in millions)
|
2018
|
2017
|
2016
|
2018
|
2017
|
||||||||||||
|
Pharmaceutical
|
$
|
121,241
|
|
$
|
116,463
|
|
$
|
109,131
|
|
4
|
%
|
7
|
%
|
||||
|
Medical
|
15,581
|
|
13,524
|
|
12,430
|
|
15
|
%
|
9
|
%
|
|||||||
|
Total segment revenue
|
136,822
|
|
129,987
|
|
121,561
|
|
5
|
%
|
7
|
%
|
|||||||
|
Corporate
|
(13
|
)
|
(11
|
)
|
(15
|
)
|
N.M.
|
|
N.M.
|
|
|||||||
|
Total revenue
|
$
|
136,809
|
|
$
|
129,976
|
|
$
|
121,546
|
|
5
|
%
|
7
|
%
|
||||
Fiscal
2018
Compared to Fiscal
2017
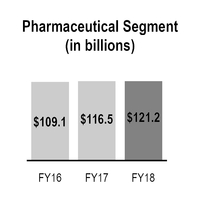
Pharmaceutical Segment
Fiscal
2018
Pharmaceutical segment revenue grew primarily due to sales growth from pharmaceutical distribution and specialty pharmaceutical customers, which together increased revenue by $9.4 billion. The increases were partially offset by the previously announced May 2017 expiration of a large pharmaceutical distribution mail order customer contract and the February 2018 divestiture of our China distribution business.
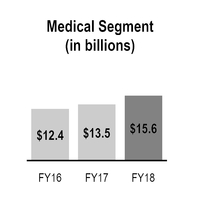
Medical Segment
Fiscal
2018
Medical segment revenue grew mainly due to $1.9 billion of contributions from acquisitions, which primarily consists of the Patient Recovery Business acquisition.
Fiscal
2017
Compared to Fiscal
2016
Pharmaceutical Segment
Fiscal
2017
Pharmaceutical segment revenue grew primarily due to sales growth from the addition of OptumRx and from other pharmaceutical distribution customers, including branded pharmaceutical price appreciation, all of which increased revenue by $7.0 billion.
Medical Segment
Fiscal
2017
Medical segment revenue grew primarily due to sales growth from new and existing customers and $212 million in contributions from acquisitions.
Cost of Products Sold
Cost of products sold f
or fiscal 2018 and 2017
increased
$6.2 billion
(
5 percent
) and
$8.4 billion
(
7 percent
) compared to the prior-year periods, respectively, as a result of the same factors affecting the changes in revenue and gross margin.
|
7
|
Cardinal Health
|
Fiscal 2018 Form 10-K
|
|
|
MD&A
|
Results of Operations
|
|
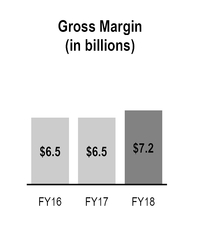
Gross Margin

|
Consolidated Gross Margin
|
Change
|
||||||||||||||||
|
(in millions)
|
2018
|
2017
|
2016
|
2018
|
2017
|
||||||||||||
|
Gross margin
|
$
|
7,181
|
|
$
|
6,544
|
|
$
|
6,543
|
|
10
|
%
|
—
|
%
|
||||
Fiscal
2018
Compared to Fiscal
2017
Fiscal
2018
consolidated gross margin increased $637 million (
10 percent
) and was favorably impacted by acquisitions ($809 million), which primarily consists of the Patient Recovery Business acquisition.
Gross margin rate grew during fiscal
2018
, mainly due to acquisitions, which primarily consists of the Patient Recovery Business acquisition. Gross margin rate growth was partially offset by the negative impact of changes in pharmaceutical distribution product mix and performance in our Cordis business due to inventory challenges and increased manufacturing costs.
Fiscal
2017
Compared to Fiscal
2016
Fiscal
2017
consolidated gross margin was essentially flat versus the prior-year period.
Consolidated gross margin for fiscal
2017
was positively impacted by sales growth from pharmaceutical distribution customers ($260 million) and acquisitions in both segments ($132 million) and was negatively impacted by the previously disclosed loss of a large pharmaceutical distribution customer.
Gross margin rate contracted during fiscal
2017
, primarily due to generic pharmaceutical customer pricing changes, partially offset by the benefits from Red Oak Sourcing within our Pharmaceutical segment generics program.
Distribution, Selling, General and Administrative ("SG&A") Expenses
|
SG&A Expenses
|
Change
|
||||||||||||||||
|
(in millions)
|
2018
|
2017
|
2016
|
2018
|
2017
|
||||||||||||
|
SG&A expenses
|
$
|
4,596
|
|
$
|
3,775
|
|
$
|
3,648
|
|
22
|
%
|
3
|
%
|
||||
Fiscal
2018
Compared to Fiscal
2017
Fiscal
2018
SG&A expenses increased mainly due to acquisitions ($524 million),
which primarily consists of the Patient Recovery Business acquisition, and enterprise-wide compensation related items.
Fiscal
2017
Compared to Fiscal
2016
Fiscal
2017
SG&A expenses increased primarily due to acquisitions ($112 million) and costs related to a multi-year project to replace certain Pharmaceutical segment finance and operating information systems, partially offset by reduced enterprise-wide incentive compensation.
|
Cardinal Health
|
Fiscal 2018 Form 10-K
|
8
|
|
|
MD&A
|
Results of Operations
|
|
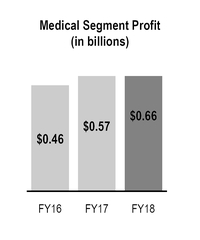
Segment Profit
We evaluate segment performance based on segment profit, among other measures. See
Note 16
of the "Notes to Consolidated Financial Statements" for additional information on segment profit.
|
Segment Profit and Operating Earnings
|
Change
|
||||||||||||||||
|
(in millions)
|
2018
|
2017
|
2016
|
2018
|
2017
|
||||||||||||
|
Pharmaceutical
|
$
|
1,992
|
|
$
|
2,187
|
|
$
|
2,488
|
|
(9
|
)%
|
(12
|
)%
|
||||
|
Medical
|
662
|
|
572
|
|
457
|
|
16
|
%
|
25
|
%
|
|||||||
|
Total segment profit
|
2,654
|
|
2,759
|
|
2,945
|
|
(4
|
)%
|
(6
|
)%
|
|||||||
|
Corporate
|
(2,528
|
)
|
(639
|
)
|
(486
|
)
|
296
|
%
|
31
|
%
|
|||||||
|
Total consolidated operating earnings
|
$
|
126
|
|
$
|
2,120
|
|
$
|
2,459
|
|
(94
|
)%
|
(14
|
)%
|
||||
Fiscal
2018
Compared to Fiscal
2017
Pharmaceutical Segment Profit
Fiscal
2018
Pharmaceutical segment profit decreased largely due to our generics program performance and the adverse impact of customer contract renewals. Our generics program performance includes the negative impact of generic pharmaceutical customer pricing changes partially offset by the benefits of Red Oak Sourcing. Performance from our specialty pharmaceutical products distribution and services business positively impacted Pharmaceutical segment profit.
Medical Segment Profit
Fiscal
2018
Medical segment profit increased largely due to acquisitions, inclusive of the unfavorable cost of products sold impact from the fair value step up of inventory acquired with the Patient Recovery Business acquisition.
The increase was partially offset by
performance from the Cordis business, and to a lesser extent, performance from other Cardinal Health Brand products. The performance from the Cordis business primarily reflects inventory challenges and increased operating costs.
Corporate
The changes in Corporate during fiscal
2018
are due to the factors discussed in the Other Components of Consolidated Operating Earnings section that follows.
Fiscal
2017
Compared to Fiscal
2016
Pharmaceutical Segment Profit
Fiscal
2017
Pharmaceutical segment profit decreased largely due to our generic program performance. The previously disclosed loss of a large pharmaceutical distribution customer, the adverse impact of customer contract renewals and reduced levels of branded pharmaceutical price appreciation also contributed to the decrease in Pharmaceutical segment profit.
Medical Segment Profit
Fiscal
2017
Medical segment profit increased due to strong performance
from naviHealth, contributions from Cardinal Health branded products, reduced enterprise-wide incentive compensation, and contributions from distribution services. Cardinal Health branded products growth includes the prior year unfavorable impact on cost of products sold from the Cordis inventory fair value step up.
Corporate
The changes in Corporate during fiscal
2017
are due to the factors discussed in the Other Components of Consolidated Operating Earnings section that follows.
|
9
|
Cardinal Health
|
Fiscal 2018 Form 10-K
|
|
|
MD&A
|
Results of Operations
|
|
Other Components of Consolidated Operating Earnings
In addition to revenue, gross margin, and SG&A expenses discussed previously, consolidated operating earnings were impacted by the following:
|
(in millions)
|
2018
|
2017
|
2016
|
||||||||
|
Restructuring and employee severance
|
$
|
176
|
|
$
|
56
|
|
$
|
25
|
|
||
|
Amortization and other acquisition-related costs
|
707
|
|
527
|
|
459
|
|
|||||
|
Impairments and (gain)/loss on disposal of assets, net
|
1,417
|
|
18
|
|
21
|
|
|||||
|
Litigation (recoveries)/charges, net
|
159
|
|
48
|
|
(69
|
)
|
|||||
Restructuring and Employee Severance
The increase in restructuring and employee severance during fiscal 2018 was primarily due to $125 million in contract termination costs to transition the distribution of our Medical segment's surgeon gloves in certain international markets from a third-party distribution arrangement to a direct distribution model.
Amortization and Other Acquisition-Related Costs
Amortization of acquisition-related intangible assets was $574 million, $395 million and $355 million for fiscal
2018
,
2017
and
2016
, respectively. The increase in amortization of acquisition-related intangible assets during fiscal
2018
was largely due to the Patient Recovery Business acquisition.
Transaction and integration costs associated with the acquisition of the Patient Recovery Business were
$109 million
and $54 million during fiscal
2018
and 2017, respectively.
Impairments and (gain)/loss on disposal of assets, net
During the fourth quarter of fiscal 2018, we recognized a $1.4 billion non-cash goodwill impairment charge related to our Medical segment, as discussed further in
Note 5
of the "Notes to Consolidated Financial Statements." There was no tax benefit related to this goodwill impairment charge.
Litigation (Recoveries)/Charges, Net
The increases in litigation charges during fiscal 2018 and 2017 were due to an increase in estimated losses and legal defense costs associated with inferior vena cava (IVC) filter product liability claims.
During fiscal
2016
, we received and recognized income of
$80 million
from settlements of class action antitrust lawsuits in which we were a class member.
Earnings/(loss) Before Income Taxes
|
|
In addition to the items discussed above, earnings/(loss) before income taxes was impacted by the following:
|
Earnings/(loss) Before Income Taxes
|
Change
|
||||||||||||||||
|
(in millions)
|
2018
|
2017
|
2016
|
2018
|
2017
|
||||||||||||
|
Other (income)/expense, net
|
$
|
23
|
|
$
|
(5
|
)
|
$
|
5
|
|
N.M.
|
|
N.M.
|
|
||||
|
Interest expense, net
|
329
|
|
201
|
|
178
|
|
64
|
%
|
13
|
%
|
|||||||
|
Loss on extinguishment of debt
|
2
|
|
—
|
|
—
|
|
N.M.
|
|
N.M.
|
|
|||||||
Interest Expense, Net
Fiscal 2018 interest expense increased primarily due to new debt issued in June 2017 to fund a portion of the purchase price of the Patient Recovery Business acquisition.
|
Cardinal Health
|
Fiscal 2018 Form 10-K
|
10
|
|
|
MD&A
|
Results of Operations
|
|
Provision for Income Taxes
Generally, fluctuations in the effective tax rate are due to changes in the distribution of income among taxing jurisdictions with differing income tax rates and other reconciling items.
The fluctuations in the effective tax rate from fiscal 2017 to fiscal 2018 are primarily due to net benefits from the enactment of the Tax Act, the impact of nondeductible goodwill impairment charges, an increase in valuation allowances and a benefit from a capital loss due to international legal entity reorganization. The significant increase in valuation allowances were related to capital losses, credit carryforwards and net operating loss carryforwards in U.S. federal, U.S. state and international jurisdictions that will not likely be realized. A reconciliation of the provision based on the federal statutory income tax rate to our effective income tax rate from continuing operations is as follows (see
Note 8
of the "Notes to Consolidated Financial Statements" for additional information):
|
|
2018 (1)
|
2017 (2)
|
2016 (2)
|
|||||
|
Provision at Federal statutory rate
|
28.1
|
%
|
35.0
|
%
|
35.0
|
%
|
||
|
State and local income taxes, net of federal benefit
|
(16.0
|
)
|
1.0
|
|
1.5
|
|
||
|
Foreign tax rate differential
|
(48.4
|
)
|
(7.3
|
)
|
(0.6
|
)
|
||
|
Nondeductible/nontaxable items
|
(10.2
|
)
|
0.2
|
|
1.0
|
|
||
|
Goodwill impairment
|
(124.7
|
)
|
—
|
|
—
|
|
||
|
Tax Act
|
410.9
|
|
—
|
|
—
|
|
||
|
Capital loss
|
71.4
|
|
—
|
|
—
|
|
||
|
Change in valuation allowances
|
(76.9
|
)
|
7.7
|
|
0.1
|
|
||
|
Foreign tax credits
|
27.3
|
|
(1.6
|
)
|
(0.1
|
)
|
||
|
China tax
|
(25.8
|
)
|
—
|
|
—
|
|
||
|
Other
|
(21.9
|
)
|
(2.3
|
)
|
0.2
|
|
||
|
Effective income tax rate
|
213.8
|
%
|
32.7
|
%
|
37.1
|
%
|
||
|
(1)
|
The effective income tax rate for fiscal 2018 represents an income tax benefit tax rate.
|
|
(2)
|
The effective income tax rates for fiscal 2017 and 2016 represents income tax expense tax rates.
|
Fiscal
2018
The fiscal 2018 effective income tax rate was impacted by various items including benefits from the enactment of the Tax Act, the impact of nondeductible goodwill impairment charges, changes in valuation allowances and a benefit from a capital loss due to an international legal entity reorganization.
The net benefit from the Tax Act for fiscal 2018 includes a provisional net tax benefit of $977 million related to the remeasurement of our deferred tax assets and liabilities to the new federal statutory rate, the benefit from the impact of applying a lower federal tax rate to our year-to-date U.S. pre-tax earnings and a provisional tax expense of $41 million for the one-time repatriation tax applied to our undistributed foreign earnings.
Our effective tax rate for fiscal 2018 also includes $59 million of tax expense recognized in connection with the sale of our China distribution business.
Ongoing Audits
The IRS is currently conducting audits of fiscal years 2008 through 2014.
Fiscal
2017
and Fiscal
2016
The fiscal 2017 effective income tax rate was favorably impacted by the realignment of foreign subsidiaries in anticipation of closing the acquisition of the Patient Recovery Business and also from deductions related to U.S. production activities. The state and local income tax rate decreased primarily due to resolutions with state taxing authorities.
The fiscal 2016 effective income tax rate was favorably impacted by the state and local income tax rate, which decreased due to resolutions with state taxing authorities and a shift in the distribution of income among jurisdictions. The foreign tax rate differential decreased primarily due to the deferred tax benefits recognized in fiscal 2015.
|
11
|
Cardinal Health
|
Fiscal 2018 Form 10-K
|
|
|
MD&A
|
Liquidity and Capital Resources
|
|
Liquidity and Capital Resources
We currently believe that, based on available capital resources (cash on hand and committed credit facilities) and projected operating cash flow, we have adequate capital resources to fund working capital needs; currently anticipated capital expenditures; currently anticipated business growth and expansion; contractual obligations; tax payments; and current and projected debt service requirements, dividends, and share repurchases. If we decide to engage in one or more additional acquisitions, depending on the size and timing of such transactions, we may need to access capital markets for additional financing.
Cash and Equivalents
Our cash and equivalents balance was
$1.8 billion
at
June 30, 2018
compared to
$6.9 billion
at
June 30, 2017
.
The decrease in cash and equivalents during fiscal
2018
was due to
$6.1 billion
deployed for acquisitions during the year,
$954 million
used for debt repayments,
$581 million
paid in dividends,
$550 million
paid for share repurchases and
$384 million
paid for capital expenditures, offset in part by
$2.8 billion
net cash provided by operating activities and
$861 million
of proceeds from the divestiture of the China distribution business. N
et cash provided by operating activities increased by $1.6 billion from fiscal 2017 primarily due to working capital changes in part as a result of timing of customer and vendor payments related to the new Pharmaceutical segment finance and operating information systems. At
June 30, 2018
, our cash and equivalents were held in cash depository accounts with major banks or invested in high quality, short-term liquid investments.
In August 2018, we completed the sale of our interest in naviHealth to CD&R and received proceeds of
$736 million
(after adjusting for certain fees and expenses) and a
44%
equity interest in a partnership that owns naviHealth.
The increase in cash and equivalents during fiscal
2017
of $4.5 billion was due to proceeds from a $5.2 billion debt issuance and
$1.2 billion
provided by operating activities, partially offset by
$600 million
paid for share repurchases,
$577 million
paid in dividends,
$387 million
paid in capital expenditures and $310 million in debt repayments. The $1.8 billion decrease in net cash provided by operating activities in fiscal 2017 was primarily due to an increase in working capital as a result of changes in timing of customer and vendor payments, some of which related to implementation of the new Pharmaceutical segment finance and operating information systems.
The decrease in cash and equivalents during fiscal 2016 of $2.2 billion was due to
$3.6 billion
deployed for acquisitions,
$651 million
paid for share repurchases,
$512 million
paid in dividends and
$465 million
paid in capital expenditures, partially offset by net cash provided by operating activities of
$3.0 billion
, which was positively impacted by increased net earnings and working capital improvements.
The cash and equivalents balance at
June 30, 2018
included $557 million of cash held by subsidiaries outside of the United States.
Though our foreign earnings as of December 31, 2017 have been deemed to be repatriated from a U.S. federal tax perspective, we have not yet completed our assessment of the Tax Act on our plans to reinvest foreign earnings and as such have not changed our prior conclusion that the earnings are indefinitely reinvested. As such, no non-U.S. taxes related to repatriation were recorded at
June 30, 2018
. If we decide to repatriate these earnings in the future, we may be subject to certain non-U.S. taxes at that time. See
Note 8
of the "Notes to Consolidated Financial Statements" for additional information on the Tax Act.
Changes in working capital, which impact operating cash flow, can vary significantly depending on factors such as the timing of customer payments, inventory purchases and payments to vendors in the regular course of business, as well as fluctuating working capital needs driven by customer and product mix.
Other Financing Arrangements and Financial Instruments
Credit Facilities and Commercial Paper
In addition to cash and equivalents and operating cash flow, other sources of liquidity at
June 30, 2018
include a
$2.0 billion
commercial paper program, backed by a
$2.0 billion
revolving credit facility. We also have a
$1.0 billion
committed receivables sales facility program. At
June 30, 2018
, we had no amounts outstanding under our revolving credit facility or our committed receivables sales facility program. Under our commercial paper and committed receivables
programs, we had maximum amounts outstanding of
$1.7 billion
and an average daily amount outstanding of
$277 million
during fiscal 2018. Our revolving credit facility and committed receivables sales facility programs require us to maintain, as of the end of any calendar quarter, a consolidated leverage ratio of
no more than 4.25-to-1
, which will reduce to 3.25-to-1 in March 2019. As of
June 30, 2018
, we were in compliance with this financial covenant.
|
Cardinal Health
|
Fiscal 2018 Form 10-K
|
12
|
|
|
MD&A
|
Liquidity and Capital Resources
|
|
Long-Term Obligations
In June 2018, we repaid our
$550 million
1.95% Notes due 2018 in full at maturity. At
June 30, 2018
, we had total long-term obligations of
$8.0 billion
.
In fiscal 2018 we sold our China distribution business, including its debt which was $378 million as of June 30, 2017.
See
Note 4
of the “Notes to Consolidated Financial Statements”
for further discussion of this divestiture.
In June 2017, we sold $1 billion aggregate principal amount of 1.948% notes due 2019, $1.15 billion aggregate principal amount of 2.616% notes due 2022, $350 million aggregate principal amount of floating rate notes due 2022, $750 million aggregate principal amount of 3.079% notes due 2024, $1.35 billion aggregate principal amount of 3.410% notes due 2027 and $600 million aggregate principal amount of 4.368% notes due 2047. In addition to funding a portion of the purchase price of the acquisition of the
Patient Recovery Business
described below, in July 2017 we used a portion of the debt proceeds to redeem our $400 million 1.7% notes due 2018.
Funding for Acquisition of Medtronic's Patient Recovery Business
On
July 29, 2017
, we acquired the
Patient Recovery Business from Medtronic
for
$6.1 billion
in cash. We funded the acquisition through
$4.5 billion
in new long-term debt issued in June 2017, the use of existing cash and borrowings under existing credit arrangements.
Risk Management
We use interest rate swaps, foreign currency contracts and commodity contracts to manage our exposure to cash flow variability. We also use interest rate swaps to protect the value of our debt and use foreign currency forward contracts to protect the value of our existing and forecasted foreign currency assets and liabilities. See the "Quantitative and Qualitative Disclosures About Market Risk" section as well as
Note 1
and
Note 12
of the “Notes to Consolidated Financial Statements” for information regarding the use of financial instruments and derivatives as well as foreign currency, interest rate and commodity exposures.
Capital Deployment
Capital Expenditures
Capital expenditures during fiscal
2018
,
2017
and
2016
were
$384 million
,
$387 million
and
$465 million
, respectively.
We expect capital expenditures in fiscal
2019
to be between $360 million and $390 million primarily for information technology projects, growth projects in our core business and for integration of the acquisition of the Patient Recovery Business.
Dividends
During fiscal
2018
, we paid quarterly dividends totaling
$1.85
per share, an increase of
3 percent
from fiscal
2017
.
On May 9, 2018, our Board of Directors approved a quarterly dividend of $0.4763 per share, or $1.91 per share on an annualized basis, which was paid on July 15, 2018 to shareholders of record on July 2, 2018.
On August 8, 2018, our Board of Directors approved a quarterly dividend of $0.4763 per share, or $1.91 per share on an annualized basis, which will be paid on October 15, 2018 to shareholders of record on October 1, 2018.
Share Repurchases
During fiscal
2018
, we repurchased $550 million of our common shares. We funded the repurchases with available cash and short-term borrowing. At
June 30, 2018
, we
had
$893 million
r
emaining under our existing $1.0 billion share repurchase program.
On August 16, 2018 we entered into an accelerated share repurchase program ("ASR") to purchase shares of our common stock for an aggregate purchase price of $
600 million
and received an initial delivery of
9.5 million
shares of common stock using a reference price of $
50.45
. The program is expected to conclude in the second quarter of fiscal 2019.
During fiscal 2017, we repurchased $600 million of our common shares. We funded the repurchases with available cash.
Acquisition of Medtronic's Patient Recovery Business
Described above under "Funding for Acquisition of Medtronic's Patient Recovery Business."
|
13
|
Cardinal Health
|
Fiscal 2018 Form 10-K
|
|
|
MD&A
|
Other
|
|
Contractual Obligations
At
June 30, 2018
, our contractual obligations, including estimated payments due by period, are as follows:
|
(in millions)
|
2019
|
2020 to 2021
|
2022 to 2023
|
There-after
|
Total
|
||||||||||||||
|
Long-term debt and short-term borrowings (1)
|
$
|
999
|
|
$
|
964
|
|
$
|
2,259
|
|
$
|
4,783
|
|
$
|
9,005
|
|
||||
|
Interest on long-term debt
|
303
|
|
531
|
|
420
|
|
2,068
|
|
3,322
|
|
|||||||||
|
Capital lease obligations (2)
|
2
|
|
4
|
|
2
|
|
—
|
|
8
|
|
|||||||||
|
Operating leases (3)
|
113
|
|
174
|
|
99
|
|
103
|
|
489
|
|
|||||||||
|
Purchase obligations and other payments (4)
|
534
|
|
501
|
|
382
|
|
196
|
|
1,613
|
|
|||||||||
|
Total contractual obligations (5)
|
$
|
1,951
|
|
$
|
2,174
|
|
$
|
3,162
|
|
$
|
7,150
|
|
$
|
14,437
|
|
||||
|
(1)
|
Represents maturities of our long-term debt obligations and other short-term borrowings excluding capital lease obligations described below. See
Note 7
of the “Notes to Consolidated Financial Statements” for further information.
|
|
(2)
|
Represents maturities of our capital lease obligations included within long-term obligations in our consolidated balance sheets.
|
|
(3)
|
Represents minimum rental payments for operating leases having initial or remaining non-cancelable lease terms as described in
Note 9
of the “Notes to Consolidated Financial Statements.”
|
|
(4)
|
A purchase obligation is defined as an agreement to purchase goods or services that is legally enforceable and specifies all significant terms, including fixed or minimum quantities to be purchased; fixed, minimum or variable price provisions; and approximate timing of the transaction. The purchase obligation amounts disclosed above represent estimates of the minimum for which we are obligated and the time period in which cash outflows will occur. Purchase orders and authorizations to purchase that involve no firm commitment from either party are excluded from the above table. In addition, contracts that can be unilaterally canceled with no termination fee or with proper notice are excluded from our total purchase obligations except for the amount of the termination fee or the minimum amount of goods that must be purchased during the requisite notice period. Purchase obligations and other payments also includes quarterly payments of $45.6 million that we are required to pay CVS Health Corporation ("CVS") in connection with Red Oak Sourcing and will be in place for the remaining six years of the agreement. See
Note 9
of the “Notes to Consolidated Financial Statements” for additional information.
|
|
(5)
|
Long-term liabilities, such as unrecognized tax benefits, deferred taxes and other tax liabilities, have been excluded from the above table due to the inherent uncertainty of the underlying tax positions or because of the inability to reasonably estimate the timing of any cash outflows. See
Note 8
of the "Notes to Consolidated Financial Statements" for further discussion of income taxes.
|
Off-Balance Sheet Arrangements
We had no significant "off-balance sheet arrangements" at
June 30, 2018
, as that term is defined in the SEC rules.
Recent Financial Accounting Standards
See
Note 1
of the “Notes to Consolidated Financial Statements” for a discussion of recent financial accounting standards.
|
Cardinal Health
|
Fiscal 2018 Form 10-K
|
14
|
|
|
MD&A
|
Critical Accounting Policies and Sensitive Accounting Estimates
|
|
Critical Accounting Policies and Sensitive Accounting Estimates
Critical accounting policies are those accounting policies that (i) can have a significant impact on our financial condition and results of operations and (ii) require the use of complex and subjective estimates based upon past experience and management’s judgment. Other people applying reasonable judgment to the same facts and circumstances could develop different estimates. Because estimates are inherently uncertain, actual results may differ. In this section, we describe the significant policies applied in preparing our consolidated financial statements that management believes are the most dependent on estimates and assumptions. For further discussion of accounting policies for items within this section and of additional accounting policies, see
Note 1
of the “Notes to Consolidated Financial Statements.”
Allowance for Doubtful Accounts
The allowance for doubtful accounts includes general and specific reserves. We determine our allowance for doubtful accounts by reviewing accounts receivable aging, industry trends, customer financial strength and credit standing, historical write-off trends and payment history. We regularly evaluate how changes in economic conditions may affect credit risks. See
Note 1
of the “Notes to Consolidated Financial Statements” for further information on our policy for Receivables and Allowance for Doubtful Accounts.
A hypothetical 0.1 percent increase or decrease in the reserve as a percentage of trade receivables at
June 30, 2018
, would result in an increase or decrease in bad debt expense of
$8 million
. We believe the reserve maintained and expenses recorded in fiscal
2018
are appropriate.
At this time, we are not aware of any analytical findings or customer issues that are likely to lead to a significant future increase in the allowance for doubtful accounts as a percentage of revenue. The following table presents information regarding the allowance for doubtful accounts over the past three fiscal years:
|
(in millions, except percentages)
|
2018
|
2017
|
2016
|
||||||||
|
Allowance for doubtful accounts at beginning of period
|
$
|
137
|
|
$
|
135
|
|
$
|
135
|
|
||
|
Charged to costs and expenses
|
114
|
|
60
|
|
74
|
|
|||||
|
Reduction to allowance for customer deductions and write-offs
|
(111
|
)
|
(58
|
)
|
(74
|
)
|
|||||
|
Allowance for doubtful accounts at end of period
|
$
|
139
|
|
$
|
137
|
|
$
|
135
|
|
||
|
Allowance as a percentage of customer receivables
|
1.8
|
%
|
1.7
|
%
|
1.8
|
%
|
|||||
|
Allowance as a percentage of revenue
|
0.10
|
%
|
0.11
|
%
|
0.11
|
%
|
|||||
The sum of the components may not equal the total due to rounding.
Inventories
A substantial portion of our inventories (
56 percent
at both
June 30, 2018
and
2017
) are valued at the lower of cost, using the last-in, first-out ("LIFO") method, or market. These are primarily merchandise inventories at the core pharmaceutical distribution facilities within our Pharmaceutical segment (“distribution facilities”). The LIFO impact on the consolidated statements of earnings depends on pharmaceutical manufacturer price appreciation or deflation and our fiscal year-end inventory levels, which can be meaningfully influenced by customer buying behavior immediately preceding our fiscal year-end. Historically, prices for branded pharmaceuticals have generally tended to rise, resulting in an increase in cost of products sold, whereas prices for generic pharmaceuticals generally tend to decline, resulting in a decrease in cost of products sold. See
Note 1
of the “Notes to Consolidated Financial Statements” for further information on our policy for Inventories.
Using LIFO, if there is a decrease in inventory levels that have experienced pharmaceutical price appreciation, the result generally will be a decrease in future cost of products sold as our older inventory is held at a lower cost. Conversely, if there is a decrease in inventory levels that have experienced a pharmaceutical price decline, the result generally will be an increase in future cost of products sold as our older inventory is held at a higher cost.
We believe that the average cost method of inventory valuation provides a reasonable approximation of the current cost of replacing inventory within these distribution facilities. As such, the LIFO reserve is the difference between (a) inventory at the lower of LIFO cost or market and (b) inventory at replacement cost determined using the average cost method of inventory valuation. If we had used the average cost method of inventory valuation for all inventory within the distribution facilities, the value of our inventories would not have changed in fiscal
2018
or
2017
because inventories valued at LIFO were
$92 million
and
$46 million
higher than the average cost value at
June 30, 2018
and
2017
, respectively. We do not record inventories in excess of replacement cost. As such, we did not record a LIFO reserve in fiscal
2018
and
2017
.
Our remaining inventory that is not valued at the lower of LIFO or market is stated at the lower of cost, using the first-in, first-out method, or market. Inventories presented in the consolidated balance sheets are net of reserves for excess and obsolete inventory which were
$147 million
and
$76 million
at
June 30, 2018
and
2017
, respectively.
The increase in the reserves for excess and obsolete inventory during fiscal
2018
was driven by increased
inventory reserves within our Medical segment Cordis business and the Patient Recovery acquisition.
|
15
|
Cardinal Health
|
Fiscal 2018 Form 10-K
|
|
|
MD&A
|
Critical Accounting Policies and Sensitive Accounting Estimates
|
|
We reserve for inventory obsolescence using estimates based on historical experience, historical and projected sales trends, specific categories of inventory, age and expiration dates of on-hand
inventory and manufacturer return policies. If actual conditions are less favorable than our assumptions, additional inventory reserves may be required.
Business Combinations
The assets acquired and liabilities assumed in a business combination, including identifiable intangible assets, are recorded at their estimated fair values as of the acquisition date. For further discussion of the Business Combinations accounting policy, see
Note 1
of the “Notes to Consolidated Financial Statements.”
Critical estimates and assumptions include: expected future cash flows for customer relationships, trademarks, trade names, patents,
developed technology, in-process research and development ("IPR&D") and other identifiable intangible assets; discount rates that reflect the risk factors associated with future cash flows; and estimates of useful lives. See
Note 2
of the “Notes to Consolidated Financial Statements” for additional information regarding our acquisitions.
Goodwill and Other Indefinite-Lived Intangible Assets
Purchased goodwill and intangible assets with indefinite lives are tested for impairment annually or when indicators of impairment exist. Goodwill impairment testing involves a comparison of the estimated fair value of reporting units to the respective carrying amount, which may be performed utilizing either a qualitative or quantitative assessment.
Qualitative factors are first assessed to determine if it is more likely than not that the fair value of a reporting unit is less than its carrying amount. If it is determined that it is more likely than not that the fair value does not exceed the carrying amount, then a quantitative test is performed. The quantitative goodwill impairment test involves a comparison of the estimated fair value of the reporting unit to the respective carrying amount.
A reporting unit is defined as an operating segment or
one level below an operating segment (also known as a component).
We have two operating segments, which are the same as our reportable segments: Pharmaceutical and Medical. These operating segments are comprised of divisions (which are components), for which discrete financial information is available. Components are aggregated into reporting units for purposes of goodwill impairment testing to the extent that they share similar economic characteristics. Our reporting units are: Pharmaceutical operating segment (excluding our Nuclear Pharmacy Services division); Nuclear Pharmacy Services division; Medical operating segment (excluding our Cardinal Health at Home division and naviHealth division) (“Medical Unit”); Cardinal Health at Home division; and naviHealth division.
Goodwill impairment testing involves judgment, including the identification of repo
rting units, qualitative evaluation of events and circumstances to determine if it is more likely than not that an impairment exists, and, if necessary,
the estimation of the fair value of the applicable reporting
unit. Our qualitative evaluation considers the weight of evidence and significance of all identified events and circumstances and most relevant drivers of fair value, both positive and negative, in determining whether it is more likely than not that the fair value of a reporting unit is less than its carrying amount.
Our determination of estimated fair value of our reporting units is based on a combination of the income-based and market-based
approaches
(using discount rates ranging from
8.5 percent
to
13.5 percent
)
. We use discount rates that are commensurate with the risks and uncertainty inherent in the respective reporting units and in our internally-developed forecasts. Under the market-based approach, we determine fair value by comparing our reporting units to similar businesses or guideline companies whose securities are actively traded in public markets. We also use the guideline transaction method to determine fair value based on pricing multiples derived from the sale of companies that are similar to our reporting units.
Estimating the fair value of reporting units requires the use of estimates and significant judgments that are based on a number of factors including actual operating results. The use of alternate estimates and assumptions or changes in the industry or peer groups could materially affect the determination of fair value for each reporting unit and potentially result in goodwill impairment. If a reporting unit fails to achieve expected earnings or otherwise fails to meet current financial plans, or if there were changes to any other key assumptions used in the tests, the reporting unit could incur a goodwill impairment in a future period.
We performed annual impairment testing in fiscal 2018, 2017 and 2016 and, with the exception of our Medical Unit in fiscal 2018, concluded that there were no impairments of goodwill as the estimated fair value of each reporting unit exceeded its carrying value. As discussed further in
Note 5
of the "Notes to Consolidated Financial Statements," during the fourth quarter of fiscal 2018 we recognized a
$1.4 billion
goodwill impairment charge related to our Medical Unit, which is included in impairments and loss on disposal of assets in our consolidated statements of earnings. The impairment was primarily driven by inventory and cost challenges within our Cordis business which furthered in the fourth quarter of fiscal 2018. There was no tax benefit related to the goodwill impairment charge. If the fair value of the Medical Unit were to decline below its carrying value in subsequent periods, additional impairment would be recognized in those periods. For any of our other reporting units, there would not have been an impairment for fiscal 2018 if we raised the discount rate by 1 percent.
|
Cardinal Health
|
Fiscal 2018 Form 10-K
|
16
|
|
|
MD&A
|
Critical Accounting Policies and Sensitive Accounting Estimates
|
|
The impairment test for indefinite-lived intangibles other than goodwill (primarily IPR&D) involves first assessing qualitative factors to determine if it is more likely than not that the fair value of the indefinite-lived intangible asset is less than its carrying amount. If so, then a quantitative test is performed to compare the estimated fair value of the indefinite-lived intangible asset to the respective asset's carrying amount. Our qualitative evaluation
requires the use of estimates and significant judgments and
considers the weight of evidence and
significance of all identified events and circumstances and most relevant drivers of fair value, both positive and negative, in determining whether it is more likely than not that the fair value of the indefinite-lived intangible asset is less than its carrying amount.
See
Note 1
of "Notes to Consolidated Financial Statements" for additional information regarding goodwill and other intangible assets.
Vendor Reserves
In the ordinary course of business, our vendors may dispute deductions taken against payments otherwise due to them or assert other disputes. These disputed transactions are researched and resolved based upon findings of the research performed. At any given time, there are outstanding items in various stages of research and resolution. In determining appropriate reserves for areas of exposure with our vendors, we assess historical experience and current outstanding claims. We have established various levels of reserves based on the type of claim and status of review. For further discussion on the Vendor Reserves, see
Note 1
of “Notes to Consolidated Financial Statements.”
Vendor reserves were
$45 million
and
$50 million
at
June 30, 2018
and
2017
, respectively. Approximately 69 percent of the vendor reserve at the end of fiscal
2018
pertained to the Pharmaceutical segment compared to 77 percent at the end of fiscal
2017
. The reserve balance will fluctuate due to variations in outstanding claims from period-to-period, timing of resolutions and specific vendor issues.
The ultimate outcome of specific claims may be different than our original estimate and may require adjustment. We believe, however, that reserves recorded for such disputes are reasonable based upon current facts and circumstances.
Loss Contingencies and Self-Insurance
We accrue for contingencies related to disputes, litigation and regulatory matters if it is probable that a liability has been incurred and the amount of the loss can be reasonably estimated. Because these matters are inherently unpredictable and unfavorable developments or outcomes can occur, assessing contingencies is highly subjective and requires judgments about future events.
We also self-insure for employee healthcare, certain product liability matters, auto liability, property and workers' compensation and maintain insurance for individual losses exceeding certain limits when available.
Self-insurance accruals include an estimate for expected settlements on pending claims, defense costs, administrative fees, claims adjustment costs and an estimate for claims incurred but not reported. For certain types of exposures, we develop the estimate of expected ultimate costs to settle each claim based on specific information
related to each claim if available. Other estimates are based on an assessment of outstanding claims, historical analysis and current payment trends. For claims incurred but not reported, the liabilities are calculated and derived in accordance with generally accepted actuarial practices or using an estimated lag period.
We regularly review contingencies and self-insurance accruals to determine whether our accruals and related disclosures are adequate. Examples of such contingencies include the New York Opioid Stewardship Act, various lawsuits related to the distribution of prescription opioid pain medications and the Cordis IVC filter lawsuits. The amount of loss may differ from these estimates. See
Note 9
of the “Notes to Consolidated Financial Statements” for additional information regarding loss contingencies and product liability lawsuits.
|
17
|
Cardinal Health
|
Fiscal 2018 Form 10-K
|
|
|
MD&A
|
Critical Accounting Policies and Sensitive Accounting Estimates
|
|
Provision for Income Taxes
We account for income taxes using the asset and liability method. Deferred tax assets and liabilities are measured using enacted tax rates in the respective jurisdictions in which we operate. Our income tax expense, deferred income tax assets and liabilities, and unrecognized tax benefits reflect management’s assessment of estimated future taxes to be paid on items in the consolidated financial statements.
The following table presents information about our tax position at June 30:
|
(in millions)
|
2018
|
2017
|
|||||
|
Total deferred income tax assets (1)
|
$
|
848
|
|
$
|
692
|
|
|
|
Valuation allowance for deferred income tax assets (2)
|
(412
|
)
|
(237
|
)
|
|||
|
Net deferred income tax assets
|
436
|
|
455
|
|
|||
|
Total deferred income tax liabilities
|
(2,213
|
)
|
(2,331
|
)
|
|||
|
Net deferred income tax liability
|
$
|
(1,777
|
)
|
$
|
(1,876
|
)
|
|
|
(1)
|
Total deferred income tax assets included
$526 million
and
$378 million
of loss and tax credit carryforwards at
June 30, 2018
and
2017
, respectively.
|
|
(2)
|
The valuation allowance primarily relates to federal, state and international loss and credit carryforwards for which the ultimate realization of future benefits is uncertain.
|
Expiring or unusable loss and credit carryforwards and the required valuation allowances are adjusted quarterly when it is more likely than not that at least a portion of the respective deferred tax assets will not be realized. After applying the valuation allowances, we do not anticipate any limitations on our use of any of the other net deferred income tax assets described above. Tax benefits from uncertain tax positions are recognized when it is more likely than not that the position will be sustained upon examination of the technical
merits of the position, including resolutions of any related appeals or litigation. The amount recognized is measured as the largest amount of tax benefit that is greater than 50 percent likely of being realized upon settlement.
Our assumptions and estimates around uncertain tax positions require significant judgment; the actual amount of tax benefit related to uncertain tax positions may differ from these estimates. See
Note 8
of the “Notes to Consolidated Financial Statements” for additional information regarding unrecognized tax benefits.
We believe that our estimates for the valuation allowances against deferred tax assets and unrecognized tax benefits are appropriate based on current facts and circumstances. The amount we ultimately pay when matters are resolved may differ from the amounts accrued. Changes in our current estimates due to unanticipated market conditions, tax law changes or other factors could have a material effect on our ability to utilize deferred tax assets. For a further discussion on Provision for Income Taxes, see
Note 8
of the “Notes to the Consolidated Financial Statements.”
The calculation of our tax liabilities includes estimates for uncertainties in the application of broad and complex changes to the U.S. tax code as per the Tax Cuts and Jobs Act ("the Tax Act") as enacted by the United States government on December 22, 2017. Although we are still completing our accounting for the tax effects of the Tax Act, we have made reasonable estimates and recorded provisional amounts based on management judgment and our current understanding of the Tax Act which is subject to further interpretation by the Internal Revenue Service ("IRS"). See
Note 8
of the “Notes to Consolidated Financial Statements” for additional information regarding the Tax Act.
Share-Based Compensation
Employee share-based compensation is recognized in the consolidated statements of earnings based on the grant date fair value of the awards. The grant date market price of our common shares determines the fair value of restricted share units and performance share units. The fair value of stock options is determined using a lattice valuation model. We believe the lattice model provides reasonable estimates because it takes into account employee exercise patterns based on changes in our stock price and other variables and it provides for a range of input assumptions.
We analyze historical data to estimate option exercise behaviors and post-vesting forfeitures. The expected life of the options granted, which represents the length of time in years that the options granted are expected to be outstanding, is calculated from the option valuation model. Expected volatilities are based on implied volatility
from traded options on our common shares and historical volatility over a period of time commensurate with the contractual term of the option grant (up to ten years).
Forfeiture estimates for all types of awards are adjusted as circumstances change and ultimately reflect actual forfeitures when an award vests. Actual forfeitures in future reporting periods could be higher or lower than our current estimates.
Compensation expense for nonvested performance share units depends on our periodic assessment of the probability of the targets being achieved and our estimate, which may vary over time, of the number of shares that ultimately will be issued. See
Note 17
of the "Notes to Consolidated Financial Statements" for additional information regarding share-based compensation.
|
Cardinal Health
|
Fiscal 2018 Form 10-K
|
18
|
|
|
Explanation and Reconciliation of Non-GAAP Financial Measures
|
||
Explanation and Reconciliation of Non-GAAP Financial Measures
This report, including the "Fiscal
2018
Overview" section within MD&A, contains financial measures that are not calculated in accordance with GAAP. In addition to analyzing our business based on financial information prepared in accordance with GAAP, we use these non-GAAP financial measures internally to evaluate our performance, evaluate the balance sheet, engage in financial and operational planning, and determine incentive compensation because we believe that these measures provide additional perspective on and, in some circumstances are more closely correlated to, the performance of our underlying, ongoing business. We provide these non-GAAP financial measures to investors as supplemental metrics to assist readers in assessing the effects of items and events on our financial and operating results on a year-over-year basis and in comparing our performance to that of our competitors. However, the non-GAAP financial measures that we use may be calculated differently from, and therefore may not be comparable to, similarly titled measures used by other companies. The non-GAAP financial measures disclosed by us should not be considered a substitute for, or superior to, financial measures calculated in accordance with GAAP, and the financial results calculated in accordance with GAAP and reconciliations to those financial statements set forth below should be carefully evaluated.
Exclusions from Non-GAAP Financial Measures
Management believes it is useful to exclude the following items from the non-GAAP measures presented in this report for its own and for investors’ assessment of the business for the reasons identified below:
|
•
|
LIFO charges and credits
are excluded because the factors that drive last-in first-out ("LIFO") inventory charges or credits, such as pharmaceutical manufacturer price appreciation or deflation and year-end inventory levels (which can be meaningfully influenced by customer buying behavior immediately preceding our fiscal year-end), are largely out of our control and cannot be accurately predicted. The exclusion of LIFO charges and credits from non-GAAP metrics facilitates comparison of our current financial results to our historical financial results and to our peer group companies’ financial results.
|
|
•
|
Restructuring and employee severance costs
are excluded because they are not part of the ongoing operations of our underlying business.
|
|
•
|
Amortization and other acquisition-related costs
, which include transaction costs, integration costs, and changes in the fair value of contingent consideration obligations, are excluded primarily for consistency with the presentation of the financial results of our peer group companies. Additionally, costs for amortization of acquisition-related intangible assets are non-cash amounts, which are variable in amount and frequency and are significantly impacted by the timing and size of acquisitions, so their exclusion facilitates comparison of historical, current and forecasted financial results. We also exclude other acquisition-related costs, which are directly related to an acquisition but do not meet the criteria to be recognized on the acquired entity’s initial balance sheet as part of the purchase price allocation. These costs are also significantly impacted by the timing, complexity and size of acquisitions.
|
|
•
|
Impairments and gain or loss on disposal of assets
are excluded because they do not occur in or reflect the ordinary course of our ongoing business operations and are inherently unpredictable in timing and amount, and in the case of impairments, are non-cash amounts, so their exclusion facilitates comparison of historical, current and forecasted financial results.
|
|
•
|
Litigation recoveries or charges, net
are excluded because they often relate to events that may have occurred in prior or multiple periods, do not occur in or reflect the ordinary course of our business and are inherently unpredictable in timing and amount.
|
|
•
|
Loss on extinguishment of debt
is excluded because it does not typically occur in the normal course of business and may obscure analysis of trends and financial performance. Additionally, the amount and frequency of this type of charge is not consistent and is significantly impacted by the timing and size of debt extinguishment transactions.
|
|
•
|
Transitional tax benefit, net
related to the Tax Cuts and Jobs Act is excluded because it results from the one-time impact during the one-year measurement period of a very significant change in the U.S. federal corporate tax rate and, due to the significant size of the benefit, obscures analysis of trends and financial performance. The transitional tax benefit includes the initial estimate and measurement period adjustments for the re-measurement of deferred tax assets and liabilities due to the reduction of the U.S. federal corporate income tax rate and the repatriation tax on undistributed foreign earnings, both of which are subject to adjustment during an up to 12 month measurement period.
|
The tax effect for each of the items listed above, other than the transitional tax benefit item, is determined using the tax rate and other tax attributes applicable to the item and the jurisdiction(s) in which the item is recorded. The gross, tax and net impact of each item are presented with our GAAP to non-GAAP reconciliations.
|
19
|
Cardinal Health
|
Fiscal 2018 Form 10-K
|
|
|
Explanation and Reconciliation of Non-GAAP Financial Measures
|
||
Definitions
Growth rate calculation
: growth rates in this report are determined by dividing the difference between current period results and prior period results by prior period results.
Non-GAAP operating earnings
: operating earnings excluding (1) LIFO charges/(credits), (2) restructuring and employee severance, (3) amortization and other acquisition-related costs, (4) impairments and (gain)/loss on disposal of assets and (5) litigation (recoveries)/charges, net.
Non-GAAP earnings before income taxes
: earnings before income taxes excluding (1) LIFO charges/(credits), (2) restructuring and employee severance, (3) amortization and other acquisition-related costs, (4) impairments and (gain)/loss on disposal of assets, (5) litigation (recoveries)/charges, net and (6) loss on extinguishment of debt.
Non-GAAP Net Earnings attributable to Cardinal Health, Inc.:
net earnings attributable to Cardinal Health, Inc. excluding (1) LIFO charges/(credits), (2) restructuring and employee severance, (3) amortization and other acquisition-related costs, (4) impairments and (gain)/loss on disposal of assets, (5) litigation (recoveries)/charges, net, (6) loss on extinguishment of debt, each net of tax, and (7) transitional tax benefit related to the Tax Cuts and Jobs Act.
Non-GAAP effective tax rate
: (provision for income taxes adjusted for (1) LIFO charges/(credits), (2) restructuring and employee severance, (3) amortization and other acquisition-related costs, (4) impairments and (gain)/loss on disposal of assets, (5) litigation (recoveries)/charges, net, (6) loss on extinguishment of debt, and (7) transitional tax benefit, (net) divided by (earnings before income taxes adjusted for the first six items).
Non-GAAP diluted EPS attributable to Cardinal Health, Inc.
: non-GAAP net earnings attributable to Cardinal Health, Inc. divided by diluted weighted-average shares outstanding.
|
Cardinal Health
|
Fiscal 2018 Form 10-K
|
20
|
|
|
Explanation and Reconciliation of Non-GAAP Financial Measures
|
||
GAAP to Non-GAAP Reconciliations
|
(in millions, except per common share amounts)
|
Operating Earnings
|
Operating Earnings Growth Rate
|
Earnings/(Loss) Before Income Taxes
|
Provision for Income Taxes
|
Net Earnings
1,2
|
Net Earnings/(Loss)
1,2
Growth Rate
|
Diluted EPS
1,2
|
Diluted EPS
1,2
Growth Rate
|
|||||||||||||
|
Fiscal Year 2018
|
|||||||||||||||||||||
|
GAAP
|
$
|
126
|
|
(94
|
)%
|
$
|
(228
|
)
|
$
|
(487
|
)
|
$
|
259
|
|
(80
|
)%
|
$
|
0.81
|
|
(80
|
)%
|
|
Restructuring and employee severance
|
176
|
|
176
|
|
25
|
|
151
|
|
0.48
|
|
|||||||||||
|
Amortization and other acquisition-related costs
|
707
|
|
707
|
|
176
|
|
531
|
|
1.69
|
|
|||||||||||
|
Impairments and loss on disposal of assets
4
|
1,417
|
|
1,417
|
|
(44
|
)
|
1,461
|
|
4.64
|
|
|||||||||||
|
Litigation (recoveries)/charges, net
|
159
|
|
159
|
|
48
|
|
111
|
|
0.35
|
|
|||||||||||
|
Loss on extinguishment of debt
|
—
|
|
2
|
|
1
|
|
1
|
|
—
|
|
|||||||||||
|
Transitional tax benefit, net
3
|
—
|
|
—
|
|
936
|
|
(936
|
)
|
(2.97
|
)
|
|||||||||||
|
Non-GAAP
|
$
|
2,585
|
|
(7
|
)%
|
$
|
2,233
|
|
$
|
655
|
|
$
|
1,578
|
|
(9
|
)%
|
$
|
5.00
|
|
(7
|
)%
|
|
Fiscal Year 2017
|
|||||||||||||||||||||
|
GAAP
|
$
|
2,120
|
|
(14
|
)%
|
$
|
1,924
|
|
$
|
630
|
|
$
|
1,288
|
|
(10
|
)%
|
$
|
4.03
|
|
(7
|
)%
|
|
Restructuring and employee severance
|
56
|
|
56
|
|
20
|
|
36
|
|
0.11
|
|
|||||||||||
|
Amortization and other acquisition-related costs
|
527
|
|
527
|
|
165
|
|
362
|
|
1.13
|
|
|||||||||||
|
Impairments and loss on disposal of assets
|
18
|
|
18
|
|
6
|
|
12
|
|
0.04
|
|
|||||||||||
|
Litigation (recoveries)/charges, net
|
48
|
|
48
|
|
19
|
|
29
|
|
0.09
|
|
|||||||||||
|
Non-GAAP
|
$
|
2,769
|
|
(4
|
)%
|
$
|
2,572
|
|
$
|
839
|
|
$
|
1,727
|
|
—
|
%
|
$
|
5.40
|
|
3
|
%
|
|
Fiscal Year 2016
|
|||||||||||||||||||||
|
GAAP
|
$
|
2,459
|
|
14
|
%
|
$
|
2,276
|
|
$
|
845
|
|
$
|
1,427
|
|
18
|
%
|
$
|
4.32
|
|
20
|
%
|
|
Restructuring and employee severance
|
25
|
|
25
|
|
9
|
|
16
|
|
0.05
|
|
|||||||||||
|
Amortization and other acquisition-related costs
|
459
|
|
459
|
|
143
|
|
316
|
|
0.96
|
|
|||||||||||
|
Impairments and (gain)/loss on disposal of assets
|
21
|
|
21
|
|
6
|
|
15
|
|
0.04
|
|
|||||||||||
|
Litigation (recoveries)/charges, net
|
(69
|
)
|
(69
|
)
|
(27
|
)
|
(42
|
)
|
(0.13
|
)
|
|||||||||||
|
Non-GAAP
|
$
|
2,895
|
|
17
|
%
|
$
|
2,711
|
|
$
|
976
|
|
$
|
1,732
|
|
18
|
%
|
$
|
5.24
|
|
20
|
%
|
|
Fiscal Year 2015
|
|||||||||||||||||||||
|
GAAP
|
$
|
2,161
|
|
15
|
%
|
$
|
1,967
|
|
$
|
755
|
|
$
|
1,212
|
|
4
|
%
|
$
|
3.61
|
|
7
|
%
|
|
Restructuring and employee severance
|
44
|
|
44
|
|
15
|
|
29
|
|
0.09
|
|
|||||||||||
|
Amortization and other acquisition-related costs
|
281
|
|
281
|
|
100
|
|
181
|
|
0.54
|
|
|||||||||||
|
Impairments and (gain)/loss on disposal of assets
|
(19
|
)
|
(19
|
)
|
(10
|
)
|
(9
|
)
|
(0.03
|
)
|
|||||||||||
|
Litigation (recoveries)/charges, net
|
5
|
|
5
|
|
(14
|
)
|
19
|
|
0.06
|
|
|||||||||||
|
Loss on extinguishment of debt
|
—
|
|
60
|
|
23
|
|
37
|
|
0.11
|
|
|||||||||||
|
Non-GAAP
|
$
|
2,472
|
|
16
|
%
|
$
|
2,339
|
|
$
|
870
|
|
$
|
1,469
|
|
11
|
%
|
$
|
4.38
|
|
14
|
%
|
|
Fiscal Year 2014
|
|||||||||||||||||||||
|
GAAP
|
$
|
1,885
|
|
89
|
%
|
$
|
1,798
|
|
$
|
635
|
|
$
|
1,163
|
|
247
|
%
|
$
|
3.37
|
|
247
|
%
|
|
Restructuring and employee severance
|
31
|
|
31
|
|
11
|
|
20
|
|
0.06
|
|
|||||||||||
|
Amortization and other acquisition-related costs
|
223
|
|
223
|
|
79
|
|
144
|
|
0.42
|
|
|||||||||||
|
Impairments and (gain)/loss on disposal of assets
|
15
|
|
15
|
|
5
|
|
10
|
|
0.03
|
|
|||||||||||
|
Litigation (recoveries)/charges, net
|
(21
|
)
|
(21
|
)
|
(8
|
)
|
(13
|
)
|
(0.04
|
)
|
|||||||||||
|
Non-GAAP
|
$
|
2,133
|
|
4
|
%
|
$
|
2,047
|
|
$
|
722
|
|
$
|
1,324
|
|
3
|
%
|
$
|
3.84
|
|
3
|
%
|
|
1
|
from continuing operations
|
|
2
|
attributable to Cardinal Health, Inc.
|
|
3
|
Reflects the estimated net transitional benefit from the re-measurement of our deferred tax assets and liabilities partially offset by the repatriation tax on cash and earnings of foreign subsidiaries. We have not yet completed our analysis of the impact of the Tax Act and, as such, these amounts are provisional estimates and we may record additional provisional amounts or adjustments to the provisional amounts in future periods.
|
|
4
|
Fiscal year 2018 includes a goodwill impairment charge of $1.4 billion related to our Medical segment. There was no tax benefit related to this goodwill impairment charge.
|
The sum of the components may not equal the total due to rounding.
We apply varying tax rates depending on the item's nature and tax jurisdiction where it is incurred.
|
21
|
Cardinal Health
|
Fiscal 2018 Form 10-K
|
|
|
Selected Financial Data
|
||
Selected Financial Data
The consolidated financial data below includes all business combinations as of the date of acquisition that occurred during these periods. The following selected consolidated financial data should be read in conjunction with the consolidated financial statements and related notes and MD&A.
|
(in millions, except per common share amounts)
|
2018
1,2
|
2017
|
2016
|
2015
|
2014
|
||||||||||||||
|
Earnings Data:
|
|||||||||||||||||||
|
Revenue
|
$
|
136,809
|
|
$
|
129,976
|
|
$
|
121,546
|
|
$
|
102,531
|
|
$
|
91,084
|
|
||||
|
Operating earnings
|
126
|
|
2,120
|
|
2,459
|
|
2,161
|
|
1,885
|
|
|||||||||
|
Earnings from continuing operations
|
259
|
|
1,294
|
|
1,431
|
|
1,212
|
|
1,163
|
|
|||||||||
|
Earnings/(loss) from discontinued operations, net of tax
|
—
|
|
—
|
|
—
|
|
3
|
|
3
|
|
|||||||||
|
Net earnings
|
259
|
|
1,294
|
|
1,431
|
|
1,215
|
|
1,166
|
|
|||||||||
|
Less: Net earnings attributable to noncontrolling interests
|
(3
|
)
|
(6
|
)
|
(4
|
)
|
—
|
|
—
|
|
|||||||||
|
Net earnings attributable to Cardinal Health, Inc.
|
$
|
256
|
|
$
|
1,288
|
|
$
|
1,427
|
|
$
|
1,215
|
|
$
|
1,166
|
|
||||
|
Basic earnings per common share attributable to Cardinal Health, Inc.:
|
|||||||||||||||||||
|
Continuing operations
|
$
|
0.82
|
|
$
|
4.06
|
|
$
|
4.36
|
|
$
|
3.65
|
|
$
|
3.41
|
|
||||
|
Discontinued operations
|
—
|
|
—
|
|
—
|
|
0.01
|
|
0.01
|
|
|||||||||
|
Net basic earnings per common share attributable to Cardinal Health, Inc.
|
$
|
0.82
|
|
$
|
4.06
|
|
$
|
4.36
|
|
$
|
3.66
|
|
$
|
3.42
|
|
||||
|
Diluted earnings per common share attributable to Cardinal Health, Inc.:
|
|||||||||||||||||||
|
Continuing operations
|
$
|
0.81
|
|
$
|
4.03
|
|
$
|
4.32
|
|
$
|
3.61
|
|
$
|
3.37
|
|
||||
|
Discontinued operations
|
—
|
|
—
|
|
—
|
|
0.01
|
|
0.01
|
|
|||||||||
|
Net diluted earnings per common share attributable to Cardinal Health, Inc.
|
$
|
0.81
|
|
$
|
4.03
|
|
$
|
4.32
|
|
$
|
3.62
|
|
$
|
3.38
|
|
||||
|
Cash dividends declared per common share
|
$
|
1.8635
|
|
$
|
1.8091
|
|
$
|
1.6099
|
|
$
|
1.4145
|
|
$
|
1.2500
|
|
||||
|
Balance Sheet Data:
|
|||||||||||||||||||
|
Total assets
|
$
|
39,951
|
|
$
|
40,112
|
|
$
|
34,122
|
|
$
|
30,142
|
|
$
|
26,033
|
|
||||
|
Long-term obligations, less current portion
|
8,012
|
|
9,068
|
|
4,952
|
|
5,211
|
|
3,171
|
|
|||||||||
|
Total Cardinal Health, Inc. shareholders' equity
|
6,059
|
|
6,808
|
|
6,554
|
|
6,256
|
|
6,401
|
|
|||||||||
1
During the fourth quarter of fiscal 2018, we recognized a non-cash goodwill impairment charge of $1.4 billion related to our Medical segment. There was no tax benefit related to this goodwill impairment charge.
2
During fiscal 2018, the United States enacted the Tax Cuts and Jobs Act. See
Note 8
for more information.
|
Cardinal Health
|
Fiscal 2018 Form 10-K
|
22
|
|
|
Disclosures about Market Risk
|
|
Quantitative and Qualitative Disclosures About Market Risk
We are exposed to cash flow and earnings fluctuations as a result of certain market risks. These market risks primarily relate to foreign exchange, interest rate, and commodity price-related changes. We maintain a hedging program to manage volatility related to some of these market exposures which employs operational, economic, and derivative financial instruments in order to mitigate risk. See
Note 1
and
Note 12
of the “Notes to Consolidated Financial Statements” for further discussion regarding our use of derivative instruments.
Foreign Exchange Rate Sensitivity
By the nature of our global operations, we are exposed to cash flow and earnings fluctuations resulting from foreign exchange rate variation. These exposures are transactional and translational in nature. The following foreign currencies represent the principal drivers of our foreign exchange exposure: Canadian dollar, Euro, Thai baht, Mexican peso and Chinese renminbi.
We apply a Value-At-Risk ("VAR") methodology to our transactional and translational exposures. The VAR model is a risk estimation tool and is not intended to represent actual losses in fair value that could be incurred.
Transactional Exposure
Transactional exposure arises from the purchase and sale of goods and services in currencies other than our functional currency or the functional currency of our subsidiaries. At the end of each fiscal year we perform sensitivity analyses on our forecasted transactional exposure for the upcoming fiscal year. These analyses include the estimated impact of our hedging program, which is designed to
mitigate transactional exposure. Applying a VAR methodology to our transactional exposure and including the impact of our hedging program, the potential maximum loss in earnings for the upcoming fiscal year is estimated to be $26 million, which is based on a one-year horizon and a 95 percent confidence level. Under the same methodology, at June 30, 2017, our potential maximum loss in earnings for the upcoming fiscal year was estimated to be $19 million.
Translational Exposure
We have exposure related to the translation of financial statements of our foreign operations into U.S. dollars, our functional currency. Applying a VAR methodology to our translational exposure, the potential maximum loss in earnings for the upcoming fiscal year is estimated to be $9 million, which is based on a one-year horizon and a 95 percent confidence level. Under the same methodology, at June 30, 2017, our potential maximum loss in earnings for the upcoming fiscal year was estimated to be $14 million.
Interest Rate Sensitivity
We are exposed to changes in interest rates primarily as a result of our borrowing and investing activities to maintain liquidity and fund operations. The nature and amount of our long-term and short-term debt can be expected to fluctuate as a result of business requirements, market conditions and other factors. Our policy is to manage exposures to interest rates using a mix of fixed and floating rate debt as deemed appropriate by management. We utilize interest rate swap instruments to mitigate our exposure to interest rate movements.
As part of our risk management program, we perform an annual sensitivity analysis on our forecasted exposure to interest rates for the upcoming fiscal year. This analysis assumes a hypothetical 50 basis point change in interest rates. At
June 30, 2018
and
2017
, the potential increase or decrease in annual interest expense under this
analysis as a result of this hypothetical change was $15 million and $16 million, respectively.
We are also exposed to market risk from changes in interest rates related to our cash and cash equivalents, which includes marketable securities that are classified as available-for-sale and are carried at fair value in the consolidated balance sheets. The fair value of our cash and cash equivalents is subject to change primarily as a result of changes in market interest rates and investment risk related to the issuers' credit worthiness. At
June 30, 2018
, a hypothetical increase or decrease of 50 basis points in interest rates would result in no change in the estimated fair value. At
June 30, 2017
, a hypothetical increase or decrease of 50 basis points in interest rates would result in a potential increase or decrease of $1 million in the estimated fair value.
|
23
|
Cardinal Health
|
Fiscal 2018 Form 10-K
|
|
|
Disclosures about Market Risk
|
|
Commodity Price Sensitivity
We are directly exposed to market price changes for certain commodities, including oil-based resins, nitrile, cotton, diesel fuel and latex. We typically purchase raw materials at either market prices or prices tied to a commodity index and some finished goods at prices based in part on a commodity price index.
As part of our risk management program, we perform sensitivity analysis on our forecasted direct commodity exposure for the upcoming fiscal year. Our forecasted direct commodity exposure at
June 30, 2018
increased approximately $190 million from June 30, 2017 primarily due to the acquisition of the Patient Recovery Business. At
June 30, 2018
and
2017
, we had hedged a portion of these direct commodity exposures (see
Note 12
of the “Notes to Consolidated Financial Statements” for further discussion).
Our forecasted direct commodity exposures for the upcoming fiscal years were $424 million and $234 million at June 30, 2018 and 2017, respectively. The potential gain/loss given a hypothetical 10 percent fluctuation in commodity prices, assuming pricing collectively shifts in the same direction and we are unable to change customer pricing in response to those shifts, for the upcoming fiscal year were $42 million and $23 million at June 30, 2018 and 2017, respectively. The hypothetical offsetting impact of hedges in both periods was minimal. In prior years, we forecasted both direct and indirect exposure to commodity pricing changes. Beginning in fiscal 2018, we began only estimating direct exposure because it is the primary way that we view and manage commodity risk. Under the prior methodology, our exposure in fiscal 2017 for the next fiscal year was estimated to be $411 million and the potential gain/loss was $41 million.
|
Cardinal Health
|
Fiscal 2018 Form 10-K
|
24
|
|
|
Business
|
||
Business
General
Cardinal Health, Inc. is a global integrated healthcare services and products company providing customized solutions for hospitals, healthcare systems, pharmacies, ambulatory surgery centers, clinical laboratories and physician offices. We provide medical products and pharmaceuticals and cost-effective solutions that enhance supply chain efficiency from hospital to home.
Pharmaceutical Segment
In the United States, our Pharmaceutical segment:
|
•
|
distributes branded and generic pharmaceutical and over-the-counter healthcare and consumer products through its Pharmaceutical Distribution division to retailers (including chain and independent drug stores and pharmacy departments of supermarkets and mass merchandisers), hospitals and other healthcare providers. This division:
|
|
•
|
maintains prime vendor relationships that streamline the purchasing process resulting in greater efficiency and lower costs for our retail, hospital and other healthcare provider customers;
|
|
•
|
provides services to pharmaceutical manufacturers, including distribution, inventory management, data reporting, new product launch support and chargeback administration;
|
|
•
|
provides pharmacy management services to hospitals as well as medication therapy management and patient outcomes services to hospitals, other healthcare providers and payers, and operates pharmacies in community health centers; and
|
|
•
|
repackages generic pharmaceuticals and over-the-counter healthcare products;
|
|
•
|
through its Specialty Solutions division, distributes specialty pharmaceutical products to hospitals and other healthcare providers and provides consulting, patient support and other services for specialty pharmaceutical products to pharmaceutical manufacturers and healthcare providers; and
|
|
•
|
operates nuclear pharmacies and manufacturing facilities through its Nuclear Pharmacy Services division, which manufactures, prepares and delivers radiopharmaceuticals for use in nuclear imaging and other procedures in hospitals and physician offices. This division also contract manufactures a radiopharmaceutical treatment (Xofigo) and holds the North American rights to manufacture and distribute Lymphoseek, a radiopharmaceutical diagnostic imaging agent.
|
See
Note 16
of the “Notes to Consolidated Financial Statements” for Pharmaceutical segment revenue, profit and assets for fiscal
2018
,
2017
and
2016
.
Pharmaceutical Distribution
Our Pharmaceutical Distribution division’s gross margin includes margin from our generic pharmaceutical program, from distribution services agreements with branded pharmaceutical manufacturers and from over-the-counter healthcare and consumer products. It also includes manufacturer cash discounts.
Margin from our generic pharmaceutical program includes price discounts and rebates from manufacturers and may in some instances include price appreciation. Our earnings on generic pharmaceuticals are generally highest during the period immediately following the initial launch of a product, because generic pharmaceutical selling prices are generally highest during that period and tend to decline over time.
Margin from distribution services agreements with branded pharmaceutical manufacturers is derived primarily from compensation we receive for providing a range of distribution and related services to manufacturers. Our compensation typically is a percentage of the wholesale acquisition cost that is set by manufacturers. In addition, under a limited number of agreements, branded pharmaceutical price appreciation, which is determined by the manufacturers, also serves as part of our compensation.
Sourcing Venture With CVS Health Corporation
In July 2014, we established Red Oak Sourcing, a U.S.-based generic pharmaceutical sourcing venture with CVS with an initial term of 10 years. Red Oak Sourcing negotiates generic pharmaceutical supply contracts on behalf of both companies.
Specialty Pharmaceutical Products and Services
We refer to products and services offered by our Specialty Solutions division as “specialty pharmaceutical products and services.” The Specialty Solutions division distributes oncology, rheumatology, urology, nephrology and other pharmaceutical products ("specialty pharmaceutical products") and human-derived plasma products to hospitals, dialysis clinics, physician offices and other healthcare providers; provides consulting, patient support, logistics, group purchasing and other services to pharmaceutical manufacturers and healthcare providers primarily supporting the development, marketing and distribution of specialty pharmaceutical products; and provides specialty pharmacy services. Our use of the terminology "specialty pharmaceutical products and services" may not be comparable to the terminology used by other industry participants.
|
25
|
Cardinal Health
|
Fiscal 2018 Form 10-K
|
|
|
Business
|
||
Medical Segment
Our Medical segment manufactures and sources Cardinal Health branded medical, surgical and laboratory products, including cardiovascular and endovascular products; wound care products; single-use surgical drapes, gowns and apparel; exam and surgical gloves; and fluid suction and collection systems. We further expanded this segment's portfolio of Cardinal Health Brand products through the acquisition of the
Patient Recovery Business
from Medtronic in July 2017, which includes incontinence, wound care, enteral feeding, urology, operating room supply, electrode and needle, syringe and sharps disposal product lines. Our Cardinal Health Brand products are sold directly or through third-party distributors in the United States, Canada, Europe, Asia and other markets.
The Medical segment also distributes a broad range of national brand products and provides supply chain services and solutions to hospitals, ambulatory surgery centers, clinical laboratories and other healthcare providers in the United States and Canada.
This segment also distributes medical products to patients' homes in the United States through our Cardinal Health at Home division.
This segment also assembles and sells sterile and non-sterile procedure kits. It also provides supply chain services, including spend management, distribution management and inventory management services, to healthcare providers.
naviHealth Partnership
In August 2018, we entered into a partnership with CD&R through which we own 44% of the ownership interests in the naviHealth business. naviHealth partners with health plans, hospital systems, physician groups and other healthcare providers to manage post-acute care through value-based programs.
See
Note 16
of the “Notes to Consolidated Financial Statements” for Medical segment revenue, profit and assets for fiscal
2018
,
2017
and
2016
.
Acquisitions and Divestitures
Acquisitions
We have acquired a number of businesses over the years that have enhanced our core strategic areas of Cardinal Health Brand medical products, generic pharmaceutical distribution and services, specialty pharmaceutical products and services, international and post-acute care. We expect to continue to pursue additional acquisitions in the future.
During the last five fiscal years, we completed the following three large acquisitions:
|
Date
|
Company
|
Location
|
Lines
of Business
|
Acquisition
Price
(in billions)
|
|
|
07/17
|
Patient Recovery Business of Medtronic, plc
|
Mansfield, MA
|
Patient Care, Deep Vein Thrombosis and Nutritional Insufficiency
|
$6.1
|
|
|
10/15
|
Cordis business of Johnson & Johnson
|
Fremont, CA
|
Cardiovascular and endovascular products
|
$1.9
|
|
|
07/15
|
The Harvard Drug Group
|
Livonia, MI
|
Pharmaceutical product distribution
|
$1.1
|
|
We have also completed several smaller acquisitions during the last five fiscal years, including: in fiscal 2017, the acquisition of the North
American rights to Lymphoseek, a radiopharmaceutical diagnostic imaging agent, from Navidea Biopharmaceuticals, Inc.; in fiscal 2015, the acquisitions of Tradex International, Inc., a supplier of disposable gloves, and Metro Medical Supply, Inc., a distributor of specialty pharmaceuticals and medical and surgical products; and in fiscal 2014, the acquisition of Access Closure, Inc., a manufacturer and distributor of extravascular closure devices.
Divestitures
Over the past year, we have also completed several divestitures, including, in February 2018, selling our pharmaceutical and medical products distribution business in China to Shanghai Pharmaceuticals Holding Co., Ltd. for proceeds of $861 million (after adjusting for third party indebtedness and preliminary transaction adjustments).
Additionally, in August 2018, we completed the sale of our ownership interest in naviHealth, Inc. to investor entities controlled by CD&R for proceeds of $736 million (after adjusting for certain fees and expenses) and a 44% equity interest in a partnership that owns the naviHealth business.
We had acquired our ownership interest in naviHealth through a series of transactions, beginning in fiscal 2016, when we acquired a 71% ownership interest. As of the end of fiscal 2018, we owned 98% of the interests in naviHealth.
|
Cardinal Health
|
Fiscal 2018 Form 10-K
|
26
|
|
|
Business
|
||
Customers
Our largest customers, CVS and OptumRx accounted for
25 percent
and 11 percent of our fiscal
2018
revenue, respectively. In the aggregate, our five largest customers, including CVS and OptumRx, accounted for 47 percent of our fiscal
2018
revenue. Our pharmaceutical distribution agreements with CVS extend through June 2019.
We have agreements with group purchasing organizations (“GPOs”) that act as agents to negotiate vendor contracts on behalf of their
members. Our two largest GPO relationships in terms of member revenue are with Vizient, Inc. and Premier, Inc. Sales to members of these two GPOs, under numerous contracts across all of our businesses, collectively accounted for
22 percent
of our revenue in fiscal
2018
.
Suppliers
We rely on many different suppliers. Products obtained from our five largest suppliers accounted for an aggregate of
29 percent
of our revenue during fiscal
2018
, but no single supplier’s products accounted for more than
8 percent
of revenue.
Competition
We operate in a highly competitive environment in the distribution of pharmaceuticals and consumer healthcare products. We also operate in a highly competitive environment in the development, manufacturing and distribution of medical devices and surgical products. We compete on many levels, including price, service offerings, support services, breadth of product lines and product quality and efficacy.
In the Pharmaceutical segment, we compete with wholesale distributors with national reach, including McKesson Corporation and AmerisourceBergen Corporation, regional wholesale distributors, self-warehousing chains, specialty distributors, third-party logistics companies, companies that provide specialty pharmaceutical
services and nuclear pharmacies, among others. In addition, the Pharmaceutical segment has experienced competition from a number of organizations offering generic pharmaceuticals, including telemarketers. We also compete with manufacturers that sell their products directly.
In the Medical segment, we compete with many diversified healthcare companies and national medical product distributors, such as Medline Industries, Inc., Owens & Minor, Inc. and Becton, Dickinson and Company, as well as regional medical product distributors and companies that are focused on specific product categories. We also compete with companies that distribute medical products to patients' homes and third-party logistics companies.
Employees
At
June 30, 2018
, we had approximately 32,300 employees in the United States and approximately 17,900 employees outside of the United States.
Intellectual Property
We rely on a combination of trade secret, patent, copyright and trademark laws, nondisclosure and other contractual provisions, and technical measures to protect our products, services and intangible assets. We hold patents, and continue to pursue patent protection throughout the world, relating to the manufacture, operation and use of various medical and surgical products, to certain distribution and logistics systems, to the production and distribution of our nuclear pharmacy products and to other service offerings. We also operate under licenses for certain proprietary technologies, and in certain instances we license our technologies to third parties.
We believe that we have taken all necessary steps to protect our proprietary rights, but no assurance can be given that we will be able to successfully enforce or protect our rights in the event that they are infringed upon by a third party. While all of these proprietary rights are important to our operations, we do not consider any particular patent, trademark, license, franchise or concession to be material to our overall business.
|
27
|
Cardinal Health
|
Fiscal 2018 Form 10-K
|
|
|
Business
|
||
Regulatory Matters
Our business is highly regulated in the United States, at both the federal and state level, and in foreign countries. Depending upon the specific business, we may be subject to regulation by government entities including:
|
•
|
the U.S. Drug Enforcement Administration (the “DEA”);
|
|
•
|
certain agencies within the U.S. Department of Health and Human Services, including the U.S. Food and Drug Administration (the “FDA”), the Centers for Medicare and Medicaid Services, the Office of Inspector General and the Office for Civil Rights;
|
|
•
|
state health departments, insurance departments, Medicaid departments or other comparable state agencies;
|
|
•
|
state boards of pharmacy and other controlled substance authorities;
|
|
•
|
the U.S. Nuclear Regulatory Commission (the “NRC”);
|
|
•
|
the U.S. Federal Trade Commission (the "FTC");
|
|
•
|
U.S. Customs and Border Protection; and
|
|
•
|
agencies comparable to those listed above in markets outside the United States.
|
These regulatory agencies have a variety of civil, administrative and criminal sanctions at their disposal for failure to comply with applicable legal or regulatory requirements. They can suspend our ability to manufacture and distribute products, initiate product recalls, seize products or impose criminal, civil and administrative sanctions.
Distribution
State Boards of Pharmacy, FDA, DEA and various other state authorities regulate the marketing, purchase, storage and distribution of pharmaceutical and medical products under various federal and state statutes including the federal Prescription Drug Marketing Act of 1987, Drug Quality and Security Act of 2013 (the “DQSA”), and Controlled Substances Act (the "CSA"). The CSA governs the sale, packaging, storage and distribution of controlled substances. Wholesale distributors of controlled substances must hold valid DEA registrations and state-level licenses, meet various security and operating standards, and comply with the CSA. They must also comply with state requirements relating to controlled substances that differ from state to state.
Manufacturing and Marketing
We sell our manufactured products in the United States, Canada, Europe, Asia and other markets. The FDA and other governmental agencies in the United States, as well as foreign governmental agencies, administer requirements that cover the design, testing, safety, effectiveness, manufacturing (including good manufacturing practices), quality systems, labeling, promotion and advertising (including restrictions on promoting or advertising a product other than for the product's cleared or approved uses), distribution, importation and post-market surveillance for most of our manufactured products. In addition, we need specific approval or clearance from, and registrations with, regulatory authorities before
we can market and sell some products in the United States and certain other countries, including countries in the European Union ("EU").
In the United States, authorization to commercially market a medical device is generally received in one of two ways. The first, known as pre-market notification or the 510(k) process, requires us to demonstrate that a medical device is substantially equivalent to a legally marketed medical device. The second more rigorous process, known as pre-market approval (“PMA”), requires us to independently demonstrate that a medical device is safe and effective. Many of our Medical segment products are cleared through the 510(k) process and certain Cordis products must be approved through the PMA process.
In the EU, we are required to comply with applicable Medical Device Directives ("MDDs") and obtain CE Mark Certification in order to market medical devices. The EU regulatory bodies finalized a new Medical Device Regulation ("MDR") in 2017, which replaces the existing MDDs after a three-year transition period. Among other things, the MDR clarifies that private label distributors are deemed to be the manufacturer, which will increase our regulatory obligations in the EU with respect to private label products.
It can be costly and time-consuming to obtain regulatory approvals, clearances and registrations of medical devices, and they might not be granted on a timely basis, if at all. Even after we obtain approval or clearance to market a product or obtain product registrations, the product and our manufacturing processes are subject to continued regulatory oversight, including periodic inspection of manufacturing facilities by FDA and other regulatory authorities both in the United States and internationally.
From time to time, we may determine that products we manufacture or market do not meet our specifications, regulatory requirements or published standards. When we or a regulatory agency identify a quality or regulatory issue, we investigate and take appropriate corrective action, which may include recalling the product, correcting the product at the customer location, revising product labeling and notifying customers.
Health and Personal Information Practices
We collect, handle and maintain patient-identifiable health information. The U.S. Health Insurance Portability and Accountability Act of 1996 ("HIPAA"), as augmented by the Health Information Technology for Economic and Clinical Health Act, and state laws regulate the use and disclosure of patient-identifiable health information, including requiring specified privacy and security measures. We also collect, handle and maintain other sensitive personal and financial information that is subject to U.S. federal and state laws protecting such information.
The processing and disclosure of personal information is also highly regulated in many other countries in which we operate. In Europe, for example, we are subject to the EU data protection regulations, including the current EU Directive on Data Protection, which requires member states to impose minimum restrictions on the collection, use
|
Cardinal Health
|
Fiscal 2018 Form 10-K
|
28
|
|
|
Business
|
||
and transfer of personal data. The EU General Data Protection Regulation ("GDPR") includes, among other things, a requirement for prompt notice of data breaches to data subjects and supervisory authorities in certain circumstances and significant fines for non-compliance. The GDPR also requires companies processing personal data of individuals residing in the EU to comply with EU privacy and data protection rules.
Nuclear Pharmacies and Related Businesses
Our nuclear pharmacies and radiopharmaceutical manufacturing facilities (including for Xofigo) require licenses or permits and must abide by regulations issued by the NRC, applicable state boards of pharmacy and the radiologic health agency or department of health of each state in which we operate, including pharmacy sterile compounding standards and practices. In addition, our radiopharmaceutical manufacturing facilities also must comply with FDA regulations, including good manufacturing practices.
Product Tracing and Supply Chain Integrity
Title II of the DQSA, known as the Drug Supply Chain Security Act or "Track and Trace," establishes a phased-in national system for tracing pharmaceutical products through the pharmaceutical distribution supply chain to prevent the introduction of counterfeit, adulterated or mislabeled drugs. The first phase of implementation began in 2015, and upon full implementation in 2023, we and other supply chain stakeholders will participate in an electronic, interoperable, prescription drug tracing system. In addition, the FDA also has issued regulations requiring most medical device labeling to bear a unique device identifier. These regulations are being phased in through 2020. The MDR finalized in the EU in 2017 also introduces a new unique device identifier requirement with a three-year transition period.
Government Healthcare Programs
We are subject to U.S. federal healthcare fraud and abuse laws. These laws generally prohibit persons from soliciting, offering, receiving or paying any compensation in order to induce someone to order, recommend or purchase products or services that are in any way paid for by Medicare, Medicaid or other federally-funded healthcare programs. They also prohibit submitting any fraudulent claim for payment by the federal government. There are similar state healthcare fraud and abuse laws that apply to Medicaid and other state-funded healthcare programs. Violations of these laws may result in criminal or civil penalties, as well as breach of contract claims and
qui tam
actions (false claims cases initiated by private parties purporting to act on behalf of federal or state governments).
Some businesses within each of our segments are Medicare-certified suppliers or participate in other federal and state healthcare
programs, such as state Medicaid programs and the federal 340B drug pricing program. These businesses are subject to accreditation and quality standards and other rules and regulations, including applicable reporting, billing, payment and record-keeping requirements. Other businesses within each segment manufacture pharmaceutical or medical products or repackage pharmaceuticals that are purchased or reimbursed through, or are otherwise governed by, federal or state healthcare programs. Failure to comply with applicable eligibility requirements, standards and regulations could result in civil or criminal sanctions, including the loss of our ability to participate in Medicare, Medicaid and other federal and state healthcare programs.
Our U.S. federal and state government contracts are subject to specific procurement requirements. Failure to comply with applicable rules or regulations or with contractual or other requirements may result in monetary damages and criminal or civil penalties as well as termination of our government contracts or our suspension or debarment from government contract work.
Antitrust Laws
The U.S. federal government, most U.S. states and many foreign countries have laws that prohibit certain types of conduct deemed to be anti-competitive. Violations of these laws can result in various sanctions, including criminal and civil penalties. Private plaintiffs also could bring civil lawsuits against us in the United States for alleged antitrust law violations, including claims for treble damages.
Environmental, Health and Safety Laws
In the United States and other countries, we are subject to various federal, state and local environmental laws, as well as laws relating to safe working conditions and laboratory practices.
Laws Relating to Foreign Trade and Operations
U.S. and foreign laws require us to abide by standards relating to the import and export of finished goods, raw materials and supplies and the handling of information. We also must comply with various export control and trade embargo laws, which may require licenses or other authorizations for transactions within some countries or with some counterparties.
Similarly, we are subject to U.S. and foreign laws concerning the conduct of our foreign operations, including the U.S. Foreign Corrupt Practices Act, the U.K. Bribery Act and other foreign anti-bribery laws. Among other things, these laws generally prohibit companies and their intermediaries from offering, promising or making payments to officials of foreign governments for the purpose of obtaining or retaining business.
|
29
|
Cardinal Health
|
Fiscal 2018 Form 10-K
|
|
|
Business
|
||
Other Information
Although our agreements with manufacturers sometimes require us to maintain inventory levels within specified ranges, our distribution businesses are generally not required by our customers to maintain particular inventory levels other than as needed to meet service level requirements. Certain supply contracts with U.S. government entities require us to maintain sufficient inventory to meet emergency demands, but we do not believe those requirements materially affect inventory levels.
Our customer return policies generally require that the product be physically returned, subject to restocking fees. We only allow customers to return products that can be added back to inventory and resold at full value, or that can be returned to vendors for credit.
We offer market payment terms to our customers.
Revenue and Long-Lived Assets by Geographic Area
See
Note 16
of the “Notes to Consolidated Financial Statements” for revenue and long-lived assets by geographic area.
|
Cardinal Health
|
Fiscal 2018 Form 10-K
|
30
|
|
|
Risk Factors
|
||
Risk Factors
The risks described below could materially and adversely affect our results of operations, financial condition, liquidity or cash flows. These are not the only risks we face. Our businesses also could be affected by risks that we are not presently aware of or that we currently consider immaterial to our operations.
We could continue to suffer the adverse effects of competitive pressures.
As described in greater detail in the "Business" section, we operate in markets that are highly competitive and dynamic. In addition, competitive pressures in our pharmaceutical and medical distribution may be increased by new business models, new entrants, new regulations, or changes in consumer demand. Our businesses face continued pricing pressure from these factors, which adversely affects our margins. If we are unable to offset margin reductions caused by these pricing pressures through steps such as sourcing or cost control measures, additional service offerings and sales of higher margin products, our results of operations could continue to be adversely affected.
Our Pharmaceutical segment’s generic pharmaceutical program may continue to be adversely affected by pricing changes and fewer product launches.
The performance of our Pharmaceutical segment’s generic pharmaceutical program declined in fiscal 2018 and 2017 and is expected to decline in fiscal 2019. The decline has been due to generic pharmaceutical customer pricing deflation and less benefit from new generic pharmaceutical launches, which have more than offset the benefits from sourcing generic pharmaceuticals through our Red Oak Sourcing venture with CVS. If we continue to be unable to offset this decline, our Pharmaceutical segment profit and consolidated operating earnings will continue to be adversely affected.
The extent and magnitude of generic pharmaceutical pricing changes is uncertain in future fiscal years and may vary from what we anticipate. Similarly, the number of new generic pharmaceutical launches also varies from year to year, and the margin impact of these launches varies from product to product. Finally, the benefit from Red Oak Sourcing could be less than we anticipate.
CVS is a large customer that generates a significant amount of our revenue.
Our sales and credit concentration is significant. CVS accounted for 25 percent of our fiscal 2018 revenue and 22 percent of our gross trade receivable balance at June 30, 2018. Our pharmaceutical distribution agreements with CVS expire in June 2019. If CVS does not renew our agreements, renews our agreements at a reduced price or significantly reduces its purchases from us, our results of operations and financial condition could be adversely affected.
Changes in manufacturer approaches to pricing branded pharmaceutical products could have an adverse effect on our Pharmaceutical segment’s margins.
Our compensation under contractual arrangements with manufacturers for the purchase of branded pharmaceutical products is set as a percentage of the wholesale acquisition cost set by the manufacturer. Sales prices of branded pharmaceutical products to
our customers generally are a percentage discount from wholesale acquisition cost.
In recent years, pharmaceutical manufacturers have generally increased the wholesale acquisition cost of their branded pharmaceuticals each year. In May 2018, the U.S. government announced plans to, among other things, adopt policies to encourage manufacturers to limit increases in (or reduce) wholesale acquisition cost. If manufacturers change their historical approach to setting and increasing wholesale acquisition cost and we are unable to negotiate alternative ways to be compensated by manufacturers or customers for the value of our services, our Pharmaceutical segment profit and consolidated operating earnings could be adversely affected.
Our Pharmaceutical segment’s margins under a limited number of our distribution services agreements with branded pharmaceutical manufacturers are affected by prices established by the manufacturers.
Our distribution services agreements with branded pharmaceutical manufacturers generally provide that we receive fees from the manufacturers to compensate us for services we provide them. Under a limited number of agreements, branded pharmaceutical price appreciation, which is determined by the manufacturers currently also serves as a part of our compensation. If manufacturers decide not to increase prices or to implement only small increases and we are unable to negotiate alternative ways to be compensated by manufacturers or customers for the value of our services, our margins could be adversely affected.
Our business is subject to rigorous regulatory and licensing requirements.
As described in greater detail in the "Business" section, our business is highly regulated in the United States, at both the federal and state level, and in foreign countries. If we fail to comply with regulatory requirements, or if allegations are made that we fail to comply, our results of operations and financial condition could be adversely affected.
To lawfully operate our businesses, we are required to obtain and hold permits, product registrations, licenses and other regulatory approvals from, and to comply with operating and security standards of, numerous governmental bodies. For example, as a wholesale distributor of controlled substances, we must hold valid DEA registrations and state-level licenses, meet various security and operating standards, and comply with the CSA. Failure to maintain or renew necessary permits, product registrations, licenses or approvals, or to comply with required standards, could have an adverse effect on our results of operations and financial condition.
Products that we manufacture, source, distribute or market must comply with regulatory requirements. Noncompliance or concerns over noncompliance may result in suspension of our ability to distribute, import or manufacture products, product bans, recalls or seizures, or criminal or civil sanctions, which, in turn, could result in product liability claims and lawsuits, including class actions. In addition, it can be costly and time-consuming to obtain regulatory approvals or product registrations to market a medical device, and
|
31
|
Cardinal Health
|
Fiscal 2018 Form 10-K
|
|
|
Risk Factors
|
||
such approvals or registrations might not be granted on a timely basis, if at all.
We collect, handle and maintain patient-identifiable health information and other sensitive personal and financial information, which are subject to federal, state and foreign laws that regulate the use and disclosure of such information. Regulations currently in place continue to evolve, and new laws in this area could further restrict our ability to collect, handle and maintain personal or patient information, or could require us to incur additional compliance costs, either of which could have an adverse impact on our results of operations. Violations of federal, state or foreign laws concerning privacy and data protection could subject us to civil or criminal penalties, breach of contract claims, costs for remediation and harm to our reputation.
We are required to comply with laws relating to healthcare fraud and abuse. The requirements of these laws are complex and subject to varying interpretations, and it is possible that regulatory authorities could challenge our policies and practices. If we fail to comply with these laws, we could be subject to federal or state government investigations or
qui tam
actions (false claims cases initiated by private parties purporting to act on behalf of federal or state governments), which could result in civil or criminal sanctions, including the loss of licenses or the ability to participate in Medicare, Medicaid and other federal and state healthcare programs. Such sanctions and damages could adversely affect our results of operations and financial condition.
Some businesses within each of our segments are Medicare-certified suppliers or participate in other federal and state healthcare programs, such as state Medicaid program and the federal 340B drug pricing program. In addition, other businesses within each segment manufacture pharmaceutical or medical products or repackage pharmaceuticals that are purchased or reimbursed through, or are otherwise governed by, federal or state healthcare programs. Failure to comply with applicable eligibility requirements, standards and regulations could result in civil or criminal sanctions, including the loss of our ability to participate in Medicare, Medicaid and other federal and state healthcare programs.
Our government contracts are subject to specific procurement requirements. Failure to comply with applicable rules or regulations or with contractual or other requirements may result in monetary damages and criminal or civil penalties as well as termination of our government contracts or our suspension or debarment from government contract work.
Our global operations are required to comply with the U.S. Foreign Corrupt Practices Act, the U.K. Bribery Act and similar anti-bribery laws in other jurisdictions and U.S. and foreign export control, trade embargo and customs laws. If we fail to comply with any of these laws, we could suffer civil or criminal sanctions.
We could be subject to adverse changes in the tax laws or challenges to our tax positions.
We are a large multinational corporation with operations in the United States and many foreign countries. As a result, we are subject to the tax laws of many jurisdictions.
The Tax Act was enacted in December 2017. The Tax Act, among other things, reduced the U.S. federal corporate tax rate from 35 percent to 21 percent and required companies to pay a one-time tax to repatriate, for U.S. purposes, earnings of certain foreign subsidiaries that were previously deferred for tax purposes. In addition, beginning in our fiscal year 2019, the Tax Act limits certain deductions and creates new taxes on certain foreign sourced earnings. While we generally expect the impact of the Tax Act to be positive, it is possible that the limitation of certain deductions and the creation of new taxes could be more detrimental to us than anticipated.
From time to time, initiatives are proposed in the United States and other jurisdictions in which we operate that could adversely affect our tax positions, effective tax rate or tax payments. Specific initiatives that may impact us include the repeal of the LIFO (last-in, first-out) method of inventory accounting for income tax purposes, the establishment or increase in taxation at the U.S. state level on the basis of gross revenues, recommendations of the base erosion and profit shifting project undertaken by the Organization for Economic Cooperation and Development and the European Commission’s investigation into illegal state aid.
Tax laws are complex and subject to varying interpretations. Tax authorities have challenged some of our tax positions and it is possible that they will challenge others. These challenges may adversely affect our effective tax rate or tax payments.
Changes to the U.S. healthcare environment may not be favorable to us.
In recent years, the U.S. healthcare industry has undergone significant changes designed to increase access to medical care, improve safety and patient outcomes, contain costs and increase efficiencies. These changes include adoption of the Patient Protection and Affordable Care Act, a general decline in Medicare and Medicaid reimbursement levels, efforts by healthcare insurance companies to limit or reduce payments to pharmacies and providers, the basis for payments beginning to transition from a fee-for-service model to value-based payments and risk-sharing models, and the industry shifting away from traditional healthcare venues like hospitals and into clinics, physician offices and patients’ homes.
We expect the U.S. healthcare industry to continue to change significantly in the future. Possible changes include repeal and replacement of major parts of the Patient Protection and Affordable Care Act, further reduction or limitations on governmental funding at the state or federal level, efforts by healthcare insurance companies to further limit payments for products and services or changes in legislation or regulations governing prescription pharmaceutical pricing, healthcare services or mandated benefits. These possible changes, and the uncertainty surrounding these possible changes, may cause healthcare industry participants to reduce the amount of products and services they purchase from us or the price they are willing to pay for our products and services, which could adversely affect us.
|
Cardinal Health
|
Fiscal 2018 Form 10-K
|
32
|
|
|
Risk Factors
|
||
Our business and operations depend on the proper functioning of information systems, critical facilities and distribution networks. Our business could be adversely affected if we experience a cyber-attack or other systems breach.
We rely on our and third-party service providers' information systems for a wide variety of critical operations, including to obtain, rapidly process, analyze and manage data to:
|
•
|
facilitate the purchase and distribution of inventory items from numerous distribution centers;
|
|
•
|
receive, process and ship orders on a timely basis;
|
|
•
|
manage accurate billing and collections for thousands of customers;
|
|
•
|
process payments to suppliers;
|
|
•
|
facilitate manufacturing and assembly of medical products; and
|
|
•
|
generate financial information.
|
Our business also depends on the proper functioning of our critical facilities, including our national logistics center, and our distribution networks. Our results of operations could be adversely affected if our or a service provider's information systems, critical facilities or distribution networks are disrupted (including disruption of access), are damaged or fail, whether due to physical disruptions, such as fire, natural disaster, pandemic or power outage, or due to cyber-security incidents, ransomware or other actions of third parties, including labor strikes, political unrest and terrorist attacks. Manufacturing disruptions also can occur due to regulatory action, production quality deviations, safety issues or raw material shortages or defects, or because a key product is manufactured at a single manufacturing facility with limited alternate facilities.
From time to time, our businesses perform business process improvements or infrastructure modernizations or use service providers for key systems and processes, such as receiving and processing customer orders, customer service and accounts payable. If any of these initiatives are not successfully or efficiently implemented or maintained, they could adversely affect our business and our internal control over financial reporting.
Our business relies on the secure transmission, storage and hosting of patient-identifiable health information, financial information and other sensitive information relating to our customers, company and workforce. We have programs in place to detect, contain and respond to information security incidents. However, because the techniques used to obtain unauthorized access, disable or degrade service or sabotage systems change frequently and may be difficult to detect for long periods of time, we may be unable to anticipate these techniques or to implement adequate preventative measures. In addition, hardware, software or applications developed internally or procured from third parties may contain defects in design or manufacture or other problems that could unexpectedly compromise information security. Unauthorized parties also may attempt to gain access to our or a service provider's systems or facilities through fraud, trickery or other forms of deception.
Any compromise of our or a service provider's information systems, including unauthorized access to or use or disclosure of sensitive information, could adversely impact our operations, results of operations or our ability
to satisfy legal requirements, including those related to patient-identifiable health information and the new EU general data protection regulation (GDPR).
Consolidation in the U.S. healthcare industry may negatively impact our results of operations.
In recent years, U.S. healthcare industry participants, including distributors, manufacturers, healthcare providers, insurers and pharmacy chains, have consolidated or formed strategic alliances. Consolidations create larger enterprises with greater negotiating power, and also could result in the possible loss of a customer where the combined enterprise selects one distributor from two incumbents. If this consolidation trend continues, it could adversely affect our results of operations.
We may become involved in legal proceedings that could adversely impact our cash flows or results of operations.
Due to the nature of our business, which includes the distribution of controlled substances and the manufacture of medical products, we may from time to time become involved in disputes, litigation and regulatory matters. Litigation is inherently unpredictable and the unfavorable outcome of one or more of these legal proceedings could adversely affect our results of operations or financial condition.
For example, we are subject to a number of lawsuits and investigations related to the national health crisis involving the abuse of opioid pain medication as described below in the Risk Factor titled "The public health crisis involving the abuse of prescription opioid pain medication could negatively affect our business" and in
Note 9
to the "Notes to Consolidated Financial Statements."
Additionally, some of the products that we distribute or manufacture have been and may in the future be alleged to cause personal injury, subjecting us to product liability claims. For example, we are a defendant in product liability lawsuits that allege personal injuries associated with the use of Cordis OptEase and TrapEase inferior vena cava (IVC) filter products. We have accrued an amount for losses and legal defense costs related to these lawsuits, which are discussed in
Note 9
of the “Notes to Consolidated Financial Statements." Any settlement of or judgment for a product liability claim that is not covered by insurance and is in excess of any prior accruals could adversely affect our results of operations and financial condition.
We also operate in an industry characterized by extensive intellectual property litigation. Patent litigation can result in significant damage awards and injunctions that could prevent the manufacture and sale of affected products or force us to make royalty payments in order to continue selling the affected products.
The public health crisis involving the abuse of prescription opioid pain medication could negatively affect our business.
Our Pharmaceutical segment distributes prescription opioid pain medications. In recent years, the abuse of prescription opioid pain medication has received heightened public attention. These developments heighten a number of risks that we face and may present new risks that could adversely affect our operations or financial condition.
|
33
|
Cardinal Health
|
Fiscal 2018 Form 10-K
|
|
|
Risk Factors
|
||
A significant number of counties, municipalities and other plaintiffs, including a number of state attorneys general, have filed lawsuits against pharmaceutical manufacturers, pharmaceutical wholesale distributors (including us), retail chains and others relating to the manufacturing, marketing or distribution of prescription opioid pain medications. In addition, we are currently being investigated by about 40 other states for the same activities and may be named as a defendant in additional lawsuits in the future. We are vigorously defending ourselves in these lawsuits. The defense and resolution of current and future lawsuits could adversely affect our results of operations and financial condition or have adverse reputational or operational effects on our business. See
Note 9
of the "Notes to the Consolidated Financial Statements" for more information regarding these matters.
Other legislative, regulatory or industry measures related to the public health crisis could affect our business in ways that we may not be able to predict. For example, in April 2018, the State of New York created an aggregate $100 million annual assessment on all manufacturers and distributors licensed to sell or distribute opioids in New York. In addition, legislation has been proposed in some states that, if enacted, could require distributors to pay taxes on the distribution of opioid medications in those states. These proposed bills vary in the tax amounts and the means of calculation. Liabilities for taxes or assessments under any such laws could have an adverse impact on our results of operations unless we are able to mitigate them through operational changes or commercial arrangements where permitted.
Unfavorable publicity regarding the abuse or misuse of prescription opioid pain medications and the role of wholesale distributors in the supply chain of such prescription medications, as well as the continued proliferation of the opioid lawsuits, investigations, regulations and legislative actions discussed above could adversely affect our reputation and results of operations.
Our ability to manage and complete acquisitions and divestitures could impact our strategic objectives and financial condition.
An important element of our growth strategy has been to acquire other businesses that expand or complement our existing businesses. In fiscal 2018, we spent $6.1 billion to acquire other businesses including, in July 2017, the acquisition of the Patient Recovery Business from Medtronic for $6.1 billion and divested our China distribution business as well as our majority interest in naviHealth.
The acquisition of the Patient Recovery Business as well as other acquisitions involve the following risks: we may overpay for a business or fail to realize the synergies and other benefits we expect from the acquisition; our management’s attention may be diverted to integration efforts; we may fail to retain key personnel of the acquired business; future developments may impair the value of our purchased goodwill or intangible assets; we may face difficulties or delays establishing, integrating or combining operations and systems; we may assume liabilities related to legal proceedings involving the acquired business; we may face challenges retaining the customers
of the acquired business; or we may encounter unforeseen internal control, regulatory or compliance issues.
When we decide to sell assets or a business, we may encounter difficulty finding buyers or alternative exit strategies, which could delay the achievement of our strategic objectives. We could also experience greater dis-synergies than expected and the impact of the divestiture on our results of operations could be greater than anticipated.
We depend on certain suppliers to make their raw materials and products available to us and are subject to fluctuations in costs of raw materials and products.
We depend on the availability of various components, compounds, raw materials and energy supplied by others for our operations. In some instances, for reasons of quality assurance, cost effectiveness, or availability, we procure certain components and raw materials from a sole supplier. Any of our supplier relationships could be interrupted due to events beyond our control, including natural disasters, or could be terminated. In addition, due to the stringent regulations and requirements of the FDA regarding the manufacture of our products, we may not be able to quickly establish additional or replacement sources for certain components or materials. A sustained supply reduction or interruption, and an inability to develop alternative sources for such supply, could have an adverse effect on our business.
Our manufacturing businesses use oil-based resins, pulp, cotton, latex and other commodities as raw materials in many products. Prices of oil and gas also affect our distribution and transportation costs. Prices of these commodities are volatile and can fluctuate significantly, causing our costs to produce and distribute our products to fluctuate. Due to competitive dynamics and contractual limitations, we may be unable to pass along cost increases through higher prices. If we cannot fully offset cost increases through other cost reductions, or recover these costs through price increases or surcharges, our results of operations could be adversely affected.
Our results of operations may suffer upon the bankruptcy, insolvency, or other credit failure of a customer that has a substantial amount owed to us.
Most of our customers buy products and services from us on credit, which is made available to customers based on our assessment of creditworthiness. The bankruptcy, insolvency or other credit failure of any customer that has a substantial amount owed to us could adversely affect our results of operations.
As a result of our international operations, we have exposure to economic, political and currency risks, including changes in tariffs.
We conduct our operations in various regions of the world outside of the United States, including Europe, Asia and Latin America. Global developments can affect our business in many ways. Our global operations are affected by local economic environments, including inflation, recession and competition. Additionally, divergent or unfamiliar regulatory systems and labor markets also can increase the risks and burdens of operating in numerous countries.
Changes or uncertainty in U.S. or foreign policy, including any changes or uncertainty with respect to U.S. or international trade
|
Cardinal Health
|
Fiscal 2018 Form 10-K
|
34
|
|
|
Risk Factors
|
||
policies or tariffs, also can disrupt our global operations, as well as our customers and suppliers, in a particular location and may require us to spend more money to source certain products or materials that we purchase.
In addition, we conduct our business in U.S. dollars and various functional currencies of our foreign subsidiaries. Changes in foreign currency exchange rates could adversely affect our financial results, which are reported in U.S. dollars. We may not be able to hedge to protect us against these exposures, and any hedges may not successfully mitigate these exposures.
Our goodwill may be further impaired, which would require us to record a significant charge to earnings in accordance with generally accepted accounting principles.
U.S. GAAP requires us to test our goodwill for impairment on an annual basis, or more frequently if indicators for potential impairment exist. This year, as a result of the required annual test, we have
recorded a $1.4 billion impairment to goodwill within our Medical segment. The testing required by GAAP involves estimates and judgments by management. Although we believe our assumptions and estimates are reasonable and appropriate, any changes in key assumptions, including a failure to meet business plans or other unanticipated events and circumstances such as a rise in interest rates, may affect the accuracy or validity of such estimates. In addition to the impairment to goodwill in our Medical segment, it is possible that we may record significant charges related to other business units or we may record additional charges in our Medical segment, which charge or charges could adversely affect our results of operations. See "Critical Accounting Policies and Sensitive Accounting Estimates" in MD&A above for more information regarding goodwill impairment testing.
|
35
|
Cardinal Health
|
Fiscal 2018 Form 10-K
|
|
|
Properties and Legal Proceedings
|
||
Properties
In the United States and Puerto Rico, at
June 30, 2018
, the Pharmaceutical segment operated 24 primary pharmaceutical distribution facilities and one national logistics center; seven specialty distribution facilities;
and more than 140 nuclear pharmacy and radiopharmaceutical manufacturing facilities.
The Medical segment operated more than 70 medical-surgical distribution, assembly, manufacturing and other operating facilities in the United States and Puerto Rico. Our U.S. operating facilities are located in 45 states.
Outside the United States and Puerto Rico, at
June 30, 2018
, our Medical segment operated 25 facilities in Canada, Costa Rica, the Dominican Republic, Germany, Ireland, Japan, Malaysia, Malta, Mexico and Thailand that engage in manufacturing, distribution or research.
At
June 30, 2018
, we owned more than 75 operating facilities and leased more than 200 operating facilities around the world. Our principal executive offices are headquartered in an owned building located at 7000 Cardinal Place in Dublin, Ohio.
We consider our operating properties to be in satisfactory condition and adequate to meet our present needs. However, we regularly evaluate operating properties and may make further additions and improvements or consolidate locations as we seek opportunities to expand or enhance the efficiency of our business.
Legal Proceedings
The legal proceedings described in
Note 9
of the "Notes to Consolidated Financial Statements" are incorporated in this "Legal Proceedings" section by reference.
|
Cardinal Health
|
Fiscal 2018 Form 10-K
|
36
|
|
|
Market for Registrant's Common Equity
|
||
Market for Registrant's Common Equity, Related Stockholder Matters and Issuer Purchases of Equity Securities
Our common shares are listed on the New York Stock Exchange under the symbol “CAH.” The following table reflects the range of the reported high and low closing prices of our common shares as reported on the New York Stock Exchange Composite Tape and the per share dividends declared for the fiscal years ended
June 30, 2018
and
2017
and paid quarterly. It also reflects the range of the reported high and low closing prices of our common shares from July 1, 2018 through the period ended on July 31, 2018 and the per share dividends declared from July 1, 2018 through the period ended on July 31, 2018:
|
High
|
Low
|
Dividends Declared
|
|||||||||
|
Fiscal 2017
|
|||||||||||
|
Quarter Ended:
|
|||||||||||
|
September 30, 2016
|
$
|
84.92
|
|
$
|
75.26
|
|
$
|
0.4489
|
|
||
|
December 31, 2016
|
76.71
|
|
65.17
|
|
0.4489
|
|
|||||
|
March 31, 2017
|
83.80
|
|
72.47
|
|
0.4489
|
|
|||||
|
June 30, 2017
|
82.71
|
|
71.18
|
|
0.4624
|
|
|||||
|
Fiscal 2018
|
|||||||||||
|
Quarter Ended:
|
|||||||||||
|
September 30, 2017
|
$
|
78.69
|
|
$
|
64.36
|
|
$
|
0.4624
|
|
||
|
December 31, 2017
|
68.24
|
|
55.00
|
|
0.4624
|
|
|||||
|
March 31, 2018
|
75.23
|
|
61.22
|
|
0.4624
|
|
|||||
|
June 30, 2018
|
65.82
|
|
48.83
|
|
0.4763
|
|
|||||
|
Fiscal 2019
|
$
|
50.80
|
|
$
|
48.80
|
|
$
|
—
|
|
||
At July 31, 2018 there were approximately
7,817
shareholders of record of our common shares.
We anticipate that we will continue to pay quarterly cash dividends in the future. The payment and amount of future dividends remain, however, within the discretion of our Board of Directors and will depend upon our future earnings, financial condition, capital requirements and other factors.
Issuer Purchases of Equity Securities
|
Period
|
Total Number
of Shares Purchased (1) |
Average Price Paid per Share
|
Total Number of Shares
Purchased as Part of Publicly Announced Programs (2) |
Approximate
Dollar Value of
Shares That May
Yet be Purchased
Under the Programs (2)
(in millions)
|
|||||||||
|
April 2018
|
292
|
|
$
|
63.07
|
|
—
|
|
$
|
993
|
|
|||
|
May 2018
|
449,113
|
|
52.22
|
|
448,675
|
|
970
|
|
|||||
|
June 2018
|
1,433,537
|
|
53.41
|
|
1,433,244
|
|
893
|
|
|||||
|
Total
|
1,882,942
|
|
$
|
53.13
|
|
1,881,919
|
|
$
|
893
|
|
|||
|
(1)
|
Reflects
292
,
438
and
293
common shares purchased in April, May and June
2018
, respectively, through a rabbi trust as investments of participants in our Deferred Compensation Plan.
|
|
(2)
|
On February 7, 2018 our Board of Directors approved a $1.0 billion share repurchase program that expires on December 31, 2020. During the three months ended
June 30, 2018
, we repurchased
two million
common shares under this program at June 30, 2018. We have
$893 million
available under this program. On August 16, 2018 we entered into an ASR program to purchase shares of our common stock for an aggregate purchase price of $
600 million
and received an initial delivery of
9.5 million
shares of common stock using a reference price of $
50.45
. The program is expected to conclude in the second quarter of fiscal 2019.
|
|
37
|
Cardinal Health
|
Fiscal 2018 Form 10-K
|
|
|
Market for Registrant's Common Equity
|
||
Five Year Performance Graph
The following line graph compares the cumulative total return of our common shares with the cumulative total return of the Standard & Poor’s Composite—500 Stock Index (the "S&P 500 Index") and the Standard & Poor's Composite—500 Healthcare Index (the "S&P 500 Healthcare Index"). The line graph assumes, in each case, an initial investment of $100 on June 30, 2013, based on the market prices at the end of each fiscal year through and including
June 30, 2018
, and reinvestment of dividends. The S&P 500 Index and S&P 500 Healthcare Index investments are weighted on the basis of market capitalization at the beginning of each period.
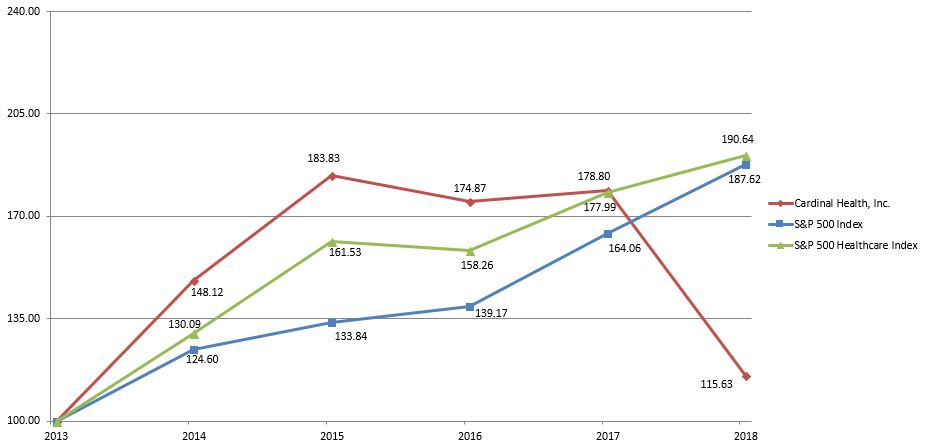
|
June 30
|
||||||||||||||||||
|
2013
|
2014
|
2015
|
2016
|
2017
|
2018
|
|||||||||||||
|
Cardinal Health, Inc.
|
$
|
100.00
|
|
$
|
148.12
|
|
$
|
183.83
|
|
$
|
174.87
|
|
$
|
178.80
|
|
$
|
115.63
|
|
|
S&P 500 Index
|
100.00
|
|
124.60
|
|
133.84
|
|
139.17
|
|
164.06
|
|
187.62
|
|
||||||
|
S&P 500 Healthcare Index
|
100.00
|
|
130.09
|
|
161.53
|
|
158.26
|
|
177.99
|
|
190.64
|
|
||||||
|
Cardinal Health
|
Fiscal 2018 Form 10-K
|
38
|
|
|
Reports
|
||
Management Reports
Evaluation of Disclosure Controls and Procedures
We evaluated, with the participation of our principal executive officer and principal financial officer, the effectiveness of our disclosure controls and procedures (as defined in Rule 13a-15(e) under the Securities Exchange Act of 1934 (the "Exchange Act")) as of
June 30, 2018
. Based on this evaluation, our principal executive officer and principal financial officer have concluded that our disclosure controls and procedures were effective as of
June 30, 2018
to provide reasonable assurance that information required to be disclosed in our reports under the Exchange Act is recorded, processed, summarized and reported within the time periods specified in the SEC rules and forms and that such information is accumulated and communicated to management as appropriate to allow timely decisions regarding required disclosure.
Management’s Report on Internal Control Over Financial Reporting
Management is responsible for establishing and maintaining adequate internal control over financial reporting as defined in Rule 13a-15(f) under the Exchange Act. Our internal control system is designed to provide reasonable assurance regarding the reliability of financial reporting and the preparation of financial statements for external purposes in accordance with generally accepted accounting principles. Because of its inherent limitations, internal control over financial reporting may not prevent or detect misstatements. Also, controls deemed effective now may become inadequate in the future because of changes in conditions, or because compliance with policies or procedures has deteriorated or been circumvented.
Management assessed the effectiveness of our internal control over financial reporting as of
June 30, 2018
. In making this assessment, management used the criteria established in the Internal Control-Integrated Framework issued by the Committee of Sponsoring Organizations of the Treadway Commission (2013 framework) (the “COSO criteria”). Based on management’s assessment and the COSO criteria, management believes that our internal control over financial reporting was effective as of
June 30, 2018
.
Our independent registered public accounting firm, Ernst & Young LLP, has issued a report on our internal control over financial reporting. Ernst & Young LLP’s report appears following this "Management Reports" section and expresses an unqualified opinion on the effectiveness of our internal control over financial reporting.
On July 29, 2017, we completed the acquisition of the Patient Recovery business. As permitted by guidelines established by the SEC, management excluded the Patient Recovery business from the scope of its assessment of the effectiveness of internal control over financial reporting as of June 30, 2018. The Patient Recovery business constituted 17% and 11% of our total and net assets, respectively, as of June 30, 2018 and approximately 2% of our revenue for the fiscal year then ended.
Changes in Internal Control Over Financial Reporting
There were no changes in our internal control over financial reporting during the quarter ended
June 30, 2018
that have materially affected, or are reasonably likely to materially affect, our internal control over financial reporting.
|
39
|
Cardinal Health
|
Fiscal 2018 Form 10-K
|
|
|
Reports
|
||
Report of Independent Registered Public Accounting Firm on Internal Control Over Financial Reporting
The Shareholders and the Board of Directors of Cardinal Health, Inc.
Opinion on Internal Control over Financial Reporting
We have audited Cardinal Health, Inc. and subsidiaries’ internal control over financial reporting as of June 30, 2018, based on criteria established in Internal Control-Integrated Framework issued by the Committee of Sponsoring Organizations of the Treadway Commission (2013 framework) (the COSO criteria). In our opinion, Cardinal Health, Inc. and subsidiaries (the Company) maintained, in all material respects, effective internal control over financial reporting as of June 30, 2018, based on the COSO criteria.
As indicated in the accompanying “Management’s Report on Internal Control Over Financial Reporting,” management’s assessment of and conclusion on the effectiveness of internal control over financial reporting did not include the internal controls of the Patient Recovery Business, which is included in the 2018 consolidated financial statements of the Company and constituted 17% and 11% of total and net assets, respectively; as of June 30, 2018 and 2% of revenues for the year then ended. Our audit of internal control over financial reporting of the Company also did not include an evaluation of the internal control over financial reporting of the Patient Recovery Business.
We also have audited, in accordance with the standards of the Public Company Accounting Oversight Board (United States) (PCAOB), the consolidated balance sheets of Cardinal Health, Inc. and subsidiaries as of June 30, 2018 and 2017 and the related consolidated statements of earnings, comprehensive income, shareholders’ equity and cash flows for each of the three years in the period ended June 30, 2018, and the related notes and financial statement schedule listed in the Index at Item 15(a)(2) and our report dated August 22, 2018 expressed an unqualified opinion thereon.
Basis for Opinion
The Company’s management is responsible for maintaining effective internal control over financial reporting and for its assessment of the effectiveness of internal control over financial reporting included in the accompanying “Management’s Report on Internal Control Over Financial Reporting.” Our responsibility is to express an opinion on the Company’s internal control over financial reporting based on our audit. We are a public accounting firm registered with the PCAOB and are required to be independent with respect to the Company in accordance with the U.S. federal securities laws and the applicable rules and regulations of the Securities and Exchange Commission and the PCAOB.
We conducted our audit in accordance with the standards of the PCAOB. Those standards require that we plan and perform the audit to obtain reasonable assurance about whether effective internal control over financial reporting was maintained in all material respects.
Our audit included obtaining an understanding of internal control over financial reporting, assessing the risk that a material weakness exists, testing and evaluating the design and operating effectiveness of internal control based on the assessed risk, and performing such other procedures as we considered necessary in the circumstances. We believe that our audit provides a reasonable basis for our opinion.
Definition and Limitations of Internal Control Over Financial Reporting
A company’s internal control over financial reporting is a process designed to provide reasonable assurance regarding the reliability of financial reporting and the preparation of financial statements for external purposes in accordance with generally accepted accounting principles. A company’s internal control over financial reporting includes those policies and procedures that (1) pertain to the maintenance of records that, in reasonable detail, accurately and fairly reflect the transactions and dispositions of the assets of the company; (2) provide reasonable assurance that transactions are recorded as necessary to permit preparation of financial statements in accordance with generally accepted accounting principles, and that receipts and expenditures of the company are being made only in accordance with authorizations of management and directors of the company; and (3) provide reasonable assurance regarding prevention or timely detection of unauthorized acquisition, use, or disposition of the company’s assets that could have a material effect on the financial statements.
Because of its inherent limitations, internal control over financial reporting may not prevent or detect misstatements. Also, projections of any evaluation of effectiveness to future periods are subject to the risk that controls may become inadequate because of changes in conditions, or that the degree of compliance with the policies or procedures may deteriorate.
|
/s/ Ernst & Young LLP
|
|
Grandview Heights, Ohio
|
|
August 22, 2018
|
|
Cardinal Health
|
Fiscal 2018 Form 10-K
|
40
|
|
|
Reports
|
||
Report of Independent Registered Public Accounting Firm
To the Shareholders and the Board of Directors of Cardinal Health, Inc.
Opinion on the Financial Statements
We have audited the accompanying consolidated balance sheets of Cardinal Health, Inc. and subsidiaries (the Company) as of June 30, 2018 and 2017, the related consolidated statements of earnings, comprehensive income, shareholders' equity and cash flows for each of the three years in the period ended June 30, 2018, and the related notes and the financial statement schedule listed in the Index at Item 15(a)(2) (collectively referred to as the “consolidated financial statements”). In our opinion, the consolidated financial statements present fairly, in all material respects, the financial position of the Company at June 30, 2018 and 2017, and the results of its operations and its cash flows for each of the three years in the period ended June 30, 2018, in conformity with U.S. generally accepted accounting principles.
We also have audited, in accordance with the standards of the Public Company Accounting Oversight Board (United States) (PCAOB), the Company's internal control over financial reporting as of June 30, 2018, based on criteria established in Internal Control-Integrated Framework issued by the Committee of Sponsoring Organizations of the Treadway Commission (2013 framework) and our report dated August 22, 2018 expressed an unqualified opinion thereon.
Basis for Opinion
These financial statements are the responsibility of the Company's management. Our responsibility is to express an opinion on the Company’s financial statements based on our audits. We are a public accounting firm registered with the PCAOB and are required to be independent with respect to the Company in accordance with the U.S. federal securities laws and the applicable rules and regulations of the Securities and Exchange Commission and the PCAOB.
We conducted our audits in accordance with the standards of the PCAOB. Those standards require that we plan and perform the audit to obtain reasonable assurance about whether the financial statements are free of material misstatement, whether due to error or fraud. Our audits included performing procedures to assess the risks of material misstatement of the financial statements, whether due to error or fraud, and performing procedures that respond to those risks. Such procedures included examining, on a test basis, evidence regarding the amounts and disclosures in the financial statements. Our audits also included evaluating the accounting principles used and significant estimates made by management, as well as evaluating the overall presentation of the financial statements. We believe that our audits provide a reasonable basis for our opinion.
|
/s/ Ernst & Young LLP
|
|
We have served as the Company's auditor since 2002.
|
|
Grandview Heights, Ohio
|
|
August 22, 2018
|
|
41
|
Cardinal Health
|
Fiscal 2018 Form 10-K
|
|
|
Financial Statements
|
||
Financial Statements and Supplementary Data
|
Page
|
|
|
Consolidated Financial Statements and Schedule:
|
|
|
Cardinal Health
|
Fiscal 2018 Form 10-K
|
42
|
|
|
Financial Statements
|
||
Consolidated Statements of Earnings
|
(in millions, except per common share amounts)
|
2018
|
2017
|
2016
|
||||||||
|
Revenue
|
$
|
136,809
|
|
$
|
129,976
|
|
$
|
121,546
|
|
||
|
Cost of products sold
|
129,628
|
|
123,432
|
|
115,003
|
|
|||||
|
Gross margin
|
7,181
|
|
6,544
|
|
6,543
|
|
|||||
|
Operating expenses:
|
|||||||||||
|
Distribution, selling, general and administrative expenses
|
4,596
|
|
3,775
|
|
3,648
|
|
|||||
|
Restructuring and employee severance
|
176
|
|
56
|
|
25
|
|
|||||
|
Amortization and other acquisition-related costs
|
707
|
|
527
|
|
459
|
|
|||||
|
Impairments and (gain)/loss on disposal of assets, net
|
1,417
|
|
18
|
|
21
|
|
|||||
|
Litigation (recoveries)/charges, net
|
159
|
|
48
|
|
(69
|
)
|
|||||
|
Operating earnings
|
126
|
|
2,120
|
|
2,459
|
|
|||||
|
Other (income)/expense, net
|
23
|
|
(5
|
)
|
5
|
|
|||||
|
Interest expense, net
|
329
|
|
201
|
|
178
|
|
|||||
|
Loss on extinguishment of debt
|
2
|
|
—
|
|
—
|
|
|||||
|
Earnings/(loss) before income taxes
|
(228
|
)
|
1,924
|
|
2,276
|
|
|||||
|
Provision for/(benefit from) income taxes
|
(487
|
)
|
630
|
|
845
|
|
|||||
|
Net earnings
|
259
|
|
1,294
|
|
1,431
|
|
|||||
|
Less: Net earnings attributable to noncontrolling interests
|
(3
|
)
|
(6
|
)
|
(4
|
)
|
|||||
|
Net earnings attributable to Cardinal Health, Inc.
|
$
|
256
|
|
$
|
1,288
|
|
$
|
1,427
|
|
||
|
Earnings per common share attributable to Cardinal Health, Inc.
|
|||||||||||
|
Basic
|
$
|
0.82
|
|
$
|
4.06
|
|
$
|
4.36
|
|
||
|
Diluted
|
0.81
|
|
4.03
|
|
4.32
|
|
|||||
|
Weighted-average number of common shares outstanding:
|
|||||||||||
|
Basic
|
313
|
|
317
|
|
327
|
|
|||||
|
Diluted
|
315
|
|
320
|
|
330
|
|
|||||
The accompanying notes are an integral part of these consolidated statements.
|
43
|
Cardinal Health
|
Fiscal 2018 Form 10-K
|
|
|
Financial Statements
|
||
|
(in millions)
|
2018
|
2017
|
2016
|
||||||||
|
Net earnings
|
$
|
259
|
|
$
|
1,294
|
|
$
|
1,431
|
|
||
|
Other comprehensive income/(loss):
|
|||||||||||
|
Foreign currency translation adjustments and other
|
58
|
|
(25
|
)
|
(82
|
)
|
|||||
|
Amounts reclassified to earnings
|
(23
|
)
|
—
|
|
—
|
|
|||||
|
Net unrealized gain/(loss) on derivative instruments, net of tax
|
(2
|
)
|
16
|
|
(11
|
)
|
|||||
|
Total other comprehensive income/(loss), net of tax
|
33
|
|
(9
|
)
|
(93
|
)
|
|||||
|
Total comprehensive income
|
292
|
|
1,285
|
|
1,338
|
|
|||||
|
Less: comprehensive income attributable to noncontrolling interests
|
(3
|
)
|
(6
|
)
|
(4
|
)
|
|||||
|
Total comprehensive income attributable to Cardinal Health, Inc.
|
$
|
289
|
|
$
|
1,279
|
|
$
|
1,334
|
|
||
The accompanying notes are an integral part of these consolidated statements.
|
Cardinal Health
|
Fiscal 2018 Form 10-K
|
44
|
|
|
Financial Statements
|
||
|
June 30
|
|||||||
|
(in millions)
|
2018
|
2017
|
|||||
|
Assets
|
|||||||
|
Current assets:
|
|||||||
|
Cash and equivalents
|
$
|
1,763
|
|
$
|
6,879
|
|
|
|
Trade receivables, net
|
7,800
|
|
8,048
|
|
|||
|
Inventories, net
|
12,308
|
|
11,301
|
|
|||
|
Prepaid expenses and other
|
1,926
|
|
2,117
|
|
|||
|
Assets held for sale
|
756
|
|
—
|
|
|||
|
Total current assets
|
24,553
|
|
28,345
|
|
|||
|
Property and equipment, net
|
2,487
|
|
1,879
|
|
|||
|
Goodwill and other intangibles, net
|
12,229
|
|
9,207
|
|
|||
|
Other assets
|
682
|
|
681
|
|
|||
|
Total assets
|
$
|
39,951
|
|
$
|
40,112
|
|
|
|
Liabilities, Redeemable Noncontrolling Interests and Shareholders’ Equity
|
|||||||
|
Current liabilities:
|
|||||||
|
Accounts payable
|
$
|
19,677
|
|
$
|
17,906
|
|
|
|
Current portion of long-term obligations and other short-term borrowings
|
1,001
|
|
1,327
|
|
|||
|
Other accrued liabilities
|
2,002
|
|
$
|
1,988
|
|
||
|
Liabilities related to assets held for sale
|
213
|
|
—
|
|
|||
|
Total current liabilities
|
22,893
|
|
21,221
|
|
|||
|
Long-term obligations, less current portion
|
8,012
|
|
9,068
|
|
|||
|
Deferred income taxes and other liabilities
|
2,975
|
|
2,877
|
|
|||
|
Redeemable noncontrolling interests
|
12
|
|
118
|
|
|||
|
Shareholders’ equity:
|
|||||||
|
Preferred shares, without par value:
|
|||||||
|
Authorized—
500 thousand
shares, Issued—
none
|
—
|
|
—
|
|
|||
|
Common shares, without par value:
|
|||||||
|
Authorized—
755 million
shares, Issued—
327 million
shares at
June 30, 2018
and June 30, 2017, respectively
|
2,730
|
|
2,697
|
|
|||
|
Retained earnings
|
4,645
|
|
4,967
|
|
|||
|
Common shares in treasury, at cost:
18 million
shares and 11 million shares at
June 30, 2018
and June 30, 2017, respectively
|
(1,224
|
)
|
(731
|
)
|
|||
|
Accumulated other comprehensive loss
|
(92
|
)
|
(125
|
)
|
|||
|
Total Cardinal Health, Inc. shareholders' equity
|
6,059
|
|
6,808
|
|
|||
|
Noncontrolling interests
|
—
|
|
20
|
|
|||
|
Total shareholders’ equity
|
6,059
|
|
6,828
|
|
|||
|
Total liabilities, redeemable noncontrolling interests and shareholders’ equity
|
$
|
39,951
|
|
$
|
40,112
|
|
|
|
45
|
Cardinal Health
|
Fiscal 2018 Form 10-K
|
|
|
Financial Statements
|
||
Consolidated Statements of Shareholders' Equity
|
Common Shares
|
Treasury Shares
|
Accumulated Other
Comprehensive Income/(Loss) |
Noncontrolling Interests
|
Total
Shareholders’ Equity |
|||||||||||||||||||||||||
|
(in millions)
|
Shares Issued
|
Amount
|
Retained
Earnings |
Shares
|
Amount
|
||||||||||||||||||||||||
|
Balance at June 30, 2015
|
364
|
|
$
|
3,003
|
|
$
|
5,521
|
|
(36
|
)
|
$
|
(2,245
|
)
|
$
|
(23
|
)
|
$
|
—
|
|
$
|
6,256
|
|
|||||||
|
Net earnings
|
1,427
|
|
3
|
|
1,430
|
|
|||||||||||||||||||||||
|
Other comprehensive loss, net of tax
|
(93
|
)
|
(93
|
)
|
|||||||||||||||||||||||||
|
Purchase of noncontrolling interests
|
(7
|
)
|
(7
|
)
|
|||||||||||||||||||||||||
|
Employee stock plans activity, including tax benefit of $33 million
|
—
|
|
7
|
|
2
|
|
137
|
|
144
|
|
|||||||||||||||||||
|
Treasury shares acquired
|
(8
|
)
|
(651
|
)
|
(651
|
)
|
|||||||||||||||||||||||
|
Dividends declared
|
(529
|
)
|
(529
|
)
|
|||||||||||||||||||||||||
|
Other
|
|
|
21
|
|
21
|
|
|||||||||||||||||||||||
|
Balance at June 30, 2016
|
364
|
|
3,010
|
|
6,419
|
|
(42
|
)
|
(2,759
|
)
|
(116
|
)
|
17
|
|
6,571
|
|
|||||||||||||
|
Net earnings
|
1,288
|
|
2
|
|
1,290
|
|
|||||||||||||||||||||||
|
Other comprehensive loss, net of tax
|
(9
|
)
|
(9
|
)
|
|||||||||||||||||||||||||
|
Purchase of noncontrolling interests
|
(1
|
)
|
(1
|
)
|
|||||||||||||||||||||||||
|
Employee stock plans activity, including tax benefit of $34 million
|
—
|
|
(11
|
)
|
2
|
|
167
|
|
156
|
|
|||||||||||||||||||
|
Treasury shares acquired
|
(8
|
)
|
(600
|
)
|
(600
|
)
|
|||||||||||||||||||||||
|
Dividends declared
|
(580
|
)
|
(580
|
)
|
|||||||||||||||||||||||||
|
Other
|
(1
|
)
|
2
|
|
1
|
|
|||||||||||||||||||||||
|
Retirement of Treasury Shares
|
(37
|
)
|
(302
|
)
|
(2,159
|
)
|
37
|
|
2,461
|
|
—
|
|
|||||||||||||||||
|
Balance at June 30, 2017
|
327
|
|
2,697
|
|
4,967
|
|
(11
|
)
|
(731
|
)
|
(125
|
)
|
20
|
|
6,828
|
|
|||||||||||||
|
Net earnings
|
256
|
|
(1
|
)
|
255
|
|
|||||||||||||||||||||||
|
Other comprehensive loss, net of tax
|
33
|
|
33
|
|
|||||||||||||||||||||||||
|
Purchase and divestiture of noncontrolling interests
|
(19
|
)
|
(19
|
)
|
|||||||||||||||||||||||||
|
Employee stock plans activity, including tax benefit of $10 million
|
—
|
|
33
|
|
1
|
|
57
|
|
90
|
|
|||||||||||||||||||
|
Treasury shares acquired
|
(8
|
)
|
(550
|
)
|
(550
|
)
|
|||||||||||||||||||||||
|
Dividends declared
|
(584
|
)
|
(584
|
)
|
|||||||||||||||||||||||||
|
Other
|
6
|
|
|
6
|
|
||||||||||||||||||||||||
|
Balance at June 30, 2018
|
327
|
|
$
|
2,730
|
|
$
|
4,645
|
|
(18
|
)
|
$
|
(1,224
|
)
|
$
|
(92
|
)
|
$
|
—
|
|
$
|
6,059
|
|
|||||||
The accompanying notes are an integral part of these consolidated statements.
|
Cardinal Health
|
Fiscal 2018 Form 10-K
|
46
|
|
|
Financial Statements
|
||
|
(in millions)
|
2018
|
2017
|
2016
|
||||||||
|
Cash flows from operating activities:
|
|||||||||||
|
Net earnings
|
$
|
259
|
|
$
|
1,294
|
|
$
|
1,431
|
|
||
|
Adjustments to reconcile net earnings to net cash provided by operating activities:
|
|||||||||||
|
Depreciation and amortization
|
1,032
|
|
717
|
|
641
|
|
|||||
|
Loss on extinguishment of debt
|
2
|
|
—
|
|
—
|
|
|||||
|
Impairments and loss on sale of other investments
|
6
|
|
4
|
|
—
|
|
|||||
|
Impairments and loss on disposal of assets, net
|
1,417
|
|
18
|
|
21
|
|
|||||
|
Share-based compensation
|
85
|
|
96
|
|
111
|
|
|||||
|
Provision for/(benefit from) deferred income taxes
|
(1,012
|
)
|
291
|
|
87
|
|
|||||
|
Provision for bad debts
|
111
|
|
63
|
|
73
|
|
|||||
|
Change in fair value of contingent consideration obligation
|
(2
|
)
|
(5
|
)
|
(16
|
)
|
|||||
|
Change in operating assets and liabilities, net of effects from acquisitions and divestitures:
|
|
||||||||||
|
Increase in trade receivables
|
(871
|
)
|
(665
|
)
|
(866
|
)
|
|||||
|
Increase in inventories
|
(1,211
|
)
|
(673
|
)
|
(1,179
|
)
|
|||||
|
Increase in accounts payable
|
2,574
|
|
564
|
|
2,815
|
|
|||||
|
Other accrued liabilities and operating items, net
|
378
|
|
(520
|
)
|
(147
|
)
|
|||||
|
Net cash provided by operating activities
|
2,768
|
|
1,184
|
|
2,971
|
|
|||||
|
Cash flows from investing activities:
|
|||||||||||
|
Acquisition of subsidiaries, net of cash acquired
|
(6,142
|
)
|
(132
|
)
|
(3,614
|
)
|
|||||
|
Additions to property and equipment
|
(384
|
)
|
(387
|
)
|
(465
|
)
|
|||||
|
Purchase of available-for-sale securities and other investments
|
(9
|
)
|
(194
|
)
|
(200
|
)
|
|||||
|
Proceeds from sale of available-for-sale securities and other investments
|
65
|
|
228
|
|
136
|
|
|||||
|
Proceeds from maturities of available-for-sale securities
|
—
|
|
77
|
|
50
|
|
|||||
|
Proceeds from divestitures, net of cash sold, and disposal of property and equipment
|
862
|
|
3
|
|
13
|
|
|||||
|
Net cash used in investing activities
|
(5,608
|
)
|
(405
|
)
|
(4,080
|
)
|
|||||
|
Cash flows from financing activities:
|
|||||||||||
|
Payment of contingent consideration obligation
|
(35
|
)
|
(3
|
)
|
(25
|
)
|
|||||
|
Net change in short-term borrowings
|
(50
|
)
|
3
|
|
26
|
|
|||||
|
Purchase of noncontrolling interests
|
(106
|
)
|
(12
|
)
|
(10
|
)
|
|||||
|
Reduction of long-term obligations
|
(954
|
)
|
(310
|
)
|
(6
|
)
|
|||||
|
Proceeds from interest rate swap terminations
|
—
|
|
14
|
|
—
|
|
|||||
|
Proceeds from long-term obligations, net of issuance costs
|
3
|
|
5,171
|
|
—
|
|
|||||
|
Net tax proceeds/(withholding) from share-based compensation
|
(3
|
)
|
26
|
|
6
|
|
|||||
|
Excess tax benefits from share-based compensation
|
—
|
|
34
|
|
33
|
|
|||||
|
Dividends on common shares
|
(581
|
)
|
(577
|
)
|
(512
|
)
|
|||||
|
Purchase of treasury shares
|
(550
|
)
|
(600
|
)
|
(651
|
)
|
|||||
|
Net cash provided by/(used in) financing activities
|
(2,276
|
)
|
3,746
|
|
(1,139
|
)
|
|||||
|
Effect of exchange rates changes on cash and equivalents
|
4
|
|
(2
|
)
|
(12
|
)
|
|||||
|
Cash reclassified to assets held for sale
|
(4
|
)
|
—
|
|
|
—
|
|
||||
|
Net increase/(decrease) in cash and equivalents
|
(5,116
|
)
|
4,523
|
|
(2,260
|
)
|
|||||
|
Cash and equivalents at beginning of period
|
6,879
|
|
2,356
|
|
4,616
|
|
|||||
|
Cash and equivalents at end of period
|
$
|
1,763
|
|
$
|
6,879
|
|
$
|
2,356
|
|
||
|
Supplemental Information:
|
|||||||||||
|
Cash payments for interest
|
$
|
320
|
|
$
|
200
|
|
$
|
174
|
|
||
|
Cash payments for income taxes
|
425
|
|
686
|
|
635
|
|
|||||
The accompanying notes are an integral part of these consolidated statements.
|
47
|
Cardinal Health
|
Fiscal 2018 Form 10-K
|
|
|
Notes to Financial Statements
|
||
Notes to Consolidated Financial Statements
1. Basis of Presentation and Summary of Significant Accounting Policies
Cardinal Health, Inc. is a globally integrated healthcare services and products company providing customized solutions for hospitals, healthcare systems, pharmacies, ambulatory surgery centers, clinical laboratories and physician offices. The company provides medical products and pharmaceuticals and cost-effective solutions that enhance supply chain efficiency. References to “we”, “our” and similar pronouns in these consolidated financial statements are to Cardinal Health, Inc. and its majority-owned or controlled subsidiaries unless the context otherwise requires.
Our fiscal year ends on June 30. References to fiscal
2018
,
2017
and
2016
in these consolidated financial statements are to the fiscal years ended
June 30, 2018
,
2017
and
2016
, respectively.
Basis of Presentation
Our consolidated financial statements include the accounts of all majority-owned or controlled subsidiaries, and all significant intercompany transactions and amounts have been eliminated. To conform to the current year presentation, certain prior year amounts have been reclassified. The results of businesses acquired or disposed of are included in the consolidated financial statements from the date of the acquisition or up to the date of disposal, respectively.
Use of Estimates
Our consolidated financial statements are prepared in accordance with accounting principles generally accepted in the United States (“GAAP”). The preparation of financial statements in accordance with GAAP requires us to make estimates, judgments and assumptions that affect the amounts reported in the consolidated financial statements and accompanying notes. Estimates, judgments and assumptions are used in the accounting and disclosure related to, among other items, allowance for doubtful accounts, inventory valuation and reserves, business combinations, goodwill and other intangible asset impairment, vendor reserves, loss contingencies, self-insurance accruals, income taxes and share-based compensation. Actual amounts could ultimately differ from these estimated amounts.
Cash Equivalents
We consider liquid investments purchased with an initial maturity of three months or less to be cash equivalents. The carrying value of cash equivalents approximates fair value.
Receivables and Allowance for Doubtful Accounts
Trade receivables are presented net of an allowance for doubtful accounts of
$139 million
and
$137 million
at
June 30, 2018
and
2017
, respectively. An account is considered past due on the first day after its due date. In accordance with contract terms, we generally have the ability to charge customers service fees or higher prices if an account is considered past due. We regularly monitor past due accounts and establish appropriate reserves to cover potential
losses, which are based primarily on historical collection rates and the credit worthiness of the customer. We write off any amounts deemed uncollectible against the established allowance for doubtful accounts.
We provide financing to various customers. Such financing arrangements range from
1 year
to
5 years
at interest rates that are generally subject to fluctuation. Interest income on these arrangements is recognized as it is earned. The financings may be collateralized, guaranteed by third parties or unsecured. Finance notes, net and related accrued interest were
$136 million
(current portion
$26 million
) and
$171 million
(current portion
$53 million
) at
June 30, 2018
and
2017
, respectively, and are included in other assets (current portion is included in prepaid expenses and other) in the consolidated balance sheets. Finance notes receivable allowance for doubtful accounts were
$7 million
and
$9 million
at
June 30, 2018
and
2017
, respectively. We estimate an allowance for these financing receivables based on historical collection rates and the credit worthiness of the customer. We write off any amounts deemed uncollectible against the established allowance for doubtful accounts.
Concentrations of Credit Risk
We maintain cash depository accounts with major banks, and we invest in high quality, short-term liquid instruments, and in marketable securities. Our short-term liquid instruments mature within three months and we have not historically incurred any related losses. Investments in marketable debt securities consist of a portfolio of high-grade instruments. Such investments are made only in instruments issued by highly-rated institutions, whose financial condition we monitor. We had none of these investments at June 30, 2018.
Our trade receivables and finance notes and related accrued interest are exposed to a concentration of credit risk with certain large customers and with customers in the retail and healthcare sectors. Credit risk can be affected by changes in reimbursement and other economic pressures impacting the healthcare industry. With respect to customers in the retail and healthcare sectors, such credit risk is limited due to supporting collateral and the diversity of the customer base, including its wide geographic dispersion. We perform regular credit evaluations of our customers’ financial conditions and maintain reserves for losses through the established allowance for doubtful accounts. Historically, such losses have been within our expectations. Refer to the "Receivables and Allowance for Doubtful Accounts" section within this Note for additional information on the accounting treatment of reserves for allowance for doubtful accounts.
Major Customers
CVS Health Corporation ("CVS") and OptumRx, are our only customers that individually account for at least 10 percent of revenue and gross trade receivables. These customers are primarily serviced through our Pharmaceutical segment.
|
Cardinal Health
|
Fiscal 2018 Form 10-K
|
48
|
|
|
Notes to Financial Statements
|
||
The following table summarizes historical percent of revenue and gross trade receivables from CVS and OptumRx:
|
Percent of Revenue
|
Percent of Gross Trade Receivables at June 30
|
|||||||||||||
|
2018
|
2017
|
2016
|
2018
|
2017
|
||||||||||
|
CVS
|
25
|
%
|
23
|
%
|
25
|
%
|
22
|
%
|
20
|
%
|
||||
|
OptumRx
|
11
|
%
|
11
|
%
|
7
|
%
|
4
|
%
|
1
|
%
|
||||
Our pharmaceutical distribution contract with OptumRx began in fiscal 2016 and did not exceed 10 percent until fiscal 2017.
We have entered into agreements with group purchasing organizations (“GPOs”) which act as purchasing agents that negotiate vendor contracts on behalf of their members. Vizient, Inc. and Premier, Inc. are our
two
largest GPO member relationships in terms of revenue. Sales to members of these
two
GPOs collectively accounted for
22 percent
,
21 percent
and
17 percent
of revenue for fiscal
2018
,
2017
and
2016
, respectively. Our trade receivable balances are with individual members of the GPO, and therefore no significant concentration of credit risk exists with these types of arrangements.
Inventories
A substantial portion of our inventories (
56 percent
at both
June 30, 2018
and
2017
) are valued at the lower of cost, using the last-in, first-out ("LIFO") method, or market. These inventories are included within the core pharmaceutical distribution facilities of our Pharmaceutical segment (“distribution facilities”) and are primarily merchandise inventories. The LIFO method presumes that the most recent inventory purchases are the first items sold, so LIFO helps us better match current costs and revenue. We believe that the average cost method of inventory valuation provides a reasonable approximation of the current cost of replacing inventory within the distribution facilities. As such, the LIFO reserve is the difference between (a) inventory at the lower of LIFO cost or market and (b) inventory at replacement cost determined using the average cost method of inventory valuation.
If we had used the average cost method of inventory valuation for all inventory within the distribution facilities, the value of our inventories would not have changed in fiscal
2018
or
2017
because inventories valued at LIFO were
$92 million
and
$46 million
higher than the average cost value at
June 30, 2018
and
2017
, respectively. We do not record inventories in excess of replacement cost. As such, we did not record any changes in our LIFO reserve in fiscal
2018
and
2017
.
Our remaining inventory that is not valued at the lower of LIFO or market is stated at the lower of cost, using the first-in, first-out method, or net realizable value.
Net realizable value is defined as the estimated selling prices in the ordinary course of business, less reasonably predictable costs of completion, disposal and transportation.
Inventories presented in the consolidated balance sheets are net of reserves for excess and obsolete inventory which were
$147 million
and
$76 million
at
June 30, 2018
and
2017
, respectively.
The increase in the reserves for excess and obsolete inventory during fiscal
2018
was driven by increased
Cordis inventory
reserves and the Patient Recovery acquisition. We reserve for inventory obsolescence using estimates based on historical experience, historical and projected sales trends, specific categories of inventory and age of on-hand inventory.
Cash Discounts
Manufacturer cash discounts are recorded as a component of inventory cost and recognized as a reduction of cost of products sold as inventory is sold.
Property and Equipment
Property and equipment are carried at cost less accumulated depreciation. Property and equipment held for sale are recorded at the lower of cost or fair value less cost to sell. When certain events or changes in operating conditions occur, an impairment assessment may be performed on the recoverability of the carrying amounts.
Depreciation expense is computed using the straight-line method over the estimated useful lives of the assets, including capital lease assets which are depreciated over the terms of their respective leases. We generally use the following range of useful lives for our property and equipment categories: buildings and improvements—
3
to
39 years
; machinery and equipment—
3
to
20 years
; and furniture and fixtures—
3
to
7 years
. We recorded depreciation and amortization expense of
$446 million
,
$314 million
and
$277 million
for fiscal
2018
,
2017
and
2016
, respectively.
The following table presents the components of property and equipment, net at June 30:
|
(in millions)
|
2018
|
2017
|
|||||
|
Land, building and improvements
|
$
|
2,115
|
|
$
|
1,637
|
|
|
|
Machinery and equipment
|
3,006
|
|
2,860
|
|
|||
|
Furniture and fixtures
|
139
|
|
130
|
|
|||
|
Total property and equipment, at cost
|
5,260
|
|
4,627
|
|
|||
|
Accumulated depreciation and amortization
|
(2,773
|
)
|
(2,748
|
)
|
|||
|
Property and equipment, net
|
$
|
2,487
|
|
$
|
1,879
|
|
|
Repairs and maintenance expenditures are expensed as incurred. Interest on long-term projects is capitalized using a rate that approximates the weighted-average interest rate on long-term obligations, which was
4 percent
at
June 30, 2018
. The amount of capitalized interest was immaterial for all periods presented.
Business Combinations
The assets acquired and liabilities assumed in a business combination, including identifiable intangible assets, are recorded at their estimated fair values as of the acquisition date. The excess of the purchase price over the estimated fair value of the identifiable net assets acquired is recorded as goodwill. We base the fair values of identifiable intangible assets on detailed valuations that require management to make significant judgments, estimates and assumptions. Critical estimates and assumptions include: expected future cash flows for customer relationships, trade names and other identifiable intangible assets; discount rates that reflect the risk factors associated with future cash flows; and estimates of useful lives. When an acquisition involves contingent consideration, we recognize a liability equal to the fair value of the contingent consideration obligation at the acquisition date. The estimate of fair
|
49
|
Cardinal Health
|
Fiscal 2018 Form 10-K
|
|
|
Notes to Financial Statements
|
||
value of a contingent consideration obligation requires subjective assumptions to be made regarding future business results, discount rates, discount periods and probabilities assigned to various potential business result scenarios. See
Note 2
for additional information regarding our acquisitions.
Goodwill and Other Intangible Assets
Purchased goodwill and intangible assets with indefinite lives are not amortized, but instead are tested for impairment annually or when indicators of impairment exist.
Purchased goodwill is tested for impairment at least annually. Qualitative factors are first assessed to determine if it is more likely than not that the fair value of a reporting unit is less than its carrying amount. If it is determined that it is more likely than not that the fair value does not exceed the carrying amount, then a quantitative test is performed. The quantitative goodwill impairment test involves a comparison of the estimated fair value of the reporting unit to the respective carrying amount.
Goodwill impairment testing involves judgment, including the identification of reporting units, qualitative evaluation of events and circumstances to determine if it is more likely than not that an impairment exists, and, if necessary, the estimation of the fair value of the applicable reporting unit. Our qualitative evaluation considers the weight of evidence and significance of all identified events and circumstances and most relevant drivers of fair value, both positive and negative, in determining whether it is more likely than not that the fair value of a reporting unit is less than its carrying amount.
We have
two
operating segments, which are the same as our reportable segments: Pharmaceutical and Medical. These operating segments are comprised of divisions (components), for which discrete financial information is available. Components are aggregated into reporting units for purposes of goodwill impairment testing to the extent that they share similar economic characteristics. Our reporting units are: Pharmaceutical operating segment (excluding our Nuclear Pharmacy Services division); Nuclear Pharmacy Services division; Medical operating segment (excluding our Cardinal Health at Home division and naviHealth division) (“Medical Unit”); Cardinal Health at Home division; and naviHealth division.
Fair value can be determined using market, income or cost-based approaches. Our determination of estimated fair value of the reporting units is based on a combination of the income-based and market-based approaches. Under the income-based approach, we use a discounted cash flow model in which cash flows anticipated over several future periods, plus a terminal value at the end of that time horizon, are discounted to their present value using an appropriate risk-adjusted rate of return. We use our internal forecasts to estimate future cash flows, which we believe are consistent with those of a market participant, and include an estimate of long-term growth rates based on our most recent views of the long-term outlook for each reporting unit. Actual results may differ materially from those used in our forecasts. We use discount rates that are commensurate with the risks and uncertainty inherent in the respective reporting units and in our internally-developed forecasts. Discount rates used in our reporting unit valuations ranged from
8.5 percent
to
13.5 percent
.
Under the market-based approach, we determine fair value by comparing our reporting units to similar businesses or guideline companies whose securities are actively traded in public markets. We also use the guideline transaction method to determine fair value based on pricing multiples derived from the sale of companies that are similar to our reporting units. To further confirm fair value, we compare the aggregate fair value of our reporting units to our total market capitalization. Estimating the fair value of reporting units requires the use of estimates and significant judgments that are based on a number of factors including forecasted operating results. The use of alternate estimates and assumptions or changes in the industry or peer groups could materially affect the determination of fair value for each reporting unit and potentially result in goodwill impairment.
We performed annual impairment testing in fiscal
2018
,
2017
and
2016
and with the exception of our Medical Unit in fiscal 2018, concluded that there were no impairments of goodwill as the estimated fair value of each reporting unit exceeded its carrying value. As discussed further in
Note 5
of the "Notes to Consolidated Financial Statements," during the fourth quarter of fiscal 2018 we recognized a
$1.4 billion
goodwill impairment charge related to our Medical Unit, which is included in impairments and loss on disposal of assets in our consolidated statements of earnings. There was no tax benefit related to this goodwill impairment charge.
The impairment test for indefinite-lived intangibles other than goodwill (primarily IPR&D) involves first assessing qualitative factors to determine if it is more likely than not that the fair value of the indefinite-lived intangible asset is less than its carrying amount. If so, then a quantitative test is performed to compare the estimated fair value of the indefinite-lived intangible asset to the respective asset's carrying amount. Our qualitative evaluation
requires the use of estimates and significant judgments and
considers the weight of evidence and significance of all identified events and circumstances and most relevant drivers of fair value, both positive and negative, in determining whether it is more likely than not that the fair value of the indefinite-lived intangible asset is less than its carrying amount.
Intangible assets with finite lives, primarily customer relationships; trademarks, trade names and patents; and developed technology, are amortized using a combination of straight-line and accelerated methods based on the expected cash flows from the asset over their estimated useful lives. We review intangible assets with finite lives for impairment whenever events or changes in circumstances indicate that the related carrying amounts may not be recoverable. Determining whether an impairment loss occurred requires a comparison of the carrying amount to the sum of the future forecasted undiscounted cash flows expected to be generated by the asset group. Actual results may differ materially from those used in our forecasts.
Assets Held for Sale
We classify assets and liabilities (the “disposal group”) as held for sale when management commits to a plan to sell the disposal group in its present condition and at a price that is reasonable in relation to its current fair value. We also consider whether an active program to locate a buyer has been initiated and if it is probable that the sale will
|
Cardinal Health
|
Fiscal 2018 Form 10-K
|
50
|
|
|
Notes to Financial Statements
|
||
occur within one year without significant changes to the plan to sell. Upon classification of the disposal group as held for sale, we test the assets for impairment and cease related depreciation and amortization.
Investments
Investments in non-marketable equity securities are accounted for under either the cost or equity method of accounting and are included in other assets in the consolidated balance sheets. For investments in which we can exercise significant influence, we use the equity method of accounting. Our share of the earnings and losses was immaterial, both individually and in the aggregate, for all periods presented and is recorded in other income, net in the consolidated statements of earnings. We closely monitor our investments for other-than-temporary impairment by considering factors such as the operating performance of the investment and current economic and market conditions.
Marketable securities are classified as available-for-sale and are carried at fair value in the consolidated balance sheets. Unrealized gains and losses on available-for-sale securities, net of applicable taxes, are included within shareholders’ equity in accumulated other comprehensive income ("AOCI"). We monitor these securities for other-than-temporary impairment by considering factors such as the duration that, and the extent to which, the fair value is below cost, the operating performance and credit worthiness of the issuer of the securities and current economic and market conditions. See
Note 6
for additional information regarding available-for-sale securities.
Vendor Reserves
In the ordinary course of business, our vendors may dispute deductions taken against payments otherwise due to them or assert other disputes. These disputes are researched and resolved based upon the findings of the research performed. At any given time, there are outstanding items in various stages of research and resolution. In determining appropriate reserves for areas of exposure with our vendors, we assess historical experience and current outstanding claims. We have established various levels of reserves based on the type of claim and status of review. Though the claim types are relatively consistent, we periodically refine our methodology by updating the reserve estimate percentages to reflect actual historical experience. The ultimate outcome of certain claims may be different than our original estimate and may require an adjustment. Adjustments to vendor reserves are included in cost of products sold. In addition, the reserve balance will fluctuate due to variations of outstanding claims from period-to-period, timing of settlements and specific vendor issues, such as bankruptcies. Vendor reserves were
$45 million
and
$50 million
at
June 30, 2018
and
2017
, respectively, excluding third-party returns. See Third-Party Returns section within this Note for a description of third-party returns.
Distribution Services Agreement and Other Vendor Fees
Our Pharmaceutical segment recognizes fees received from distribution services agreements and other fees received from vendors related to the purchase or distribution of the vendors’ inventory when those fees have been earned and we are entitled to
payment. Since the benefit provided to a vendor is related to the purchase and distribution of the vendor’s inventory, we recognize the fees as a reduction in the carrying value of the inventory that generated the fees, and as such, a reduction of cost of products sold in our consolidated statements of earnings when the inventory is sold.
Loss Contingencies and Self-Insurance
We accrue for contingencies related to disputes, litigation and regulatory matters if it is probable that a liability has been incurred and the amount of the loss can be reasonably estimated. We also self-insure for employee healthcare, general liability, certain product liability matters, auto liability, property and workers' compensation. Self-insurance accruals include an estimate for expected settlements or pending claims, defense costs, administrative fees, claim adjustment costs and an estimate for claims incurred but not reported. Because these matters are inherently unpredictable and unfavorable developments or resolutions can occur, assessing contingencies and other liabilities is highly subjective and requires judgments about future events. We regularly review contingencies and our self-insurance accruals to determine whether our accruals and related disclosures are adequate. The amount of ultimate loss may differ from these estimates.
We recognize these estimated loss contingencies, income from favorable resolution of litigation and certain defense costs in litigation (recoveries)/charges in our consolidated statements of earnings.
See
Note 9
for additional information regarding loss contingencies and product liability lawsuits.
Income Taxes
We account for income taxes using the asset and liability method. Deferred tax assets and liabilities are measured using enacted tax rates in the respective jurisdictions in which we operate
. We assess the realizability of deferred tax assets on a quarterly basis and provide a valuation allowance for deferred tax assets when it is more likely than not that at least a portion of the deferred tax assets will not be realized. The realizability of deferred tax assets depends on our ability to generate sufficient taxable income within the carryback or carryforward periods provided for in the tax law for each applicable tax jurisdiction and also considers all available positive and negative evidence.
Deferred taxes for non-U.S. liabilities are not provided on the unremitted earnings of subsidiaries outside of the United States when it is expected that these earnings are indefinitely reinvested.
Tax benefits from uncertain tax positions are recognized when it is more likely than not that the position will be sustained upon examination of the technical merits of the position, including resolutions of any related appeals or litigation processes. The amount recognized is measured as the largest amount of tax benefit that is greater than 50 percent likely of being realized upon settlement. See
Note 8
for additional information regarding income taxes.
Other Accrued Liabilities
Other accrued liabilities represent various current obligations, including certain accrued operating expenses and taxes payable.
|
51
|
Cardinal Health
|
Fiscal 2018 Form 10-K
|
|
|
Notes to Financial Statements
|
||
Noncontrolling Interests and Redeemable Noncontrolling Interests
Noncontrolling interests represent the portion of net earnings, comprehensive income and net assets that is not attributable to Cardinal Health, Inc.
The redeemable noncontrolling interests relate to our
ownership interest in naviHealth Holdings, LLC ("naviHealth"), which we acquired during
fiscal
2016. The redeemable noncontrolling interests are redeemable at the option of the third-party noncontrolling interest holders at any time after the two-year anniversary of the closing, or earlier if a trigger event occurs. As such, the noncontrolling interests have been presented as redeemable noncontrolling interests in our consolidated balance sheets. The noncontrolling interests will be adjusted each period for net earnings and dividends attributable to the noncontrolling interests and changes in the noncontrolling ownership interests, if any. An additional adjustment to the carrying value of the noncontrolling interests may be required if the redemption value under the terms of the agreement exceeds the carrying value. Changes in the carrying value of the noncontrolling interests related to a change in the redemption value will be recorded through retained earnings and will not affect net earnings attributable to Cardinal Health, Inc. See
Note 13
for additional information regarding redeemable noncontrolling interests.
In June 2018, we signed a securities purchase agreement and a contribution and rollover agreement with investor entities controlled by Clayton, Dubilier & Rice ("CD&R") to sell our ownership interest in naviHealth. For more information on this divestiture see
Note 4
.
Share-Based Compensation
Share-based compensation provided to employees is recognized in the consolidated statements of earnings based on the grant date fair value of the awards. The fair value of stock options is determined on the grant date using a lattice valuation model. The fair value of restricted share units and performance share units is determined by the grant date market price of our common shares. The compensation expense associated with nonvested performance share units is dependent on our periodic assessment of the probability of the targets being achieved and our estimate, which may vary over time, of the number of shares that ultimately will be issued. The compensation expense recognized for share-based awards is net of estimated forfeitures and is recognized ratably over the service period of the awards. All income tax effects of share-based awards are recognized in the statement of earnings as awards vest or are settled. We classify share-based compensation expense in distribution, selling, general and administrative ("SG&A") expenses to correspond with the same line item as the majority of the cash compensation paid to employees. If awards are modified in connection with a restructuring activity, the incremental share-based compensation expense is classified in restructuring and employee severance. See
Note 17
for additional information regarding share-based compensation.
Dividends
We paid cash dividends per common share of
$1.85
,
$1.80
and
$1.55
in fiscal
2018
,
2017
and
2016
, respectively.
Revenue Recognition
We recognize revenue when persuasive evidence of an arrangement exists, product delivery has occurred or the services have been rendered, the price is fixed or determinable, and collectability is reasonably assured.
Pharmaceutical Segment
The Pharmaceutical segment recognizes distribution revenue when title transfers to its customers and we have no further obligation to provide services related to such merchandise.
Revenue for deliveries that are directly shipped to customers from the manufacturer when we act as an intermediary in the ordering and delivery of products is recorded gross. This is in accordance with accounting standards addressing reporting revenue on a gross basis as a principal versus on a net basis as an agent. This revenue is recorded on a gross basis since we incur credit risk from the customer, are primarily responsible for fulfillment, bear the risk of loss for incomplete shipments and do not receive a separate fee or commission for the transaction and, as such, are the primary obligor. Revenue from these sales is recognized when title transfers to the customer and we have no further obligation to provide services related to such merchandise.
Radiopharmaceutical revenue is recognized upon delivery of the product to the customer and we have no further obligation to provide services related to such merchandise.
Medical Segment
The Medical segment recognizes revenue when title transfers to its customers and we have no further obligation to provide services related to such products.
Sales Returns and Allowances
Revenue is recorded net of sales returns and allowances. Our customer return policies generally require that the product be physically returned, subject to restocking fees, in a condition suitable to be added back to inventory and resold at full value, or returned to vendors for credit (“merchantable product”). Product returns are generally consistent throughout the year and typically are not specific to any particular product or customer.
We accrue for estimated sales returns and allowances at the time of sale based upon historical customer return trends, margin rates and processing costs. Our accrual for sales returns is reflected as a reduction of revenue and cost of products sold for the sales price and cost, respectively. At
June 30, 2018
and
2017
, the accrual for estimated sales returns and allowances was
$479 million
and
$347 million
, respectively, the impact of which is reflected in trade receivables, net and inventories, net in the consolidated balance sheets. Sales returns and allowances were
$2.4 billion
,
$2.3 billion
and
$2.2 billion
, for fiscal
2018
,
2017
and
2016
, respectively.
Third-Party Returns
We generally do not accept non-merchantable pharmaceutical product returns from our customers, so many of our customers return non-merchantable pharmaceutical products to the manufacturer through third parties. Since our customers generally do not have a direct relationship with manufacturers, our vendors pass the value of such returns to us (usually in the form of an accounts payable
|
Cardinal Health
|
Fiscal 2018 Form 10-K
|
52
|
|
|
Notes to Financial Statements
|
||
deduction) for distribution to customers. We, in turn, pass the value received, less an administrative fee, to our customer. In certain instances, we pass the estimated value of the return to our customer prior to our receipt of the value from the vendor. Although we believe we have satisfactory protections, we could be subject to claims from customers or vendors if our administration of this overall process was deficient in some respect or our contractual terms with vendors are in conflict with our contractual terms with our customers. We have maintained reserves for some of these situations based on their nature and our historical experience with their resolution.
Shipping and Handling
Shipping and handling costs are primarily included in SG&A expenses in our consolidated statements of earnings. Shipping and handling costs include all delivery expenses as well as all costs to prepare the product for shipment to the end customer. Shipping and handling costs were
$543 million
,
$496 million
and
$504 million
, for fiscal
2018
,
2017
and
2016
, respectively. Revenue received for shipping and handling was immaterial for all periods presented.
Restructuring and Employee Severance
Restructuring activities are programs that are not part of the ongoing operations of our underlying business, such as closing and consolidating facilities, changing the way we manufacture or distribute our products, moving manufacturing of a product to another location, changes in production or business process outsourcing or insourcing, employee severance (including rationalizing headcount or other significant changes in personnel) and realigning operations (including realignment of the management structure in response to changing market conditions). See
Note 3
for additional information regarding our restructuring activities.
Amortization and Other Acquisition-Related Costs
We classify certain costs incurred in connection with acquisitions as amortization and other acquisition-related costs in our consolidated statements of earnings. These costs consist of amortization of acquisition-related intangible assets, transaction costs, integration costs and changes in the fair value of contingent consideration obligations. Transaction costs are incurred during the initial evaluation of a potential acquisition and primarily relate to costs to analyze, negotiate and consummate the transaction as well as due diligence activities. Integration costs relate to activities required to combine the operations of an acquired enterprise into our operations and, in the case of the Cordis and Patient Recovery businesses, to stand-up the systems and processes needed to support an expanded geographic footprint. We record changes in the fair value of contingent consideration obligations relating to acquisitions as income or expense in amortization and other acquisition-related costs. See
Note 5
for additional information regarding amortization of acquisition-related intangible assets and
Note 11
for additional information regarding contingent consideration.
Translation of Foreign Currencies
Financial statements of our subsidiaries outside the United States are generally measured using the local currency as the functional currency. Adjustments to translate the assets and liabilities of these foreign subsidiaries into U.S. dollars are accumulated in
shareholders’ equity through AOCI utilizing period-end exchange rates. Revenues and expenses of these foreign subsidiaries are translated using average exchange rates during the year.
The foreign currency translation gains/(losses) included in AOCI at
June 30, 2018
and
2017
are presented in
Note 14
. Foreign currency transaction gains and losses for the period are included in the consolidated statements of earnings in the respective financial statement line item.
Interest Rate, Currency and Commodity Risk
All derivative instruments are recognized at fair value on the consolidated balance sheets and all changes in fair value are recognized in net earnings or shareholders’ equity through AOCI, net of tax.
For contracts that qualify for hedge accounting treatment, the hedge contracts must be effective at reducing the risk associated with the exposure being hedged and must be designated as a hedge at the inception of the contract. Hedge effectiveness is assessed periodically. Any contract not designated as a hedge, or so designated but ineffective, is adjusted to fair value and recognized immediately in net earnings. If a fair value or cash flow hedge ceases to qualify for hedge accounting treatment, the contract continues to be carried on the balance sheet at fair value until settled and future adjustments to the contract’s fair value are recognized immediately in net earnings. If a forecasted transaction is probable not to occur, amounts previously deferred in AOCI are recognized immediately in net earnings. See
Note 12
for additional information regarding our derivative instruments, including the accounting treatment for instruments designated as fair value, cash flow and economic hedges.
Fair Value Measurements
Fair value is defined as the price that would be received upon selling an asset or the price paid to transfer a liability on the measurement date. It focuses on the exit price in the principal or most advantageous market for the asset or liability in an orderly transaction between willing market participants. A three-tier fair value hierarchy is established as a basis for considering such assumptions and for inputs used in the valuation methodologies in measuring fair value. This hierarchy requires entities to maximize the use of observable inputs and minimize the use of unobservable inputs. The three levels of inputs used to measure fair values are:
|
Level 1 -
|
Observable prices in active markets for identical assets and liabilities.
|
|
Level 2 -
|
Observable inputs other than quoted prices in active markets for identical assets and liabilities.
|
|
Level 3 -
|
Unobservable inputs that are supported by little or no market activity and that are significant to the fair value of the assets and liabilities.
|
See
Note 11
for additional information regarding fair value measurements.
Recent Financial Accounting Standards
In March 2018, the Financial Accounting Standards Board (the "FASB") issued amended accounting guidance to codify guidance
|
53
|
Cardinal Health
|
Fiscal 2018 Form 10-K
|
|
|
Notes to Financial Statements
|
||
pursuant to SEC staff accounting bulletin 118 (“SAB 118”), which was issued in connection with the Tax Cuts and Jobs Act (the “Tax Act”) of December 2017. The guidance allows companies to use provisional estimates to record the effects of the Tax Act and also provides a measurement period (not to exceed one year from the date of enactment) to complete the accounting for the impacts of the Tax Act. We adopted this guidance in the second quarter of fiscal 2018 when it was initially issued as SAB 118. We are still completing our accounting for the tax effects of the Tax Act because all the necessary information is not currently available, prepared, or analyzed. As such, we have made reasonable estimates of the effects of the Tax Act on our financial results. As we complete our analysis of the accounting for the tax effects of enactment of the Tax Act, we may record additional provisional amounts or adjustments to provisional amounts as discrete items in future periods. See
Note 8
for additional information regarding income taxes.
In August 2017, the FASB issued accounting guidance which is intended to improve and simplify accounting rules around hedge accounting. The guidance will be effective for us in the first quarter of fiscal 2020 and early adoption is permitted. While we are currently evaluating the timing of adoption, we do not expect the impact of this standard to have a material impact on our consolidated financial statements.
In March 2016, the FASB issued amended accounting guidance that changed the accounting for certain aspects of share-based compensation to employees. The guidance requires all income tax effects of share-based awards to be recognized in the statement of earnings as awards vest or are settled. Additionally, the guidance increases the amount employers can withhold in shares to cover employee income taxes without requiring liability classification and allows a policy election for accounting for forfeitures. The primary impact of adoption is the recognition of excess tax benefits in the statement of earnings on a prospective basis, rather than as a component of equity. The impact on the presentation in the consolidated statement of cash flows is also prospective. We adopted this guidance in the first quarter of fiscal 2018. The impact of adoption on the provision for/(benefit from) income taxes on our consolidated statement of earnings was immaterial. The inclusion of excess tax benefits and deficiencies as a component of our income tax expense will increase volatility within our provision for/(benefit from) income taxes as the amount of excess tax benefits or deficiencies from share-
based compensation awards depends on our stock price at the date the awards vest or settle.
In February 2016, the FASB issued amended accounting guidance that requires lessees to recognize most leases on the balance sheet as a lease liability and corresponding right-of-use asset. The guidance also requires disclosures that meet the objective of enabling financial statement users to assess the amount, timing, and uncertainty of cash flows arising from leases. This guidance will be effective for us in the first quarter of fiscal 2020 and we expect to elect the practical expedient which will allow us to not apply the amended lease accounting guidance to comparative periods that will be presented. The majority of our lease spend relates to certain real estate with the remaining lease spend primarily related to equipment.
We are continuing to evaluate the impact of this standard on our consolidated financial statements and the methods of adoption.
In May 2014, the FASB issued amended accounting guidance related to revenue recognition which is effective for us in the first quarter of fiscal 2019. This guidance is based on the principle that revenue is recognized in an amount that reflects the consideration to which an entity expects to be entitled in exchange for the transfer of goods or services to customers. The guidance also requires additional disclosure about the nature, amount, timing, and uncertainty of revenue and cash flows arising from customer contracts, including significant judgments and changes in judgments and assets recognized from costs incurred to obtain or fulfill a contract. The FASB also subsequently issued several amendments to the standard, including clarification on principal versus agent considerations, performance obligations and licensing, and certain scope improvements and practical expedients.
During fiscal 2018 we finalized our evaluation and assessment of the amended revenue recognition guidance. Our revenue is primarily distribution revenue, which we recognize at a point in time when title transfers to customers and we have no further obligation to provide services related to such merchandise. The timing of recognition of our distribution revenue will be unchanged under the amended guidance. The adoption of the amended accounting guidance will not have a material impact on our consolidated financial statements.
In May 2017, the FASB issued final guidance that clarifies when changes to the terms or conditions of a share-based payment award must be accounted for as modifications. Entities will apply the modification accounting guidance if the value, vesting conditions or classification of the award changes. This guidance will be effective for us in the first quarter of fiscal 2019 and the impact of this new guidance is dependent on future events.
In February 2017, the FASB clarified the guidance on how to account for the derecognition of nonfinancial assets (e.g., real estate, land, buildings, intangibles) and in-substance nonfinancial assets once an entity adopts the new revenue recognition guidance that is discussed in more detail above. The guidance also defines what constitutes an in-substance nonfinancial asset. This guidance will be effective for us in the first quarter of fiscal 2019. We anticipate the adoption of this guidance will not impact our consolidated financial statements.
In January 2017, the FASB issued amended accounting guidance that simplifies the accounting for goodwill impairment by eliminating the step of measuring a goodwill impairment by estimating the implied fair value of goodwill. Instead, goodwill impairment will be measured as the amount by which the reporting unit’s carrying value exceeds its fair value, limited to the carrying value of the goodwill.
We adopted this guidance in the second quarter of fiscal 2018. During the fourth quarter of fiscal 2018, we measured the Medical Unit's impairment at the amount by which the reporting unit's carrying value exceeded its fair value, resulting in an impairment charge of
$1.4 billion
. Refer to
Note 5
for further discussion.
Also in January 2017, the FASB issued new accounting guidance that changes the definition of a business when evaluating whether a set of transferred assets and activities is considered a business. This
|
Cardinal Health
|
Fiscal 2018 Form 10-K
|
54
|
|
|
Notes to Financial Statements
|
||
guidance will be effective for us in the first quarter of fiscal 2019. The impact of adoption is dependent on future events.
In October 2016, the FASB issued amended accounting guidance that requires an entity to recognize the income tax effect of intercompany sales and transfers of assets other than inventory at the time that the transfer occurs rather than when the asset is sold to a third party. This amendment will be effective for us in the first quarter of fiscal 2019. We are currently evaluating the impact of this standard on our consolidated financial statements.
In August 2016, the FASB issued accounting guidance which clarifies the classification of certain cash receipts and cash payments in the statement of cash flows, including those related to contingent consideration payments made after a business combination, distributions received from equity method investees, debt prepayment or debt extinguishment costs and proceeds from the settlement of insurance claims. This guidance will be effective for us in the first quarter of fiscal 2019. We are currently evaluating the impact of this standard on our consolidated financial statements.
In June 2016, the FASB issued amended accounting guidance that will require entities to measure credit losses on trade and other receivables, held-to-maturity debt securities, loans and other instruments using an "expected credit loss" model that considers historical experience, current conditions and reasonable supportable forecasts. This guidance also requires that credit losses on available-for-sale debt securities with unrealized losses be recognized as allowances rather than as deductions in the amortized cost of the securities. This guidance will be effective for us in the first quarter of fiscal 2021. We are currently evaluating the impact of adoption on our consolidated financial statements.
2. Acquisitions
D
uring fiscal
2018
, we completed several acquisitions, the most significant of which is the Patient Recovery Business described in more detail below. T
he pro forma results of operations and the results of operations for acquired businesses since the acquisition dates have not been separately disclosed because the effects were not significant compared to the consolidated financial statements, individually or in the aggregate.
Patient Recovery Business
On July 29, 2017, we acquired the Patient Care, Deep Vein Thrombosis, and Nutritional Insufficiency businesses (the "Patient Recovery Business") from Medtronic plc for
$6.1 billion
in cash. The Patient Recovery Business manufactures
23
categories of medical products sold into multiple healthcare channels. The acquisition further expanded the Medical segment's portfolio of self-manufactured products. We closed the Patient Recovery Business acquisition in
28
principal countries on July 29, 2017, and acquired control of, for GAAP purposes, and the rights to the net economic benefit from the entire Patient Recovery Business in the remaining countries at the closing. We are in the process of transitioning legal ownership in the remaining non-principal countries, which we expect to complete in early calendar 2019.
The results for the entire Patient Recovery Business in all countries are included in the consolidated financial statements beginning July 29, 2017. We funded the acquisition through
$4.5 billion
in long-term debt, existing cash and borrowings under our existing credit arrangements.
Transaction and integration costs associated with the acquisition of the Patient Recovery business were
$109 million
during the fiscal year ended
June 30, 2018
and are included in amortization and other acquisition-related costs in the consolidated statements of earnings.
Fair Value of Assets Acquired and Liabilities Assumed
The allocation of the purchase price for the acquisition of the Patient Recovery Business is not yet finalized and is subject to adjustment as we complete the valuation analysis for this acquisition.
The valuation of identifiable intangible assets utilizes significant unobservable inputs and thus represents a Level 3 nonrecurring fair value measurement. The estimated fair value of the identifiable intangible assets was determined using income-based approaches, which includes market participant expectations of the cash flows that an asset could generate over its economic life, discounted back to present value using an appropriate rate of return. The weighted- average discount rate used to arrive at the present value of the identifiable intangible assets was
8.0
percent, and considers the inherent risk of each intangible asset relative to the internal rate of return and weighted-average cost of capital.
The following table summarizes the estimated fair value of the assets acquired and liabilities assumed as of the acquisition date for the Patient Recovery Business:
|
(in millions)
|
Patient Recovery Business
|
||
|
Identifiable intangible assets:
|
|||
|
Customer relationships (1)
|
$
|
1,733
|
|
|
Trade names (2)
|
187
|
|
|
|
Developed technology and other (3)
|
732
|
|
|
|
Total identifiable intangible assets acquired
|
2,652
|
|
|
|
Cash and equivalents
|
22
|
|
|
|
Inventories
|
425
|
|
|
|
Prepaid expenses and other
|
252
|
|
|
|
Property and equipment, net
|
741
|
|
|
|
Other accrued liabilities
|
(322
|
)
|
|
|
Deferred income taxes and other liabilities
|
(982
|
)
|
|
|
Total identifiable net assets acquired/(liabilities assumed)
|
2,788
|
|
|
|
Goodwill
|
3,292
|
|
|
|
Total net assets acquired
|
$
|
6,080
|
|
|
(1)
|
The range of useful lives for customer relationships is
10
to
18
years.
|
|
(2)
|
The useful life of trade names is
15
years.
|
|
(3)
|
The useful life of developed technology is
15
years.
|
|
55
|
Cardinal Health
|
Fiscal 2018 Form 10-K
|
|
|
Notes to Financial Statements
|
||
3. Restructuring and Employee Severance
The following tables summarize restructuring and employee severance costs:
|
(in millions)
|
2018
|
2017
|
2016
|
||||||||
|
Employee-related costs (1)
|
$
|
34
|
|
$
|
51
|
|
$
|
15
|
|
||
|
Facility exit and other costs (2)
|
142
|
|
5
|
|
10
|
|
|||||
|
Total restructuring and employee severance
|
$
|
176
|
|
$
|
56
|
|
$
|
25
|
|
||
|
(1)
|
Employee-related costs primarily consist of termination benefits provided to employees who have been involuntarily terminated and duplicate payroll costs during transition periods.
|
|
(2)
|
Facility exit and other costs primarily consist of product distribution and lease contract termination costs, accelerated depreciation, equipment relocation costs, project consulting fees and costs associated with restructuring our delivery of information technology infrastructure services.
|
In September 2017, we entered into an agreement to transition the distribution of our Medical segment's surgeon gloves in certain international markets from a third-party distribution arrangement to a direct distribution model. The costs with this restructuring include
$125 million
, on a pre-tax basis, of contract termination costs which have been paid and are reflected in facility exit and other costs in the consolidated statement of earnings during the fiscal year ended 2018.
The following table summarizes activity related to liabilities associated with restructuring and employee severance:
|
(in millions)
|
Employee-
Related Costs
|
Facility Exit
and Other Costs
|
Total
|
||||||||
|
Balance at June 30, 2016
|
$
|
15
|
|
$
|
1
|
|
$
|
16
|
|
||
|
Additions
|
43
|
|
1
|
|
44
|
|
|||||
|
Payments and other adjustments
|
(17
|
)
|
(2
|
)
|
(19
|
)
|
|||||
|
Balance at June 30, 2017
|
41
|
|
—
|
|
41
|
|
|||||
|
Additions
|
19
|
|
131
|
|
150
|
|
|||||
|
Payments and other adjustments
|
(36
|
)
|
(127
|
)
|
(163
|
)
|
|||||
|
Balance at June 30, 2018
|
$
|
24
|
|
$
|
4
|
|
$
|
28
|
|
||
4. Divestitures and Assets Held for Sale
China Divestiture
In February 2018, we sold our pharmaceutical and medical products distribution business in China ("China distribution business") for proceeds of
$861 million
(after adjusting for third party indebtedness and preliminary transaction adjustments) to Shanghai Pharmaceuticals Holding Co., Ltd. The proceeds are not reflective of tax obligations due in connection with the sale, for which we have recorded a liability of
$59 million
. The purchase price is subject to adjustment based on working capital requirements as set forth in the definitive agreement, which would impact the loss related to this divestiture.
We determined that the sale of the China distribution business does not meet the criteria to be classified as discontinued operations. The China distribution business primarily operated within our Pharmaceutical segment, and a smaller portion operated within our Medical segment.
During the fiscal year ended 2018, we recognized a pre-tax loss of
$41 million
related to this divestiture.
naviHealth Assets Held for Sale
In June 2018, we entered into a Securities Purchase Agreement and related Contribution and Rollover Agreement with investor entities controlled by CD&R. Pursuant to those agreements, on August 1, 2018, we sold our
98%
ownership interest in naviHealth Holdings, LLC in exchange for proceeds of
$736 million
(after adjusting for certain fees and expenses) and a
44%
equity interest in a partnership that owns
100%
of the equity interest of naviHealth. We also have certain call rights to reacquire naviHealth.
Upon signing the agreement, we met the criteria for the related assets and liabilities of naviHealth to be classified as held for sale. At June 30, 2018, we determined that the fair value less cost to sell exceeded the book value of the disposal group and there were no other indicators of asset impairment. We recognized a provisional tax benefit of
$12 million
related to the transaction during the three months ended June 30, 2018. See
Note 8
for additional information regarding income taxes. We determined that the sale of naviHealth does not meet the criteria to be classified as discontinued operations. The naviHealth business operated within our Medical segment.
The following table presents information related to the assets and liabilities that were classified as held for sale at June 30, 2018 in the consolidated balance sheets:
|
(in millions)
|
June 30, 2018
|
|||
|
Trade Receivables, net
|
$
|
74
|
|
|
|
Goodwill and other intangibles, net
|
642
|
|
||
|
Other assets
|
40
|
|
||
|
Total assets held for sale
|
$
|
756
|
|
|
|
Deferred revenue
|
35
|
|
||
|
Deferred income taxes
|
38
|
|
||
|
Other liabilities
|
140
|
|
||
|
Total liabilities related to assets held for sale
|
$
|
213
|
|
|
|
Cardinal Health
|
Fiscal 2018 Form 10-K
|
56
|
|
|
Notes to Financial Statements
|
||
5. Goodwill and Other Intangible Assets
Goodwill
The following table summarizes the changes in the carrying amount of goodwill by segment and in total:
|
(in millions)
|
Pharmaceutical (1)
|
Medical (2)
|
Total
|
||||||||
|
Balance at June 30, 2016
|
$
|
2,919
|
|
$
|
4,248
|
|
$
|
7,167
|
|
||
|
Goodwill acquired, net of purchase price adjustments
|
29
|
|
35
|
|
64
|
|
|||||
|
Foreign currency translation adjustments and other
|
(9
|
)
|
(1
|
)
|
(10
|
)
|
|||||
|
Balance at June 30, 2017
|
2,939
|
|
4,282
|
|
7,221
|
|
|||||
|
Goodwill acquired, net of purchase price adjustments
|
1
|
|
3,342
|
|
3,343
|
|
|||||
|
Foreign currency translation adjustments and other
|
28
|
|
6
|
|
34
|
|
|||||
|
Goodwill divested with the sale of our China distribution business
|
(347
|
)
|
(54
|
)
|
(401
|
)
|
|||||
|
naviHealth goodwill reclassified to assets held for sale
|
—
|
|
(509
|
)
|
(509
|
)
|
|||||
|
Impairment
|
—
|
|
(1,372
|
)
|
(1,372
|
)
|
|||||
|
Balance at June 30, 2018
|
$
|
2,621
|
|
$
|
5,695
|
|
$
|
8,316
|
|
||
|
(1)
|
At
June 30, 2018
and 2017, the Pharmaceutical segment accumulated goodwill impairment loss was
$829 million
.
|
|
(2)
|
At
June 30, 2018
, the Medical segment accumulated goodwill impairment loss was
$1.4 billion
. The Medical segment had no accumulated goodwill impairment loss at June 30, 2017.
|
The increase in the Medical segment goodwill during fiscal 2018 is primarily due to the Patient Recovery Business acquisition. Goodwill recognized in connection with the Patient Recovery Business acquisition primarily represents the expected benefits from certain synergies of integrating the business, the existing workforce of the acquired entity, and the expected growth from new customers. See
Note 2
for further discussion of this acquisition.
In conjunction with the preparation of our consolidated financial statements for fiscal 2018, we recently completed our annual quantitative goodwill impairment test, which we perform annually in the fourth quarter. This quantitative test resulted in a
$1.4 billion
goodwill impairment charge related to our Medical Unit, which is included in impairments and loss on disposal of assets in our consolidated statements of earnings. The impairment was primarily driven by inventory and cost challenges within our Cordis business which furthered in the fourth quarter of fiscal 2018. This impairment charge does not impact our liquidity, cash flows from operations, or compliance with debt covenants. There was no tax benefit related to the goodwill impairment charge. The goodwill balance for our Medical Unit, after recognizing the impairment, was
$4.3 billion
at June 30, 2018.
Using a combination of income and market-based approaches (using a discount rate of
8.5 percent
), the carrying amount exceeded the fair value and resulted in an impairment of
$1.4 billion
for the Medical unit. Our fair value estimates utilize significant unobservable inputs and thus represent Level 3 fair value measurements.
During fiscal 2018, goodwill was also reduced by
$401 million
and
$509 million
in connection with the sale of our China distribution
business and reclassification of naviHealth's assets and liabilities to held for sale, respectively.
See
Note 4
for further discussion of this divestiture and assets held for sale.
Other Intangible Assets
The following tables summarize other intangible assets by class at June 30:
|
2018
|
|||||||||||||
|
(in millions)
|
Gross
Intangible
|
Accumulated
Amortization
|
Net
Intangible
|
Weighted- Average Remaining Amortization Period (Years)
|
|||||||||
|
Indefinite-life intangibles:
|
|||||||||||||
|
IPR&D, trademarks and other
|
$
|
62
|
|
$
|
—
|
|
$
|
62
|
|
N/A
|
|||
|
Total indefinite-life intangibles
|
62
|
|
—
|
|
62
|
|
N/A
|
||||||
|
Definite-life intangibles:
|
|||||||||||||
|
Customer relationships
|
3,513
|
|
1,191
|
|
2,322
|
|
15
|
||||||
|
Trademarks, trade names and patents
|
667
|
|
246
|
|
421
|
|
15
|
||||||
|
Developed technology and other
|
1,562
|
|
454
|
|
1,108
|
|
12
|
||||||
|
Total definite-life intangibles
|
5,742
|
|
1,891
|
|
3,851
|
|
14
|
||||||
|
Total other intangible assets
|
$
|
5,804
|
|
$
|
1,891
|
|
$
|
3,913
|
|
N/A
|
|||
|
2017
|
|||||||||||
|
(in millions)
|
Gross
Intangible
|
Accumulated
Amortization
|
Net
Intangible
|
||||||||
|
Indefinite-life intangibles:
|
|||||||||||
|
IPR&D, trademarks and other
|
$
|
61
|
|
$
|
—
|
|
$
|
61
|
|
||
|
Total indefinite-life intangibles
|
61
|
|
—
|
|
61
|
|
|||||
|
Definite-life intangibles:
|
|||||||||||
|
Customer relationships
|
1,966
|
|
967
|
|
999
|
|
|||||
|
Trademarks, trade names and patents
|
509
|
|
195
|
|
314
|
|
|||||
|
Developed technology and other
|
916
|
|
304
|
|
612
|
|
|||||
|
Total definite-life intangibles
|
3,391
|
|
1,466
|
|
1,925
|
|
|||||
|
Total other intangible assets
|
$
|
3,452
|
|
$
|
1,466
|
|
$
|
1,986
|
|
||
Total amortization of intangible assets was
$574 million
,
$395 million
and
$355 million
for fiscal
2018
,
2017
and
2016
, respectively. The estimated annual amortization for intangible assets for fiscal
2019
through
2023
is as follows:
$529 million
,
$501 million
,
$430 million
,
$398 million
and
$348 million
.
During fiscal 2018, other intangible assets were reduced by
$62 million
and
$133 million
in connection with the sale of our China distribution business and reclassification of naviHealth's assets and liabilities to held for sale, respectively.
|
57
|
Cardinal Health
|
Fiscal 2018 Form 10-K
|
|
|
Notes to Financial Statements
|
||
See
Note 4
for further discussions of this divestiture and assets held for sale.
6. Available-for-Sale Securities
We invest in marketable securities, which are classified as available-for-sale and are carried at fair value in the consolidated balance sheets. We held the following investments in marketable securities at fair value at June 30:
|
(in millions)
|
2018
|
2017
|
|||||
|
Current available-for-sale securities:
|
|||||||
|
Treasury bills
|
—
|
|
25
|
|
|||
|
International bonds
|
—
|
|
3
|
|
|||
|
Corporate bonds
|
—
|
|
30
|
|
|||
|
U.S. agency bonds
|
—
|
|
3
|
|
|||
|
Asset-backed securities
|
—
|
|
3
|
|
|||
|
International equity securities
|
—
|
|
1
|
|
|||
|
Total available-for-sale securities
|
$
|
—
|
|
$
|
65
|
|
|
In July 2017, we liquidated our marketable securities. There were no unrealized gains or losses at
June 30, 2018
and unrealized gains and losses were immaterial at
June 30, 2017
. During fiscal
2018
,
2017
and
2016
, gross realized gains and losses were immaterial and we did not recognize any other-than-temporary-impairments.
7. Long-Term Obligations and Other Short-Term Borrowings
The following table summarizes long-term obligations and other short-term borrowings at June 30:
|
(in millions) (1)
|
2018
|
2017
|
|||||
|
1.7% Notes due 2018
|
$
|
—
|
|
$
|
400
|
|
|
|
1.95% Notes due 2018
|
—
|
|
547
|
|
|||
|
1.948% Notes due 2019
|
998
|
|
996
|
|
|||
|
2.4% Notes due 2019
|
448
|
|
453
|
|
|||
|
4.625% Notes due 2020
|
514
|
|
519
|
|
|||
|
2.616% Notes due 2022
|
1,143
|
|
1,142
|
|
|||
|
3.2% Notes due 2022
|
243
|
|
248
|
|
|||
|
Floating Rate Notes due 2022
|
348
|
|
347
|
|
|||
|
3.2% Notes due 2023
|
525
|
|
544
|
|
|||
|
3.079% Notes due 2024
|
742
|
|
744
|
|
|||
|
3.5% Notes due 2024
|
390
|
|
396
|
|
|||
|
3.75% Notes due 2025
|
460
|
|
481
|
|
|||
|
3.41% Notes due 2027
|
1,340
|
|
1,340
|
|
|||
|
4.6% Notes due 2043
|
346
|
|
346
|
|
|||
|
4.5% Notes due 2044
|
342
|
|
341
|
|
|||
|
4.9% Notes due 2045
|
445
|
|
445
|
|
|||
|
4.368% Notes due 2047
|
594
|
|
594
|
|
|||
|
7.0% Debentures due 2026
|
124
|
|
124
|
|
|||
|
Other obligations
|
11
|
|
388
|
|
|||
|
Total
|
9,013
|
|
10,395
|
|
|||
|
Less: current portion of long-term obligations and other short-term borrowings
|
1,001
|
|
1,327
|
|
|||
|
Long-term obligations, less current portion
|
$
|
8,012
|
|
$
|
9,068
|
|
|
(1) Maturities are presented on a calendar year basis.
Maturities of existing long-term obligations and other short-term borrowings for fiscal
2019
through
2023
and thereafter are as follows:
$1.0 billion
,
$452 million
,
$516 million
,
$1.7 billion
,
$526 million
and
$4.8 billion
.
|
Cardinal Health
|
Fiscal 2018 Form 10-K
|
58
|
|
|
Notes to Financial Statements
|
||
All the notes represent unsecured obligations of Cardinal Health, Inc. and rank equally in right of payment with all of our existing and future unsecured and unsubordinated indebtedness. The
7.0%
Debentures represent unsecured obligations of Allegiance Corporation (a wholly-owned subsidiary), which Cardinal Health, Inc. has guaranteed. None of these obligations are subject to a sinking fund and the Allegiance obligations are not redeemable prior to maturity. Interest is paid pursuant to the terms of the obligations. These notes are effectively subordinated to the liabilities of our subsidiaries, including trade payables of
$19.7 billion
.
In June 2018, we repaid the full principal of the 1.95% Notes due 2018 at maturity for
$550 million
. In July 2017, we redeemed the 1.7% Notes due 2018 early in full with a portion of the proceeds from the June 2017 issuance for
$400 million
.
In June 2017, we issued additional debt with the aggregate principal amount of
$5.2 billion
to fund a portion of the acquisition of the
Patient Recovery Business
from Medtronic, which closed on
July 29, 2017
, to redeem the
1.7%
Notes due 2018
and for general corporate purposes. The notes issued in conjunction with the acquisition are
1.948%
Notes due 2019,
2.616%
Notes due 2022,
3.079%
Notes due 2024,
3.41%
Notes due 2027,
4.368%
Notes due 2047, and floating rate Notes due 2022. The amount of the notes issued net of discounts, premiums, mark-to-market of any interest rate swaps and debt issuance costs was
$5.2 billion
.
If we undergo a change of control, as defined in the notes, and if the notes receive specified ratings below investment grade by each of Standard & Poors Ratings Services, Moody’s Investors Services and Fitch Ratings, any holder of the notes, excluding the debentures, can require with respect to the notes owned by such holder, or we can offer, to repurchase the notes at
101%
of the principal amount plus accrued and unpaid interest.
Other Financing Arrangements
In addition to cash and equivalents and operating cash flow, other sources of liquidity include a
$2.0 billion
revolving credit facility and a
$1.0 billion
committed receivables sales facility program, which we increased in August 2017 from
$1.75 billion
to
$2.0 billion
. In November 2016, we renewed our committed receivables sales facility program through Cardinal Health Funding, LLC (“CHF”) through November 1, 2019. CHF was organized for the sole purpose of buying receivables and selling undivided interests in those receivables to third-party purchasers. Although consolidated with Cardinal Health, Inc. in accordance with GAAP, CHF is a separate legal entity from Cardinal Health, Inc. and from our subsidiary that sells receivables to CHF. CHF is designed to be a special purpose, bankruptcy-remote entity whose assets are available solely to satisfy the claims of its creditors.
We also maintain a
$2.0 billion
commercial paper program backed by a
$2.0 billion
revolving credit facility. At
June 30, 2018
, we had no amounts outstanding under the revolving credit facility; however, availability was reduced by outstanding letters of credit of
$24 million
and
$20 million
at
June 30, 2018
and
2017
, respectively. We also had no amounts outstanding under the committed receivables sales facility program; however, availability was reduced by outstanding
standby letters of credit of
$34 million
and
$46 million
at
June 30, 2018
and
2017
, respectively. Under our commercial paper and committed receivables programs, we had a maximum amount outstanding of
$1.7 billion
and an average daily amount outstanding of
$277 million
during fiscal
2018
. We had no amounts outstanding under the commercial paper program as of
June 30, 2018
.
Our revolving credit facility and committed receivables sales facility program require us to maintain, as of the end of any calendar quarter, a consolidated leverage ratio of no more than
4.25
-to-1, which will reduce to 3.25-to-1 in March 2019. As of
June 30, 2018
, we were in compliance with these financial covenants.
We also maintain other short-term credit facilities and an unsecured line of credit that allowed for borrowings up to
$8 million
and
$690 million
at
June 30, 2018
and
2017
, respectively. The
$11 million
and
$388 million
balance of other obligations at
June 30, 2018
and
2017
, respectively, consisted of short-term borrowings and capital leases.
In fiscal 2018 we sold our China distribution business, including its debt which was
$378 million
as of June 30, 2017. See
Note 4
for further discussion of this divestiture.
8. Income Taxes
Earnings/(loss) before Income Taxes and Provision for Income Taxes
The following table summarizes earnings/(loss) before income taxes:
|
(in millions)
|
2018
|
2017
|
2016
|
||||||||
|
U.S. operations
|
$
|
391
|
|
$
|
1,772
|
|
$
|
2,050
|
|
||
|
Non-U.S. operations
|
(619
|
)
|
152
|
|
226
|
|
|||||
|
Earnings/(loss) before income taxes
|
$
|
(228
|
)
|
$
|
1,924
|
|
$
|
2,276
|
|
||
The following table summarizes the components of provision for/(benefit from) income taxes:
|
(in millions)
|
2018
|
2017
|
2016
|
||||||||
|
Current:
|
|||||||||||
|
Federal
|
$
|
341
|
|
$
|
273
|
|
$
|
633
|
|
||
|
State and local
|
41
|
|
10
|
|
52
|
|
|||||
|
Non-U.S.
|
143
|
|
56
|
|
73
|
|
|||||
|
Total current
|
$
|
525
|
|
$
|
339
|
|
$
|
758
|
|
||
|
Deferred:
|
|||||||||||
|
Federal
|
$
|
(1,003
|
)
|
$
|
258
|
|
$
|
96
|
|
||
|
State and local
|
16
|
|
37
|
|
12
|
|
|||||
|
Non-U.S.
|
(25
|
)
|
(4
|
)
|
(21
|
)
|
|||||
|
Total deferred
|
(1,012
|
)
|
291
|
|
87
|
|
|||||
|
Provision for/(benefit from) income taxes
|
$
|
(487
|
)
|
$
|
630
|
|
$
|
845
|
|
||
|
59
|
Cardinal Health
|
Fiscal 2018 Form 10-K
|
|
|
Notes to Financial Statements
|
||
Effective Tax Rate
The following table presents a reconciliation of the provision based on the federal statutory income tax rate to our effective income tax rate:
|
|
2018 (1)
|
2017 (2)
|
2016 (2)
|
|||||
|
Provision at Federal statutory rate
|
28.1
|
%
|
35.0
|
%
|
35.0
|
%
|
||
|
State and local income taxes, net of federal benefit
|
(16.0
|
)
|
1.0
|
|
1.5
|
|
||
|
Foreign tax rate differential
|
(48.4
|
)
|
(7.3
|
)
|
(0.6
|
)
|
||
|
Nondeductible/nontaxable items
|
(10.2
|
)
|
0.2
|
|
1.0
|
|
||
|
Goodwill impairment
|
(124.7
|
)
|
—
|
|
—
|
|
||
|
Tax Act
|
410.9
|
|
—
|
|
—
|
|
||
|
Capital loss
|
71.4
|
|
—
|
|
—
|
|
||
|
Change in valuation allowances
|
(76.9
|
)
|
7.7
|
|
0.1
|
|
||
|
Foreign tax credits
|
27.3
|
|
(1.6
|
)
|
(0.1
|
)
|
||
|
China tax related to divestiture
|
(25.8
|
)
|
—
|
|
—
|
|
||
|
Other
|
(21.9
|
)
|
(2.3
|
)
|
0.2
|
|
||
|
Effective income tax rate
|
213.8
|
%
|
32.7
|
%
|
37.1
|
%
|
||
|
(1)
|
The effective income tax rate for fiscal 2018 represents an income tax benefit tax rate.
|
|
(2)
|
The effective income tax rates for fiscal 2017 and 2016 represents income tax expense tax rates.
|
The income tax benefit rate in fiscal 2018 was
213.8%
compared to income tax expense rates of
32.7%
in fiscal 2017 and
37.1%
in fiscal 2016. Fluctuations in the effective tax rates are primarily due to net benefits from the enactment of the Tax Act, the impact of nondeductible goodwill impairment charges, and a benefit from a capital loss due to international legal entity reorganization. There were also changes in valuation allowances related to capital losses, credit carryforwards and net operating loss carryforwards in U.S. federal, U.S. state and international jurisdictions.
On December 22, 2017, the United States enacted the Tax Act.
The Tax Act makes broad and complex changes to the U.S. tax code that affect our fiscal year 2018 financial results in two primary ways. First, effective as of January 1, 2018, the Tax Act reduces the U.S. federal corporate tax rate from 35 percent to 21 percent. Second, it requires companies to pay a one-time U.S. repatriation tax on certain undistributed earnings of foreign subsidiaries.
Because our fiscal year ends in June, we have a blended U.S. Federal statutory tax rate for fiscal 2018 of
28.1
percent under the Tax Act.
The Tax Act also establishes new tax provisions that will affect us beginning July 1, 2018 including, (1) eliminating the U.S. manufacturing deduction; (2) establishing new limitations on deductible interest expense and certain executive compensation; (3) eliminating the corporate alternative minimum tax; (4) creating the base erosion anti-abuse tax; (5) creating a new provision designed to tax global intangible low-tax income (“GILTI”); (6) generally eliminating U.S. federal income taxes on dividends from foreign subsidiaries; and (7) changing rules related to uses and limitations of net operating loss carryforwards created in tax years beginning after December 31, 2017.
Regarding the new GILTI tax rules, we are allowed to make an accounting policy election to either (1) treat taxes due on future GILTI
exclusions in U.S. taxable income as a current period expense when incurred or (2) reflect such portion of the future GILTI exclusions in U.S. taxable income that relate to existing basis differences in our measurement of deferred taxes. Our analysis of the new GILTI rules and how they may impact us is incomplete. Accordingly, we have not made a policy election regarding the treatment of the GILTI tax.
As a result of the enactment of a lower tax rate, we remeasured our U.S. deferred tax assets and liabilities based on the rates at which they are expected to reverse in the future. While we are still analyzing certain aspects of the Tax Act and refining our calculations, we have recorded a provisional net benefit of
$977 million
related to this required remeasurement. The provisional estimate is based on currently available information related to deferred tax assets and liabilities which is subject to change as additional information becomes available, prepared, and analyzed.
At
June 30, 2018
, we had
$110 million
of undistributed earnings from non-U.S. subsidiaries.
In connection with the required one-time U.S. repatriation tax on undistributed earnings of foreign subsidiaries, we recorded a provisional tax expense of
$41 million
which may change when our calculation is complete. The Tax Act permits the payment of this tax in eight installments over an eight-year period beginning in fiscal 2019. Though these foreign earnings have been deemed to be repatriated from a U.S. federal tax perspective, we have not yet completed our assessment of the Tax Act on our plans to reinvest foreign earnings and as such have not changed our prior conclusion that the earnings are indefinitely reinvested. The repatriation tax is based on currently available information and technical guidance related to the new tax law. The provisional estimate will be updated when additional information related to undistributed foreign earnings, foreign taxes and foreign cash and equivalents becomes available, prepared and analyzed.
Our effective tax rate was unfavorably impacted by goodwill impairment charges related to our Medical operating segment for the portion attributable to nondeductible goodwill for income tax purposes.
On June 28, 2018, we executed an international legal entity reorganization. This transaction resulted in a US capital loss and a tax benefit of
$163 million
. Due to the uncertainty of the future utilization of the capital loss, we recorded a valuation allowance of
$72 million
on the carryforward.
We had other changes in valuation allowances related to federal credits and various international and state net operating losses that we believe are more likely than not to expire unutilized.
Deferred Income Taxes
Deferred income taxes arise from temporary differences between financial reporting and tax reporting bases of assets and liabilities and operating loss and tax credit carryforwards for tax purposes.
The following table presents the components of the deferred income tax assets and liabilities at June 30:
|
Cardinal Health
|
Fiscal 2018 Form 10-K
|
60
|
|
|
Notes to Financial Statements
|
||
|
(in millions)
|
2018
|
2017
|
|||||
|
Deferred income tax assets:
|
|||||||
|
Receivable basis difference
|
$
|
41
|
|
$
|
42
|
|
|
|
Accrued liabilities
|
110
|
|
125
|
|
|||
|
Share-based compensation
|
40
|
|
53
|
|
|||
|
Loss and tax credit carryforwards
|
526
|
|
378
|
|
|||
|
Deferred tax assets related to uncertain tax positions
|
30
|
|
51
|
|
|||
|
Other
|
101
|
|
43
|
|
|||
|
Total deferred income tax assets
|
848
|
|
692
|
|
|||
|
Valuation allowance for deferred income tax assets
|
(412
|
)
|
(237
|
)
|
|||
|
Net deferred income tax assets
|
$
|
436
|
|
$
|
455
|
|
|
|
Deferred income tax liabilities:
|
|||||||
|
Inventory basis differences
|
$
|
(1,103
|
)
|
$
|
(1,578
|
)
|
|
|
Property-related
|
(176
|
)
|
(183
|
)
|
|||
|
Goodwill and other intangibles
|
(934
|
)
|
(570
|
)
|
|||
|
Total deferred income tax liabilities
|
$
|
(2,213
|
)
|
$
|
(2,331
|
)
|
|
|
Net deferred income tax liability
|
$
|
(1,777
|
)
|
$
|
(1,876
|
)
|
|
Deferred income tax assets and liabilities in the preceding table, after netting by taxing jurisdiction, are in the following captions in the consolidated balance sheets at June 30:
|
(in millions)
|
2018
|
2017
|
|||||
|
Noncurrent deferred income tax asset (1)
|
37
|
|
73
|
|
|||
|
Noncurrent deferred income tax liability (2)
|
(1,814
|
)
|
(1,949
|
)
|
|||
|
Net deferred income tax liability
|
$
|
(1,777
|
)
|
$
|
(1,876
|
)
|
|
|
(1)
|
Included in other assets in the consolidated balance sheets.
|
|
(2)
|
Included in deferred income taxes and other liabilities in the consolidated balance sheets.
|
At
June 30, 2018
we had gross federal, state and international loss and credit carryforwards of
$794 million
,
$2.0 billion
and
$1.1 billion
, respectively, the tax effect of which is an aggregate deferred tax asset of
$526 million
. Substantially all of these carryforwards are available for at least three years. Approximately
$379 million
of the valuation allowance at
June 30, 2018
applies to certain federal, state and international loss carryforwards that, in our opinion, are more likely than not to expire unutilized. However, to the extent that tax benefits related
to these carryforwards are realized in the future, the reduction in the valuation allowance would reduce income tax expense.
Unrecognized Tax Benefits
We had
$423 million
,
$417 million
and
$527 million
of unrecognized tax benefits at
June 30, 2018
,
2017
and
2016
, respectively. The
June 30, 2018
,
2017
and
2016
balances include
$262 million
,
$268 million
and
$355 million
, respectively, of unrecognized tax benefits that, if recognized, would have an impact on the effective tax rate. The remaining unrecognized tax benefits relate to tax positions for which ultimate deductibility is highly certain but for which there is uncertainty as to the timing of such deductibility. Recognition of these tax benefits would not affect our effective tax rate. We include the full amount of unrecognized tax benefits in deferred income taxes and other liabilities in the consolidated balance sheets. The following table
presents a reconciliation of the beginning and ending amounts of unrecognized tax benefits:
|
(in millions)
|
2018
|
2017
|
2016
|
||||||||
|
Balance at beginning of fiscal year
|
$
|
417
|
|
$
|
527
|
|
$
|
542
|
|
||
|
Additions for tax positions of the current year
|
15
|
|
29
|
|
22
|
|
|||||
|
Additions for tax positions of prior years (1)
|
141
|
|
23
|
|
42
|
|
|||||
|
Reductions for tax positions of prior years
|
(40
|
)
|
(8
|
)
|
(48
|
)
|
|||||
|
Settlements with tax authorities (1)
|
(99
|
)
|
(154
|
)
|
(30
|
)
|
|||||
|
Expiration of the statute of limitations (1)
|
(11
|
)
|
—
|
|
(1
|
)
|
|||||
|
Balance at end of fiscal year
|
$
|
423
|
|
$
|
417
|
|
$
|
527
|
|
||
|
(1)
|
Included in additions for tax positions of prior years is
$110 million
related to exposures acquired as part of the Patient Recovery Business for which we are indemnified. Settlements of
$81 million
related to the Patient Recovery Business as well as
$11 million
of statute expirations.
|
It is reasonably possible that there could be a change in the amount of unrecognized tax benefits within the next 12 months due to activities of the U.S. Internal Revenue Service ("IRS") or other taxing authorities, possible settlement of audit issues, reassessment of existing unrecognized tax benefits or the expiration of statutes of limitations.
We estimate that the range of the possible change in unrecognized tax benefits within the next 12 months is a net decrease of
$0 million
to
$35 million
, exclusive of penalties and interest.
We recognize accrued interest and penalties related to unrecognized tax benefits in the provision for income taxes. At
June 30, 2018
,
2017
and
2016
, we had
$110 million
,
$99 million
and
$145 million
, respectively, accrued for the payment of interest and penalties. These balances are gross amounts before any tax benefits and are included in deferred income taxes and other liabilities in the consolidated balance sheets. During fiscal
2018
and 2017, we recognized
$8 million
and
$12 million
of expense for interest and penalties in income tax expense, respectively. During fiscal
2016
, we recognized
$9 million
of benefit for interest and penalties in income tax expense.
Other Tax Matters
We file income tax returns in the U.S. federal jurisdiction, various U.S. state and local jurisdictions, and various foreign jurisdictions. With few exceptions, we are subject to audit by taxing authorities for fiscal years 2008 through the current fiscal year.
We are a party to a tax matters agreement with CareFusion Corporation ("CareFusion"), which has been acquired by Becton, Dickinson and Company. Under the tax matters agreement, CareFusion is obligated to indemnify us for certain tax exposures and transaction taxes prior to our fiscal 2010 spin-off of CareFusion. The indemnification receivable was
$151 million
and
$142 million
at
June 30, 2018
and
2017
, respectively, and is included in other assets in the consolidated balance sheets.
As a result of the acquisition of the Patient Recovery Business, Medtronic plc is obligated to indemnify us for certain tax exposures and transaction taxes related to periods prior to the acquisition under the purchase agreement. The indemnification receivable was
$21 million
at June 30, 2018 and is included in Other assets in the consolidated balance sheet.
|
61
|
Cardinal Health
|
Fiscal 2018 Form 10-K
|
|
|
Notes to Financial Statements
|
||
9. Commitments, Contingent Liabilities and Litigation
Commitments
Operating Leases
The future minimum rental payments for operating leases having initial or remaining non-cancelable lease terms in excess of one year at
June 30, 2018
for fiscal
2019
through
2023
and thereafter are as follows:
$113 million
,
$97 million
,
$77 million
,
$58 million
,
$41 million
and
$103 million
. Rental expense relating to operating leases was
$172 million
,
$159 million
and
$126 million
in fiscal
2018
,
2017
and
2016
, respectively. Sublease rental income was immaterial for all periods presented.
Generic Sourcing Venture With CVS Health Corporation
Red Oak Sourcing, LLC ("Red Oak Sourcing") is a U.S.-based generic pharmaceutical sourcing venture with CVS Health for an initial term through June 2024. Red Oak Sourcing negotiates generic pharmaceutical supply contracts on behalf of its participants. Due to the achievement of predetermined milestones, we are required to make quarterly payments of
$45.6 million
to CVS Health for the initial term.
Contingencies
New York Opioid Stewardship Act
In April 2018, the State of New York passed a budget which included the Opioid Stewardship Act (the "OSA"). The OSA created an aggregate $100 million annual assessment on all manufacturers and distributors licensed to sell or distribute opioids in New York. Each licensed manufacturer and distributor will be required to pay a portion of the assessment based on its ratable share, as determined by the state, of the total morphine milligram equivalents sold or distributed in New York during the applicable calendar year. The initial payment is due on January 1, 2019 for opioids sold or distributed during calendar year 2017.
We accrue for contingencies if it is probable that a liability has been incurred and the amount can be reasonably estimated. At this time, we believe that it is probable that we owe an amount under the OSA for calendar years 2017 and 2018, but we are unable to estimate the amount because of uncertainties with respect to the implementation of the assessment and because the information necessary to determine our share of the assessment is not yet available.
Legal Proceedings
We become involved from time to time in disputes, litigation and regulatory matters.
We may be named from time to time in
qui tam
actions initiated by private third parties. In such actions, the private parties purport to act on behalf of federal or state governments, allege that false claims have been submitted for payment by the government and may receive an award if their claims are successful. After a private party has filed a
qui tam
action, the government must investigate the private party's claim and determine whether to intervene in and take control over the litigation. These actions may remain under seal while the government makes this determination. If the government declines to intervene, the private party may nonetheless continue to pursue the
litigation on his or her own purporting to act on behalf of the government
.
From time to time, we become aware through employees, internal audits or other parties of possible compliance matters, such as complaints or concerns relating to accounting, internal accounting controls, financial reporting, auditing, or other ethical matters or relating to compliance with laws such as healthcare fraud and abuse, anti-corruption or anti-bribery laws. When we become aware of such possible compliance matters, we investigate internally and take appropriate corrective action. In addition, from time to time, we receive subpoenas or requests for information from various federal or state agencies relating to our business or to the business of a customer, supplier or other industry participants. Internal investigations, subpoenas or requests for information could lead to the assertion of claims or the commencement of legal proceedings against us or result in sanctions.
From time to time, we may determine that products we manufacture or market do not meet our specifications, regulatory requirements, or published standards. When we or a regulatory agency identify a potential quality or regulatory issue, we investigate and take appropriate corrective action. Such actions can lead to product recalls, costs to repair or replace affected products, temporary interruptions in product sales, action by regulators and product liability claims and lawsuits, including class actions. Even absent an identified regulatory or quality issue or product recall, we can become subject to product liability claims and lawsuits.
We accrue for contingencies related to disputes, litigation and regulatory matters if it is probable that a liability has been incurred and the amount of the loss can be reasonably estimated. Because these matters are inherently unpredictable and unfavorable developments or resolutions can occur, assessing contingencies is highly subjective and requires judgments about future events. We regularly review contingencies to determine whether our accruals and related disclosures are adequate. The amount of ultimate loss may differ from these estimates.
We recognize income from the favorable outcome of litigation when we receive the associated cash or assets.
We recognize estimated loss contingencies for certain litigation and regulatory matters and income from favorable resolution of litigation in litigation (recoveries)/charges in our consolidated statements of earnings.
Opioid Lawsuits
Pharmaceutical wholesale distributors, including us, have been named as defendants in over
1,000
lawsuits relating to the distribution of prescription opioid pain medications. These lawsuits have been filed in various federal, state, and other courts by a variety of plaintiffs, which are primarily counties, municipalities and political subdivisions from
48
states. Plaintiffs also include state attorneys general, unions and other health and welfare funds, hospital systems and other healthcare providers. Of these lawsuits,
32
are purported class actions. The lawsuits seek equitable relief and monetary damages based on a variety of legal theories including various common law claims, such as negligence, public nuisance, unjust enrichment as well as violations of controlled substance laws and various other
|
Cardinal Health
|
Fiscal 2018 Form 10-K
|
62
|
|
|
Notes to Financial Statements
|
||
statutes. Many also name pharmaceutical manufacturers, retail pharmacy chains and other entities as defendants.
The vast majority of these lawsuits have been filed in U.S. federal court and have been transferred for consolidated pre-trial proceedings in a Multi-District Litigation proceeding in the United States District Court for the Northern District of Ohio. The court, among other things, ordered that three lawsuits proceed to trial in 2019 depending on the outcome of pre-trial motions. As a part of these proceedings, distributors have engaged in preliminary discussions with various parties, including state attorneys general, regarding possible resolution structures.
In addition,
39
state attorneys general have formed a multi-state task force to investigate the manufacturing, distribution, dispensing and prescribing practices of opioid medications. We have received requests related to this multi-state investigation, as well as civil investigative demands, subpoenas or requests for information from these and other state attorneys general offices. We are cooperating with the offices conducting these investigations.
We are vigorously defending ourselves in all of these opioid matters. Since all of the above-referenced lawsuits and investigations are in early stages, we are unable to predict their outcome or estimate a range of reasonably possible losses.
Product Liability Lawsuits
As of August 20, 2018, we are named as a defendant in
174
product liability lawsuits filed in Alameda County Superior Court in California involving claims by approximately
1,918
plaintiffs that allege personal injuries associated with the use of Cordis OptEase and TrapEase inferior vena cava (IVC) filter products. Another
20
lawsuits involving similar claims by approximately
21
plaintiffs are pending in other jurisdictions. These lawsuits seek a variety of remedies, including unspecified monetary damages. We are vigorously defending ourselves in these lawsuits.
At June 30, 2018, we had a total of
$259 million
, net of expected insurance recoveries, accrued for losses and legal defense costs related to the Cordis IVC filter lawsuits. While we have recorded accruals based on our assessment of these matters, because these lawsuits are in early stages, we are unable to estimate a range of reasonably possible losses in excess of this accrued amount.
10. Guarantees
In the ordinary course of business, we agree to indemnify certain other parties under acquisition and disposition agreements, customer agreements, intellectual property licensing agreements, and other agreements. Such indemnification obligations vary in scope and, when defined, in duration. In many cases, a maximum obligation is not explicitly stated, and therefore the overall maximum amount of the liability under such indemnification obligations cannot be reasonably estimated. Where appropriate, such indemnification obligations are recorded as a liability. Historically, we have not, individually or in the aggregate, made payments under these indemnification obligations in any material amounts. In certain circumstances, we believe that existing insurance arrangements, subject to the general deduction and exclusion provisions, would cover portions of the liability that may arise from these indemnification
obligations. In addition, we believe that the likelihood of a material liability being triggered under these indemnification obligations is not probable.
From time to time we enter into agreements that obligate us to make fixed payments upon the occurrence of certain events. Such obligations primarily relate to obligations arising under acquisition transactions, where we have agreed to make payments based upon the achievement of certain financial performance measures by the acquired business. Generally, the obligation is capped at an explicit amount. See
Note 11
for detail regarding contingent consideration obligations.
11. Fair Value Measurements
The following tables present the fair values for assets and (liabilities) measured on a recurring basis at June 30:
|
2018
|
|||||||||||||||
|
(in millions)
|
Level 1
|
Level 2
|
Level 3
|
Total
|
|||||||||||
|
Assets:
|
|||||||||||||||
|
Cash equivalents
|
$
|
200
|
|
$
|
—
|
|
$
|
—
|
|
$
|
200
|
|
|||
|
Other investments (2)
|
117
|
|
—
|
|
—
|
|
117
|
|
|||||||
|
Liabilities:
|
|||||||||||||||
|
Contingent consideration (3)
|
—
|
|
—
|
|
(1
|
)
|
(1
|
)
|
|||||||
|
Forward contracts (4)
|
—
|
|
(76
|
)
|
—
|
|
(76
|
)
|
|||||||
|
2017
|
|||||||||||||||
|
(in millions)
|
Level 1
|
Level 2
|
Level 3
|
Total
|
|||||||||||
|
Assets:
|
|||||||||||||||
|
Cash equivalents
|
$
|
739
|
|
$
|
—
|
|
$
|
—
|
|
$
|
739
|
|
|||
|
Available-for-sale securities (1)
|
—
|
|
65
|
|
—
|
|
65
|
|
|||||||
|
Other investments (2)
|
116
|
|
—
|
|
—
|
|
116
|
|
|||||||
|
Liabilities:
|
|||||||||||||||
|
Contingent consideration (3)
|
—
|
|
—
|
|
(32
|
)
|
(32
|
)
|
|||||||
|
Forward contracts (4)
|
—
|
|
(21
|
)
|
—
|
|
(21
|
)
|
|||||||
|
(1)
|
We invest in marketable securities, which are classified as available-for-sale and are carried at fair value in the consolidated balance sheets. Observable Level 2 inputs such as quoted prices for similar securities, interest rate spreads, yield curves and credit risk are used to determine the fair value. See
Note 6
for additional information regarding available-for-sale securities.
|
|
(2)
|
Level 1 other investments balance includes investments in mutual funds, which are used to offset fluctuations in deferred compensation liabilities. These mutual funds primarily invest in the equity securities of companies with large market capitalization and high quality fixed income debt securities. The fair value of these investments is determined using quoted market prices.
|
|
(3)
|
Contingent consideration represents the obligations incurred in connection with acquisitions. We do not deem the fair value of the contingent consideration obligations under any single acquisition to be significant. The estimate of fair value of the contingent consideration obligations requires subjective assumptions to be made regarding future business results, discount rates, discount periods, and probabilities assigned to various potential business result scenarios and was determined using probability assessments with respect to the likelihood of reaching various targets or of achieving certain milestones. The fair value measurement is based on significant inputs unobservable in the market and thus represents a Level 3 measurement. Changes in current expectations of progress could change the probability of achieving the targets within the measurement periods and result in an increase or decrease in the fair value of the contingent consideration obligation.
|
|
63
|
Cardinal Health
|
Fiscal 2018 Form 10-K
|
|
|
Notes to Financial Statements
|
||
|
(4)
|
The fair value of interest rate swaps, foreign currency contracts and commodity contracts is determined based on the present value of expected future cash flows considering the risks involved, including non-performance risk, and using discount rates appropriate for the respective maturities. Observable Level 2 inputs are used to determine the present value of expected future cash flows. The fair value of these derivative contracts, which are subject to master netting arrangements under certain circumstances, is presented on a gross basis in the consolidated balance sheets.
|
The following table presents those liabilities measured at fair value on a recurring basis using unobservable inputs (Level 3):
|
(in millions)
|
Contingent Consideration Obligation
|
||
|
Balance at June 30, 2016
|
$
|
19
|
|
|
Additions from acquisitions
|
21
|
|
|
|
Changes in fair value of contingent consideration (1)
|
(5
|
)
|
|
|
Payment of contingent consideration
|
(3
|
)
|
|
|
Balance at June 30, 2017
|
32
|
|
|
|
Additions from acquisitions
|
5
|
|
|
|
Changes in fair value of contingent consideration (1)
|
(2
|
)
|
|
|
Payment of contingent consideration
|
(35
|
)
|
|
|
Balance at June 30, 2018
|
$
|
1
|
|
The sum of the components may not equal the total due to rounding.
|
(1)
|
Amount is included in amortization and other acquisition-related costs in the consolidated statements of earnings.
|
12. Financial Instruments
We utilize derivative financial instruments to manage exposure to certain risks related to our ongoing operations. The primary risks managed through the use of derivative instruments include interest rate risk, currency exchange risk, and commodity price risk. We do not use derivative instruments for trading or speculative purposes. While the majority of our derivative instruments are designated as hedging instruments, we also enter into derivative instruments that are designed to hedge a risk, but are not designated as hedging instruments. These derivative instruments are adjusted to current fair value through earnings at the end of each period.
We are exposed to counterparty credit risk on all of our derivative instruments. Accordingly, we have established and maintain strict counterparty credit guidelines and only enter into derivative instruments with major financial institutions that are investment grade or better. We do not have significant exposure to any one counterparty and we believe the risk of loss is remote. Additionally, we do not require collateral under these agreements.
Interest Rate Risk Management
We are exposed to the impact of interest rate changes. Our objective is to manage the impact of interest rate changes on cash flows and the market value of our borrowings. We utilize a mix of debt maturities along with both fixed-rate and variable-rate debt to manage changes in interest rates. In addition, we enter into interest rate swaps to further manage our exposure to interest rate variations related to our borrowings and to lower our overall borrowing costs.
Currency Exchange Risk Management
We conduct business in several major international currencies and are subject to risks associated with changing foreign exchange rates. Our objective is to reduce earnings and cash flow volatility associated with foreign exchange rate changes to allow management to focus its attention on business operations. Accordingly, we enter into various contracts that change in value as foreign exchange rates change to protect the value of existing foreign currency assets and liabilities, commitments and anticipated foreign currency revenue and expenses.
Commodity Price Risk Management
We are exposed to changes in the price of certain commodities. Our objective is to reduce earnings and cash flow volatility associated with forecasted purchases of these commodities to allow management to focus its attention on business operations. Accordingly, we enter into derivative contracts when possible to manage the price risk associated with certain forecasted purchases.
The following table summarizes the fair value of our assets and liabilities related to derivatives designated as hedging instruments and the respective line items in which they were recorded in the consolidated balance sheets at June 30:
|
(in millions)
|
2018
|
2017
|
|||||
|
Assets:
|
|||||||
|
Foreign currency contracts (1)
|
$
|
3
|
|
$
|
3
|
|
|
|
Commodity contracts (1)
|
2
|
|
—
|
|
|||
|
Total assets
|
$
|
5
|
|
$
|
3
|
|
|
|
Liabilities:
|
|||||||
|
Foreign currency contracts (3)
|
$
|
3
|
|
$
|
2
|
|
|
|
Pay-floating interest rate swaps (2)
|
78
|
|
19
|
|
|||
|
Pay-floating interest rate swaps (3)
|
$
|
—
|
|
$
|
2
|
|
|
|
Commodity contracts (3)
|
—
|
|
1
|
|
|||
|
Total liabilities
|
$
|
81
|
|
$
|
24
|
|
|
(1) Included in prepaid expenses and other in the consolidated balance sheets.
|
(2)
|
Included in deferred income taxes and other liabilities in the consolidated balance sheets.
|
|
(3)
|
Included in other accrued liabilities in the consolidated balance sheets.
|
Fair Value Hedges
We enter into pay-floating interest rate swaps to hedge the changes in the fair value of fixed-rate debt resulting from fluctuations in interest rates. These contracts are designated and qualify as fair value hedges. Accordingly, the gain or loss recorded on the pay-floating interest rate swaps is directly offset by the change in fair value of the underlying debt. Both the derivative instrument and the underlying debt are adjusted to market value at the end of each period with any resulting gain or loss recorded in interest expense, net in the consolidated statements of earnings.
During fiscal
2018
and
2017
we entered into pay-floating interest rate swaps with total notional amounts of
$1.1 billion
and
$700 million
, respectively. These swaps have been designated as fair value hedges of our fixed rate debt and are included in deferred income taxes and other liabilities in the consolidated balance sheets.
|
Cardinal Health
|
Fiscal 2018 Form 10-K
|
64
|
|
|
Notes to Financial Statements
|
||
During fiscal
2017
we terminated notional amounts of
$600 million
of pay-floating interest rate swaps that were previously designated as fair value hedges. During fiscal
2018
and
2017
,
$550 million
and
$250 million
,
respectively, of pay-floating interest rate swaps matured.
The following tables summarize the outstanding interest rate swaps designated as fair value hedges at June 30:
|
|
2018
|
||||||
|
(in millions)
|
Notional Amount
|
Maturity Date
|
|||||
|
Pay-floating interest rate swaps
|
$
|
2,313
|
|
Nov 2019
|
-
|
Sep 2025
|
|
|
2017
|
|||||||
|
(in millions)
|
Notional Amount
|
Maturity Date
|
|||||
|
Pay-floating interest rate swaps
|
$
|
1,813
|
|
Jun 2018
|
-
|
Sep 2025
|
|
The following table summarizes the gain/(loss) recognized in earnings for interest rate swaps designated as fair value hedges:
|
(in millions)
|
2018
|
2017
|
2016
|
||||||||
|
Pay-floating interest rate swaps (1)
|
$
|
11
|
|
$
|
17
|
|
$
|
23
|
|
||
|
Fixed-rate debt (1)
|
(11
|
)
|
(17
|
)
|
(23
|
)
|
|||||
(1) Included in interest expense, net in the consolidated statements of earnings.
There was no ineffectiveness associated with these derivative instruments for any periods presented.
Cash Flow Hedges
We enter into derivative instruments to hedge our exposure to changes in cash flows attributable to interest rate, foreign currency and commodity price fluctuations associated with certain forecasted transactions. These derivative instruments are designated and qualify as cash flow hedges. Accordingly, the effective portion of the gain or loss on the derivative instrument is reported as a component of other comprehensive income and reclassified into earnings in the same line item associated with the forecasted transaction and in the same period during which the hedged transaction affects earnings. The ineffective portion of the gain or loss on the derivative instrument is recognized in earnings immediately.
During fiscal
2017
we entered into forward interest rate swaps with a total notional amount of
$700 million
to hedge probable, but not firmly committed, future transactions associated with our debt.
During fiscal
2017
we terminated
$1.0 billion
in forward interest rate swaps that were previously designated as cash-flow hedges.
We enter into foreign currency contracts to protect the value of anticipated foreign currency revenues and expenses. At
June 30, 2018
and
2017
, we held contracts to hedge probable, but not firmly committed, revenue and expenses. The principal currencies hedged are the Canadian dollar, Thai baht, Euro, and Mexican peso.
We enter into commodity contracts to manage the price risk associated with forecasted purchases of certain commodities used in our Medical segment.
The following tables summarize the outstanding cash flow hedges at June 30:
|
|
2018
|
||||||
|
(in millions)
|
Notional Amount
|
Maturity Date
|
|||||
|
Foreign currency contracts
|
$
|
124
|
|
Jul 2018
|
-
|
Jun 2019
|
|
|
Commodity contracts
|
12
|
|
Jul 2018
|
-
|
Oct 2020
|
||
|
|
2017
|
||||||
|
(in millions)
|
Notional Amount
|
Maturity Date
|
|||||
|
Foreign currency contracts
|
$
|
162
|
|
Jul 2017
|
-
|
Jun 2018
|
|
|
Commodity contracts
|
17
|
|
Jul 2017
|
-
|
Apr 2020
|
||
The following table summarizes the gain/(loss) included in AOCI for derivative instruments designated as cash flow hedges at June 30:
|
(in millions)
|
2018
|
2017
|
|||
|
Commodity contracts
|
2
|
|
(1
|
)
|
|
|
Foreign currency contracts
|
(2
|
)
|
—
|
|
|
The following table summarizes the gain/(loss) reclassified from AOCI into earnings for derivative instruments designated as cash flow hedges:
|
(in millions)
|
2018
|
2017
|
2016
|
||||||||
|
Foreign currency contracts (1)
|
$
|
1
|
|
$
|
(1
|
)
|
$
|
1
|
|
||
|
Foreign currency contracts (2)
|
—
|
|
(1
|
)
|
5
|
|
|||||
|
Foreign currency contracts (3)
|
(2
|
)
|
2
|
|
(3
|
)
|
|||||
|
Commodity contracts (3)
|
—
|
|
(3
|
)
|
(5
|
)
|
|||||
|
(1)
|
Included in revenue in the consolidated statements of earnings.
|
|
(2)
|
Included in cost of products sold in the consolidated statements of earnings.
|
|
(3)
|
Included in SG&A expenses in the consolidated statements of earnings.
|
The amount of ineffectiveness associated with these derivative instruments was immaterial for all periods presented.
Economic (Non-Designated) Hedges
We enter into foreign currency contracts to manage our foreign exchange exposure related to sales transactions, intercompany financing transactions and other balance sheet items subject to revaluation that do not meet the requirements for hedge accounting treatment. Accordingly, these derivative instruments are adjusted to current market value at the end of each period through earnings. The gain or loss recorded on these instruments is substantially offset by the remeasurement adjustment on the foreign currency denominated asset or liability. The settlement of the derivative instrument and the remeasurement adjustment on the foreign currency denominated asset or liability are both recorded in other (income)/expense, net. The principal currencies managed through foreign currency contracts are the Euro, Canadian dollar, British pound, Japanese yen, and Chinese renminbi.
The following tables summarize the outstanding economic (non-designated) derivative instruments at June 30:
|
|
2018
|
||||||
|
(in millions)
|
Notional Amount
|
Maturity Date
|
|||||
|
Foreign currency contracts
|
$
|
550
|
|
Jul 2018
|
-
|
Jun 2019
|
|
|
65
|
Cardinal Health
|
Fiscal 2018 Form 10-K
|
|
|
Notes to Financial Statements
|
||
|
|
2017
|
||||||
|
(in millions)
|
Notional Amount
|
Maturity Date
|
|||||
|
Foreign currency contracts
|
$
|
558
|
|
Jul 2017
|
|||
The following table summarizes the gain/(loss) recognized in earnings for economic (non-designated) derivative instruments:
|
(in millions)
|
2018
|
2017
|
2016
|
||||||||
|
Foreign currency contracts (1)
|
$
|
(5
|
)
|
$
|
(5
|
)
|
$
|
(17
|
)
|
||
|
(1)
|
Included in other income, net in the consolidated statements of earnings.
|
Fair Value of Financial Instruments
The carrying amounts of cash and equivalents, trade receivables, net, accounts payable, and other accrued liabilities at
June 30, 2018
and
2017
approximate fair value due to their short-term maturities.
The following table summarizes the estimated fair value of our long-term obligations and other short-term borrowings compared to the respective carrying amounts at June 30:
|
(in millions)
|
2018
|
2017
|
|||||
|
Estimated fair value
|
$
|
8,852
|
|
$
|
10,713
|
|
|
|
Carrying amount
|
9,013
|
|
10,395
|
|
|||
The fair value of our long-term obligations and other short-term borrowings is estimated based on either the quoted market prices for the same or similar issues or other inputs derived from available market information, which represents a Level 2 measurement.
The following table is a summary of the fair value gain/(loss) of our derivative instruments based upon the estimated amount that we would receive (or pay), considering counter-party credit risk, to terminate the contracts at June 30:
|
2018
|
2017
|
||||||||||||||
|
(in millions)
|
Notional
Amount |
Fair Value
Gain/(Loss) |
Notional
Amount |
Fair Value
Gain/(Loss) |
|||||||||||
|
Pay-floating interest rate swaps
|
$
|
2,313
|
|
$
|
(78
|
)
|
$
|
1,813
|
|
$
|
(19
|
)
|
|||
|
Foreign currency contracts
|
674
|
|
—
|
|
720
|
|
1
|
|
|||||||
|
Commodity contracts
|
12
|
|
—
|
|
17
|
|
(1
|
)
|
|||||||
13. Redeemable Noncontrolling Interests
In connection with the acquisition of a
71 percent
ownership interest in naviHealth during
fiscal
2016
, we recognized redeemable noncontrolling interests with a fair value of
$119 million
at the acquisition date.
In August 2017, certain third-party noncontrolling interest holders exercised their put right on the noncontrolling interest representing
16 percent
of naviHealth with a redemption value of $
103 million
and a carrying value of $
109 million
. We settled the put in September 2017 and our ownership in naviHealth increased to
98 percent
, up from
82 percent
at June 30, 2017 and 2016.
The reconciliation of the changes in redeemable noncontrolling interests are as follows:
|
(in millions)
|
Redeemable Noncontrolling Interests
|
||
|
Balance at June 30, 2016
|
$
|
117
|
|
|
Net earnings attributable to redeemable noncontrolling interests
|
4
|
|
|
|
Net purchase of redeemable noncontrolling interests
|
(3
|
)
|
|
|
Balance at June 30, 2017
|
118
|
|
|
|
Net earnings attributable to redeemable noncontrolling interest
|
2
|
|
|
|
Net purchase of redeemable noncontrolling interests
|
(103
|
)
|
|
|
Adjustment of redeemable noncontrolling interests to redemption value
|
(5
|
)
|
|
|
Balance at June 30, 2018
|
$
|
12
|
|
14. Shareholders' Equity
At
June 30, 2018
and
2017
, authorized capital shares consisted of the following:
750 million
Class A common shares, without par value;
5 million
Class B common shares, without par value; and
500 thousand
non-voting preferred shares, without par value. The Class A common shares and Class B common shares are collectively referred to below as “common shares”. Holders of common shares are entitled to share equally in any dividends declared by the Board of Directors and to participate equally in all distributions of assets upon liquidation. Generally, the holders of Class A common shares are entitled to
one vote
per share, and the holders of Class B common shares are entitled to
one-fifth of one vote
per share on proposals presented to shareholders for vote. Under certain circumstances, the holders of Class B common shares are entitled to vote as a separate class. Only Class A common shares were outstanding at
June 30, 2018
and
2017
.
We repurchased
$1.8 billion
of our common shares, in the aggregate, through share repurchase programs during fiscal
2018
,
2017
and
2016
, as described below. We funded the repurchases with available cash and short term borrowings. The common shares repurchased are held in treasury to be used for general corporate purposes.
During fiscal
2018
, we repurchased
8.4 million
common shares having an aggregate cost of
$550 million
. The average price paid per common share was
$65.30
. These repurchases include
$300 million
purchased under an accelerated share repurchase ("ASR") program, which began on February 14, 2018 and was completed on March 21, 2018. We repurchased
4.3 million
shares under the ASR at an average price paid per share of
$69.26
.
During fiscal
2017
, we repurchased
8.1 million
common shares having an aggregate cost of
$600 million
. The average price paid per common share was
$74.08
.
During fiscal
2016
, we repurchased
8.2 million
common shares having an aggregate cost of
$651 million
. The average price paid per common share was
$78.98
.
During fiscal
2017
, we retired
37 million
common shares in treasury. The retirement of these shares had no impact on total shareholders' equity; however, it did impact certain individual components of
|
Cardinal Health
|
Fiscal 2018 Form 10-K
|
66
|
|
|
Notes to Financial Statements
|
||
shareholders' equity as follows:
$2.5 billion
decrease in common shares in treasury,
$302 million
decrease in common shares, and
$2.2 billion
decrease in retained earnings.
Accumulated Other Comprehensive Income/(Loss)
The following table summarizes the changes in the balance of accumulated other comprehensive income/(loss) by component and in total:
|
(in millions)
|
Foreign
Currency
Translation
Adjustments and other
|
Unrealized
Gain/(Loss) on
Derivatives,
net of tax
|
Accumulated Other
Comprehensive
Income/(Loss)
|
||||||||
|
Balance at June 30, 2016
|
$
|
(123
|
)
|
$
|
7
|
|
$
|
(116
|
)
|
||
|
Other comprehensive income/(loss), net before reclassifications
|
(25
|
)
|
19
|
|
(6
|
)
|
|||||
|
Amounts reclassified to earnings
|
—
|
|
(3
|
)
|
(3
|
)
|
|||||
|
Total other comprehensive loss attributable to Cardinal Health, Inc., net of tax of $9 million
|
(25
|
)
|
16
|
|
(9
|
)
|
|||||
|
Balance at June 30, 2017
|
(148
|
)
|
23
|
|
(125
|
)
|
|||||
|
Other comprehensive income/(loss), before reclassifications
|
58
|
|
—
|
|
58
|
|
|||||
|
Amounts reclassified to earnings
|
(23
|
)
|
(2
|
)
|
(25
|
)
|
|||||
|
Total comprehensive income/(loss) attributable to Cardinal Health, Inc., net of tax of $1 million
|
35
|
|
(2
|
)
|
33
|
|
|||||
|
Balance at June 30, 2018
|
$
|
(113
|
)
|
$
|
21
|
|
$
|
(92
|
)
|
||
Activity related to realized and unrealized gains and losses on available-for-sale securities, as described in
Note 6
, was immaterial during fiscal
2018
and
2017
.
15. Earnings Per Share Attributable to Cardinal Health, Inc.
The following table reconciles the computation of basic and diluted earnings per share attributable to Cardinal Health, Inc.:
|
(in millions, except per share amounts)
|
2018
|
2017
|
2016
|
||||||||
|
Net earnings
|
$
|
259
|
|
$
|
1,294
|
|
$
|
1,431
|
|
||
|
Net earnings attributable to noncontrolling interest
|
(3
|
)
|
(6
|
)
|
(4
|
)
|
|||||
|
Net earnings attributable to Cardinal Health, Inc.
|
$
|
256
|
|
$
|
1,288
|
|
$
|
1,427
|
|
||
|
Weighted-average common shares–basic
|
313
|
|
317
|
|
327
|
|
|||||
|
Effect of dilutive securities:
|
|||||||||||
|
Employee stock options, restricted share units, and performance share units
|
2
|
|
3
|
|
3
|
|
|||||
|
Weighted-average common shares–diluted
|
315
|
|
320
|
|
330
|
|
|||||
|
Basic earnings per common share attributable to Cardinal Health, Inc.:
|
$
|
0.82
|
|
$
|
4.06
|
|
$
|
4.36
|
|
||
|
Diluted earnings per common share attributable to Cardinal Health, Inc.:
|
0.81
|
|
4.03
|
|
4.32
|
|
|||||
The potentially dilutive employee stock options, restricted share units and performance share units that were antidilutive for fiscal
2018
,
2017
and
2016
were
6 million
,
3 million
and
2 million
, respectively.
16. Segment Information
Our operations are principally managed on a products and services basis and are comprised of
two
operating segments, which are the same as our reportable segments: Pharmaceutical and Medical. The factors for determining the reportable segments include the manner in which management evaluates performance for purposes of allocating resources and assessing performance combined with the nature of the individual business activities.
The Pharmaceutical segment distributes branded and generic pharmaceutical, specialty pharmaceutical and over-the-counter healthcare and consumer products in the United States. This segment also provides services to pharmaceutical manufacturers and healthcare providers to support the development, marketing, and distribution of specialty pharmaceutical products; operates nuclear pharmacies and radiopharmaceutical manufacturing facilities; provides pharmacy management services to hospitals as well as medication therapy management and patient outcomes services to hospitals, other healthcare providers and payers; and repackages generic pharmaceuticals and over-the-counter healthcare products.
Our Medical segment manufactures, sources and distributes Cardinal Health branded medical, surgical and laboratory products, which are sold in the United States, Canada, Europe, Asia and other markets. We further expanded this segment's portfolio of manufactured products through the acquisition of the
Patient Recovery Business
from Medtronic in July 2017, which includes incontinence, wound care, enteral feeding, urology, operating room supply, electrode and needle, syringe and sharps disposal product lines. In addition to distributing Cardinal Health branded products, this segment also distributes a broad range of national brand products and provides supply chain services and solutions to hospitals, ambulatory surgery centers, clinical laboratories and other healthcare providers in the United States and Canada .
The following table presents revenue for each reportable segment and Corporate:
|
(in millions)
|
2018
|
2017
|
2016
|
||||||||
|
Pharmaceutical
|
$
|
121,241
|
|
$
|
116,463
|
|
$
|
109,131
|
|
||
|
Medical
|
15,581
|
|
13,524
|
|
12,430
|
|
|||||
|
Total segment revenue
|
136,822
|
|
129,987
|
|
121,561
|
|
|||||
|
Corporate (1)
|
(13
|
)
|
(11
|
)
|
(15
|
)
|
|||||
|
Total revenue
|
$
|
136,809
|
|
$
|
129,976
|
|
$
|
121,546
|
|
||
|
(1)
|
Corporate revenue consists of the elimination of inter-segment revenue and other revenue not allocated to the segments.
|
We evaluate segment performance based on segment profit, among other measures. Segment profit is segment revenue, less segment cost of products sold, less segment distribution, selling, general, and administrative ("SG&A") expenses. Segment SG&A expenses include share-based compensation expense as well as allocated corporate expenses for shared functions, including corporate
|
67
|
Cardinal Health
|
Fiscal 2018 Form 10-K
|
|
|
Notes to Financial Statements
|
||
management, corporate finance, financial and customer care shared services, human resources, information technology, and legal and compliance. The results attributable to noncontrolling interests of consolidated entities are recorded within segment profit. Corporate expenses are allocated to the segments based on headcount, level of benefit provided, and other ratable allocation methodologies.
We do not allocate the following items to our segments: LIFO inventory charges/(credits); restructuring and employee severance; amortization and other acquisition-related costs; impairments and (gain)/loss on disposal of assets; litigation (recoveries)/charges, net; other income/expense, net; interest expense, net; loss on extinguishment of debt; and provision for/(benefit from) income taxes.
In addition, certain investment spending, certain portions of enterprise-wide incentive compensation, and other spending are not allocated to the segments. Investment spending generally includes the first-year spend for certain projects that require incremental investments in the form of additional operating expenses. We encourage our segments and corporate functions to identify investment projects that will promote innovation and provide future returns. As approval decisions for such projects are dependent upon executive management, the expenses for such projects are often retained at Corporate. Investment spending within Corporate was
$43 million
,
$17 million
and
$34 million
for fiscal
2018
,
2017
and
2016
, respectively.
The following tables present segment profit by reportable segment and Corporate:
|
(in millions)
|
2018
|
2017
|
2016
|
||||||||
|
Pharmaceutical
|
$
|
1,992
|
|
$
|
2,187
|
|
$
|
2,488
|
|
||
|
Medical
|
662
|
|
572
|
|
457
|
|
|||||
|
Total segment profit
|
2,654
|
|
2,759
|
|
2,945
|
|
|||||
|
Corporate
|
(2,528
|
)
|
(639
|
)
|
(486
|
)
|
|||||
|
Total operating earnings
|
$
|
126
|
|
$
|
2,120
|
|
$
|
2,459
|
|
||
The following tables present depreciation and amortization and additions to property and equipment by reportable segment and Corporate:
|
(in millions)
|
2018
|
2017
|
2016
|
||||||||
|
Pharmaceutical
|
$
|
156
|
|
$
|
122
|
|
$
|
128
|
|
||
|
Medical
|
278
|
|
156
|
|
136
|
|
|||||
|
Corporate
|
598
|
|
439
|
|
377
|
|
|||||
|
Total depreciation and amortization
|
$
|
1,032
|
|
$
|
717
|
|
$
|
641
|
|
||
|
(in millions)
|
2018
|
2017
|
2016
|
||||||||
|
Pharmaceutical
|
$
|
58
|
|
$
|
50
|
|
$
|
88
|
|
||
|
Medical
|
127
|
|
123
|
|
96
|
|
|||||
|
Corporate
|
199
|
|
214
|
|
281
|
|
|||||
|
Total additions to property and equipment
|
$
|
384
|
|
$
|
387
|
|
$
|
465
|
|
||
The following table presents total assets for each reportable segment and Corporate at June 30:
|
(in millions)
|
2018
|
2017
|
2016
|
||||||||
|
Pharmaceutical
|
$
|
21,421
|
|
$
|
21,848
|
|
$
|
20,662
|
|
||
|
Medical
|
16,066
|
|
10,688
|
|
10,236
|
|
|||||
|
Corporate
|
2,464
|
|
7,576
|
|
3,224
|
|
|||||
|
Total assets
|
$
|
39,951
|
|
$
|
40,112
|
|
$
|
34,122
|
|
||
The following tables present revenue and property and equipment, net by geographic area:
|
(in millions)
|
2018
|
2017
|
2016
|
||||||||
|
United States
|
$
|
132,526
|
|
$
|
125,006
|
|
$
|
116,864
|
|
||
|
International
|
4,283
|
|
4,970
|
|
4,682
|
|
|||||
|
Total revenue
|
$
|
136,809
|
|
$
|
129,976
|
|
$
|
121,546
|
|
||
|
(in millions)
|
2018
|
2017
|
2016
|
||||||||
|
United States
|
$
|
1,950
|
|
$
|
1,623
|
|
$
|
1,558
|
|
||
|
International
|
537
|
|
256
|
|
238
|
|
|||||
|
Property and equipment, net
|
$
|
2,487
|
|
$
|
1,879
|
|
$
|
1,796
|
|
||
17. Share-Based Compensation
We maintain stock incentive plans (collectively, the “Plans”) for the benefit of certain of our officers, directors and employees. At
June 30, 2018
,
19 million
shares remain available for future grants under the Amended Cardinal Health, Inc. 2011 Long-Term Incentive Plan ("2011 LTIP"). Under the 2011 LTIP's fungible share counting provisions, stock options are counted against the plan as
one share for every share issued
; awards other than stock options are counted against the plan as
two and one-half shares for every share issued
. This means that only
8 million
shares could be issued under awards other than stock options while
19 million
shares could be issued under stock options. Shares are issued out of treasury shares when stock options are exercised and when restricted share units and performance share units vest.
The following table provides total share-based compensation expense by type of award:
|
(in millions)
|
2018
|
2017
|
2016
|
||||||||
|
Restricted share unit expense
|
$
|
73
|
|
$
|
69
|
|
$
|
69
|
|
||
|
Employee stock option expense
|
22
|
|
19
|
|
21
|
|
|||||
|
Performance share unit expense
|
(10
|
)
|
8
|
|
21
|
|
|||||
|
Total share-based compensation expense
|
$
|
85
|
|
$
|
96
|
|
$
|
111
|
|
||
The total tax benefit related to share-based compensation was
$23 million
,
$34 million
and
$38 million
for fiscal
2018
,
2017
and
2016
, respectively.
Restricted Share Units
Restricted share units granted under the Plans generally vest in equal annual installments over
three years
. Restricted share units accrue cash dividend equivalents that are payable upon vesting of the awards.
|
Cardinal Health
|
Fiscal 2018 Form 10-K
|
68
|
|
|
Notes to Financial Statements
|
||
The following table summarizes all transactions related to restricted share units under the Plans:
|
(in millions, except per share amounts)
|
Restricted Share Units
|
Weighted-Average
Grant Date Fair
Value per Share
|
||||
|
Nonvested at June 30, 2016
|
2
|
|
$
|
71.73
|
|
|
|
Granted
|
1
|
|
82.34
|
|
||
|
Vested
|
(1
|
)
|
69.23
|
|
||
|
Canceled and forfeited
|
—
|
|
—
|
|
||
|
Nonvested at June 30, 2017
|
2
|
|
76.72
|
|
||
|
Granted
|
1
|
|
65.97
|
|
||
|
Vested
|
(1
|
)
|
78.92
|
|
||
|
Canceled and forfeited
|
—
|
|
—
|
|
||
|
Nonvested at June 30, 2018
|
2
|
|
$
|
71.58
|
|
|
The following table provides additional data related to restricted share unit activity:
|
(in millions)
|
2018
|
2017
|
2016
|
||||||||
|
Total compensation cost, net of estimated forfeitures, related to nonvested restricted share and share unit awards not yet recognized, pre-tax
|
$
|
78
|
|
$
|
73
|
|
$
|
79
|
|
||
|
Weighted-average period in years over which restricted share and share unit cost is expected to be recognized (in years)
|
2
|
|
2
|
|
2
|
|
|||||
|
Total fair value of shares vested during the year
|
$
|
65
|
|
$
|
64
|
|
$
|
65
|
|
||
Stock Options
Employee stock options granted under the Plans generally vest in equal annual installments over
three years
and are exercisable for a period up to
ten years
from the grant date. All stock options are exercisable at a price equal to the market value of the common shares underlying the option on the grant date.
The following table summarizes all stock option transactions under the Plans:
|
(in millions, except per share amounts)
|
Stock
Options
|
Weighted-Average
Exercise Price per
Common Share
|
||||
|
Outstanding at June 30, 2016
|
7
|
|
$
|
54.09
|
|
|
|
Granted
|
1
|
|
83.09
|
|
||
|
Exercised
|
(2
|
)
|
37.79
|
|
||
|
Canceled and forfeited
|
—
|
|
—
|
|
||
|
Outstanding at June 30, 2017
|
6
|
|
63.44
|
|
||
|
Granted
|
2
|
|
66.39
|
|
||
|
Exercised
|
(1
|
)
|
43.12
|
|
||
|
Canceled and forfeited
|
—
|
|
—
|
|
||
|
Outstanding at June 30, 2018
|
7
|
|
$
|
64.50
|
|
|
|
Exercisable at June 30, 2018
|
5
|
|
$
|
59.60
|
|
|
The following table provides additional detail related to stock options:
|
(in millions, except per share amounts)
|
2018
|
2017
|
2016
|
||||||||
|
Aggregate intrinsic value of outstanding options at period end
|
$
|
13
|
|
$
|
109
|
|
$
|
181
|
|
||
|
Aggregate intrinsic value of exercisable options at period end
|
13
|
|
106
|
|
161
|
|
|||||
|
Aggregate intrinsic value of exercised options
|
14
|
|
73
|
|
63
|
|
|||||
|
Net proceeds/(withholding) from share-based compensation
|
(3
|
)
|
26
|
|
6
|
|
|||||
|
Excess tax benefits from share based compensation
|
10
|
|
34
|
|
33
|
|
|||||
|
Total compensation cost, net of estimated forfeitures, related to unvested stock options not yet recognized, pre-tax
|
17
|
|
22
|
|
22
|
|
|||||
|
Total fair value of shares vested during the year
|
19
|
|
19
|
|
20
|
|
|||||
|
Weighted-average grant date fair value per stock option
|
13.50
|
|
16.67
|
|
17.40
|
|
|||||
|
(in years)
|
2018
|
2017
|
2016
|
||
|
Weighted-average remaining contractual life of outstanding options
|
7
|
7
|
6
|
||
|
Weighted-average remaining contractual life of exercisable options
|
5
|
6
|
5
|
||
|
Weighted-average period over which stock option compensation cost is expected to be recognized
|
2
|
2
|
2
|
||
Stock options are granted to our officers and certain employees. The fair values were estimated on the grant date using a lattice valuation model. We believe the lattice model provides reasonable estimates because it has the ability to take into account individual exercise patterns based on changes in our stock price and other variables, and it provides for a range of input assumptions, which are disclosed in the table below. The risk-free rate is based on the U.S. Treasury yield curve at the time of the grant. We analyzed historical data to estimate option exercise behaviors and employee terminations to be used within the lattice model. The expected life of the options granted was calculated from the option valuation model and represents the length of time in years that the options granted are expected to be outstanding. Expected volatilities are based on implied volatility from traded options on our common shares and historical volatility over a period of time commensurate with the contractual term of the option grant (up to
ten years
).
The following table provides the range of assumptions used to estimate the fair value of stock options:
|
2018
|
2017
|
2016
|
|||||||||
|
Risk-free interest rate
|
2.1%
|
1.4%
|
-
|
2.0%
|
1.5%
|
-
|
1.9%
|
||||
|
Expected volatility
|
25%
|
24%
|
23%
|
||||||||
|
Dividend yield
|
2.7%
|
-
|
2.8%
|
2.2%
|
-
|
2.5%
|
1.8%
|
-
|
2.0%
|
||
|
Expected life in years
|
7
|
7
|
7
|
||||||||
|
69
|
Cardinal Health
|
Fiscal 2018 Form 10-K
|
|
|
Notes to Financial Statements
|
||
Performance Share Units
Performance share units vest over a
three
-year performance period based on achievement of specific performance goals. Based on the extent to which the targets are achieved, vested shares may range from
zero
to
200 percent
of the target award amount. Performance share units accrue cash dividend equivalents that are payable upon vesting of the awards.
The following table summarizes all transactions related to performance share units under the Plans (based on target award amounts):
|
(in millions, except per share amounts)
|
Performance
Share Units
|
Weighted-Average
Grant Date Fair
Value per Share
|
||||
|
Nonvested at June 30, 2016
|
0.8
|
|
$
|
63.96
|
|
|
|
Granted
|
0.2
|
|
83.19
|
|
||
|
Vested (1)
|
(0.4
|
)
|
51.49
|
|
||
|
Canceled and forfeited
|
—
|
|
—
|
|
||
|
Nonvested at June 30, 2017
|
0.6
|
|
77.83
|
|
||
|
Granted
|
0.2
|
|
66.43
|
|
||
|
Vested (2)
|
(0.2
|
)
|
71.57
|
|
||
|
Canceled and forfeited
|
(0.2
|
)
|
—
|
|
||
|
Nonvested at June 30, 2018
|
0.4
|
|
$
|
66.13
|
|
|
(1) Vested at
170 percent
of the target performance share units granted.
(2) Vested at
133 percent
of the target performance share units granted.
The following table provides additional data related to performance share unit activity:
|
(in millions)
|
2018
|
2017
|
2016
|
||||||||
|
Total compensation cost, net of estimated forfeitures, related to nonvested performance share units not yet recognized, pre-tax
|
$
|
1
|
|
$
|
13
|
|
$
|
17
|
|
||
|
Weighted-average period over which performance share unit cost is expected to be recognized (in years)
|
2
|
|
2
|
|
2
|
|
|||||
|
Total fair value of shares vested during the year
|
$
|
14
|
|
$
|
19
|
|
$
|
16
|
|
||
Employee Retirement Savings Plans
Substantially all of our domestic non-union employees are eligible to be enrolled in our company-sponsored contributory retirement savings plans, which include features under Section 401(k) of the Internal Revenue Code of 1986, and provide for matching and profit sharing contributions by us. Our contributions to the plans are determined by the Board of Directors subject to certain minimum requirements as specified in the plans. The total expense for our employee retirement savings plans was
$129 million
,
$49 million
and
$84 million
for fiscal
2018
,
2017
and
2016
, respectively.
18. Selected Quarterly Financial Data (Unaudited)
The following is selected quarterly financial data for fiscal
2018
and
2017
. The sum of the quarters may not equal year-to-date due to rounding.
|
(in millions, except per common share amounts)
|
First
Quarter |
Second
Quarter |
Third
Quarter |
Fourth
Quarter |
|||||||||||
|
Fiscal 2018
|
|||||||||||||||
|
Revenue
|
$
|
32,641
|
|
$
|
35,186
|
|
$
|
33,633
|
|
$
|
35,349
|
|
|||
|
Gross margin (1)
|
1,672
|
|
1,861
|
|
1,913
|
|
1,735
|
|
|||||||
|
Distribution, selling, general and administrative expenses
|
1,062
|
|
1,131
|
|
1,132
|
|
1,270
|
|
|||||||
|
Net earnings/(loss) (2)
|
117
|
|
1,053
|
|
255
|
|
(1,166
|
)
|
|||||||
|
Less: Net earnings attributable to noncontrolling interests
|
(2
|
)
|
—
|
|
—
|
|
—
|
|
|||||||
|
Net earnings/(loss) attributable to Cardinal Health, Inc.
|
115
|
|
1,053
|
|
255
|
|
(1,166
|
)
|
|||||||
|
Net earnings/(loss) attributable to Cardinal Health, Inc. per common share:
|
|||||||||||||||
|
Basic
|
$
|
0.36
|
|
$
|
3.35
|
|
$
|
0.81
|
|
$
|
(3.76
|
)
|
|||
|
Diluted (3)
|
0.36
|
|
3.33
|
|
0.81
|
|
(3.76
|
)
|
|||||||
|
(1)
|
Gross margin was not impacted by LIFO benefit/(charges) in fiscal 2018.
|
|
(2)
|
During the fourth quarter of fiscal 2018, we recognized a goodwill impairment charge of $
1.4 billion
related to our Medical segment. There was no tax benefit related to this goodwill impairment charge.
|
|
(3)
|
Due to the net loss during the fourth quarter of fiscal 2018, dilutive potential common shares have not been included in the denominator of the dilutive per share computation due to their antidilutive effect.
|
|
(in millions, except per common share amounts)
|
First
Quarter |
Second
Quarter |
Third
Quarter |
Fourth
Quarter |
|||||||||||
|
Fiscal 2017
|
|||||||||||||||
|
Revenue
|
$
|
32,039
|
|
$
|
33,150
|
|
$
|
31,821
|
|
$
|
32,966
|
|
|||
|
Gross margin (4)
|
1,590
|
|
1,602
|
|
1,728
|
|
1,623
|
|
|||||||
|
Distribution, selling, general and administrative expenses
|
920
|
|
910
|
|
960
|
|
983
|
|
|||||||
|
Net earnings
|
310
|
|
324
|
|
382
|
|
278
|
|
|||||||
|
Less: Net earnings attributable to noncontrolling interests
|
(1
|
)
|
—
|
|
(1
|
)
|
(4
|
)
|
|||||||
|
Net earnings attributable to Cardinal Health, Inc.
|
309
|
|
324
|
|
381
|
|
274
|
|
|||||||
|
Net earnings attributable to Cardinal Health, Inc. per common share:
|
|||||||||||||||
|
Basic
|
$
|
0.97
|
|
$
|
1.02
|
|
$
|
1.21
|
|
$
|
0.87
|
|
|||
|
Diluted
|
0.96
|
|
1.02
|
|
1.20
|
|
0.86
|
|
|||||||
|
(4)
|
Gross margin is impacted by LIFO benefit/(charges) of $
9 million
and
$(9) million
in the second and third quarter, respectively. We did not have LIFO benefits/(charges) in the fourth quarter.
|
|
Cardinal Health
|
Fiscal 2018 Form 10-K
|
70
|
|
|
Notes to Financial Statements
|
||
19. Subsequent Events
In June 2018, we entered into a Securities Purchase Agreement and related Contribution and Rollover Agreement with investor entities controlled by CD&R. Pursuant to those agreements, on August 1, 2018, we sold our
98%
ownership interest in naviHealth in exchange for proceeds of
$736 million
(after adjusting for certain fees and expenses) and a
44%
equity interest in a partnership that owns
100%
of the equity interest of naviHealth. We also have certain call rights to reacquire naviHealth.
On August 16, 2018 we entered into an ASR program to purchase shares of our common stock for an aggregate purchase price of $
600 million
and received an initial delivery of
9.5 million
shares of common stock using a reference price of $
50.45
. The program is expected to conclude in the second quarter of fiscal 2019.
|
71
|
Cardinal Health
|
Fiscal 2018 Form 10-K
|
|
|
Schedule II
|
Valuation and Qualifying Accoun
ts
|
|
Cardinal Health, Inc. and Subsidiaries
Schedule II - Valuation and Qualifying Accounts
(1)
|
(in millions)
|
Balance at
Beginning of Period
|
Charged to Costs
and Expenses (1)
|
Charged to
Other Accounts (2)
|
Deductions (3)
|
Balance at
End of Period
|
||||||||||||||
|
Fiscal 2018
|
|||||||||||||||||||
|
Accounts receivable
|
$
|
137
|
|
$
|
113
|
|
$
|
1
|
|
$
|
(111
|
)
|
$
|
139
|
|
||||
|
Finance notes receivable
|
9
|
|
(2
|
)
|
—
|
|
—
|
|
7
|
|
|||||||||
|
Sales returns and allowances
|
347
|
|
2,402
|
|
—
|
|
(2,270
|
)
|
479
|
|
|||||||||
|
Other
|
1
|
|
—
|
|
—
|
|
—
|
|
1
|
|
|||||||||
|
$
|
494
|
|
$
|
2,513
|
|
$
|
1
|
|
$
|
(2,381
|
)
|
$
|
626
|
|
|||||
|
Fiscal 2017
|
|||||||||||||||||||
|
Accounts receivable
|
$
|
135
|
|
$
|
59
|
|
$
|
1
|
|
$
|
(58
|
)
|
$
|
137
|
|
||||
|
Finance notes receivable
|
19
|
|
3
|
|
—
|
|
(13
|
)
|
9
|
|
|||||||||
|
Sales returns and allowances
|
386
|
|
2,285
|
|
—
|
|
(2,324
|
)
|
347
|
|
|||||||||
|
Other
|
1
|
|
—
|
|
—
|
|
—
|
|
1
|
|
|||||||||
|
$
|
541
|
|
$
|
2,347
|
|
$
|
1
|
|
$
|
(2,395
|
)
|
$
|
494
|
|
|||||
|
Fiscal 2016
|
|||||||||||||||||||
|
Accounts receivable
|
$
|
135
|
|
$
|
72
|
|
$
|
2
|
|
$
|
(74
|
)
|
$
|
135
|
|
||||
|
Finance notes receivable
|
14
|
|
6
|
|
—
|
|
(1
|
)
|
19
|
|
|||||||||
|
Sales returns and allowances
|
305
|
|
2,207
|
|
—
|
|
(2,126
|
)
|
386
|
|
|||||||||
|
Other
|
1
|
|
—
|
|
—
|
|
—
|
|
1
|
|
|||||||||
|
$
|
455
|
|
$
|
2,285
|
|
$
|
2
|
|
$
|
(2,201
|
)
|
$
|
541
|
|
|||||
|
(1)
|
Fiscal
2018
,
2017
and
2016
include
$3 million
,
$5 million
and
$5 million
, respectively, for reserves related to customer pricing disputes, excluded from provision for bad debts on the consolidated statements of cash flows and classified as a reduction in revenue in the consolidated statements of earnings.
|
|
(2)
|
Recoveries of amounts provided for or written off in prior years were
$1 million
,
$1 million
and
$2 million
for fiscal
2018
,
2017
and
2016
, respectively.
|
|
(3)
|
Write-off of uncollectible accounts or actual sales returns.
|
The sum of the components may not equal the total due to rounding.
|
Cardinal Health
|
Fiscal 2018 Form 10-K
|
72
|
|
|
Directors, Executive Officers, and Corporate Governance
|
||
Directors, Executive Officers and Corporate Governance
The following is a list of our executive officers:
|
Name
|
Age
|
Position
|
|
George S. Barrett
|
63
|
Executive Chairman of the Board
|
|
Michael C. Kaufmann
|
55
|
Chief Executive Officer
|
|
Jorge M. Gomez
|
50
|
Chief Financial Officer
|
|
Jon L. Giacomin
|
53
|
Chief Executive Officer, Medical segment
|
|
Michele A. M. Holcomb
|
50
|
Executive Vice President, Strategy and Corporate Development
|
|
Pamela O. Kimmet
|
60
|
Chief Human Resources Officer
|
|
Craig S. Morford
|
59
|
Chief Legal and Compliance Officer
|
|
Patricia B. Morrison
|
59
|
Executive Vice President, Customer Support Services and Chief Information Officer
|
The business experience summaries provided below for our executive officers describe positions held during the last five years (unless otherwise indicated).
Mr. Barrett has served as Executive Chairman of the Board since January 2018. Prior to that, he served as Chairman and Chief Executive Officer from August 2009. He will retire in November 2018.
Mr. Kaufmann has served as Chief Executive Officer since January 2018. From November 2014 through December 2017, he served as Chief Financial Officer. From August 2009 until November 2014, he served as Chief Executive Officer, Pharmaceutical segment.
Mr. Gomez has served as Chief Financial Officer since January 2018. From June 2015 through December 2017, he served as Senior Vice President and CFO, Medical Segment. From February 2012 until June 2015, he was Senior Vice President and CFO, Pharmaceutical segment.
Mr. Giacomin has served as Chief Executive Officer, Medical segment since February 2018. From November 2014 to February 2018, he served as Chief Executive Officer, Pharmaceutical segment. From January 2011 until November 2014, he served as President, U.S. Pharmaceutical Distribution.
Ms. Holcomb has served as Executive Vice President, Strategy and Corporate Development since January 2017. She joined us from Teva Pharmaceutical Industries Ltd., where she served as Senior Vice President, Strategy, Portfolio, Search, and Partnerships and Chief Operating Officer, Global R&D from October 2015 to December 2016 and Senior Vice President, Chief Operating Officer, Global R&D from September 2012 to September 2015.
Ms. Kimmet has served as Chief Human Resources Officer since June 2016. Prior to joining us, Ms. Kimmet served as Senior Vice President, Human Resources at Coca-Cola Enterprises, Inc. from October 2010 to June 2016.
Mr. Morford has served as Chief Legal and Compliance Officer since May 2009.
Ms. Morrison has served as Executive Vice President, Customer Support Services and Chief Information Officer since June 2011. She will retire on September 1, 2018.
We have adopted
Standards of Business Conduct
that apply to all of our directors, officers and employees. The
Standards of Business Conduct
outline our corporate values and standards of integrity and behavior and are designed to protect and promote our reputation. The full text of the
Standards of Business Conduct
is posted on our website at www.cardinalhealth.com under “About Us — Corporate Citizenship — Ethics and Governance — Ethics and Compliance.”
Any waiver of the
Standards of Business Conduct
for directors or executive officers must be approved by the Audit Committee. As required under SEC and New York Stock Exchange rules, we will disclose future amendments to our
Standards of Business Conduct
and waivers from the
Standards of Business Conduct
for our principal executive officer, principal financial officer, and principal accounting officer, or persons performing similar functions, and our other executive officers and directors on our website within four business days following the date of the amendment or waiver.
The other information called for by Item 10 of Form 10-K is incorporated by reference to our Definitive Proxy Statement (which will be filed with the SEC pursuant to Regulation 14A under the Exchange Act) relating to our 2018 Annual Meeting of Shareholders (our “2018 Proxy Statement”) under the captions “Corporate Governance” and “Share Ownership Information.”
|
73
|
Cardinal Health
|
Fiscal 2018 Form 10-K
|
|
|
Security Ownership of Certain Beneficial Owners and Management and Related Stockholder Matters
|
||
Security Ownership of Certain Beneficial Owners and Management and Related Stockholder Matters
The table below summarizes information relating to our equity compensation plans at June 30, 2018.
|
Equity Compensation Plan Information
|
|||||||||||
|
Plan Category
|
Common Shares
to be Issued
Upon Exercise of Outstanding Options and Rights (#)
|
Weighted Average
Exercise Price of Outstanding Options ($)
|
Common Shares
Remaining Available
for Future Issuance
Under Equity
Compensation Plans (excluding securities
reflected in column (a)) (#)
|
||||||||
|
(a)
|
(b)
|
(c)
|
|||||||||
|
Equity compensation plans approved by shareholders
|
10,320,017
|
|
(1)
|
$
|
64.50
|
|
(1)
|
19,305,951
|
|
(2)
|
|
|
Equity compensation plans not approved by shareholders
|
4,203
|
|
(3)
|
—
|
|
(3)
|
—
|
|
|||
|
Total at June 30, 2018
|
10,324,220
|
|
19,305,951
|
|
|||||||
|
(1)
|
In addition to stock options outstanding under the Amended Cardinal Health, Inc. 2011 Long-Term Incentive Plan (the "2011 LTIP") and the Cardinal Health, Inc. 2005 Long-Term Incentive Plan (the "2005 LTIP"), also includes 827,766 PSUs and 2,165,340 RSUs outstanding under the 2011 LTIP, 10,241 PSUs and 61,861 RSUs outstanding under the 2005 LTIP, and 165,024 RSUs outstanding under the 2007 Nonemployee Directors Equity Incentive Plan that are payable solely in common shares. PSUs and RSUs do not have an exercise price, and therefore were not included for purposes of computing the weighted-average exercise price. PSUs granted in fiscal 2015 are not reported in this table because they expired without any shares vesting. PSUs granted in fiscal 2016 and 2017 are reported in this table at the maximum payout level (200% of target) in accordance with SEC rules.
|
|
(2)
|
Reflects common shares available under the 2011 LTIP in the form of stock options and other stock-based awards. Under the 2011 LTIP's fungible share counting provisions, stock options are counted against the plan as one share for every common share issued; awards other than stock options are counted against the plan as two and one-half shares for every common share issued. This means that only 7,722,380 shares could be issued under awards other than stock options while 19,305,951 shares could be issued under stock options.
|
|
(3)
|
RSUs outstanding under the Cardinal Health, Inc. Amended and Restated Outside Directors Equity Incentive Plan that are payable solely in common shares. RSUs do not have an exercise price, and therefore were not included for purposes of computing the weighted-average exercise price.
|
The other information called for by Item 12 of Form 10-K is incorporated by reference to our 2018 Proxy Statement under the caption “Share Ownership Information.”
|
Cardinal Health
|
Fiscal 2018 Form 10-K
|
74
|
|
|
Exhibits
|
||
Exhibits, Financial Statement Schedules
(a)(1) The following financial statements are included in the "Financial Statements" section of this report:
|
Page
|
|
|
Consolidated Financial Statements and Schedule:
|
|
(a)(2) The following Supplemental Schedule is included in this report:
All other schedules not listed above have been omitted as not applicable or because the required information is included in the Consolidated Financial Statements or in the Notes thereto.
|
Exhibit
Number
|
Exhibit Description
|
|
2.1.1
|
|
|
2.1.2
|
|
|
2.1.3
|
|
|
3.1
|
|
|
3.2
|
|
|
4.1
|
|
|
4.2.1
|
|
|
4.2.2
|
|
|
4.2.3
|
|
|
4.2.4
|
|
|
4.2.5
|
|
|
4.2.6
|
|
|
4.2.7
|
|
|
4.2.8
|
|
|
4.2.9
|
|
|
4.2.10
|
|
|
4.2.11
|
|
|
75
|
Cardinal Health
|
Fiscal 2018 Form 10-K
|
|
|
Exhibits
|
||
|
4.2.12
|
|
|
4.2.13
|
|
|
4.2.14
|
|
|
4.2.15
|
|
|
4.2.16
|
|
|
4.2.17
|
|
|
4.2.18
|
|
|
4.3
|
|
|
10.1.1
|
|
|
10.1.2
|
|
|
10.1.3
|
|
|
10.1.4
|
|
|
10.1.5
|
|
|
10.1.6
|
|
|
10.1.7
|
|
|
10.1.8
|
|
|
10.2.1
|
|
|
10.2.2
|
|
|
10.2.3
|
|
|
10.2.4
|
|
|
10.2.5
|
|
|
10.2.6
|
|
|
10.3.1
|
|
|
10.3.2
|
|
|
10.3.3
|
|
|
10.3.4
|
|
|
10.4.1
|
|
|
10.4.2
|
|
|
10.4.3
|
|
|
10.5.1
|
|
|
10.5.2
|
|
|
10.5.3
|
|
|
Cardinal Health
|
Fiscal 2018 Form 10-K
|
76
|
|
|
Exhibits
|
||
|
10.6
|
|
|
10.7.1
|
|
|
10.7.2
|
|
|
10.7.3
|
|
|
10.7.4
|
|
|
10.8.1
|
|
|
10.8.2
|
|
|
10.9
|
|
|
10.10
|
|
|
10.11
|
|
|
10.12.1
|
|
|
10.12.2
|
|
|
10.13.1
|
|
|
10.13.2
|
|
|
10.14.1
|
|
|
10.14.2
|
|
|
10.14.3
|
|
|
10.14.4
|
|
|
10.14.5
|
|
|
10.14.6
|
|
|
10.14.7
|
|
|
10.14.8
|
|
|
10.14.9
|
|
|
10.14.10
|
|
|
10.14.11
|
|
|
10.14.12
|
|
|
10.14.13
|
|
|
10.14.14
|
|
|
10.14.15
|
|
|
10.14.16
|
|
|
10.14.17
|
|
|
77
|
Cardinal Health
|
Fiscal 2018 Form 10-K
|
|
|
Exhibits
|
||
|
10.14.18
|
|
|
10.14.19
|
|
|
10.14.20
|
|
|
10.14.21
|
|
|
10.14.22
|
|
|
10.14.23
|
|
|
10.15.1
|
|
|
10.15.2
|
|
|
10.15.3
|
|
|
10.16.1
|
|
|
10.16.2
|
|
|
10.16.3
|
|
|
10.16.4
|
|
|
10.17.1
|
|
|
10.17.2
|
|
|
10.18.1
|
|
|
10.18.2
|
|
|
12.1
|
|
|
21.1
|
|
|
23.1
|
|
|
31.1
|
|
|
31.2
|
|
|
32.1
|
|
|
99.1
|
|
|
101.INS
|
XBRL Instance Document
|
|
101.SCH
|
XBRL Taxonomy Extension Schema Document
|
|
101.CAL
|
XBRL Taxonomy Extension Calculation Linkbase Document
|
|
101.DEF
|
XBRL Taxonomy Definition Linkbase Document
|
|
101.LAB
|
XBRL Taxonomy Extension Label Linkbase Document
|
|
101.PRE
|
XBRL Taxonomy Extension Presentation Linkbase Document
|
|
* Management contract or compensatory plan or arrangement.
|
|
|
Cardinal Health
|
Fiscal 2018 Form 10-K
|
78
|
|
|
Form 10-K Cross Reference Index
|
||
Form 10-K Cross Reference Index
|
Item
|
Page(s)
|
|
|
Part 1
|
||
|
1
|
||
|
1A
|
||
|
1B
|
Unresolved Staff Comments
|
N/A
|
|
2
|
||
|
3
|
||
|
4
|
Mine Safety Disclosures
|
N/A
|
|
Part II
|
||
|
5
|
||
|
6
|
||
|
7
|
||
|
7A
|
||
|
8
|
||
|
9
|
Changes in and Disagreements With Accountants on Accounting and Financial Disclosure
|
N/A
|
|
9A
|
||
|
9B
|
Other Information
|
N/A
|
|
Part III
|
||
|
10
|
||
|
11
|
Executive Compensation
|
(a)
|
|
12
|
||
|
13
|
Certain Relationships and Related Transactions, and Director Independence
|
(b)
|
|
14
|
Principal Accounting Fees and Services
|
(c)
|
|
Part IV
|
||
|
15
|
||
|
16
|
Form 10-K Summary
|
N/A
|
|
N/A
|
Not applicable
|
|
|
(a)
|
The information called for by Item 11 of Form 10-K is incorporated by reference to our 2018 Proxy Statement under the captions “Corporate Governance” and “Executive Compensation.”
|
|
|
(b)
|
The information called for by Item 13 of Form 10-K is incorporated by reference to our 2018 Proxy Statement under the caption "Corporate Governance."
|
|
|
(c)
|
The information called for by Item 14 of Form 10-K is incorporated by reference to our 2018 Proxy Statement under the caption “Audit Committee Matters.”
|
|
|
79
|
Cardinal Health
|
Fiscal 2018 Form 10-K
|
|
|
Signatures
|
||
Signatures
Pursuant to the requirements of Section 13 or 15(d) of the Securities Exchange Act of 1934, the registrant has duly caused this report to be signed on its behalf by the undersigned, thereunto duly authorized on
August 22, 2018
.
|
Cardinal Health, Inc.
|
||
|
By:
|
/s/ MICHAEL C. KAUFMANN
|
|
|
MICHAEL C. KAUFMANN
|
||
|
Chief Executive Officer
|
||
Pursuant to the requirements of the Securities Exchange Act of 1934, the registrant has duly caused this report to be signed below by the following persons on behalf of the registrant and in the capacities indicated on
August 22, 2018
.
|
Name
|
Title
|
|
|
/s/ MICHAEL C. KAUFMANN
|
Chief Executive Officer and Director (principal executive officer)
|
|
|
Michael C. Kaufmann
|
||
|
/s/ JORGE M. GOMEZ
|
Chief Financial Officer (principal financial officer)
|
|
|
Jorge M. Gomez
|
||
|
/s/ STUART G. LAWS
|
Senior Vice President and Chief Accounting Officer (principal accounting officer)
|
|
|
Stuart G. Laws
|
||
|
/s/ GEORGE S. BARRETT
|
Executive Chairman of the Board
|
|
|
George S. Barrett
|
||
|
/s/ DAVID J. ANDERSON
|
Director
|
|
|
David J. Anderson
|
||
|
/s/ COLLEEN F. ARNOLD
|
Director
|
|
|
Colleen F. Arnold
|
||
|
/s/ CARRIE S. COX
|
Director
|
|
|
Carrie S. Cox
|
||
|
/s/ CALVIN DARDEN
|
Director
|
|
|
Calvin Darden
|
||
|
/s/ BRUCE L. DOWNEY
|
Director
|
|
|
Bruce L. Downey
|
||
|
/s/ PATRICIA A. HEMINGWAY HALL
|
Director
|
|
|
Patricia A. Hemingway Hall
|
||
|
/s/ AKHIL JOHRI
|
Director
|
|
|
Akhil Johri
|
||
|
/s/ CLAYTON M. JONES
|
Director
|
|
|
Clayton M. Jones
|
||
|
/s/ GREGORY B. KENNY
|
Director
|
|
|
Gregory B. Kenny
|
||
|
/s/ NANCY KILLEFER
|
Director
|
|
|
Nancy Killefer
|
||
|
/s/ DAVID P. KING
|
Director
|
|
|
David P. King
|
||
|
Cardinal Health
|
Fiscal 2018 Form 10-K
|
80
|
|
TABLE OF CONTENTS