CARDINAL HEALTH INC
10-Ks and 10-Qs
|
|
|
|
|
|
|
|
|
|
|
|
|
|
|
|
|
|
|
|
|
|
|
|
|
|
|
|
|
|
|
|
|
|
|
|
|
|
|
|
|
|
|
|
|
|
|
|
|
|
|
|
|
|
|
|
|
|
|
UNITED STATES
SECURITIES AND EXCHANGE COMMISSION
Washington, D.C. 20549
Form
10-Q
|
þ
|
QUARTERLY REPORT PURSUANT TO SECTION 13 OR 15(d) OF THE SECURITIES EXCHANGE ACT OF 1934
|
For the quarterly period ended
March 31, 2018
or
|
o
|
TRANSITION REPORT PURSUANT TO SECTION 13 OR 15(d) OF THE SECURITIES EXCHANGE ACT OF 1934
|
For the transition period from ________ to ________
Commission File Number: 1-11373

Cardinal Health, Inc.
(Exact name of registrant as specified in its charter)
|
Ohio
|
31-0958666
|
|
(State or other jurisdiction of
incorporation or organization)
|
(IRS Employer
Identification No.)
|
|
7000 Cardinal Place, Dublin, Ohio
|
43017
|
|
(Address of principal executive offices)
|
(Zip Code)
|
|
(614) 757-5000
|
|
|
(Registrant’s telephone number, including area code)
|
|
Indicate by check mark whether the registrant (1) has filed all reports required to be filed by Section 13 or 15(d) of the Securities Exchange Act of 1934 during the preceding 12 months (or for such shorter period that the registrant was required to file such reports), and (2) has been subject to such filing requirements for the past 90 days. Yes
þ
No
o
Indicate by check mark whether the registrant has submitted electronically and posted on its corporate Website, if any, every Interactive Data File required to be submitted and posted pursuant to Rule 405 of Regulation S-T (§232.405 of this chapter) during the preceding 12 months (or for such shorter period that the registrant was required to submit and post such files). Yes
þ
No
o
Indicate by check mark whether the registrant is a large accelerated filer, an accelerated filer, a non-accelerated filer, a smaller reporting company, or an emerging growth company. See the definitions of “large accelerated filer,” “accelerated filer,” “smaller reporting company” and "emerging growth company" in Rule 12b-2 of the Exchange Act.
|
Large accelerated filer
þ
|
Accelerated filer
o
|
|
Non-accelerated filer
o
(Do not check if a smaller reporting company)
|
Smaller reporting company
o
|
|
Emerging growth company
o
|
|
|
If an emerging growth company, indicate by check mark if the registrant has elected not to use the extended transition period for complying with any new or revised financial accounting standards provided pursuant to Section 13(a) of the Exchange Act
o
|
|
Indicate by check mark whether the registrant is a shell company (as defined in Rule 12b-2 of the Exchange Act). Yes
o
No
þ
The number of the registrant’s common shares, without par value, outstanding as of
April 30, 2018
, was the following:
310,685,049
.
|
Cardinal Health
Q3 Fiscal 2018 Form 10-Q
|
Table of Contents
|
Page
|
|
About Cardinal Health
Cardinal Health, Inc. is an Ohio corporation formed in 1979 and is a globally integrated healthcare services and products company providing customized solutions for hospitals, healthcare systems, pharmacies, ambulatory surgery centers, clinical laboratories and physician offices. We provide medical products and pharmaceuticals and cost-effective solutions that enhance supply chain efficiency. We connect patients, providers, payers, pharmacists and manufacturers for integrated care coordination and better patient management. We manage our business and report our financial results in two segments: Pharmaceutical and Medical. As used in this report, “we,” “our,” “us,” and similar pronouns refer to Cardinal Health, Inc. and its subsidiaries, unless the context requires otherwise. Our fiscal year ends on June 30. References to fiscal 2018 and fiscal 2017 are to the fiscal years ending or ended June 30, 2018 and June 30, 2017, respectively.
Forward-Looking Statements
This Quarterly Report on Form 10-Q for the quarter ended
March 31, 2018
(this "Form 10-Q") (including information incorporated by reference) includes "forward-looking statements" addressing expectations, prospects, estimates and other matters that are dependent upon future events or developments. Many forward-looking statements appear in Management’s Discussion and Analysis of Financial Condition and Results of Operations ("MD&A"), but there are others in this Form 10-Q, which may be identified by words such as "expect," "anticipate," "intend," "plan," "believe," "will," "should," "could," "would," "project," "continue," "likely," and similar expressions, and include statements reflecting future results, trends or guidance, statements of outlook and expense accruals. These matters are subject to risks and uncertainties that could cause actual results to differ materially from those made, projected or implied. The most significant of these risks and uncertainties are described in Exhibit 99.1 to this Form 10-Q and in "Risk Factors" in our Annual Report on Form 10-K for the fiscal year ended
June 30, 2017
(our “
2017
Form 10-K”). Forward-looking statements in this Form 10-Q speak only as of the date of this document. Except to the extent required by applicable law, we undertake no obligation to update or revise any forward-looking statement.
Non-GAAP Financial Measures
In the "Overview of Consolidated Results" section of MD&A, we use financial measures that are derived from our consolidated financial data but are not presented in our condensed consolidated financial statements prepared in accordance with U.S. generally accepted accounting principles ("GAAP"). These measures are considered "non-GAAP financial measures" under the Securities and Exchange Commission ("SEC") rules. The reasons we use these non-GAAP financial measures and the reconciliations to their most directly comparable GAAP financial measures are included in the “Explanation and Reconciliation of Non-GAAP Financial Measures” section following MD&A in this Form 10-Q.
|
1
|
Cardinal Health
|
Q3
Fiscal 2018 Form 10-Q
|
|
|
MD&A
|
Overview
|
|
Management's Discussion and Analysis of Financial Condition and Results of Operations
The discussion and analysis presented below is concerned with material changes in financial condition and results of operations between the periods specified in our condensed consolidated balance sheets at
March 31, 2018
and
June 30, 2017
, and in our condensed consolidated statements of earnings for the three and nine months ended
March 31, 2018
and
2017
. All comparisons presented are with respect to the prior-year period, unless stated otherwise. This discussion and analysis should be read in conjunction with the MD&A included in our
2017
Form 10-K.
Overview of Consolidated Results
Revenue
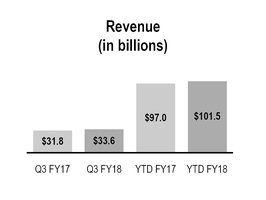
During the three and nine months ended
March 31, 2018
, revenue increased
6 percent
to
$33.6 billion
and
5 percent
to
$101.5 billion
, respectively, primarily due to sales growth from pharmaceutical distribution and specialty pharmaceutical customers, partially offset by the previously announced May 2017 expiration of a large pharmaceutical distribution mail order customer contract. The Patient Recovery Business acquisition also contributed to the increase in revenue during the three and nine months ended
March 31, 2018
.
|
Cardinal Health
|
Q3
Fiscal 2018 Form 10-Q
|
2
|
|
|
MD&A
|
Overview
|
|
GAAP and Non-GAAP Operating Earnings
|
Three Months Ended March 31,
|
Nine Months Ended March 31,
|
||||||||||||||||||||
|
(in millions)
|
2018
|
2017
|
Change
|
2018
|
2017
|
Change
|
|||||||||||||||
|
GAAP operating earnings
|
$
|
546
|
|
$
|
605
|
|
(10
|
)%
|
$
|
1,206
|
|
$
|
1,681
|
|
(28
|
)%
|
|||||
|
LIFO charges/(credits)
|
—
|
|
(9
|
)
|
—
|
|
—
|
|
|||||||||||||
|
Restructuring and employee severance
|
2
|
|
15
|
|
155
|
|
31
|
|
|||||||||||||
|
Amortization and other acquisition-related costs
|
175
|
|
128
|
|
543
|
|
365
|
|
|||||||||||||
|
Impairments and (gain)/loss on disposal of assets
|
(6
|
)
|
2
|
|
62
|
|
15
|
|
|||||||||||||
|
Litigation (recoveries)/charges, net
|
64
|
|
18
|
|
155
|
|
37
|
|
|||||||||||||
|
Non-GAAP operating earnings
|
$
|
781
|
|
$
|
759
|
|
3
|
%
|
$
|
2,121
|
|
$
|
2,129
|
|
—
|
%
|
|||||
The sum of the components may not equal the total due to rounding.
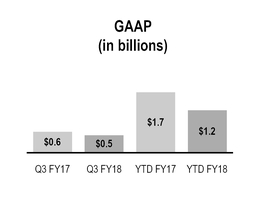
The decrease in GAAP operating earnings during the three months ended
March 31, 2018
was primarily due to increased amortization of acquisition-related intangible assets as a result of the Patient Recovery Business acquisition; litigation charges associated with inferior vena cava (IVC) filter product liability claims; performance from Cardinal Health Brand products; and a modest, negative impact from our Pharmaceutical segment generic program. These factors were partially offset by contributions from the Patient Recovery Business acquisition.
The decrease in GAAP operating earnings during the nine months ended
March 31, 2018
was primarily due to increased amortization of acquisition-related intangible assets as a result of the Patient Recovery Business acquisition; contract termination restructuring costs to transition the distribution of our Medical segment's surgeon gloves in certain international markets from a third-party distribution arrangement to a direct distribution model; litigation charges associated with inferior vena cava (IVC) filter product liability claims; a modest, negative impact from our Pharmaceutical segment generic program; performance from Cardinal Health Brand products; the loss on sale from the divestiture of our China distribution business; and the costs related to our multi-year project to replace certain Pharmaceutical segment finance and operating information systems. These factors were partially offset by contributions from the Patient Recovery Business acquisition.
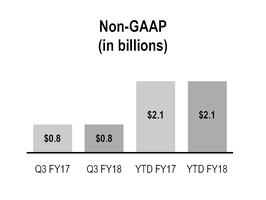
The increase in non-GAAP operating earnings during the three months ended
March 31, 2018
was primarily due to contributions from the Patient Recovery Business acquisition, partially offset by performance from Cardinal Health Brand products, primarily Cordis performance, and a modest, negative impact from our Pharmaceutical segment generic program.
The decrease in non-GAAP operating earnings during the nine months ended
March 31, 2018
was primarily due to performance from our Pharmaceutical segment generics program, performance from Cardinal Health Brand products and costs related to our multi-year project to replace certain Pharmaceutical segment finance and operating information systems. These were largely offset by contributions from the Patient Recovery Business acquisition.
|
3
|
Cardinal Health
|
Q3
Fiscal 2018 Form 10-Q
|
|
|
MD&A
|
Overview
|
|
GAAP and Non-GAAP Diluted EPS

|
Three Months Ended March 31,
|
Nine Months Ended March 31,
|
||||||||||||||||||||
|
($ per share)
|
2018
|
2017
|
Change
|
2018
|
2017
|
Change
|
|||||||||||||||
|
GAAP
(1)
|
$
|
0.81
|
|
$
|
1.20
|
|
(33
|
)%
|
$
|
4.50
|
|
$
|
3.17
|
|
42
|
%
|
|||||
|
LIFO charges/(credits)
|
—
|
|
(0.02
|
)
|
—
|
|
—
|
|
|||||||||||||
|
Restructuring and employee severance
|
0.06
|
|
0.03
|
|
0.40
|
|
0.06
|
|
|||||||||||||
|
Amortization and other acquisition-related costs
|
0.42
|
|
0.27
|
|
1.27
|
|
0.76
|
|
|||||||||||||
|
Impairments and (gain)/loss on disposal of assets
|
0.02
|
|
0.01
|
|
0.38
|
|
0.03
|
|
|||||||||||||
|
Litigation (recoveries)/charges, net
|
0.14
|
|
0.03
|
|
0.33
|
|
0.07
|
|
|||||||||||||
|
Transitional tax benefit, net
|
(0.06
|
)
|
—
|
|
(2.88
|
)
|
—
|
|
|||||||||||||
|
Non-GAAP
(1)
|
$
|
1.39
|
|
$
|
1.53
|
|
(9
|
)%
|
$
|
3.99
|
|
$
|
4.10
|
|
(3
|
)%
|
|||||
The sum of the components may not equal the total due to rounding.
|
(1)
|
diluted earnings per share attributable to Cardinal Health, Inc. ("diluted EPS")
|
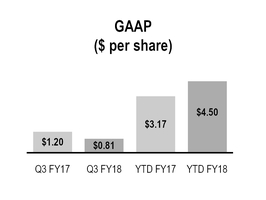
During the three months ended
March 31, 2018
, GAAP diluted EPS decreased primarily due to a higher effective tax rate and an increase in interest expense. The higher effective tax rate is due to a change in discrete items, a reduction in projected Cordis income and its impact on jurisdictional mix encompassing U.S. and international operations, partially offset by the net benefit from enactment of the U.S. Tax Cuts and Jobs Act ("Tax Act").
During the nine months ended
March 31, 2018
, GAAP diluted EPS increased primarily due to the net benefit from enactment of the Tax Act, which includes a provisional net benefit of $952 million related to the remeasurement of our deferred tax assets and liabilities to the new federal statutory rate, as well as the benefit from applying a lower federal tax rate to our year-to-date U.S. pre-tax earnings and a provisional tax expense of $41 million for a one-time repatriation tax applied to undistributed foreign earnings. This net tax benefit was partially offset by an increase in interest expense.
During the three months ended
March 31, 2018
, non-GAAP diluted EPS decreased primarily due to a higher non-GAAP effective tax rate and an increase in interest expense, partially offset by the net benefit of the factors impacting non-GAAP operating earnings.
During the nine months ended
March 31, 2018
, non-GAAP diluted EPS decreased primarily due to an increase in interest expense, partially offset by the benefit of applying a lower U.S. federal statutory tax rate to U.S. pre-tax non-GAAP earnings as a result of the Tax Act.
Cash and Equivalents
Our cash and equivalents balance was
$2.2 billion
at
March 31, 2018
compared to
$6.9 billion
at
June 30, 2017
. The decrease in cash and equivalents during the nine months ended
March 31, 2018
was due to $6.1 billion paid for acquisitions,
$436 million
paid in dividends,
$450 million
paid for share repurchases and
$403 million paid to redeem our 1.7% notes due 2018. These were offset in part by net cash of
$2.2 billion
provided by operating activities and
$861 million
of net cash proceeds from the sale of our China distribution business.
|
Cardinal Health
|
Q3
Fiscal 2018 Form 10-Q
|
4
|
|
|
MD&A
|
Overview
|
|
Significant Developments in Fiscal 2018 and Trends
Acquisitions and Divestitures
Patient Recovery Business Acquisition
On July 29, 2017, we acquired the Patient Care, Deep Vein Thrombosis, and Nutritional Insufficiency businesses (the "Patient Recovery Business") from Medtronic plc for
$6.1 billion
in cash. The Patient Recovery Business manufactures 23 categories of medical products that are sold into multiple healthcare channels, and includes numerous industry-leading brands, such as Curity, Kendall, Dover, Argyle and Kangaroo. The acquisition further expanded the Medical segment's portfolio of self-manufactured products.
China Distribution Business Divestiture
During the three months ended March 31, 2018, we completed the divestiture of our pharmaceutical and medical products distribution business in China (the "China distribution business") to Shanghai Pharmaceuticals Holding Co., Ltd. for gross proceeds of $1.2 billion. The net proceeds were
$861 million
after adjusting for third party indebtedness and preliminary transaction adjustments. The net proceeds are not reflective of tax obligations due in connection with the sale, for which we have recorded a liability of $57 million. In connection with the divestiture, we recognized a net loss of $60 million, which is comprised of the $67 million disposal group write-down which was recognized during the three months ended December 31, 2017 when we entered into the definitive agreement to sell the business, offset by a $7 million gain recognized during the three months ended March 31, 2018 resulting from fluctuations in working capital and foreign currency exchange rates.
Trends
Segment Performance for the Remainder of Fiscal 2018 and for Fiscal 2019
Within our Medical segment Cordis business, we expect continued operating cost and inventory challenges to negatively impact segment profit for the remainder of fiscal 2018.
Within our Pharmaceutical segment, we expect customer pricing changes to negatively impact segment profit for the remainder of fiscal 2018 and for fiscal 2019. We also expect fiscal 2019 to be negatively impacted by the previously-announced loss of a large pharmaceutical distribution customer. As is generally the case, the frequency, timing, magnitude, and profit impact of customer pricing changes, branded and generic pharmaceutical manufacturer pricing changes and customer wins and losses are uncertain and their impact on segment profit for the remainder of fiscal 2018 and for fiscal 2019 could be more or less than we expect.
Tax Cuts and Jobs Act
The Tax Act was enacted in December 2017. The Tax Act, among other things, reduced the U.S. federal corporate tax rate from 35 percent to 21 percent and requires companies to pay a one-time tax to repatriate, for U.S. purposes, earnings of certain foreign subsidiaries that were previously deferred for tax purposes. In addition, beginning in our fiscal year 2019, it limits certain deductions and creates new taxes on certain foreign sourced earnings. The rate change was effective at the beginning of calendar year 2018 and, as a result, we have a blended U.S. federal statutory tax rate of 28.1 percent for our fiscal year 2018. The application of the lower federal tax rate to our year-to-date U.S. pre-tax earnings resulted in a tax benefit during the nine months ended March 31, 2018. We expect the lower federal statutory rate to have a significant positive impact on earnings per share in our fiscal year 2019. Additionally, we recognized a $911 million provisional net transitional tax benefit during the nine months ended March 31, 2018, comprised of the remeasurement of our U.S. deferred tax assets and liabilities at the lower tax rate partially offset by the expense for the repatriation tax.
We are still completing our accounting for the tax effects of the Tax Act because all of the necessary information is not currently available, prepared, or analyzed. As such, the amounts we have recorded are provisional estimates and, as permitted by the SEC, we will continue to assess the impact of enactment of the Tax Act and we may record additional provisional amounts or adjustments to provisional amounts during the remainder of fiscal 2018 and in the first half of fiscal 2019.
|
5
|
Cardinal Health
|
Q3
Fiscal 2018 Form 10-Q
|
|
|
MD&A
|
Results of Operations
|
|
Results of Operations
Revenue
|
|
|
Three Months Ended March 31,
|
Nine Months Ended March 31,
|
||||||||||||||||||||
|
(in millions)
|
2018
|
2017
|
Change
|
2018
|
2017
|
Change
|
|||||||||||||||
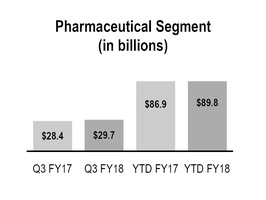
|
Pharmaceutical
|
$
|
29,720
|
|
$
|
28,406
|
|
5
|
%
|
$
|
89,786
|
|
$
|
86,911
|
|
3
|
%
|
|||||
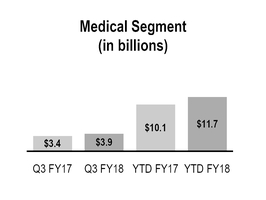
|
Medical
|
3,916
|
|
3,418
|
|
15
|
%
|
11,684
|
|
10,107
|
|
16
|
%
|
|||||||||
|
Total segment revenue
|
33,636
|
|
31,824
|
|
6
|
%
|
101,470
|
|
97,018
|
|
5
|
%
|
|||||||||
|
Corporate
|
(3
|
)
|
(3
|
)
|
—
|
%
|
(10
|
)
|
(8
|
)
|
25
|
%
|
|||||||||
|
Total revenue
|
$
|
33,633
|
|
$
|
31,821
|
|
6
|
%
|
$
|
101,460
|
|
$
|
97,010
|
|
5
|
%
|
|||||
Pharmaceutical Segment
Pharmaceutical segment revenue growth was primarily due to sales growth from pharmaceutical distribution and specialty pharmaceutical customers, which together increased revenue by $2.6 billion and $6.1 billion during the three and nine months ended
March 31, 2018
, respectively. The increases were partially offset by the previously announced May 2017 expiration of a large pharmaceutical distribution mail order customer contract and the February 2018 divestiture of our China distribution business.
Medical Segment
Medical segment revenue growth for the three months ended
March 31, 2018
was primarily due to $526 million of contributions from acquisitions,
which primarily includes the
Patient Recovery Business acquisition.
Medical segment revenue growth for the nine months ended
March 31, 2018
was primarily due to $1.4 billion of contributions from acquisitions,
which primarily includes the
Patient Recovery Business acquisition, and sales growth from new and existing customers.
Cost of Products Sold
Cost of products sold f
or the three and nine months ended
March 31, 2018
increased
$1.6 billion
(
5 percent
) and
$3.9 billion
(
4 percent
) compared to the prior-year periods, respectively, as a result of the same factors affecting the changes in revenue and gross margin.
|
Cardinal Health
|
Q3
Fiscal 2018 Form 10-Q
|
6
|
|
|
MD&A
|
Results of Operations
|
|
Gross Margin
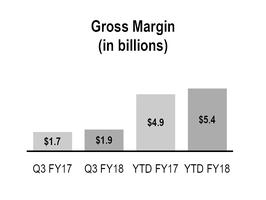

|
Three Months Ended March 31,
|
Nine Months Ended March 31,
|
||||||||||||||||||||
|
(in millions)
|
2018
|
2017
|
Change
|
2018
|
2017
|
Change
|
|||||||||||||||
|
Gross margin
|
$
|
1,913
|
|
$
|
1,728
|
|
11
|
%
|
$
|
5,446
|
|
$
|
4,921
|
|
11
|
%
|
|||||
Gross margin during the three and nine months ended
March 31, 2018
increased $185 million and $525 million, respectively, compared to the prior-year periods primarily due to acquisitions ($232 million and $568 million, respectively), which primarily includes the Patient Recovery Business acquisition.
Gross margin rate grew 26 and 30 basis points during the three and nine months ended
March 31, 2018
, respectively, due to acquisitions, which primarily includes the Patient Recovery Business
acquisition
, partially offset by the negative impact of changes in pharmaceutical distribution product mix.
Distribution, Selling, General and Administrative ("SG&A") Expenses
|
Three Months Ended March 31,
|
Nine Months Ended March 31,
|
||||||||||||||||||||
|
(in millions)
|
2018
|
2017
|
Change
|
2018
|
2017
|
Change
|
|||||||||||||||
|
SG&A expenses
|
$
|
1,132
|
|
$
|
960
|
|
18
|
%
|
$
|
3,325
|
|
$
|
2,792
|
|
19
|
%
|
|||||
The increase in SG&A expenses during the three and nine months ended
March 31, 2018
was largely due to acquisitions ($142 million and $367 million, respectively), which primarily includes the Patient Recovery Business
acquisition. The increase i
n SG&A expenses during the nine months ended
March 31, 2018
also includes costs related to our multi-year project to replace certain Pharmaceutical segment finance and operating information systems.
|
7
|
Cardinal Health
|
Q3
Fiscal 2018 Form 10-Q
|
|
|
MD&A
|
Results of Operations
|
|
Segment Profit
We evaluate segment performance based on segment profit, among other measures. See
Note 15
of the "Notes to Condensed Consolidated Financial Statements" for additional information on segment profit.
|
Three Months Ended March 31,
|
Nine Months Ended March 31,
|
||||||||||||||||||||
|
(in millions)
|
2018
|
2017
|
Change
|
2018
|
2017
|
Change
|
|||||||||||||||
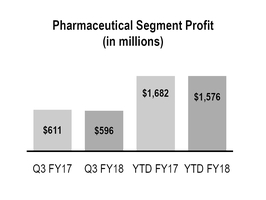
|
Pharmaceutical
|
$
|
596
|
|
$
|
611
|
|
(3
|
)%
|
$
|
1,576
|
|
$
|
1,682
|
|
(6
|
)%
|
|||||
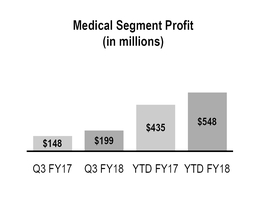
|
Medical
|
199
|
|
148
|
|
34
|
%
|
548
|
|
435
|
|
26
|
%
|
|||||||||
|
Total segment profit
|
795
|
|
759
|
|
5
|
%
|
2,124
|
|
2,117
|
|
—
|
%
|
|||||||||
|
Corporate
|
(249
|
)
|
(154
|
)
|
62
|
%
|
(918
|
)
|
(436
|
)
|
111
|
%
|
|||||||||
|
Total consolidated operating earnings
|
$
|
546
|
|
$
|
605
|
|
(10
|
)%
|
$
|
1,206
|
|
$
|
1,681
|
|
(28
|
)%
|
|||||
Pharmaceutical Segment Profit
Pharmaceutical segment profit during the three months ended
March 31, 2018
was adversely impacted by our generic program performance, which includes the negative impact of generic pharmaceutical customer pricing changes partially offset by the benefits of Red Oak Sourcing. Performance from our specialty pharmaceutical products distribution and services business positively impacted Pharmaceutical segment profit.
The decrease in Pharmaceutical segment profit during the nine months ended
March 31, 2018
was primarily due to our generic program performance and the costs related to our multi-year project to replace certain Pharmaceutical segment finance and operating information systems. Performance from our specialty pharmaceutical products distribution and services business positively impacted Pharmaceutical segment profit.
Medical Segment Profit
The increase in Medical segment profit during the three months ended
March 31, 2018
was due to acquisitions, which primarily includes the Patient Recovery Business acquisition. The increase was partially offset by performance from the Cordis business, and to a lesser extent, performance from other Cardinal Health Brand products.
The increase in Medical segment profit during the nine months ended
March 31, 2018
was primarily due to acquisitions, which included the unfavorable cost of products sold impact from the fair value step up of inventory acquired with the Patient Recovery Business acquisition. The increase was partially offset by performance from the Cordis business, and to a lesser extent, performance from other Cardinal Health Brand products.
The performance from the Cordis business for both periods primarily reflects operating costs and inventory reserves.
Corporate
The changes in Corporate during the three and nine months ended
March 31, 2018
were due to the factors discussed in the Other Components of Consolidated Operating Earnings section that follows.
|
Cardinal Health
|
Q3
Fiscal 2018 Form 10-Q
|
8
|
|
|
MD&A
|
Results of Operations
|
|
Other Components of Consolidated Operating Earnings
In addition to revenue, gross margin and SG&A expenses discussed previously, consolidated operating earnings were impacted by the following:
|
Three Months Ended March 31,
|
Nine Months Ended March 31,
|
||||||||||||||
|
(in millions)
|
2018
|
2017
|
2018
|
2017
|
|||||||||||
|
Restructuring and employee severance
|
$
|
2
|
|
$
|
15
|
|
$
|
155
|
|
$
|
31
|
|
|||
|
Amortization and other acquisition-related costs
|
175
|
|
128
|
|
543
|
|
365
|
|
|||||||
|
Impairments and (gain)/loss on disposal of assets, net
|
(6
|
)
|
2
|
|
62
|
|
15
|
|
|||||||
|
Litigation (recoveries)/charges, net
|
64
|
|
18
|
|
155
|
|
37
|
|
|||||||
Restructuring and Employee Severance
The increase in restructuring and employee severance during the nine months ended
March 31, 2018
was primarily due to $125 million in contract termination costs to transition the distribution of our Medical segment's surgeon gloves in certain international markets from a third-party distribution arrangement to a direct distribution model.
Amortization and Other Acquisition-Related Costs
Amortization of acquisition-related intangible assets was
$149 million
and
$96 million
for the three months ended
March 31, 2018
and
2017
, respectively, and
$434 million
and
$291 million
for the nine months ended
March 31, 2018
and
2017
, respectively. The increases in amortization of acquisition-related intangible assets during the three and nine months ended
March 31, 2018
were largely due to the Patient Recovery Business acquisition.
Transaction and integration costs associated with the Patient Recovery Business acquisition were $25 million and $85 million for the three and nine months ended
March 31, 2018
, respectively.
Impairments and (gain)/loss on disposal of assets, net
During the nine months ended
March 31, 2018
we recognized a net loss of $60 million related to the divestiture of our China distribution business. This loss is comprised of the $67 million disposal group write-down which was recognized during the three months ended December 31, 2017 when we entered into the definitive agreement to sell the business, offset by a $7 million gain recognized during the three months ended
March 31, 2018
resulting from fluctuations in working capital and foreign currency exchange rates.
Litigation (Recoveries)/Charges, Net
The increases in litigation charges during the three and nine months ended
March 31, 2018
were due to an increase in estimated losses and legal defense costs associated with inferior vena cava (IVC) filter product liability claims.
Earnings Before Income Taxes
|
|
In addition to the items discussed above, earnings before income taxes were impacted by the following:
|
Three Months Ended March 31,
|
Nine Months Ended March 31,
|
||||||||||||||||||||
|
(in millions)
|
2018
|
2017
|
Change
|
2018
|
2017
|
Change
|
|||||||||||||||
|
Other (income)/expense, net
|
$
|
(2
|
)
|
$
|
(5
|
)
|
N.M.
|
|
$
|
(6
|
)
|
$
|
(2
|
)
|
N.M.
|
|
|||||
|
Interest expense, net
|
$
|
84
|
|
$
|
46
|
|
83
|
%
|
$
|
251
|
|
$
|
134
|
|
87
|
%
|
|||||
|
Loss on extinguishment of debt
|
$
|
—
|
|
$
|
—
|
|
N.M.
|
|
$
|
2
|
|
$
|
—
|
|
N.M.
|
|
|||||
Interest expense, net
The increases in interest expense during the three and nine months ended
March 31, 2018
were primarily due to new debt issued in June 2017 to fund a portion of the purchase price of the Patient Recovery Business acquisition.
|
9
|
Cardinal Health
|
Q3
Fiscal 2018 Form 10-Q
|
|
|
MD&A
|
Results of Operations
|
|
Provision for/(Benefit from) Income Taxes
During the three months ended
March 31, 2018
and
2017
, the effective tax rate was
45.1 percent
and
32.3 percent
, respectively. The effective tax rate for the three months ended
March 31, 2018
was negatively impacted by a reduction in projected Cordis income and its impact on jurisdictional mix encompassing U.S. and international operations, as well as net unfavorable discrete items of $18 million, partially offset by the favorable impact of the lower U.S. federal income tax rate from enactment of the Tax Act. The effective tax rate for the three months ended March 31, 2017 was impacted by net favorable discrete items of $31 million.
During the nine months ended
March 31, 2018
and
2017
, the effective tax rate was
(48.6) percent
and
34.4 percent
, respectively. The effective tax rate for the nine months ended
March 31, 2018
was favorably impacted by the provisional net benefit from enactment of the Tax Act.
The provisional net benefit from the Tax Act during the three and nine months ended
March 31, 2018
includes a provisional net tax benefit of $18 million and $952 million, respectively, related to the remeasurement of our deferred tax assets and liabilities to the new federal statutory rate, the benefit from the impact of applying a lower federal tax rate to our year-to-date U.S. pre-tax earnings and a provisional tax expense of $41 million for the one-time repatriation tax applied to our undistributed foreign earnings.
Our effective tax rate for the nine months ended March 31, 2018 also includes
$57 million
of tax expense recognized during the three months ended December 31, 2017 in connection with the sale of our China distribution business.
|
Cardinal Health
|
Q3
Fiscal 2018 Form 10-Q
|
10
|
|
|
MD&A
|
Liquidity and Capital Resources
|
|
Liquidity and Capital Resources
We currently believe that, based on available capital resources (cash on hand and committed credit facilities) and projected operating cash flow, we have adequate capital resources to fund working capital needs; currently anticipated capital expenditures; currently anticipated business growth and expansion; contractual obligations; tax payments; and current and projected debt service requirements, dividends and share repurchases. If we decide to engage in one or more acquisitions, depending on the size and timing of such transactions, we may need to access capital markets for additional financing.
Cash and Equivalents
Our cash and equivalents balance was
$2.2 billion
at
March 31, 2018
compared to
$6.9 billion
at
June 30, 2017
. At
March 31, 2018
, our cash and equivalents were held in cash depository accounts with major banks or invested in high quality, short-term liquid investments.
During the nine months ended
March 31, 2018
, we deployed $6.1 billion for acquisitions, net of cash acquired,
$450 million
on share repurchases,
$436 million
for dividends, $403 million to redeem our 1.7% notes due 2018 and
$246 million
for capital expenditures. This was partially offset by net cash of
$2.2 billion
provided by operating activities and the
$861 million
of net proceeds from the divestiture of the China distribution business. The $1.8 billion increase in net cash provided by operating activities during the nine months ended
March 31, 2018
compared to $460 million in the prior-year period was primarily due to changes in working capital.
The cash and equivalents balance at
March 31, 2018
includes
$614 million
of cash held by subsidiaries outside of the United States
.
Though our foreign earnings as of December 31, 2017 have been deemed to be repatriated from a U.S. federal tax perspective, we have not yet completed our assessment of the Tax Act on our plans to reinvest foreign earnings and as such have not changed our prior conclusion that the earnings are indefinitely reinvested. As such, no non-U.S. taxes were recorded at
March 31, 2018
. If we decide to repatriate these earnings in the future, we may be subject to certain non-U.S. taxes at that time. See
Note 8
of the "Notes to Condensed Consolidated Financial Statements" for additional information on the Tax Act.
Changes in working capital, which impact operating cash flow, can vary significantly depending on factors such as the timing of customer payments, inventory purchases and payments to vendors in the regular course of business, as well as fluctuating working capital needs driven by customer and product mix.
Other Financing Arrangements and Financial Instruments
Credit Facilities and Commercial Paper
In addition to cash and equivalents and operating cash flow, other sources of liquidity include a
$2.0 billion
commercial paper program, which is backed by a
$2.0 billion
revolving credit facility, and a
$1.0 billion
committed receivables sales facility program.
At
March 31, 2018
, we had no amounts outstanding under the commercial paper program, revolving credit facility or the committed receivables sales facility program. During the nine months ended
March 31, 2018
, we had maximum amounts outstanding under our
commercial paper and committed receivables programs of
$1.7 billion
and an average daily amount outstanding of
$363 million
.
Our revolving credit facility and committed receivables sales facility programs require us to maintain, as of the end of any calendar quarter, a consolidated leverage ratio of
no more than 4.25-to-1
, which will reduce to 3.25-to-1 in March 2019. The ratio temporarily increased as a result of our acquisition of the Patient Recovery Business. As of
March 31, 2018
, we were in compliance with this financial covenant.
|
11
|
Cardinal Health
|
Q3
Fiscal 2018 Form 10-Q
|
|
|
MD&A
|
Liquidity and Capital Resources
|
|
Capital Deployment
Capital Expenditures
Capital expenditures during the nine months ended
March 31, 2018
and
2017
were
$246 million
and
$293 million
, respectively.
Dividends
On February 7, 2018, our Board of Directors approved a quarterly dividend of
$0.4624
per share, or
$1.85
per share on an annualized basis, which was paid on April 15, 2018 to shareholders of record on April 2, 2018.
Share Repurchases
During the three months ended
March 31, 2018
, we repurchased
$300 million
of our common shares pursuant to an accelerated share repurchase ("ASR") program, which was completed in March 2018. See
Note 13
of the "Notes to condensed consolidated financial statements" for additional information. During the nine months ended
March 31, 2018
, we repurchased
$450 million
of our common shares. We funded the repurchases with available cash and short term borrowings.
On February 7, 2018, our Board of Directors approved a new $1.0 billion share repurchase program that expires on December 31, 2020. At
March 31, 2018
, we had
$993 million
remaining under that program.
Funding for Acquisition of Patient Recovery Business
On July 29, 2017, we acquired the Patient Recovery Business from Medtronic plc for $6.1 billion in cash. We funded the acquisition through $4.5 billion in new long-term debt issued in June 2017, the use of existing cash and borrowings under existing credit arrangements.
China Distribution Business Divestiture
On February 1, 2018, we completed the divestiture of our China distribution business to
Shanghai Pharmaceuticals Holding Co., Ltd. for gross proceeds of
$1.2 billion
. The net
proceeds were
$861 million
after adjusting for third-party indebtedness
and preliminary transaction adjustments. The net proceeds are not reflective of tax obligations due in connection with the sale, for which we have recorded a liability of $57 million. The purchase price is subject to adjustment based on working capital requirements as set forth in the definitive agreement.
|
Cardinal Health
|
Q3
Fiscal 2018 Form 10-Q
|
12
|
|
|
MD&A
|
Other Items
|
|
Other Items
The MD&A in our
2017
Form 10-K addresses our contractual obligations and off-balance sheet arrangements, as of and for the fiscal year ended
June 30, 2017
. There have been no subsequent material changes outside of the ordinary course of business to those items.
Critical Accounting Policies and Sensitive Accounting Estimates
The discussion and analysis presented below is concerned with material changes in critical accounting policies and sensitive accounting estimates between the periods specified in our condensed consolidated balance sheets at March 31, 2018 and June 30, 2017. This discussion and analysis should be read in conjunction with the Critical Accounting Policies and Sensitive Accounting Estimates included in our 2017 Form 10-K. There have been no changes to our critical accounting policies and sensitive accounting estimates, except related to Goodwill detailed below and the accounting effects resulting from the Tax Act as discussed further in
Note 8
, respectively, of the "Notes to Condensed Consolidated Financial Statements."
Critical accounting policies are those accounting policies that (i) can have a significant impact on our financial condition and results of operations and (ii) require the use of complex and subjective estimates based upon past experience and management’s judgment. Other people applying reasonable judgment to the same facts and circumstances could develop different estimates. Because estimates are inherently uncertain, actual results may differ. In this section, we describe the significant policies applied in preparing our consolidated financial statements that management believes are the most dependent on estimates and assumptions for goodwill impairment testing.
Goodwill
In January 2017, the Financial Accounting Standards Board issued amended accounting guidance that simplifies the accounting for goodwill impairment by eliminating the step of measuring a goodwill impairment by estimating the implied fair value of goodwill. Instead, goodwill impairment will be measured as the amount by which the reporting unit's carrying value exceeds its fair value, limited to the carrying value of goodwill. We adopted this guidance in the second quarter of fiscal 2018. For further discussion of accounting policies, see Critical Accounting Policies and Sensitive Accounting Estimates and
Note 1
of the “Notes to Consolidated Financial Statements” contained in our 2017 Form 10-K.
Purchased goodwill is tested for impairment at least annually. Qualitative factors are first assessed to determine if it is more likely than not that the fair value of a reporting unit is less than its carrying amount. If it is determined that it is more likely than not that the fair value does not exceed the carrying amount, then a quantitative test is performed. The quantitative goodwill impairment test involves a comparison of the estimated fair value of the reporting unit to the respective carrying amount.
Goodwill impairment testing involves judgment, including the identification of reporting units, qualitative evaluation of events and circumstances to determine if it is more likely than not that an impairment exists, and, if necessary, the estimation of the fair value of the applicable reporting unit. Our qualitative evaluation considers the weight of evidence and significance of all identified events and circumstances and most relevant drivers of fair value, both positive and negative, in determining whether it is more likely than not that the fair value of a reporting unit is less than its carrying amount.
Medical Unit Goodwill Qualitative Assessment
The divisions of our Medical operating segment, excluding our Cardinal Health at Home and naviHealth divisions, form a single reporting unit (“Medical Unit”). In connection with classification of the China distribution business as assets held for sale in the second quarter of fiscal 2018, we performed a quantitative assessment for goodwill impairment of our Medical Unit and determined that the fair value exceeded its carrying value by approximately 8 percent, and therefore no impairment was recognized. The goodwill balance for our Medical Unit was $5.7 billion at March 31, 2018.
Due to indications of lower than expected fiscal 2018 profit for the Medical Unit, particularly within our Cordis business, we performed a qualitative assessment for goodwill impairment of our Medical Unit as of March 31, 2018. A qualitative goodwill impairment assessment is an inherently judgmental process that depends on the critical evaluation of various factors that may individually or in the aggregate indicate that it is more likely than not that the fair value of a reporting unit is less than its carrying value. Our qualitative assessment considered factors, both positive and negative, that differ from the analysis that we conducted in the second quarter of fiscal 2018, including, as a positive factor, lower U.S. Federal taxes from the enactment of the Tax Act, and as a negative factor, the decrease in expected profits. In weighing the totality of the positive and negative factors, and considering the result of corroborating quantitative sensitivity analyses, we concluded that it is not more likely than not that the fair value of the Medical Unit is less than its carrying amount and therefore a quantitative assessment is not required.
|
13
|
Cardinal Health
|
Q3
Fiscal 2018 Form 10-Q
|
|
|
Explanation and Reconciliation of Non-GAAP Financial Measures
|
||
Explanation and Reconciliation of Non-GAAP Financial Measures
The "Overview of Consolidated Results" section within MD&A in this Form 10-Q contains financial measures that are not calculated in accordance with GAAP.
In addition to analyzing our business based on financial information prepared in accordance with GAAP, we use these non-GAAP financial measures internally to evaluate our performance, engage in financial and operational planning, and determine incentive compensation because we believe that these measures provide additional perspective on and, in some circumstances are more closely correlated to, the performance of our underlying, ongoing business. We provide these non-GAAP financial measures to investors as supplemental metrics to assist readers in assessing the effects of items and events on our financial and operating results on a year-over-year basis and in comparing our performance to that of our competitors. However, the non-GAAP financial measures that we use may be calculated differently from, and therefore may not be comparable to, similarly titled measures used by other companies. The non-GAAP financial measures disclosed by us should not be considered a substitute for, or superior to, financial measures calculated in accordance with GAAP, and the financial results calculated in accordance with GAAP and reconciliations to those financial statements set forth below should be carefully evaluated.
Exclusions from Non-GAAP Financial Measures
Management believes it is useful to exclude the following items from the non-GAAP measures presented in this Form 10-Q for its own and for investors’ assessment of the business for the reasons identified below:
|
•
|
LIFO charges and credits
are excluded because the factors that drive last-in first-out ("LIFO") inventory charges or credits, such as pharmaceutical manufacturer price appreciation or deflation and year-end inventory levels (which can be meaningfully influenced by customer buying behavior immediately preceding our fiscal year-end), are largely out of our control and cannot be accurately predicted. The exclusion of LIFO charges from non-GAAP metrics facilitates comparison of our current financial results to our historical financial results and to our peer group companies’ financial results.
|
|
•
|
Restructuring and employee severance costs
are excluded because they relate to programs in which we fundamentally change our operations and because they are not part of the ongoing operations of our underlying business.
|
|
•
|
Amortization and other acquisition-related costs
are excluded primarily for consistency with the presentation of the financial results of our peer group companies. Additionally, costs for amortization of acquisition-related intangible assets are non-cash amounts, which are variable in amount and frequency and are significantly impacted by the timing and size of acquisitions, so their exclusion facilitates comparison of historical, current and forecasted financial results. We also exclude other acquisition-related costs, which are directly related to an acquisition but do not meet the criteria to be recognized on the acquired entity’s initial balance sheet as part of the purchase price allocation. These costs are also significantly impacted by the timing, complexity and size of acquisitions.
|
|
•
|
Impairments and gain or loss on disposal of assets
are excluded because they do not occur in or reflect the ordinary course of our ongoing business operations and are inherently unpredictable in timing and amount, and in the case of impairments, are non-cash amounts, so their exclusion facilitates comparison of historical, current and forecasted financial results.
|
|
•
|
Litigation recoveries or charges, net
are excluded because they often relate to events that may have occurred in prior or multiple periods, do not occur in or reflect the ordinary course of our business and are inherently unpredictable in timing and amount.
|
|
•
|
Loss on extinguishment of debt
is excluded because it does not typically occur in the normal course of business and may obscure analysis of trends and financial performance. Additionally, the amount and frequency of this type of charge is not consistent and is significantly impacted by the timing and size of debt financing transactions.
|
|
•
|
Transitional tax benefit, net
related to the Tax Cuts and Jobs Act is excluded because it results from the one-time impact during the one-year measurement period of a very significant change in the U.S. federal corporate tax rate and, due to the significant size of the benefit, obscures analysis of trends and financial performance. The transitional tax benefit includes the initial estimate and measurement period adjustments for the re-measurement of deferred tax assets and liabilities due to the reduction of the U.S. federal corporate income tax rate and the repatriation tax on undistributed foreign earnings, both of which are subject to adjustment during an up to 12 month measurement period.
|
The tax effect for each of the items listed above, other than the transitional tax benefit item, is determined using the tax rate and other tax attributes applicable to the item and the jurisdiction(s) in which the item is recorded. The gross, tax and net impact of each item are presented with our GAAP to non-GAAP reconciliations.
|
Cardinal Health
|
Q3
Fiscal 2018 Form 10-Q
|
14
|
|
|
Explanation and Reconciliation of Non-GAAP Financial Measures
|
||
Definitions
Growth rate calculation:
growth rates in this Form 10-Q are determined by dividing the difference between current-period results and prior-period results by prior-period results.
Non-GAAP operating earnings
: operating earnings excluding (1) LIFO charges/(credits), (2) restructuring and employee severance, (3) amortization and other acquisition-related costs, (4) impairments and (gain)/loss on disposal of assets and (5) litigation (recoveries)/charges, net.
Non-GAAP earnings before income taxes
: earnings before income taxes excluding (1) LIFO charges/(credits), (2) restructuring and employee severance, (3) amortization and other acquisition-related costs, (4) impairments and (gain)/loss on disposal of assets, (5) litigation (recoveries)/charges, net and (6) loss on extinguishment of debt.
Non-GAAP net earnings attributable to Cardinal Health, Inc.
: net earnings attributable to Cardinal Health, Inc. excluding (1) LIFO charges/(credits), (2) restructuring and employee severance, (3) amortization and other acquisition-related costs, (4) impairments and (gain)/loss on disposal of assets, (5) litigation (recoveries)/charges, net, (6) loss on extinguishment of debt, each net of tax, and (7) transitional tax benefit, net.
Non-GAAP diluted EPS attributable to Cardinal Health, Inc.
: non-GAAP net earnings attributable to Cardinal Health, Inc. divided by diluted weighted-average shares outstanding.
|
15
|
Cardinal Health
|
Q3
Fiscal 2018 Form 10-Q
|
|
|
Explanation and Reconciliation of Non-GAAP Financial Measures
|
||
GAAP to Non-GAAP Reconciliations
|
(in millions, except per common share amounts)
|
Operating Earnings
|
Operating Earnings Growth Rate
|
Earnings Before Income Taxes
|
Income Taxes
|
Net Earnings
1
|
Net Earnings
1
Growth Rate
|
Effective
Tax
Rate
|
Diluted EPS
1
|
Diluted EPS
1
Growth Rate
|
||||||||||||||
|
Three Months Ended March 31, 2018
|
|||||||||||||||||||||||
|
GAAP
|
$
|
546
|
|
(10
|
)%
|
$
|
464
|
|
$
|
209
|
|
$
|
255
|
|
(33
|
)%
|
45.1
|
%
|
$
|
0.81
|
|
(33
|
)%
|
|
Restructuring and employee severance
|
2
|
|
2
|
|
(17
|
)
|
19
|
|
0.06
|
|
|||||||||||||
|
Amortization and other acquisition-related costs
|
175
|
|
175
|
|
44
|
|
131
|
|
0.42
|
|
|||||||||||||
|
Impairments and loss on disposal of assets
|
(6
|
)
|
(6
|
)
|
(14
|
)
|
8
|
|
0.02
|
|
|||||||||||||
|
Litigation (recoveries)/charges, net
|
64
|
|
64
|
|
21
|
|
43
|
|
0.14
|
|
|||||||||||||
|
Transitional tax benefit, net
2
|
—
|
|
|
—
|
|
17
|
|
(17
|
)
|
|
(0.06
|
)
|
|
||||||||||
|
Non-GAAP
|
$
|
781
|
|
3
|
%
|
$
|
700
|
|
$
|
262
|
|
$
|
437
|
|
(10
|
)%
|
37.5
|
%
|
$
|
1.39
|
|
(9
|
)%
|
|
Three Months Ended March 31, 2017
|
|||||||||||||||||||||||
|
GAAP
|
$
|
605
|
|
(8
|
)%
|
$
|
564
|
|
$
|
182
|
|
$
|
381
|
|
(1
|
)%
|
32.3
|
%
|
$
|
1.20
|
|
3
|
%
|
|
LIFO charges/(credits)
|
(9
|
)
|
|
(9
|
)
|
(4
|
)
|
(5
|
)
|
|
(0.02
|
)
|
|
||||||||||
|
Restructuring and employee severance
|
15
|
|
|
15
|
|
6
|
|
9
|
|
|
0.03
|
|
|
||||||||||
|
Amortization and other acquisition-related costs
|
128
|
|
|
128
|
|
41
|
|
87
|
|
|
0.27
|
|
|
||||||||||
|
Impairments and loss on disposal of assets
|
2
|
|
|
2
|
|
—
|
|
2
|
|
|
0.01
|
|
|
||||||||||
|
Litigation (recoveries)/charges, net
|
18
|
|
|
18
|
|
7
|
|
11
|
|
|
0.03
|
|
|
||||||||||
|
Non-GAAP
|
$
|
759
|
|
(4
|
)%
|
$
|
718
|
|
$
|
232
|
|
$
|
485
|
|
3
|
%
|
32.3
|
%
|
$
|
1.53
|
|
7
|
%
|
|
Nine Months Ended March 31, 2018
|
|||||||||||||||||||||||
|
GAAP
|
$
|
1,206
|
|
(28
|
)%
|
$
|
959
|
|
$
|
(466
|
)
|
$
|
1,422
|
|
40
|
%
|
(48.6
|
)%
|
$
|
4.50
|
|
42
|
%
|
|
Restructuring and employee severance
|
155
|
|
155
|
|
29
|
|
126
|
|
0.40
|
|
|||||||||||||
|
Amortization and other acquisition-related costs
|
543
|
|
543
|
|
143
|
|
400
|
|
1.27
|
|
|||||||||||||
|
Impairments and loss on disposal of assets
|
62
|
|
62
|
|
(57
|
)
|
119
|
|
0.38
|
|
|||||||||||||
|
Litigation (recoveries)/charges, net
|
155
|
|
155
|
|
51
|
|
104
|
|
0.33
|
|
|||||||||||||
|
Loss on extinguishment of debt
|
—
|
|
2
|
|
1
|
|
1
|
|
—
|
|
|||||||||||||
|
Transitional tax benefit, net
2
|
—
|
|
|
—
|
|
911
|
|
(911
|
)
|
|
(2.88
|
)
|
|
||||||||||
|
Non-GAAP
|
$
|
2,121
|
|
—
|
%
|
$
|
1,875
|
|
$
|
612
|
|
$
|
1,261
|
|
(4
|
)%
|
32.6
|
%
|
$
|
3.99
|
|
(3
|
)%
|
|
Nine Months Ended March 31, 2017
|
|||||||||||||||||||||||
|
GAAP
|
$
|
1,681
|
|
(9
|
)%
|
$
|
1,549
|
|
$
|
533
|
|
$
|
1,014
|
|
(7
|
)%
|
34.4
|
%
|
$
|
3.17
|
|
(4
|
)%
|
|
LIFO charges/(credits)
|
—
|
|
|
—
|
|
—
|
|
—
|
|
|
—
|
|
|
||||||||||
|
Restructuring and employee severance
|
31
|
|
|
31
|
|
12
|
|
19
|
|
|
0.06
|
|
|
||||||||||
|
Amortization and other acquisition-related costs
|
365
|
|
|
365
|
|
120
|
|
245
|
|
|
0.76
|
|
|
||||||||||
|
Impairments and (gain)/loss on disposal of assets
|
15
|
|
|
15
|
|
4
|
|
11
|
|
|
0.03
|
|
|
||||||||||
|
Litigation (recoveries)/charges, net
|
37
|
|
|
37
|
|
14
|
|
23
|
|
|
0.07
|
|
|
||||||||||
|
Non-GAAP
|
$
|
2,129
|
|
(5
|
)%
|
$
|
1,997
|
|
$
|
684
|
|
$
|
1,311
|
|
(4
|
)%
|
34.2
|
%
|
$
|
4.10
|
|
—
|
%
|
|
1
|
attributable to Cardinal Health, Inc.
|
|
2
|
Reflects the estimated net transitional benefit from the remeasurement of our deferred tax assets and liabilities partially offset by the repatriation tax on cash and earnings of foreign subsidiaries. We have not yet completed our analysis of the impact of the Tax Act and, as such, these amounts are provisional estimates and we may record additional provisional amounts or adjustments to the provisional amounts in future periods. See
Note 8
of the "Notes to Condensed Consolidated Financial Statements" for more information on the Tax Act.
|
The sum of the components may not equal the total due to rounding.
We generally apply varying tax rates depending on the item's nature and tax jurisdiction where it is incurred.
|
Cardinal Health
|
Q3
Fiscal 2018 Form 10-Q
|
16
|
|
|
Other
|
|
Quantitative and Qualitative Disclosures About Market Risk
As previously disclosed in our
2017
Form 10-K, as a result of the completion of the acquisition of the Patient Recovery Business, our exposure to market price changes for commodities and to both translational and transactional foreign exchange rate fluctuations has increased since the end of fiscal
2017
.
As previously disclosed, our annual direct exposure to market price changes for commodities has increased by approximately $100 million as a result of the completion of the acquisition of the Patient Recovery Business. At the time of filing this Form 10-Q, we have not completed our analysis to quantify the increase to our foreign exchange transactional exposure. As a result of the Patient Recovery Business acquisition and the divestiture of the China distribution
business, our income statement translational exposure has increased by approximately $100 million.
In addition, our total foreign exchange exposure related to intercompany financing transactions and certain other balance sheet items subject to revaluation that do not meet the requirements for hedge accounting treatment is now approximately $580 million. We use foreign currency economic (non-designated) hedge contracts to offset the remeasurement impact of this exposure.
For further discussion of our programs to manage interest rate risk, currency exchange risk and commodity price risk, see Note 11 of the “Notes to Consolidated Financial Statements” contained in our 2017 Form 10-K.
Controls and Procedures
Evaluation of Disclosure Controls and Procedures
We evaluated, with the participation of our principal executive officer and principal financial officer, the effectiveness of our disclosure controls and procedures (as defined in Rule 13a-15(e) under the Securities Exchange Act of 1934 (the "Exchange Act")) as of
March 31, 2018
. Based on this evaluation, our principal executive officer and principal financial officer have concluded that as of
March 31, 2018
, our disclosure controls and procedures were effective to provide reasonable assurance that information required to be disclosed in our reports under the Exchange Act is recorded, processed, summarized, and reported within the time periods specified in the SEC rules and forms and that such information is accumulated and communicated to management as appropriate to allow timely decisions regarding required disclosure.
Changes in Internal Control Over Financial Reporting
There were no changes in our internal control over financial reporting during the quarter ended
March 31, 2018
that have materially affected, or are reasonably likely to materially affect, our internal control over financial reporting.
Legal Proceedings
The legal proceedings described in
Note 9
of the "Notes to Condensed Consolidated Financial Statements" are incorporated in this "Legal Proceedings" section by reference.
Risk Factors
You should carefully consider the information in this Form 10-Q, including the risk factor below, and the risk factors discussed in "Risk Factors" and other risks discussed in our
2017
Form 10-K and our filings with the SEC since
June 30, 2017
.
These risks could materially and adversely affect our results of operations, financial condition, liquidity and cash flows. Our business also could be affected by risks that we are not presently aware of or that we currently consider immaterial to our operations.
The public health crisis involving the abuse of prescription opioid pain medication could negatively affect our business.
Our Pharmaceutical segment distributes prescription opioid pain medications. In recent years, the abuse of prescription opioid pain medication has received heightened public attention. These developments heighten a number of risks that we face and may present new risks that could adversely affect our operations or financial condition.
A significant number of counties, municipalities and other plaintiffs including state attorneys general have filed lawsuits against pharmaceutical manufacturers, pharmaceutical wholesale distributors (including us) and retail chains relating to the manufacturing, marketing and distribution of prescription opioid pain
medications. In addition, we are currently being investigated by a number of other states for the same activities and may be named as a defendant in additional lawsuits in the future. We are vigorously defending ourselves in these lawsuits. The defense and resolution of current and future lawsuits could adversely affect our results of operations and financial condition or have adverse reputational or operational effects on our business. See
Note 9
of the “Notes to Condensed Consolidated Financial Statements" regarding these matters.
Other legislative, regulatory or industry measures to address the misuse of prescription opioid medications could affect our business in ways that we may not be able to predict. For example, in April 2018, the State of New York created an aggregate $100 million annual
|
17
|
Cardinal Health
|
Q3
Fiscal 2018 Form 10-Q
|
|
|
Other
|
|
assessment on all manufacturers and distributors licensed to sell or distribute opioids in New York. The initial payment is due on January 1, 2019 for opioids sold or distributed during calendar year 2017. We are not currently able to estimate the portion of this assessment that will be assessed against us
for calendar years 2017 or 2018
. In addition, other states are considering legislation that could require us to pay taxes on the distribution of opioid medications in those states. These proposed bills vary in the tax amounts and the means of calculation. Liabilities for taxes or assessments under any such laws will have an adverse impact on our results of operations, unless
we are able to mitigate them through operational changes or commercial arrangements where permitted.
Unfavorable publicity regarding the use or misuse of opioid prescription pain medications and the role of wholesale distributors in the supply chain of such prescription medications, as well as the continued proliferation of the opioid lawsuits, investigations, regulations and legislative actions discussed above could adversely affect our reputation or results of operations.
Unregistered Sales of Equity Securities and Use of Proceeds
Issuer Purchases of Equity Securities
|
Period
|
Total Number
of Shares Purchased (1) |
Average Price Paid per Share (2)
|
Total Number of Shares
Purchased as Part of Publicly Announced Program (3) |
Approximate
Dollar Value of
Shares That May
Yet be Purchased
Under the Program (3)
(in millions)
|
|||||||||
|
January 2018
|
225
|
|
$
|
73.40
|
|
—
|
|
$
|
293
|
|
|||
|
February 2018
|
3,564,234
|
|
67.34
|
|
3,564,004
|
|
1,053
|
|
|||||
|
March 2018
|
767,766
|
|
78.17
|
|
767,538
|
|
993
|
|
|||||
|
Total
|
4,332,225
|
|
$
|
69.26
|
|
4,331,542
|
|
$
|
993
|
|
|||
|
(1)
|
Reflects
225
,
230
and
228
common shares purchased in January, February and March 2018, respectively, through a rabbi trust as investments of participants in our Deferred Compensation Plan.
|
|
(2)
|
In the third quarter of fiscal 2018, we purchased $300 million of our common shares under an accelerated share repurchase ("ASR") program, which began on February 14, 2018 and was completed on March 21, 2018. We repurchased 4.3 million shares under the ASR at an average price paid per share of $69.26. See
Note 13
of the "Notes to Condensed Consolidated Financial Statements" for additional information.
|
|
(3)
|
On May 4, 2016, our Board of Directors approved a $1.0 billion share repurchase program that was completed in March 2018. On February 7, 2018, our Board of Directors approved a new $1.0 billion share repurchase program that expires on December 31, 2020.
|
|
Cardinal Health
|
Q3
Fiscal 2018 Form 10-Q
|
18
|
|
|
Financial Statements
|
||
Condensed Consolidated Statements of Earnings
(Unaudited)
|
Three Months Ended March 31,
|
Nine Months Ended March 31,
|
||||||||||||||
|
(in millions, except per common share amounts)
|
2018
|
2017
|
2018
|
2017
|
|||||||||||
|
Revenue
|
$
|
33,633
|
|
$
|
31,821
|
|
$
|
101,460
|
|
$
|
97,010
|
|
|||
|
Cost of products sold
|
31,720
|
|
30,093
|
|
96,014
|
|
92,089
|
|
|||||||
|
Gross margin
|
1,913
|
|
1,728
|
|
5,446
|
|
4,921
|
|
|||||||
|
Operating expenses:
|
|||||||||||||||
|
Distribution, selling, general and administrative expenses
|
1,132
|
|
960
|
|
3,325
|
|
2,792
|
|
|||||||
|
Restructuring and employee severance
|
2
|
|
15
|
|
155
|
|
31
|
|
|||||||
|
Amortization and other acquisition-related costs
|
175
|
|
128
|
|
543
|
|
365
|
|
|||||||
|
Impairments and (gain)/loss on disposal of assets, net
|
(6
|
)
|
2
|
|
62
|
|
15
|
|
|||||||
|
Litigation (recoveries)/charges, net
|
64
|
|
18
|
|
155
|
|
37
|
|
|||||||
|
Operating earnings
|
546
|
|
605
|
|
1,206
|
|
1,681
|
|
|||||||
|
Other (income)/expense, net
|
(2
|
)
|
(5
|
)
|
(6
|
)
|
(2
|
)
|
|||||||
|
Interest expense, net
|
84
|
|
46
|
|
251
|
|
134
|
|
|||||||
|
Loss on extinguishment of debt
|
—
|
|
—
|
|
2
|
|
—
|
|
|||||||
|
Earnings before income taxes
|
464
|
|
564
|
|
959
|
|
1,549
|
|
|||||||
|
Provision for/(benefit from) income taxes
|
209
|
|
182
|
|
(466
|
)
|
533
|
|
|||||||
|
Net earnings
|
255
|
|
382
|
|
1,425
|
|
1,016
|
|
|||||||
|
Less: Net earnings attributable to noncontrolling interests
|
—
|
|
(1
|
)
|
(3
|
)
|
(2
|
)
|
|||||||
|
Net earnings attributable to Cardinal Health, Inc.
|
$
|
255
|
|
$
|
381
|
|
$
|
1,422
|
|
$
|
1,014
|
|
|||
|
Earnings per common share attributable to Cardinal Health, Inc.:
|
|||||||||||||||
|
Basic
|
$
|
0.81
|
|
$
|
1.21
|
|
$
|
4.52
|
|
$
|
3.19
|
|
|||
|
Diluted
|
0.81
|
|
1.20
|
|
4.50
|
|
3.17
|
|
|||||||
|
Weighted-average number of common shares outstanding:
|
|||||||||||||||
|
Basic
|
313
|
|
316
|
|
314
|
|
318
|
|
|||||||
|
Diluted
|
315
|
|
318
|
|
316
|
|
320
|
|
|||||||
|
Cash dividends declared per common share
|
$
|
0.4624
|
|
$
|
0.4489
|
|
$
|
1.3872
|
|
$
|
1.3467
|
|
|||
See notes to condensed consolidated financial statements.
|
19
|
Cardinal Health
|
Q3
Fiscal 2018 Form 10-Q
|
|
|
Financial Statements
|
||
(Unaudited)
|
Three Months Ended March 31,
|
Nine Months Ended March 31,
|
||||||||||||||
|
(in millions)
|
2018
|
2017
|
2018
|
2017
|
|||||||||||
|
Net earnings
|
$
|
255
|
|
$
|
382
|
|
$
|
1,425
|
|
$
|
1,016
|
|
|||
|
Other comprehensive income/(loss):
|
|||||||||||||||
|
Foreign currency translation adjustments and other
|
110
|
|
33
|
|
141
|
|
(47
|
)
|
|||||||
|
Amounts reclassified to earnings
|
(23
|
)
|
—
|
|
(23
|
)
|
—
|
|
|||||||
|
Net unrealized gain/(loss) on derivative instruments, net of tax
|
3
|
|
2
|
|
2
|
|
27
|
|
|||||||
|
Total other comprehensive income/(loss), net of tax
|
90
|
|
35
|
|
120
|
|
(20
|
)
|
|||||||
|
Total comprehensive income
|
345
|
|
417
|
|
1,545
|
|
996
|
|
|||||||
|
Less: comprehensive income attributable to noncontrolling interests
|
—
|
|
(1
|
)
|
(3
|
)
|
(2
|
)
|
|||||||
|
Total comprehensive income attributable to Cardinal Health, Inc.
|
$
|
345
|
|
$
|
416
|
|
$
|
1,542
|
|
$
|
994
|
|
|||
See notes to condensed consolidated financial statements.
|
Cardinal Health
|
Q3
Fiscal 2018 Form 10-Q
|
20
|
|
|
Financial Statements
|
||
(Unaudited)
|
(in millions)
|
March 31, 2018
|
June 30, 2017
|
|||||
|
Assets
|
|||||||
|
Current assets:
|
|||||||
|
Cash and equivalents
|
$
|
2,175
|
|
$
|
6,879
|
|
|
|
Trade receivables, net
|
7,671
|
|
8,048
|
|
|||
|
Inventories, net
|
11,962
|
|
11,301
|
|
|||
|
Prepaid expenses and other
|
1,705
|
|
2,117
|
|
|||
|
Total current assets
|
23,513
|
|
28,345
|
|
|||
|
Property and equipment, net
|
2,521
|
|
1,879
|
|
|||
|
Goodwill and other intangibles, net
|
14,299
|
|
9,207
|
|
|||
|
Other assets
|
698
|
|
681
|
|
|||
|
Total assets
|
$
|
41,031
|
|
$
|
40,112
|
|
|
|
Liabilities, Redeemable Noncontrolling Interests and Shareholders’ Equity
|
|||||||
|
Current liabilities:
|
|||||||
|
Accounts payable
|
$
|
18,741
|
|
$
|
17,906
|
|
|
|
Current portion of long-term obligations and other short-term borrowings
|
551
|
|
1,327
|
|
|||
|
Other accrued liabilities
|
2,135
|
|
1,988
|
|
|||
|
Total current liabilities
|
21,427
|
|
21,221
|
|
|||
|
Long-term obligations, less current portion
|
9,027
|
|
9,068
|
|
|||
|
Deferred income taxes and other liabilities
|
3,027
|
|
2,877
|
|
|||
|
Redeemable noncontrolling interests
|
12
|
|
118
|
|
|||
|
Shareholders’ equity:
|
|||||||
|
Preferred shares, without par value:
|
|||||||
|
Authorized—
500 thousand
shares, Issued—
none
|
—
|
|
—
|
|
|||
|
Common shares, without par value:
|
|||||||
|
Authorized—
755 million
shares, Issued—327 million shares at
March 31, 2018
and June 30, 2017, respectively
|
2,710
|
|
2,697
|
|
|||
|
Retained earnings
|
5,958
|
|
4,967
|
|
|||
|
Common shares in treasury, at cost:
16 million
shares and 11 million shares at
March 31, 2018
and June 30, 2017, respectively
|
(1,126
|
)
|
(731
|
)
|
|||
|
Accumulated other comprehensive loss
|
(5
|
)
|
(125
|
)
|
|||
|
Total Cardinal Health, Inc. shareholders' equity
|
7,537
|
|
6,808
|
|
|||
|
Noncontrolling interests
|
1
|
|
20
|
|
|||
|
Total shareholders’ equity
|
7,538
|
|
6,828
|
|
|||
|
Total liabilities, redeemable noncontrolling interests and shareholders’ equity
|
$
|
41,031
|
|
$
|
40,112
|
|
|
|
21
|
Cardinal Health
|
Q3
Fiscal 2018 Form 10-Q
|
|
|
Financial Statements
|
||
(Unaudited)
|
Nine Months Ended March 31,
|
|||||||
|
(in millions)
|
2018
|
2017
|
|||||
|
Cash flows from operating activities:
|
|||||||
|
Net earnings
|
$
|
1,425
|
|
$
|
1,016
|
|
|
|
Adjustments to reconcile net earnings to net cash provided by operating activities:
|
|||||||
|
Depreciation and amortization
|
779
|
|
525
|
|
|||
|
Loss on extinguishment of debt
|
2
|
|
—
|
|
|||
|
Impairments and loss on sale of other investments
|
6
|
|
4
|
|
|||
|
Impairments and loss on disposal of assets, net
|
62
|
|
15
|
|
|||
|
Share-based compensation
|
64
|
|
73
|
|
|||
|
Provision for bad debts
|
76
|
|
46
|
|
|||
|
Change in fair value of contingent consideration obligation
|
(2
|
)
|
—
|
|
|||
|
Change in operating assets and liabilities, net of effects from acquisitions and divestitures:
|
|||||||
|
Increase in trade receivables
|
(632
|
)
|
(107
|
)
|
|||
|
Increase in inventories
|
(865
|
)
|
(1,010
|
)
|
|||
|
Increase in accounts payable
|
1,635
|
|
225
|
|
|||
|
Other accrued liabilities and operating items, net
|
(336
|
)
|
(327
|
)
|
|||
|
Net cash provided by operating activities
|
2,214
|
|
460
|
|
|||
|
Cash flows from investing activities:
|
|||||||
|
Acquisition of subsidiaries, net of cash acquired
|
(6,142
|
)
|
(113
|
)
|
|||
|
Additions to property and equipment
|
(246
|
)
|
(293
|
)
|
|||
|
Purchase of available-for-sale securities and other investments
|
(7
|
)
|
(188
|
)
|
|||
|
Proceeds from sale of available-for-sale securities and other investments
|
65
|
|
115
|
|
|||
|
Proceeds from maturities of available-for-sale securities
|
—
|
|
49
|
|
|||
|
Proceeds from divestitures, net of cash sold, and disposal of property and equipment
|
862
|
|
1
|
|
|||
|
Net cash used in investing activities
|
(5,468
|
)
|
(429
|
)
|
|||
|
Cash flows from financing activities:
|
|||||||
|
Payment of contingent consideration obligation
|
(22
|
)
|
(3
|
)
|
|||
|
Net change in short-term borrowings
|
(50
|
)
|
25
|
|
|||
|
Purchase of noncontrolling interests
|
(106
|
)
|
(12
|
)
|
|||
|
Proceeds from long-term obligations, net of issuance costs
|
3
|
|
—
|
|
|||
|
Reduction of long-term obligations
|
(403
|
)
|
(60
|
)
|
|||
|
Proceeds from interest rate swap terminations
|
—
|
|
14
|
|
|||
|
Net tax proceeds/(withholdings) from share-based compensation
|
(3
|
)
|
20
|
|
|||
|
Excess tax benefits from share-based compensation
|
—
|
|
37
|
|
|||
|
Dividends on common shares
|
(436
|
)
|
(435
|
)
|
|||
|
Purchase of treasury shares
|
(450
|
)
|
(600
|
)
|
|||
|
Net cash used in financing activities
|
(1,467
|
)
|
(1,014
|
)
|
|||
|
Effect of exchange rates changes on cash and equivalents
|
17
|
|
(5
|
)
|
|||
|
Net decrease in cash and equivalents
|
(4,704
|
)
|
(988
|
)
|
|||
|
Cash and equivalents at beginning of period
|
6,879
|
|
2,356
|
|
|||
|
Cash and equivalents at end of period
|
$
|
2,175
|
|
$
|
1,368
|
|
|
See notes to condensed consolidated financial statements.
|
Cardinal Health
|
Q3
Fiscal 2018 Form 10-Q
|
22
|
|
|
Notes to Financial Statements
|
||
Notes to Condensed Consolidated Financial Statements
1. Basis of Presentation and Summary of Significant Accounting Policies
Basis of Presentation
Our condensed consolidated financial statements include the accounts of all majority-owned or controlled subsidiaries, and all significant intercompany transactions and amounts have been eliminated. References to "we," "our," and similar pronouns in this Quarterly Report on Form 10-Q for the quarter ended
March 31, 2018
(this "Form 10-Q") refer to Cardinal Health, Inc. and its majority-owned or controlled subsidiaries unless the context requires otherwise.
Our fiscal year ends on June 30. References to fiscal
2018
and
2017
in these condensed consolidated financial statements are to the fiscal years ending or ended June 30,
2018
and June 30,
2017
, respectively.
Our condensed consolidated financial statements have been prepared in accordance with the U.S. Securities and Exchange Commission ("SEC") instructions to Quarterly Reports on Form 10-Q and include the information and disclosures required by accounting principles generally accepted in the United States ("GAAP") for interim financial reporting. The preparation of financial statements in conformity with GAAP requires us to make estimates and assumptions that affect amounts reported in the condensed consolidated financial statements and accompanying notes. Actual amounts may differ from these estimated amounts. In our opinion, all adjustments necessary for a fair presentation of the condensed consolidated financial statements have been included. Except as disclosed elsewhere in this Form 10-Q, all such adjustments are of a normal and recurring nature. In addition, financial results presented for this fiscal
2018
interim period are not necessarily indicative of the results that may be expected for the full fiscal year ending
June 30, 2018
. These condensed consolidated financial statements are unaudited and, accordingly, should be read in conjunction with the audited consolidated financial statements and related notes contained in our Annual Report on Form 10-K for the fiscal year ended
June 30, 2017
(the "
2017
Form 10-K").
Recent Financial Accounting Standards
In March 2018, the Financial Accounting Standards Board (the "FASB") issued amended accounting guidance to codify guidance pursuant to SEC staff accounting bulletin 118 (“SAB 118”), which was issued in connection with the Tax Cuts and Jobs Act (the “Tax Act”) of December 2017. The guidance allows companies to use provisional estimates to record the effects of the Tax Act and also provides a measurement period (not to exceed one year from the date of enactment) to complete the accounting for the impacts of the Tax Act. We adopted this guidance in the second quarter of fiscal 2018 when it was initially issued as SAB 118. We are still completing our accounting for the tax effects of the Tax Act because all the necessary information is not currently available, prepared, or analyzed. As such, we have made reasonable estimates of the effects of the Tax Act on our financial results. As we complete our analysis
of the accounting for the tax effects of enactment of the Tax Act, we may record additional provisional amounts or adjustments to provisional amounts as discrete items in future periods. See
Note 8
for additional information regarding income taxes.
In August 2017, the FASB issued accounting guidance which is intended to improve and simplify accounting rules around hedge accounting. The guidance will be effective for us in the first quarter of fiscal 2020 and early adoption is permitted. We are currently evaluating the impact of this standard on our consolidated financial statements.
In January 2017, the FASB issued amended accounting guidance that simplifies the accounting for goodwill impairment by eliminating the step of measuring a goodwill impairment by estimating the implied fair value of goodwill. Instead, goodwill impairment will be measured as the amount by which the reporting unit's carrying value exceeds its fair value, limited to the carrying value of goodwill. We adopted this guidance in the second quarter of fiscal 2018. The adoption did not have an impact on our condensed consolidated financial statements.
In March 2016, the FASB issued amended accounting guidance that changed the accounting for certain aspects of share-based compensation to employees. The guidance requires all income tax effects of share-based awards to be recognized in the statement of earnings as awards vest or are settled. Additionally, the guidance increases the amount employers can withhold in shares to cover employee income taxes without requiring liability classification and allows a policy election for accounting for forfeitures. The primary impact of adoption is the recognition of excess tax benefits in the statement of earnings on a prospective basis, rather than as a component of equity. The impact on the presentation in the condensed consolidated statement of cash flows is also prospective. We adopted this guidance in the first quarter of fiscal 2018. The impact of adoption on the provision for/(benefit from) income taxes on our condensed consolidated statement of earnings was immaterial. The inclusion of excess tax benefits and deficiencies as a component of our income tax expense will increase volatility within our provision for/(benefit from) income taxes as the amount of excess tax benefits or deficiencies from share-
based compensation awards depends on our stock price at the date the awards vest or settle.
In February 2016, the FASB issued amended accounting guidance that requires lessees to recognize most leases on the balance sheet as a lease liability and corresponding right-of-use asset. The guidance also requires disclosures that meet the objective of enabling financial statement users to assess the amount, timing, and uncertainty of cash flows arising from leases. This guidance will be effective for us in the first quarter of fiscal 2020, with early adoption permitted. The majority of our lease spend relates to certain real estate with the remaining lease spend primarily related to equipment. We are continuing to evaluate the impact of this standard on our consolidated financial statements and the methods of adoption.
In May 2014, the FASB issued amended accounting guidance related to revenue recognition which is effective for us in the first quarter of
|
23
|
Cardinal Health
|
Q3
Fiscal 2018 Form 10-Q
|
|
|
Notes to Financial Statements
|
||
fiscal 2019. This guidance is based on the principle that revenue is recognized in an amount that reflects the consideration to which an entity expects to be entitled in exchange for the transfer of goods or services to customers. The guidance also requires additional disclosure about the nature, amount, timing, and uncertainty of revenue and cash flows arising from customer contracts, including significant judgments and changes in judgments and assets recognized from costs incurred to obtain or fulfill a contract. The FASB also subsequently issued several amendments to the standard, including clarification on principal versus agent considerations, performance obligations and licensing, and certain scope improvements and practical expedients.
During fiscal 2018 we have made significant progress on our evaluation and assessment of the amended revenue recognition guidance. Our revenue is primarily distribution revenue, which we recognize at a point in time when title transfers to customers and we have no further obligation to provide services related to such merchandise. Although our preliminary assessment is subject to change prior to our adoption of the amended guidance in the first quarter of fiscal 2019, we generally anticipate that the timing of recognition of distribution revenue will be substantially unchanged under the amended guidance and we do not expect the adoption of the amended accounting guidance to have a material impact on our consolidated financial statements.
During the remainder of fiscal 2018 we will implement any additional required changes to processes to meet the new accounting, reporting and disclosure requirements, conclude the update of our internal controls and policies, and finalize our method of adoption.
2. Acquisitions
Patient Recovery Business
On July 29, 2017, we acquired the Patient Care, Deep Vein Thrombosis, and Nutritional Insufficiency businesses (the "Patient Recovery Business") from Medtronic plc for
$6.1 billion
in cash. The Patient Recovery Business manufactures
23
categories of medical products sold into multiple healthcare channels, and includes numerous industry-leading brands, such as Curity, Kendall, Dover, Argyle and Kangaroo. The acquisition further expanded the Medical segment's portfolio of self-manufactured products. We closed the Patient Recovery Business acquisition in
28
principal countries on July 29, 2017, and acquired control of, for GAAP purposes, and the rights to the net economic benefit from the entire Patient Recovery Business in the remaining countries at the closing. We are in the process of transitioning legal ownership in the remaining non-principal countries, which we expect to complete by the end of calendar 2018. The results for the entire Patient Recovery Business in all countries are included in the condensed consolidated financial statements beginning July 29, 2017. We funded the acquisition through
$4.5 billion
in new long-term debt, existing cash and borrowings under our existing credit arrangements.
Transaction and integration costs associated with the acquisition of the Patient Recovery business were
$25 million
and
$85 million
during the three and nine months ended
March 31, 2018
,
respectively, and are included in amortization and other acquisition-related costs in the condensed consolidated statements of earnings.
Fair Value of Assets Acquired and Liabilities Assumed
The allocation of the purchase price for the acquisition of the Patient Recovery Business is not yet finalized and is subject to adjustment as we complete the valuation analysis for this acquisition.
The valuation of identifiable intangible assets utilizes significant unobservable inputs and thus represents a Level 3 nonrecurring fair value measurement. The estimated fair value of the identifiable intangible assets was determined using income-based approaches, which includes market participant expectations of the cash flows that an asset could generate over its economic life, discounted back to present value using an appropriate rate of return. The weighted- average discount rate used to arrive at the present value of the identifiable intangible assets was
8.2 percent
, and considers the inherent risk of each intangible asset relative to the internal rate of return and weighted-average cost of capital.
The following table summarizes the estimated fair value of the assets acquired and liabilities assumed as of the acquisition date for the Patient Recovery Business:
|
(in millions)
|
Patient Recovery Business
|
||
|
Identifiable intangible assets:
|
|||
|
Customer relationships (1)
|
$
|
1,733
|
|
|
Trade names (2)
|
187
|
|
|
|
Developed technology and other (3)
|
732
|
|
|
|
Total identifiable intangible assets acquired
|
2,652
|
|
|
|
Cash and equivalents
|
22
|
|
|
|
Inventories
|
426
|
|
|
|
Prepaid expenses and other
|
252
|
|
|
|
Property and equipment, net
|
756
|
|
|
|
Other accrued liabilities
|
(307
|
)
|
|
|
Deferred income taxes and other liabilities
|
(865
|
)
|
|
|
Total identifiable net assets acquired/(liabilities assumed)
|
2,936
|
|
|
|
Goodwill
|
3,144
|
|
|
|
Total net assets acquired
|
$
|
6,080
|
|
|
(1)
|
The range of useful lives for customer relationships is
10
to
18
years.
|
|
(2)
|
The useful life of trade names is
15
years.
|
|
(3)
|
The useful life of developed technology is
15
years.
|
|
Cardinal Health
|
Q3
Fiscal 2018 Form 10-Q
|
24
|
|
|
Notes to Financial Statements
|
||
3. Restructuring and Employee Severance
The following table summarizes restructuring and employee severance costs:
|
Three Months Ended March 31,
|
|||||||
|
(in millions)
|
2018
|
2017
|
|||||
|
Employee-related costs (1)
|
$
|
(1
|
)
|
$
|
14
|
|
|
|
Facility exit and other costs (2)
|
3
|
|
1
|
|
|||
|
Total restructuring and employee severance
|
$
|
2
|
|
$
|
15
|
|
|
|
Nine Months Ended March 31,
|
|||||||
|
(in millions)
|
2018
|
2017
|
|||||
|
Employee-related costs (1)
|
$
|
18
|
|
$
|
27
|
|
|
|
Facility exit and other costs (2)
|
137
|
|
4
|
|
|||
|
Total restructuring and employee severance
|
$
|
155
|
|
$
|
31
|
|
|
|
(1)
|
Employee-related costs primarily consist of termination benefits provided to employees who have been involuntarily terminated, duplicate payroll costs during transition periods and changes to related estimates.
|
|
(2)
|
Facility exit and other costs primarily consist of product distribution and lease contract termination costs, accelerated depreciation, equipment relocation costs, project consulting fees and costs associated with restructuring our delivery of information technology infrastructure services.
|
In September 2017, we entered into an agreement to transition the distribution of our Medical segment's surgeon gloves in certain international markets from a third-party distribution arrangement to a direct distribution model. The costs with this restructuring include
$125 million
, on a pre-tax basis, in contract termination costs.
These costs are reflected in facility exit and other costs in the condensed consolidated statement of earnings during the nine months ended
March 31, 2018
. We paid
$65 million
of the contract termination fee during November 2017 and we paid the remaining
$60 million
of the contract termination fee in January 2018.
The following table summarizes activity related to liabilities associated with restructuring and employee severance:
|
(in millions)
|
Employee-
Related Costs
|
Facility Exit
and Other Costs
|
Total
|
||||||||
|
Balance at June 30, 2017
|
$
|
41
|
|
$
|
—
|
|
$
|
41
|
|
||
|
Additions
|
8
|
|
131
|
|
139
|
|
|||||
|
Payments and other adjustments
|
(31
|
)
|
(127
|
)
|
(158
|
)
|
|||||
|
Balance at March 31, 2018
|
$
|
18
|
|
$
|
4
|
|
$
|
22
|
|
||
4. Divestitures
In November 2017, we signed a definitive agreement with Shanghai Pharmaceuticals Holding Co., Ltd. to sell our pharmaceutical and medical products distribution business in China ("China distribution business") for gross proceeds of
$1.2 billion
. The transaction closed on February 1, 2018 for net proceeds of
$861 million
after adjusting for third party indebtedness and preliminary transaction adjustments. The net proceeds are not reflective of tax obligations due in connection with the sale, for which we have recorded a liability of
$57
million
. The purchase price is subject to adjustment based on working capital requirements as set forth in the definitive agreement, which would impact the loss related to this divestiture.
We determined that the sale of the China distribution business does not meet the criteria to be classified as discontinued operations. The China distribution business primarily operated within our Pharmaceutical segment, and a smaller portion operated within our Medical segment.
During the nine months ended March 31, 2018, we recognized a net loss of
$60 million
related to this divestiture. This loss is comprised of the
$67 million
disposal group write-down recognized during the six months ended December 31, 2017, offset by a
$7 million
gain recognized during the three months ended March 31, 2018 resulting from fluctuations in working capital, debt and foreign currency from December 31, 2017 to the date of close.
5. Goodwill and Other Intangible Assets
Goodwill
The following table summarizes the changes in the carrying amount of goodwill by segment and in total:
|
(in millions)
|
Pharmaceutical
|
Medical
|
Total
|
||||||||
|
Balance at June 30, 2017
|
$
|
2,939
|
|
$
|
4,282
|
|
$
|
7,221
|
|
||
|
Goodwill acquired, net of purchase price adjustments
|
1
|
|
3,194
|
|
3,195
|
|
|||||
|
Foreign currency translation adjustments and other
|
28
|
|
55
|
|
83
|
|
|||||
|
Goodwill divested with the sale of our China distribution business
|
(347
|
)
|
(54
|
)
|
(401
|
)
|
|||||
|
Balance at March 31, 2018
|
$
|
2,621
|
|
$
|
7,477
|
|
$
|
10,098
|
|
||
The increase in the Medical segment goodwill is primarily due to the Patient Recovery Business acquisition. Goodwill recognized in connection with the Patient Recovery Business acquisition primarily represents the expected benefits from certain synergies of integrating the business, the existing workforce of the acquired entity, and the expected growth from new customers.
During the nine months ended March 31, 2018, goodwill was reduced by
$401 million
in connection with the sale of our China distribution business, discussed further in
Note 4
.
|
25
|
Cardinal Health
|
Q3
Fiscal 2018 Form 10-Q
|
|
|
Notes to Financial Statements
|
||
Other Intangible Assets
The following tables summarize other intangible assets by class at:
|
March 31, 2018
|
|||||||||||||
|
(in millions)
|
Gross
Intangible
|
Accumulated
Amortization
|
Net
Intangible
|
Weighted- Average Remaining Amortization Period (Years)
|
|||||||||
|
Indefinite-life intangibles:
|
|||||||||||||
|
IPR&D, trademarks and other
|
$
|
62
|
|
$
|
—
|
|
$
|
62
|
|
N/A
|
|||
|
Total indefinite-life intangibles
|
62
|
|
—
|
|
62
|
|
N/A
|
||||||
|
Definite-life intangibles:
|
|||||||||||||
|
Customer relationships
|
3,625
|
|
1,162
|
|
2,463
|
|
15
|
||||||
|
Trademarks, trade names and patents
|
684
|
|
237
|
|
447
|
|
15
|
||||||
|
Developed technology and other
|
1,669
|
|
440
|
|
1,229
|
|
12
|
||||||
|
Total definite-life intangibles
|
5,978
|
|
1,839
|
|
4,139
|
|
14
|
||||||
|
Total other intangible assets
|
$
|
6,040
|
|
$
|
1,839
|
|
$
|
4,201
|
|
N/A
|
|||
|
June 30, 2017
|
|||||||||||
|
(in millions)
|
Gross
Intangible
|
Accumulated
Amortization
|
Net
Intangible
|
||||||||
|
Indefinite-life intangibles:
|
|||||||||||
|
IPR&D, trademarks and other
|
$
|
61
|
|
$
|
—
|
|
$
|
61
|
|
||
|
Total indefinite-life intangibles
|
61
|
|
—
|
|
61
|
|
|||||
|
Definite-life intangibles:
|
|||||||||||
|
Customer relationships
|
1,966
|
|
967
|
|
999
|
|
|||||
|
Trademarks, trade names and patents
|
509
|
|
195
|
|
314
|
|
|||||
|
Developed technology and other
|
916
|
|
304
|
|
612
|
|
|||||
|
Total definite-life intangibles
|
3,391
|
|
1,466
|
|
1,925
|
|
|||||
|
Total other intangible assets
|
$
|
3,452
|
|
$
|
1,466
|
|
$
|
1,986
|
|
||
The increase in definite-life intangibles is primarily due to the Patient Recovery Business acquisition. Total amortization of intangible assets was
$148 million
and
$96 million
for the three months ended
March 31, 2018
and
2017
, respectively, and
$435 million
and
$291 million
for the nine months ended
March 31, 2018
and
2017
, respectively. For acquisitions closed on or before
March 31, 2018
, estimated annual amortization of intangible assets for the remainder of fiscal
2018
through
2022
is as follows:
$139 million
,
$554 million
,
$523 million
,
$451 million
and
$418 million
.
During the nine months ended March 31, 2018, other intangible assets were reduced by
$62 million
in connection with the sale of our China distribution business, discussed further in
Note 4
.
6. Available-for-Sale Securities
We invest in marketable securities, which are classified as available-for-sale and are carried at fair value in the condensed consolidated balance sheets. We held the following investments in marketable securities at fair value at:
|
(in millions)
|
March 31, 2018
|
June 30, 2017
|
|||||
|
Current available-for-sale securities:
|
|||||||
|
Treasury bills
|
$
|
—
|
|
$
|
25
|
|
|
|
International bonds
|
—
|
|
3
|
|
|||
|
Corporate bonds
|
—
|
|
30
|
|
|||
|
U.S. agency bonds
|
—
|
|
3
|
|
|||
|
Asset-backed securities
|
—
|
|
3
|
|
|||
|
International equity securities
|
—
|
|
1
|
|
|||
|
Total available-for-sale securities
|
$
|
—
|
|
$
|
65
|
|
|
In July 2017, we liquidated our marketable securities. There were no unrealized gains or losses at
March 31, 2018
, and gross unrealized gains and losses were immaterial at
June 30, 2017
. During the nine months ended
March 31, 2018
and 2017, gross realized gains and losses were immaterial and we did not recognize any other-than-temporary impairments.
7. Long-Term Obligations and Other Short-Term Borrowings
At
March 31, 2018
and
June 30, 2017
, we had total long term obligations, including the current portion and other short-term borrowings, of
$9.6 billion
and
$10.4 billion
, respectively.
All the notes represent unsecured obligations of Cardinal Health, Inc. and rank equally in right of payment with all of our existing and future unsecured and unsubordinated indebtedness. Interest is paid pursuant to the terms of the obligations. These notes are effectively subordinated to the liabilities of our subsidiaries, including trade payables of
$18.7 billion
.
In June 2017, we issued additional debt with the aggregate principal amount of
$5.2 billion
to fund a portion of the acquisition of the Patient Recovery Business, to redeem the
$400 million
1.7%
Notes due 2018
and for general corporate purposes. The notes issued in June 2017 were 1.948% Notes due 2019, 2.616% Notes due 2022, 3.079% Notes due 2024, 3.410% Notes due 2027, 4.368% Notes due 2047, and floating rate Notes due 2022.
Other Financing Arrangements
In addition to cash and equivalents and operating cash flow, other sources of liquidity include a
$2.0 billion
commercial paper program, which is backed by a
$2.0 billion
revolving credit facility and a
$1.0 billion
committed receivables sales facility program. At
March 31, 2018
, we had
nothing
outstanding under the commercial paper program and
no
amounts outstanding under the revolving credit facility and committed receivables sales facility program.
In November 2016, we renewed our committed receivables sales facility program through Cardinal Health Funding, LLC (“CHF”) through November 1, 2019. CHF was organized for the sole purpose
|
Cardinal Health
|
Q3
Fiscal 2018 Form 10-Q
|
26
|
|
|
Notes to Financial Statements
|
||
of buying receivables and selling undivided interests in those receivables to third-party purchasers. Although consolidated with Cardinal Health, Inc. in accordance with GAAP, CHF is a separate legal entity from Cardinal Health, Inc. and from our subsidiary that sells receivables to CHF. CHF is designed to be a special purpose, bankruptcy-remote entity whose assets are available solely to satisfy the claims of its creditors.
8. Income Taxes
Fluctuations in our provision for/(benefit from) income taxes as a percentage of pretax earnings (“effective tax rate”) are generally due to changes in international and U.S. state effective tax rates resulting from our business mix and discrete items.
U.S. Tax Cuts and Jobs Act
On December 22, 2017, the United States enacted the Tax Cuts and Jobs Act (the “Tax Act”).
The Tax Act makes broad and complex changes to the U.S. tax code that affect our fiscal year 2018 financial results in two primary ways. First, effective as of January 1, 2018, the Tax Act reduces the U.S. federal corporate tax rate from 35 percent to 21 percent. Second, it requires companies to pay a one-time U.S. repatriation tax on certain undistributed earnings of foreign subsidiaries.
Because our fiscal year ends in June, we have a blended U.S. Federal statutory tax rate for fiscal 2018 of
28.1 percent
under the Tax Act.
The Tax Act also establishes new tax provisions that will affect us beginning July 1, 2018 including, (1) eliminating the U.S. manufacturing deduction; (2) establishing new limitations on deductible interest expense and certain executive compensation; (3) eliminating the corporate alternative minimum tax; (4) creating the base erosion anti-abuse tax; (5) creating a new provision designed to tax global intangible low-tax income (“GILTI”); (6) generally eliminating U.S. federal income taxes on dividends from foreign subsidiaries; and (7) changing rules related to uses and limitations of net operating loss carryforwards created in tax years beginning after December 31, 2017.
Regarding the new GILTI tax rules, we are allowed to make an accounting policy election to either (1) treat taxes due on future GILTI exclusions in U.S. taxable income as a current period expense when incurred or (2) reflect such portion of the future GILTI exclusions in U.S. taxable income that relate to existing basis differences in our measurement of deferred taxes. Our analysis of the new GILTI rules and how they may impact us is incomplete. Accordingly, we have not made a policy election regarding the treatment of the GILTI tax.
Remeasurement of Deferred Tax Assets and Liabilities
As a result of the enactment of a lower tax rate, we remeasured our U.S. deferred tax assets and liabilities based on the rates at which they are expected to reverse in the future. While we are still analyzing certain aspects of the Tax Act and refining our calculations, we have recorded a measurement period adjustment to our provisional net benefit of
$18 million
in
the
three months ended March 31, 2018, for a total provisional net benefit of
$952 million
in the nine months ended March 31, 2018, related to this required remeasurement. The provisional estimate is based on currently available information related to deferred tax assets and liabilities which is subject to change
as additional information becomes available, prepared, and analyzed.
Repatriation Tax on Undistributed Foreign Earnings
In connection with the required one-time U.S. repatriation tax on undistributed earnings of foreign subsidiaries, we recorded no additional adjustment during the three months ended March 31, 2018 to the provisional tax expense of
$41 million
for the nine months ended March 31, 2018. The Tax Act permits the payment of this tax over an eight-year period beginning in fiscal 2019. Though these foreign earnings have been deemed to be repatriated from a U.S. federal tax perspective, we have not yet completed our assessment of the Tax Act on our plans to reinvest foreign earnings and as such have not changed our prior conclusion that the earnings are indefinitely reinvested. The repatriation tax is based on currently available information and technical guidance related to the new tax law. The provisional estimate will be updated when additional information related to undistributed foreign earnings, foreign taxes and foreign cash and equivalents becomes available, prepared and analyzed.
Effective Tax Rate
During the three months ended
March 31, 2018
and
2017
, the effective tax rate was
45.1 percent
and
32.3 percent
, respectively. The effective tax rate for the three months ended
March 31, 2018
was negatively impacted by a reduction in projected Cordis income and its impact on jurisdictional mix encompassing U.S. and international operations, as well as net unfavorable discrete items of
$18 million
, partially offset by the favorable impact of the lower U.S. federal income tax rate from enactment of the Tax Act. The effective tax rate for the three months ended March 31, 2017 was impacted by net favorable discrete items of
$31 million
.
During the nine months ended
March 31, 2018
and
2017
, the effective tax rate was
(48.6) percent
and
34.4 percent
, respectively. The effective tax rate for the nine months ended
March 31, 2018
was favorably impacted by the provisional net benefit from enactment of the Tax Act.
The provisional net benefit from the Tax Act during the three and nine months ended
March 31, 2018
includes the aforementioned remeasurement of our deferred tax assets and liabilities to the new federal statutory rate provisional measurement period adjustment of
$18 million
and net tax benefit of
$952 million
, respectively, the benefit from the impact of applying a lower federal tax rate to year-to-date U.S. pre-tax earnings and
$41 million
provisional tax expense for the one-time repatriation tax applied to our undistributed foreign earnings.
Our effective tax rate for the nine months ended March 31, 2018 also includes
$57 million
of tax expense recognized during the three months ended December 31, 2017 in connection with the sale of our China distribution business.
Unrecognized Tax Benefits
At
March 31, 2018
and
June 30, 2017
, we had
$426 million
and
$417 million
of unrecognized tax benefits, respectively. The
March 31, 2018
and
June 30, 2017
balances include
$264 million
and
$268 million
of unrecognized tax benefits, respectively, that if recognized, would have an impact on the effective tax rate.
|
27
|
Cardinal Health
|
Q3
Fiscal 2018 Form 10-Q
|
|
|
Notes to Financial Statements
|
||
At
March 31, 2018
and
June 30, 2017
, we had
$106 million
and
$99 million
, respectively, accrued for the payment of interest and penalties related to unrecognized tax benefits, which we recognize in the provision for/(benefit from) income taxes in the condensed consolidated statements of earnings. These balances are gross amounts before any tax benefits and are included in deferred income taxes and other liabilities in the condensed consolidated balance sheets.
It is reasonably possible that there could be a change in the amount of unrecognized tax benefits within the next 12 months due to activities of the U.S. Internal Revenue Service ("IRS") or other taxing authorities, possible settlement of audit issues, reassessment of existing unrecognized tax benefits or the expiration of statutes of limitations. We estimate that the range of the possible change in unrecognized tax benefits within the next 12 months is between
zero
and a net decrease of
$35 million
, exclusive of penalties and interest.
Other Tax Matters
We file income tax returns in the U.S. federal jurisdiction, various U.S. state jurisdictions and various foreign jurisdictions. With few exceptions, we are subject to audit by taxing authorities for fiscal years 2008 through the current fiscal year.
We are a party to a tax matters agreement with CareFusion Corporation ("CareFusion"), which has been acquired by Becton, Dickinson and Company. Under the tax matters agreement, CareFusion is obligated to indemnify us for certain tax exposures and transaction taxes prior to our fiscal 2010 spin-off of CareFusion. The indemnification receivable was
$148 million
and
$142 million
at
March 31, 2018
and
June 30, 2017
, respectively, and is included in other assets in the condensed consolidated balance sheets.
As a result of the acquisition of the Patient Recovery Business, Medtronic plc is obligated to indemnify us for certain tax exposures and transaction taxes related to periods prior to the acquisition under the purchase agreement. The indemnification receivable was
$34 million
at March 31, 2018.
9. Commitments, Contingent Liabilities and Litigation
Commitments
Generic Sourcing Venture with CVS Health Corporation ("CVS Health")
Red Oak Sourcing, LLC ("Red Oak Sourcing") is a U.S.-based generic pharmaceutical sourcing venture with CVS Health for an initial term through June 2024. Red Oak Sourcing negotiates generic pharmaceutical supply contracts on behalf of its participants. Due to the achievement of predetermined milestones, we are required to make quarterly payments of
$45.6 million
to CVS Health for the initial term.
Legal Proceedings
We become involved from time to time in disputes, litigation, and regulatory matters.
We may be named from time to time in
qui tam
actions initiated by private third parties. In such actions, the private parties purport to act on behalf of federal or state governments, allege that false claims have been submitted for payment by the government and may receive an award if their claims are successful. After a private party has filed a
qui tam
action, the government must investigate the private party's
claim and determine whether to intervene in and take control over the litigation. These actions may remain under seal while the government makes this determination. If the government declines to intervene, the private party may nonetheless continue to pursue the litigation on his or her own purporting to act on behalf of the government
.
From time to time, we become aware through employees, internal audits or other parties of possible compliance matters, such as complaints or concerns relating to accounting, internal accounting controls, financial reporting, auditing, or other ethical matters or relating to compliance with laws such as healthcare fraud and abuse, anti-corruption or anti-bribery laws. When we become aware of such possible compliance matters, we investigate internally and take appropriate corrective action. In addition, from time to time, we receive subpoenas or requests for information from various federal or state agencies relating to our business or to the business of a customer, supplier or other industry participants. Internal investigations, subpoenas or requests for information could lead to the assertion of claims or the commencement of legal proceedings against us or result in sanctions.
From time to time, we may determine that products we manufacture or market do not meet our specifications, regulatory requirements, or published standards. When we or a regulatory agency identify a potential quality or regulatory issue, we investigate and take appropriate corrective action. Such actions can lead to product recalls, costs to repair or replace affected products, temporary interruptions in product sales, action by regulators and product liability claims and lawsuits, including class actions. Even absent an identified regulatory or quality issue or product recall, we can become subject to product liability claims and lawsuits.
We accrue for contingencies related to disputes, litigation and regulatory matters if it is probable that a liability has been incurred and the amount of the loss can be reasonably estimated. Because these matters are inherently unpredictable and unfavorable developments or resolutions can occur, assessing contingencies is highly subjective and requires judgments about future events. We regularly review contingencies to determine whether our accruals and related disclosures are adequate. The amount of ultimate loss may differ from these estimates.
We recognize income from the favorable outcome of litigation when we receive the associated cash or assets.
We recognize estimated loss contingencies for certain litigation and regulatory matters and income from favorable resolution of litigation in litigation (recoveries)/charges in our condensed consolidated statements of earnings.
Opioid Lawsuits
Pharmaceutical wholesale distributors, including us, have been named as defendants in hundreds of lawsuits relating to the distribution of prescription opioid pain medications. These lawsuits have been filed in various federal, state, and other courts by a variety of plaintiffs, which are primarily counties, municipalities and political subdivisions from
46
states. Plaintiffs also include four state attorneys general, unions and other health and welfare funds, hospital systems and other healthcare providers. Of these lawsuits,
21
are purported class actions. The lawsuits seek equitable relief and monetary damages based on a variety of legal theories including various common law claims, such as negligence, public nuisance, unjust
|
Cardinal Health
|
Q3
Fiscal 2018 Form 10-Q
|
28
|
|
|
Notes to Financial Statements
|
||
enrichment as well as violations of controlled substance laws and various other statutes. Many also name pharmaceutical manufacturers, retail pharmacy chains and other entities as defendants.
The vast majority of these lawsuits have been filed in U.S. federal court and have been transferred for consolidated pre-trial proceedings in a Multi-District Litigation proceeding in the United States District Court for the Northern District of Ohio. In April 2018, the court, among other things, ordered that motions to dismiss in a number of these lawsuits be briefed from June through August 2018 and that three lawsuits proceed to trial in March 2019 depending on the court's ruling on those motions. As part of these proceedings, we have been discussing with various parties and other stakeholders, including state attorneys general, possible prospective non-monetary injunctive relief and other solutions that we and others in the healthcare system either have already undertaken or may undertake in the future to help alleviate the national opioid epidemic.
We are vigorously defending ourselves in all of these opioid lawsuits. Since all of the above-referenced lawsuits are in early stages, we are unable to predict their outcome or estimate a range of reasonably possible losses.
In addition,
39
state attorneys general have formed a multi-state task force to investigate the manufacturing, distribution, dispensing and prescribing practices of opioid medications. We have received requests related to this multi-state investigation, as well as civil investigative demands, subpoenas or requests for information from these and other state attorneys general offices. We are cooperating with the offices conducting these investigations.
Product Liability Lawsuits
As of May 1, 2018, we are named as a defendant in
137
product liability lawsuits filed in Alameda County Superior Court in California involving claims by approximately
1,607
plaintiffs that allege personal injuries associated with the use of Cordis OptEase and TrapEase inferior vena cava (IVC) filter products. Another
16
lawsuits involving similar claims by approximately
17
plaintiffs are pending in other jurisdictions. These lawsuits seek a variety of remedies, including unspecified monetary damages. We are vigorously defending ourselves in these lawsuits.
At March 31, 2018, we had a total of
$247 million
, net of expected insurance recoveries, accrued for losses and legal defense costs related to the Cordis IVC filter lawsuits. While we have recorded accruals based on our assessment of these matters, because these lawsuits are in early stages, we are unable to estimate a range of reasonably possible losses in excess of this accrued amount.
10. Fair Value Measurements
Assets and (liabilities) measured on a recurring basis
The following tables present the fair values for assets and (liabilities) measured on a recurring basis at:
|
March 31, 2018
|
|||||||||||||||
|
(in millions)
|
Level 1
|
Level 2
|
Level 3
|
Total
|
|||||||||||
|
Assets:
|
|||||||||||||||
|
Cash equivalents
|
$
|
548
|
|
$
|
—
|
|
$
|
—
|
|
$
|
548
|
|
|||
|
Available-for-sale securities (1)
|
—
|
|
—
|
|
—
|
|
—
|
|
|||||||
|
Other investments (2)
|
115
|
|
—
|
|
—
|
|
115
|
|
|||||||
|
Liabilities:
|
|||||||||||||||
|
Forward contracts (3)
|
—
|
|
(58
|
)
|
—
|
|
(58
|
)
|
|||||||
|
Contingent consideration (4)
|
—
|
|
—
|
|
(14
|
)
|
(14
|
)
|
|||||||
|
June 30, 2017
|
|||||||||||||||
|
(in millions)
|
Level 1
|
Level 2
|
Level 3
|
Total
|
|||||||||||
|
Assets:
|
|||||||||||||||
|
Cash equivalents
|
$
|
739
|
|
$
|
—
|
|
$
|
—
|
|
$
|
739
|
|
|||
|
Available-for-sale securities (1)
|
—
|
|
65
|
|
—
|
|
65
|
|
|||||||
|
Other investments (2)
|
116
|
|
—
|
|
—
|
|
116
|
|
|||||||
|
Liabilities:
|
|||||||||||||||
|
Forward contracts (3)
|
—
|
|
(21
|
)
|
—
|
|
(21
|
)
|
|||||||
|
Contingent consideration (4)
|
—
|
|
—
|
|
(32
|
)
|
(32
|
)
|
|||||||
|
(1)
|
We invest in marketable securities, which are classified as available-for-sale and are carried at fair value in the condensed consolidated balance sheets. Observable Level 2 inputs such as quoted prices for similar securities, interest rate spreads, yield curves and credit risk are used to determine the fair value. See
Note 6
for additional information regarding available-for-sale securities.
|
|
(2)
|
The other investments balance includes investments in mutual funds, which are used to offset fluctuations in deferred compensation liabilities. These mutual funds primarily invest in the equity securities of companies with large market capitalization and high quality fixed income debt securities. The fair value of these investments is determined using quoted market prices.
|
|
(3)
|
The fair value of interest rate swaps, foreign currency contracts and commodity contracts is determined based on the present value of expected future cash flows considering the risks involved, including non-performance risk, and using discount rates appropriate for the respective maturities. Observable Level 2 inputs are used to determine the present value of expected future cash flows. The fair value of these derivative contracts, which are subject to master netting arrangements under certain circumstances, is presented on a gross basis in the condensed consolidated balance sheets.
|
|
(4)
|
Contingent consideration represents the obligations incurred in connection with acquisitions. We do not deem the fair value of the contingent consideration obligations under any single acquisition to be significant. The estimate of fair value of the contingent consideration obligations requires subjective assumptions to be made regarding future business results, discount rates, discount periods, and probabilities assigned to various potential business result scenarios and was determined using probability assessments with respect to the likelihood of reaching various targets or of achieving certain milestones. The fair value measurement is based on significant inputs unobservable in the market and thus represents a Level 3 measurement. Changes in current expectations of progress could change the probability of achieving the targets within the measurement periods and result in an increase or decrease in the fair value of the contingent consideration obligation.
|
|
29
|
Cardinal Health
|
Q3
Fiscal 2018 Form 10-Q
|
|
|
Notes to Financial Statements
|
||
The following table presents those liabilities measured at fair value on a recurring basis using unobservable inputs (Level 3):
|
(in millions)
|
Contingent Consideration Obligation
|
||
|
Balance at June 30, 2017
|
$
|
32
|
|
|
Additions from acquisitions
|
5
|
|
|
|
Changes in fair value of contingent consideration (1)
|
(2
|
)
|
|
|
Payment of contingent consideration
|
(22
|
)
|
|
|
Balance at March 31, 2018
|
$
|
14
|
|
The sum of the components may not equal the total due to rounding.
|
(1)
|
Amount is included in amortization and other acquisition-related costs in the condensed consolidated statements of earnings.
|
11. Financial Instruments
We utilize derivative financial instruments to manage exposure to certain risks related to our ongoing operations. The primary risks managed through the use of derivative instruments include interest rate risk, currency exchange risk and commodity price risk. We do not use derivative instruments for trading or speculative purposes. While the majority of our derivative instruments are designated as hedging instruments, we also enter into derivative instruments that are designed to hedge a risk, but are not designated as hedging instruments. These derivative instruments are adjusted to fair value through earnings at the end of each period. Our derivative and hedging programs are consistent with those described in the 2017 Form 10-K. The amount of ineffectiveness associated with these derivative instruments was immaterial for the three and nine months ended
March 31, 2018
and
2017
.
During the nine months ended
March 31, 2018
and
2017
, we entered into pay-floating interest rate swaps with total notional amounts of
$650 million
and
$100 million
, respectively. These swaps have been designated as fair value hedges of our fixed rate debt and are included in other assets in the condensed consolidated balance sheet.
During the nine months ended
March 31, 2017
, we entered into forward interest rate swaps with a total notional amount of
$200 million
to hedge probable, but not firmly committed, future transactions associated with our debt.
Fair Value of Financial Instruments
The carrying amounts of cash and equivalents, trade receivables, accounts payable and other accrued liabilities at
March 31, 2018
and
June 30, 2017
approximate fair value due to their short-term maturities.
The following table summarizes the estimated fair value of our long-term obligations and other short-term borrowings compared to the respective carrying amounts at:
|
(in millions)
|
March 31, 2018
|
June 30, 2017
|
|||||
|
Estimated fair value
|
$
|
9,576
|
|
$
|
10,713
|
|
|
|
Carrying amount
|
9,578
|
|
10,395
|
|
|||
The fair value of our long-term obligations and other short-term borrowings is estimated based on either the quoted market prices
for the same or similar issues or other inputs derived from available market information, which represents a Level 2 measurement.
12. Redeemable Noncontrolling Interests
In connection with the acquisition of a
71 percent
ownership interest in naviHealth during fiscal 2016, we recognized redeemable noncontrolling interest with a fair value of
$119 million
at the acquisition date.
In August 2017, certain third-party noncontrolling interest holders exercised their put right on the noncontrolling interest representing
16 percent
of naviHealth with a redemption value of
$103 million
and a carrying value of
$109 million
. We settled the put in September and our ownership in naviHealth increased to
98 percent
.
The following table summarizes activity in redeemable noncontrolling interests:
|
(in millions)
|
Redeemable Noncontrolling Interest
|
||
|
Balance at June 30, 2017
|
$
|
118
|
|
|
Net earnings attributable to redeemable noncontrolling interests
|
2
|
|
|
|
Net purchase of redeemable noncontrolling interests
|
(103
|
)
|
|
|
Adjustment of redeemable noncontrolling interests to redemption value
|
(5
|
)
|
|
|
Balance at March 31, 2018
|
$
|
12
|
|
13. Shareholders' Equity
During the nine months ended
March 31, 2018
, we repurchased
6.5 million
common shares having an aggregate cost of
$450 million
. The average price paid per share was
$68.81
. We funded the repurchases with available cash and short-term borrowings. These repurchases include
$300 million
purchased under an accelerated share repurchase ("ASR") program, which began on February 14, 2018 and was completed on March 21, 2018. We repurchased
4.3 million
shares under the ASR at an average price paid per share of
$69.26
.
During the nine months ended
March 31, 2017
, we repurchased
8.1 million
common shares having an aggregate cost of
$600 million
. The average price paid per common share was
$74.08
. We funded the repurchases with available cash.
The common shares repurchased are held in treasury to be used for general corporate purposes.
During the nine months ended
March 31, 2017
, we retired
37 million
common shares in treasury. The retirement of these shares had no impact on total shareholders' equity; however, it did impact certain individual components of shareholders' equity as follows:
$2.5 billion
decrease in common shares in treasury,
$302 million
decrease in common shares, and
$2.2 billion
decrease in retained earnings.
|
Cardinal Health
|
Q3
Fiscal 2018 Form 10-Q
|
30
|
|
|
Notes to Financial Statements
|
||
Accumulated Other Comprehensive Loss
The following table summarizes the changes in the balance of accumulated other comprehensive loss by component and in total:
|
(in millions)
|
Foreign
Currency
Translation
Adjustments
|
Unrealized
Gain/(Loss) on
Derivatives,
net of tax
|
Accumulated Other
Comprehensive
Loss
|
||||||||
|
Balance at June 30, 2017
|
$
|
(148
|
)
|
$
|
23
|
|
$
|
(125
|
)
|
||
|
Other comprehensive income/(loss), before reclassifications
|
141
|
|
2
|
|
143
|
|
|||||
|
Amounts reclassified to earnings
|
(23
|
)
|
—
|
|
(23
|
)
|
|||||
|
Other comprehensive income/(loss), net of tax
|
118
|
|
2
|
|
120
|
|
|||||
|
Balance at March 31, 2018
|
$
|
(30
|
)
|
$
|
25
|
|
$
|
(5
|
)
|
||
Activity related to realized and unrealized gains and losses on available-for-sale securities, as described in
Note 6
, was immaterial during the nine months ended
March 31, 2018
.
14. Earnings Per Share Attributable to Cardinal Health, Inc.
The following table reconciles the number of common shares used to compute basic and diluted earnings per share attributable to Cardinal Health, Inc.:
|
Three Months Ended March 31,
|
|||||
|
(in millions)
|
2018
|
2017
|
|||
|
Weighted-average common shares–basic
|
313
|
|
316
|
|
|
|
Effect of dilutive securities:
|
|||||
|
Employee stock options, restricted share units and performance share units
|
2
|
|
2
|
|
|
|
Weighted-average common shares–diluted
|
315
|
|
318
|
|
|
|
Nine Months Ended March 31,
|
|||||
|
(in millions)
|
2018
|
2017
|
|||
|
Weighted-average common shares–basic
|
314
|
|
318
|
|
|
|
Effect of dilutive securities:
|
|||||
|
Employee stock options, restricted share units and performance share units
|
2
|
|
2
|
|
|
|
Weighted-average common shares–diluted
|
316
|
|
320
|
|
|
The potentially dilutive employee stock options, restricted share units and performance share units that were antidilutive were
5 million
and
3 million
for the three months ended
March 31, 2018
and
2017
, respectively, and
5 million
and
3 million
for the nine months ended
March 31, 2018
and
2017
, respectively.
15. Segment Information
Our operations are principally managed on a products and services basis and are comprised of
two
operating segments, which are the same as our reportable segments: Pharmaceutical and Medical. The factors for determining the reportable segments include the manner in which management evaluates performance for purposes of allocating resources and assessing performance combined with the nature of the individual business activities.
The following table presents revenue for each reportable segment and Corporate:
|
Three Months Ended March 31,
|
|||||||
|
(in millions)
|
2018
|
2017
|
|||||
|
Pharmaceutical
|
$
|
29,720
|
|
$
|
28,406
|
|
|
|
Medical
|
3,916
|
|
3,418
|
|
|||
|
Total segment revenue
|
33,636
|
|
31,824
|
|
|||
|
Corporate (1)
|
(3
|
)
|
(3
|
)
|
|||
|
Total revenue
|
$
|
33,633
|
|
$
|
31,821
|
|
|
|
Nine Months Ended March 31,
|
|||||||
|
(in millions)
|
2018
|
2017
|
|||||
|
Pharmaceutical
|
$
|
89,786
|
|
$
|
86,911
|
|
|
|
Medical
|
11,684
|
|
10,107
|
|
|||
|
Total segment revenue
|
101,470
|
|
97,018
|
|
|||
|
Corporate (1)
|
(10
|
)
|
(8
|
)
|
|||
|
Total revenue
|
$
|
101,460
|
|
$
|
97,010
|
|
|
|
(1)
|
Corporate revenue consists of the elimination of inter-segment revenue and other revenue not allocated to the segments.
|
We evaluate segment performance based on segment profit, among other measures. Segment profit is segment revenue, less segment cost of products sold, less segment distribution, selling, general and administrative ("SG&A") expenses. Segment SG&A expenses include share-based compensation expense as well as allocated corporate expenses for shared functions, including corporate management, corporate finance, financial and customer care shared services, human resources, information technology and legal and compliance. The results attributable to noncontrolling interests are recorded within segment profit. Corporate expenses are allocated to the segments based on headcount, level of benefit provided and other ratable allocation methodologies.
We do not allocate the following items to our segments: last-in first-out, or ("LIFO"), inventory charges/(credits); restructuring and employee severance; amortization and other acquisition-related costs; impairments and (gain)/loss on disposal of assets; litigation (recoveries)/charges, net; other income, net; interest expense, net; loss on extinguishment of debt; and provision for/(benefit from) income taxes.
In addition, certain investment spending, certain portions of enterprise-wide incentive compensation and other spending are not allocated to the segments. Investment spending generally includes the first-year spend for certain projects that require incremental investments in the form of additional operating expenses. We
|
31
|
Cardinal Health
|
Q3
Fiscal 2018 Form 10-Q
|
|
|
Notes to Financial Statements
|
||
encourage our segments and corporate functions to identify investment projects that will promote innovation and provide future returns. As approval decisions for such projects are dependent upon executive management, the expenses for such projects are often retained at Corporate. Investment spending within Corporate was
$7 million
and
$2 million
for the three months ended
March 31, 2018
and
2017
, respectively, and
$17 million
and
$4 million
for the nine months ended
March 31, 2018
and
2017
, respectively.
The following table presents segment profit by reportable segment and Corporate:
|
Three Months Ended March 31,
|
|||||||
|
(in millions)
|
2018
|
2017
|
|||||
|
Pharmaceutical
|
$
|
596
|
|
$
|
611
|
|
|
|
Medical
|
199
|
|
148
|
|
|||
|
Total segment profit
|
795
|
|
759
|
|
|||
|
Corporate
|
(249
|
)
|
(154
|
)
|
|||
|
Total operating earnings
|
$
|
546
|
|
$
|
605
|
|
|
|
Nine Months Ended March 31,
|
|||||||
|
(in millions)
|
2018
|
2017
|
|||||
|
Pharmaceutical
|
$
|
1,576
|
|
$
|
1,682
|
|
|
|
Medical
|
548
|
|
435
|
|
|||
|
Total segment profit
|
2,124
|
|
2,117
|
|
|||
|
Corporate
|
(918
|
)
|
(436
|
)
|
|||
|
Total operating earnings
|
$
|
1,206
|
|
$
|
1,681
|
|
|
The following table presents total assets for each reportable segment and Corporate at:
|
(in millions)
|
March 31,
2018 |
June 30,
2017 |
|||||
|
Pharmaceutical
|
$
|
20,573
|
|
$
|
21,848
|
|
|
|
Medical
|
17,746
|
|
10,688
|
|
|||
|
Corporate
|
2,712
|
|
7,576
|
|
|||
|
Total assets
|
$
|
41,031
|
|
$
|
40,112
|
|
|
16. Share-Based Compensation
We maintain stock incentive plans (collectively, the “Plans”) for the benefit of certain of our officers, directors and employees.
The following table provides total share-based compensation expense by type of award:
|
Three Months Ended March 31,
|
|||||||
|
(in millions)
|
2018
|
2017
|
|||||
|
Restricted share unit expense
|
$
|
20
|
|
$
|
18
|
|
|
|
Employee stock option expense
|
7
|
|
4
|
|
|||
|
Performance share unit expense
|
(4
|
)
|
3
|
|
|||
|
Total share-based compensation
|
$
|
24
|
|
$
|
25
|
|
|
The sum of the components may not equal the total due to rounding.
|
Nine Months Ended March 31,
|
|||||||
|
(in millions)
|
2018
|
2017
|
|||||
|
Restricted share unit expense
|
$
|
56
|
|
$
|
53
|
|
|
|
Employee stock option expense
|
17
|
|
14
|
|
|||
|
Performance share unit expense
|
(9
|
)
|
6
|
|
|||
|
Total share-based compensation
|
$
|
64
|
|
$
|
73
|
|
|
The total tax benefit related to share-based compensation was
$8 million
and
$9 million
for the three months ended
March 31, 2018
and
2017
, respectively, and
$20 million
and
$25 million
for the nine months ended
March 31, 2018
and
2017
, respectively.
Restricted Share Units
Restricted share units granted under the Plans generally vest in equal annual installments over
three years
. Restricted share units accrue cash dividend equivalents that are payable upon vesting of the awards.
The following table summarizes all transactions related to restricted share units under the Plans:
|
(in millions, except per share amounts)
|
Restricted Share Units
|
Weighted-Average
Grant Date Fair
Value per Share
|
||||
|
Nonvested at June 30, 2017
|
2
|
|
$
|
76.72
|
|
|
|
Granted
|
1
|
|
66.13
|
|
||
|
Vested
|
(1
|
)
|
79.23
|
|
||
|
Canceled and forfeited
|
—
|
|
—
|
|
||
|
Nonvested at March 31, 2018
|
2
|
|
$
|
71.97
|
|
|
At
March 31, 2018
, the total pre-tax compensation cost, net of estimated forfeitures, related to nonvested restricted share units not yet recognized was
$73 million
, which is expected to be recognized over a weighted-average period of
two years
.
Stock Options
Employee stock options granted under the Plans generally vest in equal annual installments over
three years
and are exercisable for
ten years
from the grant date. All stock options are exercisable at a price equal to the market value of the common shares underlying the option on the grant date.
The following table summarizes all stock option transactions under the Plans:
|
(in millions, except per share amounts)
|
Stock
Options
|
Weighted-Average
Exercise Price per
Common Share
|
||||
|
Outstanding at June 30, 2017
|
6
|
|
$
|
63.44
|
|
|
|
Granted
|
2
|
|
66.44
|
|
||
|
Exercised
|
(1
|
)
|
43.08
|
|
||
|
Canceled and forfeited
|
—
|
|
—
|
|
||
|
Outstanding at March 31, 2018
|
7
|
|
$
|
64.82
|
|
|
|
Exercisable at March 31, 2018
|
5
|
|
$
|
59.55
|
|
|
At
March 31, 2018
, the total pre-tax compensation cost, net of estimated forfeitures, related to nonvested stock options not yet recognized was
$26 million
, which is expected to be recognized over
|
Cardinal Health
|
Q3
Fiscal 2018 Form 10-Q
|
32
|
|
|
Notes to Financial Statements
|
||
a weighted-average period of
two years
. The following tables provide additional detail related to stock options:
|
(in millions)
|
March 31, 2018
|
June 30, 2017
|
|||||
|
Aggregate intrinsic value of outstanding options at period end
|
$
|
46
|
|
$
|
109
|
|
|
|
Aggregate intrinsic value of exercisable options at period end
|
46
|
|
106
|
|
|||
|
(in years)
|
March 31, 2018
|
June 30, 2017
|
|
|
Weighted-average remaining contractual life of outstanding options
|
7
|
7
|
|
|
Weighted-average remaining contractual life of exercisable options
|
6
|
6
|
|
Performance Share Units
Performance share units vest over a
three
-year performance period based on achievement of specific performance goals. Based on the extent to which the targets are achieved, vested shares may range from
zero
to
200 percent
of the target award amount. Performance share units accrue cash dividend equivalents that are payable upon vesting of the awards.
The following table summarizes all transactions related to performance share units under the Plans (based on target award amounts):
|
(in millions, except per share amounts)
|
Performance
Share Units
|
Weighted-Average
Grant Date Fair
Value per Share
|
||||
|
Nonvested at June 30, 2017
|
0.6
|
|
$
|
77.83
|
|
|
|
Granted
|
0.2
|
|
66.43
|
|
||
|
Vested (1)
|
(0.2
|
)
|
71.57
|
|
||
|
Canceled and forfeited
|
(0.2
|
)
|
—
|
|
||
|
Nonvested at March 31, 2018
|
0.4
|
|
$
|
66.14
|
|
|
(1) Vested based on achievement of
133 percent
of the target performance goal.
At
March 31, 2018
, the total pre-tax compensation cost, net of
estimated forfeitures, related to nonvested performance share units not yet recognized was
$9 million
, which is expected to be recognized over a weighted-average period of
two years
if targets are achieved.
17. Subsequent Events
In April 2018, the State of New York passed a budget which included the Opioid Stewardship Act (the “OSA”). The OSA created an aggregate $100 million annual assessment on all manufacturers and distributors licensed to sell or distribute opioids in New York. Each licensed manufacturer and distributor will be required to pay a portion of the assessment based on its ratable share, as determined by the state, of the total morphine milligram equivalents sold or distributed in New York during the applicable calendar year. The initial payment is due on January 1, 2019 for opioids sold or distributed during calendar year 2017.
We accrue for contingencies if it is probable that a liability has been incurred and the amount can be reasonably estimated.
At this time
, we are unable to estimate amounts which we will owe under the OSA for calendar year 2017 or 2018 because the information necessary to determine our share of the assessment is not yet available.
|
33
|
Cardinal Health
|
Q3
Fiscal 2018 Form 10-Q
|
|
|
Exhibits
|
||
Exhibits
|
Exhibit
Number
|
Exhibit Description
|
|
3.1
|
|
|
3.2
|
|
|
10.1
|
|
|
10.2
|
|
|
12.1
|
|
|
31.1
|
|
|
31.2
|
|
|
32.1
|
|
|
99.1
|
|
|
101.INS
|
XBRL Instance Document
|
|
101.SCH
|
XBRL Taxonomy Extension Schema Document
|
|
101.CAL
|
XBRL Taxonomy Extension Calculation Linkbase Document
|
|
101.DEF
|
XBRL Taxonomy Definition Linkbase Document
|
|
101.LAB
|
XBRL Taxonomy Extension Label Linkbase Document
|
|
101.PRE
|
XBRL Taxonomy Extension Presentation Linkbase Document
|
Cardinal Health Website
Cardinal Health uses its website as a channel of distribution for material company information. Important information, including news releases, financial information, earnings and analyst presentations and information about upcoming presentations and events is routinely posted and accessible at ir.cardinalhealth.com. In addition, the website allows investors and other interested persons to sign up automatically to receive e-mail alerts when the company posts news releases, SEC filings and certain other information on its website.
|
Cardinal Health
|
Q3
Fiscal 2018 Form 10-Q
|
34
|
|
|
Form 10-Q Cross Reference Index
|
||
Form 10-Q Cross Reference Index
|
Item Number
|
Page
|
|
|
Part I. Financial Information
|
||
|
Item 1
|
||
|
Item 2
|
||
|
Item 3
|
||
|
Item 4
|
||
|
Part II. Other Information
|
||
|
Item 1
|
||
|
Item 1A
|
||
|
Item 2
|
||
|
Item 3
|
Defaults Upon Senior Securities
|
N/A
|
|
Item 4
|
Mine Safety Disclosures
|
N/A
|
|
Item 5
|
Other Information
|
N/A
|
|
Item 6
|
||
|
N/A
|
Not applicable
|
|
|
35
|
Cardinal Health
|
Q3
Fiscal 2018 Form 10-Q
|
|
|
Additional Information
|
||
Signatures
Pursuant to the requirements of Section 13 or 15(d) of the Securities Exchange Act of 1934, the registrant has duly caused this report to be signed on its behalf by the undersigned, thereunto duly authorized.
|
Cardinal Health, Inc.
|
||
|
Date:
|
May 9, 2018
|
/s/ MICHAEL C. KAUFMANN
|
|
Michael C. Kaufmann
|
||
|
Chief Executive Officer
|
||
|
/s/ JORGE M. GOMEZ
|
||
|
Jorge M. Gomez
|
||
|
Chief Financial Officer
|
||
|
Cardinal Health
|
Q3
Fiscal 2018 Form 10-Q
|
36
|
|
TABLE OF CONTENTS