CAL-MAINE FOODS INC
10-Ks and 10-Qs
|
|
|
|
|
|
|
|
|
|
|
|
|
|
|
|
|
|
|
|
|
|
|
|
|
|
|
|
|
|
|
|
|
|
|
|
|
|
|
|
|
|
|
|
|
|
|
|
|
|
|
|
|
|
|
|
|
|
|
|
|
|
1
UNITED STATES
SECURITIES AND EXCHANGE COMMISSION
Washington, DC
20549
FORM
ANNUAL REPORT PURSUANT TO
SECTION 13 OR 15(d) OF THE SECURITIES EXCHANGE ACT OF 1934
For The Fiscal Year
Ended
☐
TRANSITION REPORT PURSUANT
TO SECTION 13 OR 15(d) OF THE SECURITIES EXCHANGE
ACT OF 1934
For the transition period from ____________ to ____________
Commission file number:
(Exact name of registrant as specified in its charter)
(State or other Jurisdiction of Incorporation or Organization)
(I.R.S. Employer Identification No.)
,
,
(Address of principal executive offices) (Zip Code)
(
)
(Registrant’s telephone number, including area code)
Securities registered pursuant to Section 12 (b) of the Act:
Title of each class:
Trading Symbol(s)
Name of each exchange on which registered:
The
Securities registered pursuant to Section 12 (g) of the Act:
NONE
Indicate by check mark if the registrant is a well-known seasoned issuer as defined in Rule 405 of the Securities Act.
☑
No
☐
Indicate by check mark if the registrant is not required to file reports pursuant to Section 13 or Section 15(d) of the Act.
Yes
☐
☑
Indicate by check mark whether the registrant (1)
has filed all reports required to be filed
by Section 13 or 15(d) of the
Securities Exchange Act
of 1934 during the preceding
12 months (or for such
shorter period that the registrant
was required to file
such reports), and (2) has
been subject
to such filing requirements for the past 90 days.
☑
No
☐
Indicate by check mark whether
the registrant has submitted
electronically every Interactive Data
File required to be
submitted pursuant to Rule
405 of Regulation S-T (§232.405 of this chapter) during the preceding 12 months (or for such shorter period that the registrant was required to
submit
such files).
☑
No
☐
Indicate
by
check
mark
whether
the
registrant
is
a
large
accelerated
filer,
an
accelerated
filer,
a
non-accelerated
filer,
a
smaller
reporting
company,
or an emerging
growth company.
See the definitions
of “large accelerated
filer,” “accelerated
filer”, “smaller reporting
company”,
and "emerging growth company" in Rule 12b-2 of the Exchange Act.
☑
Accelerated filer
☐
Non-accelerated filer
☐
Smaller reporting company
☐
Emerging growth company
☐
If an
emerging
growth company,
indicate by
check mark
if the
registrant has
elected not
to use
the extended
transition period
for
complying with any new or revised financial accounting standards provided pursuant to Section 13(a) of the Exchange Act
☐
Indicate by
check mark
whether the registrant
has filed
a report on
and attestation
to its management's
assessment of
the effectiveness
of its
internal control over
financial reporting under
Section 404(b) of
the Sarbanes-Oxley Act
(15 U.S.C.
7262(b)) by the
registered public accounting
firm that prepared or issued its audit report.
Indicate by check mark whether the registrant is a shell company (as defined in Rule 12b-2 of the Act).
Yes
☐
No
☑
The aggregate market value, as
reported by The NASDAQ Global Select
Market, of the registrant’s
Common Stock, $0.01 par value,
held by
non-affiliates
at November 26,
2021, which
was the
date of
the last
business day
of the
registrant’s
most recently
completed second
fiscal
quarter, was $
1,428,527,739
.
As of
July 19,
2022,
Common Stock, $0.01 par value, were outstanding.
DOCUMENTS INCORPORATED
BY REFERENCE
The information called
for by Part
III of this Form
10-K is incorporated
herein by reference
from the registrant’s
Definitive Proxy Statement
for its 2022
annual meeting of
stockholders which will be
filed pursuant to
Regulation 14A not later
than 120 days
after the end
of the fiscal
year covered by this report.
2
TABLE OF CONTENTS
Item
Page
Number
1.
1A.
1B.
2.
3.
4.
5.
6.
7.
7A.
8.
9.
9A.
9B.
9C.
10.
11.
12.
13.
14.
15.
16.
3
PART
I.
FORWARD
-LOOKING STATEMENTS
This report contains numerous forward-looking statements within the meaning
of Section 27A of the Securities Act of 1933 (the
“Securities Act”) and Section 21E of the Securities Exchange Act of 1934 (the “Exchange Act”) relating
to, among other things,
our shell egg business, including estimated future production data, expected construction schedules, projected construction costs,
potential future supply of and demand for our products, potential future corn and soybean price trends, potential future impact on
our business of
the COVID-19 pandemic,
potential future impact
on our business
of new legislation,
rules or policies,
potential
outcomes
of
legal
proceedings,
and
other
projected
operating
data,
including
anticipated
results
of
operations
and
financial
condition. Such forward-looking statements are identified by the use of words such as “believes,” “intends,” “expects,”
“hopes,”
“may,”
“should,” “plans,”
“projected,” “contemplates,”
“anticipates,” or
similar words.
Actual outcomes
or results could
differ
materially from those
projected in the forward-looking
statements. The forward-looking
statements are based
on management’s
current intent, belief,
expectations, estimates, and
projections regarding the
Company and its industry.
These statements are
not
guarantees of future performance
and involve risks, uncertainties, assumptions,
and other factors that are
difficult to predict and
may be beyond
our control. The
factors that could
cause actual results
to differ
materially from
those projected
in the forward-
looking statements
include, among
others, (i)
the risk
factors set
forth in
Item 1A
Risk Factors
and elsewhere
in this
report as
well
as those
included
in other
reports
we file
from time
to time
with the
Securities
and
Exchange
Commission
(the “SEC”)
(including our Quarterly Reports on Form 10-Q and Current Reports
on Form 8-K), (ii) the risks and hazards inherent
in the shell
egg business (including disease, pests, weather conditions, and potential for product recall), including but not limited to the most
recent outbreak of highly pathogenic avian influenza (“HPAI”)
affecting poultry in the U.S., Canada and other countries that was
first detected in commercial
flocks in the U.S. in
February 2022, (iii) changes in
the demand for and market
prices of shell eggs
and feed costs, (iv)
our ability to
predict and meet
demand for cage-free and
other specialty eggs, (v)
risks, changes, or obligations
that
could
result
from
our
future
acquisition
of
new
flocks
or
businesses
and
risks
or
changes
that
may
cause
conditions
to
completing
a
pending
acquisition
not
to
be
met,
(vi)
risks
relating
to
the
evolving
COVID-19
pandemic,
including
without
limitation increased costs
and rising inflation
and interest rates, which
generally have been
exacerbated by Russia’s
invasion of
Ukraine starting
in February
2022, (vii)
our ability
to retain
existing customers,
acquire new
customers and
grow our
product
mix, and (viii) adverse results
in pending litigation matters. Readers
are cautioned not to place
undue reliance on forward-looking
statements because,
while we believe
the assumptions on
which the forward-looking
statements are based
are reasonable, there
can be no
assurance that these
forward-looking statements will prove
to be accurate.
Further, forward-looking statements included
herein are only made as of the respective dates thereof, or if no
date is stated, as of the date hereof. Except as otherwise required
by
law,
we
disclaim
any
intent
or
obligation
to
publicly
update
these
forward-looking
statements,
whether
because
of
new
information, future events, or otherwise.
ITEM 1.
BUSINESS
Our Business
We are the largest
producer and distributor of shell eggs in the United States. Our mission is to be the most sustainable
producer
and reliable
supplier of
consistent, high
quality fresh
shell eggs
and egg
products
in the
country,
demonstrating
a "Culture
of
Sustainability" in everything we do, and
creating value for our shareholders,
customers, team members and communities. We sell
most of our shell
eggs in the southwestern,
southeastern, mid-western and
mid-Atlantic regions of the
U.S. and aim to maintain
efficient, state-of-the-art operations located close to our customers. We
were founded in 1957 by the late Fred R. Adams, Jr. and
are headquartered in Ridgeland, Mississippi.
The Company has one operating segment, which is the production, grading, packaging,
marketing and distribution of shell eggs.
Our
integrated
operations
consist
of
hatching
chicks,
growing
and
maintaining
flocks
of
pullets,
layers
and
breeders,
manufacturing feed, and
producing, processing, packaging, and
distributing shell eggs.
Layers are mature
female chickens, pullets
are female chickens usually less than 18 weeks of age, and breeders are male and female chickens used to produce fertile eggs to
be hatched for egg production flocks. Our total flock as of May 28, 2022 consisted of approximately 42.2 million layers and 11.5
million pullets and breeders.
Many of our customers rely
on us to provide most of
their shell egg needs, including
specialty and conventional eggs.
Specialty
eggs encompass a broad range of products. We classify nutritionally enhanced,
cage-free, organic,
free-range, pasture-raised and
brown eggs
as specialty
eggs for
accounting and
reporting purposes.
We
classify all
other shell
eggs as
conventional products.
While we report separate sales information
for these egg types, there
are many cost factors that are
not specifically available for
conventional or
specialty eggs
due to
the nature
of egg
production. We
manage our
operations and
allocate resources
to these
types of eggs on a consolidated basis based on the demands of our customers.
4
Throughout the Company’s history,
we have acquired other companies in our industry. Since 1989 through our fiscal year ended
May 28, 2022, we have completed 23 acquisitions ranging
in size from 160 thousand layers to 7.5 million layers. Most recently,
effective on May 30, 2021, the Company acquired
the remaining 50% membership interest in Red River Valley
Egg Farm, LLC
(“Red River”),
which owns and
operates a specialty
shell egg production
complex that includes
1.7 million cage-free
hens. For
further
description
of
this
transaction,
refer
to
Part
II.
Item
8.
Notes
to
the
Consolidated
Financial
Statements,
.
In fiscal 2021,
we announced that
our Board of
Directors approved several
new capital projects
with an estimated
cost of $105
million to further
expand the Company’s
cage-free egg production
capabilities. These projects
include expanding
our cage-free
egg production at our
Okeechobee, Florida, production
facility. The
project is designed to include
the construction of two
cage-
free layer houses and one cage-free pullet house with capacity
for approximately 400 thousand cage-free hens and 210 thousand
pullets, respectively.
Construction is
well underway,
with the
first pullets
placed in
mid-May 2022,
the first
layer house
to be
finished by September 2022, and
with the second layer house and
project completion expected by January
2023. In Delta, Utah,
we
are
constructing
four
new
cage-free
layer
houses
and
two
pullet
house
conversions
with
capacity
for
approximately
810
thousand
cage-free
layer
hens,
which
is
expected
to
be
completed
by
fall
of
2023.
At
our
Guthrie,
Kentucky
farm,
we
are
converting existing facilities into nine
cage-free layer houses and
two pullet houses with
capacity for approximately 953 thousand
cage-free
hens,
which
is
expected
to
be
completed
by
spring
of
2025.
The
Company
plans
to
fund
these
projects
through
a
combination of available cash on hand, investments and operating cash flow.
In
October
2021,
we
announced
a
strategic
investment
in
MeadowCreek
Foods,
LLC,
that
will
specialize
in
high
value
commercial product solutions targeting specific needs in the food industry. For further description of this
transaction, refer to “—
Egg Products” below.
Effective December 5, 2021, we made an additional investment in our joint venture Southwest Specialty Eggs, LLC (“Southwest
Specialty”), to
acquire
warehouse
and
distribution
capability
to
expand
Southwest
Specialty’
customer
base
in the
southern
California, Arizona and Nevada markets.
Subsequent
to
the
end
of
fourth
quarter
2022,
the
Company’s
Board
of
Directors
approved
a
capital
project
to
expand
the
Company’s
cage-free production
capabilities. The
proposed project
at Chase,
Kansas will
convert
existing conventional
layer
capacity to cage-free capacity for
approximately 1.5 million cage-free hens
and include remodels of
all remaining pullet facilities.
Work is expected
to commence immediately with project completion expected by year-end
2025.
When
we
use
“we,”
“us,”
“our,”
or
the
“Company”
in
this
report,
we
mean
Cal-Maine
Foods,
Inc.
and
our
consolidated
subsidiaries, unless otherwise indicated or the context otherwise requires. Our fiscal year 2022 ended May 28, 2022, and the first
three fiscal quarters of fiscal
2022 ended August 28, 2021, November
27, 2021, and February 26, 2022.
All references herein to
a fiscal year means our fiscal year and all references to a year mean a calendar year.
Industry Background
According to the U.S.
Department of Agriculture (“USDA”) Agricultural
Marketing Service in 2021,
approximately 71% of table
eggs produced in the U.S.
were sold as shell
eggs, with 55.7% sold through food
at home outlets such
as grocery and convenience
stores, 11.9%
sold to food-away-from
home channels such as
restaurants and 3.7%
that are exported.
The USDA estimates that
29%
of
eggs
produced
in
the
U.S.
are
sold
as
egg
products
(shell
eggs
broken
and
sold
in
liquid,
frozen,
or
dried
form)
to
institutions (e.g. companies producing baked goods). For information about egg producers in the U.S., see “Competition” below.
We are closely monitoring the
latest outbreak of
highly pathogenic avian
influenza (“HPAI”) that was first
detected in commercial
flocks in the
U.S. in February
2022. According
to the U.S. Centers
for Disease Control
and Prevention, these
detections do not
present
an
immediate
public
health
concern.
There
have
been
no
positive
tests for
HPAI
at
any
Cal-Maine
Foods’
owned
or
contracted production facility as of July 19,
2022. The USDA division of Animal and
Plant Health Inspection Service (“APHIS”)
reported that approximately 30.7 million commercial layer hens
have been depopulated due to HPAI, representing approximately
9.5%
of
the
table
layer
flock
based
on
February
2022
reported
layer
numbers.
Pullets
impacted
comprise
approximately
1.0
million. According to APHIS,
the most recently reported
outbreaks
of HPAI affecting commercial layer hens and
pullets occurred
June 7,
2022 and
June 9, 2022,
respectively.
We
believe the
HPAI
outbreak will
continue to
impact the
overall supply
of eggs
until the layer
hen flock is
fully replenished. While no
farm is immune
from HPAI, we believe we have
implemented and continue
to maintain robust
biosecurity programs across
our locations. We are
also working closely
with federal, state
and local
government
officials
and focused
industry groups
to mitigate
the risk
of this
and future
outbreaks and
effectively
manage our
response, if
needed.
Given
historical
consumption
trends,
we believe
in the
U.S. that
general demand
for eggs
increases basically
in line
with the
overall U.S.
population growth.
Specific events
can impact
egg consumption
in a
particular period,
as occurred
with the
2015
5
HPAI
outbreak,
the
pandemic,
and
the
most
recent
HPAI
outbreak.
For
example,
in
2015,
egg
consumption
decreased
approximately
3.4%
compared
with
2014,
primarily
tied
to
a
shortage
of
eggs
resulting
from
an
outbreak
of
HPAI
in
U.S.
commercial flocks in 2014 and 2015. In 2016, consumption rebounded and increased approximately 6.0% versus 2015 and 2.5%
versus
the
pre-shortage
level
of
2014.
According
to
the
USDA’s
Economic
Research
Service,
estimated
annual
per
capita
consumption in the United States between 2016 and 2021 varied, ranging from
271 to 288 eggs. In calendar year
2021, per capita
U.S. consumption was estimated to be 280 eggs,
or approximately 5.4 eggs per person per
week. The USDA calculates per capita
consumption by dividing total
shell egg disappearance in the
U.S. by the U.S.
population. Sales prices of
eggs are dependent upon
many factors other than consumption. For information about shell egg prices
see “Prices for Shell Eggs” below.
Prices for Shell Eggs
Wholesale shell
egg sales
prices are
a critical
component of
revenue for
the Company.
Wholesale shell
egg prices
are volatile,
cyclical, and impacted
by a number
of factors, including
consumer demand, seasonal
fluctuations, the number
and productivity
of laying hens
in the U.S.,
the pandemic and
outbreaks of HPAI
.
While we use
several different
pricing mechanisms in
pricing
agreements with our customers,
we believe the majority
of conventional shell eggs
sold in the U.S. in
the retail and foodservice
channels are sold at prices
that take into account, in
varying ways, independently quoted
wholesale market prices,
such as those
published by Urner Barry
Publications, Inc. ("UB") for
shell eggs. We
sell the majority of
our conventional shell eggs
based on
formulas that take
into account,
in varying ways,
independently quoted regional
wholesale market prices
for shell
eggs or
formulas
related to our costs of production, which include the cost of corn and soybean meal. We do not sell eggs directly to consumers or
set the prices at which eggs are sold to consumers.
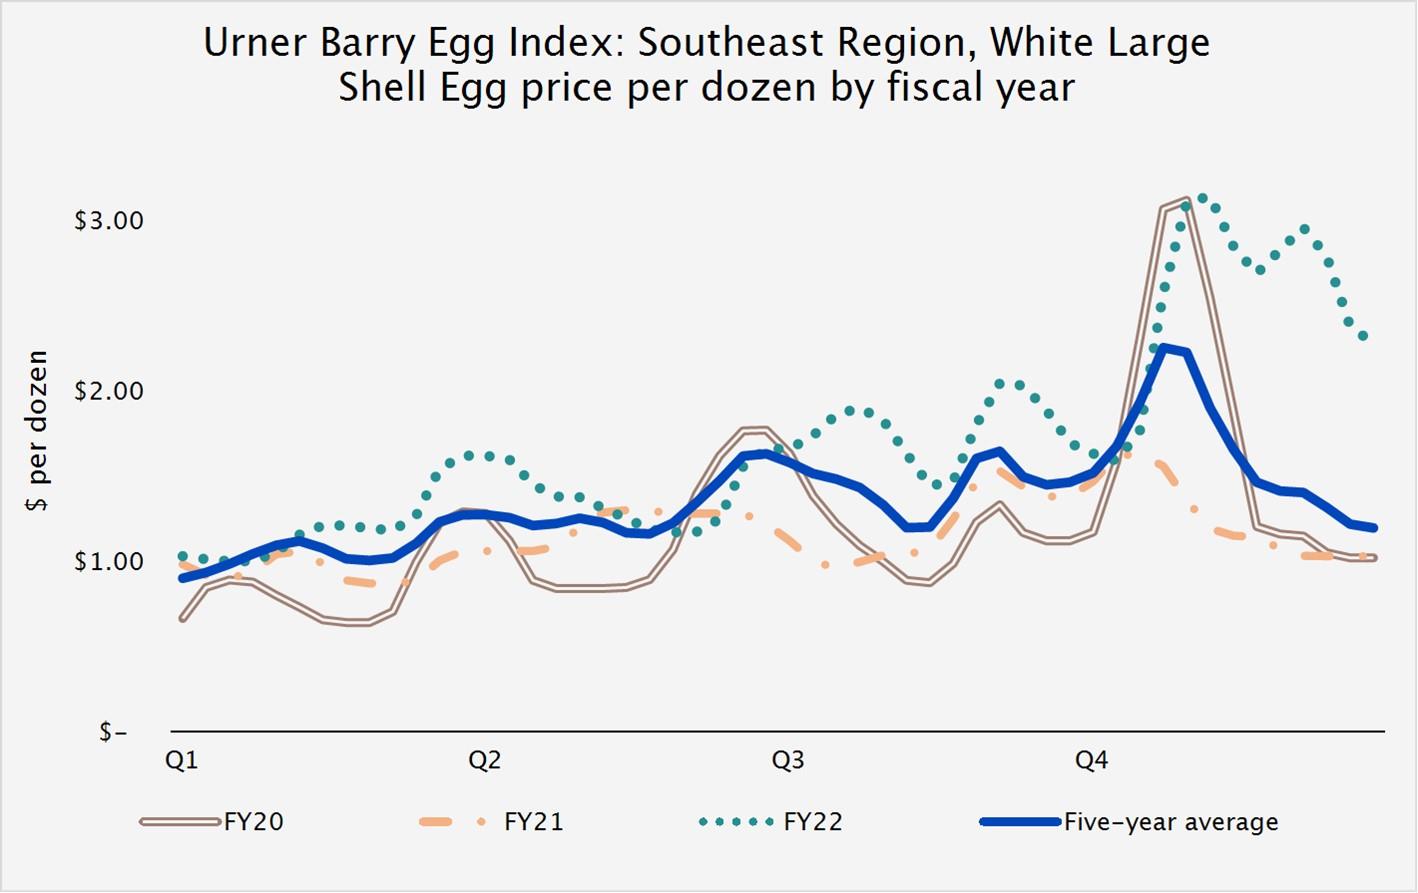
The weekly
average price for
the southeast region
for large white
conventional shell
eggs as quoted
by UB is
shown below for
the past three
fiscal years along
with the five-year average
price. As further
discussed in
, conventional shell
egg prices rose in our
fourth quarter of fiscal
2022, due to the
reduced
supply related
to the
HPAI
outbreak first
detected in
commercial flocks
in February
2022 and
steady shell
egg demand.
In the
fourth quarter
of fiscal 2020
there was a
brief but
significant increase
in shell egg
demand from
retail consumers
related to the
onset of
the COVID-19
pandemic. The
actual prices
that we realize
on any
given transaction
will not necessarily
equal quoted
market
prices because
of the
individualized
terms that
we negotiate
with individual
customers which
are influenced
by many
factors.
6
Specialty eggs
are typically
sold at
prices and
terms negotiated
directly with
customers. Historically,
prices for
specialty eggs
have
experienced
less
volatility
than
prices
for
conventional
shell
eggs
and
have
generally
been
higher
due
to
customer
and
consumer willingness to pay more for specialty eggs.
Feed Costs for Shell Egg Production
Feed is a primary cost component in
the production of shell eggs and
represented 61.9% of our fiscal 2022 farm
production costs.
We routinely fill our storage bins during harvest
season when prices for
feed ingredients are generally lower. To ensure continued
availability of feed
ingredients, we may
enter into contracts for
future purchases of
corn and soybean meal,
and as part of
these
contracts,
we
may
lock-in
the basis
portion
of
our
grain
purchases
several
months
in
advance.
Furthermore,
due
to
the more
limited
supply
for
organic
ingredients
we
may
commit
to
purchase
organic
ingredients
in
advance
to
help
assure
supply.
Ordinarily, we do not enter into long-term contracts beyond a year to purchase corn and soybean meal or hedge against increases
in the prices
of corn and soybean meal. As the quality and composition
of feed is a critical factor in the nutritional value of shell
eggs and health
of our chickens,
we formulate and
produce the vast
majority of our
own feed at our
feed mills located
near our
production plants. Our annual feed
requirements for fiscal 2022 were
1.9 million tons of finished
feed, of which we manufactured
1.8 million tons.
We
currently have
the capacity
to store
174 thousand
tons of
corn and
soybean meal,
and we
replenish these
stores as needed throughout the year.
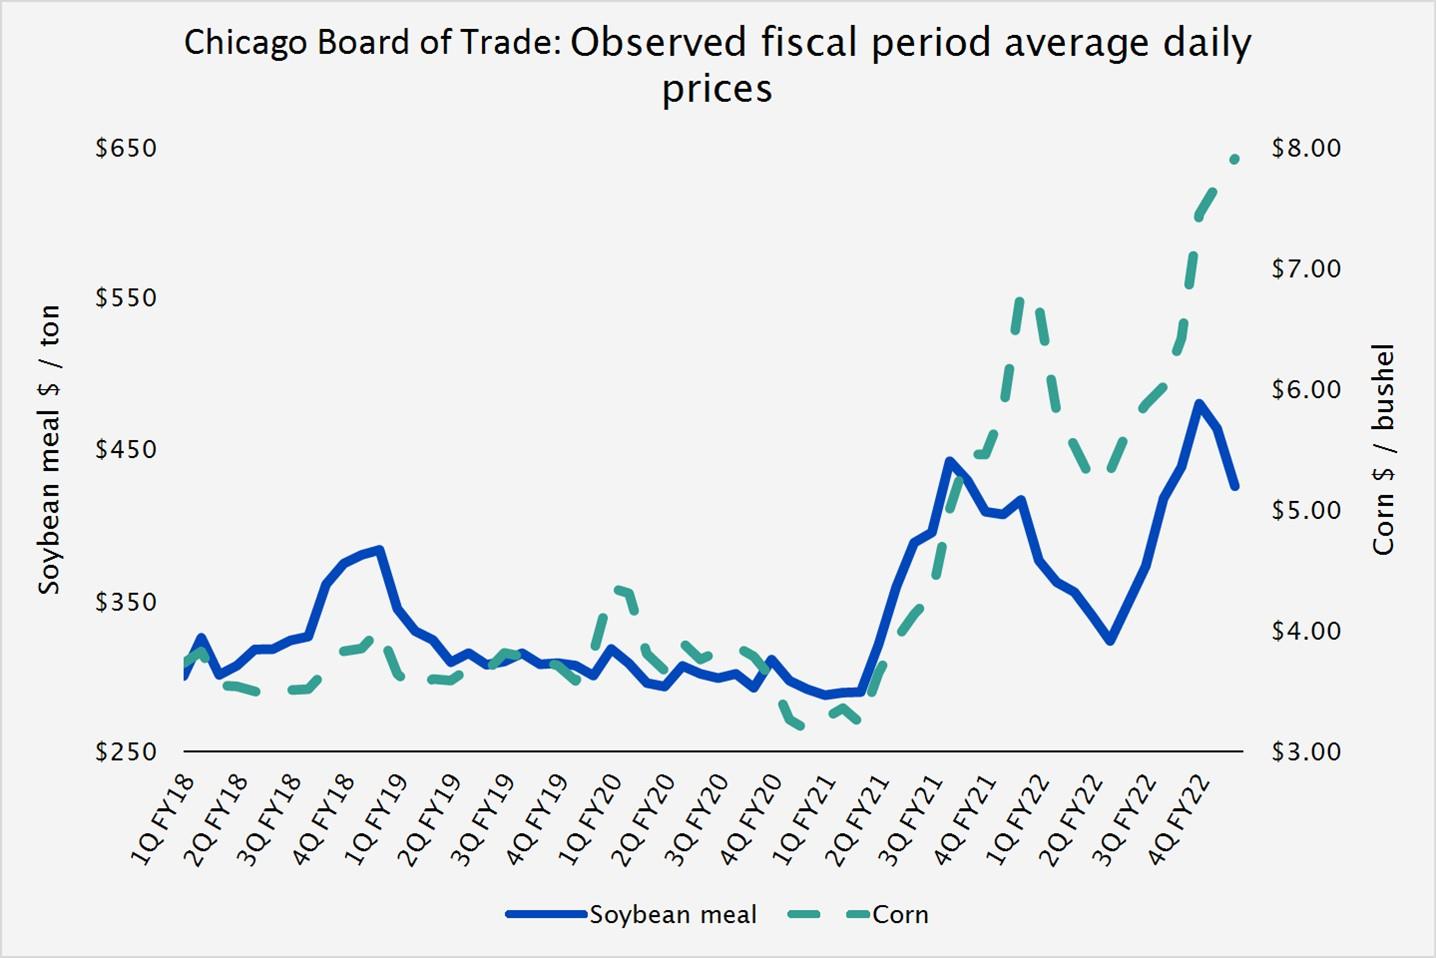
Our primary feed ingredients, corn
and soybean meal, are commodities subject
to volatile price changes due to
weather, various
supply and
demand factors,
transportation and
storage costs,
speculators and
agricultural, energy
and trade
policies in
the U.S.
and internationally and
most recently the Russia-Ukraine
war. While we
do not import
corn or soy directly
from the region, the
Russia-Ukraine
war has
had
a negative
impact on
the worldwide
supply of
grain, including
corn, putting
upward pressure
on
prices.
We
purchase
the
vast
majority
of
our
corn
and
soybean
meal
from
U.S
sources
but
may
be
forced
to
purchase
internationally
when
U.S.
supplies are
not
readily
available.
Feed
grains
are
currently
available
from
an
adequate
number
of
sources in the U.S. As a point of
reference, a multi-year comparison of
the average of daily closing prices per
Chicago Board of
Trade for each period in our fiscal calendar are
shown below for corn and soybean meal:
7
Shell Egg Production
Our percentage of dozens produced to sold was
94.3%
of our total shell eggs sold in fiscal 2022,
with 91.7% of such production
coming from company-owned facilities,
and 8.3% from contract
producers. Under a
typical arrangement with
a contract producer,
we
own
the
flock,
furnish
all feed
and
critical
supplies,
own
the
shell
eggs
produced
and
assume
market
risks.
The contract
producers own and operate their facilities and are paid a fee based on production
with incentives for performance.
The commercial production of shell eggs requires a source of baby chicks for laying flock replacement. We grow the majority of
our chicks in
our own breeder
farms and hatcheries
in a
computer-controlled environment and
obtain the balance
from commercial
sources.
After eggs are
produced, they are
cleaned, graded and
packaged. Substantially all
our farms have
modern “in-line” facilities
which
mechanically
gather,
clean,
grade
and
package
the
eggs
at
the
location
where
they
are
laid.
The
in-line
facilities
generate
significant efficiencies
and cost
savings compared
to the
cost of
eggs produced
from non-in-line
facilities, which
process eggs
that have
been laid
at another
location and
transported to
the facility.
The in-line
facilities also
produce a
higher percentage
of
USDA Grade A
eggs, which
sell at higher
prices. Eggs produced
on farms owned
by contractors are
brought to our
processing
plants to be graded and packaged.
Because shell eggs are perishable, we
do not maintain large egg inventories. Our egg
inventory
averaged
six days
of sales
during fiscal 2022.
We believe our constant
focus on production
efficiencies and automation throughout
the supply chain enable us to be a low-cost supplier in our markets.
We
are proud
to have
created and
upheld
what we
believe is
a leading
poultry
Animal Welfare
Program
(“AWP”).
We
have
aligned our AWP with regulatory,
veterinary and our certifying bodies’ guidance to govern welfare of animals in our direct care,
our contract
farmers’ care
and our farmer-suppliers’
care. We
continually review
our program
to monitor and
evolve standards
that
guide
how we
hatch
chicks,
rear
pullets
and
nurture
breeder
and
layer
hens.
At each
stage
of
our
animals’
lives, we
are
dedicated
to providing
welfare
conditions
aligned
to our
commitment
to
the principles
of
the
internationally
recognized
Five
Freedoms of Animal Welfare
. Our standards apply to
our enterprise and are
tailored for our owned and
contract grower operations
with oversights and approvals from senior members of our compliance
team.
We
do not
use artificial
hormones in
the production
of our
eggs. Hormone
use in
the poultry
and egg
production industry
has
been
effectively
banned
in
the U.S.
since
the
1950s.
We
have
an
extensive
written
protocol
that
allows
the
use
of
medically
important
antibiotics
only
when
animal
health
is
at
risk,
consistent
with
guidance
from
the
United
States
Food
and
Drug
Administration
("FDA")
and
the
Guidance
for
Judicious
Therapeutic
Use
of
Antimicrobials
in
Poultry,
developed
by
the
American Association of Avian Pathologists. When antibiotics are medically necessary, a licensed veterinary
doctor will approve
and administer approved doses for a restricted period. Our programs are designed to ensure antibiotics are ordered and used only
when necessary and records of their usage – when and where – are maintained to monitor compliance with our protocols. We
do
not use antibiotics for growth promotion or performance enhancement.
Specialty Eggs
We
are
one
of
the
largest
producers
and
marketers
of
value-added
specialty
shell
eggs
in
the
U.S.,
which
continues
to
be
a
significant and growing segment of the
market. We classify nutritionally enhanced, cage-free, organic,
free-range, pasture-raised,
and brown
eggs as
specialty
eggs for
accounting and
reporting purposes.
Specialty eggs
are intended
to meet
the demands
of
consumers who are sensitive to environmental, health and/or animal welfare
issues.
As defined by the USDA, eggs packed in USDA grade
marked consumer packages labeled as cage-free
are laid by hens that are
able to roam vertically and horizontally in indoor houses and have access to fresh food and water.
Cage-free systems must allow
hens to
exhibit natural
behaviors and
include enrichments
such as
scratch areas,
perches
and nests.
Hens must
have access
to
litter, protection from predators and be
able to move in a barn in a manner that promotes bird welfare.
A significant
number of
our customers
have announced
goals to offer
cage-free eggs
exclusively on
or before
2026, subject
in
most cases to availability of supply,
affordability and customer demand, among other
contingencies. Additionally,
several states
have
passed
legislation
requiring
the
sale
and
production
of
only
cage-free
eggs
within
this
time
period
and
other
states
are
considering
such requirements.
We
have
monitored,
and will
continue
to monitor,
this legislation
and any
legal challenges
to
these
new
laws.
Recently,
the
Supreme
Court
of
the
U.S.
announced
that
in
October
2022
it
will
review
a
case
challenging
California’s
Proposition 12
that requires the
sale of only
cage-free eggs in
that state. Our
customers typically
do not commit
to
long-term purchases
of specific quantities
or types
of eggs with
us, and as
a result, it
is difficult
to accurately
predict customer
requirements for
cage-free eggs.
We
are, however,
engaging with
our customers
in an
effort to
achieve a
smooth transition
in
meeting their announced goals and needs. Sales of cage-free eggs represented approximately 22.1%
of our shell egg revenues for
fiscal year 2022. At the end of
our fiscal 2021, our production capacity for cage-free
eggs exceeded our customers’ requirements;
8
however,
as our
customers have
continued to
transition to
meet consumer
demand and
comply with
their public
commitments
and evolving
legal requirements, and
as HPAI
has adversely
impacted cage-free
flocks, we believe
current supply
and demand
for cage-free eggs is more
balanced and expect demand
for cage-free eggs to continue
to increase. We
have invested significant
capital in recent years to acquire and construct cage-free facilities, and we expect our focus for future
expansion will continue to
include cage-free facilities. At
the same time, we understand
the importance of our continued
ability to provide more affordable
conventional eggs in order to provide our customers with a variety of egg
choices and to address hunger in our communities.
We are a member of the Eggland’s
Best, Inc. cooperative (“EB”) and produce, market, distribute and sell
Egg-Land’s
Best®
Land O’
Lakes®
Land O’
Lakes®
produced by hens that are fed a
whole-grain vegetarian diet. Our
Farmhouse Eggs
® brand eggs are produced at our
facilities by
cage-free hens
that are
provided with
a vegetarian
diet. We
market organic,
vegetarian and
omega-3 eggs
under our
4-Grain®
brand, which
consists of
conventional and
cage-free eggs.
We
also produce,
market and
distribute private
label specialty
shell
eggs to several customers.
Egg Products
Egg products are shell eggs broken
and sold in liquid, frozen, or
dried form. We
sell liquid and frozen egg products
primarily to
the institutional,
foodservice and
food manufacturing
sectors in
the U.S.
Our egg
products are
sold through
our wholly
owned
subsidiaries American Egg Products, LLC located in Georgia and
Texas Egg Products, LLC located in
Texas.
During October
2021, we
announced
that our
Board of
Directors approved
a strategic
investment that
will specialize
in high-
value commercial product solutions targeting specific needs in the food
industry. The initial focus will include hard-cooked eggs.
The new entity, located in Neosho, Missouri, will operate as MeadowCreek Foods, LLC (“MeadowCreek”). We have committed
up to $18.5 million in debt and
equity capital to MeadowCreek for
the purchase of property and equipment
and to fund working
capital,
and
we
retained
a
controlling
interest
in
the venture.
We
will serve
as the
preferred
provider
to
supply
specialty and
conventional eggs that MeadowCreek needs to manufacture egg products. MeadowCreek’s
marketing plan is designed to extend
our reach in the foodservice and retail marketplace and bring new opportunities in the restaurant, institutional and industrial food
products arenas. We
anticipate that the MeadowCreek operation will initiate production
late in our fiscal 2023 second quarter.
Summary of Conventional and Specialty Shell Egg and Egg Product
Sales
The
following
table
sets
forth
the
contribution
as
a
percentage
of
revenue
and
volumes
of
dozens
sold
of
conventional
and
specialty shell egg and egg product sales for the following fiscal years:
2022
2021
2020
Revenue
Volume
Revenue
Volume
Revenue
Volume
Conventional Eggs
59.8
%
69.0
%
56.8
%
73.2
%
61.4
%
76.1
%
Specialty Eggs
Egg-Land’s Best®
19.2
%
15.9
%
20.9
%
13.5
%
19.2
%
12.7
%
Other Specialty Eggs
17.3
%
15.1
%
19.1
%
13.3
%
16.7
%
11.2
%
Total Specialty Eggs
36.5
%
31.0
%
40.0
%
26.8
%
35.9
%
23.9
%
Egg Products
3.4
%
2.7
%
2.3
%
Marketing and Distribution
We
sell most of our
shell eggs in the
southwestern, southeastern, mid-western
and mid-Atlantic regions
of the U.S. through
our
extensive distribution network to a diverse group of customers, including
national and regional grocery store chains, club stores,
companies
servicing independent
supermarkets
in the
U.S., foodservice
distributors
and egg
product consumers.
Some of
our
sales are
completed
through
co-pack
agreements
–
a
common
practice
in
the
industry
whereby
production
and
processing
of
certain products are outsourced to another producer.
Although we face intense competition from numerous
other companies, we
believe that we have the largest market share for the sale
of shell eggs in the grocery segment, including large U.S. food retailers.
We are a member of the Eggland’s
Best, Inc. cooperative and produce, market, distribute and sell EB and Land O'Lakes branded
eggs, directly and through our joint
ventures,
Specialty Eggs, LLC and Southwest Specialty
Eggs, LLC, under exclusive license
agreements in
Alabama, Arizona,
Florida, Georgia,
Louisiana, Mississippi
and Texas,
and in
portions of
Arkansas, California,
9
Nevada,
North
Carolina,
Oklahoma
and
South
Carolina.
We
also
have
an
exclusive
license
in
New
York
City
in
addition
to
exclusivity in select New York
metropolitan areas, including areas within New Jersey and Pennsylvania.
The majority of eggs sold are based on the daily
or short-term needs of our customers. Most sales to established
accounts are on
payment terms ranging from
seven to 30
days. Although we
have established long-term relationships
with many of
our customers,
most of them are free to acquire shell eggs from other sources.
The shell eggs we
sell are either delivered to
our customers’ warehouse or retail
stores, by our own
fleet or contracted refrigerated
delivery trucks, or are picked up by our customers at our processing facilities.
Customers
Our top
three customers
accounted for
an aggregate of
45.9%, 48.6%
and 51.1% of
net sales dollars
for fiscal 2022
,
2021, and
2020,
respectively.
Our largest
customer,
Walmart
Inc. (including
Sam's Club),
accounted for
29.5%, 29.8%
and 32.1%
of net
sales dollars for fiscal 2022, 2021 and 2020, respectively.
In fiscal
2022,
approximately 87.5%
of our
revenue related
to sales
to retail
customers, 9.1%
to sales
to foodservice
providers
and 3.4%
to egg products
sales. Retail customers
include primarily
national and
regional grocery
store chains,
club stores, and
companies
servicing
independent
supermarkets
in the
U.S. Foodservice
customers
include
primarily
companies that
sell food
products and related items to restaurants, healthcare and education facilities and
hotels.
Competition
The production, processing,
and distribution of shell
eggs is an intensely
competitive business, which
has traditionally attracted
large numbers of
producers in the United
States. Shell egg competition
is generally based on
price, service and product
quality.
The shell
egg production
industry remains
highly fragmented.
According to
Egg Industry
Magazine
, the
ten largest
producers
owned approximately
53% of industry
table egg layer
hens at year-end
2021 and 2020.
We
believe industry
consolidation may
continue,
and
we
plan
to
capitalize
on
opportunities
as
they
arise.
We
believe
further
concentration
could
result
in
reduced
cyclicality of shell egg prices, but no assurance can be given in that regard.
Seasonality
Retail sales of shell eggs historically have been highest during the fall and winter months and lowest during the summer months.
Prices for shell eggs fluctuate
in response to seasonal demand
factors and a natural
increase in egg production during
the spring
and early summer.
Historically,
shell egg prices tend
to increase with the
start of the school
year and tend
to be highest prior
to
holiday
periods,
particularly
Thanksgiving,
Christmas
and
Easter.
Consequently,
and
all
other
things
being
equal,
we
would
expect to experience
lower selling prices,
sales volumes and net
income (and may
incur net losses) in
our first and
fourth fiscal
quarters ending in August/September and May/June, respectively. Accordingly, we generally expect our need for
working capital
to be highest during those quarters.
Growth Strategy
Our growth strategy is focused on remaining a
low-cost provider of shell eggs located near
our customers, offering our customers
choices
that
meet
their
requirements
for
eggs
and
egg
products
and
continuing
to
grow
our
focus
on
specialty
eggs
and
egg
products.
For
example,
our
recent
investment
in
MeadowCreek,
discussed
above,
is
intended
to
extend
our
reach
in
the
foodservice and retail marketplace and bring
new opportunities in the restaurant,
institutional and industrial food products arenas.
In light
of the growing
customer demand
and increased
legal requirements
for cage-free
eggs, we
intend to
continue to
closely
evaluate the
need to expand
through selective acquisitions,
with a priority
on those that
will facilitate our
ability to expand
our
cage-free shell egg production
capabilities in key locations and
markets. We will continue to closely evaluate
the need to continue
to
expand
and
convert
our
own
facilities
to
increase
production
of
cage-free
eggs
based
on
a
timeline
designed
to
meet
the
anticipated needs of our customers and comply with evolving legal requirements. As the ongoing production of cage-free eggs is
more costly than
the production of
conventional eggs, aligning
our cage-free production
capabilities with changing
demand for
cage-free eggs is important to the success of our business.
10
Trademarks
and License Agreements
We own the trademarks
Farmhouse Eggs®
,
Sunups®
,
Sunny Meadow®
4Grain®
. We produce and
market
Egg-Land's Best
®
and
Land O’ Lakes
® branded eggs under
license agreements with
EB. We
believe these trademarks
and license agreements
are
important to our business.
Government Regulation
Our facilities and
operations are subject
to regulation by
various federal, state,
and local agencies,
including, but not
limited to,
the FDA,
USDA, Environmental
Protection
Agency
("EPA"),
Occupational
Safety and
Health Administration
("OSHA") and
corresponding state agencies or
laws. The applicable regulations relate
to grading, quality control,
labeling, sanitary control and
reuse or
disposal of
waste. Our
shell egg
facilities are
subject to
periodic USDA,
FDA, EPA
and OSHA
inspections. Our
feed
production facilities are
subject to FDA,
EPA
and OSHA regulation
and inspections. We
maintain our own
inspection program
to
monitor
compliance
with
our
own
standards
and
customer
specifications.
It
is
possible
that
we
will
be
required
to
incur
significant
costs
for
compliance
with
such
statutes
and
regulations.
In
the
future,
additional
rules
could
be
proposed
that,
if
adopted, could increase our costs.
Ten
states
have
passed
legislation
or
regulations
mandating
minimum
space
or
cage-free
requirements
for
egg
production
or
mandated the sale of
only cage-free eggs and
egg products in
their states, with implementation
of these laws ranging
from January
2022 to January 2026. These states represent approximately 27% of the U.S. total population according to the 2020 U.S. Census.
In California and
Massachusetts, which collectively represent
14% of the
total U.S. population
according to the
2020 U.S. Census,
cage-free legislation
went into
effect January
1, 2022.
However,
these laws
are subject
to judicial
challenge,
and the
Supreme
Court of the U.S. recently announced that in
October 2022 it will review a case
challenging California’s law that requires the sale
of only cage-free eggs in that state.
These laws have already effected
and, if upheld, will continue to
affect sourcing, production
and pricing of eggs (conventional as well as specialty) as the national
demand for cage-free production could be greater than the
current
supply,
which
would
increase
the
price
of
cage-free
eggs,
unless
more
cage-free
production
capacity
is
constructed.
Likewise, the national supply for
eggs from conventional production could
exceed consumer demand which
would decrease the
price of conventional eggs.
Environmental Regulation
Our operations and facilities are subject to various federal, state, and local environmental, health and safety laws and regulations
governing,
among
other
things,
the
generation,
storage,
handling,
use,
transportation,
disposal,
and
remediation
of
hazardous
materials. Under these laws and regulations, we must obtain permits from governmental authorities, including, but
not limited to,
wastewater discharge
permits. We
have made, and
will continue to make,
capital and other expenditures
relating to compliance
with existing environmental, health and safety laws and regulations and permits. We are not currently aware of any major capital
expenditures
necessary
to
comply
with
such
laws
and
regulations;
however,
as
environmental,
health
and
safety
laws
and
regulations are becoming increasingly
more stringent, including
those relating to animal wastes
and wastewater discharges,
it is
possible that we will have to incur significant costs for compliance with such
laws and regulations in the future.
Human Capital Resources
As of May 28, 2022,
we had 2,985 employees, of whom 2,346 worked in egg
production, processing, and marketing, 197
worked
in
feed
mill operations
and 442, including
our
executive officers,
were
administrative
employees. Approximately
4.7% of
our
personnel
are
part-time, and we
utilize
temporary
employment
agencies
and
independent
contractors
to
augment
our
staffing needs when necessary. For fiscal 2022, the average monthly full-time
equivalent for contingent workers was
1,046. None
of our employees are covered by a collective bargain
ing agreement. We consider
our relations with employees to be good.
Culture and Values
We
are
proud
to
be contributing corporate
citizens
where
we live
and
work and to
help create healthy,
prosperous
communities. Our
colleagues
help
us
continue
to
enhance our community
contributions,
which are driven
by
our longstanding culture that strives to promote an environment that upholds integrity and respect and provides opportunities for
each colleague to
realize full
potential. These commitments are
encapsulated in the
Cal-Maine Foods Code
of Ethics
Officers and Employees and in our
Human Rights Statement
.
11
Health and Safety
Our top priority is the
health and safety of our
employees, who continue to produce
high-quality, affordable
egg choices for our
customers and contribute to
a stable food
supply. Our enterprise safety committee
comprises two corporate safety managers,
eight
area compliance
managers, 55
local site
compliance managers,
feed mill
managers and
general managers.
The committee
that
oversees health
and
safety regularly
reviews
our
written policies
and
changes
to
OSHA
regulation
standards
and
shares
information
as
it
relates
to
outcomes
from
incidents
in
order
to
improve
future
performance.
The
committee’s
goals
include
working to help ensure that our engagements with our consumers, customers, and regulators evidence
our strong commitment to
our workers’ health and safety.
Our commitment to our colleagues’ health includes a strong
commitment to on-site worker safety,
including a focus on accident
prevention and life safety.
Our Safety and Health Program
is designed to promote best
practices that help prevent
and minimize
workplace accidents and illnesses. The scope of our Safety and Health
Program applies to all enterprise colleagues. Additionally,
to
help
protect
the health
and well-being
of
our
colleagues and
people
in our
value
chain,
we
require
that any
contractors
or
vendors
acknowledge
and
agree
to
comply
with
the
guidelines
governed
by
our
Safety
and
Health
Program.
At
each
of
our
locations, our
general managers
are expected
to uphold
and implement
our Employee
Safety and
Health Program
in alignment
with OSHA requirements. We believe that this program, which is
reviewed annually by our senior management team,
contributes
to strong
safety outcomes. As
part of our
Safety and Health
Program, we
conduct multi-lingual training
that covers topics
such
as slip-and-fall
avoidance,
respiratory
protection,
prevention
of
hazardous
communication
of
chemicals,
the
proper
use
of
personal protective
equipment, hearing
conservation, emergency
response, lockout
and tagout of
equipment and forklift
safety,
among others.
We
have also installed dry
hydrogen peroxide biodefense
systems in our
processing facilities to
help protect our
colleagues’ respiratory health.
To help
drive our focus on
colleague safety,
we developed safety committees
at each of our sites
with employee representation from each department.
We
review
the success
of our
safety programs
on a
monthly basis
to monitor
their effectiveness
and
the development
of any
trends that need to be addressed. During fiscal year 2022 our recordable incident rates decreased by 6% compared to fiscal 2021.
Diversity, Equity and Inclusion
Our
culture seeks
to
embrace the
diversity
and
inclusion
of
all
our
team
members.
This
culture is driven
by
our
board
and
executive management team. Our board comprises seven members, four of
whom are independent. Women comprise 29% of our
board and 14% of our board members identify as a racial or ethnic minority.
As of May 28, 2022, our total workforce comprised
29% women and 52%
of colleagues who
identify as racial or
ethnic minorities. Our Policy
against Harassment, Discrimination,
Unlawful
or
Unethical
Conduct
and
Retaliation;
Reporting
Procedure affirms
our
commitment
to
supporting
our
employees
regardless of race, color, religion, sex, national
origin or any other basis protected by applicable law.
Cal-Maine Foods strives
to ensure that
our colleagues are
treated equitably. We are an Equal
Opportunity Employer that prohibits,
by policy and practice,
any violation of applicable
federal, state, or local
law regarding employment.
Discrimination because of
race, color, religion,
sex, pregnancy, age,
national origin, citizenship status, veteran
status, physical or mental disability,
genetic
information, or any other basis protected by applicable law
is prohibited. We value diversity in our workplaces or in
work-related
situations. We maintain
strong protocols to help our colleagues perform
their jobs free from harassment and discrimination. Our
focus
on
equitable
treatment
extends
to
recruitment,
employment
applications,
hiring,
placement,
job
assignments,
career
development, training, remuneration,
benefits, discharge
and other matters
tied to terms and
conditions of employment.
We
are
committed
to
offer
our
colleagues
opportunities
commensurate
with
our
operational
needs,
their
experiences,
goals
and
contributions.
Recruitment, Development and Retention
We
believe
in compensating
our
colleagues
with
fair
and competitive wages, in
addition
to offering
competitive benefits. Approximately
76% of
our employees
are paid
at hourly
rates, with
the majority
paid at
rates above
the
federal minimum wage
requirement. We
offer our full-time
eligible employees a range
of benefits,
including company-paid life
insurance. The Company provides a comprehensive self-insured health plan and pays approximately 85% of the costs of the plan
for
participating
employees
and
their
families
as
of
December
31,
2021. Recent
benchmarking
of
our health
plan
indicates comparable
benefits, at
lower
employee contributions, when compared
to an applicable
Agriculture
and
Food Manufacturing sector grouping, as well as peer group data.
In addition, we offer employees the opportunity to purchase an
extensive range of other group
plan benefits, such as dental, vision,
accident, critical illness, disability
and voluntary life.
After
one
year
of
employment, full-time employees
who
meet
eligibility
requirements may
elect
to participate
in
our
KSOP retirement plan,
which
offers
a
range
of
investment
alternatives
and
includes
many positive features,
such
as
automatic enrollment with scheduled
automatic contribution
increases and loan
provisions. Regardless of
the
12
employees’ elections
to contribute
to
the
KSOP,
the
Company contributes shares
of Company
stock or
cash
equivalent
to 3%
of pre-tax earnings for each pay period that hours are worked.
We provide
extensive
training
and
development related
to
safety,
regulatory
compliance,
and
task
training. We invest
in
developing our future leaders through our Management Intern, Management
Trainee and informal mentoring programs.
Sustainability
We understand that climate, and
the potential consequences of climate change, freshwater availability and preservation of global
biodiversity, in addition to
responsible management of
our flocks, are
vital to
the production of
high-quality eggs and
egg products
and to the success of our
Company. We have engaged in agricultural production for
more than 60
years. Our agricultural practices
continue to evolve as we continue to strive to meet the need for nutritious, affordable foods to feed a growing population even as
we exercise responsible natural resource stewardship. We
plan to publish our most recent sustainability update on or around late
July 2022, which will be available on our website. Information contained
in our website is not a part of this report.
COVID-19 Pandemic
For information
regarding our
response to
the COVID-19
pandemic, and
its impact
on our
business, see
Our Corporate Information
We
maintain
a
website
at
www.calmainefoods.com
where
general
information
about
our
business
and
corporate
governance
matters is
available. The
information contained
in our
website is
not a
part of
this report.
Our Annual
Reports on
Form 10-K,
Quarterly
Reports
on
Form
10-Q,
Current
Reports
on
Form
8-K,
proxy
statements,
and
all
amendments
to
those
reports
are
available, free of charge, through our
website as soon as reasonably practicable
after we file them with the SEC. In addition, the
SEC maintains
a website
at www.sec.gov that contains
reports, proxy
and information statements,
and other information
regarding
issuers
that
file
electronically
with
the
SEC.
Information
concerning
corporate
governance
matters
is
also
available
on
our
website. Cal-Maine Foods, Inc. is a Delaware corporation, incorporated
in 1969.
ITEM 1A.
RISK FACTORS
Our
business
and
results
of
operations
are
subject
to
numerous
risks
and
uncertainties,
many
of
which
are
beyond
our
control. The following is a description of the known factors that may materially affect
our business, financial condition or results
of operations. They
should be considered
carefully,
in addition
to the information
set forth
elsewhere in
this Annual
Report on
Form
10-K,
including
under
Part
II.
Item 7.
Management’s
Discussion
and
Analysis
of
Financial
Condition
and
Results
of
Operations,
in
making
any
investment
decisions
with
respect
to
our
securities. Additional
risks
or
uncertainties
that
are
not
currently known
to us,
or that we
are aware
of but
currently deem
to be
immaterial or
that could
apply to
any company
could
also materially adversely affect our business, financial condition or results
of operations.
INDUSTRY RISK FACTORS
Market prices
of wholesale
shell eggs
are volatile,
and decreases
in these
prices can
adversely impact
our revenues
and
profits.
Our operating results are significantly
affected by wholesale shell egg
market prices, which fluctuate widely and
are outside our
control. As
a result,
our prior
performance
should not
be presumed
to be
an accurate
indication of
future performance.
Under
certain circumstances, small increases
in production, or small
decreases in demand, within
the industry might
have a large adverse
effect on shell egg prices. Low shell egg prices adversely affect
our revenues and profits.
Market prices for
wholesale shell eggs
have been volatile
and cyclical. Shell
egg prices have
risen in the
past during periods
of
high demand such as the initial outbreak of
the COVID-19 pandemic and periods when high protein
diets are popular. Shell egg
prices
have
also
risen
during
periods
of
constrained
supply,
such
as
the
latest
highly
pathogenic
avian
influenza
(“HPAI”)
outbreak
that
was
first
detected
in
domestic
commercial
flocks
in
February
2022.
We
believe,
based
on
published
industry
estimates, that the HPAI outbreak has impacted approximately 30.7 million
laying hens in 2022 through
June. During times when
prices are
high, the
egg industry
has typically
geared up
to produce
more eggs,
primarily by
increasing the
number of
layers,
which historically has ultimately resulted in an oversupply of eggs,
leading to a period of lower prices.
13
As discussed
above under
the heading
“Seasonality” in
Part I.
Item 1.
Business, seasonal
fluctuations impact
shell egg
prices.
Therefore, comparisons of our sales
and operating results between different quarters within
a single fiscal year
are not necessarily
meaningful comparisons.
A decline in consumer demand for shell eggs can negatively impact our
business.
We
believe the
increase in
meals prepared
at home
due to
COVID-19 pandemic,
high-protein diet
trends, industry
advertising
campaigns
and
the
improved nutritional
reputation
of
eggs have
all contributed
at
one
time or
another
to
increased
shell egg
demand. However,
it is possible that the
demand for shell eggs
will decline in the future.
Adverse publicity relating
to health or
safety
concerns
and
changes
in
the
perception
of
the
nutritional
value
of
shell
eggs,
changes
in
consumer
views
regarding
consumption of
animal-based products,
as well
as movement
away from
high protein
diets, could
adversely affect
demand for
shell eggs, which would have a material adverse effect on our
future results of operations and financial condition.
Feed costs are volatile and increases in these costs can
adversely impact our results of operations.
Feed costs are the largest element of our shell
egg (farm) production cost, ranging from 55%
to 62% of total farm production cost
in the prior five fiscal
years. Although feed ingredients, primarily corn
and soybean meal, are
available from a number of
sources,
we do
not have
control over
the prices
of the
ingredients we
purchase, which
are affected
by weather,
various global
and U.S.
supply and demand
factors, transportation
and storage costs,
speculators, and
agricultural, energy
and trade policies
in the U.S.
and internationally and
most recently the Russia-Ukraine
war. While we
do not import
corn or soy directly
from the region, the
Russia-Ukraine
war has
had
a negative
impact on
the worldwide
supply of
grain, including
corn, putting
upward pressure
on
prices.
Increases in feed costs
unaccompanied by increases
in the selling price of
eggs can have a material
adverse effect on the
results of our
operations and cash flow.
Alternatively,
low feed costs can
encourage industry overproduction,
possibly resulting
in lower egg prices and lower revenue.
Shell
eggs
and
shell
egg
products
are
susceptible
to
microbial
contamination,
and
we
may
be
required
to,
or we
may
voluntarily, recall
contaminated products.
Shell eggs
and shell
egg products
are vulnerable
to contamination
by pathogens
such as
Salmonella. The
Company maintains
policies and procedures designed to comply with the complex rules and regulations governing egg production, such as The Final
Egg Rule issued
by the
FDA "Prevention
of Salmonella Enteritidis
in Shell
Eggs During Production,
Storage, and
Transportation,”
and the FDA’s Food Safety Modernization Act.
Shipment of contaminated
products, even if
inadvertent, could result
in a
violation
of law and
lead to increased
risk of exposure
to product liability
claims, product recalls
and scrutiny by
federal and state
regulatory
agencies. In
addition,
products
purchased
from
other
producers
could
contain
contaminants
that
might
be
inadvertently
redistributed by us. As such, we might decide or be required
to recall a product if we, our customers
or regulators believe it poses
a potential
health risk.
Any product
recall could
result in
a loss
of consumer
confidence in
our products,
adversely affect
our
reputation
with existing
and potential
customers and
have a
material adverse
effect
on our
business, results
of operations
and
financial condition.
Agricultural risks, including outbreaks of avian
disease, could harm our business.
Our shell egg
production activities are
subject to a variety
of agricultural risks.
Unusual or extreme
weather conditions, disease
and pests can materially and adversely affect the quality and quantity of shell eggs
we produce and distribute. Outbreaks of avian
influenza among poultry occur periodically
worldwide and have occurred sporadically
in the U.S. Most recently,
an outbreak of
HPAI,
which
was
first
detected
in
February
2022,
impacted
the
industry.
Prior
to
2022,
there
was
another
significant
HPAI
outbreak in the U.S. impacting poultry during 2015. There have been no positive tests for HPAI
at any Cal-Maine Foods’ owned
or contracted facility as
of July 19,
2022. The Company maintains
controls and procedures designed
to reduce the
risk of exposing
our flocks to harmful
diseases; however, despite these efforts, outbreaks of avian
disease can and do
still occur and may
adversely
impact the
health of
our flocks.
An outbreak
of avian
disease could
have a
material adverse
impact on
our financial
results by
increasing
government
restrictions
on
the
sale
and
distribution
of
our
products
and
requiring
us
to
euthanize
the
affected
layers. Negative publicity from an outbreak within our
industry can negatively impact customer perception, even if
the outbreak
does
not
directly
impact
our flocks.
If
a
substantial portion
of
our
layers
or production
facilities are
affected
by
any
of these
factors in any given quarter or year, our business, financial condition, and results of operations could be materially and adversely
affected.
BUSINESS AND OPERATIONAL
RISK FACTORS
14
The COVID-19 pandemic has had an adverse impact on our business and operations
Since early
2020, the
coronavirus ("COVID-19")
outbreak, characterized
as a
pandemic by
the World
Health Organization
on
March 11, 2020,
has caused significant
disruptions in international
and U.S. economies
and markets. The
effects of COVID-19
have had,
and may
continue to
have (if
a significant
resurgence occurs
including due
to variants
or related
strains of
the virus
become prevalent)
a negative impact on our business. Negative impacts have included, and
may include in the future, disruptions
in
the
supply
chain
resulting
in
increased
costs
and
decreased
availability
of
packaging
supplies,
increased
labor
costs
and
increased medical costs.
Our acquisition growth strategy subjects us to various risks.
As discussed in
, we plan
to pursue a
growth strategy that includes
selective acquisitions
of other
companies engaged
in the
production and
sale of
shell eggs,
with a
priority on
those that
will facilitate
our ability
to
expand our cage-free shell egg production capabilities in key locations and markets. We may over-estimate or under-estimate the
demand
for
cage-free
eggs,
which
could
cause
our
acquisition
strategy
to
be
less-than-optimal
for
our
future
growth
and
profitability.
The
number
of existing
companies
with
cage-free
capacity
that
we
may
be
able
to
purchase
is
limited,
as
most
production of shell
eggs by other companies
in our markets currently
does not meet customer
demands or legal requirements
to
be designated
as cage-free.
Conversely,
if we
acquire cage-free
production capacity,
which is
more expensive
to purchase
and
operate, and customer
demands or legal
requirements for cage-free
eggs were to change,
the resulting lack
of demand for
cage-
free eggs may result in higher costs and lower profitability.
Acquisitions require capital resources and can divert management’s attention from our existing business. Acquisitions also entail
an inherent risk that we
could become subject to contingent or
other liabilities, including liabilities arising from
events or conduct
prior to
our acquisition
of a
business that
were unknown
to us
at the
time of
acquisition. We
could incur
significantly greater
expenditures in integrating an acquired business than we anticipated at the
time of its purchase.
We cannot assure
you that we:
●
will identify suitable acquisition candidates;
●
can consummate acquisitions on acceptable terms;
●
can successfully integrate an acquired business into our operations;
or
●
can successfully manage the operations of an acquired business.
No
assurance
can
be
given
that
companies
we
acquire
in
the
future
will
contribute
positively
to
our
results
of
operations
or
financial condition.
In addition,
federal antitrust
laws require
regulatory approval
of acquisitions
that exceed
certain threshold
levels of significance, and we cannot guarantee that such approvals would
be obtained.
The consideration
we pay in
connection with any
acquisition affects
our financial results.
If we pay
cash, we could
be required
to
use
a
portion
of
our
available
cash
or
credit
facility
to
consummate
the
acquisition.
To
the
extent
we
issue
shares
of
our
Common Stock, existing stockholders may be diluted. In addition, acquisitions
may result in additional debt.
Our largest customers have accounted for a significant portion of our net sales volume. Accordingly, our business may be
adversely affected by the loss of, or reduced purchases by,
one or more of our large customers.
Our top
three customers
accounted for
an aggregate of
45.9%, 48.6% and
51.1% of net
sales dollars for
fiscal 2022,
2021, and
2020, respectively.
Our largest
customer,
Walmart
Inc. (including
Sam's Club),
accounted for
29.5%, 29.8%
and 32.1%
of net
sales dollars
for fiscal
2022, 2021,
and 2020,
respectively. Although
we have
established long-term
relationships with
most of
our customers
who continue
to purchase
from us
based on
our ability
to service
their needs,
they are
generally free
to acquire
shell eggs
from other
sources. If, for
any reason, one
or more
of our
large customers
were to
purchase significantly
less of
our
shell eggs
in the
future or
terminate their
purchases from
us, and
we were
not able
to sell
our shell
eggs to
new customers
at
comparable levels, it would have a material adverse effect
on our business, financial condition, and results of operations.
Our business is highly competitive.
The
production
and
sale
of
fresh
shell
eggs,
which
accounted
for
virtually
all
of
our
net
sales
in
recent
years,
is
intensely
competitive. We
compete with
a large
number of
competitors that
may prove
to be
more successful
than we
are in
producing,
marketing and
selling shell
eggs. We
cannot provide
assurance that
we will
be able
to compete
successfully with
any or
all of
these companies.
Increased competition could result in price reductions, greater
cyclicality, reduced margins
and loss of market
share, which would negatively affect our business, results of operations,
and financial condition.
15
We
are
dependent
on
our
management
team,
and
the
loss
of
any
key
member
of
this
team
may
adversely
affect
the
implementation of our business plan in a timely manner.
Our success
depends largely
upon the
continued service
of our
senior management
team. The
loss or interruption
of service
of
one or more
of our key
executive officers
could adversely affect
our ability to
manage our operations
effectively and/or
pursue
our growth strategy.
We
have not entered
into any employment
or non-compete
agreements with any
of our executive
officers.
Competition could cause us to lose talented employees, and unplanned turnover could deplete institutional knowledge
and result
in increased costs due to increased competition for employees.
Our
business
is
dependent
on
our
information
technology
systems
and
software,
and
failure
to
protect
against
or
effectively respond to
cyber-attacks, security
breaches, or other
incidents involving those systems,
could adversely affect
day-to-day operations and decision making processes and
have an adverse effect on our performance and reputation.
The efficient operation of our business depends
on our information technology systems, which we rely
on to effectively manage
our
business
data,
communications,
logistics,
accounting,
regulatory
and
other
business
processes.
If
we
do
not
allocate
and
effectively manage the resources necessary to build and sustain an appropriate technology environment, our business, reputation,
or financial results could be negatively impacted.
In addition, our information technology systems may be vulnerable
to damage
or
interruption
from
circumstances
beyond
our
control,
including
systems
failures,
natural
disasters,
terrorist
attacks,
viruses, ransomware, security breaches
or cyber incidents. Cyber-attacks
are becoming more sophisticated
and are increasing in
the number of attempts and frequency by groups and individuals with a wide range
of motives.
A security breach
of
sensitive
information
could
result
in
damage
to
our
reputation
and
our
relations
with
our
customers
or
employees.
Any such damage or interruption could have a material adverse effect on
our business.
Labor shortages or increases in labor costs could adversely
impact our business and results of operations.
Labor is a primary component of our farm production costs. Our success is dependent
upon recruiting, motivating, and retaining
staff to operate our farms. Approximately 76% of our employees are paid at hourly rates, often in entry-level positions. While all
our employees are paid at
rates above the federal minimum wage
requirements, any significant increase
in local, state or federal
minimum wage requirements could
increase our labor
costs. In addition,
any regulatory changes
requiring us to
provide additional
employee
benefits
or
mandating
increases
in
other
employee-related
costs,
such
as
unemployment
insurance
or
workers
compensation, would increase our
costs. A shortage
in the labor
pool, which may be
caused by competition from
other employers,
the remote
locations of
many of
our farms,
decreased
labor participation
rates or
changes in
government-provided
support or
immigration laws, particularly in times of lower unemployment,
could adversely affect our business and results of operations.
A
shortage of labor
available to
us could
cause our
farms to
operate with
reduced staff, which
could negatively impact
our production
capacity and efficiencies.
In fiscal 2021 and 2022, our labor costs increased primarily due to the pandemic
and its effects, which
caused us
to increase
wages in
response to
labor shortages,
and these
trends may
continue.
Accordingly,
any significant
labor
shortages or increases in our labor costs could have a material adverse effect
on our results of operations.
We
are controlled
by the
family of
our late
founder,
Fred R.
Adams, Jr.,
and Adolphus
B. Baker,
our Chief
Executive
Officer and Chairman of our Board of Directors controls
the vote of 100% of our outstanding Class A Common Stock.
Fred R. Adams,
Jr., our
Founder and Chairman Emeritus
died on March 29,
2020. Mr.
Adams’ son-in-law,
Adolphus B. Baker,
our Chief Executive Officer
and Chairman of our board
of directors, Mr.
Baker’s spouse and her
three sisters (Mr.
Adams’ four
daughters)
beneficially
own,
directly
or
indirectly
through related
entities,
100%
of our
outstanding
Class
A
Common
Stock
(which has 10 votes per
share), controlling approximately 52.1%
of our total voting power.
Additionally,
such persons and Jean
Reed Adams (“Mrs.
Adams”), the
widow of
Mr.
Adams,
also have
additional voting
power due to
beneficial ownership
of our
Common Stock
(which has one
vote per share),
directly or indirectly
through related entities,
resulting in family
voting control
of approximately
57.5% of
our total
voting power.
Mr.
Baker controls
the vote
of 100%
of our
outstanding Class
A Common
Stock.
We
understand that the
Adams and Baker
families intend to
retain ownership of
a sufficient amount
of our Common
Stock and
our Class A
Common Stock
to assure continued
ownership of
more than 50%
of the voting
power of our
outstanding shares
of
capital stock.
As a
result of
this ownership,
the Adams
and Baker
families have
the ability
to exert
substantial influence
over
matters requiring action by
our stockholders, including amendments
to our certificate of incorporation
and by-laws, the election
and
removal
of
directors,
and
any
merger,
consolidation,
or
sale
of
all
or
substantially
all
of
our
assets,
or
other
corporate
transactions. Delaware
law provides
that the
holders of
a majority
of the
voting power
of shares
entitled to
vote must
approve
certain fundamental
corporate transactions such
as a merger,
consolidation and
sale of all
or substantially
all of a
corporation’s
assets; accordingly,
such a transaction
involving us and
requiring stockholder approval
cannot be effected
without the approval
of
the
Adams
and
Baker
families.
Such
ownership
will
make
an
unsolicited
acquisition
of
our
Company
more
difficult
and
16
discourage certain types
of transactions involving
a change
of control of
our Company, including transactions
in which the
holders
of our Common Stock might otherwise receive a
premium for their shares over then current
market prices. The Adams and Baker
families’ controlling ownership of our capital stock may adversely affect
the market price of our Common Stock.
The
price
of
our
Common
Stock
may
be
affected
by
the
availability
of
shares
for
sale
in
the
market,
and
you
may
experience significant dilution as a result of future issuances
of our securities, which could materially and
adversely affect
the market price of our Common Stock.
The sale or
availability for
sale of substantial
amounts of
our Common
Stock could adversely
impact its price.
As described
in
Adams and the Daughters’ Trust (of
which the daughters of our
late founder are beneficiaries)
sold 6.9 million shares of
Common
Stock in a secondary public offering pursuant to a
previously disclosed Agreement Regarding Common Stock (the “Agreement”)
filed as an exhibit
to this report.
After the sale,
approximately 5.0 million shares
(the “Subject Shares”) remain subject
to potential
sale under the Agreement. The Agreement generally provides that if a holder
of Subject Shares intends to sell any of the Subject
Shares, such party must give
the Company a right of first
refusal to purchase all or
any of such shares. The
price payable by the
Company to
purchase shares
pursuant to
the exercise
of the
right of
first refusal
will reflect
a 6%
discount to
the then-current
market price
based on
the 20
business-day
volume-weighted average
price. If
the Company
does not
exercise its
right of
first
refusal and purchase
the shares offered,
such party will, subject
to the approval
of a special committee
of independent directors
of the
Board
of Directors,
be permitted
to sell
the
shares not
purchased
by the
Company pursuant
to a
Company
registration
statement, Rule 144
under the Securities
Act of 1933,
or another manner
of sale agreed
to by the
Company.
Although pursuant
to the Agreement the Company will have a right of
first refusal to purchase all or any of those
shares, the Company may elect not
to
exercise
its rights
of
first refusal,
and
if
so
such shares
would
be eligible
for
sale pursuant
to
the registration
rights in
the
Agreement or pursuant to Rule
144 under the Securities
Act of 1933. Sales,
or the availability for
sale, of a large
number of shares
of our Common Stock could result in a decline in the market price of our Common
Stock.
In addition,
our articles
of incorporation
authorize us
to issue
120,000,000 shares
of our Common
Stock. As
of May
28, 2022,
there were
44,139,524 shares
of our
Common Stock
outstanding. Accordingly,
a substantial
number of
shares of
our Common
Stock
are
outstanding
and
are,
or
could
become,
available
for
sale
in
the
market.
In
addition,
we
may
be
obligated
to
issue
additional shares of our Common Stock in connection with employee benefit
plans (including equity incentive plans).
In the
future, we
may decide
to raise
capital through
offerings of
our Common
Stock, additional
securities convertible
into or
exchangeable for
Common Stock, or
rights to acquire
these securities or
our Common Stock.
The issuance of
additional shares
of our Common Stock or additional securities convertible into or exchangeable for our Common Stock could result in dilution of
existing stockholders’ equity interests in
us. Issuances of substantial amounts of
our Common Stock, or the perception
that such
issuances could
occur,
may adversely
affect prevailing
market prices
for our
Common Stock,
and we
cannot predict
the effect
this dilution may have on the price of our Common Stock.
LEGAL AND REGULATORY
RISK FACTORS
Pressure from animal rights groups regarding the treatment of animals may subject us to additional costs to conform our
practices
to
comply
with
developing
standards
or
subject
us
to
marketing
costs
to
defend
challenges
to
our
current
practices and protect
our image with
our customers. In
particular,
changes in customer
preferences and
new legislation
have accelerated an increase in demand for cage-free eggs, which increases uncertainty
in our business and increases our
costs.
We and many of our customers face pressure from animal rights groups, such
as People for the Ethical Treatment of Animals and
the Humane
Society of
the United States,
to require
companies that supply
food products
to operate
their business in
a manner
that
treats
animals
in
conformity
with
certain
standards
developed
or
approved
by
these
groups.
In
general,
we
may
incur
additional costs to conform our practices to address
these standards or to defend our existing
practices and protect our image with
our customers.
The standards promoted
by these groups
change over time,
but typically
require minimum
cage space
for hens,
among other requirements, and some
of these groups have led successful
legislative efforts to ban
any form of caged housing
in
various
states. As
discussed
in Part
I. Item
1. Business
-
Government
Regulation,
several states
have
passed minimum
space
and/or cage-free
requirements for
hens, and
other states
are considering
such requirements.
In addition,
in recent
years, many
large restaurant chains, foodservice companies and grocery
chains, including our largest customers,
announced goals to transition
to an
exclusively cage-free
egg supply
chain by
specified future
dates, in
some cases
subject to
available supply,
affordability
and consumer demand.
While we anticipate that
our retail and foodservice
customers will continue to
transition to selling cage-
free eggs given
public commitments, there
is no
assurance that this
transition will take
place or take
place according to
the timeline
of current cage-free commitments. For example, customers may accelerate their transition to stocking cage-free eggs, which
may
challenge our
ability to
meet the
cage-free
volume needs
of those
customers and
result in
a loss
of shell
egg
sales. Similarly,
customers who
commit to
stock greater
proportional quantities
of cage-free
eggs are
under no
obligation to
continue to
do so,
which may
result in an
oversupply of
cage-free eggs and
result in lower
specialty egg
prices. In
addition,
legislation passed
by
17
states requiring
cage-free
sale of
eggs is
facing and
may continue
to face
legal challenges
and could
be stayed
or overturned.
These or other judicial
outcomes could also
lead to an
oversupply of cage-free eggs and
result in lower
specialty egg prices, which
could reduce the return on our capital investment in cage-free production.
Changing our infrastructure and operating procedures to conform to consumer preferences, customer demands and
new laws has
resulted and
will continue
to result
in additional
costs, including
capital and
operating cost
increases. The
USDA reported
that
the estimated cage-free
flock is 103.6 million hens
as of July 1,
2022, which is
approximately 34.8% of
the total U.S. table
egg
layer hen population. These numbers reflect recent cage-free layer hen losses due to the HPAI outbreak. According to the USDA
Agricultural
Marketing
Service, approximately
221 million
hens,
or about
74.0% of
the U.S.
non-organic
laying flock
would
have
to
be
in
cage-free
production
by
2026
to
meet
projected
demand
from
the
retailers,
foodservice
providers
and
food
manufacturers that have made promises to transition to cage-free eggs.
In
response
to
our
customers'
announced
goals
and
increased
legal
requirements
for
cage-free
eggs,
we
increased
capital
expenditures
to
increase
our
cage-free
production
capacity.
We
are
also
enhancing
our
focus
on
cage-free
capacity
when
considering
acquisition opportunities.
Our customers
typically do
not commit
to long-term
purchases of
specific quantities
or
type of eggs
with us, and
as a result,
we cannot predict
with any certainty
which types of
eggs they will
require us to
supply in
future
periods.
The ongoing
production
of
cage-free
eggs is
more
costly
than
the production
of conventional
eggs,
and
these
higher
production
costs contribute
to the
higher prices
of cage-free
eggs compared
with conventional
eggs.
Many
consumers
prefer to
buy less
expensive conventional
shell eggs.
These consumer
preferences may
in turn
influence our
customers’ future
needs for cage-free
eggs. Due
to these
uncertainties, we may
over-estimate future demand
for cage-free
eggs, which could
increase
our costs unnecessarily,
or we may under-estimate
future demand for cage-free
eggs, which could harm us competitively.
If our
competitors obtain non-cancelable long-term contracts to
provide cage-free eggs to our
existing or potential customers, then
there
may be decreased
demand for our
cage-free eggs due
to these lost
potential sales. If
we and our
competitors increase
cage-free
egg
production
and
there
is
no
commensurate
increase
in
demand
for
cage-free
eggs,
this
overproduction
could
lead
to
an
oversupply
of
cage-free
eggs,
reducing
the
sales
price
for
specialty
eggs
and
our
return
on
capital
investments
in
cage-free
production.
Failure
to
comply
with
applicable
governmental
regulations,
including
environmental
regulations,
could
harm
our
operating results,
financial condition,
and reputation.
Further,
we may
incur significant
costs to
comply with
any such
regulations.
We are subject to federal, state and local
regulations relating to grading, quality
control, labeling, sanitary control, waste
disposal,
and other
areas of
our business.
As a
fully-integrated
shell egg
producer,
our shell
egg facilities
are subject
to regulation
and
inspection by the USDA, OSHA, EPA
and FDA, as well as state and local health and agricultural agencies, among others. All of
our shell egg production and
feed mill facilities are subject
to FDA, EPA and OSHA regulation and inspections. In addition, rules
are often proposed that, if adopted as proposed, could increase our costs.
Our operations and facilities are subject to various federal, state and local environmental, health, and safety laws and regulations
governing,
among
other
things,
the
generation,
storage,
handling,
use,
transportation,
disposal,
and
remediation
of
hazardous
materials. Under these laws and
regulations, we are required to obtain permits
from governmental authorities, including, but
not
limited to wastewater discharge permits and manure
and litter land applications.
If we
fail to
comply with
applicable laws
or regulations,
or fail
to obtain
necessary permits,
we could
be subject
to significant
fines and penalties or other sanctions, our reputation could be harmed, and our operating results and financial condition could be
materially
adversely
affected.
In
addition,
because
these
laws and
regulations
are
becoming
increasingly
more
stringent,
it is
possible that we will be required to incur significant costs for compliance
with such laws and regulations in the future.
Climate change and legal or regulatory responses
may have an adverse impact on our business and results of
operations.
Extreme
weather
events,
such
as derechos,
wildfires,
drought,
tornadoes,
hurricanes,
storms,
floods
or
other
natural
disasters
could materially and adversely affect our operating
results and financial condition. In fact, derechos, fires, floods,
tornadoes and
hurricanes have affected our facilities or the facilities of other egg producers in the past. Increased global temperatures
and more
frequent occurrences
of extreme
weather events,
which may
be exacerbated
by climate
change, may
cause crop
and livestock
areas to
become unsuitable,
including due
to water
scarcity or
high or
unpredictable
temperatures,
which may
result in
much
greater stress on food systems and more pronounced food
insecurity globally. Lower
global crop production, including corn and
soy,
which are
the primary
feed ingredients
that support
the health
of our
animals, may
result in
significantly higher
prices for
these commodity inputs, impact our ability
to source the commodities we
use to feed our flocks,
and negatively impact our ability
to maintain
or grow
our operations.
Climate change
may increasingly
expose workers
and animals
to high
heat and
humidity
stressors that adversely
impact poultry
production. Increased
greenhouse gas
emissions may
also negatively
impact air quality,
soil quality
and water
quality,
which may
hamper our
ability to
support our
operations, particularly
in higher
water-
and soil-
stressed regions.
18
Increasing
frequency of
severe weather
events, whether
tied to
climate change
or any
other cause,
may negatively
impact our
ability to raise
poultry and
produce eggs profitably
or to
operate our transportation
and logistics
supply chains. Regulatory
controls
and
market
pricing may
continue
to drive
the costs
of fossil
-based
fuels higher,
which
could negatively
impact
our ability
to
source commodities
necessary to
operate our
farms or
plants and
our current
fleet of
vehicles. These
changes may
cause us
to
change, significantly, our day-to-day
business operations and our strategy. Climate change and extreme weather events may also
impact demand for our products
given evolution of consumer food preferences.
Even if we take
measures to position our business
in anticipation
of such
changes, future
compliance
with legal
or regulatory
requirements may
require significant
management
time, oversight and enterprise expense. We
may also incur significant expense tied to regulatory fines if laws and regulations are
interpreted and applied
in a manner that
is inconsistent with our
business practices. We
can make no
assurances that our efforts
to prepare
for these
adverse events
will be
in line
with future
market and
regulatory expectations
and our
access to
capital to
support our business may also be adversely impacted.
Current and future litigation could expose us to significant
liabilities and adversely affect our business reputation.
We and certain of our subsidiaries are involved in various legal proceedings. Litigation
is inherently unpredictable, and although
we
believe
we
have
meaningful
defenses
in
these
matters,
we
may
incur
liabilities
due
to
adverse
judgments
or
enter
into
settlements of claims that
could have a material
adverse effect on our
results of operations, cash flow
and financial condition.
For
a discussion of our ongoing
legal proceedings see Part
I. Item 3. Legal
Proceedings below. Such lawsuits are expensive to defend,
divert management’s attention, and may result in significant adverse
judgments or settlements. Legal proceedings may expose us
to negative publicity, which could adversely affect
our business reputation and customer preference for our products and brands.
FINANCIAL AND ECONOMIC RISK FACTORS
Weak or unstable economic conditions,
including higher inflation, could negatively impact our business.
Weak or unstable
economic conditions, including higher inflation, may adversely affect
our business by:
●
Limiting our access to capital markets or increasing the cost of capital
we may need to grow our business;
●
Changing consumer spending and habits and demand for eggs, particularly
higher-priced specialty eggs;
●
Restricting the supply of energy sources or increasing our cost to procure
energy; or
●
Reducing the availability of feed
ingredients, packaging material, and other raw
materials, or increasing the cost
of these
items.
Deterioration of economic conditions could also negatively
impact:
●
The financial condition of our suppliers, which may make
it more difficult for them to supply raw materials;
●
The financial condition of our customers, which may decrease demand
for eggs or increase our bad debt expense; or
●
The financial condition of our insurers, which could increase our cost to obtain insurance, and/or make it difficult for or
insurers to meet their obligations in the event we experience a loss due to an insured
peril.
According
to
the
U.S.
Bureau
of
Labor
Statistics,
from
May
2021
to
May
2022,
the
Consumer
Price Index for
All
Urban
Consumers increased 8.6 percent, the largest 12-month
increase since the period ending December 1981. Inflationary costs have
increased our input costs, and if
we are unable to pass these costs through
to the customer it could have an adverse
effect on our
business.
The
loss
of
any
registered
trademark
or
other
intellectual
property
could
enable
other
companies
to
compete
more
effectively with us.
We
utilize intellectual
property in
our business. For
example, we
own the
trademarks
Farmhouse Eggs®
,
4Grain®, Sunups®
,
and
Sunny Meadow®
. We
produce and market
Egg-Land’s
Best®
Land O’ Lakes
® under license
agreements with EB. We
have invested a significant amount of
money in establishing and promoting
our trademarked brands. The loss or
expiration of any
intellectual property could
enable our competitors
to compete more
effectively with us
by allowing them
to make and
sell products
substantially
similar
to
those
we
offer. This
could
negatively
impact
our
ability
to
produce
and
sell
those
products,
thereby
adversely affecting our operations.
Impairment in the carrying value
of goodwill or other assets
could negatively affect our results of
operations or net worth.
Goodwill
represents
the
excess
of
the
cost
of
business
acquisitions
over
the
fair
value
of
the
identifiable
net
assets
acquired. Goodwill
is
reviewed
at
least
annually
for
impairment
by
assessing
qualitative
factors
to
determine
whether
the
19
existence of events or circumstances
leads to a determination that
it is more likely than not
that the fair value of
a reporting unit
is less than
its carrying
amount. As of
May 28, 2022,
we had $44.0
million of
goodwill. While we
believe the
current carrying
value of this goodwill is not impaired, future goodwill impairment charges could adversely affect our results of operations in any
particular period and our net worth.
Events
beyond
our
control
such
as
pandemics,
extreme
weather
and
natural
disasters
could
negatively
impact
our
business.
Pandemics such as COVID-19, or
similar disease outbreaks in the future,
may depress demand for shell eggs
due to quarantines
or restrictions on
public interactions that
would limit the
ability of consumers
to purchase shell
eggs. Pandemics, or
similar disease
outbreaks in the future, may disrupt our supply chain and
operations at our facilities. If a significant percentage of
our workforce,
or the workforce of our suppliers or transportation providers, is unable to work because of illness or government restrictions, our
operations
would be
negatively impacted,
potentially materially.
Pandemics or
disease outbreaks
may also
impact hens
or the
food supply.
Fire,
bioterrorism,
pandemics,
extreme
weather
or natural
disasters, including
droughts,
floods,
excessive
cold
or
heat, water
rights restrictions, hurricanes or other storms, could impair the health or growth of our flocks, decrease production or availability
of feed ingredients, or interfere
with our operations due to
power outages, fuel shortages, discharges from
overtopped or breached
wastewater treatment lagoons, damage to our production and processing facilities, labor shortages or disruption of transportation
channels, among other things. Any of these factors could have a material adverse
effect on our financial results.
ITEM 1B.
UNRESOLVED
STAFF COMMENTS
None.
ITEM 2.
PROPERTIES
The table
below provides
summary
information
about the
primary
operational facilities
we use
in our
business as
of May
28,
2022.
Type
Quantity
Owned
Leased
Production Capacity
Location
Breeding Facilities
3
3
—
House up to 255,000 hens
GA, MS
Distribution Centers
4
4
—
NA
FL, GA, NC, TX
Feed Mills
25
24
1
Production capacity of 859 tons
of feed per hour
AL, AR, FL, GA, KS, KY,
LA,
MS, OH, OK, SC, TN, TX, UT
Hatcheries
2
1
1
Hatch up to 407,600 chicks per
week
FL, MS
Processing and
Packaging
43
42
1
Approximately 596,700 dozen
shell eggs per hour
AL, AR, FL, GA, KS, KY,
LA,
MS, OH, OK, SC, TX, UT
Pullet Facilities
28
27
1
Grow 27.2 million pullets
annually
AR, FL, GA, KS, KY,
MS, OH,
SC, TX, UT
Shell Egg Production
42
42
—
House up to 48.8 million hens
AL, AR, FL, GA, KS, KY,
LA,
MS, OH, OK, SC, TX, UT
Egg Products Processing
Facilities
2
2
—
Production capacity of 72.8
million lbs. per year
GA, TX
(a)
Does not include idled facilities.
Our affiliate, MeadowCreek Foods, LLC (“MeadowCreek”) owns our new egg products facility that is
currently being retrofitted
and upgraded for
future production. The
facility is expected
to be operational
late in our
fiscal 2023 second
quarter.
Once fully
operational, MeadowCreek
will have
the capacity
to produce
approximately
500 thousand
pounds of
weekly hard-cooked
egg
products.
We
also
have
ongoing
construction
projects
to
further
expand
the
Company’s
cage-free
egg
production
capabilities.
These
projects include expanding our cage-free egg production at our Okeechobee, Florida, production facility.
The project is designed
to include
the construction
of two
cage-free
layer houses
and one
cage-free pullet
house with
capacity for
approximately 400
thousand cage-free hens and 210 thousand pullets, respectively.
Construction has commenced, with the first layer house planned
to be finished
by October 1,
2022, with the
second layer house
and project completion
expected by February
1, 2023. In
Delta,
20
Utah, we
are constructing
four new
cage-free layer
houses and
two pullet
houses conversions
with capacity
for approximately
810 thousand
cage-free layer
hens which
is expected
to be
completed by
fall of
2023. At
our Guthrie,
Kentucky farm,
we are
converting nine
existing houses
to cage-free
layer houses
and two
pullet houses
with capacity
for approximately
953 thousand
cage-free hens which is expected to be completed by spring of 2025.
Subsequent
to
the
end
of
fourth
quarter
2022,
the
Company’s
Board
of
Directors
approved
a
capital
project
to
expand
the
Company’s
cage-free production
capabilities. The
proposed project
at Chase,
Kansas will
convert
existing conventional
layer
capacity to cage-free capacity for
approximately 1.5 million cage-free hens
and include remodels of
all remaining pullet facilities.
Work is expected
to commence immediately with project completion expected by year-end
2025.
As of
May
28,
2022,
we
owned
approximately
28.0 thousand
acres
of land.
There
are no
material
mortgages
or liens
on our
properties.
ITEM 3.
LEGAL PROCEEDINGS
Refer to the description of certain legal proceedings pending against us under Part II.
Item 8. Notes to the Consolidated Financial
Statements,
, which discussion is incorporated herein by reference.
ITEM 4.
MINE SAFETY DISCLOSURES
Not applicable.
PART
II.
ITEM
5.
MARKET
FOR
REGISTRANT’S
COMMON
EQUITY,
RELATED
STOCKHOLDER
MATTERS
AND
ISSUER PURCHASES OF EQUITY SECURITIES
We have two classes of
capital stock, Common Stock and Class A Common Stock. Our Common Stock trades on the NASDAQ
Global Select Market under the symbol “CALM”. There is no publ
ic trading market for the Class A Common Stock.
All outstanding
Class A
shares are
owned by
a limited
liability company
of which
Adolphus
Baker,
our Chairman
and Chief
Executive Officer,
is the
sole managing
member and
will be
voted at
the direction
of Mr.
Baker.
At July 12,
2022, there
were
approximately 324 record holders of our Common Stock and
approximately 28,419 beneficial owners whose shares were held by
nominees or broker dealers. For
additional information about our capital
structure, see
to the Consolidated Financial Statements.
Dividends
Cal-Maine has a
variable dividend policy
adopted by its
Board of Directors.
Pursuant to the
policy,
Cal-Maine pays
a dividend
to shareholders of
its Common Stock and
Class A Common Stock
on a quarterly basis
for each quarter
for which the Company
reports net
income attributable
to Cal-Maine
Foods, Inc.
computed in
accordance with
GAAP in
an amount
equal to
one-third
(1/3) of
such quarterly
income. Dividends
are paid
to shareholders
of record
as of
the 60th
day following
the last
day of
such
quarter, except for
the fourth fiscal quarter.
For the fourth quarter,
the Company will pay dividends
to shareholders of record on
the 65th day after the
quarter end. Dividends are payable
on the 15th day following
the record date. Following a
quarter for which
the
Company
does
not
report
net
income
attributable
to
Cal-Maine
Foods,
Inc.,
the
Company
will
not
pay
a
dividend
for
a
subsequent profitable quarter until the Company is profitable on a
cumulative basis computed from the date of the
last quarter for
which
a
dividend
was
paid. Under
the
Company's
Credit
Facility,
dividends
are
restricted
to
the
amount
permitted
under
the
Company’s
current dividend policy,
and may not
be paid if
a default exists
or will arise
after giving effect
to the dividend
or if
the sum of
cash and cash
equivalents of
the Company and
its subsidiaries plus
availability under
the Credit Facility
equals less
than $50 million.
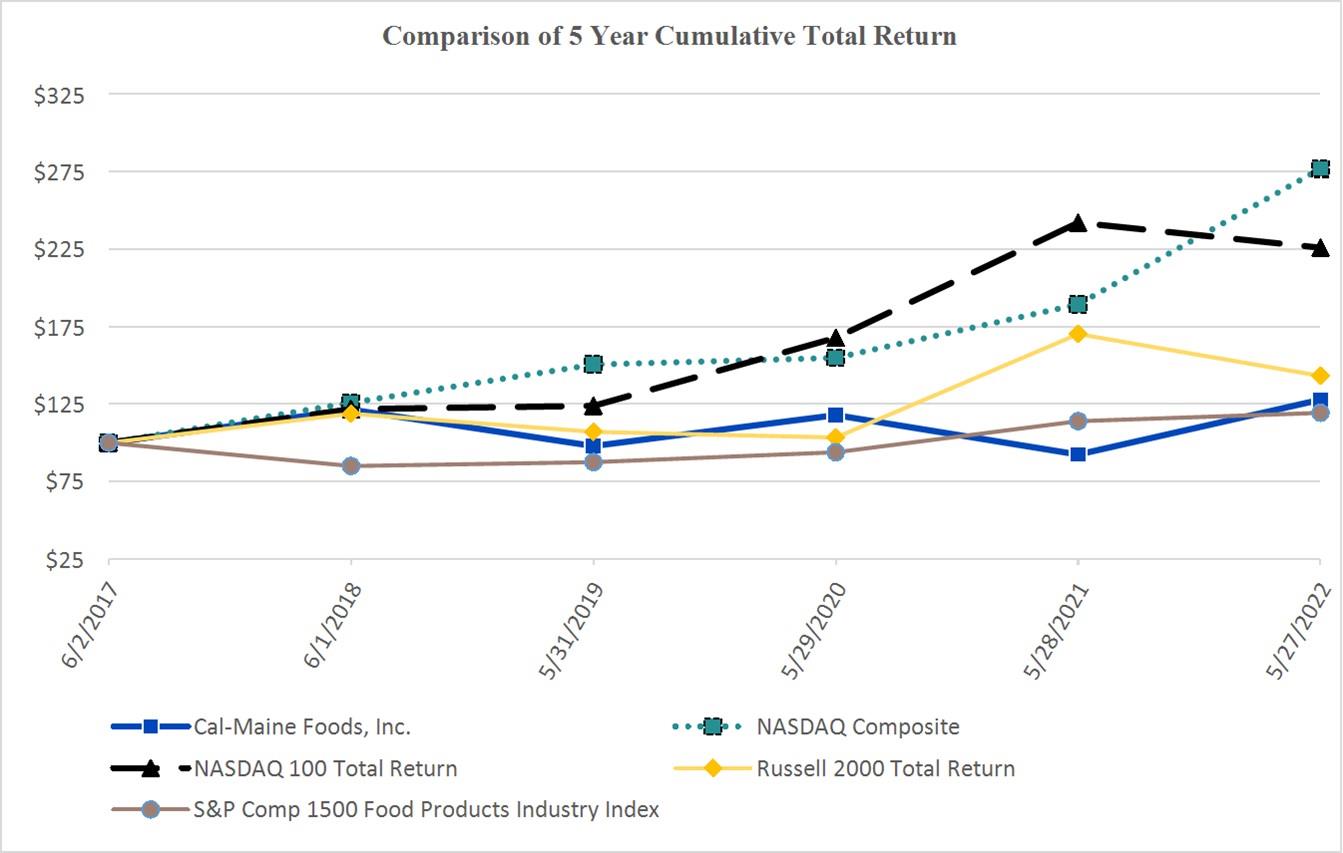
21
Stock Performance Graph
In fiscal year
2021, the Company
utilized the NASDAQ
Composite and NASDAQ
100 Total
Return indexes to
benchmark the
Company’s
total
shareholder
return.
We
are
replacing
these
indexes
with
the
(i)
Russell
2000
Total
Return,
and
(ii)
S&P
Composite
1500
Food
Products
Industry
Index.
The
Company
is
a
member
of
each
of
these
indexes
and
believes
the
other
companies included
in these indexes
provide products and
services similar to
Cal-Maine Foods.
The NASDAQ Composite
and
NASDAQ 100
Total
Return index
performances are
presented below
on the
performance graph
for comparison
purpose in
the
transitional year.
Beginning in
fiscal year
2023, only
the Russell
2000 Total
Return and
S&P Composite
1500 Food
Products
Industry indexes will be used as a
comparison for total shareholder return. The graph assumes $100 was
invested on June 2, 2017
in the stock or index and dividends were reinvested.
June 2, 2017
June 1, 2018
May 31, 2019
May 29, 2020
May 28, 2021
May 27, 2022
Cal-Maine Foods, Inc.
$
100.00
$
121.40
$
97.94
$
117.89
$
92.44
$
127.83
NASDAQ Composite
100.00
125.88
150.49
154.80
189.32
276.83
NASDAQ 100 Total Return
100.00
121.74
123.82
167.72
242.04
225.88
Russell 2000 Total Return
100.00
118.77
107.08
103.40
170.16
143.16
S&P Composite 1500 Food
Products Industry Index
100.00
85.03
87.52
93.92
113.97
119.33
Issuer Purchases of Equity Securities
There were
no purchases
of our
Common Stock
made by
or on
behalf of
our Company
or any
affiliated purchaser
during our
fiscal 2022
fourth quarter.
Recent Sales of Unregistered Securities
No sales of securities without registration under the Securities Act of 1933
occurred during our fiscal year ended May 28, 2022.
22
Securities Authorized for Issuance under Equity Compensation Plans
Equity Compensation Plan Information
(a)
(b)
(c)
Number of
securities to be
issued upon exercise
of outstanding
options, warrants
and rights
Weighted average
exercise price of
outstanding
options, warrants
and rights
Number of securities
remaining available for future
issuance under equity
compensation plans (excluding
securities reflected in column
(a))
Equity compensation plans
approved by shareholders
—
$
—
317,844
Equity compensation plans not
approved by shareholders
—
—
—
Total
—
$
—
317,844
(a)
There were no outstanding options,
warrants or rights as
of May 28, 2022. There were 1,016,573
shares of restricted
stock outstanding under our Amended and Restated 2012 Omnibus Long-Term
Incentive Plan as of May 28, 2022.
(b)
There were no outstanding options, warrants or rights as of May 28,
2022.
(c)
Reflects shares available
for future issuance
as of May 28,
2022
under our Amended
and Restated 2012
Omnibus
Long-Term Incentive
Plan.
For
additional
information,
see
Statements.
ITEM 6.
RESERVED
23
ITEM
7.
MANAGEMENT’S
DISCUSSION
AND
ANALYSIS
OF
FINANCIAL
CONDITION
AND RESULTS
OF OPERATIONS
RISK FACTORS;
FORWARD
-LOOKING STATEMENTS
For
information
relating
to
important
risks
and
uncertainties
that
could
materially
adversely
affect
our
business,
securities,
financial
condition,
operating
results,
or
cash
flow,
reference
is
made
to
the
disclosure
set
forth
under
. In
addition, because
the following
discussion includes
numerous forward
-looking statements
relating to
our business,
securities, financial condition, operating results and cash flow, reference is made to the disclosure set forth under
“
.”
COMPANY
OVERVIEW
Cal-Maine Foods, Inc. is primarily engaged in the production, grading, packaging, marketing and distribution of
fresh shell eggs.
Our fiscal
year end
is the
Saturday closest
to May 31.
The Company,
which is
headquartered in
Ridgeland, Mississippi,
is the
largest
producer
and
distributor
of
fresh
shell
eggs
in
the
United
States
(“U.S”).
In
fiscal
2022,
we
sold
approximately
1,083.8 million dozen shell eggs, which we believe
represented approximately 20% of domestic shell egg consumption.
Our total
flock as of May 28, 2022 of approximately 42.2 million layers and 11.5 million pullets and breeders is the largest in the U.S. We
sell most
of our
shell eggs
to a
diverse
group of
customers, including
national
and regional
grocery
store chains,
club stores,
companies
servicing independent supermarkets in the U.S., food service distributors, and egg product consumers in states across
the southwestern, southeastern, mid-western and mid-Atlantic regions
of the U.S.
The
Company
has
one
operating
segment,
which
is
the
production,
grading,
packaging,
marketing
and
distribution
of
shell
eggs. Many
of our
customers
rely
on
us
to
provide
most
of their
shell
egg
needs,
including
specialty
and
conventional
eggs.
Specialty eggs
represent a
broad range
of products. We
classify nutritionally
enhanced, cage-free,
organic,
free-range, pasture-
raised and brown
eggs as specialty eggs
for accounting and reporting
purposes. We
classify all other shell
eggs as conventional
eggs.
While
we
report
separate
sales
information
for
these
types
of
eggs,
there
are
a
number
of
cost
factors
which
are
not
specifically
available
for
conventional
or
specialty
eggs due
to
the
nature
of egg
production.
We
manage
our
operations
and
allocate resources to these
types of eggs on a consolidated
basis based on the demands
of our customers. For further description
of our business, refer to
HPAI
We
are
closely
monitoring
the outbreaks
of
highly
pathogenic
avian
influenza
(“HPAI”)
,
the
latest of
which
was
detected
in
commercial
flocks
in
the
U.S.
in
February
2022.
According
to
the
U.S.
Centers
for
Disease
Control
and
Prevention,
these
detections
do not
present
an immediate
public
health
concern.
There
have
been
no positive
tests for
HPAI
at
any
Cal-Maine
Foods’ owned or
contracted production facility
as of July 19,
2022. The USDA division
of Animal and
Plant Health Inspection
Service (“APHIS”), reported that approximately 30.7 million commercial layer hens have
been depopulated due to HPAI. Pullets
impacted
comprise
approximately
1.0
million.
According
to
APHIS,
the
most
recently
reported
outbreaks
of
HPAI
affecting
commercial
layer hens
and pullets
occurred
June 7,
2022 and
June 9,
2022,
respectively.
We
believe
the HPAI
outbreak
will
continue to impact the overall supply of eggs until the layer hen flock is fully replenished. While no farm is immune from HPAI,
we believe we have
implemented and continue to maintain
robust biosecurity programs across our
locations. We are also working
closely
with
federal,
state
and
local
government
officials
and
focused
industry
groups
to
mitigate
the
risk
of
this
and
future
outbreaks and effectively manage our response, if needed.
COVID-19
Since early
2020, the
coronavirus (“COVID-19”)
outbreak, characterized
as a
pandemic by
the World
Health Organization
on
March
11,
2020,
has
caused
significant
disruptions
in
international
and
U.S.
economies
and
markets.
We
understand
the
challenges and difficult economic
environment facing families
in the communities
where we live
and work, and
we are committed
to helping where we can. We have provided food assistance to
those in need by donating approximately 829 thousand
dozen eggs
in
fiscal
2022.
We
believe
we
are
taking
all
reasonable
precautions
in
the
management
of
our
operations
in
response
to
the
COVID-19 pandemic.
Our top priority
is the health
and safety
of our
employees, who
work hard
each day
to produce eggs
for
our customers. As part of the nation’s food supply, we work in a critical infrastructure industry, and we believe we have a special
responsibility to
maintain our
normal work
schedule. As
such, we
are in
regular communication
with our
managers across
our
operations
and continue
to closely
monitor the
situation in
our facilities
and in
the communities
where we
live and
work.
We
have implemented
procedures designed
to protect
our employees,
taking into
account guidelines
published
by the
Centers for
Disease Control and other government health agencies, and we have strict sanitation protocols and biosecurity measures in place
24
throughout our operations
with restricted access
to visitors. There
are no known
indications that COVID-19
affects chickens
or
can be transferred through the food supply.
We
continue to
proactively monitor
and manage
operations during
the COVID-19 pandemic,
including additional
related costs
that we incurred or
may incur in the
future. The pandemic had
a negative impact on
our business through disruptions in
the supply
chain such as
increased costs and
limited availability of
packaging supplies, increased
labor costs, increased
medical costs and,
more recently, inflation.
In fiscal
2022 and
2021, we
spent $2.2
million and
$2.3 million
(excluding medical
insurance claims)
related to
the pandemic
and
its
effects,
respectively.
The
majority
of
these
expenses
resulted
from
additional
labor
and
increased
cost
of
packaging
materials, which are
primarily reflected in cost
of sales. Medical insurance
claims related to COVID-19
paid during fiscal 2022
and 2021 were an additional $2.4 million and $1.4 million, respectively.
Executive Overview of Results – Fiscal Years
Ended May 28, 2022, May 29, 2021 and May 30, 2020
Fiscal Years
Ended
May 28, 2022
May 29, 2021
May 30, 2020
Net sales (in thousands)
$
1,777,159
$
1,348,987
$
1,351,609
Gross profit (in thousands)
$
337,059
$
160,661
$
179,588
Net average shell egg price
(a)
$
1.579
$
1.217
$
1.231
Average UB Southeast
Region - Shell Eggs - White Large
$
1.712
$
1.155
$
1.220
Feed costs per dozen produced
$
0.571
$
0.446
$
0.409
(a) The net average
shell egg selling price
is the blended price
for all sizes and
grades of shell eggs,
including non-graded
shell egg sales, breaking stock and undergrades.
Throughout the
first three quarters
of our
fiscal year 2020,
an oversupply
of eggs negatively
affected the
price of
conventional
eggs and demand
for specialty eggs
was negatively impacted
by the low
conventional egg prices.
For the first
three quarters of
fiscal 2020,
the average UB
southeastern large
index price was
down 21.9%
compared with the
prior-year period.
However, in
the fourth quarter of fiscal 2020, the average UB southeastern large index price was 62.4% higher than the average price through
the first three quarters in fiscal 2020 due to increased demand related to the onset of
the pandemic, as consumers purchased more
eggs in anticipation of preparing more meals at home.
Consumer demand maintained a steady growth throughout our first three quarters of fiscal 2021 but began trending down during
our fourth quarter of fiscal 2021
as consumers started to resume pre-pandemic
activities. Our net sales for fiscal 2021 decreased
$2.6 million compared to fiscal 2020,
primarily due to the decrease
in the selling price and
volume of conventional eggs, partially
offset by the increased volume of specialty
eggs sold. We
believe the decreased demand in foodservice
seen throughout the first
three
quarters of
fiscal 2021
due
to the
pandemic
contributed to
the depressed
price
of shell
eggs for
fiscal 2021
in the
retail
market due to the extra supply entering the retail channel from the foodservice
channel.
For
fiscal
2022,
we
believe
prices
for
conventional
eggs
were
positively
impacted
by
a
better
alignment
of
the
size
of
the
conventional
production
layer
hen
flock
and
customer
and
consumer
demand
through
the
first
three
fiscal
quarters
of
2022.
Conventional egg
prices further
increased in
the fourth
quarter of
fiscal 2022
primarily due
to decreased
supply caused
by the
HPAI
outbreak
compounded
with
good
customer
demand.
Throughout
fiscal
2022
the
hen
numbers
reported
by
the
USDA
remained below
the five-year
average. As
of July 17,
2022, APHIS
reported that
approximately 30.7
million commercial
table
egg layer
hens, or
approximately 9.5%
of the
table egg
layer flock
based on
February 2022
reported layer
numbers, have
been
depopulated due
to HPAI.
Hen numbers
reported by
the USDA
as of
June 1,
2022, were
297.5 million,
which represents
18.3
million fewer hens than a year ago.
According to
Information Resources,
Inc. (“IRI”),
for the
52 weeks
ended June
5, 2022,
which approximately
aligns with
our
fiscal year
2022, conventional
egg dozens
sold in
the U.S.
at multi-retail
outlets decreased
14.3%, while
specialty egg
dozens
sold increased 13.2% versus the prior-year comparable period.
Our conventional eggs dozens sold decreased 3.4% and specialty
egg dozens sold increased 12.5% as compared to fiscal 2021.
Gross profit increased $176.4 million to $337.1 million in fiscal 2022. The increase resulted primarily from higher
selling prices
for
conventional
eggs
as
well
as
the
increased
volume
of
specialty
eggs
sold,
partially
offset
by
the
increased
cost
of
feed
ingredients, increased processing costs and the decline in the volume of conventional eggs
sold. For fiscal year 2022, the average
Chicago
Board
of Trade
(“CBOT”)
daily
market
price
was $6.31
per bushel
for
corn and
$392.06
per ton
for
soybean meal,
25
representing increases of
38.3% and 6.1%, respectively,
compared to the daily
average CBOT prices for fiscal
2021. Feed costs
started trending
higher midway
through the
second quarter
of fiscal
2021 and
then again
near the
end of
the second
quarter of
fiscal
2022.
Beginning
in
August
2020,
the
grain
markets,
particularly
corn,
have
been
negatively
affected
by
many
factors,
including weather-related production and yield shortfalls, increased export demand and ongoing disruptions from the COVID-19
global pandemic.
These factors continued into our fiscal 2022 and
as other factors such as the
Russia-Ukraine war, increased fuel
costs, transportation and fertilizers prices
and strong export demand and restrictions
further compounded the existing issues that
contributed
to
near-historical
low
stocks-to-use
ratios
for
corn
worldwide
and
overall
higher
feed
ingredient
cost
and
price
volatility.
We continue
to execute our growth strategy of remaining a low-cost provider
of shell eggs and growth of our specialty eggs and
egg
products
through
additional
investments
in
cage-free
facilities and
selective
acquisitions.
In
fiscal
2022,
we
acquired
the
remaining 50%
membership interest
in Red
River Valley
Egg Farm,
LLC (“Red
River”), which
owns and
operates a
specialty
shell
egg
production
complex
with
approximately
1.7
million
cage-free
laying
hens,
cage-free
pullet
capacity,
a
feed
mill,
processing plant, related offices and outbuildings and related equipment located on approximately 400 acres near Bogata, Texa
s.
We
also
announced
new
capital
projects
with
estimated
costs of
$105
million
that
will
expand
our
cage-free
production
and
capacity by 2.2 million cage-free hens. For additional information,
see
RESULTS
OF OPERATIONS
The following table sets forth, for the fiscal years indicated, certain items from our consolidated
statements of income expressed
as a percentage of net sales.
Fiscal Year
Ended
May 28, 2022
May 29, 2021
Net sales
100.0
%
100.0
%
Cost of sales
81.0
%
88.1
%
Gross profit
19.0
%
11.9
%
Selling, general and administrative
11.2
%
13.6
%
(Gain) loss on disposal of fixed assets
(0.3)
%
0.2
%
Operating income (loss)
8.1
%
(1.9)
%
Total other income
1.3
%
1.2
%
Income (loss) before income taxes
9.4
%
(0.7)
%
Income tax expense (benefit)
1.9
%
(0.9)
%
Net income
7.5
%
0.2
%
Less:
Net loss attributable to noncontrolling interest
—
%
—
%
Net income attributable to Cal-Maine Foods, Inc.
7.5
%
0.2
%
26
Fiscal Year
Ended May 28, 2022 Compared to Fiscal Year
Ended May 29, 2021
NET SALES
Total net sales for fiscal
2022 were $1,777.2 million compared to $1,349.0 million for fiscal 2021.
Net shell egg sales represented 96.6% and 97.3% of total net sales
for the fiscal year 2022
and 2021, respectively. Shell egg sales
classified as
“Other”
represent sales
of hard
-cooked
eggs, hatching
eggs, and
other miscellaneous
products
included with
our
shell egg operations. The table below presents an analysis of our conventional and specialty shell egg sales (in thousands, except
percentage data):
May 28, 2022
May 29, 2021
Total net sales
$
1,777,159
$
1,348,987
Conventional
$
1,061,995
61.8
%
$
766,284
58.4
%
Specialty
648,838
37.8
%
539,780
41.1
%
Egg sales, net
1,710,833
99.6
%
1,306,064
99.5
%
Other
6,322
0.4
%
6,190
0.5
%
Net shell egg sales
$
1,717,155
100.0
%
$
1,312,254
100.0
%
Dozens sold:
Conventional
747,914
69.0
%
785,446
73.2
%
Specialty
335,875
31.0
%
287,765
26.8
%
Total dozens sold
1,083,789
100.0
%
1,073,211
100.0
%
Net average selling price per dozen:
Conventional
$
1.420
$
0.976
Specialty
$
1.932
$
1.876
All shell eggs
$
1.579
$
1.217
Egg products sales:
Egg products net sales
$
60,004
$
36,733
Pounds sold
63,968
63,627
Net average selling price per pound
$
0.938
$
0.577
Shell egg net sales
-
For fiscal 2022,
conventional egg
sales increased $295.7
million, or 38.6%,
compared to
fiscal 2021, primarily
due to
the increase
in conventional
egg prices,
partially offset
by a
4.8% decrease
in the
volume of
conventional
eggs sold.
Changes in price resulted in a $332.1
million increase and change in volume resulted
in a $36.6 million decrease in net
sales, respectively.
-
We believe
prices for conventional eggs
were positively impacted by
a better alignment of the
size of the conventional
production
layer
hen
flock
and
customer
and
consumer
demand
throughout
the
first
three
quarters
of
fiscal
2022.
Conventional egg prices further
increased in the fourth quarter
of fiscal 2022 primarily due
to decreased supply caused
by the HPAI
outbreak,
discussed above.
-
We believe lower
conventional egg prices in the prior-year period were primarily
tied to a surplus of conventional eggs
entering the retail channel from the foodservice channel exceeding
retail demand during this phase of the pandemic.
-
The decrease
in volume of
conventional eggs
sold was primarily
due to elevated
retail demand
during the
first half
of
fiscal 2021 given consumers’ preferences
to purchase eggs for in-home meal
preparation due to the pandemic.
We saw
these consumer preferences begin to shift
in the fourth quarter of
fiscal 2021 as consumers began
to resume out-of-home
dining and prepared fewer meals at home.
-
Specialty egg sales
increased $109.1 million, or
20.2%, for fiscal
2022 compared to
fiscal 2021, primarily
due to a
16.7%
increase in the volume of specialty dozens sold and a 3.0% increase in specialty egg prices. Changes in price resulted in
a $18.8 million
increase and change
in volume
resulted in a
$90.3 million increase
in net
sales, respectively. Our specialty
egg sales
also benefitted
from our
additional cage-free
production capacity.
Cage-free egg
sales for
fiscal 2022
were
22.1% of our total net shell egg sales.
27
Egg products net sales
-
Egg products
net sales increased
$23.3 million
or 63.4%, primarily
due to a
62.6% selling
price increase
compared to
fiscal 2021, which had a $23.1 million positive impact on net sales.
-
Our
egg products
net average
selling
price
increased
in fiscal
2022,
compared
to fiscal
2021
as foodservice
channel
demand has
begun to
shift more
towards pre-pandemic
levels. This
coincided
with the
HPAI
outbreak
that started
in
February 2022, in which
we believe 10.4 of
the 30.7 million culled birds
were located at facilities dedicated
to support
inline breaking facilities in Iowa.
-
Selling prices for
egg products in fiscal
2021 were negatively
impacted by a
decline in foodservice
demand during the
more restrictive phases of governmental and business shutdowns due to the pandemic.
COST OF SALES
Cost of sales for fiscal 2022 were $1,440.1 million compared to $1,188.3
million for fiscal 2021.
Cost of
sales consi
sts of
costs directly
related
to producing,
processing
and
packing
shell eggs,
purchases
of
shell
eggs from
outside producers, processing and packing of liquid
and frozen egg products and other non-egg costs. Farm
production costs are
those costs
incurred at
the egg
production facility,
including feed,
facility,
hen amortization
and other
related farm
production
costs.
The following table presents the key variables affecting our cost of
sales (in thousands,
except cost per dozen data):
Fiscal Year
Ended
May 28, 2022
May 29, 2021
% Change
Cost of Sales:
Farm production
$
927,806
$
730,902
26.9
%
Processing, packaging, and warehouse
289,056
250,058
15.6
Egg purchases and other (including change in inventory)
172,034
177,634
(3.2)
Total shell eggs
1,388,896
1,158,594
19.9
Egg products
51,204
29,536
73.4
Other
—
196
(100.0)
Total
$
1,440,100
$
1,188,326
21.2
%
Farm production costs (per dozen produced)
Feed
$
0.571
$
0.446
28.0
%
Other
$
0.352
$
0.320
10.0
%
Total
$
0.923
$
0.766
20.5
%
Outside egg purchases (average cost per dozen)
$
1.72
$
1.22
41.0
%
Dozens produced
1,022,327
970,837
5.3
%
Percent produced to sold
94.3%
90.5%
4.2
%
Farm Production
-
Feed costs
per dozen
produced increased
28.0% in
fiscal 2022
compared to
fiscal 2021,
primarily due
to higher
feed
ingredient prices,
discussed above.
-
Other
farm
production
costs increased
due
to higher
flock amortization,
primarily
from an
increase
in
our
cage-free
production, which has higher capitalized costs. Also, higher feed costs, which began to rise in our third quarter of fiscal
2021, are capitalized in our flocks during pullet production and increased our
amortization expense.
-
We had higher
facility expense as more cage-free facilities came into production.
Processing, packaging, and warehouse
-
Cost of packaging materials increased 11.9% compared to fiscal 2021 as supply chain constraints initially caused by the
pandemic
increased
costs
for
packaging
products
and
manufacturers
implemented
pandemic
surcharges.
Costs
also
increased due to rising inflation.
-
Labor costs increased 14.4% due to wage increases in response to
labor shortages, primarily due to the pandemic and its
effects.
-
Dozens processed increased 5.0% compared to fiscal 2021, which resulted
in an $11.4 million increase in costs.
28
Egg purchases and other (including change in inventory)
-
Costs in this category decreased primarily due to the decrease in the volume of
outside egg purchases, as our percentage
of produced to sold increased to 94.3% in fiscal 2022 from 90.5% in fiscal 2021,
partially offset by higher egg prices.
Looking
forward
to
fiscal
2023,
market
indications
point
to
higher
corn
and
soybean
prices and
greater
volatility
tied
to
the
Russia-Ukraine war and higher export demand.
GROSS PROFIT
Gross profit,
as a percentage
of net sales,
was 19.0% for
fiscal 2022,
compared to 11.9%
for fiscal 2021.
The increase resulted
primarily from higher selling prices for conventional eggs as well as the increased volume of
specialty eggs sold, partially offset
by the increased cost of feed ingredients,
increased processing costs and the decline in the volume of conventional eggs sold.
SELLING, GENERAL, AND ADMINISTRATIVE
EXPENSES
Selling,
general,
and
administrative
expenses
("SGA")
include
costs
of
marketing,
distribution,
accounting,
and
corporate
overhead. SG&A increased $14.7
million to $198.6 million
in fiscal 2022. The following
table presents an analysis of
our SGA
expenses (in thousands):
Fiscal Year
Ended
May 28, 2022
May 29, 2021
$ Change
% Change
Specialty egg expense
$
59,830
$
59,294
$
536
0.9
%
Delivery expense
62,677
52,670
10,007
19.0
%
Payroll, taxes and benefits
43,954
43,327
627
1.4
%
Stock compensation expense
4,063
3,778
285
7.5
%
Other expenses
28,107
24,874
3,233
13.0
%
Total
$
198,631
$
183,943
$
14,688
8.0
%
Specialty egg expense
-
Specialty egg
expense which
includes franchise
fees, advertising
and promotion
costs generally
tracks with
specialty
egg
volumes,
which
were
up
16.7%
for
fiscal
2022
compared
to
fiscal
2021.
However,
our
specialty
egg
expense
increased
only
0.9%,
primarily
due
to
increased
sales
to
other
Eggland’s
Best,
Inc.
(“EB”)
franchisees,
including
unconsolidated
affiliates,
Specialty
Eggs,
LLC
and
Southwest
Specialty
Eggs,
LLC,
that
were
responsible
for
the
franchise fees,
advertising and
promotion costs
associated with
those sales
resulting in
reduced costs
for us.
Also, the
strong conventional market diminished
the need to promote specialty eggs;
and as a result, EB temporarily
reduced the
related franchise fees for certain specialty egg products to encourage
continued production of these products.
Delivery expense
-
The increased
delivery expense
is primarily
due to
the increase
in fuel
and labor
costs for
both our
fleet and
contract
trucking.
Other expenses
-
The increase
in other expenses
is primarily due
to property losses
incurred that
were not covered
by insurance
as well
as increased
premiums
for
property
and casualty
insurance programs.
We
also
accrued an
additional
$1.1 million
in
property taxes due to the Red River acquisition.
OPERATING
INCOME (LOSS)
As a result
of the above,
our operating
income was $143.5 million
for fiscal 2022,
compared to operating
loss of $26.3 million
for fiscal 2021.
OTHER INCOME (EXPENSE)
Total
other
income
(expense)
consists
of
items
not
directly
charged
to,
or
related
to,
operations
such
as
interest
income
and
expense, equity in income or loss of unconsolidated entities, and patronage dividends,
among other items.
29
The Company
recorded interest income
of $988 thousand
in fiscal 2022,
compared to $2.8
million in
fiscal 2021. We
recorded
interest expense of $403 thousand and $213 thousand
in fiscal 2022 and 2021, respectively, primarily related to commitment fees
on our Credit Facility described below.
Patronage
dividends,
which
represent
distributions
from
our
membership
in
EB,
increased
$1.1
million
or
12.5%.
Patronage
dividends are paid once a year based on EB’s
profits and its available cash.
Equity in income
from unconsolidated entities
for fiscal 2022 was
$1.9 million compared
to $622 thousand for
fiscal 2021, due
to increased specialty
egg prices
as well
as increased sales
volume resulting from
our additional investment
in Southwest
Specialty
to expand its operations.
Other,
net for fiscal
2022 was
income of
$9.8 million compared
to $4.1 million
for fiscal 2021.
The majority of
the increase is
due to our
acquisition of the
remaining 50% membership
interest in Red
River as we
recognized a
$4.5 million
gain due to
the
remeasurement of
our equity investment,
along with the
$1.6 million payments
related to review
and adjustment of
our various
marketing agreements.
INCOME TAXES
For the
fiscal year
ended May
28, 2022,
our pre-tax
income was
$166.0 million,
compared to
pre-tax loss
of $9.9
million for
fiscal 2021. Income
tax expense of
$33.6 million was
recorded for fiscal
2022 with an
effective tax rate
of 20.2%.
Included in
fiscal 2022
income tax
expense is
the discrete
tax benefit
of $8.3
million discussed
in
Notes to
Condensed
Consolidated
Financial
Statements in
this Annual
Report.
Excluding the
discrete tax
benefit,
income tax
expense was $41.9
million with an
adjusted effective
tax rate of
25.2%. For
fiscal 2021, income
tax benefit was
$12.0 million.
Excluding the impact
of discrete items
related to a
$12.4 million net
tax benefit recorded
during fiscal 2021
in connection with
the Coronavirus Aid,
Relief, and Economic Security
Act (the “CARES Act”),
our income tax benefit
for the comparable period
of fiscal 2021 was $2.2 million, which reflects an adjusted effective
tax rate of 22.7%.
At May 28, 2022, the
Company had an income tax
receivable of $42.1 million compared
to $42.5 million at May 29,
2021. The
income tax receivable is related
to the Company’s
decision to carryback fiscal 2020
and fiscal 2021 taxable net operating
losses
to recover a
portion of taxes paid
in fiscal 2015
and fiscal 2016.
During fiscal 2022,
the Company filed
both federal carryback
tax returns,
and we believe we will receive the refunds during our third fiscal quarter of 2023.
Items causing
our effective
tax rate
to differ
from the
federal statutory
income tax
rate of
21% are
state income
taxes, certain
federal tax
credits and
certain items included
in income or
loss for financial
reporting purposes that
are not included
in taxable
income or
loss for income
tax purposes, including
tax exempt interest
income, certain
nondeductible expenses,
and net income
or loss attributable to noncontrolling interest.
NET LOSS ATTRIBUTABLE
TO NONCONTROLLING INTEREST
Net loss attributable
to noncontrolling interest was
$209 thousand for fiscal
2022 compared to
no such income or
loss for fiscal
2021.
NET INCOME ATTRIBUTABLE
TO CAL-MAINE FOODS, INC.
As a result of the above, net
income attributable to Cal-Maine Foods, Inc.
for fiscal 2022 was $132.7 million, or $2.73
per basic
and $2.72 per diluted share, compared to $2.1 million, or $0.04
per basic and diluted share for fiscal 2021.
Fiscal Year
Ended May 29, 2021 Compared to Fiscal Year
Ended May 30, 2020
The discussion
of our
results of
operations for
the fiscal
year ended
May 29,
2021 compared
to the
fiscal year
ended May
30,
2020 can be found in Part II. Item 7. Management's Discussion and Analysis of Financial Condition and Results
of Operations in
the Company's fiscal 2021 Annual Report on Form 10-K.
LIQUIDITY AND CAPITAL
RESOURCES
Working
Capital and Current Ratio
Our
working
capital
at
May
28,
2022
was
$476.8 million,
compared
to
$429.8 million
at
May
29,
2021.
The
calculation
of
working capital is defined
as current assets less current
liabilities. Our current ratio was
3.58 at May 28, 2022
compared to 5.77
30
at May 29, 2021. The current ratio is
calculated by dividing current assets by current liabilities. Due to seasonal factors described
in
, we
generally expect
our need
for working
capital to
be highest
in the
fourth and
first
fiscal quarters ending in May/June and August/September,
respectively.
Cash Flows from Operating Activities
Net cash
provided by
operating activities
was $126.2
million for
fiscal year
2022 compared
with $26.1 million
for fiscal
year
2021.
The increase in cash flow from operations
resulted primarily from higher selling prices for conventional eggs
as well as the
increased volume of
specialty eggs, partially
offset by
the increased cost
of feed ingredients
and processing costs.
The increase
in accounts payables,
accrued expenses and
other liabilities is
primarily due
to $62.3 million
balance for dividends
and income
tax payables as of May 28, 2022.
Cash Flows from Investing Activities
We
continue
to
invest
in
our
facilities,
with
$72.4
million
used
to
purchase
property,
plant
and
equipment
for
fiscal
2022,
compared to
$95.1 million
in fiscal
2021. Proceeds from
the sale
of property,
plant and
equipment was
$8.3 million
for fiscal
2022, compared to $3.4 million for in fiscal 2021. We also acquired the remaining 50% membership interest in Red River during
our first quarter of fiscal
2022 for $44.8 million, net
of cash acquired. Purchases of
investments were $98.2 million in fiscal
2022,
compared
to
$88.3
million
in
fiscal
2021.
Sales
and
maturities
of
investment
securities
were
$92.7
million
for
fiscal
2022,
compared to $129.1 million for fiscal
2021. We received $400 thousand in distributions from unconsolidated entity in
fiscal 2022
compared to $6.7 million for fiscal 2021.
Cash Flows from Financing Activities
We
paid dividends
totaling $6.1 million
and $1.7 million
in fiscal 2022
and 2021, respectively.
Purchases of common
stock by
treasury of $1.1
million and $871
thousand were made
to satisfy tax
withholding obligations
for employees
in connection with
the vesting of restricted common stock. Cash payments of $215 thousand
and $205 thousand were made on our finance lease.
As of May 28, 2022,
cash increased $1.7 million since
May 29, 2021, compared to a
decrease of $20.8 million during fiscal
2021.
Credit Facility
We had no
long-term debt outstanding at the end of fiscal 2022
and 2021. On November 15, 2021, we entered
into an Amended
and Restated Credit Agreement (the “Credit Agreement”) with a five-year term. The Credit Agreement amended and restated the
Company’s
previously
existing credit
agreement dated
July 10,
2018. The
Credit Agreement
provides for
an increased
senior
secured revolving credit facility (the “Credit Facility”), in an initial aggregate principal amount of up to $250 million. As of May
28, 2022,
no amounts
were borrowed
under the
Credit Facility.
We
have $4.1
million in
outstanding standby
letters of
credit,
which were issued under our Credit
Facility for the benefit of
certain insurance companies. Refer to
Part II. Item 8. Notes to
the
Financial Statements,
31
Material Cash Requirements
Material cash requirements for
operating activities consist of
feed ingredients, employee related
costs, and other general
operating
expenses, which we expect to be paid from our cash from operations.
We
continue
to monitor
the increasing
demand for
cage-free eggs
and to
engage with
our customers
in an
effort
to achieve
a
smooth transition
to meet
their announced
commitment timeline
for cage-free
egg sales. As
of May
28, 2022,
we had
invested
approximately $516 million
in facilities, equipment
and related operations
to expand our
cage-free production starting
with our
first facility in 2008. The following table
presents current material construction projects approved as of
May 28, 2022, along with
our $55.3
million capital
project approved
subsequent to
the end
of the
fourth quarter
2022 to
convert existing
capacity at
our
Chase, Kansas production facility to house approximately
1.5 million cage-free hens and include
remodels of all remaining pullet
facilities (in thousands):
Project(s) Type
Projected
Completion
Projected Cost
Spent as of
May 28, 2022
Remaining
Projected Cost
Cage-Free Layer & Pullet Houses/Processing
Facility
Fiscal 2023
$
131,974
$
113,386
$
18,588
Cage-Free Layer & Pullet Houses
Fiscal 2023
24,171
14,201
9,970
Cage-Free Layer & Pullet Houses
Fiscal 2024
42,591
107
42,484
Cage-Free Layer & Pullet Houses
Fiscal 2025
94,183
144
94,039
$
292,919
$
127,838
$
165,081
For additional information, see
payments,
in
thousands,
to
be
made
under
existing
contractual
obligations
as
of
May
28,
2022.
Further
information
on
debt
obligations is contained in
, and on lease obligations in
, each in Part II. Item 8.
Notes
to the Consolidated Financial Statements. As of May 28, 2022,
we had no outstanding long-term debt.
Payments due by period
Total
Less than
1 year
1-3
years
3-5
years
More than
5 years
Finance leases
$
457
$
239
$
218
$
—
$
—
Operating leases
1,080
539
536
5
—
Purchase obligations:
Feed ingredients
(a)
172,132
172,132
—
—
—
Construction contracts and other equipment
27,568
19,281
8,287
—
—
Total
$
201,237
$
192,191
$
9,041
$
5
$
—
(a)
Actual purchase obligations may change based on the contractual terms and
agreements
We believe our
current cash balances, investments, cash flows from operations, and
Credit Facility will be sufficient to fund our
capital needs for at least the next 12 months.
IMPACT OF
RECENTLY
ISSUED ACCOUNTING STANDARDS
For information on changes in accounting
principles and new accounting principles,
see “
New Accounting Pronouncements
and
Policies
” in Part II. Item 8. Notes to Consolidated Financial Statements,
CRITICAL ACCOUNTING ESTIMATES
The preparation of financial statements in accordance with U.S. GAAP requires management to make estimates
and assumptions
that affect the
reported amounts of
assets and liabilities
at the date
of the financial
statements and the
reported amounts of
revenues
and expenses during the reporting period. Actual results could
differ from these estimates. Critical accounting estimates are
those
estimates made in
accordance with GAAP
that involve a
significant level of estimation
uncertainty and have had
or are reasonably
likely to have a material impact
on the financial condition or results
of operations. Our critical accounting estimates are described
below.
32
BUSINESS COMBINATION
S
The Company applies the acquisition
method of accounting, which
requires that once control is
obtained, all the assets acquired
and liabilities assumed,
including amounts
attributable to noncontrolling
interests, are recorded
at their respective
fair values at
the
date
of acquisition.
The
excess
of
the
purchase
price
over
fair
values
of
identifiable
assets
and
liabilities
is
recorded
as
goodwill.
We
typically
use the
income method
approach for
intangible assets
acquired
in a
business combination.
Significant
judgment
exists in valuing certain
intangible assets. and the
most significant assumptions requiring judgment
involve estimating the
amount
and timing of
future cash flows,
growth rates,
discount rates selected
to measure
the risks inherent
in the future
cash flows and
the asset’s expected useful lives.
The fair values of
identifiable assets and liabilities
is determined internally and requires
estimates and the use
of various valuation
techniques. When a market value
is not readily available, our internal
valuation methodology considers the
remaining estimated
life of the assets acquired and significant judgment is required as management
determines the fair market value for those assets.
Due
to
inherent
industry
uncertainties
including
volatile
egg
prices
and
feed
costs,
unanticipated
market
changes,
events,
or
circumstances may occur that could affect the estimates and assumptions
used, which could result in subsequent impairments.
INVENTORIES
Inventories of eggs, feed,
supplies and flocks
are valued principally
at the lower
of cost (first-in,
first-out method) or net
realizable
value. If
market
prices
for
eggs and
feed
grains
move
substantially
lower,
we
record
adjustments
to
write
down
the
carrying
values of eggs
and feed inventories
to fair market
value. The cost
associated with flock inventories,
consisting principally of chick
purchases, feed, labor, contractor payments and
overhead costs, are accumulated during the growing period of approximately 22
weeks. Capitalized flock costs are then amortized over the flock’s productive
life, generally one to two years. Judgment exists in
determining
the flock’s
productive life
including
factors such
as laying
rate and
egg size,
molt cycles,
and customer
demand.
Furthermore, other factors such as
hen type or weather conditions could affect
the productive life. These factors could
make our
estimates of productive life differ from actual results. Flock mortality is charged to cost of sales as incurred. High mortality from
disease or extreme temperatures will
result in abnormal write-downs to
flock inventories. Management continually monitors each
flock and attempts to take appropriate actions to minimize the risk of mortality
loss.
GOODWILL
As a
result of
acquiring
businesses, the
Company
has $44.0
million
of goodwill
on May
28, 2022.
Goodwill is
evaluated
for
impairment
annually
by
first
performing
a
qualitative
assessment
to
determine
whether
a
quantitative
goodwill
test
is
necessary. After
assessing the totality of events or
circumstances, if we determine it
is more likely than not that the
fair value of
a reporting unit is less than its carrying
amount, then we perform additional quantitative tests to
determine the magnitude of any
impairment.
The
Company
has
determined
that
all
of
our
locations
share
similar
economic
characteristics
and
support
each
other
in
the
production of eggs and customer support. Therefore, we aggregate all our locations as a single reporting unit for testing goodwill
for
impairment.
When
the
Company
acquires
a
new
location,
we
determine
whether
it
should
be
integrated
into
our
single
reporting unit or
treated as a
separate reporting unit. Historically, we
have concluded that
acquired operations should be
integrated
into our single reporting unit due to the operational changes, redistribution of customers, and significant changes in management
that occur when we acquire businesses, which result in the acquired operations sharing
similar economic characteristics with the
rest of our locations. Once goodwill associated with acquired operations becomes part of goodwill of our single reporting unit, it
no longer represents the particular
acquired operations that gave rise to the
goodwill. We
may conclude that a business acquired
in the future should be treated as a separate reporting unit, in which case it would be tested separately
for goodwill
impairment.
At May 28, 2022, goodwill represented 3.1% of total assets and 2.9% of
stockholders’ equity.
Judgment exists in management’s evaluation
of the qualitative factors which include macroeconomic conditions, the current egg
industry environment,
cost inputs such as
feed ingredients and overall financial performance. Furthermore, judgment
exists in the
evaluation
of the
threshold of
whether it
is more
likely than
not that
the fair
value of
a reporting
unit is
less than
its carrying
amount. Uncertainty exists due to uncontrollable events that could occur
that could negatively affect our operating conditions.
During our
annual impairment
test in fiscal
2022, we
determined that
goodwill passed
the qualitative
assessment and
therefore
no quantitative analysis of goodwill impairment was necessary.
33
REVENUE RECOGNITION
Revenue recognition is completed upon satisfaction of the performance obligation to the customer, which typically occurs within
days of the Company and customer
agreeing upon the order.
See
Consolidated Financial Statements for further discussion of the policy.
The Company believes
the performance obligation
is met upon delivery
and acceptance of
the product by
our customers. Costs
to deliver
product to
customers are
included in selling,
general and
administrative expenses
in the
accompanying Consolidated
Statements
of
Income. Sales
revenue
reported
in
the
accompanying
Consolidated
Statements
of
Income
is
reduced
to
reflect
estimated returns
and allowances. The
Company records
an estimated
sales allowance
for returns
and discounts
at the
time of
sale using historical trends based on actual sales returns and sales.
The Company periodically provides
incentive offers to its
customers to encourage purchases.
Such offers include current
discount
offers (e.g., percentage discounts off current purchases), inducement
offers (e.g., offers for future discounts
subject to a minimum
current purchase), and other similar offers. Current discount offers, when accepted by customers, are treated as a reduction to the
sales price
of the
related transaction,
while inducement
offers, when
accepted by
customers, are
treated as
a reduction
to sales
price based on estimated future redemption rates.
Redemption rates are estimated using the Company’s
historical experience for
similar inducement offers. Current discount and inducement offers
are presented as a net amount in ‘‘Net
sales.’’
As the
estimates noted
above are
based on
historical information,
we do
not believe
that there
will be
a material
change in
the
estimates and assumptions used
to recognize revenue. However,
if actual results varied significantly
from our estimates it could
expose us to material gains or losses.
LOSS CONTINGENCIES
The Company evaluates
whether a loss contingency
exists, and if the
assessment of a contingency
indicates it is probable
that a
material loss has
been incurred and
the amount of
the loss can
be reasonably estimated,
the estimated loss
would be accrued
in
the Company’s financial statements.
The Company expenses the costs of litigation as they are incurred.
There
were
no
loss
contingency
reserves
for
the
past
three
fiscal
years.
Our
evaluation
of
whether
loss
contingencies
exist
primarily relates to
litigation matters. The
outcome of litigation
is uncertain due
to, among other
things, uncertainties regarding
the facts will be established
during the proceedings, uncertainties
regarding how the law will
be applied to the facts
established,
and uncertainties
regarding the
calculation of
any potential
damages or
the costs
of any
potential injunctive
relief. If
the facts
discovered or the Company’s
assumptions change, future reserves for
loss contingencies may be required.
Results of operations
may be materially affected by losses or a loss contingency reserve
resulting from adverse legal proceedings.
INCOME TAXES
We
determine our
effective tax
rate by estimating
our permanent differences
resulting from differing
treatment of items
for tax
and accounting purposes. Judgment and uncertainty exist with management’s application of tax regulations
and evaluation of the
more-likely-than-not recognition and measurement thresholds. We
are periodically audited by taxing authorities. An adverse tax
settlement could have a negative impact on our effective tax rate
and our results of operations.
34
ITEM 7A.
QUANTITATIVE
AND QUALITATIVE
DISCLOSURES ABOUT MARKET RISKS
COMMODITY PRICE RISK
Our primary exposure to market risk arises from changes
in the prices of conventional eggs,
which are subject to significant price
fluctuations that are largely
beyond our control. We
are focused on growing our
specialty shell egg business because
the selling
prices
of
specialty
shell
eggs are
generally
not
as
volatile
as conventional
shell
egg
prices. Our
exposure
to
market
risk
also
includes changes in
the prices of corn
and soybean meal,
which are commodities
subject to significant
price fluctuations due
to
market conditions
that are
largely beyond
our control.
To
ensure continued
availability of
feed ingredients,
we may
enter into
contracts for future
purchases of corn
and soybean meal,
and as part of
these contracts, we
may lock-in
the basis portion
of our
grain purchases several months in
advance and commit to purchase
organic ingredients to help
assure supply.
Ordinarily, we
do
not enter
long-term contracts
beyond a
year to
purchase corn
and soybean
meal or
hedge against
increases in
the price
of corn
and soybean meal.
The following table
outlines the impact
of price changes
for corn and
soybean meal on
feed costs per
dozen
as feed ingredient pricing varies:
Change in price per bushel of corn
$
(0.84)
$
(0.56)
$
(0.28)
$
0.00
$
0.28
$
0.56
$
0.84
Change
per ton
Soybean
Meal
$
(76.50)
0.511
0.521
0.531
0.541
0.551
0.561
0.571
$
(51.00)
0.521
0.531
0.541
0.551
0.561
0.571
0.581
$
(25.50)
0.531
0.541
0.551
0.561
0.571
0.581
0.591
$
0.00
0.541
0.551
0.561
0.571
(a)
0.581
0.591
0.601
$
25.50
0.551
0.561
0.571
0.581
0.591
0.601
0.611
$
51.00
0.561
0.571
0.581
0.591
0.601
0.611
0.621
$
76.50
0.571
0.581
0.591
0.601
0.611
0.621
0.631
(a)
Based on 2022
actual costs, table flexes feed cost inputs to show $0.01 impacts to per dozen egg feed production
costs.
INTEREST RATE
RISK
The fair value of our debt is sensitive
to changes in the general level of U.S.
interest rates. In November 2021, we entered
into a
$250 million Credit Facility which bears interest at a variable rate. No amounts were outstanding under that facility during fiscal
2022.
Under
our
current
policies,
we
do
not
use
interest
rate
derivative
instruments
to
manage
our
exposure
to
interest
rate
changes.
FIXED INCOME SECURITIES RISK
At May 28, 2022, the effective maturity of our cash equivalents and
investment securities available for sale was 9.5 months, and
the composite credit rating of the holdings are A / A2 / A (S&P / Moody’s
/ Fitch).
CONCENTRATION
OF CREDIT RISK
Our financial instruments exposed to concentrations of credit risk consist primarily of trade receivables. Concentrations of credit
risk with
respect to
receivables are
limited due
to our
large number
of customers
and their
dispersion across
geographic areas,
except that at May 28,
2022 and May 29,
2021, 27.9% and 23.8%,
respectively,
of our net accounts receivable
balance was due
from
Walmart
Inc.
(including
Sam’s
Club).
No
other
single
customer
or
customer
group
represented
10%
or
greater
of
net
accounts receivable.
35
ITEM 8.
FINANCIAL STATEMENTS
AND SUPPLEMENTARY
DATA
Report of Independent Registered Public Accounting Firm
Board of Directors and Stockholders
Cal-Maine Foods, Inc. and Subsidiaries
Ridgeland, Mississippi
Opinion on the Consolidated Financial Statements
We
have audited
the accompanying
consolidated balance
sheets of
Cal-Maine Foods,
Inc. and Subsidiaries
as of
May
28, 2022 and May 29,
2021, the related consolidated statements
of income, comprehensive income, stockholders’ equity
and cash
flows for each of the
three years in the period ended
May 28, 2022, and the related
consolidated notes and schedule listed
in the
Index
at
Item
15(a)(1)
and
15(a)(2)
(collectively
referred
to
as
the
“consolidated
financial
statements”).
In
our
opinion,
the
consolidated
financial
statements
present
fairly,
in
all
material
respects,
the
financial
position
of
Cal-Maine
Foods,
Inc.
and
Subsidiaries as of May
28, 2022 and May
29, 2021, and the
results of their operations
and their cash flows for
each of the three
years in
the period
ended May
28,
2022,
in conformity
with accounting
principles
generally
accepted
in the
United
States of
America.
We
also have
audited, in
accordance with
the standards
of the
Public Company
Accounting Oversight
Board (United
States) (“PCAOB”),
the Cal-Maine
Foods, Inc.
and Subsidiaries’
internal control
over financial
reporting as
of May
28, 2022,
based
on
the
criteria
established
in
2013
Internal
Control
–
Integrated
Framework
Organizations of the Treadway
Commission and our report dated July 19, 2022 expressed an unqualified
opinion.
Basis for Opinion
These
consolidated
financial
statements
are
the
responsibility
of
the
entities’
management.
Our
responsibility
is
to
express an
opinion on
these consolidated
financial statements
based on
our audits.
We
are a
public accounting
firm registered
with the PCAOB and
are required to be
independent with respect to
Cal-Maine Foods, Inc.
and Subsidiaries in accordance
with
the
U.S.
federal
securities
laws and
the
applicable
rules
and
regulations
of the
Securities and
Exchange
Commission
and
the
PCAOB.
We
conducted
our audits
in accordance
with the
standards of
the PCAOB.
Those
standards require
that we
plan and
perform
the
audit
to
obtain
reasonable
assurance
about
whether
the
consolidated
financial
statements
are
free
of
material
misstatement,
whether
due
to
error
or
fraud.
Our
audits
included
performing
procedures
to
assess
the
risks
of
material
misstatement of the
consolidated financial statements,
whether due to error
or fraud, and performing
procedures that respond
to
those
risks.
Such
procedures
included
examining,
on
a
test
basis,
evidence
regarding
the
amounts
and
disclosures
in
the
consolidated financial
statements. Our
audits also
included evaluating
the accounting
principles used
and significant
estimates
made
by management,
as well
as evaluating
the overall
presentation
of the
consolidated financial
statements. We
believe
our
audits provide a reasonable
basis for our opinion.
Critical Audit Matter
The
critical
audit
matter
communicated
below
is
a
matter
arising
from
the
current
period
audit
of
the
consolidated
financial
statements
that
were
communicated
or
required
to
be
communicated
to
the
Audit
Committee
and
that:
(1)
relate
to
accounts
or disclosures
that are
material
to the
consolidated
financial
statements and
(2) involved
our especially
challenging,
subjective or
complex judgments.
The communication
of the critical
audit matter
does not
alter in
any way
our opinion
on the
consolidated financial statements, taken as a whole, and we are not, by communicating the critical audit matter below,
providing
a separate opinion on the critical audit matter or on the accounts or disclosures to
which it relates.
Contingent Liabilities – Litigation and Claims – Refer to Note 18 in the Consolidated
Financial Statements
Critical Audit Matter Description
Cal-Maine Foods, Inc. and Subsidiaries record liabilities for legal proceedings and claims in those instances where they
can reasonably estimate the amount of the loss and when the liability is probable.
Where the reasonable estimate of the probable
loss is a range, Cal-Maine
Foods, Inc. and Subsidiaries record
the most likely estimate of
the loss, or the low end of
the range if
36
there is no one best estimate.
Cal-Maine Foods, Inc. and Subsidiaries either disclose the
amount of a possible loss or
range of loss
in
excess
of
established
accruals
if
estimable,
or
states
that
such
an
estimate
cannot
be
made.
Cal-Maine
Foods,
Inc.
and
Subsidiaries disclose significant
legal proceedings and
claims even where
liability is not
probable or the
amount of the
liability
is not
estimable, or
both, if
Cal-Maine Foods,
Inc. and
Subsidiaries believe
there is
at least
a reasonable
possibility that
a loss
may be incurred.
We identified litigation and claims as a critical
audit matter because of the challenges
auditing management’s judgments
applied
in
determining
the
likelihood
of
loss
related
to
the
resolution
of
such
claims.
Specifically,
auditing
management’s
determination of
whether any
contingent loss
arising from
the related
litigation and
claims is
probable, reasonably
possible or
remote, and the related disclosures, is subjective and requires significant judgment
due to the sensitivity of the issue.
How the Critical Audit Matter was addressed during
the Audit
Addressing the
matter involved
performing procedures
and evaluating
audit evidence
in connection
with forming
our
overall
opinion
on
the
consolidated
financial
statements.
These
procedures
included
testing
the
effectiveness
of
the
controls
relating to the
Cal-Maine Foods, Inc.
and Subsidiaries’ evaluation
of the
liability related
to legal
proceedings and claims,
including
controls over determining the likelihood
of a loss
and whether the amount
of loss can be
reasonably estimated, as well
as financial
statement disclosures over the legal proceedings and claims.
These procedures also included obtaining and evaluating
the letters
of audit inquiry with external
legal counsel, evaluating the reasonableness of
Cal-Maine Foods, Inc. and Subsidiaries’ assessment
regarding
whether
an
unfavorable
outcome
is
reasonably
possible
or
probable
and
reasonably
estimable,
evaluating
the
sufficiency
of Cal-Maine
Foods, Inc.
and Subsidiaries’
disclosures
related
to legal
proceedings and
claims and
evaluating
the
completeness and accuracy of Cal-Maine Foods, Inc. and Subsidiaries’ legal
contingencies.
We have served
as the Company’s auditor since 2007.
Little Rock, Arkansas
July 19, 2022
37
Cal-Maine Foods, Inc. and Subsidiaries
Consolidated Balance Sheets
(in thousands, except for par value amounts)
May 28, 2022
May 29, 2021
Assets
Current assets:
Cash and cash equivalents
$
$
Investment securities available-for-sale
Receivables:
Trade receivables, net
Income tax receivable
Other
Total receivables,
net
Inventories, net
Prepaid expenses and other current assets
Total current
assets
Property, plant &
equipment, net
Finance lease right-of-use asset, net
Operating lease right-of-use asset, net
Investments in unconsolidated entities
Goodwill
Intangible assets, net
Other long-term assets
Total assets
$
$
Liabilities and stockholders' equity
Current liabilities:
Trade accounts payable
$
$
Dividends payable
Accrued wages and benefits
Income tax payable
Accrued expenses and other liabilities
Current portion of finance lease obligation
Current portion of operating lease obligation
Total current
liabilities
Long-term finance lease obligation
Long-term operating lease obligation
Other noncurrent liabilities
Deferred income taxes
Total liabilities
Commitments and contingencies - see
Note 18
—
—
Stockholders’ equity:
Common stock ($
Common stock – authorized
Class A convertible common stock – authorized and issued
Paid-in capital
Retained earnings
Accumulated other comprehensive income (loss), net of tax
(
1,596
)
(
558
)
Common stock in treasury,
at cost –
respectively
(
28,447
)
(
27,433
)
Total Cal-Maine Foods,
Inc. stockholders’ equity
Noncontrolling interest in consolidated equity
(
206
)
Total stockholders’
equity
Total liabilities and stockholders’
equity
$
$
See Notes to Consolidated Financial Statements.
38
Cal-Maine Foods, Inc. and Subsidiaries
Consolidated Statements of Income
(in thousands, except per share amounts)
Fiscal years ended
May 28, 2022
May 29, 2021
May 30, 2020
52 weeks
52 weeks
52 weeks
Net sales
$
$
$
Cost of sales
Gross profit
Selling, general and administrative
(Gain) loss on disposal of fixed assets
(
5,109
)
Operating income (loss)
(
26,264
)
Other income (expense):
Interest expense
(
403
)
(
213
)
(
498
)
Interest income
Patronage dividends
Equity in income of unconsolidated entities
Other, net
Total other income
Income (loss) before income taxes
(
9,949
)
Income tax expense (benefit)
(
12,009
)
Net income
Less:
Net loss attributable to noncontrolling interest
(
209
)
(
63
)
Net income attributable to Cal-Maine Foods, Inc.
$
$
$
Net income per share attributable to Cal-Maine Foods, Inc.:
Basic
$
$
$
Diluted
$
$
$
Weighted average
shares outstanding:
Basic
Diluted
See Notes to Consolidated Financial Statements.
39
Cal-Maine Foods, Inc. and Subsidiaries
Consolidated Statements of
Comprehensive Income
(in thousands)
Fiscal years ended
May 28, 2022
May 29, 2021
May 30, 2020
Net income
$
$
$
Other comprehensive loss, before tax:
Unrealized holding gain (loss) available-for-sale securities, net of
reclassification adjustments
(
1,398
)
(
736
)
Increase in accumulated post-retirement benefits obligation, net of
reclassification adjustments
(
9
)
(
137
)
(
445
)
Other comprehensive loss, before tax
(
1,407
)
(
873
)
(
386
)
Income tax benefit related to items of other comprehensive loss
(
369
)
(
236
)
(
110
)
Other comprehensive loss, net of tax
(
1,038
)
(
637
)
(
276
)
Comprehensive income
Less: comprehensive loss attributable to the noncontrolling interest
(
209
)
(
63
)
Comprehensive income attributable to Cal-Maine Foods, Inc.
$
$
$
See Notes to Consolidated Financial Statements.
40
Cal-Maine Foods, Inc. and Subsidiaries
Consolidated Statements of Stockholders' Equity
(in thousands)
Common Stock
Shares
Amount
Class A
Shares
Class A
Amount
Treasury
Shares
Treasury
Amount
Paid In
Capital
Retained
Earnings
Accum.
Other
Comp.
Income
(loss)
Noncontrolling
Interest
Total
Balance at June 1, 2019
$
$
$
(
25,866
)
$
$
$
$
Stock compensation plan transactions
—
—
—
—
(
79
)
(
808
)
—
—
—
Distributions to noncontrolling interest
partners
—
—
—
—
—
—
—
—
—
(
755
)
(
755
)
Acquisition of noncontrolling interest in
Texas Egg Products,
LLC
—
—
—
—
—
—
—
—
(
2,364
)
(
135
)
Net income (loss)
—
—
—
—
—
—
—
—
(
63
)
Other comprehensive loss, net of tax
—
—
—
—
—
—
—
—
(
276
)
—
(
276
)
Balance at May 30, 2020
—
(
26,674
)
—
Impact of ASC 326, see Note 1
—
—
—
—
—
—
—
—
—
Balance at May 31, 2020
(
26,674
)
—
Stock compensation plan transactions
—
—
—
—
(
85
)
(
759
)
—
—
Dividends
—
—
—
—
—
—
—
(
1,652
)
—
—
(
1,652
)
Contributions
—
—
—
—
—
—
—
—
—
Net income
—
—
—
—
—
—
—
—
—
Other comprehensive loss, net of tax
—
—
—
—
—
—
—
—
(
637
)
(
637
)
Balance at May 29, 2021
(
27,433
)
(
558
)
Stock compensation plan transactions
—
—
—
—
(
81
)
(
1,014
)
—
—
—
Dividends
—
—
—
—
—
—
—
(
42,773
)
—
—
(
42,773
)
Contributions
—
—
—
—
—
—
—
—
—
Net income (loss)
—
—
—
—
—
—
—
—
(
209
)
Other comprehensive loss, net of tax
—
—
—
—
—
—
—
—
(
1,038
)
—
(
1,038
)
Balance at May 28, 2022
$
$
$
(
28,447
)
$
$
$
(
1,596
)
$
(
206
)
$
See Notes to Consolidated Financial Statements.
41
Cal-Maine Foods, Inc. and Subsidiaries
Consolidated Statements of Cash Flows
(in thousands)
Fiscal year ended
May 28, 2022
May 29, 2021
May 30, 2020
Cash flows from operating activities:
Net income
$
$
$
Adjustments to reconcile net income to net cash provided by operating
activities:
Depreciation and amortization
Deferred income taxes
Equity in income of affiliates
(
1,943
)
(
622
)
(
534
)
(Gain) Loss on disposal of property,
plant and equipment
(
5,109
)
Impairment loss on fixed assets
Stock compensation expense, net of amounts paid
Unrealized losses on investments
(
745
)
Gains on sales of investments
(
2,208
)
(
22
)
(
611
)
Purchases of equity securities
(
334
)
(
275
)
Sales of equity securities
Amortization of investments
Gain on change in fair value of investment in affiliates
(
4,545
)
Other
(
109
)
(
427
)
(
248
)
Change in operating assets and liabilities, net of effects from acquisitions:
Increase in receivables and other assets
(
97,722
)
(
33,487
)
(
28,300
)
Increase in inventories
(
36,152
)
(
31,159
)
(
9,704
)
Increase (decrease) in accounts payable, accrued expenses and other
liabilities
(
1,412
)
Net cash provided by operating activities
Cash flows from investing activities:
Purchases of investments
(
98,243
)
(
88,283
)
(
107,234
)
Sales of investments
Acquisition of businesses, net of cash acquired
(
44,823
)
(
44,650
)
Investment in unconsolidated entities
(
3,000
)
Distributions from unconsolidated entities
Purchases of property,
plant and equipment
(
72,399
)
(
95,069
)
(
124,178
)
Net proceeds from disposal of property,
plant and equipment
Net cash used in investing activities
(
117,021
)
(
44,191
)
(
61,365
)
Cash flows from financing activities:
Principal payments on long-term debt
(
1,500
)
Principal payments on finance lease
(
215
)
(
205
)
(
196
)
Distributions to noncontrolling interest partners
(
755
)
Purchase of common stock by treasury
(
1,127
)
(
871
)
(
910
)
Payments of dividends
(
6,117
)
(
1,652
)
Contributions
Net cash used in financing activities
(
7,456
)
(
2,723
)
(
3,361
)
Increase (decrease) in cash and cash equivalents
(
20,778
)
Cash and cash equivalents at beginning of year
Cash and cash equivalents at end of year
$
$
$
Supplemental information:
Cash paid for operating leases
$
$
$
Income taxes paid
$
$
$
Interest paid
$
$
$
See Notes to Consolidated Financial Statements.
42
Cal-Maine Foods, Inc. and Subsidiaries
Notes to Consolidated Financial Statements
Note 1 - Summary of Significant Accounting Policies
Nature of Operations
Cal-Maine Foods, Inc. (“we,”
“us,” “our,” or the
“Company”) is primarily
engaged in the
production, grading, packing and
sale of
fresh shell eggs, including nutritionally-enhanced, cage-free,
organic, free-range, pasture-raised and brown
eggs. The Company,
which is headquartered
in Ridgeland, Mississippi, is the
largest producer
and distributor of fresh
shell eggs in the
United States
and sells the majority
of its shell
eggs in states
across the
southwestern, southeastern,
mid-western and
mid-Atlantic regions
of
the United States.
Principles of Consolidation
The consolidated financial statements include
the accounts of all wholly-owned
subsidiaries and of majority-owned subsidiaries
over which we exercise control. All significant intercompany transactions and
accounts have been eliminated in consolidation.
Fiscal Year
The Company’s fiscal year-end is on the Saturday closest to May 31. Each of the year-to-date periods
ended
May 28, 2022
, May
29, 2021, and May 30, 2020, included
Use of Estimates
The preparation of the consolidated
financial statements in conformity with
generally accepted accounting principles
("GAAP")
in the United States of America requires management to make
estimates and assumptions that affect the amounts
reported in the
consolidated financial statements and accompanying notes. Actual results could
differ from those estimates.
Cash Equivalents
The
Company
considers
all
highly
liquid
investments
with
a
maturity
of
three
months
or
less
when
purchased
to
be
cash
equivalents.
We
maintain
bank
accounts
that
are
insured
by
the
Federal
Deposit
Insurance
Corporation
up
to
$250,000. The
Company
routinely
maintains
cash
balances
with
certain
financial
institutions
in
excess
of
federally
insured
amounts.
The
Company has not experienced any loss in such accounts. The Company manages this risk through maintaining cash deposits and
other highly liquid investments in high quality financial institutions.
We
primarily utilize a
cash management system
with a series of
separate accounts consisting
of lockbox accounts
for receiving
cash, concentration
accounts to which
funds are moved,
and zero-balance disbursement
accounts for funding
accounts payable.
Checks issued,
but not
presented to
the banks
for payment,
may result
in negative
book cash
balances,
which are
included in
accounts payable. At May 29,
2021, checks outstanding in excess
of related book cash
balances totaled $
Investment Securities
Our investment
securities are
accounted
for in
accordance with
ASC 320,
“Investments -
Debt and
Equity Securities”
(“ASC
320”). The Company considers its debt securities for
which there is a determinable fair market
value, and there are no restrictions
on the Company's ability to sell within the next 12 months,
as available-for-sale. We classify
these securities as current, because
the amounts
invested are
available for current
operations. Available
-for-sale securities are
carried at fair
value, with unrealized
gains and losses
reported as a separate
component of stockholders’ equity. The Company regularly
evaluates changes to the
rating
of its debt
securities by credit
agencies and economic
conditions to assess
and record any
expected credit losses
through allowance
for credit losses, limited to the amount that
fair value was less than the amortized cost
basis.
The cost basis for realized gains and
losses on available-for-sale securities
is determined by the
specific identification method. Gains
and losses are
recognized in other
income (expenses) as Other, net in the
Company's Consolidated Statements of Income. Investments
in mutual funds are classified
as “Other long-term assets” in the Company’s
Consolidated Balance Sheets.
Trade Receivables
Trade
receivables are
stated at
their carrying
values, which
include a
reserve for
credit losses.
At May
28, 2022
and May
29,
2021, reserves for credit losses
were $
43
based
on
an
evaluation
of
each
customer's
financial
condition
and
credit
history.
Collateral
is
generally
not
required.
The
Company
minimizes exposure
to counter
party credit
risk through
credit analysis
and approvals,
credit limits,
and monitoring
procedures.
In
determining
our
reserve
for
credit
losses,
receivables
are
assigned
an
expected
loss
based
on
historical
loss
information
adjusted
as
needed
for
economic
and
other
forward-looking
factors.
At
May
28,
2022
and
May
29,
2021,
customer accounted for approximately
% and
% of the Company’s trade accounts receivable,
respectively.
Inventories
Inventories of eggs, feed,
supplies and flocks
are valued principally
at the lower
of cost (first-in,
first-out method) or
net realizable
value.
The
cost
associated
with
flocks,
consisting
principally
of
chicks,
feed,
labor,
contractor
payments
and
overhead
costs,
are
accumulated during a growing period
of approximately
lives of the flocks, generally
one
. Flock mortality is charged to cost of sales as incurred.
The
Company
does
not
disclose
the
gross
cost
and
accumulated
amortization
with
respect
to
its
flock
inventories
since
this
information is not utilized by management in the operation of the Company.
Property,
Plant and Equipment
Property,
plant and equipment
are stated at
cost. Depreciation is
provided by the
straight-line method over
the estimated useful
lives, which
are
maintenance are expensed as incurred.
Expenditures that increase the
value or productive capacity of
assets are capitalized. When
property,
plant, and
equipment are
retired, sold,
or otherwise
disposed of,
the asset’s
carrying amount
and related
accumulated
depreciation are removed from the accounts and any gain or loss is included in operations. The Company capitalizes interest cost
incurred on funds used to construct property, plant, and equipment
as part of the asset to which it relates and amortizes such cost
over the asset’s
estimated useful life. When
certain events or changes
in operating conditions occur,
asset lives may be adjusted
and an impairment assessment may be performed on the recoverability
of the carrying amounts.
Leases
The Company
determines if
an arrangement
is a lease
at inception
of the
arrangement and
classifies it as
an operating
lease or
finance lease. We recognize the right to use an underlying
asset for the lease term as a right-of-use ("ROU") asset on our balance
sheet. A lease liability is recorded to represent our obligation to
make lease payments over the term of the lease. These
assets and
liabilities are included
in our Consolidated Balance
Sheet in Finance lease
right-of-use asset, Operating
lease right-of-use asset,
Current portion of finance lease
obligation, Current portion of operating lease
obligation, Long-term finance lease obligation, and
Long-term operating lease obligation.
The Company records ROU
assets and lease obligations
based on the discounted
future minimum lease payments
over the term
of the lease. When the
rate implicit in the lease is
not easily determinable,
the Company’s incremental
borrowing rate is used to
calculate the present value of the future lease payments. The Company elected not to
recognize ROU assets and lease obligations
for leases with an initial term of 12 months or less. Lease expense for operating
leases is recognized on a straight-line basis over
the lease term.
Investments in Unconsolidated Entities
The equity method
of accounting is
used when the
Company has a
20% to 50%
interest in other
entities or when
the Company
exercises significant
influence over
the entity.
Under the
equity method,
original investments
are recorded
at cost and
adjusted
by the Company’s
share of undistributed earnings or losses of these entities. Nonmarketable
investments in which the Company
has less than a
20% interest and in
which it does not
have the ability to
exercise significant influence over the
investee are initially
recorded at cost, and periodically reviewed for impairment.
Goodwill
Goodwill
represents
the
excess
of
the
purchase
price
over
the
fair
value
of
the
identifiable
net
assets
acquired.
Goodwill
is
evaluated for impairment annually by first performing a qualitative assessment to determine whether a quantitative goodwill test
is necessary.
After assessing the totality
of events or circumstances,
if we determine it is
more likely than not
that the fair value
of a reporting
unit is less
than its carrying
amount, then we
perform additional
quantitative tests to
determine the
magnitude of
any impairment.
44
Intangible Assets
Included in other intangible assets are separable intangible assets acquired in business acquisitions, which include franchise fees,
non-compete agreements
and customer
relationship intangibles.
They are
amortized over
their estimated useful
lives of
years. The
gross
cost
and
accumulated
amortization
of
intangible
assets
are
removed
when
the
recorded
amounts
are
fully
amortized and
the asset is
no longer
in use or
the contract
has expired.
When certain
events or changes
in operating
conditions
occur, asset lives may
be adjusted and an
impairment assessment may be
performed on the recoverability
of the carrying amounts.
Accrued Self Insurance
We use
a combination of insurance
and self-insurance mechanisms to provide
for the potential liabilities for
health and welfare,
workers’ compensation,
auto liability
and general
liability risks.
Liabilities associated
with our
risks retained
are estimated,
in
part, by considering claims experience, demographic factors, severity
factors and other actuarial assumptions.
Treasury Stock
Treasury
stock purchases
are accounted
for under
the cost
method whereby
the entire
cost of
the acquired
stock is
recorded as
treasury
stock. The
grant
of
restricted
stock
through
the
Company’s
share-based
compensation
plans
is
funded
through
the
issuance of
treasury stock. Gains
and losses
on the
subsequent reissuance
of shares
in accordance
with the
Company’s
share-
based compensation plans are credited or charged to paid-in
capital in excess of par value using the average-cost method.
Revenue Recognition and Delivery Costs
Revenue recognition is completed upon satisfaction of the performance obligation to the customer, which typically occurs within
days of
the Company
and customer
agreeing upon
the order.
See
policy.
The Company believes
the performance obligation
is met upon delivery
and acceptance of
the product by
our customers. Costs
to deliver
product to
customers are
included in selling,
general and
administrative expenses
in the
accompanying Consolidated
Statements
of
Income.
Sales
revenue
reported
in
the
accompanying
consolidated
statements
of
income
is
reduced
to
reflect
estimated returns
and allowances.
The Company
records an
estimated sales
allowance for
returns and
discounts at
the time
of
sale using historical trends based on actual sales returns and sales.
Advertising Costs
The Company expensed advertising
costs as incurred of $
2020, respectively.
Income Taxes
Income
taxes
are
accounted
for
using
the
liability
method.
Deferred
income
taxes
reflect
the
net
tax
effects
of
temporary
differences
between
the
carrying
amounts
of
assets
and
liabilities
for
financial
reporting
purposes
and
the
amounts
used
for
income tax purposes. The
Company’s policy with respect
to evaluating
uncertain tax
positions is
based upon whether
management
believes it
is more
likely than
not the
uncertain
tax positions
will be
sustained upon
review by
the taxing
authorities. The
tax
positions must meet the more-likely-than-not
recognition threshold with consideration
given to the amounts and
probabilities of
the outcomes
that could
be realized
upon settlement
using the
facts, circumstances
and information
at the
reporting
date. The
Company
will reflect
only
the portion
of the
tax benefit
that will
be
sustained
upon resolution
of the
position
and
applicable
interest on the portion of the tax benefit not recognized. The Company initially and subsequently measures the largest
amount of
tax benefit
that is
greater than
50% likely
to be
realized upon
settlement with
a taxing
authority that
has full
knowledge of
all
relevant
information. The
Company
records
interest
and
penalties on
uncertain
tax
positions
as
a
component
of
income
tax
expense. Based
upon management’s
assessment, there
are no uncertain
tax positions expected
to have a
material impact on
the
Company’s consolidated
financial statements.
Stock Based Compensation
We account for share-based compensation in accordance with ASC 718, Compensation-Stock Compensation (“ASC 718”). ASC
718 requires
all share-based
payments to
employees and
directors, including
grants of
employee stock
options, restricted
stock
and
performance-based
shares, to
be
recognized
in
the statement
of income
based
on their
fair
values.
ASC 718
requires the
45
benefits of tax deductions in
excess of recognized compensation cost to
be reported as a financing cash
flow. See
Business Combinations
The Company applies the acquisition
method of accounting, which
requires that once control is obtained,
all the assets acquired
and liabilities assumed,
including amounts
attributable to noncontrolling
interests, are recorded
at their respective
fair values at
the date of
acquisition. The
fair values of
identifiable assets
and liabilities are
determined internally
and requires
estimates and
the
use
of
various
valuation
techniques.
When
a
market
value
is
not
readily
available,
our
internal
valuation
methodology
considers the remaining estimated life of the assets acquired and
what management believes is the market value for those assets.
We
typically use the income
method approach for
intangible assets acquired in
a business combination. Significant
estimates in
valuing certain intangible assets include, but
are not limited to,
the amount and timing of
future cash flows, growth rates,
discount
rates and useful
lives. The excess
of the purchase
price over fair
values of identifiable
assets and liabilities
is recorded as
goodwill.
Loss Contingencies
Certain conditions may exist as of the date the financial statements are issued that may result in a loss to the Company but which
will only be
resolved when one
or more future
events occur or
fail to occur.
The Company’s
management and
its legal counsel
assess
such
contingent
liabilities,
and
such
assessment
inherently
involves
an
exercise
of
judgment.
In
assessing
loss
contingencies
related
to legal
proceedings
that are
pending against
the Company
or unasserted
claims that
may result
in such
proceedings, the Company’s
legal counsel evaluates
the perceived merits
of any legal
proceedings or unasserted
claims as well
as the perceived merits of the amount of relief sought or expected to be
sought therein.
If the assessment
of a contingency
indicates it is
probable that
a material loss
has been incurred
and the amount
of the liability
can be
estimated, the
estimated liability
would be accrued
in the Company’s
financial statements.
If the assessment
indicates a
potentially material loss contingency is
not probable, but is reasonably possible,
or is probable but cannot be estimated,
then the
nature of the
contingent liability,
together with an
estimate of the
range of possible
loss if determinable
and material, would
be
disclosed. Loss
contingencies considered
remote are
generally not
disclosed unless
they involve
guarantees, in
which case
the
nature of the guarantee would be disclosed.
The Company expenses the costs of litigation as they are incurred.
New Accounting Pronouncements and Policies
Effective
May
31,
2020,
the
Company
adopted
ASU
2016-13,
Financial
Instruments
–
Credit
Losses
(Topic
326),
which
is
intended
to
improve
financial
reporting
by
requiring
more
timely
recording
of
credit
losses
on
loans
and
other
financial
instruments held by financial institutions and other organizations.
The guidance replaces the prior “incurred loss” approach with
an “expected
loss” model
and requires
measurement of
all expected
credit losses
for financial
assets held
at the
reporting date
based on historical experience, current conditions, and reasonable and supportable forecasts. The
Company adopted the guidance
on a modified retrospective basis through a cumulative effect adjustment to retained earnings as of the beginning of the period of
adoption. The Company evaluated
its current methodology of estimating
allowance for doubtful accounts and
the risk profile of
its receivables portfolio and developed a model that includes the qualitative and forecasting aspects of the “expected loss” model
under the amended guidance. The Company finalized its assessment of the impact of the amended guidance and recorded a $
thousand cumulative increase to retained earnings at May 31, 2020.
No other new
accounting pronouncement
issued or effective
during the fiscal
year had or
is expected to
have a material
impact
on our Consolidated Financial Statements.
46
Note 2 – Acquisition
Effective on May 30, 2021, the Company acquired the remaining
% membership interest in Red River Valley
Egg Farm, LLC
(“Red River”),
including certain
liabilities. As
a result
of the
acquisition, Red
River became
a wholly
owned subsidiary
of the
Company. Red River owns and
operates a specialty
shell egg production
complex with approximately
hens,
cage-free
pullet capacity,
feed
mill, processing
plant, related
offices
and outbuildings
and
related
equipment located
on
approximately
The
following
table
summarizes
the
consideration
paid
for
Red
River
and
the
amounts
of
the
assets
acquired
and
liabilities
assumed recognized at the acquisition date:
Cash consideration paid
$
Fair value of the Company's equity interest in Red River held before the business combination
$
Recognized amounts of identifiable assets acquired and liabilities assumed
Cash
$
Accounts receivable, net
Inventory
Property, plant and equipment
Liabilities assumed
(
2,448
)
Deferred income taxes
(
8,481
)
Total identifiable
net assets
Goodwill
$
Cash and accounts receivable acquired along with liabilities
assumed were valued at their carrying
value which approximates fair
value due to the short maturity of these instruments.
Inventory consisted
primarily of
flock, feed
ingredients, packaging,
and egg
inventory.
Flock inventory
was valued at
carrying
value as management
believes that their
carrying value best
approximates their
fair value. Feed
ingredients, packaging
and egg
inventory were all valued based on market prices as of May 30, 2021.
Property,
plant and
equipment were
valued utilizing
the cost
approach which
is based
on replacement
or reproduction
costs of
the assets and subtracting any depreciation resulting from physical deterioration
and/or functional or economic obsolescence.
The Company recognized a gain of $
% equity interest in Red River held
before
the
business
combination.
The
gain
was
recorded
in
other
income
and
expense
under
the
heading
“Other,
net”
in
the
Company’s Condensed Consolidated Statements of Income. The acquisition
of Red River resulted
in a discrete tax
benefit of $
million,
which
includes
a
$
investment in Red River, with a corresponding non-recurring,
non-cash $
taxable remeasurement gain associated with the acquisition. As part of the acquisition accounting, the Company also
recorded an
$
recognition of deferred
tax liabilities resulted in
the recognition of goodwill.
None of the goodwill
recognized is expected
to be
deductible for income tax purposes.
47
Note 3 - Investment Securities
The following presents the Company’s
investment securities as of May 28, 2022 and May 29, 2021 (in thousands):
May 28, 2022
Amortized
Cost
Unrealized
Gains
Unrealized
Losses
Estimated Fair
Value
Municipal bonds
$
$
$
$
Commercial paper
Corporate bonds
Certificates of deposits
US government and agency obligations
Asset backed securities
Total current
investment securities
$
$
$
$
Mutual funds
$
$
$
$
Total noncurrent
investment securities
$
$
$
$
May 29, 2021
Amortized
Cost
Unrealized
Gains
Unrealized
Losses
Estimated Fair
Value
Municipal bonds
$
$
$
$
Commercial paper
Corporate bonds
Certificates of deposits
Asset backed securities
Total current
investment securities
$
$
$
$
Mutual funds
$
$
$
$
Total noncurrent
investment securities
$
$
$
$
Available-for-sale
Proceeds
from
the
sales and
maturities
of
available-for-sale
securities
were
$
during fiscal 2022, 2021, and 2020, respectively. Gross realized gains for fiscal 2022, 2021, and 2020 were $
thousand,
and
$
thousand, and $
Actual maturities may differ from contractual maturities because some
borrowers have the right to
call or prepay obligations with
or
without
call
or
prepayment
penalties.
Contractual
maturities
of
investment
securities
at
May
28,
2022
are
as
follows
(in
thousands):
Estimated Fair Value
Within one year
$
1-5 years
Total
$
Noncurrent
Proceeds from sales and maturities of noncurrent investment securities were $
fiscal 2022,
2021 and
2020, respectively.
Gross realized
gains on
those sales
and maturities
during fiscal
2022 and
2021 were
$
Note 4 - Fair Value
Measures
The Company
is required
to categorize
both financial
and nonfinancial
assets and
liabilities based
on the
following fair
value
hierarchy. The
fair value
of an
asset is
the price
at which
the asset
could be
sold in
an orderly
transaction between
unrelated,
48
knowledgeable, and willing
parties able to engage in
the transaction. A liability’s
fair value is defined
as the amount that would
be paid to transfer the liability to a new obligor in a transaction between such parties, not the amount that would be
paid to settle
the liability with the creditor.
●
Level 1
●
Level 2
directly or indirectly,
including:
o
Quoted prices for similar assets or liabilities in active markets
o
Quoted prices for identical or similar assets in non-active markets
o
Inputs other than quoted prices that are observable for the asset or liability
o
Inputs derived principally
from or corroborated by other observable market data
●
Level 3
to the fair value of the assets or liabilities
The disclosure of fair value of certain financial assets and liabilities recorded
at cost are as follows:
Cash and cash equivalents, accounts receivable,
and accounts payable:
short maturity of these instruments.
Lease obligations:
Assets and Liabilities Measured at Fair
Value
on a Recurring Basis
In accordance with
the fair value hierarchy
described above, the
following table shows the
fair value of our
financial assets and
liabilities that are required to be measured at fair value on a recurring basis
as of May 28, 2022 and May 29, 2021 (in thousands):
May 28, 2022
Level 1
Level 2
Level 3
Balance
Assets
Municipal bonds
$
$
$
$
Commercial paper
Corporate bonds
Certificates of deposits
US government and agency obligations
Asset backed securities
Mutual funds
Total assets measured at fair
value
$
$
$
$
May 29, 2021
Level 1
Level 2
Level 3
Balance
Assets
Municipal bonds
$
$
$
$
Commercial paper
Corporate bonds
Certificates of deposits
Asset backed securities
Mutual funds
Total assets measured at fair
value
$
$
$
$
Investment securities – available-for-sale
classified as Level
2 consist of
securities with maturities of
three months or longer
when
purchased. We
classified these
securities as
current, because
amounts invested
are available
for current
operations. Observable
inputs for these securities are yields, credit risks, default rates, and volatility.
49
Note 5 - Inventories
Inventories consisted of the following (in thousands):
May 28, 2022
May 29, 2021
Flocks, net of amortization
$
$
Eggs and egg products
Feed and supplies
$
$
We grow and maintain
flocks of layers (mature female chickens), pullets (female chickens under 18 weeks of age), and breeders
(male and female chickens used
to produce fertile eggs to
hatch for egg production flocks).
Our total flock at May
28, 2022 and
May 29, 2021,
consisted of approximately
layers, respectively.
The Company expensed amortization and mortality associated with the
flocks to cost of sales as follows (in thousands):
May 28, 2022
May 29, 2021
May 30, 2020
Amortization
$
$
$
Mortality
Total flock costs charged
to cost of sales
$
$
$
Note 6 - Property,
Plant and Equipment
Property, plant and equipment
consisted of the following (in thousands):
May 28, 2022
May 29, 2021
Land and improvements
$
$
Buildings and improvements
Machinery and equipment
Construction-in-progress
Less: accumulated depreciation
$
$
Depreciation expense was $
and May 30, 2020, respectively.
The Company
maintains insurance
for both
property damage
and business
interruption relating
to catastrophic
events, such
as
fires. Insurance recoveries
received for
property damage
and business
interruption in
excess of
the net
book value
of damaged
assets, clean-up and
demolition costs, and
post-event costs are
recognized as income
in the period
received or committed
when
all contingencies
associated with the
recoveries are
resolved. Gains on
insurance recoveries
related to business
interruption are
recorded within “Cost of sales” and any gains or losses related to property damage are recorded
within “(Gains) loss on disposal
of fixed assets.” Insurance recoveries related to business interruption are classified as
operating cash flows and recoveries related
to property
damage are classified
as investing cash
flows in
the statement of
cash flows. Insurance
claims incurred
or finalized
during the fiscal
years ended May
28, 2022, May
29, 2021, and
May 30, 2020
did not have
a material effect
on the Company's
consolidated financial statements.
Note 7 - Investment in Unconsolidated Entities
As of
May 28,
2022 and
May 29,
2021, the
Company owned
% in
Specialty Eggs,
LLC ("Specialty
Eggs") and
Southwest
Specialty Eggs,
LLC ("Southwest
Specialty Eggs"),
which are
accounted for
using the
equity method
of accounting.
Specialty
Eggs owns the Egg-Land's Best franchise for most of Georgia and South Carolina, as well as
a portion of western North Carolina
and eastern Alabama. Southwest Specialty
Eggs owns the Egg-Land's Best franchise
for Arizona, southern California
and Clark
County, Nevada (including
Las Vegas).
50
As of May
29, 2021, the
Company owned
% in Red
River which was
acquired at the
beginning of
fiscal 2022 (see
). The Company accounted for Red River using the equity method of
accounting in fiscal 2021.
Equity method investments are included
in “Investments in unconsolidated entities”
in the accompanying Consolidated Balance
Sheets and totaled $
Equity
in
income
of
unconsolidated
entities
of
$
included in the Consolidated Statements of Income for fiscal 2022
,
2021, and 2020, respectively.
The condensed consolidated financial
information for the
Company's unconsolidated joint
ventures was as
follows (in thousands):
For the fiscal year ended
May 28, 2022
May 29, 2021
May 30, 2020
Net sales
$
$
$
Net income
Total assets
Total liabilities
Total equity
The
Company
is
a
member
of
Eggland’s
Best,
Inc.
(“EB”),
which
is
a
cooperative. At
May
28,
2022
and
May
29,
2021,
“Investments
in
unconsolidated
entities”
as
shown
on
the
Company’s
Consolidated
Balance
Sheet
includes
the
cost
of
the
Company’s
investment in EB plus
any qualified written
allocations. The Company
cannot exert significant
influence over EB’s
operating
and financial
activities; therefore,
the Company
accounts for
this investment
using the
cost method.
As of
May 28,
2022 and May 29, 2021, the carrying value of this investment was $
The following relates to the Company’s
transactions with these unconsolidated affiliates (in thousands):
For the fiscal year ended
May 28, 2022
May 29, 2021
May 30, 2020
Sales to unconsolidated entities
$
$
$
Purchases from unconsolidated entities
Distributions from unconsolidated entities
May 28, 2022
May 29, 2021
Accounts receivable from unconsolidated entities
$
Accounts payable to unconsolidated entities
Note 8 - Goodwill and Other Intangible Assets
Goodwill and other intangibles consisted of the following (in thousands):
Other Intangibles
Franchise
Customer
Non-compete
Right of
Water
Total
Goodwill
rights
relationships
agreements
Use
rights
Trademark
intangibles
Balance May 30, 2020
$
$
$
$
$
$
$
$
Additions
—
—
Amortization
—
(
1,628
)
(
666
)
(
160
)
(
10
)
—
(
50
)
(
2,514
)
Balance May 29, 2021
Additions
—
Amortization
—
(
1,628
)
(
362
)
(
159
)
(
21
)
—
(
50
)
(
2,220
)
Balance May 28, 2022
$
$
$
$
$
$
$
$
51
For the Other Intangibles listed above, the gross carrying amounts and
accumulated amortization are as follows (in thousands):
May 28, 2022
May 29, 2021
Gross carrying
Accumulated
Gross carrying
Accumulated
amount
amortization
amount
amortization
Other intangible assets:
Franchise rights
$
$
(
14,213
)
$
$
(
10,957
)
Customer relationships
(
8,318
)
(
18,190
)
Non-compete agreements
(
590
)
(
271
)
Right of use intangible
(
221
)
(
191
)
Water rights *
—
—
Trademark
(
264
)
(
164
)
Total
$
$
(
23,606
)
$
$
(
29,773
)
*
Water rights are
an indefinite life intangible asset.
No significant residual value is estimated for these
intangible assets. Aggregate amortization expense for fiscal years 2022, 2021,
and 2020 totaled $
The following table presents the total estimated amortization of intangible
assets for the five succeeding years (in thousands):
For fiscal year
Estimated amortization expense
2023
$
2024
2025
2026
2027
Thereafter
Total
$
Note 9 - Employee Benefit Plans
The Company maintains a medical plan that is qualified under Section
401(a) of the Internal Revenue Code and is not subject to
tax under present income tax laws. The plan is funded by contributions from the Company and its employees. Under its plan, the
Company
self-insures
its
portion
of
medical
claims
for
substantially
all
full-time
employees. The
Company
uses
stop-loss
insurance
to
limit
its
portion
of
medical
claims
to
$
incurred but not
reported claims were approximately
$
and 2020, respectively.
The liability recorded
for incurred but
not reported claims
was $
28,
2022
and
May
29,
2021,
respectively
and
are
classified
as
“Accrued
expenses
and
other
liabilities”
in
the
Company’s
Consolidated Balance Sheets.
The Company
has a KSOP
plan that
covers substantially
all employees
(the “Plan”). The
Company makes
contributions to
the
Plan at a rate of
% of participants' eligible compensation, plus an additional amount determined at the discretion of the
Board of
Directors. Contributions
can
be
made
in
cash
or
the
Company's
Common
Stock,
and
vest
immediately. The
Company's
cash
contributions to the Plan were $
did
t
make
direct
contributions
of
the
Company’s
Common
Stock
in
fiscal
years
2022,
2021,
or
2020.
Dividends
on
the
Company’s Common Stock are paid to the Plan in cash. The Plan acquires the Company’s Common Stock, which is listed on the
NASDAQ, by using the dividends and the Company’s
cash contribution to purchase shares in the public markets.
The Plan sells
Common Stock on
the NASDAQ to pay
benefits to Plan participants.
Participants may make
contributions to the Plan
up to the
maximum allowed by the Internal Revenue Service regulations. The
Company does not match participant contributions.
The
Company
has
deferred
compensation
agreements
with
certain
officers
for
payments
to
be
made
over
specified
periods
beginning when the officers
reach age
upon
deferred
compensation
earned
over
the
estimated
remaining
service
period
of
each officer.
Payments
made
under
these
agreements
were $
related to these agreements was $
52
Effective
December
1,
2021,
the
Company
amended
and
restated
its
deferred
compensation
plan
(the
“Amended
DC Plan”).
The Amended DC Plan,
expanded eligibility for participation
from named officers only
to a select
group of management or
highly
compensated employees of the
Company,
expanded the investment options
available and added the
ability of participants to
make
elective deferrals.
The awards
issued under
the Amended
DC Plan
were $
fiscal 2022,
2021, and 2020,
respectively. Payments
made under
the Amended
DC Plan were
$
in fiscal 2022 and 2021, respectively. The liability
recorded for the Amended DC Plan was $
28, 2022 and May 29, 2021, respectively.
Deferred compensation expense for
both plans totaled $
2020,
respectively.
Postretirement Medical Plan
The Company
maintains an
unfunded postretirement
medical plan to
provide limited
health benefits to
certain qualified
retired
employees
and officers.
Retired non-officers
and
spouses are
eligible for
coverage
until attainment
of Medicare
eligibility,
at
which time coverage
ceases. Retired officers
and spouses
are eligible for
lifetime benefits under
the plan. Officers,
who retired
prior to May 1, 2012 and their spouses must participate in Medicare
Plans A and B. Officers, who retire on or after May 1, 2012
and their spouses must participate in Medicare Plans A, B, and D.
The plan is accounted for
in accordance with ASC
715, Compensation – Retirement Benefits (“ASC
715”), whereby an employer
recognizes the funded status of a defined benefit postretirement plan as
an asset or liability, and recognizes changes in the funded
status in the year the change occurs through comprehensive income. Additionally,
this expense is recognized on an accrual basis
over the employees’ approximate period of employment. The liability associated with the plan was $
at
May
28,
2022
and
May
29,
2021,
respectively.
The
remaining
disclosures
associated
with
ASC
715
are
immaterial
to
the
Company’s financial statements.
Note 10 - Credit Facility
For fiscal years 2022, 2021 and 2020, interest was $
On November 15, 2021, we entered into an Amended and Restated Credit Agreement (the “Credit
Agreement”) with a
five
-year
term. The Credit Agreement amended and restated the Company’s previously existing credit agreement dated July 10, 2018. The
Credit Agreement
provides for an
increased senior
secured revolving credit
facility (the
“Credit Facility” or
“Revolver”), in
an
initial aggregate principal amount of up to $
of credit and
a $
the consent
of BMO
Harris Bank
N.A. (the
“Administrative Agent”),
an increase
in the
Credit Facility
in the
aggregate up
to
$
commitments under the
Revolver.
fiscal 2022 or fiscal 2021. The Company had $
at May 28, 2022.
The
interest
rate
in
connection
with
loans
made
under
the
Credit
Facility
is
based
on,
at
the
Company’s
election,
either
the
Eurodollar
Rate
plus
the
Applicable
Margin
or
the
Base
Rate
plus
the
Applicable
Margin.
The
“Eurodollar
Rate”
means
the
reserve adjusted rate at which Eurodollar deposits in the London interbank market for an interest period of
one
,
two
,
three
,
six
twelve
of (a) the federal funds rate plus
% per annum, (b) the prime rate of interest established by the Administrative Agent, and (c)
the Eurodollar Rate for an
interest period of
one
% per annum, subject to
certain interest rate floors. The
“Applicable
Margin” means
% to
% per annum
for Base Rate
Loans and
% to
% per annum
for Eurodollar Rate
Loans, in
each
case
depending
upon
the Total
Funded
Debt
to
Capitalization
Ratio
for
the
Company
at
the
quarterly
pricing
date. The
Company will pay a commitment fee on the unused portion of the Credit Facility payable quarterly from
% to
% in each
case depending
upon the
Total
Funded Debt
to Capitalization
Ratio for
the Company
at the
quarterly pricing
date. The
Credit
Agreement contains customary provisions regarding replacement of
the Eurodollar Rate.
The
Credit
Facility
is
guaranteed
by
all the
current
and
future wholly-owned
direct
and
indirect
domestic
subsidiaries
of
the
Company (the
“Guarantors”), and
is secured
by a
first-priority perfected
security interest
in substantially
all of
the Company’s
and the Guarantors’ accounts, payment intangibles, instruments (including promissory notes), chattel paper, inventory (including
farm products) and deposit accounts maintained with the Administrative Agent.
53
The
Credit
Agreement
for the
Credit
Facility
contains
customary
covenants,
including
restrictions
on
the incurrence
of
liens,
incurrence of
additional debt,
sales of
assets and
other fundamental
corporate changes
and investments.
The Credit
Agreement
requires maintenance of two financial covenants: (i) a maximum Total Funded Debt to Capitalization Ratio tested
quarterly of no
greater than
%; and (ii) a requirement to maintain Minimum
Tangible Net
Worth at
all times of $
% of net
income
(if
net
income
is
positive)
less
permitted
restricted
payments
for
each
fiscal
quarter
after
November
27,
2021.
Additionally,
the Credit Agreement
requires that Fred
R. Adams Jr.’s
spouse, natural children,
sons-in-law or grandchildren,
or
any trust,
guardianship, conservatorship
or custodianship
for the primary
benefit of any
of the foregoing,
or any family
limited
partnership, similar limited liability
company or other entity
that
% of the voting control
of such entity is held
by any of the
foregoing, shall maintain
at least
% of the Company's
voting stock. Failure
to satisfy any of
these covenants will constitute
a
default under the terms of
the Credit Agreement. Further,
under the terms of the Credit
Agreement, payment of dividends under
the
Company's
current
dividend
policy
of
one-third
of
the
Company's
net
income
computed
in
accordance
with
GAAP
and
payment of other
dividends or repurchases
by the Company
of its capital stock
is allowed, as long
as after giving
effect to such
dividend
payments or
repurchases no
default has
occurred and
is continuing
and
the sum
of cash
and cash
equivalents of
the
Company and its subsidiaries plus availability under the Credit Facility equals at least $50
million.
The Credit
Agreement also
includes customary
events of
default and
customary remedies
upon the
occurrence of
an event
of
default, including acceleration
of the amounts
due under the Credit
Facility and foreclosure
of the collateral
securing the Credit
Facility.
At May 28, 2022, we were in compliance with the covenant requirements of
the Credit Facility.
Note 11 - Accrued Dividends
Payable and Dividends per Common Share
We accrue dividends at the end
of each quarter
according to our
dividend policy adopted by
our Board of
Directors. The Company
pays a dividend to shareholders of its Common Stock and Class
A Common Stock on a quarterly basis for each quarter for which
the Company reports net
income attributable to Cal-Maine
Foods, Inc. computed in
accordance with GAAP in an
amount equal
to one-third (
1/3
) of such quarterly income. Dividends are paid to shareholders of record as
of the
th day following the last day
of such quarter, except for the fourth fiscal quarter. For the fourth quarter, the Company pays dividends to shareholders of record
on the
th day after
the quarter end.
Dividends are payable
on the
th day following
the record date.
Following a quarter
for
which the Company does not report net income attributable to Cal-Maine Foods, Inc., the Company will not pay a dividend for a
subsequent profitable quarter until the Company is profitable on a
cumulative basis computed from the date of the last
quarter for
which a dividend was paid.
On our consolidated statement of
income, we determine dividends per
common share in accordance with the computation
in the
following table (in thousands, except per share data):
13 Weeks Ended
52 Weeks Ended
May 28, 2022
May 29, 2021
May 28, 2022
May 29, 2021
Net income (loss) attributable to Cal-Maine Foods, Inc.
$
$
(
4,244
)
$
$
Cumulative losses to be recovered prior to payment of
divided at beginning of period
(
4,244
)
(
1,370
)
Net income attributable to Cal-Maine Foods, Inc.
available for dividend
$
$
$
$
1/3 of net income attributable to Cal-Maine Foods, Inc.
available for dividend
$
Common stock outstanding (shares)
Class A common stock outstanding (shares)
Total common stock
outstanding (shares)
Dividends per common share*
$
$
$
$
*Dividends per
common share
=
1/3
common stock outstanding (shares).
54
Note 12 - Equity
The Company has
or the Company's Second Restated Certificate of Incorporation
(“Restated Charter”), holders of shares of the Company’s
capital
stock vote as
a single class on
all matters submitted
to a vote of
the stockholders, with
each share of
Common Stock entitled to
voting in
the election of
directors. The
Common Stock
and Class A
Common Stock
have equal liquidation
rights and the
same
dividend rights. In the
case of
any dividend payable
in stock,
holders of Common
Stock are entitled
to receive the
same percentage
dividend (payable only in shares of Common Stock) as the holders of Class A Common Stock receive (payable only
in shares of
Class A Common
Stock). Upon liquidation,
dissolution, or winding-up
of the Company, the
holders of Common
Stock are entitled
to share ratably
with the holders
of Class A
Common Stock in
all assets available
for distribution after payment
in full of
creditors.
The holders
of Common
Stock and
Class A
Common
Stock are
not entitled
to preemptive
or subscription
rights. No
class of
capital stock
may be
combined or
subdivided unless
the other
classes of
capital stock
are combined
or subdivided
in the
same
proportion. No dividend may be declared and paid on Class A Common
Stock unless the dividend is payable only to the holders
of Class A Common Stock and a dividend is declared and paid to Common Stock
concurrently.
Each share
of Class A
Common Stock
is convertible,
at the option
of its
holder,
into
The Company’s
Restated Charter
identifies family
members of
Mr.
Adams (“Immediate
Family Members”)
and arrangements
and entities that are permitted to
receive and hold shares of Class
A Common Stock, with
converting into shares of Common
Stock, with one vote per share (“Permitted
Transferees”). The Permitted
Transferees include
arrangements and entities such as revocable trusts and limited liability companies that could hold Class A Common Stock
for the
benefit of Immediate Family Members. Each Permitted
Transferee must have a relationship,
specifically defined in the Restated
Charter, with
another Permitted Transferee
or an Immediate Family
Member.
A share of Class A
Common Stock transferred
to
a person other
than a
Permitted Transferee would automatically
convert into Common
Stock with
one vote per
share. Additionally,
the
Restated
Charter
includes
a
sunset
provision
pursuant
to
which
all
of
the
outstanding
Class
A
Common
Stock
will
automatically
convert
to
Common
Stock
if:
(a)
less
than
beneficially owned by Immediate Family
Members and/or Permitted Transferees,
or (b) if less than
Common Stock
and Common Stock,
in the aggregate,
are beneficially owned
by Immediate Family
Members and/or Permitted
Transferees.
Note 13 - Net Income per Common Share
Basic net income
per share attributable
to Cal-Maine Foods, Inc.
is based on the
weighted average Common
Stock and Class A
Common Stock
outstanding. Diluted
net income
per share
attributable to
Cal-Maine Foods,
Inc. is
based on
weighted-average
common shares outstanding during the relevant period adjusted for the dilutive
effect of share-based awards.
The following table provides a reconciliation of the
numerators and denominators used to determine basic and
diluted net income
per common share attributable to Cal-Maine Foods, Inc. (amounts in
thousands, except per share data):
May 28, 2022
May 29, 2021
May 30, 2020
Numerator
Net income
$
$
$
Less: Net income (loss) attributable to noncontrolling interest
(
209
)
(
63
)
Net income attributable to Cal-Maine Foods, Inc.
$
$
$
Denominator
Weighted-average
common shares outstanding, basic
Effect of dilutive securities of restricted shares
Weighted-average
common shares outstanding, diluted
Net income per common share attributable to Cal-Maine Foods, Inc.
Basic
$
$
$
Diluted
$
$
$
55
Note 14 - Revenue Recognition
Satisfaction of Performance Obligation
The vast majority of the Company’s
revenue is derived from agreements with customers based on the customer
placing an order
for products. Pricing
for the most part
is determined when
the Company and
the customer agree
upon the specific
order, which
establishes the contract for that order.
Revenues are
recognized in
an amount
that reflects
the net
consideration we
expect to
receive in
exchange for
the goods.
Our
shell eggs
are sold at
prices related to
independently quoted wholesale
market prices or
formulas related to
our costs of
production.
The
Company’s
sales predominantly
contain
a
single
performance
obligation.
We
recognize
revenue
upon
satisfaction of
the
performance obligation
with the customer
which typically occurs
within days of
the Company
and the customer
agreeing upon
the order.
Costs
to
deliver
product
to
customers
are
included
in
selling,
general
and
administrative
expenses
in
the
accompanying
Consolidated Statements
of Income
and totaled
$
2020,
respectively.
Returns and Refunds
Some of our contracts
include a guaranteed sale
clause, pursuant to which
we credit the customer’s
account for product
that the
customer is unable to sell before expiration. The Company records an allowance of returns and refunds by using historical return
data and
comparing
to current
period
sales and
accounts
receivable.
The allowance
is recorded
as a
reduction
in sales
with a
corresponding reduction in trade accounts receivable.
Sales Incentives Provided to Customers
The Company periodically provides
incentive offers to its
customers to encourage purchases.
Such offers include current
discount
offers (e.g., percentage discounts off current purchases),
inducement offers (e.g., offers for future discounts
subject to a minimum
current purchase), and other similar offers. Current discount offers, when accepted by customers, are treated as a reduction to the
sales price
of the
related transaction,
while inducement
offers, when
accepted by
customers, are
treated as
a reduction
to sales
price based on estimated future redemption rates.
Redemption rates are estimated using the Company’s
historical experience for
similar inducement offers. Current discount and inducement offers
are presented
as a net amount in ‘‘Net sales.’’
Disaggregation of Revenue
The following table provides revenue disaggregated by product category
(in thousands):
13 Weeks Ended
52 Weeks Ended
May 28, 2022
May 29, 2021
May 28, 2022
May 29, 2021
Conventional shell egg sales
$
$
$
$
Specialty shell egg sales
Egg products
Other
$
$
$
$
Contract Costs
The Company can incur costs to
obtain or fulfill a contract with
a customer. If
the amortization period of these costs
is less than
one year, they are expensed as incurred. When the amortization period is greater than one year, a contract asset is recognized and
is amortized
over the
contract life
as a
reduction in
net sales.
As of
May 28,
2022 and
May 29,
2021, the
balance for
contract
assets is immaterial.
Contract Balances
The Company receives payment from customers based on specified terms that are
generally less than 30 days from
delivery. There
are rarely contract assets or liabilities related to performance under the contract.
56
Concentration of Credit Risks
Our largest customer, Walmart
Inc. (including Sam's Club) accounted for
%,
% and
% of net sales dollars for fiscal
2022, 2021, and 2020, respectively.
H-E-B, LP accounted for
% of net sales dollars for fiscal
Note 15 - Leases
Expenses related to operating leases, amortization of finance leases, right-of-use assets, and finance lease interest are included in
Cost of
sales, Selling
general and
administrative expense,
and Interest
income, net
in the
Consolidated Statements
of Income.
The Company’s lease cost consists of the
following (in thousands):
13 Weeks Ended
May 28, 2022
52 Weeks Ended
May 28, 2022
Operating Lease cost
$
$
Finance Lease cost
Amortization of right-of-use asset
$
$
Interest on lease obligations
$
$
Short term lease cost
$
$
Future minimum lease payments under non-cancelable leases are as follows (in
thousands):
As of May 28, 2022
Operating Leases
Finance Leases
2023
$
$
2024
2025
2026
2027
Thereafter
Total
Less imputed interest
(
75
)
(
19
)
Total
$
$
The weighted-average remaining lease term and discount rate for lease liabilities included in our Consolidated Balance Sheet are
as follows:
As of May 28, 2022
Operating Leases
Finance Leases
Weighted-average
remaining lease term (years)
Weighted-average
discount rate
%
%
Note 16 - Stock Compensation Plans
On
October
2,
2020,
shareholders
approved
the
Amended
and
Restated
Cal-Maine
Foods,
Inc.
2012
Omnibus
Long-Term
Incentive
Plan (the
“LTIP
Plan”). The
purpose of
the LTIP
Plan is
to assist
us and
our subsidiaries
in attracting
and retaining
selected individuals who are expected to contribute to our long-term success. The maximum number of
shares of Common Stock
available
for
awards under
the LTIP
Plan
is
authorized
but
unissued
shares
or
treasury
shares.
Awards
may
be
granted
under
the
LTIP
Plan
to
any
employee,
any
non-
employee member of the Company’s
Board of Directors, and any consultant
who is a natural person and
provides services to us
or one of our subsidiaries (except for incentive stock options, which may be granted only
to our employees).
The only outstanding awards under
the LTIP Plan are restricted stock awards.
The restricted stock vests
three years from the
grant
date, or upon death or
disability, change
in control, or retirement (subject
to certain requirements). The
restricted stock contains
no other service
or performance conditions.
Restricted stock is awarded
in the name of
the recipient and,
except for the right
of
disposal, constitutes issued and outstanding shares of the Company’s Common Stock for all
corporate purposes during the period
of restriction
including the right
to receive
dividends. Compensation
expense is a
fixed amount
based on the
grant date closing
price and is amortized on a straight-line basis over the vesting period. Forfeitures are
recognized as they occur.
57
Total
stock-based
compensation
expense
was
$
respectively.
Our unrecognized
compensation expense
as a result
of non-vested shares
was $
May 29,
2021. The unrecognized
compensation expense
will be
amortized to
stock compensation
expense over
a period
of
years.
A summary of our equity award activity and related information for our
restricted stock is as follows:
Number of
Shares
Weighted Average
Grant
Date Fair Value
Outstanding, May 30, 2020
$
Granted
Vested
(
79,328
)
Forfeited
(
4,431
)
Outstanding, May 29, 2021
$
Granted
Vested
(
92,918
)
Forfeited
(
4,527
)
Outstanding, May 28, 2022
$
Note 17 - Income Taxes
Income tax expense (benefit) consisted of the following:
Fiscal year ended
May 28, 2022
May 29, 2021
May 30, 2020
Current:
Federal
$
$
(
35,090
)
$
(
6,750
)
State
(
1,800
)
(
34,360
)
(
8,550
)
Deferred:
Federal
State
$
$
(
12,009
)
$
58
Significant components of the Company’s
deferred tax liabilities and assets were as follows:
May 28, 2022
May 29, 2021
Deferred tax liabilities:
Property, plant and equipment
$
$
Inventories
Investment in affiliates
Other
Total deferred
tax liabilities
Deferred tax assets:
Accrued expenses
State operating loss carryforwards
Other comprehensive income
Other
Total deferred
tax assets
Net deferred tax liabilities
$
$
The differences between income tax expense (benefit) at the Company’s
effective income tax rate and income tax expense at the
statutory federal income tax rate were as follows:
Fiscal year end
May 28, 2022
May 29, 2021
May 30, 2020
Statutory federal income tax
$
$
(
2,087
)
$
State income taxes, net
(
309
)
Domestic manufacturers deduction
Enacted net operating loss carryback provision
(
16,014
)
(
3,041
)
Tax exempt
interest income
(
9
)
(
50
)
(
111
)
Reversal of outside basis in equity investment Red River
(
7,310
)
Non-taxable remeasurement gain Red River
(
955
)
Other, net
$
$
(
12,009
)
$
Federal and state income taxes of $
respectively. Federal and state income taxes of $
2021, and 2020, respectively.
In
fiscal
2022,
the
Company
recognized
$
accrued interest and penalties related to uncertain tax positions.
As of May 28,
2022, we had completed
the audit by the Internal
Revenue Service (IRS) for
the fiscal years 2013
through 2015.
Final
audit
adjustments
did
not
result
in
a
material
change
to
the
consolidated
financial
statements.
From
management’s
perspective, the years are closed
and are only open with respect
to any net operating loss carryback
to those years.
Although we
are
subject
to
income
tax
in
many
jurisdictions
within
the
U.S.,
we
are
currently
not
under
audit
by
any
state
and
local
tax
authorities.
Tax
periods for
all years
beginning
with fiscal
year
2019 remain
open
to examination
by federal
and state
taxing
jurisdictions to which we are subject.
Note 18 - Commitments and Contingencies
State of Texas
v. Cal-Maine Foods, Inc. d/b/a Wharton;
and Wharton County Foods, LLC
On April 23, 2020, the Company and its subsidiary Wharton County Foods, LLC (“WCF”) were named as defendants in State of
Texas
v.
Cal-Maine Foods, Inc.
d/b/a Wharton; and
Wharton County Foods,
LLC, Cause No. 2020-25427,
in the District Court
of Harris County,
Texas. The State
of Texas
(the “State”) asserted claims based on the
Company’s and
WCF’s alleged violation
of
the Texas
Deceptive
Trade
Practices—Consumer
Protection
Act, Tex.
Bus.
& Com.
Code §§
17.41-17.63
(“DTPA”).
The
59
State claimed
that
the Company
and
WCF offered
shell eggs
at
excessive
or exorbitant
prices
during
the
COVID-19
state of
emergency and made misleading
statements about shell
egg prices. The
State sought temporary and
permanent injunctions against
the Company and WCF to prevent further alleged violations of the DTPA,
along with over $
2020, the
court granted
the defendants’
motion to
dismiss the
State’s
original petition
with prejudice.
On September
11, 2020,
the State
filed a
notice of
appeal, which
was assigned
to the
Texas
Court of
Appeals for
the First
District. The
State filed
its
opening brief
on December
7, 2020.
The Company
and WCF filed
their response
on February
8, 2021.
On February
11, 2022,
the Texas
Court of
Appeals heard
oral argument,
but as
of the
date of
this Annual
Report the
Texas
Court of
Appeals has
not
issued a ruling. Management believes the risk of material loss related to this matter
to be remote.
Bell et al. v. Cal-Maine Foods et al.
On April 30, 2020, the Company was named as one of several defendants in Bell et al. v. Cal-Maine Foods et al., Case No. 1:20-
cv-461, in the Western
District of Texas, Austin
Division. The defendants include numerous grocery
stores, retailers, producers,
and farms.
Plaintiffs assert
that defendants
violated the
DTPA
by allegedly
demanding exorbitant
or excessive
prices for
eggs
during the COVID-19 state of
emergency. Plaintiffs request certification of a class of all consumers who
purchased eggs in Texas
sold,
distributed,
produced,
or handled
by any
of the
defendants
during
the COVID-19
state of
emergency.
Plaintiffs
seek
to
enjoin the Company
and other defendants from
selling eggs at a
price more than
10% greater than
the price of eggs
prior to the
declaration
of
the
state
of
emergency
and
damages
in
the
amount
of
$
impacting anyone over 65 years old. On December
1, 2020, the Company and certain other defendants
filed a motion to dismiss
the plaintiffs’ amended class action complaint. The plaintiffs subsequently filed a motion to strike, and the motion to dismiss and
related proceedings were referred to a United States magistrate judge. On July 14, 2021, the magistrate judge issued a report and
recommendation to
the court that
the defendants’ motion
to dismiss be
granted and the
case be dismissed
without prejudice for
lack of subject matter jurisdiction. On September 20, 2021, the court dismissed the case without prejudice. On July 13, 2022, the
court denied the plaintiffs’ motion to set aside or amend
the judgment to amend their complaint.
On March 15, 2022,
plaintiffs filed a
second suit against the
Company and several
defendants in Bell et
al. v.
Cal-Maine Foods
et al., Case No. 1:22-cv-246, in the Western District of Texas, Austin Division
alleging the same assertions as laid out in the first
complaint. The Company has not
yet filed a responsive
pleading and there is
currently no deadline to do
so. Management believes
the risk of material loss related to both matters to be remote.
Kraft Foods Global, Inc. et al. v.
United Egg Producers, Inc. et al.
As previously
reported, on
September 25,
2008, the
Company
was named
as one
of several
defendants
in numerous
antitrust
cases involving
the United
States shell
egg
industry.
The Company
settled all
of these
cases, except
for
the claims
of certain
plaintiffs who sought substantial
damages allegedly arising from
the purchase of egg products (as
opposed to shell eggs). These
remaining plaintiffs
are Kraft
Food Global,
Inc., General
Mills, Inc.,
and Nestle
USA, Inc.
(the “Egg
Products Plaintiffs”)
and
The Kellogg Company.
On September 13, 2019, the case with the Egg Products Plaintiffs was remanded from a multi-district litigation proceeding in the
United States District Court for
the Eastern District of Pennsylvania, In
re Processed Egg Products Antitrust
Litigation, MDL No.
2002,
to
the
United
States
District
Court
for
the
Northern
District
of
Illinois,
Kraft
Foods
Global,
Inc.
et
al.
v.
United
Egg
Producers, Inc. et al., Case No. 1:11-cv-8808, for trial. The Egg Products
Plaintiffs allege that the Company and other defendants
violated Section 1
of the Sherman Act,
15. U.S.C. §
1, by agreeing
to limit the
production of eggs
and thereby illegally
to raise
the prices that
plaintiffs paid for
processed egg products.
In particular,
the Egg Products Plaintiffs
are attacking certain
features
of the United
Egg Producers animal-welfare
guidelines and program
used by the
Company and many
other egg producers.
The
Egg Products
Plaintiffs seek
to enjoin
the Company
and other
defendants from
engaging in
antitrust violations
and seek
treble
money damages. On May 2, 2022, the court set trial for October 24, 2022.
In addition,
on October
24, 2019,
the Company
entered into
a confidential
settlement agreement
with The
Kellogg Company
dismissing all
claims against the
Company for an
amount that did
not have a
material impact on
the Company’s financial condition
or results of operations. On November
11, 2019, a stipulation for
dismissal was filed with the court,
and on March 28, 2022, the
court dismissed the Company with prejudice.
The Company intends to
continue to defend the remaining
case with the Egg Products Plaintiffs
as vigorously as possible based
on
defenses
which
the
Company
believes
are
meritorious
and
provable.
Adjustments,
if
any,
which
might
result
from
the
resolution of
this remaining
matter with
the Egg
Products Plaintiffs
have not
been reflected
in the
financial statements.
While
management believes that there is
still a reasonable possibility of a
material adverse outcome from the
case with the Egg
Products
Plaintiffs, at
the present
time, it
is not
possible to
estimate the
amount of
monetary exposure,
if any,
to the
Company due
to a
range of factors,
including the
following, among others:
two earlier trials
based on substantially
the same
facts and
legal arguments
60
resulted in findings of
no conspiracy and/or damages;
this trial will be before
a different judge
and jury in a different
court than
prior related cases; there are significant factual issues to
be resolved; and there are requests for damages
other than compensatory
damages (i.e., injunction and treble money damages).
State of Oklahoma Water
shed Pollution Litigation
On June 18,
2005, the
State of
Oklahoma filed
suit, in
the United
States District
Court for
the Northern
District of
Oklahoma,
against Cal-Maine Foods, Inc. and
Tyson Foods,
Inc. and affiliates, Cobb-Vantress,
Inc., Cargill, Inc. and
its affiliate, George’s,
Inc. and
its affiliate,
Peterson Farms, Inc.
and Simmons Foods,
Inc. The
State of Oklahoma
claims that through
the disposal of
chicken litter the defendants have polluted
the Illinois River Watershed. This watershed provides water to
eastern Oklahoma. The
complaint seeks
injunctive relief
and monetary
damages, but the
claim for
monetary damages
has been dismissed
by the court.
Cal-Maine Foods,
Inc. discontinued
operations in the
watershed. Accordingly,
we do not
anticipate that
Cal-Maine Foods,
Inc.
will be materially
affected by
the request
for injunctive
relief unless the
court orders
substantial affirmative
remediation. Since
the litigation began,
Cal-Maine Foods, Inc.
purchased
% of the membership
interests of Benton County
Foods, LLC, which
is an ongoing commercial shell egg operation within the Illinois River Watershed. Benton County Foods, LLC is not a defendant
in the litigation.
The trial in the case
began in September 2009 and
concluded in February 2010. The
case was tried without a jury,
and the court
has not yet issued its ruling. Management believes the risk of material loss related
to this matter to be remote.
Other Matters
In addition to
the above, the Company
is involved in
various other claims
and litigation incidental
to its business. Although
the
outcome of these matters cannot be determined with certainty, management, upon the advice of counsel,
is of the opinion that the
final outcome should not have a material effect on the Company’s
consolidated results of operations or financial position.
Note 19 - Related Party Transaction
On August 24, 2020, Mrs. Jean Reed
Adams, the wife of the
Company’s late founder Fred R. Adams, Jr., and the Fred R. Adams,
Jr.
Daughters’
Trust,
dated
July
20,
2018
(the
“Daughters’
Trust”),
of
which
the
daughters
of
Mr.
Adams
are
beneficiaries
(together, the
“Selling Stockholders”),
completed a registered
secondary public offering
of
held by them, pursuant
to a previously disclosed Agreement
Regarding Common Stock (the
“Agreement”) filed as an
exhibit to
this report.
Mrs. Adams
and the
Daughters’ Trust
advised the
Company that
they were
conducting the
offering in
order to
pay
estate taxes related to the
settlement of Mr.
Adam’s estate
and to obtain liquidity.
The public offering
was made pursuant to the
Company’s effective shelf registration statement on Form S-3 (File No. 333-227742), including the Prospectus contained therein
dated October 9, 2018,
and a related Prospectus Supplement
dated August 19, 2020,
each of which is on
file with the Securities
and Exchange Commission. The public
offering involved only the sale
of shares of Common
Stock that were already
outstanding,
and thus the
Company did not
issue any new
shares or raise
any additional capital
in the offering.
The expenses of
the offering
(not including
the underwriting
discount and
legal fees and
expenses of
legal counsel for
the Selling Stockholders,
which were
paid by the Selling
Stockholders) paid by the
Company were $
reimbursed the Company $
SCHEDULE II - VALUATION
AND QUALIFYING ACCOUNTS
Fiscal Years
ended May 28, 2022, May 29, 2021, and May 30, 2020
(in thousands)
Description
Balance at
Beginning of Period
Charged to Cost
and Expense
Write-off
of Accounts
Balance at
End of Period
Year
ended May 28, 2022
Allowance for doubtful accounts
$
795
$
30
$
50
$
775
Year
ended May 29, 2021
Allowance for doubtful accounts
$
743
$
135
$
83
$
795
Year
ended May 30, 2020
Allowance for doubtful accounts
$
206
$
550
$
13
$
743
61
ITEM
9.
CHANGES
IN
AND
DISAGREEMENTS
WITH
ACCOUNTANTS
ON
ACCOUNTING
AND
FINANCIAL
DISCLOSURE
None.
ITEM 9A.
CONTROLS AND PROCEDURES
Disclosure Controls and Procedures
Our disclosure controls and procedures are designed to provide reasonable assurance that information
required to be disclosed by
us in
the reports
we file
or submit
under the
Securities Exchange
Act of
1934, as
amended (the
“Exchange Act”)
is recorded,
processed, summarized
and reported,
within the time
periods specified in
the Securities and
Exchange Commission’s
rules and
forms. Disclosure
controls
and
procedures
include,
without
limitation,
controls
and
procedures
designed
to
ensure
that
information
required
to
be
disclosed
by
us
in
the
reports
that
we
file
or
submit
under
the
Exchange
Act
is
accumulated
and
communicated to management,
including our principal
executive and principal
financial officers, or
persons performing similar
functions, as appropriate
to allow
timely decisions regarding
required disclosure. Based
on an
evaluation of
our disclosure controls
and procedures conducted by our
Chief Executive Officer and Chief
Financial Officer, together with other financial officers, such
officers
concluded that
our disclosure
controls and
procedures were
effective
as of
May 28,
2022 at
the reasonable
assurance
level.
Internal Control Over Financial Reporting
(a)
Management’s Report
on Internal Control Over Financial Reporting
The following
sets forth,
in accordance
with Section
404(a) of
the Sarbanes-Oxley
Act of
2002 and
Item 308
of the
Securities
and Exchange Commission’s Regulation
S-K, the report of management on our internal control over financial reporting.
1.
Our management is responsible for establishing and maintaining adequate internal control over financial
reporting.
“Internal control over financial reporting”
is a process designed
by, or under the supervision of, our
Chief Executive
Officer and Chief
Financial Officer,
together with other financial
officers, and effected
by our Board of
Directors,
management
and other
personnel, to
provide reasonable
assurance
regarding the
reliability of
financial reporting
and the preparation of financial statements for external purposes in accordance
with generally accepted accounting
principles and includes those policies and procedures that:
●
Pertain to the maintenance of records that in reasonable detail accurately and fairly reflect the transactions
and dispositions of our assets;
●
Provide reasonable assurance that transactions are recorded as necessary to permit preparation of financial
statements
in
accordance
with
generally
accepted
accounting
principles,
and
that
our
receipts
and
expenditures are being made only in accordance with
authorizations of our management and directors; and
●
Provide reasonable assurance regarding prevention or timely detection
of unauthorized acquisition, use or
disposition of our assets that could have a material effect on the financial
statements.
2.
Our
management,
in
accordance
with
Rule
13a-15(c)
under the
Exchange
Act
and
with the
participation
of
our
Chief
Executive
Officer
and
Chief
Financial
Officer,
together
with
other
financial
officers,
evaluated
the
effectiveness
of
our
internal
control
over
financial
reporting
as
of
May
28,
2022. The
framework
on
which
management’s
evaluation
of
our
internal
control
over
financial
reporting
is
based
is
the
“Internal
Control
–
Integrated
Framework”
published
in
2013
by
the
Committee
of
Sponsoring
Organizations
(“COSO”)
of
the
Treadway Commission.
3.
Management has determined
that our internal control over
financial reporting as of
May 28, 2022 is effective.
It is
noted
that
internal
control
over
financial
reporting
cannot
provide
absolute
assurance
of
achieving
financial
reporting objectives, but rather reasonable assurance of achieving
such objectives.
4.
The attestation report of FROST,
PLLC on our internal control over financial reporting,
which includes that firm’s
opinion on the effectiveness of our internal control over financial
reporting, is set forth below.
(b)
Attestation Report of the Registrant’s
Public Accounting Firm
62
Report of Independent Registered Public Accounting Firm
on Internal Control Over Financial Reporting
Board of Directors and Stockholders
Cal-Maine Foods, Inc. and Subsidiaries
Ridgeland, Mississippi
Opinion on Internal Control Over Financial Reporting
We have
audited Cal-Maine Foods, Inc.
and Subsidiaries’ internal control over
financial reporting as of
May 28, 2022,
based
on
criteria
established
in
2013
Internal
Control
–
Integrated
Framework
Organizations of the
Treadway Commission
(“COSO”).
In our opinion, Cal-Maine
Foods, Inc. and Subsidiaries
maintained, in
all material
respects, effective
internal control
over financial
reporting as
May 28,
2022, based
on criteria
established in
2013
Internal Control – Integrated Framework
We
also have
audited, in
accordance with
the standards
of the
Public Company
Accounting Oversight
Board (United
States) (“PCAOB”), the consolidated
balance sheets and the
related consolidated statements of
income, comprehensive income,
stockholders’ equity and
cash flows of Cal-Maine
Foods, Inc. and
Subsidiaries and our report
dated July 19, 2022
expressed an
unqualified opinion.
Basis for Opinion
Cal-Maine
Foods,
Inc.
and
Subsidiaries’
management
is
responsible
for
maintaining
effective
internal
control
over
financial
reporting
and
for
their
assessment
of
the
effectiveness
of
internal
control
over
financial
reporting,
included
in
the
accompanying Management’s
Report on Internal Control Over
Financial Reporting in Item 9A.
Our responsibility is to express
an opinion on the entities’
internal control over financial reporting based
on our audit.
We are a public accounting firm registered
with the PCAOB and
are required to be
independent with respect to
Cal-Maine Foods, Inc.
and Subsidiaries in accordance
with
the
U.S.
federal
securities
laws and
the
applicable
rules
and
regulations
of the
Securities and
Exchange
Commission
and
the
PCAOB.
We
conducted
our audit
in accordance
with the
standards of
the PCOAB.
Those
standards require
that we
plan
and
perform the audit to obtain reasonable assurance about whether effective internal control over financial
reporting was maintained
in all
material respects.
Our audit
of internal
control over
financial reporting
included obtaining
an understanding
of internal
control
over
financial
reporting,
assessing the
risk
that
a
material
weakness
exists,
and
testing
and
evaluating
the design
and
operating effectiveness of internal control
based on the assessed risk.
Our audit also included performing such other
procedures
as we considered necessary in the circumstances.
We believe our audit provides
a reasonable basis for our opinion.
Definition and Limitations of Internal Control Over Financial Reporting
An entities’ internal control over financial reporting is a process designed to provide reasonable assurance regarding the
reliability of financial reporting and the preparation of
consolidated financial statements for external purposes in accordance with
accounting principles
generally accepted
in the United
States of America.
An entities’ internal
control over financial
reporting
includes those
policies and
procedures that
(1) pertain
to the
maintenance
of records
that, in
reasonable detail,
accurately and
fairly reflect the
transactions and dispositions of
the assets of the
entities; (2) provide reasonable
assurance that transactions are
recorded
as
necessary
to
permit
preparation
of
consolidated
financial
statements
in
accordance
with
accounting
principles
generally
accepted
in the
United States
of America,
and
that receipts
and
expenditures
of the
entities are
being
made only
in
accordance
with
authorizations
of
management
and
directors
of
the
entities;
and
(3)
provide
reasonable
assurance
regarding
prevention or
timely detection
of unauthorized
acquisition, use,
or disposition
of the
entities’ assets
that could
have a
material
effect on the consolidated financial statements.
Because of
its inherent
limitations, internal
control over
financial reporting
may not
prevent or
detect misstatements.
Also, projections of any evaluation of effectiveness to future periods are subject to the risk that controls may become inadequate
because of changes in conditions, or that the degree of compliance with the policies
or procedures may deteriorate.
July 19, 2022
63
(c)
Changes in Internal Control Over Financial Reporting
In
connection
with
its
evaluation
of
the
effectiveness,
as
of
May
28,
2022,
of
our
internal
control
over
financial
reporting,
management determined that there was no change
in our internal control over financial reporting that
occurred during the fourth
quarter ended
May 28,
2022, that
has materially
affected,
or is
reasonably likely
to materially
affect, our
internal control
over
financial reporting.
ITEM 9B.
OTHER INFORMATION
Not applicable.
ITEM 9C.
DISCLOSURE REGARDING FOREIGN JURISDICTIONS
THAT PREVENT INSPECTIONS
Not applicable.
PART
III.
ITEM 10.
DIRECTORS, EXECUTIVE OFFICERS AND CORPORATE
GOVERNANCE
Except as set forth below, the information concerning directors, executive officers and corporate governance required by Item 10
is
incorporated
by
reference
from
our
definitive
proxy
statement
which
is
to
be
filed
pursuant
to
Regulation
14A
under
the
Securities Exchange Act of 1934 in connection with our 2022 Annual
Meeting of Shareholders.
We have adopted a Code
of Conduct and
Ethics for Directors,
Officers and Employees, including
the chief executive
and principal
financial and accounting officers
of the Company.
We will
provide a copy of the code
free of charge to any person
that requests
a copy by writing to:
Cal-Maine Foods, Inc.
P.O.
Box 2960
Jackson, Mississippi 39207
Attn.:
Investor Relations
Requests can be made by phone at (601) 948-6813.
A copy is also available at our website
www.calmainefoods.com.
We intend to disclose any amendments to, or waivers from, the
Code
of
Conduct
and
Ethics
for
Directors,
Officers
and
Employees
on
our
website
promptly
following
the
date
of
any
such
amendment or waiver. Information
contained on our website is not a part of this report.
ITEM 11.
EXECUTIVE COMPENSATION
The information concerning executive
compensation required by Item 11
is incorporated by reference from our
definitive proxy
statement which is to
be filed pursuant to Regulation
14A under the Securities
Exchange Act of 1934 in
connection with our 2022
Annual Meeting of Shareholders.
ITEM
12.
SECURITY
OWNERSHIP
OF
CERTAIN
BENEFICIAL
OWNERS
AND MANAGEMENT
AND
RELATED STOCKHOLDER
MATTERS
The information
concerning security
ownership of
certain beneficial
owners and
management and
related stockholder
matters
required by Item 12 is incorporated
by reference from our definitive proxy
statement which is to be filed pursuant
to Regulation
14A under the Securities Exchange Act of 1934 in connection with our 2022
Annual Meeting of Shareholders.
ITEM 13.
CERTAIN
RELATIONSHIPS
AND RELATED TRANSACTIONS,
AND DIRECTOR INDEPENDENCE
The
information
concerning
certain
relationships
and
related
transactions,
and
director
independence
required
by
Item
13
is
incorporated by reference from
our definitive proxy
statement which is
to be filed
pursuant to Regulation
14A under the
Securities
Exchange Act of 1934 in connection with our 2022 Annual Meeting of Shareholders.
64
ITEM 14.
PRINCIPAL ACCOUNTING
FEES AND SERVICES
The information
concerning principal
accounting fees
and services
required by
Item 14
is incorporated
by reference
from our
definitive
proxy
statement
which
is
to
be
filed
pursuant
to
Regulation
14A
under
the
Securities
Exchange
Act
of
1934
in
connection with our 2022 Annual Meeting of Shareholders.
PART
IV.
ITEM 15. EXHIBIT AND FINANCIAL STATEMENT
SCHEDULES
(a)(1)
Financial Statements
The following consolidated financial statements and notes thereto of Cal-Maine Foods, Inc. and subsidiaries are included in Item
8 and are filed herewith:
)
(a)(2)
Financial Statement Schedule
All other schedules are omitted either because they
are not applicable or required, or
because the required information is included
in the financial statements or notes thereto.
(a)(3)
Exhibits Required by Item 601 of Regulation S-K
See Part (b) of this Item 15.
65
(b)
Exhibits Required by Item 601 of Regulation S-K
The following exhibits are filed herewith or incorporated by reference:
Exhibit
Number
Exhibit
3.1
3.2
4.1**
10.1
10.2
10.3*
10.4
10.5*
10.6*
10.7*
10.8*
Form of Restricted Stock Agreement for Amended and Restated Cal-Maine Foods, Inc. 2012 Omnibus
Long-
21**
23.1**
31.1**
31.2**
32***
101.SCH***+
Inline XBRL Taxonomy
Extension Schema Document
101.CAL***+
Inline XBRL Taxonomy
Extension Calculation Linkbase Document
101.DEF***+
Inline XBRL Taxonomy
Extension Definition Linkbase Document
101.LAB***+
Inline XBRL Taxonomy
Extension Label Linkbase Document
101.PRE***+
Inline XBRL Taxonomy
Extension Presentation Linkbase Document
104
Cover Page Interactive Data File (formatted as Inline XBRL and contained
in Exhibit 101)
*
Management contract or compensatory plan or arrangement
**
Filed herewith as an Exhibit
***
Furnished herewith as an Exhibit
†
Submitted electronically with this Annual Report on Form 10-K
(c)
Financial Statement Schedules Required by Regulation S-X
The financial statement schedule required by Regulation S-X is filed at page 60. All other schedules for which provision is made
in the
applicable accounting regulations
of the
Securities and
Exchange Commission are
not required
under the
related instructions
or are inapplicable and therefore have been omitted.
ITEM 16. FORM 10-K SUMMARY
Not applicable
66
SIGNATURES
Pursuant to
the requirements of
Section 13 or
15(d) of the
Securities Exchange
Act of 1934,
the registrant has
duly caused this
report to be signed on its behalf by the undersigned, thereunto duly authorized,
in Ridgeland, Mississippi.
CAL-MAINE FOODS, INC.
/s/ Adolphus B. Baker
Adolphus B. Baker
Chief Executive Officer and Chairman of the Board
Date:
July 19, 2022
Pursuant to the requirements of the Securities Exchange Act of 1934, this report has been signed below by the following persons
on behalf of the registrant and in the capacities and on the dates indicated:
Signature
Title
Date
/s/
Adolphus B. Baker
Chief Executive Officer and
July 19, 2022
Adolphus B. Baker
Chairman of the Board
(Principal Executive Officer)
/s/
Max P.
Bowman
Vice President, Chief Financial
July 19, 2022
Max P.
Bowman
Officer and Director
(Principal Financial Officer)
/s/ Matthew S. Glover
Vice President, Accounting
July 19, 2022
Matthew S. Glover
(Principal Accounting Officer)
/s/
Sherman L. Miller
President, Chief Operating
July 19, 2022
Sherman L. Miller
Officer and Director
/s/
Letitia C. Hughes
Director
July 19, 2022
Letitia C. Hughes
/s/
James E. Poole
Director
July 19, 2022
James E. Poole
/s/
Steve W. Sanders
Director
July 19, 2022
Steve W. Sanders
/s/
Camille S. Young
Director
July 19, 2022
Camille S. Young
TABLE OF CONTENTS
Part IItem 1. BusinessItem 1A. Risk FactorsItem 1B. Unresolved Staff CommentsItem 2. PropertiesItem 3. Legal ProceedingsItem 4. Mine Safety DisclosuresPart IIItem 5. Market For Registrant S Common Equity, Related Stockholder Matters andItem 6. ReservedItem 7. Management S Discussion and Analysis Of Financial ConditionItem 7A. Quantitative and Qualitative Disclosures About Market RisksItem 8. Financial Statements and Supplementary DataNote 1 - Summary Of Significant Accounting PoliciesNote 2 AcquisitionNote 3 - Investment SecuritiesNote 4 - Fair Value MeasuresNote 5 - Inventories Inventories Consisted Of The Following (in Thousands):Note 5 - InventoriesNote 6 - Property, Plant and Equipment Property, Plant and Equipment Consisted Of The Following (in Thousands):Note 6 - Property, Plant and EquipmentNote 7 - Investment in Unconsolidated EntitiesNote 8 - Goodwill and Other Intangible Assets Goodwill and Other Intangibles Consisted Of The Following (in Thousands):Note 8 - Goodwill and Other Intangible AssetsNote 9 - Employee Benefit PlansNote 10 - Credit FacilityNote 11 - Accrued Dividends Payable and Dividends Per Common ShareNote 12 - EquityNote 13 - Net Income Per Common ShareNote 14 - Revenue RecognitionNote 15 - LeasesNote 16 - Stock Compensation PlansNote 17 - Income Taxes Income Tax Expense (benefit) Consisted Of The Following:Note 17 - Income TaxesNote 18 - Commitments and ContingenciesNote 19 - Related Party TransactionItem 9. Changes in and Disagreements with Accountants on Accounting and FinancialItem 9A. Controls and ProceduresItem 9B. Other InformationItem 9C. Disclosure Regarding Foreign Jurisdictions That Prevent InspectionsPart IIIItem 10. Directors, Executive Officers and Corporate GovernanceItem 11. Executive CompensationItem 12. Security Ownership Of Certain Beneficial Owners and Management andItem 13. Certain Relationships and Related Transactions, and Director IndependenceItem 14. Principal Accounting Fees and ServicesPart IVItem 15. Exhibit and Financial Statement SchedulesItem 16. Form 10-k Summary