CALIX, INC
10-Ks and 10-Qs
|
|
|
|
|
|
|
|
|
|
|
|
|
|
|
|
|
|
|
|
|
|
|
|
|
|
|
|
|
|
|
|
|
|
|
|
|
|
|
|
|
|
|
|
|
|
|
|
|
|
|
|
|
UNITED STATES
SECURITIES AND EXCHANGE COMMISSION
Washington, DC 20549
FORM 10-K
(Mark One)
|
x
|
ANNUAL REPORT PURSUANT TO SECTION 13 OR 15(d) OF THE SECURITIES EXCHANGE ACT OF 1934
|
For the fiscal year ended
December 31, 2013
OR
|
o
|
TRANSITION REPORT PURSUANT TO SECTION 13 OR 15(d) OF THE SECURITIES EXCHANGE ACT OF 1934
|
For the transition period from to
Commission File Number: 001-34674
Calix, Inc.
(Exact Name of Registrant as Specified in Its Charter)
|
Delaware
|
|
68-0438710
|
|
(State or Other Jurisdiction of
Incorporation or Organization)
|
|
(I.R.S. Employer
Identification No.)
|
|
1035 N. McDowell Blvd.
Petaluma, California
(Address of Principal Executive Offices) |
94954
(Zip Code)
|
|
|
Registrant’s telephone number, including area code (707) 766-3000
Securities registered pursuant to Section 12(b) of the Act:
|
||
|
Title of each class
|
Name of each exchange on which registered
|
|
|
Common Stock, $0.025 par value
|
The New York Stock Exchange
|
|
|
Securities registered pursuant to section 12(g) of the Act:
|
||
|
(Title of class)
|
||
|
(Title of class)
|
||
Indicate by check mark if the registrant is a well-known seasoned issuer, as defined in Rule 405 of the Securities Act. Yes:
o
No:
x
Indicate by check mark if the registrant is not required to file reports pursuant to Section 13 or Section 15(d) of the Act. Yes:
o
No:
x
Indicate by check mark whether the registrant (1) has filed all reports required to be filed by Section 13 or 15(d) of the Securities Exchange Act of 1934 during the preceding 12 months (or for such shorter period that the registrant was required to file such reports), and (2) has been subject to such filing requirements for the past 90 days. Yes:
x
No:
o
Indicate by check mark whether the registrant has submitted electronically and posted on its corporate Web site, if any, every Interactive Data File required to be submitted and posted pursuant to Rule 405 of Regulation S-T (§232.405 of this chapter) during the preceding 12 months (or for such shorter period that the registrant was required to submit and post such files). Yes:
x
No:
o
Indicate by check mark if disclosure of delinquent filers pursuant to Item 405 of Regulation S-K (§229.405 of this chapter) is not contained herein, and will not be contained, to the best of registrant’s knowledge, in definitive proxy or information statements incorporated by reference in Part III of this Form 10-K or any amendment to this Form 10-K.
x
Indicate by check mark whether the registrant is a large accelerated filer, an accelerated filer, a non-accelerated filer, or a smaller reporting company. See the definitions of “large accelerated filer,” “accelerated filer” and “smaller reporting company” in Rule 12b-2 of the Exchange Act.
|
Large Accelerated Filer
|
o
|
Accelerated Filer
|
x
|
||||
|
Non-accelerated filer
|
o
|
(Do not check if a smaller reporting Company)
|
Smaller Reporting Company
|
o
|
|||
Indicate by check mark whether the registrant is a shell company (as defined in Rule 12b-2 of the Exchange Act). Yes:
o
No:
x
The aggregate market value of the Common Stock held by non-affiliates of the registrant based upon the closing sale price on the New York Stock Exchange on
June 28, 2013
, the last business day of the Registrant’s most recently completed second fiscal quarter, was approximately
$409.4 million
. Shares held by each executive officer, director and by each other person (if any) who owns more than 10% of the outstanding common stock have been excluded in that such persons may be deemed to be affiliates. This determination of affiliate status is not necessarily a conclusive determination for other purposes.
As of
February 12, 2014
, the number of shares of the registrant’s common stock outstanding was
50,224,952
.
DOCUMENTS INCORPORATED BY REFERENCE
Portions of the registrant’s definitive proxy statement for its
2014
annual meeting of stockholders are incorporated by reference in Items 10, 11, 12, 13 and 14 of Part III.
Calix, Inc.
Form 10-K
TABLE OF CONTENTS
|
PART I
|
||
|
Item 1.
|
||
|
Item 1A.
|
||
|
Item 1B.
|
||
|
Item 2.
|
||
|
Item 3.
|
||
|
Item 4.
|
||
|
PART II
|
||
|
Item 5.
|
||
|
Item 6.
|
||
|
Item 7.
|
||
|
Item 7A.
|
||
|
Item 8.
|
||
|
Item 9.
|
||
|
Item 9A.
|
||
|
Item 9B.
|
||
|
PART III
|
||
|
Item 10.
|
||
|
Item 11.
|
||
|
Item 12.
|
||
|
Item 13.
|
||
|
Item 14.
|
||
|
PART IV
|
||
|
Item 15.
|
||
2
SPECIAL NOTE REGARDING FORWARD LOOKING STATEMENTS
This report includes forward-looking statements that involve substantial risks and uncertainties. All statements other than statements of historical facts contained in this report, including statements regarding Calix’s future financial position, business strategy and plans and objectives of management for future operations, are forward-looking statements. In some cases, you can identify forward-looking statements by terminology such as “believe,” “may,” “estimate,” “continue,” “anticipate,” “intend,” “should,” “plan,” “expect,” “predict,” “potential,” or the negative of these terms or other similar expressions. Forward-looking statements include, without limitation, Calix’s expectations concerning the outlook for its business, productivity, plans and goals for future operational improvements and capital investments, operational performance, future market conditions or economic performance and developments in the capital and credit markets and expected future financial performance.
Forward-looking statements involve a number of risks, uncertainties and assumptions, and actual results or events may differ materially from those projected or implied in those statements. Important factors that could cause such differences include, but are not limited to:
|
•
|
our ability to predict our revenue and plan our expenses appropriately;
|
|
•
|
the capital spending patterns of communications service providers ("CSPs"), and any decrease or delay in capital spending by CSPs due to macro-economic conditions, regulatory implementation or uncertainties, or other reasons;
|
|
•
|
the impact of government-sponsored programs on our customers;
|
|
•
|
intense competition;
|
|
•
|
our ability to develop new products or enhancements that support technological advances and meet changing CSP requirements;
|
|
•
|
our ability to achieve market acceptance of our products and CSPs’ willingness to deploy our new products;
|
|
•
|
the concentration of our customer base;
|
|
•
|
the length and unpredictability of our sales cycles;
|
|
•
|
our focus on CSPs with limited revenue potential;
|
|
•
|
our lack of long-term, committed-volume purchase contracts with our customers;
|
|
•
|
our ability to increase our sales to larger North American as well as international CSPs;
|
|
•
|
our exposure to the credit risks of our customers;
|
|
•
|
fluctuations in our gross margin;
|
|
•
|
the interoperability of our products with CSP networks;
|
|
•
|
our dependence on sole and limited source suppliers;
|
|
•
|
our ability to manage our relationships with our contract manufacturers;
|
|
•
|
our ability to forecast our manufacturing requirements and manage our inventory;
|
|
•
|
our products’ compliance with industry standards;
|
|
•
|
our ability to expand our international operations;
|
|
•
|
our inability to recruit or retain appropriate international resellers ;
|
|
•
|
the ability to address and resolve risks related to acquisitions;
|
|
•
|
our ability to protect our intellectual property and the cost of doing so;
|
|
•
|
the quality of our products, including any undetected hardware defects or bugs in our software;
|
|
•
|
our ability to estimate future warranty obligations due to product failure rates;
|
|
•
|
our ability to obtain necessary third-party technology licenses;
|
|
•
|
the attraction and retention of qualified employees and key management personnel;
|
|
•
|
our ability to build and sustain the proper information technology infrastructure; and
|
|
•
|
our ability to maintain proper and effective internal controls.
|
Calix cautions you against placing undue reliance on forward-looking statements, which reflect our current beliefs and are based on information currently available to us as of the date a forward-looking statement is made. Forward-looking statements set forth in this report on Form 10-K speak only as of the date of its filing. We undertake no obligation to revise forward-looking statements to reflect future events, changes in circumstances, or changes in beliefs. In the event that we do update any forward-looking statements, no inference should be made that we will make additional updates with respect to that statement, related matters, or any other forward-looking statements.
3
Overview
Calix, Inc. (together with its subsidiaries, “Calix,” the “Company,” “our,” “we,” or “us”) was incorporated in August 1999, and is a Delaware corporation. We are a leading provider in North America of broadband communications access systems and software for fiber- and copper-based network architectures that enable communications service providers ("CSPs"), to transform their networks and connect to their residential and business subscribers. We enable CSPs to provide a wide range of revenue-generating services, from basic voice and data to advanced broadband services, over legacy and next-generation access networks. We focus solely on CSP access networks, the portion of the network that governs available bandwidth and determines the range and quality of services that can be offered to subscribers. We develop and sell carrier-class hardware and software products, which we refer to as the Unified Access portfolio that are designed to enhance and transform CSP access networks to meet the changing demands of subscribers rapidly and cost-effectively.
Our Unified Access portfolio consists of four core platforms and/or nodes, the B6 Ethernet service access nodes ("B-Series nodes"), the C7 multiservice, multiprotocol access platform ("C-Series platform"), the E-Series Ethernet service access platforms and nodes ("E-Series platforms and nodes"), and the BLM1500 gigabit passive optical network ("GPON") access terminal. These platforms, nodes, and terminals are complemented by the P-Series and T-Series optical network terminals ("ONTs") and residential gateways ("RGs"), and the Calix Management System ("CMS"), EntriView element management software, and Compass suite of value-added software applications. Our broad and comprehensive portfolio serves the CSP network from the central office or data center to the subscriber premises and enables CSPs to deliver both basic voice and data and advanced broadband services over legacy and next-generation access networks. These packet-based platforms enable CSPs to rapidly introduce new revenue-generating services, while minimizing the capital and operational costs of CSP networks. The Unified Access portfolio allows CSPs to evolve their networks and service delivery capabilities at a pace that balances their financial, competitive and technology needs.
We believe that the rapid growth of Internet and data traffic, introduction of bandwidth-intensive advanced broadband services, such as high-speed Internet, Internet protocol television ("IPTV"), mobile broadband, high-definition video, and online gaming, the rise of “the cloud” as a mainstream vehicle for content delivery over broadband, the proliferation of broadband-ready consumer devices, and the increasingly competitive market for residential and business subscribers are driving CSPs to invest in and upgrade their access networks. We also believe that CSPs will gradually transform their access networks to deliver these advanced broadband services over fiber-based networks, thereby preparing networks for continued bandwidth growth, the introduction of new services and more cost-effective operations. During this time, CSPs will increasingly deploy new fiber-based network infrastructure to enable this transition while continuing to support basic voice and data services over legacy networks. Our portfolio is designed to enable this evolution of the access network efficiently and flexibly.
We market our access systems and software to CSPs globally through our direct sales force as well as a limited number of resellers. As of December 31, 2013, nearly eighteen million ports of our Unified Access portfolio have been deployed at a growing number of CSPs worldwide, whose networks serve over 100 million subscriber lines in total. Our customers include many of the world's largest communications providers. In addition, we have enabled over 900 customers to deploy gigabit passive optical network, Active Ethernet and point-to-point Ethernet fiber access networks.
We have a single reporting segment. Additional information about geographic areas required by this item is incorporated herein by reference to Note 12,
“Segment Information”
of the Notes to Consolidated Financial Statements of this Form 10-K.
Industry Background
CSPs compete in a rapidly changing market to deliver a range of voice, data and video services to their residential and business subscribers. CSPs include wireline and wireless service providers, cable multiple system operators ("MSOs"), electrical cooperatives, and municipalities. The rise in Internet-enabled communications has created an environment in which CSPs are competing to deliver voice, data and video offerings to their subscribers across fixed and mobile networks. Residential and business subscribers now have the opportunity to purchase an array of services such as basic voice and data as well as advanced broadband services such as high-speed Internet, IPTV, mobile broadband, high-definition video and online gaming from a variety of CSPs. The rapid growth in new services is generating increased network traffic.
For example, Cisco Systems, Inc. estimates that global IP traffic will grow at a compound annual growth rate of 23% per year from 2012 to reach approximately 121 exabytes per month in 2017. We believe that increased network traffic will be largely driven by video applications, which are expected to account for 80-90% of global consumer traffic by 2017. CSPs are also broadening their offerings of bandwidth-intensive advanced broadband services, while maintaining support for their widely utilized basic voice and data services. CSPs are being driven to evolve their access networks to enable cost-effective delivery of a broad range of services demanded by their subscribers.
With strong subscriber demand for low latency and bandwidth-intensive applications, CSPs are seeking to offer new services, realize new revenue streams, build out new infrastructure and differentiate themselves from their competitors. CSPs typically compete on their cost to acquire and retain subscribers, the quality of their service offerings, including such measures as the speed, latency, and reliability of their broadband services, and the cost to deploy and operate their networks. In the past, CSPs offered different solutions delivered over distinct networks designed for specific services and were generally not in direct competition. For example, traditional wireline service providers provided voice services whereas cable MSOs delivered cable television services. Currently, CSPs are increasingly offering services that leverage Internet protocol ("IP"), thereby enabling CSPs of all types to offer a comprehensive bundle of IP-based voice, data and video
4
services to their subscribers. This has increased the level of competition among CSPs as wireline and wireless service providers, cable MSOs and other CSPs can all compete for the same residential and business subscribers using similar types of IP-based services.
Access Networks are Critical and Strategic to CSPs and Policymakers
Access networks, also known as the local loop or last mile, directly and physically connect the residential or business subscriber to the CSP’s data center, central office or similar facilities. The access network is critical for service delivery as it governs the bandwidth capacity, service quality available to subscribers and ultimately the services CSPs can provide to subscribers. Providing differentiated, high-speed, high quality connectivity has become increasingly critical for CSPs to retain and expand their subscriber base and to launch new services. Typically, subscribers consider service breadth, bandwidth speed, latency, reliability, price, ease of use and technical support as key factors in the decision to purchase services from a CSP. As CSPs face increasing pressure to retain their basic voice and data customers in response to cable MSOs offering voice, data and video services, it is critical for CSPs to continue to invest in and upgrade their access networks in order to maintain a compelling service offering, drive new revenue opportunities and maintain and grow their subscriber base. Access networks can meaningfully affect the ongoing success of CSPs.
Governments around the world recognize the importance of expanding broadband networks and delivering advanced broadband services to more people and businesses. For example, in February 2009, the U.S. government passed the American Recovery and Reinvestment Act ("ARRA"), which set aside approximately $7.2 billion as Broadband Stimulus funds for widening the reach of broadband access across the United States, a portion of which includes broadband access equipment. These funds, distributed in the form of grants, loans and loan guarantees, primarily target wireline and wireless service providers operating in rural, unserved and underserved areas in the United States. Many CSPs have actively pursued stimulus funds and have submitted various proposals to receive assistance for their broadband access infrastructure projects. Awards for these projects were issued between December 2009 and September 2010. The timetable for completion of funded projects varies between the two agencies administering the awards. Projects funded under the Broadband Technology Opportunities Program ("BTOP"), which is administered by the National Telecommunications and Information Administration ("NTIA"), were completed by September 30, 2013. Projects funded under the Broadband Initiatives Program ("BIP"), which is administered by the Rural Utilities Service, must be completed by June 30, 2015.
Limitations of Traditional Access Networks
CSPs rely on the capabilities and quality of their access networks to sustain their business and relationships with their subscribers. In the past, subscribers had little influence over the types of services provided by CSPs. Today, subscribers can be more selective among CSPs and they are increasingly demanding advanced broadband services in addition to basic voice and data services. In general, access networks are highly capital intensive and CSPs have historically upgraded capacity as technology and subscriber demands on their networks changed. We believe CSPs will increasingly integrate fiber-and Ethernet-based access networks to enable the delivery of more advanced broadband services at a lower cost while at the same time enabling the continued delivery of basic voice and data services. Thus far, CSPs have taken an incremental approach to capacity upgrades in their access networks. As a result CSPs face multiple challenges concerning their access networks, business models and service delivery capabilities, including:
|
•
|
A Complex Patchwork of Networks and Technologies—In order to upgrade their access networks CSPs have typically added networks for new residential or business services that they deliver, such as digital subscriber line ("DSL"), data over cable service interface specification ("DOCSIS"), GPON or Gigabit Ethernet on top of existing networks. This led to an overbuild of access technologies and an unnecessarily complex patchwork of physical connections between the central office and the subscriber. In addition, CSPs have generally begun to expand the penetration of fiber into their access networks, thereby shortening the length of the subscriber connection through other lower bandwidth media types (such as copper-based or coaxial cable-based networks). CSPs have also attempted to evolve their access networks to enable more efficient packet-based services by adding Ethernet protocols on top of existing asynchronous transfer mode ("ATM"), and DSL protocols. In addition, CSPs have often deployed separate equipment to facilitate the delivery of Synchronous Optical Networking ("SONET"), Gigabit Ethernet and 10 Gigabit Ethernet transport, which connects CSP central offices with their access networks, further increasing the complexity and the cost of their networks. This approach has left most CSPs with disparate architectures, features, functions and capabilities in different parts of their networks. This increasingly complex, patchwork approach to deploying access networks and delivering new services to their subscribers has created potential complications for CSPs within their access networks. These potential complications limit data transmission capability, increase the cost of operation and maintenance and can negatively impact the subscriber experience.
|
|
•
|
Limited Capacity from Legacy Access Architectures—Legacy access network architectures were designed to address earlier generation communication demands of wireline telephone, cable television and cellular services. Such access networks have physical limitations in their ability to scale bandwidth, avoid latency issues and deliver advanced broadband services, which subscribers demand today and are expected to increasingly demand in the future. In addition, CSPs understand the need to add fiber to their networks to provide the bandwidth required to scale advanced broadband services. However, it is costly and complex to integrate fiber-based technologies into legacy access networks.
|
|
•
|
Inflexible Technologies Increase Network Switching Costs—Legacy access networks were architected around a narrow set of technologies. For example, traditional voice calls use circuit switching technology to allocate a fixed amount of network capacity to each call, regardless of whether such capacity is fully utilized. The emergence of packet-based technologies, primarily IP and Ethernet, has significantly improved the ability to transmit data efficiently across networks as bandwidth is only consumed when signals are actually being transmitted. Most legacy access networks do not allow circuit- and packet-based technologies to co-exist or to evolve from one technology to another.
|
|
•
|
Inefficient Service Roll-out Constrains Subscriber Offerings—Legacy access networks were designed to support a narrow range of services and as a result, they limit the ability of CSPs to provision the advanced broadband services increasingly demanded by
|
5
their subscribers. Packet-based networks are more flexible and efficient than traditional circuit-switched networks. For example, to provision additional business services in a legacy access network, a CSP would typically deploy additional physical connections and equipment, whereas packet-based infrastructure allows a CSP to change or add services virtually, without the presence of a service technician or the installation of new equipment. In order to deploy these services quickly and efficiently, CSPs must be able to utilize their existing infrastructure while upgrading the legacy access network to packet-based technologies.
|
•
|
Highly Reliable Access Products are Difficult to Engineer and Manage—Given the critical nature of access networks and their typical deployment in remote and distant locations, access infrastructure products must be highly reliable. Unlike most other communications equipment which is deployed in environmentally controlled data centers, central offices or similar facilities, most access equipment is deployed in outdoor environments and must be specifically engineered to operate in variable and often extremely harsh conditions, as well as fit into smaller spaces, such as on a street corner, near office buildings or on the side of a house or cellular tower. Since the access portion of the network is broadly distributed, it is expensive as well as difficult to manage and maintain. CSPs require access network equipment that can perform reliably in these uncontrolled environments and be deployed in a variety of form factors, thereby adding significant engineering and product development challenges as compared to most other forms of communications infrastructure equipment. In addition, some portion of the access market is supported by government initiatives and products sold into this segment require additional government certifications and approvals in order to qualify for deployment.
|
|
•
|
Expensive to Deploy and Operate—As a result of deploying multiple networks with discrete functions, legacy access networks require a wide variety of equipment to be installed, maintained and ultimately replaced, thereby placing a significant and recurring capital and operating expense burden on the CSP. Once installed, this equipment occupies valuable space inside a data center or central office, requires frequent labor-intensive maintenance and consumes meaningful amounts of power. Moreover, the lack of integration across protocols and fiber- and copper-based network architectures negatively impacts network performance. Inferior network performance diminishes the subscriber experience and increases network operating costs by increasing service calls, the number of required support staff and the frequency of equipment upgrades and replacements. As broadband network availability and quality are becoming more critical to subscribers, lack of network reliability can be materially disruptive, expensive and ultimately increase subscriber churn, thereby negatively impacting the CSP’s business.
|
Given these limitations of legacy access networks, we believe CSPs will over time increasingly emphasize fiber- and Ethernet-based technologies in their access networks thereby enabling the rapid, cost-effective deployment of advanced broadband services. Such technologies reduce overhead expenses, simplify network architectures and seamlessly integrate legacy and next-generation networks. We therefore believe that successful CSPs will be those that evolve from providing basic subscriber connectivity to providing the most relevant services and subscriber experience.
The Calix Solution
We are a leading provider in North America of broadband communications access systems and software for fiber- and copper-based network architectures that enable CSPs to connect to their residential and business subscribers. Our Unified Access Infrastructure portfolio enables CSPs to quickly meet subscriber demands for both basic voice and data as well as advanced broadband services, while providing CSPs with the flexibility to optimize and transform their networks at a pace that balances their financial, competitive and technology needs. Our systems and software leverage packet-based technologies that enable CSPs to offer a wide range of revenue-generating services, from basic voice and data to advanced broadband services regardless of protocol or network connection media. Our Unified Access Infrastructure portfolio consists of our B-Series nodes, our C-Series platform, our E-Series platforms and nodes, and the BLM1500 gigabit passive optical network access terminal. These platforms, nodes, and terminals are complemented by the P-Series and T-Series optical network terminals and residential gateways, the CMS, EntriView element management software, and the Compass suite of value-added software applications.
We believe that our Unified Access portfolio of network and premises-based solutions provides the following benefits to CSPs:
• Single Unified Access Network for Basic and Advanced Services - Our Unified Access portfolio allows for a broad range of subscriber services to be provisioned and delivered over a single unified network. These systems can deliver basic voice and data, advanced broadband services, including high-speed Internet, IPTV, mobile broadband, high-definition video and online gaming, as well as integrated transport within our Unified Access portfolio, all of which can be monitored and managed by CMS. The BLM1500 terminals and their management system, EntriView, acquired in November 2012, are currently being integrated with CMS. In addition, our systems can be deployed in both small and large form factors across multiple deployment scenarios depending on subscriber proximity and service requirements. Our multiservice approach allows CSPs to utilize their legacy access networks during the course of their equipment upgrade and network transformation, saving them time and money in delivering both basic voice and data and advanced broadband services.
• High Capacity and Operational Efficiency - Our Unified Access portfolio is designed to facilitate the evolution of CSP access networks to fiber- and Ethernet-based network architectures. Our portfolio includes platforms that exceed the capacity of the products of our most direct competitors. Our platforms are designed and optimized for fiber- and copper-based network architectures. We also have a broad portfolio of feature-rich fiber ONTs that serve as the on-premises gateways for new services to subscribers. Our extended reach GPON offers our customers greater capacity and operational efficiencies, including the ability to reach subscribers further away from a CSP’s central office, thereby also allowing CSPs to consolidate multiple central offices and further reduce operating expense. Furthermore, our ONTs auto-detect fiber access technologies supporting both GPON and point-to-point Gigabit Ethernet and provide CSPs additional cost and management efficiencies.
• Highly Flexible Technology Solutions - Our Unified Access portfolio enables CSPs to utilize legacy access network infrastructure during their migration towards fiber- and Ethernet-based access networks. Our portfolio supports multiple protocols, different form
6
factors and modular options optimized for a variety of installation locations and environments and multiple services delivered over fiber- and copper-based network architectures.
• Seamless Transition to Advanced Services - Our Unified Access portfolio enables CSPs to better manage the evolution of their access networks by transitioning the delivery of basic voice and data services to advanced broadband services. Our C-Series platform supports ongoing demand for basic voice and data services and facilitates a seamless and controlled migration to IP-based services. For CSPs without legacy network constraints, our B-Series nodes and E-Series platforms, and our BLM1500 terminals allow CSPs to deploy advanced broadband services rapidly and cost effectively to their subscribers.
• Highly Reliable and Purpose-Built Solutions for Demands of Access - Our Unified Access portfolio is designed for high availability and purpose-built for the demands of access network deployments. Our carrier-class products are predominantly environmentally hardened and field-tested to be capable of withstanding harsh environmental conditions, including temperatures between -40 and 65 degrees Celsius, extremely dry or wet conditions and physical abuse. Our access systems are built and tested to meet or exceed network equipment-building system standards, which are a set of safety, spatial and environmental design guidelines for telecommunications equipment. Our products are highly compatible and designed to be easily integrated into the existing operational and management infrastructure of CSP access networks. Our portfolio can be deployed in multiple form factors and power configurations to address a wide range of deployment scenarios influenced by space and power constraints.
• Compelling Customer Value Proposition - We believe our Unified Access portfolio offers CSPs a compelling value proposition. Our portfolio provides CSPs the flexibility to upgrade their networks over time, reduce operational costs and maximize their return on capital expenditures. Our packet-based platforms enable CSPs to offer new services more quickly and generate new revenue opportunities. We believe the interoperability and compatibility of our portfolio reduces the complexity and cost of managing CSP networks.
Our Strategy
Our Unified Access portfolio enables the delivery of basic voice and data and advanced broadband services, across multiple protocols and form factors over fiber- and copper-based network architectures. Our objective is to leverage our Unified Access portfolio to become the leading supplier of access systems and software that enable CSPs to transform their networks and business models to meet the changing demands of their subscribers. The principal elements of our strategy are:
•
Continue Our Sole Focus on Access Systems and Software
- Our dedicated focus on access has been an important driver of our success with our customers. We believe our focus has allowed us to develop innovative access systems and a highly efficient service and deployment model that have been widely implemented by CSPs. Virtually all of our large competitors in the access market devote some percentage of their resources to products outside of the access network, and in some cases, products not even designed for CSPs. We intend to continue to focus our efforts on the access market, which we believe will enable us to continue to deliver compelling, timely and innovative access solutions to CSPs.
•
Continue to Enable our Customers to Transform Their Networks and Business Models
- We believe that residential and business subscribers are pressuring CSPs to expand their offerings through the delivery of superior subscriber experiences. In response, CSPs need to transform their networks and business models by rapidly provisioning new services while minimizing the capital and operational costs of their networks. We believe our Unified Access portfolio enables CSPs to introduce new revenue-generating services as demanded by their subscribers.
•
Continue to Engage Directly with Customers
- We operate a differentiated business model focused on aligning with our customers, predominantly through direct engagement, service and support. Our direct customer engagement model allows us to target our sales resources as well as align our product development efforts closely to our customers' needs. Our direct engagement model is a key differentiator for our business and is critical to our continued market leadership. Although we do utilize resellers in some markets, particularly in international markets, our practice is to sell along-side the reseller and maintain the benefits of a close customer relationship.
•
Leverage our Growing Customer Footprint
- As of December 31, 2013, nearly eighteen million ports of our Unified Access portfolio have been deployed at a growing number of CSPs worldwide, whose networks serve over 100 million subscriber lines in total. Our customers include many of the world's largest communications providers. This footprint provides us with the opportunity to sell additional components of our Unified Access portfolio to existing customers. For example, the vast majority of our existing customers have purchased additional line cards and other products from us after their initial purchase. We have also demonstrated that our footprint, combined with the flexibility of our portfolio, gives us incumbency benefits to sell complementary or new offerings in the future.
•
Expand Deliberately into New Market and Applications
- We believe that a disciplined approach to targeting markets and applications is critical to our long-term success. For example, we initially focused on rural ILECs and have achieved an industry leadership position as the majority of U.S. Independent Operating Companies ("IOCs"), have deployed our access systems and software. We have also recently entered new geographic markets, including Africa, Asia, Australia, Europe, and Latin America. These deployments complement our now significant deployments in Canada and the Caribbean. We will continue our disciplined approach of targeting new markets and applications in which we believe our products will rapidly gain customer adoption. For example, we are targeting additional markets for our fiber access solutions, including the mobile backhaul and cable business services markets.
•
Pursue Strategic Relationships, Alliances and Acquisitions
- We intend to continue to pursue strategic technology and distribution relationships, alliances and acquisitions that align us with CSPs' strategic direction to increase revenue-generating services while reducing the cost to deploy and operate their access networks. We believe these relationships, alliances and acquisitions will allow us to grow our footprint and enhance our ability to sell our access systems and software. We developed and
7
invested in the Calix Compatible Program to assure interoperability across the ecosystem of the majority of vendors critical for implementing and delivering new advanced broadband services. This program has approximately 65 technology members to date and enables our customers to rapidly deploy proven solutions in their access networks. We work with Ericsson Inc. (“Ericsson”) and others to provide advanced broadband solutions globally, including efforts to ensure successful interoperation between our products and Ericsson's Mediaroom IPTV application. In addition, our acquisitions of Optical Solutions, Inc. ("OSI") in 2006 and Occam Networks, Inc. ("Occam") in 2011, and our acquisition of fiber access assets from Ericsson in November 2012, have provided us with leading copper and fiber access technologies that have been integrated into our Unified Access portfolio.
Customers
We operate a differentiated customer engagement model that focuses on direct alignment with our customers through sales, service and support. In order to allocate our product development and sales efforts efficiently, we believe that it is critical to target markets, customers and applications deliberately. We have traditionally targeted CSPs, which own, build and upgrade their own access networks and which also value strong relationships with their access systems and software suppliers.
The U.S. ILEC market is composed of three distinct “tiers” of carriers, which we categorize based on their subscriber line counts and geographic coverage. Tier 1 CSPs are very large with wide geographic footprints. They have greater than five million subscriber lines and they generally correspond with the former Regional Bell Operating Companies. Tier 2 CSPs also operate typically within a wide geographic footprint, but are smaller in scale, with subscriber lines that range from approximately half a million subscriber lines to approximately five million subscriber lines. Their service coverage areas are predominantly regional in scope and therefore are often known as Regional Local Exchange Carriers ("RLECs"). Tier 3 CSPs consist of over 1,000 predominantly local operators typically focused on a single or a cluster of communities. Often called IOCs, they range in size from a few hundred to approximately half a million subscriber lines. Because of similarities in subscriber line size and focused market footprint, we typically include Competitive Local Exchange Carriers and municipalities in this market segment.
To date, we have focused primarily on CSPs in the North American market. Our existing customers' networks serve over 100 million subscriber lines. A representative Tier 1 customer is CenturyLink, Inc. ("CenturyLink"). Representative Tier 2 customers include Frontier, Windstream Corp., Fairpoint, TDS Telecommunications Corporation, and Cincinnati Bell. Our Tier 3 CSP customers have historically accounted for a large percentage of our sales. We also serve new entrants to the access services market who are building their own access networks, including cable MSOs, such as Cox Communications, and municipalities. Moreover, we have entered new geographic markets, such as Africa, Asia, Australia, Europe, and Latin America that complement our significant market presence in Canada and the Caribbean. We anticipate that we will continue to target CSPs globally as part of our expansion strategy.
We have a few large customers who have represented a significant portion of our sales in any given period. In 2013, 2012, and 2011, we had one such customer, CenturyLink, who accounted for
26%
, 21%, and 20% of our revenue, respectively.
Some of our customers within the United States use or expect to use government-supported loan programs or grants to finance capital spending. Loans and grants through RUS, which is a part of the United States Department of Agriculture, are used to promote the development of telecommunications infrastructure in rural areas. In addition, the Broadband Stimulus initiatives under the ARRA have also made funds available to certain of our customers.
Sales to customers outside of the United States represented approximately
13%
, 7%, and 6% of our revenues for the years ended December 31, 2013, 2012, and 2011, respectively. Historically, our sales outside of the United States were predominantly to customers in the Caribbean and Canada. We expect growth in sales to other international locations to become more important over time.
Customer Engagement Model
We design, market and sell our access systems and software predominantly through our direct sales force, supported by marketing and product management personnel, although we have recently expanded this model to include resellers both in North America and globally, including a global reseller relationship with Ericsson. Our sales effort is organized either by named accounts or regional responsibilities. Account teams comprise sales managers, supported by sales engineers and account managers, who work to target and sell to existing and prospective CSPs. The sales process includes analyzing their existing networks and identifying how they can utilize our products within their networks. We also offer advice regarding eligibility and also support proposals to the appropriate agencies when we are a material supplier. Even in circumstances where a reseller is involved, our sales and marketing personnel are often selling side-by-side with the reseller. We believe that our direct customer engagement approach provides us with significant differentiation in the customer sales process by aligning us more closely with our customers' changing needs.
As part of our sales process, CSPs will usually perform a lab trial or a field trial of our access systems prior to full-scale commercial deployment. This is most common for CSPs purchasing a particular access system for the first time. Upon successful completion, the CSP generally accepts the lab and field trial equipment installed in its network and may continue with deployment of additional access systems. Our sales cycle, from initial contact with a CSP through the signing of a purchase agreement, may, in some cases, take several quarters.
Typically our customer agreements contain general terms and conditions applicable to purchases of our access systems and software. By entering into a customer agreement with us, a customer does not become obligated to order or purchase any fixed or minimum quantities of our access systems and software. Our customers generally order access systems and software from us by submitting purchase orders that describe, among other things, the type and quantities of our access systems and software that they desire to order, the delivery and installation terms and other terms that are applicable to our access systems and software. Customers who have been awarded RUS loans or grants are required to contract under form contracts approved by RUS.
Our direct customer engagement model extends to service and support. Our service and support organization works closely with our customers to ensure the successful installation and ongoing support of our Unified Access portfolio. Our service and support organization
8
provides technical product support and consults with our customers to address their needs. We offer our customers a range of support offerings, including program management, training, installation and post-sales technical support. As a part of our pre-sales effort, our engineers design the implementation of our products in our customers’ access networks to meet our customers’ performance and interoperability requirements. Although some of our reseller arrangements allow resellers to provide support, training, installation, and post-sales technical support, these resellers still rely heavily on us to provide support to the customer.
Our U.S. and China based technical support organization offers support 24 hours a day, seven days a week. With an active Calix Advantage agreement, customers receive a license to CMS, access to telephone support and online technical information, software product upgrades and maintenance releases, advance return materials authorization and on-site support, if necessary. Calix Advantage agreements are renewable on an annual basis. Most of our customers renew their Calix Advantage agreement. In addition, we offer extended warranty services for our products in one to five-year durations, which include the right to warranty coverage beyond the standard warranty period. The purchase of such extended warranties is initially recorded as deferred revenue. At the end of 2013, we had $21.1 million of deferred revenue associated with such extended warranties. For customers not under a Calix Advantage agreement or who have not purchased extended warranty services, product support and warranty services are provided for a fee on a per-incident basis. Outside North America, we typically cooperate with channel partners to provide local service and support to our end customers in those locations.”
Products and Technology
We develop, sell and support carrier-class hardware and software products, which we refer to as our Unified Access portfolio. Our Unified Access portfolio enables CSPs to deliver both basic voice and data and advanced broadband services over legacy and next-generation access networks. Our Unified Access portfolio consists of the following key features:
• Broad Product Offering — We offer a comprehensive portfolio of access systems and software that is deployed in the portion of the network that extends from the data center, central office, or similar facilities to a subscriber's premises. We sell our access systems in a variety of form factors, modular options and configurations that are important to CSPs. Our network-based products include our B-Series nodes, which provides multiservice over Ethernet via distributed nodes, our C-Series platform, which is our multiservice, multiprotocol access platform, and our Ethernet-focused E-Series platforms, which provide cost-effective, flexible service delivery of IP-based services. Our premises-based offering consists of our P-Series and T-Series ONTs and residential gateways, which are deployed in combination with our B-Series, C-Series and E-Series platforms and nodes, as well as the BLM1500 terminal. We offer an extensive line of ONTs and residential gateways to enable our customers to connect to their subscribers across a diverse set of form factors, protocols and functionality requirements.
• Multiservice and Multiprotocol — We develop our products and an extensive offering of service interfaces to ensure CSPs can connect to their subscribers to enable the delivery of basic voice and data or advanced broadband services over fiber- and copper-based network architectures regardless of protocol. Our C-Series platform also enables CSPs to integrate IP and legacy protocols as well as the integration of fiber- and copper-based connectivity in a single chassis. In doing so, the C-Series platform allows CSPs to evolve their access infrastructures over time. Our B-Series nodes and E-Series platforms and nodes are multiservice but focus solely on Ethernet. Our B-Series nodes are focused on CSPs using Ethernet over copper and fiber and a distributed architecture to transform their networks. Our E-Series platforms and nodes are well suited for CSPs who are using Ethernet to transform their networks. Our B-Series, C-Series, and E-Series platforms and nodes are often, but are not required to be, deployed together so that the C-Series platform can act as a protocol gateway for our B-Series and E-Series platforms and nodes.
• Common Operating System Kernel — All of our access systems are interoperable and are designed to be easily deployed and managed together as a single, unified access network. The C7, E7 and most other E-Series nodes utilize a common Ethernet kernel, which we refer to as the Ethernet eXtensible Architecture ("EXA"), which was developed based on industry standard protocols and focused on the needs of the access network. Because our core platforms leverage this common operating system kernel, we can develop, test and introduce new access systems and software rapidly, and enable our customers to deploy advanced broadband services at their desired pace.
• Unified Network Management — Our CMS is server-based network management software capable of overseeing and managing multiple B-Series, C-Series, and E-Series networks. In addition, CMS performs all provisioning, maintenance and troubleshooting operations across disparate access technologies and networks through a common user interface. This enables CSPs to manage and unify the various elements of our Unified Access portfolio as a single, scalable platform. CMS is often integrated by our customers with their back-office systems for billing and provisioning. EntriView, the element management system for the BLM1500, is in the process of being integrated with CMS.
Our Unified Access portfolio allows CSPs to transform their legacy and mixed protocol access networks to fiber and Ethernet over time. CSPs often deploy our B-Series nodes, C-Series, and/or E-Series platforms, and our BLM1500 together in data centers, central offices, or similar facilities to interconnect data centers and central offices. Our C-Series platform can act as a protocol gateway when deployed with our B-Series and E-Series platforms and nodes. Our B-Series and E-Series platforms and nodes can be deployed either in data centers, central offices, remote network locations, existing cabinets or in customer premises locations depending upon the CSP's requirements. All of our B-Series, C-Series and E-Series platforms and nodes interoperate with and can terminate network traffic from our P-Series ONTs. We expect to have the BLM1500 terminals and T-Series ONTs and residential gateways, acquired in November 2012, interoperable with E-Series platforms and nodes in early 2014.
9
A graphic representation of how the various components of our Unified Access portfolio work together as of the end of 2013 is shown in the network diagram below:

The graphic above depicts how a CSP might deploy our Unified Access portfolio in a CSP network. The network is divided into five segments: (1) the routed core network, (2) the data center / central office, (3) the remote terminal, (4) the node and (5) the subscriber, business or multi-dwelling unit ("MDU"), premises. First, voice, video or data content is aggregated by a router in the network core and transferred to a B6, C7, or E7. The content is then sent around a redundant Ethernet transport ring, which operates using the 10 Gigabit Ethernet or Gigabit Ethernet standard. The ring consists of a variety of Calix access platforms or nodes, including B6s, C7s, E7s and E5s, each of which may be located in other central offices or in remote terminal locations closer to subscribers. Content can be pulled from any one of these locations and delivered either to a Calix platform located at a remote node or directly to a subscriber premises. In the case where content is delivered to another Calix platform, the content can be delivered over a variety of fiber-based technologies, such as 10 Gigabit Ethernet, Gigabit Ethernet or multiple Gigabit Ethernet, or NxGE. Delivery to the subscriber premises over fiber or copper transmission lines is the final part of the access network. Delivery over fiber lines uses GPON, point-to-point Ethernet services, and delivery over copper lines uses DSL services or plain old telephone service ("POTS"). Our CMS manages all aspects of the Unified Access portfolio and supports features that allow remote management of equipment across the network, including equipment at the subscriber premises. The BLM1500 terminals and T-Series ONTs and residential gateways (not pictured) at the end of 2013 operated independently of the other Unified Access portfolio systems and are managed via the EntriView element management system, although we plan to enable them to interoperate with E-Series platforms and nodes, as well as CMS, in early 2014.
Calix B-Series Ethernet Service Access Nodes
Our B-Series Ethernet service access nodes consist of chassis-based nodes that are designed to support an array of advanced IP-based services offered by CSPs. Our B-Series nodes are designed to be carrier-class and enable CSPs to implement advanced Ethernet transport and aggregation, as well as voice, data and video services over both fiber- and copper-based network architectures. Our B-Series nodes are environmentally hardened and can be deployed in a variety of network locations, including data centers, central offices, remote terminals, video headends and co-location facilities. In addition, due to the small size of some of our B-Series nodes, many can be installed in confined locations such as remote nodes and multi-dwelling units. As such, many of our B-Series nodes can be deployed in most competitor and other third-party cabinets, or as stand-alone sealed nodes in our access network. Our B-Series nodes are managed using our CMS and can be deployed in conjunction with our C-Series and E-Series platforms as well as our P-Series ONTs. We believe the deployment flexibility and Ethernet focus of our B-Series nodes make them well suited for CSPs extending Ethernet services and fiber closer to the subscriber premises.
Our B6 has three form factors. Our B6-001 is a one rack unit chassis with one line card slot, whereas the B6-006 is a 7 rack unit chassis with six line card slots and the B6-012 is a 12 rack unit chassis with 20 service line card slots. Our B6s deliver Ethernet services over fiber, including a wide range of GPON, point-to-point Gigabit Ethernet, and 10 Gigabit Ethernet services.
10
Key technology differentiators of the B-Series nodes are:
• Multiservice over Ethernet—Our B-Series nodes enable CSPs to offer high bandwidth, advanced broadband and low latency services across Ethernet over fiber- and copper-based network architectures.
• Deployment Flexibility—Our B-Series nodes are composed of three distinct form factor chassis between 1 and 12 rack units in height. The B-Series nodes are designed to deliver operational efficiencies without sacrificing deployment flexibility or service functionality. Our B-Series node options are optimally sized to deliver high bandwidth services from a data center, central office, remote terminal, remote node or MDU. For CSPs seeking additional flexibility and performance, the B6s can be combined with C-Series and E-Series platforms and nodes, all of which are managed by our CMS.
• High Capacity and Reliability—Our B-Series nodes have high data throughput capacity and are designed to meet the demanding bandwidth and low latency requirements of advanced broadband services for residential and business subscribers. Our B-Series nodes support a range of transport options from multiple 10 Gigabit Ethernet uplinks in each chassis down to redundant Gigabit Ethernet ports. The distributed intelligence of the B6s supports 10 gigabits per second in each deployed line card. The B6s also support T1 circuit emulation and are designed to be Metro Ethernet Forum (MEF 9 and MEF 14) compliant and to meet Network Equipment-Building System ("NEBS") requirements.
• Broad Array of Advanced Services Support—Our B-Series nodes support a broad array of advanced services including up to 48 VDSL2 and 48 ADSL2+ overlay or combination voice and DSL services ports as well as DSL port bonding on each line card, and offers multiple Gigabit Ethernet network uplinks. Our B6s also support a mix of GPON, point-to-point gigabit Ethernet and multiple Gigabit Ethernet and 10 Gigabit Ethernet ports. Line card options include a mix of GPON, point-to-point gigabit Ethernet, and 10 Gigabit Ethernet services, as well as traffic management and queuing, performance monitoring, and virtual local area network stacking to support quality of service.
The following pictures depict the B-Series nodes:

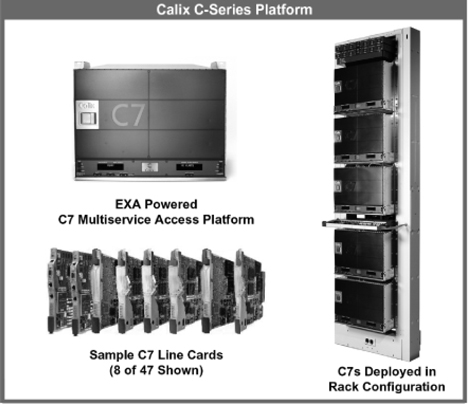
Calix C-Series Multiservice, Multiprotocol Access Platform
Our C7 multiservice, multiprotocol access platform ("C-Series platform"), is designed to support a wide array of basic voice and data services offered by CSPs, while also supporting advanced, high-speed, packet-based services such as Gigabit Ethernet, GPON and DSL (including very high-speed digital subscriber line 2 ("VDSL2"), and asymmetrical digital subscriber line 2+ ("ADSL2+") and advanced applications like IPTV. In so doing, our C-Series platform facilitates network transformation by integrating the functions required to transport and deliver voice, data and video services over both fiber- and copper-based network architectures. Our C-Series platform is a chassis-based product with 23 line card slots, three of which are used for common logic, switching fabric and uplinks, with the remaining 20 slots available for any service interface card we offer. Our C-Series platform is managed using our CMS. Our high-capacity C-Series platform is flexible and is designed to be deployed in a variety of locations, including data centers, central offices, remote terminals, video headends and co-location facilities. Our C-Series platform leverages a common operating system kernel, the EXA, that it shares with most of our E-Series Ethernet service access platforms and nodes ("E-Series platforms and nodes"), allowing for common provisioning and facilitated platform interoperability. The multiprotocol and integrated transport capabilities of our C-Series platform allow it to be deployed as an aggregation or gateway device for our B-Series and E-Series platforms and nodes and P-Series ONTs.
11
Key technology differentiators of the C-Series platform are:
• Protocol Independent—Our C-Series platform enables the integration of multiple protocols through a system architecture where line cards perform specific protocol processing.
• High Capacity—Our C-Series platform can enable up to 200 gigabits per second total throughput capacity. It can provide service delivery speeds of up to 10 gigabits per second in network transport rings or directly to subscribers, which is significantly greater than the bandwidth that CSPs are typically providing to their subscribers. This enables CSPs to scale their advanced broadband service offerings over time without the need to change their equipment.
• Flexible Switching Architecture—Our C-Series platform supports a highly scalable switching architecture with characteristics similar to high performance routers. All services are converted to packets on line cards allowing our platform to natively switch circuits, cells and packets. As a result, both legacy and advanced packet-based services can be supported simultaneously or uniformly, allowing the C-Series to be deployed as a pure Ethernet delivery platform, a traditional service delivery platform or a hybrid services platform.
• Density—In typical applications, a single 14-inch high C-Series platform shelf can terminate 480 copper-based subscriber connections, or up to 5,120 fiber-to-the premises, or FTTP, subscribers using GPON. This functionality allows up to 2,400 subscribers of advanced broadband services over copper-based networks or over 25,000 subscribers over fiber-based networks to be served out of a single seven-foot rack in the central office.
• Reduced Risk of Technological Obsolescence—As new services and technologies are introduced to the network, our flexible C-Series architecture allows CSPs to add or swap line cards to introduce new functionality into the access system. New services such as IPTV and voice-over-Internet-protocol require new features like Internet Group Management Protocol channel change processing and protocol gateway support, which can easily be added without substantial changes to existing equipment. As a result, equipment purchased by CSPs can have longer useful lives, which can reduce CSPs’ capital expenditures. The C7 can also support IPTV.
• Extensive Line Card Offering—Currently our C-Series platform offers 47 line cards that enable a diverse set of trunk and subscriber interfaces, ranging from basic voice service and specialized circuits to advanced broadband services such as packet-based Fast and gigabit Ethernet, SONET (up to optical carrier-48, or OC-48), VDSL2 and ADSL2+ across multiple copper pairs and GPON. In addition, our C-Series platform supports multiple combinations of service interface cards in any slot at any time. We believe this flexibility provides CSPs the ability to evolve networks toward higher-capacity, packet-based service offerings in a minimally disruptive and cost-effective manner.
The following pictures depict the C-Series platform and sample line cards:
12
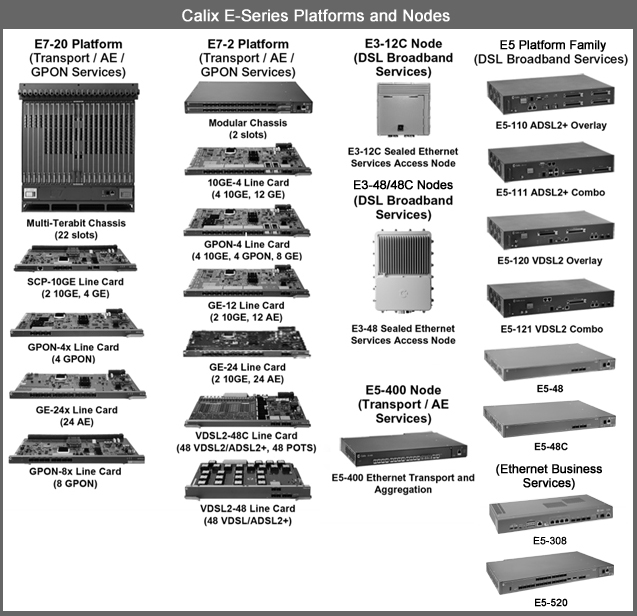
Calix E-Series Ethernet Service Access Platforms and Nodes
Our E-Series Ethernet service access platforms and Ethernet service access nodes ("E-Series platforms and nodes"), consist of chassis-based platforms as well as fixed form factor nodes that are designed to support an array of advanced IP-based services offered by CSPs. Our E-Series platforms and nodes are designed to be carrier-class and enable CSPs to implement advanced Ethernet transport and aggregation, as well as voice, data and video services over both fiber- and copper-based network architectures. Our E-Series platforms and nodes are environmentally hardened and can be deployed in a variety of network locations, including data centers, central offices, remote terminals, video headends and co-location facilities. In addition, due to the small size of many of our E-Series platforms, most can be installed in confined locations such as remote nodes and multi-dwelling units. As such, many of our E-Series platforms and nodes can be deployed in most competitor and other third-party cabinets, or as stand-alone sealed nodes in our access network. Our E-Series platforms and nodes are managed using our CMS and can be deployed in conjunction with our B-Series nodes, C-Series platform, and P-Series. We expect to make our T-Series ONTs and residential gateways interoperable with our E-Series platform and nodes in early 2014. We believe the deployment flexibility and Ethernet focus of our E-Series platforms and nodes make them well suited for CSPs extending Ethernet services and fiber closer to the subscriber premises.
Our E7 has two form factors. Our E7-2 is a one rack unit chassis with two line card slots, whereas the E7-20 is a 13 rack unit chassis with two common control card slots and 20 service line card slots. Our E7s deliver Ethernet services over copper and fiber, including a wide range of GPON, point-to-point Gigabit Ethernet, VDSL2, and 10 Gigabit Ethernet services. Our other E-Series nodes include the fixed form factor E5-48, E5-48C, E5-100 and E5-400 node families, as well as the E3-12C, E3-48 and E3-48C sealed Ethernet service access nodes, which collectively deliver high-speed broadband with interfaces that range from 10 Gigabit Ethernet transport and aggregation to ADSL2+, VDSL2, and point-to-point Gigabit Ethernet.
Key technology differentiators of the E-Series platforms and nodes are:
• Standards-Based Switching Architecture—Our E7 and many of our E5s and E3s utilize a common Ethernet kernel, the EXA, that was developed based on industry standard protocols and focused on the needs of the access network. EXA facilitates cross network awareness, installation, management and provisioning for our C-Series platform and our E-Series platforms.
• Multiservice over Ethernet—Our E-Series platforms and nodes enable CSPs to offer high bandwidth, advanced broadband and low latency services across Ethernet over fiber- and copper-based network architectures.
• Deployment Flexibility—Our E-Series platforms and nodes are composed of eight distinct small form factor configurations between 1 and 1.5 rack units in height and a 13 rack unit large chassis. The E-Series platforms and nodes are designed to deliver operational efficiencies without sacrificing deployment flexibility or service functionality. Our E-Series platforms are optimally sized to deliver high bandwidth services from a data center, central office, remote terminal, remote node or MDU. For CSPs seeking additional flexibility and performance, the E7-2 is modular and stackable and can be combined with other E7s or other B-Series, C-Series and E-Series platforms and nodes, all of which are managed by our CMS. Also managed by CMS, the E7-20 was built for the high capacity, low latency needs of the future.
• High Capacity and Reliability—Our E-Series platforms and nodes have high data throughput capacity and are designed to meet the demanding bandwidth and low latency requirements of advanced broadband services for residential and business subscribers. Our E-Series platforms and nodes support a range of transport options from six 10 Gigabit Ethernet uplinks in each E7-2 chassis down to redundant Gigabit Ethernet in the E5-100 node family. Our chassis-based E7-2 supports a redundant 100 gigabits per second backplane in each deployable module with line cards that further support a minimum of 100 gigabits per second switching capacity. The E7-20 supports the same 100 gigabits per second line card switching capacity per card, but houses each card in a 20 service line card slot chassis with a two terabits per second backplane. The E7 and the E5-400 also support transparent local area network services and are designed to be Metro Ethernet Forum compliant and to meet NEBS requirements.
• Broad Array of Advanced Services Support—Our E-Series platforms and nodes support a broad array of advanced services. Our E5-48 and E5-100 node families support up to 48 VDSL2 and 48 ADSL2+ overlay or combination voice and DSL services ports as well as DSL port bonding, and offers multiple Gigabit Ethernet network uplinks. Our E3-12C supports up to 12 VDSL2 combination voice and DSL services ports as well as DSL port bonding, and offers multiple Gigabit Ethernet network uplinks. Our E3-48, E3-48C, E5-48, and E5-48C support up to 48 VDSL2 service ports as well as DSL port bonding and port vectoring, and offer multiple 10 Gigabit Ethernet and 2.5 or single Gigabit Ethernet uplinks. Our E7 and the E5-400 support a mix of GPON, multiple Gigabit Ethernet and 10 Gigabit Ethernet ports. Line card options include a mix of GPON, point-to-point Gigabit Ethernet, 10 Gigabit Ethernet services, and in the case of the E7-2, 48 ports of VDSL2 combo services on a line card, which translates into an industry-leading 96 VDSL2 combo ports in a 1 rack unit form factor, as well as traffic management and queuing, performance monitoring and virtual local area network stacking to support quality of service.
13
The following pictures depict the E-Series platforms and nodes:
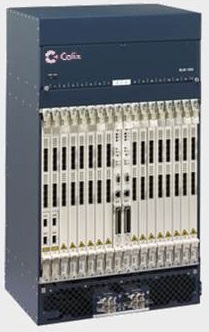
Calix BLM1500 Gigabit Passive Optical Network Access Terminals
Our BLM1500 GPON access terminals are chassis-based systems that are designed to support an array of advanced IP-based services offered by CSPs. Our BLM1500 terminals are designed to be carrier-class and enable CSPs to implement advanced services such as voice, data and video services over fiber-based network architectures. Our BLM1500 terminals are deployed in data centers and central offices and are managed using our EntriView element management system. Our T-Series ONTs and residential gateways are deployed with the BLM1500 terminals. We believe the GPON and Ethernet focus of our BLM1500 terminals make them well suited for CSPs building large, carrier-class fiber access network. We launched our BLM1500 terminals in November 2012, following our acquisition of Ericsson's EDA 1500 GPON technology.
Our BLM1500 is a 17 rack unit chassis with two common control card slots and 18 service line card slots. Our BLM1500s deliver GPON-based Ethernet services over fiber. Key technology differentiators of the BLM1500 terminals are:
• Multiservice over Ethernet—Our BLM1500 terminals enable CSPs to offer high bandwidth, advanced broadband and low latency GPON services across Ethernet over fiber-based network architectures.
• High Capacity and Reliability—Our BLM1500 terminals have high data throughput capacity and are designed to meet the demanding bandwidth and low latency requirements of advanced broadband services for residential subscribers. Our BLM1500 supports a 320 gigabits per second backplane and houses up to 18 service line cards, including both 4-port and 8-port GPON line cards.
14
• Global Tier 1 Backoffice Integration—Our BLM1500 terminals and the EntriView element management system have been integrated into backoffice systems and deployed at dozens of Tier 1 CSPs globally.
The following picture depicts a BLM1500 terminal:
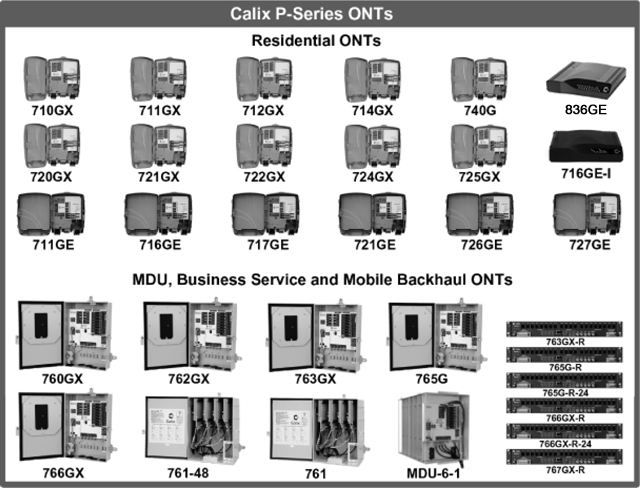
Calix P-Series Optical Network Terminals and Residential Gateways
Our P-Series ONTs and residential gateways consist of a broad range of customer premises solutions, including standards-based ONTs and residential gateways, for residential and business use in conjunction with our B-Series, C-Series, and E-Series platforms and nodes. Our P-Series ONTs and residential gateways can auto-detect the bandwidth of the network and enable CSPs to change line rates and features without expensive truck rolls or hardware replacements. Our family of ONTs and residential gateways is designed to support advanced broadband services, such as IPTV, RF video, business services and mobile backhaul (including Ethernet OAM support for conformance with service level agreements). The design and flexibility of the P-Series allows CSPs to lower initial capital expenditures as well as reduce operational costs. To meet the deployment and service requirement needs of CSPs, we offer a growing number of ONT and residential gateway models available in a variety of form factors tailored to multiple deployment scenarios, including single homes, MDUs, businesses and cellular towers as illustrated below:
15
Calix T-Series Optical Network Terminals and Residential Gateways
Our T-Series ONTs consist of a broad range of customer premises solutions, including standards-based ONTs and residential gateways, for residential and business use with our BLM1500 terminals and E7 ESAPs. Our T-Series ONTs and residential gateways are designed to support advanced broadband services, such as IPTV, high speed data, and voice services. We launched our T-Series ONTs and residential gateways in November 2012, following our acquisition of Ericsson's EDA 1500 GPON technology and its supplementary ONT portfolio.
To meet the deployment and service requirement needs of CSPs, we currently offer a variety of ONT and residential gateway models available in an array of indoor form factors as illustrated below:

16
Calix Management System and EntriView
Our CMS and EntriView element management systems are server-based network management software, which enables CSPs to remotely manage their access networks and scale bandwidth capacity to support advanced broadband services and video. Our CMS and EntriView systems are capable of overseeing and managing multiple standalone networks and perform all provisioning, maintenance and troubleshooting operations for these networks across our B-Series, C-Series, and E-Series platforms and nodes (CMS) and BLM1500 terminals (EntriView). Additionally, our CMS and EntriView systems are designed to scale from small networks to large, geographically dispersed networks consisting of hundreds or even thousands of our access systems. Our CMS provides an enhanced graphic user interface and delivers a detailed view and interactive control of various management functions, such as access control lists, alarm reporting and security. For very large CSPs, our CMS and EntriView systems can be used in conjunction with operational support systems to manage large, global networks with tens of millions of subscribers. Our CMS and EntriView systems are scalable to support large networks and enables integration into the other management systems of our customers. For smaller CSPs, our CMS operates as a standalone element management system, managing service provisioning and network troubleshooting for hundreds of independent C-Series and E-Series networks consisting of thousands of shelves and P-Series ONTs.
We offer CSPs a graphical user interface-based management software for provisioning and troubleshooting a service, and the capacity for bulk provisioning and reporting for thousands of elements simultaneously. Our CMS also has open application programming interfaces that allow third-party software developers to extend our functionality to include home provisioning, remote troubleshooting and applications monitoring and management. The following pictures are sample screenshots illustrating CMS and EntriView functionality and variety of third-party applications:

17

Compass by Calix
Compass is an expanding suite of software applications that enables CSPs to accelerate their business transformation. Each Compass application is designed to directly affect key business and market functions within CSPs, and can help them to expand revenue, increase customer satisfaction, optimize network resources, and reduce the cost of delivering services. Compass applications are offered using a software-as-a-service (“SaaS”) model based on a low monthly service fee and no upfront hardware or licensing fees. Every application is hosted in a cloud-based data center, alleviating CSPs’ need to deploy, operate, or maintain physical hardware for Compass applications, and is accessed through our Command Center subscriber interface.
Flow Analyze offers a tool that provides an in-depth view of the traffic in CSP networks on a real-time basis. This view of traffic is non-intrusive, and can be focused on a per-service, per-subscriber, per-location, and per-interface basis-both in real time and as a historical report. As a result, service providers can see what actually happened when a problem occurred in their network at any time. By monitoring subscriber usage data, as well as tracking universal subscriber identification mapping, Flow Analyze provides a low cost solution for generating monthly-usage billing reports and diagnosing subscriber complaints.
Consumer Connect enables service providers to remotely activate new broadband devices and manage home networks, creating new revenue sources, improved customer satisfaction, and reduced service delivery costs. Consumer Connect provides TR-069 ACS device management via a cloud-based software-as-a-service solution hosted by Calix, and offers such features as auto-discovery of intelligent devices within the home, auto-support of new TR-069 devices, bulk gateway maintenance, and DHCP server functionality as well as the ability to push service profiles to gateways. Consumer Connect also shares a common customer ID with Flow Analyze, allowing the applications to work closely together. Consumer connect can also provide remote customer LAN diagnostics as well as LAN visibility to help track consumer electronics trends.
18
The following picture is a sample screenshot and illustration of Flow Analyze and Consumer Connect functionality:


Research and Development
Continued investment in research and development is critical to our business. Our research and development team is composed of engineers with expertise in hardware, software and optics. Our team of engineers is primarily based in our Petaluma, California headquarters, the Minneapolis, Minnesota facility, the Santa Barbara and San Jose, California facilities, and the Nanjing, China facility, with additional engineers located in Acton, Massachusetts. We also outsource a portion of our software development to a team of software engineers based in Shenyang, China. Our research and development team is responsible for designing, developing and enhancing our hardware and software platforms, performing product and quality assurance testing and ensuring the compatibility of our products with third-party hardware and software products. We have made significant investments in our Unified Access portfolio. We intend to continue to dedicate significant
19
resources to research and development and to develop new product capabilities to support the performance, scalability and management of our Unified Access portfolio. For the years ended 2013, 2012, and 2011, our research and development expenses totaled
$79.3 million
, $66.7 million, and $67.7 million, respectively.
Manufacturing
We work closely with third parties to manufacture and deliver our products. Our manufacturing organization consists primarily of supply chain managers, new product introduction personnel and test engineers. We outsource our manufacturing and order fulfillment and tightly integrate our supply chain management and new product introduction activities. We primarily utilize Flextronics International Ltd. ("Flextronics"), as our contract manufacturer. Our relationship with Flextronics allows us to conserve working capital, reduce product costs and minimize delivery lead times while maintaining high product quality. Generally, new product introduction occurs in Flextronics’ facilities in Milpitas, California. Once product manufacturing quality and yields reach a satisfactory level, volume production and testing of circuit board assemblies, chassis and fan trays occur in Shanghai, China. Final system and cabinet assembly and testing are performed in Flextronics’ facilities in Guadalajara, Mexico. Order fulfillment is performed by Pegasus Logistics Group, Inc. in Texas. We also evaluate and utilize other vendors for various portions of our supply chain from time to time, including order fulfillment of our circuit boards. This model allows us to operate with low inventory levels while maintaining the ability to scale quickly to handle increased order volume.
Product reliability is essential for our customers, who place a premium on continuity of service for their subscribers. We perform rigorous in-house quality control testing to help ensure the reliability of our systems. Our internal manufacturing organization designs, develops and implements complex test processes to help ensure the quality and reliability of our products.
The manufacturing of our products by contract manufacturers is a complex process and involves certain risks, including the potential absence of adequate capacity, the unavailability of or interruptions in access to certain process technologies, and the reduced control over delivery schedules, manufacturing yields, quality and costs. As such, we may experience production problems or manufacturing delays in the future. Additionally, shortages in components that we use in our systems are possible and our ability to predict the availability of such components, some sourced from a single or limited source of supply, may be limited. Our systems include some components that are proprietary in nature and only available from a single source, as well as some components that are generally available from a number of suppliers. The lead times associated with certain components are lengthy and preclude rapid changes in product specifications or delivery schedules. In some cases, significant time would be required to establish relationships with alternate suppliers or providers of proprietary components. We generally do not have long-term contracts with component providers that guarantee the supply of components or their manufacturing services. If we experience any difficulties in managing relationships with our contract manufacturers, or any interruption in our own operations or our contract manufacturers operations or if a supplier is unable to meet our needs, we may encounter manufacturing delays that could impede our ability to meet our customers’ requirements and harm our business, operating results and financial condition. Our ability to deliver products in a timely manner to our customers would be adversely impacted materially if we needed to qualify replacements for any of the components used in our systems.
To date, we have not experienced significant delays or material unanticipated costs resulting from the use of our contract manufacturers. Additionally, we believe that our current contract manufacturers and our facilities can accommodate an increase in capacity for production sufficient for the foreseeable future.
Seasonality
Fluctuations in our revenue occur due to many factors, including the varying budget cycles for our customers and seasonal buying patterns of our customers. More specifically, our customers tend to spend less in the first fiscal quarter as they are finalizing their annual budgets.
Intellectual Property
Our success depends upon our ability to protect our core technology and intellectual property. To accomplish this, we rely on a combination of intellectual property rights, including patents, trade secrets, copyrights and trademarks, as well as customary contractual protections. In addition, we generally control access to and the use of our proprietary technology and other confidential information. This protection is accomplished through a combination of internal and external controls, including contractual protections with employees, contractors, customers and partners, and through a combination of U.S. and international intellectual property laws.
As of December 31, 2013, we held 86 U.S. patents and had 36 pending U.S. patent applications. One of the U.S. patents is also covered by granted international patents in three countries.
As of December 31, 2013, we had no pending international patent applications. Patents generally have a term of twenty years from filing. As our patent portfolio has been built over time, the remaining terms on the individual patents vary. Information pertaining to our patents such as filing dates and terms is available free-of-charge at the United States Patent and Trademark Office website at www.uspto.gov.
We rely on intellectual property laws, as well as nondisclosure agreements, licensing arrangements and confidentially provisions, to establish and protect our proprietary rights. U.S. patent, copyright and trade secret laws afford us only limited protection, and the laws of some foreign countries do not protect proprietary rights to the same extent. Our pending patent applications may not result in issued patents, and the issued patents may not be enforceable. Any infringement of proprietary rights could result in significant litigation costs. Further, any failure by us to adequately protect our proprietary rights could result in competitors offering similar products, resulting in the loss of our competitive advantage and decreased sales.
We believe that the frequency of assertions of patent infringement continues to increase, as patent holders, including entities that are not in our industry and others who purchase patents as an investment or to monetize such rights by obtaining royalties, use such actions as a competitive tactic as well as a source of additional revenue. Any claim of infringement from a third party, even those without merit, could
20
cause us to incur substantial costs defending against such claims and could distract our management from running our business. Furthermore, a party making such a claim, if successful, could secure a judgment that requires us to pay substantial damages. A judgment could also include an injunction or other court order that could prevent us from selling our products. In addition, we might be required to seek a license for the use of such intellectual property, which may not be available on commercially reasonable terms or at all. Alternatively, we may be required to develop non-infringing technology, which would require significant effort and expense and may ultimately not be successful.
Competition
The communications access equipment market is highly competitive. Competition in this market is based on any one or a combination of the following factors:
• price;
• functionality;
• existing business and customer relationships;
• the ability of products and services to meet customers’ immediate and future network requirements;
• product quality;
• installation capability;
• service and support;
• scalability; and
• manufacturing capability.
We compete with a number of companies within markets that we serve and we anticipate that competition will intensify. ADTRAN, Inc., enjoys strong supplier relationships with the largest U.S. ILECs, commands the leading market share position in DSL access multiplexers, and has a broad international business. Other established suppliers with which we compete include Alcatel-Lucent S.A.; Ciena Corporation; Huawei Technologies Co.; Ltd., Tellabs, Inc.; and ZTE Corporation. There are also a number of smaller companies with which we compete in various geographic or vertical markets, including Zhone Technologies, Inc. While most of these smaller competitors lack broad national scale and product portfolios, they can offer strong competition on a deal-by-deal basis. As we expand into adjacent markets, we expect to encounter new competitors. Competition in the communications access equipment market is dominated by a small number of large, multi-national corporations. Many of our competitors have substantially greater name recognition and technical, financial and marketing resources, and greater manufacturing capacity, as well as better established relationships with CSPs, than we do. Many of our competitors have greater resources to develop products or pursue acquisitions, and more experience in developing or acquiring new products and technologies and in creating market awareness for these products and technologies. In addition, a number of our competitors have the financial resources to offer competitive products at below market pricing levels that could prevent us from competing effectively. Further, a number of our competitors have built long-standing relationships with some of our prospective customers and provide financing to customers and could, therefore, have an advantage in selling products to those customers.
Government Funding Initiatives
Many of our customers fund deployment of and improvements to telecommunications network infrastructure using government funds. In the United States, CSPs are required under the Federal Communications Commission's rules to contribute a percentage of their revenues to the federal Universal Service Fund. In early October 2011, the then-chairman of the FCC outlined a plan to transform the Universal Service Fund, an $8 billion fund that is paid for by the nation's telephone customers and used to subsidize basic telephone service in rural areas, into one that will help expand broadband Internet service to 18 million Americans who lack high-speed access. These funds, now governed by a new set of rules now called the Connect America Fund ("CAF"), are distributed as subsidies to CSPs serving rural subscribers that are expensive to reach as well as to low-income consumers, schools and libraries, and rural health care facilities. In late 2013, the new FCC chairman shared plans to review the implementation of these programs. RUS administers funds through a separate U.S. government initiative to promote the development of telecommunications infrastructure in rural areas through loans, loan guarantees and grants. Some of our U.S. customers have been awarded RUS loans, and we have provided the network equipment for such projects.
Employees
As of December 31, 2013, we employed a total of 738 full-time employees, of which 583 employees were located in the United States. None of our employees is represented by a labor union with respect to his or her employment with us. We have not experienced any work stoppages, and we consider our relations with our employees to be good.
Corporate Information
Calix, a Delaware corporation, was founded in August 1999. Our principal executive offices are located at 1035 N. McDowell Boulevard, Petaluma, California 94954, and our telephone number is (707) 766-3000. Our website address is www.calix.com. We do not incorporate the information on or accessible through our website into this Form 10-K, and you should not consider any information on, or that can be accessed through, our website as part of this Form 10-K. Calix®, the Calix logo design, B6™, C7®, E5™, E7™ and other trademarks or service marks of Calix appearing in this report on Form 10-K are the property of Calix. Trade names, trademarks and service marks of other companies appearing in this report on Form 10-K are the property of the respective holders. Calix is subject to the information and periodic reporting requirements of the Securities Exchange Act of 1934 ("Exchange Act") and files periodic reports, proxy statements and other information with the Securities and Exchange Commission ("SEC"). Such periodic reports, proxy statements and other information are available for inspection and copying at the SEC’s Public Reference Room at 100 F Street, NE., Washington, DC 20549 or may be obtained by calling the SEC at 1-800-SEC-0330. In addition, the SEC maintains a Web site at http://www.sec.gov that contains reports, proxy statements
21
and other information regarding issuers that file electronically with the SEC. Calix posts on the Investor Relations page of its Web site, www.calix.com, a link to its filings with the SEC, as soon as reasonably practical after they are filed electronically with the SEC.
|
ITEM 1A.
|
Risk Factors
|
We have identified the following additional risks and uncertainties that may affect our business, financial condition and/or results of operations. Investors should carefully consider the risks described below, together with the other information set forth in this Annual Report on Form 10-K, before making any investment decision. The risks described below are not the only ones we face. Additional risks not currently known to us or that we currently believe are immaterial may also significantly impair our business operations. Our business could be harmed by any of these risks. The trading price of our common stock could decline due to any of these risks, and investors may lose all or part of their investment.
Risks Related to Our Business and Industry
Our markets are rapidly changing, which make it difficult to predict our future revenue and plan our expenses appropriately.
We compete in markets characterized by rapid technological change, changing needs of communications service providers, or CSPs, evolving industry standards and frequent introductions of new products and services. In addition, we likely will be required to reposition our product and service offerings and introduce new products and services as we encounter rapidly changing CSP requirements and increasing competitive pressures. We may not be successful in doing so in a timely and responsive manner, or at all. Also, softness in demand across any of our customer markets, including due to macro-economic conditions beyond our control or uncertainties associated with the implementation of regulatory reforms, could lead to unexpected slowdown in capital expenditures by service providers, such as that which occurred in the fourth quarter of 2013. As a result, it is difficult to forecast our future revenues and plan our operating expenses appropriately, which also makes it difficult to predict our future operating results.
We have a history of losses, and we may not be able to generate positive operating income and maintain positive cash flows in the future.
We have experienced net losses in each year of our existence. For the years ended December 31, 2013, December 31, 2012, and December 31, 2011, we incurred net losses of
$17.3 million
,
$28.3 million
, and $52.6 million, respectively. As of
December 31, 2013
, we had an accumulated deficit of
$509.8 million
.
We expect to continue to incur significant expenses for research and development, sales and marketing, customer support and general and administrative functions as we expand our operations. Given our growth rate and the intense competitive pressures we face, we may be unable to control our operating costs.
We cannot guarantee that we will achieve profitability in the future. We will have to generate and sustain significant and consistent increased revenue, while continuing to control our expenses, in order to achieve and then maintain profitability. We may also incur significant losses in the future for a number of reasons, including the risks discussed in this “Risk Factors” section and other factors that we cannot anticipate. If we are unable to generate positive operating income and maintain positive cash flows from operations, our liquidity, results of operations and financial condition will be adversely affected.
Fluctuations in our quarterly and annual operating results may make it difficult to predict our future performance, which could cause our operating results to fall below investor or analyst expectations, which could adversely affect the trading price of our stock.
A number of factors, many of which are outside of our control, may cause or contribute to significant fluctuations in our quarterly and annual operating results. These fluctuations may make financial planning and forecasting difficult. Comparing our operating results on a period-to-period basis may not be meaningful, and you should not rely on our past results as an indication of our future performance. If our revenue or operating results fall below the expectations of investors or securities analysts, or below any guidance we may provide to the market, the price of our common stock would likely decline. Moreover, we may experience delays in recognizing revenue under applicable revenue-recognition rules, particularly from government-funded contracts, such as those funded by U.S. Department of Agriculture’s Rural Utility Service ("RUS”). The extent of these delays and their impact on our revenues can fluctuate over a given time period depending on the number and size of purchase orders under these contracts during such time period. In addition, unanticipated decreases in our available liquidity due to fluctuating operating results could limit our growth and delay implementation of our expansion plans.
In addition to the other risk factors listed in this “Risk Factors” section, factors that may contribute to the variability of our operating results include:
|
•
|
our ability to predict our revenue and plan our expenses appropriately;
|
|
•
|
the capital spending patterns of CSPs and any decrease or delay in capital spending by CSPs due to macro-economic conditions, regulatory implementation or uncertainties, or other reasons;
|
|
•
|
the impact of government-sponsored programs on our customers;
|
|
•
|
intense competition;
|
|
•
|
our ability to develop new products or enhancements that support technological advances and meet changing CSP requirements;
|
|
•
|
our ability to achieve market acceptance of our products and CSPs' willingness to deploy our new products;
|
|
•
|
the concentration of our customer base;
|
|
•
|
the length and unpredictability of our sales cycles;
|
|
•
|
our focus on CSPs with limited revenue potential;
|
|
•
|
our lack of long-term, committed-volume purchase contracts with our customers;
|
|
•
|
our ability to increase our sales to larger North American as well as international CSPs;
|
22
|
•
|
our exposure to the credit risks of our customers;
|
|
•
|
fluctuations in our gross margin;
|
|
•
|
the interoperability of our products with CSP networks;
|
|
•
|
our dependence on sole- and limited-source suppliers;
|
|
•
|
our ability to manage our relationships with our contract manufacturers;
|
|
•
|
our ability to forecast our manufacturing requirements and manage our inventory;
|
|
•
|
our products' compliance with industry standards;
|
|
•
|
our ability to expand our international operations;
|
|
•
|
our ability to protect our intellectual property and the cost of doing so;
|
|
•
|
the quality of our products, including any undetected hardware defects or bugs in our software;
|
|
•
|
our ability to estimate future warranty obligations due to product failure rates;
|
|
•
|
our ability to obtain necessary third-party technology licenses;
|
|
•
|
the attraction and retention of qualified employees and key management personnel; and
|
|
•
|
our ability to maintain proper and effective internal controls.
|
Our business is dependent on the capital spending patterns of CSPs, and any decrease or delay in capital spending by CSPs, in response to economic conditions, uncertainties associated with the implementation of regulatory reforms, or otherwise, would reduce our revenues and harm our business.
Demand for our products depends on the magnitude and timing of capital spending by CSPs as they construct, expand, upgrade and maintain their access networks. The recent economic downturn has contributed to a slowdown in telecommunications industry spending, including in the specific geographies and markets in which we operate. In response to reduced consumer spending, challenging capital markets or declining liquidity trends, capital spending for network infrastructure projects of CSPs could be delayed or canceled. In addition, capital spending is cyclical in our industry and sporadic among individual CSPs, and can change on short notice. As a result, we may not have visibility into changes in spending behavior until nearly the end of a given quarter.
CSP spending on network construction, maintenance, expansion and upgrades is also affected by reductions in their budgets, delays in their purchasing cycles, access to external capital, e.g., government grants and loan programs or the capital markets, and seasonality and delays in capital allocation decisions. For example, we experienced lower than expected sales in the fourth quarter of 2013 because we believe our CSP customers had spent more than usual in the first three quarters of 2013 and they did not have enough in their budgets left in the fourth quarter to make significant purchases.
Many factors affecting our results of operations are beyond our control, particularly in the case of large CSP orders and network infrastructure deployments involving multiple vendors and technologies where the achievement of certain thresholds for acceptance is subject to the readiness and performance of the CSP or other providers, and changes in CSP requirements or installation plans. Further, CSPs may not pursue infrastructure upgrades that require our access systems and software. Infrastructure improvements may be delayed or prevented by a variety of factors including cost, regulatory obstacles (including uncertainties associated with the implementation of regulatory reforms), mergers, lack of consumer demand for advanced communications services and alternative approaches to service delivery. Reductions in capital expenditures by CSPs may slow our rate of revenue growth. As a consequence, our results for a particular period may be difficult to predict, and our prior results are not necessarily indicative of results likely in future periods.
Government-sponsored programs could impact the timing and buying patterns of CSPs, which may cause fluctuations in our operating results.
Many of our U.S. customers are Independent Operating Companies ("IOCs"), which have revenues that are particularly dependent upon interstate and intrastate access charges, and federal and state subsidies. The Federal Communications Commission ("FCC"), and some states are considering changes to such payments and subsidies, and these changes could reduce IOC revenues. Furthermore, many IOCs use or expect to use, government-supported loan programs or grants, such as RUS loans and grants to finance capital spending. Changes to these programs could reduce the ability of IOCs to access capital and thus reduce our revenue opportunities.
Many of our customers were awarded grants or loans under government stimulus programs such as the Broadband Stimulus programs under the American Recovery and Reinvestment Act of 2009 ("ARRA") and have purchased and will continue to purchase products from us or other suppliers while such programs and funding remain in place. However, customers may substantially curtail future purchases of products as ARRA funding winds down or because all purchases have been completed. The timetable for completion of funded projects varies between the two agencies administering the awards. Projects funded under the Broadband Technology Opportunities Program, which is administered by the National Telecommunications and Information Administration, were required to be completed by September 30, 2013 and no government funds will be distributed for work undertaken after that date. Projects funded under the Broadband Initiatives Program, which is administered by the Rural Utilities Service, must be completed by June 30, 2015.
The revenue recognition guidelines related to the sales of our access systems to CSPs who have received Broadband Stimulus funds may create uncertainties around the timing of our revenue, which could harm our financial results. In addition, any changes in government regulations and subsidies could cause our customers to change their purchasing decisions, which could have an adverse effect on our operating results and financial condition.
We face intense competition that could reduce our revenue and adversely affect our financial results.
The market for our products is highly competitive, and we expect competition from both established and new companies to increase. Our competitors include companies such as ADTRAN, Inc., Alcatel- Lucent S.A., Ciena Corporation, Huawei Technologies Co., Ltd. and ZTE Corporation, among others.
23
Our ability to compete successfully depends on a number of factors, including:
|
•
|
the successful development of new products;
|
|
•
|
our ability to anticipate CSP and market requirements and changes in technology and industry standards;
|
|
•
|
our ability to differentiate our products from our competitors' offerings based on performance, cost-effectiveness or other factors;
|
|
•
|
our ongoing ability to successfully integrate acquired product lines and customer bases into our business;
|
|
•
|
our ability to gain customer acceptance of our products; and
|
|
•
|
our ability to market and sell our products.
|
The broadband access equipment market has undergone consolidation in recent years, as participants have merged, made acquisitions or entered into partnerships or other strategic relationships with one another to offer more comprehensive solutions than they individually had offered. Examples include our acquisitions of Occam in February 2011 and of Ericsson's fiber access assets in November 2012, Adtran's acquisition of Nokia Siemens' broadband access line business in May 2012, and Cisco’s acquisition of ClearAccess in May 2012. We expect this trend to continue as companies attempt to strengthen or maintain their market positions in an evolving industry.
Many of our current or potential competitors have longer operating histories, greater name recognition, larger customer bases and significantly greater financial, technical, sales, marketing and other resources than we do and are better positioned to acquire and offer complementary products and services. Many of our competitors have broader product lines and can offer bundled solutions, which may appeal to certain customers. Our competitors may also invest additional resources in developing more compelling product offerings. Potential customers may also prefer to purchase from their existing suppliers rather than a new supplier, regardless of product performance or features, because the products that we and our competitors offer require a substantial investment of time and funds to install.
Some of our competitors may offer substantial discounts or rebates to win new customers or to retain existing customers. If we are forced to reduce prices in order to secure customers, we may be unable to sustain gross margins at desired levels or achieve profitability. Competitive pressures could result in increased pricing pressure, reduced profit margins, increased sales and marketing expenses and failure to increase, or the loss of, market share, any of which could reduce our revenue and adversely affect our financial results.
Product development is costly and if we fail to develop new products or enhancements that meet changing CSP requirements, we could experience lower sales.
Our market is characterized by rapid technological advances, frequent new product introductions, evolving industry standards and unanticipated changes in subscriber requirements. Our future success will depend significantly on our ability to anticipate and adapt to such changes, and to offer, on a timely and cost-effective basis, products and features that meet changing CSP demands and industry standards.
We intend to continue making significant investments in developing new products and enhancing the functionality of our existing products. Developing our products is expensive, complex and involves uncertainties. We may not have sufficient resources to successfully manage lengthy product development cycles. For the years ended December 31, 2013, 2012 and 2011, our research and development expenses were
$79.3 million
, or
21%
of our revenue,
$66.7 million
, or 20% of our revenue, and $67.7 million, or 20% of our revenue, respectively. We believe that we must continue to dedicate a significant amount of resources to our research and development efforts to maintain our competitive position. These investments may take several years to generate positive returns, if ever. In addition, we may experience design, manufacturing, marketing and other difficulties that could delay or prevent the development, introduction or marketing of new products and enhancements. If we fail to meet our development targets, demand for our products will decline.
In addition, the introduction of new or enhanced products also requires that we manage the transition from older products to these new or enhanced products in order to minimize disruption in customer ordering patterns, fulfill ongoing customer commitments and ensure that adequate supplies of new products are available for delivery to meet anticipated customer demand. If we fail to maintain compatibility with other software or equipment found in our customers' existing and planned networks, we may face substantially reduced demand for our products, which would reduce our revenue opportunities and market share. Moreover, as customers complete infrastructure deployments, they may require greater levels of service and support than we have provided in the past. We may not be able to provide products, services and support to compete effectively for these market opportunities. If we are unable to anticipate and develop new products or enhancements to our existing products on a timely and cost-effective basis, we could experience lower sales, which would harm our business.
Our new products are early in their life cycles and are subject to uncertain market demand. If our customers are unwilling to install our products or deploy new services or we are unable to achieve market acceptance of our new products, our business and financial results will be harmed.
Our new products are early in their life cycles and are subject to uncertain market demand. They also may face obstacles in manufacturing, deployment and competitive response. Potential customers may choose not to invest the additional capital required for initial system deployment of new products. In addition, demand for new products is dependent on the success of our customers in deploying and selling advanced services to their subscribers. Our products support a variety of advanced broadband services, such as high-speed Internet, Internet protocol television, mobile broadband, high-definition video and online gaming, and basic voice and data services. If subscriber demand for such services does not grow as expected or declines, or if our customers are unable or unwilling to deploy and market these services, demand for our products may decrease or fail to grow at rates we anticipate.
Our customer base is concentrated, and there are a limited number of potential customers for our products. The loss of any of our key customers, a decrease in purchases by our key customers or our inability to grow our customer base would adversely impact our revenues.
Historically, a large portion of our sales has been to a limited number of customers. For example, for the years ended December 31, 2013, 2012 and 2011, CenturyLink accounted for
26%
, 21% and 20%, respectively, of our revenue. However, we cannot anticipate the level of CenturyLink's purchases in the future.
24
We anticipate that a large portion of our revenues will continue to depend on sales to a limited number of customers. In addition, some larger customers may demand discounts and rebates or desire to purchase their access systems and software from multiple providers. As a result of these factors, our future revenue opportunities may be limited and our margins could be reduced, and our profitability may be adversely impacted. The loss of, or reduction in, orders from any key customer would significantly reduce our revenues and harm our business.
Furthermore, in recent years, the CSP market has undergone substantial consolidation. Industry consolidation generally has negative implications for equipment suppliers, including a reduction in the number of potential customers, a decrease in aggregate capital spending, and greater pricing leverage on the part of CSPs over equipment suppliers. Continued consolidation of the CSP industry and among the Incumbent Local Exchange Carrier ("ILEC") and IOC customers, who represent a large part of our business, could make it more difficult for us to grow our customer base, increase sales of our products and maintain adequate gross margins.
Our sales cycles can be long and unpredictable, and our sales efforts require considerable time and expense. As a result, our sales are difficult to predict and may vary substantially from quarter to quarter, which may cause our operating results to fluctuate significantly.
The timing of our revenues is difficult to predict. Our sales efforts often involve educating CSPs about the use and benefits of our products. CSPs typically undertake a significant evaluation process, which frequently involves not only our products but also those of our competitors and results in a lengthy sales cycle. We spend substantial time, effort and money in our sales efforts without any assurance that our efforts will produce any sales. In addition, product purchases are frequently subject to budget constraints, multiple approvals and unplanned administrative, processing and other delays. If sales expected from a specific customer for a particular quarter are not realized in that quarter or at all, we may not achieve our revenue forecasts and our financial results would be adversely affected.
Our focus on CSPs with relatively small networks limits our revenues from sales to any one customer and makes our future operating results difficult to predict.
We currently focus a large portion of our sales efforts on IOCs, cable multiple system operators ("MSOs") and selected international CSPs. Our current and potential customers generally operate small networks with limited capital expenditure budgets. Accordingly, we believe the potential revenues from the sale of our products to any one of these customers is limited. As a result, we must identify and sell products to new customers each quarter to continue to increase our sales. In addition, the spending patterns of many of our customers are characterized by small and sporadic purchases. As a consequence, we have limited backlog and will likely continue to have limited visibility into future operating results.
We do not have long-term, committed-volume purchase contracts with our customers, and therefore have no guarantee of future revenues from any customer.
Our sales are made predominantly via purchase orders, and typically we have not entered into long-term, committed-volume purchase contracts with our customers, including our key customers which account for a material portion of our revenues. As a result, any of our customers may cease to purchase our products at any time. In addition, our customers may attempt to renegotiate terms of sale, including price and quantity. If any of our key customers stop purchasing our access systems and software for any reason, our business and results of operations would be harmed.
Our efforts to increase our sales to larger North American as well as international CSPs, including MSOs, may be unsuccessful.
Our sales and marketing efforts have been focused on CSPs, including cable MSOs, in North America. A part of our long-term strategy is to increase sales to larger North American as well as international CSPs, including MSOs. We will be required to devote substantial technical, marketing and sales resources to the pursuit of these larger CSPs, who have lengthy equipment qualification and sales cycles, without any assurance of generating sales. In particular, sales to these larger CSPs may require us to upgrade our products to meet more stringent performance criteria, develop new customer-specific features or adapt our product to meet international standards. If we are unable to successfully increase our sales to larger CSPs, our operating results and long-term growth may be negatively impacted.
We are exposed to the credit risks of our customers, and if we have inadequately assessed their creditworthiness we may have more exposure to accounts receivable risk than we anticipate. Failure to collect our accounts receivable in amounts that we anticipate could adversely affect our operating results and financial condition.
In the course of our sales to customers, we may encounter difficulty collecting accounts receivable and could be exposed to risks associated with uncollectible accounts receivable. We maintain an allowance for doubtful accounts for estimated losses resulting from the inability or unwillingness of our customers to make required payments. However, these allowances are based on our judgment and a variety of factors about which our judgment may be wrong or that may change.
We perform credit evaluations of our customers' financial condition. However, our evaluation of the creditworthiness of customers may not be accurate if they do not provide us with timely and accurate financial information, or if their situations change after we evaluate their credit. While we attempt to monitor these situations carefully and attempt to adjust our allowances for doubtful accounts as appropriate, and take appropriate measures to collect accounts receivable balances, we have written down accounts receivable and written off doubtful accounts in prior periods and may be unable to avoid additional write-downs or write-offs of doubtful accounts in the future. Such write-downs or write-offs could negatively affect our operating results for the period in which they occur, and could harm our operating results.
Our gross margin may fluctuate over time and our current level of product gross margins may not be sustainable.
Our current level of product gross margins may not be sustainable and may be adversely affected by numerous factors, including:
|
•
|
changes in customer, geographic or product mix, including the mix of configurations within each product group;
|
|
•
|
increased price competition, including the impact of customer discounts and rebates;
|
25
|
•
|
our inability to reduce and control product costs;
|
|
•
|
changes in component pricing, changes in contract manufacturer rates, or charges incurred due to inventory holding periods if parts ordering does not correctly anticipate product demand;
|
|
•
|
introduction of new products;
|
|
•
|
changes in shipment volume;
|
|
•
|
changes in distribution channels;
|
|
•
|
increased warranty costs;
|
|
•
|
excess and obsolete inventory and inventory holding charges;
|
|
•
|
expediting costs incurred to meet customer delivery requirements; and
|
|
•
|
liquidated damages relating to customer contractual terms.
|
Our products must interoperate with many software applications and hardware products found in our customers' networks. If we are unable to ensure that our products interoperate properly, our business would be harmed.
Our products must interoperate with our customers' existing and planned networks, which often have varied and complex specifications, utilize multiple protocol standards, software applications and products from multiple vendors and contain multiple generations of products that have been added over time. As a result, we must continually ensure that our products interoperate properly with these existing and planned networks. To meet these requirements, we must undertake development efforts that require substantial capital investment and employee resources. We may not accomplish these development goals quickly or cost-effectively, if at all. If we fail to maintain compatibility with other software or equipment found in our customers' existing and planned networks, we may face substantially reduced demand for our products, which would reduce our revenue opportunities and market share.
We have entered into interoperability arrangements with a number of equipment and software vendors for the use or integration of their technology with our products. These arrangements give us access to, and enable interoperability with, various products that we do not otherwise offer. If these relationships fail, we may have to devote substantially more resources to the development of alternative products and processes, and our efforts may not be as effective as the combined solutions under our current arrangements. In some cases, these other vendors are either companies that we compete with directly, or companies that have extensive relationships with our existing and potential customers and may have influence over the purchasing decisions of those customers. Some of our competitors have stronger relationships with some of our existing and potential other vendors and, as a result, our ability to have successful interoperability arrangements with these companies may be harmed. Our failure to establish or maintain key relationships with third-party equipment and software vendors may harm our ability to successfully sell and market our products.
As we do not have manufacturing capabilities, we depend upon a small number of outside contract manufacturers and we do not have supply contracts with these manufacturers. Our operations could be disrupted if we encounter problems with these contract manufacturers.
We do not have internal manufacturing capabilities, and rely upon a small number of contract manufacturers to build our products. In particular, we rely on Flextronics for the manufacture of most of our products. Our reliance on a small number of contract manufacturers makes us vulnerable to possible capacity constraints and reduced control over component availability, delivery schedules, manufacturing yields and costs.
We do not have supply contracts with Flextronics or our other manufacturers. Consequently, these manufacturers are not obligated to supply products to us for any specific period, in any specific quantity or at any certain price. In addition, we have limited control over our contract manufacturers' quality systems and controls, and therefore may not be able to ensure levels of quality manufacture suitable for our customers.
The revenues that Flextronics generates from our orders represent a relatively small percentage of Flextronics' overall revenues. As a result, fulfilling our orders may not be considered a priority in the event Flextronics is constrained in its ability to fulfill all of its customer obligations in a timely manner. In addition, a substantial part of our manufacturing is done in Flextronics facilities that are located outside of the United States. We believe that the location of these facilities outside of the United States increases supply risk, including the risk of supply interruptions or reductions in manufacturing quality or controls.
If Flextronics or any of our other contract manufacturers were unable or unwilling to continue manufacturing our products in required volumes and at high quality levels, we would have to identify, qualify and select acceptable alternative contract manufacturers. An alternative contract manufacturer may not be available to us when needed or may not be in a position to satisfy our production requirements at commercially reasonable prices and quality. Any significant interruption in manufacturing would require us to reduce our supply of products to our customers, which in turn would reduce our revenues and harm our relationships with our customers.
We depend on sole-source and limited-source suppliers for key components and products. If we are unable to source these components on a timely basis, we will not be able to deliver our products to our customers.
We depend on sole-source and limited-source suppliers for key components of our products. For example, certain of our application-specific integrated circuits processors and resistor networks are purchased from sole-source suppliers. We may from time to time enter into original equipment manufacturer ("OEM") or original design manufacturer ("ODM") agreements to manufacture and/or design certain products in order to enable us to offer products into key markets on an accelerated basis. For example, a third party assisted in the design of and currently manufactures our E5-100 platform family.
Any of the sole-source and limited-source suppliers, OEMs and ODMs upon whom we rely could stop producing our components or products, cease operations or be acquired by, or enter into exclusive arrangements with, our competitors. We generally purchase our products through purchase orders and our purchase volumes are currently too low for us to be considered a priority customer by most of our suppliers.
26
As a result, most of these suppliers could stop selling to us at commercially reasonable prices, or at all. Any such interruption or delay may force us to seek similar components or products from alternative sources, which may not be available. Switching suppliers, OEMs or ODMs may require that we redesign our products to accommodate new components, and may potentially require us to re-qualify our products with our customers, which would be costly and time-consuming. Any interruption in the supply of sole-source or limited-source components for our products would adversely affect our ability to meet scheduled product deliveries to our customers, could result in lost revenue or higher expenses and would harm our business.
If we fail to forecast our manufacturing requirements accurately or fail to properly manage our inventory with our contract manufacturers, we could incur additional costs, experience manufacturing delays and lose revenue.
We bear inventory risk under our contract manufacturing arrangements. Lead times for the materials and components that we order through our contract manufacturers vary significantly and depend on numerous factors, including the specific supplier, contract terms and market demand for a component at a given time. Lead times for certain key materials and components incorporated into our products are currently lengthy, requiring us or our contract manufacturers to order materials and components several months in advance of manufacture.
If we overestimate our production requirements, we or our contract manufacturers may purchase excess components and build excess inventory. If our contract manufacturers, at our request, purchase excess components that are unique to our products or build excess products, we could be required to pay for these excess parts or products and their storage costs. Historically, we have reimbursed our primary contract manufacturers for a portion of inventory purchases when our inventory has been rendered obsolete, for example due to manufacturing and engineering change orders resulting from design changes manufacturing discontinuation of parts by our suppliers, or in cases where inventory levels greatly exceed projected demand. If we incur payments to our contract manufacturers associated with excess or obsolete inventory, this would have an adverse effect on our gross margins, financial condition and results of operations.
We have experienced unanticipated increases in demand from customers, which resulted in delayed shipments and variable shipping patterns. If we underestimate our product requirements, our contract manufacturers may have inadequate component inventory, which could interrupt manufacturing of our products and result in delays or cancellation of sales.
If we fail to comply with evolving industry standards, sales of our existing and future products would be adversely affected.
The markets for our products are characterized by a significant number of standards, both domestic and international, which are evolving as new technologies are developed and deployed. As we expand into adjacent markets and increase our international footprint, we are likely to encounter additional standards. Our products must comply with these standards in order to be widely marketable. In some cases, we are compelled to obtain certifications or authorizations before our products can be introduced, marketed or sold in new markets or to customers that we have not historically served. For example, our ability to maintain Operations System Modification for Intelligent Network Elements ("OSMINE") certification for our products will affect our ongoing ability to continue to sell our products to CenturyLink and other Tier 1 CSPs.
In addition, our ability to expand our international operations and create international market demand for our products may be limited by regulations or standards adopted by other countries that may require us to redesign our existing products or develop new products suitable for sale in those countries. Although we believe our products are currently in compliance with domestic and international standards and regulations in countries in which we currently sell, we may not be able to design our products to comply with evolving standards and regulations in the future. Accordingly, this ongoing evolution of standards may directly affect our ability to market or sell our products. Further, the cost of complying with the evolving standards and regulations, or the failure to obtain timely domestic or foreign regulatory approvals or certification such that we may not be able to sell our products where these standards or regulations apply, would result in lower revenues and lost market share.
We may be unable to successfully expand our international operations. In addition, we may be subject to a variety of international risks that could harm our business.
We currently generate most of our sales from customers in North America and have limited experience marketing, selling and supporting our products and services outside North America or managing the administrative aspects of a worldwide operation. While we are in the process of expanding our international operations, we may not be able to create or maintain international market demand for our products. In addition, as we expand our operations internationally, our support organization will face additional challenges including those associated with delivering support, training and documentation in languages other than English. If we invest substantial time and resources to expand our international operations and are unable to do so successfully and in a timely manner, our business, financial condition and results of operations will suffer.
In the course of expanding our international operations and operating overseas, we will be subject to a variety of risks, including:
|
•
|
differing regulatory requirements, including tax laws, trade laws, labor regulations, tariffs, export quotas, custom duties or other trade restrictions;
|
|
•
|
liability or damage to our reputation resulting from corruption or unethical business practices in some countries;
|
|
•
|
fluctuation in currency exchange rates;
|
|
•
|
longer collection periods and difficulties in collecting accounts receivable;
|
|
•
|
greater difficulty supporting and localizing our products;
|
|
•
|
different or unique competitive pressures as a result of, among other things, the presence of local equipment suppliers;
|
|
•
|
challenges inherent in efficiently managing an increased number of employees over large geographic distances, including the need to implement appropriate systems, policies, compensation and benefits and compliance programs;
|
|
•
|
limited or unfavorable intellectual property protection;
|
|
•
|
risk of change in international political or economic conditions, terrorist attacks or acts of war; and
|
|
•
|
restrictions on the repatriation of earnings.
|
27
We engage resellers, including Ericsson, to promote, sell, install and support our products to some customers in North America and internationally. Their failure to do so or our inability to recruit or retain appropriate resellers may reduce our sales and thus harm our business.
We engage some value added resellers ("VARs"), who provide sales and support services for our products. In particular, the non-exclusive reseller agreement entered into with Ericsson in 2012 has provided us with an extensive new global reseller channel. We compete with other telecommunications systems providers for our VARs' business and many of our VARs, including Ericsson, are free to market competing products. If Ericsson or any other VAR promotes a competitor's products to the detriment of our products or otherwise fails to market our products and services effectively, we could lose market share. In addition, the loss of a key VAR or the failure of VARs to provide adequate customer service could have a negative effect on customer satisfaction and could cause harm to our business. If we do not properly recruit and train VARs to sell, install and service our products, our business, financial condition and results of operations may suffer. Our use of VARs and other third-party support partners, and the associated risks of doing so, are likely to increase as we expand sales outside of North America.
We may have difficulty managing our growth, which could limit our ability to increase sales.
We have experienced significant growth in sales and operations in recent years. We expect to continue to expand our research and development, sales, marketing and support activities. Our historical growth has placed, and planned future growth is expected to continue to place, significant demands on our management, as well as our financial and operational resources, to:
|
•
|
manage a larger organization;
|
|
•
|
expand our manufacturing and distribution capacity;
|
|
•
|
increase our sales and marketing efforts;
|
|
•
|
broaden our customer-support capabilities;
|
|
•
|
implement appropriate operational and financial systems; and
|
|
•
|
maintain effective financial disclosure controls and procedures.
|
If we cannot grow, or fail to manage our growth effectively, we may not be able to execute our business strategies and our business, financial condition and results of operations would be adversely affected.
We may not be able to protect our intellectual property, which could impair our ability to compete effectively.
We depend on certain proprietary technology for our success and ability to compete.
As of December 31, 2013, we held 86 U.S. patents and had 36 pending U.S. patent applications. One of the U.S. patents is also covered by granted international patents in three countries.
We currently have no pending international patent applications. We rely on intellectual property laws, as well as nondisclosure agreements, licensing arrangements and confidentiality provisions, to establish and protect our proprietary rights. U.S. patent, copyright and trade secret laws afford us only limited protection, and the laws of some foreign countries do not protect proprietary rights to the same extent. Our pending patent applications may not result in issued patents, and our issued patents may not be enforceable. Any infringement of our proprietary rights could result in significant litigation costs. Further, any failure by us to adequately protect our proprietary rights could result in our competitors offering similar products, resulting in the loss of our competitive advantage and decreased sales.
Despite our efforts to protect our proprietary rights, attempts may be made to copy or reverse engineer aspects of our products or to obtain and use information that we regard as proprietary. Accordingly, we may be unable to protect our proprietary rights against unauthorized third-party copying or use. Furthermore, policing the unauthorized use of our intellectual property is difficult for us. Litigation may be necessary in the future to enforce our intellectual property rights, to protect our trade secrets or to determine the validity and scope of the proprietary rights of others. Litigation could result in substantial costs and diversion of resources and could harm our business.
We could become subject to litigation regarding intellectual property rights that could harm our business.
We may be subject to intellectual property infringement claims that are costly to defend and could limit our ability to use some technologies in the future. Third parties may assert patent, copyright, trademark or other intellectual property rights to technologies or rights that are important to our business. Such claims may involve non-practicing entities, patent holding companies or other adverse patent owners who have no relevant product revenue, and therefore our own issued and pending patents may provide little or no deterrence to suit from these entities.
We have received in the past and expect that in the future we may receive, particularly as a public company, communications from competitors and other companies alleging that we may be infringing their patents, trade secrets or other intellectual property rights and/or offering licenses to such intellectual property or threatening litigation. In addition, we have agreed, and may in the future agree, to indemnify our customers for any expenses or liabilities resulting from certain claimed infringements of patents, trademarks or copyrights of third parties. Any claims asserting that our products infringe, or may infringe on, the proprietary rights of third parties, with or without merit, could be time-consuming, resulting in costly litigation and diverting the efforts of our engineering teams and management. These claims could also result in product shipment delays or require us to modify our products or enter into royalty or licensing agreements. Such royalty or licensing agreements, if required, may not be available to us on acceptable terms, if at all.
The quality of our support and services offerings is important to our customers, and if we fail to continue to offer high quality support and services, we could lose customers, which would harm our business.
Once our products are deployed within our customers' networks, they depend on our support organization to resolve any issues relating to those products. A high level of support is critical for the successful marketing and sale of our products. If we do not effectively assist our customers in deploying our products, succeed in helping them quickly resolve post-deployment issues or provide effective ongoing support, it could adversely affect our ability to sell our products to existing customers and harm our reputation with potential new customers. As a result, our failure to maintain high quality support and services could result in the loss of customers, which would harm our business.
28
Our products are highly technical and may contain undetected hardware defects or software bugs, which could harm our reputation and adversely affect our business.
Our products are highly technical and, when deployed, are critical to the operation of many networks. Our products have contained and may contain undetected defects, bugs or security vulnerabilities. Some defects in our products may only be discovered after a product has been installed and used by customers, and may in some cases only be detected under certain circumstances or after extended use. Any errors, bugs, defects or security vulnerabilities discovered in our products after commercial release could result in loss of revenues or delay in revenue recognition, loss of customers and increased service and warranty cost, any of which could adversely affect our business, operating results and financial condition. In addition, we could face claims for product liability, tort or breach of warranty. Our contracts with customers contain provisions relating to warranty disclaimers and liability limitations, which may not be upheld. Defending a lawsuit, regardless of its merit, is costly and may divert management's attention and adversely affect the market's perception of us and our products. In addition, if our business liability insurance coverage proves inadequate or future coverage is unavailable on acceptable terms or at all, our business, operating results and financial condition could be adversely impacted.
Our estimates regarding future warranty obligations may change due to product failure rates, shipment volumes, field service obligations and rework costs incurred in correcting product failures. If our estimates change, the liability for warranty obligations may be increased, impacting future cost of revenue.
Our products are highly complex, and our product development, manufacturing and integration testing may not be adequate to detect all defects, errors, failures and quality issues. Quality or performance problems for products covered under warranty could adversely impact our reputation and negatively affect our operating results and financial position. The development and production of new products with high complexity often involves problems with software, components and manufacturing methods. If significant warranty obligations arise due to reliability or quality issues arising from defects in software, faulty components or manufacturing methods, our operating results and financial position could be negatively impacted by:
|
•
|
cost associated with fixing software or hardware defects;
|
|
•
|
high service and warranty expenses;
|
|
•
|
high inventory obsolescence expense;
|
|
•
|
delays in collecting accounts receivable;
|
|
•
|
payment of liquidated damages for performance failures; and
|
|
•
|
declining sales to existing customers.
|
Our use of open source software could impose limitations on our ability to commercialize our products.
We incorporate open source software into our products. Although we closely monitor our use of open source software, the terms of many open source software licenses have not been interpreted by the courts, and there is a risk that such licenses could be construed in a manner that could impose unanticipated conditions or restrictions on our ability to sell our products. In such event, we could be required to make our proprietary software generally available to third parties, including competitors, at no cost, to seek licenses from third parties in order to continue offering our products, to re-engineer our products or to discontinue the sale of our products in the event re-engineering cannot be accomplished on a timely basis or at all, any of which could adversely affect our revenues and operating expenses.
If we are unable to obtain necessary third-party technology licenses, our ability to develop new products or product enhancements may be impaired.
While our current licenses of third-party technology generally relate to commercially available off-the-shelf technology, we may in the future be required to license additional technology from third parties to develop new products or product enhancements. These third-party licenses may be unavailable to us on commercially reasonable terms, if at all. Our inability to obtain necessary third-party licenses may force us to obtain substitute technology of lower quality or performance standards or at greater cost, any of which could harm the competitiveness of our products and result in lost revenues.
Our failure or the failure of our contract manufacturers to comply with applicable environmental and other legal regulations could adversely impact our results of operations.
The manufacture, assembly and testing of our products may require the use of hazardous materials that are subject to environmental, health and safety regulations, or materials subject to international laws restricting the use of conflict minerals. Our failure or the failure of our contract manufacturers to comply with any of these applicable requirements could result in regulatory penalties, legal claims or disruption of production. In addition, our failure or the failure of our contract manufacturers to properly manage the use, transportation, emission, discharge, storage, recycling or disposal of hazardous materials could subject us to increased costs or liabilities. Existing and future environmental regulations and other legal requirements may restrict our use of certain materials to manufacture, assemble and test products. Any of these consequences could adversely impact our results of operations by increasing our expenses and/or requiring us to alter our manufacturing processes.
Regulatory and physical impacts of climate change and other natural events may affect our customers and our contract manufacturers, resulting in adverse effects on our operating results.
As emissions of greenhouse gases continue to alter the composition of the atmosphere, affecting large-scale weather patterns and the global climate, any new regulation of greenhouse gas emissions may result in additional costs to our customers and our contract manufacturers. In addition, the physical impacts of climate change and other natural events, including changes in weather patterns, drought, rising ocean and temperature levels, earthquakes and tsunamis may impact our customers, suppliers, contract manufacturers, and our operations. These potential physical effects may adversely affect our revenues, costs, production and delivery schedules, and cause harm to our results of operations and financial condition.
29
We may pursue acquisitions, which involve a number of risks. If we are unable to address and resolve these risks successfully, such acquisitions could disrupt our business.
On November 2, 2012, we acquired Ericsson's fiber access assets. On February 22, 2011, we acquired Occam Networks. We may in the future acquire other businesses, products or technologies to expand our product offerings and capabilities, customer base and business. We have evaluated, and expect to continue to evaluate, a wide array of potential strategic transactions. We have limited experience making such acquisitions. Any of these transactions could be material to our financial condition and results of operations. The anticipated benefit of acquisitions may never materialize. In addition, the process of integrating acquired businesses, products or technologies may create unforeseen operating difficulties and expenditures. Some of the areas where we may face acquisition-related risks include:
|
•
|
diversion of management time and potential business disruptions;
|
|
•
|
expenses, distractions and potential claims resulting from acquisitions, whether or not they are completed;
|
|
•
|
retaining and integrating employees from any businesses we may acquire;
|
|
•
|
issuance of dilutive equity securities or incurrence of debt;
|
|
•
|
integrating various accounting, management, information, human resource and other systems to permit effective management;
|
|
•
|
incurring possible write-offs, impairment charges, contingent liabilities, amortization expense of intangible assets or impairment of goodwill;
|
|
•
|
difficulties integrating and supporting acquired products or technologies;
|
|
•
|
unexpected capital expenditure requirements;
|
|
•
|
insufficient revenues to offset increased expenses associated with the acquisition;
|
|
•
|
opportunity costs associated with committing capital to such acquisitions; and
|
|
•
|
acquisition-related litigation.
|
Foreign acquisitions would involve risks in addition to those mentioned above, including those related to integration of operations across different cultures and languages, currency risks and the particular economic, political and regulatory risks associated with specific countries. We may not be able to address these risks successfully, or at all, without incurring significant costs, delays or other operating problems. Our inability to address successfully such risks could disrupt our business.
Our use of and reliance upon development resources in China may expose us to unanticipated costs or liabilities.
We operate a wholly foreign owned enterprise in Nanjing, China, where a dedicated team of engineers performs product development, quality assurance, cost reduction and other engineering work. We also outsource a portion of our software development to a team of software engineers based in Shenyang, China. Our reliance upon development resources in China may not enable us to achieve meaningful product cost reductions or greater resource efficiency. Further, our development efforts and other operations in China involve significant risks, including:
|
•
|
difficulty hiring and retaining appropriate engineering resources due to intense competition for such resources and resulting wage inflation;
|
|
•
|
the knowledge transfer related to our technology and exposure to misappropriation of intellectual property or confidential information, including information that is proprietary to us, our customers and third parties;
|
|
•
|
heightened exposure to changes in the economic, security and political conditions of China;
|
|
•
|
fluctuation in currency exchange rates and tax risks associated with international operations; and
|
|
•
|
development efforts that do not meet our requirements because of language, cultural or other differences associated with international operations, resulting in errors or delays.
|
Difficulties resulting from the factors above and other risks related to our operations in China could expose us to increased expense, impair our development efforts, harm our competitive position and damage our reputation.
Our customers are subject to government regulation, and changes in current or future laws or regulations that negatively impact our customers could harm our business.
The FCC has jurisdiction over all of our U.S. customers. FCC regulatory policies that create disincentives for investment in access network infrastructure or impact the competitive environment in which our customers operate may harm our business. For example, future FCC regulation affecting providers of broadband Internet access services could impede the penetration of our customers into certain markets or affect the prices they may charge in such markets. Furthermore, many of our customers are subject to FCC rate regulation of interstate telecommunications services, and are recipients of Connect America Fund capital incentive payments, which are intended to subsidize broadband and telecommunications services in areas that are expensive to serve. In early October 2011, the then-chairman of the FCC outlined a plan to transform the Universal Service Fund, an $8 billion fund that is paid for by telephone customers in the U.S. and was used to subsidize basic telephone service in rural areas, into one that will help expand broadband Internet service to 18 million Americans who lack high-speed access. In late 2013, the new FCC chairman shared plans to review the implementation of this program. Changes to these programs could change the ability of IOCs to access capital and reduce our revenue opportunities.
In addition, many of our customers are subject to state regulation of intrastate telecommunications services, including rates for such services, and may also receive funding from state universal service funds. Changes in rate regulations or universal service funding rules, either at the U.S. federal or state level, could adversely affect our customers' revenues and capital spending plans. In addition, various international regulatory bodies have jurisdiction over certain of our non-U.S. customers. Changes in these domestic and international standards, laws and regulations, or judgments in favor of plaintiffs in lawsuits against CSPs based on changed standards, laws and regulations could adversely affect the development of broadband networks and services. This, in turn, could directly or indirectly adversely impact the communications industry in which our customers operate.
30
Many jurisdictions, including international governments and regulators, are also evaluating, implementing and enforcing regulations relating to cyber security, privacy and data protection, which can affect the market and requirements for networking and communications equipment. To the extent our customers are adversely affected by laws or regulations regarding their business, products or service offerings, our business, financial condition and results of operations would suffer.
Privacy concerns relating to our products and services could affect our business practices, damage our reputation and deter customers from purchasing our products and services.
Government and regulatory authorities in the U.S. and around the world have implemented and are continuing to implement laws and regulations concerning data protection. The interpretation and application of these data protection laws and regulations are often uncertain and in flux, and it is possible that they may be interpreted and applied in a manner that is inconsistent with our data practices. Complying with these various laws could cause us to incur substantial costs or require us to change our business practices in a manner adverse to our business.
Concerns about, or regulatory actions involving our practices with regard to the collection, use, disclosure, or security of customer information or other privacy related matters, even if unfounded, could damage our reputation and adversely affect operating results. While we strive to comply with all applicable data protection laws and regulations, the failure or perceived failure to comply may result in inquiries and other proceedings or actions against us by government entities or others, or could cause us to lose customers, which could potentially have an adverse effect on our business.
We may be subject to governmental export and import controls that could subject us to liability or impair our ability to compete in additional international markets.
Our products may be or become subject to U.S. export controls that will restrict our ability to export them outside of the free-trade zones covered by the North American Free Trade Agreement, Central American Free Trade Agreement and other treaties and laws. Therefore, future international shipments of our products may require export licenses or export license exceptions. In addition, the import laws of other countries may limit our ability to distribute our products, or our customers' ability to buy and use our products, in those countries. Changes in our products or changes in export and import regulations or duties may create delays in the introduction of our products in international markets, prevent our customers with international operations from deploying our products or, in some cases, prevent the export or import of our products to certain countries altogether. Any change in export or import regulations, duties or related legislation, shift in approach to the enforcement or scope of existing regulations, or change in the countries, persons or technologies targeted by such regulations, could negatively impact our ability to sell, profitably or at all, our products to existing or potential international customers.
If we lose any of our key personnel, or are unable to attract, train and retain qualified personnel, our ability to manage our business and continue our growth would be negatively impacted.
Our success depends, in large part, on the continued contributions of our key management, engineering, sales and marketing personnel, many of whom are highly skilled and would be difficult to replace. None of our senior management or key technical or sales personnel is bound by a written employment contract to remain with us for a specified period. In addition, we do not currently maintain key man life insurance covering our key personnel. If we lose the services of any key personnel, our business, financial condition and results of operations may suffer.
Competition for skilled personnel, particularly those specializing in engineering and sales, is intense. We cannot be certain that we will be successful in attracting and retaining qualified personnel, or that newly hired personnel will function effectively, both individually and as a group. In particular, we must continue to expand our direct sales force, including hiring additional sales managers, to grow our customer base and increase sales. In addition, if we offer employment to personnel employed by competitors, we may become subject to claims of unfair hiring practices, and incur substantial costs in defending ourselves against these claims, regardless of their merits. If we are unable to effectively recruit, hire and utilize new employees, execution of our business strategy and our ability to react to changing market conditions may be impeded, and our business, financial condition and results of operations may suffer.
Volatility or lack of performance in our stock price may also affect our ability to attract and retain our key personnel. Our executive officers and employees hold a substantial number of shares of our common stock and vested stock options. Employees may be more likely to leave us if the shares they own or the shares underlying their vested options have significantly appreciated in value relative to the original purchase prices of the shares or the exercise prices of the options, or if the exercise prices of the options that they hold are significantly above the market price of our common stock. If we are unable to retain our employees, our business, operating results and financial condition will be harmed.
If we fail to maintain proper and effective internal controls, our ability to produce accurate financial statements on a timely basis could be impaired, which would adversely affect our operating results, our ability to operate our business and our stock price.
Ensuring that we have adequate internal financial and accounting controls and procedures in place to produce accurate financial statements on a timely basis is a costly and time-consuming effort that needs to be re-evaluated frequently. We have in the past discovered, and may in the future discover, areas of our internal financial and accounting controls and procedures that need improvement.
Our management is responsible for establishing and maintaining adequate internal control over financial reporting to provide reasonable assurance regarding the reliability of our financial reporting and the preparation of financial statements for external purposes in accordance with U.S. generally accepted accounting principles. Our management does not expect that our internal control over financial reporting will prevent or detect all error and all fraud. A control system, no matter how well designed and operated, can provide only reasonable, not absolute, assurance that the control system's objectives will be met. Because of the inherent limitations in all control systems, no evaluation of controls can provide absolute assurance that misstatements due to error or fraud will not occur or that all control issues and instances of fraud, if any, within our company will have been detected.
31
We are required to comply with Section 404 of the Sarbanes-Oxley Act ("SOX"), which requires us to expend significant resources in developing the required documentation and testing procedures. We cannot be certain that the actions we have taken and are taking to improve our internal controls over financial reporting will be sufficient to maintain effective internal controls over financial reporting in subsequent reporting periods, or that we will be able to implement our planned processes and procedures in a timely manner. In addition, new and revised accounting standards and financial reporting requirements may occur in the future, and implementing changes required by new standards, requirements or laws may require a significant expenditure of our management's time, attention and resources and may adversely affect our reported financial results. If we are unable to produce accurate financial statements on a timely basis, investors could lose confidence in the reliability of our financial statements, which could cause the market price of our common stock to decline and make it more difficult for us to finance our operations and growth.
Interruptions, failures or material breaches in our information technology and communications systems could harm our business, customer relations and financial condition.
Information technology helps us operate efficiently, interface with customers, maintain financial accuracy and efficiency and accurately produce our financial statements. If we do not allocate and effectively manage the resources necessary to build and sustain the proper technology infrastructure, we could be subject to transaction errors, processing inefficiencies, the loss of customers, business disruptions or the loss of or damage to intellectual property through security breach. If our data management systems do not effectively collect, store, process and report relevant data for the operation of our business, whether due to equipment malfunction or constraints, software deficiencies or human error, our ability to effectively plan, forecast and execute our business plan and comply with applicable laws and regulations will be impaired, perhaps materially. Any such impairment could materially and adversely affect our financial condition, results of operations, cash flows and the timeliness with which we internally and externally report our operating results.
We have applied multiple layers of security to control access to our information technology systems. We also use encryption and authentication technologies to secure the transmission and storage of data. These security measures may be compromised as a result of third-party security breaches, employee error, malfeasance, faulty password management or other irregularity, and result in persons obtaining unauthorized access to our data or accounts. Third parties may attempt to fraudulently induce employees into disclosing user names, passwords or other sensitive information, which may in turn be used to access our information technology systems.
While we apply best practice policies and devote significant resources to network security, data encryption and other security measures to protect our information technology and communications systems and data, these security measures cannot provide absolute security. We may experience a breach of our systems and may be unable to protect sensitive data. The costs to us to eliminate or alleviate network security problems, bugs, viruses, worms, malicious software programs and security vulnerabilities could be significant, and our efforts to address these problems may not be successful and could result in unexpected interruptions, delays, cessation of service and may harm our business operations.
Although our systems have been designed around industry-standard architectures to reduce downtime in the event of outages or catastrophic occurrences, they remain vulnerable to damage or interruption from earthquakes, floods, fires, power loss, telecommunication failures, terrorist attacks, cyber-attacks, viruses, denial-of-service attacks, human error, hardware or software defects or malfunctions, and similar events or disruptions. Some of our systems are not fully redundant, and our disaster recovery planning is not sufficient for all eventualities. Our systems are also subject to break-ins, sabotage, and intentional acts of vandalism. Despite any precautions we may take, the occurrence of a natural disaster, a decision by any of our third-party hosting providers to close a facility we use without adequate notice for financial or other reasons, or other unanticipated problems at our hosting facilities could cause system interruptions and delays, and result in loss of critical data and lengthy interruptions in our services.
We incur significant increased costs as a result of operating as a public company, which may adversely affect our operating results and financial condition.
As a public company, we incur significant accounting, legal and other expenses, including costs associated with our public company reporting requirements. We also anticipate that we will continue to incur costs associated with corporate governance requirements, including requirements under SOX and the Dodd-Frank Wall Street Reform and Consumer Protection Act ("Dodd-Frank"), as well as rules implemented by the SEC, and the New York Stock Exchange ("NYSE"). Furthermore, these laws and regulations could make it more difficult or more costly for us to obtain certain types of insurance, including director and officer liability insurance, and we may be forced to accept reduced policy limits and coverage or incur substantially higher costs to obtain the same or similar coverage. The impact of these requirements could also make it more difficult for us to attract and retain qualified persons to serve on our board of directors, our board committees or as executive officers.
New laws and regulations as well as changes to existing laws and regulations affecting public companies, including the provisions of SOX and Dodd-Frank and rules adopted by the SEC and the NYSE, would likely result in increased costs to us as we respond to their requirements. We are investing resources to comply with evolving laws and regulations, and this investment may result in increased general and administrative expense and a diversion of management's time and attention from revenue generating activities to compliance activities.
Risks Related to Ownership of Our Common Stock
Our stock price may be volatile, and the value of an investment in our common stock may decline.
The trading price of our common stock has been, and is likely to continue to be, volatile, which means that it could decline substantially within a short period of time and could be subject to wide fluctuations in response to various factors, some of which are beyond our control. These factors include those discussed in the “Risk Factors” section of this Form 10-K and others such as:
|
•
|
quarterly variations in our results of operations or those of our competitors;
|
|
•
|
failures by us to meet any guidance regarding our anticipated results that we have previously provided;
|
32
|
•
|
changes in earnings estimates or recommendations by securities analysts;
|
|
•
|
failures by us to meet securities analysts’ estimates;
|
|
•
|
announcements by us or our competitors of new products, significant contracts, commercial relationships, acquisitions or capital commitments;
|
|
•
|
developments with respect to intellectual property rights;
|
|
•
|
our ability to develop and market new and enhanced products on a timely basis;
|
|
•
|
our commencement of, or involvement in, litigation;
|
|
•
|
changes in governmental regulations or in the status of our regulatory approvals; and
|
|
•
|
a slowdown in the communications industry or the general economy.
|
In recent years, the stock market in general, and the market for technology companies in particular, has experienced extreme price and volume fluctuations that have often been unrelated or disproportionate to the operating performance of those companies. Broad market and industry factors may seriously affect the market price of our common stock, regardless of our actual operating performance. In addition, in the past, following periods of volatility in the overall market and the market price of a particular company's securities, securities class action litigation has often been instituted against these companies. This litigation, if instituted against us, could result in substantial costs and a diversion of our management's attention and resources.
If securities or industry analysts do not publish research or reports about our business or if they issue an adverse or misleading opinion regarding our stock, our stock price and trading volume could decline.
The trading market for our common stock will be influenced by the research and reports that industry or securities analysts publish about us or our business. If any of the analysts who cover us issue an adverse or misleading opinion regarding our stock, our stock price would likely decline. If several of these analysts cease coverage of our company or fail to publish reports on us regularly, we could lose visibility in the financial markets, which in turn could cause our stock price or trading volume to decline.
Provisions in our charter documents and under Delaware law could discourage a takeover that stockholders may consider favorable and may lead to entrenchment of our management and board of directors.
Our amended and restated certificate of incorporation and amended and restated bylaws contain provisions that could have the effect of delaying or preventing changes in control or changes in our management or our board of directors. These provisions include:
|
•
|
a classified board of directors with three-year staggered terms, which may delay the ability of stockholders to change the membership of a majority of our board of directors;
|
|
•
|
no cumulative voting in the election of directors, which limits the ability of minority stockholders to elect director candidates;
|
|
•
|
the exclusive right of our board of directors to elect a director to fill a vacancy created by the expansion of the board of directors or the resignation, death or removal of a director, which prevents stockholders from being able to fill vacancies on our board of directors;
|
|
•
|
the ability of our board of directors to issue shares of preferred stock and to determine the price and other terms of those shares, including preferences and voting rights, without stockholder approval, which could be used to significantly dilute the ownership of a hostile acquirer;
|
|
•
|
a prohibition on stockholder action by written consent, which forces stockholder action to be taken at an annual or special meeting of our stockholders;
|
|
•
|
the requirement that a special meeting of stockholders may be called only by the chairman of the board of directors, the chief executive officer or the board of directors, which may delay the ability of our stockholders to force consideration of a proposal or to take action, including the removal of directors; and
|
|
•
|
advance notice procedures that stockholders must comply with in order to nominate candidates to our board of directors or to propose matters to be acted upon at a stockholders' meeting, which may discourage or deter a potential acquirer from conducting a solicitation of proxies to elect the acquirer's own slate of directors or otherwise attempting to obtain control of us.
|
We are also subject to certain anti-takeover provisions under Delaware law. Under Delaware law, a corporation may not, in general, engage in a business combination with any holder of 15% or more of its capital stock unless the holder has held the stock for three years or, among other things, the board of directors has approved the transaction.
We may need additional capital in the future to finance our business.
We may need to raise additional capital to fund operations in the future. Although we believe that, based on our current level of operations and anticipated growth, our existing cash and cash equivalents will provide adequate funds for ongoing operations, planned capital expenditures and working capital requirements for at least the next 12 months, we may need additional capital if our current plans and assumptions change. If future financings involve the issuance of equity securities, our then-existing stockholders would suffer dilution. If we raise additional debt financing, we may be subject to restrictive covenants that limit our ability to conduct our business. We may not be able to raise sufficient additional funds on terms that are favorable to us, if at all. If we fail to raise sufficient funds and continue to incur losses, our ability to fund our operations, take advantage of strategic opportunities, develop products or technologies or otherwise respond to competitive pressures could be significantly limited. Any failure to obtain financing when and as required could force us to curtail our operations, which would harm our business.
We do not currently intend to pay dividends on our common stock and, consequently, our stockholders' ability to achieve a return on their investment will depend on appreciation in the price of our common stock.
We do not currently intend to pay any cash dividends on our common stock for the foreseeable future. We currently intend to invest our future earnings, if any, to fund our growth. Additionally, the terms of our credit facility restrict our ability to pay dividends under certain circumstances. Therefore, our stockholders are not likely to receive any dividends on our common stock for the foreseeable future.
33
None.
We currently lease approximately
287,300
square feet of office space worldwide. Information concerning our principal leased properties as of
December 31, 2013
is set forth below:
|
Location
|
Principal Use
|
Square
Footage
|
Lease
Expiration Date
|
||||
|
Petaluma, California
(1)
|
Corporate headquarters, sales, marketing, product design, service and repair engineering, distribution, research and development
|
82,100
|
|
February 2019
|
|||
|
Santa Barbara, California
|
Product design, research and development
|
51,000
|
|
July 2014
|
|||
|
San Jose, California
|
Product design, research and development, administration
|
46,100
|
|
August 2018
|
|||
|
Fremont, California
|
Not applicable
(2)
|
36,000
|
|
July 2015
|
|||
|
Minneapolis, Minnesota
(3)
|
Product design, research and development, service and repair engineering
|
33,200
|
|
March 2019
|
|||
|
Nanjing, China
|
Research and development
|
26,600
|
|
February 2016
|
|||
|
Acton, Massachusetts
|
Research and development
|
6,200
|
|
June 2016
|
|||
|
Richardson, Texas
|
Service and repair engineering
|
6,100
|
|
July 2017
|
|||
|
287,300
|
|
||||||
|
(1) On January 28, 2013, we entered into an amendment to this Petaluma lease and extended the lease expiration date to February 2019.
|
|||||||
|
(2) A portion of the property is sublet under a sublease expiring in 2015. The remaining area of the property was vacated in March 2013, for which we have been actively seeking a sublease. Employees in this location were consolidated into our San Jose, California location.
|
|||||||
|
(3) In October 2013, we entered into an amendment to this Minneapolis lease to extend the lease term from March 2014 to March 2019.
|
|||||||
We believe that our facilities are in good condition and are generally suitable to meet our needs for the foreseeable future. However, we may continue to seek additional space as needed, and we believe this space will be available on commercially reasonable terms.
For a description of our material pending legal proceedings, please refer to Note 5,
“Commitments and Contingencies – Litigation”
of the Notes to Consolidated Financial Statements included in Part II, Item 8 of this Annual Report on Form 10-K, which is incorporated by reference.
Not applicable.
|
ITEM 5.
|
Market for Registrant’s Common Equity, Related Stockholder Matters and Issuer Purchases of Equity Securities.
|
Comparative Stock Prices
Our common stock has been trading on the New York Stock Exchange, under the trading symbol “CALX” since our initial public offering on March 24, 2010. Prior to this time, there was no public market for our common stock. The following table sets forth, for the fiscal periods indicated, the high and low sale prices per share of our common stock as reported on NYSE.
34
|
High
|
Low
|
|||||||
|
Fiscal Year 2013
|
||||||||
|
First Quarter
|
$
|
9.17
|
|
$
|
7.26
|
|
||
|
Second Quarter
|
10.98
|
|
7.29
|
|
||||
|
Third Quarter
|
13.98
|
|
9.96
|
|
||||
|
Fourth Quarter
|
13.36
|
|
8.43
|
|
||||
|
High
|
Low
|
|||||||
|
Fiscal Year 2012
|
||||||||
|
First Quarter
|
$
|
12.21
|
|
$
|
6.08
|
|
||
|
Second Quarter
|
9.48
|
|
6.65
|
|
||||
|
Third Quarter
|
8.26
|
|
4.25
|
|
||||
|
Fourth Quarter
|
7.80
|
|
5.47
|
|
||||
Number of Common Stock Holders and Number of Shares Outstanding
On
February 12, 2014
, there were approximately
312
stockholders of record of our common stock who held an aggregate of
50,224,952
shares of our common stock. The closing price of our common stock as of
February 12, 2014
was
$7.48
. A substantially greater number of holders of Calix common stock are street name or beneficial holders, whose shares are held of record by banks, brokers and other financial institutions.
Dividends
We have never declared or paid any cash dividends on our common stock. Our credit facility does not limit the company’s ability to pay dividends on our common stock if credit extensions under the credit facility are less than
$5 million
and certain conditions are met; otherwise the maximum amount of dividends permitted to be paid under the credit facility is
$15 million
a year if certain conditions are met. We currently expect to be able to meet these conditions. However, we do not currently intend to pay any cash dividends on our common stock in the foreseeable future.
Recent Sales of Unregistered Securities
None.
Issuer Purchases of Equity Securities
None.
Performance Graph
The following graph shows a comparison of the cumulative total shareholder return on our common stock with the cumulative total returns of the NYSE Composite Index and the Morningstar Communication Equipment Index. The graph tracks the performance of a $100 investment in our common stock and in each of the indexes during the period from March 24, 2010 (the date our common stock commenced trading on NYSE) through
December 31, 2013
. Data for the NYSE Composite Index and the Morningstar Communication Equipment Index assume reinvestment of dividends. Shareholder returns over the indicated period are based on historical data and should not be considered indicative of future shareholder returns.
35
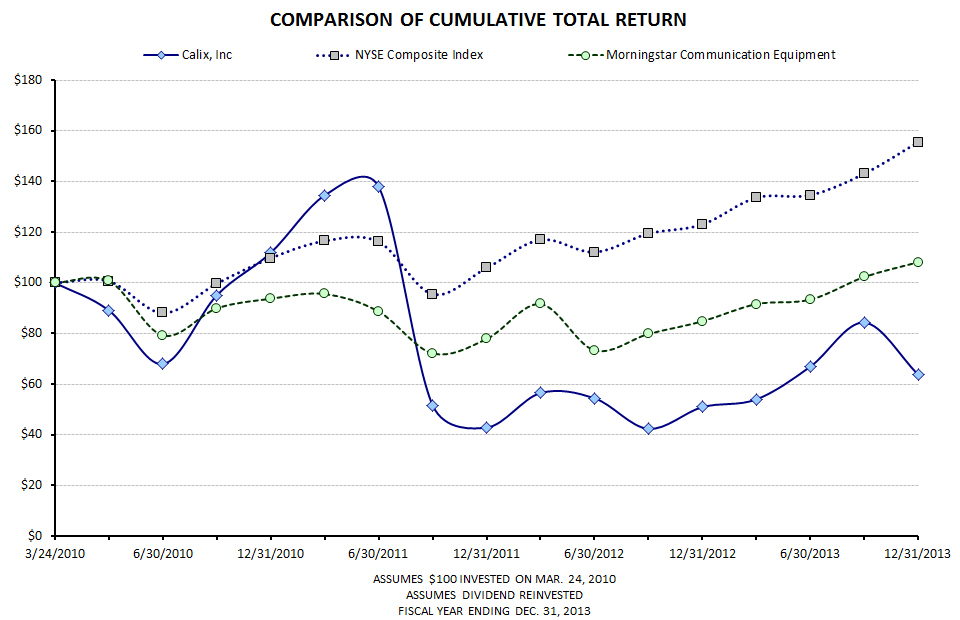
This performance graph shall not be deemed “soliciting material” or to be “filed” with the Securities and Exchange Commission for purposes of Section 18 of the Securities Exchange Act of 1934, as amended, or otherwise subject to the liabilities under that Section, and shall not be deemed to be incorporated by reference into any filing of Calix, Inc. under the Securities Act of 1933, as amended.
The following selected consolidated financial data should be read in conjunction with our consolidated financial statements and the related notes thereto, of this Form 10-K, the section titled “Management’s Discussion and Analysis of Financial Condition and Results of Operations” and the other financial information and data appearing elsewhere in this Form 10-K. The selected financial data included in this section is not intended to replace and is not a substitute for, the financial statements and related notes in this Form 10-K.
We derived the statements of operations data for the years ended
December 31, 2013
,
2012
and
2011
and the balance sheet data as of
December 31, 2013
and
2012
from our audited financial statements and related notes thereto of this Form 10-K. We derived the statements of operations data for the years ended
December 31, 2010
and
2009
, and the balance sheet data as of
December 31, 2011
,
2010
and
2009
from our audited financial statements and related notes which are not included in this Form 10-K. Historical results for any prior period are not necessarily indicative of future results for any period.
36
|
Years Ended December 31,
|
||||||||||||||||||||
|
2013
|
2012
(1)
|
2011
(1)
|
2010
|
2009
|
||||||||||||||||
|
(In thousands, except per share data)
|
||||||||||||||||||||
|
Statements of Operations Data:
|
||||||||||||||||||||
|
Revenue
|
$
|
382,618
|
|
$
|
330,218
|
|
$
|
344,669
|
|
$
|
287,043
|
|
$
|
232,947
|
|
|||||
|
Cost of revenue:
|
||||||||||||||||||||
|
Products and services
(2)
|
203,191
|
|
185,103
|
|
195,698
|
|
168,873
|
|
150,863
|
|
||||||||||
|
Acquisition-related expenses
|
—
|
|
—
|
|
19,966
|
|
—
|
|
—
|
|
||||||||||
|
Amortization of intangible assets
|
8,353
|
|
7,539
|
|
9,552
|
|
5,440
|
|
5,440
|
|
||||||||||
|
Total cost of revenue
|
211,544
|
|
192,642
|
|
225,216
|
|
174,313
|
|
156,303
|
|
||||||||||
|
Gross profit
|
171,074
|
|
137,576
|
|
119,453
|
|
112,730
|
|
76,644
|
|
||||||||||
|
Operating expenses:
|
||||||||||||||||||||
|
Research and development
(2)
|
79,299
|
|
66,748
|
|
67,725
|
|
55,412
|
|
46,132
|
|
||||||||||
|
Sales and marketing
(2)
|
68,075
|
|
62,129
|
|
55,551
|
|
42,121
|
|
33,486
|
|
||||||||||
|
General and administrative
(2)
|
31,945
|
|
26,114
|
|
27,002
|
|
27,998
|
|
15,613
|
|
||||||||||
|
Amortization of intangible assets
|
10,208
|
|
10,208
|
|
8,569
|
|
740
|
|
740
|
|
||||||||||
|
Acquisition-related expenses
(2)
|
—
|
|
1,401
|
|
12,927
|
|
3,942
|
|
—
|
|
||||||||||
|
Total operating expenses
|
189,527
|
|
166,600
|
|
171,774
|
|
130,213
|
|
95,971
|
|
||||||||||
|
Loss from operations
|
(18,453
|
)
|
(29,024
|
)
|
(52,321
|
)
|
(17,483
|
)
|
(19,327
|
)
|
||||||||||
|
Interest and other income (expense), net
(3)
|
1,174
|
|
856
|
|
(5
|
)
|
(989
|
)
|
(3,466
|
)
|
||||||||||
|
Loss before provision for (benefit from) income taxes
|
(17,279
|
)
|
(28,168
|
)
|
|
(52,326
|
)
|
|
(18,472
|
)
|
|
(22,793
|
)
|
|||||||
|
Provision for (benefit from) income taxes
|
(14
|
)
|
158
|
|
224
|
|
81
|
|
(352
|
)
|
||||||||||
|
Net loss
|
(17,265
|
)
|
(28,326
|
)
|
|
(52,550
|
)
|
|
(18,553
|
)
|
|
(22,441
|
)
|
|||||||
|
Preferred stock dividends
|
—
|
|
—
|
|
—
|
|
900
|
|
3,747
|
|
||||||||||
|
Net loss attributable to common stockholders
|
$
|
(17,265
|
)
|
$
|
(28,326
|
)
|
|
$
|
(52,550
|
)
|
|
$
|
(19,453
|
)
|
|
$
|
(26,188
|
)
|
||
|
Net loss per common share:
|
||||||||||||||||||||
|
Basic and diluted
|
$
|
(0.35
|
)
|
$
|
(0.59
|
)
|
$
|
(1.15
|
)
|
$
|
(0.65
|
)
|
$
|
(6.48
|
)
|
|||||
|
Weighted-average number of shares used to compute net loss per common share:
|
||||||||||||||||||||
|
Basic and diluted
|
49,419
|
|
48,180
|
|
45,546
|
|
29,778
|
|
4,040
|
|
||||||||||
|
|
As of December 31,
|
|||||||||||||||||||
|
2013
|
2012
(1)
|
2011
(1)
|
2010
|
2009
|
||||||||||||||||
|
(In thousands, except per share data)
|
||||||||||||||||||||
|
Balance Sheet Data:
|
|
|||||||||||||||||||
|
Cash, cash equivalents and marketable securities
|
$
|
82,747
|
|
$
|
46,995
|
|
|
$
|
38,938
|
|
|
$
|
98,324
|
|
|
$
|
68,049
|
|
||
|
Working capital
|
114,366
|
|
84,255
|
|
|
77,745
|
|
|
126,957
|
|
|
77,999
|
|
|||||||
|
Total assets
|
383,599
|
|
377,897
|
|
|
358,103
|
|
|
257,556
|
|
|
241,116
|
|
|||||||
|
Current and long-term loans payable
|
—
|
|
—
|
|
|
—
|
|
|
—
|
|
|
20,000
|
|
|||||||
|
Preferred stock warrant liabilities
|
—
|
|
—
|
|
|
—
|
|
|
—
|
|
|
195
|
|
|||||||
|
Convertible preferred stock
|
—
|
|
—
|
|
|
—
|
|
|
—
|
|
|
479,628
|
|
|||||||
|
Common stock and additional paid-in capital
|
783,509
|
|
761,454
|
|
|
741,504
|
|
|
606,907
|
|
|
52,841
|
|
|||||||
|
Total stockholders’ equity (deficit)
|
273,923
|
|
269,075
|
|
|
277,417
|
|
|
195,303
|
|
(339,358
|
)
|
||||||||
37
|
(1) We acquired Ericsson's fiber access assets in November 2012 and Occam in February 2011. Our Consolidated Statements of Operations and Consolidated Balance Sheets data include the results of these acquired businesses only for periods subsequent to their respective acquisition dates. See Note 2,
“Business Combinations"
of the Notes to the Consolidated Financial Statements in this Form 10-K for more details.
|
|||||||||||||||||||||
|
(2) Includes stock-based compensation as follows:
|
|||||||||||||||||||||
|
2013
|
2012
|
2011
|
2010
|
2009
|
|||||||||||||||||
|
Cost of revenue
|
$
|
1,468
|
|
$
|
1,433
|
|
$
|
1,503
|
|
$
|
1,745
|
|
$
|
682
|
|
||||||
|
Research and development
|
4,896
|
|
4,227
|
|
4,828
|
|
5,966
|
|
2,657
|
|
|||||||||||
|
Sales and marketing
|
5,577
|
|
5,160
|
|
4,500
|
|
4,555
|
|
1,739
|
|
|||||||||||
|
General and administrative
|
7,980
|
|
6,617
|
|
9,538
|
|
13,309
|
|
4,118
|
|
|||||||||||
|
Acquisition-related expenses
|
—
|
|
—
|
|
1,234
|
|
—
|
|
—
|
|
|||||||||||
|
Total
|
$
|
19,921
|
|
$
|
17,437
|
|
$
|
21,603
|
|
$
|
25,575
|
|
$
|
9,196
|
|
||||||
|
(3) 2013 includes $1.7 million of gain from utilization of inventory credit from Ericsson. 2012 includes $1.0 million of gain on bargain purchase of Ericsson's fiber access assets; 2010 and 2009 include $1.2 million and $3.9 million of interest expense, respectively, which are primarily for a term loan that was repaid in May 2010.
|
|||||||||||||||||||||
The Management’s Discussion and Analysis of Financial Condition and Results of Operations contains forward-looking statements regarding future events and our future results that are subject to the safe harbors created under the Securities Act of 1933 (the “Securities Act”) and the Securities Exchange Act of 1934 (the “Exchange Act”). All statements other than statements of historical facts are statements that could be deemed forward-looking statements. These statements are based on current expectations, estimates, forecasts, and projections about the industries in which we operate and the beliefs and assumptions of our management. In some cases, forward-looking statements can be identified by the use of words such as “may,” “will,” “expects,” “plans,” “anticipates,” “estimates,” “potential,” or “continue” or the negative thereof or other comparable terminology. In addition, any statements that refer to projections of our future financial performance, our anticipated growth and trends in our businesses, and other characterizations of future events or circumstances are forward-looking statements. Readers are cautioned that these forward-looking statements are only predictions and are subject to risks, uncertainties, and assumptions that are difficult to predict, including those identified in the Risk Factors discussed in Item 1A, in the discussion below, as well as in other sections of this Annual Report on Form 10-K. Therefore, actual results may differ materially and adversely from those expressed in any forward-looking statements. All forward-looking statements and reasons why results may differ included in this report are made as of the date hereof, and we assume no obligation to update these forward-looking statements or reasons why actual results might differ.
Overview
We are a leading provider in North America of broadband communications access systems and software for fiber- and copper-based network architectures that enable communications service providers to connect to their residential and business subscribers. We enable CSPs to provide a wide range of revenue-generating services, from basic voice and data to advanced broadband services, over legacy and next-generation access networks. We focus solely on CSP access networks, the portion of the network that governs available bandwidth and determines the range and quality of services that can be offered to subscribers. We develop and sell carrier-class hardware and software products, which is referred to as the Unified Access portfolio that are designed to enhance and transform CSP access networks to meet the changing demands of subscribers rapidly and cost-effectively.
We market our access systems and software to CSPs globally through our direct sales force as well as a limited number of resellers. As of December 31, 2013, nearly eighteen million ports of our Unified Access portfolio have been deployed at a growing number of CSPs worldwide, whose networks serve over 100 million subscriber lines in total. Our customers include many of the world's largest communications providers. In addition, we have enabled over 900 customers to deploy gigabit passive optical network, Active Ethernet and point-to-point Ethernet fiber access networks.
Our revenue increased to
$382.6 million
for 2013 from
$330.2 million
for 2012 and
$344.7 million
for 2011. During the first half of 2012, we experienced softness in our business due to lower demand across multiple customer markets, which was due to a slowdown in capital expenditures by service providers increasingly concerned about macro-economic conditions and uncertainties associated with the implementation of regulatory reforms. However, beginning in the second half of 2012 and during 2013, we experienced steady improvement in our operating results. During the fourth quarter of 2013, we experienced a slow down in the growth of our business which we believe was due to our customers having purchased more than usual in the first three quarters of 2013 and to their not having enough budgets left in the fourth quarter. Continued revenue growth will depend on our ability to continue to sell our access systems and software to existing customers and to attract new customers, including in particular, large CSPs and customers in international markets. Additionally, our acquisition of Ericsson's fiber access assets has had a positive impact to revenue in 2013 and we expect the positive impact to continue in 2014 and beyond. Since our inception we have incurred significant losses, and as of
December 31, 2013
, we had an accumulated deficit of
$509.8 million
. Our net loss was
$17.3 million
,
$28.3 million
, and
$52.6 million
for the years ended December 31, 2013, 2012, and 2011, respectively.
Revenue fluctuations result from many factors, including but not limited to: increases or decreases in customer orders for our products and services, large customer purchase agreements with delayed revenue recognition, varying budget cycles and seasonal buying patterns of our customers. More specifically, our customers tend to spend less in the first fiscal quarter as they are finalizing their annual budgets. Customer spending then increases in subsequent quarters for the remainder of the year and historically, although not always, ends with a
38
“budget flush” in the fourth quarter. As of
December 31, 2013
, our deferred revenue of
$53.3 million
primarily included certain contracts with customers who receive government supported loans and grants from the U.S. Department of Agriculture’s Rural Utility Service (“RUS”) that require installation services, as well as extended warranty services contracts that are recognized ratably over the period during which the services are to be performed. The timing of deferred recognition may cause significant fluctuations in our revenue and operating results from period to period.
Cost of revenue is strongly correlated to revenue and will tend to fluctuate from all of the aforementioned factors that could impact revenue. Other factors that impact cost of revenue include changes in the mix of products and services delivered to our customers and changes in the cost of our inventory. Cost of revenue includes fixed expenses related to our internal operations, which could impact our cost of revenue as a percentage of revenue if there are large sequential fluctuations to revenue.
Our gross profit and gross margin have been, and will likely be, impacted by several factors, including new product introduction or upgrades to existing products, changes in customer mix, changes in the mix of products and services demanded and sold, shipment volumes, changes in our product costs, changes in pricing and the extent of customer rebates and incentive programs. We believe our gross margin could increase due to favorable changes in these factors, for example, increases in sales of our advanced E-Series Ethernet service access platforms, upgrades to our C7 platform, new introductions of our P-Series optical network terminals and reductions in the impact of rebate or similar programs. We believe our gross margin could decrease due to unfavorable changes in factors such as increased product costs, pricing decreases due to competitive pressure and an unfavorable customer or product mix. Changes in these factors could have a material impact on our future average selling prices and unit costs. Also, the timing of deferred revenue recognition and related deferred costs can have a material impact on our gross profit and gross margin results. The timing of recognition and the relative size of these arrangements could cause large fluctuations in our gross profit from period to period.
Our operating expenses have fluctuated based on the following factors: timing of variable compensation expenses due to fluctuations in order volumes, timing of salary increases which have historically occurred in the second quarter, timing of bonus expenses due to changes in the Company’s performance, timing of research and development expenses including prototype builds and intermittent outsourced development projects, fluctuations in stock-based compensation expenses due to increased equity grants or modifications to outstanding equity awards, and changes in acquisition-related expenses. As a result of the acquisition of Ericsson's fiber access assets in November 2012, we have also incurred increased compensation costs in research and development due to the additional headcount and increased facility related costs. We anticipate that our operating expenses will increase in absolute dollar amounts but will decline as a percentage of revenue over time.
As a result of the fluctuations described above and a number of other factors, many of which are outside our control, our annual operating results fluctuate from period to period. Comparing our operating results on a period-to-period basis may not be meaningful, and you should not rely on our past results as an indication of our future performance.
Acquisition of Ericsson's Fiber Access Assets
On November 2, 2012, we acquired the fiber access assets of Ericsson, including the Ericsson EDA 1500 GPON solution and its complementary ONT portfolio, under an Asset Purchase Agreement ("EFAA Acquisition"). Total consideration for the purchase was $12.0 million in cash.
In connection with this acquisition, Calix and Ericsson also signed a non-exclusive global reseller agreement, under which Calix became Ericsson's preferred global partner for broadband access applications. This partnership provides Calix with an extensive new global reseller channel, and we believe our acquisition of Ericsson's fiber access portfolio delivers powerful new complements to our industry-leading Unified Access portfolio. We believe this partnership also provides Ericsson's existing fiber access customers with world-class support and maintenance, and an expanded portfolio of access systems and software from a leading company totally focused on access.
The transaction is accounted for using the acquisition method of accounting in accordance with the accounting standard for business combinations. As a result of this acquisition, we recognized a bargain purchase gain of
$1.0 million
in 2012. We have included the financial results of the acquired Ericsson's fiber access assets in the Consolidated Financial Statements from the date of acquisition. See Note 2,
“Business Combinations”
of the Notes to Consolidated Financial Statements in this Form 10-K for additional information related to this acquisition.
Acquisition of Occam Networks
On February 22, 2011, we completed our acquisition of Occam, a provider of innovative broadband access products designed to enable telecom service providers to offer bundled voice, video and high speed internet, or Triple Play, services over both fiber optic and copper networks in a stock and cash transaction valued at approximately $213.1 million which consisted of $94.5 million of cash consideration and a value of $118.6 million of common stock and equity awards issued. The combined organization provides CSPs globally with an enhanced portfolio of advanced broadband access systems, and accelerates innovation across our expanded Unified Access portfolio.
As a result of this acquisition, we recorded $50.6 million in goodwill and $97.7 million in other intangible assets. We are amortizing the finite-lived intangible assets over their useful lives. See “Critical Accounting Policies and Estimates-Valuation of Goodwill and Intangible Assets” section below for information relating to these items and our test for impairment. The results of operations of Occam have been included in our consolidated financial statements since the acquisition date. See Note 2,
“Business Combinations”
of the Notes to Consolidated Financial Statements in this Form 10-K for additional information related to this acquisition.
Critical Accounting Policies and Estimates
Our financial statements are prepared in accordance with U.S. GAAP. These accounting principles require us to make certain estimates and judgments that can affect the reported amounts of assets and liabilities as of the date of the financial statements, as well as the reported
39
amounts of revenue and expenses during the periods presented. We base our estimates, assumptions and judgments on historical experience and on various other factors that are believed to be reasonable under the circumstances. To the extent there are material differences between these estimates and actual results, our financial statements will be affected. We evaluate our estimates, assumptions and judgments on an ongoing basis.
We believe the following critical accounting policies affect our more significant judgments and estimates used in the preparation of our financial statements.
Business Combination
We accounted for our business acquisitions under Accounting Standards Codification ("ASC") Topic 805,
“Business Combinations."
Under this guidance, all of the assets acquired and liabilities assumed are recognized at their fair value as of the acquisition date. The excess of the purchase price over the estimated fair values of the net tangible and intangible assets acquired is recorded as goodwill. If a business combination results in a bargain purchase for us, the economic gain resulting from the fair value received being greater than the purchase price is recorded as a gain included in other income (expense), net, in the Consolidated Statements of Comprehensive Loss. Prior to recognizing the gain, we reassess whether we have correctly identified all of the assets acquired and liabilities assumed and recognize any additional assets or liabilities that result from that review. We also review the measurement procedures used in valuing the assets acquired and liabilities assumed.
While we use our best estimates and assumptions as a part of calculating the fair value at the acquisition date, our estimates are inherently uncertain and subject to refinement. These assumptions and estimates include a market participant’s use of the asset and an appropriate discount rate. Our estimates are based on historical experience and information obtained from the management of the acquired companies. Our significant assumptions and estimates can include, but are not limited to, the cash flows that an asset is expected to generate in the future, the appropriate weighted-average cost of capital, and the cost savings expected to be derived from acquiring an asset. These estimates are inherently uncertain and unpredictable. In addition, unanticipated events and circumstances may occur which may affect the accuracy or validity of such estimates. As a result, during the measurement period, which may be up to one year from the acquisition date, we may record adjustments retrospectively to the fair value of assets acquired and liabilities assumed, with the corresponding offset to goodwill as of the acquisition date, or other income or expense in the case of a bargain purchase for the period of the acquisition. Upon the conclusion of the measurement period or final determination of the fair value of assets acquired or liabilities assumed, whichever comes first, any subsequent adjustments are recorded to our Consolidated Statements of Comprehensive Loss.
Revenue Recognition
We derive revenue primarily from the sale of hardware products and related software. Revenue is recognized when all of the following criteria have been met:
|
•
|
Persuasive evidence of an arrangement exists. We generally rely upon sales agreements and customer purchase orders as evidence of an arrangement.
|
|
•
|
Delivery has occurred. We use the shipping terms of the arrangement or evidence of customer acceptance to verify delivery or performance.
|
|
•
|
Sales price is fixed or determinable. We assess whether the sales price is fixed or determinable based on the payment terms and whether the sales price is subject to refund or adjustment. Payment terms to customers can range from net 30 to net 120 days.
|
|
•
|
Collectability is reasonably assured. We assess collectability based primarily on creditworthiness of customers and their payment histories.
|
Revenue from installation and training services are recognized as the services are completed. Post-sales software support revenue and extended warranty services revenue are deferred and recognized ratably over the period during which the services are to be performed. To date, service revenue has comprised an insignificant portion of our revenue and we have not reported service revenue separately from product revenue in our financial statements. In instances where substantive acceptance provisions are specified in the customer agreement, revenue is deferred until all acceptance criteria have been met. From time to time, we offer customers sales incentives, which include volume rebates and discounts. These amounts are estimated on a quarterly basis and recorded net of revenue.
We enter into arrangements with certain of our customers who receive government supported loans and grants from the RUS to finance capital spending. Under the terms of an RUS equipment contract that includes installation services, the customer does not take possession and control and title does not pass until formal acceptance is obtained from the customer. Under this type of arrangement, we do not recognize revenue until we have received formal acceptance from the customer. For RUS arrangements that do not involve installation services, we recognize revenue in accordance with the revenue recognition policy described above.
Our products contain both software and non-software components that function together to deliver the products' essential functionality. When we enter into sales arrangements that consist of multiple deliverables of our product and service offerings, we allocate the total consideration of the arrangement to each separable deliverable based on their relative selling price. We limit the amount allocable to delivered elements to the amount that is not contingent upon the delivery of additional items or meeting specified performance conditions, and recognize revenue on each deliverable in accordance with our revenue policy. The determination of selling price for each deliverable is based on a selling price hierarchy, which is vendor-specific objective evidence (“VSOE”) if available, third-party evidence (“TPE”) if VSOE is not available, or estimated selling price (“ESP”) if neither VSOE nor TPE is available. VSOE of selling price is based on the price charged when the element is sold separately. In determining VSOE, we require that a substantial majority of the selling prices of an element fall within a narrow range when each element is sold separately. We have established VSOE for our training and post-sales software support services based on the normal pricing practices of these services when sold separately. TPE of selling price is established by evaluating whether there are similar competitor products or services that are sold in stand-alone sales transaction to similarly situated customers. Generally, our
40
marketing strategy differs from that of our peers and our offerings contain a significant level of customization and differentiation such that the comparable pricing of products with similar functionality cannot be obtained. Additionally, as we are unable to reliably determine what similar competitor products' selling prices are on a stand-alone basis, we are not typically able to determine TPE. ESP is established considering multiple factors including, but not limited to geographies market conditions, competitive landscape, internal costs, gross margin objectives, characteristics of targeted customers and pricing practices. The determination of ESP is made through consultation with and formal approval by management, taking into consideration the go-to-market strategy.
Stock-Based Compensation
In accordance with ASC Topic 718,
"Compensation - Stock Compensation,"
stock-based awards are recorded at fair value as of the grant date and recognized to expense over the employee’s requisite service period (generally the vesting period), which we have elected to amortize on a straight-line basis.
We value restricted stock units ("RSUs") and restricted stock awards ("RSAs") at the closing market price of our common stock on the date of grant. The fair value of performance restricted stock units ("PRSUs") with a market condition is estimated on the date of grant, using a Monte Carlo simulation model to estimate the total return ranking of our common stock in relation to the peer group over each performance period. Compensation cost on PRSUs with a market condition is not adjusted for subsequent changes in the Company's stock performance or the level of ultimate vesting.
We estimate the fair value of stock options and employee stock purchase rights at the grant date using the Black-Scholes option-pricing model. This model requires the use of highly judgmental assumptions, including expected stock price volatility and expected life of option awards, which have a significant impact on the fair value estimates and are discussed in detail in Note 8,
"Stockholders' Equity"
of the Notes to Consolidated Financial Statements in this Form 10-K. Changes to these estimates will cause the fair values of our stock options and related stock-based compensation expense that we record to vary.
In addition, we apply an estimated forfeiture rate to awards granted and record stock-based compensation expense only for those awards that are expected to vest. Forfeiture rates are estimated at the time of grant based on our historical experience. Further, to the extent our actual forfeiture rate is different from our estimate, stock-based compensation is adjusted accordingly.
Inventory Valuation
Inventory, which primarily consisted of finished goods purchased from contract manufacturers, is stated at the lower of cost, determined by the first-in, first-out method, or market value. Inbound shipping costs are included in cost of inventory. In addition, the Company, from time to time, procures component inventory primarily as a result of manufacturing discontinuation of critical components by suppliers. We regularly monitor inventory quantities on-hand and record write-downs for excess and obsolete inventories based on our estimate of demand for our products, potential obsolescence of technology, product life cycle and whether pricing trends or forecasts indicate that the carrying value of inventory exceeds our estimated selling price. These factors are impacted by market and economic conditions, technology changes and new product introductions and require estimates that may include elements that are uncertain. Actual demand may differ from forecasted demand and may have a material effect on gross margins. If inventory is written down, a new cost basis is established that cannot be increased in future periods. The sale of previously reserved inventory has not had a material impact on our gross margins.
Allowance for Doubtful Accounts
We maintain an allowance for doubtful accounts for estimated losses resulting from the inability of our customers to make required payments. We record a specific allowance based on an analysis of individual past-due balances. Additionally, based on historical write-offs and our collection experience, we record an additional allowance based on a percentage of outstanding receivables. We perform credit evaluations of our customers’ financial condition. These evaluations require significant judgment and are based on a variety of factors including, but not limited to, current economic trends, payment history and a financial review of the customer. Actual collection losses may differ from management’s estimates, and such differences could be material to our financial position and results of operations.
Warranty
We offer limited warranties for our hardware products for a period of one or five years, depending on the product type. We recognize estimated costs related to warranty activities as a component of cost of revenue upon product shipment. The estimates are based on historical product failure rates and historical costs incurred in correcting product failures. The recorded amount is adjusted from time to time for specifically identified warranty exposure. Actual warranty expenses are charged against our estimated warranty liability when incurred. Factors that affect our warranty liability include the number of installed units and historical and anticipated rates of warranty claims and cost per claim.
Valuation of Goodwill and Intangible Assets
Goodwill is not amortized but instead is subject to an annual impairment test or more frequently if events or changes in circumstances indicate that it may be impaired. We evaluate goodwill on an annual basis as of the end of the second quarter of each year. Management has determined that we operate as a single reporting unit and, therefore, evaluates goodwill impairment at the enterprise level. Intangible assets are reviewed for impairment whenever events or changes in circumstances indicate an asset’s carrying value may not be recoverable.
In an annual impairment test, we first assess qualitative factors to determine whether it is necessary to perform the two-step quantitative goodwill impairment test. In assessing the qualitative factors, management considers the impact of these key factors: macro-economic conditions, industry and market environment, overall financial performance of the Company, cash flow from operating activities, market capitalization and stock price. If management determines as a result of the qualitative assessment that it is more likely than not that the fair value of a reporting unit is less than its carrying amount, then the quantitative test is required. Otherwise, no further testing is required.
41
In a quantitative test, we compare the Company's fair value to its carrying value including goodwill. We determine the Company's fair value using both an income approach and a market approach. Under the income approach, we determine fair value based on estimated future cash flows, discounted by an estimated weighted-average cost of capital, which reflects the overall level of inherent risk of the Company and the rate of return an outside investor would expect to earn. Under the market-based approach, we utilize information regarding the Company as well as publicly available industry information to determine earnings multiples that are used to value the Company. If the carrying value of the Company exceeds its fair value, we will determine the amount of impairment loss by comparing the implied fair value of goodwill with the carrying value of goodwill. An impairment charge is recognized for the excess of the carrying value of goodwill over its implied fair value.
At the end of the second quarter of 2013, we completed our annual goodwill impairment test. Based on our assessment of the aforementioned qualitative factors, we concluded that the fair value of the Company was more likely than not greater than its carrying amount as of June 29, 2013. As such, it was not necessary to perform the two-step quantitative goodwill impairment test at the time. Subsequent to the 2013 annual impairment test, there have been no significant events or circumstances affecting the valuation of goodwill. As of December 31, 2013, there were no events or changes in circumstances that indicated that the carrying amount of intangible assets may not be recoverable or that goodwill shall be tested for impairment. Therefore, there was
no
impairment to the carrying value of the Company's goodwill. There were
no
impairment losses for goodwill during 2012 and 2011.
Intangible assets with finite useful lives are amortized over their estimated useful life, generally
five years
. We periodically evaluate intangible assets for impairment whenever events or changes in circumstances indicate that a potential impairment may have occurred. If such events or changes in circumstances arise, we compare the carrying amount of the intangible assets to the estimated future undiscounted cash flows expected to be generated by the assets. If the estimated aggregate undiscounted cash flows are less than the carrying amount of the intangible assets, an impairment charge, calculated as the amount by which the carrying amount of the assets exceeds the fair value of the assets, is recorded. The fair value of intangible assets is determined based on the estimated discounted cash flows expected to be generated from the assets. We have reviewed events and changes to our business during the year and have determined that there was no impairment to our intangible assets during 2013. We did not incur any impairment losses for intangible assets during 2012 and 2011.
Income Taxes
We evaluate our tax positions and estimate our current tax exposure in each jurisdiction in which we operate. This includes assessing the temporary differences resulting from differing treatment of items not currently deductible for tax purposes. These differences result in deferred tax assets and liabilities on our consolidated balance sheets, which are calculated based upon the difference between the financial statement and tax bases of assets and liabilities using the enacted tax rates that will be in effect when these differences reverse. In general, deferred tax assets represent future tax benefits to be received when certain expenses previously recognized in our statements of operations become deductible expenses under applicable income tax laws or loss or credit carry-forwards are utilized. Since realization of our deferred tax assets is dependent on future taxable income against which these deductions, losses and credits can be utilized, we must assess the likelihood that our deferred tax assets will be recovered from future taxable income. To the extent we believe that recovery is below the more likely than not threshold, we must establish a valuation allowance against the net deferred tax asset. Significant judgment is required in determining our provision for income taxes, our deferred tax assets and liabilities and any valuation allowance recorded against net deferred tax assets.
Since inception, we have incurred operating losses and accordingly have federal and state net operating loss carry-forwards of
$550.1 million
and
$174.2 million
, respectively, as of December 31, 2013. The U.S. federal net operating loss carryforwards will expire at various dates beginning in 2018 and through 2031, if not utilized. The state net operation loss carryforwards will expire at various dates beginning in 2014 and through 2031, if not utilized. Additionally, we had U.S. federal and state research and development credits of $18.5 million and $23.8 million as of December 31, 2013. The credits have varying expiration dates between 2015 and 2033 with California credits having no expiration. These two items account for the bulk of our net deferred tax asset of
$207.5 million
as of December 31, 2013. Excluding our foreign operations, we have recorded a full valuation allowance against the net deferred assets at each balance sheet date presented. We believe that based on the available evidence and history of operation losses, it is more likely than not that we will not be able to utilize all of our deferred assets before expiration. We intend to maintain the full valuation allowances until sufficient evidence exists to support the reversal of the valuation allowances.
Results of Operations for Years Ended
December 31, 2013
,
2012
and
2011
Revenue
The following table sets forth our revenue (in thousands, except for percentages):
|
Years Ended December 31,
|
2013 vs 2012 Change
|
2012 vs 2011 Change
|
|||||||||||||||||||||||
|
2013
|
2012
|
2011
|
$
|
%
|
$
|
%
|
|||||||||||||||||||
|
Revenue
|
$
|
382,618
|
|
$
|
330,218
|
|
$
|
344,669
|
|
$
|
52,400
|
|
16
|
%
|
$
|
(14,451
|
)
|
(4
|
)%
|
||||||
Our revenue is principally derived in the United States. During
2013
,
2012
, and
2011
, revenue generated in the United States represented approximately 87%, 93% and 94%, respectively. We expect that our international revenue will continue to grow and become a larger proportion of our revenue as we continue our expansion into international markets.
2013 compared to 2012:
The increase in revenue during 2013 compared with 2012 primarily resulted from improved macro-economic conditions and our continuous efforts to expand our worldwide footprint. We experienced an increase in shipment volume across our existing
42
customer base and from the addition of new customers. In addition, our revenue increased in 2013 as a result of completing and recognizing more revenue on RUS-funded projects, which were previously in deferred revenue. During 2013, our revenue from the United States, European and Caribbean customers increased by
$27.4 million
,
$17.1 million
, and
$8.1 million
, respectively, as compared with 2012. Historically, our sales outside of the United States were predominantly to customers in the Caribbean and Canada. We expect growth in sales to other international locations to become more important over time.
2012 compared to 2011:
Revenue decreased in 2012 compared with 2011 by $14.5 million, or 4%, primarily due to a decrease in shipment volume during the first half of the year resulting from the softness in demand across multiple customer markets which we believe was due to a slowdown in capital expenditures by service providers increasingly concerned about macro-economic conditions and uncertainties associated with the implementation of regulatory reforms. In the first half of 2012, revenue decreased by $11.9 million as compared to the same period of 2011. These issues began to subside in the second half of 2012 and our shipment volume and revenue increased accordingly.
Cost of Revenue and Gross Profit
Our cost of revenue is comprised of the following:
|
•
|
Products and services revenue—Cost of products revenue includes the inventory costs of our products that have shipped, accrued warranty costs for our standard warranty program, outbound freight costs to deliver products to our customers, overhead from our manufacturing operations cost centers, including stock-based compensation, and other manufacturing related costs associated with manufacturing our products and managing our inventory. We outsource our manufacturing to third-party manufacturers. Inventory costs are estimated using standard costs, which reflect the cost of historical direct labor, direct overhead and materials used to build our inventory. Cost of services revenue includes direct installation material costs, direct costs from third-party installers, professional service costs, repair fees charged by our outsourced repair contractors to refurbish product returns under an extended warranty or per incident repair agreement, and other miscellaneous costs to support our services.
|
|
•
|
Acquisition-related expenses—Acquisition-related expenses are primarily related to inventory acquired from Occam that was revalued to its estimated fair value and was amortized to cost of revenue as the inventory was sold. We amortized $14.2 million related to the revaluation of inventory during 2011. Additionally, we incurred charges of $5.6 million during 2011 for excess and obsolete inventory resulting from the Occam acquisition.
|
|
•
|
Amortization of acquired intangible assets—In connection with the acquisitions of Occam in 2011 and OSI in 2006, we recorded amortizable intangible assets of $30.3 million and $28.9 million respectively, which included core developed technologies, purchase order backlog and the trade name. These amounts are amortized to cost of revenue over their estimated useful lives. The intangible assets resulting from our acquisition of OSI had been fully amortized during the first quarter of 2011. In addition, we acquired $16.3 million in-process technology from Occam. At the end of the first quarter of 2012, upon the completion of the research and development efforts associated with this in-process technology, we determined that this technology had a useful life of 5 years and therefore reclassified it as core developed technology and began amortizing this intangible asset to cost of revenue during the second quarter of 2012.
|
The following table sets forth our cost of revenue (in thousands, except for percentages):
|
Years Ended December 31,
|
2013 vs 2012 Change
|
2012 vs 2011 Change
|
|||||||||||||||||||||||
|
2013
|
2012
|
2011
|
$
|
%
|
$
|
%
|
|||||||||||||||||||
|
Cost of revenue:
|
|||||||||||||||||||||||||
|
Products and services
|
$
|
203,191
|
|
$
|
185,103
|
|
$
|
195,698
|
|
$
|
18,088
|
|
10
|
%
|
$
|
(10,595
|
)
|
(5
|
)%
|
||||||
|
Acquisition-related expenses
|
—
|
|
—
|
|
19,966
|
|
—
|
|
—
|
%
|
(19,966
|
)
|
(100
|
)%
|
|||||||||||
|
Amortization of intangible assets
|
8,353
|
|
7,539
|
|
9,552
|
|
814
|
|
11
|
%
|
(2,013
|
)
|
(21
|
)%
|
|||||||||||
|
Total cost of revenue
|
$
|
211,544
|
|
$
|
192,642
|
|
$
|
225,216
|
|
$
|
18,902
|
|
10
|
%
|
$
|
(32,574
|
)
|
(14
|
)%
|
||||||
|
Gross profit
|
$
|
171,074
|
|
$
|
137,576
|
|
$
|
119,453
|
|
$
|
33,498
|
|
24
|
%
|
$
|
18,123
|
|
15
|
%
|
||||||
|
Gross margin
|
45
|
%
|
42
|
%
|
35
|
%
|
|||||||||||||||||||
2013 compared to 2012:
The increase in cost of revenue during 2013 compared with 2012 was due to an
$18.1 million
increase in products and services cost, which was primarily related to increased shipments, the completion and expense recognition of several RUS-funded projects and a
$2.1 million
increase in provision for write-downs of excess and obsolete inventories, and a
$0.8 million
increase in amortization of intangible assets resulted from core developed technology that began amortizing in the second quarter of 2012. See Note 3,
“Goodwill and Intangible Assets”
of the Notes to Consolidated Financial Statements included in this Form 10-K for details of this intangible asset.
Gross margin increased in 2013 compared with 2012, primarily due to a combination of product mix and cost reductions. In 2013, we shipped more higher margin E-Series platforms as compared to 2012.
2012 compared to 2011:
Cost of revenue decreased in 2012 compared with 2011 by $32.6 million, or 14%, which is due to the fact that we did not incur any associated acquisition-related expenses subsequent to 2011, a decrease in cost of products and service revenues, and a decrease in amortization of intangible assets. The decrease in cost of products and service revenues was a result of decreased revenue, increased order volumes, and decreased write-down charges for excess and obsolete inventory as a result of improved inventory management
The decrease in amortization of intangible assets in 2012 is primarily attributable to the completion of the amortization of certain intangibles in 2011 that we acquired from Occam and OSI, offset in part by the amortization of the core developed technology that was reclassified from in-process technology in the first quarter of 2012 as discussed above.
43
Gross margin increased in 2012 compared with 2011, primarily due to the absence of acquisition-related expenses, lower excess and obsolete inventory write-down charges, lower intangible assets amortization expenses, and a combination of product mix and cost reductions. In 2012, we shipped more higher margin E-Series platforms as compared to 2011.
Operating Expenses
Research and Development Expenses
Research and development expenses represent the largest component of our operating expenses and include personnel costs, consulting services, depreciation on lab equipment, costs of prototypes and overhead allocations. We generally expense research and development costs as incurred, since the costs of software development that we incur after a product has reached technological feasibility are not material. The following table sets forth our research and development expenses (in thousands, except for percentages):
|
Years Ended December 31,
|
2013 vs 2012 Change
|
2012 vs 2011 Change
|
|||||||||||||||||||||||
|
2013
|
2012
|
2011
|
$
|
%
|
$
|
%
|
|||||||||||||||||||
|
Research and development
|
$
|
79,299
|
|
$
|
66,748
|
|
$
|
67,725
|
|
$
|
12,551
|
|
19
|
%
|
$
|
(977
|
)
|
(1
|
)%
|
||||||
|
Percent of total revenue
|
21
|
%
|
20
|
%
|
20
|
%
|
|||||||||||||||||||
2013 compared to 2012:
The increase in research and development expenses during 2013 compared with 2012 was primarily due to a $9.9 million increase in compensation and employee benefits expenses, including stock-based compensation expense, due to increased headcount resulting from our acquisition of Ericsson's fiber access assets in November 2012, a company-wide salary increase, and bonuses earned in 2013. In 2012, we did not have a company-wide salary increase or bonus payout. In addition, during 2013, we had a $2.5 million increase in depreciation and facility related costs as a result of the additional equipment that was acquired from Ericsson and entry into a lease for office space in San Jose in November 2012.
We are continuing our strategic investments in our Unified Access portfolio. We intend to continue to dedicate significant resources to research and development and to develop new product capabilities to support the performance, scalability and management of our Unified Access portfolio.
2012 compared to 2011:
Research and development expenses decreased in 2012 compared with 2011 by $1.0 million, or 1%, primarily due to a decrease in prototype expenses resulting from the timing of new product development activities, and a decrease in stock-based compensation expense resulting from RSUs granted in a company-wide stock option exchange program, which were fully vested by May 2011. These decreases were offset in part by an increase in compensation expenses due to increased headcount resulting from the acquisition of Ericsson's fiber access assets on November 2, 2012 and the expansion of our China development center.
Sales and Marketing Expenses
Sales and marketing expenses consist of personnel costs, employee sales commissions and marketing programs. The following table sets forth our sales and marketing expenses (in thousands, except for percentages):
|
Years Ended December 31,
|
2013 vs 2012 Change
|
2012 vs 2011 Change
|
|||||||||||||||||||||||
|
2013
|
2012
|
2011
|
$
|
%
|
$
|
%
|
|||||||||||||||||||
|
Sales and marketing
|
$
|
68,075
|
|
$
|
62,129
|
|
$
|
55,551
|
|
$
|
5,946
|
|
10
|
%
|
$
|
6,578
|
|
12
|
%
|
||||||
|
Percent of total revenue
|
18
|
%
|
19
|
%
|
16
|
%
|
|||||||||||||||||||
2013 compared to 2012:
The increase in sales and marketing expenses during 2013 compared with 2012 was primarily due to a $4.1 million increase in compensation and employee benefits-related expenses, including stock-based compensation expense, due to increased headcount resulting from the hiring of additional employees to pursue our international expansion, the company-wide salary increase, bonuses earned during 2013, and increased commissions resulting from increased international sales. In addition, depreciation and amortization expenses increased by $1.1 million primarily due to increased purchase of software applications, and consulting services expense increased by $0.8 million primarily due to the IT consulting services and support provided to the former Ericsson customers.
We will continue our investments in sales and marketing in order to extend our market reach and grow our business in support of our key strategic initiatives.
2012 compared to 2011:
Sales and marketing expenses increased in 2012 compared with 2011 by $6.6 million, or 12%, primarily due to an increase in compensation and related costs, an increase in stock-based compensation expense, which were primarily driven by an increase in headcount in order to expand our international sales operations.
44
General and Administrative Expenses
General and administrative expenses consist primarily of personnel costs and costs for facilities related to our executive, finance, human resource, information technology and legal organizations and fees for professional services. Professional services consist of outside legal, tax, and audit services. The following table sets forth our general and administrative expenses (in thousands, except for percentages):
|
Years Ended December 31,
|
2013 vs 2012 Change
|
2012 vs 2011 Change
|
|||||||||||||||||||||||
|
2013
|
2012
|
2011
|
$
|
%
|
$
|
%
|
|||||||||||||||||||
|
General and administrative
|
$
|
31,945
|
|
$
|
26,114
|
|
$
|
27,002
|
|
$
|
5,831
|
|
22
|
%
|
$
|
(888
|
)
|
(3
|
)%
|
||||||
|
Percent of total revenue
|
8
|
%
|
8
|
%
|
8
|
%
|
|||||||||||||||||||
2013 compared to 2012:
The increase in general and administrative expenses during 2013 compared with 2012 was partly due to a $3.1 million increase in compensation and employee benefits related expenses, including stock-based compensation expense, primarily due to the company-wide salary increase, bonuses earned during 2013, additional equity awards granted in 2013, and increased headcount. During 2013, there was also a $1.6 million increase in professional and consulting service expenses resulting primarily from increased legal and audit fees as well as increased projects on infrastructure hosting and application support.
2012 compared to 2011:
General and administrative expenses decreased in 2012 compared with 2011 by $0.9 million, or 3%, primarily due to a decrease in stock-based compensation expense resulting from RSUs granted in a company-wide stock option exchange program, which were fully vested by May 2011. These decreases were offset in part by increases in professional service expenses as well as an increase in compensation and related expenses due to increased headcount.
Acquisition-related Expenses
We expense all acquisition-related costs as incurred. These costs generally include outside services for legal and accounting fees, costs associated with consolidating facilities, severance and retention bonuses paid to transitional and certain other employees, and costs for other integration services. The following table sets forth our acquisition-related expenses included in operating expenses (in thousands, except for percentages):
|
Years Ended December 31,
|
2013 vs 2012 Change
|
2012 vs 2011 Change
|
|||||||||||||||||||||||
|
2013
|
2012
|
2011
|
$
|
%
|
$
|
%
|
|||||||||||||||||||
|
Acquisition-related expenses
|
$
|
—
|
|
$
|
1,401
|
|
$
|
12,927
|
|
$
|
(1,401
|
)
|
(100
|
)%
|
$
|
(11,526
|
)
|
(89
|
)%
|
||||||
|
Percent of total revenue
|
—
|
%
|
—
|
%
|
4
|
%
|
|||||||||||||||||||
2013 compared to 2012:
We did not incur any acquisition-related expenses in 2013. See the discussion below for the acquisition-related expenses for 2012.
2012 compared to 2011:
Acquisition-related expenses for 2012 and 2011 were related to our EFAA acquisition and our Occam acquisition, respectively. The decrease is primarily due to the magnitude and complexity of the Occam acquisition compared to the EFAA acquisition. For the Occam acquisition, we incurred significant expenses associated with legal and professional fees, consolidating facilities, severance payments, salaries paid to transitional Occam employees, and stock-based compensation related to accelerated vesting for certain Occam executives who terminated subsequent to the acquisition date. For the EFAA acquisition, the vast majority of the $1.4 million acquisition-related expense consisted of one-time payments made to former Ericsson employees who transferred to Calix as a result of the acquisition. We do not expect any additional acquisition-related expenses going forward for the EFAA acquisition.
For more information regarding the aforementioned acquisitions, see Note 2,
“Business Combinations”
of the Notes to Consolidated Financial Statements included in this Form 10-K.
Amortization of Intangible Assets
In connection with our acquisitions of Occam in 2011 and OSI in 2006, we recorded amortizable intangible assets related to customer relationships of $51.0 million and $3.7 million, respectively. These amounts are amortized to operating expenses over their estimated useful lives. The amortization of intangible assets related to OSI acquisition was completed during the first quarter of 2011. The following table sets forth our amortization of intangible assets expenses included in operating expenses (in thousands, except for percentages):
|
Years Ended December 31,
|
2013 vs 2012 Change
|
2012 vs 2011 Change
|
|||||||||||||||||||||||
|
2013
|
2012
|
2011
|
$
|
%
|
$
|
%
|
|||||||||||||||||||
|
Amortization of intangible assets
|
$
|
10,208
|
|
$
|
10,208
|
|
$
|
8,569
|
|
$
|
—
|
|
—
|
%
|
$
|
1,639
|
|
19
|
%
|
||||||
|
Percent of total revenue
|
3
|
%
|
3
|
%
|
2
|
%
|
|||||||||||||||||||
2013 compared to 2012:
Amortization of intangible assets for 2013 had not changed compared with 2012 because there had been no changes in our intangible assets. See Note 3,
“Goodwill and Intangible Assets”
of the Notes to Consolidated Financial Statements included in this Form 10-K for details of this intangible asset.
2012 compared to 2011:
Amortization of intangible assets was greater during 2012 than during 2011 due to twelve months of amortization in 2012 compared with ten months of amortization in 2011, as the Occam acquisition was completed on February 22, 2011.
45
Interest and Other Income (Expense), net
The following table sets forth our interest and other income (expense), net (in thousands, except for percentages):
|
Years Ended December 31,
|
2013 vs 2012 Change
|
2012 vs 2011 Change
|
||||||||||||||||||||||||
|
2013
|
2012
|
2011
|
$
|
%
|
$
|
%
|
||||||||||||||||||||
|
Interest and other income (expense), net
|
||||||||||||||||||||||||||
|
Interest income
|
$
|
7
|
|
$
|
15
|
|
$
|
87
|
|
$
|
(8
|
)
|
(53
|
)%
|
$
|
(72
|
)
|
(83
|
)%
|
|||||||
|
Interest expense
|
(167
|
)
|
(185
|
)
|
(184
|
)
|
18
|
|
(10
|
)%
|
(1
|
)
|
1
|
%
|
||||||||||||
|
Utilization of inventory credit
|
1,651
|
|
—
|
|
—
|
|
1,651
|
|
100
|
%
|
—
|
|
—
|
%
|
||||||||||||
|
Gain on bargain purchase
|
—
|
|
1,029
|
|
—
|
|
(1,029
|
)
|
(100
|
)%
|
1,029
|
|
100
|
%
|
||||||||||||
|
Other income (expense), net
|
(317
|
)
|
(3
|
)
|
92
|
|
(314
|
)
|
10,467
|
%
|
(95
|
)
|
(103
|
)%
|
||||||||||||
|
Total interest and other income (expense), net
|
$
|
1,174
|
|
$
|
856
|
|
$
|
(5
|
)
|
$
|
318
|
|
37
|
%
|
$
|
861
|
|
(17,220
|
)%
|
|||||||
|
Percent of total revenue
|
—
|
%
|
—
|
%
|
—
|
%
|
||||||||||||||||||||
2013 compared to 2012:
The increase in interest and other income (expense), net, for 2013 compared with 2012 was primarily attributable to a gain associated with inventories we obtained from Ericsson using a credit that we received as part of our EFAA acquisition ("Ericsson Credit"). We recorded such inventories at their fair market value and recognized a gain of
$1.7 million
for the amount in excess of the fair value of the Ericsson Credit that was recorded at the date of the EFAA acquisition. This increase was offset in part by a $1.0 million gain on bargain purchase recognized in connection with the EFAA acquisition that was recorded in 2012 which did not recur in 2013. See Note 2,
"Business Combinations"
of the Notes to the Consolidated Financial Statements in this Form 10-K for more details.
2012 compared to 2011:
Interest and other income (expense), net, increased by $0.9 million during 2012 from a net expense of $5 thousand for 2011 to a net income of $0.9 million for 2012. This increase was primarily due to a gain on bargain purchase related to the EFAA acquisition. See Note 2,
"Business Combinations"
of the Notes to the Consolidated Financial Statements in this Form 10-K for more details. The EFAA acquisition resulted in a bargain purchase as Ericsson had been incurring losses in its fiber access business at the time of the acquisition and was therefore motivated to sell the assets of its fiber access assets.
Provision for (benefit from) Income Taxes
The following table sets forth our provision for (benefit from) income taxes (in thousands, except percentages):
|
Years Ended December 31,
|
2013 vs 2012 Change
|
2012 vs 2011 Change
|
|||||||||||||||||||||||
|
2013
|
2012
|
2011
|
$
|
%
|
$
|
%
|
|||||||||||||||||||
|
Provision for income taxes
|
$
|
(14
|
)
|
$
|
158
|
|
$
|
224
|
|
$
|
(172
|
)
|
(109
|
)%
|
$
|
(66
|
)
|
(29
|
)%
|
||||||
|
Effective tax rate
|
0.1
|
%
|
(0.6
|
)%
|
(0.4
|
)%
|
|||||||||||||||||||
2013 compared to 2012:
Income tax expense decreased by
$0.2 million
in 2013 from
$0.2 million
in 2012 to a
$14 thousand
benefit in 2013. The decrease was primarily due to a 2012 federal AMT return to provision true-up of $0.3 million, a $0.1 million benefit due to the reversal of an unrecognized tax benefit reserve, and a $0.3 million decrease in foreign income tax, partially offset by an increase resulting from the federal and state benefit of $0.6 million recorded in 2012 on the bargain purchase gain related to the EFAA acquisition.
We have significant accumulated net operation losses which are subject to a full valuation allowance and, as such, we have not received a benefit for these losses.
The income tax benefit for 2013 primarily consisted of state alternative minimum tax (AMT) and state and foreign income taxes, net of a tax benefit recorded from the utilization of a portion of the AMT net operation loss (NOL) acquired from Occam. We will carry forward the remainder of the AMT NOL, which was approximately $5.3 million as of December 31, 2013, to offset future AMT taxable income. The income tax provision for 2012 primarily consisted of federal AMT and state and foreign income taxes. The effective tax rates differ from the U.S. federal statutory rate of 34.0% due primarily to the tax affected change in the valuation allowance against our deferred tax assets.
As of December 31, 2013, we had unrecognized tax benefits of $14.4 million, none of which would affect our effective tax rate if recognized.
2012 compared to 2011:
Income tax expense decreased by $0.1 million in 2012 compared with 2011. The decrease was primarily due to a federal and state benefit of $0.6 million recorded on the bargain purchase gain related to the EFAA acquisition, partially offset by increases in federal and foreign income taxes.
As of December 31, 2012, we had unrecognized tax benefits of $13.2 million, of which $0.1 million would affect our effective tax rate if recognized.
Liquidity and Capital Resources
We have funded our operations primarily through cash generated from operations and the 2010 initial public offering of our common stock. At
December 31, 2013
, we had cash and cash equivalents of
$82.7 million
including $2.8 million of cash held by our foreign subsidiaries. Our cash and cash equivalents consisted of deposits held at banks and money market mutual funds held at major financial
46
institutions. Our intent is to permanently reinvest our earnings outside the U.S. and our current plans do not demonstrate a need to repatriate the foreign cash to fund our U.S. operations.
The following table presents the cash inflows and outflows by activity during 2013, 2012, and 2011 (in thousands):
|
Years Ended December 31,
|
||||||||||||
|
2013
|
2012
|
2011
|
||||||||||
|
Net cash provided by operating activities
|
$
|
40,818
|
|
$
|
27,678
|
|
$
|
14,589
|
|
|||
|
Net cash used in investing activities
|
(6,987
|
)
|
(22,179
|
)
|
(36,409
|
)
|
||||||
|
Net cash provided by (used in) financing activities
|
1,818
|
|
2,513
|
|
(5,634
|
)
|
||||||
Operating Activities
Our operating activities provided cash of
$40.8 million
in 2013,
$27.7 million
in 2012 and
$14.6 million
in 2011. The
increase
in cash provided by operating activities during 2013 as compared to 2012 was due primarily to a
favorable
change of
$15.7 million
in our operating results after adjustment of non-cash charges, offset partially by a
$2.5 million
decrease
in net cash inflow resulting from changes in operating assets and liabilities.
In 2013, non-cash charges were
$47.6 million
(the majority of which consist of stock-based compensation expense, amortization expenses and depreciation). Cash inflows from changes in operating assets and liabilities primarily resulted from a
$16.0 million
decrease in net accounts receivable due to strong collections in 2013, a
$6.4 million
increase in accounts payable due to the timing of inventory receipts and payments, and a
$0.5 million
decrease in prepaid expenses and other assets. Cash outflows from changes in operating assets and liabilities included primarily a
$6.1 million
increase in inventory due to timing of inventory receipts, a
$4.2 million
decrease in accrued liabilities primarily due to the timing of our sales commissions payout and the decrease in warranty liability, a
$1.8 million
decrease in deferred revenue as a result of revenue recognition for previous shipments related to certain RUS-funded contracts, and a
$0.3 million
increase in restricted cash to collateralize the outstanding letters of credit with Silicon Valley Bank.
The increase in cash provided by operating activities during 2012 as compared to 2011 was due primarily to a favorable change of $16.8 million in our operating results after adjustment of non-cash charges, offset partially by a $3.7 million decrease in net cash inflow resulting from changes in operating assets and liabilities. In 2012, non-cash charges were $43.0 million (the majority of which consist of depreciation and amortization expenses and stock-based compensation expense). Cash inflows from changes in operating assets and liabilities primarily resulted from a $26.4 million increase in deferred revenue as a result of increased shipments relating to certain RUS-funded contracts, an $11.3 million decrease in inventory due to improved inventory management, and a $2.6 million increase in accounts payable due to the timing of inventory receipts and payments. Cash outflows from changes in operating assets and liabilities included primarily a $13.4 million increase in deferred cost of revenue primarily related to the deferral of certain RUS-funded contracts, a $13.0 million increase in net accounts receivable due to the timing of sale and billing activities, and a $0.9 million decrease in accrued liabilities.
In 2011, our operating activities provided cash of $14.6 million. This resulted primarily from non-cash charges of $50.4 million (the majority of which consist of stock-based compensation expense, amortization of intangible assets, and depreciation expense) and positive net changes in operating assets and liabilities, largely offset by our net loss of $52.6 million. Cash inflows from changes in operating assets and liabilities included primarily a net decrease of $13.7 million in accounts receivable due to strong cash collections, $8.6 million related to the sell through of inventory, an increase in deferred revenue of $2.8 million due to the deferral of certain RUS funded contracts and $0.3 million release of restricted cash. These inflows were partially offset by cash outflows from accounts payable of $7.8 million resulting primarily from payments of accounts payable assumed from Occam and a decrease of $0.7 million in accrued and other liabilities.
Investing Activities
In 2013, our cash used in investing activities consisted of capital expenditures of
$7.0 million
primarily as a result of purchases of test equipment, computer equipment and software.
In 2012, our cash used in investing activities primarily consisted of cash payment of $12.0 million to complete the acquisition of Ericsson's fiber access assets, and capital expenditures of $10.2 million primarily as a result of purchases of computer equipment and software.
In 2011, our cash used in investing activities primarily consisted of our acquisition of Occam for $60.8 million, net of $33.6 million of Occam cash assumed in the transaction, and capital expenditures of $7.4 million, partially offset by maturities of marketable securities of $31.8 million.
Financing Activities
In 2013, our financing activities provided cash of
$1.8 million
, which consisted of proceeds of
$4.8 million
from the issuance of common stock under the employee stock purchase plan (“ESPP”) and proceeds of
$0.7 million
from the exercises of stock options, offset by
$3.4 million
payment of payroll taxes for the vesting of restricted stock units and restricted stock awards and
$0.3 million
payments for debt issuance costs associated with the credit agreement that we entered into with Bank of America.
In 2012, our financing activities provided cash of $2.5 million, which consisted of proceeds of $4.1 million from the issuance of common stock under the employee stock purchase plan (“ESPP”) and proceeds of $0.2 million from the exercises of stock options, offset by $1.7 million payment of payroll taxes for the vesting of restricted stock units and restricted stock awards.
47
In 2011, our cash used in financing activities of $5.6 million primarily consisted of payment of payroll taxes of $10.4 million for the vesting of restricted stock units, offset by proceeds of $3.9 million from the issuance of common stock under the employee stock purchase plan or “ESPP” and proceeds of $0.8 million from the exercise of stock options. The payroll taxes withholding of $10.4 million for the vesting of the RSUs were net share-settled to cover the required withholding tax and the remaining amount was converted into an equivalent number of shares of common stock. The total shares withheld were approximately 485,000, which was based on the value of the RSUs on their vesting date as determined by our closing stock price.
Working Capital and Capital Expenditure Needs
We currently have no material cash commitments, except for normal recurring trade payables, expense accruals, operating leases and firm purchase commitments. In addition, we believe that our outsourced approach to manufacturing provides us significant flexibility in both managing inventory levels and financing our inventory. In the event that our revenue plan does not meet our expectations, we may eliminate or curtail expenditures to mitigate the impact on our working capital.
We also have a credit facility with an aggregate principal amount of up to $50.0 million. The credit facility matures in July 2016, but may be extended up to two times (each extension for an additional one-year period) upon mutual agreement with the lenders. Proceeds of the credit facility may be used for general corporate purposes and permitted acquisitions. As of December 31, 2013, there was
$50.0 million
available for borrowing under this credit facility. For a detailed discussion of our credit facility, please refer to Note 10, "
Credit Facility
" of the Notes to Consolidated Financial Statements included in this Form 10-K.
We believe based on our current operating plan, our existing cash, cash equivalents and existing amounts available under our credit facility will be sufficient to meet our anticipated cash needs for at least the next twelve months. Our future capital requirements will depend on many factors including our rate of revenue growth, the timing and extent of spending to support development efforts, the expansion of sales and marketing activities, the timing of introductions of new products and enhancements to existing products, the acquisition of new capabilities or technologies and the continued market acceptance of our products. In the event that additional financing is required from outside sources, we may not be able to raise it on terms acceptable to us or at all. If we are unable to raise additional capital when desired, our business, operating results and financial condition would be harmed.
Contractual Obligations and Commitments
Our principal commitments consist of obligations under operating leases for office space and non-cancelable outstanding purchase obligations. The following table summarizes our contractual obligations at
December 31, 2013
(in thousands):
|
Payments Due by Period
|
||||||||||||||||||||
|
Total
|
Less Than 1 year
|
1-3 Years
|
3-5 Years
|
More Than 5 years
|
||||||||||||||||
|
Operating lease obligations
(1)
|
$
|
12,756
|
|
$
|
3,438
|
|
$
|
4,995
|
|
$
|
4,071
|
|
$
|
252
|
|
|||||
|
Non-cancelable purchase commitments
(2)
|
16,314
|
|
16,314
|
|
—
|
|
—
|
|
—
|
|
||||||||||
|
Total
|
$
|
29,070
|
|
$
|
19,752
|
|
$
|
4,995
|
|
$
|
4,071
|
|
$
|
252
|
|
|||||
|
(1) The total minimum payments under our operating lease obligations have not been reduced by minimum sublease rentals of $0.2 million due in the future under non-cancelable sublease of a portion of our office in Fremont, California.
|
||||||||||||||||||||
|
(2) Represents outstanding non-cancelable purchase orders for finished goods to be delivered by our contract manufacturers.
|
||||||||||||||||||||
Future minimum operating lease obligations in the table above include primarily payments for our office space in Petaluma, California, and for our facilities in Minneapolis, Minnesota; Acton, Massachusetts; Nanjing, China; Richardson, Texas; and Fremont, San Jose, and Santa Barbara, California, which expire at various dates through 2019, and for certain office equipment under non-cancelable operating lease agreements, obtained through our acquisition of Occam, which expire at various dates through 2015. A portion of the office in Fremont, California is sublet under a sublease expiring in 2015. We are also actively seeking to sublease the remainder of our Fremont office that was vacated in March 2013.
See Note 5,
“Commitments and Contingencies”
of the Notes to Consolidated Financial Statements included in this Form 10-K for more discussions on our operating leases and purchase commitments.
Off-Balance Sheet Arrangements
As of
December 31, 2013
and December 31, 2012, we did not have any off-balance sheet arrangements.
Interest Rate Risk
The primary objectives of our investment activity are to preserve principal, provide liquidity and maximize income without significantly increasing risk. By policy, we do not enter into investments for trading or speculative purposes. At
December 31, 2013
, we had cash and cash equivalents of
$82.7 million
, which was held primarily in cash or money market funds. Due to the nature of these money market funds, we believe that we do not have any material exposure to changes in the fair value of our cash equivalents as a result of changes in interest rates.
48
Our exposure to interest rate risk also relates to the amount of interest we must pay on our borrowings under our credit facility, which allows us to borrow up to a maximum amount of $50.0 million. Borrowings under our credit facility will accrue interest at a variable rate based upon the applicable base rate or LIBOR plus a margin depending on the Company's leverage ratio of consolidated funded indebtedness to consolidated Adjusted EBITDA (customarily defined). As of
December 31, 2013
, we had no borrowings under the credit facility.
Foreign Currency Exchange Risk
In our view, our primary foreign currency exposures are economic, translation, and transaction.
Economic Exposure
The direct effect of foreign currency fluctuations on our sales and expenses have not been material because our sales and expenses are primarily denominated in U.S. dollars. However, we are indirectly exposed to changes in foreign currency exchange rates to the extent of our use of foreign contract manufacturers whom we pay in U.S. dollars. Changes in the local currency rates of these vendors in relation to the U.S. dollar could cause an increase in the price of products that we purchase. Additionally, if the U.S. dollar strengthens relative to other currencies, such strengthening could have an indirect effect on our sales to the extent it raises the cost of our products to non-U.S. customers and thereby reduces demand. A weaker U.S. dollar could have the opposite effect. The precise indirect effect of currency fluctuations is difficult to measure or predict because our sales are influenced by many factors in addition to the impact of such currency fluctuations.
Translation Exposure
Our sales contracts are primarily denominated in U.S. dollars and, therefore, the majority of our revenues are not subject to foreign currency risk. We are directly exposed to changes in foreign exchange rates to the extent such changes affect our expenses related to our foreign assets and liabilities with our subsidiary in China and the United Kingdom, whose functional currencies are the Chinese Renminbi ("RMB") and British Pound Sterling, respectively.
Our operating expenses are incurred primarily in the United States, with a small portion of expenses incurred in China associated with our research and development operations that are maintained there, and in the United Kingdom for our sales and services office there. Our operating expenses are generally denominated in the functional currencies of our subsidiaries in which the operations are located. For 2013, approximately
92%
of our operating expenses were U.S.-dollar denominated, and
4%
of our expenses were denominated in each of British pound and Chinese RMB. If the currency exchange rates in 2013 had been the same as in 2012, our 2013 operating results would have decreased by approximately
$67 thousand
. If the U.S. dollar had appreciated or depreciated by 10%, relative to the British pound and the Chinese RMB, our operating expenses for 2013 would have decreased or increased by
$1.6 million
, or
1%
. We do not currently enter into forward exchange contracts to hedge exposure denominated in foreign currencies or any derivative financial instruments. In the future, we may consider entering into hedging transactions to help mitigate our foreign currency exchange risk.
Foreign exchange rate fluctuations may also adversely impact our financial position as the assets and liabilities of our foreign operations are translated into U.S. dollars in preparing our Consolidated Balance Sheets. The effect of foreign exchange rate fluctuations on our consolidated financial position for the year ended December 31, 2013 was a net translation gain of approximately
$58 thousand
. This gain is recognized as an adjustment to stockholders’ equity through accumulated other comprehensive income.
Transaction Exposure
We have certain assets and liabilities, primarily receivables and accounts payable (including inter-company transactions) that are denominated in currencies other than the relevant entity’s functional currency. In certain circumstances, changes in the functional currency value of these assets and liabilities create fluctuations in our reported consolidated financial position, cash flows and results of operations. Transaction gains and losses on these foreign currency denominated assets and liabilities are recognized each period within other income (expense), net in our Consolidated Statements of Comprehensive Loss. During the year ended
December 31, 2013
, net loss we recognized related to these foreign exchange assets and liabilities was approximately
$0.1 million
.
49
REPORT OF INDEPENDENT REGISTERED PUBLIC ACCOUNTING FIRM
The Board of Directors and Stockholders of Calix, Inc.
We have audited the accompanying consolidated balance sheets of Calix, Inc. as of December 31, 2013 and 2012, and the related consolidated statements of comprehensive loss, stockholders' equity and cash flows for each of the three years in the period ended December 31, 2013. Our audits also included the financial statement schedule listed in the Index at Item 15(a). These financial statements and schedule are the responsibility of the Company's management. Our responsibility is to express an opinion on these financial statements and schedule based on our audits.
We conducted our audits in accordance with the standards of the Public Company Accounting Oversight Board (United States). Those standards require that we plan and perform the audit to obtain reasonable assurance about whether the financial statements are free of material misstatement. An audit includes examining, on a test basis, evidence supporting the amounts and disclosures in the financial statements. An audit also includes assessing the accounting principles used and significant estimates made by management, as well as evaluating the overall financial statement presentation. We believe that our audits provide a reasonable basis for our opinion.
In our opinion, the financial statements referred to above present fairly, in all material respects, the consolidated financial position of Calix, Inc. at December 31, 2013 and 2012, and the consolidated results of its operations and its cash flows for each of the three years in the period ended December 31, 2013, in conformity with U.S. generally accepted accounting principles. Also, in our opinion, the related financial statement schedule, when considered in relation to the basic financial statements taken as a whole, presents fairly in all material respects the information set forth therein.
We also have audited, in accordance with the standards of the Public Company Accounting Oversight Board (United States), Calix, Inc.’s internal control over financial reporting as of December 31, 2013, based on criteria established in Internal Control-Integrated Framework issued by the Committee of Sponsoring Organizations of the Treadway Commission (1992 framework) and our report dated February 20, 2014 expressed an unqualified opinion thereon.
/s/ Ernst & Young LLP
San Francisco, California
February 20, 2014
50
CALIX, INC.
(In thousands, except share and per share data)
|
December 31,
2013 |
December 31,
2012 |
|||||||
|
ASSETS
|
||||||||
|
Current assets:
|
||||||||
|
Cash and cash equivalents
|
$
|
82,747
|
|
$
|
46,995
|
|
||
|
Restricted cash
|
295
|
|
—
|
|
||||
|
Accounts receivable, net
|
43,520
|
|
59,519
|
|
||||
|
Inventory
|
51,071
|
|
43,282
|
|
||||
|
Deferred cost of revenue
|
21,076
|
|
21,077
|
|
||||
|
Prepaid expenses and other current assets
|
5,757
|
|
5,677
|
|
||||
|
Total current assets
|
204,466
|
|
176,550
|
|
||||
|
Property and equipment, net
|
17,473
|
|
21,083
|
|
||||
|
Goodwill
|
116,175
|
|
116,175
|
|
||||
|
Intangible assets, net
|
43,740
|
|
62,301
|
|
||||
|
Other assets
|
1,745
|
|
1,788
|
|
||||
|
Total assets
|
$
|
383,599
|
|
$
|
377,897
|
|
||
|
LIABILITIES AND STOCKHOLDERS’ EQUITY
|
||||||||
|
Current liabilities:
|
||||||||
|
Accounts payable
|
$
|
23,163
|
|
$
|
16,804
|
|
||
|
Accrued liabilities
|
32,075
|
|
36,176
|
|
||||
|
Deferred revenue
|
34,862
|
|
39,315
|
|
||||
|
Total current liabilities
|
90,100
|
|
92,295
|
|
||||
|
Long-term portion of deferred revenue
|
18,431
|
|
15,782
|
|
||||
|
Other long-term liabilities
|
1,145
|
|
745
|
|
||||
|
Total liabilities
|
109,676
|
|
108,822
|
|
||||
|
Commitments and contingencies (See Note 5)
|
|
|
||||||
|
Stockholders’ equity:
|
||||||||
|
Preferred stock, $0.025 par value; 5,000,000 shares authorized; no shares issued and outstanding as of December 31, 2013 and December 31, 2012
|
—
|
|
—
|
|
||||
|
Common stock, $0.025 par value; 100,000,000 shares authorized 50,224,952 shares and 48,898,924 shares issued and outstanding as of December 31, 2013 and December 31, 2012, respectively
|
1,256
|
|
1,222
|
|
||||
|
Additional paid-in capital
|
782,253
|
|
760,232
|
|
||||
|
Accumulated other comprehensive income
|
190
|
|
132
|
|
||||
|
Accumulated deficit
|
(509,776
|
)
|
(492,511
|
)
|
||||
|
Total stockholders’ equity
|
273,923
|
|
269,075
|
|
||||
|
Total liabilities and stockholders’ equity
|
$
|
383,599
|
|
$
|
377,897
|
|
||
See accompanying notes to consolidated financial statements.
51
CALIX, INC.
(In thousands, except per share data)
|
|
Years Ended December 31,
|
|||||||||||
|
2013
|
2012
|
2011
|
||||||||||
|
Revenue
|
$
|
382,618
|
|
$
|
330,218
|
|
$
|
344,669
|
|
|||
|
Cost of revenue:
|
||||||||||||
|
Products and services
(1)
|
203,191
|
|
185,103
|
|
195,698
|
|
||||||
|
Acquisition-related expenses
|
—
|
|
—
|
|
19,966
|
|
||||||
|
Amortization of intangible assets
|
8,353
|
|
7,539
|
|
9,552
|
|
||||||
|
Total cost of revenue
|
211,544
|
|
192,642
|
|
225,216
|
|
||||||
|
Gross profit
|
171,074
|
|
137,576
|
|
119,453
|
|
||||||
|
Operating expenses:
|
||||||||||||
|
Research and development
(1)
|
79,299
|
|
66,748
|
|
67,725
|
|
||||||
|
Sales and marketing
(1)
|
68,075
|
|
62,129
|
|
55,551
|
|
||||||
|
General and administrative
(1)
|
31,945
|
|
26,114
|
|
27,002
|
|
||||||
|
Amortization of intangible assets
|
10,208
|
|
10,208
|
|
8,569
|
|
||||||
|
Acquisition-related expenses
(1)
|
—
|
|
1,401
|
|
12,927
|
|
||||||
|
Total operating expenses
|
189,527
|
|
166,600
|
|
171,774
|
|
||||||
|
Loss from operations
|
(18,453
|
)
|
(29,024
|
)
|
(52,321
|
)
|
||||||
|
Interest and other income (expense), net:
|
||||||||||||
|
Interest income
|
7
|
|
15
|
|
87
|
|
||||||
|
Interest expense
|
(167
|
)
|
(185
|
)
|
(184
|
)
|
||||||
|
Utilization of inventory credit
|
1,651
|
|
—
|
|
—
|
|
||||||
|
Gain on bargain purchase
|
—
|
|
1,029
|
|
—
|
|
||||||
|
Other income (expense), net
|
(317
|
)
|
(3
|
)
|
92
|
|
||||||
|
Total interest and other income (expense), net
|
1,174
|
|
856
|
|
(5
|
)
|
||||||
|
Loss before provision for (benefit from) income taxes
|
(17,279
|
)
|
(28,168
|
)
|
(52,326
|
)
|
||||||
|
Provision for (benefit from) income taxes
|
(14
|
)
|
158
|
|
224
|
|
||||||
|
Net loss
|
(17,265
|
)
|
(28,326
|
)
|
(52,550
|
)
|
||||||
|
Net loss per common share:
|
||||||||||||
|
Basic and diluted
|
$
|
(0.35
|
)
|
$
|
(0.59
|
)
|
$
|
(1.15
|
)
|
|||
|
Weighted-average number of shares used to compute net loss per common share:
|
||||||||||||
|
Basic and diluted
|
49,419
|
|
48,180
|
|
45,546
|
|
||||||
|
Other comprehensive income, net of tax:
|
||||||||||||
|
Unrealized loss on investments, net
|
$
|
—
|
|
$
|
—
|
|
$
|
(21
|
)
|
|||
|
Foreign currency translation adjustments, net
|
58
|
|
34
|
|
88
|
|
||||||
|
Total other comprehensive income, net of tax
|
58
|
|
34
|
|
67
|
|
||||||
|
Comprehensive loss
|
$
|
(17,207
|
)
|
$
|
(28,292
|
)
|
$
|
(52,483
|
)
|
|||
|
|
||||||||||||
|
(1) Includes stock-based compensation as follows:
|
||||||||||||
|
Cost of revenue
|
$
|
1,468
|
|
$
|
1,433
|
|
$
|
1,503
|
|
|||
|
Research and development
|
4,896
|
|
4,227
|
|
4,828
|
|
||||||
|
Sales and marketing
|
5,577
|
|
5,160
|
|
4,500
|
|
||||||
|
General and administrative
|
7,980
|
|
6,617
|
|
9,538
|
|
||||||
|
Acquisition-related expenses
|
—
|
|
—
|
|
1,234
|
|
||||||
|
$
|
19,921
|
|
$
|
17,437
|
|
$
|
21,603
|
|
||||
See accompanying notes to consolidated financial statements.
52
CALIX, INC.
CONSOLIDATED STATEMENTS OF STOCKHOLDERS’ EQUITY
(In thousands)
|
Accumulated
|
|||||||||||||||||||||||
|
Common Stock
|
Additional
|
Other
|
Total
|
||||||||||||||||||||
|
Paid-in
|
Comprehensive
|
Accumulated
|
Stockholders’
|
||||||||||||||||||||
|
Shares
|
Amount
|
Capital
|
Income (loss)
|
Deficit
|
Equity
|
||||||||||||||||||
|
Balance at December 31, 2010
|
38,712
|
|
$
|
968
|
|
$
|
605,939
|
|
$
|
31
|
|
$
|
(411,635
|
)
|
$
|
195,303
|
|
||||||
|
Stock-based compensation
|
—
|
|
—
|
|
21,603
|
|
—
|
|
—
|
|
21,603
|
|
|||||||||||
|
Acquisition of Occam Networks
|
6,359
|
|
159
|
|
118,469
|
|
—
|
|
—
|
|
118,628
|
|
|||||||||||
|
Exercise of stock options and warrants
|
207
|
|
5
|
|
799
|
|
—
|
|
—
|
|
804
|
|
|||||||||||
|
Issuance of vested restricted stock units, net of taxes withheld
|
1,703
|
|
42
|
|
(10,418
|
)
|
—
|
|
—
|
|
(10,376
|
)
|
|||||||||||
|
Restricted stock awards issued
|
423
|
|
11
|
|
(11
|
)
|
—
|
|
—
|
|
—
|
|
|||||||||||
|
Stock issued under employee stock purchase plan
|
421
|
|
10
|
|
3,928
|
|
—
|
|
—
|
|
3,938
|
|
|||||||||||
|
Net loss
|
—
|
|
—
|
|
—
|
|
—
|
|
(52,550
|
)
|
(52,550
|
)
|
|||||||||||
|
Other comprehensive income
|
—
|
|
—
|
|
—
|
|
67
|
|
—
|
|
67
|
|
|||||||||||
|
Balance at December 31, 2011
|
47,825
|
|
1,195
|
|
740,309
|
|
98
|
|
(464,185
|
)
|
277,417
|
|
|||||||||||
|
Stock-based compensation
|
—
|
|
—
|
|
17,437
|
|
—
|
|
—
|
|
17,437
|
|
|||||||||||
|
Exercise of stock options
|
115
|
|
3
|
|
191
|
|
—
|
|
—
|
|
194
|
|
|||||||||||
|
Issuance of vested restricted stock units, net of taxes withheld
|
400
|
|
10
|
|
(1,564
|
)
|
—
|
|
—
|
|
(1,554
|
)
|
|||||||||||
|
Stock issued under employee stock purchase plan
|
619
|
|
16
|
|
4,047
|
|
—
|
|
—
|
|
4,063
|
|
|||||||||||
|
Shares withheld for taxes for vested restricted stock awards
|
(35
|
)
|
(1
|
)
|
(189
|
)
|
—
|
|
—
|
|
(190
|
)
|
|||||||||||
|
Restricted stock awards forfeited
|
(25
|
)
|
(1
|
)
|
1
|
|
—
|
|
|||||||||||||||
|
Net loss
|
—
|
|
—
|
|
—
|
|
—
|
|
(28,326
|
)
|
(28,326
|
)
|
|||||||||||
|
Other comprehensive income
|
—
|
|
—
|
|
—
|
|
34
|
|
—
|
|
34
|
|
|||||||||||
|
Balance at December 31, 2012
|
48,899
|
|
$
|
1,222
|
|
$
|
760,232
|
|
$
|
132
|
|
$
|
(492,511
|
)
|
$
|
269,075
|
|
||||||
|
Stock-based compensation
|
—
|
|
—
|
|
19,921
|
|
—
|
|
—
|
|
19,921
|
|
|||||||||||
|
Exercise of stock options
|
160
|
|
4
|
|
743
|
|
—
|
|
—
|
|
747
|
|
|||||||||||
|
Issuance of vested restricted stock units, net of taxes withheld
|
529
|
|
14
|
|
(3,045
|
)
|
—
|
|
—
|
|
(3,031
|
)
|
|||||||||||
|
Stock issued under employee stock purchase plan
|
686
|
|
17
|
|
4,811
|
|
—
|
|
—
|
|
4,828
|
|
|||||||||||
|
Shares withheld for taxes for vested restricted stock awards
|
(34
|
)
|
(1
|
)
|
(409
|
)
|
—
|
|
—
|
|
(410
|
)
|
|||||||||||
|
Restricted stock awards forfeited
|
(15
|
)
|
—
|
|
—
|
|
—
|
|
—
|
|
—
|
|
|||||||||||
|
Net loss
|
—
|
|
—
|
|
—
|
|
—
|
|
(17,265
|
)
|
(17,265
|
)
|
|||||||||||
|
Other comprehensive income
|
—
|
|
—
|
|
—
|
|
58
|
|
—
|
|
58
|
|
|||||||||||
|
Balance at December 31, 2013
|
50,225
|
|
$
|
1,256
|
|
$
|
782,253
|
|
$
|
190
|
|
$
|
(509,776
|
)
|
$
|
273,923
|
|
||||||
See accompanying notes to consolidated financial statements.
53
CALIX, INC.
(In thousands)
|
|
Years Ended December 31,
|
|||||||||||
|
2013
|
2012
|
2011
|
||||||||||
|
Operating activities:
|
||||||||||||
|
Net loss
|
$
|
(17,265
|
)
|
$
|
(28,326
|
)
|
$
|
(52,550
|
)
|
|||
|
Adjustments to reconcile net loss to net cash provided by operating activities:
|
||||||||||||
|
Amortization of premiums relating to available-for-sale securities
|
—
|
|
—
|
|
244
|
|
||||||
|
Depreciation and amortization
|
10,181
|
|
8,562
|
|
7,954
|
|
||||||
|
Loss on retirement of property and equipment
|
569
|
|
262
|
|
2,449
|
|
||||||
|
Amortization of intangible assets
|
18,561
|
|
17,747
|
|
18,121
|
|
||||||
|
Stock-based compensation
|
19,921
|
|
17,437
|
|
21,603
|
|
||||||
|
Utilization of inventory credit
|
(1,651
|
)
|
—
|
|
—
|
|
||||||
|
Gain on bargain purchase
|
—
|
|
(1,029
|
)
|
—
|
|
||||||
|
Changes in operating assets and liabilities:
|
||||||||||||
|
Restricted cash
|
(295
|
)
|
754
|
|
300
|
|
||||||
|
Accounts receivable, net
|
15,999
|
|
(13,011
|
)
|
13,722
|
|
||||||
|
Inventory
|
(6,138
|
)
|
11,308
|
|
8,557
|
|
||||||
|
Deferred cost of revenue
|
1
|
|
(13,379
|
)
|
73
|
|
||||||
|
Prepaid expenses and other assets
|
535
|
|
47
|
|
(148
|
)
|
||||||
|
Accounts payable
|
6,359
|
|
2,554
|
|
(7,818
|
)
|
||||||
|
Accrued liabilities
|
(4,217
|
)
|
(869
|
)
|
(386
|
)
|
||||||
|
Deferred revenue
|
(1,804
|
)
|
26,403
|
|
2,781
|
|
||||||
|
Other long-term liabilities
|
62
|
|
(782
|
)
|
(313
|
)
|
||||||
|
Net cash provided by operating activities
|
40,818
|
|
27,678
|
|
14,589
|
|
||||||
|
Investing activities:
|
||||||||||||
|
Purchase of property and equipment
|
(6,987
|
)
|
(10,179
|
)
|
(7,355
|
)
|
||||||
|
Sales and maturities of marketable securities
|
—
|
|
—
|
|
31,755
|
|
||||||
|
Acquisitions, net of cash acquired
|
—
|
|
(12,000
|
)
|
(60,809
|
)
|
||||||
|
Net cash used in investing activities
|
(6,987
|
)
|
(22,179
|
)
|
(36,409
|
)
|
||||||
|
Financing activities:
|
||||||||||||
|
Proceeds from exercise of stock options and other
|
747
|
|
194
|
|
804
|
|
||||||
|
Proceeds from employee stock purchase plan
|
4,828
|
|
4,063
|
|
3,938
|
|
||||||
|
Taxes withheld upon vesting of restricted stock units and restricted stock awards
|
(3,441
|
)
|
(1,744
|
)
|
(10,376
|
)
|
||||||
|
Payments for debt issuance costs
|
(316
|
)
|
—
|
|
—
|
|
||||||
|
Net cash provided by (used in) financing activities
|
1,818
|
|
2,513
|
|
(5,634
|
)
|
||||||
|
Effect of exchange rate changes on cash and cash equivalents
|
103
|
|
45
|
|
88
|
|
||||||
|
Net increase (decrease) in cash and cash equivalents
|
35,752
|
|
8,057
|
|
(27,366
|
)
|
||||||
|
Cash and cash equivalents at beginning of period
|
46,995
|
|
38,938
|
|
66,304
|
|
||||||
|
Cash and cash equivalents at end of period
|
$
|
82,747
|
|
$
|
46,995
|
|
$
|
38,938
|
|
|||
|
Supplemental disclosures of cash flow information
|
||||||||||||
|
Interest paid
|
$
|
57
|
|
$
|
68
|
|
$
|
87
|
|
|||
|
Income taxes paid
|
96
|
|
125
|
|
79
|
|
||||||
|
Non-cash financing and investing activities
|
||||||||||||
|
Property and equipment acquired using credits from Ericsson Inc.
|
$
|
125
|
|
$
|
—
|
|
$
|
—
|
|
|||
|
Value of common stock issued in acquisition
|
—
|
|
—
|
|
117,258
|
|
||||||
|
Fair value of equity awards assumed in connection with acquisition
|
—
|
|
—
|
|
1,370
|
|
||||||
See accompanying notes to consolidated financial statements.
54
CALIX, INC.
NOTES TO CONSOLIDATED FINANCIAL STATEMENTS
|
1.
|
Description of Business and Significant Accounting Policies
|
Company
Calix, Inc. (together with its subsidiaries, “Calix,” the “Company,” “our,” “we,” or “us”) was incorporated in August 1999, and is a Delaware corporation. The Company is a leading provider in North America of broadband communications access systems and software for fiber- and copper-based network architectures that enable communications service providers ("CSPs") to transform their networks and connect to their residential and business subscribers. The Company enables CSPs to provide a wide range of revenue-generating services, from basic voice and data to advanced broadband services, over legacy and next-generation access networks. The Company focuses solely on CSP access networks, the portion of the network that governs available bandwidth and determines the range and quality of services that can be offered to subscribers. The Company develops and sells carrier-class hardware and software products, which the Company refers to as the Unified Access portfolio that are designed to enhance and transform CSP access networks to meet the changing demands of subscribers rapidly and cost-effectively.
Basis of Presentation
The Company's fiscal year begins on January 1st and ends on December 31st. Quarterly periods are based on a 4-4-5 fiscal calendar with the first, second and third fiscal quarters ending on the 13th Saturday of each fiscal period.
The accompanying consolidated financial statements, including the accounts of Calix, Inc. and its wholly owned subsidiaries, have been prepared in accordance with the requirements of the U.S. Securities and Exchange Commission (“SEC”). In the opinion of management, the consolidated financial statements include all normal and recurring adjustments that are considered necessary for the fair presentation of the Company’s financial position and operating results. All significant intercompany balances and transactions have been eliminated in consolidation.
Applicable Accounting Guidance
Any reference in these notes to applicable accounting guidance (“guidance”) is meant to refer to the authoritative U.S. generally accepted accounting principles ("GAAP") as found in the Financial Accounting Standards Board (“FASB”) Accounting Standards Codification (“ASC”).
Use of Estimates
The preparation of financial statements is in conformity with U.S. GAAP, which requires management to make estimates and assumptions that affect the amounts reported in the consolidated financial statements and accompanying notes. For the Company, these estimates include, but are not limited to: allowances for doubtful accounts and sales returns, excess and obsolete inventory, allowances for obligations to its contract manufacturers, valuation of stock-based compensation, useful lives assigned to long-lived assets and acquired intangible assets, warranty costs, and contingencies. Actual results could differ from those estimates, and such differences could be material to the Company's financial position and results of operations.
Business Combination
The Company accounted for its business acquisitions under ASC Topic 805,
“Business Combinations”
("ASC Topic 805")
.
Under this guidance all of the assets acquired and liabilities assumed are recognized at their fair value as of the acquisition date. The excess of the purchase price over the estimated fair values of the net tangible and intangible assets acquired is recorded as goodwill. If a business combination results in a bargain purchase for the Company, the economic gain resulting from the fair value received being greater than the purchase price is recorded as a gain that is included in other income (expense), net in the Consolidated Statements of Comprehensive Loss. Prior to recognizing the gain, the Company reassesses whether it has correctly identified all of the assets acquired and liabilities assumed and recognizes any additional assets or liabilities that result from that review. The Company also reviews the measurement procedures used in valuing the assets acquired and liabilities assumed.
While the Company uses its best estimates and assumptions as a part of calculating the fair value at the acquisition date, the Company's estimates are inherently uncertain and subject to refinement. As a result, during the measurement period, which maybe up to one year from the acquisition date, the Company may record adjustments retrospectively to the fair value of assets acquired and liabilities assumed, with the corresponding offset to goodwill, or records a corresponding other income or expense in the case of a bargain purchase. Upon the conclusion of the measurement period or final determination of the fair value of assets acquired or liabilities assumed, whichever comes first, any subsequent adjustments are recorded to the Company's Consolidated Statements of Comprehensive Loss.
Transaction costs associated with the business combinations are expensed as incurred, and are included in acquisition-related expenses within operating expenses in the Consolidated Statements of Comprehensive Loss.
Revenue Recognition
The Company derives revenue primarily from the sale of hardware products and related software. Revenue is recognized when all of the following criteria have been met:
55
|
•
|
Persuasive evidence of an arrangement exists. The Company generally relies upon sales agreements and customer purchase orders as evidence of an arrangement.
|
|
•
|
Delivery has occurred. The Company uses the shipping terms of the arrangement or evidence of customer acceptance to verify delivery or performance.
|
|
•
|
Sales price is fixed or determinable. The Company assesses whether the sales price is fixed or determinable based on the payment terms and whether the sales price is subject to refund or adjustment. Payment terms to customers can range from net
30
to net
120
days.
|
|
•
|
Collectability is reasonably assured. The Company assesses collectability based primarily on creditworthiness of customers and their payment histories.
|
Revenue from installation and training services are recognized as the services are completed. Post-sales software support revenue and extended warranty services revenue are deferred and recognized ratably over the period during which the services are to be performed. To date, service revenue has comprised an insignificant portion of the Company's revenue and the Company has not reported service revenue separately from product revenue in its financial statements. In instances where substantive acceptance provisions are specified in the customer agreement, revenue is deferred until all acceptance criteria have been met. From time to time, the Company offers customers sales incentives, which include volume rebates and discounts. These amounts are estimated on a quarterly basis and recorded as a reduction of revenue.
The Company enters into arrangements with certain of its customers who receive government supported loans and grants from the U.S. Department of Agriculture's Rural Utility Service (“RUS”) to finance capital spending. Under the terms of an RUS equipment contract that includes installation services, the customer does not take possession and control and title does not pass until formal acceptance is obtained from the customer. Under this type of arrangement, the Company does not recognize revenue until it has received formal acceptance from the customer. For RUS arrangements that do not involve installation services, the Company recognizes revenue in accordance with the revenue recognition policy described above.
The Company's products contain both software and non-software components that function together to deliver the products' essential functionality. When the Company enters into sales arrangements that consist of multiple deliverables of its product and service offerings, the Company allocates the total consideration of the arrangement to each separable deliverable based on its relative selling price. The Company limits the amount allocable to delivered elements to the amount that is not contingent upon the delivery of additional items or meeting specified performance conditions, and recognizes revenue on each deliverable in accordance with its revenue recognition policy. The determination of selling price for each deliverable is based on a selling price hierarchy, which is vendor-specific objective evidence (“VSOE”) if available, third-party evidence (“TPE”) if VSOE is not available, or estimated selling price (“ESP”) if neither VSOE nor TPE is available. VSOE of selling price is based on the price charged when the element is sold separately. In determining VSOE, the Company requires that a substantial majority of the selling prices of an element fall within a narrow range when each element is sold separately. The Company has established VSOE for its training and post-sales software support services based on the normal pricing practices of these services when sold separately. TPE of selling price is established by evaluating whether there are similar competitor products or services that are sold in stand-alone sales transaction to similarly situated customers. Generally, the Company's marketing strategy differs from that of its peers and its offerings contain a significant level of customization and differentiation such that the comparable pricing of products with similar functionality cannot be obtained. Additionally, as the Company is unable to reliably determine what similar competitor products' selling prices are on a stand-alone basis, it is not typically able to determine TPE. ESP is established considering multiple factors including, but not limited to geographies market conditions, competitive landscape, internal costs, gross margin objectives, characteristics of targeted customers and pricing practices. The determination of ESP is made through consultation with and formal approval by management, taking into consideration the go-to-market strategy.
Cost of Revenue
Cost of revenue consists primarily of finished goods inventory purchased from the Company’s contract manufacturers, payroll and related expenses associated with managing the relationships with contract manufacturers, depreciation of manufacturing test equipment, warranty costs, excess and obsolete inventory costs, shipping charges, and amortization of certain intangible assets. For the year ended December 31, 2011, cost of revenue also includes acquisition-related expenses associated with the acquisition of Occam primarily related to a charge resulting from the required revaluation of Occam inventory to its estimated fair value and an associated write-down of acquired inventory determined as excess and obsolete.
Stock-Based Compensation
In accordance with ASC Topic 718,
"Compensation - Stock Compensation"
("ASC Topic 718"),
stock-based awards are recorded at fair value as of the grant date and recognized to expense over the employee’s requisite service period (generally the vesting period), which the Company has elected to amortize on a straight-line basis. Stock-based compensation expense is reduced by the Company’s estimated forfeitures on all unvested awards.
The fair value of stock option and employee stock purchase right is estimated at the grant date using the Black-Scholes option valuation model. The fair value of restricted stock unit and restricted stock award is based on the closing market price of the Company's common stock on the date of grant. The fair value of performance restricted stock unit ("PRSU") with a market condition is estimated on the date of grant, using a Monte Carlo simulation model to estimate the total return ranking of the Company's stock in relation to the peer group over each performance period. Compensation cost on PRSUs with a market condition is not adjusted for subsequent changes in the Company's stock performance or the level of ultimate vesting.
56
Warranty
The Company offers limited warranties for its hardware products for a period of
one
or
five
years, depending on the product type. Warranty service revenues are deferred and recognized ratably over the period during which the services are to be performed. The Company recognizes estimated costs related to warranty activities as a component of cost of revenue upon product shipment. The estimates are based on historical product failure rates and historical costs incurred in correcting product failures. The recorded amount is adjusted from time to time for specifically identified warranty exposure. Actual warranty expenses are charged against the Company’s estimated warranty liability when incurred. Factors that affect the Company’s warranty liability include the number of installed units and historical and anticipated rates of warranty claims and cost per claim.
Research and Development
Research and development costs include costs of developing new products and processes, as well as design and engineering costs. Such costs are charged to research and development expense as incurred.
Development costs related to software incorporated in the Company’s products incurred subsequent to the establishment of technological feasibility are capitalized and amortized over the estimated useful lives of the related products. Technological feasibility is established upon completion of a working model.
Credit Risk and Inventory Supplier Concentrations
Financial instruments that potentially subject the Company to significant concentrations of credit risk consist primarily of cash and cash equivalents and accounts receivable. Cash equivalents consist of money market funds, which are invested through financial institutions in the United States. Deposits in these financial institutions may, at times, exceed federally insured limits. The Company has not experienced any losses in such accounts. The Company also has approximately
$2.8 million
of cash held by its foreign subsidiaries in China and the United Kingdom. Management believes that the financial institutions that hold the Company’s cash and cash equivalents are financially sound and, accordingly, minimal credit risk exists with respect to these cash and cash equivalents.
Concentrations of credit risk in relation to customers with an accounts receivable balance of 10% or greater of total accounts receivable and customers with net revenues of 10% or greater of total revenues are presented below for the periods indicated.
|
Percentage of Accounts Receivable
|
Percentage of Revenue
|
|||||||||
|
At December 31,
|
Years Ended December 31,
|
|||||||||
|
|
2013
|
|
2012
|
|
2013
|
|
2012
|
|
2011
|
|
|
CenturyLink
|
|
15%
|
13%
|
26%
|
|
21%
|
|
20%
|
||
|
Ericsson
(1)
|
|
12%
|
|
*
|
|
*
|
|
*
|
|
*
|
|
(1) Includes certain of Ericsson's consolidated subsidiaries.
|
||||||||||
|
* Less than 10% of total accounts receivable or revenue.
|
||||||||||
The Company maintains an allowance for doubtful accounts for estimated losses resulting from the inability of its customers to make required payments. The Company records a specific allowance based on an analysis of individual past-due balances. Additionally, based on its historical write-offs and collections experience, the Company records an additional allowance based on a percentage of outstanding receivables. The Company performs credit evaluations of its customers’ financial condition. These evaluations require significant judgment and are based on a variety of factors including, but not limited to, current economic trends, payment history and financial review of the customer. Actual collection losses may differ from management’s estimates, and such differences could be material to the Company’s financial position and results of operations.
The Company depends primarily on a small number of outside contract manufacturers for the bulk of its finished goods inventory. In particular, the Company relies on Flextronics for the manufacture of most of its products. The Company generally purchases its products through purchase orders with its suppliers or contract manufacturers. While the Company seeks to maintain a sufficient reserve of its products, the Company’s business and results of operations could be adversely affected by a stoppage or delay in receiving such products, the receipt of defective parts, an increase in price of such products or the Company’s inability to obtain lower prices from its contract manufacturers and suppliers in response to competitive pressures.
Fair Value of Financial Instruments
The carrying amounts of cash and cash equivalents, trade receivables, marketable securities, accounts payable, and other accrued liabilities approximate their fair value due to their relatively short-term nature. The carrying amount of the other long-term liabilities approximates its fair value.
Cash, Cash Equivalents, and Marketable Securities
The Company has invested its excess cash primarily in money market funds in 2013 and 2012. Before 2012, the Company also invested some cash in highly liquid debt instruments. The Company considers all investments with maturities of three months or less when purchased to be cash equivalents. Marketable securities represent highly liquid debt instruments with maturities greater than 90 days at date of purchase. Cash, cash equivalents and marketable securities are stated at amounts that approximate fair value based on quoted market prices.
57
The Company’s investments have been classified and accounted for as available-for-sale. Such investments are recorded at fair value and unrealized holding gains and losses are reported as a separate component of comprehensive loss in the stockholders’ equity until realized. Should the Company determine that any unrealized losses on the investments are other-than-temporary, the amount of that impairment to be recognized in earnings will depend on whether the Company intends to sell the security or more likely than not will be required to sell the security before recovery of its amortized cost basis less any current period credit loss. During 2011, all of the Company's marketable securities had been sold or matured. Realized gains and losses, which have been immaterial, are determined on the specific identification method and are reflected in results of operations.
Restricted Cash
As of December 31, 2013, the Company had
$0.3 million
cash restricted for collateralizing the outstanding letters of credit with Silicon Valley Bank. As of December 31, 2012, there were
no
restricted cash balances.
Inventory
Inventory, which primarily consisted of finished goods purchased from contract manufacturers, is stated at the lower of cost, determined by the first-in, first-out method, or market value. Inbound shipping costs are included in cost of inventory. In addition, the Company, from time to time, procures component inventory primarily as a result of manufacturing discontinuation of critical components by suppliers. The Company regularly monitors inventory quantities on hand and records write-downs for excess and obsolete inventories based on the Company’s estimate of demand for its products, potential obsolescence of technology, product life cycles, and whether pricing trends or forecasts indicate that the carrying value of inventory exceeds its estimated selling price. These factors are impacted by market and economic conditions, technology changes, and new product introductions and require estimates that may include elements that are uncertain. Actual demand may differ from forecasted demand and may have a material effect on gross margins. If inventory is written down, a new cost basis is established that cannot be increased in future periods. Shipments from our suppliers or contract manufacturers before the Company receives them are recorded as in-transit inventory when title and the significant risks and rewards of ownership have passed to the Company.
Deferred Cost of Revenue
When the Company’s products have been shipped, but the product revenue associated with the arrangement has been deferred as a result of not meeting the criteria for immediate revenue recognition, the Company also defers the related inventory costs for the delivered items until all criteria are met for revenue recognition. Deferred cost of revenue also includes installation service costs related to customer installation projects in which the revenue has been deferred until completion of the project and, to a lesser extent, trial orders that are pending acceptance.
Property and Equipment
Property and equipment are stated at cost, less accumulated depreciation, and are depreciated using the straight-line method over the estimated useful life of each asset. Computer equipment is depreciated over
two
years; purchased software is depreciated over
three
years; test equipment is depreciated over
three
years; furniture and fixtures are depreciated over
seven
years; and leasehold improvements are depreciated over
the shorter of the respective lease term or the estimated useful life of the asset
. Maintenance and repairs are charged to expense as incurred.
Goodwill
The Company records goodwill when consideration paid in a business acquisition exceeds the fair value of the net tangible assets and the identified intangible assets acquired. Goodwill is not amortized but instead is subject to an annual impairment test or more frequently if events or changes in circumstances indicate that it may be impaired. The Company evaluates goodwill on an annual basis as of the end of the second quarter of each fiscal year. Management has determined that it operates as a single reporting unit and, therefore, evaluates goodwill impairment at the enterprise level.
In an annual impairment test, the Company first assesses qualitative factors to determine whether it is necessary to perform the two-step quantitative goodwill impairment test. In assessing the qualitative factors, management considers the impact of these key factors: macro-economic conditions, industry and market environment, overall financial performance of the Company, cash flow from operating activities, market capitalization and stock price. If the Company determines as a result of the qualitative assessment that it is more likely than not that the fair value of a reporting unit is less than its carrying amount, then the quantitative test is required. Otherwise, no further testing is required.
In a quantitative test, the Company compares its fair value to its carrying value including goodwill. The Company determines its fair value using both an income approach and a market approach. Under the income approach, the Company determines fair value based on estimated future cash flows, discounted by an estimated weighted-average cost of capital, which reflects the overall level of inherent risk of the Company and the rate of return an outside investor would expect to earn. Under the market-based approach, the Company utilizes information regarding the Company as well as publicly available industry information to determine earnings multiples that are used to value the Company. If the carrying value of the Company exceeds its fair value, the Company will determine the amount of impairment loss by comparing the implied fair value of goodwill with the carrying value of goodwill. An impairment charge is recognized for the excess of the carrying value of goodwill over its implied fair value.
At the end of the second quarter of 2013, the Company has completed its annual goodwill impairment test. Based on its assessment of the aforementioned qualitative factors, management concluded that the fair value of the Company was more likely than not greater than its carrying amount as of June 29, 2013. As such, it was not necessary to perform the two-step quantitative goodwill impairment test at the time. Subsequent to the 2013 annual impairment test, there have been no significant events or circumstances affecting the valuation of goodwill. As
58
of December 31, 2013, there was
no
impairment to the carrying value of the Company's goodwill. There were
no
impairment losses for goodwill during 2012 and 2011.
Intangible Assets and Other Long-Lived Assets
Intangible assets with finite useful lives are amortized over their estimated useful life, generally
five years
. The Company periodically evaluates long-lived assets, including intangible assets, for impairment whenever events or changes in circumstances indicate that a potential impairment may have occurred. If such events or changes in circumstances arise, the Company compares the carrying amount of the long-lived assets to the estimated future undiscounted cash flows expected to be generated by the long-lived assets. If the estimated aggregate undiscounted cash flows are less than the carrying amount of the long-lived assets, an impairment charge, calculated as the amount by which the carrying amount of the assets exceeds the fair value of the assets, is recorded. The fair value of long-lived assets is determined based on the estimated discounted cash flows expected to be generated from the assets. The Company has reviewed events and changes to its business during the year and has determined that there was
no
impairment to its intangible assets and other long-lived assets during 2013. The Company did not incur any impairment losses for intangible assets and other long-lived assets during 2012 and 2011.
Income Taxes
The Company evaluates its tax positions and estimates its current tax exposure along with assessing temporary differences that result from different book to tax treatment of items not currently deductible for tax purposes. These differences result in deferred tax assets and liabilities on the Company’s balance sheets, which are estimated based upon the difference between the financial statement and tax bases of assets and liabilities using the enacted tax rates that will be in effect when these differences reverse. In general, deferred tax assets represent future tax benefits to be received when certain expenses previously recognized in the Company’s statements of operations become deductible expenses under applicable income tax laws or loss or credit carryforwards are utilized. Accordingly, realization of the Company’s deferred tax assets is dependent on future taxable income against which these deductions, losses and credits can be utilized.
The Company must assess the likelihood that the Company’s deferred tax assets will be recovered from future taxable income, and to the extent the Company believes that recovery is not more likely than not, the Company must establish a valuation allowance. Management judgment is required in determining the Company’s provision for income taxes, the Company’s deferred tax assets and liabilities and any valuation allowance recorded against the Company’s net deferred tax assets. Excluding our foreign operations, the Company recorded a full valuation allowance at each balance sheet date presented because, based on the available evidence, the Company believes it is more likely than not that it will not be able to utilize all of its deferred tax assets in the future. The Company intends to maintain the full valuation allowances until sufficient evidence exists to support the reversal of the valuation allowances.
Foreign Currency Translation
Assets and liabilities of the Company’s wholly owned foreign subsidiaries are translated from their respective functional currencies at exchange rates in effect at the balance sheet date, and revenues and expenses are translated at the monthly average exchanges rates. Any material resulting translation adjustments are reflected as a separate component of stockholders’ equity. Realized foreign currency transaction gains and losses were not significant during the years ended December 31, 2013, 2012 and 2011.
Recent Accounting Pronouncements
In July 2013, the Financial Accounting Standards Board ("FASB") issued Accounting Standards Update No. 2013-11, Income Taxes (Topic 740): Presentation of an Unrecognized Tax Benefit When a Net Operating Loss Carryforward, a Similar Tax Loss, or a Tax Credit Carryforward Exists (a consensus of the FASB Emerging Issues Task Force) ("ASU 2013-11"), which provides explicit guidance on the financial statement presentation of an unrecognized tax benefit when a net operating loss carryforward, a similar tax loss or a tax credit carryforward exists. Under the new standard update, in most circumstances, an unrecognized tax benefit should be presented in the Company's financial statements as a reduction to a deferred tax asset for a net operating loss carryforward, a similar tax loss or a tax credit carryforward. The amendments should be applied prospectively to all unrecognized tax benefits that exist at the effective date. Retrospective application is permitted. ASU 2013-11 will be effective for the Company beginning in the first quarter of fiscal 2014. The Company does not expect adoption of this guidance to have a material impact on its financial statements.
In February 2013, the FASB issued Accounting Standards Update No. 2013-02, Comprehensive Income (Topic 220): Reporting of Amounts Reclassified Out of Accumulated Other Comprehensive Income ("ASU 2013-02"), to improve the reporting of reclassifications out of accumulated other comprehensive income. ASU 2013-02 requires an entity to report the effect of significant reclassifications out of accumulated other comprehensive income on the respective line items in net income if the amount being reclassified is required under U.S. GAAP to be reclassified in its entirety to net income. For other amounts that are not required under U.S. GAAP to be reclassified in their entirety from accumulated other comprehensive income to net income in the same reporting period, an entity is required to cross-reference other disclosures required under U.S. GAAP that provide additional detail about those amounts. ASU 2013-02 was effective for the Company in its first quarter of fiscal 2013 and was applied prospectively. Other than requiring additional disclosures, adoption of this guidance did not have an impact on the financial statements of the Company.
2. Business Combinations
Acquisition of Ericsson Fiber Access Assets
On November 2, 2012, Calix acquired the fiber access assets of Ericsson Inc. ("Ericsson"), including the Ericsson EDA 1500 GPON solution and its complementary ONT portfolio, under an Asset Purchase Agreement ("EFAA Acquisition"). In connection with this acquisition, Calix and Ericsson also signed a non-exclusive global reseller agreement, under which Calix became Ericsson's preferred global
59
partner for broadband access applications. Calix expected this partnership to provide Calix with an extensive new global reseller channel, and Calix believed that its acquisition of Ericsson's fiber access portfolio delivered powerful new complements to Calix's industry-leading Unified Access portfolio. Calix expected that this partnership would also provide Ericsson's existing fiber access customers with world-class support and maintenance, and an expanded portfolio of access systems and software from a leading company totally focused on access.
The EFAA Acquisition was accounted for as a business combination under ASC Topic 805
.
The Company finalized the fair values of the acquired assets and assumed liabilities from Ericsson, as summarized in the following table (in thousands), and closed the measurement period in 2013.
|
At November 2, 2012
|
|||
|
Inventory
|
$
|
9,361
|
|
|
Other current asset
|
739
|
|
|
|
Property and equipment
|
3,616
|
|
|
|
Other current liabilities
|
(124
|
)
|
|
|
Deferred tax liability
|
(563
|
)
|
|
|
Net assets acquired
|
13,029
|
|
|
|
Gain on bargain purchase
|
(1,029
|
)
|
|
|
Total purchase price
|
$
|
12,000
|
|
Total consideration for the purchase price was
$12.0 million
in cash. Because the fair value of identifiable assets acquired, net of liabilities assumed, exceeded the consideration transferred, the Company recognized a bargain purchase gain of
$1.0 million
, net of income taxes. The Company reassessed the recognition and measurement of identifiable assets acquired and liabilities assumed and concluded that all acquired assets and assumed liabilities were recognized and that the valuation procedures and resulting measures were appropriate. The gain is included as a separate line item on the Company's Consolidated Statements of Comprehensive Loss for the year ended December 31, 2012.
Pursuant to the Asset Purchase Agreement, the Company received a credit of approximately
$3.3 million
("Ericsson Credit") that would expire on August 31, 2013 without cash value. The Ericsson Credit was recorded at fair value as of the date of the acquisition and it could be used for consulting services, additional inventory, and test equipment agreed to by both parties. During 2013, due to the Company's marketing and selling effort as well as changes in the market, the Company succeeded in obtaining inventories and equipment from Ericsson using the Ericsson Credit in a total amount in excess of the fair value of the Ericsson Credit that was recorded by the Company upon the completion of the acquisition. The Company recorded such inventories received at their fair market value and recognized a gain of
$1.7 million
for the amount in excess of the fair value of the Ericsson Credit within 'Utilization of inventory credit' in our consolidated statement of comprehensive loss. Subsequent to the acquisition, Ericsson extended the expiration date of the Ericsson Credit to December 31, 2014.
The Company recognized
$1.4 million
of acquisition-related costs in 2012 in connection with the EFAA Acquisition. These costs are included in the Consolidated Statements of Comprehensive Loss in the line item entitled “Acquisition-related expenses” within Operating expenses.
The assets, liabilities, and operating results associated with the EFAA Acquisition have been included in the Company's consolidated financial statements from the date of acquisition. For 2013, it is impracticable to determine the results of operations or the revenue which resulted from the EFAA acquisition as the acquired business had been integrated into our operations in 2013. For 2012, approximately
$0.6 million
of our total revenue resulted from the EFAA acquisition. Pro forma results of operations have not been presented because it is impracticable to obtain the historical operating results of EFAA before the acquisition on a standalone basis and that the effect of the acquisition was not material to our consolidated results of operations.
Acquisition of Occam Networks
On February 22, 2011, the Company completed its acquisition of Occam Networks, Inc. ("Occam") in a stock and cash transaction valued at approximately
$213.1 million
which consisted of
$94.5 million
of cash consideration and a value of
$118.6 million
of common stock and equity awards issued. In connection with the consummation of the acquisition, each outstanding share of common stock of Occam was converted, effective as of February 22, 2011, into the right to receive: (i)
0.2925
shares of Calix common stock and (ii)
$3.8337
in cash. In addition, (a) each outstanding Occam stock option or restricted stock unit as of immediately prior to the effective time of the acquisition which was or became vested as of the effective time of the acquisition with a per share exercise price that was less than (i)
$3.8337
plus (ii)
0.2925
multiplied by the average volume weighted average trading price of Calix common stock during the five consecutive trading days ending on the trading day that was one day before the effective time of the acquisition, such amount being referred to as the cash-out consideration and (b) Occam options or restricted stock units held by persons who were not Occam employees or consultants immediately prior to the effective time of the acquisition were automatically canceled and extinguished and the vested portion thereof was automatically converted into the right to receive the cash-out consideration for the aggregate number of shares of Occam common stock that were issuable upon the exercise of such stock options or restricted stock units, less any applicable per share exercise price.
Unvested portions of each outstanding Occam stock option or restricted stock unit held by Occam employees who continued to be employed by Calix or its subsidiaries after the effective time of the merger transaction that were not cashed out and canceled as described above were, at the effective time, automatically converted into options or restricted stock units, as the case may be, for Calix common stock, subject to adjustments in accordance with the compensatory award exchange ratio, and subject to the terms and conditions of such award prior to the effective time, including vesting and exercisability. The fair value of Calix stock options and restricted stock units issued to
60
employees of Occam was
$5.8 million
including those accelerated for Occam executives associated with their severance agreements, which were executed subsequent to the acquisition date. The fair value of options was estimated using a Black-Scholes option pricing model.
The following table represents the weighted average assumptions used to estimate fair value of stock options:
|
At February 22, 2011
|
|
|
Expected volatility
|
52%
|
|
Expected life (years)
|
3.95
|
|
Expected dividend yield
|
—
|
|
Risk-free interest rate
|
1.65%
|
The acquisition of Occam was accounted for under the acquisition method of accounting, which requires the acquired assets and assumed liabilities to be recorded based on their estimated fair values. The fair values assigned to the acquired assets and assumed liabilities are based on valuations using management's best estimates and assumptions utilizing the best information available at the time these consolidated financial statements were issued. During the measurement period (which is not to exceed one year from the acquisition date), the Company is required to retrospectively adjust the provisional assets or liabilities if new information is obtained about facts and circumstances that existed as of the acquisition date that, if known, would have resulted in the recognition of those assets or liabilities as of that date.
The Company finalized the fair values of the acquired assets and assumed liabilities and closed the measurement period in 2011. The following table summarizes the fair value of the acquired assets and assumed liabilities related to the acquisition of Occam (in thousands):
|
At February 22, 2011
|
|||
|
Cash and cash equivalents
|
$
|
33,631
|
|
|
Restricted cash
|
1,054
|
|
|
|
Accounts receivable
|
16,854
|
|
|
|
Inventory
|
29,229
|
|
|
|
Prepaid expenses and other assets
|
854
|
|
|
|
Property and equipment
|
7,363
|
|
|
|
Intangible assets:
|
|||
|
Trade name (useful life of 6 months)
|
2,290
|
|
|
|
Customer relationships (useful life of 5 years)
|
51,040
|
|
|
|
Core developed technology (useful life of 5 years)
|
25,494
|
|
|
|
In-process technology
|
16,270
|
|
|
|
Purchase order backlog (useful life of 10 months)
|
2,560
|
|
|
|
Total intangible assets
|
97,654
|
|
|
|
Goodwill
|
50,599
|
|
|
|
Current liabilities
|
(22,414
|
)
|
|
|
Deferred revenue
|
(866
|
)
|
|
|
Long-term liabilities
|
(890
|
)
|
|
|
Total
|
$
|
213,068
|
|
Trade names represented acquired product names, which were expected to have a useful life of six months. Customer relationships represented agreements with existing Occam customers and have estimated useful lives of five years.
Core developed technology represented technology that had reached technological feasibility and includes Occam's primary product line. The fair value of the core developed technology was determined using future discounted cash flows related to the projected income stream of the developed technology for a discrete projection period. Core developed technology is being amortized over its estimated useful life of five years.
In-process technology represented projects that had not reached technological feasibility at the time of the acquisition and they did not have a finite useful life. See Note 3,
"Goodwill and Intangible Assets"
of these Notes to Consolidated Financial Statements for an update of the in-process technology acquired from Occam.
Acquired backlog represented goods and services that the Occam customers were contractually obligated to receive in the future and was expected to have a ten month life.
During the year ended December 31, 2011, the Company incurred
$20.0 million
of acquisition-related expenses that was recorded in cost of revenue, resulting from the required revaluation of inventory to its estimated fair value and an associated write-down of inventory determined as excess and obsolete. The Company also recorded
$12.9 million
of acquisition-related expenses within operating expenses in the twelve months ended December 31, 2011, related to severance for terminated employees and salaries for transitional employees, expenses associated with consolidating facilities, transaction costs for financial advisory, legal and accounting services, and stock-based compensation expense primarily related to accelerated vesting for certain Occam executives who terminated subsequent to the acquisition date.
61
The premium paid by the Company in this transaction was attributable to the strategic benefits of creating a more competitive and efficient company, more capable of competing against larger telecommunications equipment companies in more markets and the significant cost synergies that would be obtained by the combined organization. The combined organization was expected to provide communications service providers globally with an enhanced portfolio of advanced broadband access systems, and accelerate innovation across the expanded Calix Unified Access portfolio. The acquisition was expected to result in more access options over both fiber and copper for communications service providers to deploy, which could expedite the proliferation of advanced broadband services to both residential and business subscribers, including such services as high-speed Internet, Internet protocol television, voice over internet protocol ("VOIP"), Ethernet business services, and other advanced broadband applications.
The results of operations of Occam have been included in the Company's consolidated financial statements since the acquisition date. Pro forma results of operations are not presented because they are not significantly different from our actual consolidated results of operations for 2011 as this acquisition occurred in February 2011.
3. Goodwill and Intangible Assets
Goodwill
Goodwill was recorded as a result of the Company's acquisitions of Occam in February 2011 and Optical Solutions, Inc. ("OSI") in February 2006. This goodwill is not deductible for tax purposes, and there have been
no
adjustments or impairment to goodwill since the acquisition dates.
Intangible Assets
Intangible assets are carried at cost, less accumulated amortization. The details of intangible assets as of December 31, 2013 and December 31, 2012 are disclosed in the following table (in thousands):
|
|
December 31, 2013
|
December 31, 2012
|
||||||||||||||||||||||
|
|
Gross
Carrying Amount |
Accumulated
Amortization |
Net
|
Gross
Carrying
Amount
|
Accumulated
Amortization
|
Net
|
||||||||||||||||||
|
Core developed technology
|
$
|
68,964
|
|
$
|
(47,339
|
)
|
$
|
21,625
|
|
$
|
68,964
|
|
$
|
(38,986
|
)
|
$
|
29,978
|
|
||||||
|
Customer relationships
|
54,740
|
|
(32,625
|
)
|
22,115
|
|
54,740
|
|
(22,417
|
)
|
32,323
|
|
||||||||||||
|
Total intangible assets, excluding goodwill
|
$
|
123,704
|
|
$
|
(79,964
|
)
|
$
|
43,740
|
|
$
|
123,704
|
|
$
|
(61,403
|
)
|
$
|
62,301
|
|
||||||
At the end of the first quarter of 2012, upon the completion of the research and development efforts associated with the
$16.3 million
in-process technology that was acquired from Occam, the Company determined that this technology had a useful life of
5 years
and therefore reclassified it as core developed technology. The Company began amortizing this intangible asset to cost of revenue during the second quarter of 2012.
Amortization expense for intangible assets was
$18.6 million
,
$17.7 million
, and
$18.1 million
for the years ended December 31, 2013, 2012, and 2011, respectively. Expected future amortization expense for the fiscal years indicated is as follows (in thousands):
|
Period
|
Expected Amortization Expense
|
||
|
2014
|
$
|
18,561
|
|
|
2015
|
18,561
|
|
|
|
2016
|
5,805
|
|
|
|
2017
|
813
|
|
|
|
Total
|
$
|
43,740
|
|
4. Balance Sheet Details
Cash and cash equivalents consisted of the following (in thousands):
|
December 31,
2013 |
December 31,
2012 |
|||||||
|
Cash
|
$
|
62,905
|
|
$
|
27,157
|
|
||
|
Money market funds
|
19,842
|
|
19,838
|
|
||||
|
Total cash and cash equivalents
|
$
|
82,747
|
|
$
|
46,995
|
|
||
62
Accounts receivable, net consisted of the following (in thousands):
|
December 31,
2013 |
December 31,
2012 |
|||||||
|
Accounts receivable
|
$
|
44,642
|
|
$
|
61,680
|
|
||
|
Allowance for doubtful accounts
|
(358
|
)
|
(421
|
)
|
||||
|
Product return reserve
|
(764
|
)
|
(1,740
|
)
|
||||
|
Accounts receivable, net
|
$
|
43,520
|
|
$
|
59,519
|
|
||
Inventory consisted of the following (in thousands):
|
December 31,
2013 |
December 31,
2012 |
|||||||
|
Raw materials
|
$
|
6,591
|
|
$
|
9,377
|
|
||
|
Finished goods
|
44,480
|
|
33,905
|
|
||||
|
Total inventory
|
$
|
51,071
|
|
$
|
43,282
|
|
||
Property and equipment, net consisted of the following (in thousands):
|
December 31,
2013 |
December 31,
2012 |
|||||||
|
Test equipment
|
$
|
36,932
|
|
$
|
37,595
|
|
||
|
Computer equipment and purchased software
|
27,280
|
|
31,582
|
|
||||
|
Furniture and fixtures
|
1,614
|
|
1,470
|
|
||||
|
Leasehold improvements
|
7,077
|
|
6,763
|
|
||||
|
Total
|
72,903
|
|
77,410
|
|
||||
|
Accumulated depreciation and amortization
|
(55,430
|
)
|
(56,327
|
)
|
||||
|
Property and equipment, net
|
$
|
17,473
|
|
$
|
21,083
|
|
||
Depreciation and amortization expense was
$10.2 million
,
$8.6 million
,
$8.0 million
for the years ended December 31, 2013, 2012, and 2011, respectively.
Accrued liabilities consisted of the following (in thousands):
|
December 31,
2013 |
December 31,
2012 |
|||||||
|
Accrued compensation and related benefits
|
$
|
13,127
|
|
$
|
12,906
|
|
||
|
Accrued warranty
|
10,856
|
|
11,762
|
|
||||
|
Accrued professional and consulting fees
|
1,634
|
|
1,740
|
|
||||
|
Accrued excess and obsolete inventory at contract manufacturers
|
756
|
|
1,357
|
|
||||
|
Accrued customer rebates
|
712
|
|
1,565
|
|
||||
|
Accrued business travel expenses
|
540
|
|
593
|
|
||||
|
Sales and use tax payable
|
521
|
|
929
|
|
||||
|
Income taxes payable
|
368
|
|
627
|
|
||||
|
Accrued other
|
3,561
|
|
4,697
|
|
||||
|
Total accrued liabilities
|
$
|
32,075
|
|
$
|
36,176
|
|
||
Deferred cost of revenue consisted entirely of products and services. Deferred revenue consisted of the following (in thousands):
|
December 31,
2013
|
December 31,
2012
|
|||||||
|
Deferred Revenue:
|
||||||||
|
Product and services - current
|
$
|
32,051
|
|
$
|
36,715
|
|
||
|
Extended warranty - current
|
2,811
|
|
2,600
|
|
||||
|
Extended warranty - non-current
|
18,335
|
|
15,711
|
|
||||
|
Product and services - non-current
|
96
|
|
71
|
|
||||
|
Total deferred revenue
|
$
|
53,293
|
|
$
|
55,097
|
|
||
63
The following table provides the balances and changes in the components of accumulated other comprehensive income (loss) for the years indicated (in thousands):
|
Foreign Currency Translation Adjustments
|
Unrealized Gain (Loss) on Investments
|
Accumulated Other Comprehensive Income
|
||||||||||
|
Balance at 12/31/2010
|
$
|
10
|
|
$
|
21
|
|
$
|
31
|
|
|||
|
Current period other comprehensive income (loss)
|
88
|
|
(21
|
)
|
67
|
|
||||||
|
Balance at 12/31/2011
|
98
|
|
—
|
|
98
|
|
||||||
|
Current period other comprehensive income
|
34
|
|
—
|
|
34
|
|
||||||
|
Balance at 12/31/2012
|
132
|
|
—
|
|
132
|
|
||||||
|
Current period other comprehensive income
|
58
|
|
—
|
|
58
|
|
||||||
|
Balance at 12/31/2013
|
$
|
190
|
|
$
|
—
|
|
$
|
190
|
|
|||
5. Commitments and Contingencies
Lease Commitments
The Company leases office space under non-cancelable operating leases. Certain of the Company’s operating leases contain renewal options and rent acceleration clauses. Future minimum payments under the non-cancelable operating leases consisted of the following as of
December 31, 2013
(in thousands):
|
Period
|
Minimum Future Lease Payments
|
|||
|
2014
|
$
|
3,438
|
|
|
|
2015
|
2,743
|
|
||
|
2016
|
2,252
|
|
||
|
2017
|
2,177
|
|
||
|
2018
|
1,894
|
|
||
|
Thereafter
|
252
|
|
||
|
Total
|
$
|
12,756
|
|
|
The above total minimum payments have not been reduced by minimum sublease rentals of
$0.2 million
due in the future under non-cancelable sublease of a portion of the Company's office in Fremont, California.
The Company leases its primary office space in Petaluma, California under a lease agreement ("Petaluma Lease") that extends through February 2014. On January 28, 2013, the Company entered into an amendment to its Petaluma Lease ("Amendment") to extend the lease term to February 2019. In connection with the Petaluma Lease and the Amendment, the Company received lease incentives of
$1.2 million
and
$0.4 million
, respectively, which can be used for leasehold improvements or be applied as credits to rent payments. The Company had capitalized the full amount of the lease incentives upon inception of the respective agreement and these incentives are being amortized to reduce rent expense over the extended lease term. As of December 31, 2013, total unamortized lease incentive was
$0.5 million
, of which
$0.1 million
and
$0.4 million
were included in "Accrued liabilities" and "Other long-term liabilities", respectively, in the Consolidated Balance Sheet as of December 31, 2013. Payments under the Company’s operating leases that escalate over the term of the lease are recognized as rent expense on a straight-line basis.
The above table also includes future minimum lease payments primarily for our facilities in Minneapolis, Minnesota; Acton, Massachusetts; Nanjing, China; Richardson, Texas; and Fremont, San Jose, and Santa Barbara, California, which expire at various dates through 2019, and for certain office equipment under non-cancelable operating lease agreements, which expire at various dates through 2015.
For the years ended December 31, 2013, 2012 and 2011, total rent expense of the Company, net of sublease income, was
$3.9 million
,
$3.5 million
,
$3.6 million
, respectively.
Purchase Commitments
The Company’s primary contract manufacturers place orders for component inventory in advance based upon the Company’s build forecasts in order to reduce manufacturing lead times and ensure adequate component supply. The components are used by the contract manufacturers to build the products included in the build forecasts. The Company does not take ownership of the components and any outstanding orders do not represent firm purchase commitments pursuant to the Company’s agreement with the contract manufacturer. The Company will provide purchase orders to its contract manufacturers in order to fulfill its monthly finished product inventory requirements. The Company incurs a liability when the manufacturer has converted the component inventory to a finished product and takes ownership of the inventory when transferred to the designated shipping warehouse. However, historically, the Company has reimbursed its primary contract manufacturer for component inventory purchases when this inventory has been rendered excess or obsolete, for example due to manufacturing and engineering change orders resulting from design changes, manufacturing discontinuation of parts by its suppliers, or in
64
cases where inventory levels greatly exceed projected demand. The estimated excess and obsolete inventory liabilities related to such manufacturing and engineering change orders, which are included in accrued liabilities in the accompanying balance sheets, were
$0.8 million
and
$1.4 million
as of December 31, 2013 and 2012, respectively. The Company records these amounts in cost of products and services in its Consolidated Statements of Comprehensive Loss.
As of December 31, 2013, the Company had non-cancelable outstanding purchase orders of
$16.3 million
for finished goods to be delivered by its contract manufacturers within one year.
Accrued Warranty
The Company provides a warranty for its hardware products. Hardware generally has a
one
to
five
-year warranty from the date of shipment. The Company accrues for potential warranty claims based on the Company’s historical claims experience. The adequacy of the accrual is reviewed on a periodic basis and adjusted, if necessary, based on additional information as it becomes available.
Changes in the Company’s warranty reserve in the periods as indicated were as follows (in thousands):
|
|
Years Ended December 31,
|
|||||||||||
|
2013
|
2012
|
2011
|
||||||||||
|
Balance at beginning of period
|
$
|
11,762
|
|
$
|
12,104
|
|
$
|
3,789
|
|
|||
|
Accrued warranty from the Occam acquisition
|
—
|
|
—
|
|
8,500
|
|
||||||
|
Warranty charged to cost of revenue
|
4,350
|
|
4,701
|
|
5,883
|
|
||||||
|
Utilization of warranty
|
(5,256
|
)
|
(5,043
|
)
|
(6,068
|
)
|
||||||
|
Balance at end of period
|
$
|
10,856
|
|
$
|
11,762
|
|
$
|
12,104
|
|
|||
Litigation
From time to time, the Company is involved in various legal proceedings arising from the normal course of business activities.
On September 16, 2010, the Company, two direct, wholly-owned subsidiaries of the Company, and Occam entered into an Agreement and Plan of Merger and Reorganization (the “Merger Agreement”). In response to the announcement of the Merger Agreement on October 6, 2010, a purported class action complaint was filed by stockholders of Occam in the Delaware Court of Chancery: Steinhardt v. Howard-Anderson, et al. (Case No. 5878-VCL). On November 24, 2010, these stockholders filed an amended complaint (the “amended Steinhardt complaint”). The amended Steinhardt complaint named Occam (which has since been merged into Calix) and the members of the Occam board of directors as defendants. The amended Steinhardt complaint did not name Calix as a defendant.
The amended Steinhardt complaint sought injunctive relief rescinding the merger transaction and an award of damages in an unspecified amount, as well as plaintiffs' costs, attorney's fees, and other relief.
The merger transaction was completed on February 22, 2011. On January 6, 2012, the Delaware court ruled on a motion for sanctions brought by the defendants against certain of the lead plaintiffs. The Delaware court found that lead plaintiffs Michael Steinhardt, Steinhardt Overseas Management, L.P., and Ilex Partners, L.L.C., collectively the “Steinhardt Plaintiffs,” had engaged in improper trading of Calix shares, and dismissed the Steinhardt Plaintiffs from the case with prejudice. The court further held that the Steinhardt Plaintiffs are: (i) barred from receiving any recovery from the litigation, (ii) required to self-report to the SEC, (iii) directed to disclose their improper trading in any future application to serve as lead plaintiff, and (iv) ordered to disgorge trading profits of
$0.5 million
,to be distributed to the remaining members of the class of former Occam stockholders. The Delaware court also granted the motion of the remaining lead plaintiffs, Herbert Chen and Derek Sheeler, for class certification, and certified Messrs. Chen and Sheeler as class representatives. The certified class is a non-opt-out class consisting of all owners of Occam common stock whose shares were converted to shares of Calix on the date of the merger transaction, with the exception of the defendants in the Delaware action and their affiliates. Chen and Sheeler, on behalf of the class of similarly situated former Occam stockholders, continue to seek an award of damages in an unspecified amount.
Fact discovery in the case closed on April 30, 2013. On June 11, 2013, the plaintiffs filed their Second Amended Class Action Complaint for Breach of Fiduciary Duty (“Second Amended Complaint”). The Second Amended Complaint adds Occam's former CFO as a defendant, and alleges that each of the defendants breached their fiduciary duties by failing to attempt to obtain the best purchase price for Occam and failing to disclose certain allegedly material facts about the merger transaction in the preliminary proxy statement and prospectus included in the Registration Statement on Form S-4 filed with the SEC on November 2, 2010.
On July 17, 2013, attorneys representing all of the defendants named in the Second Amended Complaint filed Defendants' Opening Brief in Support of Their Motion for Summary Judgment, arguing that all defendants are entitled to summary judgment on all counts of the Second Amended Complaint. Plaintiffs' answering brief to the motion for summary judgment was filed on September 3, 2013, and defendants' reply brief was filed on October 4, 2013. A hearing on the motion for summary judgment was held on December 6, 2013. A decision on that motion is pending. If that decision does not dispose of the case entirely, the case is likely to go to trial at some time in 2014.
The Company believes that the allegations in the Second Amended Complaint are without merit and intends to continue to vigorously contest the action. However, there can be no assurance that the Company will be successful in defending this ongoing action. In addition, the Company has obligations, under certain circumstances, to hold harmless and indemnify each of the former Occam directors and officers against judgments, fines, settlements and expenses related to claims against such directors and otherwise to the fullest extent permitted under Delaware law and Occam's bylaws and certificate of incorporation. Such obligations may apply to this lawsuit.
65
The Company is not currently a party to any other legal proceedings that, if determined adversely to the Company, would individually or in the aggregate have a material adverse effect on the Company's business, operating results or financial condition.
Guarantees
The Company from time to time enters into certain types of contracts that contingently require it to indemnify various parties against claims from third parties. These contracts primarily relate to (i) certain real estate leases, under which the Company may be required to indemnify property owners for environmental and other liabilities, and other claims arising from the Company’s use of the applicable premises, (ii) certain agreements with the Company’s officers, directors, and employees, under which the Company may be required to indemnify such persons for liabilities arising out of their relationship with the Company, (iii) contracts under which the Company may be required to indemnify customers against third-party claims that a Company product infringes a patent, copyright, or other intellectual property right and (iv) procurement or license agreements, under which the Company may be required to indemnify licensors or vendors for certain claims that may be brought against them arising from the Company’s acts or omissions with respect to the supplied products or technology.
Generally, a maximum obligation under these contracts is not explicitly stated. Because the obligated amounts associated with these types of agreements are not explicitly stated, the overall maximum amount of the obligation cannot be reasonably estimated. Historically, the Company has not been required to make payments under these obligations, and no liabilities have been recorded for these obligations in the Company’s balance sheets.
6. Fair Value Measurements
In accordance with ASC Topic 820, "
Fair Value Measurements and Disclosures
," (“ASC Topic 820”), the Company measures its cash equivalents and marketable securities at fair value on a recurring basis. ASC Topic 820 clarifies that fair value is an exit price, representing the amount that would be received to sell an asset or paid to transfer a liability in an orderly transaction between market participants. As such, fair value is a market-based measurement that should be determined based on assumptions that market participants would use in pricing an asset or liability. As a basis for considering such assumptions, ASC Topic 820 establishes a three-tier value hierarchy, which prioritizes the inputs used in measuring fair value as follows:
Level 1 – Observable inputs that reflect quoted prices (unadjusted) for identical assets or liabilities in active markets.
Level 2 – Observable inputs other than quoted prices included in Level 1 for similar instruments in active markets, quoted prices for identical or similar instruments in markets that are not active, and model-driven valuations in which all significant inputs and significant value drivers are observable in active markets.
Level 3 – Unobservable inputs to the valuation derived from fair valuation techniques in which one or more significant inputs or significant value drivers are unobservable. The fair value hierarchy also requires the Company to maximize the use of observable inputs, when available, and to minimize the use of unobservable inputs when determining inputs and determining fair value.
The following table sets forth the Company's financial assets measured at fair value as of
December 31, 2013
and December 31, 2012, based on the three-tier fair value hierarchy (in thousands):
|
As of December 31, 2013
|
Level 1
|
Total
|
|||||
|
Money market funds
|
$
|
19,842
|
|
$
|
19,842
|
|
|
|
Total
|
$
|
19,842
|
|
$
|
19,842
|
|
|
|
As of December 31, 2012
|
Level 1
|
Total
|
|||||
|
Money market funds
|
$
|
19,838
|
|
$
|
19,838
|
|
|
|
Total
|
$
|
19,838
|
|
$
|
19,838
|
|
|
The Company's money market funds consisted of highly liquid investments with original maturities of three months or less and are classified as cash equivalents. The carrying amounts of our money market funds approximate their fair values due to their nature, duration and short maturities. The fair values of money market funds were derived from quoted market prices as active markets for these instruments exist. The Company has no level 2 or level 3 financial assets.
66
7. Net Loss per Share
The following table sets forth the computation of basic and diluted net loss per share for the periods indicated (in thousands, except per share data):
|
|
Years Ended December 31,
|
||||||||||
|
2013
|
2012
|
2011
|
|||||||||
|
Numerator:
|
|||||||||||
|
Net loss
|
$
|
(17,265
|
)
|
$
|
(28,326
|
)
|
$
|
(52,550
|
)
|
||
|
Denominator:
|
|||||||||||
|
Weighted-average common shares outstanding
|
49,419
|
|
48,180
|
|
45,546
|
|
|||||
|
Basic and diluted net loss per common share
|
$
|
(0.35
|
)
|
$
|
(0.59
|
)
|
$
|
(1.15
|
)
|
||
|
Potentially dilutive shares, weighted-average
|
5,308
|
|
4,454
|
|
3,695
|
|
|||||
For all the three years presented, unvested restricted stock awards are included in the calculation of basic weighted-average shares because such shares are participating securities, however the impact was immaterial.
Potentially dilutive shares are excluded from the computation of the basic and diluted net loss per share because their effect is antidilutive. These antidilutive shares were primarily from stock options, restricted stock units and performance restricted stock awards.
8. Stockholders’ Equity
Common Stock
On March 2, 2010, the Company’s board of directors approved an amended and restated certificate of incorporation that increased the authorized common stock to
100 million
shares and the authorized preferred stock to
5.0 million
shares effective immediately prior to the completion of the Company’s initial public offering on March 26, 2010.
On March 21, 2010, the Company’s board of directors approved an amended and restated certificate of incorporation effecting a 2-for-3 reverse stock split of its common stock and all convertible preferred stock. The par value and the authorized shares of the common stock and convertible preferred stock were not adjusted as a result of the reverse stock split. All issued and outstanding common stock, convertible preferred stock, warrants for common stock, warrants for preferred stock, and per share amounts contained in the financial statements have been retroactively adjusted to reflect this reverse stock split for all periods presented. The reverse stock split was effected on March 23, 2010.
On
March 26, 2010
, the Company completed its initial public offering in which
4,166,666
shares of common stock were sold by the Company at a public offering price of
$13.00
per share. Gross proceeds of
$54.2 million
from the sale of common stock by the Company were reduced by issuance costs of
$4.6 million
and underwriters fees of
$3.8 million
. On
April 8, 2010
, the Company issued and sold
949,339
shares of common stock resulting from the exercise of the underwriters’ option to purchase common shares associated with the Company’s initial public offering. This sale resulted in gross proceeds of
$12.3 million
based on an initial public offering price of
$13.00
per share of common stock, which were reduced by underwriters’ discount and offering expenses payable by the Company of
$0.8 million
.
On February 22, 2011, in connection with the acquisition of Occam, the Company issued
6.4 million
shares of the Company’s common stock, a value of
$117.2 million
. For more information regarding the acquisition of Occam see Note 2,
“Business Combinations”
of these Notes to Consolidated Financial Statements.
Holders of our common stock are entitled to receive dividends, if any, as may be declared from time to time by our board of directors out of legally available funds.
No
dividends have been declared or paid as of December 31, 2013. In the event of our liquidation, dissolution or winding up, holders of our common stock will be entitled to share ratably in the net assets legally available for distribution to stockholders after the payment of all of our debts and other liabilities and the satisfaction of any liquidation preference granted to the holders of any then outstanding shares of preferred stock.
Preferred Stock
The board of directors has the authority, without action by stockholders with the exception of stockholders who hold board positions, to designate and issue up to
5.0 million
shares of preferred stock in one or more series and to fix the rights, preferences, privileges and restrictions thereof. These rights, preferences and privileges could include dividend rights, conversion rights, voting rights, terms of redemption, liquidation preferences, sinking fund terms and the number of shares constituting any series or the designation of such series, any or all of which may be greater than the rights of common stock. The issuance of the Company’s preferred stock could adversely affect the voting power of holders of common stock and the likelihood that such holders will receive dividend payments and payments upon liquidation. In addition, the issuance of preferred stock could have the effect of delaying, deferring or preventing a change in control of the Company or other corporate action. Subsequent to the Company’s initial public offering and the conversion of all preferred stock outstanding at that date, the board of directors has not designated any rights, preference or powers of any preferred stock and
no
shares of preferred stock have been issued.
67
Equity Incentive Plans
Prior to March 2010, the Company had the 2000 Stock Plan ("2000 Plan") and the Amended and Restated 2002 Stock Plan ("2002 Plan") (together, "Prior Plans"). Under the Prior Plans, the Company may grant incentive stock options at a price not less than
100%
of the fair market value of the common stock on the date of grant and non-statutory stock options at a price not less than
85%
, or, with respect to the 2002 Plan,
100%
of the fair market value of the common stock on the date of grant. Before April 2004, certain options could be granted with the right to exercise those options before vesting. The majority of the stock options granted under the Prior Plans vest over
4 years
and expire in
10 years
.
On March 2, 2010, the Company’s Board of Directors approved the 2010 Equity Incentive Award Plan ("2010 Plan") which allows the Company to grant stock options, restricted stock awards ("RSA"), restricted stock units ("RSU"), performance restricted stock units ("PRSU"), stock appreciation rights, dividend equivalents, deferred stock, and stock payments to employees, directors and consultants of the Company. A total of
4,666,666
shares of common stock were reserved for future issuance under the 2010 Plan, which became effective upon the completion of the Company’s initial public offering of common stock. In addition, on the first day of each year beginning in 2011 and ending in 2020, the 2010 Plan provides for an annual automatic increase to the shares reserved for issuance and no more than
17,150,494
shares of Common Stock may be issued upon the exercise of Incentive Stock Options. Pursuant to the automatic annual increase, total
1,999,998
additional shares had been reserved under the 2010 Plan since 2011.
Upon the effectiveness of the 2010 Plan, equity awards were granted only under the 2010 Plan and shares of common stock previously reserved for issuance under the Prior Plans became available for issuance under the 2010 Plan. To date, awards granted under the 2010 Plan consist of stock options, RSAs, RSUs and PRSUs.
Stock options granted under the 2010 Plan are granted in general at a price not less than
100%
of the fair market value of the common stock on the date of grant. Generally, the options issued under the 2010 Plan
vest 25% on the first anniversary of the vesting commencement date and on a monthly basis thereafter for a period of an additional three years
. The options have a maximum term of
ten years
.
Each RSU granted under the 2010 Plan represents a right to receive one share of the Company’s common stock (subject to adjustment for certain specified changes in the capital structure of the Company) upon the completion of a specific period of continued service.
The majority of RSUs granted vest over
four years
.
In July 2011, the Company granted
423,000
RSAs to executives under the 2010 Plan, which
vest 25% per year for 4 years from the grant date
. Upon issuance of RSA, the holder is entitled to have all the rights of a stockholder, subject to the restrictions in his or her Award Agreement, including the right to receive all dividends and other distributions paid or made with respect to the shares.
In 2012, the Company commenced granting PRSUs to its executives with
two
-year and
three
-year performance periods. The performance criterion is based on the relative total shareholder return (“TSR”) of Calix common stock as compared to the TSR of the Company’s peer group. The TSR is calculated by dividing (a) the average closing trading price for the 90-day period ending on the last day of the applicable performance period by (b) the average closing trading price for the 90-day period immediately preceding the first day of the applicable performance period. This TSR is then used to derive the achievement ratio, which is then multiplied by the number of units in the grant to derive the common stock to be issued for each performance period, which may equal from zero percent (
0%
) to two hundred percent (
200%
) of the target award.
Stock Option Exchange Program
On September 23, 2009, the Company completed a stock option exchange program, which was approved by its board of directors, pursuant to which eligible employees were able to exchange eligible stock options for restricted stock units on a one-for-one basis. Pursuant to the exchange, the Company canceled options for
3.4 million
shares of the Company’s common stock and issued an equivalent number of RSUs to eligible holders on September 23, 2009, of which 50% vested in October 2010 and the remaining 50% vested in May 2011. In connection with the RSU grants, the unrecognized compensation expense related to the exchanged options was expensed over the remainder of the original vesting period of the options exchanged. The incremental cost due to the exchange was deferred until a liquidity event, which happened with the Company’s IPO, and had been recognized in accordance with the vesting periods described above.
68
Stock Options
The following table summarizes the activity of stock options under the Company’s equity incentive plans (in thousands, except per share data):
|
Weighted-
|
Weighted-Average
|
||||||||||||
|
Average
|
Remaining
|
Aggregate
|
|||||||||||
|
Number of
|
Exercise Price
|
Contractual Life
|
Intrinsic
|
||||||||||
|
Stock Options
|
Shares
|
Per Share
|
(in years)
|
Value
(1)
|
|||||||||
|
Outstanding as of December 31, 2012
|
2,213
|
|
$
|
13.51
|
|
||||||||
|
Granted
|
573
|
|
8.57
|
|
|||||||||
|
Exercised
|
(160
|
)
|
4.66
|
|
|||||||||
|
Forfeited or expired
|
(66
|
)
|
13.32
|
|
|||||||||
|
Outstanding as of December 31, 2013
|
2,560
|
|
$
|
12.96
|
|
7.6
|
$
|
2,474
|
|
||||
|
Vested and expected to vest at December 31, 2013
|
2,520
|
|
$
|
13.02
|
|
7.6
|
$
|
2,414
|
|
||||
|
|
|||||||||||||
|
(1) Amounts represent the difference between the exercise price and the fair market value of common stock at December 31, 2013 for all in the money options outstanding.
|
|||||||||||||
During the years ended December 31, 2013, 2012, and 2011, total intrinsic value of stock options exercised was
$1.0 million
,
$0.6 million
,
$2.7 million
, respectively. Total cash received from employees as a result of stock option exercises in 2013, 2012, and 2011 was
$0.7 million
,
$0.2 million
,
$0.8 million
, respectively.
The following table summarizes information about stock options outstanding and exercisable at
December 31, 2013
(in thousands, except year and per share data):
|
Options Outstanding
|
Options Exercisable
|
|||||||||||||||||||||
|
Weighted-Average
|
Weighted-
|
Weighted-
|
||||||||||||||||||||
|
Number
|
Remaining
|
Average
|
Number
|
Average
|
||||||||||||||||||
|
of Shares
|
Contractual Life
|
Exercise Price
|
of Shares
|
Exercise Price
|
||||||||||||||||||
|
Range of Exercise Prices
|
Outstanding
|
(in years)
|
Per Share
|
Exercisable
|
Per Share
|
|||||||||||||||||
|
$
|
1.20
|
|
—
|
$
|
6.80
|
|
453
|
|
7.3
|
$
|
6.31
|
|
255
|
|
$
|
6.12
|
|
|||||
|
6.95
|
|
—
|
8.38
|
|
183
|
|
8.2
|
7.67
|
|
61
|
|
7.47
|
|
|||||||||
|
8.41
|
|
—
|
8.41
|
|
467
|
|
9.1
|
8.41
|
|
95
|
|
8.41
|
|
|||||||||
|
8.55
|
|
—
|
10.71
|
|
436
|
|
8.0
|
10.45
|
|
216
|
|
10.35
|
|
|||||||||
|
10.85
|
|
—
|
18.86
|
|
508
|
|
7.2
|
15.58
|
|
351
|
|
15.74
|
|
|||||||||
|
19.40
|
|
—
|
4,401.93
|
|
513
|
|
6.4
|
24.42
|
|
387
|
|
25.40
|
|
|||||||||
|
$
|
1.20
|
|
—
|
$
|
4,401.93
|
|
2,560
|
|
7.6
|
$
|
12.96
|
|
1,365
|
|
$
|
14.94
|
|
|||||
Restricted Stock Units, Performance Restricted Stock Units, and Restricted Stock Awards
The following table summarizes the activities of the Company's RSUs, PRSUs, and RSAs under the Company’s equity incentive plans (in thousands, except per share data):
|
RSUs
|
PRSUs
|
RSAs
|
||||||||||||||||||
|
Weighted-Average
|
Weighted-Average
|
Weighted-Average
|
||||||||||||||||||
|
Grant Date
|
Grant Date
|
Grant Date
|
||||||||||||||||||
|
Number of
|
Fair Value
|
Number of
|
Fair Value
|
Number of
|
Fair Value
|
|||||||||||||||
|
Shares
|
Per Share
|
Shares
|
Per Share
|
Shares
|
Per Share
|
|||||||||||||||
|
Outstanding at December 31, 2012
|
1,762
|
|
$
|
11.67
|
|
183
|
|
$
|
14.78
|
|
299
|
|
$
|
21.67
|
|
|||||
|
Granted
|
705
|
|
9.20
|
|
230
|
|
11.24
|
|
—
|
|
—
|
|
||||||||
|
Vested
|
(822
|
)
|
11.07
|
|
—
|
|
—
|
|
(95
|
)
|
21.67
|
|
||||||||
|
Canceled
|
(139
|
)
|
9.51
|
|
—
|
|
—
|
|
(15
|
)
|
21.67
|
|
||||||||
|
Outstanding at December 31, 2013
|
1,506
|
|
$
|
11.04
|
|
413
|
|
$
|
12.81
|
|
189
|
|
$
|
21.67
|
|
|||||
Upon vesting of certain RSUs and RSAs, the Company withheld shares with value equivalent to the employees’ minimum statutory obligation for the applicable income and other employment taxes, and remitted the cash to the appropriate taxing authorities. The number of shares withheld was based on the value of the RSUs or RSAs on their vesting date as determined by the Company’s closing stock price. The withheld shares are reserved for future grant and issuance under the 2010 Plan.
69
Modification of Stock Awards
In February 2013, the Company entered into a Transition and Separation Agreement ("Agreement") with Roger Weingarth, the Company's former Executive Vice President and Chief Operating Officer. Under the Agreement, Mr. Weingarth transitioned to the role of advisor to the Chief Executive Officer of the Company effective as of April 1, 2013, and would terminate his employment with the Company on March 31, 2014 ("Termination Date"). Upon his termination, the Agreement provides for, among other things, the acceleration of the vesting of his unvested stock options, RSAs and RSUs held by him as of the Termination Date. In accordance with ASC Topic 718, total fair value of the accelerated stock awards after the modification is
$0.6 million
, which is being recognized on a straight-line basis over the remaining service period through the Termination Date. During the year ended December 31, 2013,
$0.5 million
of the total fair value has been recognized in general and administrative expenses of the Consolidated Statement of Comprehensive Loss in this Form 10-K.
Employee Stock Purchase Plan
The Company’s 2010 Employee Stock Purchase Plan, as amended (“2010 ESPP”) allows employees to purchase shares of the Company’s common stock through payroll deductions of up to
15 percent
of their annual compensation subject to certain Internal Revenue Code limitations. In addition, no participant may purchase more than
2,000
shares of common stock in each offering period.
The offering periods under the 2010 ESPP are six-month periods commencing on June 1 and December 1 of each year. The price of common stock purchased under the plan is
85 percent
of the lower of the fair market value of the common stock on the commencement date and exercise date of each six-month offering period.
The 2010 ESPP, as amended in 2012, provides for the issuance of a maximum of
4.3 million
shares of common stock. During the twelve months ended December 31, 2013,
685,781
shares were purchased and issued. As of December 31, 2013, there were
2.6 million
shares available for issuance.
Stock Based Compensation
In accordance with ASC Topic 718, stock-based compensation expense associated with stock options, RSUs, PRSUs, RSAs, and purchase rights under the 2010 ESPP is measured at the grant date based on the fair value of the award, and is recognized, net of forfeitures, as expense over the remaining requisite service period on a straight-line basis. During the years ended December 31, 2013, 2012, and 2011, the Company recorded stock-based compensation expense of
$19.9 million
,
$17.4 million
and
$21.6 million
, respectively.
The following table summarizes the weighted-average grant date fair values of the Company's stock-based awards granted in the periods indicated:
|
Years Ended December 31,
|
|||||||||||
|
2013
|
2012
|
2011
|
|||||||||
|
Stock options
|
$
|
4.89
|
|
$
|
4.68
|
|
$
|
9.77
|
|
||
|
RSUs
|
$
|
9.20
|
|
$
|
6.55
|
|
$
|
21.33
|
|
||
|
PRSUs
|
$
|
11.24
|
|
$
|
14.81
|
|
N/A
|
||||
|
RSAs
|
N/A
|
N/A
|
$
|
21.67
|
|
||||||
|
ESPP
|
$
|
2.94
|
|
$
|
2.34
|
|
$
|
3.48
|
|
||
The Company values the RSUs and RSAs at the closing market price of the Company’s common stock on the date of grant.
The fair value of the PRSU with a market condition is estimated on the date of award, using a Monte Carlo simulation model to estimate the TSR of the Company's stock in relation to the peer group over each performance period. Compensation cost on PRSUs with a market condition is not adjusted for subsequent changes in the Company's stock performance or the level of ultimate vesting.
The Company estimates the fair value of stock options and purchase rights under the 2010 ESPP at the grant date using the Black-Scholes option-pricing model. This model requires the use of the following assumptions:
(i) Expected volatility of the Company's common stock - Starting in the fourth quarter of 2012, the Company computed its expected volatility assumption based on a blended volatility (
50%
historical volatility and
50%
implied volatility from traded options on the Company's common stock). This change of the method was made as the Company's common stock has now been publicly traded for more than two years, a sufficient history of stock prices had been developed. The selection of a blended volatility assumption was based upon the Company's assessment that a blended volatility is more representative of the Company's future stock price trend as it weighs the historical volatility with the future implied volatility. Expected volatilities computed using this new method for stock options granted in the fourth quarter of 2012 was
66%
. Prior to the fourth quarter of 2012, the Company’s computation of expected volatility was based on the Company’s peer group in the industry in which the Company does business. Expected volatilities computed using the old method for stock options granted in the first three quarters of 2012 ranged from
55%
to
56%
.
(ii) Expected life of the option award - Represents the weighted-average period that the stock options are expected to remain outstanding. The Company’s computation of expected life utilizes the simplified method in accordance with Staff Accounting Bulletin No. 110 ("SAB 110") due to the lack of sufficient historical exercise data to provide a reasonable basis upon which to estimate expected term. The mid-point between the vesting date and the expiration date is used as the expected term under this method.
(iii) Expected dividend yield - Assumption is based on the Company's history of not paying dividends and no future expectations of dividend payouts.
70
(iv) Risk-free interest rate - Based on the U.S. Treasury yield curve in effect at the time of grant with maturities approximating the grant’s expected life.
The following table summarizes the weighted-average assumptions used in estimating the grant-date fair value of stock options and of each employee’s purchase right under the 2010 ESPP in the periods indicated:
|
Years Ended December 31,
|
||||||||
|
Stock Options
|
2013
|
2012
|
2011
|
|||||
|
Expected volatility
|
62
|
%
|
56
|
%
|
52
|
%
|
||
|
Expected life (years)
|
6.05
|
|
6.25
|
|
6.25
|
|
||
|
Expected dividend yield
|
—
|
|
—
|
|
—
|
|
||
|
Risk-free interest rate
|
1.14
|
%
|
1.06
|
%
|
2.11
|
%
|
||
|
Years Ended December 31,
|
||||||||
|
ESPP
|
2013
|
2012
|
2011
|
|||||
|
Expected volatility
|
50
|
%
|
63
|
%
|
52
|
%
|
||
|
Expected life (years)
|
0.50
|
|
0.50
|
|
0.50
|
|
||
|
Expected dividend yield
|
—
|
|
—
|
|
—
|
|
||
|
Risk-free interest rate
|
0.09
|
%
|
0.13
|
%
|
0.66
|
%
|
||
In addition, the Company applies an estimated forfeiture rate to awards granted and records stock-based compensation expense only for those awards that are expected to vest. Forfeiture rates are estimated at the time of grant based on the Company's historical experience. Further, to the extent the Company's actual forfeiture rate is different from management's estimate, stock-based compensation is adjusted accordingly.
On February 22, 2011, in connection with the acquisition of Occam (see Note 2,
"Business Combinations"
of these Notes to Consolidated Financial Statements), the Company issued
536,190
stock options and
42,654
RSUs to certain Occam employees. The grants were in exchange for certain options and RSUs that were held by Occam employees prior to the acquisition which retained the original vesting schedule of the initial Occam grants, except for certain equity awards held by Occam executives that were accelerated in association with their severance agreements. The Company estimated the fair value of
$5.8 million
of the options and RSUs in accordance with ASC Topic 718. In accordance with ASC Topic 805, the Company allocated the value of
$1.4 million
of certain options and RSUs to consideration in the business combination with the remaining value of
$4.5 million
allocated to post-combination expense to be recognized over the remaining service period of the grants.
As of December 31, 2013, unrecognized stock-based compensation expenses by award type, net of estimated forfeitures, and their expected weighted-average recognition periods are summarized in the following table (in thousands).
|
As of December 31, 2013
|
||||||||||||||||||||
|
Stock Option
|
RSU
|
PRSU
|
RSA
|
ESPP
|
||||||||||||||||
|
Unrecognized stock-based compensation expense
|
$
|
6,391
|
|
$
|
10,861
|
|
$
|
1,801
|
|
$
|
2,392
|
|
$
|
662
|
|
|||||
|
Weighted-average amortization period (in years)
|
2.2
|
|
2.3
|
|
1.3
|
|
1.5
|
|
0.4
|
|
||||||||||
Common Stock Warrants
Warrants to purchase convertible preferred stock that did not expire at the close of the Company’s initial public offering, in March 2010, converted to warrants to purchase common stock at the applicable conversion rate for the related preferred stock. As of December 31, 2013, the following warrants to purchase common stock were outstanding (in thousands, except per share data):
|
Expiration Date
|
|
Exercise Price
Per Share
|
|
Number of Warrants Outstanding
|
||
|
August 16, 2014
|
|
$
|
10.26
|
|
|
8
|
|
September 4, 2017
|
|
$
|
19.56
|
|
15
|
|
|
|
|
23
|
||||
71
Shares Reserved for Future Issuance
The Company had common shares reserved for future issuance as follows (in thousands):
|
As of December 31,
|
||||||||
|
2013
|
2012
|
2011
|
||||||
|
Stock options outstanding
|
2,560
|
|
2,213
|
|
1,661
|
|
||
|
Restricted stock units outstanding
|
1,506
|
|
1,762
|
|
1,775
|
|
||
|
Performance restricted stock units outstanding
|
413
|
|
183
|
|
—
|
|
||
|
Shares available for future grant under 2010 Plan
|
3,652
|
|
3,959
|
|
4,508
|
|
||
|
Shares available for future issuance under ESPP
|
2,574
|
|
3,260
|
|
579
|
|
||
|
Common stock warrants
|
23
|
|
23
|
|
23
|
|
||
|
Total
|
10,728
|
|
11,400
|
|
8,546
|
|
||
9. Employee Benefit Plan
The Company sponsors a 401(k) tax-deferred savings plan for all employees who meet certain eligibility requirements. Participants may contribute, on a pre-tax basis, a percentage of their annual compensation, but not to exceed a maximum contribution amount pursuant to Section 401(k) of the Internal Revenue Code. The Company, at the discretion of the board of directors, may make additional matching contributions on behalf of the participants. The Company made matching contributions totaling
$1.5 million
,
$1.4 million
, and
$1.3 million
in
2013
,
2012
and
2011
, respectively.
10. Credit Facility
The Company had a revolving credit facility ("Prior Credit Facility") of
$30.0 million
with Silicon Valley Bank based upon a percentage of eligible accounts receivable, which matured on
June 30, 2013
. After the Prior Credit Facility matured on June 30, 2013, the Company cash collateralized the outstanding letters of credit with Silicon Valley Bank. As of December 31, 2013, the Company had
$0.3 million
cash restricted for collateralizing the outstanding letters of credit with Silicon Valley Bank.
On July 29, 2013, the Company entered into a credit agreement with Bank of America, N.A. The credit agreement is structured such that other financial institutions can at a later time become party to the credit agreement through an amendment via a syndication process (collectively, together with Bank of America, N.A., the "Lenders"). The credit agreement provides for a revolving facility in the aggregate principal amount of up to
$50.0 million
, which includes a
$20.0 million
sublimit for the issuance of letters of credit and a
$10.0 million
sublimit for a swingline facility. Subject to customary conditions, up to
$25.0 million
of the revolving facility may be converted to a term loan facility at any time prior to the maturity of the revolving facility. The revolving facility matures on
July 29, 2016
, but may be extended up to
two
times (each extension for an additional one-year period) upon mutual agreement of the Company and the Lenders. The credit facility is secured by substantially all of the Company's assets, including its intellectual property. Proceeds of the credit facility may be used for general corporate purposes and permitted acquisitions.
Loans under the credit facility bear interest at an annual rate equal to the base rate plus
0.75%
to
1.25%
or LIBOR plus
2.00%
to
2.50%
based on a leverage ratio of consolidated funded indebtedness to consolidated Adjusted EBITDA (customarily defined).
Interest on the revolving facility is due quarterly, and any outstanding interest and principal is due on the maturity date of the revolving facility.
The Company is required to repay principal on a term loan in twenty equal quarterly payments from the date the Company enters into a term loan, and all outstanding principal and accrued interest is due on the revolving facility maturity date. Swingline loans must be repaid on the earlier of (i) ten business days after a loan is made and (ii) the revolving facility maturity date. The Company is also required to pay commitment fees of
0.25%
per year on any unused portions of this facility.
The credit facility includes affirmative and negative covenants applicable to the Company that are typical for credit facilities of this type. Furthermore, the credit agreement requires us to maintain certain financial covenants, including a maximum consolidated leverage ratio, and a minimum consolidated liquidity ratio of cash, cash equivalents and accounts receivable to consolidated funded indebtedness. As of December 31, 2013, the Company was in compliance with these requirements. The credit facility also includes customary events of default, the occurrence and continuation of which would provide the Lenders with the right to demand immediate repayment of any principal and unpaid interest under the credit facility, and to exercise remedies against us and the collateral securing the loans under the credit facility.
As of December 31, 2013, there was
$50.0 million
available for borrowing under this credit facility.
The Company incurred
$0.3 million
of debt issuance costs that were directly attributable to the issuance of this credit facility. These costs will be amortized over three years starting from the effective date of the credit facility. As of December 31, 2013, the unamortized debt issuance costs of
$0.3 million
were included within "Other assets" in the Company's Consolidated Balance Sheets.
11. Income Taxes
The Company recorded a provision for/(benefit from) income taxes of
$(14) thousand
,
$0.2 million
, and
$0.2 million
, in 2013, 2012 and 2011, respectively. The income tax benefit for 2013 primarily consisted of state alternative minimum tax (AMT) and state and foreign income taxes, net of the tax benefit recorded from the utilization of a portion of the AMT net operation loss (NOL) acquired from Occam. The remainder of the AMT NOL, which was approximately
$5.3 million
as of December 31, 2013, will be carried forward by the Company to offset future AMT income.
72
Provision for (benefit from) income taxes consisted of the following for the periods indicated (in thousands):
|
Years Ended December 31,
|
|||||||||||
|
2013
|
2012
|
2011
|
|||||||||
|
Federal current income tax (benefit)
|
$
|
(274
|
)
|
$
|
152
|
|
$
|
—
|
|
||
|
State current income tax
|
41
|
|
73
|
|
114
|
|
|||||
|
Foreign current income tax
|
315
|
|
440
|
|
228
|
|
|||||
|
Federal deferred income tax (benefit)
|
—
|
|
(474
|
)
|
—
|
|
|||||
|
State deferred income tax (benefit)
|
—
|
|
(89
|
)
|
—
|
|
|||||
|
Foreign deferred income tax (benefit)
|
(96
|
)
|
56
|
|
(118
|
)
|
|||||
|
Provision for (benefit from) income taxes
|
$
|
(14
|
)
|
$
|
158
|
|
$
|
224
|
|
||
The differences between the statutory tax rate and the effective tax rate, expressed as a percentage of loss before income taxes, were as follows:
|
Years Ended December 31,
|
||||||||
|
2013
|
2012
|
2011
|
||||||
|
Federal statutory rate
|
34.0
|
%
|
34.0
|
%
|
34.0
|
%
|
||
|
State statutory rate
|
3.4
|
%
|
5.2
|
%
|
5.2
|
%
|
||
|
Foreign operations
|
1.4
|
%
|
0.1
|
%
|
0.2
|
%
|
||
|
Release of FIN 48 liability and interest
|
0.7
|
%
|
—
|
%
|
—
|
%
|
||
|
R&D tax credits
|
13.1
|
%
|
2.5
|
%
|
2.1
|
%
|
||
|
Release of valuation allowance related to EFAA acquisition
|
—
|
%
|
2.0
|
%
|
—
|
%
|
||
|
Acquisition-related costs
|
—
|
%
|
1.2
|
%
|
(1.5
|
)%
|
||
|
Other permanent items
|
(4.5
|
)%
|
0.1
|
%
|
(1.6
|
)%
|
||
|
2012 tax true-up
|
1.0
|
%
|
—
|
%
|
—
|
%
|
||
|
Valuation allowance
|
(49.0
|
)%
|
(45.7
|
)%
|
(38.8
|
)%
|
||
|
Effective tax rate
|
0.1
|
%
|
(0.6
|
)%
|
(0.4
|
)%
|
||
The significant components of the Company’s deferred tax assets and liabilities were as follows (in thousands):
|
As of December 31,
|
|||||||
|
2013
|
2012
|
||||||
|
Deferred tax assets:
|
|||||||
|
Net operating loss carryforwards
|
$
|
168,431
|
|
$
|
180,005
|
|
|
|
Tax credit carryforwards
|
22,507
|
|
20,154
|
|
|||
|
Depreciation and amortization
|
2,996
|
|
2,858
|
|
|||
|
Accruals and reserves
|
11,479
|
|
11,353
|
|
|||
|
Deferred revenue
|
12,037
|
|
13,367
|
|
|||
|
Stock-based compensation
|
5,570
|
|
3,592
|
|
|||
|
Other
|
450
|
|
294
|
|
|||
|
Gross deferred tax assets
|
223,470
|
|
231,623
|
|
|||
|
Valuation allowance
|
(207,315
|
)
|
(207,441
|
)
|
|||
|
Net deferred tax assets
|
16,155
|
|
24,182
|
|
|||
|
Deferred tax liabilities:
|
|||||||
|
Intangible assets
|
(15,988
|
)
|
(24,120
|
)
|
|||
|
Net deferred tax assets reflected in balance sheet
|
$
|
167
|
|
$
|
62
|
|
|
Management reviews the recognition of deferred tax assets to determine if realization of such assets is more likely than not. The realization of the Company’s deferred tax assets is dependent upon future earnings. The Company has been in a cumulative loss position since inception, which represents a significant piece of negative evidence. Using the more likely than not criteria specified in the applicable accounting guidance, this negative evidence cannot be overcome by positive evidence currently available to the Company and as a result the Company has established a full valuation allowance against its deferred tax assets with the exception of certain foreign deferred tax assets. The Company’s valuation allowance decreased by
$0.1 million
in 2013 and increased by
$5.4 million
in 2012. As of December 31, 2013 and 2012, respectively, the valuation allowance included
$0.1 million
related to excess tax benefits of stock option deductions prior to the adoption of ASC Topic 718. The benefits will increase additional paid-in capital when realized.
As of December 31, 2013, the Company had U.S. federal and state net operating losses of approximately
$550.1 million
and $
174.2 million
, respectively. The U.S. federal net operation loss carryforwards will expire at various dates beginning in 2018 and through 2031 if not
73
utilized. The state net operation loss carryforwards will expire at various dates beginning in 2014 and through 2031, if not utilized. As of December 31, 2013 and 2012, the Company had
$37.2 million
and
$36.3 million
in federal deductions, respectively, and
$34.0 million
and
$33.3 million
in state deductions, respectively, related to excess tax benefits from stock options which are not included in the net operation loss carryforward amounts in the table above since they have not met the realization criteria of ASC Topic 718. The tax benefits from these deductions will increase additional paid-in capital when realized. Additionally, the Company has U.S. federal, California and other various U.S. states research and development credits of approximately
$18.5 million
,
$22.0 million
and
$1.8 million
as of December 31, 2013, respectively. The U.S. federal research and development credits will begin to expire in 2020 and through 2033, and the California research and development credits have no expiration date. The credits related to other various U.S. states will begin to expire in 2015 and through 2028. During 2013, the Company performed a Section 382 study of the Internal Revenue Code (and similar state provisions) through December 31, 2012, which resulted in no adjustment of the Company’s net operation loss carryforwards.
Uncertain Tax Positions
ASC Topic 740, “Income Taxes,” prescribes a recognition threshold and measurement attribute to the financial statement recognition and measurement of a tax position taken or expected to be taken in a tax return. The guidance also provides guidance on derecognition, classification, accounting in interim periods and disclosure requirements for uncertain tax positions. The standard requires the Company to recognize the financial statement effects of an uncertain tax position when it is more likely than not that such position will be sustained upon audit. The Company recognizes accrued interest and penalties related to unrecognized tax benefits as interest expense and income tax expense, respectively, in statements of operations.
The following table reconciles the Company's unrecognized tax benefits for the years ended December 31, 2013 and 2012 (in thousands):
|
Years Ended December 31,
|
|||||||
|
2013
|
2012
|
||||||
|
Balance at beginning of period
|
$
|
13,238
|
|
$
|
12,543
|
|
|
|
Additions for tax positions related to prior year
|
317
|
|
228
|
|
|||
|
Reductions for tax positions related to prior year
|
(48
|
)
|
(37
|
)
|
|||
|
Additions for tax positions related to current year
|
990
|
|
504
|
|
|||
|
Reductions from a lapse of applicable statute of limitations
|
(115
|
)
|
—
|
|
|||
|
Balance at end of period
|
$
|
14,382
|
|
$
|
13,238
|
|
|
The total amount of unrecognized tax benefits that would affect the Company’s effective tax rate is
none
and
$0.1 million
as of December 31, 2013 and December 31, 2012, respectively. There were
no
accrued interest or penalties for uncertain income tax as of December 31, 2013.
The Company files tax returns in the United State and various state jurisdictions, the United Kingdom and China. The tax years 1999 through 2013 remain open and subject to examination by the appropriate governmental agencies in the U.S. due to tax attribute carryforwards.
12. Segment Information
The Company develops, markets and sells communications access systems and software, and there are no segment managers who are held accountable for operations, operating results and plans for levels or components below the Company unit level. Accordingly, the Company is considered to be in a single reporting segment and operating unit structure. The Company’s chief operating decision maker is the Company’s Chief Executive Officer, who reviews financial information presented on a Company-wide basis, accompanied by disaggregated information about revenues by geographic region for purposes of allocating resources and evaluating financial performance.
Geographic Information:
The following is a summary of revenues by geographic region based upon the location of the customers (in thousands):
|
Years Ended December 31,
|
||||||||||||
|
2013
|
2012
|
2011
|
||||||||||
|
United States
|
$
|
333,403
|
|
$
|
306,003
|
|
$
|
323,070
|
|
|||
|
Caribbean
|
17,466
|
|
9,343
|
|
12,837
|
|
||||||
|
Europe
|
17,397
|
|
268
|
|
211
|
|
||||||
|
Canada
|
10,231
|
|
10,894
|
|
6,691
|
|
||||||
|
Other
|
4,121
|
|
3,710
|
|
1,860
|
|
||||||
|
Total
|
$
|
382,618
|
|
$
|
330,218
|
|
$
|
344,669
|
|
|||
74
The Company's property and equipment, net of accumulated depreciation, are located in the following geographical areas (in thousands):
|
As of December 31,
|
||||||||||||
|
2013
|
2012
|
2011
|
||||||||||
|
United States
|
$
|
14,969
|
|
$
|
18,390
|
|
$
|
14,339
|
|
|||
|
China
|
2,504
|
|
2,693
|
|
1,791
|
|
||||||
|
Total
|
$
|
17,473
|
|
$
|
21,083
|
|
$
|
16,130
|
|
|||
13. Quarterly Financial Data—Unaudited
The Company's fiscal year begins on January 1st and ends on December 31st. Quarterly periods are based on a 4-4-5 fiscal calendar with the first, second and third fiscal quarters ending on the 13th Saturday of each fiscal period. As a result, the Company had two fewer days in the first quarter of 2013 and one more day in the fourth quarter of 2013 than in the respective 2012 periods.
The following table presents selected unaudited quarterly financial data of the Company (in thousands, except per share data). The Company’s quarterly results of operations for these periods are not necessarily indicative of future results of operations.
|
Fiscal Year 2013 Quarter Ended
|
||||||||||||||||
|
March 30
|
June 29
|
September 28
|
December 31
(1)
|
|||||||||||||
|
Revenue
|
$
|
90,548
|
|
$
|
94,439
|
|
$
|
103,628
|
|
$
|
94,003
|
|
||||
|
Gross profit
|
41,115
|
|
42,505
|
|
47,407
|
|
40,047
|
|
||||||||
|
Operating loss
|
(5,540
|
)
|
(4,845
|
)
|
(12
|
)
|
(8,056
|
)
|
||||||||
|
Net income (loss)
|
(6,203
|
)
|
(5,153
|
)
|
544
|
|
(6,453
|
)
|
||||||||
|
Net income (loss) per common share, basic
|
$
|
(0.13
|
)
|
$
|
(0.10
|
)
|
$
|
0.01
|
|
$
|
(0.13
|
)
|
||||
|
Net income (loss) per common share, diluted
|
$
|
(0.13
|
)
|
$
|
(0.10
|
)
|
$
|
0.01
|
|
$
|
(0.13
|
)
|
||||
|
Fiscal Year 2012 Quarter Ended
|
||||||||||||||||
|
March 31
|
June 30
|
September 29
|
December 31
(2)
|
|||||||||||||
|
Revenue
|
$
|
78,565
|
|
$
|
78,928
|
|
$
|
81,301
|
|
$
|
91,424
|
|
||||
|
Gross profit
|
33,819
|
|
33,221
|
|
33,506
|
|
37,030
|
|
||||||||
|
Operating loss
|
(7,369
|
)
|
(6,830
|
)
|
(7,077
|
)
|
(7,748
|
)
|
||||||||
|
Net loss
|
(7,521
|
)
|
(7,091
|
)
|
(7,140
|
)
|
(6,574
|
)
|
||||||||
|
Net loss per common share, basic and diluted
|
$
|
(0.16
|
)
|
$
|
(0.15
|
)
|
$
|
(0.15
|
)
|
$
|
(0.14
|
)
|
||||
|
(1) For the fourth quarter of 2013, net loss included $1.7 million of gain from utilization of inventory credit from Ericsson. See Note 2,
"Business Combinations"
of these Notes to the Consolidated Financial Statements for details of the Ericsson Credit.
|
||||||||||||||||
|
(2) The Company acquired Ericsson's fiber access assets in November 2012. The quarterly financial data included the results of this acquisition only for periods subsequent to the acquisition date. See Note 2, “Business Combinations" of these Notes to the Consolidated Financial Statements for details of this acquisition. For the fourth quarter of 2012, operating loss included $1.4 million of acquisition-related expenses and net loss included $1.0 million of gain from bargain purchase of Ericsson's fiber access assets.
|
||||||||||||||||
During the fiscal years ended
December 31, 2013
,
2012
and
2011
, there were no changes in accountants nor any disagreements with accountants on accounting and financial disclosure.
Evaluation of Disclosure Controls and Procedures
As of the end of the period covered by this report, which we refer to as the evaluation date, we carried out an evaluation under the supervision and with the participation of management, including our principle executive officer and principle financial officer, of our disclosure controls and procedures (as defined in Rules 13a-15(e) and 15d-15(e) under the Securities Exchange Act of 1934, as amended).
The purpose of this evaluation was to determine whether as of the evaluation date our disclosure controls and procedures were effective to provide reasonable assurance that the information we are required to disclose in our filings with the Securities and Exchange Commission, (i) is recorded, processed, summarized and reported within the time periods specified in the SEC’s rules and forms and (ii) accumulated and communicated to our management, including our
principal executive officer and our principal financial officer
, as appropriate to allow timely decisions regarding required disclosure. Based upon this evaluation, our
principal executive officer and our
75
principal financial officer
concluded that our disclosure controls and procedures were effective as of the end of the period covered by this report.
Management’s Report on Internal Control Over Financial Reporting
Management is responsible for establishing and maintaining adequate internal control over financial reporting. Our internal control over financial reporting is designed to provide reasonable assurance regarding the reliability of financial reporting and the preparation of financial statements for external purposes in accordance with generally accepted accounting principles. Because of its inherent limitations, internal control over financial reporting may not prevent or detect misstatements. Also, projections of any evaluation of effectiveness to future periods are subject to the risk that controls may become inadequate because of changes in conditions, or that the degree of compliance with the policies or procedures may deteriorate. Management has evaluated the effectiveness of our internal control over financial reporting as of
December 31, 2013
using the criteria set forth in the Internal Control—Integrated Framework issued by the Committee of Sponsoring Organizations of the Treadway Commissi
on
(1992 framework)
("COS
O"). Based on our evaluation, management has concluded that we maintained effective control over financial reporting as of
December 31, 2013
based on the COSO criteria. The effectiveness of our internal control over financial reporting as of
December 31, 2013
has been audited by Ernst & Young, LLP, an independent registered public accounting firm, as stated in their report included in this Annual Report on Form 10-K.
Limitations on the Effectiveness of Controls
Our disclosure controls and procedures provide our
principal executive officer and our principal financial officer
reasonable assurances that our disclosure controls and procedures will achieve their objectives. However, our management, including our
principal executive officer and our principal financial officer
, does not expect that our disclosure controls and procedures or our internal control over financial reporting can or will prevent all human error. A control system, no matter how well designed and implemented, can provide only reasonable, not absolute, assurance that the objectives of the control system are met. Furthermore, the design of a control system must reflect the fact that there are internal resource constraints, and the benefit of controls must be weighed relative to their corresponding costs. Because of the limitations in all control systems, no evaluation of controls can provide complete assurance that all control issues and instances of error, if any, within our company are detected. These inherent limitations include the realities that judgments in decision-making can be faulty, and that breakdowns can occur due to human error or mistake. Additionally, controls, no matter how well designed, could be circumvented by the individual acts of specific persons within the organization. The design of any system of controls is also based in part upon certain assumptions about the likelihood of future events, and there can be no assurance that any design will succeed in achieving its stated objectives under all potential future conditions.
Changes in Internal Control over Financial Reporting
There was no change in our internal control over financial reporting identified in connection with the evaluation required by Rule 13a-15(d) and 15d-15(d) of the Exchange Act that occurred during the period covered by this report that has materially affected, or is reasonably likely to materially affect, our internal control over financial reporting.
76
REPORT OF INDEPENDENT REGISTERED PUBLIC ACCOUNTING FIRM
To the Board of Directors and Stockholders of Calix Inc.
We have audited Calix, Inc.’s internal control over financial reporting as of December 31, 2013, based on criteria established in Internal Control-Integrated Framework issued by the Committee of Sponsoring Organizations of the Treadway Commission (1992 framework) (the COSO criteria). Calix, Inc.’s management is responsible for maintaining effective internal control over financial reporting, and for its assessment of the effectiveness of internal control over financial reporting included in the accompanying Management's Report on Internal Control Over Financial Reporting. Our responsibility is to express an opinion on the company's internal control over financial reporting based on our audit.
We conducted our audit in accordance with the standards of the Public Company Accounting Oversight Board (United States). Those standards require that we plan and perform the audit to obtain reasonable assurance about whether effective internal control over financial reporting was maintained in all material respects. Our audit included obtaining an understanding of internal control over financial reporting, assessing the risk that a material weakness exists, testing and evaluating the design and operating effectiveness of internal control based on the assessed risk, and performing such other procedures as we considered necessary in the circumstances. We believe that our audit provides a reasonable basis for our opinion.
A company's internal control over financial reporting is a process designed to provide reasonable assurance regarding the reliability of financial reporting and the preparation of financial statements for external purposes in accordance with generally accepted accounting principles. A company's internal control over financial reporting includes those policies and procedures that (1) pertain to the maintenance of records that, in reasonable detail, accurately and fairly reflect the transactions and dispositions of the assets of the company; (2) provide reasonable assurance that transactions are recorded as necessary to permit preparation of financial statements in accordance with generally accepted accounting principles, and that receipts and expenditures of the company are being made only in accordance with authorizations of management and directors of the company; and (3) provide reasonable assurance regarding prevention or timely detection of unauthorized acquisition, use, or disposition of the company's assets that could have a material effect on the financial statements.
Because of its inherent limitations, internal control over financial reporting may not prevent or detect misstatements. Also, projections of any evaluation of effectiveness to future periods are subject to the risk that controls may become inadequate because of changes in conditions, or that the degree of compliance with the policies or procedures may deteriorate.
In our opinion, Calix, Inc. maintained, in all material respects, effective internal control over financial reporting as of December 31, 2013, based on the COSO criteria.
We also have audited, in accordance with the standards of the Public Company Accounting Oversight Board (United States), the consolidated balance sheets of Calix, Inc. as of December 31, 2013 and 2012, and the related consolidated statements of comprehensive loss, stockholders' equity, and cash flows for each of the three years in the period ended December 31, 2013, and its financial statement schedule listed in the Index at Item 15(a), and our report dated February 20, 2014 expressed an unqualified opinion thereon.
/s/ Ernst & Young LLP
San Francisco, California
February 20, 2014
77
None.
Information required by this Item 10 relating to our directors is incorporated herein by reference to the information set forth under the captions “Proposal No. 1—Election of Directors” and “Director Compensation” and in other applicable sections of the Proxy Statement for the
2014
Annual Meeting of Stockholders to be filed with the Securities and Exchange Commission pursuant to Regulation 14A of the Exchange Act, or the Proxy Statement, to be filed within 120 days of the end of the fiscal year covered by this Report. Information required by this Item 10 relating to our officers is incorporated herein by reference to the information set forth under the captions “Executive Officers” and “Executive Compensation” and in other applicable sections of the Proxy Statement. Information regarding our Section 16 reporting compliance is incorporated herein by reference to the information set forth under the captions “Security Ownership of Certain Beneficial Owners and Management” and “Section 16(a) Beneficial Ownership Reporting Compliance” of the Proxy Statement.
We have adopted a code of ethics, which applies to all employees, officers and directors of Calix. The Code of Business Conduct and Ethics meets the requirements of a “code of ethics” as defined by Item 406 of Regulation S-K, and applies to our Chief Executive Officer, Chief Accounting Officer (who is both our principal financial and principal accounting officer), as well as all other employees, as indicated above. The Code of Business Conduct and Ethics also meets the requirements of a code of conduct under NYSE listing standards. The Code of Business Conduct and Ethics is posted on our website at www.calix.com under the links “About Calix—Investor Relations—Corporate Governance—Code of Conduct". We intend to disclose any amendments to the Code of Business Conduct and Ethics, as well as any waivers for executive officers or directors, on our website at www.calix.com.
ITEM 11.
Executive Compensation.
Information required by this Item 11 relating to executive compensation and other matters is incorporated herein by reference to the information set forth under the caption “Compensation Discussion and Analysis” and in other applicable sections of the Proxy Statement.
ITEM 12.
Security Ownership of Certain Beneficial Owners and Management and Related Stockholder Matters.
Information required by this Item 12 relating to security ownership of certain beneficial owners and management and related stockholder matters is incorporated herein by reference to the information set forth under the caption “Security Ownership of Certain Beneficial Owners and Management” and in other applicable sections of the Proxy Statement. Information regarding securities authorized for issuance under our equity compensation plans is incorporated herein by reference to the information set forth under the caption “Equity Compensation Plan Information” of the Proxy Statement.
ITEM 13.
Certain Relationships and Related Transactions, and Director Independence.
Information required by this Item 13 relating to certain relationships and related transactions and director independence is incorporated herein by reference to the information set forth under the caption “Certain Relationships and Related Transactions” and in other applicable sections of the Proxy Statement.
Information required by this Item 14 relating to principal account fees and services is incorporated herein by reference to the information set forth under the caption “Principal Accountant Fees and Services” of the Proxy Statement.
78
(a) The following documents are filed as part of this Report:
1. Consolidated Financial Statements
The consolidated financial statements of Calix and the report of independent registered public accounting firm thereon are set forth under Part II, Item 8 of this report.
2. Consolidated Financial Statement Schedules
The following Financial Statement Schedule is filed as part of this Report:
Schedules not listed above have been omitted because they are not applicable or are not required or the information required to be set forth therein is included in the consolidated financial statements and notes thereto.
3. Exhibits.
The following exhibits are filed with or incorporated by reference in this report. Where such filing is made by incorporation by reference to a previously filed registration statement or report, such registration statement or report is identified in parentheses. We will furnish any exhibit upon request to: Calix Investor Relations, David Allen at david.allen@calix.com.
|
Exhibit
|
||
|
Number
|
Description
|
|
|
2.1
|
Agreement and Plan of Merger and Reorganization, dated as of September 16, 2010, by and among Calix, Inc., Ocean Sub I, Inc., Ocean Sub II, LLC, Occam Networks, Inc. (filed as Exhibit 2.1 to Calix’s Registration Statement on Form S-4 originally filed with the Securities and Exchange Commission on November 2, 2010 (File No. 333-170282), as amended by Amendment No. 1 filed December 14, 2010, as amended by Post-Effective Amendment No. 1, filed December 14, 2010 and as amended by Post-Effective Amendment No. 2, filed February 7, 2011 and incorporated by reference herein).
|
|
|
2.2
|
Support Agreement, dated September 16, 2010, by and among Calix, Inc., Ocean Sub I, Inc., Ocean Sub II, LLC and certain stockholders of Occam Networks, Inc. (filed as Exhibit 2.2 to Calix’s Registration Statement on Form S-4 originally filed with the Securities and Exchange Commission on November 2, 2010 (File No. 333-170282), as amended by Amendment No. 1 filed December 14, 2010, as amended by Post-Effective Amendment No. 1, filed December 14, 2010 and as amended by Post-Effective Amendment No. 2, filed February 7, 2011 and incorporated by reference herein).
|
|
|
3.1
|
Amended and Restated Certificate of Incorporation of Calix, Inc. (filed as Exhibit 3.3 to Amendment No. 7 to Calix’s Registration Statement on Form S-1 filed with the Securities and Exchange Commission on March 23, 2010 (File No. 333-163252) and incorporated by reference herein).
|
|
|
3.2
|
Amended and Restated Bylaws of Calix, Inc. (filed as Exhibit 3.5 to Amendment No. 7 to Calix’s Registration Statement on Form S-1 filed with the Securities and Exchange Commission on March 23, 2010 (File No. 333-163252) and incorporated by reference herein).
|
|
|
4.1
|
Form of Calix, Inc.’s Common Stock Certificate (filed as Exhibit 4.1 to Amendment No. 7 to Calix’s Registration Statement on Form S-1 filed with the Securities and Exchange Commission on March 23, 2010 (File No. 333-163252) and incorporated by reference herein).
|
|
|
4.2
|
Amended and Restated Investors’ Rights Agreement, by and between Calix, Inc. and the investors listed on Exhibit A thereto, dated May 29, 2009 (filed as Exhibit 4.2 to Calix’s Registration Statement on Form S-1 filed with the SEC on November 20, 2009 (File No. 333-163252) and incorporated by reference herein).
|
|
|
4.3
|
Warrant to Purchase Stock, between Optical Solutions, Inc. and Silicon Valley Bank, dated August 16, 2004 (filed as Exhibit 4.22 to Calix’s Registration Statement on Form S-1 filed with the SEC on November 20, 2009 (File No. 333-163252) and incorporated by reference herein).
|
|
|
4.4
|
Assignment, between Silicon Valley Bank and Silicon Valley Bancshares, dated August 19, 2004 (filed as Exhibit 4.23 to Calix’s Registration Statement on Form S-1 filed with the SEC on November 20, 2009 (File No. 333-163252) and incorporated by reference herein).
|
|
79
|
Exhibit
|
||
|
Number
|
Description
|
|
|
4.5
|
Warrant to Purchase Stock, between Calix, Inc. and Greater Bay Venture Banking, a division of Greater Bay Bank N.A., dated September 4, 2007 (filed as Exhibit 4.27 to Calix’s Registration Statement on Form S-1 filed with the SEC on November 20, 2009 (File No. 333-163252) and incorporated by reference herein).
|
|
|
10.1*
|
Calix Networks, Inc. Amended and Restated 2000 Stock Plan and related documents (filed as Exhibit 10.1 to Calix’s Registration Statement on Form S-1 filed with the SEC on November 20, 2009 (File No. 333-163252) and incorporated by reference herein).
|
|
|
10.2*
|
Calix Networks, Inc. Amended and Restated 2002 Stock Plan and related documents (filed as Exhibit 10.2 to Amendment No. 6 to Calix’s Registration Statement on Form S-1 filed with the SEC on March 8, 2010 (File No. 333-163252) and incorporated by reference herein).
|
|
|
10.3*
|
Optical Solutions, Inc. Amended and Restated 1997 Long-Term Incentive and Stock Option Plan and related documents (filed as Exhibit 10.3 to Calix’s Registration Statement on Form S-1 filed with the SEC on November 20, 2009 (File No. 333-163252) and incorporated by reference herein).
|
|
|
10.4*
|
Calix, Inc. 2010 Equity Incentive Award Plan and related documents (filed as Exhibit 10.2 to Amendment No. 6 to Calix’s Registration Statement on Form S-1 filed with the SEC on March 8, 2010 (File No. 333-163252) and incorporated by reference herein).
|
|
|
10.5
|
Form of Indemnification Agreement made by and between Calix, Inc. and each of its directors, executive officers and some employees (filed as Exhibit 10.5 to Amendment No. 6 to Calix’s Registration Statement on Form S-1 filed with the SEC on March 8, 2010 (File No. 333-163252) and incorporated by reference herein).
|
|
|
10.6
|
Lease, between RNM Lakeville, LLC and Calix, Inc., dated February 13, 2009 (filed as Exhibit 10.6 to Calix’s Registration Statement on Form S-1 filed with the SEC on November 20, 2009 (File No. 333-163252) and incorporated by reference herein).
|
|
|
10.7
|
Credit Agreement, among Calix, Inc., certain of its subsidiaries, Bank of America, N.A. and the other lenders party thereto, dated July 29, 2013 (filed as Exhibit 10.1 to Calix’s Form 10-Q filed with the SEC on August 6, 2013 (File No. 001-34674) and incorporated by reference herein).
|
|
|
10.8*
|
Offer Letter, between Calix, Inc. and Carl Russo, dated November 1, 2006 (filed as Exhibit 10.8 to Amendment No. 1 to Calix’s Registration Statement on Form S-1 filed with the SEC on December 31, 2009 (File No. 333-163252) and incorporated by reference herein).
|
|
|
10.9*
|
Offer Letter, between Calix, Inc. and Tony Banta, dated August 25, 2005 (filed as Exhibit 10.10 to Amendment No. 1 to Calix’s Registration Statement on Form S-1 filed with the SEC on December 31, 2009 (File No. 333-163252) and incorporated by reference herein).
|
|
|
10.10*
|
Offer Letter, between Calix, Inc. and John Colvin, dated March 3, 2004 (filed as Exhibit 10.11 to Amendment No. 1 to Calix’s Registration Statement on Form S-1 filed with the SEC on December 31, 2009 (File No. 333-163252) and incorporated by reference herein).
|
|
|
10.11*
|
Offer Letter, between Calix, Inc. and Kevin Pope, dated December 21, 2008 (filed as Exhibit 10.12 to Amendment No. 1 to Calix’s Registration Statement on Form S-1 filed with the SEC on December 31, 2009 (File No. 333-163252) and incorporated by reference herein).
|
|
|
10.12*
|
Offer Letter, between Calix, Inc. and Roger Weingarth, dated February 17, 2003, as amended April 13, 2004 (filed as Exhibit 10.13 to Amendment No. 1 to Calix’s Registration Statement on Form S-1 filed with the SEC on December 31, 2009 (File No. 333-163252) and incorporated by reference herein).
|
|
|
10.13*
|
Offer Letter, between Calix, Inc. and Michael Ashby, dated March 7, 2011 (filed as Exhibit 10.2 to Calix’s Form 8-K filed with the SEC on March 7, 2011 (File No. 001-34674) and incorporated by reference herein).
|
|
|
10.14*
|
Employment Agreement, between Calix, Inc. and Andrew Lockhart, dated February 2, 2011 (filed as Exhibit 10.20 to Calix's Form 10-Q filed with the SEC on May 3, 2012 (File No. 001-34674) and incorporated by reference herein).
|
|
|
10.15*
|
Offer Letter, between Calix, Inc. and William Atkins, dated December 21, 2013.
|
|
|
10.16*
|
Transition and Separation Agreement, by and between Michael Ashby and Calix, Inc., dated February 7, 2014.
|
|
|
10.17*
|
Transition and Separation Agreement, by and between Roger Weingarth and Calix, Inc., dated February 6, 2013 (filed as Exhibit 10.26 to Calix's Form 10-K filed with the SEC on February 22, 2013 (File No. 001-34674) and incorporated by reference herein).
|
|
|
10.18*
|
Calix, Inc. Amended And Restated Employee Stock Purchase Plan (Effective as of May 23, 2012) (filed as Exhibit 10.1 to Calix’s Form 10-Q filed with the SEC on August 7, 2012 (File No. 001-34674) and incorporated by reference herein).
|
|
|
10.19*
|
Calix, Inc. Non-Employee Director Equity Compensation Policy, as amended October 18, 2011 and July 25, 2012 (filed as Exhibit 10.2 to Calix’s Form 10-Q filed with the SEC on August 7, 2012 (File No. 001-34674) and incorporated by reference herein).
|
|
|
10.20†
|
Asset Purchase Agreement between Ericsson Inc. and Calix, Inc., dated August 20, 2012 (filed as Exhibit 10.1 to Calix’s Form 10-Q/A filed with the SEC on December 18, 2012 (File No. 001-34674) and incorporated by reference herein).
|
|
|
10.21*
|
Calix, Inc. Non-Employee Director Cash Compensation Policy, effective January 31, 2014.
|
|
|
10.22*
|
Calix, Inc. Non-Employee Director Restricted Stock Unit Deferred Compensation Plan, effective January 1, 2013 (filed as Exhibit 10.22 to Calix's Form 10-K filed with the SEC on February 22, 2013 (File No. 001-34674) and incorporated by reference herein).
|
|
|
10.23*
|
Calix, Inc. Management Bonus Program Under the 2010 Equity Incentive Award Plan (filed as Exhibit 10.1 to Calix's Form 8-K filed with the SEC on February 28, 2012 (File No. 001-34674) and incorporated by reference herein).
|
|
80
|
Exhibit
|
||
|
Number
|
Description
|
|
|
10.24*
|
Calix, Inc. Long Term Incentive Program Under the 2010 Equity Incentive Award Plan (filed as Exhibit 10.2 to Calix's Form 8-K filed with the SEC on February 28, 2012 (File No. 001-34674) and incorporated by reference herein).
|
|
|
10.25
|
First Amendment to Lease, by and between 1031, 1035, 1039 North McDowell, LLC and Calix, Inc., effective January 28, 2013 (filed as Exhibit 10.25 to Calix's Form 10-K filed with the SEC on February 22, 2013 (File No. 001-34674) and incorporated by reference herein).
|
|
|
21.1
|
Subsidiaries of the Registrant.
|
|
|
23.1
|
Consent of Ernst & Young LLP, independent registered public accounting firm.
|
|
|
24.1
|
Power of Attorney (included on signature page to this Annual Report on Form 10-K).
|
|
|
31.1
|
Certification of Principle Executive Officer of Calix, Inc. Pursuant to Rule 13a-14(a) of the Securities Exchange Act of 1934.
|
|
|
31.2
|
Certification of Principle Financial Officer of Calix, Inc. Pursuant to Rule 13a-14(a) of the Securities Exchange Act of 1934.
|
|
|
32.1
|
Certification of Principle Executive Officer and Principle Financial Officer of Calix, Inc. Pursuant to 18 U.S.C. Section 1350, as adopted pursuant to Section 906 of the Sarbanes-Oxley Act of 2002.
|
|
|
101.INS
|
XBRL Instance Document.
|
|
|
101.SCH
|
XBRL Taxonomy Extension Schema Document.
|
|
|
101.CAL
|
XBRL Taxonomy Extension Calculation Linkbase Document.
|
|
|
101.DEF
|
XBRL Taxonomy Extension Definition Linkbase Document.
|
|
|
101.LAB
|
XBRL Taxonomy Extension Label Linkbase Document.
|
|
|
101.PRE
|
XBRL Taxonomy Extension Presentation Linkbase Document.
|
|
|
*
|
Indicates management contract or compensatory plan or arrangement.
|
|
|
†
|
Confidential treatment has been granted as to certain portions of this agreement.
|
|
81
SIGNATURES
Pursuant to the requirements of the Securities Exchange Act of 1934, the Registrant has duly caused this report to be signed on its behalf by the undersigned thereunto duly authorized.
|
|
CALIX, INC.
(Registrant)
|
|||
|
Dated:
|
February 20, 2014
|
By:
|
/s/ Carl Russo
|
|
|
|
Carl Russo
|
|||
|
|
Chief Executive Officer
(Principal Executive Officer)
|
|||
|
Dated:
|
February 20, 2014
|
By:
|
/s/ Michael Ashby
|
|
|
|
Michael Ashby
|
|||
|
|
Chief Accounting Officer
(Principal Financial and Accounting Officer)
|
|||
POWER OF ATTORNEY
Each person whose individual signature appears below hereby authorizes and appoints Carl Russo and Michael Ashby, and each of them, with full power of substitution and re-substitution and full power to act without the other, as his true and lawful attorney-in-fact and agent to act in his name, place and stead and to execute in the name and on behalf of each person, individually and in each capacity stated below, and to file any and all amendments to this Annual Report on Form 10-K, and to file the same, with all exhibits thereto, and other documents in connection therewith, with the Securities and Exchange Commission, granting unto said attorneys-in-fact and agents, and each of them, full power and authority to do and perform each and every act and thing, ratifying and confirming all that said attorneys-in-fact and agents or any of them or their or his substitute or substitutes may lawfully do or cause to be done by virtue thereof.
Pursuant to the requirements of the Securities Exchange Act of 1934, this report has been signed below by the following persons on behalf of the registrant and in the capacities indicated on
February 20, 2014
.
|
Signature
|
Title
|
Date
|
||
|
/s/ Carl Russo
|
|
Chief Executive Officer and Director
(Principal Executive Officer)
|
|
February 20, 2014
|
|
Carl Russo
|
|
|
||
|
/s/ Michael Ashby
|
|
Chief Accounting Officer
(Principal Financial and Accounting Officer)
|
|
February 20, 2014
|
|
Michael Ashby
|
|
|
||
|
/s/ Don Listwin
|
|
Chairman of the Board of Directors
|
|
February 20, 2014
|
|
Don Listwin
|
|
|
||
|
/s/ Michael Everett
|
|
Director
|
|
February 20, 2014
|
|
Michael Everett
|
|
|
||
|
/s/ Michael Flynn
|
|
Director
|
|
February 20, 2014
|
|
Michael Flynn
|
|
|
||
|
/s/ Adam Grosser
|
|
Director
|
|
February 20, 2014
|
|
Adam Grosser
|
|
|
||
|
/s/ Michael Matthews
|
|
Director
|
|
February 20, 2014
|
|
Michael Matthews
|
|
|
||
|
/s/ Thomas Pardun
|
|
Director
|
|
February 20, 2014
|
|
Thomas Pardun
|
|
|
||
82
Schedule II. Valuation and Qualifying Accounts
|
Additions
|
||||||||||||||||
|
Charged to
|
||||||||||||||||
|
Balance
|
Costs or
|
Deductions
|
||||||||||||||
|
At Beginning
|
Expenses or
|
and Write
|
Balance At
|
|||||||||||||
|
of Year
|
Revenue
|
Offs
|
End of Year
|
|||||||||||||
|
(In thousands)
|
||||||||||||||||
|
Year ended December 31, 2013
|
||||||||||||||||
|
Allowance for doubtful accounts
|
$
|
421
|
|
$
|
(13
|
)
|
$
|
(50
|
)
|
$
|
358
|
|
||||
|
Product return reserve
|
1,740
|
|
3,535
|
|
(4,511
|
)
|
764
|
|
||||||||
|
Year ended December 31, 2012
|
||||||||||||||||
|
Allowance for doubtful accounts
|
$
|
402
|
|
$
|
112
|
|
$
|
(93
|
)
|
$
|
421
|
|
||||
|
Product return reserve
|
835
|
|
5,474
|
|
(4,569
|
)
|
1,740
|
|
||||||||
|
Year ended December 31, 2011
|
||||||||||||||||
|
Allowance for doubtful accounts
|
$
|
617
|
|
$
|
130
|
|
$
|
(345
|
)
|
$
|
402
|
|
||||
|
Product return reserve
|
551
|
|
4,996
|
|
(4,712
|
)
|
835
|
|
||||||||
83
EXHIBIT INDEX
|
Exhibit
|
||
|
Number
|
Description
|
|
|
2.1
|
Agreement and Plan of Merger and Reorganization, dated as of September 16, 2010, by and among Calix, Inc., Ocean Sub I, Inc., Ocean Sub II, LLC, Occam Networks, Inc. (filed as Exhibit 2.1 to Calix’s Registration Statement on Form S-4 originally filed with the Securities and Exchange Commission on November 2, 2010 (File No. 333-170282), as amended by Amendment No. 1 filed December 14, 2010, as amended by Post-Effective Amendment No. 1, filed December 14, 2010 and as amended by Post-Effective Amendment No. 2, filed February 7, 2011 and incorporated by reference herein).
|
|
|
2.2
|
Support Agreement, dated September 16, 2010, by and among Calix, Inc., Ocean Sub I, Inc., Ocean Sub II, LLC and certain stockholders of Occam Networks, Inc. (filed as Exhibit 2.2 to Calix’s Registration Statement on Form S-4 originally filed with the Securities and Exchange Commission on November 2, 2010 (File No. 333-170282), as amended by Amendment No. 1 filed December 14, 2010, as amended by Post-Effective Amendment No. 1, filed December 14, 2010 and as amended by Post-Effective Amendment No. 2, filed February 7, 2011 and incorporated by reference herein).
|
|
|
3.1
|
Amended and Restated Certificate of Incorporation of Calix, Inc. (filed as Exhibit 3.3 to Amendment No. 7 to Calix’s Registration Statement on Form S-1 filed with the Securities and Exchange Commission on March 23, 2010 (File No. 333-163252) and incorporated by reference herein).
|
|
|
3.2
|
Amended and Restated Bylaws of Calix, Inc. (filed as Exhibit 3.5 to Amendment No. 7 to Calix’s Registration Statement on Form S-1 filed with the Securities and Exchange Commission on March 23, 2010 (File No. 333-163252) and incorporated by reference herein).
|
|
|
4.1
|
Form of Calix, Inc.’s Common Stock Certificate (filed as Exhibit 4.1 to Amendment No. 7 to Calix’s Registration Statement on Form S-1 filed with the Securities and Exchange Commission on March 23, 2010 (File No. 333-163252) and incorporated by reference herein).
|
|
|
4.2
|
Amended and Restated Investors’ Rights Agreement, by and between Calix, Inc. and the investors listed on Exhibit A thereto, dated May 29, 2009 (filed as Exhibit 4.2 to Calix’s Registration Statement on Form S-1 filed with the SEC on November 20, 2009 (File No. 333-163252) and incorporated by reference herein).
|
|
|
4.3
|
Warrant to Purchase Stock, between Optical Solutions, Inc. and Silicon Valley Bank, dated August 16, 2004 (filed as Exhibit 4.22 to Calix’s Registration Statement on Form S-1 filed with the SEC on November 20, 2009 (File No. 333-163252) and incorporated by reference herein).
|
|
|
4.4
|
Assignment, between Silicon Valley Bank and Silicon Valley Bancshares, dated August 19, 2004 (filed as Exhibit 4.23 to Calix’s Registration Statement on Form S-1 filed with the SEC on November 20, 2009 (File No. 333-163252) and incorporated by reference herein).
|
|
|
4.5
|
Warrant to Purchase Stock, between Calix, Inc. and Greater Bay Venture Banking, a division of Greater Bay Bank N.A., dated September 4, 2007 (filed as Exhibit 4.27 to Calix’s Registration Statement on Form S-1 filed with the SEC on November 20, 2009 (File No. 333-163252) and incorporated by reference herein).
|
|
|
10.1*
|
Calix Networks, Inc. Amended and Restated 2000 Stock Plan and related documents (filed as Exhibit 10.1 to Calix’s Registration Statement on Form S-1 filed with the SEC on November 20, 2009 (File No. 333-163252) and incorporated by reference herein).
|
|
|
10.2*
|
Calix Networks, Inc. Amended and Restated 2002 Stock Plan and related documents (filed as Exhibit 10.2 to Amendment No. 6 to Calix’s Registration Statement on Form S-1 filed with the SEC on March 8, 2010 (File No. 333-163252) and incorporated by reference herein).
|
|
|
10.3*
|
Optical Solutions, Inc. Amended and Restated 1997 Long-Term Incentive and Stock Option Plan and related documents (filed as Exhibit 10.3 to Calix’s Registration Statement on Form S-1 filed with the SEC on November 20, 2009 (File No. 333-163252) and incorporated by reference herein).
|
|
|
10.4*
|
Calix, Inc. 2010 Equity Incentive Award Plan and related documents (filed as Exhibit 10.2 to Amendment No. 6 to Calix’s Registration Statement on Form S-1 filed with the SEC on March 8, 2010 (File No. 333-163252) and incorporated by reference herein).
|
|
|
10.5
|
Form of Indemnification Agreement made by and between Calix, Inc. and each of its directors, executive officers and some employees (filed as Exhibit 10.5 to Amendment No. 6 to Calix’s Registration Statement on Form S-1 filed with the SEC on March 8, 2010 (File No. 333-163252) and incorporated by reference herein).
|
|
|
10.6
|
Lease, between RNM Lakeville, LLC and Calix, Inc., dated February 13, 2009 (filed as Exhibit 10.6 to Calix’s Registration Statement on Form S-1 filed with the SEC on November 20, 2009 (File No. 333-163252) and incorporated by reference herein).
|
|
|
10.7
|
Credit Agreement, among Calix, Inc., certain of its subsidiaries, Bank of America, N.A. and the other lenders party thereto, dated July 29, 2013 (filed as Exhibit 10.1 to Calix’s Form 10-Q filed with the SEC on August 6, 2013 (File No. 001-34674) and incorporated by reference herein).
|
|
|
10.8*
|
Offer Letter, between Calix, Inc. and Carl Russo, dated November 1, 2006 (filed as Exhibit 10.8 to Amendment No. 1 to Calix’s Registration Statement on Form S-1 filed with the SEC on December 31, 2009 (File No. 333-163252) and incorporated by reference herein).
|
|
|
10.9*
|
Offer Letter, between Calix, Inc. and Tony Banta, dated August 25, 2005 (filed as Exhibit 10.10 to Amendment No. 1 to Calix’s Registration Statement on Form S-1 filed with the SEC on December 31, 2009 (File No. 333-163252) and incorporated by reference herein).
|
|
|
10.10*
|
Offer Letter, between Calix, Inc. and John Colvin, dated March 3, 2004 (filed as Exhibit 10.11 to Amendment No. 1 to Calix’s Registration Statement on Form S-1 filed with the SEC on December 31, 2009 (File No. 333-163252) and incorporated by reference herein).
|
|
84
|
Exhibit
|
||
|
Number
|
Description
|
|
|
10.11*
|
Offer Letter, between Calix, Inc. and Kevin Pope, dated December 21, 2008 (filed as Exhibit 10.12 to Amendment No. 1 to Calix’s Registration Statement on Form S-1 filed with the SEC on December 31, 2009 (File No. 333-163252) and incorporated by reference herein).
|
|
|
10.12*
|
Offer Letter, between Calix, Inc. and Roger Weingarth, dated February 17, 2003, as amended April 13, 2004 (filed as Exhibit 10.13 to Amendment No. 1 to Calix’s Registration Statement on Form S-1 filed with the SEC on December 31, 2009 (File No. 333-163252) and incorporated by reference herein).
|
|
|
10.13*
|
Offer Letter, between Calix, Inc. and Michael Ashby, dated March 7, 2011 (filed as Exhibit 10.2 to Calix’s Form 8-K filed with the SEC on March 7, 2011 (File No. 001-34674) and incorporated by reference herein).
|
|
|
10.14*
|
Employment Agreement, between Calix, Inc. and Andrew Lockhart, dated February 2, 2011 (filed as Exhibit 10.20 to Calix's Form 10-Q filed with the SEC on May 3, 2012 (File No. 001-34674) and incorporated by reference herein).
|
|
|
10.15*
|
Offer Letter, between Calix, Inc. and William Atkins, dated December 21, 2013.
|
|
|
10.16*
|
Transition and Separation Agreement, by and between Michael Ashby and Calix, Inc., dated February 7, 2014.
|
|
|
10.17*
|
Transition and Separation Agreement, by and between Roger Weingarth and Calix, Inc., dated February 6, 2013 (filed as Exhibit 10.26 to Calix's Form 10-K filed with the SEC on February 22, 2013 (File No. 001-34674) and incorporated by reference herein).
|
|
|
10.18*
|
Calix, Inc. Amended And Restated Employee Stock Purchase Plan (Effective as of May 23, 2012) (filed as Exhibit 10.1 to Calix’s Form 10-Q filed with the SEC on August 7, 2012 (File No. 001-34674) and incorporated by reference herein).
|
|
|
10.19*
|
Calix, Inc. Non-Employee Director Equity Compensation Policy, as amended October 18, 2011 and July 25, 2012 (filed as Exhibit 10.2 to Calix’s Form 10-Q filed with the SEC on August 7, 2012 (File No. 001-34674) and incorporated by reference herein).
|
|
|
10.20†
|
Asset Purchase Agreement between Ericsson Inc. and Calix, Inc., dated August 20, 2012 (filed as Exhibit 10.1 to Calix’s Form 10-Q/A filed with the SEC on December 18, 2012 (File No. 001-34674) and incorporated by reference herein).
|
|
|
10.21*
|
Calix, Inc. Non-Employee Director Cash Compensation Policy, effective January 31, 2014.
|
|
|
10.22*
|
Calix, Inc. Non-Employee Director Restricted Stock Unit Deferred Compensation Plan, effective January 1, 2013 (filed as Exhibit 10.22 to Calix's Form 10-K filed with the SEC on February 22, 2013 (File No. 001-34674) and incorporated by reference herein).
|
|
|
10.23*
|
Calix, Inc. Management Bonus Program Under the 2010 Equity Incentive Award Plan (filed as Exhibit 10.1 to Calix's Form 8-K filed with the SEC on February 28, 2012 (File No. 001-34674) and incorporated by reference herein).
|
|
|
10.24*
|
Calix, Inc. Long Term Incentive Program Under the 2010 Equity Incentive Award Plan (filed as Exhibit 10.2 to Calix's Form 8-K filed with the SEC on February 28, 2012 (File No. 001-34674) and incorporated by reference herein).
|
|
|
10.25
|
First Amendment to Lease, by and between 1031, 1035, 1039 North McDowell, LLC and Calix, Inc., effective January 28, 2013 (filed as Exhibit 10.25 to Calix's Form 10-K filed with the SEC on February 22, 2013 (File No. 001-34674) and incorporated by reference herein).
|
|
|
21.1
|
Subsidiaries of the Registrant.
|
|
|
23.1
|
Consent of Ernst & Young LLP, independent registered public accounting firm.
|
|
|
24.1
|
Power of Attorney (included on signature page to this Annual Report on Form 10-K).
|
|
|
31.1
|
Certification of Principle Executive Officer of Calix, Inc. Pursuant to Rule 13a-14(a) of the Securities Exchange Act of 1934.
|
|
|
31.2
|
Certification of Principle Financial Officer of Calix, Inc. Pursuant to Rule 13a-14(a) of the Securities Exchange Act of 1934.
|
|
|
32.1
|
Certification of Principle Executive Officer and Principle Financial Officer of Calix, Inc. Pursuant to 18 U.S.C. Section 1350, as adopted pursuant to Section 906 of the Sarbanes-Oxley Act of 2002.
|
|
|
101.INS
|
XBRL Instance Document.
|
|
|
101.SCH
|
XBRL Taxonomy Extension Schema Document.
|
|
|
101.CAL
|
XBRL Taxonomy Extension Calculation Linkbase Document.
|
|
|
101.DEF
|
XBRL Taxonomy Extension Definition Linkbase Document.
|
|
|
101.LAB
|
XBRL Taxonomy Extension Label Linkbase Document.
|
|
|
101.PRE
|
XBRL Taxonomy Extension Presentation Linkbase Document.
|
|
|
*
|
Indicates management contract or compensatory plan or arrangement.
|
|
|
†
|
Confidential treatment has been granted as to certain portions of this agreement.
|
|
85
TABLE OF CONTENTS
Part IItem 1. BusinessItem 1A. Risk FactorsItem 1B. Unresolved Staff CommentsItem 2. PropertiesItem 3. Legal ProceedingsItem 4. Mine Safety DisclosuresPart IIItem 5. Market For Registrant S Common Equity, Related Stockholder Matters and Issuer Purchases Of Equity SecuritiesItem 6. Selected Financial DataItem 7. Management S Discussion and Analysis Of Financial Condition and Results Of OperationsItem 7A. Quantitative and Qualitative Disclosures About Market RiskItem 8. Financial Statements and Supplementary DataItem 9. Changes in and Disagreements with Accountants on Accounting and Financial DisclosureItem 9A. Controls and ProceduresItem 9B. Other InformationPart IIIItem 10. Directors, Executive Officers and Corporate GovernanceItem 11. Executive CompensationItem 12. Security Ownership Of Certain Beneficial Owners and Management and Related Stockholder MattersItem 13. Certain Relationships and Related Transactions, and Director IndependenceItem 14. Principal Accountant Fees and ServicesPart IVItem 15. Exhibits, Financial Statement Schedules