META FINANCIAL GROUP INC
10-Ks and 10-Qs
|
|
|
|
|
|
|
|
|
|
|
|
|
|
|
|
|
|
|
|
|
|
|
|
|
|
|
|
|
|
|
|
|
|
|
|
|
|
|
|
|
|
|
|
|
|
|
|
|
|
|
|
|
|
|
|
|
|
|
UNITED STATES
SECURITIES AND EXCHANGE COMMISSION
Washington, D.C. 20549
FORM 10‑K
|
☒
|
ANNUAL REPORT PURSUANT TO SECTION 13 OR 15(d) OF THE SECURITIES EXCHANGE ACT OF 1934
|
For the fiscal year ended
September 30, 2018
OR
|
☐
|
TRANSITION REPORT PURSUANT TO SECTION 13 OR 15(d) OF THE SECURITIES EXCHANGE ACT OF 1934
|
For the transition period from _______ to _______
Commission file number 0‑22140.

|
META FINANCIAL GROUP, INC.
®
|
|
(Name of Registrant as specified in its charter)
|
|
Delaware
|
|
42‑1406262
|
|
(State or other jurisdiction of incorporation or organization)
|
|
(I.R.S. Employer Identification No.)
|
|
5501 South Broadband Lane, Sioux Falls, SD
|
|
57108
|
|
(Address of principal executive offices)
|
|
(Zip Code)
|
Registrant’s telephone number: (605) 782-1767
Securities Registered Pursuant to Section 12(b) of the Act:
|
Title of Class
|
|
Name of each exchange on which registered
|
|
Common Stock, par value $0.01 per share
|
|
NASDAQ Global Market
|
Securities Registered Pursuant to Section 12(g) of the Act: None
Indicate by check mark if the Registrant is a well‑known seasoned issuer, as defined in Rule 405 of the Securities Act. YES ☐ NO ☒
Indicate by check mark if the Registrant is not required to file reports pursuant Section 13 and Section 15(d) of the Act. YES ☐ NO ☒
Indicate by check mark whether the Registrant (1) has filed all reports required to be filed by Section 13 or 15(d) of the Securities Exchange Act of 1934 during the preceding 12 months (or for such shorter period that the Registrant was required to file such reports), and (2) has been subject to such filing requirements for the past 90 days. YES ☒ NO ☐
Indicate by check mark whether the Registrant has submitted electronically and posted on its corporate Web site, if any, every Interactive Data File required to be submitted and posted pursuant to Rule 405 of Regulation S‑T during the preceding 12 months (or for such shorter period that the Registrant was required to submit and post such files). YES ☒ NO☐.
Indicate by check mark if disclosure of delinquent filers pursuant to Item 405 of Regulation S‑K is not contained herein, and will not be contained, to the best of Registrant’s knowledge, in definitive proxy or information statements incorporated by reference in Part III of this Form 10‑K or any amendment to this Form 10‑K.☐
Indicate by check mark whether the Registrant is a large accelerated filer, an accelerated filer, a non‑accelerated filer, smaller reporting company, or an emerging growth company. (Check one):
|
Large accelerated filer ☒
|
Accelerated filer ☐
|
Non‑accelerated filer ☐
|
Smaller Reporting Company ☐
|
|
Emerging growth company ☐
|
|||
If an emerging growth company, indicate by check mark if the registrant has elected not to use the extended transition period for complying with any new or revised financial accounting standard provided pursuant to Section 13(a) of the Exchange Act. ☐
Indicate by check mark whether the Registrant is a shell company (as defined in Rule 12b‑2 of the Exchange Act). ☐ YES ☒ NO
As of March 31, 2018, the aggregate market value of the voting stock held by non-affiliates of the Registrant, computed by reference to the average of the closing bid and asked prices of such stock on the NASDAQ Global Market as of such date, was $979.7 million.
As of
November 26, 2018
, there were
39,406,938
shares of the Registrant’s Common Stock outstanding.
DOCUMENTS INCORPORATED BY REFERENCE
PART III of Form 10-K -- Portions of the Proxy Statement for the Annual Meeting of Stockholders to be held
January 30, 2019
are incorporated by reference into Part III of this report.
META FINANCIAL GROUP, INC.
FORM 10-K
Table of Contents
|
|
|
Page
No.
|
|
|
|
|
|
|
PART I
|
|
|
|
|
|
|
Item 1.
|
||
|
Item 1A.
|
||
|
Item 1B.
|
||
|
Item 2.
|
||
|
Item 3.
|
||
|
Item 4.
|
||
|
|
|
|
|
|
PART II
|
|
|
|
|
|
|
Item 5.
|
||
|
Item 6.
|
||
|
Item 7.
|
||
|
Item 7A.
|
||
|
Item 8.
|
||
|
Item 9.
|
||
|
Item 9A.
|
||
|
Item 9B.
|
||
|
|
|
|
|
|
PART III
|
|
|
|
|
|
|
Item 10.
|
||
|
Item 11.
|
||
|
Item 12.
|
||
|
Item 13.
|
||
|
Item 14.
|
||
|
|
|
|
|
|
PART IV
|
|
|
|
|
|
|
Item 15.
|
||
|
Item 16.
|
||
i
Forward-Looking Statements
Meta Financial Group, Inc.® (“Meta” or “the Company” or “us”) and its wholly-owned subsidiary, MetaBank® (the “Bank” or “MetaBank”), may from time to time make written or oral “forward-looking statements,” including statements contained in this Annual Report on Form 10-K, in its other filings with the Securities and Exchange Commission (“SEC”), in its reports to stockholders, and in other communications by the Company and the Bank, which are made in good faith by the Company pursuant to the “safe harbor” provisions of the Private Securities Litigation Reform Act of 1995.
You can identify forward-looking statements by words such as “may,” “hope,” “will,” “should,” “expect,” “plan,” “anticipate,” “intend,” “believe,” “estimate,” “predict,” “potential,” “continue,” “could,” “future,” or the negative of those terms, or other words of similar meaning or similar expressions. You should carefully read statements that contain these words because they discuss our future expectations or state other “forward-looking” information. These forward-looking statements are based on information currently available to us and assumptions about future events, and include statements with respect to the Company’s beliefs, expectations, estimates, and intentions, which are subject to significant risks and uncertainties, and are subject to change based on various factors, some of which are beyond the Company’s control. Such risks, uncertainties and other factors may cause our actual growth, results of operations, financial condition, cash flows, performance and business prospects and opportunities to differ materially from those expressed in, or implied by, these forward-looking statements. Such statements address, among others, the following subjects: future operating results; customer retention; loan and other product demand; important components of the Company's statements of financial condition and operations; growth and expansion; new products and services, such as those offered by the Bank or the Company's Payments divisions (which includes Meta Payment Systems (“MPS”), Refund Advantage, EPS Financial (“EPS”) and Specialty Consumer Services (“SCS”)); credit quality and adequacy of reserves; technology; and the Company's employees. The following factors, among others, could cause the Company's financial performance and results of operations to differ materially from the expectations, estimates, and intentions expressed in such forward-looking statements: the risk that we are unable to recoup a significant portion of the lost earnings associated with the non-renewal of the agreement with H&R Block through agreements with new tax partners and expanded relationships with existing tax partners; the risk that loan production levels and other anticipated benefits related to the agreement with Jackson Hewitt Tax Service®, as extended, may not be as much as anticipated; risks relating to the recently-announced management transition; maintaining our executive management team; the expected growth opportunities, beneficial synergies and/or operating efficiencies from the Crestmark acquisition may not be fully realized or may take longer to realize than expected; customer losses and business disruption related to the Crestmark acquisition; unanticipated or unknown losses and liabilities may be incurred by the Company following the completion of the Crestmark acquisition; the strength of the United States' economy, in general, and the strength of the local economies in which the Company conducts operations; the effects of, and changes in, trade, monetary, and fiscal policies and laws, including interest rate policies of the Board of Governors of the Federal Reserve System (the “Federal Reserve”), as well as efforts of the U.S. Congress, United States Treasury in conjunction with bank regulatory agencies to stimulate the economy and protect the financial system; inflation, interest rate, market, and monetary fluctuations; the timely and efficient development of, and acceptance of new products and services offered by the Company or its strategic partners, as well as risks (including reputational and litigation) attendant thereto, and the perceived overall value of these products and services by users; the risks of dealing with or utilizing third parties, including, in connection with the Company’s refund advance business, the risk of reduced volume of refund advance loans as a result of reduced customer demand for or acceptance of usage of Meta’s strategic partners’ refund advance products; any actions which may be initiated by our regulators in the future; the impact of changes in financial services laws and regulations, including, but not limited to, laws and regulations relating to the tax refund industry and the insurance premium finance industry, our relationship with our primary regulators, the Office of the Comptroller of the Currency and the Federal Reserve, as well as the Federal Deposit Insurance Corporation which insures the Bank’s deposit accounts up to applicable limits; technological changes, including, but not limited to, the protection of electronic files or databases; acquisitions; litigation risk, in general, including, but not limited to, those risks involving the Bank's divisions; the growth of the Company’s business, as well as expenses related thereto; continued maintenance by the Bank of its status as a well-capitalized institution, particularly in light of our growing deposit base, a portion of which has been characterized as “brokered”; changes in consumer spending and saving habits; and the success of the Company at maintaining its high quality asset level and managing and collecting assets of borrowers in default should problem assets increase.
These statements are based on information currently available to us and are subject to various risks, uncertainties, and other factors, including, but not limited to, those discussed herein under the caption “Risk Factors” that could cause our actual growth, results of operations, financial condition, cash flows, performance and business prospects and opportunities to differ materially from those expressed in, or implied by, these statements.
2
The foregoing list of factors is not exclusive. We caution you not to place undue reliance on these forward-looking statements, which speak only as of the date of this report. All subsequent written and oral forward-looking statements attributable to us or any person acting on our behalf are expressly qualified in their entirety by the cautionary statements contained or referred to in this section. Additional discussions of factors affecting the Company’s business and prospects are contained herein, including under the caption “Risk Factors,” and in the Company’s periodic filings with the SEC. The Company expressly disclaims any intent or obligation to update any forward-looking statements, whether written or oral, that may be made from time to time by or on behalf of the Company or its subsidiaries.
Item 1.
Business
GENERAL
Meta, a registered unitary savings and loan holding company, was incorporated in Delaware on June 14, 1993, the principal assets of which are all the issued and outstanding shares of the Bank, a federal savings bank, the accounts of which are insured up to applicable limits by the Federal Deposit Insurance Corporation ("FDIC") as administrator of the Deposit Insurance Fund (“DIF”). Unless the context otherwise requires, references herein to the Company include Meta and the Bank, and all subsidiaries of Meta, direct or indirect, on a consolidated basis.
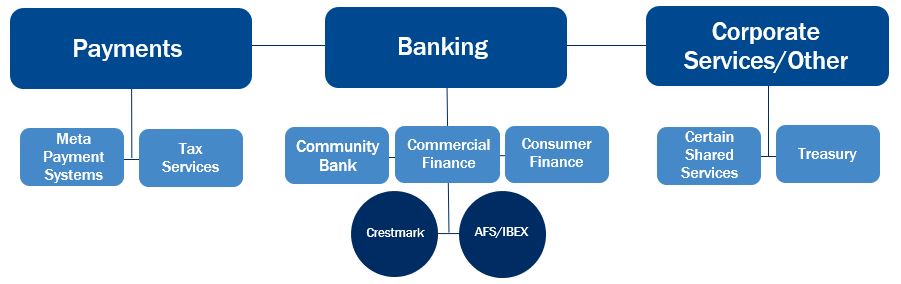
The Bank, a wholly-owned full-service banking subsidiary of Meta, operates through three reportable segments (Payments, Banking, and Corporate Services/Other). The diagram below reflects the Company's divisions and how they fall within the Company's segment structure. The Company works with high-value niche industries, strategic-growth companies and technology adopters to grow their businesses and build more profitable customer relationships. The Company tailors solutions for bank and non-bank businesses, and provides a focused collaborative approach.
The business of the Bank consists of attracting deposits and investing those funds in its National Lending and Community Banking loan and lease portfolios. In addition to originating loans and leases, the Bank also occasionally contracts to sell loans, such as tax refund advance loans and government guaranteed loans, to third party buyers. The Bank also sells and purchases loan participations from time to time to and from other financial institutions, as well as mortgage-backed securities ("MBS") and other investments permissible under applicable regulations.
In addition to its lending and deposit gathering activities, the Bank’s divisions issue prepaid cards, design innovative consumer credit products, sponsor automated teller machines (“ATMs”) into various debit networks, and offer tax refund-transfer services and other payment industry products and services. Through its activities, the Meta Payment Systems (“MPS”) division generates both fee income and low- and no cost deposits for the Bank.
3
On September 8, 2015, the Bank purchased substantially all of the assets and related liabilities of Fort Knox Financial Services Corporation and its subsidiary, Tax Product Services, LLC (together “Refund Advantage”). The assets acquired by the Bank in the acquisition include the Fort Knox operating platform and trade name, Refund Advantage®, and other assets. On November 1, 2016, the Bank purchased substantially all of the assets and certain liabilities of EPS Financial, LLC ("EPS") from privately held Drake Enterprises, Ltd. ("Drake"). The assets acquired by the Bank in the EPS acquisition include the EPS trade name, operating platform, and other assets. On December 14, 2016, the Bank purchased substantially all of the assets and specified liabilities of privately-held Specialty Consumer Services LP ("SCS") relating to its consumer lending and tax advance business. All of these transactions expanded the Company’s business into providing tax refund-transfer and lending services for its customers. On August 1, 2018, the Company completed the acquisition of Crestmark Bancorp, Inc. ("Crestmark") and its Michigan state-charted bank subsidiary, Crestmark Bank (the "Crestmark Acquisition"). Through its Crestmark division, the Bank provides business-to-business commercial financing.
First Midwest Financial Capital Trust I, also a wholly-owned subsidiary of the Company, was established in July 2001 for the purpose of issuing trust preferred securities.
Through the Crestmark Acquisition, the Company acquired floating rate capital securities due to Crestmark Capital Trust I, a 100%-owned nonconsolidated subsidiary of the Company.
In April 2017, the Company formed a new entity, Meta Capital, LLC ("Meta Capital"), that is a wholly-owned service corporation subsidiary of MetaBank. Meta Capital was formed for the purpose of making minority equity investments. Meta Capital focuses on investing in companies in the financial services industry.
The Company is subject to comprehensive regulation and supervision. See “Regulation” herein.
The principal executive office of the Company is located at 5501 South Broadband Lane, Sioux Falls, South Dakota 57108. Its telephone number at that address is (605) 782-1767.
MARKET AREAS
The MPS, Refund Advantage, EPS and SCS divisions operate out of Sioux Falls, South Dakota, with offices in Louisville, Kentucky, Easton, Pennsylvania and Hurst, Texas. AFS/IBEX operates out of its headquarters in Dallas, Texas with other offices throughout the country. Crestmark operates out of its headquarters in Troy, Michigan, with other offices throughout the country. The community bank’s locations and primary market areas include 10 branch offices in Storm Lake, Iowa, Brookings, South Dakota, Sioux Falls, South Dakota and the Des Moines, Iowa area.
4
LENDING ACTIVITIES
General
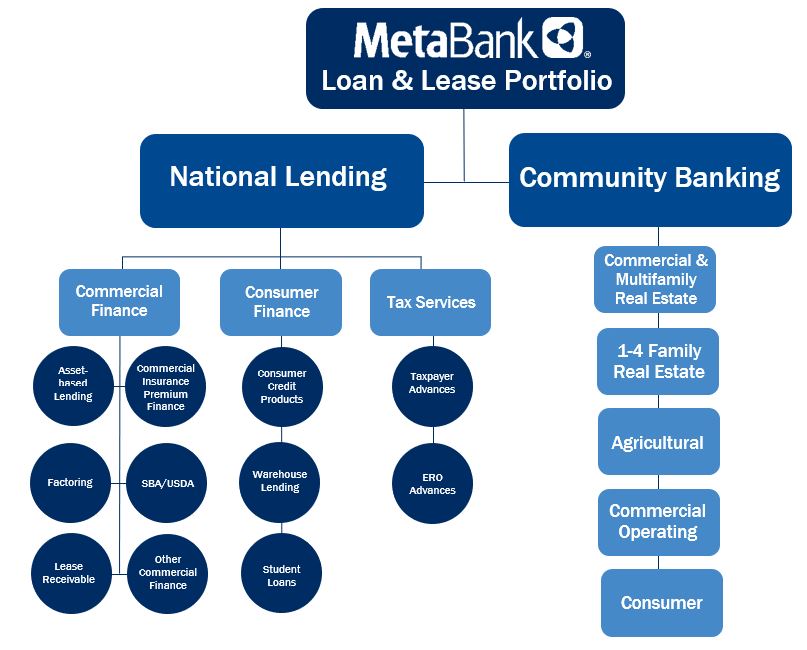
The diagram below shows the composition of the Company's lending portfolio by loan type. The Company emphasizes credit quality and seeks to avoid undue concentrations of loans and leases to a single industry or based on a single class of collateral. The Company has established lending policies that include a number of underwriting factors that it considers in making a loan, including loan-to-value ratio, cash flow, interest rate and credit history of the borrower.
5
The Company has recently focused its lending activities on the origination of commercial finance loans, commercial and multi-family real estate loans, one-to-four family mortgage loans, consumer finance loans and taxpayer advance loans. The Company also continues to originate traditional commercial operating loans, consumer loans and agricultural-related loans. The Company originates most of its community banking loans in its primary market areas. At
September 30, 2018
, the Company’s loans and leases receivable, net of allowance for loan and lease losses, totaled
$2.93 billion
, or
50%
of the Company’s total assets, as compared to
$1.32 billion
, or
25%
, at
September 30, 2017
. The Bank signed an agreement extension in August 2017 to originate taxpayer advance loans to customers of Jackson Hewitt Tax Service through the 2020 tax season. The Bank also purchased two separate student loan portfolios, one in fiscal year 2017 and one in the beginning of fiscal year 2018. Meta entered into agreements with third parties to originate a greater volume of consumer credit products on a broader national scale during the third quarter of fiscal year 2018. Through the Crestmark Acquisition, the Company engages in a national platform of commercial finance lending activities.
Loan and lease applications are initially considered and approved at various levels of authority, depending on the type and amount of the loan or lease. The Company has a loan committee structure in place for oversight of its lending activities. Loans and leases in excess of certain amounts require approval by at least two members of the loan committee, a majority of the loan committee, or by the Company’s Board Loan Committee, which has responsibility for the overall supervision of the loan and lease portfolio. The Company may discontinue, adjust, or create new lending programs to respond to competitive factors.
At
September 30, 2018
, the Company’s largest lending relationship to a single borrower or group of related borrowers totaled $65.0 million. The Company had 24 other lending relationships in excess of $10.3 million as of
September 30, 2018
.
Loan and Lease Portfolio Composition
The following table provides information about the composition of the Company’s loan and lease portfolio in dollar amounts and in percentages as of the dates indicated. In general, for the fiscal year ended
September 30, 2018
, the aggregate principal amounts in all categories of loans and leases discussed below, except agricultural loans, increased over levels from the prior fiscal year.
Loan and lease tables have been conformed to be consistent with the Company's updated categorization of its lending portfolio between National Lending and Community Banking.
6
|
|
At September 30,
|
|||||||||||||||||||||||||||||||||
|
|
2018
|
2017
|
2016
|
2015
|
2014
|
|||||||||||||||||||||||||||||
|
|
Amount
|
Percent
|
Amount
|
Percent
|
Amount
|
Percent
|
Amount
|
Percent
|
Amount
|
Percent
|
||||||||||||||||||||||||
|
|
(Dollars in Thousands)
|
|||||||||||||||||||||||||||||||||
|
Real estate loans:
|
||||||||||||||||||||||||||||||||||
|
National Lending
|
||||||||||||||||||||||||||||||||||
|
Commercial finance
|
$
|
14,971
|
|
0.5
|
%
|
$
|
—
|
|
—
|
%
|
$
|
—
|
|
—
|
%
|
$
|
—
|
|
—
|
%
|
$
|
—
|
|
—
|
%
|
|||||||||
|
Total National Lending
|
14,971
|
|
0.5
|
%
|
—
|
|
—
|
%
|
—
|
|
—
|
%
|
—
|
|
—
|
%
|
—
|
|
—
|
%
|
||||||||||||||
|
Community Banking
|
||||||||||||||||||||||||||||||||||
|
Commercial and multi-family
|
748,579
|
|
25.4
|
%
|
585,510
|
|
44.1
|
%
|
422,932
|
|
45.7
|
%
|
310,199
|
|
43.5
|
%
|
224,302
|
|
44.9
|
%
|
||||||||||||||
|
1-4 family
|
223,482
|
|
7.7
|
%
|
196,706
|
|
14.8
|
%
|
162,298
|
|
17.5
|
%
|
125,021
|
|
17.5
|
%
|
116,395
|
|
23.3
|
%
|
||||||||||||||
|
Agricultural
|
36,780
|
|
1.2
|
%
|
61,800
|
|
4.7
|
%
|
63,612
|
|
6.9
|
%
|
64,316
|
|
9.0
|
%
|
56,071
|
|
11.3
|
%
|
||||||||||||||
|
Total Community Banking
|
1,008,841
|
|
34.3
|
%
|
844,016
|
|
63.6
|
%
|
648,842
|
|
70.1
|
%
|
499,536
|
|
70.0
|
%
|
396,768
|
|
79.5
|
%
|
||||||||||||||
|
Total real estate loans
|
1,023,812
|
|
34.8
|
%
|
844,016
|
|
63.6
|
%
|
648,842
|
|
70.1
|
%
|
499,536
|
|
70.0
|
%
|
396,768
|
|
79.5
|
%
|
||||||||||||||
|
Other loans and leases:
|
||||||||||||||||||||||||||||||||||
|
National Lending
|
||||||||||||||||||||||||||||||||||
|
Commercial finance
|
1,494,878
|
|
50.8
|
%
|
255,308
|
|
19.2
|
%
|
174,034
|
|
18.8
|
%
|
106,505
|
|
14.9
|
%
|
—
|
|
—
|
%
|
||||||||||||||
|
Consumer finance
|
335,361
|
|
11.4
|
%
|
140,229
|
|
10.6
|
%
|
14,300
|
|
1.5
|
%
|
13,261
|
|
1.9
|
%
|
11,933
|
|
2.4
|
%
|
||||||||||||||
|
Tax services
|
1,073
|
|
—
|
%
|
192
|
|
—
|
%
|
190
|
|
—
|
%
|
—
|
|
—
|
%
|
—
|
|
—
|
%
|
||||||||||||||
|
Total National Lending
|
1,831,312
|
|
62.2
|
%
|
395,729
|
|
29.8
|
%
|
188,524
|
|
20.4
|
%
|
119,766
|
|
16.8
|
%
|
11,933
|
|
2.4
|
%
|
||||||||||||||
|
Community Banking
|
||||||||||||||||||||||||||||||||||
|
Agricultural
|
23,718
|
|
0.8
|
%
|
33,594
|
|
2.5
|
%
|
37,083
|
|
4.0
|
%
|
43,626
|
|
6.1
|
%
|
42,258
|
|
8.5
|
%
|
||||||||||||||
|
Commercial operating
|
42,311
|
|
1.4
|
%
|
30,718
|
|
2.3
|
%
|
28,651
|
|
3.1
|
%
|
29,893
|
|
4.2
|
%
|
30,846
|
|
6.2
|
%
|
||||||||||||||
|
Consumer
|
23,836
|
|
0.8
|
%
|
22,775
|
|
1.7
|
%
|
22,794
|
|
2.5
|
%
|
20,266
|
|
2.8
|
%
|
17,396
|
|
3.5
|
%
|
||||||||||||||
|
Total Community Banking
|
89,865
|
|
3.0
|
%
|
87,087
|
|
6.6
|
%
|
88,528
|
|
9.6
|
%
|
93,785
|
|
13.2
|
%
|
90,500
|
|
18.1
|
%
|
||||||||||||||
|
Total other loans and leases
|
1,921,177
|
|
65.2
|
%
|
482,816
|
|
36.4
|
%
|
277,052
|
|
29.9
|
%
|
213,551
|
|
30.0
|
%
|
102,433
|
|
20.5
|
%
|
||||||||||||||
|
Total loans and leases
|
$
|
2,944,989
|
|
100.0
|
%
|
$
|
1,326,832
|
|
100.0
|
%
|
$
|
925,894
|
|
100.0
|
%
|
$
|
713,087
|
|
100.0
|
%
|
$
|
499,201
|
|
100.0
|
%
|
|||||||||
7
The following table shows the composition of the Company’s loan and lease portfolio by fixed- and adjustable-rate at the dates indicated.
|
|
September 30,
|
|||||||||||||||||||||||||||||||||
|
|
2018
|
2017
|
2016
|
2015
|
2014
|
|||||||||||||||||||||||||||||
|
(Dollars in thousands)
|
Amount
|
Percent
|
Amount
|
Percent
|
Amount
|
Percent
|
Amount
|
Percent
|
Amount
|
Percent
|
||||||||||||||||||||||||
|
Fixed-rate loans and leases:
|
||||||||||||||||||||||||||||||||||
|
National Lending
|
||||||||||||||||||||||||||||||||||
|
Commercial finance
|
$
|
956,920
|
|
32.5
|
%
|
$
|
250,459
|
|
18.9
|
%
|
$
|
171,604
|
|
18.5
|
%
|
$
|
106,505
|
|
14.9
|
%
|
$
|
—
|
|
—
|
%
|
|||||||||
|
Consumer finance
|
21,093
|
|
0.7
|
%
|
16,489
|
|
1.2
|
%
|
14,300
|
|
1.5
|
%
|
12,811
|
|
1.8
|
%
|
10,948
|
|
2.2
|
%
|
||||||||||||||
|
Tax services
(1)
|
1,073
|
|
—
|
%
|
—
|
|
—
|
%
|
—
|
|
—
|
%
|
—
|
|
—
|
%
|
—
|
|
—
|
%
|
||||||||||||||
|
Total National Lending
|
979,086
|
|
33.2
|
%
|
266,948
|
|
20.1
|
%
|
185,904
|
|
20.0
|
%
|
119,316
|
|
16.7
|
%
|
10,948
|
|
2.2
|
%
|
||||||||||||||
|
Community Banking
|
||||||||||||||||||||||||||||||||||
|
Commercial and multi-family real estate
|
729,290
|
|
24.8
|
%
|
566,157
|
|
42.7
|
%
|
404,888
|
|
43.7
|
%
|
284,586
|
|
39.9
|
%
|
203,840
|
|
40.8
|
%
|
||||||||||||||
|
1-4 family real estate
|
210,965
|
|
7.2
|
%
|
185,597
|
|
14.0
|
%
|
152,232
|
|
16.4
|
%
|
116,171
|
|
16.3
|
%
|
105,870
|
|
21.2
|
%
|
||||||||||||||
|
Agricultural
|
46,940
|
|
1.6
|
%
|
80,419
|
|
6.1
|
%
|
86,651
|
|
9.4
|
%
|
95,021
|
|
13.3
|
%
|
74,634
|
|
15.0
|
%
|
||||||||||||||
|
Commercial operating
|
19,968
|
|
0.7
|
%
|
13,935
|
|
1.1
|
%
|
12,393
|
|
1.3
|
%
|
15,520
|
|
2.2
|
%
|
13,659
|
|
2.7
|
%
|
||||||||||||||
|
Consumer
|
9,198
|
|
0.3
|
%
|
8,168
|
|
0.6
|
%
|
8,724
|
|
0.9
|
%
|
8,031
|
|
1.1
|
%
|
8,331
|
|
1.7
|
%
|
||||||||||||||
|
Total Community Banking
|
1,016,361
|
|
34.6
|
%
|
854,274
|
|
64.5
|
%
|
664,888
|
|
71.7
|
%
|
519,329
|
|
72.8
|
%
|
406,334
|
|
81.4
|
%
|
||||||||||||||
|
Total fixed-rate loans and leases
|
1,995,447
|
|
67.8
|
%
|
1,121,222
|
|
84.5
|
%
|
850,792
|
|
91.7
|
%
|
638,645
|
|
89.5
|
%
|
417,282
|
|
83.6
|
%
|
||||||||||||||
|
Adjustable-rate loans and leases:
|
||||||||||||||||||||||||||||||||||
|
National Lending
|
||||||||||||||||||||||||||||||||||
|
Commercial finance
|
552,929
|
|
18.8
|
%
|
4,849
|
|
0.4
|
%
|
2,430
|
|
0.3
|
%
|
—
|
|
—
|
%
|
—
|
|
—
|
%
|
||||||||||||||
|
Consumer finance
|
314,268
|
|
10.6
|
%
|
123,742
|
|
9.3
|
%
|
—
|
|
—
|
%
|
450
|
|
0.1
|
%
|
985
|
|
0.2
|
%
|
||||||||||||||
|
Tax services
(1)
|
—
|
|
—
|
%
|
192
|
|
—
|
%
|
190
|
|
—
|
%
|
—
|
|
—
|
%
|
—
|
|
—
|
%
|
||||||||||||||
|
Total National Lending
|
867,197
|
|
29.4
|
%
|
128,783
|
|
9.7
|
%
|
2,620
|
|
0.3
|
%
|
450
|
|
0.1
|
%
|
985
|
|
0.2
|
%
|
||||||||||||||
|
Community Banking
|
||||||||||||||||||||||||||||||||||
|
Commercial and multi-family real estate
|
19,289
|
|
0.6
|
%
|
19,354
|
|
1.5
|
%
|
18,044
|
|
1.9
|
%
|
25,613
|
|
3.6
|
%
|
20,461
|
|
4.1
|
%
|
||||||||||||||
|
1-4 family real estate
|
12,517
|
|
0.4
|
%
|
11,110
|
|
0.8
|
%
|
10,066
|
|
1.1
|
%
|
8,850
|
|
1.2
|
%
|
10,525
|
|
2.1
|
%
|
||||||||||||||
|
Agricultural
|
13,558
|
|
0.5
|
%
|
14,975
|
|
1.1
|
%
|
14,044
|
|
1.5
|
%
|
12,921
|
|
1.8
|
%
|
23,696
|
|
4.7
|
%
|
||||||||||||||
|
Commercial operating
|
22,343
|
|
0.8
|
%
|
16,782
|
|
1.3
|
%
|
16,258
|
|
1.8
|
%
|
14,373
|
|
2.0
|
%
|
17,187
|
|
3.4
|
%
|
||||||||||||||
|
Consumer
|
14,638
|
|
0.5
|
%
|
14,606
|
|
1.1
|
%
|
14,070
|
|
1.5
|
%
|
12,235
|
|
1.7
|
%
|
9,065
|
|
1.8
|
%
|
||||||||||||||
|
Total Community Banking
|
82,345
|
|
2.8
|
%
|
76,827
|
|
5.8
|
%
|
72,482
|
|
7.8
|
%
|
73,992
|
|
10.3
|
%
|
80,934
|
|
16.1
|
%
|
||||||||||||||
|
Total adjustable-rate loans and leases
|
949,542
|
|
32.2
|
%
|
205,610
|
|
15.5
|
%
|
75,102
|
|
8.1
|
%
|
74,442
|
|
10.4
|
%
|
81,919
|
|
16.3
|
%
|
||||||||||||||
|
Total loans and leases
|
2,944,989
|
|
100.0
|
%
|
1,326,832
|
|
100.0
|
%
|
925,894
|
|
99.8
|
%
|
713,087
|
|
99.9
|
%
|
499,201
|
|
99.9
|
%
|
||||||||||||||
|
Deferred fees and discounts
|
(250
|
)
|
(1,461
|
)
|
(789
|
)
|
(577
|
)
|
(797
|
)
|
||||||||||||||||||||||||
|
Allowance for loan and lease losses
|
(13,040
|
)
|
(7,534
|
)
|
(5,635
|
)
|
(6,255
|
)
|
(5,397
|
)
|
||||||||||||||||||||||||
|
Total loans and leases receivable, net
|
$
|
2,931,699
|
|
$
|
1,317,837
|
|
$
|
919,470
|
|
$
|
706,255
|
|
$
|
493,007
|
|
|||||||||||||||||||
(1)
Certain tax services loans do not bear interest.
8
The following table illustrates the maturity analysis of the Company’s loan and lease portfolio at
September 30,
2018
. The table reflects management’s estimate of the effects of loan and lease prepayments or curtailments based on data from the Company’s historical experiences and other third-party sources.
|
|
Due in one year or less
|
Due after one year through five years
|
Due after five years
|
Total
|
||||||||||||||||||||
|
|
Amount
|
Weighted
Average
Rate
|
Amount
|
Weighted
Average
Rate
|
Amount
|
Weighted
Average
Rate
|
Amount
|
|||||||||||||||||
|
|
(Dollars in Thousands)
|
|||||||||||||||||||||||
|
National Lending
|
||||||||||||||||||||||||
|
Commercial finance
|
$
|
1,013,866
|
|
6.94
|
%
|
$
|
366,821
|
|
8.80
|
%
|
$
|
129,162
|
|
9.87
|
%
|
$
|
1,509,849
|
|
||||||
|
Consumer finance
|
90,385
|
|
6.20
|
%
|
167,358
|
|
7.10
|
%
|
77,618
|
|
6.29
|
%
|
335,361
|
|
||||||||||
|
Tax services
|
1,073
|
|
—
|
%
|
—
|
|
—
|
%
|
—
|
|
—
|
%
|
1,073
|
|
||||||||||
|
Total National Lending
|
1,105,324
|
|
7.01
|
%
|
534,179
|
|
8.26
|
%
|
206,780
|
|
8.41
|
%
|
1,846,283
|
|
||||||||||
|
Community Banking
|
||||||||||||||||||||||||
|
Commercial and multi-family real estate
|
154,220
|
|
4.39
|
%
|
301,669
|
|
4.46
|
%
|
292,690
|
|
4.56
|
%
|
748,579
|
|
||||||||||
|
1-4 family real estate
|
43,949
|
|
4.49
|
%
|
81,775
|
|
3.81
|
%
|
97,758
|
|
3.83
|
%
|
223,482
|
|
||||||||||
|
Agricultural
|
25,580
|
|
5.44
|
%
|
18,836
|
|
4.47
|
%
|
16,082
|
|
4.77
|
%
|
60,498
|
|
||||||||||
|
Commercial operating
|
11,100
|
|
5.26
|
%
|
21,550
|
|
5.53
|
%
|
9,661
|
|
4.72
|
%
|
42,311
|
|
||||||||||
|
Consumer
|
6,536
|
|
5.44
|
%
|
12,923
|
|
5.53
|
%
|
4,376
|
|
5.54
|
%
|
23,836
|
|
||||||||||
|
Total Community Banking
|
241,386
|
|
4.50
|
%
|
436,754
|
|
4.43
|
%
|
420,567
|
|
4.41
|
%
|
1,098,706
|
|
||||||||||
|
Total
|
$
|
1,346,710
|
|
6.56
|
%
|
$
|
970,933
|
|
6.54
|
%
|
$
|
627,347
|
|
5.79
|
%
|
$
|
2,944,989
|
|
||||||
9
National Lending (Commercial Finance, Consumer Finance and Tax Services)
Commercial Finance
Our commercial finance product lines include asset-based lending, factoring, leasing, commercial insurance premium finance, and other commercial finance products offered on a nationwide basis. Asset-based lending and factoring primarily service small businesses that are startups, distressed and/or generally that may not be otherwise qualified for traditional bank financing. Leasing focuses on providing equipment finance solutions to mid-market companies. These product offerings supplement the asset generation capacity in our community bank and tax services divisions and enhance the overall yield of our loan and lease portfolio, enabling us to earn attractive risk-adjusted net interest margins.
Asset-Based Lending
.
Through its Crestmark division, the Bank provides asset-based loans secured by debtors' short-term assets such as inventory, accounts receivable, and work-in-process. Asset-based loans may also be secured by real estate and equipment. The primary sources of repayment are the operating income of the borrower, the collection of the receivables securing the loan, and/or the sale of the inventory securing the loan. Loans are typically revolving lines of credit with terms of one to three years, whereby the Bank withholds a contingency reserve representing the difference between the amount advanced and the fair value of the invoice amount or other collateral value. Credit risk is managed through advance rates appropriate for the collateral, standardized loan policies, established and authorized credit limits, attentive portfolio management and the use of lock box agreements and similar arrangements which result in the Company receiving and controlling the debtors' cash receipts. The Bank also originates collateralized term loans and notes receivable, with terms ranging from three to 25 years.
Factoring.
Through its Crestmark division, the Bank provides factoring lending where clients provide detailed inventory, accounts receivable, and work-in-process reports for lending arrangements. The factoring clients are diversified as to industry and geography. With these loans, the Crestmark division withholds a contingency reserve, which is the difference between the fair value of the invoice amount or other collateral value and the amount advanced. This reserve is withheld for nonpayment of factored receivables, service fees and other adjustments. Credit risk is managed through standardized advance policies, established and authorized credit limits, verification of receivables, attentive portfolio management and the use of lock box agreements and similar arrangements which result in the Company receiving and controlling the client's cash receipts. In addition, clients generally guarantee the payment of purchased accounts receivable.
Leasing.
Through its Crestmark division, the Bank provides creative, flexible lease solutions for technology, capital equipment and select transportation assets like tractors and trailers. Direct financing leases and sales-type leases substantially transfer the benefits and risks of equipment ownership to the lessee. The lease may contain provisions that transfer ownership to the lessee at the end of the initial term, contain a bargain purchase option or allow for purchase of the equipment at fair market value. Residual values are estimated at the inception of the lease. Lease maturities are generally no greater than 84 months. The focus in this lease financing category is to support middle market companies by providing a variety of financing products to help them meet their business objectives.
Commercial Insurance Premium Finance.
Through its AFS/IBEX division the Bank provides, on a national basis, short-term, primarily collateralized financing to facilitate the commercial customers’ purchase of insurance for various forms of risk, otherwise known as insurance premium financing. This includes, but is not limited to, policies for commercial property, casualty and liability risk. Premiums are advanced either directly to the insurance carrier or through an intermediary/broker and repaid by the policyholder with interest during the policy term. The policyholder generally makes a 20% to 25% down payment to the insurance broker and finances the remainder over nine to 10 months on average. The down payment is set such that if the policy is canceled, the unearned premium is typically sufficient to cover the loan balance and accrued interest. The AFS/IBEX division markets itself to the insurance community as a competitive option based on service, reputation, competitive terms, cost and ease of operation.
Small Business Administration ("SBA") and United States Department of Agriculture ("USDA").
The Bank originates loans through programs partially guaranteed by the SBA or USDA. These loans are to small businesses and professionals with what the Bank believes are lower risk characteristics.
10
Other Commercial Finance.
Included in this category of loans are the Company's healthcare receivables loan portfolio primarily comprised of loans to individuals for medical services received. The majority of these loans are guaranteed by the hospital providing the service to the debtor and this guarantee serves to reduce credit risk as the guarantors agree to repurchase severely delinquent loans. Credit risk is minimized on these loans based on the guarantor’s repurchase agreement. This loan category also includes commercial real estate loans to customers of the Crestmark division.
Consumer Finance
Consumer Credit Products.
Through the acquisition of SCS, the Bank acquired a platform that provides a total solution for marketplace lending, including underwriting and loan management in the direct-to-consumer credit business. The acquired platform allows the Bank to provide innovative lending solutions through consumer credit products. The Company designs and structures its credit programs in an effort to insulate the Company from program losses and to potentially increase the liquidity attributes of such lending programs' marketability to potential bank or other purchasers. While each program is different, all contain one or more types of credit enhancements, loss protections, or trigger events. When determining the applicable program enhancement, generally, the Company uses proprietary data provided by the Company’s partner, with respect to such program, supplemented with public data to design and shape appropriate loss curves, as well as implement stresses significantly higher than base to provide protection in changing credit cycles. Credit enhancements are typically built through holding excess program interest and fees in a reserve account to pay program credit losses. Cash flow waterfall positioning allows for losses and Company program principal and interest to be paid, under certain circumstances, before servicing or other program expenses. Trigger events allow programs and originations to be suspended if certain vintage loss limits, during a specific period of time, are triggered or if cumulative loss percentages are triggered. These triggers are designed to allow the Company to address potential issues quickly. Other trigger events in certain programs provide for excess credit or reserve enhancements, which could be beyond excess interest amounts, if certain loss triggers are breached.
Through September 30, 2018, the Bank has launched two consumer credit programs. During the second quarter of fiscal 2018, the Bank entered into a three-year program agreement with Liberty Lending, LLC ("Liberty Lending") whereby the Bank provides personal loans to Liberty Lending customers. Meta and Liberty Lending market the program jointly through a wide variety of marketing channels. The loan products under this agreement are closed-end installment loans ranging from $3,500 to $45,000 in initial principal amount with durations of between 13 and 60 months. The Bank expects to apply a provision of approximately 1% on outstanding loan balances within this program.
The Bank entered into a three-year agreement with Health Credit Services ("HCS") during the third quarter of fiscal 2018. The Bank approves and originates loans for elective medical procedures for select HCS provider offices throughout the United States. HCS works with its provider partners to market the loans, as well as provide servicing for them. The loan products offered are unsecured, closed-end installment loans with terms between 12 and 84 months and revolving lines of credit with durations between six and 60 months. The Bank expects to apply a provision for loan and lease losses of approximately 1% on outstanding loan balances within this program.
The Company estimates in order for the 1% allowance for loan losses for its current consumer loan programs not to be adequate, net cumulative program loan losses would need to be between 15% to 20% for the current prime program and between 25% to 30% for the current non-prime program. Expected cumulative net loss rates are estimated to be under 8% for the prime program and under 10% for the non-prime program. Program loss rates are dependent on curvature of the loss curve. A quicker, or steeper curve, may impact these rates. Current curvature is based on historical or like-program statistics. In constructing its contracts with its current partners, the Company instituted the ability to suspend or terminate any new originations if net cumulative loss rates exceed certain levels. These suspension or termination loss rates are set well below the estimated net cumulative loss rate levels which would lead to the inadequacy of the 1% allowance for loan losses.
Warehouse Lending.
In fiscal 2018, the Bank entered into a first-out participation agreement in a highly-secured, consumer receivable asset-based warehouse line of credit. The Bank holds a senior position, providing up to $65.0 million, with the subordinate party contributing up to $100.0 million, thereby enhancing the Bank’s position with significant subordination.
11
Student Loans.
The Bank's purchased student loan portfolios are seasoned, floating rate, private portfolios that are serviced by a third-party servicer. The portfolio purchased during the first quarter of fiscal year 2018 is indexed to one-month LIBOR, while the portfolio purchased in the first quarter of fiscal year 2017 is indexed to three-month LIBOR plus various margins. The Company received written notification on June 18, 2018 from ReliaMax Surety Company ("ReliaMax"), the company that provided insurance coverage for the student loan portfolios, which informed policy holders that the South Dakota Division of Insurance filed a petition to have ReliaMax declared insolvent and to adopt a plan of liquidation. An Order of Liquidation was entered on June 27, 2018 by the Sixth Circuit Court in Hughes County, South Dakota, declaring ReliaMax insolvent and appointing the South Dakota Division of Insurance as liquidator to adopt a plan of liquidation. The Company expects to ultimately recover a portion of the unearned premiums, which could take a year or longer. Due to the cancellation of the Company’s insurance coverage with respect to the purchased student loan portfolios, the Company adjusted the allowance for loan and lease losses attributable to the purchased student loan portfolios to
$2.8 million
at September 30, 2018.
Tax Services
The Bank's tax services division provides short-term, interest free taxpayer advance loans. Taxpayers are underwritten to determine eligibility for these unsecured loans. Due to the nature of taxpayer advance loans, it typically takes no more than three e-file cycles (the period of time between scheduled IRS payments) from when the return is accepted by the IRS to collect from the borrower. In the event of default, the Bank has no recourse against the tax consumer. The Bank will charge off the balance of a taxpayer advance loan if there is a balance at the end of the calendar year, or when collection of principal becomes doubtful.
Through its tax services division, the Bank provides short-term electronic return originator ("ERO") advance loans on a nationwide basis. These loans are typically utilized by tax preparers to purchase tax preparation software and to prepare tax office operations for the upcoming tax season. EROs go through an underwriting process to determine eligibility for the unsecured advances. ERO loans are not collateralized. Collection on ERO advances begins once the ERO begins to process refund transfers. Generally, the Bank will charge off the balance of an ERO advance loan if there is a balance at the end of June, or when collection of principal becomes doubtful.
Community Banking
Commercial and Multi-Family Real Estate
.
The Company engages in commercial and multi-family real estate lending in the community bank's primary market areas and surrounding areas. These loans are secured primarily by apartment buildings, office buildings, and hotels. Commercial and multi-family real estate loans generally are underwritten with terms not exceeding 20 years, have loan-to-value ratios of up to 80% of the appraised value of the property securing the loan, and are typically secured by guarantees of the borrowers. The Company has a variety of rate adjustment features and other terms in its commercial and multi-family real estate loan portfolio. Commercial and multi-family real estate loans provide for a margin over a number of different indices. In underwriting these loans, the Company analyzes the financial condition of the borrower, the borrower’s credit history, and the reliability and predictability of the cash flow generated by the property securing the loan. Appraisals on properties securing commercial real estate loans originated by the Company are performed by independent appraisers.
The repayment of loans secured by commercial and multi-family real estate is typically dependent upon the successful operation of the related real estate project. If the cash flow from the project is reduced (for example, if leases are not obtained or renewed, or a bankruptcy court modifies a lease term, or a major tenant is unable to fulfill its lease obligations), the borrower’s ability to repay the loan may be impaired. See “Non-Performing Assets, Other Loans of Concern and Classified Assets.”
One-to-Four Family Residential Mortgage
. One-to-four family residential mortgage loan originations are typically generated by the Company’s marketing efforts, its present customers, walk-in customers and referrals. The Company offers fixed-rate loans and adjustable-rate mortgage ("ARM") loans for both permanent structures and those under construction. The Company’s one-to-four family residential mortgage originations are secured primarily by properties located in the community bank's primary market areas and surrounding areas.
12
The Company originates one-to-four family residential mortgage loans with terms up to a maximum of 30 years and with loan-to-value ratios up to 100% of the lesser of the appraised value of the property securing the loan or the contract price. However, the vast majority of these loans are originated with loan-to-value ratios below 80%. The Company generally requires that private mortgage insurance be obtained in an amount sufficient to reduce the Company’s exposure to at or below the 80% loan‑to‑value level. Due to consumer demand, the Company also offers fixed-rate mortgage loans with terms up to 30 years, which may conform to secondary market standards such as Fannie Mae, Ginnie Mae, and Freddie Mac standards. The Company typically holds all fixed-rate mortgage loans and does not engage in secondary market sales. The Company also currently offers five- and ten-year ARM loans.
In underwriting one-to-four family residential real estate loans, the Company evaluates both the borrower’s ability to make monthly payments and the value of the property securing the loan. Properties securing real estate loans made by the Company are appraised by independent appraisers approved by the Board of Directors of the Company. The Company generally requires borrowers to obtain an attorney’s title opinion or title insurance, as well as fire and property insurance (including flood insurance, if necessary) in an amount not less than the amount of the loan. Real estate loans originated by the Company generally contain a “due on sale” clause allowing the Company to declare the unpaid principal balance due and payable upon the sale of the security property. The Company has not engaged in sub-prime residential mortgage originations. See “Non-Performing Assets, Other Loans of Concern and Classified Assets.”
Agricultural Lending
. The Company originates loans to finance the purchase of farmland, livestock, farm machinery and equipment, seed, fertilizer, and other farm-related products, primarily in its market areas. Agricultural operating loans are originated at either an adjustable- or fixed-rate of interest for up to a one-year term or, in the case of livestock, are due upon sale. Agricultural real estate loans are frequently originated with adjustable rates of interest. Generally, such loans provide for a fixed rate of interest for the first five to 10 years, after which the loan will balloon or the interest rate will adjust annually. These loans generally amortize over a period of 20 to 25 years. Fixed-rate agricultural real estate loans typically have terms up to 10 years. Agricultural real estate loans are generally limited to 75% of the value of the property securing the loan.
Payments on loans are dependent on the successful operation or management of the farm property securing the loan or for which an operating loan is utilized. The success of the loan may also be affected by many factors outside the control of the borrower such as weather, government support programs and grain and livestock prices. These risks may be reduced, by the farmer, with the use of crop insurance coverage and futures contracts or options to mitigate price risk, both of which the Company frequently requires of the borrowers to help ensure loan repayment. Many farms are also dependent on a limited number of key individuals whose injury or death may result in an inability to successfully operate the farm.
See “Non-Performing Assets, Other Loans of Concern and Classified Assets.”
Commercial Operating Lending
.
The Company originates its community banking commercial operating loans primarily in its market areas. Most of these commercial operating loans have been extended to finance local and regional businesses and include short-term loans to finance machinery and equipment purchases, inventory and accounts receivable. Commercial loans also may involve the extension of revolving credit for a combination of equipment acquisitions and working capital in expanding companies. The maximum term for loans extended on machinery and equipment is based on the projected useful life of such machinery and equipment. Generally, the maximum term on non-mortgage lines of credit is one year.
The Company’s commercial operating lending policy includes credit file documentation and analysis of the borrower’s character, capacity to repay the loan, the adequacy of the borrower’s capital and collateral as well as an evaluation of conditions affecting the borrower. Analysis of the borrower’s past, present and future cash flows is also an important aspect of the Company’s current credit analysis. Commercial operating loans typically are made on the basis of the borrower’s ability to make repayment from the cash flow of the borrower’s business. As a result, the availability of funds for the repayment of commercial operating loans may be substantially dependent on the success of the business itself (which, in turn, is likely to be dependent upon the general economic environment). The Company’s commercial operating loans are usually, but not always, secured by business assets and personal guarantees. However, the collateral securing the loans may depreciate over time, may be difficult to appraise and may fluctuate in value based on the success of the business.
13
Consumer Lending
. The Company originates a variety of secured consumer loans, including home equity, home improvement, automobile and boat loans, as well as loans secured by savings deposits in its primary market areas and surrounding areas. Substantially all of the Company’s home equity loans and lines of credit are secured by second mortgages on principal residences. The Bank will lend amounts which, together with all prior liens, may be up to 90% of the appraised value of the property securing the loan. Home equity loans and lines of credit generally have maximum terms of five years.
Consumer loan terms vary according to the type and value of collateral, length of contract and creditworthiness of the borrower. The underwriting standards employed by the Bank for consumer loans include an application, a determination of the applicant’s payment history on other debts and an assessment of ability to meet existing obligations and payments on the proposed loan. Although creditworthiness of the applicant is a primary consideration, the underwriting process also may include a comparison of the value of the security, if any, in relation to the proposed loan amount.
ORIGINATIONS, SALES AND SERVICING OF LOANS AND LEASES
Loans and leases are generally originated by the Company’s staff of lending officers. Loan and lease applications are taken and processed in the branches, loan production offices, and the main office of the Company. While the Company originates both adjustable-rate and fixed-rate loans and leases, its ability to originate loans and leases is dependent upon the relative customer demand for loans and leases in its market. Demand is affected by the interest rate and economic environment.
The Company, from time to time, sells loan participations, generally without recourse. At
September 30, 2018
, there were no outstanding loans sold by the Company with recourse. When loan participations are sold, the Company may retain
the responsibility for collecting and remitting loan payments, making certain that real estate tax payments are made on behalf of borrowers, and otherwise servicing the loans. The servicing fee is recognized as income over the life of the loans. The Company services loans that it originated and sold totaling
$134.0 million
at
September 30, 2018
, of which
$98.9 million
were sold to SBA/USDA,
$2.3 million
were sold to Fannie Mae, and
$32.7 million
were sold to others.
We generally sell the guaranteed portion of our SBA 7(a) loans and USDA program loans in the secondary market. These sales have resulted in premium income for us at the time of sale and created a stream of future servicing income. When we sell the guaranteed portion of our loans, we incur credit risk on the non-guaranteed portion of the loans, and if a customer defaults on the loan, we share any loss and recovery related to the loan pro-rata with the SBA or USDA, as applicable. If the SBA or USDA establishes that a loss on a guaranteed loan is attributable to significant technical deficiencies in the manner in which the loan was originated, funded or serviced by us, the SBA or USDA may seek recovery of the principal loss related to the deficiency from us, which could materially adversely affect our business, results of operations and financial condition.
In periods of economic uncertainty, the Company’s ability to originate large dollar volumes of loans and leases may be substantially reduced or restricted, with a resultant decrease in related loan origination fees, other fee income and operating earnings. In addition, the Company’s ability to sell loans may substantially decrease if potential buyers (principally government agencies) reduce their purchasing activities.
14
The following table shows the loan and lease originations (including draws, loan and lease renewals, and undisbursed portions of loans and leases in process), purchases, and sales and repayment activities of the Company for the periods indicated.
|
|
Years Ended September 30,
|
||||||||||
|
|
2018
|
2017
|
2016
|
||||||||
|
Originations:
|
(Dollars in Thousands)
|
||||||||||
|
Adjustable-rate:
|
|||||||||||
|
Commercial finance
|
$
|
816,283
|
|
$
|
—
|
|
$
|
—
|
|
||
|
Consumer finance
|
81,686
|
|
—
|
|
—
|
|
|||||
|
Total National Lending
|
928,026
|
|
23,032
|
|
—
|
|
|||||
|
Commercial and multi-family real estate
|
5,935
|
|
6,014
|
|
2,460
|
|
|||||
|
1-4 family real estate
|
24,152
|
|
21,324
|
|
15,276
|
|
|||||
|
Agricultural
|
35,679
|
|
23,513
|
|
21,954
|
|
|||||
|
Commercial operating
|
166,408
|
|
168,136
|
|
35,433
|
|
|||||
|
Consumer
|
7
|
|
9
|
|
13
|
|
|||||
|
Total Community Lending
|
232,180
|
|
218,996
|
|
75,136
|
|
|||||
|
Total adjustable rate
|
1,160,206
|
|
242,028
|
|
75,136
|
|
|||||
|
Fixed-rate:
|
|||||||||||
|
Commercial finance
|
1,218,436
|
|
535,339
|
|
357,252
|
|
|||||
|
Consumer finance
|
347,508
|
|
242,503
|
|
221,468
|
|
|||||
|
Tax services
(1)
|
1,256,237
|
|
1,261,825
|
|
31,537
|
|
|||||
|
Total National Lending
|
2,822,180
|
|
2,039,667
|
|
610,257
|
|
|||||
|
Commercial and multi-family real estate
|
285,415
|
|
190,618
|
|
154,478
|
|
|||||
|
1-4 family real estate
|
71,344
|
|
74,294
|
|
81,218
|
|
|||||
|
Agricultural
|
31,226
|
|
21,373
|
|
35,105
|
|
|||||
|
Commercial operating
|
14,279
|
|
31,834
|
|
11,238
|
|
|||||
|
Consumer
|
1,360
|
|
919
|
|
923
|
|
|||||
|
Total Community Lending
|
403,624
|
|
319,038
|
|
282,962
|
|
|||||
|
Total fixed-rate
|
3,225,804
|
|
2,358,705
|
|
893,219
|
|
|||||
|
Total loans and leases originated
|
4,386,010
|
|
2,600,733
|
|
968,355
|
|
|||||
|
Acquired:
|
|||||||||||
|
Commercial finance
|
1,063,504
|
|
—
|
|
—
|
|
|||||
|
Total National Lending
|
1,063,504
|
|
—
|
|
—
|
|
|||||
|
Total loans and leases acquired
|
1,063,504
|
|
—
|
|
—
|
|
|||||
|
Purchases:
|
|||||||||||
|
Consumer finance
|
137,751
|
|
133,785
|
|
—
|
|
|||||
|
Total National Lending
|
137,751
|
|
133,785
|
|
—
|
|
|||||
|
Commercial and multi-family real estate
|
—
|
|
7,078
|
|
—
|
|
|||||
|
1-4 family real estate
|
—
|
|
540
|
|
—
|
|
|||||
|
Commercial operating
|
27,919
|
|
—
|
|
—
|
|
|||||
|
Total Community Lending
|
27,919
|
|
7,618
|
|
—
|
|
|||||
|
Total loans and leases purchased
|
165,670
|
|
141,403
|
|
—
|
|
|||||
|
Sales and repayments:
|
|||||||||||
|
Sales:
|
|||||||||||
|
Commercial finance
|
17,621
|
|
—
|
|
—
|
|
|||||
|
Tax services
|
—
|
|
685,934
|
|
17,611
|
|
|||||
|
Total National Lending
|
17,621
|
|
685,934
|
|
17,611
|
|
|||||
|
Commercial and multi-family real estate
|
22,571
|
|
4,720
|
|
—
|
|
|||||
|
Agricultural
|
40
|
|
—
|
|
83
|
|
|||||
|
Total Community Lending
|
22,611
|
|
4,720
|
|
83
|
|
|||||
|
Total loan sales
|
40,232
|
|
690,654
|
|
17,694
|
|
|||||
|
Repayments:
|
|||||||||||
|
Loan and lease principal repayments
|
3,949,780
|
|
1,652,674
|
|
737,853
|
|
|||||
|
Total principal repayments
|
3,949,780
|
|
1,652,674
|
|
737,853
|
|
|||||
|
Total reductions
|
3,990,012
|
|
2,343,328
|
|
755,547
|
|
|||||
|
(Decrease) increase in other items, net
|
4,295
|
|
(441
|
)
|
408
|
|
|||||
|
Net increase
|
$
|
1,629,468
|
|
$
|
398,367
|
|
$
|
213,216
|
|
||
1)
Certain tax services loans do not bear interest.
15
NON-PERFORMING ASSETS, OTHER LOANS AND LEASES OF CONCERN AND CLASSIFIED ASSETS
The following table sets forth the Company’s loan and lease delinquencies by type, by amount and by percentage of type at
September 30, 2018
.
|
|
Loans and Leases Delinquent For:
|
||||||||||||||||||||||||||||
|
|
30-59 Days
|
60-89 Days
|
90 Days and Over
|
||||||||||||||||||||||||||
|
Number
|
Amount
|
Percent
of
Category
|
Number
|
Amount
|
Percent
of
Category
|
Number
|
Amount
|
Percent
of
Category
|
|||||||||||||||||||||
|
|
(Dollars in Thousands)
|
||||||||||||||||||||||||||||
|
Commercial finance
|
397
|
|
$
|
20,708
|
|
86.2
|
%
|
237
|
|
$
|
3,702
|
|
69.9
|
%
|
983
|
|
$
|
5,996
|
|
62.9
|
%
|
||||||||
|
Consumer finance
|
318
|
|
3,209
|
|
13.4
|
|
155
|
|
1,595
|
|
30.1
|
|
158
|
|
2,384
|
|
25.0
|
|
|||||||||||
|
Tax services
(1)
|
—
|
|
—
|
|
—
|
|
—
|
|
—
|
|
—
|
|
—
|
|
1,073
|
|
11.3
|
|
|||||||||||
|
Total National Lending
|
715
|
|
23,917
|
|
99.6
|
|
392
|
|
5,297
|
|
100.0
|
|
1,141
|
|
9,453
|
|
99.2
|
|
|||||||||||
|
1-4 family real estate
|
2
|
|
105
|
|
0.4
|
|
—
|
|
—
|
|
—
|
|
1
|
|
79
|
|
0.8
|
|
|||||||||||
|
Total Community Banking
|
2
|
|
105
|
|
0.4
|
|
—
|
|
—
|
|
—
|
|
1
|
|
79
|
|
0.8
|
|
|||||||||||
|
Total
|
717
|
|
$
|
24,022
|
|
100.0
|
%
|
392
|
|
$
|
5,297
|
|
100.0
|
%
|
1,142
|
|
$
|
9,532
|
|
100.0
|
%
|
||||||||
(1)
The tax services loans past due represented the aggregate remaining balance of the tax services loan portfolio.
Delinquencies 90 days and over constituted
0.3%
of total loans and leases and
0.16%
of total assets.
Generally, when a loan or lease becomes delinquent
90
days or more or when the collection of principal or interest becomes doubtful, the Company will place the loan or lease on a non-accrual status and, as a result, previously accrued interest income on the loan or lease is reversed against current income. The loan or lease will generally remain on a non-accrual status until six months of good payment history has been established or management believes the financial status of the borrower has been significantly restored. Certain relationships in the table above are over 90 days past due and still accruing. The Company considers these relationships as being in the process of collection. Commercial insurance premium finance loans, consumer finance and tax services loans are generally not placed on non-accrual status, but are instead written off when the collection of principal and interest become doubtful.
16
The table below sets forth the amounts and categories of the Company’s non-performing assets.
|
|
At September 30,
|
||||||||||||||||||
|
|
2018
|
2017
|
2016
|
2015
|
2014
|
||||||||||||||
|
Non-performing loans and leases
|
(Dollars in Thousands)
|
||||||||||||||||||
|
Non-accruing loans and leases:
|
|||||||||||||||||||
|
Commercial finance
|
$
|
2,864
|
|
$
|
—
|
|
$
|
—
|
|
$
|
—
|
|
$
|
—
|
|
||||
|
Total National Lending
|
2,864
|
|
—
|
|
—
|
|
—
|
|
—
|
|
|||||||||
|
Commercial and multi-family real estate
|
—
|
|
685
|
|
—
|
|
904
|
|
312
|
|
|||||||||
|
1-4 family real estate
|
—
|
|
—
|
|
83
|
|
24
|
|
281
|
|
|||||||||
|
Agricultural
|
—
|
|
—
|
|
—
|
|
5,132
|
|
340
|
|
|||||||||
|
Total Community Banking
|
—
|
|
685
|
|
83
|
|
6,060
|
|
933
|
|
|||||||||
|
Total
|
2,864
|
|
685
|
|
83
|
|
6,060
|
|
933
|
|
|||||||||
|
Accruing loans and leases delinquent 90 days or more:
|
|
|
|
|
|
|
|
|
|
|
|||||||||
|
Commercial finance
|
3,801
|
|
1,205
|
|
965
|
|
1,728
|
|
—
|
|
|||||||||
|
Consumer finance
|
2,384
|
|
1,387
|
|
—
|
|
—
|
|
—
|
|
|||||||||
|
Tax services
(1)
|
1,073
|
|
—
|
|
—
|
|
—
|
|
—
|
|
|||||||||
|
Total National Lending
|
7,258
|
|
2,592
|
|
965
|
|
1,728
|
|
—
|
|
|||||||||
|
1-4 family real estate
|
79
|
|
—
|
|
—
|
|
—
|
|
—
|
|
|||||||||
|
Agricultural
|
—
|
|
34,295
|
|
—
|
|
—
|
|
—
|
|
|||||||||
|
Consumer
|
—
|
|
19
|
|
53
|
|
13
|
|
54
|
|
|||||||||
|
Total Community Banking
|
79
|
|
34,314
|
|
53
|
|
13
|
|
54
|
|
|||||||||
|
Total
|
7,337
|
|
36,906
|
|
1,018
|
|
1,741
|
|
54
|
|
|||||||||
|
Total non-performing loans and leases
|
10,201
|
|
37,591
|
|
1,101
|
|
7,801
|
|
987
|
|
|||||||||
|
Other assets
|
|
|
|
|
|
|
|
|
|
|
|||||||||
|
Foreclosed and repossessed assets:
|
|
|
|
|
|
|
|
|
|
|
|||||||||
|
Commercial finance
|
1,626
|
|
—
|
|
—
|
|
—
|
|
—
|
|
|||||||||
|
Commercial and multi-family real estate
|
—
|
|
62
|
|
76
|
|
—
|
|
—
|
|
|||||||||
|
1-4 family real estate
|
90
|
|
230
|
|
—
|
|
—
|
|
15
|
|
|||||||||
|
Agricultural
|
29,922
|
|
—
|
|
—
|
|
—
|
|
—
|
|
|||||||||
|
Total
|
31,638
|
|
292
|
|
76
|
|
—
|
|
15
|
|
|||||||||
|
Total other assets
|
31,638
|
|
292
|
|
76
|
|
—
|
|
15
|
|
|||||||||
|
Total non-performing assets
|
$
|
41,839
|
|
$
|
37,883
|
|
$
|
1,177
|
|
$
|
7,801
|
|
$
|
1,002
|
|
||||
|
Total as a percentage of total assets
|
0.72
|
%
|
0.72
|
%
|
0.03
|
%
|
0.31
|
%
|
0.05
|
%
|
|||||||||
(1)
Certain tax services loans do not bear interest.
For the year ended
September 30, 2018
, gross interest income that would have been recorded had the non-accruing loans and leases been current in accordance with their original terms amounted to approximately
$0.1 million
, none of which was included in interest income.
17
Non-Accruing Loans
and Leases
At
September 30, 2018
, the Company had
$2.9 million
in non-accruing loans and leases, which constituted less than 0.1% of the Company's gross loan and lease portfolio and total assets. At
September 30, 2017
, the Company had
$0.7 million
in non-accruing loans which also constituted less than 0.1% of its gross loans portfolio and total assets. The fiscal
2018
increase in non-accruing loans and leases relates to an increase in non-accruing loans and leases in the commercial finance portfolio.
Accruing Loans and Leases Delinquent 90 Days or More
At
September 30, 2018
, the Company had
$7.3 million
in accruing loans and leases delinquent 90 days or more, compared to
$36.9 million
at
September 30, 2017
. This balance of accruing loans and leases 90 days or more past due was mainly comprised of National Lending loans and leases.
Classified Assets
Federal regulations provide for the classification of loans, leases, and other assets such as debt and equity securities considered by our primary regulator, the OCC, to be of lesser quality as “substandard,” “doubtful” or “loss,” with each such classification dependent on the facts and circumstances surrounding the assets in question. An asset is considered “substandard” if it is inadequately protected by the current net worth and paying capacity of the obligor or of the collateral pledged, if any. “Substandard” assets include those characterized by the “distinct possibility” that the Bank will sustain “some loss” if the deficiencies are not corrected. Assets classified as “doubtful” have all of the weaknesses inherent in those classified “substandard,” with the added characteristic that the weaknesses present make “collection or liquidation in full,” on the basis of currently existing facts, conditions and values, “highly questionable and improbable.” Assets classified as “loss” are those considered “uncollectible” and of such minimal value that their continuance as assets without the establishment of a specific loss reserve is not warranted.
General allowances represent loss allowances which have been established to recognize the inherent risk associated with lending activities, but which, unlike specific allowances, have not been allocated to particular problem assets. When assets are classified as “loss,” the Bank is required either to establish a specific allowance for losses equal to 100% of that portion of the asset so classified or to charge off such amount. The Bank’s determinations as to the classification of its assets and the amount of its valuation allowances are subject to review by its regulatory authorities, which may order the establishment of additional general or specific loss allowances.
On the basis of management’s review of its classified assets, at
September 30, 2018
, the Company had classified loans and leases of
$24.6 million
as substandard and none as doubtful or loss. Further, at
September 30, 2018
, the Company owned real estate or other assets as a result of foreclosure of loans with a value of
$31.6 million
.
Allowance for Loan and Lease Losses
The allowance for loan and lease losses is established through a provision for loan and lease losses based on management’s evaluation of the risk inherent in its loan and lease portfolio and changes in the nature and volume of its loan and lease activity, including those loans and leases that are being specifically monitored by management. Such evaluation, which includes a review of loans and leases for which full collectability may not be reasonably assured, includes consideration of, among other matters, the estimated fair value of the underlying collateral, economic conditions, historical loan and lease loss experience and other factors that warrant recognition in providing for an appropriate loan and lease loss allowance.
Management closely monitors economic developments both regionally and nationwide, and considers these factors when assessing the appropriateness of its allowance for loan and lease losses. The current economic environment continues to show signs of stability and improvement in the Bank’s markets. The Bank’s average loss rates over the past three years were low relative to industry averages for such years, offset, in the case of fiscal 2016, with a higher agricultural loss rate driven by the charge off of one relationship. The Bank does not believe it is likely these low loss conditions will continue indefinitely. Each loan and lease segment is evaluated using both historical loss factors as well as other qualitative factors in order to determine the amount of risk the Company believes exists within that segment.
18
Management believes that, based on a detailed review of the loan and lease portfolio, historic loan and lease losses, current economic conditions, the size of the loan and lease portfolio and other factors, the level of the allowance for loan and lease losses at
September 30, 2018
reflected an appropriate allowance against probable losses from the lending portfolio. Although the Company maintains its allowance for loan and lease losses at a level it considers to be appropriate, investors and others are cautioned that there can be no assurance that future losses will not exceed estimated amounts, or that additional provisions for loan and lease losses will not be required in future periods. In addition, the Company’s determination of the allowance for loan and lease losses is subject to review by the OCC, which can require the establishment of additional general or specific allowances
Real estate properties acquired through foreclosure are recorded at fair value. If fair value at the date of foreclosure is lower than the balance of the related loan, the difference will be charged to the allowance for loan and lease losses at the time of transfer. Valuations are periodically updated by management and, if the value declines, a specific provision for losses on such property is established by a charge to operations.
19
The following table sets forth an analysis of the Company’s allowance for loan and lease losses.
|
|
September 30,
|
||||||||||||||||||
|
|
2018
|
2017
|
2016
|
2015
|
2014
|
||||||||||||||
|
|
(Dollars in Thousands)
|
||||||||||||||||||
|
Balance at beginning of period
|
$
|
7,534
|
|
$
|
5,635
|
|
$
|
6,255
|
|
$
|
5,397
|
|
$
|
3,930
|
|
||||
|
Charge-offs:
|
|
|
|
|
|
|
|
|
|||||||||||
|
Commercial finance
|
(2,643
|
)
|
(626
|
)
|
(726
|
)
|
(285
|
)
|
—
|
|
|||||||||
|
Consumer finance
|
(1,443
|
)
|
—
|
|
(728
|
)
|
—
|
|
—
|
|
|||||||||
|
Tax services
|
(21,802
|
)
|
(7,841
|
)
|
(249
|
)
|
—
|
|
—
|
|
|||||||||
|
Total National Lending charge-offs
|
(25,888
|
)
|
(8,467
|
)
|
(1,703
|
)
|
(285
|
)
|
—
|
|
|||||||||
|
Commercial and multi-family real estate
|
—
|
|
(138
|
)
|
(385
|
)
|
(214
|
)
|
—
|
|
|||||||||
|
1-4 family real estate
|
(45
|
)
|
—
|
|
(32
|
)
|
(45
|
)
|
—
|
|
|||||||||
|
Agricultural
|
—
|
|
—
|
|
(3,252
|
)
|
(186
|
)
|
(50
|
)
|
|||||||||
|
Commercial operating
|
—
|
|
(390
|
)
|
—
|
|
—
|
|
—
|
|
|||||||||
|
Consumer
|
(31
|
)
|
(2
|
)
|
—
|
|
—
|
|
—
|
|
|||||||||
|
Total Community Banking charge-offs
|
(76
|
)
|
(530
|
)
|
(3,669
|
)
|
(445
|
)
|
(50
|
)
|
|||||||||
|
Total charge-offs
|
(25,964
|
)
|
(8,997
|
)
|
(5,372
|
)
|
(730
|
)
|
(50
|
)
|
|||||||||
|
Recoveries:
|
|||||||||||||||||||
|
Commercial finance
|
1,169
|
|
61
|
|
107
|
|
114
|
|
—
|
|
|||||||||
|
Consumer finance
|
—
|
|
—
|
|
11
|
|
—
|
|
—
|
|
|||||||||
|
Tax services
|
453
|
|
229
|
|
—
|
|
—
|
|
—
|
|
|||||||||
|
Total National Lending recoveries
|
1,622
|
|
290
|
|
118
|
|
114
|
|
—
|
|
|||||||||
|
Commercial and multi-family real estate
|
—
|
|
—
|
|
27
|
|
6
|
|
347
|
|
|||||||||
|
1-4 family real estate
|
—
|
|
—
|
|
—
|
|
—
|
|
2
|
|
|||||||||
|
Agricultural
|
411
|
|
12
|
|
2
|
|
—
|
|
—
|
|
|||||||||
|
Commercial operating
|
—
|
|
5
|
|
—
|
|
3
|
|
18
|
|
|||||||||
|
Consumer
|
3
|
|
—
|
|
—
|
|
—
|
|
—
|
|
|||||||||
|
Total Community Banking recoveries
|
414
|
|
17
|
|
29
|
|
9
|
|
367
|
|
|||||||||
|
Total recoveries
|
2,037
|
|
307
|
|
147
|
|
123
|
|
367
|
|
|||||||||
|
Net (charge-offs) recoveries
|
(23,927
|
)
|
(8,690
|
)
|
(5,225
|
)
|
(607
|
)
|
317
|
|
|||||||||
|
Provision charged to expense
|
29,433
|
|
10,589
|
|
4,605
|
|
1,465
|
|
1,150
|
|
|||||||||
|
Balance at end of period
|
$
|
13,040
|
|
$
|
7,534
|
|
$
|
5,635
|
|
$
|
6,255
|
|
$
|
5,397
|
|
||||
|
Ratio of net charge-offs during the period to
average loans and leases outstanding during the period
|
1.31
|
%
|
0.73
|
%
|
0.06
|
%
|
0.10
|
%
|
(0.07
|
)%
|
|||||||||
|
Ratio of net charge-offs during the period to
non-performing assets at year end
|
57.19
|
%
|
22.94
|
%
|
443.84
|
%
|
7.78
|
%
|
(31.66
|
)%
|
|||||||||
|
Allowance to total loans and leases
|
0.44
|
%
|
0.57
|
%
|
0.61
|
%
|
0.88
|
%
|
1.08
|
%
|
|||||||||
For more information on the Provision for Loan and Lease Losses, see “Management’s Discussion and Analysis of Financial Condition and Results of Operations,” which is included in Item 7 of this Annual Report on Form 10-K.
20
The distribution of the Company’s allowance for losses on loans and leases at the dates indicated is summarized as follows:
|
|
At September 30,
|
|||||||||||||||||||||||||||||||||
|
|
2018
|
2017
|
2016
|
2015
|
2014
|
|||||||||||||||||||||||||||||
|
|
Amount
|
Percent of
Loans and Leases in
Each
Category
of Total
Loans and Leases
|
Amount
|
Percent of
Loans in
Each
Category
of Total
Loans
|
Amount
|
Percent of
Loans in
Each
Category
of Total
Loans
|
Amount
|
Percent of
Loans in
Each
Category
of Total
Loans
|
Amount
|
Percent of
Loans in
Each
Category
of Total
Loans
|
||||||||||||||||||||||||
|
|
(Dollars in Thousands)
|
|||||||||||||||||||||||||||||||||
|
Commercial finance
|
$
|
1,302
|
|
51.3
|
%
|
$
|
800
|
|
19.2
|
%
|
$
|
588
|
|
18.8
|
%
|
$
|
293
|
|
14.9
|
%
|
$
|
—
|
|
—
|
%
|
|||||||||
|
Consumer finance
|
3,670
|
|
11.4
|
|
—
|
|
10.6
|
|
—
|
|
1.5
|
|
—
|
|
1.9
|
|
—
|
|
2.4
|
|
||||||||||||||
|
Tax services
|
—
|
|
—
|
|
5
|
|
—
|
|
5
|
|
—
|
|
—
|
|
—
|
|
—
|
|
—
|
|
||||||||||||||
|
Total National Lending
|
4,972
|
|
62.7
|
|
805
|
|
29.8
|
|
593
|
|
20.4
|
|
293
|
|
16.8
|
|
—
|
|
2.4
|
|
||||||||||||||
|
Commercial & multi-family real estate
|
6,047
|
|
25.4
|
|
2,670
|
|
44.1
|
|
2,198
|
|
45.7
|
|
1,187
|
|
43.5
|
|
1,575
|
|
44.9
|
|
||||||||||||||
|
1-4 family real estate
|
590
|
|
7.7
|
|
803
|
|
14.8
|
|
654
|
|
17.5
|
|
278
|
|
17.5
|
|
552
|
|
23.3
|
|
||||||||||||||
|
Agricultural
|
1,216
|
|
2.0
|
|
2,574
|
|
7.2
|
|
1,474
|
|
10.9
|
|
3,700
|
|
15.1
|
|
982
|
|
19.7
|
|
||||||||||||||
|
Commercial operating
|
173
|
|
1.4
|
|
150
|
|
2.3
|
|
112
|
|
3.1
|
|
28
|
|
4.2
|
|
93
|
|
6.2
|
|
||||||||||||||
|
Consumer
|
42
|
|
0.8
|
|
6
|
|
1.7
|
|
51
|
|
2.5
|
|
20
|
|
2.8
|
|
78
|
|
3.5
|
|
||||||||||||||
|
Total Community Lending
|
8,068
|
|
37.3
|
|
6,203
|
|
70.2
|
|
4,489
|
|
79.6
|
|
5,213
|
|
83.2
|
|
3,280
|
|
97.6
|
|
||||||||||||||
|
Unallocated
|
—
|
|
—
|
|
527
|
|
—
|
|
553
|
|
749
|
|
—
|
|
2,117
|
|
—
|
|
||||||||||||||||
|
Total
|
$
|
13,040
|
|
100.0
|
%
|
$
|
7,534
|
|
100.0
|
%
|
$
|
5,635
|
|
100.0
|
%
|
$
|
6,255
|
|
100.0
|
%
|
$
|
5,397
|
|
100.0
|
%
|
|||||||||
Investment Activities
General
The investment policy of the Company generally is to invest funds among various categories of investments and maturities based upon the Company’s need for liquidity, to achieve the proper balance between its desire to minimize risk and maximize yield, to provide collateral for borrowings and to fulfill the Company’s asset/liability management policies. The Company’s investment and mortgage-backed securities portfolios are managed in accordance with a written investment policy adopted by the Board of Directors, which is implemented by members of the Company’s Investment Committee. The Company closely monitors balances in these accounts, and maintains a portfolio of highly liquid assets to fund potential deposit outflows or other liquidity needs. To date, the Company has not experienced any significant outflows related to the MPS division deposits, though no assurance can be given that this will continue to be the case.
As of
September 30, 2018
, investment securities and MBS with fair values of approximately $1.06 billion, $317.4 million, and $13.9 million were pledged as collateral for the Bank’s Federal Home Loan Bank of Des Moines (“FHLB”) advances, Federal Reserve Bank (“FRB”) advances and collateral for securities sold under agreements to repurchase, respectively. For additional information regarding the Company’s collateralization of borrowings, see Notes 8 and 9 to the “Notes to Consolidated Financial Statements,” which is included in Part II, Item 8 “Financial Statements and Supplementary Data” of this Annual Report on Form 10-K.
Investment Securities
It is the Company’s general policy to purchase investment securities which are U.S. Government-related securities, U.S. Government-related agency and instrumentality securities, U.S. Government-related agency or instrumentality collateralized securities, state and local government obligations, commercial paper, corporate debt securities and overnight federal funds.
21
As of
September 30, 2018
, the Company had total investment securities, excluding MBS, with an amortized cost of
$1.68 billion
compared to
$1.54 billion
as of
September 30, 2017
. At
September 30, 2018
, $1.21 billion, or 74%, of the Company’s investment securities were pledged to secure various obligations of the Company. Many of the Company’s municipal holdings are able to be pledged at both the FRB and the FHLB.
As of
September 30, 2018
, the Company held obligations of states and political subdivisions of
$1.28 billion
, representing
76.0%
of total investment securities, excluding MBS. This amount is spread among 45 of the 50 states of the U.S. and the District of Columbia, with no individual state (excluding U.S. Government agency or instrumentality backed and/or convertible municipal securities) having a concentration higher than 10% of the total carrying value of the municipal portfolio. Management believes this geographical diversification lessens the credit risk associated with these investments. The Company also monitors concentrations of the ultimate borrower and exposure to counties within each state to further enhance proper diversification.
The following table sets forth the carrying value of the Company’s investment securities portfolio, excluding MBS, at the dates indicated.
|
|
At September 30,
|
||||||||||
|
|
2018
|
2017
|
2016
|
||||||||
|
|
(Dollars in Thousands)
|
||||||||||
|
Investment Securities AFS
|
|||||||||||
|
Trust preferred and corporate securities
|
$
|
—
|
|
$
|
—
|
|
$
|
12,978
|
|
||
|
Asset backed securities
|
313,028
|
|
96,832
|
|
116,815
|
|
|||||
|
Small business administration securities
|
44,337
|
|
57,871
|
|
80,719
|
|
|||||
|
Obligations of states and political subdivisions
|
16,910
|
|
—
|
|
—
|
|
|||||
|
Non-bank qualified obligations of states and political subdivisions
|
1,109,885
|
|
950,829
|
|
698,672
|
|
|||||
|
Common equities and mutual funds
|
3,800
|
|
1,445
|
|
1,125
|
|
|||||
|
Subtotal AFS
|
1,487,960
|
|
1,106,977
|
|
910,309
|
|
|||||
|
Investment Securities HTM
|
|||||||||||
|
Obligations of states and political subdivisions
|
—
|
|
19,247
|
|
20,626
|
|
|||||
|
Non-bank qualified obligations of states and political subdivisions
(1)
|
164,304
|
|
430,593
|
|
465,469
|
|
|||||
|
Subtotal HTM
|
164,304
|
|
449,840
|
|
486,095
|
|
|||||
|
FHLB Stock
|
23,400
|
|
61,123
|
|
47,512
|
|
|||||
|
Total Investment Securities and FHLB Stock
|
$
|
1,675,664
|
|
$
|
1,617,940
|
|
$
|
1,443,916
|
|
||
|
Other Interest-Earning Assets:
|
|||||||||||
|
Interest bearing deposits in other financial institutions and federal funds sold
(2)
|
$
|
4,248
|
|
$
|
1,227,308
|
|
$
|
513,441
|
|
||
(1)
Includes no taxable obligations of states and political subdivisions.
(2)
From time to time, the Company maintains balances in excess of insured limits at various financial institutions, including the FHLB, the FRB, and other private institutions. At
September 30, 2018
, the Company had $4.2 million in interest bearing deposits held at the FRB and none at other institutions. At
September 30, 2018
, the Company did not have interest bearing deposits held at the FHLB and had no federal funds sold at a private institution.
The composition and maturities of the Company’s available for sale and held to maturity investment securities portfolio at September 30, 2018, excluding equity securities and mutual funds, FHLB stock and MBS, are indicated in the following table. The actual maturity of certain municipal housing related securities is typically less than its stated contractual maturity due to scheduled principal payments and prepayments of the underlying mortgages.
22
|
|
September 30, 2018
|
||||||||||||||||||||||
|
|
1 Year or Less
|
After 1 Year Through 5 Years
|
After 5 Years Through 10 Years
|
After 10 Years
|
Total Investment Securities
|
||||||||||||||||||
|
|
Carrying Value
|
Carrying Value
|
Carrying Value
|
Carrying Value
|
Amortized Cost
|
Fair Value
|
|||||||||||||||||
|
Available for Sale
|
(Dollars in Thousands)
|
||||||||||||||||||||||
|
Asset backed securities
|
$
|
—
|
|
$
|
—
|
|
$
|
—
|
|
$
|
313,028
|
|
$
|
310,700
|
|
$
|
313,028
|
|
|||||
|
Small business administration securities
|
—
|
|
1,241
|
|
29,940
|
|
13,156
|
|
45,591
|
|
44,337
|
|
|||||||||||
|
Obligations of states and political subdivisions
|
1,700
|
|
5,941
|
|
6,181
|
|
3,088
|
|
17,154
|
|
16,910
|
|
|||||||||||
|
Non-bank qualified obligations of states and political subdivisions
|
829
|
|
34,322
|
|
314,022
|
|
760,712
|
|
1,140,884
|
|
1,109,885
|
|
|||||||||||
|
Total Investment Securities AFS
|
$
|
2,529
|
|
$
|
41,504
|
|
$
|
350,143
|
|
$
|
1,089,984
|
|
$
|
1,514,329
|
|
$
|
1,484,160
|
|
|||||
|
Weighted Average Yield
(1)
|
0.97
|
%
|
1.80
|
%
|
2.03
|
%
|
2.57
|
%
|
2.79
|
%
|
2.38
|
%
|
|||||||||||
|
|
September 30, 2018
|
||||||||||||||||||||||
|
|
1 Year or Less
|
After 1 Year Through 5 Years
|
After 5 Years Through 10 Years
|
After 10 Years
|
Total Investment Securities
|
||||||||||||||||||
|
|
Carrying Value
|
Carrying Value
|
Carrying Value
|
Carrying Value
|
Amortized Cost
|
Fair Value
|
|||||||||||||||||
|
Held to Maturity
|
(Dollars in Thousands)
|
||||||||||||||||||||||
|
Non-bank qualified obligations of states and political subdivisions
|
$
|
—
|
|
$
|
—
|
|
$
|
—
|
|
$
|
164,304
|
|
$
|
164,304
|
|
$
|
153,546
|
|
|||||
|
Total Investment Securities HTM
|
$
|
—
|
|
$
|
—
|
|
$
|
—
|
|
$
|
164,304
|
|
$
|
164,304
|
|
$
|
153,546
|
|
|||||
|
Weighted Average Yield
(1)
|
—
|
%
|
—
|
%
|
—
|
%
|
2.91
|
%
|
2.72
|
%
|
2.77
|
%
|
|||||||||||
(1)
Yields on tax-exempt obligations have not been computed on a tax-equivalent basis.
Mortgage-Backed Securities
The Company’s mortgage-backed and related securities portfolio as of
September 30, 2018
consisted entirely of securities issued by U.S. Government agencies or instrumentalities, including those of Ginnie Mae, Fannie Mae, Freddie Mac and Farmer Mac. The Ginnie Mae, Fannie Mae, Freddie Mac and Farmer Mac certificates are modified pass‑through MBS representing undivided interests in underlying pools of fixed‑rate, or certain types of adjustable-rate, predominantly single-family mortgages issued by these U.S. Government agencies or instrumentalities.
At
September 30, 2018
, the Company had a diverse portfolio of MBS with an amortized cost of
$386.2 million
, all at fixed rates of interest. The fair market value of the MBS at September 30, 2018 was $371.5 million. At
September 30, 2018
, the Company primarily held seasoned 20-year, 30-year, and 40-year pass through MBS. Coupons on these securities ranged from below 3% to 4.5%.
MBS generally increase the quality of the Company’s assets by virtue of the insurance or guarantees that back them, are more liquid than individual mortgage loans, and may be used to collateralize borrowings or other obligations of the Company. At
September 30, 2018
, $175.1 million, or 47%, of the Company’s MBS were pledged to secure various obligations of the Company.
23
While MBS carry a reduced credit risk as compared to whole loans, such securities remain subject to the risk that a fluctuating interest rate environment, along with other factors such as the geographic distribution and other underwriting risks inherent in the underlying mortgage loans, may alter the prepayment rate of such mortgage loans and so affect both the prepayment speed, and value, of such securities. The prepayment risk associated with MBS is continually monitored, and prepayment rate assumptions are adjusted as appropriate to update the Company’s MBS accounting and asset/liability reports.
The following table sets forth the carrying value of the Company’s MBS at the dates indicated.
|
|
At September 30,
|
||||||||||
|
|
2018
|
2017
|
2016
|
||||||||
|
Available for Sale
|
(Dollars in Thousands)
|
||||||||||
|
Farmer Mac
|
$
|
52,849
|
|
$
|
—
|
|
$
|
—
|
|
||
|
Freddie Mac
|
69,575
|
|
100,287
|
|
164,577
|
|
|||||
|
Fannie Mae
|
241,641
|
|
486,167
|
|
394,363
|
|
|||||
|
Total AFS
|
$
|
364,065
|
|
$
|
586,454
|
|
$
|
558,940
|
|
||
|
|
At September 30,
|
||||||||||
|
|
2018
|
2017
|
2016
|
||||||||
|
Held to Maturity
|
(Dollars in Thousands)
|
||||||||||
|
Farmer Mac
|
$
|
—
|
|
$
|
61,295
|
|
$
|
71,011
|
|
||
|
Fannie Mae
|
—
|
|
43,458
|
|
51,894
|
|
|||||
|
Ginnie Mae
|
7,850
|
|
8,936
|
|
10,853
|
|
|||||
|
Total HTM
|
$
|
7,850
|
|
$
|
113,689
|
|
$
|
133,758
|
|
||
24
The following table sets forth the contractual maturities of the Company’s MBS at
September 30, 2018
. Excluded from the table below is the effect of prepayments, periodic principal repayments and the adjustable-rate nature of these instruments, all of which typically lower the average life of these securities.
|
|
September 30, 2018
|
||||||||||||||||||||||
|
|
1 Year or Less
|
After 1 Year Through 5 Years
|
After 5 Years Through 10 Years
|
After 10 Years
|
Total Investment Securities
|
||||||||||||||||||
|
|
Carrying Value
|
Carrying Value
|
Carrying Value
|
Carrying Value
|
Amortized Cost
|
Fair Value
|
|||||||||||||||||
|
Available for Sale
|
(Dollars in Thousands)
|
||||||||||||||||||||||
|
Farmer Mac
|
$
|
—
|
|
$
|
—
|
|
$
|
—
|
|
$
|
52,849
|
|
$
|
55,206
|
|
$
|
52,849
|
|
|||||
|
Freddie Mac
|
—
|
|
—
|
|
—
|
|
69,575
|
|
72,388
|
|
69,575
|
|
|||||||||||
|
Fannie Mae
|
—
|
|
—
|
|
—
|
|
241,641
|
|
250,707
|
|
241,641
|
|
|||||||||||
|
Total Investment Securities
|
$
|
—
|
|
$
|
—
|
|
$
|
—
|
|
$
|
364,065
|
|
$
|
378,301
|
|
$
|
364,065
|
|
|||||
|
Weighted Average Yield
|
—
|
%
|
—
|
%
|
—
|
%
|
2.87
|
%
|
2.61
|
%
|
2.87
|
%
|
|||||||||||
|
|
September 30, 2018
|
||||||||||||||||||||||
|
|
1 Year or Less
|
After 1 Year Through 5 Years
|
After 5 Years Through 10 Years
|
After 10 Years
|
Total Investment Securities
|
||||||||||||||||||
|
|
Carrying Value
|
Carrying Value
|
Carrying Value
|
Carrying Value
|
Amortized Cost
|
Fair Value
|
|||||||||||||||||
|
Held to Maturity
|
(Dollars in Thousands)
|
||||||||||||||||||||||
|
Ginnie Mae
|
$
|
—
|
|
$
|
—
|
|
$
|
—
|
|
$
|
7,850
|
|
$
|
7,850
|
|
$
|
7,428
|
|
|||||
|
Total Investment Securities
|
—
|
|
—
|
|
—
|
|
7,850
|
|
7,850
|
|
7,428
|
|
|||||||||||
|
Weighted Average Yield
|
—
|
%
|
—
|
%
|
—
|
%
|
2.45
|
%
|
2.45
|
%
|
2.79
|
%
|
|||||||||||
At
September 30, 2018
, the contractual maturity of all of the Company’s MBS was in excess of ten years. The actual maturity of a mortgage-backed security is typically less than its stated contractual maturity due to scheduled principal payments and prepayments of the underlying mortgages. Prepayments that are different than anticipated will affect the yield to maturity. The yield is based upon the interest income and the amortization of any premium or discount related to the mortgage-backed security. In accordance with U.S. Generally Accepted Accounting Principles (“GAAP”), premiums and discounts are amortized over the estimated lives of the loans, which decrease and increase interest income, respectively. The prepayment assumptions used to determine the amortization period for premiums and discounts can significantly affect the yield of MBS, and these assumptions are reviewed periodically to reflect actual prepayments. Although prepayments of underlying mortgages depend on many factors, including the type of mortgages, the coupon rate, borrower credit scores, loan to premises value, the age of mortgages, the geographical location of the underlying real estate collateralizing the mortgages and general levels of market interest rates, the difference between the interest rates on the underlying mortgages and the prevailing mortgage interest rates generally is the most significant determinant of the rate of prepayments. During periods of falling mortgage interest rates, if the coupon rate of the underlying mortgages exceeds the prevailing market interest rates offered for mortgage loans, refinancing generally increases and accelerates the prepayment of the underlying mortgages and the related security. Under such circumstances, the Company may be subject to reinvestment risk because, to the extent that the Company’s MBS amortize or prepay faster than anticipated, the Company may not be able to reinvest the proceeds of such repayments and prepayments at a comparable rate. During periods of rising interest rates, these prepayments tend to decelerate as the prevailing market interest rates for mortgage rates increase and prepayment incentives dissipate.
25
During the first quarter of fiscal 2018, the Company early adopted Accounting Standard Update ("ASU") 2017-12,
"Derivatives and Hedging (Topic 815): Targeted Improvements to Accounting for Hedging Activities."
Due to the early adoption of the ASU, the Company transferred $204.7 million of investment securities and $101.3 million of MBS from held to maturity ("HTM") to available for sale ("AFS") during the first quarter of fiscal 2018. In connection with the Crestmark Acquisition, the Company transferred $40.9 million of investment securities from HTM to AFS during the fourth quarter of fiscal 2018, as allowed through FASB's Accounting Standards Codification ("ASC") 320-10-25-6(c), which allows for the transfer of securities from HTM in the event of a major business combination.
Management has implemented a process to identify securities with potential credit impairment that are other-than-temporary. This process involves evaluation of the length of time and extent to which the fair value has been less than the amortized cost basis, review of available information regarding the financial position of the issuer, monitoring the rating, watch, and outlook of the security, monitoring changes in value, cash flow projections, and the Company’s intent to sell a security or whether it is more likely than not we will be required to sell the security before the recovery of its amortized cost which, in some cases, may extend to maturity. To the extent we determine that a security is deemed to be other-than-temporarily impaired, an impairment loss is recognized.
For all securities considered temporarily impaired, the Company does not intend to sell these securities and it is not more likely than not that the Company will be required to sell the security before recovery of its amortized cost, which may occur at maturity. The Company believes it will collect all principal and interest due on all investments with amortized cost in excess of fair value and considered only temporarily impaired.
In fiscal
2018
,
2017
and
2016
, there were no other-than-temporary impairments recorded. Fannie Mae and Freddie Mac, which are both in conservatorship, generally provide the certificate holder a guarantee of timely payments of interest, whether or not collected. Ginnie Mae’s guarantee to the holder is timely payments of principal and interest, backed by the full faith and credit of the U.S. Government.
Funding Activities
General
The Company’s sources of funds are deposits, borrowings, amortization and repayment of loan and lease principal, interest earned on or maturation of investment securities and short-term investments, MBS and funds provided from operations.
Borrowings, including FHLB advances, repurchase agreements, other short-term borrowings, and funds available through the FRB Discount Window, may be used at times to compensate for seasonal reductions in deposits or deposit inflows at less than projected levels, may be used on a longer-term basis to support expanded lending activities, and may also be used to match the funding of a corresponding asset.
Deposits
The Company offers a variety of deposit accounts having a wide range of interest rates and terms. The Company’s deposits consist of statement savings accounts, money market savings accounts, negotiable order of withdrawal accounts ("NOW") and regular checking accounts, deposits related to prepaid cards primarily categorized as checking accounts and certificate accounts currently ranging in terms from three months to five years. The Company solicits deposits from its primary market area and relies primarily on competitive pricing policies, advertising and high-quality customer service to attract and retain these deposits. In addition, the Company may periodically utilize brokered deposits to target strategic maturities related to our seasonal tax advance lending. The tax advance lending season typically lasts six weeks or less and it is generally more efficient to fund these short-term loans by using brokered deposits rather than by selling investment securities. Other sources of brokered deposits may also be utilized periodically to take advantage of balance sheet funding opportunities.
The flow of deposits is influenced significantly by general economic conditions, changes in money market and prevailing interest rates, and competition.
26
The variety of deposit accounts offered by the Company has allowed it to be competitive in obtaining funds and to respond with flexibility to changes in consumer demand. The Company endeavors to manage the pricing of its deposits in keeping with its asset/liability management and profitability objectives. Based on its experience, the Company believes that its savings, money market accounts, NOW, regular checking accounts and deposits related to prepaid cards are relatively stable sources of deposits. However, the ability of the Company to attract and maintain certificates of deposit and the rates paid on these deposits has been and will continue to be significantly affected by market conditions.
At
September 30, 2018
,
$2.41 billion
of the Company’s
$4.43 billion
deposit portfolio was attributable to the Payments segment. The majority of these deposits represent funds available to spend on prepaid debit cards and other stored value products, of which $2.33 billion are included with non-interest-bearing checking accounts and $81.6 million are included with interest-bearing checking and savings deposits on the Company’s Consolidated Statements of Financial Condition. Generally, these deposits do not pay interest. The Payments segment originates debit card programs through outside sales agents and other financial institutions. As such, these deposits carry a somewhat higher degree of concentration risk than traditional consumer products. If a major client or card program were to leave the Bank, deposit outflows could be more significant than if the Bank were to lose a more traditional customer, although it is considered unlikely that all deposits related to a program would leave the Bank without significant advance notification. As such, and as historical results indicate, the Company believes that its deposit portfolio attributable to the Payments segment is stable. The increase in deposits arising from Payments has allowed the Bank to reduce its reliance on certificates of deposits and public funds, which typically have relatively higher costs. See “Regulation - FDIC Deposit Classification Guidance.”
The following table sets forth the deposit flows at the Company during the periods indicated.
|
|
September 30,
|
||||||||||
|
|
2018
|
2017
|
2016
|
||||||||
|
|
(Dollars in Thousands)
|
||||||||||
|
Opening Balance
|
$
|
3,223,424
|
|
$
|
2,430,082
|
|
$
|
1,657,534
|
|
||
|
Acquired
|
1,120,666
|
|
—
|
|
—
|
|
|||||
|
Deposits
|
418,034,951
|
|
418,732,743
|
|
418,950,277
|
|
|||||
|
Withdrawals
|
(417,955,022
|
)
|
(417,941,472
|
)
|
(418,178,086
|
)
|
|||||
|
Interest Credited
|
6,968
|
|
2,071
|
|
357
|
|
|||||
|
Ending Balance
|
$
|
4,430,987
|
|
$
|
3,223,424
|
|
$
|
2,430,082
|
|
||
|
Net Increase
|
$
|
1,207,563
|
|
$
|
793,342
|
|
$
|
772,548
|
|
||
|
Percent Increase
|
37.46
|
%
|
32.65
|
%
|
46.61
|
%
|
|||||
27
The following table sets forth the dollar amount of deposits in the various types of deposit programs offered by the Company for the periods indicated.
|
September 30,
|
||||||||||||||||||||
|
2018
|
2017
|
2016
|
||||||||||||||||||
|
Amount
|
Percent of
Total
|
Amount
|
Percent of
Total
|
Amount
|
Percent of
Total
|
|||||||||||||||
|
(Dollars in Thousands)
|
||||||||||||||||||||
|
Transactions and Savings Deposits:
|
||||||||||||||||||||
|
Non-interest bearing checking
|
$
|
2,405,274
|
|
54.3
|
%
|
$
|
2,454,057
|
|
76.1
|
%
|
$
|
2,167,522
|
|
89.2
|
%
|
|||||
|
Interest bearing checking
|
111,587
|
|
2.5
|
%
|
67,294
|
|
2.1
|
%
|
38,077
|
|
1.6
|
%
|
||||||||
|
Savings deposits
|
54,765
|
|
1.2
|
%
|
53,505
|
|
1.7
|
%
|
50,742
|
|
2.1
|
%
|
||||||||
|
Money market deposits
|
51,995
|
|
1.2
|
%
|
48,758
|
|
1.5
|
%
|
47,749
|
|
1.9
|
%
|
||||||||
|
Wholesale deposits
|
94,384
|
|
2.1
|
%
|
18,245
|
|
0.6
|
%
|
—
|
|
—
|
%
|
||||||||
|
Total non-certificate deposits
|
$
|
2,718,005
|
|
61.3
|
%
|
$
|
2,641,859
|
|
82.0
|
%
|
$
|
2,304,090
|
|
94.8
|
%
|
|||||
|
Time Certificates of Deposit:
|
|
|
|
|
|
|
|
|
|
|
|
|
||||||||
|
Variable
|
$
|
109
|
|
—
|
%
|
$
|
103
|
|
—
|
%
|
$
|
124
|
|
—
|
%
|
|||||
|
0.00 - 0.99%
|
85,895
|
|
2.0
|
%
|
58,745
|
|
1.8
|
%
|
125,519
|
|
5.2
|
%
|
||||||||
|
1.00 - 1.99%
|
718,447
|
|
16.2
|
%
|
522,393
|
|
16.2
|
%
|
349
|
|
—
|
%
|
||||||||
|
2.00 - 2.99%
|
907,989
|
|
20.5
|
%
|
324
|
|
—
|
%
|
—
|
|
—
|
%
|
||||||||
|
3.00 - 3.99%
|
542
|
|
—
|
%
|
—
|
|
—
|
%
|
—
|
|
—
|
%
|
||||||||
|
Total time certificates of deposits
(1)
|
$
|
1,712,982
|
|
38.7
|
%
|
$
|
581,565
|
|
18.0
|
%
|
$
|
125,992
|
|
5.2
|
%
|
|||||
|
Total deposits
|
$
|
4,430,987
|
|
100.0
|
%
|
$
|
3,223,424
|
|
100.0
|
%
|
$
|
2,430,082
|
|
100.0
|
%
|
|||||
(1)
As of September 30, 2018, total time certificates of deposits included
$1.44 billion
of wholesale certificates of deposits.
28
The following table shows rate and maturity information for the Company’s certificates of deposit as of
September 30, 2018
.
|
|
Variable
|
0.00- 0.99%
|
1.00 - 1.99%
|
2.00 - 2.99%
|
3.00 - 3.99%
|
Total
|
Percent of
Total
|
|||||||||||||||||||
|
|
(Dollars in Thousands)
|
|||||||||||||||||||||||||
|
Certificate accounts maturing in quarter ending:
|
|
|
|
|
||||||||||||||||||||||
|
December 31, 2018
|
$
|
9
|
|
$
|
49,910
|
|
$
|
439,982
|
|
$
|
72,393
|
|
$
|
—
|
|
$
|
562,294
|
|
32.8
|
%
|
||||||
|
March 31, 2019
|
27
|
|
11,875
|
|
129,808
|
|
517,339
|
|
—
|
|
659,049
|
|
38.5
|
%
|
||||||||||||
|
June 30, 2019
|
14
|
|
7,482
|
|
44,091
|
|
88,834
|
|
—
|
|
140,421
|
|
8.2
|
%
|
||||||||||||
|
September 30, 2019
|
18
|
|
7,744
|
|
37,131
|
|
155,903
|
|
241
|
|
201,037
|
|
11.7
|
%
|
||||||||||||
|
December 31, 2019
|
9
|
|
2,565
|
|
22,835
|
|
9,773
|
|
—
|
|
35,182
|
|
2.0
|
%
|
||||||||||||
|
March 31, 2020
|
32
|
|
1,673
|
|
5,178
|
|
45,895
|
|
—
|
|
52,778
|
|
3.1
|
%
|
||||||||||||
|
June 30, 2020
|
—
|
|
2,015
|
|
18,622
|
|
1,949
|
|
—
|
|
22,586
|
|
1.3
|
%
|
||||||||||||
|
September 30, 2020
|
—
|
|
1,458
|
|
5,417
|
|
7,958
|
|
202
|
|
15,035
|
|
0.9
|
%
|
||||||||||||
|
December 31, 2020
|
—
|
|
174
|
|
3,068
|
|
3,552
|
|
—
|
|
6,794
|
|
0.4
|
%
|
||||||||||||
|
March 31, 2021
|
—
|
|
261
|
|
839
|
|
660
|
|
—
|
|
1,760
|
|
0.1
|
%
|
||||||||||||
|
June 30, 2021
|
—
|
|
86
|
|
4,353
|
|
383
|
|
—
|
|
4,822
|
|
0.3
|
%
|
||||||||||||
|
September 30, 2021
|
—
|
|
506
|
|
1,995
|
|
746
|
|
—
|
|
3,247
|
|
0.2
|
%
|
||||||||||||
|
Thereafter
|
—
|
|
146
|
|
5,128
|
|
2,604
|
|
99
|
|
7,977
|
|
0.5
|
%
|
||||||||||||
|
Total
|
$
|
109
|
|
$
|
85,895
|
|
$
|
718,447
|
|
$
|
907,989
|
|
$
|
542
|
|
$
|
1,712,982
|
|
100.0
|
%
|
||||||
|
Percent of total
|
—
|
%
|
5.0
|
%
|
41.9
|
%
|
53.0
|
%
|
0.1
|
%
|
100.0
|
%
|
|
|
||||||||||||
The following table indicates the amount of the Company’s certificates of deposit and other deposits by time remaining until maturity as of
September 30, 2018
.
|
|
Maturity
|
||||||||||||||||||
|
|
3 Months or
Less
|
After 3 to 6
Months
|
After 6 to 12
Months
|
After 12 Months
|
Total
|
||||||||||||||
|
|
(Dollars in Thousands)
|
||||||||||||||||||
|
Certificates of deposit less than $250,000
|
$
|
486,336
|
|
$
|
626,907
|
|
$
|
295,762
|
|
$
|
140,722
|
|
$
|
1,549,727
|
|
||||
|
Certificates of deposit of $250,000 or more
|
75,958
|
|
32,142
|
|
45,696
|
|
9,459
|
|
$
|
163,255
|
|
||||||||
|
Total certificates of deposit
|
$
|
562,294
|
|
$
|
659,049
|
|
$
|
341,458
|
|
$
|
150,181
|
|
$
|
1,712,982
|
|
||||
At
September 30, 2018
, there were $14.4 million in deposits from governmental and other public entities included in certificates of deposit.
Borrowings
Although deposits are the Company’s primary source of funds, the Company’s practice has been to utilize borrowings when they are a less costly source of funds, can be invested at a positive interest rate spread, or when the Company desires additional capacity to fund loan demand. Borrowings from various sources mature based on stated payment schedules.
The Company’s borrowings have historically consisted primarily of advances from the FHLB upon the security of a blanket collateral agreement of a percentage of unencumbered loans and the pledge of specific investment securities. Such advances can be made pursuant to several different credit programs, each of which has its own interest rate and range of maturities. At
September 30, 2018
, the Bank had
$422.0 million
of overnight borrowings,
no
term advances, and the ability to borrow up to an approximate additional $1.45 billion from the FHLB.
29
The Company completed the public offering of $75.0 million of 5.75% fixed-to-floating rate subordinated debentures during fiscal year 2016. These notes are due August 15, 2026. The subordinated debentures were sold at par, resulting in net proceeds of approximately $73.9 million. At
September 30, 2018
,
$73.5 million
in subordinated debentures, net of issuance costs of
$1.5 million
, were outstanding.
On July 16, 2001, the Company issued all of the 10,310 authorized shares of Company Obligated Mandatorily Redeemable Preferred Securities of First Midwest Financial Capital Trust I (preferred securities of subsidiary trust) holding solely trust preferred securities. Distributions are paid semi‑annually. Cumulative cash distributions are calculated at a variable rate of the London Interbank Offered Rate (“LIBOR”) plus 3.75%, not to exceed 12.5%. The Company may, at one or more times, defer interest payments on the capital securities for up to 10 consecutive semi-annual periods, but not beyond July 25, 2031. At the end of any deferral period, all accumulated and unpaid distributions must be paid. The capital securities are required to be redeemed on July 25, 2031; however, the Company has a semi‑annual option to shorten the maturity date. The option has not been exercised as of the date of this filing. The redemption price is $1,000 per capital security plus any accrued and unpaid distributions to the date of redemption. Holders of the capital securities have no voting rights, are unsecured, and rank junior in priority of payment to all of the Company’s indebtedness and senior to the Company’s common stock. The trust preferred securities have been includable in the Company’s capital calculations since they were issued. The preferential capital treatment of the Company’s trust preferred securities was grandfathered under recent banking legislation. The outstanding balance of the trust preferred securities at September 30, 2018 was $10.3 million.
Through the Crestmark Acquisition, the Company acquired $3.4 million in floating rate capital securities due to Crestmark Capital Trust I, a 100%-owned nonconsolidated subsidiary of the Company. The subordinated debentures bear interest at LIBOR plus 3.00%, have a stated maturity of 30 years and are redeemable by the Company at par, with regulatory approval. The interest rate is reset quarterly at distribution dates in February, May, August, and November. The subsidiary has the option to defer interest payments on the subordinated debentures from time to time for a period not to exceed five consecutive years.
The Company has a line of credit with another financial institution for $25.0 million as of
September 30, 2018
. This line of credit has no fee, and, as of September 30, 2018, the Company has not drawn on it.
From time to time, the Company has offered retail repurchase agreements to its customers. These agreements typically range from 14 days to five years in term, and typically have been offered in minimum amounts of $100,000. The proceeds of these transactions are used to meet cash flow needs of the Company. At
September 30, 2018
, the Company had
$3.7 million
of retail repurchase agreements outstanding.
As of September 30, 2018, the Company had
three
capital leases,
two
equipment leases and
one
property lease. At September 30, 2018, the portion of the liability expected to be expensed and amortized over the fiscal year ending September 30, 2019 is approximately
$64,818
, while the portion of the liability expected to be expensed and amortized beyond
12
months is
$1.8 million
. The majority of the
$1.8 million
is related to the Urbandale, Iowa retail branch location.
30
The following table sets forth the maximum month-end balance and average balance of FHLB advances, retail and reverse repurchase agreements, trust preferred securities, subordinated debentures, capital leases, and overnight fed funds purchased for the periods indicated.
|
|
Year Ended September 30,
|
||||||||||
|
|
2018
|
2017
|
2016
|
||||||||
|
|
(Dollars in Thousands)
|
||||||||||
|
Maximum Balance:
|
|||||||||||
|
FHLB advances
|
$
|
620,000
|
|
$
|
415,000
|
|
$
|
107,000
|
|
||
|
Repurchase agreements
|
3,740
|
|
3,782
|
|
3,468
|
|
|||||
|
Trust preferred securities
|
13,919
|
|
10,310
|
|
10,310
|
|
|||||
|
Subordinated debentures
|
73,491
|
|
73,347
|
|
73,211
|
|
|||||
|
Capital leases
|
1,932
|
|
2,012
|
|
2,137
|
|
|||||
|
Other overnight borrowings
|
44,000
|
|
20,000
|
|
—
|
|
|||||
|
Overnight fed funds purchased
|
1,134,000
|
|
987,000
|
|
992,000
|
|
|||||
|
Average Balance:
|
|
|
|
|
|
|
|||||
|
FHLB advances
|
$
|
68,356
|
|
$
|
52,956
|
|
$
|
61,454
|
|
||
|
Repurchase agreements
|
2,557
|
|
2,225
|
|
2,179
|
|
|||||
|
Trust preferred securities
|
10,906
|
|
10,310
|
|
10,310
|
|
|||||
|
Subordinated debentures
|
73,412
|
|
73,273
|
|
9,437
|
|
|||||
|
Capital leases
|
1,907
|
|
1,979
|
|
2,086
|
|
|||||
|
Other overnight borrowings
|
12,644
|
|
1,425
|
|
—
|
|
|||||
|
Overnight fed funds purchased
|
326,786
|
|
259,378
|
|
339,035
|
|
|||||
The following table sets forth certain information as to the Company’s FHLB advances, retail and reverse repurchase agreements, trust preferred securities, subordinated debentures, capital leases, and overnight fed funds purchased at the dates indicated.
|
|
September 30,
|
||||||||||
|
|
2018
|
2017
|
2016
|
||||||||
|
|
(Dollars in Thousands)
|
||||||||||
|
FHLB advances
|
$
|
—
|
|
$
|
415,000
|
|
$
|
107,000
|
|
||
|
Repurchase agreements
|
3,694
|
|
2,472
|
|
3,039
|
|
|||||
|
Trust preferred securities
|
13,661
|
|
10,310
|
|
10,310
|
|
|||||
|
Subordinated debentures
|
73,491
|
|
73,347
|
|
73,211
|
|
|||||
|
Capital leases
|
1,876
|
|
1,938
|
|
2,018
|
|
|||||
|
Overnight fed funds purchased
|
422,000
|
|
987,000
|
|
992,000
|
|
|||||
|
Total borrowings
|
$
|
514,722
|
|
$
|
1,490,067
|
|
$
|
1,187,578
|
|
||
|
Weighted average interest rate of FHLB advances
|
—
|
%
|
1.27
|
%
|
0.89
|
%
|
|||||
|
Weighted average interest rate of repurchase agreements
|
2.05
|
%
|
0.98
|
%
|
0.60
|
%
|
|||||
|
Weighted average interest rate of trust preferred securities
|
6.35
|
%
|
5.26
|
%
|
4.99
|
%
|
|||||
|
Weighted average interest rate of subordinated debentures
|
5.75
|
%
|
5.75
|
%
|
5.75
|
%
|
|||||
|
Weighted average interest rate of overnight fed funds purchased
|
2.39
|
%
|
1.33
|
%
|
0.45
|
%
|
|||||
31
Subsidiary Activities
The subsidiaries of the Company are the Bank and First Midwest Financial Capital Trust I.
Payments Activities
The Company, through the MPS division, is focused on innovation in the fintech and payments industries. MPS offers a complement of prepaid cards, consumer credit products and other payment industry- related products and services that are marketed to consumers through financial institutions and other commercial entities on a nationwide basis. The products and services offered by MPS are generally designed to facilitate the processing and settlement of authorized electronic transactions involving the movement of funds. MPS offers specific product solutions in the areas of prepaid cards and ATM sponsorship. MPS’ products and services generally target banks, card processors, third parties that market and distribute the cards, resellers and independent tax preparers (EROs).
Each line of MPS’ business is discussed generally below. We cross-utilize personnel and resources across these lines of business (for example, MPS may develop products for both prepaid and consumer credit needs pursuant to a client's request).
Prepaid Cards
Prepaid cards are debit cards that are embedded with a magnetic stripe which encodes relevant card data (which may or may not include information about the user and/or purchaser of such card), or an EMV chip, which is equipped with a microprocessor chip and the technology used to authenticate chip card transactions. When the holder of such a card attempts a permitted transaction, necessary information, including the authorization for such transaction, is shared between the “point of use” or “point of sale” and authorization systems maintaining the account of record. Most recently, “virtual” prepaid cards have become popular in the industry. Virtual prepaid cards are used in both the consumer space, for example as a gift card, and in the commercial arena to facilitate accounts payable and vendor payments.
The funds associated with such cards are typically held in pooled accounts at the Bank representing the aggregate value of all cards issued in connection with particular products or programs. Although the funds are held in pooled accounts, the account of record indicates the funds held by each individual card. The cards may work in a closed loop (e.g., the card will only work at one particular merchant and will not work anywhere else), a "Restricted Access Network" (e.g., the card will only work at a specific set of merchants such as a shopping mall), or in an open loop which functions as a Visa, MasterCard, or Discover branded debit card that will work wherever such cards are accepted for payment. Most of MPS’ prepaid cards are open loop.
The MPS prepaid card business can generally be divided into two program categories: Consumer Use and Business or Commercial Use products. These programs are typically offered through a third-party relationship.
Consumer Use
Examples of consumer use prepaid card programs include payroll, general purpose reloadable ("GPR"), reward, gift and benefit/HSA cards. Payroll cards are a product whereby an employee’s payroll is loaded to the card by their employer utilizing direct deposit. GPR cards are usually distributed by retailers and can be reloaded an indefinite number of times at participating retail load networks. Other examples of reloadable cards are travel cards, which are used to replace traveler’s checks and can be reloaded a predetermined number of times, as well as tax-related cards where a taxpayer’s refund is placed on the card. Reloadable cards are generally open- loop cards that consumers can use to obtain cash at ATMs or purchase goods and services wherever such cards are accepted for payment.
Business or Commercial Use
Prepaid cards are also frequently used by businesses for travel and entertainment, accounts payable and B2B settlement products. For example, virtual prepaid cards are used to facilitate one-time payments between a company and its vendors for monthly settlement. Travel and entertainment cards, alternatively, are reloadable by the company for use by its employees to travel for business.
32
ATM Sponsorship
MPS sponsors ATM independent sales organizations (“ISOs”) into various networks and provides associated sponsorships of encryption support organizations and third-party processors in support of the financial institutions and the ATM ISO sponsorships. Sponsorship consists of the review and oversight of entities participating in debit and credit networks. In certain instances, MPS also has certain leasehold interests in certain ATMs which require bank ownership and registration for compliance with applicable state law.
While the Company has adopted policies and procedures to manage and monitor the risks attendant to this line of business, and the executives who manage the Company’s program have years of experience in this area of the Company's business, no guarantee can be made that the Company will not experience losses in the MPS division. MPS has signed agreements with terms extending through the next few years with several of its largest sales agents/program managers, which the Company expects will help mitigate this risk. See “- Regulation - Proposal Prepaid Payments Regulation.”
Regulation
General
The Company is broadly regulated as a savings and loan holding company by the Federal Reserve, and is required to file reports with and otherwise comply with the rules and regulations of the Federal Reserve applicable to such companies. As a reporting company under the Securities Exchange Act of 1934, as amended (the "Exchange Act"), the Company is also required to file reports with the SEC and otherwise comply with federal securities laws. The Bank is a federally chartered thrift institution that is subject to broad federal regulation and oversight extending to all of its operations by the OCC, its primary federal regulator, and by the FDIC as deposit insurer. The Bank is also a member of the FHLB. See “Risk Factors” included in Item 1A of this Annual Report on Form 10-K.
The legislative and regulatory enactments described below have had and are expected to continue to have a material impact upon the operations of the Company and the Bank.
Dodd-Frank Wall Street Reform and Consumer Protection Act of 2010 (the "Dodd-Frank Act”)
The Dodd-Frank Act abolished the Office of Thrift Supervision (the “OTS”) on July 21, 2011, and transferred rulemaking authority and regulatory oversight to the Office of the Comptroller of the Currency (the "OCC") with respect to federal savings banks, such as the Bank, and to the Board of Governors of the Federal Reserve System with respect to savings and loan holding companies, such as the Company.
Pursuant to the Dodd-Frank Act, the Bank is also subject to regulations promulgated by the Bureau of Consumer Financial Protection (the “Bureau”). The Bureau has consolidated rules and orders with respect to consumer financial products and services and has substantial power to define the rights of consumers and responsibilities of lending institutions, such as the Bank. The Bureau does not, however, examine or supervise the Bank for compliance with such regulations; rather, based on the Bank’s size (less than $10 billion in assets), enforcement authority remains with the OCC although the Bank may be required to submit reports or other materials to the Bureau upon its request. Notwithstanding jurisdictional limitations set forth in the Dodd-Frank Act, the Bureau and federal banking regulators may endeavor to work jointly in investigating and resolving cases as they arise.
The Dodd-Frank Act included provisions which restrict interchange fees to those which are “reasonable and proportionate” for certain debit card issuers and limits the ability of networks and issuers to restrict debit card transaction routing (known as the “Durbin Amendment”). The Federal Reserve issued final rules implementing the Durbin Amendment on June 29, 2011. Notably, the interchange fee restrictions in the Durbin Amendment do not apply to the Bank because debit card issuers with total worldwide assets of less than $10 billion are exempt.
33
The Economic Growth, Regulatory Relief, and Consumer Protection Act of 2018 (“Regulatory Relief Act”)
Passed by Congress and signed into law on May 24, 2018, the Regulatory Relief Act includes a number of provisions that positively affect smaller banking institutions (e.g., those with less than $10 billion in assets) like the Bank. Specific
provisions of the Regulatory Relief Act that benefit smaller banks include a loosening of Volcker Rule requirements (as discussed in “—Volcker Rule” below) if the bank has trading assets and trading liabilities that are less than 5% of its total assets, modifications to the “qualified mortgage” criteria under the “ability to repay” rules for certain mortgages that are held and maintained on the bank’s portfolio, and relief from certain capital requirements required by an international banking capital framework. Most significantly for the Bank, the Regulatory Relief Act also includes a provision that allows certain federal savings banks with less than $20 billion in assets, such as the Bank, to elect treatment as a national bank for most regulatory purposes without requiring a charter conversion application to the OCC. Federal savings banks that make such an election will no longer be subject to qualified thrift investment rules but may lose the ability to invest in service corporations.
Anti-Money Laundering (“AML”) Laws and Regulations
Continuing a trend that started with the enactment of the USA Patriot Act of 2001 (the “Patriot Act”), AML and financial transparency laws and regulations have been enhanced to impose strict standards for gathering and verifying customer information in order to ensure funds or other assets are not being placed in U.S. financial institutions to facilitate terrorist financing and laundering of funds. Among other provisions, the Patriot Act requires financial institutions to have AML programs in place and requires banking regulators to consider a holding company’s effectiveness in combating money laundering when ruling on certain merger or acquisition applications. Failure to comply with such laws and rules and to have and maintain a robust AML program can have a material adverse effect on a financial institution.
Privacy
The Bank is required by statute and regulation to disclose its privacy policies to its customers on an annual basis. The Bank does not share nonpublic personal information about its customers with non-affiliated third parties for marketing purposes. The Bank is also required to appropriately safeguard its customers’ personal information.
Preemption
Under the preemption standards established under the Dodd‑Frank Act for both national banks and federal savings associations, preemption of a state consumer financial law is permissible only if: (i) application of the state law would have a discriminatory effect on national banks or federal thrifts as compared to state banks; (ii) the state law is preempted under a judicial standard that requires a state consumer financial law to prevent or significantly interfere with the exercise of the national bank’s or federal thrift’s powers before it can be preempted, with such preemption determination being made by the OCC (by regulation or order) or by a court, in either case on a “case‑by‑case” basis; or (iii) the state law is preempted by another provision of federal law other than Title X of the Dodd-Frank Act. Additionally, the Dodd-Frank Act specifies that such preemption standards only apply to national banks and federal thrifts themselves, and not their non-depository institution subsidiaries or affiliates. Specifically, operating subsidiaries of national banks and federal thrifts that are not themselves chartered as a national bank or federal thrift may no longer benefit from federal preemption of state consumer financial laws, which now apply to such subsidiaries (or affiliates) to the same extent that they apply to any person, corporation or entity subject to such state laws. The Bank has one wholly owned service corporation subsidiary as of the date of this Annual Report on Form 10-K.
Prohibition on Unfair, Deceptive and Abusive Acts and Practices
The Bureau was created by the Dodd-Frank Act to administer and carry out the purposes and objectives of the federal consumer financial laws and to prevent evasions thereof, with respect to all financial institutions that offer financial products and services to consumers. The Bureau is also authorized to prescribe rules applicable to any covered person or service provider identifying and prohibiting acts or practices that are unfair, deceptive or abusive in connection with any transaction with a consumer for a consumer financial product or service, or the offering of a consumer financial product or service. The authority to prohibit “abusive” acts or practices was newly added to federal law with the passage of the Dodd-Frank Act. The Bureau has engaged in rulemaking and taken enforcement actions that directly impact the business operations of financial institutions offering consumer financial products or services including the Bank and its divisions, and is expected to adopt a regulation related to the definition of “abusive” acts or practices in the near future.
34
Prepaid Accounts under the Electronic Fund Transfer Act ("Regulation E") and the Truth In Lending Act ("Regulation Z")
The Bureau’s “Prepaid Accounts Rule,” adopted on October 5, 2016, enhanced the regulations applicable to prepaid products (both cards and other delivery methods, including codes) and brought them fully within Regulation E, which implements the federal Electronic Funds Transfer Act, by adding a definition for “prepaid account.” In addition, prepaid products that have a credit component, like some of those offered in connection with an existing program manager agreement, are now regulated by Regulation Z, which implements the federal Truth in Lending Act.
Pursuant to the Prepaid Accounts Rule, the Bureau requires that the consumer be presented with a new “Know Before You Owe” disclosure. Financial institutions, such as the Bank, must provide certain account information in a short form disclosure, in close proximity to the short-form disclosure, and in a long form disclosure to consumers before they acquire a prepaid account, unless specifically exempted. The rule generally extended Regulation E’s error resolution and limited liability requirements to all prepaid accounts, regardless of whether the financial institution has completed its consumer identification and verification process with respect to the account. In addition, the Prepaid Accounts Rule extended Regulation E’s three tiers of liability for unauthorized transfers to prepaid accounts, depending on when the consumer reported the error. The rule also extended Regulation E’s periodic statement requirement to prepaid accounts. Under the rule, financial institutions must, at no additional charge or fee, provide prepaid account holders with (i) periodic account statements, or (ii) access to his or her account balance through a readily available telephone line and written and electronic records of the account history. The rule also extended Regulation Z’s credit card rules and disclosure requirements to prepaid accounts that provide overdraft services and other credit features. The rule also requires account issuers, such as the Bank, to post their publicly offered prepaid card program agreements on their websites, make them available to consumers upon request, and provide copies of all publicly offered prepaid card program agreements to the Bureau. The Bureau has issued further refinements to the original rule in the past year and has also announced that the effective date for compliance has been extended from April 2018 to April 2019.
Customer Identification Programs for Holders of Prepaid Cards
The federal banking agencies, including the OCC and the Federal Reserve, issued guidance in 2016 that extends the requirements of the Customer Identification Program required by Section 326 of the Patriot Act to prepaid accounts where the cardholder has either the (i) ability to reload funds, or (ii) access to credit or overdraft features. If either of these features is present, the issuer must verify the identity of the named account holder.
Incentive-Based Compensation Restrictions
The Dodd-Frank Act requires that the federal banking regulators, including the Federal Reserve and the OCC, issue a rule related to incentive-based compensation. No such rule has, as of the date of this Annual Report on Form 10-K, been adopted, but a proposed rule was published in 2016 that expanded upon a prior proposed rule published in 2011. The proposed rule is intended to (i) prohibit incentive-based payment arrangements that the banking regulators determine could encourage certain financial institutions to take inappropriate risks by providing excessive compensation or that could lead to material financial loss, (ii) require the board of directors of those financial institutions to take certain oversight actions related to incentive-based compensation, and (iii) require those financial institutions to disclose information concerning incentive-based compensation arrangements to the appropriate federal regulator.
The Company and the Bank would be Level 3 covered institutions under the proposed rule because both have average total consolidated assets between $1 billion and $50 billion. As a Level 3 covered institution, the Company and the Bank would only be subject to the most basic set of prohibitions and requirements, which prohibit “excessive compensation, fees, or benefits” or any compensation agreement that “could lead to material financial loss.”
The proposed rule would also require that the Company’s board of directors, or a committee thereof, conduct oversight of its incentive-based compensation program and approve incentive-based compensation arrangements for senior executive officers. Additionally, the Company and the Bank would be required to create and maintain records that document the structure of all of the incentive-based compensation arrangements, demonstrate compliance with the final rule, and disclose those records to the appropriate Federal regulator upon request.
Examination Guidance for Third-Party Lending
On July 29, 2016, the FDIC issued revised examination guidance related to third-party lending relationships (e.g., lending arrangements that rely on a third party to perform a significant aspect of the lending process). Similar to guidance published by the OCC in 2013, this guidance generally requires that financial institutions, including the Bank, ensure that risks related to such third-party lending relationships are evaluated, including the type of lending activity, the complexity of the lending program, the projected and realized volume created by the relationship, and the number of third-party lending relationships the institution has in place.
35
Short-Term, Small-Dollar Installment Lending
In October 2017, the OCC rescinded its guidance on deposit advance products in light of the Bureau’s pending small dollar loan rule (see “Risk Factors—The Bureau’s final rule related to certain small dollar loans will impact certain processes used by the Bank and could materially impact the Bank’s ability to grow certain aspects of the Payments division” included in Item 1A of this Annual Report on Form 10-K for more information). On October 26, 2018, the Bureau announced that it will propose changes to this rule in January 2019, and, in early November 2018, a federal judge in Texas stayed compliance with the rule in connection with a court case challenging it. Although the text of the proposed Bureau changes to this rule has not been made available to the public as of the date of this Annual Report on Form 10-K, the Bureau stated that the ability-to-repay component of the small dollar loan rule will be addressed in the upcoming revisions; the repayment provisions in the rule, however, will not be affected.
In May 2018, the OCC published guidance that encourages national banks and federal savings associations to offer responsible short-term, small-dollar installment loans with terms between two and twelve months and equal amortizing payments. Pursuant to the OCC’s guidance on this issue, banks are encouraged to offer these products in a manner that is consistent with sound risk management principles and clear, documented underwriting guidelines.
Other Regulation
The Bank is also subject to a variety of other regulations with respect to its business operations including, but not limited to, the Truth in Lending Act, the Truth in Savings Act, the Consumer Leasing Act, the Equal Credit Opportunity Act, the Electronic Funds Transfer Act, the Military Lending Act, the Servicemembers’ Civil Relief Act, the Fair Housing Act, the Home Mortgage Disclosure Act, the Fair Debt Collection Practices Act, the Telephone Consumer Protection Act, the Controlling the Assault of Non-Solicited Pornography and Marketing Act, and the Fair Credit Reporting Act. As discussed below, any change in the regulations affecting the Bank’s operations is not predictable and could affect the Bank’s operations and profitability.
Bank Supervision and Regulation
The Bank is a federally chartered thrift institution that is subject to broad federal regulation and oversight extending to all of its operations by its primary federal regulator, the OCC, and by its deposit insurer, the FDIC. Such regulation covers all aspects of the banking business, including lending practices, safeguarding deposits, capital structure, transactions with affiliates, and conduct and qualifications of personnel. The Bank pays assessment fees both to the OCC and the FDIC, and the level of such assessments reflects the condition of the Bank. If the condition of the Bank were to deteriorate, the level of such assessments could increase significantly, having a material adverse effect on the Company’s financial condition and results of operations. The Bank is also a member of the FHLB System and is subject to certain limited regulation by the Federal Reserve.
Regulatory authorities have been granted extensive discretion in connection with their supervisory and enforcement activities which are intended to strengthen the financial condition of the banking industry, including, but not limited to, the imposition of restrictions on the operation of an institution, the classification of assets by the institution, and the adequacy of an institution’s allowance for loan and lease losses. Typically, these actions are undertaken due to violations of laws or regulations or conduct of operations in an unsafe or unsound manner. The OCC has announced that supervisory strategies for 2019 will focus on the following: (i) cybersecurity and operational resiliency; (ii) commercial and retail credit loan underwriting, concentration risk management, and the allowance for loan and lease losses; (iii) the Bank Secrecy Act/AML compliance management; (iv) compliance-related management to address regulatory requirements; and (v) internal controls and end-to-end processes necessary for product service delivery.
Any change in the nature of such regulation and oversight, such as the items mentioned above, whether by the OCC, the FDIC, the Federal Reserve, or legislatively by Congress, could have a material impact on the Company or the Bank and their respective operations. The discussion herein of the regulatory and supervisory structure within which the Bank operates is general and does not purport to be exhaustive or a complete description of the laws and regulations involved in the Bank’s operations. The discussion is qualified in its entirety by the actual laws and regulations.
Federal Regulation of the Bank
The OCC has extensive authority over the operations of federal savings associations, such as the Bank. Pursuant to its authority to regulate and supervise federal savings banks, the OCC has established a comprehensive framework for activities in which a federal savings association can engage and is intended primarily for the protection of the DIF and depositors. The OCC also has extensive discretion in connection with the development and implementation of supervisory and enforcement activities and examination policies.
36
In connection with its assumption of responsibility for the ongoing examination, supervision and regulation of federal savings associations, the OCC published a final rule on July 21, 2011 that republishes those OTS regulations that the OCC has the authority to promulgate and enforce as of the July 21, 2011 transfer date ("Transfer Date"), with nomenclature and other technical amendments to reflect OCC supervision of federal savings associations. Since the Transfer Date, the OCC has rescinded additional OTS documents that formerly applied to federal savings and loan associations, and applied new policy guidance where policy guidance did not already exist. For example, in 2015, the OCC streamlined requirements (where permitted) to provide integrated treatment to national banks and federal savings associations with respect to certain corporate activities and transactions. The new regulations define an “eligible savings association” as one that: (i) is well-capitalized as defined in 12 CFR 6.4; (ii) has a composite rating of 1 or 2 under the Uniform Financial Institutions Rating System (“CAMELS”); (iii) has a Community Reinvestment Act (“CRA”), 12 U.S.C. 2901 et seq., rating of ‘‘Outstanding’’ or ‘‘Satisfactory,’’ if applicable; (iv) has a consumer compliance rating of 1 or 2 under the Uniform Interagency Consumer Compliance Rating System; and (v) is not subject to a cease and desist order, consent order, formal written agreement, or Prompt Corrective Action directive or, if subject to any such order, agreement, or directive, is informed in writing by the OCC that the savings association may be treated as an ‘‘eligible bank or eligible savings association’’ for purposes of the regulation. The OCC’s regulations and guidance supersede that of OTS and are indicative of the OCC’s goal of one integrated policy platform for national banks and savings associations.
On September 10, 2018, the OCC issued a proposed rule implementing a provision in the Regulatory Relief Act that would permit eligible federal savings associations, like the Bank, to elect treatment as a national bank for many purposes, including those related to the activities a national bank may permissibly undertake (the “NB Election Proposed Rule”). If adopted as proposed and elected by the Bank, the Bank would no longer be subject to the existing requirements related to qualified thrift lender status. Additionally, if adopted as proposed, the Bank would no longer be able to use a federal savings bank’s authority to create and operate service corporations (although the OCC has specifically requested information from the public as to whether a covered savings association should be allowed to retain service corporations that engage only in activities permitted to national banks).
In addition to taking many enforcement actions and finalizing regulation covering prepaid payments, described below, the Bureau finalized its ability to repay (“ATR”) rule as well as its qualified mortgage rule in January 2013. The ATR rule applies to residential mortgage loan applications received after January 10, 2014. The scope of the ATR rule specifically applies to loans securing one-to-four unit dwellings and includes purchases, refinances and home equity loans for principal or second homes. Under the ATR rules, a lender may not make a residential mortgage loan unless the lender makes a reasonable and good faith determination that is based on verified, documented information at or before consummation that the borrower has a reasonable ability to repay. The eight underwriting factors that must be considered and verified include the following: (i) income and assets: (ii) employment status; (iii) monthly payment of loan; (iv) monthly payment of any simultaneous loan secured by the same property; (v) monthly payment for other mortgage-related obligations like property taxes and insurance; (vi) current debt obligations; (vii) monthly debt to income ratio; and (viii) credit history (although eight factors are delineated, the ATR rule does not dictate that a lender follow a particular underwriting model). Liability for violations of the ATR rule include actual damages, statutory damages, court costs and attorneys’ fees.
Additionally, the Bureau published regulations required by the Dodd-Frank Act related to “qualified mortgages,” which are mortgages for which there is a presumption that the lender has satisfied the ATR rules. Pursuant to Dodd-Frank, qualified mortgages (“QMs”) must have certain product-feature prerequisites and affordability underwriting requirements. Generally, to meet the QM test, the lender must calculate the monthly payments based on the highest payment that will apply in the first five years and the consumer must have a total debt-to-income ratio that is less than or equal to 43%. The QM rule provides a safe harbor for lenders that make loans that satisfy the definition of a QM and are not higher priced. With respect to higher-priced mortgage loans, there is a rebuttable presumption of compliance available to the lender with respect to compliance with the ATR rule.
With respect to QMs, the Regulatory Relief Act allows insured depository institutions with less than $10 billion in assets, like the Bank, to designate certain consumer mortgage loans it originates and holds in portfolio as QMs even though such mortgage loans do not meet the ATR requirements described above.
With respect to final regulations that affect insured depository institutions such as the Bank, the Bureau also issued a final rule related to international remittances, which covers entities that provide at least 100 remittance transfers per calendar year. As such, the Bank is subject to this rule.
37
It is possible that additional rulemaking could require significant revisions to the regulations under which the Bank operates and is supervised. Any change in such laws and regulations or interpretations thereof negatively impacting the Bank's or the Company's current operations, whether by the OCC, the FDIC, the Bureau, the Federal Reserve or through legislation, could have a material adverse impact on the Bank and its operations and on the Company and its stockholders.
Business Activities
The activities of federal savings associations are generally governed by federal laws and regulations. These laws and regulations delineate the nature and extent of the activities in which federal savings associations may engage. In particular, many types of lending authority for federal savings associations are limited to a specified percentage of the institution’s capital or assets.
Loan and Investment Powers
The Bank derives its lending and investment powers from the Home Owners’ Loan Act (“HOLA”) and the OCC’s implementing regulations thereunder. Under these laws and regulations, the Bank may invest in mortgage loans secured by residential and commercial real estate, commercial and consumer loans, certain types of debt securities and certain other assets. The Bank may also establish service corporations that are permitted to engage in activities not otherwise permissible for the Bank, including certain real estate equity investments and securities and insurance brokerage activities; provided, however, that such investments are limited to 3% of the Bank's assets. These investment powers are subject to various limitations, including (i) a prohibition against the acquisition of any corporate debt security unless, prior to acquisition, the savings association has determined that the investment is safe and sound and suitable for the institution and that the issuer has adequate resources and willingness to provide all required payments on its obligations in a timely manner; (ii) a limit of 400% of an association’s capital on the aggregate amount of loans secured by non-residential real estate property; (iii) a limit of 20% of an association’s assets on the aggregate amount of commercial and agricultural loans and leases with the amount of commercial loans in excess of 10% of assets being limited to small business loans; (iv) a limit of 35% of an association’s assets on the aggregate amount of secured consumer loans and acquisitions of certain debt securities, with amounts in excess of 30% of assets being limited to loans made directly to the original obligor and where no third-party finder or referral fees were paid; (v) a limit of 5% of assets on non-conforming loans (loans in excess of the specific limitations of the HOLA); and (vi) a limit of the greater of 5% of assets or an association’s capital on certain construction loans made for the purpose of financing what is or is expected to become residential property. In addition, the HOLA and the OCC regulations provide that a federal savings association may invest up to 10% of its assets in tangible personal property for leasing purposes.
The Bank’s general permissible lending limit to one borrower is equal to the greater of $500,000 or 15% of unimpaired capital and surplus (except when the loans made in excess of the 15% maximum are fully secured by certain readily marketable collateral, in which case this limit is increased to 25% of unimpaired capital and surplus). At
September 30, 2018
, the Bank’s lending limit under these restrictions was $75.3 million. At
September 30, 2018
, the Bank was in compliance with this lending limit.
Federal Deposit Insurance and Other Regulatory Requirements
Insurance of Accounts and Regulation by the FDIC
The Bank is a member of the DIF, which is administered by the FDIC. Deposits are insured up to applicable limits by the FDIC and such insurance is backed by the full faith and credit of the United States Government. While not our primary federal regulator, the FDIC as insurer imposes deposit insurance premiums and is authorized to conduct examinations of and to require reporting by FDIC-insured institutions. It also may prohibit any FDIC-insured institution from engaging in any activity the FDIC determines by regulation or order to pose a serious risk to the DIF. The FDIC also has authority to initiate enforcement actions against any FDIC-insured institution after giving its primary federal regulator the opportunity to take such action, and may seek to terminate the deposit insurance if it determines that the institution has engaged in unsafe or unsound practices or is in an unsafe or unsound condition.
38
Under the Dodd-Frank Act, a permanent increase in deposit insurance to $250,000 was authorized. The coverage limit is per depositor, per insured depository institution for each account ownership category. The Dodd-Frank Act also set a new minimum DIF reserve ratio at 1.35% of estimated insured deposits. The FDIC is required to attain this ratio by September 30, 2020. By law, the FDIC is required to offset the effect of the increase in the minimum reserve ratio on insured depository institutions with less than $10 billion in assets, like the Bank; to satisfy these requirements, large banks are subject to a temporary surcharge on their assessment base. The reserve ratio reached 1.33% as of June 30, 2018 and is expected to reach 1.35% by December 31, 2018.
The FDIC imposes an assessment against all depository institutions for deposit insurance. Pursuant to changes adopted by the FDIC that were effective July 1, 2016, in connection with the achievement of a 1.15% reserve ratio, the initial base rate for deposit insurance is between 3-30 basis points. Total base assessment after possible adjustments now ranges between 1.5-40.0 basis points. For established smaller institutions, like the Bank, CAMELS composite ratings are used along with (i) an initial base assessment rate, (ii) an unsecured debt adjustment, and (iii) a brokered deposit adjustment rate to calculate a total base assessment rate. The final rule states that it is “revenue neutral” in that it leaves aggregate assessment revenue collected from small banks approximately as it would have been absent the final rule. Risk categorization for purposes of deposit insurance are no longer utilized.
As noted above, brokered deposits are subject to an adjustment rate in the calculation of deposit insurance premiums. Based upon guidance issued by the FDIC, some of the Bank's prepaid deposits are deemed to be “brokered” deposits. As discussed below, should the Bank fail to maintain its well-capitalized status, limitations related to brokered deposits would automatically trigger, which could have a material adverse effect on the Bank and the Company.
Under the Federal Deposit Insurance Act (“FDIA”), the FDIC may terminate deposit insurance upon a finding that the institution has engaged in unsafe or unsound practices, is in an unsafe or unsound condition to continue operations, or has violated any applicable law, regulation, rule, order, or condition imposed by the FDIC or the OCC. Management of the Bank does not know of any practice, condition or violation that might lead to termination of deposit insurance.
A significant increase in DIF insurance premiums would have an adverse effect on the operating expenses and results of operations of the Bank.
DIF-insured institutions pay a Financing Corporation (“FICO”) assessment in order to fund the interest on bonds issued to resolve thrift failures in the 1980s. At
September 30, 2018
, the FICO assessment was equal to 0.32 basis points for each $100 of its total assessment base of approximately $4.94 billion. These assessments will continue until the bonds mature in 2019.
Interest Rate Risk Management
The OCC requires federal savings banks, like the Bank, to have an effective and sound interest rate risk management program, including appropriate measurement and reporting, robust and meaningful stress testing, assumption development reflecting the institution’s experience, and comprehensive model valuation. Interest rate risk exposure is supposed to be managed using processes and systems commensurate with their earnings and capital levels, complexity, business model, risk profile, and scope of operations. Federal savings banks are required to have an independent interest rate risk management process in place that measures both earnings and capital at risk.
Stress Testing
Although the Dodd-Frank Act requires institutions with more than $10 billion in assets to conduct stress testing, the OCC expects every bank, regardless of its size or risk profile, to have an effective internal process to (i) assess its capital adequacy in relation to its overall risks at least annually, and (ii) to plan for maintaining appropriate capital levels. It is the OCC’s belief that stress testing permits community banks to identify their key vulnerabilities to market forces and assess how to effectively manage those risks should they emerge. If stress testing results indicate that capital ratios could fall below the level needed to adequately support the bank’s overall risk profile, the OCC believes the bank’s board and management should take appropriate steps to protect the bank from such an occurrence, including establishing a plan that requires closer monitoring of market information, adjusting strategic and capital plans to mitigate risk, changing risk appetite and risk tolerance levels, limiting or stopping loan growth or adjusting the portfolio mix, adjusting underwriting standards, raising more capital, and selling or hedging loans to reduce the potential impact from such stress events.
39
Assessments
The Dodd-Frank Act provides that, in establishing the amount of an assessment, the Comptroller of the Currency may consider the nature and scope of the activities of the entity, the amount and type of assets it holds, the financial and managerial condition of the entity and any other factor that is appropriate. The assessments are paid to the OCC on a semi-annual basis. During the fiscal year ended
September 30, 2018
, the Bank paid assessments (standard assessments) of $857,218 to the OCC.
Basel III Capital Requirements
2018 is the fourth year of implementation of the bank capital rules (the “Basel III Capital Rules”) adopted by our primary federal regulator, the Federal Reserve, and the Bank’s primary federal regulator, the OCC. The Basel III Capital Rules established a new comprehensive capital framework for U.S. banking organizations and generally implement the so-called Basel III international capital standards adopted in 2010 by the Basel Committee on Banking Supervision. The Basel III Capital Rules substantially increased the risk-based capital requirements applicable to bank holding companies and their depository institution subsidiaries, including us and the Bank.
The Basel III Capital Rules established three components of regulatory capital: (i) common equity tier 1 capital (“CET1 Capital”), (ii) additional tier 1 capital, and (iii) tier 2 capital. Tier 1 capital is the sum of CET1 Capital and additional tier 1 capital instruments meeting certain requirements. Total capital is the sum of tier 1 capital and tier 2 capital. Under the Basel III Capital Rules, for most banking organizations, the most common form of additional tier 1 capital is non-cumulative perpetual preferred stock and the most common form of tier 2 capital is subordinated notes and a portion of the allocation for loan and lease losses, in each case, subject to the Basel III Capital Rules’ specific requirements. CET1 Capital, tier 1 capital, and total capital serve as the numerators for three prescribed regulatory capital ratios. Risk-weighted assets, calculated using the standardized approach in the Basel III Capital Rules for us and the Bank, provide the denominator for such ratios. There is also a leverage ratio that compares tier 1 capital to average total assets.
Failure by the Company or the Bank to meet minimum capital requirements set by the Basel III Capital Rules could result in certain mandatory and/or discretionary disciplinary actions by our regulators that could have a material adverse effect on our business and our consolidated financial position. Under the capital requirements and the regulatory framework for prompt corrective action, the Company and the Bank must meet specific capital guidelines that involve quantitative measures of the Company's and the Bank’s assets, liabilities and certain off-balance-sheet items as calculated under regulatory accounting practices. The Company’s and the Bank’s capital amounts and classifications are also subject to qualitative judgments by regulators about components, risk weightings and other factors.
Beginning on January 1, 2018, the Company and the Bank have been required to maintain a capital conservation buffer above the minimum risk-based capital requirements in order to avoid certain limitations on capital distributions, stock repurchases and discretionary bonus payments to executive officers for 2018. The capital conservation buffer is exclusively composed of CET1 Capital, applies to each of the three risk-based capital ratios (but not the leverage ratio), and increases the minimum requirement of the three risk-based capital ratios by 0.625% for each year from 2016 through 2019. On January 1, 2018, the Company and Bank complied with the capital conservation buffer requirement for 2018.
The Basel III Capital Rules provide for a number of deductions from and adjustments to CET1 Capital. These include, for example, the requirement that deferred tax assets arising from temporary differences that could not be realized through net operating loss carrybacks and significant investments in non-consolidated financial entities be deducted from CET1 Capital to the extent that any one such category exceeds 10% of CET1 Capital or all such items, in the aggregate, exceed 15% of CET1 Capital. See Note 13 to the “Notes to Consolidated Financial Statements,” which is included in Part II, Item 8 “Financial Statements and Supplementary Data” of this Annual Report on Form 10-K.
Pursuant to the Basel III Capital Rules, the effects of certain accumulated other comprehensive income or loss (“AOCI”) items are not excluded; however, “non-advanced approaches banking organizations,” including the Company and the Bank, may make a one-time permanent election to continue to exclude these items. This election was made concurrently with the first filing of certain of the Company's and the Bank’s periodic regulatory reports in the beginning of 2015 in order to avoid significant variations in the level of capital depending upon the impact of interest rate fluctuations on the fair value of the Company's securities portfolio. The Basel III Capital Rules also preclude certain hybrid securities, such as trust preferred securities issued prior to May 19, 2010, from being included in our Tier 1 capital, subject to grandfathering in the case of companies, such as the Company and the Bank, that had less than $15 billion in total consolidated assets as of December 31, 2009.
40
Implementation of the deductions and other adjustments to CET1 Capital began on January 1, 2015, and are being phased in over a four-year period (beginning at 40% on January 1, 2015, and an additional 20% per year thereafter). The implementation of the capital conservation buffer began on January 1, 2016 at the 0.625% level and the buffer increases by 0.625% on each subsequent January 1, until it reaches 2.5% on January 1, 2019.
The Basel III Capital Rules prescribe a standardized approach for risk weightings for a large and risk-sensitive number of categories, depending on the nature of the assets, generally ranging from 0% for U.S. government and agency securities to 600% for certain equity exposures, and resulting in high-risk weights for a variety of asset classes.
As of
September 30, 2018
, the Bank exceeded all of its regulatory capital requirements, as reflected in the table below, and was designated as “well-capitalized” under federal guidelines. The tables below include certain non-GAAP financial measures that are used by investors, analysts and bank regulatory agencies to assess the capital position of financial services companies. Management reviews these measures along with other measures of capital as part of its financial analysis. See Note 13 to the “Notes to Consolidated Financial Statements,” which is included in Part II, Item 8 “Financial Statements and Supplementary Data” of this Annual Report on Form 10-K.
Regulatory Capital Data
|
|
Company (Actual)
|
Bank (Actual)
|
Minimum
Requirement For
Capital Adequacy
Purposes
|
Minimum Requirement
To Be Well Capitalized
Under Prompt
Corrective Action
Provisions
|
|||||||
|
|
Ratio
|
Ratio
|
Ratio
|
Ratio
|
|||||||
|
|
(Dollars in Thousands)
|
||||||||||
|
September 30, 2018
|
|||||||||||
|
Tier 1 leverage ratio
|
8.50
|
%
|
9.75
|
%
|
4.00
|
%
|
5.00
|
%
|
|||
|
Common equity Tier 1 capital ratio
|
10.56
|
%
|
12.50
|
%
|
4.50
|
%
|
6.50
|
%
|
|||
|
Tier 1 capital ratio
|
10.97
|
%
|
12.56
|
%
|
6.00
|
%
|
8.00
|
%
|
|||
|
Total qualifying capital ratio
|
13.18
|
%
|
12.89
|
%
|
8.00
|
%
|
10.00
|
%
|
|||
41
The following table provides certain non-GAAP financial measures used to compute certain of the ratios included in the table above, as well as a reconciliation of such non-GAAP financial measures to the most directly comparable financial measure in accordance with GAAP.
Reconciliation:
|
|
Standardized Approach
(1)
|
||
|
September 30, 2018
|
|||
|
|
(Dollars in Thousands)
|
||
|
|
|||
|
Total stockholders' equity
|
$
|
747,726
|
|
|
Adjustments:
|
|
|
|
|
LESS: Goodwill, net of associated deferred tax liabilities
|
299,456
|
|
|
|
LESS: Certain other intangible assets
|
64,716
|
|
|
|
LESS: Net unrealized gains (losses) on available-for-sale securities
|
(33,114
|
)
|
|
|
LESS: Non-controlling interest
|
3,574
|
|
|
|
LESS: Unrealized currency gains (losses)
|
3
|
|
|
|
Common Equity Tier 1
(1)
|
413,091
|
|
|
|
Long-term debt and other instruments qualifying as Tier 1
|
13,661
|
|
|
|
Tier 1 minority interest not included in common equity tier 1 capital
|
2,118
|
|
|
|
Total Tier 1 capital
|
428,870
|
|
|
|
Allowance for loan and lease losses
|
13,185
|
|
|
|
Subordinated debentures (net of issuance costs)
|
73,491
|
|
|
|
Total qualifying capital
|
515,546
|
|
|
(1)
Capital ratios were determined using the Basel III Capital Rules that became effective on January 1, 2015. Basel III revised the definition of capital, increased minimum capital ratios, and introduced a minimum CET1 ratio; those changes are being fully phased in through the end of 2021.
The following table provides a reconciliation of tangible common equity used in calculating tangible book value data.
|
September 30, 2018
|
|||
|
(Dollars in Thousands)
|
|||
|
Total Stockholders' Equity
|
$
|
747,726
|
|
|
Less: Goodwill
|
303,270
|
|
|
|
Less: Intangible assets
|
70,719
|
|
|
|
Tangible common equity
|
373,737
|
|
|
|
Less: AOCI
|
(33,111
|
)
|
|
|
Tangible common equity excluding AOCI
|
406,848
|
|
|
Due to the predictable, quarterly cyclicality of MPS deposits in connection with tax season business activity, management believes that a six-month capital calculation is a useful metric to monitor the Company’s overall capital management process. As such, the Bank’s six-month average Tier 1 leverage ratio, CET1 capital ratio, Tier 1 capital ratio, and Total qualifying capital ratio as of September 30, 2018 were
10.64%
,
16.84%
,
16.92%
, and
17.37%
, respectively.
Recent Releases Related to Capital Rules
In November 2017, the federal banking agencies, including the OCC, the FDIC, and the Federal Reserve, issued a final rule that simplifies certain aspects of the agencies’ capital rules as they relate to small federal savings banks and savings and loan holding companies. The rule, which is intended to reduce the regulatory burden on smaller, less complex banking organizations like the Company and the Bank, has transitional provisions for the regulatory treatment of certain components of capital. The rule went into effect on January 1, 2018.
42
Additionally, the Regulatory Relief Act provides banks with less than $10 billion in assets, like the Bank, relief from certain Basel III Capital Rules and the Volcker Rule. The Regulatory Relief Act requires that the federal banking regulators establish a simplified leverage capital framework for these smaller banks. The new regulations are expected to specify a minimum community bank leverage ratio that would deem a qualifying bank to be well capitalized for prompt corrective action purposes. If a smaller bank maintains this ratio, it will be automatically deemed to be in compliance with capital and leverage requirements, thereby simplifying the capital regime to which it is currently subject. As of the date of this Annual Report on Form 10-K, rules implementing this provision of the Regulatory Relief Act have not been proposed.
On November 21, 2018, the FDIC, the OCC and the Federal Reserve jointly issued a proposed rule required by the Regulatory Relief Act that would permit qualifying banks that have less than $10 billion in consolidated assets to elect to be subject to a 9% leverage ratio that would be applied using less complex leverage calculations (referred to as the “community bank leverage ratio” or “CBLR”). Under the proposed rule, banks that opt into the CBLR framework and maintain a CBLR of greater than 9% would not be subject to other risk-based and leverage capital requirements and would be deemed to have met the well capitalized ratio requirements. As of the date of this Annual Report on Form 10-K, the rule is in proposed form so the content and scope of the final rule, and its impact on the Bank (if any), cannot be determined.
Prompt Corrective Action ("PCA")
Federal banking regulators are authorized and, under certain circumstances, required to take certain actions against banks that fail to meet their minimum capital requirements expressed in terms of a total risk-based capital ratio, a Tier 1 risk-based capital ratio, a common equity Tier 1 ratio, and a leverage ratio (as identified in the tables above). In certain situations, a federal banking agency may reclassify a well-capitalized institution as adequately capitalized and may require an adequately capitalized or undercapitalized institution to comply with supervisory actions as if the institution were in the next lower category (except the requirement to file a capital restoration plan). If and when a bank’s PCA capital category designation is changed, it will receive notice of such change in designation. Moreover, if a bank becomes aware of a material event between Reports of Condition and Income (or Call Report) periods that would cause the bank to be placed in a lower capital level category, the bank is required to notify the OCC that its PCA capital category may have changed.
The federal banking agencies are generally required to take action to restrict the activities of an “undercapitalized,” “significantly undercapitalized” or “critically undercapitalized” bank. Any such bank must submit a capital restoration plan that is guaranteed by the parent holding company, and such holding company must provide appropriate assurances of performance. Until such plan is approved, the bank may not increase its assets, acquire another institution, establish a branch or engage in any new activities, and generally may not make capital distributions. The banking regulators are authorized to impose additional restrictions, discussed below, that are applicable to significantly undercapitalized institutions.
Adequately capitalized banks, in general, cannot pay dividends or make any capital contributions that would leave them undercapitalized; they cannot pay a management fee to a controlling person if, after paying the fee, they would be undercapitalized; and they cannot accept, renew or roll over any brokered deposit unless they have applied for and been granted a waiver by the FDIC. The FDIC has defined the “national rate” for all interest-bearing deposits held by less-than-well-capitalized institutions as “a simple average of rates paid by all insured depository institutions and branches for which data are available” and has stated that its presumption is that this national rate is the prevailing rate in any market. As such, less-than-well-capitalized institutions that are permitted to accept, renew or roll over brokered deposits via FDIC waiver generally may not pay an interest rate in excess of the national rate plus 75 basis points on such brokered deposits.
43
Undercapitalized banks may not accept, renew or roll over brokered deposits, and are subject to restrictions on the soliciting of deposits over prevailing rates. In addition, undercapitalized banks are subject to certain regulatory restrictions. These restrictions include, among others, that such a bank generally may not make any capital distributions, must submit an acceptable capital restoration plan to the FDIC, may not increase its average total assets during a calendar quarter in excess of its average total assets during the preceding calendar quarter unless any increase in total assets is consistent with a capital restoration plan approved by the FDIC and the bank’s ratio of equity to total assets increases during the calendar quarter at a rate sufficient to enable the bank to become adequately capitalized within a reasonable time. In addition, such banks may not acquire a business, establish or acquire a branch office or engage in a new line of business without regulatory approval. Further, as part of a capital restoration plan, the bank’s holding company must generally guarantee that the bank will return to adequately capitalized status and provide appropriate assurances of performance of that guarantee. If a capital restoration plan is not approved, or if the bank fails to implement the plan in any material respect, the bank would be treated as if it were “significantly undercapitalized,” which would result in the imposition of a number of additional requirements and restrictions. FDIC-insured institutions are also subject to changes in their FDIC insurance assessment rates in accordance with their perceived risks to the DIF. Finally, bank regulatory agencies have the ability to seek to impose higher than normal capital requirements known as individual minimum capital requirements (“IMCR”) for institutions with higher risk profiles. If the Bank’s capital status - well-capitalized - changes as a result of future operations or regulatory order, or if it becomes subject to an IMCR, the Company’s financial condition or results of operations could be adversely affected.
Any institution that fails to comply with its capital plan or is “significantly undercapitalized” (
i.e.
, Tier 1 risk-based ratio of less than 4% or CET1 risk-based or core capital ratios of less than 3% or a risk-based capital ratio of less than 6%) will become subject to one or more additional specified actions and operating restrictions mandated by the Federal Deposit Insurance Corporation Improvement Act of 1991. These actions and restrictions include requiring the issuance of additional voting securities; limitations on asset growth; mandated asset reduction; changes in senior management; divestiture, merger or acquisition of the association; restrictions on executive compensation; and any other action the OCC deems appropriate. An institution that becomes “critically undercapitalized” is subject to further mandatory restrictions on its activities in addition to those applicable to significantly undercapitalized associations. In addition, the appropriate banking regulator must appoint a receiver (or conservator with the FDIC’s concurrence) for an institution, with certain limited exceptions, within 90 days after a bank becomes critically undercapitalized. Any undercapitalized institution is also subject to other possible enforcement actions, including the appointment of a receiver or conservator. The appropriate regulator is also generally authorized to reclassify an institution into a lower capital category and impose restrictions applicable to such category if the institution is engaged in unsafe or unsound practices or is in an unsafe or unsound condition.
The imposition of any of these measures on the Bank may have a substantial adverse effect on it and on the Company’s operations and profitability. The Company's stockholders are not entitled to preemptive rights and, therefore, if the Company is directed by its regulators to issue additional shares of common stock, such issuance may result in dilution to the Company's existing stockholders.
Institutions in Troubled Condition
Certain events, including entering into a formal written agreement with a bank’s regulator that requires action to improve the bank’s financial condition, or being informed by the regulator that the bank is in troubled condition, will automatically result in limitations on so-called “golden parachute” agreements pursuant to Section 18(K) of the FDIA. In addition, organizations that are not in compliance with minimum capital requirements, or are otherwise in a troubled condition, must give 90 days’ written notice to the OCC before appointing a Director or Senior Executive Officer, pursuant to the OCC’s regulations.
Branching by Federal Savings Associations
Subject to certain limitations, the HOLA and the OCC regulations permit federally chartered savings associations to establish branches in any state of the United States. Although there is no geographic restriction on interstate branching by federal savings associations, federal law requires that no federal savings association my establish, retain, or operate a branch outside of its home state unless (i) it retains its status as a qualified thrift lender or a domestic building and loan association, and (ii) the total assets of the federal savings association attributable to all of the federal savings associations' branches in the state would qualify the branches as a whole as a qualified thrift lender or a domestic building and loan association. In certain limited instances, this prohibition would not apply and the OCC is also vested with the discretion to allow a federal savings association, for good cause, up to two years to comply with this provision. Additionally, federal savings associations are prohibited from branching outside of their home states if doing so would result in their holding company being deemed a multiple savings and loan holding company; however, federal law includes certain exceptions.
44
Standards for Safety and Soundness
The federal banking agencies have adopted the
Interagency Guidelines Establishing Standards for Safety and Soundness
. The guidelines establish certain safety and soundness standards for all depository institutions. The operational and managerial standards in the guidelines generally relate to the following: (i) internal controls and information systems; (ii) internal audit systems; (iii) loan documentation; (iv) credit underwriting; (v) interest rate exposure; (vi) asset growth; (vii) compensation, fees and benefits; (viii) asset quality; and (ix) earnings. Again, rather than providing specific rules, the guidelines set forth basic compliance considerations and guidance with respect to a depository institution. Failure to meet the standards in the guidelines, however, could result in a request by the OCC to the Bank to provide a written compliance plan to demonstrate its efforts to come into compliance with such guidelines.
Civil Money Penalties
The OCC has the authority to assess civil money penalties (“CMPs”) against any national bank, federal savings bank or any of their institution-affiliated parties (“IAPs”). In addition, the OCC has the authority to assess CMPs against bank service companies and service providers. CMPs may encourage an affected party to correct violations, unsafe or unsound practices or breaches of fiduciary duty. CMPs are also intended to serve as a deterrent to future violations of law, regulations, orders and other conditions. When determining CMP amounts, the OCC is required by statute to consider the following four factors: (i) the size and financial resources and good faith of the institution or IAP charged; (ii) the gravity of the violation; (iii) the history of previous violations; and (iv) such other matters as justice may require. In addition to these factors, there are other factors that the Federal Financial Institutions Examination Council has adopted that banking agencies should consider. If the Bank, the Company or any of its IAPs were to have CMPs imposed, such penalties could be material.
Limitations on Dividends and Other Capital Distributions
Federal regulations govern the permissibility of capital distributions by a federal savings association. Pursuant to the Dodd-Frank Act, savings associations that are part of a savings and loan holding company structure must file a notice of a declaration of a dividend with the Federal Reserve at least 30 days before the proposed dividend declaration by the Bank’s board of directors. In the case of cash dividends, OCC regulations require that federal savings associations that are subsidiaries of a stock savings and loan holding company must file an informational copy of that notice with the OCC at the same time the notice is filed with the Federal Reserve. OCC regulations further set forth the circumstances under which a federal savings association is required to submit an application or notice before it may make a capital distribution.
A federal savings association proposing to make a capital distribution is required to submit an application to the OCC if: the association does not qualify for expedited treatment as an "eligible savings association" pursuant to criteria set forth in OCC regulations; the total amount of all of the association’s capital distributions (including the proposed capital distribution) for the applicable calendar year exceeds the association’s net income for that year to date plus the association’s retained net income for the preceding two years; the association would not be at least adequately capitalized following the distribution; or the proposed capital distribution would violate a prohibition contained in any applicable statute, regulation or agreement between the association and the OCC or the Company’s and Bank’s former regulator, the OTS, or violate a condition imposed on the association in an application or notice approved by the OCC or the OTS.
A federal savings association proposing to make a capital distribution is required to submit a prior notice to the OCC if: the association would not be well-capitalized following the distribution, the proposed capital distribution would reduce the amount of or retire any part of the association’s common or preferred stock or retire any part of debt instruments such as notes or subordinate debentures included in the association’s capital (other than regular payments required under a debt instrument), the savings association’s proposed distribution is payable in property other than cash; or the association is a subsidiary of a federally chartered mutual savings and loan holding company; however, where a savings association subsidiary of a stock savings and loan holding company is proposing to pay a cash dividend that does not require an application or a notice filing, only an informational filing with the OCC is required if notice is also required by the Federal Reserve.
45
Each of the Federal Reserve and OCC has primary reviewing responsibility for the applications or notices required to be submitted to it by savings associations relating to a proposed distribution. The Federal Reserve may disapprove of a notice, and the OCC may disapprove of a notice or deny an application, if:
|
•
|
the savings association would be undercapitalized, significantly undercapitalized or critically undercapitalized following the distribution;
|
|
•
|
the proposed distribution raises safety and soundness concerns; or
|
|
•
|
the proposed distribution violates a prohibition contained in any statute, regulation, enforcement action or agreement between the savings association (or its holding company, in the case of the Federal Reserve) and the entity’s primary federal regulator, or a condition imposed on the savings association (or its holding company, in the case of the Federal Reserve) in an application or notice approved by the entity’s primary federal regulator.
|
Under current regulations, the Bank is not permitted to pay dividends on its stock if its regulatory capital would fall below the amount required for the liquidation account established to provide a limited priority claim to the assets of the Bank to qualifying depositors at March 31, 1992, who continue to maintain deposits at the Bank after its conversion from a federal mutual savings and loan association to a federal stock savings bank pursuant to its Plan of Conversion adopted August 21, 1991.
During the fiscal year ended
September 30, 2018
, the Bank paid cash dividends in the amount of $45.3 million to the Company during the fourth quarter of fiscal 2018
,
a portion of which was used to fund the Crestmark Acquisition and other related expenses. The Company does not currently anticipate that it will need dividends from the Bank in order to fund dividends to the Company’s stockholders.
Qualified Thrift Lender Test
All savings associations, including the Bank, are required to meet a qualified thrift lender (“QTL”) test to avoid certain restrictions on their operations. This test requires a savings association to have at least 65% of its portfolio assets (as defined by regulation) in qualified thrift investments (primarily residential mortgages and related investments, including certain MBS) on a monthly average for nine out of every 12 months on a rolling basis or meet the requirements for a domestic building and loan association under the Internal Revenue Code. Under either test, the required assets primarily consist of residential housing related to loans and investments. At
September 30, 2018
, the Bank met the QTL test and has at all times since its inception and expects to do so for the foreseeable future.
Any savings association that fails to meet the QTL test must convert to a national bank charter, unless it qualifies as a QTL within one year and thereafter remains a QTL, or limits its new investments and activities to those permissible for both a savings association and a national bank. In addition, the association is subject to national bank limits for payment of dividends and branching authority. If such association has not requalified or converted to a national bank within three years after the failure to meet the QTL test, it must divest all investments and cease all activities not permissible for a national bank or federal savings association.
If the NB Election Proposed Rule is adopted as proposed, and if the Bank determines to avail itself of this election, the Bank would no longer be subject to QTL requirements upon the election’s effectiveness, which would be 60 days after submission of such election to the OCC.
Community Reinvestment Act
Under the CRA, the Bank is evaluated periodically by its primary federal banking regulator to determine if it is meeting its continuing and affirmative obligations consistent with its safe and sound operation, to help meet the credit needs of its assessment areas, including low- and moderate-income neighborhoods. The Bank received a “Satisfactory” rating during its most recent Performance Evaluation dated January 3, 2017. A copy of the Bank’s most recent Performance Evaluation is available as part of its Public File. It is expected that CRA regulations will be addressed by the federal regulators in the near term as the OCC released for public comment in August 2018 a proposal requesting information relating to modernizing the CRA.
46
Volcker Rule
On December 10, 2013, five financial regulatory agencies, including the Federal Reserve and the OCC, our primary federal regulators, adopted final rules implementing the so-called Volcker Rule embodied in Section 13 of the Bank Holding Company Act (“BHCA”), which was added by Section 619 of the Dodd-Frank Act. The final rules prohibit banking entities from (i) engaging in short-term proprietary trading for their own accounts and (ii) having certain ownership interests in and relationships with hedge funds or private equity funds (“covered funds”). The final rules are intended to provide greater clarity with respect to both the extent of those primary prohibitions and of the related exemptions and exclusions. The final rules also require each regulated entity to establish an internal compliance program that is consistent with the extent to which it engages in activities covered by the Volcker Rule, which must include (for the largest entities) making regular reports about those activities to regulators. Community and small banks, such as the Bank, are afforded some relief under the final rules and have received additional relief in the Regulatory Relief Act passed in 2018. The Company does not at this time expect the Volcker Rule to have a material impact on its operations.
Transactions with Affiliates
The Bank must comply with Sections 23A and 23B of the Federal Reserve Act relative to transactions with “affiliates,” generally defined to mean any company that controls or is under common control with the institution (as such, the Company is an affiliate of the Bank for these purposes). Transactions between an institution or its subsidiaries and its affiliates are required to be on terms as favorable to the Bank as terms prevailing at the time for transactions with non-affiliates. Certain transactions, such as loans to an affiliate, are restricted to a percentage of the institutions’ capital (
e.g.
, the aggregate amount of covered transactions with any individual affiliate is limited to 10% of the capital and surplus of the institution; the aggregate amount of covered transactions with all affiliates is limited to 20% of the institution’s capital and surplus). In addition, a savings and loan holding company may not lend to any affiliate engaged in activities not permissible for a savings and loan holding company or acquire the securities of most affiliates. The OCC has the discretion to treat subsidiaries of savings institutions as affiliates on a case-by-case basis.
The Dodd-Frank Act also states that an insured depository institution may not “purchase an asset from, or sell an asset to” a bank insider (or its related interests) unless (i) the transaction is conducted on market terms between the parties, and (ii) if the proposed transaction represents more than 10% of the capital stock and surplus of the insured institution, it has been approved in advance by a majority of the institution’s non-interested directors.
Certain transactions with directors, officers, or controlling persons are also subject to conflict of interest regulations. These conflict of interest regulations and other statutes also impose restrictions on loans to such persons and their related interests. Among other things, such loans must be made on terms substantially the same as for loans to unaffiliated individuals and must not create an abnormal risk of repayment or other unfavorable features for the Bank.
Federal Home Loan Bank System
The Bank is a member of the FHLB of Des Moines, one of 11 regional FHLBs that administer the home financing credit function of savings associations that is subject to supervision and regulation by the Federal Housing Finance Agency. All advances from the FHLB are required to be fully secured by sufficient collateral as determined by the FHLB. In addition, all long-term advances must be used for residential home financing.
As members of the FHLB System, the Bank is required to purchase and maintain activity-based capital stock in the FHLB in the amount specified by the applicable Federal Home Loan Bank's capital plan. At
September 30, 2018
, the Bank had in the aggregate
$23.4 million
in FHLB stock, which was in compliance with the Federal Home Loan Bank of Des Moines' requirement. For the fiscal year ended
September 30, 2018
, dividends paid by the FHLB to the Bank totaled
$1.1 million
.
Under federal law, the FHLBs are required to provide funds for the resolution of troubled savings associations and to contribute to low- and moderately-priced housing programs through direct loans or interest subsidies on advances targeted for community investment and low- and moderate-income housing projects. These contributions have adversely affected the level of FHLB dividends paid and could continue to do so in the future. These contributions could also have an adverse effect on the value of FHLB stock in the future. A reduction in value of the Bank’s FHLB stock may result in a corresponding reduction in the Bank’s capital. In addition, the federal agency that regulates the FHLBs has required each FHLB to register its stock with the SEC, which has increased the costs of each FHLB and may have other effects that are not possible to predict at this time.
47
FDIC Deposit Classification Guidance
The FDIC has published industry guidance (the “Guidance”) in the form of Frequently Asked Questions with respect to the categorization of deposit liabilities as "brokered" deposits. As of
September 30, 2018
, the Bank categorized
$2.21 billion
, or
49.9%
of its deposit liabilities, as brokered deposits
.
Due to the Bank’s status as a "well-capitalized" institution under the Basel III Capital Rules, and further with respect to the Bank’s financial condition in general, the Company does not at this time anticipate that the Guidance will have a material adverse impact on the Company’s liquidity, statements of financial condition or results of operations going forward. However, should the Bank ever fail to be well-capitalized in the future as a result of not meeting the well-capitalized requirements or the imposition of an individual minimum capital requirement or a similar formal requirement, then, notwithstanding that the Bank has capital in excess of the well-capitalized minimum requirements, the Bank would be prohibited, absent waiver from the FDIC, from utilizing brokered deposits (
i.e.,
no insured depository institution that is deemed to be less than “well-capitalized” may accept, renew or roll over brokered deposits absent a waiver from the FDIC). In such event, unless the Bank were to receive a suitable waiver from the FDIC, such a result could produce material adverse consequences for the Bank with respect to liquidity and could also have material adverse effects on the Company’s financial condition and results of operations. Further, and in general, depending on the Bank’s condition in the future, the FDIC could increase the surcharge on our brokered deposits up to 30 basis points. The Company intends to monitor any future clarifications, rulings and interpretations, including whether institutions would be expected by the FDIC to amend prior call reports. If we are required to amend previous call reports with respect to our level of brokered deposits, which the Company does not expect, or we are ever required to pay higher surcharge assessments with respect to these deposits, such payments could be material and therefore could have a material adverse effect on our financial condition and results of operations.
Holding Company Supervision & Regulation
We are a registered unitary savings and loan holding company, and as such we are subject to Federal Reserve examination, supervision, and certain reporting requirements. In addition, the Federal Reserve has enforcement authority over us and any of our non-savings institution subsidiaries. Among other things, this authority permits the Federal Reserve to restrict or prohibit activities that are determined to be a serious risk to the financial safety, soundness or stability of a subsidiary savings association.
The Federal Reserve has responsibility for the primary supervision and regulation of all savings and loan holding companies, including the Company. In connection with its assumption of responsibility for the ongoing examination, supervision and regulation of savings and loan holding companies, the Federal Reserve has published an interim final rule (“Regulation LL”). Related to this authority, on November 7, 2014, the Federal Reserve issued a list identifying the supervisory guidance documents issued by it prior to July 21, 2011 that are now applicable to savings and loan holding companies such as the Company, which list is periodically updated. The Federal Reserve stated that, among other things, this list was part of its initiative to establish a savings and loan holding company supervisory program similar in nature to its “long-established supervisory program for bank holding companies.”
Restrictions Applicable to All Savings and Loan Holding Companies
Federal law prohibits a savings and loan holding company, including us, directly or indirectly, from acquiring:
|
•
|
control (as defined under the HOLA) of another savings institution (or a holding company parent) without prior Federal Reserve approval;
|
|
•
|
through merger, consolidation or purchase of assets another savings institution or a holding company thereof, or acquiring all or substantially all of the assets of such institution (or a holding company) without prior Federal Reserve approval; or
|
|
•
|
control of any depository institution not insured by the FDIC (except through a merger with and into the holding company’s savings institution subsidiary that is approved by the Federal Reserve).
|
48
A savings and loan holding company may not acquire as a separate subsidiary an FDIC-insured institution that has a principal office outside of the state where the principal office of its subsidiary institution is located, except:
|
•
|
in the case of certain emergency acquisitions approved by the FDIC;
|
|
•
|
if such holding company controlled a savings institution subsidiary that operated a home or branch office in such additional state as of March 5, 1987; or
|
|
•
|
if the laws of the state in which the savings institution to be acquired is located specifically authorize a savings institution chartered by that state to be acquired by a savings institution chartered by the state where the acquiring savings institution or savings and loan holding company is located, or by a holding company that controls such a state-chartered association.
|
The HOLA also prohibits a savings and loan holding company (directly or indirectly, or through one or more subsidiaries) from acquiring or retaining, with certain exceptions, more than 5% of the voting shares of a non‑subsidiary savings association, a non-subsidiary holding company or a non-subsidiary company engaged in activities other than those permitted by the HOLA. In evaluating applications by holding companies to acquire savings associations, the Federal Reserve must consider the financial and managerial resources and future prospects of the company and institution involved, the effect of the acquisition on the risk to the DIF, the convenience and needs of the community and competitive factors.
Failure to Meet QTL Test
If a banking subsidiary of a savings and loan holding company fails to meet the QTL test (as discussed in “Federal Deposit Insurance and Other Regulatory Requirements—Qualified Thrift Lender Test” above), the holding company must register with the Federal Reserve as a bank holding company within one year of the savings institution’s failure to comply.
Activities Restrictions
Prior to the Dodd-Frank Act, savings and loan holding companies were generally permitted to engage in a wider array of activities than those permissible for their bank holding company counterparts and could have concentrations in real estate lending that are not typical for bank holding companies. Section 606 of the Dodd-Frank Act amended the HOLA and requires that covered savings and loan holding companies (
e.g.
, those that are not exempt from activities restrictions under the HOLA) that intend to engage in activities that are permissible only for a financial holding company under Section 4(k) of the BHCA do so only if the covered company meets all of the criteria to qualify as a financial holding company, and complies with all of the requirements applicable to a financial holding company as if the covered savings and loan holding company was a bank holding company. Savings and loan holding companies engaging in Section 4(k) activities permissible for bank holding companies need to comply with notice and filing requirements of the Federal Reserve.
If the Federal Reserve believes that an activity of a savings and loan holding company or a non-bank subsidiary constitutes a serious risk to the financial safety, soundness or stability of a subsidiary savings association and is inconsistent with the principles of sound banking, the purposes of the HOLA or other applicable statutes, the Federal Reserve may require the savings and loan holding company to terminate the activity or divest control of the non-banking subsidiary. This obligation is established in Section 10(g)(5) of the HOLA and bank holding companies are subject to equivalent obligations under the BHCA and the Federal Reserve’s Regulation Y.
Source of Strength and Capital Requirements
The Dodd-Frank Act requires all companies, including savings and loan holding companies, that directly or indirectly control an insured depository institution to serve as a source of financial and managerial strength to its subsidiary savings associations; to date, however, specific regulations implementing this requirement have not been published. Moreover, pursuant to the Dodd-Frank Act, savings and loan holding companies are generally subject to the same capital and activity requirements as those applicable to bank holding companies.
New rules promulgated by the Federal Reserve related to capital requirements that were required by the Dodd-Frank Act have also become effective. For a summary of the applicable changes, see “Risk Factors-Risks Related to Our Industry and Business.”
49
Examination
The Federal Reserve has stated that it intends, to the greatest extent possible, taking into account any unique characteristics of savings and loan holding companies and the requirements of the HOLA, to assess the condition, performance and activities of savings and loan holding companies on a consolidated basis in a manner that is consistent with the Federal Reserve’s established risk-based approach regarding bank holding company supervision. As with bank holding companies, the Federal Reserve’s objective is to ensure that a savings and loan holding company and its non-depository subsidiaries are effectively supervised and can serve as a source of strength for, and do not threaten the soundness of, its subsidiary depository institution(s).
In accordance with its goal to assess the condition, performance and activities of savings and loan holding companies on a consolidated basis in a manner that is consistent with the Federal Reserve’s established risk-based approach regarding bank holding company supervision, the Federal Reserve announced in 2013 that it will use the “RFI/C(D)” rating system (commonly referred to as “RFI”) to assign indicative ratings to such companies. On December 9, 2016, the Federal Reserve issued a proposal to fully apply its existing rating system for bank holding companies to savings and loan holding companies on a fully implemented basis (the "Ratings Proposal"). If adopted as proposed, indicative ratings would no longer be used to evaluate the Company.
In late 2013, the Federal Reserve announced that, with respect to savings and loan holding companies with less than $10 billion in assets (like the Company), such companies’ inspection frequency and scope requirements will be the same as those for bank holding companies of the same asset size. The FRB is responsible for determining whether or not a savings and loan holding company is “complex” as determined by certain factors enumerated by the Federal Reserve. According to the Federal Reserve, with respect to institutions with less than $10 billion in assets (such as the Company), the determination of whether a holding company is "complex" versus "noncomplex" is made at least annually, on a case-by-case basis, taking into account and weighing a number of considerations, such as: the size and structure of the holding company; the extent of intercompany transactions between insured depository institution subsidiaries and the holding company or uninsured subsidiaries of the holding company; the nature and scale of any non-bank activities, including whether the activities are subject to review by another regulator and the extent to which the holding company is conducting Gramm-Leach-Bliley authorized activities (
e.g.
, insurance, securities, merchant banking); whether risk management processes for the holding company are consolidated; and whether the holding company has material debt outstanding to the public. The Federal Reserve has advised savings and loan holding companies with less than $10 billion in assets (like the Company) to refer to this supervisory guidance until the Ratings Proposal is finalized. As of the date of this filing, the FRB has not advised the Company that it is "complex".
Change of Control
The federal banking laws require that appropriate regulatory approvals must be obtained before an individual or company may take actions to “control” a bank or savings association. The definition of control found in the HOLA is similar to that found in the BHCA for bank holding companies. Both statutes apply a similar three-prong test for determining when a company controls a bank or savings association. Specifically, a company has control over either a bank or savings association if the company:
(1)
directly or indirectly or acting in concert with one or more persons, owns, controls or has the power to vote 25% or more of the voting securities of a company;
(2)
controls in any manner the election of a majority of the directors (or any individual who performs similar functions in respect of any company, including a trustee under a trust) of the board; or
(3)
directly or indirectly exercises a controlling influence over the management or policies of the bank.
Regulation LL implements the HOLA to govern the operations of savings and loan holding companies. Regulation LL includes a specific definition of “control” similar to the statutory definition, with certain additional provisions, including those related to a determination as to when a company or natural person acquires control of a savings association or savings and loan holding company under the HOLA or the Change in Bank Control Act (“CBCA”). In light of the similarity between the statutes governing bank holding companies and savings and loan holding companies, the Federal Reserve uses its established rules and processes with respect to control determinations under the HOLA and the CBCA to ensure consistency between equivalent statutes administered by the same agency.
50
The Federal Reserve stated in connection with its issuance of Regulation LL that it will review investments and relationships with savings and loan holding companies by companies using the current practices and policies applicable to bank holding companies to the extent possible. Overall, the indicia of control used by the Federal Reserve under the BHCA to determine whether a company has a controlling influence over the management or policies of a banking organization (which, for Federal Reserve purposes, includes savings associations and savings and loan holding companies) are similar to the control factors found in prior OTS regulations.
Moreover, unlike the prior OTS control rules, the Federal Reserve does not have a separate application process for rebutting control under the BHCA and Regulation LL does not include such a process. Given that Federal Reserve practice is to consider potential control relationships for all investors in connection with applications submitted under the BHCA, the Federal Reserve will review potential control relationships for all investors in connection with applications submitted to the Federal Reserve under Section 10(e) or 10(o) of the HOLA. The Federal Reserve may obtain a series of passivity commitments from investors seeking to purchase in excess of 5% of the issued and outstanding common stock of savings and loan holding companies and bank holding companies.
Management
On August 9, 2017, the Federal Reserve published proposed guidance related to supervisory expectations for boards of directors, including boards of directors of savings and loan holding companies. The proposal seeks to clarify supervisory expectations of boards and distinguish the roles held by senior management to allow boards to focus on fulfilling their core responsibilities. The comment period closed on February 15, 2018, and, as of the date of this Annual Report on Form 10-K, no final rule has yet been published.
Federal and State Taxation
Federal and State Taxation
Meta and its subsidiaries file a consolidated federal income tax return and various consolidated state income tax returns. Additionally, Meta or its subsidiaries file separate company income tax returns in states where required. All returns are filed on a fiscal year basis using the accrual method of accounting. We monitor relevant tax authorities and change our estimate of accrued income tax due to changes in income or franchise tax laws and their interpretation by the courts and regulatory authorities. In addition to the regular income tax, corporations, including savings banks such as the Bank, generally are subject to a minimum tax. An alternative minimum tax is imposed at a minimum tax rate of 20% on alternative minimum taxable income, which is the
sum of a corporation’s regular taxable income (with certain adjustments) and tax preference items, less any available exemption. The alternative minimum tax is imposed to the extent it exceeds the corporation’s regular income tax and net operating losses can offset no more than 90% of alternative minimum taxable income. Under the Tax Cuts and Jobs Act (the "Tax Act"), the alternative minimum tax will not be imposed for tax years beginning on or after January 1, 2018.
To the extent earnings appropriated to a savings bank’s bad debt reserves and deducted for federal income tax purposes exceed the allowable amount of such reserves computed under the experience method and to the extent of the bank’s supplemental reserves for losses on loans and leases (“Excess”), such Excess may not, without adverse tax consequences, be utilized for the payment of cash dividends or other distributions to a stockholder (including distributions on redemption, dissolution or liquidation) or for any other purpose (except to absorb bad debt losses). As of
September 30, 2018
, the Bank’s Excess for tax purposes totaled approximately
$6.7 million
.
Competition
The Company competes with a wide range of regional and national banks located in our market areas as well as non-bank commercial finance and factoring companies on a nationwide basis.
The Company’s Community Banking operation faces strong competition, both in originating real estate and other loans and in attracting deposits. Competition in originating real estate loans comes primarily from commercial banks, savings banks, credit unions, captive finance companies, insurance companies and mortgage bankers making loans secured by real estate located in the Company’s market area. Commercial banks and credit unions provide vigorous competition in consumer lending. The Company competes for real estate and other loans principally on the basis of the quality of services it provides to borrowers, interest rates and loan fees it charges, and the types of loans it originates.
51
The Company’s Community Banking operation attracts deposits through its Retail Banking offices, primarily from the communities in which those Retail Banking offices are located; therefore, competition for those deposits is principally from other commercial banks, savings banks, credit unions and brokerage offices located in the same communities. The Company competes for these deposits by offering a variety of deposit accounts at competitive rates, convenient business hours and convenient branch locations with interbranch deposit and withdrawal privileges at each branch location.
The Company’s MPS division serves customers nationally and also faces strong competition from large commercial banks and specialty providers of electronic payments processing and servicing, including prepaid, debit and credit card issuers, Automated Clearing House (“ACH”) processors and ATM network sponsors. Many of these national players are aggressive competitors, leveraging relationships and economies of scale.
It is also expected that the Bank will continue to experience strong competition for its AFS/IBEX division with respect to financing insurance premiums and for its Refund Advantage, EPS, and SCS businesses with respect to tax return processing services.
Employees
At
September 30, 2018
, the Company and its subsidiaries had a total of 1,219 full-time equivalent employees, an increase of 392 employees, or 47%, from
September 30, 2017
. The Company’s employees are not represented by any collective bargaining group. Management considers its employee relations to be good.
Available Information
The Company’s website address is www.metafinancialgroup.com. The Company makes available, through a link with the SEC’s EDGAR database, free of charge, its annual report on Form 10-K, quarterly reports on Form 10-Q, current reports on Form 8-K, amendments to those reports filed or furnished pursuant to Section 13(a) or 15(d) of the Exchange Act, and statements of ownership on Forms 3, 4, and 5. Investors are encouraged to access these reports and other information about our business on our website. The information found on the Company’s website is not incorporated by reference in this or any other report the Company files or furnishes to the SEC. We also will provide copies of our Annual Report on Form 10-K, free of charge, upon written request to Brittany Kelley Elsasser, Director of Investor Relations, at the Company’s address. Also posted on our website, among other things, are the charters of our committees of the Board of Directors, as well as the Company's and the Bank's Codes of Ethics.
We are subject to various risks, including those described below that, individually or in the aggregate, could cause our actual results to differ materially from expected or historical results. Our business could be harmed, perhaps materially, by any of these risks, as well as other risks that we have not identified, whether due to such risks not presently being known to us, because we do not currently believe such risks to be material, or
otherwise. The trading price of our common stock could decline due to any of these risks, and you may lose all or part of your investment. The risks discussed below also include forward-looking statements, and actual results and events may differ substantially from those discussed or highlighted in these forward-looking statements. In assessing these risks, you should also refer to the other information contained in this annual report on Form 10-K, including the Company’s financial statements and related notes. Before making an investment decision with respect to any of our securities, you should carefully consider the following risks and uncertainties described below and elsewhere in this annual report on Form 10-K. See also “Forward-Looking Statements.”
52
Risks Related to Our Industry and Business
Our growth has been robust, and failure to generate sufficient capital to support anticipated growth could cause us difficulty in maintaining regulatory capital compliance and adversely affect our earnings and prospects.
We have continued to experience considerable growth recently, having increased our assets from
$5.23 billion
at September 30, 2017 to
$5.84 billion
at
September 30, 2018
. This increase was primarily the result of the Crestmark Acquisition, as well as continued loan and lease growth. Asset growth and diversification of our lending business, primarily driven by the Crestmark Acquisition, has required and, if continued as expected, will continue to generate a need for higher levels of capital which management believes may not be met through earnings retention alone. Additionally, our asset mix has materially changed since September 30, 2017 and is expected to continue to change, as we expand and diversify our financial product offerings in the market, especially in our commercial lending and financing business and in our tax-related financial solutions divisions. These lending activities carry risk weights far in excess of traditional one- to four- family loans, and as a result it will be more difficult to maintain regulatory capital compliance.
There can be no assurance that we will be able to access sources of capital, private or public, to satisfy capital requirements in the future. Failure to remain well-capitalized, or to attain potentially even higher levels of capitalization that may be required in the future under regulatory initiatives mandated by Congress, our regulatory agencies, or under the Basel accords, could adversely affect the Company’s earnings and prospects.
We may have difficulty continuing to grow, and even if we do grow, our growth may strain our resources and limit our ability to expand our operations successfully.
As described above, we have experienced significant growth in our assets, including in connection with the Crestmark Acquisition and as a result of organic growth; this is also the case with the level of our deposits, which have continued to grow. Our future profitability will depend in part on our continued ability to grow our business, including through acquisitions and other strategic transactions. Our growth will also depend on our ability to successfully integrate the operations of acquired businesses, including as a result of the Crestmark Acquisition. See also “Acquisitions could disrupt our business and may not be successful.” We may not, however, be able to sustain our historical growth rate or be able to grow at all. In addition, we believe that our future success will depend on competitive factors and on the ability of our senior management to continue to maintain a robust system of internal controls and procedures and manage a growing number of customer relationships. See “--The Company operates in an extremely competitive market, and the Company’s business will suffer if it is unable to compete effectively.” We may not be able to implement changes or improvements to these internal controls and procedures in an efficient or timely manner and may discover deficiencies in existing systems and controls. Consequently, continued growth, if achieved, may place a strain on our operational infrastructure, which could have a material adverse effect on our financial condition and results of operations.
We incur significant costs and demands upon management and accounting and finance resources as a result of complying with the laws and regulations affecting public companies; if we fail to maintain proper and effective internal controls, our ability to produce accurate and timely financial statements could be impaired, which could harm our operating results, our ability to operate our business and our reputation.
As a SEC reporting company, we are required to, among other things, maintain a system of effective internal control over financial reporting, which requires annual management and independent registered public accounting firm assessments of the effectiveness of our internal controls. Ensuring that we have adequate internal financial and accounting controls and procedures in place so that we can produce accurate financial statements on a timely basis is a costly and time-consuming effort that needs to be re-evaluated frequently. We have historically dedicated a significant amount of time and resources to implement our internal financial and
accounting controls and procedures. Substantial work may continue to be required to further implement, document, assess, test, and, if necessary, remediate our system of internal controls. We may also need to retain additional finance and accounting personnel in the future.
53
If our internal control over financial reporting is not effective, we may be unable to issue our financial statements in a timely manner, we may be unable to obtain the required audit or review of our financial statements by our independent registered public accounting firm in a timely manner, or we may otherwise be unable to comply with the periodic reporting requirements of the SEC. Additionally, our common stock listing on the NASDAQ Global Select Market could be suspended or terminated and our stock price could materially suffer. In addition, we or members of our management team could be subject to investigation and sanction by the SEC or other regulatory authorities and to claims by stockholders, which could impose significant additional costs on us and divert our management's attention. See also "
Item 9A. Controls and Procedures-Management’s Annual Report on Internal Control over Financial Reporting
" for inherent limitations in a control system.
As a savings and loan holding company, we are required to serve as a “source of strength” for the Bank.
Federal banking law codifies a requirement that savings and loan holding companies (like the Company) act as a financial “source of strength” for its FDIC-insured depository institution subsidiaries (like the Bank). The term “source of financial strength” is defined in the relevant statute as the ability of a company to provide financial assistance to such insured depository institution in the event of the financial distress of such insured depository institution. The statute permits the OCC, as the Bank’s primary federal regulator, to request reports from the Company to assess its ability to serve as a source of strength and to enforce compliance with these statutory requirements. To date, no regulations have been proposed in connection with this statutory requirement, although it is widely assumed that the Federal Reserve would enforce its prior guidance regarding this doctrine as applied to bank holding companies when applying the rule to savings and loan holding companies like the Company.
Given the power provided to the federal banking agencies in this provision, it is possible that we could be required to serve as a source of strength for the Bank when we might not otherwise voluntarily choose to do so. Specifically, the imposition of such financial requirements might require us to raise additional capital to support the Bank at a time when it is not otherwise prudent for us to do so; for example, such raise could be on terms that are not favorable or typical in the existing market. If we were unable to raise necessary capital, we could become subject to negative or burdensome regulatory conditions that could negatively impact our growth. Further, any capital provided by us to the Bank would be subordinate to others with interest in the Bank, including the Bank's depositors. In addition, in the event of the bankruptcy of the Company at a time when it had a commitment to one of the Bank’s regulators to maintain the capital of the Bank, the regulators’ claims against the Company may be entitled to priority status over other obligations.
Our loan portfolio has grown substantially, and our underwriting practices may not prevent future losses in our loan portfolio.
Our loan portfolio has grown substantially over the last several years, primarily due to the Crestmark Acquisition and organic growth in loan originations. Our underwriting practices are designed to mitigate risk by adhering to specific loan and financing parameters. Components of our underwriting program include, where appropriate, an analysis of the borrower and their creditworthiness, a financial statement review, a business plan review, and, if applicable, cash flow projections and a valuation of collateral. Other lending programs, particularly in the Bank's divisions, rely on management experience and quantitative data. We may incur losses in our loan portfolio, especially the portion acquired in the Crestmark Acquisition for which integration efforts continue, if our underwriting practices or criteria fail to adequately identify, price, and mitigate credit risks. It is also possible that losses will exceed the amounts the Bank has set aside for loss reserves and result in reduced interest income and increased provision for loan losses, which could have an adverse effect on our financial condition and results of operations. Deterioration in our loan portfolio could also cause a decrease in our capital, which would make it more difficult to maintain regulatory capital compliance.
54
Our loan portfolio includes loans with a higher risk of loss.
The Company originates commercial loans and related financing products, commercial mortgage loans, consumer loans, agricultural real estate loans, agricultural loans, and residential mortgage loans. Commercial, commercial mortgage, consumer, agricultural real estate, and agricultural loans may expose the Bank to greater credit risk than loans secured by residential real estate because the collateral securing these loans may not be sold as easily as residential real estate. These loans also have greater credit risk than residential real estate, including for the following reasons:
|
•
|
Commercial Loans and Related Financing Products.
Repayment is dependent upon the successful operation of the borrower’s business. Moreover, due to the composition of borrowers under these loans within our portfolio (small- to medium-sized businesses), this portfolio may be more susceptible to even mild or moderate economic declines than a portfolio of loans with larger commercial borrowers.
|
|
•
|
Commercial Mortgage Loans
. Repayment is dependent upon income being generated in amounts sufficient to cover operating expenses and debt service.
|
|
•
|
Consumer Loans.
Consumer loans (such as personal lines of credit) are collateralized, if at all, with assets that may not provide an adequate source of payment of the loan due to depreciation, damage, or loss.
|
|
•
|
Agricultural Loans.
Repayment is dependent upon the successful operation of the business, which is greatly dependent on many things outside the control of either the Bank or the borrowers. These factors include weather, commodity prices, and interest rates, among others.
|
|
•
|
Commercial Insurance Premium Finance Loans.
Repayment is dependent upon the successful operations of the business. The risk is mitigated, however, because the loan is secured by the unamortized portion of the underlying insurance policy.
|
|
•
|
Student Loans.
Repayment is dependent upon the obligor’s fulfillment of its contractual payment obligations, which is greatly dependent on factors outside the control of the Bank.
|
|
•
|
Taxpayer Advance Loans.
Repayment is dependent upon an income tax refund being approved and paid by the Internal Revenue Service or a state tax authority.
|
If our actual loan and lease losses exceed our allowance for loan and lease losses, our net income will decrease.
We make various assumptions and judgments about the collectability of our loan and lease portfolio, including the creditworthiness of our borrowers and the value of the real estate and other assets serving as collateral for the repayment of our loans and leases. Despite our underwriting and monitoring practices, our loan and lease customers may not repay their loans and leases according to their terms, and the collateral securing the payment of these loans and leases may be insufficient to pay any remaining loan and lease balance. We may experience significant loan and lease losses, which could have a material adverse effect on our operating results. Because we must use assumptions regarding individual loans and leases and the economy, the current allowance for loan and lease losses may not be sufficient to cover actual loan and lease losses, and increases in the allowance may be necessary. We may need to significantly increase our provision for losses on loans and leases if one or more of our larger loans and leases or credit relationships becomes impaired or if we continue to expand our commercial real estate and commercial lending businesses or enter new lines of lending. In addition, federal and state regulators periodically review our allowance for loan and lease losses and may require us to increase our provision for loan and lease losses or recognize loan charge-offs. Material additions to our allowance would materially decrease our net income. We cannot provide any assurance that our monitoring procedures and policies will reduce certain lending risks or that our allowance for loan and lease losses will be adequate to cover actual losses. Nonpayment of loans and leases related to the Bank’s and its divisions’ businesses may have a materially adverse effect on our overall financial condition and results of operation, as well as the value of our common stock.
Further, a new method of determining loan and lease loss allowances, expected to be implemented in fiscal year 2020, is under analysis and could impact future profitability.
55
Economic and market conditions could adversely affect our industry and regulatory costs.
Our success depends, to a certain extent, upon local economic and political conditions as well as governmental monetary policies. Conditions such as inflation, recession, unemployment, changes in interest rates, money supply and other factors beyond our control may adversely affect asset quality, deposit levels, products, and loan and lease demand and, therefore, our earnings.
Flat or declining national economic growth and reduced availability of commercial credit could negatively impact the credit performance of commercial and consumer credit in general. Under such conditions, the broader U.S. economy could experience increased commercial and consumer credit contraction, a lack of customer confidence, increased market volatility, and widespread reduction in general business activity. Such adverse changes in the economy may also have a negative effect on the ability of our commercial and consumer borrowers to make timely repayments of their loans and leases, which would have an adverse impact to our earnings.
The resulting economic pressure from any or all of these events on consumers and businesses and the lack of confidence in the financial markets could adversely affect our business, financial condition, results of operations, and stock price. A worsening of these economic conditions would likely exacerbate the adverse effects of difficult market conditions on us and others in the financial institutions industry.
In particular, as a result of credit and liquidity challenges faced by the broader economy, our industry and business lines could come under new or increased supervision regulation. Although the November 2016 federal election has, to some degree, curtailed an expansion of our regulatory obligations (see "--We operate in a highly regulated environment, and changes in laws and regulations to which we are subject may adversely affect our results of operations." below), compliance with existing and additional regulations in a distressed market would likely increase our costs, limit our ability to pursue new business opportunities, and curtail the businesses in which we operate.
Because we have a significant amount of real estate loans, declines in real estate values could adversely affect the value of property used as collateral. Customer demand for loans secured by real estate may also decrease due to weaker economic conditions, an increase in unemployment, a decrease in real estate values, or an increase in interest rates.
In addition, the demand for commercial lending and other forms of commercial financing could weaken due to national economic conditions that cause business growth and credit needs to retract, which could diminish or delay our realization of the anticipated benefits of the Crestmark Acquisition since the Crestmark division is focused on commercial lending and financing. Further, weakened demand could adversely affect the specialty lending operations of our Crestmark division that are focused on certain industries or its factoring services because, if Crestmark is unable to collect on loans, leases or purchased receivables, Crestmark and the Bank will sustain losses, which could be material. See also “-Our loan portfolio includes loans with a higher risk of loss.”
The process we use to estimate losses inherent in our credit exposure requires difficult, subjective and complex judgments, including forecasts of economic conditions, and determinations as to whether economic conditions might impair the ability of our borrowers to repay their loans and leases. The level of uncertainty concerning economic conditions may adversely affect the accuracy of our estimates which may, in turn, impact the reliability of our underwriting processes. See also “--If the Company’s actual loan and leases losses exceed the Company’s allowance for loan and lease losses, the Company’s net income will decrease.”
The value of the portfolio of investment securities that we hold, which portfolio constitutes a large percentage of our assets, may also be adversely affected by adverse market conditions.
If we experience financial setbacks or regulatory action in the future, we may be required to pay significantly higher FDIC insurance premiums than we currently pay due, in part, to our significant level of brokered deposits or we could be curtailed or prohibited from accepting some or all such brokered deposits. See Part I, Item 1 “Business - Regulation.”
56
We operate in a highly regulated environment, and changes in laws and regulations to which we are subject may adversely affect our results of operations.
The Company and the Bank operate in a highly regulated environment and we are subject to extensive regulation, supervision, and examination by the OCC and the Federal Reserve. In addition, the Bank is subject to regulation by the FDIC and, to a lesser degree, the Bureau. See Part I, Item 1 “Business - Regulation” herein. Applicable laws and regulations may change, and the enforcement of existing laws and regulations may vary when actions are evaluated by these regulators. Any such changes could adversely affect our business. Regulatory authorities have extensive discretion in connection with their supervisory and enforcement activities, including, but not limited, to the imposition of restrictions on the operation of an institution, the classification of assets by the institution, and the adequacy of an institution’s allowance for loan and lease losses. Any change in such regulation and oversight, whether in the form of restrictions on activities, regulatory policy, regulations or legislation, could have a material impact on our operations.
For example, on February 3, 2017, President Trump signed Executive Order 13772, specifying new core principles for regulating the U.S. financial system. Among other things, the President directed the Secretary of the Treasury, in consultation with federal regulatory agencies, to review existing laws and regulations and report on the extent to which they were consistent with the core principles. Beginning in February 2017, Congress passed, and the President signed, more than a dozen resolutions under the Congressional Review Act, repealing various federal regulations, including regulations adopted by the Bureau. Moreover, in May 2018, Congress passed, and President Trump signed, the Regulatory Relief Act, which includes a variety of provisions intended to ease the cost of compliance and its related burdens for insured depository institutions. Additionally, proposals to modify existing regulations in light of the new core principles are under consideration by various federal regulatory agencies, including the Bureau. There can be no assurance that any such legislation will be enacted, or that changes in existing regulations will be adopted to implement the new core principles.
As a result, the effect of financial services legislation and regulations remains uncertain. The implementation, amendment, or repeal of federal financial services laws or regulations may limit the Bank and its divisions’ business opportunities, impose additional costs on the Company and the Bank, impact the Company’s and the Bank’s revenues or the value of their assets, or otherwise adversely affect the Company or the Bank and its divisions’ businesses.
Changes to the Small Business Administration’s rules, regulations, and loan products could adversely impact the Bank.
The Crestmark division solicits commercial customers that want to utilize the U.S. Small Business Administration’s commercial lending programs to establish or expand their existing businesses. By their nature, these loans typically fall outside the Bank’s commercial underwriting criteria, either because they are in the “start-up” phase or because their business plan or business metrics pose challenges that the Bank has traditionally believed to be outside its risk parameters. The economic support provided by the SBA, however, positively affects underwriting scoring, allowing such loans to be originated by the Bank.
SBA loans do not provide participating banks with blanket guaranties; typically, only a portion of such loans (usually about 75%) are guaranteed. The process to file for the guaranteed funds can be complicated and payments can be significantly delayed; moreover, to the extent the SBA were to review the underlying loan package and raise any issues in connection with the Bank’s documentation of such loans, it could decline the guaranty or require additional paperwork to support the lending decision, which may be costly to prepare. Further, payment on the guaranty may only be claimed after the Bank liquidates the collateral and seeks payment from any loan guarantors. As such, there may be a significant period of time between loan default and realization on the SBA guarantee. See also “--The Crestmark Division generates numerous government-backed loans funded by the Bank, any of which could be negatively impacted by a variety of factors.”
While such loans are backed by the full faith and credit of the U.S. government, these programs are subject to Congressional appropriation and could be materially modified either by Congress or by the SBA in connection with its rule-writing authority. To the extent such modifications negatively affect participation or demand in the market for such loans in the future, the Bank could be negatively impacted.
57
The OCC and Federal Reserve are our primary banking regulators, and we may not be able to comply with applicable banking regulations to their satisfaction.
Our primary regulators have broad discretionary powers to enforce banking laws and regulations and may seek to take informal or formal supervisory action if they deem such actions are necessary or required. If imposed in the future, corrective steps could result in additional regulatory requirements, operational restrictions, a consent order, enhanced supervision and/or civil money penalties. If imposed, additional resources, both economic and in terms of personnel, would likely need to be dedicated by the Company and the Bank and such regulatory actions could have a material adverse effect on us.
Regulatory capital requirements have increased.
Under the Basel III Capital Rules, minimum requirements have increased for both the quantity and quality of capital held by banking organizations. The Basel III Capital Rules include a new minimum ratio of CET1 Capital to risk-weighted assets of 4.5% and a capital conservation buffer of 1.8750% for 2018, increasing by 0.0625% per year to 2.5% of risk-weighted assets for 2019 and later years. The rules also impose a minimum ratio of tier 1 capital to risk-weighted assets of 6% and include a minimum leverage ratio (tier 1 capital to average total assets) of 4% for all banking organizations. The rules emphasize CET1 Capital and implement strict eligibility criteria for regulatory capital instruments. The minimum total capital ratio remains at 8%, but the general PCA framework has been changed to incorporate these increased minimum requirements. The Basel III Capital Rules phase-in period for smaller, less complex banking organizations, like us and the Bank, began in January 2015. The phase-in has already increased capital requirements for the Company and the Bank, which will be subject to further increasing capital requirements until the phase-in is complete. While the recently passed Regulatory Relief Act requires that federal banking regulators establish a simplified leverage capital framework for smaller banks, the increased regulatory capital requirements could affect our and the Bank's future growth, and if we or the Bank fail to meet such requirements, including of the Basel III Capital Rules (including the application of well-capitalized levels in connection with such rules), we and the Bank would be subject to adverse regulatory action by our regulators, which action could have a material adverse effect on us, the Bank, and our shareholders.
We have a concentration of our assets in mortgage-backed securities and municipal securities.
As of
September 30, 2018
, approximately
6.4%
of our assets were invested in MBS. Our mortgage-backed and related securities portfolio consists primarily of securities issued by U.S. government instrumentalities, including those of Fannie Mae and Freddie Mac which are in conservatorship. The Fannie Mae and Freddie Mac certificates are modified pass-through MBS that represent undivided interests in underlying pools of fixed-rate, or certain types of adjustable-rate, predominantly single-family and, to a lesser extent, multi-family residential mortgages issued by these U.S. government instrumentalities.
MBS are subject to credit risk and the risk that a fluctuating interest rate environment, along with other risks such as the geographic distribution of the underlying mortgage loans, may alter the prepayment rate of such mortgage loans and affect both the prepayment speed and value of such securities.
As of
September 30, 2018
, approximately
21.9%
of the Bank’s assets were invested in municipal securities. Municipal securities remain subject to the risk that a fluctuating interest rate environment may alter the value of the securities.
The full impact of the Dodd-Frank Act is still unknown.
Hundreds of new federal regulations, studies and reports were required under the Dodd-Frank Act. A significant number of them have been finished, but some, including the executive compensation rule, still need to be finalized. Based on the provisions of the Dodd-Frank Act that have already been implemented as well as anticipated regulations, it is likely that banks and thrifts as well as their holding companies will continue to be subject to regulation and compliance obligations that expose us to higher costs as well as noncompliance risk and related regulatory consequences. Given that required regulations under the Dodd-Frank Act have not yet been adopted, there can be no assurance as to the specific provisions of any such of future regulations or their impact on us or our business, including whether any such future regulations will impose greater restrictions on our business, which could adversely impact our business and results of operations.
58
The Bureau has reshaped certain consumer financial laws through rulemaking and enforcement of prohibitions against unfair, deceptive or abusive practices, and such actions have directly impacted the business operations of depository institutions offering consumer financial products or services, including the Bank, and may continue to do so in the future.
The Bureau has broad rulemaking authority to administer and carry out the purposes and objectives of “federal consumer financial laws, and to prevent evasions thereof” with respect to all financial institutions that offer financial products and services to consumers. The Bureau is also authorized to prescribe rules, applicable to any covered person or service provider, identifying and prohibiting acts or practices that are “unfair, deceptive, or abusive” in connection with any transaction with a consumer for a consumer financial product or service, or the offering of a consumer financial product or service (“UDAAP authority”). We cannot predict the impact the Bureau’s future actions will have on the banking industry broadly or the Company and the Bank specifically. Notwithstanding that insured depository institutions with assets of $10 billion or less (such as the Bank) will continue to be supervised and examined by their primary federal regulators, the full reach and impact of the Bureau’s broad rulemaking powers and UDAAP authority on the operations of financial institutions offering consumer financial products or services are currently unknown. See “Business Regulation - Bank Supervision and Regulation” which is included in Item 1 of this Annual Report on Form 10-K.
A less than “Satisfactory” CRA rating could have a negative effect on the OCC’s review of certain banking applications
submitted by the Bank.
Under the CRA, the Bank is evaluated periodically by the OCC, its primary federal banking regulator, to determine if it is meeting its continuing and affirmative obligation consistent with its safe and sound operation to help meet the credit needs of its entire community, including low- and moderate-income neighborhoods. In the Bank’s most recent CRA examination dated January 3, 2017, the Bank received an overall rating of “Satisfactory.” If the Bank were to receive a future CRA rating of less than “Satisfactory,” the CRA requires the OCC to take such rating into account in considering an application for any of the following: (i) the establishment of a domestic branch; (ii) the relocation of its main office or of a branch; (iii) the merger or consolidation with or acquisition of assets or assumption of liabilities of an insured depository institution; or (iv) the conversion of the Bank to a national charter. Based upon the NB Election Proposed Rule, CRA ratings will also be considered in determining whether a federal savings bank may to elect treatment as a national bank, although such rule has not yet been finalized as of the date of this Annual Report on Form 10-K and could be revised to materially differ from the proposed rule.
Actions taken by the Federal Reserve in connection with national monetary policy could have a material adverse effect on us.
The Federal Reserve is tasked with monitoring domestic economic conditions and national monetary and credit supply. To carry out these responsibilities, the Federal Reserve Board uses numerous monetary tools, including open market operations in U.S. government securities, adjustments of the discount rate, and changes in reserve requirements against bank deposits. Each of these measures is used in combination in an attempt to positively affect economic conditions in the United States. These actions also directly affect the interest rates charged by U.S. insured depository institutions and have a direct and immediate impact on savings and loan holding companies like us. Any future Federal Reserve actions or policies may have a material adverse effect on us, including with regard to the interest rates we will be able to charge.
Changes in interest rates could adversely affect our results of operations and financial condition.
Our earnings depend substantially on our interest rate spread, which is the difference between (i) the rates we earn on loans, securities, and other earning assets, and (ii) the interest rates we pay on deposits and other borrowings. These rates are highly sensitive to many factors beyond our control, including general economic conditions and the policies of various governmental and regulatory authorities. As market interest rates rise, we experience competitive pressures to increase the rates we pay on deposits, especially at our community bank, which may decrease our net interest income. Conversely, if interest rates fall, yields on loans and investments may fall. The Bank monitors its interest rate risk exposure; however, the Bank can provide no assurance that its efforts will appropriately protect the Bank in the future from interest rate risk exposure. For additional information, see Part II, Item 7A, “Quantitative and Qualitative Disclosures About Market Risk.”
59
Legal challenges to our, or the Bank’s, operations could have a significant material adverse effect on us.
From time to time, we, the Bank or our other subsidiaries are subject to legal proceedings and claims in the ordinary course of business. An adverse resolution in litigation, including litigation or other actions brought by our shareholders, customers or another third party, such as a state attorney general, could result in substantial damages or otherwise negatively impact our business, reputation and financial condition. See also Part I, Item 3, "Legal Proceedings."
We are subject to certain operational risks, including, but not limited to, data processing system failures, errors, breaches and customer or employee fraud.
There have been a number of publicized cases involving errors, fraud, or other misconduct by employees of financial services firms in recent years. Misconduct by our employees could include hiding unauthorized activities from us, improper or unauthorized activities on behalf of our customers, or improper use of confidential information. Employee fraud, errors, and employee and customer misconduct could subject us to financial losses or regulatory sanctions and significantly harm our reputation. It is not always possible to prevent employee errors and misconduct, and the precautions we take to prevent and detect this activity may not be effective in all cases. Employee errors could also subject us to civil claims for negligence.
Although we maintain a system of internal controls and procedures designed to reduce the risk of loss from employee or customer fraud or misconduct and employee errors, and although we maintain insurance coverage to mitigate losses that may be attributable to operational risks, including data processing system failures and errors and customer or employee fraud, these internal controls may fail to prevent or detect such an occurrence, or such an occurrence and related losses may not be insured or exceed applicable insurance limits.
In addition, there have been a number of cases where financial institutions have been the victim of fraud related to unauthorized wire and automated clearinghouse transactions. The facts and circumstances of each case vary but generally involve criminals posing as customers (
i.e.
, stealing bank customers’ identities) to transfer funds out of the institution quickly in an effort to place the funds beyond recovery prior to detection. Although we have policies and procedures in place to verify the authenticity of our customers and prevent identity theft, we can provide no assurances that these policies and procedures will prevent all fraudulent transfers. In addition, our computer systems could be infiltrated by hackers or other intruders. We can provide no assurances that the safeguards we have in place or may implement in the future will prevent all unauthorized infiltrations or breaches. Identity theft, successful unauthorized intrusions, and similar unauthorized conduct could result in reputational damage and financial losses to the Company.
Changes in technology could be costly.
The banking industry is undergoing technological innovation at a fast pace. To keep up with our competition, we need to stay abreast of innovations and evaluate those technologies that will enable us to compete on a cost-effective basis. This is especially true with respect to our MPS division. The cost of such technology, including personnel, has been high in both absolute and relative terms and additional funds continue to be used to enhance existing management information systems. There can be no assurance, given the fast pace of change and innovation, that our technology, either purchased or developed internally, will meet our needs, in a timely, cost-effective manner. During the course of implementing new technology into our or the Bank’s operations, we may experience system interruptions and failures. In addition, there can be no
assurances that we will recognize, in a timely manner or at all, the benefits that we may expect as a result of our implementing new technology into our operations. Moreover, in connection with our integration of the Crestmark division into the broader operations of the Bank, we may experience significant, one-time or recurring technology-related costs relating to the integration of systems used by the Crestmark division into the Bank’s existing systems. See also “-Acquisitions could disrupt our business and may not be successful.”
60
We are dependent upon relationships with various third parties with respect to the operations of the Bank and its divisions, and our relationships with such third parties, some of which are material to us, including changes in such relationships, could adversely affect our business.
The Bank has entered into numerous contracts with third parties with respect to the operations of its business. In some instances, the third parties provide services to the Bank and its divisions; in other instances, the Bank and its divisions provide products and services to such third parties. The Bank has also started offering consumer credit products to the national consumer credit market that are brokered or arranged by third parties. See "Risks Related to Marketing Program Agreements." If any such agreements are not renewed by the third party, if such agreements are renewed on terms less favorable to the Bank, or if such agreements are found to be illegal or in need of material restructuring to comply with applicable law or regulation, such actions could have a material adverse impact on the Bank, its divisions and, ultimately, the Company. For example, in July 2017, the Bank announced that it would not be providing interest-free Refund Advance loans for H&R Block tax preparation customers during the 2018 tax season. The Company’s relationship with H&R Block represented approximately $12.0 million in net earnings during fiscal year 2017. Given the loss of this relationship, the Company recognized a total impairment charge of $10.2 million, which was expensed during the 2017 fiscal fourth quarter.
In addition, if any of our counterparties is unable to meet its obligations to us for any reason (including but not limited to bankruptcy, computer or other technological interruptions or failures, personnel loss, negative regulatory actions, or acts of God), we may need to seek alternative service providers, or discontinue certain products or programs in their entirety. We have experienced, and expect to continue to experience, situations where we have been held directly or indirectly responsible, or were otherwise subject to liability, for actions of our third party vendors undertaken on behalf of the Bank or for the inability of our vendors to perform services for our customers on a timely basis or at all. Any such responsibility or liability in the future may have a material adverse effect on our business, including the operations of the Bank and its divisions, and financial results.
To the extent any agreement with a service provider is terminated, we may not be able to secure alternate service providers, and, even if we do, the terms with alternate providers may not be as favorable as those currently in place. In addition, were we to lose any of our significant third-party providers, it could cause a material disruption in our ability to service our customers, which also could have an adverse material impact on the Bank, its divisions and, ultimately, the Company. Moreover, significant disruptions in our ability to provide services could negatively affect the perception of our business, which could result in a loss of confidence and other adverse effects on our business.
Further, our agreements with third-party vendors could come under scrutiny by our regulators. If a regulator should raise an issue with, or object to, any term or provision in such an agreement or any action taken by such third party vis-à-vis the Bank’s operations or customers, this could result in a material adverse effect to the Company including, but not limited to, the imposition of fines and/or penalties and the termination of such agreement. Moreover, if our regulators examine our third party service providers and find questionable or illegal acts or practices, our regulators could require us to restructure or terminate our agreements with such providers.
We operate in an extremely competitive market, and our business will suffer if we are unable to compete effectively.
We encounter significant competition in all of our market areas from other commercial banks, savings and loan associations, credit unions, mortgage banking firms, consumer finance companies, securities brokerage firms, insurance companies, money market mutual funds and other financial intermediaries. Many of our competitors have substantially greater resources and lending limits and may offer services that we do not or cannot provide. Our profitability depends upon our continued ability to compete successfully in our market areas. The Bank's divisions operate on a national scale against competitors with substantially greater resources. The success of the Bank's divisions depends upon our, the Bank’s and the divisions' ability to compete in their various business markets.
Several banking institutions have adopted business strategies that are similar to ours, particularly with respect to the MPS division. As a consequence, we have encountered competition in this area and anticipate that we will continue to do so in the future. This competition may increase our costs, reduce our revenues or revenue growth, or make it difficult for us to compete effectively in obtaining additional customer relationships. With respect to the Crestmark division, we are also subject to additional competitive market factors. See “Risks Related to the Bank’s Divisions” for additional risks related to the Crestmark division.
61
The Bank relies on brokered deposits to assist in funding its loan and other financing products; accordingly, any change in the Bank’s ability to gather brokered deposits may adversely impact the Bank.
A substantial portion of our deposit liabilities are classified as brokered deposits, and failure to maintain the Bank's status as a "well-capitalized" institution could have an adverse effect on us, and our ability to fund our operations.
Based on published FDIC guidance, as of
September 30, 2018
, the Bank classified
$2.21 billion
, or
49.9%
, of its deposit liabilities as brokered deposits. Due to the Bank’s current status as a “well-capitalized” institution under the FDIC’s prompt corrective action regulations, management believes that this categorization of a segment of its deposits does not pose a risk to the Bank. However, should the Bank ever fail to be well-capitalized in the future as a result of not meeting the well-capitalized requirements or the imposition of an individual minimum capital requirement or similar formal requirement, then, the Bank would be prohibited, absent waiver from the FDIC, from utilizing brokered deposits (
i.e.,
no insured depository institution that is deemed to be less than “well-capitalized” may accept, renew or rollover brokered deposits absent a waiver from the FDIC). In such event, unless the Bank were to receive a suitable waiver from the FDIC, such a result could produce material adverse consequences for the Bank with respect to liquidity and could also have material adverse effects on our financial condition and results of operations. Further, and in general, depending on the Bank’s condition in the future, the FDIC could increase the surcharge on our brokered deposits up to 30 basis points. For the year ended
September 30, 2018
, we estimate that the additional surcharge attributable to the Bank’s brokered deposits was approximately $0.5 million, after tax. If we are required to amend previous call reports with respect to our level of brokered deposits or we are ever required to pay higher surcharge assessments with respect to these deposits, such payments could be material and therefore could have a material adverse effect on our financial condition and results of operations.
Our reputation and business could be damaged by negative publicity.
Reputational risk, including as a result of negative publicity, is inherent in our business. Negative publicity can result from actual or alleged conduct in a number of areas, including legal and regulatory compliance, lending practices, corporate governance, litigation, inadequate protection of customer data, illegal or unauthorized acts taken by third parties that supply products or services to the Company or the Bank, and ethical behavior of our employees. Damage to our reputation could adversely impact our ability to attract new, and maintain existing, loan and deposit customers, employees and business relationships, and, particularly with respect to our MPS division, could result in the imposition of new regulatory requirements, operational restrictions, enhanced supervision and/or civil money penalties. Such damage could also adversely affect our ability to raise additional capital. Any such damage to our reputation could have a material adverse effect on our financial condition and results of operations.
We derive a significant percentage of our deposits, total assets and income from deposit accounts that we generate through MPS’ customer relationships, of which four are particularly significant to our operations.
We derive a significant percentage of our deposits, total assets and income from deposit accounts we generate through program manager relationships between third parties and MPS. Deposits related to our top four program managers (each, a significant program manager) totaled $1.38 billion at
September 30, 2018
. We provide oversight and auditing of such third-party relationships and all such relationships must meet all internal and regulatory requirements. We may exit these relationships if such requirements are not met or if required to do so by our regulators. We perform liquidity reporting and planning daily and identify and monitor contingent sources of liquidity, such as national CDs, fed fund lines or public fund CDs. If one of these significant program manager relationships were to be terminated, it could materially reduce our deposits, assets and income. Similarly, if a significant program manager was not replaced, we may be required to seek higher-rate funding sources as compared to the existing program manager, and interest expense might increase.
62
The student loan portfolio purchases present risks to the Bank.
The Bank purchased two separate student loan portfolios; the first in fiscal year 2017 and the second at the beginning of fiscal year 2018. The first portfolio included seasoned loans that were taken by medical school students who enrolled in non-U.S. medical schools and the second included more traditional loans made to higher education students. The servicing of these loans is done through a third-party. When the portfolios were purchased, they were insured by ReliaMax Surety Company ("RSC"); however, the South Dakota Division of Insurance placed RSC into liquidation in June 2018. As a result of the liquidation proceedings, the Bank's purchased student loan portfolios are no longer insured. Due to the cancellation of the insurance coverage with respect to the purchased student loan portfolios, we adjusted the allowance for loan and lease losses attributable to the purchased student loan portfolios to
$2.8 million
at September 30, 2018, and we expect to recognize additional ongoing provision expense on the purchased student loan portfolios until recovery of unearned premiums is collected. We cannot provide any assurances as to whether or to what extent we will be able to recover all or any portion of unearned premiums relating to the Bank's purchased student loan portfolios, whether as a result of the RSC liquidation plan, the New York Property/Casualty Insurance Security Fund, or otherwise. If our recovery of unearned premiums is less than expected (including if we do not recover any such amounts at all), we may recognize loan losses in the future in excess of our estimates, which may adversely affect our realized pre-tax yields on the Bank's purchased student loan portfolios and may otherwise have a material adverse impact on our financial condition and results of operations.
A data security breach involving us, the Bank or any of our business vendors, marketers, or partners could expose us to liability and protracted and costly litigation, and could adversely affect our reputation and operating revenues.
In connection with our businesses, we collect and retain significant volumes of personally identifiable information, including social security numbers of our customers and other personally identifiable information of our customers and employees. Our vendors, marketers, or partners may experience security breaches involving the receipt, transmission, and storage of confidential customer and other personally identifiable information; alternatively, we may directly experience such a security breach. Such security breaches could include account takeovers, unavailability of service, computer viruses, or other malicious code, cyberattacks, or other events. These threats may arise from human error, fraud or malice on the part of employees or third parties or from accidental technological failure. If one or more of these events occurs, it could result in the disclosure of confidential customer information, damage to our reputation with our customers and the market, additional costs (such as costs for repairing systems or adding new personnel or protection technologies), regulatory penalties, and financial losses for both us and our clients and customers. Such events could also cause interruptions or malfunctions in our operations, as well as the operations of our clients, customers, or other third parties with which we engage in business. Risks and exposures related to cybersecurity attacks are expected to remain high for the foreseeable future due to the rapidly evolving nature and sophistication of these threats and also due to the expanding use of technology-based products and services by us and our customers. There can be no assurance that we will not suffer losses related to a security breach in the future, and any such losses may be material.
The continued occurrence of high-profile data breaches provides evidence of the serious threats faced by financial institutions globally with respect to information security. Our customers and employees, and those of our tax preparation and loan marketing partners, expect that we and our partners will adequately protect their personal information, and the regulatory environment surrounding information security and privacy is increasingly demanding. Improper access to or use of our or the tax preparation partners' or loan marketing partners' systems or databases could result in the theft, publication, deletion or modification of confidential customer and other information, any of which could have a material adverse effect on us and our operations. In addition, a data security breach at the tax preparation or loan marketing partners could result in significant reputational harm to us and cause the use and acceptance of our tax-related products and loan marketing-related products and services to decline, either of which could have an adverse impact on our operating revenues and future growth prospects.
In March 2015, federal regulators issued two related statements regarding cybersecurity. One statement indicates that financial institutions should design multiple layers of security controls to establish lines of defense and to ensure that their risk management processes also address the risk posed by compromised customer credentials, including security measures to reliably authenticate customers accessing internet-based services of the financial institution. The other statement indicates that a financial institution’s management is expected to maintain sufficient business continuity planning processes to ensure the rapid recovery, resumption, and maintenance of the institution’s operations after a cyber-attack involving destructive malware. A financial institution is also expected to develop appropriate processes to enable recovery of data and business operations and address rebuilding network capabilities and restoring data if the institution or its critical service providers fall victim to this type of cyber-attack. If the Bank or its divisions fail to observe this regulatory guidance, the Bank could be subject to various regulatory sanctions, including financial penalties.
63
Acquisitions could disrupt our business and may not be successful.
As part of our general growth strategy, we have expanded our business in part through acquisitions. Since December 2014, we have completed the acquisition of substantially all of the commercial loan portfolio and related assets of AFS/IBEX Financial Services, Inc., and completed the acquisition of the assets of Fort Knox Financial Services Corporation and its subsidiary, Tax Products Services LLC, in September 2015. In addition, we completed the acquisition of substantially all the assets and certain liabilities of EPS Financial in November 2016 and completed the acquisition of substantially all of the assets and specified liabilities of SCS in December 2016. More recently, as discussed above, we completed the Crestmark Acquisition on August 1, 2018.
In addition to the transactions noted above, we may engage in additional acquisitions in the future that we believe provide a strategic or geographic fit with our business. We cannot predict if or when we may enter into any such acquisition, or the nature or terms of any such acquisition. To the extent that we grow through acquisitions, we cannot assure that we will be able to adequately and profitably manage this growth or that such acquired businesses will be integrated into our existing businesses as efficiently or in a timely manner as we may anticipate. Acquiring other businesses will generally involve risks commonly associated with acquisitions, including:
|
•
|
increased capital needs;
|
|
•
|
increased and new regulatory and compliance requirements;
|
|
•
|
implementation or remediation of controls, procedures and policies with respect to the acquired business;
|
|
•
|
diversion of management time and focus from operation of our then-existing business to acquisition-integration challenges;
|
|
•
|
coordination of product, sales, marketing and program and systems management functions;
|
|
•
|
transition of the acquired business’s users and customers onto our systems;
|
|
•
|
retention of employees from the acquired business;
|
|
•
|
integration of employees from the acquired business into our organization;
|
|
•
|
integration of the acquired business’s accounting, information management, human resources and other administrative systems and operations with ours;
|
|
•
|
potential liability for activities of the acquired business prior to the acquisition, including violations of law, commercial disputes and tax and other known and unknown liabilities;
|
|
•
|
potential increased litigation or other claims in connection with the acquired business, including claims brought by regulators, terminated employees, customers, former stockholders, vendors, or other third parties; and
|
|
•
|
potential goodwill impairment.
|
64
If we are unable to successfully integrate an acquired business or technology, or otherwise address these difficulties and challenges or other problems encountered in connection with an acquisition, we might not realize the anticipated benefits of that acquisition, we might incur unanticipated liabilities or we might otherwise suffer harm to our business generally, which could have a material adverse effect on our business, prospects, financial condition and results of operations. Unanticipated costs, delays, regulatory review and examination, or other operational or financial problems related to integrating the acquired business with our company may result in the diversion of our management's attention from other business issues and opportunities. To integrate acquired businesses, we must implement our technology and compliance systems in the acquired operations and integrate and manage the personnel of the acquired operations. We also must effectively integrate the different cultures of acquired business organizations into our own in a way that aligns various interests and may need to enter new markets in which we have no or limited experience and where competitors in such markets have stronger market positions. Failures or difficulties in integrating the operations of the businesses that we acquire, including their personnel, technology, compliance programs, financial systems, distribution and general business operations and procedures, marketing, promotion and other relationships, may affect our ability to grow and may result in us incurring asset impairment or restructuring charges. Furthermore, acquisitions and investments are often speculative in nature and the actual benefits we derive from them could be lower or take longer to materialize than we expect.
To the extent we pay the consideration for any future acquisitions or investments in cash, any such payment would reduce the amount of cash available to us for other business purposes. Future acquisitions or investments could also result in dilutive issuances of our equity securities or the incurrence of debt, contingent liabilities, amortization expenses, or impairment charges against goodwill on our balance sheet, any of which could harm our financial condition and negatively impact our stockholders.
For more information regarding risks related to the Crestmark Acquisition, see “Risks Related to the Bank’s Divisions.”
An impairment charge of goodwill or other intangibles could have a material adverse impact on our financial condition and results of operations.
Because we have recently experienced significant growth, in part through acquisitions, goodwill and intangible assets are included within our consolidated assets. Our goodwill and intangible assets were
$374.0 million
as of
September 30, 2018
. Under accounting principles generally accepted in the United States, or GAAP, we are required to test the carrying value of goodwill and intangible assets at least annually or sooner if events occur that indicate impairment could exist. These events or circumstances could include a significant change in the business climate, including sustained decline in a reporting unit’s fair value, legal and regulatory factors, operating performance indicators, competition and other factors. GAAP requires us to assign and then test goodwill at the reporting unit level. If over a sustained period of time we experience a decrease in our stock price and market capitalization, which may serve as an estimate of the fair value of our reporting unit, this may be an indication of impairment. If the fair value of our reporting unit is less than its net book value, we may be required to record goodwill impairment charges in the future. In addition, if the revenue and cash flows generated from any of our other intangible assets is not sufficient to support its net book value, we may be required to record an impairment charge. For example, in the fiscal 2017 fourth quarter, we recognized a $10.2 million intangible impairment charge related to the non-renewal of the H&R Block relationship. The amount of any impairment charge could be significant and could have a material adverse impact on our financial condition and results of operations for the period in which the charge is taken.
65
New lines of business or new products and services may subject us to additional risks.
From time to time, we may implement new lines of business or offer new financial products or services within existing lines of business. Substantial risks and uncertainties are associated with developing and marketing new lines of business or new products or services, particularly in instances where the markets are not fully developed, and we may be required to invest significant time and management and capital resources in connection with such new lines of business or new products or services. Initial timetables for the introduction and development of new lines of business or new products or services may not be achieved. In addition, price and profitability targets for new lines of business or new products or services may not prove feasible, as we, the Bank or any of the Bank's divisions may need to price products and services on less advantageous terms than anticipated to retain or attract clients. External factors, such as regulatory reception, compliance with regulations and guidance, competitive alternatives, and shifting market preferences, may also impact the successful implementation of a new line of business or a new product or service. Furthermore, any new line of business or new product or service may be expensive to implement and could also have a significant impact on the effectiveness of our system of internal controls. Failure to successfully manage these risks in the development and implementation of new lines of business or new products or services could reduce our revenues and potentially generate losses.
The Bank owns or is seeking a number of patents, trademarks and other forms of intellectual property with respect to the operation of its business and the protection of such intellectual property may in the future require material expenditures.
Our divisions, through the Bank, seek protection for various forms of intellectual property from time to time. No assurance can be given that such protection will be granted. In addition, given the competitive market environment of its business, the Bank must be vigilant in ensuring that its patents and other intellectual property are protected and not exploited by unlicensed third parties.
The Bank must also protect itself and defend against intellectual property challenges initiated by third parties making various claims against it. With respect to these claims, regardless of whether we are pursuing our claims against perceived infringers or defending our intellectual property from third parties asserting various claims of infringement, it is possible that significant personnel time and monetary resources could be used to pursue or defend such claims.
Intellectual property risks extend to foreign countries whose protections of such property are not as extensive as those in the United States. As such, the Bank may need to spend additional sums to ensure that its intellectual property protections are maximized globally. Moreover, should there be a material, improper use of the Bank’s intellectual property, this could have an adverse impact on our divisions' operations and the Bank.
The OCC’s new “fintech” charter could present a market risk to the Company generally and the MPS division specifically.
The OCC announced on July 31, 2018 that it would begin to accept and evaluate charters for entities that wanted to conduct certain components of a banking business pursuant to a federal charter, known as a “special purpose national bank” (“SPNB”) charter. Intended to promote economic opportunity and spur financial innovation, SPNBs may engage in any of the following activities: paying checks, lending money or taking deposits. In order to obtain an SPNB charter, applicants will have to consider capital, liquidity, and financial inclusion in their application materials. Initially, these entities will be subject to heightened OCC supervision. The Superintendent of the State of New York’s Department of Financial Services has filed suit against the OCC in connection with the availability of such charter option, alleging, among other points, that SPNBs are unconstitutional and will harm consumers. The Conference of State Bank Supervisors has also filed a similar suit against the OCC.
As of the date of this filing, the OCC has not announced approval of any applications for an SPNB charter, although it has publicly stated that applications have been filed. If any such applications are granted, recipients of an SPNB charter may enter the U.S. payments market in which the Bank operates, which could have a material adverse effect on the Bank and the Payments division.
66
Existing insurance policies may not adequately protect the Company and its subsidiaries.
Fidelity, business interruption, cybersecurity, and property insurance policies are in place with respect to the operations of the Company. Should any event triggering such policies occur, however, it is possible that our policies would not fully reimburse us for the losses we could sustain due to deductible limits, policy limits, coverage limits, or other factors. We generally renew our insurance policies on an annual basis. If the cost of coverage becomes too high, we may need to reduce our policy limits, increase the deductibles or agree to certain exclusions from our coverage in order to reduce the premiums to an acceptable amount.
The loss of key members of our senior management team or key employees in the Bank's divisions, or our inability to attract and retain qualified personnel, could adversely affect our business.
We believe that our success depends largely on the efforts and abilities of our senior executive management team. Their experience and industry contacts significantly benefit us. Our future success also depends in large part on our ability to attract, retain and motivate key management and operating personnel. On October 30, 2018, we announced that J. Tyler Haahr had stepped down as Chief Executive Officer and that Brad Hanson, President of the Company and the Bank, would assume the additional role of Chief Executive Officer. This, and any other management transition in the future, may create uncertainty and involve a diversion of resources and management attention, be disruptive to our daily operations or impact public or market perception, any of which could negatively impact our ability to operate effectively or execute our strategies and result in a material adverse impact on our business, financial condition, results of operations or cash flows.
Additionally, as we continue to develop and expand our operations, we may require personnel with different skills and experiences, with a sound understanding of our business and the industries in which we operate. The competition for qualified personnel in the financial services industry is intense, and the loss of any of our key personnel or an inability to continue to attract, retain, and motivate key personnel could adversely affect our business.
If we foreclose on and take ownership of real estate collateral property, we may be subject to the increased costs associated with the ownership of real property, resulting in reduced revenues.
We may have to foreclose on collateral property to protect our investment and may thereafter own and operate such property. In such case, we would be exposed to the risks inherent in the ownership of real estate. The amount that we, as a mortgagee, may realize after a default is dependent upon factors outside of our control, including, but not limited to: (i) general or local economic conditions; (ii) neighborhood values; (iii) interest rates; (iv) real estate tax rates; (v) operating expenses of the mortgaged properties; (vi) supply of and demand for rental units or properties; (vii) ability to obtain and maintain adequate occupancy of the properties; (viii) zoning laws; (ix) governmental rules, regulations and fiscal policies; and (x) acts of God.
Additionally, hazardous substances may be discovered on such foreclosed real estate. In this event, we could be required to remove the substances from and remediate the properties at our own cost and expense. The cost of removal and environmental remediation could be substantial. We may not have adequate remedies against the owners of the properties or other responsible parties and could find it difficult or impossible to sell the affected properties.
Expenditures associated with the ownership of real estate, principally real estate taxes and maintenance costs, may have a material adverse effect on our business, financial condition and operating results. Therefore, the cost of operating a real property may exceed the rental income earned from such property, if any, and we may have to advance funds in order to protect our investment or may be required to dispose of the real property at a loss. The foregoing expenditures and costs could adversely affect our ability to generate revenues, resulting in reduced levels of profitability.
Our agricultural loans are subject to factors beyond the Company’s control.
The agricultural industry is subject to commodity price fluctuations. Extended periods of low commodity prices, higher input costs or poor weather conditions could result in reduced profit margins, reducing demand for goods and services provided by agriculture-related businesses, which, in turn, could affect other businesses in our market area. Any combination of these factors could produce losses within our agricultural loan portfolios.
67
Our framework for managing risks may not be effective in mitigating risk and loss to us.
We have established processes and procedures intended to identify, measure, monitor, report, and analyze the types of risk to which we are subject, including liquidity risk, credit risk, market risk, interest rate risk, operational risk, legal and compliance risk, and reputational risk, among others. However, as with any risk management framework, there are inherent limitations to our risk management strategies, as there may exist, or develop in the future, risks that we have not appropriately anticipated or identified. Further, risk mitigation techniques and the judgments that accompany their application cannot anticipate every economic and financial outcome or the specific circumstances and timing of such outcomes, which may result in the Bank or any of its divisions incurring losses.
For example, the 2008 financial and credit crisis and resulting regulatory reform highlighted both the importance, and limitations of managing unanticipated risks. If our risk management framework proves ineffective, we could suffer unexpected losses which could have a material adverse effect on our financial condition and results of operations
.
Changes in accounting policies or accounting standards, or changes in how accounting standards are interpreted or applied, could materially affect how we report our financial results and condition.
Our accounting policies are fundamental to determining and understanding our financial results and condition. Some of these policies require use of estimates and assumptions that may affect the value of our assets or liabilities and financial results. Any changes in our accounting policies could materially affect our financial statements. From time to time, the Financial Accounting Standards Board (the “FASB”) and the SEC change the financial accounting and reporting standards that govern the preparation of our financial statements. In addition, those that set accounting standards and those that interpret the accounting standards (such as the FASB, the SEC, banking regulators, and our outside auditors) may change or even reverse their previous interpretations or positions on how these standards should be applied. Changes in financial accounting and reporting standards and changes in current interpretations may be beyond our control, can be difficult to predict, and could materially affect how we report our financial results and condition. We may be required to apply a new or revised standard retroactively or apply an existing standard differently and retroactively, which may result in us being required to restate prior period financial statements, which restatements may reflect material changes. For example, the FASB issued a rule in 2016 requiring companies to estimate current expected credit losses. The rule, which is a major change for banking organizations, becomes effective for the Company on October 1, 2020. The new standard is likely to result in more timely recognition of credit losses than under the previous incurred loss model, and we are evaluating the extent to which the new rule will affect our results of operations.
Catastrophic events could occur and impact our operations or the operations of our vendors or other third parties with which we do business.
Catastrophic events (including those that are weather related, as well as those that are geopolitical related) could have an adverse impact on the Bank’s ability and the ability of our vendors and other third parties with which we do business, to provide necessary services to support the operation of the Bank and provide products and services to the Bank’s customers. These events, which are beyond our control, could be short-term in nature or longer term, lasting for significant periods of time. Although insurance coverage may provide some protection in light of such events, it cannot be determined whether insurance proceeds would adequately compensate the Bank for the losses it incurred as a result of such events. See also “--Existing insurance policies may not adequately protect the Company and its subsidiaries.” Moreover, the damage caused by such events may not be directly compensable from insurance proceeds or otherwise, such as damage to our reputation as a result of such events.
68
Risks Related to the Bank's Divisions
The Bureau's Prepaid Accounts Rule impacts the Bank’s offering of prepaid cards.
As described above, the Bureau issued a final rule on October 5, 2016, which supplemented the existing regulatory framework pursuant to which prepaid products (both cards and other delivery methods, including codes) are offered and serviced. The Prepaid Accounts Rule brought prepaid products fully within Regulation E, which implements the federal Electronic Funds Transfer Act, and, for prepaid products that have a “credit” component, within Regulation Z, which implements the federal Truth in Lending Act. The Prepaid Accounts Rule created tailored provisions which (i) created a definition for a “prepaid account” in Regulation E, (ii) required certain disclosures to consumers before such consumer acquires a prepaid card account, (iii) extended Regulation E’s limited liability and error resolution provisions to certain registered prepaid accounts, (iv) regulated the provision of billing statements, and (v) extended Regulation Z’s credit card rules and disclosure requirements to prepaid accounts that provide overdraft services and other credit features (the Bank currently issues a card with an overdraft feature that is marketed by a third party program manager.) The Prepaid Accounts Rule also requires account issuers to post their publicly offered prepaid card program agreements on their own websites and make them available to consumers upon request and to provide copies of all publicly offered prepaid card program agreements to the Bureau. The Prepaid Accounts Rule became effective on October 1, 2017, although the general effective date for compliance has been extended by the Bureau to April 1, 2019. Compliance with the Prepaid Accounts Rule has resulted in additional costs which we expect to continue to grow.
Prepaid card issuers like the Bank are subject to heightened regulatory scrutiny based on AML and Bank Secrecy Act concerns.
There is a concern within the bank regulatory environment over the use of credit and, in particular, prepaid cards as a means by which to illegally launder and move money. The U.S. Treasury’s Financial Crimes Enforcement Network issued rules related to providers of “prepaid access” which have left certain issues unresolved related to its regulatory requirements. It is likely that any changes to the regulatory environment related to the offering of prepaid cards will increase the Bank’s compliance and operational costs. Although the Bank will continue to work with its regulators to provide information about its operations as well as the state of the prepaid card industry, we believe such concerns in general will continue for the foreseeable future for the entire banking industry, with a continued emphasis on heightened compliance expectations, resulting in higher compliance costs. See Part I, Item 1“Business Regulation - Bank Supervision and Regulation.”
Our tax refund-related business is concentrated in a limited number of partners, and our success will depend upon the
maintenance of those agreements.
If any of our relationships with the companies through which we offer tax refund-related products to consumers and commercial entities were to significantly decrease, such a decrease would likely have a significant adverse impact on our financial condition. For example, the Bank’s agreement with Jackson Hewitt Tax Service extends through the 2020 tax season, but the loss of this relationship prior to such time for a contractual or other reason would have a materially adverse impact on the Bank’s results of operation.
69
Tax advance loans represent a significant credit risk, and if we are unable to collect a significant portion of the tax refund advances, it would materially negatively impact earnings.
There is a credit risk associated with a tax refund advance because the funds are disbursed to the customer prior to the Company receiving the customer’s refund from the Internal Revenue Service (the “IRS”). Because there is no recourse to the customer if the tax refund advance is not paid in full with the proceeds of the customer’s tax refund, we may not collect all of our payments related to the tax refund advances from the IRS and state revenue departments. Losses will generally occur on tax refund advances when we do not receive payment from the IRS or state revenue department due to a number of reasons, such as IRS revenue protection strategies including audits of returns, errors in the tax return, tax return fraud, and tax debts not previously disclosed to us during our underwriting process. Although our underwriting takes these factors into consideration during the tax refund advance approval process, if the IRS significantly alters its revenue protection strategies for a given tax season, or we are incorrect in our underwriting assumptions, we could experience higher loan loss provisions above those projected. In addition, a consumer could exercise its rights and withdraw its ACH authorization provided in connection with a tax refund advance, meaning the Bank could no longer collect the payments related to the tax refund advances via a direct debit to the customer’s designated bank account, which could result in additional losses. For the tax season refund advance activity incurred in fiscal 2018, the Bank recorded
$21.3 million
in net charge-offs related to tax refund advances through September 30, 2018.
Our network of tax preparation partners is extensive, but it may be difficult to manage and retain such marketing partners because of competitive market forces.
As of the date of this filing, the Bank has a network of over 10,000 active EROs that utilize the Bank’s services, and it is expected that this number will increase for the 2018 tax season. Although each ERO undergoes an analysis of its operations prior to marketing the Bank’s products, it is possible that certain EROs will facilitate or engage in tax-related malfeasance or offer the Bank's products and services in a manner that does not comply with law or contractual representations, warranties, and covenants. In addition, it is possible that EROs may choose to offer the tax-related products of other companies that provide products and services similar to the Bank’s for pricing or other competitive reasons. Any of these events, were they to occur in the future, could result in material adverse consequences to us.
Agency, technological, or human error could lead to tax refund processing delays, which could adversely affect our reputation and operating revenues.
We and our tax preparation partners rely on the IRS, technology, and employees when processing and preparing tax refunds and tax-related products and services. Any delays during the processing or preparation period could result in reputational damage to us or to our tax preparation partners, which could reduce the use and acceptance of our cards and tax-related products and services, either of which could have a significant adverse impact on our operating revenues and future growth prospects. An IRS delay in processing tax returns in any given tax season could result in a smaller percentage of expected revenues flowing into our third fiscal quarter following such tax season.
Changes in laws and regulations, or our failure to comply with existing laws and regulations, applicable to our tax refund-related services could have a material adverse effect on our business, prospects, results of operations and financial condition.
We derive a significant portion of our total operating revenues and earnings from tax refund processing and settlement services. The tax preparation industry is highly regulated under a variety of statutes and regulations, all of which are subject to change, which may impose significant costs, limitations or prohibitions on the way we conduct or expand our tax refund processing and related services. Any new requirements or rules, changes in such requirements or rules, new interpretations of existing requirements or rules, failure to follow requirements or rules, or future lawsuits or rulings could increase our compliance and other costs of doing business, require significant systems redevelopment, render our products or services less profitable or obsolete or otherwise have a material adverse effect on our business, prospects, results of operations, and financial condition. In addition, changes in the U.S. tax laws as a result of pending tax legislation in the U.S. Congress or otherwise may adversely impact our tax refund processing and settlement business, and such damage could reduce customer demand for our strategic partner’s refund advance products, thereby reducing the volume of refund advance loans that we may offer.
70
Fraud and other illegal activity involving our tax preparation partners or products could lead to a regulatory investigation and reputational damage to us, reduce the use and acceptance of our cards and reload network, reduce the use of our services, and could adversely affect our financial position and results of operations.
Criminals are using increasingly sophisticated methods to engage in illegal activities involving prepaid cards, reload products, and tax refunds. Illegal activities involving such products and services include malicious social engineering schemes, where people are asked to provide a prepaid card or reload product in order to obtain a loan or purchase goods or services. Illegal activities may also include fraudulent payment or refund schemes and identity theft. We rely upon third party tax preparers for tax preparation and other services, which subjects us to risks related to the vulnerabilities of those third parties. Even a single significant instance of fraud could result in reputational damage to us, which could reduce the use and acceptance of our cards and other products and services, cause retail distributors or their customers to cease doing business with us or them, or could lead to greater regulation that would increase our compliance costs. Fraudulent activity could also result in the imposition of regulatory sanctions, including significant monetary fines, which could adversely affect our business, operating results and financial condition.
The Bureau's final rule related to certain small dollar loans will impact certain processes used by the Bank and could materially impact the Bank’s ability to grow certain aspects of the Payments division.
On October 5, 2017, the Bureau issued its final rule related to certain small dollar loans. Affecting primarily shorter term (e.g., 45 days or less) loans with an Annual Percentage Rate of 36% or more, the rule generally requires a provider of such loans to determine the consumer borrower’s ability to repay; an alternative to the ability-to-repay determination is provided for loans that do not exceed $500 and meet certain other requirements.
In addition to these restrictions, the Bureau also imposes certain requirements related to the collection of longer-term loans with an Annual Percentage Rate of 36% or more; specifically, the final rule requires that, where the creditor (like the Bank) has access to the consumer’s bank account for repayment of the loan proceeds, the creditor must provide certain notices to the consumer about upcoming payments and transactions via model forms the Bureau also published. In addition, a creditor is prohibited from attempting to withdraw payment from a consumer’s bank account where such repayment has been declined for two consecutive payment attempts. At such time, the creditor is required to get a new, specific authorization from the consumer to debit the bank account. Implementation of these requirements for these types of products may negatively impact products and services that we could offer either directly or in connection with a third-party loan marketer.
This rule is scheduled to become effective in August 2019, although the Bureau stated that it will publish proposed revisions to the “ability to repay” components of the rule in January 2019. In response to this, in early November 2018, a U.S. federal judge in Texas stayed compliance with the regulation until such time as he determines to lift the stay, which likely will not be before March 2019 when the parties provide further reports to the judge. As such, as of the date of this Annual Report on Form 10-K, the impact of this regulation on the Bank and the parties with which it markets loans that would otherwise be subject to the final rule’s requirements as originally published cannot be determined.
Premium financing activity may result in increased exposure to credit risk and fraud.
We acquired the premium finance loan portfolio and related assets of AFS/IBEX Financial Services, Inc. in December 2014 and continue, through that platform, to serve businesses and insurance agencies nationwide with commercial insurance premium financing products. We rely on insurance agents and brokers to produce these commercial loans, which are made to borrowers who borrow funds to pay premiums on property and casualty insurance policies. Typically, the financing arrangement with the borrower provides for periodic payments to the lender to secure the insurance policy with an insurer, and the lender is entitled to any unearned premium due from the insurer in the event of policy cancellation, with any excess returned to the insured/borrower after the loan has been paid off. The financing arrangement typically includes a limited power of attorney to permit the lender to cancel the insurance policy in the event of default. Typically, premium finance loans are designed to amortize faster than the unearned premium that has been paid, either as a down payment, or periodically is earned, so that the value of the unearned premium exceeds the outstanding financed amount, providing collateral to the lender. If the borrower fails to pay on the premium finance loan, then the financed insurance policy must be cancelled to avoid losses with respect to unearned premiums. We must consider both the creditworthiness of the borrower as well as the creditworthiness of the insurer (for the ability to return the unearned premium). There is also an operational risk of assuring that the insurance policy is cancelled on a timely basis to prevent unearned premium from dissipating once the policy can be cancelled. Further, since we are not involved in the marketing of the loans, we are therefore exposed to the risk of fraud by third-party marketers.
71
Costs of conforming products and services to the Payment Card Industry Data Security Standards (the “PCI DSS”) are costly and could continue to affect the operations of MPS.
The PCI DSS is a multifaceted standard that includes data security management, policies and procedures as well as other protective measures, that was created by the largest credit card associations in the world in an effort to protect the nonpublic personal information of all types of cardholders, including prepaid cardholders and holders of network branded credit cards (such as Discover, MasterCard and Visa). The PCI DSS mandates a prescribed technical foundation for the collection, storage and transmission of cardholder data and also contains significant provisions regarding the testing of security protections by various entities in the payment card industry, including MPS. Compliance with the PCI DSS is costly and changes to the standards could have an equal, or greater, effect on profitability of the relevant business division.
The potential for fraud in the card payment industry is significant.
Issuers of prepaid and credit cards have suffered significant losses in recent years with respect to the theft of cardholder data that has been illegally exploited for personal gain. The theft of such information is regularly reported and affects not only individuals but businesses as well. Many types of credit card fraud exist, including the counterfeiting of cards and “skimming” (whereby a skimmer reads a debit card's encoded mag stripe and a camera records the PIN that is entered by a customer). It is estimated that global losses from ATM skimming alone are over $2.0 billion annually. Losses from fraud have been substantial for certain card industry participants. Such fraudulent activity could adversely impact us in the future, notwithstanding our recent introduction of EMV (i.e., chip-enabled) cards and the broader acceptance of such cards in the U.S. and international markets.
Additionally, new frauds, including those perpetrated by Wi-Fi scanners and the cracking of encryption software, are also being perpetrated against global banks and their customers. The Bank continues to monitor these developments and has a program in place to monitor for debit and credit card fraud. Even with such policies and procedures in place and although fraud has not had a material impact on the profitability of the Bank, there can be no assurance that the Bank, its customers or the ATM networks or card payment industry in which it participates will not be the victims of a fraud.
The threat of fraud in the industry also includes the possibility that there is collusion between certain participants in the card system to act illegally. Although MPS is not aware of any instances to date, it is possible that such activities could occur in the future, thereby adversely impacting our operations and profitability.
Competition in the card industry is significant. In order to maintain an edge to its products and offerings, MPS must invest significantly in technology and research and development.
The heavy emphasis upon technology in the products and services offered by MPS requires significant expenditures with respect to research and development, both to exploit technological gains and to develop new products and services to meet customers’ needs. While some efforts may yield substantial benefits for the division, others will not, thereby resulting in expenditures for which profits will not be realized. MPS is not able to predict with any degree of certainty the level of research and development that will be required in the future, how much those efforts will cost, or how profitable such developments will be for the division if and when undertaken.
Our business could suffer if there is a decline in the use of prepaid cards or there are adverse developments with respect to the prepaid financial services industry in general.
As the prepaid financial services industry evolves, consumers may find prepaid financial services to be less attractive than other financial services. Consumers might not use prepaid financial services for any number of reasons. For example, negative publicity surrounding the Company or other prepaid financial service providers could impact MPS’s business and prospects for growth to the extent it adversely impacts the perception of prepaid financial services. If consumers do not continue or increase their usage of prepaid cards, MPS’s operating revenues may remain at current levels or decline. Growth of prepaid financial services as an electronic payment mechanism may not occur or may occur more slowly than estimated. If there is a shift in the mix of payment forms used by consumers (
i.e.
, cash, credit cards, traditional debit cards and prepaid cards) away from products and services offered by MPS, such a shift could have a material adverse effect on our financial condition and results of operations.
72
Discover, MasterCard and Visa, as well as other electronic funds networks in which MPS operates, could change their rules.
Pursuant to the agreements between MPS and Discover, MasterCard, Visa and other card networks, these third parties typically retain the right to prescribe certain business practices and procedures with respect to parties such as MPS. Such prescribed terms include, but are not limited to, a contracting party’s level of capital as well as other business requirements.
Discover, MasterCard and Visa also retain the right in their agreements with industry participants such as MPS to unilaterally change the rules under which such transactions are processed with little or no advance warning. This power includes the power to prevent MPS from accessing their networks in order to process transactions as well as the power to revise, replace or alter existing card interchange rates and rules. Should any third party choose to invoke this right unilaterally, such changes could materially impact the operations of MPS and, if MPS is unable to comply with such rules, such third-party card networks could terminate their relationships with MPS.
Our business is generally heavily dependent upon the Internet, and any negative disruptions to its operation could negatively impact our business, including MPS in particular.
Much of our business, especially at the divisional level, depends upon transactions being processed through the Internet. Like nearly all other commercial enterprises, we rely upon others to provide the Internet so that commerce can be conducted. Were there to be a failure in the operation of the Internet or a significant impairment in our ability to move information on the Internet or our ability to do so in accordance with customer safeguard protocols, we would need to develop alternative processes during which time revenues and profitability may be lower, and there can be no assurance that we could develop or find such an alternative on terms acceptable to us or at all.
Our ability to process transactions requires functioning communication and electricity lines.
The nature of the banking industry in general, and the credit card and debit card industry in particular, is that it must be operational every day of the week and every hour of the day. Any disruption in the utilities utilized by the Bank or its divisions could have a negative effect on our operations, result in negative publicity, and have a material adverse effect on our financial condition and results of operations.
Data encryption technology has not been perfected and vigilance in MPS’ information technology systems is costly.
The Bank and its divisions hold sensitive business and personal information with respect to the products and services they offer. This information, which is generally digitally encrypted, is passed along various technology channels, including the Internet. Although we encrypt customer and other sensitive information and expend significant financial and personnel resources to maintain the integrity of our technology networks and the confidentiality of nonpublic customer information, because such information may travel on public technology and other non-secure channels, the confidential information is potentially susceptible to hacking and other illegal intrusions. Were such a security breach to occur, the provision of products and services to our customers would be impaired. In addition, were a breach to occur, we could incur significant fines from the electronic funds associations involved, or from federal and/or state regulators and could be subject to other prohibitions, as well as extensive litigation from commercial parties and consumers affected by such breach. Such actions would have a material adverse effect on our financial condition and results of operations.
Unclaimed funds represented by unused value on the cards presents compliance and other risks.
The concept of escheatment involves the reporting and delivery of property to states that is abandoned when its rightful owner cannot be readily located and/or identified. In the context of prepaid cards, the funds in connection with such cards can sometimes be “abandoned” or unused for the relevant period of time set forth in each applicable state’s abandoned property laws. MPS utilizes automated programs to ensure its operations are compliant with such applicable laws and regulations. There appears, however, to be a movement among some state regulators to more broadly interpret definitions in escheatment statutes and regulations than in the past. State regulators may choose to initiate collection or other litigation action against prepaid card issuers, like MPS, for unreported abandoned property, and such actions may seek to assess fines and penalties.
73
MPS's revenue is concentrated.
MPS works with a large number of business partners to derive its revenue. The Company believes four of its partners have reached a size that, should these partners’ business with the Company end or there is a significant decrease in revenues associated with any of these business relationships, the earnings attributable to them would have a material effect on the financial results of the Company.
The composition of Crestmark’s customer base presents unique market risks and opportunities.
The Crestmark division specializes in providing business-to-business working capital solutions, equipment leasing, and asset-based lending services to small- and medium-sized businesses that are outside the scope of what traditional banks typically offer. These services include customizable business lines of credit, machinery and equipment financing, term loans, working capital acquisition funding and expansion financing, discount factoring, and traditional factoring. Prior to the Crestmark Acquisition, Crestmark typically provided these services to customers who were not “bankable” under traditional lending standards, and the loans it made were based in large part on the value of and control over the borrower’s collateral. The Bank continues to refine the underwriting and credit assessments of the Crestmark’s divisions customers in connection with the loans and financing opportunities the division is creating for the Bank. Additionally, due to the smaller size of the Crestmark division’s commercial customers, such customers are more likely than larger commercial businesses to be strained by regional or national economic downturns. Stressed economic conditions may reduce the ability of the Crestmark division’s commercial borrowers to make loan and lease payments or cause the value of the Bank’s collateral to decline. The effect of a downturn in general economic conditions may be more significant for the Crestmark division’s business than for the Bank as a whole due to the specialized nature of its financial products and collateral.
Moreover, given the relatively smaller nature of the Crestmark division’s customers, it is difficult to verify the accuracy and reliability of customer financial and other underwriting materials. If materials provided to the Crestmark division by commercial credit applicants are materially inaccurate or false, or if the third-party resources the Crestmark division uses to underwrite credit applicants do not identify risks presented by such potential customer relationships, the Bank could suffer significant material consequences in connection with the performance of its commercial loan portfolio, its earnings, and its reputation and may need to dedicate resources to ensure the division’s ability to identify such fraud in the future.
Crestmark’s business presents a heightened degree of operational and credit risks to the Bank.
Crestmark’s focus on asset-based loans and other forms of commercial financing subjects Crestmark, and therefore the Bank, to the potential for fraud by borrowers regarding the value of underlying collateral. As a result, the Bank may assume different or greater lending risks than other commercial lenders in connection with the commercial products and services offered through the Crestmark division. Even routine funding transactions expose the Bank to credit risk in the event of default of its counterparty or client. In addition, credit risk related to products and services offered by the Crestmark division may be exacerbated when the collateral held by the Bank cannot be realized upon or is liquidated at prices insufficient to recover the full amount due under the financial instrument.
Future success of the Crestmark division is dependent on its ability to compete effectively in the highly competitive commercial finance industry.
The Crestmark division faces substantial competition in all phases of its operations from a variety of different competitors, and its future growth and success depends on its ability to compete effectively in this highly competitive environment. The Crestmark division competes for loans, leases, and other financial services with numerous national and regional banks, thrifts, credit unions, and other financial institutions, as well as other entities that provide financial services, including specialty lenders, securities firms, and mutual funds. Certain larger commercial financing companies do not currently focus their marketing efforts on smaller commercial companies; however, any shift in focus by such larger financing companies may further fragment existing market share in this commercial finance industry. Moreover, some of the financial institutions and financial service organizations with which the Crestmark division competes are not subject to the same degree of regulation as the Crestmark division and the Bank. Many of the Crestmark division’s competitors have been in business for many years, have established customer bases, are larger, offer larger branch networks than the Bank does, and may offer other services that neither the Crestmark division nor the Bank do. This competition may limit the Crestmark division’s growth or earnings.
74
The Crestmark division generates government-backed loans funded by the Bank, any of which could be negatively impacted by a variety of factors.
Prior to its acquisition, the Crestmark division originated loans backed by numerous state and federal government agencies. Risks inherent in the Bank’s participation in such programs, through its Crestmark division, include: (i) some of these programs guarantee only a portion of the commercial loan made by the Bank; as such, if the borrower defaults and losses exceed those guaranteed by the government agency, the Bank could realize significant losses; (ii) certain programs, including some guaranteed by the United States Department of Agriculture, limit the geographic scope of such loans; as such, if the Crestmark division is not able to market these loans to potential borrowers, the Bank’s share in this market may be negatively impacted; (iii) the intended beneficiaries of such loan programs may experience a contraction in their credit quality due to local, national, or global economic events or because of factors specific to their business, including, for example, businesses dependent upon the farming and agriculture industry; as such, any negative impact to certain commercial business lines designed to benefit from such government-sponsored loan programs could constrict the Bank’s business in these areas; and (iv) nearly all of these guaranteed loan programs are subject to an appropriations process, either at the legislative or regulatory level; this means that funds that may be currently available to guarantee loans or portions of loans could be limited or eliminated in their entirety with little or no advance warning.
Through our Crestmark division, we engage in equipment leasing activities; the residual value of leased equipment at the time of its disposition may be less than forecasted at the time we entered into the lease.
The market value of any given piece of leased equipment could be less than its depreciated value at the time it is sold due to various factors, including factors beyond our control. The market value of used leased equipment depends on several factors, including:
|
•
|
the market price for new equipment that is similar;
|
|
•
|
the age and condition of the leased equipment at the time it is sold;
|
|
•
|
the supply of and demand for similar used equipment on the market;
|
|
•
|
technological advances relating to the leased equipment or similar equipment; and
|
|
•
|
economic conditions in the specific business or industry in which the equipment is used, as well as broader regional or national economic conditions.
|
We include in income from operations the difference between the sales price and the depreciated value of an item of leased equipment sold. Changes in our assumptions regarding depreciation could change our depreciation expense, as well as the gain or loss realized upon disposal of leased equipment. If we sell our used leased equipment at prices significantly below our projections or in lesser quantities than we anticipated at the time we entered into the lease, our results of operations and cash flows may be negatively impacted.
75
Risks Related to Marketing Program Agreements
Program agreements that the Bank has entered into, and expects to enter into from time to time in the future, with third parties to market and service consumer loans originated by the Bank may subject the Bank to claims from regulatory agencies and other third parties that, if successful, could negatively impact the Bank’s current and future business.
The Bank has entered into various agreements with unaffiliated third parties (“Marketers”), whereby the Marketers will market and service unsecured consumer loans underwritten and originated by the Bank. We expect the Bank to enter into additional similar program agreements with other third parties to market and service loans originated by the Bank, from time to time in the future. Certain types of these arrangements have been challenged both in the courts and in regulatory actions. In these actions, plaintiffs have generally argued that the “true lender” is the marketer and that the intent of such lending program is to evade state usury and loan licensing laws. Other cases have also included other claims, including racketeering and other state law claims, in their challenge of such programs. There can be no assurance that lawsuits or regulatory actions in connection with any such lending programs the Bank enters into will not be brought in the future. If a regulatory agency, consumer advocate group, or other third party were to bring an action against the Bank or any of the third parties with which the Bank operates such lending programs, and such actions were successful, such an outcome could have a material adverse effect on our financial condition and results of operation.
Agreements with Marketers, whereby the Bank will originate and hold unsecured consumer loans, may result in increased exposure to credit risk and fraud and may present certain additional risks.
Although the Bank has historically offered unsecured consumer loans to its customers through its brick-and-mortar branch network, the Bank’s entry into program agreements with other third parties to market and service loans originated by the Bank, such as its program agreement with Liberty Lending, LLC, represents a new area of the consumer credit market for the Bank, which presents potential increased credit, operational, and reputational risks. Because the loans originated under such programs are unsecured, in the event a borrower does not repay the loan in accordance with its terms or otherwise defaults on the loan, the Bank may not be able to recover from the borrower an amount sufficient to pay any remaining balance on the loan. See “--If our actual loan losses exceed our allowance for loan and lease losses, our net income will decrease.” We may also become subject to claims by regulatory agencies, customers, or other third parties due to the conduct of the third parties with which the Bank operates such lending programs if such conduct is deemed to not comply with applicable laws in connection with the marketing and servicing of loans originated pursuant to these programs.
Risks Related to Our Common Stock
The price of our common stock may be volatile, which may result in losses for investors.
The market price for shares of our common stock has been volatile in the past, and several factors could cause the price to fluctuate substantially in the future. These factors include:
|
•
|
announcements of developments related to our business;
|
|
•
|
the initiation, pendency or outcome of litigation, regulatory reviews, inquiries and investigations, and any related adverse publicity;
|
|
•
|
fluctuations in our results of operations;
|
|
•
|
sales of substantial amounts of our securities into the marketplace;
|
|
•
|
general conditions in the banking industry or the worldwide economy;
|
|
•
|
a shortfall in revenues or earnings compared to securities analysts’ expectations;
|
|
•
|
lack of an active trading market for the common stock;
|
|
•
|
changes in analysts’ recommendations or projections; and
|
76
|
•
|
announcement of new acquisitions or other projects.
|
The market price of our common stock may fluctuate significantly in the future, and these fluctuations may be unrelated to our performance. General market price declines or market volatility in the future could adversely affect the price of our common stock, and the current market price may not be indicative of future market prices.
An investment in our common stock is not an insured deposit.
Our common stock is not a bank deposit and, therefore, is not insured against loss by the FDIC, any other deposit insurance fund, or by any other public or private entity. Investment in our common stock is inherently subject to risks, including those described in this “Risk Factors” section, and is subject to forces that affect the financial markets in general. As a result, if you hold or acquire our common stock, it is possible that you may lose all or a portion of your investment.
Future sales or additional issuances of our capital stock may depress prices of shares of our common stock or otherwise dilute the book value of shares then outstanding.
Sales of a substantial amount of our capital stock in the public market or the issuance of a significant number of shares could adversely affect the market price for shares of our common stock. As of September 30, 2018, we were authorized to issue up to 90,000,000 shares of common stock, of which 39,167,280 shares were outstanding, and 24,783 shares were held as treasury stock. We were also authorized to issue up to 3,000,000 shares of preferred stock and 3,000,000 shares of non-voting common stock, none of which were outstanding or reserved for issuance. Future sales or additional issuances of stock may affect the market price for shares of our common stock.
Federal regulations and our organizational documents may inhibit a takeover or prevent a transaction you may favor or limit our growth opportunities, which could cause the market price of our common stock to decline.
Certain provisions of our charter documents and federal regulations could have the effect of making it more difficult for a third party to acquire, or of discouraging a third party from attempting to acquire, control of the Company. In addition, we may need to obtain approval from regulatory authorities before we can acquire control of any other company. Such approvals could involve significant expenses related to diligence, legal compliance, and the submission of required applications and could be conditioned on acts or practices that limit or otherwise constrain our operations.
We may not be able to pay dividends in the future in accordance with past practice.
We have historically paid a quarterly dividend to stockholders. The payment of dividends is subject to legal and regulatory restrictions. Any payment of dividends in the future will depend, in large part, on our earnings, capital requirements, financial condition, regulatory review, and other factors considered relevant by our Board of Directors.
Not applicable.
77
The Company's home office is located at 5501 South Broadband Lane in Sioux Falls, South Dakota. The Bank is a federally chartered savings bank which operates 10 full-service branch offices in four market areas: Storm Lake and Des Moines, Iowa; and Brookings and Sioux Falls, South Dakota; and 17 non-branch offices located in South Dakota, Texas, California, Kentucky, Pennsylvania, Florida, Louisiana, Tennessee, Michigan, and Canada. The non-branch offices are related to the following divisions of MetaBank: MPS, Refund Advantage, EPS, SCS, AFS/IBEX, and Crestmark. The MPS division offers prepaid cards, along with other payment industry products and services with operations in three offices in Sioux Falls, South Dakota. Refund Advantage and EPS offer tax payment industry products and services nationwide, with offices located in Louisville, Kentucky, and Easton, Pennsylvania. SCS provides consumer credit services through its propriety underwriting model with an office located in Hurst, Texas. The AFS/IBEX division provides nationwide commercial insurance premium financing for business and insurance agencies and has two agency offices, one in Dallas, Texas, and one in Newport Beach, California. The Crestmark division, which provides business-to-business commercial financing, is headquartered in Troy, Michigan, with loan production offices in Newport Beach, California; Boynton Beach, Florida; Pompano Beach, Florida; Baton Rouge, Louisiana; Franklin, Tennessee; and Toronto, Ontario, Canada.
Of the Company's 27 properties, the Company leases 19 of them, all on market terms. See Note 7 to the “Notes to Consolidated Financial Statements” which is included in Part II, Item 8 “Financial Statements and Supplementary Data” of this Annual Report on Form 10-K.
Though the Company has experienced rapid growth in each of its segments, management believes current facilities are adequate to meet its present needs.
The Bank was served on April 15, 2013, with a lawsuit captioned Inter National Bank v. NetSpend Corporation, MetaBank, BDO USA, LLP d/b/a BDO Seidman, Cause No. C-2084-12-I filed in the District Court of Hidalgo County, Texas. The Plaintiff’s Second Amended Original Petition and Application for Temporary Restraining Order and Temporary Injunction adds both MetaBank and BDO Seidman to the original causes of action against NetSpend. NetSpend acts as a prepaid card program manager and processor for both Inter National Bank ("INB") and MetaBank. According to the Petition, NetSpend has informed INB that the depository accounts at INB for the NetSpend program supposedly contained $10.5 million less than they should. INB alleges that NetSpend has breached its fiduciary duty by making affirmative misrepresentations to INB about the safety and stability of the program, and by failing to timely disclose the nature and extent of any alleged shortfall in settlement of funds related to cardholder activity and the nature and extent of NetSpend’s systemic deficiencies in its accounting and settlement processing procedures. To the extent that an accounting reveals that there is an actual shortfall, INB alleges that MetaBank may be liable for portions or all of said sum due to the fact that funds have been transferred from INB to MetaBank, and thus MetaBank would have been unjustly enriched. The Bank is vigorously contesting this matter. In January 2014, NetSpend was granted summary judgment in this matter which is under appeal. Because the theory of liability against both NetSpend and the Bank is the same, the Bank views the NetSpend summary judgment as a positive in support of its position. An estimate of a range of reasonably possible loss cannot be made at this stage of the litigation because discovery is still being conducted.
The Bank was served, on October 14, 2016, with a lawsuit captioned Card Limited, LLC v. MetaBank dba Meta Payment Systems, Civil No. 2:16-cv-00980 in the United States District Court for the District of Utah. This action was initiated by a former prepaid program manager of the Bank, which was terminated by the Bank in fiscal year 2016. Card Limited alleges that after all of the programs were wound down, there were two accounts with a positive balance to which they are entitled. The Bank’s position is that Card Limited is not entitled to the funds contained in said accounts. The total amount to which Card Limited claims it is entitled is $4.0 million. The Bank intends to vigorously defend this claim. An estimate of a range of reasonably possible loss cannot be made at this stage of the litigation because discovery is still being conducted.
78
On February 9, 2018, the Bank’s AFS/IBEX division filed a lawsuit in the United States District Court for the Eastern District of New York captioned AFS/IBEX, a division of MetaBank v. Aegis Managing Agency Limited ("AMA"), Aegis Syndicate 1225 (together with AMA, the "Aegis defendants"), CRC Insurance Services, Inc. ("CRC"), and Transportation Underwriters, Inc. The suit was filed against commercial insurance underwriters and brokers that facilitated the issuance of commercial insurance policies to Red Hook Construction Group-II, LLC (“Red Hook”). The Bank’s position is that both CRC and Transportation Underwriters represented to the Bank that, upon cancellation of the insurance policies prior to their stated terms, any unearned premiums would be refunded. The Bank then provided insurance premium financing to Red Hook, and Red Hook executed a written premium finance agreement pursuant to which Red Hook assigned its rights to any unearned premiums to the Bank. After the policies were cancelled, the Aegis defendants failed to return the unearned insurance premiums totaling just over $1.6 million owed to the Bank under the insurance policies and the premium finance agreement. A discovery schedule has been established and is scheduled to proceed until January 31, 2019. The Bank is seeking recovery of all amounts to which it is entitled at law or equity and intends to vigorously pursue its claims against the defendants.
From time to time, the Company or its subsidiaries are subject to certain legal proceedings and claims in the ordinary course of business. Accruals have been recorded when the outcome is probable and can be reasonably estimated. While management currently believes that the ultimate outcome of these proceedings will not have a material adverse effect on the Company’s financial position or its results of operations, legal proceedings are inherently uncertain and unfavorable resolution of some or all of these matters could, individually or in the aggregate, have a material adverse effect on the Company’s and its subsidiaries’ respective businesses, financial condition or results of operations.
Not applicable.
All share and per share data for all periods presented has been adjusted to reflect the 3-for-1 forward stock split of the Company's common stock that the Company effected on October 4, 2018.
The Company’s common stock trades on the NASDAQ Global Market
®
under the symbol “CASH.” Quarterly dividends for the first, second and third quarters of fiscal year
2018
and for all quarters of fiscal year
2017
were $0.04 per share. The quarterly dividend for the fourth quarter of fiscal year 2018 was $0.05 per share.
Dividend payment decisions are made with consideration of a variety of factors including earnings, financial condition, market considerations and regulatory restrictions.
As of
November 26, 2018
, the Company had (i)
39,406,938
shares of common stock outstanding, which were held by approximately
224
stockholders of record, (ii) no shares of nonvoting common stock outstanding, and (iii)
101,771
shares of common stock held in treasury.
The transfer agent for the Company’s common stock is Computershare Investor Services, 462 South 4th Street, Suite 1600, Louisville, KY 40202.
There were no purchases by the Company during the fiscal year ended
September 30, 2018
, of equity securities that are registered by the Company pursuant to Section 12 of the Exchange Act.
79
Total Stock Return Performance Graph
The following graph compares the cumulative total stockholder return on Meta common stock over the last five fiscal years with the cumulative total return of the NASDAQ Composite Index and the NASDAQ ABA Community Bank Index (assuming the investment of $100 in each index on October 1, 2013 and reinvestment of all dividends). The stock price performance reflected below is based on historical results and is not necessarily indicative of future stock price performance.
The information contained in this section, including the following line graph, shall not be deemed to be "soliciting material" or "filed" or incorporated by reference in future filings of Meta with the SEC, or subject to the liabilities of Section 18 of the Exchange Act, except to the extent we specifically incorporate it by reference into a document filed under the Securities Act of 1933, as amended, or the Exchange Act.
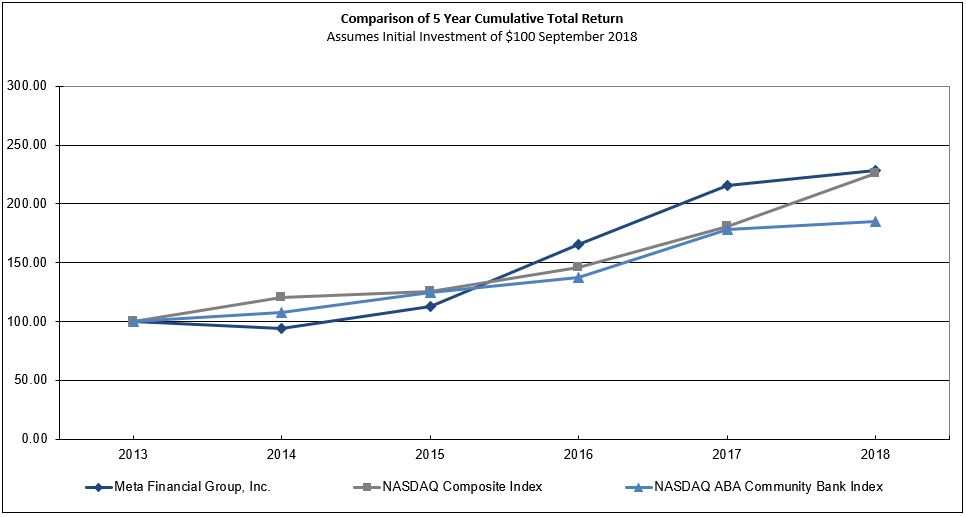
|
Year Ended September 30,
|
||||||||||||||||||
|
Index
|
2013
|
2014
|
2015
|
2016
|
2017
|
2018
|
||||||||||||
|
Meta Financial Group, Inc.
|
$
|
100.00
|
|
$
|
94.03
|
|
$
|
112.91
|
|
$
|
165.58
|
|
$
|
215.56
|
|
$
|
228.48
|
|
|
NASDAQ Composite Index
|
100.00
|
|
120.61
|
|
125.43
|
|
146.03
|
|
180.62
|
|
226.08
|
|
||||||
|
NASDAQ ABA Community Bank Index
|
100.00
|
|
107.84
|
|
124.38
|
|
137.38
|
|
178.62
|
|
184.60
|
|
||||||
80
Item 6.
Selected Financial Data
All share and per share data for all periods presented has been adjusted for the 3-for-1 forward stock split of the Company's common stock effected by the Company on October 4, 2018.
|
September 30,
|
2018
|
2017
|
2016
|
2015
|
2014
|
||||||||||||||
|
SELECTED FINANCIAL CONDITION DATA
|
|||||||||||||||||||
|
(Dollars in Thousands)
|
|||||||||||||||||||
|
Total assets
|
$
|
5,835,067
|
|
$
|
5,228,332
|
|
$
|
4,006,419
|
|
$
|
2,529,705
|
|
$
|
2,054,031
|
|
||||
|
Loans and leases receivable, net
|
2,931,699
|
|
1,317,837
|
|
919,470
|
|
706,255
|
|
493,007
|
|
|||||||||
|
Securities available for sale
|
1,852,025
|
|
1,693,431
|
|
1,469,249
|
|
1,256,087
|
|
1,140,216
|
|
|||||||||
|
Securities held to maturity
|
172,154
|
|
563,529
|
|
619,853
|
|
345,744
|
|
282,933
|
|
|||||||||
|
Goodwill and intangible assets
|
373,989
|
|
150,901
|
|
65,849
|
|
70,505
|
|
2,588
|
|
|||||||||
|
Deposits
|
4,430,987
|
|
3,223,424
|
|
2,430,082
|
|
1,657,534
|
|
1,366,541
|
|
|||||||||
|
Total borrowings
|
514,722
|
|
1,490,067
|
|
1,187,578
|
|
561,317
|
|
497,721
|
|
|||||||||
|
Stockholders' equity
|
747,726
|
|
434,496
|
|
334,975
|
|
271,335
|
|
174,802
|
|
|||||||||
|
Year Ended September 30,
|
2018
|
2017
|
2016
|
2015
|
2014
|
||||||||||||||
|
SELECTED OPERATIONS DATA
|
|
|
|
|
|
|
|
|
|
|
|||||||||
|
(Dollars in Thousands, Except Per Share Data)
|
|
|
|
|
|
|
|
|
|
|
|||||||||
|
Total interest income
|
$
|
158,534
|
|
$
|
108,103
|
|
$
|
81,396
|
|
$
|
61,607
|
|
$
|
48,660
|
|
||||
|
Total interest expense
|
27,985
|
|
14,873
|
|
4,091
|
|
2,387
|
|
2,398
|
|
|||||||||
|
Net interest income
|
130,549
|
|
93,230
|
|
77,305
|
|
59,220
|
|
46,262
|
|
|||||||||
|
Provision for loan and lease losses
|
29,432
|
|
10,589
|
|
4,605
|
|
1,465
|
|
1,150
|
|
|||||||||
|
Net interest income after provision for loan and lease losses
|
101,117
|
|
82,641
|
|
72,700
|
|
57,755
|
|
45,112
|
|
|||||||||
|
Total non-interest income
|
184,525
|
|
172,172
|
|
100,770
|
|
58,174
|
|
51,738
|
|
|||||||||
|
Total non-interest expense
|
228,232
|
|
199,663
|
|
134,648
|
|
96,506
|
|
78,231
|
|
|||||||||
|
Income before income tax expense
|
57,410
|
|
55,150
|
|
38,822
|
|
19,423
|
|
18,619
|
|
|||||||||
|
Income tax expense
|
5,117
|
|
10,233
|
|
5,602
|
|
1,368
|
|
2,906
|
|
|||||||||
|
Net income before non-controlling interest
|
52,293
|
|
44,917
|
|
33,220
|
|
18,055
|
|
15,713
|
|
|||||||||
|
Net income attributable to non-controlling interest
|
673
|
|
—
|
|
—
|
|
—
|
|
—
|
|
|||||||||
|
Net income attributable to parent
|
$
|
51,620
|
|
$
|
44,917
|
|
$
|
33,220
|
|
$
|
18,055
|
|
$
|
15,713
|
|
||||
|
Earnings per common share:
|
|
|
|
|
|
|
|
|
|
|
|||||||||
|
Basic
|
$
|
1.68
|
|
$
|
1.62
|
|
$
|
1.31
|
|
$
|
0.89
|
|
$
|
0.86
|
|
||||
|
Diluted
|
$
|
1.67
|
|
$
|
1.61
|
|
$
|
1.30
|
|
$
|
0.89
|
|
$
|
0.84
|
|
||||
81
|
Year Ended September 30,
|
2018
|
2017
|
2016
|
2015
|
2014
|
||||||||||||||
|
SELECTED FINANCIAL RATIOS AND OTHER DATA
|
|||||||||||||||||||
|
PERFORMANCE RATIOS
|
|||||||||||||||||||
|
Return on average assets
|
1.12
|
%
|
1.13
|
%
|
1.10
|
%
|
0.78
|
%
|
0.81
|
%
|
|||||||||
|
Return on average equity
|
10.44
|
%
|
11.20
|
%
|
10.80
|
%
|
8.83
|
%
|
10.01
|
%
|
|||||||||
|
Net interest margin, tax equivalent
|
3.41
|
%
|
3.05
|
%
|
3.19
|
%
|
3.03
|
%
|
2.80
|
%
|
|||||||||
|
QUALITY RATIOS
|
|
|
|
|
|
|
|
|
|
|
|||||||||
|
Non-performing assets to total assets
|
0.72
|
%
|
0.72
|
%
|
0.03
|
%
|
0.31
|
%
|
0.05
|
%
|
|||||||||
|
Allowance for loan and lease losses to total loans and leases
|
0.44
|
%
|
0.57
|
%
|
0.61
|
%
|
0.88
|
%
|
1.08
|
%
|
|||||||||
|
Allowance for loan and lease losses to non-performing loans and leases
|
128
|
%
|
20
|
%
|
479
|
%
|
80
|
%
|
547
|
%
|
|||||||||
|
CAPITAL RATIOS
|
|
|
|
|
|
|
|
|
|
|
|||||||||
|
Stockholders' equity to total assets
|
12.81
|
%
|
8.31
|
%
|
8.36
|
%
|
10.73
|
%
|
8.51
|
%
|
|||||||||
|
Average stockholders' equity to average assets
|
10.72
|
%
|
10.07
|
%
|
10.19
|
%
|
8.81
|
%
|
8.14
|
%
|
|||||||||
|
OTHER DATA
|
|
|
|
|
|
|
|
|
|
|
|||||||||
|
Book value per common share outstanding at end of year
|
$
|
19.09
|
|
$
|
15.05
|
|
$
|
13.10
|
|
$
|
11.08
|
|
$
|
9.44
|
|
||||
|
Tangible book value per common share outstanding at end of year
|
9.54
|
|
9.82
|
|
10.52
|
|
8.20
|
|
9.30
|
|
|||||||||
|
Dividends declared per share at end of year
|
0.18
|
|
0.17
|
|
0.17
|
|
0.17
|
|
0.17
|
|
|||||||||
|
Number of full-service branch offices at end of year
|
10
|
|
10
|
|
10
|
|
10
|
|
11
|
|
|||||||||
|
Common shares outstanding
|
39,167,280
|
|
28,867,785
|
|
25,570,923
|
|
24,489,066
|
|
18,508,812
|
|
|||||||||
This section should be read in conjunction with the following parts of this Form 10-K: Part II, Item 8 “Financial Statements and Supplementary Data,” Part II, Item 7A, “Quantitative and Qualitative Disclosures About Market Risk,” and Part I, Item 1 “Business.”
General
The Company, a registered unitary savings and loan holding company, is a Delaware corporation, the principal assets of which are all the issued and outstanding shares of the Bank, a federal savings bank. Unless the context otherwise requires, references herein to the Company include Meta and the Bank, and all subsidiaries of Meta, direct or indirect, on a consolidated basis.
Overview of Corporate Developments Since Fiscal Year 2017
On October 30, 2018, the Company announced that its Board of Directors appointed Brad Hanson, President of Meta Financial Group, MetaBank and Meta Payment Systems, to the additional role of Chief Executive Officer, effective immediately. Hanson also remains on the Meta Board. Hanson replaces J. Tyler Haahr, who stepped down as Chief Executive Officer. It is expected that Haahr will remain Chairman of the Board and an employee through the Company’s Annual Meeting of Stockholders expected to be held in January 2019. Frederick V. Moore, currently Lead Director and Vice Chairman, has been appointed to serve as Chairman effective following the date of the Annual Meeting.
82
On October 5, 2018, Meta common stock began trading on a split-adjusted basis following the 3-for-1 forward stock split the Company effected on October 4, 2018. As a result of the stock split, the number of issued and outstanding shares of Meta common stock increased to 39.2 million shares, which includes shares issued in the Crestmark Acquisition.
On August 28, 2018, the Company announced that its Board of Directors approved an increase in the quarterly common stock dividend paid on October 1, 2018 to $0.05 per share, or $0.20 annualized (which amounts reflect the effectiveness of the stock split), representing a 15.4% increase over the quarterly dividend paid in the prior quarter (as adjusted to give effect to the stock split).
On August 1, 2018, Meta completed the previously announced Crestmark Acquisition. Effective as of the closing of the transaction, W. David Tull, Crestmark's Chairman and Chief Executive Officer, and Michael R. Kramer, a member at the law firm Dickinson Wright, PLLC, were appointed to the board of directors of Meta and MetaBank. Mick Goik, President and Chief Operating Officer of Crestmark, was named Executive Vice President of MetaBank and President of the Meta commercial finance division, which includes Crestmark.
In mid-July 2018, the Company entered into a first-out participation agreement in a highly secured, consumer receivable asset-based warehouse line of credit. The Company holds a senior position, providing up to $65.0 million, with the subordinate party contributing up to $100.0 million, thereby enhancing the Company’s position with significant subordination. The Company expects to realize a variable yield with a floor of 6%.
On June 20, 2018, Meta announced that, on June 18, 2018, the Company received written notification from ReliaMax, the entity that provided insurance for the Company's purchased student loans, informing policy holders that the South Dakota Division of Insurance had filed a petition to have ReliaMax declared insolvent and to adopt a plan of liquidation. The Company expects to ultimately recover a portion of the unearned premiums.
On June 20, 2018, Meta announced its entry into an agreement with Global Cash Card, Inc. ("GCC") to extend their agreement through 2022. GCC is a leading provider of paycard solutions, specializing in paperless payroll and direct deposit distribution for its clients.
On April 30, 2018, Meta announced an expanded, four-year agreement with AAA. Together, Meta and AAA anticipate bringing robust payments solutions to US-based AAA Clubs. Under this new agreement, MetaBank and AAA will expand distribution of the payments products, as well as enhancing them based on member feedback and consumer preference, adding features like mobile applications for card management and additional load capabilities.
On April 30, 2018, Meta also announced an agreement with CURO Group Holdings Corp ("CURO"), a leader in providing short-term credit to underbanked consumers. Together, the organizations will launch a new line of credit product that the parties believe will be more flexible and transparent than others in the market, and well-suited for US-based underbanked consumers.
On April 3, 2018, Meta announced it entered into a three-year agreement with HCS, a technology-driven, patient financing company. MetaBank will approve and originate loans for elective procedures for select HCS provider offices throughout the country.
On March 12, 2018, Meta announced a 10-year renewal of a relationship with Money Network Financial, LLC ("Money Network"), a wholly-owned subsidiary of First Data (NYSE: FDC). MetaBank supports a range of Money Network payments programs, most notably the Money Network® Electronic Payment Delivery Service, which large organizations use to provide employees the option of receiving wages electronically.
On January 25, 2018, Meta announced that it entered into a three-year program agreement with Liberty Lending, whereby MetaBank will provide personal loans to Liberty Lending customers. This marks the entry point for Meta into a direct-to-consumer credit business, leveraging its balance sheet to generate income on higher margin products.
On October 11, 2017, the Company completed the purchase of a $73.0 million, seasoned, floating rate, private student loan portfolio. All loans are indexed to one-month LIBOR. This portfolio purchase builds on the Company's existing student loan platform.
83
Overview
The Company recorded net income of
$51.6 million
in fiscal
2018
compared to
$44.9 million
in fiscal
2017
. The increase in net income was primarily due to increases in net interest income and non-interest income. The Company’s net interest income grew to
$130.5 million
in fiscal
2018
, compared to
$93.2 million
in fiscal
2017
. The increase was primarily attributable to improvement in the overall interest-earning asset mix due to loan and lease growth, including the loan and lease portfolio acquired in the Crestmark Acquisition. In fiscal
2018
, non-interest income increased to
$184.5 million
from
$172.2 million
in fiscal
2017
, primarily due to increases in rental income, tax advance product fee income, deposit fee income and refund transfer product fee income. Partially offsetting the higher non-interest income and net interest income was non-interest expense, which rose
$28.6 million
, from
$199.7 million
in fiscal
2017
to
$228.2 million
in fiscal
2018
, and income tax expense which decreased from
$10.2 million
to
$5.1 million
year over year.
Overall, the cost of funds at MetaBank averaged
0.70%
during fiscal
2018
, compared to
0.43%
during
2017
. This increase was primarily due to the addition of wholesale deposits and an increase in short-term borrowing rates.
Tangible book value per common share decreased by
$0.28
, or
3%
, to
$9.54
per share at
September 30, 2018
, from
$9.82
per share at
September 30, 2017
. This decrease was driven by an increase in common shares outstanding along with increases in goodwill and intangible assets, which for this calculation, are excluded from total stockholders' equity. The increases in common shares outstanding, goodwill and intangible assets were primarily attributable to the Crestmark Acquisition completed during fiscal 2018. Book value per common share outstanding increased by
$4.04
, or
27%
, to
$19.09
per share at
September 30, 2018
, from
$15.05
per share at
September 30, 2017
.
The Company’s non-performing assets ("NPAs") at
September 30, 2018
were
$41.8 million
, representing
0.72%
of total assets, compared to
$37.9 million
, or
0.72%
of total assets, at
September 30, 2017
. The increase in NPAs is primarily attributable to the acquired loans and leases from the Crestmark Acquisition, along with increases related to loan growth in the commercial insurance premium finance, student loan, and tax services portfolios. Partially offsetting the increase in NPAs at
September 30, 2018
compared to
September 30, 2017
was the payment in full of a previously disclosed $7.0 million nonperforming agricultural loan relationship during the first quarter of fiscal 2018.
Financial Condition
As of
September 30, 2018
, the Company’s assets grew by
$606.7 million
, or
12%
, to
$5.84 billion
, compared to
$5.23 billion
at
September 30, 2017
. The growth in assets resulted from a variety of factors but primarily due to increases in loan and lease balances from the acquired Crestmark division.
Total cash and cash equivalents were
$100.0 million
at
September 30, 2018
, a decrease of
$1.17 billion
from
$1.27 billion
at
September 30, 2017
. The majority of this decrease was related to a temporary repositioning of the balance sheet in September 2017. The Company maintains its cash investments in interest-bearing overnight deposits with the FHLB and the FRB. At
September 30, 2018
, the Company had no federal funds sold.
The total of MBS and investment securities decreased
$232.8 million
, or
10%
, to
$2.02 billion
at
September 30, 2018
, compared to
September 30, 2017
, as investment maturities, sales and principal pay downs exceeded purchases. The Company’s portfolio of securities customarily consists primarily of MBS, which have expected lives much shorter than the stated final maturity, non-bank qualified obligations of states and political subdivisions (“NBQ”) which mature in approximately 15 years or less, and other tax exempt municipal mortgage related pass through securities which have average lives much shorter than their stated final maturities. All MBS held by the Company at September 30, 2018 were issued by a U.S. Government agency or instrumentality. Of the total
$371.9 million
of MBS at September 30, 2018,
$364.1 million
were classified as AFS, and
$7.9 million
were classified as HTM. Of the total
$1.65 billion
of investment securities,
$1.49 billion
were classified as AFS and
$164.3 million
were classified as HTM. During fiscal
2018
, the Company purchased an aggregate of $141.6 million of MBS securities, of which all have an average life estimated at approximately five years or less or stated final maturities of approximately 30 years or less, and sold MBS in the amount of $336.8 million. In addition, the Company purchased $511.6 million of investment securities which are principally comprised of tax exempt municipal bonds primarily backed by, and/or convertible into, Ginnie Mae, Fannie Mae, or Freddie Mac MBS securities, government related and guaranteed floating rate securities, and smaller portions of other security types.
84
During the first quarter of fiscal 2018, the Company early adopted Accounting Standard Update ("ASU") 2017-12,
"Derivatives and Hedging (Topic 815): Targeted Improvements to Accounting for Hedging Activities
." Due to the early adoption of the ASU, the Company transferred $204.7 million of investment securities and $101.3 million of MBS from HTM to AFS during the first quarter of fiscal 2018. In connection with the Crestmark Acquisition, the Company transferred $40.9 million of investment securities from HTM to AFS during the fourth quarter of fiscal 2018, as allowed through ASC 320-10-25-6(c), which allows for the transfer of securities from HTM in the event of a major business combination. See Note 6 to the “Notes to Consolidated Financial Statements,” which is included in Part II, Item 8 “Consolidated Financial Statements and Supplementary Data” of this Annual Report on Form 10-K.
The Company’s portfolio of net loans and leases receivable increased by
$1.61 billion
, or
122%
, to
$2.93 billion
at
September 30, 2018
, from
$1.32 billion
at
September 30, 2017
, primarily attributable to loans and leases acquired as part of the Crestmark Acquisition. Excluding loans and leases acquired as part of the Crestmark Acquisition, total net loans and leases receivable would have increased
$454.0 million
, or
34%
, during fiscal year 2018. Crestmark loans and leases receivable were acquired at a fair value of
$1.05 billion
on August 1, 2018 and grew to
$1.16 billion
at September 30, 2018.
National lending loans and leases increased
$1.45 billion
, or
367%
, to
$1.85 billion
at
September 30, 2018
compared to
September 30, 2017
. Excluding the Crestmark division, national lending loans and leases would have increased
$291.4 million
, or
74%
, at
September 30, 2018
compared to
September 30, 2017
. Within the national lending portfolios, excluding the Crestmark division, commercial finance loans and leases increased
$95.4 million
from September 30, 2017 to September 30, 2018, primarily driven by an increase of
$87.4 million
, or
35%
, in commercial insurance premium finance loans. The consumer finance portfolio increased
$195.1 million
, largely driven by consumer credit products, an asset-based consumer warehouse line of credit, and the Company's student loan portfolio.
Community banking loans grew
$167.6 million
, or
18%
, at
September 30, 2018
compared to
September 30, 2017
, due to growth in commercial real estate loans of
$163.1 million
and residential mortgage loans of
$26.8 million
, offset in part by a decrease in agricultural loans of
$34.9 million
. See Note 3 to the “Notes to Consolidated Financial Statements,” which is included in Part II, Item 8 “Financial Statements and Supplementary Data” of this Annual Report on Form 10-K.
Through the Bank, the Company owns stock in the FHLB due to the Bank’s membership and participation in this banking system. The FHLB requires a level of stock investment based on a pre-determined formula. The Company’s investment in such stock decreased
$37.7 million
, or
62%
, to
$23.4 million
at
September 30, 2018
, from
$61.1 million
at
September 30, 2017
. The decrease directly correlates with the lower short-term borrowings balances compared to the prior year.
Total end-of-period deposits increased by
$1.21 billion
, or
37%
, to
$4.43 billion
at
September 30, 2018
, from
$3.22 billion
at
September 30, 2017
. The increase in end-of-period deposits was primarily the result of an increase in wholesale deposits of
$1.06 billion
, an increase in certificate of deposits of
$152.5 million
, and an increase in interest bearing deposits of
$44.3 million
, partially offset by a decrease in non-interest bearing checking deposits of
$48.8 million
. The increase in wholesale deposits and certificate of deposits was primarily attributable to the fair value of deposits acquired on August 1, 2018 in the Crestmark Acquisition, which included
$825.1 million
in wholesale deposits and
$295.6 million
in certificates of deposits. End of period deposits attributable to the Payments divisions decreased $23.9 million, or 1%, at
September 30, 2018
, as compared to
September 30, 2017
.
The Company’s total borrowings decreased
$975.3 million
, or
65%
, from
$1.49 billion
at
September 30, 2017
, to
$514.7 million
at
September 30, 2018
, primarily due to the decrease in short-term advances from the FHLB. The Company’s short-term borrowings fluctuate on a daily basis due to the nature of a portion of its non-interest-bearing deposit base, primarily related to payroll processing timing with a higher volume of short-term borrowings on Monday and Tuesday, which are typically paid down throughout the week. This predictable fluctuation may be augmented near a month-end by a prefunding of certain programs. The Company also has an available no fee line of credit with JP Morgan of $25.0 million with no funds advanced at September 30, 2018.
See Note 9 to the “Notes to Consolidated Financial Statements,” which are included in Part II, Item 8 “Financial Statements and Supplementary Data” of this Annual Report on Form 10-K.
85
At
September 30, 2018
, the Company’s stockholders’ equity totaled
$747.7 million
, an increase of
$313.2 million
from
$434.5 million
at
September 30, 2017
. Stockholders’ equity increased primarily as a result of an increase in additional paid-in capital as a result of the Crestmark Acquisition. At
September 30, 2018
, the Bank continued to meet regulatory requirements for classification as a well-capitalized institution. See Note 13 to the “Notes to Consolidated Financial Statements,” which is included in Part II, Item 8 “Financial Statements and Supplementary Data” of this Annual Report on Form 10-K.
Results of Operations
The Company’s results of operations are dependent on net interest income, provision for loan and lease losses, non-interest income, non-interest expense and income tax expense. Net interest income is the difference, or spread, between the average yield on interest-earning assets and the average rate paid on interest-bearing liabilities. The interest rate spread is affected by regulatory, economic and competitive factors that influence interest rates, loan and lease demand and deposit flows. Notwithstanding that a significant amount of the Company’s deposits, primarily those attributable to the Payments divisions, pay relatively low rates of interest or none at all, the Company, like other financial institutions, is subject to interest rate risk to the extent that its interest-earning assets mature or reprice at different times, or on a different basis, than its interest-bearing liabilities. The provision for loan and lease losses is the adjustment to the allowance for loan and lease losses balance for the applicable period. The allowance for loan and lease losses is management’s estimate of probable loan and lease losses in the lending portfolio based upon loan and lease losses that have been incurred as of the balance sheet date.
The Company’s non-interest income is derived primarily from tax product fees, prepaid cards, credit products, deposit and ATM fees attributable to the MPS division and fees charged on bank loans, leases and transaction accounts. Non-interest income is also derived from rental income, net gains on the sale of securities, net gains on the sale of loans and leases, as well as the Company’s holdings of bank-owned life insurance. This income is offset by non-interest expenses, such as compensation and occupancy expenses associated with additional personnel and office locations, as well as card processing expenses and tax product expenses attributable to Payments. Non-interest expense is also impacted by acquisition-related expenses, operating lease equipment depreciation expense, occupancy and equipment expenses, regulatory expenses, and legal and consulting expenses.
86
Average Balances, Interest Rates and Yields
The following table presents, for the periods indicated, the total dollar amount of interest income from average interest-earning assets and the resulting yields, as well as the interest expense on average interest-bearing liabilities, expressed both in dollars and rates. Only the yield/rate have tax equivalent adjustments. Non-accruing loans and leases have been included in the table as loans or leases carrying a zero yield.
|
Year Ended September 30,
|
2018
|
2017
|
2016
|
|||||||||||||||||||||||||||||
|
(Dollars in Thousands)
|
Average
Outstanding
Balance
|
Interest
Earned /
Paid
|
Yield /
Rate
(1)
|
Average
Outstanding
Balance
|
Interest
Earned /
Paid
|
Yield /
Rate
(2)
|
Average
Outstanding
Balance
|
Interest
Earned /
Paid
|
Yield /
Rate
(2)
|
|||||||||||||||||||||||
|
Interest-earning assets:
|
||||||||||||||||||||||||||||||||
|
Cash & fed funds sold
|
$
|
87,536
|
|
$
|
2,249
|
|
2.57
|
%
|
$
|
150,338
|
|
$
|
1,382
|
|
0.92
|
%
|
$
|
66,759
|
|
$
|
737
|
|
1.54
|
%
|
||||||||
|
Mortgage-backed securities
|
618,985
|
|
15,479
|
|
2.50
|
%
|
747,027
|
|
16,571
|
|
2.22
|
%
|
728,738
|
|
15,771
|
|
2.16
|
%
|
||||||||||||||
|
Tax exempt investment securities
|
1,381,838
|
|
34,402
|
|
3.30
|
%
|
1,303,830
|
|
31,930
|
|
3.77
|
%
|
1,061,198
|
|
24,965
|
|
3.56
|
%
|
||||||||||||||
|
Asset-backed securities
|
167,477
|
|
5,773
|
|
3.45
|
%
|
115,716
|
|
2,999
|
|
2.59
|
%
|
54,993
|
|
1,199
|
|
2.18
|
%
|
||||||||||||||
|
Other investment securities
|
76,412
|
|
2,156
|
|
2.82
|
%
|
115,958
|
|
3,104
|
|
2.68
|
%
|
101,258
|
|
2,537
|
|
2.51
|
%
|
||||||||||||||
|
Total investments
|
2,244,712
|
|
57,810
|
|
3.07
|
%
|
2,282,531
|
|
54,604
|
|
3.15
|
%
|
1,946,187
|
|
44,472
|
|
2.95
|
%
|
||||||||||||||
|
Total commercial finance
|
474,766
|
|
36,726
|
|
7.74
|
%
|
216,478
|
|
10,199
|
|
4.71
|
%
|
135,334
|
|
7,276
|
|
5.38
|
%
|
||||||||||||||
|
Total consumer finance
|
230,553
|
|
15,965
|
|
6.92
|
%
|
100,815
|
|
6,704
|
|
6.65
|
%
|
—
|
|
—
|
|
—
|
%
|
||||||||||||||
|
Total tax services
|
112,583
|
|
819
|
|
0.73
|
%
|
49,026
|
|
11
|
|
0.02
|
%
|
3,804
|
|
—
|
|
—
|
%
|
||||||||||||||
|
National Lending loans and leases
(3)
|
817,902
|
|
53,510
|
|
6.54
|
%
|
366,319
|
|
16,914
|
|
4.62
|
%
|
139,138
|
|
7,276
|
|
5.23
|
%
|
||||||||||||||
|
Community Banking loans
(4)
|
1,009,255
|
|
44,965
|
|
4.46
|
%
|
820,980
|
|
35,203
|
|
4.29
|
%
|
671,308
|
|
28,911
|
|
4.31
|
%
|
||||||||||||||
|
Total loans and leases
|
1,827,157
|
|
98,475
|
|
5.39
|
%
|
1,187,299
|
|
52,117
|
|
4.39
|
%
|
810,446
|
|
36,187
|
|
4.47
|
%
|
||||||||||||||
|
Total interest-earning assets
|
4,159,405
|
|
$
|
158,534
|
|
4.08
|
%
|
3,620,168
|
|
$
|
108,103
|
|
3.46
|
%
|
2,823,392
|
|
$
|
81,396
|
|
3.34
|
%
|
|||||||||||
|
Non-interest-earning assets
|
452,767
|
|
362,133
|
|
193,286
|
|
||||||||||||||||||||||||||
|
Total assets
|
$
|
4,612,172
|
|
$
|
3,982,301
|
|
$
|
3,016,678
|
|
|||||||||||||||||||||||
|
Interest-bearing liabilities:
|
||||||||||||||||||||||||||||||||
|
Interest-bearing checking
|
$
|
90,199
|
|
$
|
211
|
|
0.23
|
%
|
$
|
42,231
|
|
$
|
172
|
|
0.41
|
%
|
$
|
36,317
|
|
$
|
97
|
|
0.27
|
%
|
||||||||
|
Savings
|
56,834
|
|
37
|
|
0.07
|
%
|
55,484
|
|
31
|
|
0.06
|
%
|
59,670
|
|
24
|
|
0.04
|
%
|
||||||||||||||
|
Money markets
|
48,320
|
|
123
|
|
0.25
|
%
|
46,466
|
|
87
|
|
0.19
|
%
|
46,115
|
|
75
|
|
0.16
|
%
|
||||||||||||||
|
Time deposits
|
130,944
|
|
1,803
|
|
1.38
|
%
|
103,115
|
|
830
|
|
0.80
|
%
|
79,825
|
|
418
|
|
0.52
|
%
|
||||||||||||||
|
Wholesale deposits
|
738,796
|
|
12,989
|
|
1.76
|
%
|
558,855
|
|
4,931
|
|
0.88
|
%
|
—
|
|
—
|
|
—
|
%
|
||||||||||||||
|
Total interest-bearing deposits
|
1,065,093
|
|
15,163
|
|
1.42
|
%
|
806,151
|
|
6,051
|
|
0.75
|
%
|
221,927
|
|
614
|
|
0.28
|
%
|
||||||||||||||
|
Overnight fed funds purchased
|
326,786
|
|
6,294
|
|
1.93
|
%
|
259,378
|
|
2,649
|
|
1.02
|
%
|
339,035
|
|
1,607
|
|
0.47
|
%
|
||||||||||||||
|
FHLB advances
|
68,356
|
|
947
|
|
1.39
|
%
|
52,956
|
|
1,045
|
|
1.97
|
%
|
61,454
|
|
709
|
|
1.15
|
%
|
||||||||||||||
|
Subordinated debentures
|
73,413
|
|
4,488
|
|
6.11
|
%
|
73,273
|
|
4,448
|
|
6.07
|
%
|
9,437
|
|
539
|
|
5.71
|
%
|
||||||||||||||
|
Other borrowings
|
28,014
|
|
1,093
|
|
3.90
|
%
|
15,939
|
|
680
|
|
4.27
|
%
|
14,575
|
|
622
|
|
4.27
|
%
|
||||||||||||||
|
Total borrowings
|
496,569
|
|
12,822
|
|
2.58
|
%
|
401,546
|
|
8,822
|
|
2.20
|
%
|
424,501
|
|
3,477
|
|
0.82
|
%
|
||||||||||||||
|
Total interest-bearing liabilities
|
1,561,662
|
|
27,985
|
|
1.79
|
%
|
1,207,697
|
|
14,873
|
|
1.23
|
%
|
646,428
|
|
4,091
|
|
0.63
|
%
|
||||||||||||||
|
Non-interest bearing deposits
|
2,455,360
|
|
—
|
|
—
|
%
|
2,286,358
|
|
—
|
|
0.00
|
%
|
2,017,977
|
|
—
|
|
—
|
%
|
||||||||||||||
|
Total deposits and interest-bearing liabilities
|
4,017,022
|
|
$
|
27,985
|
|
0.70
|
%
|
3,494,055
|
|
$
|
14,873
|
|
0.43
|
%
|
2,664,405
|
|
$
|
4,091
|
|
0.15
|
%
|
|||||||||||
|
Other non-interest bearing liabilities
|
100,880
|
|
87,084
|
|
44,786
|
|
||||||||||||||||||||||||||
|
Total liabilities
|
4,117,902
|
|
3,581,139
|
|
2,709,191
|
|
||||||||||||||||||||||||||
|
Shareholders' equity
|
494,270
|
|
401,162
|
|
307,487
|
|
||||||||||||||||||||||||||
|
Total liabilities and stockholders' equity
|
$
|
4,612,172
|
|
$
|
3,982,301
|
|
$
|
3,016,678
|
|
|||||||||||||||||||||||
|
Net interest income and net interest rate spread including non-interest bearing deposits
|
$
|
130,549
|
|
3.38
|
%
|
$
|
93,230
|
|
3.04
|
%
|
$
|
77,305
|
|
3.18
|
%
|
|||||||||||||||||
|
Net interest margin
|
3.14
|
%
|
2.58
|
%
|
2.74
|
%
|
||||||||||||||||||||||||||
|
Tax equivalent effect
|
0.27
|
%
|
0.47
|
%
|
0.45
|
%
|
||||||||||||||||||||||||||
|
Net interest margin, tax equivalent
(5)
|
3.41
|
%
|
3.05
|
%
|
3.19
|
%
|
||||||||||||||||||||||||||
87
(1)
Tax rate used to arrive at the TEY for the year ended September 30, 2018 was 24.53%.
(2)
Tax rate used to arrive at the TEY for the years ended September 30, 2017 and September 30, 2016 was 35%.
(3)
Previously stated Specialty Finance Loans have been renamed as National Lending Loans. National Lending Loans are comprised of loan portfolios that are not generated by the Community Bank.
(4)
Previously stated Retail Bank loans have been renamed as Community Banking Loans.
(5)
Net interest margin expressed on a fully taxable equivalent basis ("net interest margin, tax equivalent") is a non-GAAP financial measure. The tax-equivalent adjustment to net interest income recognizes the estimated income tax savings when comparing taxable and tax-exempt assets and adjusting for federal and state exemption of interest income. We believe that it is a standard practice in the banking industry to present net interest margin expressed on a fully taxable equivalent basis, and accordingly believe the presentation of this non-GAAP financial measure may be useful for peer comparison purposes.
Rate / Volume Analysis
The following table presents, for the periods presented, the dollar amount of changes in interest income and interest expense for major components of interest-earning assets and interest-bearing liabilities. The table distinguishes between the change related to higher outstanding balances and the change due to the levels and volatility of interest rates. For each category of interest-earning assets and interest-bearing liabilities, information is provided on changes attributable to (i) changes in volume (
i.e.,
changes in volume multiplied by old rate) and (ii) changes in rate (
i.e.,
changes in rate multiplied by old volume). For purposes of this table, changes attributable to both rate and volume that cannot be segregated have been allocated proportionately to the change due to volume and the change due to rate.
|
Year Ended September 30,
|
2018 vs. 2017
|
2017 vs. 2016
(1)
|
||||||||||||||||||||||
|
|
Increase /
(Decrease)
Due to Volume
|
Increase /
(Decrease)
Due to Rate
|
Total
Increase /
(Decrease)
|
Increase /
(Decrease)
Due to Volume
|
Increase /
(Decrease)
Due to Rate
|
Total
Increase /
(Decrease)
|
||||||||||||||||||
|
Interest-earning assets
|
||||||||||||||||||||||||
|
Cash & fed funds sold
|
$
|
(773
|
)
|
$
|
1,640
|
|
$
|
867
|
|
$
|
1,115
|
|
$
|
(470
|
)
|
$
|
645
|
|
||||||
|
Mortgage-backed securities
|
(3,042
|
)
|
1,950
|
|
(1,092
|
)
|
385
|
|
415
|
|
800
|
|
||||||||||||
|
Tax exempt investment securities
|
4,778
|
|
(2,306
|
)
|
2,472
|
|
5,576
|
|
1,389
|
|
6,965
|
|
||||||||||||
|
Asset-Backed Securities
|
1,594
|
|
1,179
|
|
2,773
|
|
1,537
|
|
263
|
|
1,800
|
|
||||||||||||
|
Other investment securities
|
(1,105
|
)
|
157
|
|
(948
|
)
|
389
|
|
178
|
|
567
|
|
||||||||||||
|
Total investments
|
1,300
|
|
1,906
|
|
3,206
|
|
7,887
|
|
2,245
|
|
10,132
|
|
||||||||||||
|
Total commercial finance
|
17,243
|
|
9,283
|
|
26,526
|
|
3,915
|
|
(992
|
)
|
2,923
|
|
||||||||||||
|
Total consumer finance
|
8,973
|
|
288
|
|
9,261
|
|
6,704
|
|
—
|
|
6,704
|
|
||||||||||||
|
Total tax services
|
29
|
|
779
|
|
808
|
|
—
|
|
11
|
|
11
|
|
||||||||||||
|
National Lending loans and leases
|
27,361
|
|
9,235
|
|
36,596
|
|
10,619
|
|
(981
|
)
|
9,638
|
|
||||||||||||
|
Community Banking loans
|
8,358
|
|
1,404
|
|
9,762
|
|
6,418
|
|
(126
|
)
|
6,292
|
|
||||||||||||
|
Total loans and leases
|
32,590
|
|
13,768
|
|
46,358
|
|
17,037
|
|
(1,107
|
)
|
15,930
|
|
||||||||||||
|
Total interest-earning assets
|
$
|
33,117
|
|
$
|
17,314
|
|
$
|
50,431
|
|
$
|
26,039
|
|
$
|
668
|
|
$
|
26,707
|
|
||||||
|
Interest-bearing liabilities
|
||||||||||||||||||||||||
|
Interest-bearing checking
|
$
|
136
|
|
$
|
(97
|
)
|
$
|
39
|
|
$
|
18
|
|
$
|
57
|
|
$
|
75
|
|
||||||
|
Savings
|
1
|
|
5
|
|
6
|
|
(2
|
)
|
10
|
|
8
|
|
||||||||||||
|
Money markets
|
4
|
|
32
|
|
36
|
|
1
|
|
10
|
|
11
|
|
||||||||||||
|
Time deposits
|
265
|
|
708
|
|
973
|
|
145
|
|
267
|
|
412
|
|
||||||||||||
|
Wholesale deposits
|
1,966
|
|
6,092
|
|
8,058
|
|
4,931
|
|
—
|
|
4,931
|
|
||||||||||||
|
Total interest-bearing deposits
|
2,400
|
|
6,712
|
|
9,112
|
|
5,093
|
|
344
|
|
5,437
|
|
||||||||||||
|
Overnight fed funds purchased
|
825
|
|
2,820
|
|
3,645
|
|
(451
|
)
|
1,493
|
|
1,042
|
|
||||||||||||
|
FHLB advances
|
258
|
|
(356
|
)
|
(98
|
)
|
(109
|
)
|
445
|
|
336
|
|
||||||||||||
|
Subordinated debentures
|
8
|
|
31
|
|
39
|
|
3,873
|
|
36
|
|
3,909
|
|
||||||||||||
|
Other borrowings
|
476
|
|
(63
|
)
|
413
|
|
58
|
|
—
|
|
58
|
|
||||||||||||
|
Total borrowings
|
2,307
|
|
1,693
|
|
4,000
|
|
3,371
|
|
1,974
|
|
5,345
|
|
||||||||||||
|
Total interest-bearing liabilities
|
$
|
4,707
|
|
$
|
8,405
|
|
$
|
13,112
|
|
$
|
8,464
|
|
$
|
2,318
|
|
$
|
10,782
|
|
||||||
|
Net effect on net interest income
|
$
|
28,410
|
|
$
|
8,909
|
|
$
|
37,319
|
|
$
|
17,575
|
|
$
|
(1,650
|
)
|
$
|
15,925
|
|
||||||
88
Comparison of Operating Results for the Years Ended
September 30, 2018
, and
September 30, 2017
General
The Company recorded net income of
$51.6 million
, or
$1.67
per diluted share, for the year ended
September 30, 2018
, compared to
$44.9 million
, or
$1.61
per diluted share, for the year ended
September 30, 2017
, an increase of
$6.7 million
. The increase in net income was primarily caused by an increase in net interest income of
$37.3 million
, a reduction of
$10.2 million
in intangible impairment expense, and increases in rental income of
$7.3 million
, tax advance fee income of
$3.8 million
, deposit fees of
$3.7 million
, and refund advance fee income of
$2.9 million
.
The net income increase was offset in part by an increase in compensation and benefits expense of
$20.3 million
, loss on sale of securities of
$7.7 million
, legal and consulting expense of
$6.7 million
, other expense of
$4.9 million
, and occupancy and equipment expense of
$3.3 million
.
Net Interest Income
Net interest income for fiscal
2018
increased by
$37.3 million
, or
40%
, to
$130.5 million
from
$93.2 million
for the prior year. Net interest margin increased to
3.41%
in fiscal
2018
as compared to
3.05%
in fiscal
2017
. The increase in net interest income was primarily due to an increase in interest income of
$50.4 million
to
$158.5 million
from
$108.1 million
for the prior year. The increase in interest income was primarily due to an increase in the Company’s average earning assets of
$539.2 million
, or
15%
, to
$4.16 billion
during fiscal
2018
from
$3.62 billion
during
2017
. This increase was primarily driven by a combination of strong loan growth in the Company's existing portfolios and the acquired loans and leases from the Crestmark Acquisition. Interest income on investment securities was also a contributing factor. The increase in interest income was partially offset by an increase in interest expense of
$13.1 million
, to
$28.0 million
for fiscal 2018 from
$14.9 million
for the prior year.
Overall, when using a taxable equivalent yield (“TEY”), the Company’s interest earning asset yield increased by
62
basis points primarily due to a continued shift in the earning asset mix driven by growth in existing loan balances along with acquired Crestmark loans and leases. The Company experienced growth in its commercial finance, consumer finance, tax services and community bank portfolios. The yield on the national lending portfolio increased by
192
basis points while the yield on the community banking loan portfolio increased by
17
basis points. The yield on the investment securities portfolio decreased by
eight
basis points on a tax equivalent basis. Had corporate tax rates not changed due to the Tax Act, the reported securities portfolio TEY would have increased by 25 basis points.
The Company’s average balance of total deposits and interest-bearing liabilities increased
$523.0 million
, or
15%
, to
$4.02 billion
during fiscal
2018
from
$3.49 billion
during
2017
. The increase was driven by a combination of both wholesale deposits and short-term borrowings in order to fund the Company's loan growth and acquired loan and lease portfolios. The average outstanding balance of non-interest-bearing deposits increased from
$2.29 billion
in fiscal
2017
to
$2.46 billion
in fiscal
2018
. The Company’s cost of total deposits and interest-bearing liabilities increased
27
basis points to
0.70%
during fiscal
2018
from
0.43%
during
2017
. This increase was primarily due to a rise in short-term interest rates as well as higher average overall funding balances when compared to the prior year. Notwithstanding this increase, the Company believes that its growing, lower-cost deposit base gives it a distinct and significant competitive advantage, and even more so if interest rates continue to rise, because the Company anticipates that its cost of funds will likely remain relatively low, increasing less than at many other banks.
Provision for Loan and Lease Losses
In fiscal
2018
, the Company recorded
$29.4 million
in provision for loan and lease losses, compared to
$10.6 million
in fiscal
2017
. The increase in provision expense was driven by a combination of higher seasonal tax services loans held on the balance sheet, growth in the existing community bank and commercial insurance premium finance loan portfolios, provision related to the Company's student loan portfolio and provision related to the acquired Crestmark loans and leases.
Non‑Interest Income
Non-interest income increased by
$12.4 million
, or
7%
, to
$184.5 million
for fiscal
2018
from
$172.2 million
for fiscal
2017
. This increase was primarily due to rental income, tax advance fee income, deposit fee income and refund transfer fee income, which increased
$7.3 million
,
$3.8 million
,
$3.7 million
and
$2.9 million
, respectively. Rental income is a new line item for fiscal year 2018 related to operating leases that are attributable to the Crestmark division. The increase in tax advance fee income was primarily due to retaining all tax advance loans originated during the 2018 tax season. The increase in deposit fee income was primarily related to the growth and transition of certain product fee income from card fees to deposit fees, attributable to the Company's Payments division. Partially offsetting the above mentioned increases was a loss on sale of securities of
$7.7 million
due in large part to the Company's balance sheet restructuring related to the Crestmark Acquisition.
89
Non-Interest Expense.
Non-interest expense increased by
$28.6 million
, or
14%
, to
$228.2 million
for fiscal
2018
from
$199.7 million
for fiscal
2017
. This increase in non-interest expense was largely driven by an increase in compensation expense of
$20.3 million
when compared to the prior year. Also contributing to the increase were legal and consulting, other expense, occupancy and equipment expense and card processing expense, which increased
$6.7 million
,
$4.9 million
,
$3.3 million
and
$2.2 million
, respectively, from fiscal 2017 to fiscal 2018. The increase in compensation and benefits was due in part to employees joining the Company as part of the Crestmark Acquisition along with increased staffing to support the Company's other growing business line initiatives. The Company also incurred certain costs associated with the Crestmark Acquisition throughout the fiscal year that drove the increases in legal and consulting and other expense. The increase in occupancy and equipment expense was also largely attributable to the Crestmark Acquisition. Partially offsetting the above mentioned increases was a reduction in intangible impairment of
$10.2 million
which was down relative to fiscal 2017, which included an intangible impairment charge related to the non-renewal of the H&R Block relationship.
Income Tax Expense
Income tax expense for fiscal
2018
was
$5.1 million
, resulting in an effective tax rate of
9.0%
in fiscal 2018 compared to a tax expense of
$10.2 million
and an effective tax rate of
18.6%
, in fiscal
2017
. Despite the increase in earnings, the Company recorded less income tax expense than the prior year due to multiple factors. One factor that contributed to the reduction in both the income tax expense and effective tax rate were the provisions of the Tax Act, which lowered Meta's statutory rate from 35% in fiscal 2017 to 24.53% in fiscal 2018. The Company also recognized an investment tax credit in fiscal 2018, which reduced the Company's income tax expense by $4.0 million from fiscal 2017, reflecting the generation of investment tax credits under the Company's initiatives in the renewable energy sector. In addition, fiscal 2018 included a $4.6 million benefit recognized by the Company as a result of amending a historical tax return of Crestmark.
Comparison of Operating Results for the Years Ended
September 30, 2017
, and
September 30, 2016
General
The Company recorded net income of $44.9 million, or $1.61 per diluted share, for the year ended September 30, 2017, compared to $33.2 million, or $1.30 per diluted share, for the year ended September 30, 2016, an increase of $11.7 million. The increase in net income was primarily caused by an increase in tax advance fee income of $30.3 million, a $24.2 million increase in card fee income, a $15.9 million increase in net interest income, and a $15.6 million increase in refund advance fee income. The net income increase was offset in part by an increase in compensation and benefits expense of $27.1 million, a $10.2 million intangible impairment expense, a $7.5 million increase in amortization expense, and an increase in other expense of $5.5 million.
Net Interest Income
Net interest income for fiscal
2017
increased by $15.9 million, or
21%
, to
$93.2 million
from
$77.3 million
for the prior year. Net interest margin decreased to 3.05% in fiscal
2017
as compared to 3.19% in
2016
. The increase in net interest income was primarily due to an increase in interest income of $26.7 million to $108.1 million from $81.4 million for the prior year. The increase in interest income was primarily due to an increase in the Company’s average earning assets of $796.8 million, or 28%, to $3.62 billion during fiscal 2017 from $2.82 billion during 2016.
The Company’s average earning assets increased $796.8 million, or 28%, to $3.62 billion during fiscal
2017
from $2.82 billion during
2016
. This was due to a significant increase in volume in commercial real estate loans and specialty finance loans, which includes premium finance loans and the December 2016 purchased student loan portfolio.Growth in investment security balances and yields attained on those investment securities also contributed to the increase in net interest income. The increase in interest income was partially offset by an increase in interest expense of $10.8 million, to $14.9 million from $4.1 million for the prior year.
90
The Company’s average balance of total deposits and interest-bearing liabilities increased $829.7 million, or 31%, to
$3.49 billion during fiscal 2017 from $2.66 billion during 2016. A portion of this increase was due to the utilization of advantageous pricing and strategic maturities on certain wholesale deposits, an increase in average non-interest bearing deposits and the Company's completion of the public offering of its subordinated notes in August 2016, which are due August 15, 2026. This increase was partially offset by a decrease of $79.7 million in the average balance of overnight fed funds purchased. The average outstanding balance of non-interest-bearing deposits increased from $2.02 billion in fiscal 2016 to $2.29 billion in fiscal 2017. The Company’s cost of total deposits and interest-bearing liabilities increased 28 basis points to 0.43% during fiscal 2017 from 0.15% during 2016. This increase was primarily due to a combination of the issuance of the Company's subordinated debt in the fourth quarter of fiscal 2016, the addition of wholesale deposits, an increase in the overnight borrowing rates and higher average overall funding balances due to the Company's utilization of more of its capital during non-tax season with higher investment balances and funding.
Provision for Loan Losses
In fiscal
2017
, the Company recorded
$10.6 million
in provision for loan losses, compared to $4.6 million in
2016
. The increase in provision expense was primarily driven by higher seasonal volumes in tax season loans. The growth in the Banking segment loans, as well as the downgrade of a significant agriculture relationship during the second quarter of fiscal 2017 also contributed to an increased provision in fiscal 2017.
Non-Interest Income
Non-interest income increased by $71.4 million, or 71%, to $172.2 million for fiscal 2017 from $100.8 million for 2016. This increase was primarily due to an increase in tax advance fee income of $30.3 million, a $24.2 million increase in card fee income, and a $15.6 million increase in refund transfer product fee income. The increases in tax advance fee income and refund transfer product fee income were related to the acquisitions of EPS and SCS during the fiscal 2017 first quarter. Card fee income primarily grew due to a wind-down of one of our non-strategic partners and also due to continued strong growth in our core business relationships.
Non-Interest Expense
Non-interest expense increased by
$65.0 million
, or
48%
, to
$199.7 million
for fiscal
2017
from
$134.6 million
for fiscal
2016
. This increase in non-interest expense from 2016 to 2017 was largely driven by an increase in compensation expense of $27.1 million, an increase in amortization expense of $7.5 million, and an increase in other expense of $5.5 million. The increases in these categories were principally due to the EPS and SCS acquisitions, which occurred in the first quarter of fiscal 2017. The increase in compensation was also driven by non-cash stock-related compensation expense associated with three executive officers signing long-term employment agreements in the first and second quarters of fiscal 2017. Also leading to the increase in non-interest expense when comparing 2017 to 2016 was a $10.2 million intangible impairment charge related to the non-renewal of the H&R Block relationship during the fiscal 2017 fourth quarter. In addition, and to a lesser extent, noninterest expense also increased year over year due to increases in legal and consulting expense, tax advance product expense, refund transfer product expense, occupancy and equipment expense, and card processing expense.
Income Tax Expense
Income tax expense for fiscal 2017 was $10.2 million, resulting in an effective tax rate of 18.6%, compared to a tax expense of $5.6 million and an effective tax rate of 14.4%, in fiscal 2016. The increase in the Company’s recorded income tax expense for 2017 was primarily attributable to an increase in earnings; however, the increase was partially offset by the effects of adopting ASU 2016-09, “Improvements to Employee Share-Based Payment Accounting” for recording excess tax benefits as a reduction to income tax expense.
Asset Quality
At
September 30, 2018
, non-performing assets, consisting of impaired/non-accruing loans and leases, accruing loans and leases delinquent 90 days or more, foreclosed real estate and repossessed property totaled
$41.8 million
, or
0.72%
of total assets, compared to
$37.9 million
, or
0.72%
of total assets, at
September 30, 2017
. The small increase in NPAs was primarily attributable to the growth of, including through acquired loans and leases within, the commercial finance portfolio. Despite the increase in overall NPAs, NPAs as a percentage of total assets remained the same as the prior year due to the corresponding increase in assets. As of
September 30, 2018
, the Company had non-accruing loans and leases totaling
$2.9 million
and foreclosed and repossessed assets of approximately
$31.6 million
.
91
The Company maintains an allowance for loan and lease losses because it is probable that some loans and leases may not be repaid in full. At
September 30, 2018
, the Company had an allowance for loan and lease losses of
$13.0 million
as compared to
$7.5 million
at
September 30, 2017
. The increase was driven by a $1.3 million increase in the community banking allowance and a $4.2 million increase in the national lending allowance which was primarily comprised of $2.8 million related to the student loan portfolios and $0.8 million related to consumer credit products. The combined allowance for loan and lease losses and fair value marks was $24.4 million, or 0.8%, of the total loan and lease portfolio at September 30, 2018, compared to an allowance for loan loss of $7.5 million, or 0.6% of the total loan portfolio at September 30, 2017.
Management’s periodic review of the allowance for loan and lease losses is based on various subjective and objective factors including the Company’s past loss experience, known and inherent risks in the portfolio, adverse situations that may affect the borrower’s ability to repay, the estimated value of any underlying collateral and current economic conditions. While management may allocate portions of the allowance for specifically identified problem loan and lease situations, the majority of the allowance is based on both subjective and objective factors related to the overall loan and lease portfolio and is available for any loan and lease charge-offs that may occur. As stated previously, there can be no assurance future losses will not exceed estimated amounts, or that additional provisions for loan and lease losses will not be required in future periods. In addition, the Bank is subject to review by the OCC, which has the authority to require management to make changes to the allowance for loan and lease losses, and the Company is subject to similar review by the Federal Reserve.
In determining the allowance for loan and lease losses, the Company specifically identifies loans and leases it considers as having potential collectability problems. Based on criteria established by ASC 310,
Receivables
, some of these loans and leases are considered to be “impaired” while others are not considered to be impaired, but possess weaknesses that the Company believes merit additional analysis in establishing the allowance for loan and lease losses. All other loans and leases are evaluated by applying estimated loss ratios to various pools of loans and leases. The Company then analyzes other applicable qualitative factors (such as economic conditions) in determining the aggregate amount of the allowance needed.
At
September 30, 2018
,
$0.6 million
of the allowance for loan and lease losses was allocated to impaired loans and leases. See Note 3 of the “Notes to Consolidated Financial Statements,” which is included in Part II, Item 8 “Financial Statements and Supplementary Data” of this Annual Report on Form 10-K.
$0.8 million
of the total allowance was allocated to other identified problem loans and loan relationships, representing
0.7%
of the related loan and lease balances, and
$11.6 million
of the total allowance, representing
0.4%
of the related loan and lease balances, was allocated to the remaining overall loan and lease portfolio based on historical loss experience and qualitative factors. At
September 30, 2017
,
none
of the allowance for loan losses was allocated to impaired loans and leases.
$2.0 million
of the total allowance was allocated to other identified problem loan and lease situations or
3.5%
of related loan and lease balances, and
$5.5 million
of the total allowance, representing
0.4%
, was allocated against losses from the overall loan and leases portfolio based on historical loss experience and qualitative factors.
The Company maintains an internal loan and lease review and classification process which involves multiple officers of the Company and is designed to assess the general quality of credit underwriting and to promote early identification of potential problem loans and leases. All loan officers are charged with the responsibility of risk rating all loans and leases in their portfolios and updating the ratings, positively or negatively, on an ongoing basis as conditions warrant.
The level of potential problem loans and leases is another predominant factor in determining the relative level of risk in the loan and lease portfolio and in determining the appropriate level of the allowance for loan and lease losses. Potential problem loans and leases are generally defined by management to include loans and leases rated as substandard by management that are not considered impaired (
i.e.
, non-accrual loans and leases and accruing troubled debt restructurings), but there are circumstances that create doubt as to the ability of the borrower to comply with repayment terms. The decision of management to include performing loans and leases in potential problem loans and leases does not necessarily mean that the Company expects losses to occur, but that management recognizes a higher degree or risk associated with these loans and leases. The loans and leases that have been reported as potential problem loans and leases are predominantly commercial loans and leases covering a diverse range of businesses and real estate property types. At
September 30, 2018
, potential problem loans and leases totaled
$24.6 million
compared to
$39.5 million
at
September 30, 2017
.
92
Liquidity and Capital Resources
The Company’s primary sources of funds are deposits, derived principally through its Payments divisions, and to a lesser extent through its community bank division, borrowings, principal and interest payments on loans and leases and MBS, and maturing investment securities. In addition, the Company utilizes wholesale deposit sources to provide funding when necessary or when favorable terms are available. While scheduled loan repayments and maturing investments are relatively predictable, deposit flows and early loan repayments are influenced by the level of interest rates, general economic conditions and competition.
The Company relies on advertising, quality customer service, convenient locations and competitive pricing to attract and retain its community bank deposits and primarily solicits these deposits from its core market areas. Based on its experience, the Company believes that its consumer checking, savings and money market accounts are relatively stable sources of deposits. The Company’s ability to attract and retain time deposits has been, and will continue to be, affected by market conditions. However, the Company does not foresee any significant community bank funding issues resulting from the sensitivity of time deposits to such market factors.
The low-cost checking deposits generated through the Company's Payments divisions may carry a greater degree of concentration risk than traditional consumer checking deposits but, based on experience, the Company believes that Payments‑generated deposits are a stable source of funding. To date, the Company has not experienced any material
net outflows related to Payments-generated deposits, though no assurance can be given that this will continue to be the case.
The Bank is required by regulation to maintain sufficient liquidity to assure its safe and sound operation. In the opinion of management, the Bank is in compliance with this requirement.
Liquidity management is both a daily and long-term function of the Company’s management strategy. The Company adjusts its investments in liquid assets based upon management’s assessment of (i) expected loan demand, (ii) the projected availability of purchased loan products, (iii) expected deposit flows, (iv) yields available on interest-bearing deposits and (v) the objectives of its asset/liability management program. Excess liquidity is generally invested in interest-earning overnight deposits and other short-term government agency or instrumentality obligations. If the Company requires funds beyond its ability to generate them internally, it has additional borrowing capacity with the FHLB and other wholesale funding sources. The Company is not aware of any facts that would be reasonably likely to have a material adverse impact on the Company’s liquidity or its ability to borrow additional funds.
The primary investing activities of the Company are the origination of loans and leases, the acquisitions of companies and the purchase of securities. During the years ended
September 30, 2018
,
2017
and
2016
, the Company originated loans and leases totaling
$4.4 billion
,
$2.6 billion
and
$968.4 million
, respectively. Purchases of loans and leases totaled
$165.7 million
and
$141.4 million
during the years ended
September 30, 2018
and
2017
, respectively, and the Company did not purchase any loans during the year ended September 30, 2016. During the years ended
September 30, 2018
,
2017
and
2016
, the Company purchased MBS and other securities in the amount of
$653.2 million
,
$849.5 million
and
$902.9 million
, respectively. Of these purchases there were no securities designated as held to maturity in
2018
and
$0.9 million
and
$298.9 million
designated as held to maturity in
2017
and
2016
, respectively.
At
September 30, 2018
, the Company had unfunded loan and lease commitments of
$748.8 million
. See Note 14 to the “Notes to Consolidated Financial Statements,” which is included in Part II, Item 8 “Financial Statements and Supplementary Data” of this Annual Report on Form 10-K. Certificates of deposit scheduled to mature in one year or less at
September 30, 2018
totaled
$1.56 billion
, of which $1.32 billion were wholesale time deposits and $246.4 million were non-wholesale time deposits. Management believes that loan repayment and other sources of funds will be adequate to meet the Company’s foreseeable short- and long-term liquidity needs.
93
The following table summarizes the Company’s significant contractual obligations at
September 30, 2018
(dollars in thousands)
|
Contractual Obligations
|
Total
|
Less than 1 year
|
1 to 3 years
|
3 to 5 years
|
More than 5 years
|
||||||||||||||
|
Time deposits
|
$
|
276,180
|
|
$
|
246,357
|
|
$
|
25,945
|
|
$
|
3,878
|
|
$
|
—
|
|
||||
|
Wholesale time deposits
|
1,436,802
|
|
1,316,444
|
|
116,259
|
|
4,099
|
|
—
|
|
|||||||||
|
Long-term debt
|
88,963
|
|
—
|
|
150
|
|
169
|
|
88,644
|
|
|||||||||
|
Short-term debt
|
425,759
|
|
425,759
|
|
—
|
|
—
|
|
—
|
|
|||||||||
|
Operating leases
|
37,883
|
|
3,854
|
|
7,085
|
|
5,516
|
|
21,428
|
|
|||||||||
|
Data processing services
|
22,078
|
|
4,833
|
|
10,813
|
|
6,432
|
|
—
|
|
|||||||||
|
Total
|
$
|
2,287,665
|
|
$
|
1,997,247
|
|
$
|
160,252
|
|
$
|
20,094
|
|
$
|
110,072
|
|
||||
During July 2001, the Company’s unconsolidated trust subsidiary, First Midwest Financial Capital Trust I, sold $10.3 million in floating-rate cumulative preferred securities. Proceeds from the sale were used to purchase trust preferred securities of the Company, which mature in 2031, and are redeemable at any time after five years. The capital securities are required to be redeemed on July 25, 2031; however, the Company has the option to redeem them earlier. The Company used the proceeds for general corporate purposes.
In 2016, the Company completed a public offering of $75.0 million of its 5.75% fixed-to-floating rate subordinated debentures due August 15, 2026. Use of proceeds from the offering was for general purposes, acquisitions and investments in MetaBank as Tier 1 capital to support growth.
Through the Crestmark Acquisition, consummated in the fourth quarter of fiscal 2018, the Company acquired $3.4 million in floating rate capital securities due to Crestmark Capital Trust I, a 100%-owned nonconsolidated subsidiary of the company. The subordinated debentures bear interest at LIBOR plus 3.00%, have a stated maturity of 30 years and are redeemable by the Company at par, with regulatory approval. See Note 9 to the “Notes to Consolidated Financial Statements,” which is included in Part II, Item 8 “Financial Statements and Supplementary Data” of this Annual Report on Form 10-K.
The Company and the Bank met regulatory requirements for classification as well-capitalized institutions at
September 30, 2018
. See Note 13 to the “Notes to Consolidated Financial Statements,” which is included in Part II, Item 8 “Financial Statements and Supplementary Data” of this Annual Report on Form 10-K.
The payment of dividends and repurchase of shares have the effect of reducing stockholders’ equity. Prior to authorizing such transactions, the Board of Directors considers the effect the dividend or repurchase of shares would have on liquidity and regulatory capital ratios.
The Board of Directors approved a minimum management target, reflected in its capital plan, for the Bank to stay at or above an 8% Tier 1 capital to adjusted total assets ratio during fiscal 2018. Adjusted total assets are calculated based on a rolling six-month average basis.
Management and the Board of Directors are also mindful of new capital rules that will increase bank and holding company capital requirements and liquidity requirements. No assurance can be given that our regulators will consider our liquidity level, or our capital level, though substantially in excess of current rules pursuant to which we are considered “well-capitalized,” to be sufficiently high in the future.
Off-Balance Sheet Financing Arrangements
For discussion of the Company’s off-balance sheet financing arrangements, see Note 14 of “Notes to Consolidated Financial Statements,” which is included in Part II, Item 8 “Financial Statements and Supplementary Data” of this Annual Report on Form 10-K. Depending on the extent to which the commitments or contingencies described in Note 14 occur, the effect on the Company’s capital and net income could be significant.
94
Impact of Inflation and Changing Prices
The Consolidated Financial Statements and Notes thereto presented in this Annual Report have been prepared in accordance with GAAP, which require the measurement of financial position and operating results in terms of historical dollars without considering the change in the relative purchasing power of money over time due to inflation. The primary impact of inflation is reflected in the increased cost of the Company’s operations. Unlike most industrial companies, virtually all the assets and liabilities of the Company are monetary in nature. As a result, interest rates generally have a more significant impact on a financial institution’s performance than do the effects of general levels of inflation. Interest rates do not necessarily move in the same direction, or to the same extent, as the prices of goods and services. There have not been any material effects on Meta's business due to inflation during any of the last three fiscal years.
Impact of New Accounting Standards
See Note 1 to the Consolidated Financial Statements for information regarding recently issued accounting pronouncements.
Critical Accounting Policies
The Company’s financial statements are prepared in accordance with GAAP. The financial information contained within these financial statements is, to a significant extent, based on approximate measures of the financial effects of transactions and events that have already occurred. Management has identified the policies described below as Critical Accounting Policies. These policies involve complex and subjective decisions and assessments. Some of these estimates may be uncertain at the time they are made, could change from period to period, and could have a material impact on the financial statements.
Allowance for Loan and Lease Losses
The Company’s allowance for loan and lease losses methodology incorporates a variety of risk considerations, both quantitative and qualitative, in establishing an allowance for loan and lease losses that management believes is appropriate at each reporting date. Quantitative factors include the Company’s historical loss experience, delinquency and charge-off trends, collateral values, changes in non-performing loans and leases and other factors. Quantitative factors also incorporate known information about individual loans and leases, including borrowers’ sensitivity to interest rate movements. Qualitative factors include the general economic environment in the Company’s markets, including economic conditions throughout the Midwest and, in particular, the state of certain industries. Size and complexity of individual credits in relation to loan and lease structure, existing loan and lease policies and pace of portfolio growth are other qualitative factors that are considered in the methodology. Although management believes the levels of the allowance as of both
September 30, 2018
, and
September 30, 2017
, were adequate to absorb probable losses inherent in the loan and lease portfolio, a decline in local economic conditions or other factors could result in increasing losses.
Goodwill and Identifiable Intangible Assets
The Company accounts for business combinations under the acquisition method of accounting in accordance with ASC 805,
Business Combinations
. Under the acquisition method, the Company records assets acquired, including identifiable intangible assets, liabilities assumed, and any non-controlling interest in the acquired business at their fair values as of the acquisition date. Any acquisition-related transaction costs are expensed in the period incurred. Results of operations of the acquired entity are included in the Consolidated Statements of Operations from the date of acquisition. Any measurement-period adjustments are recorded in the period the adjustment is identified.
The excess of consideration paid over the fair value of the net assets acquired is recorded as goodwill. Determining the fair value of assets acquired, including identifiable intangible assets, liabilities assumed, and any non-controlling interest often requires the use of significant estimates and assumptions. This may involve estimates based on third-party valuations, such as appraisals, or internal valuations based on discounted cash flow analyses or other valuation techniques such as estimates of attrition, inflation, asset growth rates, discount rates, multiples of earnings or other relevant factors. In addition, the determination of the useful lives over which an intangible asset will be amortized is subjective. See Note 20 Goodwill and Intangibles to the Consolidated Financial Statements for further information.
95
As stated above, the Company derives a portion of its income from the excess of interest collected over interest paid. The rates of interest the Company earns on assets and pays on liabilities generally are established contractually for a period of time. Market interest rates change over time. Accordingly, the Company’s results of operations, like those of most financial institutions, are impacted by changes in interest rates and the interest rate sensitivity of its assets and liabilities. The risk associated with changes in interest rates and the Company’s ability to adapt to these changes is known as interest rate risk and is the Company’s only significant “market” risk.
The Company monitors and measures its exposure to changes in interest rates in order to comply with applicable government regulations and risk policies established by the Board of Directors, and in order to preserve stockholder value. In monitoring interest rate risk, the Company analyzes assets and liabilities based on characteristics including size, coupon rate, repricing frequency, maturity date and likelihood of prepayment.
If the Company’s assets mature or reprice more rapidly or to a greater extent than its liabilities, then economic value of equity and net interest income would tend to increase during periods of rising rates and decrease during periods of falling interest rates. Conversely, if the Company’s assets mature or reprice more slowly or to a lesser extent than its liabilities, then economic value of equity and net interest income would tend to decrease during periods of rising interest rates and increase during periods of falling interest rates.
The Company currently focuses lending efforts toward originating and purchasing competitively priced adjustable-rate and fixed-rate loan and lease products with short to intermediate terms to maturity, and may originate loans with terms longer than five years for borrowers that have a strong credit profile and typically lower loan-to-value ratios. This approach allows the Company to better maintain a portfolio of loans and leases that will have less sensitivity to changes in the level of interest rates, while providing a reasonable spread to the cost of liabilities used to fund the loans and leases.
The Company’s primary objective for its investment portfolio is to provide a source of liquidity for the Company. In addition, the investment portfolio may be used in the management of the Company’s interest rate risk profile. The investment policy generally calls for funds to be invested among various categories of security types and maturities based upon the Company’s need for liquidity, desire to achieve a proper balance between minimizing risk while maximizing yield, the need to provide collateral for borrowings and to fulfill the Company’s asset/liability management goals.
The Company’s cost of funds responds to changes in interest rates due to the relatively short-term nature of its deposit portfolio, and due to the relatively short-term nature of its borrowed funds. The Company believes that its growing portfolio of low-cost deposits provides a stable and profitable funding vehicle, but also subjects the Company to greater risk in a falling interest rate environment than it would otherwise have without this portfolio. This risk is due to the fact that, while asset yields may decrease in a falling interest rate environment, the Company cannot significantly reduce interest costs associated with these deposits, which thereby compresses the Company’s net interest margin. As a result of the Company’s interest rate risk exposure in this regard, the Company has elected not to enter into any new longer-term wholesale borrowings.
The Board of Directors and relevant government regulations establish limits on the level of acceptable interest rate risk at the Company, to which management adheres. There can be no assurance, however, that, in the event of an adverse change in interest rates, the Company’s efforts to limit interest rate risk will be successful.
Interest Rate Risk (“IRR”)
Overview
The Company actively
manages interest rate risk, as changes in market interest rates can have a significant impact on reported earnings. The Bank, like other financial institutions, is subject to interest rate risk to the extent that its interest-bearing liabilities mature or reprice more rapidly than its interest-earning assets. The interest rate risk process is designed to compare income simulations in market scenarios designed to alter the direction, magnitude and speed of interest rate changes, as well as the slope of the yield curve. The Company does not currently engage in trading activities to control interest rate risk although it may do so in the future, if deemed necessary, to help manage interest rate risk.
96
Earnings at risk and economic value analysis
As a continuing part of its financial strategy, the Bank considers methods of managing an asset/liability mismatch consistent with maintaining acceptable levels of net interest income. In order to monitor interest rate risk, the Board of Directors has created an Investment Committee whose principal responsibilities are to assess the Bank’s asset/liability mix and implement strategies that will enhance income while managing the Bank’s vulnerability to changes in interest rates.
The Company uses two approaches to model interest rate risk: Earnings at Risk (“EAR analysis”) and Economic Value of Equity (“EVE analysis”). Under EAR analysis, net interest income is calculated for each interest rate scenario to the net interest income forecast in the base case. EAR analysis measures the sensitivity of interest-sensitive earnings over a one-year minimum time horizon. The results are affected by projected rates, prepayments, caps and floors. Management exercises its best judgment in making assumptions regarding events that management can influence, such as non-contractual deposit re-pricing, as well as events outside of management's control, such as customer behavior on lending and deposit activity and the effect that competition has on both lending and deposit pricing. These assumptions are subjective and, as a result, net interest income simulation results will differ from actual results due to the timing, magnitude and frequency of interest rate changes, changes in market conditions, customer behavior and management strategies, among other factors. We perform various sensitivity analyses on assumptions of deposit attrition and deposit re-pricing. Market-implied forward rates and various likely and extreme interest rate scenarios can be used for EAR analysis. These likely and extreme scenarios can include rapid and gradual interest rate ramps, rate shocks and yield curve twists.
The EAR analysis used in the following table reflects the required analysis used no less than quarterly by management. It models -100, +100, +200, +300 and +400 basis point parallel shifts in market interest rates over the next one-year period. Due to the current low level of interest rates, only a ‑100 basis point parallel shift is represented.
The Company is within Board approved policy limits for all interest rate scenarios using the snapshot as of
September 30, 2018
. The tables below show the results of the scenarios as of
September 30, 2018
and 2017:
Net Sensitive Earnings at Risk
|
Net Sensitive Earnings at Risk
|
||||||||||||||
|
Balances as of September 30, 2018
|
Standard (Parallel Shift) Year 1
|
|||||||||||||
|
|
Net Interest Income at Risk%
|
|||||||||||||
|
|
-100
|
+100
|
+200
|
+300
|
+400
|
|||||||||
|
Percent Change Scenario
|
-3.0
|
%
|
2.6
|
%
|
5.1
|
%
|
7.4
|
%
|
9.9
|
%
|
||||
|
Board Policy Limits
|
-8.0
|
%
|
-8.0
|
%
|
-10.0
|
%
|
-15.0
|
%
|
-20.0
|
%
|
||||
|
Net Sensitive Earnings at Risk
|
||||||||||||||
|
Balances as of September 30, 2017
|
Standard (Parallel Shift) Year 1
|
|||||||||||||
|
|
Net Interest Income at Risk%
|
|||||||||||||
|
|
-100
|
+100
|
+200
|
+300
|
+400
|
|||||||||
|
Percent Change Scenario
|
-6.6
|
%
|
3.7
|
%
|
6.0
|
%
|
8.4
|
%
|
10.9
|
%
|
||||
|
Board Policy Limits
|
-8.0
|
%
|
-8.0
|
%
|
-10.0
|
%
|
-15.0
|
%
|
-20.0
|
%
|
||||
The EAR analysis reported at
September 30, 2018
, shows that in an increasing +100, +200, +300, and +400 interest rate environment, more assets than liabilities will reprice over the modeled one-year period.
97
IRR is a snapshot in time. The Company’s business and deposits are very predictably cyclical on a weekly, monthly and yearly basis. The Company’s static IRR results could vary depending on which day of the week and timing in relation to certain payrolls, as well as time of the month in regard to early funding of certain programs, when this snapshot is taken. The Company’s overnight federal funds purchased fluctuates on a predictable daily and monthly basis due to fluctuations in a portion of its non-interest bearing deposit base, primarily related to payroll processing and timing of when certain programs are prefunded and when the funds are received. Owing to the snapshot nature of IRR, as is required by regulators, in concert with the Company’s predictable weekly, monthly and yearly fluctuating deposit base and overnight borrowings, the results produced by static IRR analysis are not necessarily representative of what management, the Board of Directors and others would view as the Company’s true IRR positioning. Management and the Board are aware of and understand these typical borrowing and deposit fluctuations as well as the point in time nature of IRR analysis and anticipated an outcome where the Company may temporarily be outside of Board policy limits based on a snapshot analysis.
For management to better understand the IRR position of the Bank, an alternative IRR run was completed, for which all
September 30, 2018
, values were utilized with the exception of overnight borrowings, non-interest bearing deposits, brokered deposits, cash due from banks, non-earning assets, and non-paying liabilities. To diminish potential issues documented above, quarterly average balances were utilized for overnight borrowings, non-interest-bearing deposits, brokered deposits and cash due from banks. Non-earning assets and non-paying liabilities were used to balance the balance sheet. Management believes this view on IRR, while still subject to some yearly cyclicality, more accurately portrays the Bank's IRR position. As noted in the below chart, the alternative EAR results are more normalized and slightly improved in the -100 interest rate shock compared to the static results, as reduced time deposits were offset by higher overnight borrowings and non-interest bearing deposits.
The Company would be within policy limits in all scenarios utilizing the alternative IRR scenario run for management purposes. The tables below highlight those results for
September 30, 2018
and 2017.
Alternative Net Sensitive Earnings at Risk
|
Net Sensitive Earnings at Risk
|
||||||||||||||
|
Balances as of September 30, 2018
|
Standard (Parallel Shift) Year 1
|
|||||||||||||
|
Alternative IRR Results
|
Net Interest Income at Risk%
|
|||||||||||||
|
|
-100
|
+100
|
+200
|
+300
|
+400
|
|||||||||
|
Percent Change Scenario
|
-2.8
|
%
|
2.4
|
%
|
4.7
|
%
|
6.9
|
%
|
9.1
|
%
|
||||
|
Board Policy Limits
|
-8.0
|
%
|
-8.0
|
%
|
-10.0
|
%
|
-15.0
|
%
|
-20.0
|
%
|
||||
|
Net Sensitive Earnings at Risk
|
||||||||||||||
|
Balances as of September 30, 2017
|
Standard (Parallel Shift) Year 1
|
|||||||||||||
|
Alternative IRR Results
|
Net Interest Income at Risk%
|
|||||||||||||
|
|
-100
|
+100
|
+200
|
+300
|
+400
|
|||||||||
|
Percent Change Scenario
|
-1.8
|
%
|
3.4
|
%
|
5.4
|
%
|
5.7
|
%
|
6.3
|
%
|
||||
|
Board Policy Limits
|
-8.0
|
%
|
-8.0
|
%
|
-10.0
|
%
|
-15.0
|
%
|
-20.0
|
%
|
||||
The alternative EAR analysis reported at
September 30, 2018
shows that in an increasing +100, +200, +300, and +400 interest rate environment, more assets than liabilities will reprice over the modeled one-year period.
98
Net Sensitive Earnings at Risk as of
September 30, 2018
|
Balances as of September 30, 2018
|
% of
|
Change in Interest Income/Expense
for a given change in interest rates
|
|||||||||||||||||||||
|
|
Total Earning
|
Total Earning
|
Over / (Under) Base Case Parallel Shift
|
||||||||||||||||||||
|
Basis Point Change Scenario
|
Assets (in $000's)
|
Assets
|
-100
|
Base
|
+100
|
+200
|
+300
|
+400
|
|||||||||||||||
|
Total Loans and Leases
|
2,956,859
|
|
59.1
|
%
|
203,530
|
|
219,768
|
|
236,756
|
|
253,706
|
|
270,537
|
|
287,470
|
|
|||||||
|
Total Investments (non-TEY) and other Earning Assets
|
2,046,476
|
|
40.9
|
%
|
63,908
|
|
70,074
|
|
74,881
|
|
79,446
|
|
83,957
|
|
88,504
|
|
|||||||
|
Total Interest -Sensitive Income
|
5,003,335
|
|
100.0
|
%
|
267,438
|
|
289,843
|
|
311,637
|
|
333,151
|
|
354,494
|
|
375,974
|
|
|||||||
|
Total Interest-Bearing Deposits
|
2,025,564
|
|
82.6
|
%
|
30,676
|
|
41,654
|
|
52,971
|
|
64,288
|
|
75,606
|
|
86,923
|
|
|||||||
|
Total Borrowings
|
427,570
|
|
17.4
|
%
|
6,413
|
|
10,749
|
|
15,086
|
|
19,424
|
|
23,764
|
|
28,106
|
|
|||||||
|
Total Interest-Sensitive Expense
|
2,453,134
|
|
100.0
|
%
|
37,089
|
|
52,403
|
|
68,057
|
|
83,713
|
|
99,370
|
|
115,029
|
|
|||||||
Alternative Net Sensitive Earnings at Risk
|
Alternative IRR Results
|
% of
|
Change in Interest Income/Expense
for a given change in interest rates
|
|||||||||||||||||||||
|
|
Total Earning
|
Total Earning
|
Over / (Under) Base Case Parallel Shift
|
||||||||||||||||||||
|
Basis Point Change Scenario
|
Assets (in $000's)
|
Assets
|
-100
|
Base
|
+100
|
+200
|
+300
|
+400
|
|||||||||||||||
|
Total Loans and Leases
|
2,965,747
|
|
59.2
|
%
|
203,529
|
|
219,767
|
|
236,754
|
|
253,704
|
|
270,535
|
|
287,468
|
|
|||||||
|
Total Investments (non-TEY) and other Earning Assets
|
2,047,752
|
|
40.8
|
%
|
64,005
|
|
70,230
|
|
75,101
|
|
79,734
|
|
84,325
|
|
88,955
|
|
|||||||
|
Total Interest -Sensitive Income
|
5,013,499
|
|
100.0
|
%
|
267,534
|
|
289,997
|
|
311,855
|
|
333,438
|
|
354,860
|
|
376,423
|
|
|||||||
|
Total Interest-Bearing Deposits
|
1,997,117
|
|
80.3
|
%
|
30,533
|
|
41,403
|
|
52,613
|
|
63,823
|
|
75,033
|
|
86,243
|
|
|||||||
|
Total Borrowings
|
488,703
|
|
19.7
|
%
|
7,333
|
|
12,334
|
|
17,341
|
|
22,355
|
|
27,382
|
|
32,415
|
|
|||||||
|
Total Interest-Sensitive Expense
|
2,485,820
|
|
100.0
|
%
|
37,866
|
|
53,737
|
|
69,955
|
|
86,178
|
|
102,415
|
|
118,658
|
|
|||||||
The Company believes that its growing portfolio of non-interest bearing deposits provides a stable and profitable funding vehicle and a significant competitive advantage in a rising interest rate environment as the Company’s cost of funds will likely remain relatively low, with less increase expected relative to other banks.
Under EVE analysis, the economic value of financial assets, liabilities and off-balance sheet instruments is derived under each rate scenario. The economic value of equity is calculated as the difference between the estimated market value of assets and liabilities, net of the impact of off-balance sheet instruments.
The EVE analysis used in the following table reflects the required analysis used no less than quarterly by management. It models immediate -100, +100, +200, 300 and +400 basis point parallel shifts in market interest rates. Due to the current low level of interest rates, only a -100 basis point parallel shift is represented.
99
The Company is within Board policy limits for all scenarios. The tables below show the results of the scenario as of
September 30, 2018
and 2017:
Economic Value Sensitivity
|
Balances as of September 30, 2018
|
Standard (Parallel Shift)
|
|||||||||||||
|
|
Economic Value of Equity at Risk%
|
|||||||||||||
|
|
-100
|
+100
|
+200
|
+300
|
+400
|
|||||||||
|
Percent Change Scenario
|
0.6
|
%
|
-2.6
|
%
|
-6.0
|
%
|
-9.8
|
%
|
-12.3
|
%
|
||||
|
Board Policy Limits
|
-10.0
|
%
|
-10.0
|
%
|
-20.0
|
%
|
-30.0
|
%
|
-40.0
|
%
|
||||
|
Balances as of September 30, 2017
|
Standard (Parallel Shift)
|
|||||||||||||
|
|
Economic Value of Equity at Risk%
|
|||||||||||||
|
|
-100
|
+100
|
+200
|
+300
|
+400
|
|||||||||
|
Percent Change Scenario
|
-3.2
|
%
|
-0.8
|
%
|
-3.8
|
%
|
-7.8
|
%
|
-10.7
|
%
|
||||
|
Board Policy Limits
|
-10.0
|
%
|
-10.0
|
%
|
-20.0
|
%
|
-30.0
|
%
|
-40.0
|
%
|
||||
The EVE at risk reported at
September 30, 2018
, shows that as interest rates increase immediately, the economic value of equity position will decrease from the base, partially due to the degree of the economic value of its base asset size in relation to the economic value of its base liabilities.
The Company would be within policy limits in all scenarios utilizing the alternative IRR scenario run for management purposes. The tables below highlight those results for
September 30, 2018
and 2017:
Alternative Economic Value Sensitivity
|
Balances as of September 30, 2018
|
Standard (Parallel Shift)
|
|||||||||||||
|
Alternative IRR Results
|
Economic Value of Equity at Risk%
|
|||||||||||||
|
|
-100
|
+100
|
+200
|
+300
|
+400
|
|||||||||
|
Percent Change Scenario
|
0.4
|
%
|
-2.4
|
%
|
-5.5
|
%
|
-9.2
|
%
|
-11.5
|
%
|
||||
|
Board Policy Limits
|
-10.0
|
%
|
-10.0
|
%
|
-20.0
|
%
|
-30.0
|
%
|
-40.0
|
%
|
||||
|
Balances as of September 30, 2017
|
Standard (Parallel Shift)
|
|||||||||||||
|
Alternative IRR Results
|
Economic Value of Equity at Risk%
|
|||||||||||||
|
|
-100
|
+100
|
+200
|
+300
|
+400
|
|||||||||
|
Percent Change Scenario
|
-2.2
|
%
|
-1.9
|
%
|
-6.0
|
%
|
-10.9
|
%
|
-14.7
|
%
|
||||
|
Board Policy Limits
|
-10.0
|
%
|
-10.0
|
%
|
-20.0
|
%
|
-30.0
|
%
|
-40.0
|
%
|
||||
The EVE at risk reported using the alternative methodology used for management purposes shows that as interest rates increase immediately, the economic value of equity position will decrease from the base, partially due to the degree of the economic value of its base asset size in relation to the economic value of its base liabilities.
Detailed Economic Value Sensitivity as of
September 30, 2018
The following table details the economic value sensitivity to changes in market interest rates at
September 30, 2018
, for loans and leases, investments, deposits, borrowings and other assets and liabilities (dollars in thousands).
100
|
Balances as of September 30, 2018
|
% of
|
Change in Economic Value
for a given change in interest rates
|
||||||||||||||||||
|
|
Book
|
Total
|
Over / (Under) Base Case Parallel Shift
|
|||||||||||||||||
|
Basis Point Change Scenario
|
Value (in $000's)
|
Assets
|
-100
|
+100
|
+200
|
+300
|
+400
|
|||||||||||||
|
Total Loans and Leases
|
2,956,859
|
|
51
|
%
|
1.3
|
%
|
-1.3
|
%
|
-2.5
|
%
|
-3.7
|
%
|
-4.8
|
%
|
||||||
|
Total Investment
|
2,043,919
|
|
35
|
%
|
4.2
|
%
|
-4.9
|
%
|
-9.9
|
%
|
-14.8
|
%
|
-18.7
|
%
|
||||||
|
Other Assets
|
820,355
|
|
14
|
%
|
—
|
%
|
—
|
%
|
—
|
%
|
—
|
%
|
—
|
%
|
||||||
|
Assets
|
5,821,133
|
|
100
|
%
|
2.1
|
%
|
-2.4
|
%
|
-4.7
|
%
|
-7.1
|
%
|
-9.0
|
%
|
||||||
|
Interest Bearing Deposits
|
2,025,564
|
|
41
|
%
|
0.8
|
%
|
-0.8
|
%
|
-1.5
|
%
|
-2.2
|
%
|
-2.9
|
%
|
||||||
|
Non-Interest Bearing Deposits
|
2,420,142
|
|
48
|
%
|
5.0
|
%
|
-4.5
|
%
|
-8.5
|
%
|
-12.2
|
%
|
-15.6
|
%
|
||||||
|
Total Borrowings & Other Liabilities
|
552,212
|
|
11
|
%
|
—
|
%
|
—
|
%
|
—
|
%
|
—
|
%
|
—
|
%
|
||||||
|
Liabilities
|
4,997,918
|
|
100
|
%
|
2.5
|
%
|
-2.3
|
%
|
-4.4
|
%
|
-6.3
|
%
|
-8.1
|
%
|
||||||
Detailed Alternative Economic Value Sensitivity
The following is EVE at risk reported using the alternative methodology used for management purposes, for loans and leases, investments, deposits, borrowings, and other assets and liabilities (dollars in thousands). The analysis reflects the more evenly matched changes in value of the Bank’s non-interest bearing deposit base under a rising rate environment relative to changes in value observed in total investments.
|
Alternative IRR Results
|
% of
|
Change in Economic Value
for a given change in interest rates
|
||||||||||||||||||
|
Economic Value Sensitivity
|
Book
|
Total
|
Over / (Under) Base Case Parallel Shift
|
|||||||||||||||||
|
Basis Point Change Scenario
|
Value (in $000's)
|
Assets
|
-100
|
+100
|
+200
|
+300
|
+400
|
|||||||||||||
|
Total Loans and Leases
|
2,965,747
|
|
51
|
%
|
1.3
|
%
|
-1.3
|
%
|
-2.5
|
%
|
-3.7
|
%
|
-4.8
|
%
|
||||||
|
Total Investment
|
2,045,195
|
|
35
|
%
|
4.2
|
%
|
-4.9
|
%
|
-9.9
|
%
|
-14.8
|
%
|
-18.7
|
%
|
||||||
|
Other Assets
|
810,191
|
|
14
|
%
|
—
|
%
|
—
|
%
|
—
|
%
|
—
|
%
|
—
|
%
|
||||||
|
Assets
|
5,821,133
|
|
100
|
%
|
2.1
|
%
|
-2.4
|
%
|
-4.7
|
%
|
-7.1
|
%
|
-9.0
|
%
|
||||||
|
Interest Bearing Deposits
|
1,997,117
|
|
40
|
%
|
0.8
|
%
|
-0.7
|
%
|
-1.5
|
%
|
-2.1
|
%
|
-2.8
|
%
|
||||||
|
Non-Interest Bearing Deposits
|
2,489,611
|
|
50
|
%
|
5.0
|
%
|
-4.5
|
%
|
-8.6
|
%
|
-12.3
|
%
|
-15.7
|
%
|
||||||
|
Total Borrowings & Other Liabilities
|
511,190
|
|
10
|
%
|
—
|
%
|
—
|
%
|
—
|
%
|
—
|
%
|
—
|
%
|
||||||
|
Liabilities
|
4,997,918
|
|
100
|
%
|
2.6
|
%
|
-2.4
|
%
|
-4.5
|
%
|
-6.5
|
%
|
-8.3
|
%
|
||||||
Certain shortcomings are inherent in the method of analysis discussed above and as presented in the table. For example, although certain assets and liabilities may have similar maturities or periods to repricing, they may react in different degrees to changes in market interest rates. Also, the interest rates on certain types of assets and liabilities may fluctuate in advance of changes in market interest rates, while interest rates on other types may lag behind changes in market rates. Additionally, certain assets, such as adjustable rate mortgage loans, have features that restrict changes in interest rates on a short-term basis and over the life of the asset. Furthermore, although management has estimated changes in the levels of prepayments and early withdrawal in these rate environments, such levels would likely deviate from those assumed in calculating the table. Finally, the ability of some borrowers to service their debt may decrease in the event of an interest rate increase.
The above EAR and EVE measures do not include all actions that management may undertake to manage interest rate risk in response to anticipated changes in interest rates.
101
Table of Contents
|
Report of Independent Registered Public Accounting Firm
|
|
|
|
Consolidated Financial Statements
|
|
Statements of Financial Condition
|
|
Statements of Operations
|
|
Statements of Comprehensive Income
|
|
Statements of Changes in Stockholders’ Equity
|
|
Statements of Cash Flows
|
|
Notes to Consolidated Financial Statements
|
102
KPMG LLP
2500 Ruan Center
666 Grand Avenue
Des Moines, IA 50309
Report of Independent Registered Public Accounting Firm
The Board of Directors and Stockholders
Meta Financial Group, Inc.:
Opinion on the Consolidated
Financial Statements
We have audited the accompanying consolidated statements of financial condition of Meta Financial Group, Inc. and subsidiaries (the Company) as of September 30, 2018 and 2017, the related consolidated statements of operations, comprehensive income, changes in stockholders’ equity, and cash flows for each of the years in the three‑year period ended September 30, 2018, and the related notes (collectively, the consolidated financial statements). In our opinion, the consolidated financial statements present fairly, in all material respects, the financial position of the Company as of September 30, 2018 and 2017, and the results of its operations and its cash flows for each of the years in the three‑year period ended September 30, 2018, in conformity with U.S. generally accepted accounting principles.
We also have audited, in accordance with the standards of the Public Company Accounting Oversight Board (United States) (PCAOB), the Company’s internal control over financial reporting as of September 30, 2018, based on criteria established in
Internal Control - Integrated Framework (2013)
issued by the Committee of Sponsoring Organizations of the Treadway Commission, and our report dated November 29, 2018 expressed an unqualified opinion on the effectiveness of the Company’s internal control over financial reporting.
Basis for Opinion
These consolidated financial statements are the responsibility of the Company’s management. Our responsibility is to express an opinion on these consolidated financial statements based on our audits. We are a public accounting firm registered with the PCAOB and are required to be independent with respect to the Company in accordance with the U.S. federal securities laws and the applicable rules and regulations of the Securities and Exchange Commission and the PCAOB.
We conducted our audits in accordance with the standards of the PCAOB. Those standards require that we plan and perform the audit to obtain reasonable assurance about whether the consolidated financial statements are free of material misstatement, whether due to error or fraud. Our audits included performing procedures to assess the risks of material misstatement of the consolidated financial statements, whether due to error or fraud, and performing procedures that respond to those risks. Such procedures included examining, on a test basis, evidence regarding the amounts and disclosures in the consolidated financial statements. Our audits also included evaluating the accounting principles used and significant estimates made by management, as well as evaluating the overall presentation of the consolidated financial statements. We believe that our audits provide a reasonable basis for our opinion.
|
|
/s/ KPMG LLP
|
|
We have served as the Company’s auditor since 2008.
|
|
|
Des Moines, Iowa
|
|
|
November 29, 2018
|
|
103
META FINANCIAL GROUP, INC. AND SUBSIDIARIES
Consolidated Statements of Financial Condition
|
(Dollars in Thousands, Except Share and Per Share Data)
|
|||||||
|
ASSETS
|
September 30, 2018
|
September 30, 2017
|
|||||
|
Cash and cash equivalents
|
$
|
99,977
|
|
$
|
1,267,586
|
|
|
|
Investment securities available-for-sale
|
1,487,960
|
|
1,106,977
|
|
|||
|
Mortgage-backed securities available-for-sale
|
364,065
|
|
586,454
|
|
|||
|
Investment securities held to maturity
|
164,304
|
|
449,840
|
|
|||
|
Mortgage-backed securities held to maturity
|
7,850
|
|
113,689
|
|
|||
|
Loans held for sale
|
15,606
|
|
—
|
|
|||
|
Loans and leases receivable
|
2,944,739
|
|
1,325,371
|
|
|||
|
Allowance for loan and lease losses
|
(13,040
|
)
|
(7,534
|
)
|
|||
|
Federal Home Loan Bank stock, at cost
|
23,400
|
|
61,123
|
|
|||
|
Accrued interest receivable
|
22,016
|
|
19,380
|
|
|||
|
Premises, furniture, and equipment, net
|
40,458
|
|
19,320
|
|
|||
|
Rental equipment
|
107,290
|
|
—
|
|
|||
|
Bank-owned life insurance
|
87,293
|
|
84,702
|
|
|||
|
Foreclosed real estate and repossessed assets
|
31,638
|
|
292
|
|
|||
|
Goodwill
|
303,270
|
|
98,723
|
|
|||
|
Intangible assets
|
70,719
|
|
52,178
|
|
|||
|
Prepaid assets
|
27,906
|
|
28,392
|
|
|||
|
Deferred taxes
|
18,737
|
|
9,101
|
|
|||
|
Other assets
|
30,879
|
|
12,738
|
|
|||
|
Total assets
|
$
|
5,835,067
|
|
$
|
5,228,332
|
|
|
|
LIABILITIES AND STOCKHOLDERS’ EQUITY
|
|
|
|
|
|||
|
LIABILITIES
|
|
|
|
|
|||
|
Non-interest-bearing checking
|
$
|
2,405,274
|
|
$
|
2,454,057
|
|
|
|
Interest-bearing checking
|
111,587
|
|
67,294
|
|
|||
|
Savings deposits
|
54,765
|
|
53,505
|
|
|||
|
Money market deposits
|
51,995
|
|
48,758
|
|
|||
|
Time certificates of deposit
|
276,180
|
|
123,637
|
|
|||
|
Wholesale deposits
|
1,531,186
|
|
476,173
|
|
|||
|
Total deposits
|
4,430,987
|
|
3,223,424
|
|
|||
|
Short-term debt
|
425,759
|
|
1,404,534
|
|
|||
|
Long-term debt
|
88,963
|
|
85,533
|
|
|||
|
Accrued interest payable
|
7,794
|
|
2,280
|
|
|||
|
Accrued expenses and other liabilities
|
133,838
|
|
78,065
|
|
|||
|
Total liabilities
|
5,087,341
|
|
4,793,836
|
|
|||
|
STOCKHOLDERS’ EQUITY
|
|
|
|
|
|||
|
Preferred stock, 3,000,000 shares authorized, no shares issued or outstanding at September 30, 2018 and 2017, respectively
|
—
|
|
—
|
|
|||
|
Common stock, $.01 par value; 90,000,000 and 45,000,000 shares authorized, 39,192,063 and 28,871,621 shares issued, and 39,167,280 and 28,867,785 shares outstanding at September 30, 2018 and 2017, respectively
(1)
|
393
|
|
288
|
|
|||
|
Common stock, Nonvoting, $.01 par value; 3,000,000 shares authorized, no shares issued or outstanding at September 30, 2018 and 2017, respectively
|
—
|
|
—
|
|
|||
|
Additional paid-in capital
|
565,811
|
|
258,144
|
|
|||
|
Retained earnings
|
213,048
|
|
167,164
|
|
|||
|
Accumulated other comprehensive (loss) income
|
(33,111
|
)
|
9,166
|
|
|||
|
Treasury stock, at cost, 24,783 and 3,836 common shares at September 30, 2018 and 2017, respectively
|
(1,989
|
)
|
(266
|
)
|
|||
|
Total equity attributable to parent
|
744,152
|
|
434,496
|
|
|||
|
Non-controlling interest
|
3,574
|
|
—
|
|
|||
|
Total stockholders' equity
|
747,726
|
|
434,496
|
|
|||
|
Total liabilities and stockholders’ equity
|
$
|
5,835,067
|
|
$
|
5,228,332
|
|
|
(1)
All share and per share data for all periods presented has been adjusted to reflect the 3-for-1 forward stock split of the Company's common stock effected by the Company on October 4, 2018.
See Notes to Consolidated Financial Statements.
104
META FINANCIAL GROUP, INC. AND SUBSIDIARIES
|
|
For the Years Ended September 30,
|
||||||||||
|
(Dollars in Thousands, Except Share and Per Share Data)
|
2018
|
2017
|
2016
|
||||||||
|
Interest and dividend income:
|
|||||||||||
|
Loans and leases, including fees
|
$
|
98,475
|
|
$
|
52,117
|
|
$
|
36,187
|
|
||
|
Mortgage-backed securities
|
15,479
|
|
16,571
|
|
15,771
|
|
|||||
|
Other investments
|
44,580
|
|
39,415
|
|
29,438
|
|
|||||
|
|
158,534
|
|
108,103
|
|
81,396
|
|
|||||
|
Interest expense:
|
|
|
|||||||||
|
Deposits
|
15,163
|
|
6,051
|
|
614
|
|
|||||
|
FHLB advances and other borrowings
|
12,822
|
|
8,822
|
|
3,477
|
|
|||||
|
|
27,985
|
|
14,873
|
|
4,091
|
|
|||||
|
Net interest income
|
130,549
|
|
93,230
|
|
77,305
|
|
|||||
|
Provision for loan and lease losses
|
29,432
|
|
10,589
|
|
4,605
|
|
|||||
|
Net interest income after provision for loan and lease losses
|
101,117
|
|
82,641
|
|
72,700
|
|
|||||
|
Non-interest income:
|
|
|
|||||||||
|
Refund transfer product fees
|
41,879
|
|
38,956
|
|
23,347
|
|
|||||
|
Tax advance product fees
|
35,703
|
|
31,913
|
|
1,575
|
|
|||||
|
Card fees
|
94,446
|
|
94,707
|
|
70,533
|
|
|||||
|
Rental income
|
7,333
|
|
—
|
|
—
|
|
|||||
|
Loan and lease fees
|
4,470
|
|
3,882
|
|
3,374
|
|
|||||
|
Bank-owned life insurance income
|
2,590
|
|
2,216
|
|
1,656
|
|
|||||
|
Deposit fees
|
4,451
|
|
736
|
|
603
|
|
|||||
|
Loss on sale of securities, net (Includes ($8,177), ($493), and ($326) reclassified from accumulated other comprehensive income (loss) for net losses on available for sale securities for the fiscal years ended September 30, 2018, 2017 and 2016, respectively)
|
(8,177
|
)
|
(493
|
)
|
(326
|
)
|
|||||
|
Gain on sale of loans and leases
|
355
|
|
—
|
|
—
|
|
|||||
|
Loss on foreclosed real estate
|
(19
|
)
|
(6
|
)
|
—
|
|
|||||
|
Other income
|
1,494
|
|
261
|
|
8
|
|
|||||
|
Total non-interest income
|
184,525
|
|
172,172
|
|
100,770
|
|
|||||
|
Non-interest expense:
|
|
|
|
|
|
|
|||||
|
Compensation and benefits
|
109,044
|
|
88,728
|
|
61,675
|
|
|||||
|
Refund transfer product expense
|
11,750
|
|
11,885
|
|
8,648
|
|
|||||
|
Tax advance product expense
|
1,817
|
|
3,241
|
|
—
|
|
|||||
|
Card processing expense
|
26,283
|
|
24,130
|
|
22,263
|
|
|||||
|
Occupancy and equipment expense
|
19,740
|
|
16,465
|
|
13,999
|
|
|||||
|
Operating lease equipment depreciation expense
|
5,386
|
|
—
|
|
—
|
|
|||||
|
Legal and consulting expense
|
15,064
|
|
8,384
|
|
4,824
|
|
|||||
|
Marketing
|
2,674
|
|
2,117
|
|
1,972
|
|
|||||
|
Data processing expense
|
1,226
|
|
1,449
|
|
1,334
|
|
|||||
|
Amortization expense
|
9,641
|
|
12,362
|
|
4,828
|
|
|||||
|
Intangible impairment
|
18
|
|
10,248
|
|
—
|
|
|||||
|
Other expense
|
25,589
|
|
20,654
|
|
15,105
|
|
|||||
|
Total non-interest expense
|
228,232
|
|
199,663
|
|
134,648
|
|
|||||
|
Income before income tax expense
|
57,410
|
|
55,150
|
|
38,822
|
|
|||||
|
Income tax expense (Includes ($2,330), ($185), and ($118) income tax benefit reclassified from accumulated other comprehensive income (loss) for the fiscal years ended September 30, 2018, 2017 and 2016, respectively)
|
5,117
|
|
10,233
|
|
5,602
|
|
|||||
|
Net income before non-controlling interest
|
52,293
|
|
44,917
|
|
33,220
|
|
|||||
|
Net income attributable to non-controlling interest
|
673
|
|
—
|
|
—
|
|
|||||
|
Net income attributable to parent
|
$
|
51,620
|
|
$
|
44,917
|
|
$
|
33,220
|
|
||
|
Earnings per common share
(1)
:
|
|
|
|
|
|
|
|||||
|
Basic
|
$
|
1.68
|
|
$
|
1.62
|
|
$
|
1.31
|
|
||
|
Diluted
|
$
|
1.67
|
|
$
|
1.61
|
|
$
|
1.30
|
|
||
(1)
All share and per share data for all periods presented has been adjusted to reflect the 3-for-1 forward stock split of the Company's common stock effected by the Company on October 4, 2018.
105
META FINANCIAL GROUP, INC. AND SUBSIDIARIES
Consolidated Statements of Comprehensive Income
|
|
For Years Ended September 30,
|
||||||||||
|
(Dollars in Thousands)
|
2018
|
2017
|
2016
|
||||||||
|
Net income before non-controlling interests
|
$
|
52,293
|
|
$
|
44,917
|
|
$
|
33,220
|
|
||
|
Other comprehensive income:
|
|
|
|
|
|
|
|||||
|
Change in net unrealized (loss) gain on securities
|
(66,053
|
)
|
(21,661
|
)
|
31,965
|
|
|||||
|
Losses realized in net income
|
8,177
|
|
493
|
|
326
|
|
|||||
|
|
(57,876
|
)
|
(21,168
|
)
|
32,291
|
|
|||||
|
Deferred income tax effect
|
(15,596
|
)
|
(7,414
|
)
|
11,826
|
|
|||||
|
Unrealized gains on currency translation
|
3
|
|
—
|
|
—
|
|
|||||
|
Total other comprehensive loss income
|
(42,277
|
)
|
(13,754
|
)
|
20,465
|
|
|||||
|
Total comprehensive income
|
10,016
|
|
31,163
|
|
53,685
|
|
|||||
|
Total comprehensive income attributable to non-controlling interest
|
673
|
|
—
|
|
—
|
|
|||||
|
Comprehensive income attributable to parent
|
$
|
9,343
|
|
$
|
31,163
|
|
$
|
53,685
|
|
||
See Notes to Consolidated Financial Statements.
106
META FINANCIAL GROUP, INC. AND SUBSIDIARIES
Consolidated Statements of Changes in Stockholders' Equity
For the Years Ended
September 30, 2016
,
2017
and
2018
All share and per share data for all periods presented in the following table has been adjusted to reflect the 3-for-1 forward stock split of the Company's common stock effected by the Company on October 4, 2018.
|
Meta Financial Group Stockholder's Equity
|
|||||||||||||||||||||||||||||||
|
(Dollars in Thousands, Except Share and Per Share Data)
|
Common
Stock
|
Additional
Paid-in
Capital
|
Retained
Earnings
|
Accumulated
Other
Comprehensive
Income (Loss),
Net of Tax
|
Treasury
Stock
|
Total Meta
Stockholders’
Equity
|
Non-controlling Interest
|
Total Equity
|
|||||||||||||||||||||||
|
Balance, September 30, 2015
|
$
|
245
|
|
$
|
170,586
|
|
$
|
98,359
|
|
$
|
2,455
|
|
$
|
(310
|
)
|
$
|
271,335
|
|
$
|
—
|
|
$
|
271,335
|
|
|||||||
|
Cash dividends declared on common stock ($0.17 per share)
|
—
|
|
—
|
|
(4,389
|
)
|
—
|
|
—
|
|
(4,389
|
)
|
—
|
|
(4,389
|
)
|
|||||||||||||||
|
Issuance of common shares from the sales of equity securities
|
8
|
|
11,493
|
|
—
|
|
—
|
|
—
|
|
11,501
|
|
—
|
|
11,501
|
|
|||||||||||||||
|
Issuance of common shares due to issuance of stock options and restricted stock
|
2
|
|
2,045
|
|
—
|
|
—
|
|
310
|
|
2,357
|
|
—
|
|
2,357
|
|
|||||||||||||||
|
Stock compensation
|
—
|
|
486
|
|
—
|
|
—
|
|
—
|
|
486
|
|
—
|
|
486
|
|
|||||||||||||||
|
Net change in unrealized gains (losses) on securities, net of income taxes
|
—
|
|
—
|
|
—
|
|
20,465
|
|
—
|
|
20,465
|
|
—
|
|
20,465
|
|
|||||||||||||||
|
Net income
|
—
|
|
—
|
|
33,220
|
|
—
|
|
—
|
|
33,220
|
|
—
|
|
33,220
|
|
|||||||||||||||
|
Balance, September 30, 2016
|
$
|
255
|
|
$
|
184,610
|
|
$
|
127,190
|
|
$
|
22,920
|
|
$
|
—
|
|
$
|
334,975
|
|
$
|
—
|
|
$
|
334,975
|
|
|||||||
|
Balance, September 30, 2016
|
$
|
255
|
|
$
|
184,610
|
|
$
|
127,190
|
|
$
|
22,920
|
|
$
|
—
|
|
$
|
334,975
|
|
$
|
—
|
|
$
|
334,975
|
|
|||||||
|
Adoption of Accounting Standards Update 2016-09
|
—
|
|
104
|
|
(104
|
)
|
—
|
|
—
|
|
—
|
|
—
|
|
—
|
|
|||||||||||||||
|
Cash dividends declared on common stock ($0.17 per share)
|
—
|
|
—
|
|
(4,839
|
)
|
—
|
|
—
|
|
(4,839
|
)
|
—
|
|
(4,839
|
)
|
|||||||||||||||
|
Issuance of common shares due to exercise of stock options
|
—
|
|
650
|
|
—
|
|
—
|
|
—
|
|
650
|
|
—
|
|
650
|
|
|||||||||||||||
|
Issuance of common shares due to restricted stock
|
12
|
|
—
|
|
—
|
|
—
|
|
—
|
|
12
|
|
—
|
|
12
|
|
|||||||||||||||
|
Issuance of common shares due to ESOP
|
—
|
|
1,174
|
|
—
|
|
—
|
|
—
|
|
1,174
|
|
—
|
|
1,174
|
|
|||||||||||||||
|
Issuance of common shares due to acquisition
|
21
|
|
37,275
|
|
—
|
|
—
|
|
—
|
|
37,296
|
|
—
|
|
37,296
|
|
|||||||||||||||
|
Contingent consideration equity earnout due to acquisition
|
—
|
|
24,142
|
|
—
|
|
—
|
|
—
|
|
24,142
|
|
—
|
|
24,142
|
|
|||||||||||||||
|
Shares repurchased for tax withholdings on stock compensation
|
—
|
|
(204
|
)
|
—
|
|
—
|
|
(266
|
)
|
(470
|
)
|
—
|
|
(470
|
)
|
|||||||||||||||
|
Stock compensation
|
—
|
|
10,393
|
|
—
|
|
—
|
|
—
|
|
10,393
|
|
—
|
|
10,393
|
|
|||||||||||||||
|
Net change in unrealized losses on securities, net of income taxes
|
—
|
|
—
|
|
—
|
|
(13,754
|
)
|
—
|
|
(13,754
|
)
|
—
|
|
(13,754
|
)
|
|||||||||||||||
|
Net income
|
—
|
|
—
|
|
44,917
|
|
—
|
|
—
|
|
44,917
|
|
—
|
|
44,917
|
|
|||||||||||||||
|
Balance, September 30, 2017
|
$
|
288
|
|
$
|
258,144
|
|
$
|
167,164
|
|
$
|
9,166
|
|
$
|
(266
|
)
|
$
|
434,496
|
|
$
|
—
|
|
$
|
434,496
|
|
|||||||
|
Balance, September 30, 2017
|
$
|
288
|
|
$
|
258,144
|
|
$
|
167,164
|
|
$
|
9,166
|
|
$
|
(266
|
)
|
$
|
434,496
|
|
$
|
—
|
|
$
|
434,496
|
|
|||||||
|
Cash dividends declared on common stock ($0.18 per share)
|
—
|
|
—
|
|
(5,736
|
)
|
—
|
|
—
|
|
(5,736
|
)
|
—
|
|
(5,736
|
)
|
|||||||||||||||
|
Issuance of common shares due to exercise of stock options
|
1
|
|
147
|
|
—
|
|
—
|
|
—
|
|
148
|
|
—
|
|
148
|
|
|||||||||||||||
|
Issuance of common shares due to restricted stock
|
4
|
|
—
|
|
—
|
|
—
|
|
—
|
|
4
|
|
—
|
|
4
|
|
|||||||||||||||
|
Issuance of common shares due to ESOP
|
1
|
|
1,605
|
|
—
|
|
—
|
|
—
|
|
1,606
|
|
—
|
|
1,606
|
|
|||||||||||||||
|
Issuance of common shares due to acquisition
|
99
|
|
295,667
|
|
—
|
|
—
|
|
—
|
|
295,766
|
|
—
|
|
295,766
|
|
|||||||||||||||
|
Shares repurchased for tax withholdings on stock compensation
|
—
|
|
(875
|
)
|
—
|
|
(1,723
|
)
|
(2,598
|
)
|
—
|
|
(2,598
|
)
|
|||||||||||||||||
|
Stock compensation
|
—
|
|
11,123
|
|
—
|
|
—
|
|
—
|
|
11,123
|
|
—
|
|
11,123
|
|
|||||||||||||||
|
Net change in unrealized losses on securities, net of income taxes
|
—
|
|
—
|
|
—
|
|
(42,277
|
)
|
—
|
|
(42,277
|
)
|
—
|
|
(42,277
|
)
|
|||||||||||||||
|
Net income
|
—
|
|
—
|
|
51,620
|
|
—
|
|
—
|
|
51,620
|
|
673
|
|
52,293
|
|
|||||||||||||||
|
Non-controlling interest due to acquisition
|
—
|
|
—
|
|
—
|
|
—
|
|
—
|
|
—
|
|
3,167
|
|
3,167
|
|
|||||||||||||||
|
Distributions to non-controlling interest
|
—
|
|
—
|
|
—
|
|
—
|
|
—
|
|
—
|
|
(266
|
)
|
(266
|
)
|
|||||||||||||||
|
Balance, September 30, 2018
|
$
|
393
|
|
$
|
565,811
|
|
$
|
213,048
|
|
$
|
(33,111
|
)
|
$
|
(1,989
|
)
|
$
|
744,152
|
|
$
|
3,574
|
|
$
|
747,726
|
|
|||||||
See Notes to Consolidated Financial Statements.
107
META FINANCIAL GROUP, INC. AND SUBSIDIARIES
Consolidated Statements of Cash Flows
|
|
For the Years Ended September 30,
|
||||||||||
|
(Dollars in Thousands)
|
2018
|
2017
|
2016
|
||||||||
|
Cash flows from operating activities:
|
|||||||||||
|
Net income before noncontrolling interest
|
$
|
52,293
|
|
$
|
44,917
|
|
$
|
33,220
|
|
||
|
Adjustments to reconcile net income to net cash provided by operating activities:
|
|||||||||||
|
Depreciation, amortization and accretion, net
|
37,722
|
|
45,048
|
|
35,617
|
|
|||||
|
Stock compensation
|
11,123
|
|
10,393
|
|
486
|
|
|||||
|
Provision (recovery):
|
|||||||||||
|
Loan and lease losses
|
29,432
|
|
10,589
|
|
4,605
|
|
|||||
|
Deferred taxes
|
6,530
|
|
(6,286
|
)
|
(230
|
)
|
|||||
|
Loans held for sale:
|
|||||||||||
|
Originations
|
(1,691
|
)
|
(685,934
|
)
|
—
|
|
|||||
|
Proceeds from sales
|
17,621
|
|
685,934
|
|
—
|
|
|||||
|
Net change
|
952
|
|
—
|
|
—
|
|
|||||
|
Fair value adjustment of foreclosed real estate
|
29
|
|
18
|
|
—
|
|
|||||
|
Net realized (gain) loss:
|
|||||||||||
|
Other assets
|
127
|
|
406
|
|
104
|
|
|||||
|
Foreclosed real estate or other assets
|
19
|
|
6
|
|
—
|
|
|||||
|
Available for sale securities, net
|
8,177
|
|
537
|
|
326
|
|
|||||
|
Held to maturity securities, net
|
—
|
|
(44
|
)
|
—
|
|
|||||
|
Loans held for sale
|
(181
|
)
|
—
|
|
—
|
|
|||||
|
Lease receivables and equipment
|
(526
|
)
|
—
|
|
—
|
|
|||||
|
Net change:
|
|||||||||||
|
Other assets
|
2,633
|
|
(23,408
|
)
|
(1,968
|
)
|
|||||
|
Accrued interest payable
|
1,933
|
|
1,405
|
|
603
|
|
|||||
|
Accrued expenses and other liabilities
|
(28,610
|
)
|
30,806
|
|
11,237
|
|
|||||
|
Accrued interest receivable
|
2,745
|
|
(2,181
|
)
|
(3,847
|
)
|
|||||
|
Change in bank-owned life insurance value
|
(2,591
|
)
|
(2,216
|
)
|
(1,656
|
)
|
|||||
|
Impairment of intangibles
|
18
|
|
10,248
|
|
—
|
|
|||||
|
Excess contingent consideration paid
|
—
|
|
(248
|
)
|
—
|
|
|||||
|
Net cash provided by operating activities
|
137,755
|
|
119,990
|
|
78,497
|
|
|||||
|
Cash flows from investing activities:
|
|||||||||||
|
Available for Sale securities:
|
|||||||||||
|
Purchases
|
(626,575
|
)
|
(848,613
|
)
|
(603,995
|
)
|
|||||
|
Proceeds from sales
|
596,758
|
|
457,306
|
|
285,508
|
|
|||||
|
Proceeds from maturities and principal repayments
|
162,118
|
|
126,420
|
|
116,333
|
|
|||||
|
Held to Maturity:
|
|||||||||||
|
Purchases
|
—
|
|
(932
|
)
|
(298,869
|
)
|
|||||
|
Proceeds from sales
|
—
|
|
5,870
|
|
—
|
|
|||||
|
Proceeds from maturities and principal repayments
|
40,525
|
|
45,615
|
|
20,465
|
|
|||||
|
Bank Owned Life Insurance:
|
|||||||||||
|
Purchases
|
—
|
|
(25,000
|
)
|
(10,000
|
)
|
|||||
|
Loans and leases:
|
|||||||||||
|
Purchases
|
(165,670
|
)
|
(141,403
|
)
|
—
|
|
|||||
|
Proceeds from sales
|
22,611
|
|
4,720
|
|
89
|
|
|||||
|
Net change
|
(493,381
|
)
|
(274,840
|
)
|
(217,985
|
)
|
|||||
|
Proceeds from sales of foreclosed real estate or other assets
|
244
|
|
200
|
|
—
|
|
|||||
|
Federal Home Loan Bank stock:
|
|||||||||||
|
Purchases
|
(961,124
|
)
|
(715,891
|
)
|
(860,902
|
)
|
|||||
|
Redemption
|
998,880
|
|
702,280
|
|
837,800
|
|
|||||
|
Rental Equipment:
|
|||||||||||
|
Purchases
|
(1,848
|
)
|
—
|
|
—
|
|
|||||
|
Proceeds from sales
|
2,362
|
|
—
|
|
—
|
|
|||||
|
Premises and equipment:
|
|||||||||||
|
Purchases
|
(8,542
|
)
|
(6,798
|
)
|
(6,979
|
)
|
|||||
|
Proceeds from sales
|
—
|
|
58
|
|
55
|
|
|||||
|
Rental equipment operating lease originations
|
(15,000
|
)
|
—
|
|
—
|
|
|||||
|
Cash paid for acquisitions
|
(6
|
)
|
(29,425
|
)
|
—
|
|
|||||
108
|
Cash received upon acquisitions
|
58,858
|
|
—
|
|
—
|
|
|||||
|
Net cash used in investing activities
|
(389,790
|
)
|
(700,433
|
)
|
(738,480
|
)
|
|||||
|
Cash flows from financing activities:
|
|||||||||||
|
Net change:
|
|||||||||||
|
Checking, savings, and money market deposits
|
7
|
|
319,524
|
|
737,727
|
|
|||||
|
Time deposits
|
(143,096
|
)
|
(2,355
|
)
|
34,821
|
|
|||||
|
Wholesale deposits
|
229,982
|
|
476,173
|
|
—
|
|
|||||
|
FHLB and other borrowings
|
(415,000
|
)
|
308,000
|
|
100,000
|
|
|||||
|
Federal funds
|
(565,000
|
)
|
(5,000
|
)
|
452,000
|
|
|||||
|
Securities sold under agreements to repurchase
|
1,222
|
|
(565
|
)
|
(969
|
)
|
|||||
|
Short-term borrowings
|
(11,642
|
)
|
—
|
|
—
|
|
|||||
|
Distributions to non-controlling interest
|
(266
|
)
|
—
|
|
—
|
|
|||||
|
Principal payments:
|
|||||||||||
|
Other liabilities
|
(4,888
|
)
|
|
—
|
|
|
—
|
|
|||
|
Capital lease obligations
|
(62
|
)
|
(80
|
)
|
(126
|
)
|
|||||
|
Cash dividends paid
|
(5,736
|
)
|
(4,839
|
)
|
(4,389
|
)
|
|||||
|
Purchase of shares by ESOP
|
1,606
|
|
1,174
|
|
—
|
|
|||||
|
Issuance of restricted stock
|
4
|
|
12
|
|
—
|
|
|||||
|
Proceeds from exercise of stock options & issuance of common stock
|
148
|
|
650
|
|
13,858
|
|
|||||
|
Shares repurchased for tax withholdings on stock compensation
|
(2,598
|
)
|
(470
|
)
|
—
|
|
|||||
|
Contingent consideration - cash paid
|
—
|
|
(17,253
|
)
|
—
|
|
|||||
|
Proceeds from long term debt
|
—
|
|
—
|
|
75,000
|
|
|||||
|
Redemption of long term debt
|
(258
|
)
|
—
|
|
—
|
|
|||||
|
Payment of debt issuance costs
|
—
|
|
—
|
|
(1,767
|
)
|
|||||
|
Payment of debt extinguishment costs
|
—
|
|
(772
|
)
|
—
|
|
|||||
|
Net cash (used in) provided by financing activities
|
(915,577
|
)
|
1,074,199
|
|
1,406,155
|
|
|||||
|
Effect of exchange rate changes on cash
|
3
|
|
—
|
|
—
|
|
|||||
|
Net change in cash and cash equivalents
|
(1,167,609
|
)
|
493,756
|
|
746,172
|
|
|||||
|
Cash and cash equivalents at beginning of year
|
1,267,586
|
|
773,830
|
|
27,658
|
|
|||||
|
Cash and cash equivalents at end of year
|
$
|
99,977
|
|
$
|
1,267,586
|
|
$
|
773,830
|
|
||
109
META FINANCIAL GROUP, INC. AND SUBSIDIARIES
Consolidated Statements of Cash Flows (Con't.)
|
|
For the Years Ended September 30,
|
||||||||||
|
(Dollars in Thousands)
|
2018
|
2017
|
2016
|
||||||||
|
Supplemental disclosure of cash flow information
|
|||||||||||
|
Cash paid during the year for:
|
|||||||||||
|
Interest
|
$
|
33,499
|
|
$
|
16,278
|
|
$
|
3,488
|
|
||
|
Income taxes
|
8,946
|
|
20,058
|
|
5,898
|
|
|||||
|
Franchise taxes
|
160
|
|
187
|
|
98
|
|
|||||
|
Other taxes
|
206
|
|
290
|
|
79
|
|
|||||
|
Supplemental disclosure of non-cash investing and financing activities:
|
|
|
|
|
|
|
|||||
|
Transfers
|
|||||||||||
|
Loans and leases to foreclosed real estate or other assets
|
30,451
|
|
440
|
|
76
|
|
|||||
|
Loans and leases to rental equipment
|
9
|
|
—
|
|
—
|
|
|||||
|
Rental equipment to loans and leases
|
993
|
|
—
|
|
—
|
|
|||||
|
Loans and leases to held for sale
|
15,068
|
|
—
|
|
—
|
|
|||||
|
Contingent consideration - equity
|
—
|
|
24,142
|
|
—
|
|
|||||
|
Stock issued for acquisitions
|
295,767
|
|
37,296
|
|
—
|
|
|||||
|
Purchases/Sales of investment securities accrued, not settled
|
|||||||||||
|
Available for sale purchases
|
1,430
|
|
—
|
|
—
|
|
|||||
|
Securities transferred from held-to-maturity to available-for-sale
|
346,771
|
|
—
|
|
—
|
|
|||||
See Notes to Consolidated Financial Statements.
110
NOTES TO CONSOLIDATED FINANCIAL STATEMENTS
PRINCIPLES OF CONSOLIDATION
The Consolidated Financial Statements include the accounts of Meta Financial Group, Inc. (the “Company”), a unitary savings and loan holding company located in Sioux Falls, South Dakota, and its wholly-owned subsidiaries which include MetaBank (the “Bank”), a federally chartered savings bank whose primary federal regulator is the Office of the Comptroller of the Currency, and Meta Capital, LLC, a wholly owned service corporation subsidiary of MetaBank which invests in companies in the financial services industry. All significant intercompany balances and transactions have been eliminated. The Company also owns
100%
of First Midwest Financial Capital Trust I (the “Trust”), which was formed in July 2001 for the purpose of issuing trust preferred securities. The Trust is not included in the Consolidated Financial Statements of the Company. Through the Crestmark Acquisition, the Company acquired floating rate capital securities due to Crestmark Capital Trust I, a 100%-owned nonconsolidated subsidiary of the Company. See Note 2. Acquisitions for additional disclosure on the Crestmark Acquisition. In addition, the Company evaluates its relationships with other entities to identify whether they are variable interest entities ("VIEs") and to assess whether it is the primary beneficiary of such entities. If the determination is made that the Company is the primary beneficiary, then that entity is included in the Consolidated Financial Statements. If an entity is not a VIE, the Company also evaluates arrangements in which there is a general partner or managing member to determine whether consolidation is appropriate.
Variable Interest Entities
VIEs are defined by contractual ownership or other interests that change with fluctuations in the VIE's net asset value. The primary beneficiary is the entity which has both: (1) the power to direct the activities of the VIE that most significantly impacts the VIE’s economic performance, and (2) the obligation to absorb losses or receive benefits of the entity that could potentially be significant to the VIE. To determine whether or not a variable interest the Company holds could potentially be significant to the VIE, the Company considers both qualitative and quantitative factors regarding the nature, size and form of the Company's involvement with the VIE. Further, the Company assesses whether or not the Company is the primary beneficiary of a VIE on an ongoing basis.
The Crestmark Capital Trust I qualifies as a VIE for which the Company is not the primary beneficiary. Consequently, the accounts of that entity are not consolidated in the Company’s Financial Statements.
As a result of the Crestmark Acquisition, the Company acquired existing membership interests of
five
joint venture limited liability companies (the "LLCs"). See Note 2. Acquisitions for additional disclosure on the Crestmark Acquisition. The Company holds
80%
of the membership interests in each of the five LLC entities, which offer commercial lending and other financing arrangements. In connection with these LLCs, the Company exclusively provides funding for each entity's activities. The Company determined it is the primary beneficiary of all five LLCs as it has the managing power under the terms of each of the LLC operating agreements. Results of the five LLCs are reflected in the Company's September 30, 2018 Consolidated Financial Statements and are summarized below. The assets recognized as a result of consolidating the LLCs are the property of the LLCs and are not available for any other purpose.
111
The summarized financial information for the Company’s consolidated VIEs consisted of the following:
|
September 30, 2018
|
|||
|
(Dollars in Thousands)
|
|||
|
Cash and cash equivalents
|
$
|
867
|
|
|
Loans and leases receivable
|
131,197
|
|
|
|
Allowance for loan and lease losses
|
(145
|
)
|
|
|
Accrued interest receivable
|
887
|
|
|
|
Rental equipment
|
99
|
|
|
|
Foreclosed real estate and repossessed assets
|
1,626
|
|
|
|
Other assets
|
3,247
|
|
|
|
Total assets
|
137,778
|
|
|
|
Accrued expenses and other liabilities
|
2,386
|
|
|
|
Non-controlling interest
|
3,574
|
|
|
|
Net assets less non-controlling interest
|
131,818
|
|
|
Amounts for non-controlling interests reflect the proportionate share of membership interest (equity) and net income attributable to the holders of minority membership interest in the following entities:
|
•
|
Capital Equipment Solutions, LLC (“CES”) - CES was organized to engage in the business of providing equipment financing term loans.
|
|
•
|
CM Help, LLC - CM Help was organized to provide flexible patient loan programs to hospitals and patient clients of hospitals as a financing alternative for the self-pay and co-pay portions of patients’ hospital expenses.
|
|
•
|
CM Southgate II, LLC - CM Southgate II was organized to engage in the business of acquiring fleet leases and semi-trailer/tractor loans and leases.
|
|
•
|
CM Sterling, LLC - CM Sterling was organized to engage in asset-based lending and factoring.
|
|
•
|
CM TFS, LLC - CM TFS was organized to engage in the business of acquiring equipment financing term loans and leases.
|
NATURE OF BUSINESS AND INDUSTRY SEGMENT INFORMATION
The primary source of revenue relates to payment processing services for prepaid debit cards, ATM sponsorship, tax refund transfer and other money transfer systems and services. Additionally, a significant source of revenue for the Company is interest from the purchase or origination of commercial finance loans, consumer finance loans and community banking loans. The Company accepts deposits from customers in the normal course of business through its community bank division and on a national basis through its MPS and tax services divisions, and through wholesale funding. The Company operates in the banking industry, which accounts for the majority of its revenues and assets. The Company uses the “management approach” for reporting information about segments in annual and interim financial statements. The management approach is based on the way the chief operating decision-maker organizes segments within a company for making operating decisions and assessing performance. Reportable segments are based on products and services, geography, legal structure, management structure and any other manner in which management disaggregates a company. Based on the management approach model, the Company has determined that its business is comprised of
three
reporting segments. See Note 16 Segment Reporting for additional information on the Company's segment reporting.
112
USE OF ESTIMATES IN PREPARING FINANCIAL STATEMENTS
The preparation of Consolidated Financial Statements in conformity with GAAP requires management to make estimates and assumptions that affect the reported amounts of assets, liabilities and disclosure of contingent assets and liabilities at the date of the financial statements and the reported amounts of revenue and expenses during the reporting period. Actual results could differ from those estimates. Certain significant estimates include the valuation of residual values within lease receivables, allowance for loan and lease losses, the valuation of foreclosed real estate and repossessed assets, the valuation of goodwill and intangible assets and the fair values of securities and other financial instruments. These estimates are reviewed by management regularly; however, they are particularly susceptible to significant changes in the future.
CASH AND CASH EQUIVALENTS AND FEDERAL FUNDS SOLD
For purposes of reporting cash flows, cash and cash equivalents is defined to include the Company’s cash on hand and due from financial institutions and short-term interest-bearing deposits in other financial institutions. The Company reports cash flows net for customer loan transactions, securities purchased under agreement to resell, federal funds purchased, deposit transactions, securities sold under agreements to repurchase, and Federal Home Loan Bank ("FHLB") advances with terms less than
90
days. The Bank is required to maintain reserve balances in cash or on deposit with the FRB, based on a percentage of deposits. The total of those reserve balances was
$16.5 million
at
September 30, 2018
, and
$1.5 million
at September 30, 2017. The Company at times maintains balances in excess of insured limits at various financial institutions including the FHLB, the FRB and other private institutions. At
September 30, 2018
, the Company had
$16.0 million
interest-bearing deposits held at the FHLB and
$4.2 million
in interest-bearing deposits held at the FRB. At
September 30, 2018
, the Company had no federal funds sold. The Company does not believe these instruments carry a significant risk of loss, but cannot provide assurances that no losses could occur if these institutions were to become insolvent.
SECURITIES
GAAP requires that, at acquisition, an enterprise classify debt securities into one of three categories: Available for Sale (“AFS”), Held to Maturity (“HTM”) or trading. AFS securities are carried at fair value on the Consolidated Statements of Financial Condition, and unrealized holding gains and losses are excluded from earnings and recognized as a separate component of equity in accumulated other comprehensive income (loss) (“AOCI”). HTM debt securities are measured at amortized cost. Both AFS and HTM are subject to review for other-than-temporary impairment. Meta did not hold trading securities at September 30, 2018 or 2017.
The Company classifies the majority of its securities as AFS. AFS securities are those the Company may decide to sell if needed for liquidity, asset/liability management or other reasons. Prior to June 30, 2013, the Basel III Accord was finalized and clarified that unrealized losses and gains on securities will not affect regulatory capital for those companies that opt out of the requirement, which the Company has done.
Gains and losses on the sale of securities are determined using the specific identification method based on amortized cost and are reflected in results of operations at the time of sale. Interest and dividend income, adjusted by amortization of purchase premium or discount over the estimated life of the security using the level yield method, is included in income as earned.
The fair values of securities available for sale are determined by obtaining quoted prices on nationally recognized securities exchanges (Level 1 inputs), or based upon quoted prices for similar instruments in active markets, quoted prices for identical or similar instruments in markets that are not active and model-based valuation techniques for which significant assumptions are observable in the market (Level 2 inputs). The Company considers these valuations supplied by a third-party provider that utilizes several sources for valuing fixed-income securities. Sources utilized by the third-party provider include pricing models that vary based on asset class and include available trade, bid, and other market information. This methodology includes broker quotes, proprietary models, descriptive terms and conditions databases, as well as extensive quality control programs.
113
Securities Impairment
Management continually monitors the investment securities portfolio for impairment on a security-by-security basis and has a process in place to identify securities that could potentially have a credit impairment that is other-than-temporary. This process involves the consideration of the length of time and extent to which the fair value has been less than the amortized cost basis, review of available information regarding the financial position of the issuer, monitoring the rating of the security, monitoring changes in value, cash flow projections, and the Company’s intent to sell a security or whether it is more likely than not the Company will be required to sell the security before the recovery of its amortized cost, which, in some cases, may extend to maturity. To the extent the Company determines that a security is deemed to be other-than-temporarily impaired, an impairment loss is recognized. If the Company intends to sell a security or it is more likely than not that the Company would be required to sell a security before the recovery of its amortized cost, the Company recognizes an other-than-temporary impairment for the difference between amortized cost and fair value. If the Company does not expect to recover the amortized cost basis, does not plan to sell the security and if it is not more likely than not that the Company would be required to sell the security before the recovery of its amortized cost, the recognition of the other-than-temporary impairment is bifurcated. For those securities, the Company separates the total impairment into a credit loss component recognized in net income, and the amount of the loss related to other factors is recognized in other comprehensive income, net of taxes.
The amount of the credit loss component of a debt security impairment is estimated as the difference between amortized cost and the present value of the expected cash flows of the security. The present value is determined using the best estimate of cash flows discounted at the effective interest rate implicit to the security at the date of purchase or the current yield to accrete an asset-backed or floating rate security. In fiscal
2018
,
2017
and
2016
, there was no other-than-temporary impairment recorded.
LOANS HELD FOR SALE
LHFS include commercial loans originated under the guidelines of the SBA or USDA. LHFS are held at the lower of cost or fair value. Generally, LHFS are valued on an aggregate portfolio basis. Any amount by which the cost exceeds fair value is initially recorded as a valuation allowance and subsequently reflected in the gain or loss on sale when sold. Gains and losses on LHFS are recorded in non-interest income on the Consolidated Statement of Operations. Loan costs and fees are deferred at origination and are recognized in income at the time of sale. Interest income is calculated based on the note rate of the loan and is recorded as interest income.
LOANS AND LEASES RECEIVABLE
LOANS RECEIVABLE
Loans receivable that management has the intent and ability to hold for the foreseeable future or until maturity or pay-off are reported at their outstanding principal balances net of any unearned income, cumulative charge-offs, unamortized deferred fees and costs on originated loans, and unamortized premiums or discounts on purchased loans.
Interest income on loans is accrued over the term of the loans based upon the amount of principal outstanding except when serious doubt exists as to the collectability of a loan, in which case the accrual of interest is discontinued. Unearned income, deferred loan fees and costs, and discounts and premiums are amortized to interest income over the contractual life of the loan using the interest method. The Company generally places Community Banking loans on nonaccrual status when: the full and timely collection of interest or principal becomes uncertain; they are 90 days past due for interest or principal, unless they are both well-secured and in the process of collection; or part of the principal balance has been charged off. The majority of the Company's National Lending loans follow the same nonaccrual policy as Community Banking loans with certain commercial finance, consumer finance and tax service loans not generally being placed on non-accrual status, but instead are charged off when the collection of principal and interest become doubtful. When placed on nonaccrual status, the accrued unpaid interest receivable is reversed against interest income and any remaining amortizing of net deferred fees is suspended. Cash collected on these loans is applied to first reduce the carrying value of the loan with any remainder being recognized as interest income. Generally, a loan can return to accrual status when all delinquent interest and principal become current under the terms of the loan agreement and collectability of the remaining principal and interest is no longer doubtful. Loans are considered past due when contractually required principal or interest payments have not been made on the due dates.
114
For commercial loans, the Company generally fully charges off or charges down to net realizable value (fair value of collateral, less estimated costs to sell) for loans secured by collateral when: management judges the loans to be uncollectible; repayment is deemed to be protracted beyond reasonable time frames; the loan has been classified as a loss by either the Company's internal loan review process or its banking regulatory agencies; the customer has filed bankruptcy and the loss becomes evident owing to lack of assets; or the loan meets a defined number of days past due unless the loan is both well-secured and in the process of collection. For consumer loans, the Company fully charges off or charges down to net realizable value when deemed uncollectible due to bankruptcy or other factors, or meets a defined number of days past due.
The Company generally considers a loan to be impaired when, based on current information and events, it determines that it will not be able to collect all amounts due according to the loan contract, including scheduled interest payments. This evaluation is generally based on delinquency information, an assessment of the borrower’s financial condition and the adequacy of collateral, if any. The Company's impaired loans predominantly include loans on nonaccrual status in the Banking segment and loans modified in a troubled-debt-restructuring, whether on accrual or nonaccrual status. The Company measures the amount of impairment, if any, based on the difference between the recorded investment in the loan (net of previous charge-offs, deferred loan fees or costs and unamortized premium or discount) and the present value of expected future cash flows, discounted at the loans effective interest rate. When collateral is the sole source of repayment for the impaired loan, the Company charges down to net realizable value.
As part of the Company’s ongoing risk management practices, management attempts to work with borrowers when necessary to extend or modify loan terms to better align with their current ability to repay. Extensions and modifications to loans are made in accordance with internal policies and guidelines which conform to regulatory guidance. Each occurrence is unique to the borrower and is evaluated separately. In a situation where an economic concession has been granted to a borrower that is experiencing financial difficulty, the Company identifies and reports that loan as a troubled debt restructuring (“TDR”). Management considers regulatory guidelines when restructuring loans to ensure that prudent lending practices are followed. As such, qualification criteria and payment terms consider the borrower’s current and prospective ability to comply with the modified terms of the loan. Additionally, the Company structures loan modifications with the intent of strengthening repayment prospects.
The Company considers whether a borrower is experiencing financial difficulties, as well as whether a concession has been granted to a borrower determined to be troubled, when determining whether a modification meets the criteria of being a TDR. For such purposes, evidence which may indicate that a borrower is troubled includes, among other factors, the borrower’s default on debt, the borrower’s declaration of bankruptcy or preparation for the declaration of bankruptcy, the borrower’s forecast that entity-specific cash flows will be insufficient to service the related debt, or the borrower’s inability to obtain funds from sources other than existing creditors at an effective interest rate equal to the current market interest rate for similar debt for a non-troubled debtor. If a borrower is determined to be troubled based on such factors or similar evidence, a concession will be deemed to have been granted if a modification of the terms of the debt occurred that management would not otherwise consider. Such concessions may include, among other modifications, a reduction of the stated interest for the remaining original life of the debt, an extension of the maturity date at a stated interest rate lower than the current market rate for new debt with similar risk, a reduction of accrued interest, or a reduction of the face amount or maturity amount of the debt.
Loans that are reported as TDRs apply the identical criteria in the determination of whether the loan should be accruing or not accruing. The event of classifying the loan as a TDR due to a modification of terms may be independent from the determination of accruing interest on a loan.
LEASES RECEIVABLE
The Company provides various types of commercial lease financing that are classified for accounting purposes as direct financing, sales-type or operating leases. Leases that transfer substantially all of the benefits and risks of ownership to the lessee are classified as direct financing or sales-type leases and are included in loans and leases receivable on the Consolidated Statements of Financial Condition. Direct financing and sales-type leases are carried at the combined present value of future minimum lease payments and lease residual values. The determination of lease classification requires various judgments and estimates by management, including the fair value of equipment at lease inception, useful life of the equipment under lease, lease residual value, and collectability of minimum lease payments.
115
Sales-type leases generate dealer profit, which is recognized at lease inception by recording lease revenue net of lease cost. Lease revenue consists of the present value of the future minimum lease payments. Lease cost consists of the lease equipment’s book value, less the present value of its residual. Interest income on direct financing and sales-type leases is recognized using methods that approximate a level yield over the fixed, non-cancelable term of the lease. Recognition of interest income is generally discontinued at the time the lease becomes 90 days delinquent, unless the lease is well-secured and in process of collection. Delinquency and past due status is based on the contractual terms of the lease. The Company receives pro rata rent payments for the interim period until the lease contract commences and the fixed, non-cancelable lease term begins. Interim payments are recognized in the month they are earned and are recorded in interest income. Management has policies and procedures in place for the determination of lease classification and review of the related judgments and estimates for all lease financings.
The Company generally fully charges off or charges down to net realizable value (fair value of collateral, less estimated costs to sell) for leases when: management judges the lease to be uncollectible; repayment is deemed to be protracted beyond reasonable time frames; the lease has been classified as a loss by either the Company's internal review process or its banking regulatory agencies; the customer has filed bankruptcy and the loss becomes evident owing to lack of assets; or the lease meets a defined number of days past due unless the lease is both well-secured and in the process of collection.
Some lease financings include a residual value component, which represents the estimated fair value of the leased equipment at the expiration of the initial term of the transaction. The estimation of the residual value involves judgments regarding product and technology changes, customer behavior, shifts in supply and demand, and other economic assumptions. The Company reviews residual assumptions at least annually and records impairment, if necessary, which is charged to non-interest expense in the period it becomes known. The Company may purchase and sell minimum lease payments, primarily as a credit risk reduction tool, to third-party financial institutions at fixed rates on a non-recourse basis with its underlying equipment as collateral. For those transactions that achieve sale treatment, the related lease cash flow stream and the non-recourse financing are derecognized. For those transactions that do not achieve sale treatment, the underlying lease remains on the Company’s Consolidated Statements of Financial Condition and non-recourse debt is recorded in the amount of the proceeds received. The Company retains servicing of these leases and bills, collects, and remits funds to the third-party financial institution. Upon default by the lessee, the third-party financial institutions may take control of the underlying collateral which the Company would otherwise retain as residual value.
Leases that do not transfer substantially all benefits and risks of ownership to the lessee are classified as operating leases. Such leased equipment and related initial direct costs are included in Rental Equipment on the Consolidated Statements of Financial Condition and are depreciated on a straight-line basis over the term of the lease to its estimated residual value. Depreciation expense is recorded as Operating Lease Equipment Depreciation Expense within non-interest expense. Operating lease rental income is recognized when it becomes due and is reflected as a component of non-interest income. An allowance for lease losses is not provided on operating leases.
MORTGAGE SERVICING AND TRANSFERS OF FINANCIAL ASSETS
The Company, from time to time, sells loan participations, generally without recourse. The Company also sells commercial SBA and USDA loans to third parties, generally without recourse. Sold loans are not included in the Consolidated Financial Statements. The Bank generally retains the right to service the sold loans for a fee and records a servicing asset, which is included within Other Assets on the Consolidated Statements of Financial Condition. At September 30, 2018 and 2017, the Bank was servicing loans for others with aggregate unpaid principal balances of $
134.0
million and $
21.8
million, respectively.
Transfers of financial assets are accounted for as sales when control over the assets has been surrendered. Control over transferred assets is deemed to be surrendered when (1) the assets have been legally isolated from the Company, (2) the transferee obtains the right (free of conditions that constrain it from taking advantage of that right) to pledge or exchange the transferred assets, and (3) the Company does not maintain effective control over the transferred assets through an agreement to repurchase them before their maturity.
116
ALLOWANCE FOR LOAN AND LEASE LOSSES
The allowance for loan and lease losses ("ALLL") represents management’s estimate of probable loan and lease losses that have been incurred as of the date of the Consolidated Financial Statements. The ALLL is increased by a provision for loan and lease losses charged to expense and decreased by charge-offs (net of recoveries). Estimating the risk of loss and the amount of loss on any loan or lease is necessarily subjective. Management’s periodic evaluation of the appropriateness of the ALLL is based on the Company’s and peer group’s past loan and lease loss experience, known and inherent risks in the portfolio, adverse situations that may affect the borrower’s ability to repay, the estimated value of any underlying collateral, and current economic conditions. While management may periodically allocate portions of the ALLL for specific problem loan or lease situations, the entire ALLL is available for any loan or lease charge-offs that occur. The ALLL consists of specific and general components.
The specific component of the ALLL relates to impaired loans and leases. Loans are generally considered impaired if full principal or interest payments are not probable in accordance with the contractual loan terms. Leases are generally considered impaired if collectability of the remaining minimum lease payments becomes uncertain. Often this is associated with a delay or shortfall in payments of 90 days or more for community banking loans and leases. Non-accrual loans and leases and all TDRs are considered impaired. Impaired loans and leases, or portions thereof, are charged off when deemed uncollectible. Impaired loans are carried at the present value of expected future cash flows discounted at the loan’s effective interest rate or at the fair value of the collateral if the loan is collateral dependent. For such loans, an allowance is established when the discounted cash flows (or collateral value or observable market price) of the impaired loan is lower than the carrying value of that loan.
The general reserve covers Community Bank and Crestmark division loans and leases not considered impaired and is determined based upon both quantitative and qualitative analysis. A separate general reserve analysis is performed for individual classified non-impaired loans and leases and for non-classified smaller-balance homogeneous loans. The three main assumptions for the quantitative components for 2018 and 2017 are historical loss rates, the look back period (“LBP”) and the loss emergence period (“LEP”).
|
•
|
The historical loss experience is determined by portfolio segment and is based on the actual loss history of the Company over the past
seven
years. For the individual classified loans, historic charge-off rates for the Company’s classified loan population are utilized.
|
|
•
|
A three to seven-year LBP is appropriate as it captures the Company’s ability to workout troubled loans or relationships while continuing to factor in the loss experience resulting from varying economic cycles and other factors.
|
|
•
|
The weighted average LEP is an estimate of the average amount of time from the point the Company identifies a credit event of the borrower to the point the loss is confirmed by the Company weighted by the dollar value of the write off. The LEP is only applied to the non-classified loan general reserve in the Company's Community Bank portfolio.
|
Qualitative adjustment considerations for the general reserve include considerations of changes in lending and leasing policies and procedures, changes in national and local economic and business conditions and developments, changes in the nature and volume of the loan and lease portfolio, changes in lending and leasing management and staff, trending in past due, classified, nonaccrual, and other loan and lease categories, changes in the Company’s loan and lease review system and oversight, changes in collateral and residual values, credit concentration risk, and the regulatory and legal requirements and environment.
National Lending portfolios, outside of loans and leases attributable to the Crestmark division, primarily utilize a general reserve process that mostly uses historical factors related to the specific loan and lease portfolio, although other qualitative factors may be considered in the final loss rate used to calculate the reserve on these portfolios. Loans in these portfolios are generally not placed on non-accrual status or impaired. The balances are written off after a loan becomes past due greater than 210 days for commercial insurance premium finance loans, 180 days for tax and other specialty lending loans, 120 days for consumer credit products and 90 days for other loans. See Note 3. Loans and Leases Receivable, Net for further information on the ALLL.
117
FORECLOSED REAL ESTATE AND REPOSSESSED ASSETS
Real estate properties and repossessed assets acquired through, or in lieu of, loan foreclosure are initially recorded at fair value less selling costs at the date of foreclosure, establishing a new cost basis. The fair value of the real estate owned is based on independent appraisals, real estate brokers’ price opinions, or automated valuation methods, less costs to sell. The fair value of repossessed assets is based on available pricing guides, auction results or price opinions, less costs to sell. Any reduction to fair value from the carrying value of the related loan at the time of acquisition is accounted for as a loan loss and charged against the allowance for loan and lease losses. Subsequent valuations are periodically performed by management. If the subsequent fair value, less costs to sell, declines to less than the carrying amount of the asset, the shortfall is recognized in the period it becomes known as an impairment in non-interest expense and a valuation allowance is recorded for the asset. Operating expenses of properties are also recorded in non-interest expense.
INCOME TAXES
The Company records income tax expense based on the amount of taxes due on its tax return plus deferred taxes computed based on the expected future tax consequences of temporary differences between the carrying amounts and tax bases of assets and liabilities, using enacted tax rates. Deferred tax assets are reduced by a valuation allowance when, in the opinion of management, it is more likely than not that some portion or all of the deferred tax assets will not be realized.
In accordance with ASC 740,
Income Taxes
, the Company recognizes a tax position as a benefit only if it is more likely than not that the tax position would be sustained in a tax examination, with a tax examination being presumed to occur. The amount recognized is the largest amount of tax benefit that is greater than 50% likely of being realized upon examination. For tax positions not meeting the more likely than not test, no tax benefit is recorded. The Company recognizes interest and/or penalties related to income tax matters in income tax expense. The effect on deferred tax assets and liabilities from a change in tax rates is recorded in income tax expense in the Consolidated Statements of Operations in the period in which the enactment date occurs. If current period income tax rates change, the impact on the annual effective income tax rate is applied year to date in the period of enactment. See Note 12. Income Taxes for further information on Income Taxes.
PREMISES, FURNITURE AND EQUIPMENT
Land is carried at cost. Buildings, furniture, fixtures, leasehold improvements and equipment are carried at cost, less accumulated depreciation and amortization. Capital leases, where the Company is the lessee, are included in premises and equipment at the capitalized amount less accumulated amortization. The Company primarily uses the straight-line method of depreciation over the estimated useful lives of the assets, which range from
10
to
40
years for buildings, and
2
to
15
years for leasehold improvements, and for furniture, fixtures and equipment. The Company amortizes capitalized leased assets on a straight-line basis over the lives of the respective leases. Assets are reviewed for impairment when events indicate the carrying amount may not be recoverable. See Note 7. Premises, Furniture and Equipment, net for further information on Premises, Furniture and Equipment.
BANK-OWNED LIFE INSURANCE
Bank-owned life insurance represents the cash surrender value of investments in life insurance contracts. Earnings on the contracts are based on the earnings on the cash surrender value, less mortality costs.
EMPLOYEE STOCK OWNERSHIP PLAN (“ESOP”)
The cost of shares issued to the ESOP, but not yet allocated to participants, are presented in the Consolidated Statements of Financial Condition as a reduction of stockholders’ equity. Compensation expense is recorded based on the market price of the shares as they are committed to be released for allocation to participant accounts. The difference between the market price and the cost of shares committed to be released is recorded as an adjustment to additional paid-in capital. Dividends on allocated ESOP shares are recorded as a reduction of retained earnings. Dividends on unallocated shares are used to reduce the accrued interest and principal amount of the ESOP’s loan payable to the Company. At September 30, 2018 and 2017, all shares in the ESOP were allocated. See Note 10. Employee Stock Ownership and Profit Sharing Plans for further information on ESOP.
FINANCIAL INSTRUMENTS WITH OFF-BALANCE SHEET RISK
The Company, in the normal course of business, makes commitments to make loans which are not reflected in the Consolidated Financial Statements. The reserve for these unfunded commitments is included within Other Liabilities on the Consolidated Statements of Financial Condition.
118
GOODWILL
Goodwill represents the cost in excess of the fair value of net assets acquired (including identifiable intangibles) in transactions accounted for as business acquisitions. Goodwill is evaluated annually for impairment at a reporting unit level. The Company has determined that its reporting units are one level below the operating segments and distinguish these reporting units based on how the segments and reporting units are managed, taking into consideration the economic characteristics, nature of the products, and customers of the segments and reporting units. The Company performs its impairment evaluation as of September 30 of each fiscal year. If the implied fair value of goodwill is lower than its carrying amount, goodwill impairment is indicated and goodwill is written down to its implied fair value. Subsequent increases in goodwill are not recognized in the Consolidated Financial Statements. No goodwill impairment was recognized during the years ended September 30, 2018, 2017 or 2016. See Note 20. Goodwill and Intangible Assets for further information on Goodwill.
INTANGIBLE ASSETS
Intangible assets other than goodwill are amortized over their respective estimated lives. All intangible assets are subject to an impairment test at least annually or more often if conditions indicate a possible impairment. See Note 20. Goodwill and Intangible Assets for further information on Intangible Assets.
SECURITIES SOLD UNDER AGREEMENTS TO REPURCHASE
The Company enters into sales of securities under agreements to repurchase with primary dealers only, which provide for the repurchase of the same security. Securities sold under agreements to repurchase identical securities are collateralized by assets which are held in safekeeping in the name of the Bank or by the dealers who arranged the transaction. Securities sold under agreements to repurchase are treated as financings, and the obligations to repurchase such securities are reflected as a liability. The securities underlying the agreements remain in the asset accounts of the Company. See Note 9. Short Term Debt and Long Term Debt for further information on Securities Sold under Agreements to Repurchase.
REVENUE RECOGNITION
Interest revenue from loans, leases, and investments is recognized on the accrual basis of accounting as the interest is earned according to the terms of the particular loan, lease, or investment. Income from service and other customer charges is recognized as earned. Revenue within the Payments segment is recognized as services are performed and service charges are earned in accordance with the terms of the various programs. The Company is adopting Accounting Standards Update 2014-09,
Revenue from Contracts with Customers
, and related amendments beginning October 1, 2018. For further discussion on revenue recognition, see ASU 2014-09 below in the New Accounting Pronouncements in this footnote.
EARNINGS PER COMMON SHARE (“EPS”)
Basic earnings per share is computed by dividing income available to common stockholders after the allocation of dividends and undistributed earnings to the participating securities by the weighted average number of common shares outstanding for the period. Diluted earnings per share reflects the potential dilution that could occur if securities or other contracts to issue common stock were exercised, and is computed after giving consideration to the weighted average dilutive effect of the Company’s stock options and after the allocation of earnings to the participating securities. The Company effected a
3
-for-1 forward stock split of its common stock on October 4, 2018. All EPS amounts have been retrospectively adjusted to reflect this stock split. See Note 5. Earnings per Common Share for further information on EPS.
COMPREHENSIVE INCOME (LOSS)
Comprehensive income (loss) consists of net income and other comprehensive income or loss. Other comprehensive income or loss includes the change in net unrealized gains and losses on securities available for sale, net of reclassification adjustments and tax effects. Accumulated other comprehensive income (loss) is recognized as a separate component of stockholders’ equity.
119
STOCK COMPENSATION
Compensation expense for share-based awards is recorded over the vesting period at the fair value of the award at the time of grant. The exercise price of options or fair value of nonvested restricted shares granted under the Company’s incentive plans is equal to the fair market value of the underlying stock at the grant date. See Note 11. Share-Based Compensation Plans for further information on Stock Compensation.
RECLASSIFICATION AND REVISION OF PRIOR PERIOD BALANCES
On October 5, 2018, Meta common stock began trading on a split-adjusted basis following the 3-for-1 forward stock split with respect to Meta's common stock, which the Company effected on October 4, 2018. As a result, all share and per share data for all periods presented in this Form 10-K has been adjusted to reflect the
3
-for-1 forward stock split.
NEW ACCOUNTING PRONOUNCEMENTS
Accounting Standards Update (“ASU”) No. 2016-13,
Financial Instruments - Credit Losses (Topic 326): Measurement of Credit Losses on Financial Instruments
This ASU requires organizations to replace the incurred loss impairment methodology with a methodology reflecting expected credit losses with considerations for a broader range of reasonable and supportable information to substantiate credit loss estimates
.
This ASU is effective for annual reporting periods beginning after December 15, 2019. The Company has been analyzing its data and has taken measures to ensure its systems capture data applicable to the standard. In addition, the Company is undergoing a readiness assessment with an external consultant that began in the first quarter of fiscal 2018. The Company has chosen a vendor for a software solution and has begun the implementation of the software.
ASU No. 2016-04,
Extinguishment of liabilities
(Subtopic 405-20): Recognition of Breakage for Certain Prepaid Stored-Value Products
This ASU requires organizations to derecognize the deposit liabilities for unredeemed prepaid stored-value products (i.e. - breakage) consistently with breakage guidance in Topic 606,
Revenue from Contracts with Customers.
This ASU is effective for annual reporting periods beginning after December 15, 2017, and the Company expects the impact to the Consolidated Financial Statements to be minimal.
ASU No. 2016-02,
Leases (Topic 842): Amendments to the Leases Analysis
ASU No. 2018-10,
Codification Improvements to Topic 842
ASU No. 2018-11
,
Targeted Improvements
For lessees, Topic 842 requires leases to be recognized on the balance sheet, along with disclosure of key information about leasing arrangements. Topic 842 was subsequently amended by ASU 2018-01, 2018-10 and 2018-11. The new standard establishes a right-of-use (ROU) model that requires a lessee to recognize a ROU asset and lease liability on the balance sheet for all leases with a term longer than 12 months. Leases will be classified as finance or operating, with classification affecting the pattern and classification expense recognition in the income statement.
For lessors, Topic 842 requires lessors to classify leases as sales-type, direct financing or operating leases. A lease is a sales-type lease if any one of five criteria are met, each of which indicate that the lease, in effect, transfers control of the underlying asset to the lessee. If none of those five criteria are met, but two additional criteria are both met, indicating the lessor has transferred substantially all the risks and benefits of the underlying asset to the lessee and a third party, the lease is a direct financing lease. All leases that are not sales-type or direct financing leases are operating leases.
The new standard is effective for the Company on October 1, 2019, with early adoption permitted. A modified retrospective transition approach is required, applying the new standard to all leases existing at the date of initial application. An entity may choose to use either (1) the new standard's effective date or (2) the beginning of the earliest comparative period presented in the financial statements as its date of initial application. The Company expects to adopt the new standard on October 1, 2019 using the effective date as its date of initial application. Consequently, financial information will not be updated and the disclosures required under the new standard will not be provided for dates and periods before October 1, 2019.
120
The new standard provides several optional practical expedients in transition. The Company expects to elect the ‘package of practical expedients,’ which permits the Company not to reassess under the new standard the Company's prior conclusions about lease identification, lease classification and initial direct costs. The Company does not expect to elect the use-of-hindsight or the practical expedient pertaining to land easements; the latter not being applicable to the Company. As a lessee, the Company expects this new standard to have a material effect on its financial statements. While the Company continues to assess all of the effects of adoption, the Company currently believes the most significant effects relate to (1) the recognition of ROU assets and lease liabilities on the balance sheet for the Company's office and equipment operating leases; (2) providing significant new disclosures about the Company's leasing activities. As a lessor, the Company is still in the process of assessing the impact of the standard on its existing lease portfolio. The Company does not expect a significant change in its leasing activities between now and adoption.
The new standard also provides practical expedients for a lessee’s and lessor’s ongoing accounting. The Company currently expects to elect the short-term lease recognition exemption for all leases that qualify. This means, for those leases that qualify, the Company (as lessee) would not recognize ROU assets or lease liabilities. The Company (as lessee and lessor) also currently expects to elect the practical expedient to not separate lease and non-lease components for all of its leases that qualify.
ASU No. 2014-9,
Revenue Recognition – Revenue from Contracts with Customers (Topic 606)
In May 2014, the FASB issued a new standard related to revenue recognition. Under the standard, revenue is recognized when a customer obtains control of promised goods or services in an amount that reflects the consideration the entity expects to receive in exchange for those goods or services. In addition, the standard requires disclosure of the nature, amount, timing, and uncertainty of revenue and cash flows arising from contracts with customers. The Company adopted the standard effective October 1, 2018, using the modified retrospective approach with a cumulative effect adjustment included in Retained Earnings upon the date of adoption. Results for prior period amounts will not be adjusted and will continue to be reported in accordance with the Company’s historical accounting policies. The Company implemented internal controls and key system functionality to enable the preparation of financial information on adoption.
The most significant impact of the standard relates to the Company's accounting for revenues of prepaid cards in its MPS division, specifically, breakage on unregistered, unused cardholder balances. For such balances, the Company recognizes breakage revenue predominantly after the month of the card balance expiration rather than ratably over the life of the prepaid card. The Company performed an analysis on such revenues and has determined an approximate impact to Retained Earnings of
$2.0 million
in additional earned revenue upon adoption at October 1, 2018. All other revenue streams remain substantially unchanged.
ASU 2016-15,
Statement of Cash Flows (Topic 230): Classification of Certain Cash Receipts and Cash Payments
This ASU addresses eight classification issues related to the statement of cash flows including; debt prepayment or debt extinguishment costs, settlement of zero-coupon bonds, contingent consideration payments made after a business combination, proceeds from the settlement of insurance claims, proceeds from the settlement of corporate-owned life insurance policies, including bank-owned life insurance policies, distributions received from equity method investees, beneficial interests in securitization transactions, and separately identifiable cash flows and application of the predominance principle. This update is effective for annual periods and interim periods in fiscal years beginning after December 15, 2017, and the Company is currently assessing the potential impact to the Consolidated Financial Statements.
ASU 2017-08,
Receivables - Nonrefundable Fees and Other Costs (Subtopic 310-20): Premium Amortization on Purchased Callable Debt Securities
This ASU requires entities to shorten the amortization period for certain callable debt securities held at a premium. Specifically, the amendments in this update require the premium to be amortized to the earliest call date. The amendments do not require an accounting change for securities held at a discount; the discount continues to be amortized to maturity. The amendments in this update are effective for fiscal years, and interim periods within those fiscal years, beginning after December 15, 2018, and is not expected to have an impact on the Consolidated Financial Statements.
121
ASU 2017-12,
Derivatives and Hedging (Topic 815): Targeted Improvements to Accounting for Hedging Activities
This ASU targets improving the accounting treatment for hedging activities and provides more flexibility in defining what can be hedged, less earnings volatility due to ineffective hedges, and less arduous documentation requirements. The ASU also offers the ability to reclassify prepayable debt securities from HTM to AFS and subsequently sell the securities, as long as the securities are eligible to be hedged. This update is effective for annual periods and interim periods in fiscal years beginning after December 15, 2018, with early adoption permitted in any interim period or fiscal year before the effective date. The Company early adopted this ASU as of October 1, 2017. The Company reclassified certain prepayable debt securities from HTM to AFS during the first quarter of fiscal year 2018. See Note 6. Securities for additional information on the securities reclassified.
ASU 2016-01,
Financial Instruments - Overall (Subtopic 825-10): Recognition and Measurement of Financial Assets and Liabilities
ASU 2018-03,
Technical Corrections and Improvements to Financial Instruments - Overall (Subtopic 825-10)
These ASUs make revisions to seven areas of Subtopic 825-10, including that equity investments will be required to be measured at fair value with changes in fair value being recognized in net income, simplifying the impairment assessment for equity investments without readily determinable fair value, eliminating the requirement for public business entities to disclose the method(s) and significant assumptions used to estimate fair value for financial instruments measured at amortized cost, requiring public business entities to use exit price notions when measuring fair value of financial instruments, requiring separate presentation in other comprehensive income of the portion of total change in fair value of a liability resulting from a change in the instrument specific credit risk, requiring separate presentation of financial assets and liabilities by measurement category and form of financial asset, and clarifying that an entity should evaluate the need for a valuation allowance on a deferred tax asset related to AFS securities in combination with the entity’s other deferred tax assets. The improvements become effective in fiscal years beginning after December 15, 2017. The Company does not expect these improvements to have a material impact on its Consolidated Financial Statements.
ASU 2016-18,
Statement of Cash Flows (Topic 230): Restricted Cash
This ASU addresses the existing diversity in classifying and presenting changes in restricted cash on the statements of cash flows. The amendments in this ASU require that the statements of cash flows explain the change during the period of total cash, cash equivalents, and amounts generally described as restricted cash or restricted cash equivalents. This ASU is effective for fiscal years beginning after December 15, 2017 and is not expected to have a material impact to the Company.
ASU 2017-01,
Clarifying the Definition of a Business
This ASU amends Topic 805 by providing a screen to determine when a set of assets and activities is not a business. The screen reduces the number of transactions that need to be further evaluated. The amendments in this ASU provide a framework to assist entities in evaluating whether both an input and substantive process are present and narrows the definition of “output” so the term is consistent with how outputs are described in Topic 606. The definition of a business affects many areas of accounting including, acquisitions, disposals, goodwill and consolidation. This ASU becomes effective for fiscal years beginning after December 15, 2017 and are applied prospectively. This ASU is not expected to materially impact the Company.
ASU 2017-04
, Intangibles - Goodwill and Other (Topic 350): Simplifying the Test for Goodwill Impairment
This ASU amends Topic 350 for entities performing the two-step test to determine the amount, if any, of goodwill impairment. Under this ASU, the quantitative impairment analysis of goodwill is now only a one step test where the amount of impairment, if any, is equal to the excess of the reporting unit carrying amount over the reporting unit fair value. This ASU does not amend Topic 350 for entities performing a qualitative assessment of goodwill. The Company will early adopt this ASU beginning October 1, 2018 and will apply the guidance within, as necessary, on a prospective basis. As the Company performs a qualitative assessment over goodwill, the adoption of this ASU is not expected to have a material impact to the Company.
ASU 2017-05,
Other Income - Gains and Losses from the Derecognition of Nonfinancial Assets (Subtopic 610-20): Clarifying the Scope of Asset Derecognition Guidance and Accounting for Partial Sales of Nonfinancial Assets
This ASU clarifies the scope of nonfinancial asset guidance in Subtopic 610-20 and provides guidance on the accounting for partial sales of nonfinancial assets within the scope of Subtopic 610-20. The amendments within this ASU are effective for annual reporting periods beginning after December 15, 2017. The amendments in this ASU are more impactful to the real estate, power and utilities, and alternative energy industries and is not expected to have a material impact on the Company's Consolidated Financial Statements.
122
ASU 2018-02
,
Income Statement - Reporting Comprehensive Income (Topic 220): Reclassification of Certain Tax Effects from Accumulated Other Comprehensive Income
This ASU allows a reclassification from accumulated other comprehensive income to retained earnings for stranded tax effects resulting from the Tax Act. The reclassification is not required but is an accounting policy election that must be disclosed during the year of adoption. This ASU will be effective for fiscal years beginning after December 15, 2018 with earlier adoption permitted. At this time, the Company does not expect to elect the reclassification option.
ASU 2018-07
,
Compensation - Stock Compensation (Topic 718): Improvements to Nonemployee Share-Based Payment Accounting
This ASU expands the scope of Topic 718 to include share-based payment transactions for acquiring goods or services from nonemployees. Key improvements from this ASU include clarifying the measurement date to the grant date and eliminating the requirement to reassess classification of such awards upon vesting. Any share-based awards to nonemployees classified as a liability that are not settled prior to adoption and any equity classified awards for which a measurement date has not been established will require remeasurement through a cumulative-effect adjustment to retained earnings as of the beginning of the year of adoption. Upon transition, nonemployee awards are required to be measured at fair value as of the adoption date and must not remeasure assets that are completed. The Company will early adopt this ASU beginning October 1, 2018. This ASU is not expected to materially impact the Company's Consolidated Financial Statements.
ASU 2018-09,
Codification Improvements
This ASU represents changes in various Subtopics to clarify, correct errors, or make minor improvements. The amendments are not expected to have a significant effect on current accounting practice. Subtopics impacted by this ASU that are relevant to the Company include Subtopic 220-10 Income Statement - Reporting Comprehensive Income-Overall, Subtopic 718-740 Compensation - Stock Compensation-Income Taxes, Subtopic 805-740 Business Combinations - Income Taxes, and Subtopic 820-10 Fair Value Measurement-Overall. Many of the amendments within this ASU do not require transition and are effective upon issuance. However, some are not effective until fiscal years beginning after December 15, 2018. The amendments within this ASU are not expected to materially impact the Company's Consolidated Financial Statements.
ASU 2018-13
,
Fair Value Measurement (Topic 820): Disclosure Framework - Changes to the Disclosure Requirements for Fair Value Measurement
This ASU modifies the disclosure requirements on fair value measurements in Topic 820, including the removal, modification to, and addition of certain disclosure requirements. This ASU will be effective for fiscal years beginning after December 15, 2019 with early adoption permitted. The majority of the disclosure changes are to be applied on a prospective basis. The Company is currently in the process of reviewing this ASU to determine whether the modifications within will be adopted prior to the effective date. Although this ASU has a significant impact to the Company’s fair value disclosures, no additional impact to the Consolidated Financial Statements is expected.
CRESTMARK BANCORP, INC
On August 1, 2018, the Company completed the Crestmark Acquisition. Crestmark previously provided business-to-business commercial financing. With this acquisition, the Company acquired all assets and assumed all liabilities of Crestmark at a purchase price of
$295.8 million
paid in stock. The aggregate value of the acquisition was based upon the issuance of
9,919,512
shares of Meta common stock and the closing price of Meta shares on July 31, 2018 of
$29.82
.
The Company recorded goodwill of
$204.5 million
associated with the acquisition. Goodwill resulted from expected operational synergies and expanded product lines. See Note 20 to the Consolidated Financial Statements for further information on goodwill.
123
The Company has included the financial results of Crestmark in its Consolidated Financial Statements as of the acquisition date. The Crestmark Acquisition has been accounted for under the acquisition method of accounting. The assets and liabilities, both tangible and intangible, were recorded at their estimated fair values as of the acquisition date. The Company made significant estimates and exercised judgment in estimating fair values and accounting for the acquired assets and liabilities. The Company recognized
$9.0 million
in transaction-related expenses during fiscal 2018. The transaction expenses are reflected on the Consolidated Statements of Operations primarily under legal and consulting.
The following table represents the approximate fair value of the assets acquired and liabilities assumed of Crestmark on the Consolidated Statements of Financial Condition as of August 1, 2018:
|
|
As of August 1, 2018
|
||
|
|
(Dollars in Thousands)
|
||
|
Fair value of consideration paid
|
|
||
|
Cash paid
|
$
|
6
|
|
|
Stock issued
|
295,767
|
|
|
|
Total consideration paid
|
295,773
|
|
|
|
|
|||
|
Fair value of assets acquired
|
|||
|
Cash and cash equivalents
|
58,858
|
|
|
|
Investment & MBS securities
|
25,349
|
|
|
|
Loan and lease receivables held for sale
|
17,494
|
|
|
|
Loan and lease receivables held for investment
|
1,046,010
|
|
|
|
Federal Home Loan Bank stock, at cost
|
33
|
|
|
|
Accrued interest receivable
|
5,381
|
|
|
|
Premises, furniture, and equipment
|
18,458
|
|
|
|
Rental equipment
|
98,977
|
|
|
|
Foreclosed real estate and repossessed assets
|
1,209
|
|
|
|
Intangible assets
|
28,253
|
|
|
|
Other assets
|
22,170
|
|
|
|
Total assets
|
1,322,192
|
|
|
|
Fair value of liabilities assumed
|
|||
|
Time certificates of deposits
|
295,590
|
|
|
|
Wholesale certificates of deposits
|
825,076
|
|
|
|
Total deposits
|
1,120,666
|
|
|
|
Short-term debt
|
11,642
|
|
|
|
Long-term debt
|
3,609
|
|
|
|
Accrued interest payable
|
3,581
|
|
|
|
Accrued expenses and other liabilities
|
88,301
|
|
|
|
Total liabilities assumed
|
1,227,799
|
|
|
|
Fair value of non-controlling interest assumed
|
|||
|
Non-controlling interest
|
3,167
|
|
|
|
Total non-controlling interest
|
3,167
|
|
|
|
Fair value of net assets acquired
|
91,226
|
|
|
|
Goodwill resulting from acquisition
|
204,547
|
|
|
124
Crestmark was consolidated into the Company's Consolidated Financial Statements starting on August 1, 2018. The aggregate net interest income and net income of Crestmark consolidated into the Company's financial statements since the date of acquisition was
$19.1 million
and
$9.7 million
, respectively, for the year ended September 30, 2018. The following financial information presents the Company's results as if the Crestmark Acquisition on August 1, 2018 had occurred on October 1, 2016:
|
Twelve Months Ended
|
|||||||
|
September 30,
|
|||||||
|
(Dollars in Thousands Except Share and Per Share Data)
|
2018
|
2017
|
|||||
|
Net interest income
|
$
|
206,822
|
|
$
|
181,184
|
|
|
|
Net income attributable to parent
|
74,640
|
|
64,390
|
|
|||
|
Basic earnings per share
|
1.91
|
|
1.71
|
|
|||
|
Diluted earnings per share
|
1.91
|
|
1.70
|
|
|||
These pro forma results are based on estimates and assumptions, which the Company believes are reasonable. They are not the results that would have been realized had the Crestmark Acquisition actually occurred on October 1, 2016 and are not necessarily indicative of the Company's Consolidated Statements of Operations in future periods. The pro forma results include adjustments related to purchase accounting, primarily related to amortization of intangibles created and accretion of loan discount.
SCS
On December 14, 2016, the Company, through MetaBank, completed the acquisition of substantially all of the assets and specified liabilities of Specialty Consumer Services LP ("SCS"). The assets acquired by MetaBank in the SCS acquisition include the SCS trade name, propriety underwriting model and loan management system and other assets. SCS primarily provides consumer tax advance and other consumer credit services through its loan management services and other financial products.
Under the terms of the purchase agreement, the aggregate purchase price paid at closing, which was based upon the December 14, 2016 tangible book value of SCS, was approximately
$7.5 million
in cash and the issuance of
339,984
shares of Meta common stock. In addition, contingent cash consideration of
$17.5 million
was paid out in the third quarter of fiscal 2017 and equity contingent consideration of
793,293
shares of Meta common stock was paid in the fourth quarter of fiscal 2017 following the achievement of specified performance benchmarks (described more fully below). The Company acquired assets with approximate fair values of
$28.3 million
of intangible assets, including customer relationships, trademark, and non-compete agreements, and negligible other assets, resulting in goodwill of
$31.4 million
.
Subject to the equity earn-out terms of the purchase agreement, SCS was eligible to receive up to an aggregate of
793,293
shares of Meta common stock within
20
days after the applicable equity earn-out statement was deemed final if certain targets achieved. The equity earn-out measurements were as follows; 1) if, as of an equity earn-out measurement date, the anticipated 2018 measured gross profit met or exceeded the statement amount, MetaBank would deliver to SCS a stated number of shares of Meta common stock; 2) if, as of an equity earn-out measurement date, the aggregate anticipated loan volume under all 2018 eligible contracts was greater than or equal to the agreed upon volume amount, then MetaBank would deliver to SCS a stated number of shares of Meta common stock; and 3) if, as of an equity earn-out measurement date, each agreement specified in the contract was in effect and none of such agreements was amended or modified as of such time (except as approved in writing by the President of MetaBank, in his or her sole discretion), then MetaBank would deliver to SCS a stated number of shares of Meta l common stock. None of the equity earn-out payments was contingent on the achievement of any of the other equity earn-out targets. Upon the determined equity earn-out measurement date, MetaBank determined that each of the three earn-out measurement targets was achieved and the Company issued an aggregate of 793,293 shares of Meta common stock in the fourth quarter of fiscal 2017.
125
Subject to the cash earn-out terms of the purchase agreement, MetaBank agreed to pay to SCS an amount equal to
100%
of the 2017 measured business gross profit up to a maximum of
$17.5 million
within
20
days after the date on which each determination of the cash earn-out payment was deemed final. During the third quarter of fiscal 2017, MetaBank paid out the
$17.5 million
of contingent cash consideration to SCS based upon the measured business gross profit.
The Company has included the financial results of SCS in its Consolidated Financial Statements subsequent to the acquisition date. The fair value of the liability for the cash contingent consideration was approximately
$17.3 million
and was included in other liabilities in the Company's Consolidated Statements of Financial Condition. The fair value of the equity contingent consideration was approximately
$24.1 million
at closing and was included in additional paid-in capital in the Company's Consolidated Statements of Financial Condition. The respective fair values of the liability and equity were estimated using an option-based income valuation method with significant inputs that were not observable in the market and thus represent a Level 3 fair value measurement as defined in the FASB's Accounting Standards Codification ("ASC") 820,
Fair Value Measurements and Disclosures
. The significant inputs in the Level 3 measurement not supported by market activity included the Company's probability assessments of the expected future cash flows related to the Company's acquisition of SCS during the earn-out period.
The following table represents the approximate fair value of assets acquired from and liabilities recorded of SCS on the Consolidated Statements of Financial Condition as of December 14, 2016.
|
|
As of December 14, 2016
|
||
|
|
(Dollars in Thousands)
|
||
|
Fair value of consideration paid
|
|||
|
Cash
|
$
|
7,548
|
|
|
Stock issued
|
10,789
|
|
|
|
Paid Consideration
|
18,337
|
|
|
|
Contingent consideration - cash
|
17,252
|
|
|
|
Contingent consideration - equity
|
24,142
|
|
|
|
Contingent consideration payable
|
41,394
|
|
|
|
Total consideration paid
|
59,731
|
|
|
|
|
|
|
|
|
Fair value of assets acquired
|
|
|
|
|
Intangible assets
|
28,310
|
|
|
|
Other assets
|
2
|
|
|
|
Total assets
|
28,312
|
|
|
|
Fair value of net assets acquired
|
28,312
|
|
|
|
Goodwill resulting from acquisition
|
$
|
31,419
|
|
The SCS transaction has been accounted for under the acquisition method of accounting. The assets and liabilities, both tangible and intangible, were recorded at their estimated fair values as of the transaction date. The Company made significant estimates and exercised judgment in estimating fair values and accounting for such acquired assets and liabilities. Upon receipt of final fair value estimates on certain assets, liabilities, and contingent considerations, which must be within one year of the acquisition date, the Company made final adjustments to the purchase price allocation and retrospectively adjusted the recorded goodwill.
The Company recognized goodwill of
$31.4 million
as of December 14, 2016, which was calculated as the excess of both the adjusted consideration exchanged and the liabilities recorded as compared to the fair value of identifiable assets acquired. Goodwill resulted from expected operational synergies and expanded product lines and is expected to be deductible for tax purposes. See Note 20 to the Consolidated Financial Statements for further information on goodwill.
126
The Company recognized
$0.8 million
of pre-tax transaction related expenses during the fiscal year ended 2017. The transaction expenses are reflected on the Consolidated Statements of Operations primarily under legal and consulting.
EPS FINANCIAL
On November 1, 2016, the Company, through MetaBank, completed the acquisition of substantially all of the assets and certain liabilities of EPS Financial, LLC ("EPS") from privately-held Drake Enterprises, Ltd. ("Drake"). The assets acquired by MetaBank in the EPS acquisition include the EPS trade name, operating platform, and other assets. EPS is a leading provider of comprehensive tax-related financial transaction solutions for over
10,000
ERO's nationwide, offering a one-stop-shop for all tax preparer financial transactions. These solutions include a full-suite of refund settlement products, prepaid payroll card solutions and merchant services.
Under the terms of the purchase agreement, the aggregate purchase price, which was based upon the November 1, 2016 tangible book value of EPS, included the payment of
$21.9 million
in cash, after adjustments, and the issuance of
1,107,537
shares of Meta common stock. The Company acquired assets with approximate fair values of
$17.9 million
of intangible assets, including customer relationships, trademark, and non-compete agreements, and
$0.1 million
of other assets, resulting in
$30.4 million
of goodwill.
The following table represents the approximate fair value of assets acquired and liabilities assumed of EPS on the Consolidated Statements of Financial Condition as of November 1, 2016:
|
|
As of November 1, 2016
|
||
|
|
(Dollars in Thousands)
|
||
|
Fair value of consideration paid
|
|||
|
Cash
|
$
|
21,877
|
|
|
Stock issued
|
26,507
|
|
|
|
Total consideration paid
|
48,384
|
|
|
|
|
|
|
|
|
Fair value of assets acquired
|
|||
|
Intangible assets
|
17,930
|
|
|
|
Other assets
|
79
|
|
|
|
Total assets
|
18,009
|
|
|
|
Fair value of net assets acquired
|
18,009
|
|
|
|
Goodwill resulting from acquisition
|
$
|
30,375
|
|
The Company has included the financial results of EPS in its Consolidated Financial Statements subsequent to the acquisition date. The EPS transaction has been accounted for under the acquisition method of accounting. The assets and liabilities, both tangible and intangible, were recorded at their estimated fair values as of the transaction date. The Company made significant estimates and exercised judgment in estimating fair values and accounting for such acquired assets and liabilities.
The Company recognized goodwill of
$30.4 million
as of November 1, 2016, which is calculated as the excess of both the consideration exchanged and the liabilities assumed, which were negligible, as compared to the fair value of identifiable assets acquired. Goodwill resulted from expected operational synergies and expanded product lines and is expected to be deductible for tax purposes. See Note 20 to the Consolidated Financial Statements for further information on goodwill.
The Company recognized
$0.5 million
of pre-tax transaction-related expenses during fiscal 2017. The transaction expenses are reflected on the Consolidated Statements of Operations primarily under legal and consulting.
127
Loans and Leases
Year-end loans and leases receivable were as follows:
|
|
September 30, 2018
|
September 30, 2017
|
|||||
|
|
(Dollars in Thousands)
|
||||||
|
National Lending
|
|||||||
|
Commercial finance
|
$
|
1,509,849
|
|
$
|
255,308
|
|
|
|
Consumer finance
|
335,361
|
|
140,229
|
|
|||
|
Tax services
|
1,073
|
|
192
|
|
|||
|
Total National Lending
|
1,846,283
|
|
395,729
|
|
|||
|
Community Banking
|
|||||||
|
Commercial and multi-family real estate
|
748,579
|
|
585,510
|
|
|||
|
1-4 family real estate
|
223,482
|
|
196,706
|
|
|||
|
Agricultural
|
60,498
|
|
95,394
|
|
|||
|
Commercial operating
|
42,311
|
|
30,718
|
|
|||
|
Consumer
|
23,836
|
|
22,775
|
|
|||
|
Total Community Banking
|
1,098,706
|
|
931,103
|
|
|||
|
Total gross loans and leases receivable
|
2,944,989
|
|
1,326,832
|
|
|||
|
Allowance for loan and lease losses
|
(13,040
|
)
|
(7,534
|
)
|
|||
|
Net deferred loan origination fees
|
(250
|
)
|
(1,461
|
)
|
|||
|
Total loans and leases receivable, net
|
$
|
2,931,699
|
|
$
|
1,317,837
|
|
|
Annual activity in the allowance for loan and lease losses was as follows:
|
Year ended September 30,
|
2018
|
|
2017
|
|
2016
|
|
|||||
|
|
(Dollars in Thousands)
|
||||||||||
|
Beginning balance
|
$
|
7,534
|
|
$
|
5,635
|
|
$
|
6,255
|
|
||
|
Provision for loan and lease losses
|
29,433
|
|
10,589
|
|
4,605
|
|
|||||
|
Recoveries
|
2,037
|
|
307
|
|
147
|
|
|||||
|
Charge offs
|
(25,964
|
)
|
(8,997
|
)
|
(5,372
|
)
|
|||||
|
Ending balance
|
$
|
13,040
|
|
$
|
7,534
|
|
$
|
5,635
|
|
||
128
Allowance for loan and lease losses and recorded investment in loans and leases at
September 30, 2018
and
2017
were as follows:
|
Allowance for loan and lease losses:
|
Beginning balance
|
Provision (recovery) for loan and lease losses
|
Charge offs
|
Recoveries
|
Ending balance
|
||||||||||||||
|
Year Ended September 30, 2018
|
(Dollars in Thousands)
|
||||||||||||||||||
|
National Lending
|
|||||||||||||||||||
|
Commercial finance
|
$
|
800
|
|
$
|
1,976
|
|
$
|
(2,643
|
)
|
$
|
1,169
|
|
$
|
1,302
|
|
||||
|
Consumer finance
|
—
|
|
5,113
|
|
(1,443
|
)
|
—
|
|
3,670
|
|
|||||||||
|
Tax services
|
5
|
|
21,344
|
|
(21,802
|
)
|
453
|
|
—
|
|
|||||||||
|
Total National Lending
|
805
|
|
28,433
|
|
(25,888
|
)
|
1,622
|
|
4,972
|
|
|||||||||
|
Community Banking
|
|||||||||||||||||||
|
Commercial and multi-family real estate
|
2,670
|
|
3,377
|
|
—
|
|
—
|
|
6,047
|
|
|||||||||
|
1-4 family real estate
|
803
|
|
(168
|
)
|
(45
|
)
|
—
|
|
590
|
|
|||||||||
|
Agricultural
|
2,574
|
|
(1,769
|
)
|
—
|
|
411
|
|
1,216
|
|
|||||||||
|
Commercial operating
|
150
|
|
23
|
|
—
|
|
—
|
|
173
|
|
|||||||||
|
Consumer
|
6
|
|
64
|
|
(31
|
)
|
3
|
|
42
|
|
|||||||||
|
Total Community Banking
|
6,203
|
|
1,527
|
|
(76
|
)
|
414
|
|
8,068
|
|
|||||||||
|
Unallocated
|
527
|
|
(527
|
)
|
—
|
|
—
|
|
—
|
|
|||||||||
|
Total
|
7,534
|
|
29,433
|
|
(25,964
|
)
|
2,037
|
|
13,040
|
|
|||||||||
|
Allowance for loan and lease losses:
|
Beginning balance
|
Provision (recovery) for loan and lease losses
|
Charge offs
|
Recoveries
|
Ending balance
|
||||||||||||||
|
Year Ended September 30, 2017
|
(Dollars in Thousands)
|
||||||||||||||||||
|
National Lending
|
|||||||||||||||||||
|
Commercial finance
|
$
|
589
|
|
$
|
776
|
|
$
|
(626
|
)
|
$
|
61
|
|
$
|
800
|
|
||||
|
Consumer finance
|
—
|
|
—
|
|
—
|
|
—
|
|
—
|
|
|||||||||
|
Tax services
|
6
|
|
7,612
|
|
(7,842
|
)
|
229
|
|
5
|
|
|||||||||
|
Total National Lending
|
595
|
|
8,388
|
|
(8,468
|
)
|
290
|
|
805
|
|
|||||||||
|
Community Banking
|
|||||||||||||||||||
|
Commercial and multi-family real estate
|
2,198
|
|
610
|
|
(138
|
)
|
—
|
|
2,670
|
|
|||||||||
|
1-4 family real estate
|
654
|
|
149
|
|
—
|
|
—
|
|
803
|
|
|||||||||
|
Agricultural
|
1,474
|
|
1,088
|
|
—
|
|
12
|
|
2,574
|
|
|||||||||
|
Commercial operating
|
110
|
|
425
|
|
(390
|
)
|
5
|
|
150
|
|
|||||||||
|
Consumer
|
51
|
|
(44
|
)
|
(1
|
)
|
—
|
|
6
|
|
|||||||||
|
Total Community Banking
|
4,487
|
|
2,228
|
|
(529
|
)
|
17
|
|
6,203
|
|
|||||||||
|
Unallocated
|
553
|
|
(26
|
)
|
—
|
|
—
|
|
527
|
|
|||||||||
|
Total
|
5,635
|
|
10,589
|
|
(8,997
|
)
|
307
|
|
7,534
|
|
|||||||||
129
|
Allowance
|
Loans and Leases
|
||||||||||||||||||||||
|
Recorded Investment
|
Ending balance: individually evaluated for impairment
|
Ending balance: collectively evaluated for impairment
|
Total
|
Ending balance: individually evaluated for impairment
|
Ending balance: collectively evaluated for impairment
|
Total
|
|||||||||||||||||
|
Year Ended September 30, 2018
|
(Dollars in Thousands)
|
||||||||||||||||||||||
|
National Lending
|
|||||||||||||||||||||||
|
Commercial finance
|
$
|
588
|
|
$
|
714
|
|
$
|
1,302
|
|
$
|
13,612
|
|
$
|
1,496,237
|
|
$
|
1,509,849
|
|
|||||
|
Consumer finance
|
—
|
|
3,670
|
|
3,670
|
|
—
|
|
335,361
|
|
335,361
|
|
|||||||||||
|
Tax services
|
—
|
|
—
|
|
—
|
|
—
|
|
1,073
|
|
1,073
|
|
|||||||||||
|
Total National Lending
|
588
|
|
4,384
|
|
4,972
|
|
13,612
|
|
1,832,671
|
|
1,846,283
|
|
|||||||||||
|
Community Banking
|
|||||||||||||||||||||||
|
Commercial and multi-family real estate
|
—
|
|
6,047
|
|
6,047
|
|
405
|
|
748,174
|
|
748,579
|
|
|||||||||||
|
1-4 family real estate
|
—
|
|
590
|
|
590
|
|
94
|
|
223,388
|
|
223,482
|
|
|||||||||||
|
Agricultural
|
—
|
|
1,216
|
|
1,216
|
|
1,454
|
|
59,044
|
|
60,498
|
|
|||||||||||
|
Commercial operating
|
—
|
|
173
|
|
173
|
|
46
|
|
42,265
|
|
42,311
|
|
|||||||||||
|
Consumer
|
—
|
|
42
|
|
42
|
|
—
|
|
23,836
|
|
23,836
|
|
|||||||||||
|
Total Community Banking
|
—
|
|
8,068
|
|
8,068
|
|
1,999
|
|
1,096,707
|
|
1,098,706
|
|
|||||||||||
|
Total
|
588
|
|
12,452
|
|
13,040
|
|
15,611
|
|
2,929,378
|
|
2,944,989
|
|
|||||||||||
|
Allowance
|
Loans and Leases
|
||||||||||||||||||||||
|
Recorded Investment
|
Ending balance: individually evaluated for impairment
|
Ending balance: collectively evaluated for impairment
|
Total
|
Ending balance: individually evaluated for impairment
|
Ending balance: collectively evaluated for impairment
|
Total
|
|||||||||||||||||
|
Year Ended September 30, 2017
|
(Dollars in Thousands)
|
||||||||||||||||||||||
|
National Lending
|
|||||||||||||||||||||||
|
Commercial finance
|
$
|
—
|
|
$
|
800
|
|
$
|
800
|
|
$
|
—
|
|
$
|
255,308
|
|
$
|
255,308
|
|
|||||
|
Consumer finance
|
—
|
|
—
|
|
—
|
|
—
|
|
140,229
|
|
140,229
|
|
|||||||||||
|
Tax services
|
—
|
|
5
|
|
5
|
|
—
|
|
192
|
|
192
|
|
|||||||||||
|
Total National Lending
|
—
|
|
805
|
|
805
|
|
—
|
|
395,729
|
|
395,729
|
|
|||||||||||
|
Community Banking
|
|||||||||||||||||||||||
|
Commercial and multi-family real estate
|
—
|
|
2,670
|
|
2,670
|
|
1,109
|
|
584,401
|
|
585,510
|
|
|||||||||||
|
1-4 family real estate
|
—
|
|
803
|
|
803
|
|
72
|
|
196,634
|
|
196,706
|
|
|||||||||||
|
Agricultural
|
—
|
|
2,574
|
|
2,574
|
|
—
|
|
95,394
|
|
95,394
|
|
|||||||||||
|
Commercial operating
|
—
|
|
150
|
|
150
|
|
—
|
|
30,718
|
|
30,718
|
|
|||||||||||
|
Consumer
|
—
|
|
6
|
|
6
|
|
—
|
|
22,775
|
|
22,775
|
|
|||||||||||
|
Total Community Banking
|
—
|
|
6,203
|
|
6,203
|
|
—
|
|
931,103
|
|
931,103
|
|
|||||||||||
|
Unallocated
|
—
|
|
527
|
|
527
|
|
—
|
|
—
|
|
—
|
|
|||||||||||
|
Total
|
—
|
|
7,534
|
|
7,534
|
|
1,181
|
|
1,325,651
|
|
1,326,832
|
|
|||||||||||
130
The asset classification of loans and leases at
September 30, 2018
, and
2017
, were as follows:
|
Asset Classification
|
Pass
|
Watch
|
Special Mention
|
Substandard
|
Total
|
||||||||||||||
|
Year Ended September 30, 2018
|
(Dollars in Thousands)
|
||||||||||||||||||
|
National Lending
|
|||||||||||||||||||
|
Commercial finance
|
$
|
1,379,902
|
|
$
|
—
|
|
$
|
116,334
|
|
$
|
13,613
|
|
1,509,849
|
|
|||||
|
Consumer finance
|
335,361
|
|
—
|
|
—
|
|
—
|
|
335,361
|
|
|||||||||
|
Tax services
|
1,073
|
|
—
|
|
—
|
|
—
|
|
1,073
|
|
|||||||||
|
Total National Lending
|
1,716,336
|
|
—
|
|
116,334
|
|
13,613
|
|
1,846,283
|
|
|||||||||
|
Community Banking
|
|||||||||||||||||||
|
Commercial and multi-family real estate
|
736,134
|
|
12,251
|
|
194
|
|
—
|
|
748,579
|
|
|||||||||
|
1-4 family real estate
|
222,883
|
|
281
|
|
239
|
|
79
|
|
223,482
|
|
|||||||||
|
Agricultural
|
42,292
|
|
2,447
|
|
4,872
|
|
10,887
|
|
60,498
|
|
|||||||||
|
Commercial operating
|
42,311
|
|
—
|
|
—
|
|
—
|
|
42,311
|
|
|||||||||
|
Consumer
|
23,580
|
|
256
|
|
—
|
|
—
|
|
23,836
|
|
|||||||||
|
Total Community Banking
|
1,067,200
|
|
15,235
|
|
5,305
|
|
10,966
|
|
1,098,706
|
|
|||||||||
|
Total Loans and Leases
|
$
|
2,783,536
|
|
$
|
15,235
|
|
$
|
121,639
|
|
$
|
24,579
|
|
$
|
2,944,989
|
|
||||
|
Asset Classification
|
Pass
|
Watch
|
Special Mention
|
Substandard
|
Total
|
||||||||||||||
|
Year Ended September 30, 2017
|
(Dollars in Thousands)
|
||||||||||||||||||
|
National Lending
|
|||||||||||||||||||
|
Commercial finance
|
$
|
255,308
|
|
$
|
—
|
|
$
|
—
|
|
$
|
—
|
|
255,308
|
|
|||||
|
Consumer finance
|
140,229
|
|
—
|
|
—
|
|
—
|
|
140,229
|
|
|||||||||
|
Tax services
|
192
|
|
—
|
|
—
|
|
—
|
|
192
|
|
|||||||||
|
Total National Lending
|
395,729
|
|
—
|
|
—
|
|
—
|
|
395,729
|
|
|||||||||
|
Community Banking
|
|||||||||||||||||||
|
Commercial and multi-family real estate
|
574,730
|
|
10,200
|
|
201
|
|
379
|
|
585,510
|
|
|||||||||
|
1-4 family real estate
|
195,838
|
|
525
|
|
247
|
|
96
|
|
196,706
|
|
|||||||||
|
Agricultural
|
45,770
|
|
6,547
|
|
2,939
|
|
40,138
|
|
95,394
|
|
|||||||||
|
Commercial operating
|
30,718
|
|
—
|
|
—
|
|
—
|
|
30,718
|
|
|||||||||
|
Consumer
|
22,775
|
|
—
|
|
—
|
|
—
|
|
22,775
|
|
|||||||||
|
Total Community Banking
|
869,831
|
|
17,272
|
|
3,387
|
|
40,613
|
|
931,103
|
|
|||||||||
|
Total Loans and Leases
|
$
|
1,265,560
|
|
$
|
17,272
|
|
$
|
3,387
|
|
$
|
40,613
|
|
$
|
1,326,832
|
|
||||
Federal regulations provide for the classification of loans and other assets such as debt and equity securities considered by the Bank's regulator, the Office of the Comptroller of the Currency (the “OCC”), to be of lesser quality as “substandard,” “doubtful” or “loss.” The loan classification and risk rating definitions are as follows:
Pass- A pass asset is of sufficient quality in terms of repayment, collateral and management to preclude a special mention or an adverse rating.
Watch- A watch asset is generally a credit performing well under current terms and conditions but with identifiable weakness meriting additional scrutiny and corrective measures. Watch is not a regulatory classification but can be used to designate assets that are exhibiting one or more weaknesses that deserve management’s attention. These assets are of better quality than special mention assets.
131
Special Mention- Special mention assets are a credit with potential weaknesses deserving management’s close attention and, if left uncorrected, may result in deterioration of the repayment prospects for the asset. Special mention assets are not adversely classified and do not expose an institution to sufficient risk to warrant adverse classification. Special mention is a temporary status with aggressive credit management required to garner adequate progress and move to watch or higher.
The adverse classifications are as follows:
Substandard- A substandard asset is inadequately protected by the net worth and/or repayment ability or by a weak collateral position. Assets so classified will have well-defined weaknesses creating a distinct possibility the Bank will sustain some loss if the weaknesses are not corrected. Loss potential does not have to exist for an asset to be classified as substandard.
Doubtful- A doubtful asset has weaknesses similar to those classified substandard, with the degree of weakness causing the likely loss of some principal in any reasonable collection effort. Due to pending factors, the asset’s classification as loss is not yet appropriate.
Loss- A loss asset is considered uncollectible and of such little value that the asset’s continuance on the Bank’s balance sheet is no longer warranted. This classification does not necessarily mean an asset has no recovery or salvage value leaving room for future collection efforts.
Loans and leases, or portions thereof, are charged off when collection of principal becomes doubtful. Generally, this is associated with a delay or shortfall in payments of 210 days or more for commercial insurance premium finance, 180 days or more for the purchased student loan portfolios, 120 days or more for consumer credit products and leases, and 90 days or more for community banking loans and commercial finance loans. Action is taken to charge off ERO loans if such loans have not been collected by the end of June and taxpayer advance loans if such loans have not been collected by the end of the calendar year. Non-accrual loans and troubled debt restructurings are generally considered impaired.
Past due loans and leases at
September 30, 2018
and
2017
were as follows
:
|
Accruing and Non-accruing Loans and Leases
|
Non-performing Loans and Leases
|
|||||||||||||||||||||||||
|
Past Due Loans and Leases
|
30-59 Days
Past Due
|
60-89 Days
Past Due
|
>
89 Days Past Due
|
Total Past
Due
|
Current
|
Total Loans and Leases
Receivable
|
> 89 Days Past Due and Accruing
|
Non-accrual balance
|
Total
|
|||||||||||||||||
|
Year Ended September 30, 2018
|
(Dollars in Thousands)
|
|||||||||||||||||||||||||
|
National Lending
|
||||||||||||||||||||||||||
|
Commercial finance
|
20,708
|
|
3,702
|
|
5,996
|
|
30,406
|
|
1,479,443
|
|
1,509,849
|
|
3,801
|
|
2,864
|
|
6,665
|
|
||||||||
|
Consumer finance
|
3,209
|
|
1,595
|
|
2,384
|
|
7,188
|
|
328,173
|
|
335,361
|
|
2,384
|
|
—
|
|
2,384
|
|
||||||||
|
Tax services
|
—
|
|
—
|
|
1,073
|
|
1,073
|
|
—
|
|
1,073
|
|
1,073
|
|
—
|
|
1,073
|
|
||||||||
|
Total National Lending
|
23,917
|
|
5,297
|
|
9,453
|
|
38,667
|
|
1,807,616
|
|
1,846,283
|
|
7,258
|
|
2,864
|
|
10,122
|
|
||||||||
|
Community Banking
|
||||||||||||||||||||||||||
|
Commercial and multi-family real estate
|
—
|
|
—
|
|
—
|
|
—
|
|
748,579
|
|
748,579
|
|
—
|
|
—
|
|
—
|
|
||||||||
|
1-4 family real estate
|
105
|
|
—
|
|
79
|
|
184
|
|
223,298
|
|
223,482
|
|
79
|
|
—
|
|
79
|
|
||||||||
|
Agricultural
|
—
|
|
—
|
|
—
|
|
—
|
|
60,498
|
|
60,498
|
|
—
|
|
—
|
|
—
|
|
||||||||
|
Commercial operating
|
—
|
|
—
|
|
—
|
|
—
|
|
42,311
|
|
42,311
|
|
—
|
|
—
|
|
—
|
|
||||||||
|
Consumer
|
—
|
|
—
|
|
—
|
|
—
|
|
23,836
|
|
23,836
|
|
—
|
|
—
|
|
—
|
|
||||||||
|
Total Community Banking
|
105
|
|
—
|
|
79
|
|
184
|
|
1,098,522
|
|
1,098,706
|
|
79
|
|
—
|
|
79
|
|
||||||||
|
Total Loans and Leases
|
24,022
|
|
5,297
|
|
9,532
|
|
38,851
|
|
2,906,138
|
|
2,944,989
|
|
7,337
|
|
2,864
|
|
10,201
|
|
||||||||
132
|
Accruing and Non-accruing Loans and Leases
|
Non-performing Loans and Leases
|
||||||||||||||||||||||||||||||||||
|
Past Due Loans and Leases
|
30-59 Days
Past Due
|
60-89 Days
Past Due
|
>
89 Days Past Due
|
Total Past
Due
|
Current
|
Total Loans and Leases
Receivable
|
> 89 Days Past Due and Accruing
|
Non-accrual balance
|
Total
|
||||||||||||||||||||||||||
|
Year Ended September 30, 2017
|
(Dollars in Thousands)
|
||||||||||||||||||||||||||||||||||
|
National Lending
|
|||||||||||||||||||||||||||||||||||
|
Commercial finance
|
$
|
1,509
|
|
$
|
2,442
|
|
$
|
1,205
|
|
$
|
5,156
|
|
$
|
250,152
|
|
$
|
255,308
|
|
$
|
1,205
|
|
$
|
—
|
|
$
|
1,205
|
|
||||||||
|
Consumer finance
|
2,503
|
|
541
|
|
1,387
|
|
4,431
|
|
135,798
|
|
140,229
|
|
1,387
|
|
—
|
|
1,387
|
|
|||||||||||||||||
|
Tax services
|
—
|
|
—
|
|
—
|
|
—
|
|
192
|
|
192
|
|
—
|
|
—
|
|
—
|
|
|||||||||||||||||
|
Total National Lending
|
4,012
|
|
2,983
|
|
2,592
|
|
9,587
|
|
386,142
|
|
395,729
|
|
2,592
|
|
—
|
|
2,592
|
|
|||||||||||||||||
|
Community Banking
|
|||||||||||||||||||||||||||||||||||
|
Commercial and multi-family real estate
|
295
|
|
—
|
|
390
|
|
685
|
|
584,825
|
|
585,510
|
|
—
|
|
685
|
|
685
|
|
|||||||||||||||||
|
1-4 family real estate
|
370
|
|
79
|
|
—
|
|
449
|
|
196,257
|
|
196,706
|
|
—
|
|
—
|
|
—
|
|
|||||||||||||||||
|
Agricultural
|
—
|
|
—
|
|
34,295
|
|
34,295
|
|
61,099
|
|
95,394
|
|
34,295
|
|
—
|
|
34,295
|
|
|||||||||||||||||
|
Commercial operating
|
—
|
|
—
|
|
—
|
|
—
|
|
30,718
|
|
30,718
|
|
—
|
|
—
|
|
—
|
|
|||||||||||||||||
|
Consumer
|
9
|
|
17
|
|
19
|
|
45
|
|
22,730
|
|
22,775
|
|
19
|
|
—
|
|
19
|
|
|||||||||||||||||
|
Total Community Banking
|
674
|
|
96
|
|
34,704
|
|
35,474
|
|
895,629
|
|
931,103
|
|
34,314
|
|
685
|
|
34,999
|
|
|||||||||||||||||
|
Total Loans and Leases
|
$
|
4,686
|
|
$
|
3,079
|
|
$
|
37,296
|
|
$
|
45,061
|
|
$
|
1,281,771
|
|
$
|
1,326,832
|
|
$
|
36,906
|
|
$
|
685
|
|
$
|
37,591
|
|
||||||||
Non-accruing loans and leases were
$2.9 million
and
$0.7 million
at
September 30, 2018
and
2017
, respectively. There were
$7.3 million
and
$36.9 million
in accruing loans and leases delinquent 90 days or more at
September 30, 2018
and
2017
, respectively. For the year ended
September 30, 2018
, gross interest income which would have been recorded had the non-accruing loans and leases been current in accordance with their original terms amounted to approximately
$0.1 million
, none of which was included in interest income.
When analysis of borrower operating results and financial condition indicates that underlying cash flows of the borrower’s business are not adequate to meet its debt service requirements, the loan is evaluated for impairment. Often, this is associated with a delay or shortfall in scheduled payments, as described above.
133
Impaired loans and leases at
September 30, 2018
and
2017
were as follows:
|
September 30, 2018
|
Recorded
Balance
|
Unpaid Principal
Balance
|
Specific
Allowance
|
||||||||
|
Loans and leases without a specific valuation allowance
|
(Dollars in Thousands)
|
||||||||||
|
National Lending
|
|||||||||||
|
Commercial finance
|
$
|
8,199
|
|
$
|
8,529
|
|
$
|
—
|
|
||
|
Total National Lending
|
8,199
|
|
8,529
|
|
—
|
|
|||||
|
Community Banking
|
|||||||||||
|
Commercial and multi-family real estate
|
405
|
|
405
|
|
—
|
|
|||||
|
1-4 family real estate
|
94
|
|
94
|
|
—
|
|
|||||
|
Agricultural
|
1,454
|
|
1,454
|
|
—
|
|
|||||
|
Consumer
|
46
|
|
46
|
|
—
|
|
|||||
|
Total Community Banking
|
1,999
|
|
1,999
|
|
—
|
|
|||||
|
Total
|
10,198
|
|
10,528
|
|
—
|
|
|||||
|
Loans and leases with a specific valuation allowance
|
|||||||||||
|
National Lending
|
|||||||||||
|
Commercial finance
|
$
|
5,413
|
|
$
|
5,663
|
|
$
|
588
|
|
||
|
Total National Lending
|
5,413
|
|
5,663
|
|
588
|
|
|||||
|
Total
|
5,413
|
|
5,413
|
|
588
|
|
|||||
|
September 30, 2017
|
Recorded
Balance
|
Unpaid Principal
Balance
|
Specific
Allowance
|
||||||||
|
Loans and leases without a specific valuation allowance
|
(Dollars in Thousands)
|
||||||||||
|
Community Banking
|
|||||||||||
|
Commercial and multi-family real estate
|
$
|
1,109
|
|
$
|
1,109
|
|
$
|
—
|
|
||
|
1-4 family real estate
|
72
|
|
72
|
|
—
|
|
|||||
|
Total Community Banking
|
1,181
|
|
1,181
|
|
—
|
|
|||||
|
Total
|
$
|
1,181
|
|
$
|
1,181
|
|
$
|
—
|
|
||
|
Loans and leases with a specific valuation allowance
|
|||||||||||
|
Total
|
$
|
—
|
|
$
|
—
|
|
$
|
—
|
|
||
Cash interest collected on impaired loans and leases was not material during the years ended
September 30, 2018
and
2017
.
134
The following table provides the average recorded investment in impaired loans and leases for the years ended
September 30, 2018
and
2017
.
|
Year Ended September 30,
|
|||||||
|
2018
|
2017
|
||||||
|
Average
Recorded
Investment
|
Average
Recorded
Investment
|
||||||
|
(Dollars in Thousands)
|
|||||||
|
National Lending
|
|||||||
|
Commercial finance
|
$
|
1,134
|
|
$
|
—
|
|
|
|
Total National Lending
|
1,134
|
|
—
|
|
|||
|
Community Banking
|
|||||||
|
Commercial and multi-family real estate
|
673
|
|
883
|
|
|||
|
1-4 family real estate
|
159
|
|
176
|
|
|||
|
Agricultural
|
1,652
|
|
414
|
|
|||
|
Commercial operating
|
—
|
|
202
|
|
|||
|
Consumer
|
67
|
|
—
|
|
|||
|
Total Community Banking
|
2,551
|
|
1,675
|
|
|||
|
Total loans and leases
|
3,685
|
|
1,675
|
|
|||
For economic or legal reasons relating to a borrower’s financial difficulties, the Company may grant to a borrower a concession for other than an insignificant period of time that the Company would not otherwise grant. The Company classifies these related loans and leases as troubled debt restructurings (“TDR”) which may involve forgiving a portion of interest or principal on existing loans or leases, making loans or leases at a rate materially less than current market rates, or extending the term of the loan or lease.
For the year ended
September 30, 2018
, the Company had
10
Community Banking loans with a balance of
$2.0 million
, and
11
National Lending loans and leases, with a balance of
$2.5 million
classified as TDRs. For the year ended
September 30, 2017
, the Company had
four
Community Banking loans, with a balance of
$0.5 million
classified as TDRs. All of the TDRs that were modified during the year ended
September 30, 2018
were modified to extend the term of the loan.
During the year ended
September 30, 2018
, the Company had
one
Community Banking loan with a balance of
$0.1 million
that was modified in a TDR within the previous 12 months and for which there was a payment default. For the year ended
September 30, 2017
, there were
no
TDR loans for which there was a payment default. The Company had
no
commitments to lend additional funds on loans or leases with terms modified in a TDR at
September 30, 2018
and
2017
.
Loans serviced for others are not reported as assets. The unpaid principal balances of these loans at fiscal year-end were as follows:
|
September 30,
|
2018
|
2017
|
2016
|
||||||||
|
|
(Dollars in Thousands)
|
||||||||||
|
Mortgage loan portfolios serviced for Fannie Mae
|
$
|
2,338
|
|
$
|
3,162
|
|
$
|
3,980
|
|
||
|
SBA/USDA
|
98,942
|
|
—
|
|
—
|
|
|||||
|
Other
|
32,726
|
|
18,649
|
|
15,452
|
|
|||||
|
|
$
|
134,006
|
|
$
|
21,811
|
|
$
|
19,432
|
|
||
135
EPS is computed after deducting dividends. The Company has granted restricted share awards with dividend rights that are considered to be participating securities. Accordingly, a portion of the Company’s earnings is allocated to those participating securities in the EPS calculation. Basic earnings per share is computed by dividing income available to common stockholders after the allocation of dividends and undistributed earnings to the participating securities by the weighted average number of common shares outstanding for the period. Diluted earnings per share reflects the potential dilution that could occur if securities or other contracts to issue common stock were exercised, and is computed after giving consideration to the weighted average dilutive effect of the Company’s stock options and after the allocation of earnings to the participating securities. Antidilutive options are disregarded in the EPS calculations.
On October 5, 2018, Meta common stock began trading on a split-adjusted basis as a result of the
3
-for-1 forward stock split with respect to Meta's common stock, which was effected on October 4, 2018. As a result of the stock split, the number of issued and outstanding shares of Meta common stock increased to
39.2 million
shares, which includes shares issued pursuant to the Crestmark Acquisition.
A reconciliation of the net income and common stock share amounts used in the computation of basic and diluted EPS for the fiscal years ended
September 30, 2018
,
2017
and
2016
is presented below. All share and per share data reported for all periods presented in the table below has been adjusted to reflect the 3-for-1 forward stock split.
|
|
2018
|
2017
|
2016
|
||||||||
|
|
(Dollars in Thousands, Except Share and Per Share Data)
|
||||||||||
|
Basic income per common share:
|
|||||||||||
|
Net income attributable to Meta Financial Group, Inc.
|
$
|
51,620
|
|
$
|
44,917
|
|
$
|
33,220
|
|
||
|
Weighted average common shares outstanding
|
30,737,499
|
|
27,741,276
|
|
25,331,868
|
|
|||||
|
Basic income per common share
|
$
|
1.68
|
|
$
|
1.62
|
|
$
|
1.31
|
|
||
|
Diluted income per common share:
|
|||||||||||
|
Net income attributable to Meta Financial Group, Inc.
|
$
|
51,620
|
|
$
|
44,917
|
|
$
|
33,220
|
|
||
|
Weighted average common shares outstanding
|
30,737,499
|
|
27,741,276
|
|
25,331,868
|
|
|||||
|
Outstanding options - based upon the two-class method
|
115,551
|
|
166,956
|
|
160,170
|
|
|||||
|
Weighted average diluted common shares outstanding
|
30,853,050
|
|
27,908,232
|
|
25,492,038
|
|
|||||
|
Diluted income per common share
|
$
|
1.67
|
|
$
|
1.61
|
|
$
|
1.30
|
|
||
All stock options were considered in computing diluted EPS for the years ended September 30, 2018, 2017, and 2016.
136
During the first quarter of fiscal 2018, the Company early adopted Accounting Standard Update ("ASU") 2017-12, "
Derivatives and Hedging (Topic 815): Targeted Improvements to Accounting for Hedging Activities.
" Due to the early adoption of the ASU, the Company transferred
$204.7 million
of investment securities and
$101.3 million
of MBS from HTM to AFS during the first quarter of fiscal 2018. In connection with the Crestmark Acquisition, the Company transferred
$40.9 million
of investment securities from HTM to AFS during the fourth quarter of fiscal 2018, as allowed through ASC 320-10-25-6(c), which allows for the transfer of securities from HTM in the event of a major business combination.
Securities available for sale at September 30, 2018 and 2017 were as follows:
|
Available For Sale
|
GROSS
|
|
GROSS
|
|
|||||||||||
|
|
AMORTIZED
|
|
UNREALIZED
|
|
UNREALIZED
|
|
FAIR
|
|
|||||||
|
At September 30, 2018
|
COST
|
|
GAINS
|
|
(LOSSES)
|
|
VALUE
|
|
|||||||
|
|
(Dollars in Thousands)
|
||||||||||||||
|
Debt securities
|
|||||||||||||||
|
Small business administration securities
|
$
|
45,591
|
|
$
|
1
|
|
$
|
(1,255
|
)
|
$
|
44,337
|
|
|||
|
Obligation of states and political subdivisions
|
17,154
|
|
49
|
|
(293
|
)
|
16,910
|
|
|||||||
|
Non-bank qualified obligations of states and political subdivisions
|
1,140,884
|
|
826
|
|
(31,825
|
)
|
1,109,885
|
|
|||||||
|
Asset-backed securities
|
310,700
|
|
2,585
|
|
(257
|
)
|
313,028
|
|
|||||||
|
Mortgage-backed securities
|
378,301
|
|
—
|
|
(14,236
|
)
|
364,065
|
|
|||||||
|
Total debt securities
|
1,892,630
|
|
3,461
|
|
(47,866
|
)
|
1,848,225
|
|
|||||||
|
Common equities and mutual funds
|
3,172
|
|
635
|
|
(7
|
)
|
3,800
|
|
|||||||
|
Total available for sale securities
|
$
|
1,895,802
|
|
$
|
4,096
|
|
$
|
(47,873
|
)
|
$
|
1,852,025
|
|
|||
|
AMORTIZED
|
|
GROSS
UNREALIZED
|
|
GROSS
UNREALIZED
|
|
FAIR
|
|
||||||||
|
At September 30, 2017
|
COST
|
|
GAINS
|
|
(LOSSES)
|
|
VALUE
|
|
|||||||
|
|
(Dollars in Thousands)
|
||||||||||||||
|
Debt securities
|
|||||||||||||||
|
Small business administration securities
|
$
|
57,046
|
|
$
|
825
|
|
$
|
—
|
|
$
|
57,871
|
|
|||
|
Non-bank qualified obligations of states and political subdivisions
|
938,883
|
|
14,983
|
|
(3,037
|
)
|
950,829
|
|
|||||||
|
Asset-backed securities
|
94,451
|
|
2,381
|
|
—
|
|
96,832
|
|
|||||||
|
Mortgage-backed securities
|
588,918
|
|
1,259
|
|
(3,723
|
)
|
586,454
|
|
|||||||
|
Total debt securities
|
1,679,298
|
|
19,448
|
|
(6,760
|
)
|
1,691,986
|
|
|||||||
|
Common equities and mutual funds
|
1,009
|
|
436
|
|
—
|
|
1,445
|
|
|||||||
|
Total available for sale securities
|
$
|
1,680,307
|
|
$
|
19,884
|
|
$
|
(6,760
|
)
|
$
|
1,693,431
|
|
|||
Securities held to maturity at September 30, 2018 and 2017 were as follows:
|
Held to Maturity
|
GROSS
|
|
GROSS
|
|
|||||||||||
|
|
AMORTIZED
|
|
UNREALIZED
|
|
UNREALIZED
|
|
FAIR
|
|
|||||||
|
At September 30, 2018
|
COST
|
|
GAINS
|
|
(LOSSES)
|
|
VALUE
|
|
|||||||
|
|
(Dollars in Thousands)
|
||||||||||||||
|
Debt securities
|
|||||||||||||||
|
Non-bank qualified obligations of states and political subdivisions
|
$
|
164,304
|
|
$
|
—
|
|
$
|
(10,758
|
)
|
$
|
153,546
|
|
|||
|
Mortgage-backed securities
|
7,850
|
|
—
|
|
(422
|
)
|
7,428
|
|
|||||||
|
Total held to maturity securities
|
$
|
172,154
|
|
$
|
(11,180
|
)
|
$
|
160,974
|
|
||||||
137
|
AMORTIZED
|
|
GROSS
UNREALIZED
|
|
GROSS
UNREALIZED
|
|
FAIR
|
|
||||||||
|
At September 30, 2017
|
COST
|
|
GAINS
|
|
(LOSSES)
|
|
VALUE
|
|
|||||||
|
|
(Dollars in Thousands)
|
||||||||||||||
|
Debt securities
|
|||||||||||||||
|
Obligations of states and political subdivisions
|
$
|
19,247
|
|
$
|
157
|
|
$
|
(36
|
)
|
$
|
19,368
|
|
|||
|
Non-bank qualified obligations of states and political subdivisions
|
430,593
|
|
4,744
|
|
(2,976
|
)
|
432,361
|
|
|||||||
|
Mortgage-backed securities
|
113,689
|
|
—
|
|
(1,233
|
)
|
112,456
|
|
|||||||
|
Total held to maturity securities
|
$
|
563,529
|
|
$
|
4,901
|
|
$
|
(4,245
|
)
|
$
|
564,185
|
|
|||
Management has implemented processes to identify securities that could potentially have a credit impairment that is other-than-temporary. This process can include, but is not limited to, evaluating the length of time and extent to which the fair value has been less than the amortized cost basis, reviewing available information regarding the financial position of the issuer, interest or dividend payment status, monitoring the rating of the security, monitoring changes in value, and projecting cash flows. Management also determines whether the Company intends to sell a security or whether it is more likely than not the Company will be required to sell the security before the recovery of its amortized cost basis which, in some cases, may extend to maturity. To the extent the Company determine that a security is deemed to be other-than-temporarily impaired, an impairment loss is recognized.
For all securities considered temporarily impaired, the Company does not intend to sell these securities and it is not more likely than not that the Company will be required to sell the security before recovery of its amortized cost, which may occur at maturity. The Company believes collection will occur for all principal and interest due on all investments with amortized cost in excess of fair value and considered only temporarily impaired.
GAAP requires that, at acquisition, an enterprise classify debt securities into one of three categories: available for sale, held to maturity or trading. AFS securities are carried at fair value on the Consolidated Statements of Financial Condition, and unrealized holding gains and losses are excluded from earnings and recognized as a separate component of equity in accumulated other comprehensive income. HTM debt securities are measured at amortized cost. Both AFS and HTM are subject to review for other-than-temporary impairment. Meta did not have any trading securities at September 30, 2018.
Gross unrealized losses and fair value, aggregated by investment category and length of time that individual securities have been in continuous unrealized loss position at
September 30, 2018
, and
2017
, were as follows:
|
Available For Sale
|
LESS THAN 12 MONTHS
|
OVER 12 MONTHS
|
TOTAL
|
||||||||||||||||||||
|
At September 30, 2018
|
Fair
Value
|
Unrealized
(Losses)
|
Fair
Value
|
Unrealized
(Losses)
|
Fair
Value
|
Unrealized
(Losses)
|
|||||||||||||||||
|
|
(Dollars in Thousands)
|
||||||||||||||||||||||
|
Debt securities
|
|||||||||||||||||||||||
|
Small business administration securities
|
$
|
43,097
|
|
$
|
(1,255
|
)
|
$
|
—
|
|
$
|
—
|
|
$
|
43,097
|
|
$
|
(1,255
|
)
|
|||||
|
Obligations of states and political subdivisions
|
11,036
|
|
(279
|
)
|
881
|
|
(14
|
)
|
11,917
|
|
(293
|
)
|
|||||||||||
|
Non-bank qualified obligations of states and political subdivisions
|
626,693
|
|
(13,539
|
)
|
358,095
|
|
(18,286
|
)
|
984,788
|
|
(31,825
|
)
|
|||||||||||
|
Asset-backed securities
|
146,638
|
|
(257
|
)
|
—
|
|
—
|
|
146,638
|
|
(257
|
)
|
|||||||||||
|
Mortgage-backed securities
|
121,217
|
|
(3,292
|
)
|
242,849
|
|
(10,944
|
)
|
364,066
|
|
(14,236
|
)
|
|||||||||||
|
Total debt securities
|
948,681
|
|
(18,622
|
)
|
601,825
|
|
(29,244
|
)
|
1,550,506
|
|
(47,866
|
)
|
|||||||||||
|
Common equities and mutual funds
|
1,818
|
|
(7
|
)
|
—
|
|
—
|
|
1,818
|
|
(7
|
)
|
|||||||||||
|
Total available for sale securities
|
$
|
950,499
|
|
$
|
(18,629
|
)
|
$
|
601,825
|
|
$
|
(29,244
|
)
|
$
|
1,552,324
|
|
$
|
(47,873
|
)
|
|||||
138
|
|
LESS THAN 12 MONTHS
|
OVER 12 MONTHS
|
TOTAL
|
||||||||||||||||||||
|
At September 30, 2017
|
Fair
Value
|
Unrealized
(Losses)
|
Fair
Value
|
Unrealized
(Losses)
|
Fair
Value
|
Unrealized
(Losses)
|
|||||||||||||||||
|
|
(Dollars in Thousands)
|
||||||||||||||||||||||
|
Debt securities
|
|||||||||||||||||||||||
|
Non-bank qualified obligations of states and political subdivisions
|
$
|
280,900
|
|
$
|
(2,887
|
)
|
$
|
5,853
|
|
$
|
(150
|
)
|
$
|
286,753
|
|
$
|
(3,037
|
)
|
|||||
|
Mortgage-backed securities
|
237,897
|
|
(1,625
|
)
|
100,287
|
|
(2,098
|
)
|
338,184
|
|
(3,723
|
)
|
|||||||||||
|
Total available for sale securities
|
$
|
518,797
|
|
$
|
(4,512
|
)
|
$
|
106,140
|
|
$
|
(2,248
|
)
|
$
|
624,937
|
|
$
|
(6,760
|
)
|
|||||
|
Held To Maturity
|
LESS THAN 12 MONTHS
|
OVER 12 MONTHS
|
TOTAL
|
||||||||||||||||||||
|
At September 30, 2018
|
Fair
Value
|
Unrealized
(Losses)
|
Fair
Value
|
Unrealized
(Losses)
|
Fair
Value
|
Unrealized
(Losses)
|
|||||||||||||||||
|
|
(Dollars in Thousands)
|
||||||||||||||||||||||
|
Debt securities
|
|||||||||||||||||||||||
|
Non-bank qualified obligations of states and political subdivisions
|
$
|
6,178
|
|
$
|
(287
|
)
|
$
|
147,368
|
|
$
|
(10,471
|
)
|
$
|
153,546
|
|
$
|
(10,758
|
)
|
|||||
|
Mortgage-backed securities
|
—
|
|
—
|
|
7,428
|
|
(422
|
)
|
7,428
|
|
(422
|
)
|
|||||||||||
|
Total held to maturity securities
|
6,178
|
|
(287
|
)
|
154,796
|
|
(10,893
|
)
|
160,974
|
|
(11,180
|
)
|
|||||||||||
|
|
LESS THAN 12 MONTHS
|
OVER 12 MONTHS
|
TOTAL
|
||||||||||||||||||||
|
At September 30, 2017
|
Fair
Value
|
Unrealized
(Losses)
|
Fair
Value
|
Unrealized
(Losses)
|
Fair
Value
|
Unrealized
(Losses)
|
|||||||||||||||||
|
|
(Dollars in Thousands)
|
||||||||||||||||||||||
|
Debt securities
|
|||||||||||||||||||||||
|
Obligations of states and political subdivisions
|
$
|
1,364
|
|
$
|
(6
|
)
|
$
|
4,089
|
|
$
|
(30
|
)
|
$
|
5,453
|
|
$
|
(36
|
)
|
|||||
|
Non-bank qualified obligations of states and political subdivisions
|
202,018
|
|
(2,783
|
)
|
6,206
|
|
(193
|
)
|
208,224
|
|
(2,976
|
)
|
|||||||||||
|
Mortgage-backed securities
|
112,456
|
|
(1,233
|
)
|
—
|
|
—
|
|
112,456
|
|
(1,233
|
)
|
|||||||||||
|
Total held to maturity securities
|
$
|
315,838
|
|
$
|
(4,022
|
)
|
$
|
10,295
|
|
$
|
(223
|
)
|
$
|
326,133
|
|
$
|
(4,245
|
)
|
|||||
As of
September 30, 2018
and
2017
, the investment portfolio included securities with current unrealized losses which have existed for longer than one year. All of these securities are considered to be acceptable credit risks. Because the declines in fair value were due to changes in market interest rates, not in estimated cash flows, and the Company does not intend to sell these securities (has not made a decision to sell), and it is not more likely than not that the Company will be required to sell the security before recovery of its amortized cost basis, which may occur at maturity, no other-than-temporary impairment was recorded at
September 30, 2018
or
2017
.
The amortized cost and fair value of debt securities by contractual maturity are shown below. Certain securities have call features which allow the issuer to call the security prior to maturity. Expected maturities may differ from contractual maturities in MBS because borrowers may have the right to call or prepay obligations with or without call or prepayment penalties. Therefore, MBS are not included in the maturity categories in the following maturity summary. The expected maturities of certain SBA securities may differ from contractual maturities because the borrowers may have the right to prepay the obligation. However, certain prepayment penalties may apply.
139
|
Available For Sale
|
AMORTIZED
COST
|
|
FAIR
VALUE
|
|
|||
|
At September 30, 2018
|
(Dollars in Thousands)
|
||||||
|
Due in one year or less
|
$
|
2,532
|
|
$
|
2,529
|
|
|
|
Due after one year through five years
|
41,415
|
|
41,504
|
|
|||
|
Due after five years through ten years
|
352,099
|
|
350,143
|
|
|||
|
Due after ten years
|
1,118,283
|
|
1,089,984
|
|
|||
|
|
1,514,329
|
|
1,484,160
|
|
|||
|
Mortgage-backed securities
|
378,301
|
|
364,065
|
|
|||
|
Common equities and mutual funds
|
3,172
|
|
3,800
|
|
|||
|
Total available for sale securities
|
$
|
1,895,802
|
|
$
|
1,852,025
|
|
|
|
|
AMORTIZED
COST
|
|
FAIR
VALUE
|
|
|||
|
At September 30, 2017
|
(Dollars in Thousands)
|
||||||
|
Due in one year or less
|
$
|
—
|
|
$
|
—
|
|
|
|
Due after one year through five years
|
36,586
|
|
37,674
|
|
|||
|
Due after five years through ten years
|
347,831
|
|
358,198
|
|
|||
|
Due after ten years
|
705,963
|
|
709,660
|
|
|||
|
|
1,090,380
|
|
1,105,532
|
|
|||
|
Mortgage-backed securities
|
588,918
|
|
586,454
|
|
|||
|
Common equities and mutual funds
|
1,009
|
|
1,445
|
|
|||
|
Total available for sale securities
|
$
|
1,680,307
|
|
$
|
1,693,431
|
|
|
|
Held To Maturity
|
AMORTIZED
COST
|
|
FAIR
VALUE
|
|
|||
|
At September 30, 2018
|
(Dollars in Thousands)
|
||||||
|
Due after ten years
|
164,304
|
|
153,546
|
|
|||
|
|
164,304
|
|
153,546
|
|
|||
|
Mortgage-backed securities
|
7,850
|
|
7,428
|
|
|||
|
Total held to maturity securities
|
$
|
172,154
|
|
$
|
160,974
|
|
|
|
|
AMORTIZED
COST
|
|
FAIR
VALUE
|
|
|||
|
At September 30, 2017
|
(Dollars in Thousands)
|
||||||
|
Due in one year or less
|
$
|
1,483
|
|
$
|
1,480
|
|
|
|
Due after one year through five years
|
17,926
|
|
18,160
|
|
|||
|
Due after five years through ten years
|
144,996
|
|
147,832
|
|
|||
|
Due after ten years
|
285,435
|
|
284,257
|
|
|||
|
|
449,840
|
|
451,729
|
|
|||
|
Mortgage-backed securities
|
113,689
|
|
112,456
|
|
|||
|
Total held to maturity securities
|
$
|
563,529
|
|
$
|
564,185
|
|
|
140
Activities related to the sale of securities are summarized below.
|
|
2018
|
2017
|
2016
|
||||||||
|
Year ended
|
(Dollars in Thousands)
|
||||||||||
|
Available For Sale
|
|||||||||||
|
Proceeds from sales
|
$
|
596,758
|
|
$
|
457,306
|
|
$
|
285,508
|
|
||
|
Gross gains on sales
|
2,551
|
|
4,091
|
|
1,459
|
|
|||||
|
Gross losses on sales
|
10,728
|
|
4,628
|
|
1,785
|
|
|||||
|
Net loss on available for sale securities
|
(8,177
|
)
|
(537
|
)
|
(326
|
)
|
|||||
|
Held To Maturity
|
|||||||||||
|
Net carrying amount of securities sold
|
$
|
—
|
|
$
|
5,826
|
|
$
|
—
|
|
||
|
Gross realized gain on sales
|
—
|
|
92
|
|
—
|
|
|||||
|
Gross realized losses on sales
|
—
|
|
48
|
|
—
|
|
|||||
|
Net gain on held to maturity securities
|
—
|
|
44
|
|
—
|
|
|||||
During the fiscal 2018 fourth quarter, the Company completed a balance sheet restructuring related to the closing of the Crestmark Acquisition, selling approximately
$260 million
of lower-yielding AFS securities.
Securities with fair values of approximately
$8.0 million
and $
5.7
million at
September 30, 2018
and
2017
, respectively, were pledged as collateral for public funds on deposit. Securities with fair values of approximately $
5.9
million and $
3.8
million at
September 30, 2018
, and
2017
, respectively, were pledged as collateral for individual, trust and estate deposits.
Federal Home Loan Bank ("FHLB") Stock
The Company’s borrowings from the FHLB are secured by a blanket collateral agreement with respect to a percentage of unencumbered loans and the pledge of specific investment securities. Such advances can be made pursuant to several different credit programs, each of which has its own interest rate and range of maturities.
The investments in the FHLB stock are required investments related to the Company’s membership in and current borrowings from the FHLB of Des Moines. The investments in the FHLB of Des Moines could be adversely impacted by the financial operations of the FHLBs and actions of their regulator, the Federal Housing Finance Agency. The Company periodically evaluates investments for other than temporary impairment. There was no impairment of this investment in
2018
,
2017
or
2016
.
The FHLB stock is carried at cost since it is generally redeemable at par value. The carrying value of the stock held at the FHLB was
$23.4 million
and
$61.1 million
at
September 30, 2018
and
2017
, respectively. At fiscal year-end 2018 and 2017, the Company pledged securities with fair values of approximately
$1.06 billion
and
$1.07 billion
, respectively, against specific FHLB advances. In addition, a combination of qualifying residential and other real estate loans of approximately
$756.0 million
and
$628.0 million
were pledged as collateral at
September 30, 2018
and
2017
, respectively.
Included in Interest and Dividend Income from other investments is
$1.1 million
,
$0.5 million
and
$0.6 million
related to dividend income on FHLB stock for the fiscal years ended
September 30, 2018
,
2017
and
2016
, respectively.
141
Year-end premises and equipment were as follows:
|
September 30,
|
2018
|
2017
|
|||||
|
|
(Dollars in Thousands)
|
||||||
|
Land
|
$
|
2,932
|
|
$
|
1,578
|
|
|
|
Buildings
|
27,359
|
|
10,642
|
|
|||
|
Furniture, fixtures, and equipment
|
56,438
|
|
46,934
|
|
|||
|
Capitalized leases
|
2,259
|
|
2,259
|
|
|||
|
|
88,988
|
|
61,413
|
|
|||
|
Less: accumulated depreciation and amortization
|
(48,530
|
)
|
(42,093
|
)
|
|||
|
Net book value
|
$
|
40,458
|
|
$
|
19,320
|
|
|
Depreciation expense of premises, furniture and equipment included in occupancy and equipment expense was approximately
$5.7 million
,
$5.5 million
and
$5.4 million
for the years ended
September 30, 2018
,
2017
and
2016
, respectively. Amortization expense on capitalized leases for the years ended
September 30, 2018
, 2017 and 2016, was $
0.1 million
,
$0.1 million
and
$0.2 million
, respectively, and is included in occupancy and equipment expense. Substantially all of the Company's capitalized leases at September 30, 2018 were building leases.
Time certificates of deposits in denominations of $
250,000
or more were approximately
$163.3 million
and
$85.2 million
at
September 30, 2018
, and
2017
, respectively.
At
September 30, 2018
, the scheduled maturities of time certificates of deposits were as follows for the years ending:
|
As of September 30,
|
|||
|
(Dollars in Thousands)
|
|||
|
|
|||
|
2019
|
$
|
1,562,801
|
|
|
2020
|
125,581
|
|
|
|
2021
|
16,623
|
|
|
|
2022
|
6,929
|
|
|
|
2023
|
1,048
|
|
|
|
Total
(1)
|
1,712,982
|
|
|
(1)
As of September 30, 2018, the Company had
$1.44 billion
of certificates of deposits which were recorded in wholesale deposits on the Consolidated Statements of Financial Condition.
Under the Dodd-Frank Act, IRA and non-IRA deposit accounts are permanently insured up to $
250,000
by the DIF under management of the FDIC.
142
Short Term Debt
|
September 30,
|
2018
|
2017
|
|||||
|
Overnight federal funds purchased
|
$
|
422,000
|
|
$
|
987,000
|
|
|
|
Short-term FHLB advances
|
—
|
|
415,000
|
|
|||
|
Short-term capital lease
|
65
|
|
62
|
|
|||
|
Repurchase agreements
|
3,694
|
|
2,472
|
|
|||
|
Total
|
425,759
|
|
1,404,534
|
|
|||
T
he Company had
$422.0 million
of overnight federal funds purchased from the FHLB at
September 30, 2018
as compared to
$987.0 million
at
September 30, 2017
. At
September 30, 2018
, the Company had
no
short-term advances from the FHLB as compared to
$415.0 million
at
September 30, 2017
.
The Bank has executed blanket pledge agreements whereby the Bank assigns, transfers, and pledges to the FHLB and grants to the FHLB a security interest in real estate and securities collateral. The Bank has the right to use, commingle, and dispose of the collateral it has assigned to the FHLB. Under the agreement, the Bank must maintain “eligible collateral” that has a “lending value” at least equal to the “required collateral amount,” all as defined by the agreement.
At fiscal year-end
2018
and
2017
, the Bank pledged securities with fair values of approximately $
1.06 billion
and $
1.07 billion
, respectively, against specific FHLB advances. In addition, qualifying real estate loans of approximately
$756.0 million
, and
$628.0 million
were pledged as collateral at
September 30, 2018
, and
2017
, respectively.
As of
September 30, 2018
, the Company was the lessee on
three
capital leases,
two
equipment leases and
one
property lease. At
September 30, 2018
, the portion of the liability expected to be expensed and amortized over the next
12
months is approximately
$64,818
.
Securities sold under agreements to repurchase totaled approximately $
3.7
million and $
2.5
million at
September 30, 2018
, and
2017
, respectively.
An analysis of securities sold under agreements to repurchase at September 30, 2018 and 2017 follows:
|
September 30,
|
2018
|
2017
|
|||||
|
|
(Dollars in Thousands)
|
||||||
|
Highest month-end balance
|
$
|
3,740
|
|
$
|
3,782
|
|
|
|
Average balance
|
2,557
|
|
2,225
|
|
|||
|
Weighted average interest rate for the year
|
2.05
|
%
|
0.98
|
%
|
|||
|
Weighted average interest rate at year end
|
2.48
|
%
|
1.59
|
%
|
|||
The Company pledged securities with fair values of approximately
$13.9 million
at
September 30, 2018
, as collateral for securities sold under agreements to repurchase. There were
$9.3 million
of securities pledged as collateral for securities sold under agreements to repurchase at
September 30, 2017
.
The Company has a line of credit with another financial institution for
$25.0 million
as of
September 30, 2018
. This line of credit has no fee, and, as of September 30, 2018, the Company had not drawn on it.
143
Long Term Debt
|
September 30,
|
2018
|
2017
|
|||||
|
(Dollars in Thousands)
|
|||||||
|
Long-term FHLB advances
|
$
|
—
|
|
$
|
—
|
|
|
|
Trust preferred securities
|
13,661
|
|
10,310
|
|
|||
|
Subordinated debentures (net of issuance costs)
|
73,491
|
|
73,347
|
|
|||
|
Long-term capital lease
|
1,811
|
|
1,876
|
|
|||
|
Total
|
88,963
|
|
85,533
|
|
|||
At
September 30, 2018
and 2017, the Company had no long-term advances from the FHLB.
At September 30, 2018, the scheduled maturities of the Company's long-term debt were as follows for the years ending:
|
September 30,
|
||||||||||||
|
(Dollars in Thousands)
|
Trust preferred securities
|
Subordinated debentures
|
Long-term capital lease
|
Total
|
||||||||
|
2019
|
$
|
—
|
|
$
|
—
|
|
$
|
—
|
|
$
|
—
|
|
|
2020
|
—
|
|
—
|
|
73
|
|
73
|
|
||||
|
2021
|
—
|
|
—
|
|
77
|
|
77
|
|
||||
|
2022
|
—
|
|
—
|
|
82
|
|
82
|
|
||||
|
2023
|
—
|
|
—
|
|
87
|
|
87
|
|
||||
|
Thereafter
|
13,661
|
|
73,491
|
|
1,492
|
|
88,644
|
|
||||
|
Total long-term debt
|
$
|
13,661
|
|
$
|
73,491
|
|
$
|
1,811
|
|
$
|
88,963
|
|
Certain trust preferred securities are due to First Midwest Financial Capital Trust I, a
100%
-owned nonconsolidated subsidiary of the Company. The securities were issued in 2001 in conjunction with the Trust’s issuance of
10,000
shares of Trust Preferred Securities. The securities bear the same interest rate and terms as the trust preferred securities. The securities are included on the Consolidated Statements of Financial Condition as liabilities.
The Company issued all of the
10,310
authorized shares of trust preferred securities of First Midwest Financial Capital Trust I holding solely securities. Distributions are paid semi-annually. Cumulative cash distributions are calculated at a variable rate of London Interbank Offered Rate (“LIBOR”) plus
3.75%
(
6.35%
at
September 30, 2018
, and
5.22%
at
September 30, 2017
), not to exceed
12.5%
. The Company may, at one or more times, defer interest payments on the capital securities for up to
10
consecutive semi-annual periods, but not beyond July 25, 2031. At the end of any deferral period, all accumulated and unpaid distributions are required to be paid. The capital securities are required to be redeemed on July 25, 2031; however, the Company has a semi-annual option to shorten the maturity date. The redemption price is $
1,000
per capital security plus any accrued and unpaid distributions to the date of redemption.
Holders of the capital securities have no voting rights, are unsecured and rank junior in priority of payment to all of the Company’s indebtedness and senior to the Company’s common stock.
Although the securities issued by the Trust are not included as a component of stockholders’ equity, the securities are treated as capital for regulatory purposes, subject to certain limitations.
Through the Crestmark Acquisition, the Company acquired
$3.4 million
in floating rate capital securities due to Crestmark Capital Trust I, a 100%-owned nonconsolidated subsidiary of the Company. The subordinated debentures bear interest at LIBOR plus
3.00%
, have a stated maturity of
30
years and are redeemable by the Company at par, with regulatory approval. The interest rate is reset quarterly at distribution dates in February, May, August, and November. The interest rate as of
September 30, 2018
was
5.31%
. The Company has the option to defer interest payments on the subordinated debentures from time to time for a period not to exceed five consecutive years.
144
The Company completed the public offering of
$75.0 million
of
5.75%
fixed-to-floating rate subordinated debentures during fiscal year 2016. These notes are due August 15, 2026. The subordinated debentures were sold at par, resulting in net proceeds of approximately
$73.9 million
. At September 30, 2018, the Company had
$73.5 million
in subordinated debentures, net of issuance costs of
$1.5 million
. Accumulated interest expense on the subordinated debentures was
$8.6 million
as of September 30, 2018.
As of September 30, 2018, the Company was the lessee on
three
capital leases,
two
equipment leases and
one
property lease. At September 30, 2018, the portion of the liability expected to be expensed and amortized beyond
12
months was
$1.8 million
. The majority of the
$1.8 million
is related to the Urbandale, Iowa retail branch location
.
All share and per share data for all periods presented has been adjusted to reflect the 3-for-1 forward stock split with respect to the Company's common stock effected on October 4, 2018.
The Company maintains an Employee Stock Ownership Plan (“ESOP”) for eligible employees who have
1,000
hours of employment with the Bank, have worked at least
one
year at the Bank and who have attained age
21
. ESOP expense of $
2,073,000
, $
1,668,000
and $
1,150,000
was recorded for the years ended
September 30, 2018
,
2017
and
2016
, respectively. Contributions of $
2,011,040
, $
1,606,102
and $
1,174,682
were made to the ESOP during the years ended
September 30, 2018
,
2017
and
2016
, respectively.
Contributions to the ESOP and shares released from suspense are allocated among ESOP participants on the basis of compensation in the year of allocation. Benefits generally become
100%
vested after
seven
years of credited service. Prior to the completion of
seven
years of credited service, a participant who terminates employment for reasons other than death or disability receives a reduced benefit based on the ESOP’s vesting schedule. Forfeitures are reallocated among remaining participating employees in the same proportion as contributions. Benefits are payable in the form of stock upon termination of employment. The Company’s contributions to the ESOP are not fixed, so benefits payable under the ESOP cannot be estimated.
For the years ended
September 30, 2018
,
2017
and
2016
,
72,996
shares,
61,458
shares and
58,143
shares, from the suspense account, with a fair value of $
27.55
, $
26.13
and $
20.20
per share, respectively, were released. For the years ended
September 30, 2018
,
2017
and
2016
, allocated shares and total ESOP shares reflect
6,687
shares,
42,378
shares and
46,506
shares, respectively, withdrawn from the ESOP by participants who were no longer with the Company or by participants diversifying their holdings. At
September 30, 2018
,
2017
and
2016
, there were
3,987
,
4,437
and
8,130
shares purchased, respectively, for dividend reinvestment.
Year-end ESOP shares are as follows:
|
At September 30,
|
2018
|
2017
|
2016
|
||||||||
|
|
(Dollars in Thousands)
|
||||||||||
|
Allocated shares
|
812,346
|
|
768,657
|
|
788,616
|
|
|||||
|
Unearned shares
|
—
|
|
|
|
—
|
|
|||||
|
Total ESOP shares
|
812,346
|
|
768,657
|
|
788,616
|
|
|||||
|
Fair value of unearned shares
|
$
|
—
|
|
$
|
—
|
|
$
|
—
|
|
||
The Company also has a profit sharing plan covering substantially all full-time employees. Contribution expense to the profit sharing plan, included in compensation and benefits, for the years ended
September 30, 2018
,
2017
and
2016
was $
2.2
million, $
1.6
million and $
1.3
million, respectively.
145
All share and per share data for all periods presented has been adjusted to reflect the 3-for-1 forward stock split of the Company's common stock effected by the Company with respect to its common stock on October 4, 2018.
The Company maintains the 2002 Omnibus Incentive Plan, as amended and restated, which, among other things, provides for the awarding of stock options and nonvested restricted shares to certain officers and directors of the Company. Awards are granted by the Compensation Committee of the Board of Directors based on the performance of the award recipients or other relevant factors.
The following table shows the effect to income, net of tax benefits, of share-based expense recorded in the years ended
September 30, 2018
, 2017 and 2016.
|
Year Ended September 30,
|
2018
|
2017
|
2016
|
||||||||
|
|
(Dollars in Thousands)
|
||||||||||
|
Total employee stock-based compensation expense recognized in income, net of tax effects of $3,139, $3,907, and $192, respectively
|
$
|
7,878
|
|
$
|
6,486
|
|
$
|
559
|
|
||
As of
September 30, 2018
, stock-based compensation expense not yet recognized in income totaled $
17.0
million, which is expected to be recognized over a weighted-average remaining period of
3.59
years.
At grant date, the fair value of options awarded to recipients is estimated using a Black-Scholes valuation model. The exercise price of stock options equals the fair market value of the underlying stock at the date of grant. Options are issued for
10
-year periods with
100%
vesting generally occurring either at grant date or over a
four
-year period.
No
options were granted during the years ended
September 30, 2018
, 2017 or 2016. The intrinsic value of options exercised during the years ended
September 30, 2018
,
2017
and
2016
were $
1.9
million, $
1.8
million and $
1.5
million, respectively.
Shares have previously been granted each year to executives and senior leadership members under the applicable Company incentive plan. These shares vest at various times ranging from immediately to
four
years based on circumstances at time of grant. The fair value is determined based on the fair market value of the Company’s stock on the grant date. Director shares are issued to the Company’s directors, and these shares vest immediately. The total fair value of director’s shares granted during the years ended
September 30, 2018
,
2017
and
2016
was $
1.1
million, $
0.5
million and $
0.2
million, respectively.
In addition to the Company’s 2002 Omnibus Incentive Plan, the Company also maintains the 1995 Stock Option and Incentive Plan. No new options were, or could have been, awarded under the 1995 plan during the year ended
September 30, 2018
; however, previously awarded options were exercised under this plan during the year ended September 30, 2017.
In addition, during the first and second quarters of fiscal 2017, shares were granted to certain named executive officers (“NEOs”) of the Company in connection with their signing of employment agreements with the Company. These stock awards vest in equal installments over
eight
years.
The following tables show the activity of options and share awards (including shares of restricted stock subject to vesting and fully-vested restricted stock) granted, exercised or forfeited under all of the Company’s option and incentive plans during the years ended
September 30, 2018
and
2017
.
146
|
|
Number
of
Shares
|
|
Weighted
Average
Exercise
Price
|
|
Weighted
Average
Remaining
Contractual
Term (Yrs)
|
|
Aggregate
Intrinsic
Value
|
|
|||||
|
|
(Dollars in Thousands, Except Share and Per Share Data)
|
||||||||||||
|
Options outstanding, September 30, 2017
|
227,271
|
|
$
|
7.54
|
|
2.28
|
|
$
|
4,225
|
|
|||
|
Granted
|
—
|
|
—
|
|
—
|
|
—
|
|
|||||
|
Exercised
|
(71,310
|
)
|
5.48
|
|
—
|
|
1,909
|
|
|||||
|
Forfeited or expired
|
—
|
|
—
|
|
—
|
|
—
|
|
|||||
|
Options outstanding, September 30, 2018
|
155,961
|
|
$
|
8.48
|
|
1.78
|
|
$
|
2,974
|
|
|||
|
Options exercisable end of year
|
155,961
|
|
$
|
8.48
|
|
1.78
|
|
$
|
2,974
|
|
|||
|
|
Number
of
Shares
|
|
Weighted
Average
Exercise
Price
|
|
Weighted
Average
Remaining
Contractual
Term (Yrs)
|
|
Aggregate
Intrinsic
Value
|
|
|||||
|
|
(Dollars in Thousands, Except Share and Per Share Data)
|
||||||||||||
|
Options outstanding, September 30, 2016
|
376,680
|
|
$
|
8.58
|
|
2.68
|
|
$
|
4,379
|
|
|||
|
Granted
|
—
|
|
—
|
|
—
|
|
—
|
|
|||||
|
Exercised
|
(88,158
|
)
|
11.13
|
|
—
|
|
1,790
|
|
|||||
|
Forfeited or expired
|
(61,251
|
)
|
9
|
|
—
|
|
1,464
|
|
|||||
|
Options outstanding, September 30, 2017
|
227,271
|
|
$
|
7.54
|
|
2.28
|
|
$
|
4,225
|
|
|||
|
Options exercisable end of year
|
227,271
|
|
$
|
7.54
|
|
2.28
|
|
$
|
4,225
|
|
|||
|
|
Number of
Shares
|
|
Weighted Average
Fair Value At Grant
|
|
||
|
|
(Dollars in Thousands, Except Share and Per Share Data)
|
|||||
|
Nonvested shares outstanding, September 30, 2017
|
913,578
|
|
$
|
28.99
|
|
|
|
Granted
|
354,108
|
|
30.36
|
|
||
|
Vested
|
(253,944
|
)
|
27.49
|
|
||
|
Forfeited or expired
|
(7,929
|
)
|
23.27
|
|
||
|
Nonvested shares outstanding, September 30, 2018
|
1,005,813
|
|
$
|
29.89
|
|
|
|
|
Number of
Shares
|
|
Weighted Average
Fair Value At Grant
|
|
||
|
|
(Dollars in Thousands, Except Share and Per Share Data)
|
|||||
|
Nonvested shares outstanding, September 30, 2016
|
61,968
|
|
$
|
13.79
|
|
|
|
Granted
|
949,812
|
|
29.16
|
|
||
|
Vested
|
(87,405
|
)
|
21.41
|
|
||
|
Forfeited or expired
|
(10,797
|
)
|
18.80
|
|
||
|
Nonvested shares outstanding, September 30, 2017
|
913,578
|
|
$
|
28.99
|
|
|
147
The Company and its subsidiaries file a consolidated federal income tax return on a fiscal year basis. The provision for income taxes for the years presented below consisted of the following:
|
Years ended September 30,
|
2018
|
2017
|
2016
|
||||||||
|
|
(Dollars in Thousands)
|
||||||||||
|
Federal:
|
|||||||||||
|
Current
|
$
|
(4,023
|
)
|
$
|
12,153
|
|
$
|
4,410
|
|
||
|
Deferred
|
5,895
|
|
(5,040
|
)
|
(440
|
)
|
|||||
|
|
1,872
|
|
7,113
|
|
3,970
|
|
|||||
|
State:
|
|
|
|
|
|
|
|||||
|
Current
|
2,611
|
|
4,366
|
|
1,422
|
|
|||||
|
Deferred
|
634
|
|
(1,246
|
)
|
210
|
|
|||||
|
|
3,245
|
|
3,120
|
|
1,632
|
|
|||||
|
Income tax expense
|
$
|
5,117
|
|
$
|
10,233
|
|
$
|
5,602
|
|
||
148
The tax effects of the Company's temporary differences that give rise to significant portions of its deferred tax assets and liabilities at
September 30, 2018
and
2017
were:
|
September 30,
|
2018
|
2017
|
|||||
|
|
(Dollars in Thousands)
|
||||||
|
Deferred tax assets:
|
|||||||
|
Bad debts
|
$
|
3,224
|
|
$
|
2,832
|
|
|
|
Deferred compensation
|
3,495
|
|
1,548
|
|
|||
|
Stock based compensation
|
3,758
|
|
3,436
|
|
|||
|
AMT Credit
|
—
|
|
1,869
|
|
|||
|
Intangibles
|
—
|
|
5,235
|
|
|||
|
Net unrealized losses on securities available for sale
|
10,663
|
|
—
|
|
|||
|
Valuation adjustments
|
6,991
|
|
—
|
|
|||
|
General business credits
(1)
|
12,243
|
|
—
|
|
|||
|
Accrued expenses
|
3,144
|
|
1,188
|
|
|||
|
Other assets
|
1,629
|
|
1,579
|
|
|||
|
|
45,147
|
|
17,687
|
|
|||
|
Deferred tax liabilities:
|
|
|
|
|
|||
|
Premises and equipment
|
(347
|
)
|
(1,713
|
)
|
|||
|
Intangibles
|
(4,231
|
)
|
—
|
|
|||
|
Net unrealized gains on securities available for sale
|
—
|
|
(4,934
|
)
|
|||
|
Deferred income
|
(2,070
|
)
|
—
|
|
|||
|
Leased assets
|
(17,985
|
)
|
—
|
|
|||
|
Other liabilities
|
(1,777
|
)
|
(1,939
|
)
|
|||
|
|
(26,410
|
)
|
(8,586
|
)
|
|||
|
Net deferred tax assets
|
$
|
18,737
|
|
$
|
9,101
|
|
|
(1)
The general business credits are investment tax credits generated from qualified solar energy property placed in service during the year ended September 30, 2018 or in previous periods by Crestmark prior to acquisition. These credits expire on September 30, 2037.
149
The table below reconciles the statutory federal income tax expense and rate to the effective income tax expense and rate for the years presented. The Company's effective tax rate is calculated by dividing income tax expense by income before income tax expense.
|
Years ended September 30,
|
2018
|
2017
|
2016
|
||||||||||||||||
|
(Dollars in Thousands)
|
Amount
|
Rate
|
Amount
|
Rate
|
Amount
|
Rate
|
|||||||||||||
|
Statutory federal income tax expense and rate
|
$
|
14,082
|
|
24.5
|
%
|
$
|
19,303
|
|
35.0
|
%
|
$
|
13,588
|
|
35.0
|
%
|
||||
|
Change in tax rate resulting from:
|
|||||||||||||||||||
|
State income taxes net of federal benefits
|
2,461
|
|
4.3
|
%
|
2,014
|
|
3.7
|
%
|
933
|
|
2.4
|
%
|
|||||||
|
Tax exempt income
|
(6,968
|
)
|
(12.1
|
)%
|
(9,991
|
)
|
(18.1
|
)%
|
(8,257
|
)
|
(21.3
|
)%
|
|||||||
|
Nondeductible acquisition costs
|
1,295
|
|
2.3
|
%
|
—
|
|
—
|
%
|
—
|
|
—
|
%
|
|||||||
|
General business credits
|
(3,948
|
)
|
(6.9
|
)%
|
—
|
|
—
|
%
|
—
|
|
—
|
%
|
|||||||
|
Tax Reform
|
3,849
|
|
6.7
|
%
|
—
|
|
—
|
%
|
—
|
|
—
|
%
|
|||||||
|
Amended Crestmark Bancorp historical tax return
|
(4,644
|
)
|
(8.1
|
)%
|
—
|
|
—
|
%
|
—
|
|
—
|
%
|
|||||||
|
Other, net
|
(1,010
|
)
|
(1.7
|
)%
|
(1,093
|
)
|
(2.0
|
)%
|
(662
|
)
|
(1.7
|
)%
|
|||||||
|
Total income tax expense
|
$
|
5,117
|
|
9.0
|
%
|
$
|
10,233
|
|
18.6
|
%
|
$
|
5,602
|
|
14.4
|
%
|
||||
As of
September 30, 2018
, the Company had a gross deferred tax asset of
$2.0 million
for separate company state cumulative net operating loss carryforwards, for which
$1.6 million
was reserved. At September 30, 2017, the Company had a gross deferred tax asset of
$1.3 million
for separate company state cumulative net operating loss carryforwards, which was fully reserved for.
In general, management believes that the realization of its deferred tax assets is more likely than not based on the expectations as to future taxable income; therefore, there was no deferred tax valuation allowance at
September 30, 2018
, or
2017
with the exception of the state cumulative net operating loss carryforwards discussed above.
Federal income tax laws provided savings banks with additional bad debt deductions through September 30, 1987, totaling
$6.7 million
for the Bank. Accounting standards do not require a deferred tax liability to be recorded on this amount, which liability otherwise would total approximately
$1.4 million
at
September 30, 2018
and
2017
. If the Bank were to be liquidated or otherwise cease to be a bank, or if tax laws were to change, the
$1.4 million
would be recorded as expense.
The Tax Act was signed into law on December 22, 2017. In addition to implementing numerous other changes to the U.S. tax regime, the Tax Act lowers the U.S. corporate tax rate from 35% to 21% effective for taxable years beginning on or after January 1, 2018. GAAP requires that the impact of tax legislation be recognized in the period in which the law was enacted.
As a result of the Tax Act, the Company remeasured its deferred tax assets and deferred tax liabilities during its fiscal 2018 first quarter, resulting in additional income tax expense of
$3.6 million
. As the Company’s fiscal year end ends on September 30, the statutory corporate rate for fiscal 2018 was prorated to
24.5%
.
The provisions of ASC 740,
Income Taxes,
address the determination of how tax benefits claimed or expected to be claimed on a tax return should be recorded in the Consolidated Financial Statements. Under ASC 740, the Company recognizes the tax benefits from an uncertain tax position only if it is more likely than not that the tax position will be sustained upon examination, with a tax examination being presumed to occur, including the resolution of any related appeals or litigation. The tax benefits recognized in the Consolidated Financial Statements from such a position are measured as the largest benefit that has a greater than 50% likelihood of being realized upon ultimate resolution.
The Company uses the flow through method of accounting for investment tax credits under which the credits are recognized as a reduction to income tax expense in the period in which the credit arises. During the fiscal year ended September 30, 2018,
$4.0 million
in investment tax credits were recognized as a reduction to income tax expense. During the fiscal years ended September 30, 2017 and 2016, no investment tax credits were recognized.
150
The Company’s tax reserves reflect management’s judgment as to the resolution of the issues involved if subject to judicial review. While the Company believes that its reserves are adequate to cover reasonably expected tax risks, there can be no assurance that, in all instances, an issue raised by a tax authority will be resolved at a financial cost that does not exceed its related reserve. With respect to these reserves, the Company’s income tax expense would include (i) any changes in tax reserves arising from material changes during the period in the facts and circumstances surrounding a tax issue, and (ii) any difference from the Company’s tax position as recorded in the Consolidated Financial Statements and the final resolution of a tax issue during the period.
The tax years ended
September 30, 2015
and later remain subject to examination by the Internal Revenue Service. For state purposes, the tax years ended
September 30, 2015
and later remain open for examination, with few exceptions.
A reconciliation of the beginning and ending balances for liabilities associated with unrecognized tax benefits for the years ended
September 30, 2018
, and
2017
follows:
|
September 30,
|
2018
|
|
2017
|
|
|||
|
|
(Dollars in Thousands)
|
||||||
|
Balance at beginning of year
|
$
|
645
|
|
$
|
525
|
|
|
|
Additions for tax positions related to the current year
|
—
|
|
192
|
|
|||
|
Additions for tax positions related to the prior years
|
—
|
|
31
|
|
|||
|
Reductions for tax positions related to prior years
|
(211
|
)
|
(103
|
)
|
|||
|
Balance at end of year
|
$
|
434
|
|
$
|
645
|
|
|
The total amount of unrecognized tax benefits that, if recognized, would impact the effective rate was $
384,000
as of
September 30, 2018
. The Company recognizes interest related to unrecognized tax benefits as a component of income tax expense. The amount of accrued interest related to unrecognized tax benefits was $
68,000
as of
September 30, 2018
. The Company does not anticipate any significant change in the total amount of unrecognized tax benefits within the next 12 months.
As U.S. banking organizations, the Company and the Bank are required to comply with the regulatory capital rules adopted by the Federal Reserve and the OCC (the "Basel III Capital Rules") that became effective on January 1, 2015, subject to phase-in periods for certain requirements and other provisions of the Basel III Capital Rules. Under the Basel III Capital Rules and the regulatory framework for prompt corrective action, the Company and Bank must meet specific capital guidelines that involve quantitative measures of the Company’s and Bank’s assets, liabilities and certain off-balance-sheet items as calculated under regulatory accounting practices. The Company’s and Bank’s capital amounts and classifications are also subject to qualitative judgments by regulators about components, risk weightings and other factors.
The Basel III Capital Rules require the Company and the Bank to maintain minimum ratios (set forth in the table below) of total risk-based capital and Tier 1 capital (as defined in the regulations) to risk-weighted assets (as defined), and a leverage ratio consisting of Tier 1 capital (as defined) to average assets (as defined). At September 30, 2018, both the Bank and the Company exceeded federal regulatory minimum capital requirements to be classified as well-capitalized under the prompt corrective action requirements. The Company and the Bank took the accumulated other comprehensive income (“AOCI”) opt-out election; under the rule, non-advanced approach banking organizations were given a one-time option to exclude certain AOCI components. The table below includes certain non-GAAP financial measures that are used by investors, analysts and bank regulatory agencies to assess the capital position of financial services companies. Management reviews these measures along with other measures of capital as part of its financial analyses and has included this non-GAAP financial information, and the corresponding reconciliation to total equity.
151
|
|
Company
|
Bank
|
Minimum
Requirement For
Capital Adequacy
Purposes
|
Minimum Requirement
To Be Well Capitalized
Under Prompt
Corrective Action
Provisions
|
|||||||
|
September 30, 2018
|
|
||||||||||
|
Tier 1 leverage ratio
|
8.50
|
%
|
9.75
|
%
|
4.00
|
%
|
|
5.00
|
%
|
||
|
Common equity Tier 1 capital ratio
|
10.56
|
|
12.50
|
|
4.50
|
|
|
6.50
|
|
||
|
Tier 1 capital ratio
|
10.97
|
|
12.56
|
|
6.00
|
|
|
8.00
|
|
||
|
Total qualifying capital ratio
|
13.18
|
|
12.89
|
|
8.00
|
|
|
10.00
|
|
||
|
September 30, 2017
|
|
|
|
|
|
|
|
|
|
||
|
Tier 1 leverage ratio
|
7.64
|
%
|
9.64
|
%
|
4.00
|
%
|
5.00
|
%
|
|||
|
Common equity Tier 1 capital ratio
|
13.97
|
|
18.22
|
|
4.50
|
|
|
6.50
|
|
||
|
Tier 1 capital ratio
|
14.46
|
|
18.22
|
|
6.00
|
|
|
8.00
|
|
||
|
Total qualifying capital ratio
|
18.41
|
|
18.59
|
|
8.00
|
|
|
10.00
|
|
||
The following table provides a reconciliation of the amounts included in the table above for the Company.
|
|
Standardized Approach
(1)
September 30, 2018
|
||
|
|
(Dollars in Thousands)
|
||
|
|
|||
|
Total stockholders' equity
|
$
|
747,726
|
|
|
Adjustments:
|
|
|
|
|
LESS: Goodwill, net of associated deferred tax liabilities
|
299,456
|
|
|
|
LESS: Certain other intangible assets
|
64,716
|
|
|
|
LESS: Net unrealized gains (losses) on available-for-sale securities
|
(33,114
|
)
|
|
|
LESS: Non-controlling interest
|
3,574
|
|
|
|
LESS: Unrealized currency gains (losses)
|
3
|
|
|
|
Common Equity Tier 1
(1)
|
413,091
|
|
|
|
Long-term debt and other instruments qualifying as Tier 1
|
13,661
|
|
|
|
Tier 1 minority interest not included in common equity tier 1 capital
|
2,118
|
|
|
|
Total Tier 1 capital
|
428,870
|
|
|
|
Allowance for loan and lease losses
|
13,185
|
|
|
|
Subordinated debentures (net of issuance costs)
|
73,491
|
|
|
|
Total qualifying capital
|
515,546
|
|
|
(1)
The Basel III Capital Rules revised the definition of capital, increased minimum capital ratios, and introduced a minimum CET1 ratio. Those changes became effective for the Company on January 1, 2015, and are being fully phased in through the end of 2021. The capital ratios were determined using the Basel III Capital Rules that became effective on January 1, 2015.
Under the Basel III Capital Rules, since January 1, 2016, the Company and the Bank have been required to maintain a capital conservation buffer above the minimum risk-based capital requirements in order to avoid certain limitations on capital distributions, stock repurchases and discretionary bonus payments to executive officers. The capital conservation buffer is exclusively composed of Common Equity Tier 1 capital, and it applies to each of the three risk-based capital ratios but not the leverage ratio. On January 1, 2018, the Company and Bank were in compliance with the capital conservation buffer requirement. The capital conservation buffer was subject to a three year phase-in and will increase the three risk-based capital ratios by 0.625% for 2019, at which point the Common Equity Tier 1 risk-based, Tier 1 risk-based and total risk-based capital ratios will be 7.0%, 8.5% and 10.5%, respectively.
152
In the normal course of business, the Bank makes various commitments to extend credit which are not reflected in the accompanying Consolidated Financial Statements.
At
September 30, 2018
and
2017
, unfunded loan commitments approximated $
748.8
million and $
233.2
million, respectively, excluding undisbursed portions of loans in process. The increase over the prior year was primarily attributable to loans acquired through the Crestmark Acquisition. Commitments, which are disbursed subject to certain limitations, extend over various periods of time. Generally, unused commitments are cancelled upon expiration of the commitment term as outlined in each individual contract.
The Company had
$1.4 million
in commitments to purchase securities at
September 30, 2018
and none at
September 30, 2017
. The Company had
no
commitments to sell securities at
September 30, 2018
or
September 30, 2017
.
The exposure to credit loss in the event of non-performance by other parties to financial instruments for commitments to extend credit is represented by the contractual amount of those instruments. The same credit policies and collateral requirements are used in making commitments and conditional obligations as are used for on-balance-sheet instruments. Management monitors several factors when estimating its allowance for uncollectible off-balance-sheet credit exposures, including, but not limited to, economic developments and historical loss rates. At
September 30, 2018
, the Company had an allowance for credit losses on off-balance sheet credit exposures of
$0.1 million
, as compared to
$0.2 million
at
September 30, 2017
. This amount is maintained as a separate liability account within other liabilities.
Since certain commitments to make loans and to fund lines of credit expire without being used, the amount does not necessarily represent future cash commitments. In addition, commitments used to extend credit are agreements to lend to a customer as long as there is no violation of any condition established in the contract.
LEGAL PROCEEDINGS
The Bank was served on April 15, 2013, with a lawsuit captioned Inter National Bank v. NetSpend Corporation, MetaBank, BDO USA, LLP d/b/a BDO Seidman, Cause No. C-2084-12-I filed in the District Court of Hidalgo County, Texas. The Plaintiff’s Second Amended Original Petition and Application for Temporary Restraining Order and Temporary Injunction adds both MetaBank and BDO Seidman to the original causes of action against NetSpend. NetSpend acts as a prepaid card program manager and processor for both INB and MetaBank. According to the Petition, NetSpend has informed Inter National Bank (“INB”) that the depository accounts at INB for the NetSpend program supposedly contained
$10.5 million
less than they should. INB alleges that NetSpend has breached its fiduciary duty by making affirmative misrepresentations to INB about the safety and stability of the program, and by failing to timely disclose the nature and extent of any alleged shortfall in settlement of funds related to cardholder activity and the nature and extent of NetSpend’s systemic deficiencies in its accounting and settlement processing procedures. To the extent that an accounting reveals that there is an actual shortfall, INB alleges that MetaBank may be liable for portions or all of said sum due to the fact that funds have been transferred from INB to MetaBank, and thus MetaBank would have been unjustly enriched. The Bank is vigorously contesting this matter. In January 2014, NetSpend was granted summary judgment in this matter which is under appeal. Because the theory of liability against both NetSpend and the Bank is the same, the Bank views the NetSpend summary judgment as a positive in support of its position. An estimate of a range of reasonably possible loss cannot be made at this stage of the litigation because discovery is still being conducted.
The Bank was served on October 14, 2016, with a lawsuit captioned Card Limited, LLC v. MetaBank dba Meta Payment Systems, Civil No. 2:16-cv-00980 in the United States District Court for the District of Utah. This action was initiated by former prepaid program manager of the Bank, which was terminated by the Bank in fiscal year 2016. Card Limited alleges that after all of the programs have been wound down, there are two accounts with a positive balance to which they are entitled. The Bank’s position is that Card Limited is not entitled to the funds contained in said accounts. The total amount to which Card Limited claims it is entitled is
$4,001,025
. The Bank intends to vigorously defend this claim. An estimate of a range of reasonably possible loss cannot be made at this stage of the litigation because discovery is still being conducted.
Other than the matters set forth above and litigation routine to the Company's or its subsidiaries' respective businesses, there are no other new material pending legal proceedings or updates to which the Company or its subsidiaries is a party.
153
The Company has leased property under various non-cancelable operating lease agreements which expire at various times through
2037
, and require annual rentals ranging from $
400
to $
789,000
plus the payment of property taxes, normal maintenance, and insurance on certain properties. The Company also entered into capital lease agreements during the fiscal year ended September 30, 2015, for building and equipment expiring at various times through fiscal year
2035
. Amortization expense for these capital leases was
$0.1 million
for the fiscal year ended
September 30, 2018
, and included in interest expense.
In November 2014, the Company entered into a sale-leaseback transaction for one of its community bank locations in the Des Moines area. This lease meets the requirements of a capital lease and has been reflected as such in the financial statements. The original term of the lease is
20 years
and does not contain any penalties for failure to renew after the initial
20
year term where guarantees or loans from the lessee to the lessor are expected to be outstanding. The Company has the option to extend the lease for
four
additional
five
year terms at the conclusion of the original lease term.
The following table shows the total minimum rental commitment for the Company's operating and capital leases for each of the years presented below as of
September 30, 2018
.
|
|
Year Ended September 30,
|
||||||
|
|
(Dollars in Thousands)
|
||||||
|
Operating
Leases
|
Capital
Leases
|
||||||
|
2019
|
$
|
3,854
|
|
$
|
179
|
|
|
|
2020
|
3,656
|
|
182
|
|
|||
|
2021
|
3,429
|
|
182
|
|
|||
|
2022
|
2,955
|
|
182
|
|
|||
|
2023
|
2,561
|
|
182
|
|
|||
|
Thereafter
|
21,428
|
|
2,058
|
|
|||
|
Total Leases Commitments
|
$
|
37,883
|
|
$
|
2,965
|
|
|
|
Amounts representing interest
|
|
|
$
|
1,089
|
|
||
|
Present value of net minimum lease payments
|
|
|
1,876
|
|
|||
An operating segment is generally defined as a component of a business for which discrete financial information is available and whose results are reviewed by the chief operating decision-maker. Operating segments are aggregated into reportable segments if certain criteria are met.
The Company reports its results of operations through the following
three
business segments:
Payments, Banking, and Corporate Services/Other
. The Meta Payment Systems and Tax Services divisions are reported in the
Payments
segment. The Community Banking, Commercial Finance and Consumer Finance divisions are reported in the
Banking segment
. Certain shared services, including the investment portfolio, wholesale deposits and borrowings, are included in Corporate Services/Other.
154
|
|
Payments
|
Banking
|
Corporate Services/Other
|
Total
|
|||||||||||
|
Year Ended September 30, 2018
|
|||||||||||||||
|
Interest income
|
$
|
24,487
|
|
$
|
97,817
|
|
$
|
36,230
|
|
$
|
158,534
|
|
|||
|
Interest expense
|
1,646
|
|
7,012
|
|
19,327
|
|
27,985
|
|
|||||||
|
Net interest income
|
22,841
|
|
90,805
|
|
16,903
|
|
130,549
|
|
|||||||
|
Provision for loan and lease losses
|
21,344
|
|
8,088
|
|
—
|
|
29,432
|
|
|||||||
|
Non-interest income
|
176,250
|
|
13,950
|
|
(5,675
|
)
|
184,525
|
|
|||||||
|
Non-interest expense
|
126,610
|
|
46,982
|
|
54,640
|
|
228,232
|
|
|||||||
|
Income (loss) before income tax expense (benefit)
|
51,137
|
|
49,685
|
|
(43,412
|
)
|
57,410
|
|
|||||||
|
Total assets
|
186,502
|
|
3,413,409
|
|
2,235,156
|
|
5,835,067
|
|
|||||||
|
Total goodwill
|
87,145
|
|
216,125
|
|
—
|
|
303,270
|
|
|||||||
|
Total deposits
|
2,412,986
|
|
746,003
|
|
1,271,998
|
|
4,430,987
|
|
|||||||
|
|
Payments
|
Banking
|
Corporate Services/Other
|
Total
|
|||||||||||
|
Year Ended September 30, 2017
|
|||||||||||||||
|
Interest income
|
$
|
13,845
|
|
$
|
52,231
|
|
$
|
42,027
|
|
$
|
108,103
|
|
|||
|
Interest expense
|
503
|
|
2,723
|
|
11,647
|
|
14,873
|
|
|||||||
|
Net interest income
|
13,342
|
|
49,508
|
|
30,380
|
|
93,230
|
|
|||||||
|
Provision for loan losses
|
7,613
|
|
2,976
|
|
—
|
|
10,589
|
|
|||||||
|
Non-interest income
|
165,707
|
|
4,685
|
|
1,780
|
|
172,172
|
|
|||||||
|
Non-interest expense
|
132,984
|
|
24,520
|
|
42,159
|
|
199,663
|
|
|||||||
|
Income (loss) before income tax expense (benefit)
|
38,452
|
|
26,697
|
|
(9,999
|
)
|
55,150
|
|
|||||||
|
Total assets
|
185,521
|
|
1,343,968
|
|
3,698,843
|
|
5,228,332
|
|
|||||||
|
Total goodwill
|
87,145
|
|
11,578
|
|
—
|
|
98,723
|
|
|||||||
|
Total deposits
|
2,436,893
|
|
229,969
|
|
556,562
|
|
3,223,424
|
|
|||||||
|
Payments
|
Banking
|
Corporate Services/Other
|
Total
|
||||||||||||
|
Year Ended September 30, 2016
|
|||||||||||||||
|
Interest income
|
$
|
9,711
|
|
$
|
38,321
|
|
$
|
33,364
|
|
$
|
81,396
|
|
|||
|
Interest expense
|
181
|
|
1,331
|
|
2,579
|
|
4,091
|
|
|||||||
|
Net interest income
|
9,530
|
|
36,990
|
|
30,785
|
|
77,305
|
|
|||||||
|
Provision for loan losses
|
971
|
|
3,634
|
|
—
|
|
4,605
|
|
|||||||
|
Non-interest income
|
95,261
|
|
4,280
|
|
1,229
|
|
100,770
|
|
|||||||
|
Non-interest expense
|
77,411
|
|
23,001
|
|
34,236
|
|
134,648
|
|
|||||||
|
Income (loss) before income tax expense (benefit)
|
26,409
|
|
14,635
|
|
(2,222
|
)
|
38,822
|
|
|||||||
|
Total assets
|
87,311
|
|
946,420
|
|
2,972,688
|
|
4,006,419
|
|
|||||||
|
Total goodwill
|
25,350
|
|
11,578
|
|
—
|
|
36,928
|
|
|||||||
|
Total deposits
|
2,131,042
|
|
299,030
|
|
10
|
|
2,430,082
|
|
|||||||
155
Presented below are condensed financial statements for the parent company, Meta, at the dates and for the years presented below.
CONDENSED STATEMENTS OF FINANCIAL CONDITION
|
September 30,
|
2018
|
2017
|
|||||
|
|
(Dollars in Thousands)
|
||||||
|
ASSETS
|
|||||||
|
Cash and cash equivalents
|
$
|
28,209
|
|
$
|
14,569
|
|
|
|
Investment securities held to maturity
|
411
|
|
310
|
|
|||
|
Investment in subsidiaries
|
823,215
|
|
521,021
|
|
|||
|
Other assets
|
124
|
|
96
|
|
|||
|
Total assets
|
$
|
851,959
|
|
$
|
535,996
|
|
|
|
LIABILITIES AND STOCKHOLDERS' EQUITY
|
|
|
|
|
|||
|
LIABILITIES
|
|
|
|
|
|||
|
Long term debt
|
$
|
87,152
|
|
$
|
83,657
|
|
|
|
Other liabilities
|
17,081
|
|
17,843
|
|
|||
|
Total liabilities
|
$
|
104,233
|
|
$
|
101,500
|
|
|
|
STOCKHOLDERS' EQUITY
|
|
|
|
|
|||
|
Common stock
|
$
|
393
|
|
$
|
288
|
|
|
|
Additional paid-in capital
|
565,811
|
|
258,144
|
|
|||
|
Retained earnings
|
213,048
|
|
167,164
|
|
|||
|
Accumulated other comprehensive income (loss)
|
(33,111
|
)
|
9,166
|
|
|||
|
Treasury stock, at cost
|
(1,989
|
)
|
(266
|
)
|
|||
|
Total equity attributable to parent
|
744,152
|
|
434,496
|
|
|||
|
Non-controlling interest
|
3,574
|
|
—
|
|
|||
|
Total stockholders' equity
|
747,726
|
|
434,496
|
|
|||
|
Total liabilities and stockholders' equity
|
$
|
851,959
|
|
$
|
535,996
|
|
|
156
CONDENSED STATEMENTS OF OPERATIONS
|
Years Ended September 30,
|
2018
|
2017
|
2016
|
||||||||
|
|
(Dollars in Thousands)
|
||||||||||
|
Interest expense
|
$
|
5,061
|
|
$
|
4,959
|
|
$
|
1,022
|
|
||
|
Other expense
|
663
|
|
440
|
|
382
|
|
|||||
|
Total expense
|
5,724
|
|
5,399
|
|
1,404
|
|
|||||
|
Loss before income taxes and equity in undistributed net income of subsidiaries
|
(5,724
|
)
|
(5,399
|
)
|
(1,404
|
)
|
|||||
|
Income tax (benefit)
|
(1,504
|
)
|
(1,935
|
)
|
(519
|
)
|
|||||
|
Loss before equity in undistributed net income of subsidiaries
|
(4,220
|
)
|
(3,464
|
)
|
(885
|
)
|
|||||
|
Equity in undistributed net income of subsidiaries
|
55,840
|
|
48,381
|
|
34,105
|
|
|||||
|
Net income attributable to parent
|
$
|
51,620
|
|
$
|
44,917
|
|
$
|
33,220
|
|
||
157
CONDENSED STATEMENTS OF CASH FLOWS
|
For the Years Ended September 30,
|
2018
|
2017
|
2016
|
||||||||
|
|
(Dollars in Thousands)
|
||||||||||
|
CASH FLOWS FROM OPERATING ACTIVITIES
|
|||||||||||
|
Net Income attributable to parent
|
$
|
51,620
|
|
$
|
44,917
|
|
$
|
33,220
|
|
||
|
Adjustments to reconcile net income to net cash provided by operating activities:
|
|||||||||||
|
Depreciation, amortization and accretion, net
|
143
|
|
136
|
|
(22
|
)
|
|||||
|
Equity in undistributed net income of subsidiaries
|
(55,840
|
)
|
(48,381
|
)
|
(34,105
|
)
|
|||||
|
Stock compensation
|
11,123
|
|
10,393
|
|
426
|
|
|||||
|
Other assets
|
232
|
|
7
|
|
(5
|
)
|
|||||
|
Accrued expenses and other liabilities
|
(860
|
)
|
16,636
|
|
541
|
|
|||||
|
Cash dividend received
|
45,315
|
|
—
|
|
—
|
|
|||||
|
Net cash provided by operating activities
|
51,733
|
|
23,708
|
|
55
|
|
|||||
|
CASH FLOWS FROM INVESTING ACTIVITES
|
|||||||||||
|
Held to Maturity:
|
|||||||||||
|
Proceeds from maturities and principal repayments
|
8
|
|
—
|
|
—
|
|
|||||
|
Capital contributions to subsidiaries
|
(20,322
|
)
|
(82,820
|
)
|
(81,000
|
)
|
|||||
|
Net cash (used in) investing activities
|
(20,314
|
)
|
(82,820
|
)
|
(81,000
|
)
|
|||||
|
CASH FLOWS FROM FINANCING ACTIVITIES
|
|||||||||||
|
Cash dividends paid
|
(5,736
|
)
|
(4,839
|
)
|
(4,389
|
)
|
|||||
|
Payment:
|
|||||||||||
|
Short term debt
|
(11,642
|
)
|
—
|
|
—
|
|
|||||
|
Long term debt
|
(258
|
)
|
—
|
|
75,000
|
|
|||||
|
Debt issuance costs
|
—
|
|
—
|
|
(1,767
|
)
|
|||||
|
Purchase of shares by ESOP
|
1,606
|
|
1,174
|
|
—
|
|
|||||
|
Proceeds/(payment):
|
|||||||||||
|
Contingent consideration - equity
|
—
|
|
24,142
|
|
—
|
|
|||||
|
Exercise of stock options & issuance of common stock
|
148
|
|
650
|
|
13,537
|
|
|||||
|
Issuance of restricted stock
|
4
|
|
12
|
|
—
|
|
|||||
|
Issuance of commons shares due to acquisitions
|
295,767
|
|
37,296
|
|
—
|
|
|||||
|
Cash acquired due to acquisitions
|
697
|
|
—
|
|
—
|
|
|||||
|
Net increase in investment in subsidiaries
|
(295,767
|
)
|
—
|
|
—
|
|
|||||
|
Shares repurchased for tax withholdings on stock compensation
|
(2,598
|
)
|
(470
|
)
|
—
|
|
|||||
|
Net cash provided by (used in) financing activities
|
(17,779
|
)
|
57,965
|
|
82,381
|
|
|||||
|
Net change in cash and cash equivalents
|
$
|
13,640
|
|
$
|
(1,147
|
)
|
$
|
1,436
|
|
||
|
CASH AND CASH EQUIVALENTS
|
|
|
|
|
|||||||
|
Beginning of year
|
14,569
|
|
15,716
|
|
14,280
|
|
|||||
|
End of year
|
$
|
28,209
|
|
$
|
14,569
|
|
$
|
15,716
|
|
||
The extent to which the Company may pay cash dividends to stockholders will depend on the cash currently available at the Company, as well as the ability of the Bank to pay dividends to the Company. For further discussion, see Note 13 herein.
158
All share and per share data for all periods presented in the following table has been adjusted to reflect the 3-for-1 forward stock split with respect to the Company's common stock effected by the Company on October 4, 2018.
|
|
QUARTER ENDED
|
||||||||||||||
|
|
December 31
|
March 31
|
June 30
|
September 30
|
|||||||||||
|
|
(Dollars in Thousands, Except Per Share Data)
|
||||||||||||||
|
Fiscal Year 2018
|
|||||||||||||||
|
Interest and dividend income
|
$
|
30,857
|
|
$
|
33,371
|
|
$
|
34,104
|
|
$
|
60,202
|
|
|||
|
Interest expense
|
4,661
|
|
5,966
|
|
5,693
|
|
11,665
|
|
|||||||
|
Net interest income
|
26,196
|
|
27,405
|
|
28,411
|
|
48,537
|
|
|||||||
|
Provision for loan and lease losses
|
1,068
|
|
18,343
|
|
5,315
|
|
4,706
|
|
|||||||
|
Non-interest income
|
29,268
|
|
97,419
|
|
33,225
|
|
24,613
|
|
|||||||
|
Net Income attributable to parent
|
4,670
|
|
31,436
|
|
6,792
|
|
8,722
|
|
|||||||
|
Earnings per common share
|
|
|
|
|
|
|
|
|
|||||||
|
Basic
|
$
|
0.15
|
|
$
|
1.07
|
|
$
|
0.22
|
|
$
|
0.24
|
|
|||
|
Diluted
|
0.15
|
|
1.06
|
|
0.22
|
|
0.24
|
|
|||||||
|
Dividend declared per share
|
0.04
|
|
0.04
|
|
0.04
|
|
0.05
|
|
|||||||
|
Fiscal Year 2017
|
|
|
|
|
|
|
|
|
|||||||
|
Interest and dividend income
|
$
|
22,575
|
|
$
|
27,718
|
|
$
|
28,861
|
|
$
|
28,949
|
|
|||
|
Interest expense
|
2,742
|
|
3,752
|
|
3,918
|
|
4,461
|
|
|||||||
|
Net interest income
|
19,833
|
|
23,966
|
|
24,943
|
|
24,488
|
|
|||||||
|
Provision (recovery) for loan losses
|
843
|
|
8,649
|
|
1,240
|
|
(144
|
)
|
|||||||
|
Non-interest income
|
19,349
|
|
92,170
|
|
30,820
|
|
29,833
|
|
|||||||
|
Net Income attributable to parent
|
1,244
|
|
32,142
|
|
9,787
|
|
1,744
|
|
|||||||
|
Earnings per common share
|
|
|
|
|
|
|
|
|
|||||||
|
Basic
|
$
|
0.05
|
|
$
|
1.15
|
|
$
|
0.35
|
|
$
|
0.07
|
|
|||
|
Diluted
|
0.05
|
|
1.14
|
|
0.35
|
|
0.07
|
|
|||||||
|
Dividend declared per share
|
0.04
|
|
0.04
|
|
0.04
|
|
0.04
|
|
|||||||
|
Fiscal Year 2016
|
|
|
|
|
|
|
|
|
|||||||
|
Interest and dividend income
|
$
|
18,275
|
|
$
|
20,629
|
|
$
|
20,763
|
|
$
|
21,729
|
|
|||
|
Interest expense
|
720
|
|
691
|
|
844
|
|
1,836
|
|
|||||||
|
Net interest income
|
17,555
|
|
19,938
|
|
19,919
|
|
19,893
|
|
|||||||
|
Provision for loan losses
|
786
|
|
1,173
|
|
2,098
|
|
548
|
|
|||||||
|
Non-interest income
|
16,834
|
|
40,901
|
|
23,807
|
|
19,228
|
|
|||||||
|
Net Income attributable to parent
|
4,058
|
|
14,283
|
|
8,873
|
|
6,006
|
|
|||||||
|
Earnings per common share
|
|
|
|
|
|
|
|
|
|||||||
|
Basic
|
$
|
0.16
|
|
$
|
0.57
|
|
$
|
0.35
|
|
$
|
0.23
|
|
|||
|
Diluted
|
0.16
|
|
0.56
|
|
0.35
|
|
0.23
|
|
|||||||
|
Dividend declared per share
|
0.04
|
|
0.04
|
|
0.04
|
|
0.04
|
|
|||||||
159
ASC 820,
Fair Value Measurements
defines fair value, establishes a framework for measuring the fair value of assets and liabilities using a hierarchy system and requires disclosures about fair value measurement. It clarifies that fair value is the price that would be received to sell an asset or paid to transfer a liability in an orderly transaction between market participants in the market in which the reporting entity transacts.
The fair value hierarchy is as follows:
Level 1 Inputs
- Valuation is based upon quoted prices for identical instruments traded in active markets that the Company has the ability to access at measurement date.
Level 2 Inputs
- Valuation is based upon quoted prices for similar instruments in active markets, quoted prices for identical or similar instruments in markets that are not active and model-based valuation techniques for which significant assumptions are observable in the market.
Level 3 Inputs
- Valuation is generated from model-based techniques that use significant assumptions not observable in the market and are used only to the extent that observable inputs are not available. These unobservable assumptions reflect the Company’s own estimates of assumptions that market participants would use in pricing the asset or liability. Valuation techniques include use of option pricing models, discounted cash flow models and similar techniques.
There were
no
transfers between levels of the fair value hierarchy for the years ended
September 30, 2018
or
2017
.
Securities Available for Sale and Held to Maturity
. Securities available for sale are recorded at fair value on a recurring basis and securities held to maturity are carried at amortized cost. Fair value measurement is based upon quoted prices, if available. If quoted prices are not available, fair values are measured using an independent pricing service. For both Level 1 and Level 2 securities, management uses various methods and techniques to corroborate prices obtained from the pricing service, including but not limited to reference to dealer or other market quotes, and by reviewing valuations of comparable instruments. The Company’s Level 1 securities include equity securities and mutual funds. The Company’s Level 2 securities include U.S. Government agency and instrumentality securities, U.S. Government agency and instrumentality MBS and municipal bonds. The Company had no Level 3 securities at
September 30, 2018
, or
2017
.
The fair values of securities are determined by obtaining quoted prices on nationally recognized securities exchanges (Level 1 inputs), or valuation based upon quoted prices for similar instruments in active markets, quoted prices for identical or similar instruments in markets that are not active and model‑based valuation techniques for which significant assumptions are observable in the market (Level 2 inputs). The Company considers these valuations supplied by a third-party provider which utilizes several sources for valuing fixed-income securities. These sources include Interactive Data Corporation, Reuters, Standard and Poor’s, Bloomberg Financial Markets, Street Software Technology and the third‑party provider’s own matrix and desk pricing. The Company, no less than annually, reviews the third party’s methods and source’s methodology for reasonableness and to ensure an understanding of inputs utilized in determining fair value. Sources utilized by the third-party provider include but are not limited to pricing models that vary based on asset class and include available trade, bid, and other market information. This methodology includes but is not limited to broker quotes, proprietary models, descriptive terms and conditions databases, as well as extensive quality control programs. Monthly, the Company receives and compares prices provided by multiple securities dealers and pricing providers to validate the accuracy and reasonableness of prices received from the third-party provider. On a monthly basis, the Investment Committee reviews mark-to-market changes in the securities portfolio for reasonableness.
160
The following table summarizes the fair values of securities available for sale and held to maturity at
September 30, 2018
and
2017
. Securities available for sale are measured at fair value on a recurring basis, while securities held to maturity are carried at amortized cost in the Consolidated Statements of Financial Condition.
|
|
Fair Value At September 30, 2018
|
||||||||||||||||||||||||||||||
|
|
Available For Sale
|
Held to Maturity
|
|||||||||||||||||||||||||||||
|
(Dollars in Thousands)
|
Total
|
Level 1
|
Level 2
|
Level 3
|
Total
|
Level 1
|
Level 2
|
Level 3
|
|||||||||||||||||||||||
|
Debt securities
|
|||||||||||||||||||||||||||||||
|
Small business administration securities
|
44,337
|
|
—
|
|
44,337
|
|
—
|
|
—
|
|
—
|
|
—
|
|
—
|
|
|||||||||||||||
|
Obligations of states and political subdivisions
|
16,910
|
|
—
|
|
16,910
|
|
—
|
|
—
|
|
—
|
|
—
|
|
—
|
|
|||||||||||||||
|
Non-bank qualified obligations of states and political subdivisions
|
1,109,885
|
|
—
|
|
1,109,885
|
|
—
|
|
153,546
|
|
—
|
|
153,546
|
|
—
|
|
|||||||||||||||
|
Asset-backed securities
|
313,028
|
|
—
|
|
313,028
|
|
—
|
|
—
|
|
—
|
|
—
|
|
—
|
|
|||||||||||||||
|
Mortgage-backed securities
|
364,065
|
|
—
|
|
364,065
|
|
—
|
|
7,428
|
|
—
|
|
7,428
|
|
—
|
|
|||||||||||||||
|
Total debt securities
|
1,848,225
|
|
—
|
|
1,848,225
|
|
—
|
|
160,974
|
|
—
|
|
160,974
|
|
—
|
|
|||||||||||||||
|
Common equities and mutual funds
|
3,800
|
|
3,800
|
|
—
|
|
—
|
|
—
|
|
—
|
|
—
|
|
—
|
|
|||||||||||||||
|
Total securities
|
$
|
1,852,025
|
|
$
|
3,800
|
|
$
|
1,848,225
|
|
$
|
—
|
|
$
|
160,974
|
|
$
|
—
|
|
$
|
160,974
|
|
$
|
—
|
|
|||||||
|
|
Fair Value At September 30, 2017
|
||||||||||||||||||||||||||||||
|
|
Available For Sale
|
Held to Maturity
|
|||||||||||||||||||||||||||||
|
(Dollars in Thousands)
|
Total
|
Level 1
|
Level 2
|
Level 3
|
Total
|
Level 1
|
Level 2
|
Level 3
|
|||||||||||||||||||||||
|
Debt securities
|
|||||||||||||||||||||||||||||||
|
Small business administration securities
|
57,871
|
|
—
|
|
57,871
|
|
—
|
|
—
|
|
—
|
|
—
|
|
—
|
|
|||||||||||||||
|
Obligations of states and political subdivisions
|
—
|
|
—
|
|
—
|
|
—
|
|
19,368
|
|
—
|
|
19,368
|
|
—
|
|
|||||||||||||||
|
Non-bank qualified obligations of states and political subdivisions
|
950,829
|
|
—
|
|
950,829
|
|
—
|
|
432,361
|
|
—
|
|
432,361
|
|
—
|
|
|||||||||||||||
|
Asset-backed securities
|
96,832
|
|
—
|
|
96,832
|
|
—
|
|
—
|
|
—
|
|
—
|
|
—
|
|
|||||||||||||||
|
Mortgage-backed securities
|
586,454
|
|
—
|
|
586,454
|
|
—
|
|
112,456
|
|
—
|
|
112,456
|
|
—
|
|
|||||||||||||||
|
Total debt securities
|
1,691,986
|
|
—
|
|
1,691,986
|
|
—
|
|
564,185
|
|
—
|
|
564,185
|
|
—
|
|
|||||||||||||||
|
Common equities and mutual funds
|
1,445
|
|
1,445
|
|
—
|
|
—
|
|
—
|
|
—
|
|
—
|
|
—
|
|
|||||||||||||||
|
Total securities
|
$
|
1,693,431
|
|
$
|
1,445
|
|
$
|
1,691,986
|
|
$
|
—
|
|
$
|
564,185
|
|
$
|
—
|
|
$
|
564,185
|
|
$
|
—
|
|
|||||||
Foreclosed Real Estate and Repossessed Assets
. Real estate properties and repossessed assets are initially recorded at the fair value less selling costs at the date of foreclosure, establishing a new cost basis. The carrying amount represents the lower of the new cost basis or the fair value less selling costs of foreclosed assets that were measured at fair value subsequent to their initial classification as foreclosed assets.
Loans and Leases.
The Company does not record loans and leases at fair value on a recurring basis. However, if a loan or lease is considered impaired, an allowance for loan and lease losses is established. Once a loan or lease is identified as individually impaired, management measures impairment in accordance with ASC 310,
Receivables
.
The following table summarizes the assets of the Company that are measured at fair value in the Consolidated Statements of Financial Condition on a non-recurring basis as of
September 30, 2018
and
2017
.
161
|
|
Fair Value at September 30, 2018
|
||||||||||||||
|
(Dollars in Thousands)
|
Total
|
Level 1
|
Level 2
|
Level 3
|
|||||||||||
|
Impaired Loans and Leases, net
|
|||||||||||||||
|
Commercial finance
|
$
|
4,825
|
|
$
|
—
|
|
$
|
—
|
|
$
|
4,825
|
|
|||
|
Total National Lending
|
4,825
|
|
—
|
|
—
|
|
4,825
|
|
|||||||
|
Total impaired loans and leases
|
4,825
|
|
—
|
|
—
|
|
4,825
|
|
|||||||
|
Foreclosed Assets, net
|
31,638
|
|
—
|
|
—
|
|
31,638
|
|
|||||||
|
Total
|
$
|
36,463
|
|
$
|
—
|
|
$
|
—
|
|
$
|
36,463
|
|
|||
|
|
Fair Value At September 30, 2017
|
||||||||||||||
|
(Dollars in Thousands)
|
Total
|
Level 1
|
Level 2
|
Level 3
|
|||||||||||
|
Impaired Loans and Leases, net
|
|||||||||||||||
|
Foreclosed Assets, net
|
292
|
|
—
|
|
—
|
|
292
|
|
|||||||
|
Total
|
$
|
292
|
|
$
|
—
|
|
$
|
—
|
|
$
|
292
|
|
|||
|
|
Quantitative Information About Level 3 Fair Value Measurements
|
||||||||||
|
(Dollars in Thousands)
|
Fair Value at
September 30, 2018
|
Fair Value at
September 30, 2017
|
Valuation
Technique
|
Unobservable
Input
|
|||||||
|
Impaired Loans and Leases, net
|
$
|
4,825
|
|
$
|
—
|
|
Market approach
|
Appraised values
(1)
|
|||
|
Foreclosed Assets, net
|
31,638
|
|
292
|
|
Market approach
|
Appraised values
(1)
|
|||||
(1)
The Company generally relies on external appraisers to develop this information. Management reduced the appraised value by estimated selling costs in a range of
4%
to
10%
.
T
he following tables disclose the Company’s estimated fair value amounts of its financial instruments at the dates provided. It is management’s belief that the fair values presented below are reasonable based on the valuation techniques and data available to the Company as of
September 30, 2018
and
2017
, as more fully described below. The operations of the Company are managed from a going concern basis and not a liquidation basis. As a result, the ultimate value realized for the financial instruments presented could be substantially different when actually recognized over time through the normal course of operations. Additionally, a substantial portion of the Company’s inherent value is the Bank’s capitalization and franchise value. Neither of these components have been given consideration in the presentation of fair values below.
The following presents the carrying amount and estimated fair value of the financial instruments held by the Company at
September 30, 2018
and
2017
.
162
|
|
September 30, 2018
|
||||||||||||||||||
|
|
Carrying
Amount
|
Estimated
Fair Value
|
Level 1
|
Level 2
|
Level 3
|
||||||||||||||
|
|
(Dollars in Thousands)
|
||||||||||||||||||
|
Financial assets
|
|||||||||||||||||||
|
Cash and cash equivalents
|
$
|
99,977
|
|
$
|
99,977
|
|
$
|
99,977
|
|
$
|
—
|
|
$
|
—
|
|
||||
|
Securities available for sale
|
1,852,025
|
|
1,852,025
|
|
3,800
|
|
1,848,225
|
|
—
|
|
|||||||||
|
Securities held to maturity
|
172,154
|
|
160,974
|
|
—
|
|
160,974
|
|
—
|
|
|||||||||
|
Total securities
|
2,024,179
|
|
2,012,999
|
|
3,800
|
|
2,009,199
|
|
—
|
|
|||||||||
|
Loans held for sale
|
15,606
|
|
15,606
|
|
—
|
|
15,606
|
|
—
|
|
|||||||||
|
Loans and leases receivable:
|
|||||||||||||||||||
|
Commercial finance
|
1,509,849
|
|
1,506,969
|
|
—
|
|
—
|
|
1,506,969
|
|
|||||||||
|
Consumer finance
|
335,361
|
|
342,931
|
|
—
|
|
—
|
|
342,931
|
|
|||||||||
|
Tax services
|
1,073
|
|
1,073
|
|
—
|
|
—
|
|
1,073
|
|
|||||||||
|
Total National Lending
|
1,846,283
|
|
1,850,973
|
|
—
|
|
—
|
|
1,850,973
|
|
|||||||||
|
Commercial and multi-family real estate
|
748,579
|
|
731,291
|
|
—
|
|
—
|
|
731,291
|
|
|||||||||
|
One to four family residential mortgage
|
223,482
|
|
220,697
|
|
—
|
|
—
|
|
220,697
|
|
|||||||||
|
Agricultural
|
60,498
|
|
58,849
|
|
—
|
|
—
|
|
58,849
|
|
|||||||||
|
Commercial operating
|
42,311
|
|
41,912
|
|
—
|
|
—
|
|
41,912
|
|
|||||||||
|
Consumer
|
23,836
|
|
24,033
|
|
—
|
|
—
|
|
24,033
|
|
|||||||||
|
Total Community Banking
|
1,098,706
|
|
1,076,782
|
|
—
|
|
—
|
|
1,076,782
|
|
|||||||||
|
Total loans and leases receivable
|
2,944,989
|
|
2,927,755
|
|
—
|
|
—
|
|
2,927,755
|
|
|||||||||
|
Federal Home Loan Bank stock
|
23,400
|
|
23,400
|
|
—
|
|
23,400
|
|
—
|
|
|||||||||
|
Accrued interest receivable
|
22,016
|
|
22,016
|
|
22,016
|
|
—
|
|
—
|
|
|||||||||
|
Financial liabilities
|
|||||||||||||||||||
|
Non-interest bearing demand deposits
|
2,405,274
|
|
2,405,274
|
|
2,405,274
|
|
—
|
|
—
|
|
|||||||||
|
Interest bearing demand deposits, savings, and money markets
|
218,347
|
|
218,347
|
|
218,347
|
|
—
|
|
—
|
|
|||||||||
|
Certificates of deposits
|
276,180
|
|
273,800
|
|
—
|
|
273,800
|
|
—
|
|
|||||||||
|
Wholesale non-maturing deposits
|
94,384
|
|
94,384
|
|
94,384
|
|
—
|
|
—
|
|
|||||||||
|
Wholesale certificates of deposits
|
1,436,802
|
|
1,432,146
|
|
—
|
|
1,432,146
|
|
—
|
|
|||||||||
|
Total deposits
|
4,430,987
|
|
4,423,951
|
|
2,718,005
|
|
1,705,946
|
|
—
|
|
|||||||||
|
Advances from Federal Home Loan Bank
|
—
|
|
—
|
|
—
|
|
—
|
|
—
|
|
|||||||||
|
Federal funds purchased
|
422,000
|
|
422,000
|
|
422,000
|
|
—
|
|
—
|
|
|||||||||
|
Securities sold under agreements to repurchase
|
3,694
|
|
3,694
|
|
—
|
|
3,694
|
|
—
|
|
|||||||||
|
Capital leases
|
1,876
|
|
1,876
|
|
—
|
|
1,876
|
|
—
|
|
|||||||||
|
Trust preferred securities
|
13,661
|
|
13,866
|
|
—
|
|
13,866
|
|
—
|
|
|||||||||
|
Subordinated debentures
|
73,491
|
|
75,563
|
|
—
|
|
75,563
|
|
—
|
|
|||||||||
|
Accrued interest payable
|
7,794
|
|
7,794
|
|
7,794
|
|
—
|
|
—
|
|
|||||||||
163
|
|
September 30, 2017
|
||||||||||||||||||
|
|
Carrying
Amount
|
Estimated
Fair Value
|
Level 1
|
Level 2
|
Level 3
|
||||||||||||||
|
|
(Dollars in Thousands)
|
||||||||||||||||||
|
Financial assets
|
|||||||||||||||||||
|
Cash and cash equivalents
|
$
|
1,267,586
|
|
$
|
1,267,586
|
|
$
|
1,267,586
|
|
$
|
—
|
|
$
|
—
|
|
||||
|
Securities available for sale
|
1,693,431
|
|
1,693,431
|
|
1,445
|
|
1,691,986
|
|
—
|
|
|||||||||
|
Securities held to maturity
|
563,529
|
|
564,185
|
|
—
|
|
564,185
|
|
—
|
|
|||||||||
|
Total securities
|
2,256,960
|
|
2,257,616
|
|
1,445
|
|
2,256,171
|
|
—
|
|
|||||||||
|
Loans and leases receivable:
|
|
|
|
|
|
|
|
|
|
|
|||||||||
|
Commercial finance
|
255,308
|
|
255,813
|
|
—
|
|
—
|
|
255,813
|
|
|||||||||
|
Consumer finance
|
140,229
|
|
141,958
|
|
—
|
|
—
|
|
141,958
|
|
|||||||||
|
Tax services
|
192
|
|
192
|
|
—
|
|
—
|
|
192
|
|
|||||||||
|
Total National Lending
|
395,729
|
|
397,963
|
|
—
|
|
—
|
|
397,963
|
|
|||||||||
|
Commercial and multi-family real estate
|
585,510
|
|
576,330
|
|
—
|
|
—
|
|
576,330
|
|
|||||||||
|
One to four family residential mortgage
|
196,706
|
|
196,970
|
|
—
|
|
—
|
|
196,970
|
|
|||||||||
|
Agricultural
|
95,394
|
|
94,454
|
|
—
|
|
—
|
|
94,454
|
|
|||||||||
|
Commercial operating
|
30,718
|
|
30,682
|
|
—
|
|
—
|
|
30,682
|
|
|||||||||
|
Consumer
|
22,775
|
|
22,003
|
|
—
|
|
—
|
|
22,003
|
|
|||||||||
|
Total Community Banking
|
931,103
|
|
920,439
|
|
—
|
|
—
|
|
920,439
|
|
|||||||||
|
Total loans and leases receivable
|
1,326,832
|
|
1,318,402
|
|
—
|
|
—
|
|
1,318,402
|
|
|||||||||
|
Federal Home Loan Bank stock
|
61,123
|
|
61,123
|
|
—
|
|
61,123
|
|
—
|
|
|||||||||
|
Accrued interest receivable
|
19,380
|
|
19,380
|
|
19,380
|
|
—
|
|
—
|
|
|||||||||
|
Financial liabilities
|
|
|
|
|
|
|
|
|
|
|
|||||||||
|
Non-interest bearing demand deposits
|
2,454,057
|
|
2,454,057
|
|
2,454,057
|
|
—
|
|
—
|
|
|||||||||
|
Interest bearing demand deposits, savings, and money markets
|
169,557
|
|
169,557
|
|
169,557
|
|
—
|
|
—
|
|
|||||||||
|
Certificates of deposit
|
123,637
|
|
123,094
|
|
—
|
|
123,094
|
|
—
|
|
|||||||||
|
Wholesale non-maturing deposits
|
18,245
|
|
18,245
|
|
18,245
|
|
—
|
|
—
|
|
|||||||||
|
Wholesale certificates of deposits
|
457,928
|
|
457,509
|
|
—
|
|
457,509
|
|
—
|
|
|||||||||
|
Total deposits
|
3,223,424
|
|
3,222,462
|
|
2,641,859
|
|
580,603
|
|
—
|
|
|||||||||
|
Advances from Federal Home Loan Bank
|
415,000
|
|
415,003
|
|
—
|
|
415,003
|
|
—
|
|
|||||||||
|
Federal funds purchased
|
987,000
|
|
987,000
|
|
987,000
|
|
—
|
|
—
|
|
|||||||||
|
Securities sold under agreements to repurchase
|
2,472
|
|
2,472
|
|
—
|
|
2,472
|
|
—
|
|
|||||||||
|
Capital leases
|
1,938
|
|
1,938
|
|
—
|
|
1,938
|
|
—
|
|
|||||||||
|
Trust preferred
|
10,310
|
|
10,447
|
|
—
|
|
10,447
|
|
—
|
|
|||||||||
|
Subordinated debentures
|
73,347
|
|
76,500
|
|
—
|
|
76,500
|
|
—
|
|
|||||||||
|
Accrued interest payable
|
2,280
|
|
2,280
|
|
2,280
|
|
—
|
|
—
|
|
|||||||||
164
The following sets forth the methods and assumptions used in determining the fair value estimates for the Company’s financial instruments at
September 30, 2018
and
2017
.
CASH AND CASH EQUIVALENTS
The carrying amount of cash and short-term investments is assumed to approximate the fair value.
SECURITIES AVAILABLE FOR SALE AND HELD TO MATURITY
Securities available for sale are recorded at fair value on a recurring basis and securities held to maturity are carried at amortized cost. Fair values for investment securities are based on obtaining quoted prices on nationally recognized securities exchanges, or matrix pricing, which is a mathematical technique widely used in the industry to value debt securities without relying exclusively on quoted prices for the specific securities, but rather by relying on the securities’ relationship to other benchmark quoted securities.
LOANS HELD FOR SALE
The carrying amount of loans held for sale is assumed to approximate the fair value.
LOANS AND LEASES RECEIVABLE, NET
The fair value of loans and leases is estimated using a historical or replacement cost basis concept (
i.e.,
an entrance price concept). The fair value of loans and leases was estimated by discounting the future cash flows using the current rates at which similar loans and leases would be made to borrowers and for similar remaining maturities. When using the discounting method to determine fair value, loans and leases were grouped by homogeneous loans and leases with similar terms and conditions and discounted at a target rate at which similar loans and leases would be made to borrowers at
September 30, 2018
and
2017
. In addition, when computing the estimated fair value for all loans and leases, allowances for loan and lease losses have been subtracted from the calculated fair value as a result of the discounted cash flow which approximates the fair value adjustment for the credit quality component.
FHLB STOCK
The fair value of such stock is assumed to approximate book value since the Company is generally able to redeem this stock at par value.
ACCRUED INTEREST RECEIVABLE
The carrying amount of accrued interest receivable is assumed to approximate the fair value.
DEPOSITS
The carrying values of non-interest-bearing checking deposits, interest-bearing checking deposits, savings, money markets, and wholesale non-maturing deposits are assumed to approximate fair value, since such deposits are immediately withdrawable without penalty. The fair value of time certificates of deposit and wholesale certificates of deposit were estimated by discounting expected future cash flows by the current rates offered on certificates of deposit with similar remaining maturities.
In accordance with ASC 825,
Financial Instruments
, no value has been assigned to the Company’s long-term relationships with its deposit customers (core value of deposits intangible) since such intangible is not a financial instrument as defined under ASC 825.
ADVANCES FROM FHLB
The fair value of such advances was estimated by discounting the expected future cash flows using current interest rates for advances with similar terms and remaining maturities.
FEDERAL FUNDS PURCHASED
The carrying amount of federal funds purchased is assumed to approximate the fair value.
165
SECURITIES SOLD UNDER AGREEMENTS TO REPURCHASE, CAPITAL LEASES, TRUST PREFERRED SECURITIES AND SUBORDINATED DEBENTURES
The fair value of these instruments was estimated by discounting the expected future cash flows using derived interest rates approximating market over the contractual maturity of such borrowings.
ACCRUED INTEREST PAYABLE
The carrying amount of accrued interest payable is assumed to approximate the fair value.
LIMITATIONS
Fair value estimates are made at a specific point in time, based on relevant market information about the financial instrument. Additionally, fair value estimates are based on existing on- and off-balance sheet financial instruments without attempting to estimate the value of anticipated future business, customer relationships and the value of assets and liabilities that are not considered financial instruments. These estimates do not reflect any premium or discount that could result from offering the Company’s entire holdings of a particular financial instrument for sale at one time. Furthermore, since no market exists for certain of the Company’s financial instruments, fair value estimates may be based on judgments regarding future expected loss experience, current economic conditions, risk characteristics of various financial instruments and other factors. These estimates are subjective in nature and involve uncertainties and matters of significant judgment and therefore cannot be determined with a high level of precision. Changes in assumptions as well as tax considerations could significantly affect the estimates. Accordingly, based on the limitations described above, the aggregate fair value estimates are not intended to represent the underlying value of the Company, on either a going concern or a liquidation basis.
The Company had a total of
$303.3 million
of goodwill as of
September 30, 2018
. The recorded goodwill was due to two separate business combinations during fiscal 2015, two separate business combinations during the first quarter of fiscal 2017, and one business combination during the fourth quarter of fiscal 2018. The fiscal 2015 business combinations included
$11.6 million
of goodwill in connection with the purchase of substantially all of the commercial loan portfolio and related assets of AFS/IBEX on December 2, 2014, and
$25.4 million
in goodwill in connection with the purchase of substantially all of the assets and liabilities of Refund Advantage on September 8, 2015. The fiscal 2017 business combinations included
$30.4 million
of goodwill in connection with the purchase of substantially all of the assets of EPS on November 1, 2016, and
$31.4 million
of goodwill in connection with the purchase of substantially all of the assets and specified liabilities of SCS on December 14, 2016. The fiscal 2018 business combination included
$204.5 million
of goodwill in connection with the Crestmark Acquisition consummated on August 1, 2018. The goodwill associated with the AFS/IBEX, Refund Advantage, EPS, and SCS transactions are deductible for tax purposes. The goodwill associated with the Crestmark Acquisition is not deductible for tax purposes.
The carrying amount of the Company’s goodwill and intangible assets for the years ended
September 30, 2018
and
2017
are as follows:
|
|
September 30,
|
||||||
|
|
2018
|
2017
|
|||||
|
|
(Dollars in Thousands)
|
||||||
|
Goodwill
|
|||||||
|
Beginning balance
|
$
|
98,723
|
|
$
|
36,928
|
|
|
|
Acquisitions during the period
|
204,547
|
|
61,795
|
|
|||
|
Write-offs during the period
|
—
|
|
—
|
|
|||
|
Ending balance
|
$
|
303,270
|
|
$
|
98,723
|
|
|
166
The Company completed an annual goodwill impairment test for the fiscal year ended
September 30, 2018
. Based on the results of the qualitative analysis, it was identified that it was more likely than not the fair value of the goodwill recorded exceeded the current carrying value. The Company concluded a quantitative analysis was not required and no impairment existed.
|
|
Trademark
(1)
|
Non-Compete
(2)
|
Customer Relationships
(3)
|
Technology/Other
(4)
|
Total
|
||||||||||||||
|
Intangibles
|
|||||||||||||||||||
|
Balance as of September 30, 2017
|
$
|
10,051
|
|
$
|
1,782
|
|
$
|
31,707
|
|
$
|
8,638
|
|
$
|
52,178
|
|
||||
|
Acquisitions during the period
|
3,634
|
|
—
|
|
24,278
|
|
449
|
|
28,361
|
|
|||||||||
|
Amortization during the period
|
(698
|
)
|
(485
|
)
|
(7,530
|
)
|
(928
|
)
|
(9,641
|
)
|
|||||||||
|
Write-offs during the period
|
—
|
|
—
|
|
—
|
|
(179
|
)
|
(179
|
)
|
|||||||||
|
Balance as of September 30, 2018
|
$
|
12,987
|
|
$
|
1,297
|
|
$
|
48,455
|
|
$
|
7,980
|
|
$
|
70,719
|
|
||||
|
Balance upon acquisition
|
$
|
14,624
|
|
$
|
2,480
|
|
$
|
82,088
|
|
$
|
10,951
|
|
$
|
110,143
|
|
||||
|
Accumulated amortization
|
$
|
(1,637
|
)
|
$
|
(1,183
|
)
|
$
|
(23,385
|
)
|
$
|
(2,263
|
)
|
$
|
(28,468
|
)
|
||||
|
Accumulated impairment
|
|
|
|
|
$
|
(10,248
|
)
|
$
|
(708
|
)
|
$
|
(10,956
|
)
|
||||||
|
Balance as of September 30, 2018
|
$
|
12,987
|
|
$
|
1,297
|
|
$
|
48,455
|
|
$
|
7,980
|
|
$
|
70,719
|
|
||||
(1) Book amortization period of 5-15 years. Amortized using the straight line and accelerated methods.
(2) Book amortization period of 3-5 years. Amortized using the straight line method.
(3) Book amortization period of 10-30 years. Amortized using the accelerated method.
(4) Book amortization period of 3-20 years. Amortized using the straight line method.
|
|
Trademark
(1)
|
Non-Compete
(2)
|
Customer Relationships
(3)
|
Technology/Other
(4)
|
Total
|
||||||||||||||
|
Intangibles
|
|||||||||||||||||||
|
Balance as of September 30, 2016
|
$
|
5,149
|
|
$
|
127
|
|
$
|
20,590
|
|
$
|
3,055
|
|
$
|
28,921
|
|
||||
|
Acquisitions during the period
|
5,500
|
|
2,180
|
|
31,770
|
|
6,947
|
|
46,397
|
|
|||||||||
|
Amortization during the period
|
(598
|
)
|
(525
|
)
|
(10,405
|
)
|
(835
|
)
|
(12,363
|
)
|
|||||||||
|
Write-offs during the period
|
—
|
|
—
|
|
(10,248
|
)
|
(529
|
)
|
(10,777
|
)
|
|||||||||
|
Balance as of September 30, 2017
|
$
|
10,051
|
|
$
|
1,782
|
|
$
|
31,707
|
|
$
|
8,638
|
|
$
|
52,178
|
|
||||
|
Balance upon acquisition
|
$
|
10,990
|
|
$
|
2,480
|
|
$
|
57,810
|
|
$
|
10,502
|
|
$
|
81,782
|
|
||||
|
Accumulated amortization
|
(939
|
)
|
(698
|
)
|
(15,855
|
)
|
(1,335
|
)
|
(18,827
|
)
|
|||||||||
|
Accumulated impairment
|
—
|
|
—
|
|
(10,248
|
)
|
(529
|
)
|
(10,777
|
)
|
|||||||||
|
Balance as of September 30, 2017
|
$
|
10,051
|
|
$
|
1,782
|
|
$
|
31,707
|
|
$
|
8,638
|
|
$
|
52,178
|
|
||||
(1) Book amortization period of 15 years. Amortized using the straight line and accelerated methods.
(2) Book amortization period of 3 years. Amortized using the straight line method.
(3) Book amortization period of 10-30 years. Amortized using the accelerated method.
(4) Book amortization period of 3-20 years. Amortized using the straight line method.
The Company tests intangible assets for impairment at least annually or more often if conditions indicate a possible impairment. The Company recorded an immaterial impairment charge during the fourth quarter of fiscal 2018 and a
$10.2 million
intangible impairment charge during the fourth quarter of fiscal 2017 related to the non-renewal of the H&R Block relationship.
167
The weighted-average amortization period, by major intangible asset class and in total, for the acquisition during fiscal year 2018 were as follows:
|
Weighted Average Amortization Period
|
|
|
Intangible
|
Crestmark
|
|
Trademark
|
10.0
|
|
Customer Relationships
|
10.0
|
|
Technology/Other
|
3.0
|
|
Total
|
9.9
|
The anticipated future amortization of intangibles is as follows:
|
|
Year ended
|
||
|
|
(Dollars in Thousands)
|
||
|
2019
|
$
|
17,733
|
|
|
2020
|
11,017
|
|
|
|
2021
|
8,559
|
|
|
|
2022
|
6,404
|
|
|
|
2023
|
5,077
|
|
|
|
Thereafter
|
21,929
|
|
|
|
Total anticipated intangible amortization
|
$
|
70,719
|
|
On October 5, 2018, Meta common stock began trading on a split-adjusted basis as a result of the
3
-for-1 forward stock split with respect to Meta's common stock, which was effected on October 4, 2018 as a stock dividend. As a result of the stock split, the number of issued and outstanding shares of Meta common stock increased to
39.2 million
shares, which includes shares issued in the Crestmark Acquisition.
On October 30, 2018, the Company announced that its Board of Directors appointed Brad Hanson, President of Meta Financial Group, MetaBank and Meta Payment Systems, to the additional role of Chief Executive Officer, effective immediately. Hanson will also remain on the Meta Board. Hanson replaces J. Tyler Haahr, who stepped down as Chief Executive Officer. It is expected that Haahr will remain Chairman of the Board and an employee through the Company’s Annual Meeting of Stockholders expected to be held in January 2019. Frederick V. Moore, currently Lead Director and Vice Chairman, has been appointed to serve as Chairman effective following the date of the Annual Meeting.
None.
|
(a)
|
Evaluation of Disclosure Controls and Procedures.
|
Management, under the direction of its Chief Executive Officer and Chief Financial Officer, is responsible for maintaining disclosure controls and procedures (as defined in Rules 13a-15(e) and 15d-15(e) under the Securities Exchange Act of 1934, as amended (the “1934 Act”) that are designed to ensure that information required to be disclosed in reports filed or submitted under the 1934 Act is recorded, processed, summarized and reported within the time periods specified in SEC rules and forms and that such information is accumulated and communicated to management, including the Company’s Chief Executive Officer and Chief Financial Officer, to allow timely decisions regarding required disclosures.
168
In connection with the preparation of this Annual Report on Form 10-K, management evaluated the Company’s disclosure controls and procedures. The evaluation was performed under the direction of the Company’s Chief Executive Officer and Chief Financial Officer to determine the effectiveness, as of
September 30, 2018
, of the design and operation of the Company’s disclosure controls and procedures. Based upon that evaluation, the Chief Executive Officer and Chief Financial Officer concluded that
the Company’s disclosure controls and procedures were effective in timely alerting them to the material information relating to the Company required to be included in the Company’s periodic SEC filings.
|
(b)
|
Management’s Annual Report on Internal Control over Financial Reporting.
|
The Company’s management is responsible for establishing and maintaining effective internal control over financial reporting. The Company’s internal control over financial reporting is a process designed to provide reasonable assurance regarding the reliability of financial reporting and the preparation of financial statements for external purposes in accordance with GAAP. Our internal control over financial reporting includes those policies and procedures that (i) pertain to the maintenance of records that, in reasonable detail, accurately and fairly reflect the transactions and dispositions of the assets of the Company; (ii) provide reasonable assurance that transactions are recorded as necessary to permit preparation of financial statements in accordance with GAAP, and that receipts and expenditures of the Company are being made only in accordance with authorizations of the Company’s management and directors; and (iii) provide reasonable assurance regarding prevention or timely detection of unauthorized acquisition, use or disposition of the Company assets that could have a material effect on the financial statements.
Internal control over financial reporting, no matter how well designed, has inherent limitations. Because of such inherent limitations, internal control over financial reporting may not prevent or detect misstatements. Also, projections of any evaluation of effectiveness to future periods are subject to the risk that controls may become inadequate because of changes in conditions, or that the degree of compliance with the policies or procedures may deteriorate.
Management assessed the effectiveness of the Company’s internal control over financial reporting as of
September 30, 2018
, based on the criteria set forth by the Committee of Sponsoring Organizations of the Treadway Commission in “Internal Control Integrated Framework (2013).” Based on this assessment, our management concluded that our internal control over financial reporting was effective as of
September 30, 2018
.
Meta acquired Crestmark on August 1, 2018. Crestmark, which had assets of
$1.35 billion
as of September 30, 2018, and revenues of
$31.5 million
for the year ended September 30, 2018, was excluded from the scope of this report as allowed by the Securities and Exchange Commission. Crestmark's assets comprised
23%
of Meta's assets at September 30, 2018, and Crestmark's 2018 revenues were
9%
of Meta's revenues for 2018.
The effectiveness of the Company’s internal control over financial reporting as of September 30, 2018, has been audited by KPMG LLP, the independent registered public accounting firm that also has audited the Company’s Consolidated Financial Statements included in this Annual Report on Form 10-K. KPMG LLP’s report on the Company’s internal control over financial reporting appears below.
|
(c)
|
Changes in Internal Control over Financial Reporting.
|
There were no changes in the Company's internal control over financial reporting that occurred during the fourth quarter that have materially affected, or are reasonably likely to materially affect, the Company's internal control over financial reporting.
None.
169
KPMG LLP
2500 Ruan Center
666 Grand Avenue
Des Moines, IA 50309
Report of Independent Registered Public Accounting Firm
The Board of Directors and Stockholders
Meta Financial Group, Inc.:
Opinion on Internal Control Over Financial Reporting
We have audited Meta Financial Group, Inc. and subsidiaries’ (the Company) internal control over financial reporting as of September 30, 2018, based on criteria established in
Internal Control - Integrated Framework (2013)
issued by the Committee of Sponsoring Organizations of the Treadway Commission. In our opinion, the Company maintained, in all material respects, effective internal control over financial reporting as of September 30, 2018, based on criteria established in
Internal Control - Integrated Framework (2013)
issued by the Committee of Sponsoring Organizations of the Treadway Commission.
We also have audited, in accordance with the standards of the Public Company Accounting Oversight Board (United States) (PCAOB), the consolidated statements of financial condition of the Company as of September 30, 2018 and 2017, the related consolidated statements of operations, comprehensive income, changes in stockholders’ equity, and cash flows for each of the years in the three-year period ended September 30, 2018, and the related notes (collectively, the consolidated financial statements), and our report dated November 29, 2018 expressed an unqualified opinion on those consolidated financial statements.
The Company acquired Crestmark Bancorp, Inc. on August 1, 2018, and management has excluded from its assessment of the effectiveness of the Company’s internal control over financial reporting as of September 30, 2018, Crestmark Bancorp, Inc.’s internal control over financial reporting associated with total assets of $1.35 billion and total revenues of $31.5 million included in the consolidated financial statements of the Company as of and for the year ended September 30, 2018. Our audit of internal control over financial reporting of the Company also excluded an evaluation of the internal control over financial reporting of Crestmark Bancorp, Inc.
Basis for Opinion
The Company’s management is responsible for maintaining effective internal control over financial reporting and for its assessment of the effectiveness of internal control over financial reporting, included in the accompanying Management’s Annual Report on Internal Control over Financial Reporting. Our responsibility is to express an opinion on the Company’s internal control over financial reporting based on our audit. We are a public accounting firm registered with the PCAOB and are required to be independent with respect to the Company in accordance with the U.S. federal securities laws and the applicable rules and regulations of the Securities and Exchange Commission and the PCAOB.
We conducted our audit in accordance with the standards of the PCAOB. Those standards require that we plan and perform the audit to obtain reasonable assurance about whether effective internal control over financial reporting was maintained in all material respects. Our audit of internal control over financial reporting included obtaining an understanding of internal control over financial reporting, assessing the risk that a material weakness exists, and testing and evaluating the design and operating effectiveness of internal control based on the assessed risk. Our audit also included performing such other procedures as we considered necessary in the circumstances. We believe that our audit provides a reasonable basis for our opinion.
170
Definition and Limitations of Internal Control Over Financial Reporting
A company’s internal control over financial reporting is a process designed to provide reasonable assurance regarding the reliability of financial reporting and the preparation of financial statements for external purposes in accordance with generally accepted accounting principles. A company’s internal control over financial reporting includes those policies and procedures that (1) pertain to the maintenance of records that, in reasonable detail, accurately and fairly reflect the transactions and dispositions of the assets of the company; (2) provide reasonable assurance that transactions are recorded as necessary to permit preparation of financial statements in accordance with generally accepted accounting principles, and that receipts and expenditures of the company are being made only in accordance with authorizations of management and directors of the company; and (3) provide reasonable assurance regarding prevention or timely detection of unauthorized acquisition, use, or disposition of the company’s assets that could have a material effect on the financial statements.
Because of its inherent limitations, internal control over financial reporting may not prevent or detect misstatements. Also, projections of any evaluation of effectiveness to future periods are subject to the risk that controls may become inadequate because of changes in conditions, or that the degree of compliance with the policies or procedures may deteriorate.
|
|
/s/ KPMG LLP
|
|
|
|
|
Des Moines, Iowa
|
|
|
November 29, 2018
|
|
171
Directors
Information concerning directors of the Company required by this item will be included under the captions “Election of Directors,” “Communicating with Our Directors” and “Stockholder Proposals For The Fiscal Year 2019 Annual Meeting” in the Company’s definitive Proxy Statement for the Annual Meeting of Stockholders to be held on January 30, 2019 (the “
2018
Proxy Statement”), a copy of which will be filed not later than 120 days after
September 30, 2018
, and is incorporated herein by reference.
Executive Officers
Information concerning the executive officers of the Company required by this item will be included under the captions “Executive Officers” and “Election of Directors” in the 2018 Proxy Statement and is incorporated herein by reference.
Compliance with Section 16(a)
Information required by this item regarding compliance with Section 16(a) of the Exchange Act will be included under the caption “Section 16(a) Beneficial Ownership Reporting Compliance” in the Company’s
2018
Proxy Statement and is incorporated herein by reference.
Audit Committee Financial Expert
Information regarding the audit committee of the Company’s Board of Directors, including information regarding Frederick Moore, Becky Shulman and Kendall Stork, the audit committee financial experts serving on the audit committee for fiscal
2018
, will be included under the captions “Meetings and Committees” and “Election of Directors” in the Company’s
2018
Proxy Statement and is incorporated herein by reference.
Code of Ethics
Information regarding the Company’s Code of Ethics will be included under the caption “Corporate Governance” in the Company’s
2018
Proxy Statement and is incorporated herein by reference.
Information concerning executive and director compensation will be included under the captions “Compensation of Directors” and “Executive Compensation” in the Company’s
2018
Proxy Statement and is incorporated herein by reference.
(a) Security Ownership of Certain Beneficial Owners and Management
The information required by this item will be included under the caption “Stock Ownership” in the Company’s
2018
Proxy Statement and is incorporated herein by reference.
(b) Changes in Control
Management of the Company knows of no arrangements, including any pledge by any persons of securities of the Company, the operation of which may, at a subsequent date, result in a change in control of the Registrant.
(c) Equity Compensation Plan Information
172
The Company maintains the 2002 Omnibus Incentive Plan for purposes of issuing stock-based compensation to employees and directors. The plan was amended and restated effective November 24, 2014 and currently authorizes 1,150,000 shares to be issued under the plan. The Company also has unexercised options outstanding under a previous stock option plan. The following table provides information about the Company’s common stock that may be issued under the Company’s omnibus incentive plans.
All share and per share data presented in the table below has been adjusted to reflect the 3-for-1 forward stock split of the Company's common stock effected by the Company on October 4, 2018.
|
Plan Category
|
Number of securities
to be issued upon
exercise of
outstanding options,
warrants and rights
|
Weighted-average
exercise price of
outstanding options,
warrants and rights
|
Number of securities
remaining available
for future issuance
under equity
compensation plan
excluding securities
reflected in (a)
|
|||||||
|
Equity compensation plans approved by stockholders
|
155,961
|
|
$
|
8.48
|
|
1,568,277
|
|
|||
|
Equity compensation plans not approved by stockholders
|
—
|
|
—
|
|
—
|
|
||||
The information required by this item will be included under the captions “Election of Directors,” “Meetings and Committees” and “Related Person Transactions” in the Company’s
2018
Proxy Statement and is incorporated herein by reference.
The information required by this item will be included under the caption “Ratification of Independent Registered Public Accounting Firm” in the Company’s
2018
Proxy Statement and is incorporated herein by reference.
173
The following is a list of documents filed as Part of this report:
(a)
Financial Statements:
The following financial statements are included under Part II, Item 8 of this Annual Report on Form 10-K:
|
1.
|
Report of Independent Registered Public Accounting Firm.
|
|
2.
|
Consolidated Statements of Financial Condition as of September 30, 2018, and 2017.
|
|
3.
|
Consolidated Statements of Operations for the Years Ended September 30, 2018, 2017 and 2016.
|
|
4.
|
Consolidated Statements of Comprehensive Income for the Years ended September 30, 2018, 2017, and 2016.
|
|
5.
|
Consolidated Statements of Changes in Stockholders’ Equity for the Years Ended September 30, 2018, 2017, and 2016.
|
|
6.
|
Consolidated Statements of Cash Flows for the Years Ended September 30, 2018, 2017, and 2016.
|
|
7.
|
Notes to Consolidated Financial Statements.
|
174
(b)
Exhibits:
|
Exhibit
Number
|
Description
|
|
|
|
|
Asset Purchase Agreement, dated as of July 15, 2015, by and among Meta Financial Group, Inc., MetaBank, Fort Knox Financial Services Corporation, Tax Product Services LLC, Alan D. Lodge Family Trust, Michael E. Boone, Michael J. Boone, Cary Shields and Alan D. Lodge filed on July 16, 2015 as an exhibit to the Registrant’s Current Report on Form 8‑K, is incorporated herein by reference. Exhibits and schedules have been omitted pursuant to Item 601(b)(2) of Regulation S-K. The Registrant will furnish the omitted exhibits and schedules to the Securities and Exchange Commission upon request by the Commission.
|
|
|
|
|
|
Asset Purchase Agreement, dated as of October 1, 2016, by and among Meta Financial Group, Inc., MetaBank, Drake Enterprises, Ltd., and EPS Financial, LLC filed on November 3, 2016 as an exhibit to the Registrant’s Current Report on Form 8-K, is incorporated herein by reference. Exhibits and schedules have been omitted pursuant to Item 601(b)(2) of Regulation S-K. The Registrant will furnish the omitted exhibits and schedules to the Securities and Exchange Commission upon request by the Commission.
|
|
|
|
|
|
Asset Purchase Agreement dated as of November 9, 2016, by and among Meta Financial Group, Inc., MetaBank, and Specialty Consumer Services LP filed on November 10, 2016 as an exhibit to the Registrant’s Current Report on Form 8-K, is incorporated herein by reference. Exhibits and schedules have been omitted pursuant to Item 601(b)(2) of Regulation S-K. The Registrant will furnish the omitted exhibits and schedules to the Securities and Exchange Commission upon request by the Commission.
|
|
|
Agreement and Plan of Merger, dated as of January 9, 2018, by and among Meta Financial Group, Inc., MetaBank, Crestmark Bancorp, Inc. and Crestmark Bank filed on January 9, 2018 as an exhibit to the Registrant's Current Report on Form 8-K, is incorporated herein by reference. Certain exhibits and schedules have been omitted pursuant to Item 601(b)(2) of Regulation S-K. The Registrant will furnish the omitted exhibits and schedules to the Securities and Exchange Commission upon request by the Commission.
|
|
|
|
|
|
Registrant’s Certificate of Incorporation, as amended, filed on August 8, 2018 as an exhibit to the Registrant’s Quarterly Report on Form 10-Q for the fiscal quarter ended June 30, 2018, is incorporated herein by reference.
|
|
|
|
|
|
Registrant’s Amended and Restated By-laws, as amended, filed on February 8, 2017 as an exhibit to the Registrant’s Quarterly Report on Form 10-Q for the fiscal quarter ended December 31, 2016, is incorporated herein by reference.
|
|
|
|
|
|
Registrant’s Specimen Stock Certificate, filed on June 26, 2016 as an exhibit to the Registrant’s registration statement on Form S-3 (Commission File No. 333-212269), is incorporated herein by reference.
|
|
|
|
|
|
Indenture, dated as of August 15, 2016, by and between the Registrant and U.S. Bank National Association, as trustee, filed on August 15, 2016 as an exhibit to the Registrant’s Current Report on Form 8-K, is incorporated herein by reference.
|
|
|
First Supplemental Indenture, dated as of August 15, 2016, by and between the Registrant and U.S. Bank National Association, as trustee, filed on August 15, 2016 as an exhibit to the Registrant’s Current Report on Form 8-K, is incorporated herein by reference.
|
|
|
Form of Global Note of the Registrant representing the 5.75% Fixed-to-Floating Rate Subordinated Notes due August 15, 2026, filed on August 15, 2016 as an exhibit to the Registrant’s Current Report on Form 8-K, is incorporated herein by reference.
|
|
|
*
10.1
|
Registrant’s 1995 Stock Option and Incentive Plan, filed as an exhibit to the Registrant’s Annual Report on Form 10-KSB for the fiscal year ended September 30, 1996, is incorporated herein by reference
|
|
|
|
|
*
10.2
|
Employment Agreement between MetaBank and J. Tyler Haahr, dated as of October 1, 2016, filed on November 18, 2016 as an exhibit to the Registrant’s Current Report on Form 8-K, is incorporated herein by reference.
|
|
|
|
|
*
10.3
|
Employment Agreement between MetaBank and Bradley C. Hanson, dated as of October 1, 2016, filed on November 18, 2016 as an exhibit to the Registrant’s Current Report on Form 8-K, is incorporated herein by reference.
|
|
|
|
|
*
10.4
|
Employment Agreement between MetaBank and Glen W. Herrick, dated as of October 1, 2016, filed on December 6, 2016 as an exhibit to the Registrant’s Current Report on Form 8-K, is incorporated herein by reference.
|
|
|
|
|
*
10.5
|
Performance-Based Restricted Stock Agreement between Meta and J. Tyler Haahr, dated as of November 16, 2016, filed on November 18, 2016 as an exhibit to the Registrant’s Current Report on Form 8-K, is incorporated herein by reference.
|
|
|
|
|
*
10.6
|
Performance-Based Restricted Stock Agreement between Meta and Bradley C. Hanson, dated as of November 16, 2016, filed on November 18, 2016 as an exhibit to the Registrant’s Current Report on Form 8-K, is incorporated herein by reference.
|
|
*
10.7
|
Performance-Based Restricted Stock Agreement between Meta and Glen W. Herrick, dated as of December 2, 2016, filed on December 6, 2016 as an exhibit to the Registrant’s Current Report on Form 8-K, is incorporated herein by reference.
|
175
|
*
10.8
|
Registrant’s Supplemental Employees’ Investment Plan, originally filed as an exhibit to the Registrant’s Annual Report on Form 10-KSB for the fiscal year ended September 30, 1994. First amendment to such agreement, filed as an exhibit to the Registrant’s Annual Report on Form 10-K for the fiscal year ended September 30, 2008, is incorporated herein by reference.
|
|
*
10.9
|
Registrant’s Amended and Restated 2002 Omnibus Incentive Plan, as amended, filed on January 24, 2018 as an exhibit to the Registrant’s Current Report on Form 8-K, is incorporated herein by reference.
|
|
Investor Rights Agreement by and among Meta Financial Group, Inc., BEP IV LLC and BEP Investors, LLC, dated as of December 17, 2015, filed on December 17, 2015 as an exhibit to the Registrant’s Current Report on Form 8‑K, is incorporated herein by reference.
|
|
|
*
10.11
|
Severance and General Release Agreement dated as of August 30, 2017, by and between the MetaBank and Cynthia Smith, filed on September 8, 2017 as an exhibit to the Registrant’s Current Report on Form 8-K, is incorporated herein by reference.
|
|
|
|
|
*
10.12
|
Form of Restricted Stock Agreement under Meta Financial Group, Inc. 2002 Omnibus Incentive Plan filed on August 2, 2016 as an exhibit to the Registrant’s Quarterly Report on Form 10-Q, is incorporated herein by reference.
|
|
*
10.13
|
Employment Agreement between MetaBank and Michael Goik, dated as of January 9, 2018, filed on April 20, 2018 as an exhibit to the Registrant's registration statement on Form S-4 (Commission File No. 333-223769), is incorporated herein by reference.
|
|
|
|
|
Subsidiaries of the Registrant is filed herewith.
|
|
|
|
|
|
Consent of Independent Registered Public Accounting Firm is filed herewith.
|
|
|
|
|
|
Certification of Principal Executive Officer pursuant to Section 302 of the Sarbanes‑Oxley Act of 2002 is filed herewith.
|
|
|
|
|
|
Certification of Principal Financial Officer pursuant to Section 302 of the Sarbanes‑Oxley Act of 2002 is filed herewith.
|
|
|
|
|
|
Certification of the CEO pursuant to Section 906 of the Sarbanes-Oxley Act of 2002 is filed herewith.
|
|
|
|
|
|
Certification of the CFO pursuant to Section 906 of the Sarbanes-Oxley Act of 2002 is filed herewith.
|
|
|
|
|
|
101.INS
|
Instance Document Filed Herewith.
|
|
|
|
|
101.SCH
|
XBRL Taxonomy Extension Schema Document Filed Herewith.
|
|
|
|
|
101.CAL
|
XBRL Taxonomy Extension Calculation Linkbase Document Filed Herewith.
|
|
|
|
|
101.DEF
|
XBRL Taxonomy Extension Definition Linkbase Document Filed Herewith.
|
|
|
|
|
101.LAB
|
XBRL Taxonomy Extension Label Linkbase Document Filed Herewith.
|
|
|
|
|
101.PRE
|
XBRL Taxonomy Extension Presentation Linkbase Document Filed Herewith.
|
* Management Contract or Compensatory Plan or Agreement
(c)
Financial Statement Schedules:
All financial statement schedules have been omitted as the information is not required under the related
instructions or is inapplicable.
None.
176
SIGNATURES
Pursuant to the requirements of Section 13 or 15(d) of the Securities Exchange Act of 1934, the Registrant has duly caused this Report to be signed on its behalf by the undersigned, thereunto duly authorized.
|
|
META FINANCIAL GROUP, INC.
|
|
|
|
|
|
|
Date: November 29, 2018
|
By:
|
/s/ Bradley C. Hanson
|
|
|
|
Bradley C. Hanson,
|
|
|
|
President, Chief Executive Officer, and Director
|
177
Pursuant to the requirements of the Securities Exchange Act of 1934, this Report has been signed below by the following persons on behalf of the Registrant and in the capacities and on the dates indicated.
|
By:
|
/s/ Bradley C. Hanson
|
|
Date: November 29, 2018
|
|
|
Bradley C. Hanson, President, Chief Executive Officer, and
|
|
|
|
Director
|
|||
|
(Principal Executive Officer)
|
|||
|
By:
|
/s/ J. Tyler Haahr
|
|
Date: November 29, 2018
|
|
|
J. Tyler Haahr, Chairman of the Board
|
|
|
|
|
|
|
|
|
By:
|
/s/ Douglas J. Hajek
|
|
Date: November 29, 2018
|
|
|
Douglas J. Hajek, Director
|
|
|
|
|
|
|
|
|
By:
|
/s/ Elizabeth G. Hoople
|
|
Date: November 29, 2018
|
|
|
Elizabeth G. Hoople, Director
|
|
|
|
|
|
|
|
|
By:
|
/s/ Michael R. Kramer
|
|
Date: November 29, 2018
|
|
|
Michael R. Kramer, Director
|
|
|
|
By:
|
/s/ Frederick V. Moore
|
|
Date: November 29, 2018
|
|
|
Frederick V. Moore, Director
|
|
|
|
|
|
|
|
|
By:
|
/s/ Becky S. Shulman
|
|
Date: November 29, 2018
|
|
|
Becky S. Shulman, Director
|
|
|
|
By:
|
/s/ Kendall E. Stork
|
|
Date: November 29, 2018
|
|
|
Kendall E. Stork, Director
|
|
|
|
By:
|
/s/ W. David Tull
|
|
Date: November 29, 2018
|
|
|
W. David Tull, Director
|
|
|
|
By:
|
/s/ Glen W. Herrick
|
|
Date: November 29, 2018
|
|
|
Glen W. Herrick, Executive Vice
|
|
|
|
|
President and Chief Financial Officer
|
|
|
|
(Principal Financial Officer)
|
|||
|
|
|
|
|
|
By:
|
/s/ Sonja A. Theisen
|
|
Date: November 29, 2018
|
|
|
Sonja A. Theisen, Senior Vice President
|
|
|
|
|
and Chief Accounting Officer
|
|
|
|
|
(Principal Accounting Officer)
|
|
|
178
TABLE OF CONTENTS
Part IItem 1. BusinessItem 1A. Risk FactorsItem 9A. Controls and Procedures-management S Annual Report on Internal Control Over Financial ReportingItem 1B. Unresolved Staff CommentsItem 2. PropertiesItem 3. Legal ProceedingsItem 4. Mine Safety DisclosuresPart IIItem 5. Market For Registrant S Common Equity, Related Stockholder Matters and Issuer Purchases Of Equity SecuritiesItem 6. Selected Financial DataItem 7. Management S Discussion and Analysis Of Financial Condition and Results Of OperationsItem 7A. Quantitative and Qualitative Disclosures About Market Risk and Interest Rate RiskItem 8. Financial Statements and Supplementary DataNote 1. Summary Of Significant Accounting PoliciesNote 2. AcquisitionsNote 3. Loans and Leases Receivable, NetNote 4. Loan ServicingNote 5. Earnings Per Common ShareNote 6. SecuritiesNote 7. Premises, Furniture and Equipment, NetNote 8. Time Certificates Of DepositsNote 9. Short Term Debt and Long Term DebtNote 10. Employee Stock Ownership and Profit Sharing PlansNote 11. Share-based Compensation PlansNote 12. Income TaxesNote 13. Capital Requirements and Restrictions on Retained EarningsNote 14. Commitments and ContingenciesNote 15. Lease CommitmentsNote 16. Segment ReportingNote 17. Parent Company Financial StatementsNote 18. Selected Quarterly Financial Data (unaudited)Note 19. Fair Values Of Financial InstrumentsNote 20. Goodwill and Intangible AssetsNote 21. Subsequent EventsItem 9. Changes in and Disagreements with Accountants on Accounting and Financial DisclosureItem 9A. Controls and ProceduresItem 9B. Other InformationPart IIIItem 10. Directors, Executive Officers and Corporate GovernanceItem 11. Executive CompensationItem 12. Security Ownership Of Certain Beneficial Owners and Management and Related Stockholder MattersItem 13. Certain Relationships and Related Transactions, and Director IndependenceItem 14. Principal Accountant Fees and ServicesPart IVItem 15. Exhibits and Financial Statement SchedulesItem 16. Form 10-k Summary