CATERPILLAR INC
10-Ks and 10-Qs
|
|
|
|
|
|
|
|
|
|
|
|
|
|
|
|
|
|
|
|
|
|
|
|
|
|
|
|
|
|
|
|
|
|
|
|
|
|
|
|
|
|
|
|
|
|
|
|
|
|
|
|
|
|
|
|
|
|
|
UNITED STATES
SECURITIES AND EXCHANGE COMMISSION
Washington, D.C. 20549

FORM 10-K
(Mark One)
|
ý
|
ANNUAL REPORT PURSUANT TO SECTION 13 OR 15(d) OF THE SECURITIES EXCHANGE ACT OF 1934
|
For the fiscal year ended
December 31, 2016
OR
|
o
|
TRANSITION REPORT PURSUANT TO SECTION 13 OR 15(d) OF THE SECURITIES EXCHANGE ACT OF 1934
|
For the transition period from to .
Commission File No. 1-768
CATERPILLAR INC.
(Exact name of Registrant as specified in its charter)
|
Delaware
|
|
37-0602744
|
|
(State or other jurisdiction of incorporation)
|
|
(IRS Employer I.D. No.)
|
|
|
|
|
|
100 NE Adams Street, Peoria, Illinois
|
|
61629
|
|
(Address of principal executive offices)
|
|
(Zip Code)
|
Registrant’s telephone number, including area code:
(309) 675-1000
Securities registered pursuant to Section 12(b) of the Act:
|
Title of each class
|
|
Name of each exchange
on which registered
|
|
Common Stock ($1.00 par value)
(1)
|
|
New York Stock Exchange
|
|
9 3/8% Debentures due March 15, 2021
|
|
New York Stock Exchange
|
|
8% Debentures due February 15, 2023
|
|
New York Stock Exchange
|
|
5.3% Debentures due September 15, 2035
|
|
New York Stock Exchange
|
|
(1)
|
In addition to the New York Stock Exchange, Caterpillar common stock is also listed on stock exchanges in France and Switzerland.
|
Securities registered pursuant to Section 12(g) of the Act:
None
Indicate by check mark if the Registrant is a well-known seasoned issuer, as defined in Rule 405 of the Securities Act. Yes
ý
No
o
Indicate by check mark if the Registrant is not required to file reports pursuant to Section 13 or Section 15(d) of the Act. Yes
o
No
ý
Indicate by check mark whether the Registrant (1) has filed all reports required to be filed by Section 13 or 15(d) of the Securities Exchange Act of 1934 during the preceding 12 months (or for such shorter period that the Registrant was required to file such reports), and (2) has been subject to such filing requirements for the past 90 days. Yes
ý
No
o
Indicate by check mark whether the Registrant has submitted electronically and posted on its corporate Web site, if any, every Interactive Data File required to be submitted and posted pursuant to Rule 405 of Regulation S-T (§232.405 of this chapter) during the preceding 12 months (or for such shorter period that the registrant was required to submit and post such files). Yes
ý
No
o
Indicate by check mark if disclosure of delinquent filers pursuant to Item 405 of Regulation S-K is not contained herein, and will not be contained, to the best of Registrant’s knowledge, in definitive proxy or information statements incorporated by reference in Part III of this Form 10-K or any amendment to this Form 10-K.
o
Indicate by check mark whether the Registrant is a large accelerated filer, an accelerated filer, a non-accelerated filer, or a smaller reporting company. See the definitions of “large accelerated filer,” “accelerated filer” and “smaller reporting company” in Rule 12b-2 of the Exchange Act. (Check one):
|
Large accelerated filer
x
|
Accelerated filer
o
|
|
|
Non-accelerated filer
o
|
Smaller Reporting Company
o
|
|
Indicate by check mark whether the Registrant is a shell company (as defined in Rule 12b-2 of the Exchange Act). Yes
o
No
ý
As of June 30, 2016, there were 584,231,181 shares of common stock of the Registrant outstanding, and the aggregate market value of the voting stock held by non-affiliates of the Registrant (assuming only for purposes of this computation that directors and executive officers may be affiliates) was approximately $44.1 billion.
As of December 31, 2016
, there were 586,486,024 shares of common stock of the Registrant outstanding.
Documents Incorporated by Reference
Portions of the documents listed below have been incorporated by reference into the indicated parts of this Form 10-K, as specified in the responses to the item numbers involved.
|
Part III
|
2017 Annual Meeting Proxy Statement (Proxy Statement) to be filed with the Securities and Exchange Commission (SEC) within 120 days after the end of the calendar year.
|
TABLE OF CONTENTS
|
Page
|
|||
i
|
Item 1.
|
Business.
|
General
Originally organized as Caterpillar Tractor Co. in 1925 in the State of California, our company was reorganized as Caterpillar Inc. in 1986 in the State of Delaware. As used herein, the term “Caterpillar,” “we,” “us,” “our” or “the company” refers to Caterpillar Inc. and its subsidiaries unless designated or identified otherwise.
Overview
With
2016
sales and revenues of
$38.537 billion
, Caterpillar is the world’s leading manufacturer of construction and mining equipment, diesel and natural gas engines, industrial gas turbines and diesel-electric locomotives. The company principally operates through its three product segments - Construction Industries, Resource Industries and Energy & Transportation - and also provides financing and related services through its Financial Products segment. Caterpillar is also a leading U.S. exporter. Through a global network of independent dealers and direct sales of certain products, Caterpillar builds long-term relationships with customers around the world.
Currently, we have six operating segments, of which four are reportable segments and are described below. Further information about our reportable segments, including geographic information, appears in Note 23 — “Segment information” of Part II, Item 8 "Financial Statements and Supplementary Data."
Categories of Business Organization
1.
Machinery, Energy & Transportation
— Represents the aggregate total of Construction Industries, Resource Industries, Energy & Transportation and All Other operating segments and related corporate items and eliminations.
2.
Financial Products
— Primarily includes the company’s Financial Products Segment. This category includes Caterpillar Financial Services Corporation (Cat Financial), Caterpillar Financial Insurance Services (Insurance Services) and their respective subsidiaries.
Other information about our operations in
2016
, including certain risks associated with our operations, is included in Part II, Item 7 “Management’s Discussion and Analysis of Financial Condition and Results of Operations.”
Construction Industries
Our Construction Industries segment is primarily responsible for supporting customers using machinery in infrastructure, forestry and building construction. The majority of machine sales in this segment are made in the heavy and general construction, rental, quarry and aggregates markets and mining.
Nature of customer demand for construction machinery varies around the world. Customers in developing economies often prioritize purchase price in making their investment decisions, while customers in developed economies generally weigh productivity and other performance criteria that contribute to lower owning and operating costs over the lifetime of the machine. To meet customer expectations in developing economies, Caterpillar developed differentiated product offerings that target customers in those markets, including our SEM brand machines. We believe that these customer-driven product innovations enable us to compete more effectively in developing economies. The majority of Construction Industries' research and development spending in 2016 focused on the next generation of construction machines.
The competitive environment for construction machinery is characterized by some global competitors and many regional and specialized local competitors. Examples of global competitors include Komatsu Ltd., Volvo Construction Equipment (part of the Volvo Group), CNH Industrial N.V., Deere & Company, Hitachi Construction Machinery Co., Ltd., J.C. Bamford Excavators Ltd., Doosan Infracore Co. Ltd., and Hyundai Construction Equipment (part of Hyundai Heavy Industries). As an example of regional and local competitors, our competitors in China also include Guangxi LiuGong Machinery Co., Ltd., Longking Holdings Ltd., Sany Heavy Industry Co., Ltd., Xiamen XGMA Machinery Co., Ltd., XCMG Group, The Shandong Heavy Industry Group Co., Ltd. (Shantui Construction Machinery Co., Ltd.), Strong Construction Machinery Co., Ltd., and Shandong Lingong Construction Machinery Co., Ltd. (SDLG, part of Volvo Group). Each of these companies has varying product lines that compete with Caterpillar products, and each has varying degrees of regional focus.
1
The Construction Industries product portfolio includes the following machines and related parts:
|
·
backhoe loaders
|
·
compact loaders
|
·
small track-type tractors
|
||
|
·
track-type loaders
|
·
small and medium wheel loaders
|
· medium track-type tractors
|
||
|
·
mini excavators
|
·
small, medium and large track excavators
|
·
motorgraders
|
||
|
·
wheel excavators
|
·
pipelayers
|
·
telehandlers
|
||
|
· cold planers
|
· asphalt pavers
|
·
compactors
|
||
|
·
road reclaimers
|
· wheel and track skidders
|
· knuckleboom loaders
|
||
|
·
site prep tractors
|
· wheel and track feller bunchers
|
· forestry excavators
|
||
|
·
skid steer loaders
|
||||
Resource Industries
The Resource Industries segment is primarily responsible for supporting customers using machinery in mining, quarry, waste and material handling applications. Caterpillar offers mining customers the broadest product range in the industry. We manufacture high productivity equipment for both surface and underground mining operations around the world. Our equipment is used to extract and haul copper, iron ore, coal, oil sands, aggregates, gold and other minerals and ores. In addition to equipment, Resource Industries also develops and sells technology products and services to provide customers fleet management systems, equipment management analytics and autonomous machine capabilities.
Customers in most markets place an emphasis on equipment that is highly productive, reliable and provides the lowest total cost of ownership over the life of the equipment. In some developing markets, customers often prioritize purchase price in making their investment decisions. We believe our ability to control the integration and design of key machine components represents a competitive advantage. Our research and development efforts remain focused on providing mining and quarry customers the lowest total cost of ownership enabled through the highest quality, most productive products in the industry.
The competitive environment for Resource Industries consists of a few larger global competitors that compete in several of the markets that we serve and a substantial number of smaller companies that compete in a more limited range of products, applications, and regional markets. Our global surface competitors include Komatsu Ltd., Joy Global, Inc., Hitachi Construction Machinery Co., Ltd., Volvo Construction Equipment, Atlas Copco AB, and Sandvik Mining. Our global underground competitors include Joy Global, Inc., Atlas Copco AB, Liebherr-International AG, Sandvik Mining and Zhengzhou Coal Mining Machinery Group Co., Ltd.
The Resource Industries product portfolio includes the following machines and related parts:
|
·
electric rope shovels
|
·
large mining trucks
|
·
landfill compactors
|
||
|
·
draglines
|
·
longwall miners
|
·
soil compactors
|
||
|
·
hydraulic shovels
|
·
large wheel loaders
|
·
machinery components
|
||
|
·
track and rotary drills
|
·
off-highway trucks
|
·
electronics and control systems
|
||
|
·
highwall miners
|
·
articulated trucks
|
·
select work tools
|
||
|
·
hard rock vehicles
|
·
scoops and haulers
|
·
hard rock continuous mining systems
|
||
|
·
continuous miners
|
·
wheel tractor scrapers
|
|
||
|
·
large track-type tractors
|
·
wheel dozers
|
|||
Energy & Transportation
Our Energy & Transportation segment supports customers in oil and gas, power generation, marine, rail and industrial applications, including Cat® machines. The product and services portfolio includes reciprocating engines, generator sets, marine propulsion systems, gas turbines and turbine-related services, the remanufacturing of Cat engines and components and remanufacturing services for other companies, diesel-electric locomotives and other rail-related products and services and product support of on-highway vocational trucks for North America.
2
Regulatory emissions standards of the U.S. Environmental Protection Agency (EPA) and comparable standards in other developed economies have required us to make significant investments in research and development that will continue as new products and similar regulations are introduced over the next several years. We believe that our emissions technology provides a competitive advantage in connection with emissions standards compliance and performance.
The competitive environment for reciprocating engines in marine, oil and gas, industrial and electric power generation systems along with turbines in oil and gas and electric power generation consists of a few larger global competitors that compete in a variety of markets that Caterpillar serves, and a substantial number of smaller companies that compete in a limited-size product range, geographic region and/or application. Principal global competitors include Cummins Inc., Rolls-Royce Power Systems, GE Oil & Gas, GE Power, Deutz AG and Wärtsilä Corp. Other competitors, such as MAN Diesel & Turbo SE, Siemens Energy, Rolls-Royce Marine, Mitsubishi Heavy Industries Ltd., Volvo Penta, Weichai Power Co., Ltd., Kirloskar Oil Engines Limited and other emerging market competitors compete in certain markets in which Caterpillar competes. An additional set of competitors, including Generac Power Systems, Inc., Kohler Co., Inc., Aggreko plc and others, are packagers who source engines and/or other components from domestic and international suppliers and market products regionally and internationally through a variety of distribution channels. In rail-related businesses, our global competitors include GE Transportation, Vossloh AG, Siemens Akteingesellschaft, Alstom Transport SA, and Voestalpine AG. We also compete with other companies on a more limited range of products, services and/or geographic regions.
The Energy & Transportation portfolio includes the following products and related parts:
|
•
|
reciprocating engine powered generator sets
|
|
•
|
reciprocating engines supplied to the industrial industry as well as Caterpillar machinery
|
|
•
|
integrated systems used in the electric power generation industry
|
|
•
|
turbines, centrifugal gas compressors and related services
|
|
•
|
reciprocating engines and integrated systems and solutions for the marine and oil and gas industries
|
|
•
|
remanufactured reciprocating engines and components
|
|
•
|
diesel-electric locomotives and components and other rail-related products and services
|
Financial Products Segment
The business of our Financial Products segment is primarily conducted by Cat Financial, a wholly owned finance subsidiary of Caterpillar. Cat Financial’s primary business is to provide retail and wholesale financing alternatives for Caterpillar products to customers and dealers around the world. Retail financing is primarily comprised of the financing of Caterpillar equipment, machinery and engines. Cat Financial also provides financing for vehicles, power generation facilities and marine vessels that, in most cases, incorporate Caterpillar products. In addition to retail financing, Cat Financial provides wholesale financing to Caterpillar dealers and purchases short-term trade receivables from Caterpillar and its subsidiaries. The various financing plans offered by Cat Financial are primarily designed to increase the opportunity for sales of Caterpillar products and generate financing income for Cat Financial. A significant portion of Cat Financial’s activities is conducted in North America. Cat Financial also has offices and subsidiaries in Asia/Pacific, Europe and Latin America.
For over 35 years, Cat Financial has been providing financing in the various markets in which it participates, contributing to its knowledge of asset values, industry trends, product structuring and customer needs.
In certain instances, Cat Financial’s operations are subject to supervision and regulation by state, federal and various foreign governmental authorities, and may be subject to various laws and judicial and administrative decisions imposing various requirements and restrictions which, among other things, (i) regulate credit granting activities and the administration of loans, (ii) establish maximum interest rates, finance charges and other charges, (iii) require disclosures to customers and investors, (iv) govern secured transactions, (v) set collection, foreclosure, repossession and other trade practices and (vi) regulate the use and reporting of information related to a borrower’s credit experience. Cat Financial’s ability to comply with these and other governmental and legal requirements and restrictions affects its operations.
Cat Financial’s retail leases and installment sale contracts (totaling 55 percent*) include:
|
•
|
Tax leases that are classified as either operating or finance leases for financial accounting purposes, depending on the characteristics of the lease. For tax purposes, Cat Financial is considered the owner of the equipment (14 percent*).
|
|
•
|
Finance (non-tax) leases, where the lessee for tax purposes is considered to be the owner of the equipment during the term of the lease, that either require or allow the customer to purchase the equipment for a fixed price at the end of the term (18 percent*).
|
3
|
•
|
Installment sale contracts, which are equipment loans that enable customers to purchase equipment with a down payment or trade-in and structure payments over time (22 percent*).
|
|
•
|
Governmental lease-purchase plans in the U.S. that offer low interest rates and flexible terms to qualified non-federal government agencies (1 percent*).
|
Cat Financial’s wholesale notes receivable, finance leases and installment sale contracts (totaling 12 percent*) include:
|
•
|
Inventory/rental programs, which provide assistance to dealers by financing their new Caterpillar inventory and rental fleets (4 percent*).
|
|
•
|
Short-term receivables Cat Financial purchased from Caterpillar at a discount (8 percent*).
|
Cat Financial’s retail notes receivables (33 percent*) include:
|
•
|
Loans that allow customers and dealers to use their Caterpillar equipment or other assets as collateral to obtain financing.
|
*Indicates the percentage of Cat Financial’s total portfolio at December 31, 2016. We define total portfolio as total finance receivables (net of unearned income and allowance for credit losses) plus equipment on operating leases, less accumulated depreciation. For more information on the above and Cat Financial’s concentration of credit risk, please refer to Note 6 — “Cat Financial Financing Activities” of Part II, Item 8 "Financial Statements and Supplementary Data."
_____________________________
Cat Financial operates in a highly competitive environment, with financing for users of Caterpillar equipment available through a variety of sources, principally commercial banks and finance and leasing companies. Cat Financial’s competitors include Wells Fargo Equipment Finance Inc. and various other banks and finance companies. In addition, many of our manufacturing competitors own financial subsidiaries such as Volvo Financial Services, Komatsu Financial L.P. and John Deere Capital Corporation that utilize below-market interest rate programs (funded by the manufacturer) to assist machine sales. Caterpillar and Cat Financial work together to provide a broad array of financial merchandising programs around the world to meet these competitive offers.
Cat Financial’s financial results are largely dependent upon the ability of Caterpillar dealers to sell equipment and customers’ willingness to enter into financing or leasing agreements. It is also affected by, among other things, the availability of funds from its financing sources, general economic conditions such as inflation and market interest rates and its cost of funds relative to its competitors.
Cat Financial has a match-funding policy that addresses interest rate risk by aligning the interest rate profile (fixed or floating rate) of its debt portfolio with the interest rate profile of its receivables portfolio within predetermined ranges on an ongoing basis. In connection with that policy, Cat Financial uses interest rate derivative instruments to modify the debt structure to match assets within the receivables portfolio. This matched funding reduces the volatility of margins between interest-bearing assets and interest-bearing liabilities, regardless of which direction interest rates move. For more information regarding match funding, please see Note 3 — “Derivative financial instruments and risk management” of Part II, Item 8 "Financial Statements and Supplementary Data." See also the risk factors associated with our financial products business included in Item 1 A. of this Form 10-K.
In managing foreign currency risk for Cat Financial’s operations, the objective is to minimize earnings volatility resulting from conversion and the remeasurement of net foreign currency balance sheet positions, and future transactions denominated in foreign currencies. This policy allows the use of foreign currency forward, option and cross currency contracts to offset the risk of currency mismatch between the receivable and debt portfolios, and exchange rate risk associated with future transactions denominated in foreign currencies.
Cat Financial provides financing only when certain criteria are met. Credit decisions are based on a variety of credit quality factors including prior payment experience, customer financial information, credit-rating agency ratings, loan-to-value ratios and other internal metrics. Cat Financial typically maintains a security interest in retail-financed equipment and requires physical damage insurance coverage on financed equipment. Cat Financial finances a significant portion of Caterpillar dealers’ sales and inventory of Caterpillar equipment throughout the world. Cat Financial’s competitive position is improved by marketing programs offered in conjunction with Caterpillar and/or Caterpillar dealers. Under these programs, Caterpillar, or the
4
dealer, funds an amount at the outset of the transaction, which Cat Financial then recognizes as revenue over the term of the financing. We believe that these marketing programs provide Cat Financial a significant competitive advantage in financing Caterpillar products.
Caterpillar Insurance Company, a wholly owned subsidiary of Caterpillar Insurance Holdings Inc., is a U.S. insurance company domiciled in Missouri and primarily regulated by the Missouri Department of Insurance. Caterpillar Insurance Company is licensed to conduct property and casualty insurance business in 50 states, the District of Columbia and Guam, and as such, is also regulated in those jurisdictions. The State of Missouri acts as the lead regulatory authority and monitors Caterpillar Insurance Company’s financial status to ensure that it is in compliance with minimum solvency requirements, as well as other financial ratios prescribed by the National Association of Insurance Commissioners. Caterpillar Insurance Company is also licensed to conduct insurance business through a branch in Zurich, Switzerland and, as such, is regulated by the Swiss Financial Market Supervisory Authority.
Caterpillar Life Insurance Company, a wholly owned subsidiary of Caterpillar, is a U.S. insurance company domiciled in Missouri and primarily regulated by the Missouri Department of Insurance. Caterpillar Life Insurance Company is licensed to conduct life and accident and health insurance business in 26 states and the District of Columbia and, as such, is also regulated in those jurisdictions. The State of Missouri acts as the lead regulatory authority and it monitors the financial status to ensure that it is in compliance with minimum solvency requirements, as well as other financial ratios prescribed by the National Association of Insurance Commissioners. Caterpillar Life Insurance Company provides stop loss insurance protection to a Missouri Voluntary Employees’ Beneficiary Association (VEBA) trust used to fund medical claims of salaried retirees of Caterpillar under the VEBA.
Caterpillar Insurance Co. Ltd., a wholly owned subsidiary of Caterpillar Insurance Holdings Inc., is a captive insurance company domiciled in Bermuda and regulated by the Bermuda Monetary Authority. Caterpillar Insurance Co. Ltd. is a Class 2 insurer (as defined by the Bermuda Insurance Amendment Act of 1995), which primarily insures its parent and affiliates. The Bermuda Monetary Authority requires an Annual Financial Filing for purposes of monitoring compliance with solvency requirements.
Caterpillar Product Services Corporation (CPSC), a wholly owned subsidiary of Caterpillar, is a warranty company domiciled in Missouri. CPSC previously conducted a machine extended service contract program in Germany and France by providing machine extended warranty reimbursement protection to dealers in Germany and France. The program was discontinued effective January 1, 2013, though CPSC continues to provide extended warranty reimbursement protection under existing contracts.
Caterpillar Insurance Services Corporation, a wholly owned subsidiary of Caterpillar Insurance Holdings Inc., is a Tennessee insurance brokerage company licensed in all 50 states and the District of Columbia. It provides brokerage services for all property and casualty and life and health lines of business.
Caterpillar’s insurance group provides protection for claims under the following programs:
|
•
|
Contractual Liability Insurance to Caterpillar and its affiliates, Caterpillar dealers and original equipment manufacturers (OEMs) for extended service contracts (parts and labor) offered by Caterpillar, third party dealers and OEMs.
|
|
•
|
Cargo insurance for the worldwide cargo risks of Caterpillar products.
|
|
•
|
Contractors’ Equipment Physical Damage Insurance for equipment manufactured by Caterpillar or OEMs, which is leased, rented or sold by third party dealers to customers.
|
|
•
|
General liability, employer’s liability, auto liability and property insurance for Caterpillar.
|
|
•
|
Retiree Medical Stop Loss Insurance for medical claims under the VEBA.
|
|
•
|
Brokerage services for property and casualty and life and health business.
|
Acquisitions
Information related to acquisitions appears in Note 24 — “Acquisitions” of Part II, Item 8 "Financial Statements and Supplementary Data."
5
Competitive Environment
Caterpillar products and product support services are sold worldwide into a variety of highly competitive markets. In all markets, we compete on the basis of product performance, customer service, quality and price. From time to time, the intensity of competition results in price discounting in a particular industry or region. Such price discounting puts pressure on margins and can negatively impact operating profit. Outside the United States, certain of our competitors enjoy competitive advantages inherent to operating in their home countries or regions.
Raw Materials and Component Products
We source our raw materials and manufactured components from suppliers both domestically and internationally. These purchases include unformed materials and rough and finished parts. Unformed materials include a variety of steel products, which are then cut or formed to shape and machined in our facilities. Rough parts include various sized steel and iron castings and forgings, which are machined to final specification levels inside our facilities. Finished parts are ready to assemble components, which are made either to Caterpillar specifications or to supplier developed specifications. We machine and assemble some of the components used in our machines, engines and power generation units and to support our after-market dealer parts sales. We also purchase various goods and services used in production, logistics, offices and product development processes. We maintain global strategic sourcing models to meet our global facilities’ production needs while building long-term supplier relationships and leveraging enterprise spend. We expect our suppliers to maintain, at all times, industry-leading levels of quality and the ability to timely deliver raw materials and component products for our machine and engine products. We use a variety of agreements with suppliers to protect our intellectual property and processes to monitor and mitigate risks of the supply base causing a business disruption. The risks monitored include supplier financial viability, the ability to increase or decrease production levels, business continuity, quality and delivery.
Patents and Trademarks
We own a number of patents and trademarks, which have been obtained over a period of years and relate to the products we manufacture and the services we provide. These patents and trademarks are generally considered beneficial to our business. We do not regard our business as being dependent upon any single patent or group of patents.
Order Backlog
The dollar amount of backlog believed to be firm was approximately $12.1 billion at
December 31, 2016
and $13.0 billion at
December 31, 2015
. Compared with year-end
2015
, the order backlog declined about $900 million. The decrease was in Energy & Transportation and Construction Industries, partially offset by an increase in Resource Industries. Of the total backlog at
December 31, 2016
, approximately $3.4 billion was not expected to be filled in
2017
.
Dealers and Distributors
Our machines are distributed principally through a worldwide organization of dealers (dealer network), 49 located in the United States and 123 located outside the United States, serving 190 countries. Reciprocating engines are sold principally through the dealer network and to other manufacturers for use in products. Some of the reciprocating engines manufactured by our subsidiary Perkins Engines Company Limited, are also sold through its worldwide network of 96 distributors covering 179 countries. The FG Wilson branded electric power generation systems manufactured by our subsidiary Caterpillar Northern Ireland Limited are sold through its worldwide network of 184 distributors covering 145 countries. Some of the large, medium speed reciprocating engines are also sold under the MaK brand through a worldwide network of 20 distributors covering 130 countries.
Our dealers do not deal exclusively with our products; however, in most cases sales and servicing of our products are the dealers’ principal business. Some products, primarily turbines and locomotives, are sold directly to end customers through sales forces employed by the company. At times, these employees are assisted by independent sales representatives.
While the large majority of our worldwide dealers are independently owned and operated, we own and operate a dealership in Japan that covers approximately 85% of the Japanese market: Nippon Caterpillar Division. We are currently operating this Japanese dealer directly and its results are reported in the All Other operating segments. There are also three independent dealers in the Southern Region of Japan.
6
For Caterpillar branded products, the company’s relationship with each of its independent dealers is memorialized in standard sales and service agreements. Pursuant to this agreement, the company grants the dealer the right to purchase and sell its products and to service the products in a specified geographic service territory. Prices to dealers are established by the company after receiving input from dealers on transactional pricing in the marketplace. The company also agrees to defend its intellectual property and to provide warranty and technical support to the dealer. The agreement further grants the dealer a non-exclusive license to use the company’s trademarks, service marks and brand names. In some instances, a separate trademark agreement exists between the company and a dealer.
In exchange for these rights, the agreement obligates the dealer to develop and promote the sale of the company’s products to current and prospective customers in the dealer’s service territory. Each dealer agrees to employ adequate sales and support personnel to market, sell and promote the company’s products, demonstrate and exhibit the products, perform the company’s product improvement programs, inform the company concerning any features that might affect the safe operation of any of the company’s products and maintain detailed books and records of the dealer’s financial condition, sales and inventories and make these books and records available at the company’s reasonable request.
These sales and service agreements are terminable at will by either party primarily upon 90 days written notice.
Research and Development
We place strong emphasis on product-oriented research and development relating to the development of new or improved machines, engines and major components. In
2016
,
2015
and
2014
, we spent $1,951 million, $2,119 million and $2,380 million, or 5.1, 4.5 and 4.3 percent of our sales and revenues, respectively, on our research and development programs.
Employment
As of
December 31, 2016
, we employed about 95,400 full-time persons of whom approximately 54,500 were located outside the United States. In the United States, we employed approximately 40,900 employees, most of whom are at-will employees and, therefore, not subject to any type of employment contract or agreement. Full-time employment at the end of 2015 includes approximately 2,100 employees who participated in the U.S. voluntary retirement enhancement program in the U.S. and left the company January 1, 2016. At select business units, certain highly specialized employees have been hired under employment contracts that specify a term of employment, pay and other benefits.
|
Full-Time Employees at Year-End
|
|||||
|
|
2016
|
2015
|
|||
|
Inside U.S.
|
40,900
|
|
47,700
|
|
|
|
Outside U.S.
|
54,500
|
|
58,000
|
|
|
|
Total
|
95,400
|
|
105,700
|
|
|
|
By Region:
|
|
|
|
|
|
|
North America
|
41,200
|
|
48,000
|
|
|
|
EAME
|
20,000
|
|
21,300
|
|
|
|
Latin America
|
11,400
|
|
12,300
|
|
|
|
Asia/Pacific
|
22,800
|
|
24,100
|
|
|
|
Total
|
95,400
|
|
105,700
|
|
|
As of
December 31, 2016
, there were approximately 7,400 U.S. hourly production employees who were covered by collective bargaining agreements with various labor unions, including The United Automobile, Aerospace and Agricultural Implement Workers of America (UAW), The International Association of Machinists and The United Steelworkers. Approximately 5,600 of such employees are covered by collective bargaining agreements with the UAW that expire on March 1, 2017 and December 17, 2018. Outside the United States, the company enters into employment contracts and agreements in those countries in which such relationships are mandatory or customary. The provisions of these agreements generally correspond in each case with the required or customary terms in the subject jurisdiction.
7
Sales and Revenues
Sales and revenues outside the United States were 59 percent of consolidated sales and revenues for
2016
and 2015 and 62 percent for
2014
.
Environmental Matters
The company is regulated by federal, state and international environmental laws governing our use, transport and disposal of substances and control of emissions. In addition to governing our manufacturing and other operations, these laws often impact the development of our products, including, but not limited to, required compliance with air emissions standards applicable to internal combustion engines. We have made, and will continue to make, significant research and development and capital expenditures to comply with these emissions standards.
We are engaged in remedial activities at a number of locations, often with other companies, pursuant to federal and state laws. When it is probable we will pay remedial costs at a site, and those costs can be reasonably estimated, the investigation, remediation, and operating and maintenance costs are accrued against our earnings. Costs are accrued based on consideration of currently available data and information with respect to each individual site, including available technologies, current applicable laws and regulations, and prior remediation experience. Where no amount within a range of estimates is more likely, we accrue the minimum. Where multiple potentially responsible parties are involved, we consider our proportionate share of the probable costs. In formulating the estimate of probable costs, we do not consider amounts expected to be recovered from insurance companies or others. We reassess these accrued amounts on a quarterly basis. The amount recorded for environmental remediation is not material and is included in the line item "Accrued expenses" in Statement 3 — "Consolidated Financial Position at December 31" of Part II, Item 8 "Financial Statements and Supplementary Data." There is no more than a remote chance that a material amount for remedial activities at any individual site, or at all the sites in the aggregate, will be required.
Available Information
The company files electronically with the Securities and Exchange Commission (SEC) required reports on Form 8-K, Form 10-Q, Form 10-K and Form 11-K; proxy materials; ownership reports for insiders as required by Section 16 of the Securities Exchange Act of 1934 (Exchange Act); and registration statements on Forms S-3 and S-8, as necessary; and other forms or reports as required. The public may read and copy any materials the company has filed with the SEC at the SEC’s Public Reference Room at 100 F Street, N.E., Washington, DC 20549. The public may obtain information on the operation of the Public Reference Room by calling the SEC at (800) SEC-0330. The SEC maintains a website (www.sec.gov) that contains reports, proxy and information statements, and other information regarding issuers that file electronically with the SEC. The company maintains a website (www.Caterpillar.com) and copies of our annual report on Form 10-K, quarterly reports on Form 10-Q, current reports on Form 8-K and any amendments to these reports filed or furnished with the SEC are available free of charge through our website (www.Caterpillar.com/secfilings) as soon as reasonably practicable after filing with the SEC. Copies of our board committee charters, our board’s Guidelines on Corporate Governance Issues, Worldwide Code of Conduct and other corporate governance information are available on our website (www.Caterpillar.com/governance). The information contained on the company’s website is not included in, or incorporated by reference into, this annual report on Form 10-K.
Additional company information may be obtained as follows:
Current information -
|
•
|
phone our Information Hotline - (800) 228-7717 (U.S. or Canada) or (858) 764-9492 (outside U.S. or Canada) to request company publications by mail, listen to a summary of Caterpillar’s latest financial results and current outlook, or to request a copy of results
|
|
•
|
request, view or download materials on-line or register for email alerts at www.Caterpillar.com/materialsrequest
|
Historical information -
|
•
|
view/download on-line at www.Caterpillar.com/historical
|
8
|
Item 1A.
|
Risk Factors.
|
The statements in this section describe the most significant risks to our business and should be considered carefully in conjunction with Part II, Item 7 “Management’s Discussion and Analysis of Financial Condition and Results of Operations” and the “Notes to Consolidated Financial Statements” of Part II, Item 8 "Financial Statements and Supplementary Data" to this Form 10-K. In addition, the statements in this section and other sections of this Form 10-K, including in Part II, Item 7 "Management's Discussion and Analysis of Financial Condition and Results of Operations" include “forward-looking statements” as that term is defined in the Private Securities Litigation Reform Act of 1995 and involve uncertainties that could significantly impact results. Forward-looking statements give current expectations or forecasts of future events about the company or our outlook. You can identify forward-looking statements by the fact they do not relate to historical or current facts and by the use of words such as “believe,” “expect,” “estimate,” “anticipate,” “will be,” “should,” “plan,” “project,” “intend,” “could” and similar words or expressions.
Forward-looking statements are based on assumptions and on known risks and uncertainties. Although we believe we have been prudent in our assumptions, any or all of our forward-looking statements may prove to be inaccurate, and we can make no guarantees about our future performance. Should known or unknown risks or uncertainties materialize or underlying assumptions prove inaccurate, actual results could materially differ from past results and/or those anticipated, estimated or projected.
We undertake no obligation to publicly update forward-looking statements, whether as a result of new information, future events or otherwise. You should, however, consult any subsequent disclosures we make in our filings with the SEC on Form 10-Q or Form 8-K.
The following is a cautionary discussion of risks, uncertainties and assumptions that we believe are significant to our business. In addition to the factors discussed elsewhere in this report, the following are some of the important factors that, individually or in the aggregate, we believe could make our actual results differ materially from those described in any forward-looking statements. It is impossible to predict or identify all such factors and, as a result, you should not consider the following factors to be a complete discussion of risks, uncertainties and assumptions.
MACROECONOMIC RISKS
Our business is highly sensitive to global and regional economic conditions and economic conditions in the industries we serve.
Our results of operations are materially affected by economic conditions globally and regionally and in the particular industries we serve. The demand for our products and services tends to be cyclical and can be significantly reduced in periods of economic weakness characterized by lower levels of government and business investment, lower levels of business confidence, lower corporate earnings, perceived or actual industry overcapacity, higher unemployment and lower consumer spending. A prolonged period of economic weakness may also result in increased expenses due to higher allowances for doubtful accounts and potential goodwill and asset impairment charges. Economic conditions vary across regions and countries, and demand for our products and services generally increases in those regions and countries experiencing economic growth and investment. Slower economic growth or a change in the global mix of regions and countries experiencing economic growth and investment could have an adverse effect on our business, results of operations and financial condition.
The energy, transportation and mining industries are major users of our products, including the coal, iron ore, gold, copper, oil and natural gas industries. Customers in these industries frequently base their decisions to purchase our products on the expected future performance of these industries, which in turn are dependent in part on commodity prices. Prices of commodities in these industries are frequently volatile and can change abruptly and unpredictibly in response to general economic conditions and trends, government actions, regulatory actions, commodity inventories, production levels, market expectations and any disruptions in production or distribution. Economic conditions affecting the industries we serve may in the future also lead to reduced capital expenditures by our customers. Reduced capital expenditures by our customers are likely to lead to a decrease in the demand for our products and may also result in a decrease in demand for aftermarket parts as customers are likely to extend preventative maintenance schedules and delay major overhauls when possible.
The rates of infrastructure spending, housing starts and commercial construction also play a significant role in our results. Our products are an integral component of these activities, and as these activities decrease, demand for our products may be significantly impacted, which could negatively impact our results.
9
Commodity price changes, material price increases, fluctuations in demand for our products or significant shortages of material may adversely impact our financial results or our ability to meet commitments to customers.
We are a significant user of steel and many other commodities required for the manufacture of our products. Increases in the prices of such commodities would increase our costs, negatively impacting our business, results of operations and financial condition if we are unable to fully offset the effect of these increased costs through price increases, productivity improvements or cost reduction programs.
We rely on suppliers to secure material, particularly steel, required for the manufacture of our products. A disruption in deliveries to or from suppliers or decreased availability of raw materials or commodities could have an adverse effect on our ability to meet our commitments to customers or increase our operating costs. On the other hand, if demand for our products is less than we expect, we may experience excess inventories and be forced to incur additional charges and our profitability may suffer. Our business, competitive position, results of operations or financial condition could be negatively impacted if supply is insufficient for our operations, if we experience excess inventories or if we are unable to adjust our production schedules or our purchases from suppliers to reflect changes in customer demand and market fluctuations on a timely basis.
Changes in government monetary or fiscal policies may negatively impact our results
.
Most countries where our products and services are sold have established central banks to regulate monetary systems and influence economic activities, generally by adjusting interest rates. Interest rate changes affect overall economic growth, which affects demand for residential and nonresidential structures, as well as energy and mined products, which in turn affects sales of our products and services that serve these activities. Interest rate changes may also affect our customers’ ability to finance machine purchases, can change the optimal time to keep machines in a fleet and can impact the ability of our suppliers to finance the production of parts and components necessary to manufacture and support our products. Increases in interest rates could negatively impact sales and create supply chain inefficiencies.
Central banks and other policy arms of many countries take actions to vary the amount of liquidity and credit available in an economy. The impact from a change in liquidity and credit policies could impact the customers and markets we serve or our suppliers, which could adversely impact our business, results of operations and financial condition.
Changes in monetary and fiscal policies, along with other factors, may cause currency exchange rates to fluctuate. Actions that lead the currency exchange rate of a country where we manufacture products to increase relative to other currencies could reduce the competitiveness of products made in that country, which could adversely affect our competitive position, results of operations and financial condition.
Government policies on taxes and spending also affect our business. Throughout the world, government spending finances a significant portion of infrastructure development, such as highways, airports, sewer and water systems and dams. Tax regulations determine depreciation lives and the amount of money users of our products can retain, both of which influence investment decisions. Unfavorable developments, such as declines in government revenues, decisions to reduce public spending or increases in taxes, could negatively impact our results.
Our global operations are exposed to political and economic risks, commercial instability and events beyond our control in the countries in which we operate.
Our global operations are dependent upon products manufactured, purchased and sold in the U.S. and internationally, including in countries with political and economic instability or uncertainty. This includes, for example, the uncertainty related to the United Kingdom’s June 2016 vote to leave the European Union (commonly known as “Brexit”).
Some countries have greater political and economic volatility and greater vulnerability to infrastructure and labor disruptions than others. Our business could be negatively impacted by adverse fluctuations in freight costs, limitations on shipping and receiving capacity, and other disruptions in the transportation and shipping infrastructure at important geographic points of exit and entry for our products. Operating in a number of different regions and countries exposes us to a number of risks, including:
|
•
|
multiple and potentially conflicting laws, regulations and policies that are subject to change;
|
|
•
|
imposition of currency restrictions, restrictions on repatriation of earnings or other restraints;
|
|
•
|
imposition of burdensome tariffs or quotas;
|
|
•
|
changes in trade agreements;
|
10
|
•
|
imposition of new or additional trade and economic sanctions laws imposed by the U.S. or foreign governments;
|
|
•
|
war or terrorist acts; and
|
|
•
|
political and economic instability or civil unrest that may severely disrupt economic activity in affected countries.
|
The occurrence of one or more of these events may negatively impact our business, results of operations and financial condition.
OPERATIONAL RISKS
The success of our business depends on our ability to develop, produce and market quality products that meet our customers’ needs.
Our business relies on continued global demand for our brands and products. To achieve business goals, we must develop and sell products that appeal to our dealers, OEMs and end-user customers. This is dependent on a number of factors, including our ability to maintain key dealer relationships, our ability to produce products that meet the quality, performance and price expectations of our customers and our ability to develop effective sales, advertising and marketing programs. In addition, our continued success in selling products that appeal to our customers is dependent on leading-edge innovation, with respect to both products and operations, and on the availability and effectiveness of legal protection for our innovation. Failure to continue to deliver high quality, innovative, competitive products to the marketplace, to adequately protect our intellectual property rights, to supply products that meet applicable regulatory requirements, including engine exhaust emission requirements or to predict market demands for, or gain market acceptance of, our products, could have a negative impact on our business, results of operations and financial condition.
We operate in a highly competitive environment, which could adversely affect our sales and pricing.
We operate in a highly competitive environment. We compete on the basis of a variety of factors, including product performance, customer service, quality and price. There can be no assurance that our products will be able to compete successfully with other companies’ products. Thus, our share of industry sales could be reduced due to aggressive pricing or product strategies pursued by competitors, unanticipated product or manufacturing difficulties, our failure to price our products competitively, our failure to produce our products at a competitive cost or an unexpected buildup in competitors’ new machine or dealer-owned rental fleets, leading to severe downward pressure on machine rental rates and/or used equipment prices.
Lack of customer acceptance of price increases we announce from time to time, changes in customer requirements for price discounts, changes in our customers’ behavior or a weak pricing environment attributable to industry overcapacity could have an adverse impact on our business, results of operations and financial condition.
In addition, our results and ability to compete may be impacted negatively by changes in our geographic and product mix of sales.
Increased information technology security threats and more sophisticated computer crime pose a risk to our systems, networks, products and services.
We rely upon information technology systems and networks, some of which are managed by third parties, in connection with a variety of business activities. Additionally, we collect and store data that is sensitive to Caterpillar. Operating these information technology systems and networks and processing and maintaining this data, in a secure manner, are critical to our business operations and strategy. Information technology security threats -- from user error to cybersecurity attacks designed to gain unauthorized access to our systems, networks and data -- are increasing in frequency and sophistication. Cybersecurity attacks may range from random attempts to coordinated and targeted attacks, including sophisticated computer crime and advanced threats. These threats pose a risk to the security of our systems and networks and the confidentiality, availability and integrity of our data. Cybersecurity attacks could also include attacks targeting the security, integrity and/or reliability of the hardware and software installed in our products. We have experienced cybersecurity attacks that have resulted in unauthorized parties gaining access to our information technology systems and networks, and we could in the future experience similar attacks. However, to date, no cybersecurity attack has had a material impact on our financial condition, results of operations or liquidity. While we actively manage information technology security risks within our control, there can be no assurance that such actions will be sufficient to mitigate all potential risks to our systems, networks and data. The potential consequences of a material cybersecurity attack include reputational damage, litigation with third parties, disruption to systems, unauthorized release of confidential or otherwise protected information, corruption of data, diminution in the value of our investment in research,
11
development and engineering, and increased cybersecurity protection and remediation costs, which in turn could adversely affect our competitiveness and results of operations.
We expect to incur additional restructuring charges as we continue to contemplate cost reduction actions in an effort to optimize our cost structure and may not achieve the anticipated savings and benefits of these actions.
On September 24, 2015, we announced significant restructuring and cost reduction actions expected to occur through 2018 to lower our operating costs in response to current economic and business conditions. We expect to take additional restructuring actions to optimize our cost structure and improve the efficiency of our operation, which will reduce our profitability in the periods incurred. As a result of these actions, we will incur charges, which may include but not be limited to asset impairments, employee termination costs, charges for pension and other postretirement contractual benefits, potential additional pension funding obligations, and pension curtailments, any of which could be significant, and could adversely affect our financial condition and results of operations. In addition, we may not realize anticipated savings or benefits from past or future cost reduction actions in full or in part or within the time periods we expect. We are also subject to the risks of labor unrest, negative publicity and business disruption in connection with our cost reduction actions. Failure to realize anticipated savings or benefits from our cost reduction actions could have a material adverse effect on our business, prospects, financial condition, liquidity, results of operations and cash flows.
We may not realize all of the anticipated benefits from cost-reduction initiatives, cash flow improvement initiatives and efficiency or productivity initiatives.
We are actively engaged in a number of initiatives to increase our productivity, efficiency and cash flow and to reduce costs, which we expect to have a positive long-term effect on our business, competitive position, results of operations and financial condition. For example, one such initiative is to implement sustained improvements in our operational efficiency and order-to-delivery processes so that our lead time is better aligned with customer requirements, as well as to reduce waste, further enhance quality and maximize value for our customers. There can be no assurance that these initiatives or others will continue to be beneficial to the extent anticipated, or that the estimated efficiency improvements, incremental cost savings or cash flow improvements will be realized as anticipated or at all. If these initiatives are not implemented successfully, it could have an adverse effect on our operations and competitive position.
Our business is subject to the inventory management decisions and sourcing practices of our dealers and our OEM customers.
We sell finished products primarily through an independent dealer network and directly to OEMs and are subject to risks relating to their inventory management decisions and operational and sourcing practices. Both carry inventories of finished products as part of ongoing operations and adjust those inventories based on their assessments of future needs and market conditions, including levels of used equipment inventory. Such adjustments may impact our results positively or negatively. If the inventory levels of our dealers and OEM customers are higher than they desire, they may postpone product purchases from us, which could cause our sales to be lower than the end-user demand for our products and negatively impact our results. Similarly, our results could be negatively impacted through the loss of time-sensitive sales if our dealers and OEM customers do not maintain inventory levels sufficient to meet customer demand.
We may not realize all of the anticipated benefits of our acquisitions, joint ventures or divestitures, or these benefits may take longer to realize than expected.
In pursuing our business strategy, we routinely evaluate targets and enter into agreements regarding possible acquisitions, divestitures and joint ventures. We often compete with others for the same opportunities. To be successful, we conduct due diligence to identify valuation issues and potential loss contingencies, negotiate transaction terms, complete complex transactions and manage post-closing matters such as the integration of acquired businesses. Further, while we seek to mitigate risks and liabilities of such transactions through, among other things, due diligence, there may be risks and liabilities that such due diligence efforts fail to discover, that are not accurately or completely disclosed to us or that we inadequately assess. We may incur unanticipated costs or expenses following a completed acquisition, including post-closing asset impairment charges, expenses associated with eliminating duplicate facilities, litigation, and other liabilities. Risks associated with our past or future acquisitions also include the following:
|
•
|
the business culture of the acquired business may not match well with our culture;
|
|
•
|
technological and product synergies, economies of scale and cost reductions may not occur as expected;
|
12
|
•
|
unforeseen expenses, delays or conditions may be imposed upon the acquisition, including due to required regulatory approvals or consents;
|
|
•
|
we may acquire or assume unexpected liabilities or be subject to unexpected penalties or other enforcement actions;
|
|
•
|
faulty assumptions may be made regarding the macroeconomic environment or the integration process;
|
|
•
|
unforeseen difficulties may arise in integrating operations, processes and systems;
|
|
•
|
higher than expected investments may be required to implement necessary compliance processes and related systems, including IT systems, accounting systems and internal controls over financial reporting;
|
|
•
|
we may fail to retain, motivate and integrate key management and other employees of the acquired business;
|
|
•
|
higher than expected costs may arise due to unforeseen changes in tax, trade, environmental, labor, safety, payroll or pension policies in any jurisdiction in which the acquired business conducts its operations; and
|
|
•
|
we may experience problems in retaining customers and integrating customer bases.
|
Many of these factors will be outside of our control and any one of them could result in increased costs, decreases in the amount of expected revenues and diversion of management’s time and attention. They may also delay the realization of the benefits we anticipate when we enter into a transaction.
In order to conserve cash for operations, we may undertake acquisitions financed in part through public offerings or private placements of debt or equity securities, or other arrangements. Such acquisition financing could result in a decrease in our earnings and adversely affect other leverage measures. If we issue equity securities or equity-linked securities, the issued securities may have a dilutive effect on the interests of the holders of our common shares.
Failure to implement our acquisition strategy, including successfully integrating acquired businesses, could have an adverse effect on our business, financial condition and results of operations. Furthermore, we make strategic divestitures from time to time. In the case of divestitures, we may agree to indemnify acquiring parties for certain liabilities arising from our former businesses. These divestitures may also result in continued financial involvement in the divested businesses, including through guarantees or other financial arrangements, following the transaction. Lower performance by those divested businesses could affect our future financial results.
Union disputes or other labor matters could adversely affect our operations and financial results.
Some of our employees are represented by labor unions in a number of countries under various collective bargaining agreements with varying durations and expiration dates. There can be no assurance that any current or future issues with our employees will be resolved or that we will not encounter future strikes, work stoppages or other types of conflicts with labor unions or our employees. We may not be able to satisfactorily renegotiate collective bargaining agreements in the United States and other countries when they expire. If we fail to renegotiate our existing collective bargaining agreements, we could encounter strikes or work stoppages or other types of conflicts with labor unions. In addition, existing collective bargaining agreements may not prevent a strike or work stoppage at our facilities in the future. We may also be subject to general country strikes or work stoppages unrelated to our business or collective bargaining agreements. A work stoppage or other limitations on production at our facilities for any reason could have an adverse effect on our business, results of operations and financial condition. In addition, many of our customers and suppliers have unionized work forces. Strikes or work stoppages experienced by our customers or suppliers could have an adverse effect on our business, results of operations and financial condition.
Unexpected events, including natural disasters, may increase our cost of doing business or disrupt our operations.
The occurrence of one or more unexpected events, including war, terrorist acts, fires, tornadoes, tsunamis, hurricanes, earthquakes, floods and other forms of severe weather in the United States or in other countries in which we operate or in which our suppliers are located could adversely affect our operations and financial performance. Natural disasters, pandemic illness, equipment failures, power outages or other unexpected events could result in physical damage to and complete or partial closure of one or more of our manufacturing facilities or distribution centers, temporary or long-term disruption in the supply of component products from some local and international suppliers, disruption in the transport of our products to dealers and end-users and delay in the delivery of our products to our distribution centers. Existing insurance arrangements may not provide protection for all of the costs that may arise from such events.
13
FINANCIAL RISKS
Disruptions or volatility in global financial markets could limit our sources of liquidity, or the liquidity of our customers, dealers and suppliers.
Continuing to meet our cash requirements over the long-term requires substantial liquidity and access to varied sources of funds, including capital and credit markets. Global economic conditions may cause volatility and disruptions in the capital and credit markets. Market volatility, changes in counterparty credit risk, the impact of government intervention in financial markets and general economic conditions may also adversely impact our ability to access capital and credit markets to fund operating needs. Global or regional economic downturns could cause financial markets to decrease the availability of liquidity, credit and credit capacity for certain issuers, including certain of our customers, dealers and suppliers. An inability to access capital and credit markets may have an adverse effect on our business, results of operations, financial condition and competitive position. Furthermore, changes in global economic conditions, including material cost increases and decreases in economic activity in key markets we serve, and the success of plans to manage cost increases, inventory and other important elements of our business may significantly impact our ability to generate funds from operations.
In addition, demand for our products generally depends on customers’ ability to pay for our products, which, in turn, depends on their access to funds. Changes in global economic conditions may result in customers experiencing increased difficulty in generating funds from operations and capital and credit market volatility and uncertainty may cause financial institutions to revise their lending standards, resulting in customers’ decreased access to capital. If capital and credit market volatility occurs, customers’ liquidity may decline which, in turn, would reduce their ability to purchase our products.
Failure to maintain our credit ratings would increase our cost of borrowing and could adversely affect our cost of funds, liquidity, competitive position and access to capital markets.
Each of Caterpillar’s and Cat Financial’s costs of borrowing and their respective ability to access the capital markets are affected not only by market conditions but also by the short- and long-term debt ratings assigned to their respective debt by the major credit rating agencies. These ratings are based, in significant part, on each of Caterpillar’s and Cat Financial’s performance as measured by financial metrics such as net worth, interest coverage and leverage ratios, as well as transparency with rating agencies and timeliness of financial reporting. There can be no assurance that Caterpillar or Cat Financial will be able to maintain their credit ratings. On December 13, 2016, Moody’s Investors Service (Moody’s) downgraded the long- and short-term ratings of Caterpillar and Cat Financial to A3 from A2 and to Prime-2 from Prime-1. A further downgrade of Caterpillar or Cat Financial’s credit ratings by Moody’s or one of the other major credit rating agencies could adversely affect Caterpillar’s and Cat Financial’s cost of funds, liquidity, competitive position and access to the capital markets, including restricting, in whole or in part, access to the commercial paper market. There can be no assurance that the commercial paper market will continue to be a reliable source of short-term financing for Cat Financial or an available source of short-term financing for Caterpillar. An inability to access the capital markets could have an adverse effect on our cash flow, results of operations and financial condition.
Our Financial Products segment is subject to risks associated with the financial services industry.
Cat Financial is significant to our operations and provides financing support to a significant share of our global sales. The inability of Cat Financial to access funds to support its financing activities to our customers could have an adverse effect on our business, results of operations and financial condition.
Continuing to meet Cat Financial's cash requirements over the long-term could require substantial liquidity and access to sources of funds, including capital and credit markets. Cat Financial has continued to maintain access to key global medium term note and commercial paper markets, but there can be no assurance that such markets will continue to represent a reliable source of financing. If global economic conditions were to deteriorate, Cat Financial could face materially higher financing costs, become unable to access adequate funding to operate and grow its business and/or meet its debt service obligations as they mature, and be required to draw upon contractually committed lending agreements and/or seek other funding sources. However, there can be no assurance that such agreements and other funding sources would be available or sufficient under extreme market conditions. Any of these events could negatively impact Cat Financial’s business, as well as our and Cat Financial's results of operations and financial condition.
Market disruption and volatility may also lead to a number of other risks in connection with these events, including but not limited to:
14
|
•
|
Market developments that may affect customer confidence levels and cause declines in the demand for financing and adverse changes in payment patterns, causing increases in delinquencies and default rates, which could impact Cat Financial’s write-offs and provision for credit losses.
|
|
•
|
The process Cat Financial uses to estimate losses inherent in its credit exposure requires a high degree of management’s judgment regarding numerous subjective qualitative factors, including forecasts of economic conditions and how economic predictors might impair the ability of its borrowers to repay their loans. Financial market disruption and volatility may impact the accuracy of these judgments.
|
|
•
|
Cat Financial’s ability to engage in routine funding transactions or borrow from other financial institutions on acceptable terms or at all could be adversely affected by disruptions in the capital markets or other events, including actions by rating agencies and deteriorating investor expectations.
|
|
•
|
As Cat Financial’s lending agreements are primarily with financial institutions, their ability to perform in accordance with any of its underlying agreements could be adversely affected by market volatility and/or disruptions in financial markets.
|
Changes in interest rates or market liquidity conditions could adversely affect Cat Financial's and our earnings and/or cash flow.
Changes in interest rates and market liquidity conditions could have an adverse effect on Cat Financial's and our earnings and cash flows. Because a significant number of the loans made by Cat Financial are made at fixed interest rates, its business is subject to fluctuations in interest rates. Changes in market interest rates may influence its financing costs, returns on financial investments and the valuation of derivative contracts and could reduce its and our earnings and cash flows. Although Cat Financial manages interest rate and market liquidity risks through a variety of techniques, including a match funding program, the selective use of derivatives and a broadly diversified funding program, there can be no assurance that fluctuations in interest rates and market liquidity conditions will not have an adverse effect on its and our earnings and cash flows. If any of the variety of instruments and strategies Cat Financial uses to hedge its exposure to these types of risk is ineffective, we may incur losses. With respect to Insurance Services' investment activities, changes in the equity and bond markets could cause an impairment of the value of its investment portfolio, requiring a negative adjustment to earnings.
An increase in delinquencies, repossessions or net losses of Cat Financial customers could adversely affect its results.
Inherent in the operation of Cat Financial is the credit risk associated with its customers. The creditworthiness of each customer and the rate of delinquencies, repossessions and net losses on customer obligations are directly impacted by several factors, including relevant industry and economic conditions, the availability of capital, the experience and expertise of the customer's management team, commodity prices, political events and the sustained value of the underlying collateral. Any increase in delinquencies, repossessions and net losses on customer obligations could have a material adverse effect on Cat Financial's and our earnings and cash flows. In addition, although Cat Financial evaluates and adjusts its allowance for credit losses related to past due and non-performing receivables on a regular basis, adverse economic conditions or other factors that might cause deterioration of the financial health of its customers could change the timing and level of payments received and thus necessitate an increase in Cat Financial's estimated losses, which could also have a material adverse effect on Cat Financial's and our earnings and cash flows.
We conduct operations in many areas of the world, involving transactions denominated in a variety of currencies. We are subject to currency exchange rate risk to the extent that our costs are denominated in currencies other than those in which we earn revenues. Fluctuations in currency exchange rates have had, and will continue to have, an impact on our results as expressed in U.S. dollars. There can be no assurance that currency exchange rate fluctuations will not adversely affect our results of operations, financial condition and cash flows. While the use of currency hedging instruments may provide us with protection from adverse fluctuations in currency exchange rates, by utilizing these instruments we potentially forego the benefits that might result from favorable fluctuations in currency exchange rates. In addition, our outlooks do not assume fluctuations in currency exchange rates. Adverse fluctuations in currency exchange rates from the date of our outlooks could cause our actual results to differ materially from those anticipated in our outlooks and adversely impact our business, results of operations and financial condition.
We also face risks arising from the imposition of exchange controls and currency devaluations. Exchange controls may limit our ability to convert foreign currencies into U.S. dollars or to remit dividends and other payments by our foreign subsidiaries
15
or businesses located in or conducted within a country imposing controls. Currency devaluations result in a diminished value of funds denominated in the currency of the country instituting the devaluation.
Restrictive covenants in our debt agreements could limit our financial and operating flexibility.
We maintain a number of credit facilities to support general corporate purposes (facilities) and have issued debt securities to manage liquidity and fund operations (debt securities). The agreements relating to a number of the facilities and the debt securities contain certain restrictive covenants applicable to us and certain of our subsidiaries, including Cat Financial. These covenants include maintaining a minimum consolidated net worth (defined as the consolidated stockholder’s equity including preferred stock but excluding the pension and other post-retirement benefits balance within accumulated other comprehensive income (loss)), limitations on the incurrence of liens and certain restrictions on consolidation and merger. Cat Financial has also agreed under certain of these agreements not to exceed a certain leverage ratio (consolidated debt to consolidated net worth, calculated (1) on a monthly basis as the average of the leverage ratios determined on the last day of each of the six preceding calendar months and (2) at each December 31), to maintain a minimum interest coverage ratio (profit excluding income taxes, interest expense and net gain/(loss) from interest rate derivatives to interest expense, calculated at the end of each calendar quarter for the rolling four quarter period then most recently ended) and not to terminate, amend or modify its support agreement with us.
A breach of one or more of the covenants could result in adverse consequences that could negatively impact our business, results of operations and financial condition. These consequences may include the acceleration of amounts outstanding under certain of the facilities, triggering of an obligation to redeem certain debt securities, termination of existing unused commitments by our lenders, refusal by our lenders to extend further credit under one or more of the facilities or to enter into new facilities or the lowering or modification of our credit ratings or those of one or more of our subsidiaries.
Sustained increases in funding obligations under our pension plans may impair our liquidity or financial condition.
We maintain certain defined benefit pension plans for our employees, which impose on us certain funding obligations. In determining our future payment obligations under the plans, we assume certain rates of return on the plan assets and a certain level of future benefit payments. Significant adverse changes in credit or capital markets could result in actual rates of return being materially lower than projected and increased contribution requirements. We are expecting to make contributions to our pension plans in the future, and may be required to make contributions that could be material. We may fund contributions through the use of cash on hand, the proceeds of borrowings, shares of our common stock or a combination of the foregoing, as permitted by applicable law. Our assumptions for future benefit payments may also be materially higher than projected. These factors could significantly increase our payment obligations under the plans, and as a result, adversely affect our business and overall financial condition.
LEGAL & REGULATORY RISKS
Our global operations are subject to extensive trade and anti-corruption laws and regulations.
Due to the international scope of our operations, we are subject to a complex system of import- and export-related laws and regulations, including U.S. regulations issued by Customs and Border Protection, the Bureau of Industry and Security, the Office of Antiboycott Compliance, the Directorate of Defense Trade Controls and the Office of Foreign Assets Control, as well as the counterparts of these agencies in other countries. Any alleged or actual violations may subject us to government scrutiny, investigation and civil and criminal penalties, and may limit our ability to import or export our products or to provide services outside the United States. Furthermore, embargoes and sanctions imposed by the U.S. and other governments restricting or prohibiting sales to specific persons or countries or based on product classification expose us to potential criminal and civil sanctions. We cannot predict the nature, scope or effect of future regulatory requirements to which our operations might be subject or the manner in which existing laws might be administered or interpreted.
In addition, the U.S. Foreign Corrupt Practices Act and similar foreign anti-corruption laws generally prohibit companies and their intermediaries from making improper payments or providing anything of value to improperly influence foreign government officials for the purpose of obtaining or retaining business, or obtaining an unfair advantage. Recent years have seen a substantial increase in the global enforcement of anti-corruption laws. Our operations outside the United States, including in developing countries, could increase the risk of such violations. Violations of anti-corruption laws or regulations by our employees, by intermediaries acting on our behalf, or by our joint venture partners may result in severe criminal or civil sanctions, could disrupt our business, and result in an adverse effect on our reputation, business and results of operations or financial condition.
16
International trade policies may impact demand for our products and our competitive position.
Government policies on international trade and investment such as import quotas, capital controls or tariffs, whether adopted by individual governments or addressed by regional trade blocs, can affect the demand for our products and services, impact the competitive position of our products or prevent us from being able to sell products in certain countries. The implementation of more restrictive trade policies, such as more detailed inspections, higher tariffs or new barriers to entry, in countries where we sell large quantities of products and services could negatively impact our business, results of operations and financial condition. For example, a government’s adoption of “buy national” policies or retaliation by another government against such policies could have a negative impact on our results of operations.
We may incur additional tax expense or become subject to additional tax exposure.
We are subject to income taxes in the United States and numerous foreign jurisdictions. Our domestic and international tax liabilities are dependent upon the location of earnings among these different jurisdictions. Our future results of operations could be adversely affected by changes in the effective tax rate as a result of a change in the mix of earnings in countries with differing statutory tax rates, changes in our overall profitability, changes in tax laws or treaties or in their application or interpretation, changes in tax rates, repatriation of cash to the United States, changes in generally accepted accounting principles, changes in the valuation of deferred tax assets and liabilities, changes in the amount of earnings indefinitely reinvested offshore, the results of audits and examinations of previously filed tax returns and continuing assessments of our tax exposures. We are also subject to the continuous examination of our income tax returns by the U.S. Internal Revenue Service and other tax authorities. We regularly assess the likelihood of an adverse outcome resulting from these examinations. If our effective tax rates were to increase, or if the ultimate determination of our taxes owed is for an amount in excess of amounts previously accrued, our operating results, cash flows and financial condition could be adversely affected. For information regarding additional legal matters related to our taxes, please see Note 5 — "Income taxes" and Note 22 — "Environmental and legal matters" of Part II, Item 8 "Financial Statements and Supplementary Data" to this Annual Report on Form 10-K
.
Costs associated with lawsuits or investigations or adverse rulings in enforcement or other legal proceedings may have an adverse effect on our results of operations.
We are subject to a variety of legal proceedings and legal compliance risks in virtually every part of the world. We face an inherent business risk of exposure to various types of claims, lawsuits and government investigations. We are involved in various intellectual property, product liability, product warranty and environmental claims and lawsuits and other legal proceedings that arise in and outside of the ordinary course of our business. The industries in which we operate are also periodically reviewed or investigated by regulators, which could lead to enforcement actions, fines and penalties or the assertion of private litigation claims. It is not possible to predict with certainty the outcome of claims, investigations and lawsuits, and we could in the future incur judgments, fines or penalties or enter into settlements of lawsuits and claims that could have an adverse effect on our business, results of operations and financial condition in any particular period.
The global and diverse nature of our operations means that legal and compliance risks will continue to exist and additional legal proceedings and other contingencies, the outcome of which cannot be predicted with certainty, will arise from time to time. In addition, subsequent developments in legal proceedings may affect our assessment and estimates of loss contingencies recorded as a reserve and require us to make payments in excess of our reserves, which could have an adverse effect on our results of operations.
New regulations or changes in financial services regulation could adversely impact Caterpillar and Cat Financial.
Cat Financial’s operations are highly regulated by governmental authorities in the locations where it operates, which can impose significant additional costs and/or restrictions on its business. In the U.S., for example, certain of Cat Financial’s activities are subject to the U.S. Dodd-Frank Wall Street Reform and Consumer Protection Act (Dodd-Frank), which includes extensive provisions regulating the financial services industry. As such, Cat Financial has become and could continue to become subject to additional regulatory costs that could be significant
and have an adverse effect on Cat Financial's and our results of operations and financial condition. Additional regulations in the U.S. or internationally impacting the financial services industry could also add significant cost or operational constraints that might have an adverse effect on Cat Financial's and our results of operations and financial condition.
17
We are subject to stringent environmental laws and regulations that impose significant compliance costs.
Our facilities, operations and products are subject to increasingly stringent environmental laws and regulations globally, including laws and regulations governing emissions to noise, air, discharges to water and the generation, handling, storage, transportation, treatment and disposal of non-hazardous and hazardous waste materials. Some environmental laws impose strict, retroactive and joint and several liability for the remediation of the release of hazardous substances, even for conduct that was lawful at the time it occurred, or for the conduct of, or conditions caused by, prior operators, predecessors or other third parties. Failure to comply with environmental laws could expose us to penalties or clean-up costs, civil or criminal liability and sanctions on certain of our activities, as well as damage to property or natural resources. The potential liabilities, sanctions, damages and remediation efforts related to any non-compliance with such laws and regulations could negatively impact our ability to conduct our operations and our financial condition and results of operations. In addition, there can be no assurances that we will not be adversely affected by costs, liabilities or claims with respect to existing or subsequently acquired operations or under present laws and regulations or those that may be adopted or imposed in the future.
Environmental laws and regulations may also change from time to time, as may related interpretations and other guidance. Changes in environmental laws or regulations could result in higher expenses and payments, and uncertainty relating to environmental laws or regulations may also affect how we conduct our operations and structure our investments and could limit our ability to enforce our rights. Changes in environmental and climate change laws or regulations, including laws relating to greenhouse gas emissions, could lead to new or additional investment in product designs and could increase environmental compliance expenditures. Changes in climate change concerns, or in the regulation of such concerns, including greenhouse gas emissions, could subject us to additional costs and restrictions, including increased energy and raw materials costs. If environmental laws or regulations are either changed or adopted and impose significant operational restrictions and compliance requirements upon us or our products, they could negatively impact our business, capital expenditures, results of operations, financial condition and competitive position.
|
Item 1B.
|
Unresolved Staff Comments.
|
None.
18
|
Item 1C.
|
Executive Officers of the Registrant.
|
|
Name and age
|
Present Caterpillar Inc. position
and date of initial election
|
Principal positions held during the
past five years if other than
Caterpillar Inc. position currently held
|
||
|
Douglas R. Oberhelman (63)
|
Chairman (2010)
|
Chief Executive Officer (2010-2016)
|
||
|
D. James Umpleby III (58)
|
Chief Executive Officer (2017)
|
Vice President (2010-2012), Group President (2013-2016)
|
||
|
Bradley M. Halverson (56)
|
Group President and Chief Financial Officer (2013)
|
Vice President (2010-2012)
|
||
|
Robert B. Charter (53)
|
Group President (2015)
|
Vice President (2009-2015)
|
||
|
Thomas A. Pellette (54)
|
Group President (2015)
|
Vice President (2013-2015), Vice President, Customer Services, Solar (2010-2013)
|
||
|
Denise C. Johnson (50)
|
Group President (2016)
|
Vice President (2012-2016),
General Manager, Specialty Products (2011-2012)
|
||
|
Bob De Lange (47)
|
Group President (2017)
|
Vice President (2015-2016), Worldwide Product Manager, Medium Wheel Loaders, (2013-2014), Regional Product Manager, Medium Wheel Loaders (2010-2013)
|
||
|
James B. Buda (69)
|
Executive Vice President, Law and Public Policy (2012)
|
Senior Vice President and Chief Legal Officer (2011 - 2012)
|
||
|
Jananne A. Copeland (54)
|
Chief Accounting Officer (2007)
|
Chief Accounting Officer and Corporate Controller (2010 - 2012)
|
||
|
Item 2.
|
Properties.
|
General Information
Caterpillar’s operations are highly integrated. Although the majority of our plants are involved primarily in production relating to our Construction Industries, Resource Industries or Energy & Transportation segments, several plants are involved in manufacturing relating to more than one business segment. In addition, several plants reported in our financial statements under the All Other segments are involved in the manufacturing of components that are used in the assembly of products for more than one business segment. Caterpillar’s parts distribution centers are involved in the storage and distribution of parts for Construction Industries, Resource Industries and Energy & Transportation. The research and development activities carried on at our Technical Center in Mossville, Illinois involve products for Construction Industries, Resource Industries and Energy & Transportation.
We believe the properties we own to be generally well maintained and adequate for present use. Through planned capital expenditures, we expect these properties to remain adequate for future needs. Properties we lease are covered by leases expiring over terms of generally one to ten years. We do not anticipate any difficulty in retaining occupancy of any leased facilities, either by renewing leases prior to expiration or by replacing them with equivalent leased facilities.
Headquarters and Other Key Offices
Our corporate headquarters are currently in Peoria, Illinois. On January 31, 2017, we announced plans to establish a corporate headquarters in the Chicago, Illinois area. Additional marketing and operating headquarters are located both inside and outside the United States including San Diego, California; Geneva, Switzerland; Beijing, China; Singapore, Republic of Singapore; Piracicaba, Brazil, and Tokyo, Japan. Our Financial Products business is headquartered in leased offices located in Nashville, Tennessee.
Technical Center, Training Centers, Demonstration Areas and Proving Grounds
We operate a Technical Center located in Mossville, Illinois, and various other technical and training centers, demonstration areas and proving grounds located both inside and outside the United States.
19
Parts Distribution Centers
Distribution of our parts is conducted from parts distribution centers inside and outside the United States. We operate parts distribution centers in the following locations: Morton, Illinois; Mossville, Illinois; Arvin, California; Denver, Colorado; Miami, Florida; Atlanta, Georgia; St. Paul, Minnesota; Clayton, Ohio; Houston, Pennsylvania; York, Pennsylvania; Waco, Texas; Duffield, Virginia; Spokane, Washington; Melbourne, Australia; Queensland, Australia; Grimbergen, Belgium; Piracicaba, Brazil; Shanghai, China; Dortmund, Germany; Lunen, Germany; San Luis Potosi, Mexico; Singapore, Republic of Singapore; Moscow, Russia; Johannesburg, South Africa, and Dubai, United Arab Emirates. We also own or lease other facilities that support our distribution activities.
Remanufacturing and Components
Remanufacturing of our products is reported in our Energy & Transportation segment and is conducted primarily at the facilities in the following locations: Franklin, Indiana; Corinth, Mississippi, Prentiss County, Mississippi; West Fargo, North Dakota; Piracicaba, Brazil; Shanghai, China; and Nuevo Laredo, Mexico.
Component manufacturing is reported in the All Other segments and is conducted primarily at facilities in the following locations: Aurora, Illinois; East Peoria, Illinois; Mapleton, Illinois; Peoria, Illinois; Menominee, Michigan; Boonville, Missouri; West Plains, Missouri; Goldsboro, North Carolina; Sumter, South Carolina; Tianjin, China; Xuzhou, China; Atessa, Italy; Bazzano, Italy; Frosinone, Italy; San Eusebio, Italy; Ramos Arizpe, Mexico; Pyeongtaek, South Korea; Shrewsbury, United Kingdom and Skinningrove, United Kingdom.
We also lease or own other facilities that support our remanufacturing and component manufacturing activities.
Manufacturing
Manufacturing of products for our Construction Industries, Resource Industries and Energy & Transportation segments is conducted primarily at the locations listed below. These facilities are believed to be suitable for their intended purposes, with adequate capacities for current and projected needs for existing products.
Our principal manufacturing facilities include those used by the following segments in the following locations:
20
|
Segment
|
U.S. Facilities
|
Facilities Outside the U.S.
|
||
|
|
|
|
||
|
Construction Industries
|
Arkansas:
North Little Rock
|
Belgium:
Gosselies
|
||
|
|
Illinois:
Aurora, Decatur, East Peoria
|
Brazil:
Campo Largo, Piracicaba
|
||
|
|
North Carolina:
Clayton, Sanford
|
China:
Suzhou, Wujiang, Xuzhou, Qingzhou
|
||
|
|
Texas:
Victoria
|
France:
Grenoble, Echirolles
|
||
|
Georgia:
Athens, LaGrange
|
Hungary:
Godollo
|
|||
|
|
|
India:
Thiruvallar
|
||
|
|
|
Indonesia:
Jakarta
|
||
|
Italy:
Minerbio
|
||||
|
|
|
Japan:
Akashi, Sagamihara
|
||
|
Poland:
Janow, Sosnowiec
|
||||
|
|
|
Russia:
Tosno, Novosibirsk
|
||
|
|
|
United Kingdom:
Desford, Stockton
|
||
|
Thailand:
Rayong
|
||||
|
|
|
|
||
|
Resource Industries
|
Illinois:
Aurora, Decatur, East Peoria, Joliet
|
China:
Langfang, Tongzhou, Wuxi, Zhengzhou
|
||
|
|
Pennsylvania:
Houston
|
France:
Arras
|
||
|
|
South Carolina:
Sumter
|
Germany:
Dortmund, Lunen
|
||
|
Tennessee:
Dyersburg
|
India:
Hosur, Thiruvallur
|
|||
|
|
Texas:
Denison
|
Indonesia:
Batam
|
||
|
|
Wisconsin:
South Milwaukee
|
Italy:
Jesi
|
||
|
|
|
Japan:
Sagamihara
|
||
|
|
Mexico:
Acuna, Monterrey, Reynosa, Torreon
|
|||
|
|
Russia:
Tosno
|
|||
|
|
Thailand:
Rayong
|
|||
|
|
|
|
||
|
|
|
|
||
|
Energy & Transportation
|
Alabama:
Albertville, Montgomery
|
Australia:
Revesby
|
||
|
California:
San Diego
|
Belgium:
Gosselies
|
|||
|
Colorado:
Denver
|
Brazil:
Curitiba, Hortolandia, Piracicaba, Sete Lagoas
|
|||
|
|
Georgia:
Griffin
|
China
: Tianjin, Wuxi
|
||
|
|
Illinois:
Island Lake,
LaGrange, Mossville, Mapleton, Pontiac
|
Czech Republic:
Zatec
|
||
|
|
Indiana:
Lafayette, Muncie
|
Germany:
Kiel, Mannheim, Rostock
|
||
|
Oklahoma:
Broken Arrow
|
India:
Hosur, Aurangabad
|
|||
|
North Carolina:
Winston-Salem
|
Mexico:
San Luis Potosi, Tijuana
|
|||
|
|
Kentucky:
Decoursey, Mayfield
|
Republic of Singapore:
Singapore
|
||
|
|
South Carolina:
Newberry
|
Sweden:
Ockero Islands
|
||
|
|
Texas:
Channelview, De Soto, Mabank, San Antonio, Schertz, Seguin, Sherman
|
Switzerland:
Riazzino
|
||
|
United Kingdom:
Larne, Monkstown, Peterborough, Sandiacre, Shoreham, South Queensferry, Springvale, Stafford, Wimborne
|
||||
|
|
|
|||
21
|
Item 3.
|
Legal Proceedings.
|
Certain legal proceedings in which we are involved are discussed in Note 22 — "Environmental and legal matters" of Part II, Item 8 "Financial Statements and Supplementary Data" and should be considered an integral part of Part I, Item 3 "Legal Proceedings."
|
Item 4.
|
Mine Safety Disclosures.
|
Not applicable.
|
Item 5.
|
Market for Registrant’s Common Equity, Related Stockholder Matters and Issuer Purchases of Equity Securities.
|
Common Stock (NYSE: CAT)
Listing Information:
Caterpillar common stock is listed on the New York Stock Exchange in the United States, and on stock exchanges in France and Switzerland.
Price Ranges:
Quarterly price ranges of Caterpillar common stock on the New York Stock Exchange, the principal market in which the stock is traded, were:
|
|
2016
|
2015
|
||||||||||||||
|
Quarter
|
High
|
Low
|
High
|
Low
|
||||||||||||
|
First
|
$
|
77.25
|
|
$
|
56.36
|
|
$
|
92.37
|
|
$
|
78.19
|
|
||||
|
Second
|
$
|
80.89
|
|
$
|
69.04
|
|
$
|
89.62
|
|
$
|
79.39
|
|
||||
|
Third
|
$
|
88.98
|
|
$
|
73.46
|
|
$
|
85.45
|
|
$
|
62.99
|
|
||||
|
Fourth
|
$
|
97.40
|
|
$
|
80.33
|
|
$
|
75.93
|
|
$
|
63.10
|
|
||||
Number of Stockholders:
Stockholders of record at year-end totaled 29,394, compared with 30,274 at the end of 2015.
22
Performance Graph: Total Cumulative Stockholder Return for Five-Year Period Ending December 31, 2016
The graph below shows the cumulative stockholder return assuming an investment of $100 on December 31, 2011, and reinvestment of dividends issued thereafter.
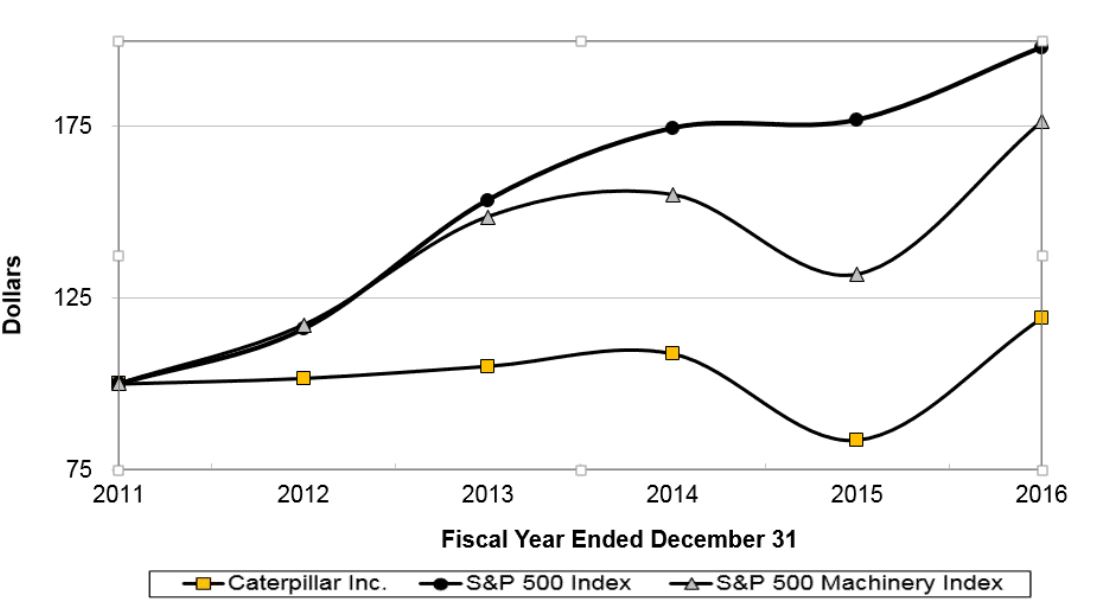
|
|
2011
|
2012
|
2013
|
2014
|
2015
|
2016
|
|||||||||||||||||
|
Caterpillar Inc.
|
$
|
100.00
|
|
$
|
101.58
|
|
$
|
105.08
|
|
$
|
108.69
|
|
$
|
83.74
|
|
$
|
119.01
|
|
|||||
|
S&P 500
|
$
|
100.00
|
|
$
|
115.98
|
|
$
|
153.51
|
|
$
|
174.47
|
|
$
|
176.88
|
|
$
|
197.98
|
|
|||||
|
S&P 500 Machinery
|
$
|
100.00
|
|
$
|
177.09
|
|
$
|
148.67
|
|
$
|
155.05
|
|
$
|
131.84
|
|
$
|
176.40
|
|
|||||
Additional information required by Item 5 regarding our stock is included in Part II, Item 7 "Management's Discussion and Analysis of Financial Condition and Results of Operations" under "Dividends paid per common share."
23
Non-U.S. Employee Stock Purchase Plans
As of December 31, 2016, we had 27 employee stock purchase plans (the "EIP Plans") administered outside the United States for our non-U.S. employees, which had approximately 13,000 active participants in the aggregate. During the fourth quarter of
2016
, approximately 71,000 shares of Caterpillar common stock were purchased by the EIP Plans pursuant to the terms of such plans.
Issuer Purchases of Equity Securities
No shares were repurchased during the fourth quarter of
2016
.
Other Purchases of Equity Securities
|
Period
|
Total number
of Shares
Purchased
(1)
|
Average Price
Paid per Share
|
Total Number
of Shares Purchased
Under the Program
|
Approximate Dollar
Value of Shares that
may yet be Purchased
under the Program
|
|||||||
|
October 1-31, 2016
|
1,775
|
|
$
|
69.03
|
|
N/A
|
N/A
|
||||
|
November 1-30, 2016
|
1,381
|
|
$
|
95.13
|
|
N/A
|
N/A
|
||||
|
December 1-31, 2016
|
292
|
|
$
|
95.72
|
|
N/A
|
N/A
|
||||
|
Total
|
3,448
|
|
$
|
81.74
|
|
|
|
||||
_____________________________
|
(1)
|
Represents shares delivered back to issuer for the payment of taxes resulting from the vesting of restricted stock units for employees and Directors.
|
24
|
Item 6.
|
Selected Financial Data.
|
|
Five-year Financial Summary
|
|||||||||||||||||||||
|
(Dollars in millions except per share data)
|
|||||||||||||||||||||
|
|
2016
|
2015
|
6
|
2014
|
6
|
2013
|
6
|
2012
|
6
|
||||||||||||
|
Years ended December 31,
|
|
|
|
|
|
|
|
|
|
|
|||||||||||
|
Sales and revenues
|
$
|
38,537
|
|
$
|
47,011
|
|
$
|
55,184
|
|
$
|
55,656
|
|
$
|
65,875
|
|
||||||
|
Percent inside the United States
|
41
|
%
|
41
|
%
|
38
|
%
|
33
|
%
|
31
|
%
|
|||||||||||
|
Percent outside the United States
|
59
|
%
|
59
|
%
|
62
|
%
|
67
|
%
|
69
|
%
|
|||||||||||
|
Sales
|
$
|
35,773
|
|
$
|
44,147
|
|
$
|
52,142
|
|
$
|
52,694
|
|
$
|
63,068
|
|
||||||
|
Revenues
|
$
|
2,764
|
|
$
|
2,864
|
|
$
|
3,042
|
|
$
|
2,962
|
|
$
|
2,807
|
|
||||||
|
Profit (loss)
4
|
$
|
(67
|
)
|
$
|
2,512
|
|
$
|
2,452
|
|
$
|
6,556
|
|
$
|
5,397
|
|
||||||
|
Profit (loss) per common share
1
|
$
|
(0.11
|
)
|
$
|
4.23
|
|
$
|
3.97
|
|
$
|
10.16
|
|
$
|
8.27
|
|
||||||
|
Profit (loss) per common share–diluted
2,5
|
$
|
(0.11
|
)
|
$
|
4.18
|
|
$
|
3.90
|
|
$
|
9.95
|
|
$
|
8.06
|
|
||||||
|
Dividends declared per share of common stock
|
$
|
3.08
|
|
$
|
3.01
|
|
$
|
2.70
|
|
$
|
2.32
|
|
$
|
2.02
|
|
||||||
|
Return on average common stockholders’ equity
3
|
(0.5
|
)%
|
15.8
|
%
|
13.0
|
%
|
34.1
|
%
|
35.4
|
%
|
|||||||||||
|
Capital expenditures:
|
|
|
|
|
|
|
|
|
|
|
|||||||||||
|
Property, plant and equipment
|
$
|
1,109
|
|
$
|
1,388
|
|
$
|
1,539
|
|
$
|
2,522
|
|
$
|
3,350
|
|
||||||
|
Equipment leased to others
|
$
|
1,819
|
|
$
|
1,873
|
|
$
|
1,840
|
|
$
|
1,924
|
|
$
|
1,726
|
|
||||||
|
Depreciation and amortization
|
$
|
3,034
|
|
$
|
3,046
|
|
$
|
3,163
|
|
$
|
3,087
|
|
$
|
2,813
|
|
||||||
|
Research and development expenses
|
$
|
1,951
|
|
$
|
2,119
|
|
$
|
2,380
|
|
$
|
1,552
|
|
$
|
2,491
|
|
||||||
|
As a percent of sales and revenues
|
5.1
|
%
|
4.5
|
%
|
4.3
|
%
|
2.8
|
%
|
3.8
|
%
|
|||||||||||
|
Average number of employees
|
99,500
|
|
110,800
|
|
115,600
|
|
122,500
|
|
127,800
|
|
|||||||||||
|
December 31,
|
|
|
|
|
|
|
|
|
|
|
|||||||||||
|
Total assets
|
$
|
74,704
|
|
$
|
78,342
|
|
$
|
84,498
|
|
$
|
84,755
|
|
$
|
88,833
|
|
||||||
|
Long-term debt due after one year:
|
|
|
|
|
|
|
|
|
|
|
|||||||||||
|
Consolidated
|
$
|
22,818
|
|
$
|
25,169
|
|
$
|
27,696
|
|
$
|
26,643
|
|
$
|
27,672
|
|
||||||
|
Machinery, Energy & Transportation
|
$
|
8,436
|
|
$
|
8,960
|
|
$
|
9,445
|
|
$
|
7,961
|
|
$
|
8,624
|
|
||||||
|
Financial Products
|
$
|
14,382
|
|
$
|
16,209
|
|
$
|
18,251
|
|
$
|
18,682
|
|
$
|
19,048
|
|
||||||
|
Total debt:
|
|
|
|
|
|
|
|
|
|
|
|||||||||||
|
Consolidated
|
$
|
36,783
|
|
$
|
38,013
|
|
$
|
39,195
|
|
$
|
37,672
|
|
$
|
40,060
|
|
||||||
|
Machinery, Energy & Transportation
|
$
|
9,152
|
|
$
|
9,486
|
|
$
|
9,964
|
|
$
|
8,737
|
|
$
|
10,372
|
|
||||||
|
Financial Products
|
$
|
27,631
|
|
$
|
28,527
|
|
$
|
29,231
|
|
$
|
28,935
|
|
$
|
29,688
|
|
||||||
|
1
|
Computed on weighted-average number of shares outstanding.
|
|
2
|
Computed on weighted-average number of shares outstanding diluted by assumed exercise of stock-based compensation awards, using the treasury stock method.
|
|
3
|
Represents profit (loss) divided by average stockholders’ equity (beginning of year stockholders’ equity plus end of year stockholders’ equity divided by two).
|
|
4
|
Profit (loss) attributable to common stockholders.
|
|
5
|
In 2016, the assumed exercise of stock-based compensation awards was not considered because the impact would be antidilutive.
|
|
6
|
Reflects the change in accounting principle for pension and other postretirement benefit plans (see Note 1B) and changes from the adoption of new accounting guidance (see Note 1K).
|
Additional information required by Item 6 is included in Part II, Item 7 "Management's Discussion and Analysis of Financial Condition and Results of Operations."
25
|
Item 7.
|
Management’s Discussion and Analysis of Financial Condition and Results of Operations.
|
This Management’s Discussion and Analysis of Financial Condition and Results of Operations should be read in conjunction with our discussion of cautionary statements and significant risks to the company’s business under Item 1A. Risk Factors of the 2016 Form 10-K.
OVERVIEW
Our sales and revenues for 2016 were $38.537 billion, down $8.474 billion, or 18 percent, from $47.011 billion in 2015. Sales declined across the company reflecting weak end-user demand in most of the industries we serve including in construction, oil and gas, mining and rail. A loss of $67 million was incurred in 2016, compared with profit of $2.512 billion in 2015. The decline was primarily due to lower
sales volume
, the unfavorable impact of higher
mark-to-market losses
related to remeasurement of our
pension and other postemployment benefits (OPEB)
plans, unfavorable
price realization
and a goodwill impairment charge in
Resource Industries
. These unfavorable items were partially offset by lower costs resulting from restructuring and other cost reduction actions.
Fourth-quarter 2016 sales and revenues were $9.574 billion, a 13 percent decrease from $11.030 billion in the fourth quarter of 2015. A loss of $1.171 billion was incurred in the fourth quarter of 2016 compared with a loss of $94 million in the fourth quarter of 2015. The loss was $2.00 per share in the fourth quarter of 2016 compared with a loss per share of $0.16 in the fourth quarter of 2015. Profit declined primarily due to the unfavorable impact of increased mark-to-market losses related to remeasurement of our pension and OPEB plans, a goodwill impairment charge and lower sales volume. These unfavorable items were partially offset by lower costs resulting from restructuring and other cost reduction actions and lower
restructuring costs
.
Highlights for 2016 include:
|
•
|
Sales and revenues in 2016 were $38.537 billion, down 18 percent from 2015. Sales declined in all segments and all regions.
|
|
•
|
Results for both 2015 and 2016 included significant restructuring costs and 2016 also included three large non-cash items.
|
|
•
|
Restructuring costs were $1.019 billion in 2016, or $1.16 per share, compared with restructuring costs of $898 million in 2015, or $0.98 per share.
|
|
•
|
Mark-to-market losses related to remeasurement of our pension and OPEB plans were $985 million in 2016, or $1.15 per share, a significant increase from mark-to-market losses in 2015 of $179 million, or $0.19 per share.
|
|
•
|
Results for 2016 included a goodwill impairment charge in Resource Industries of $595 million, or $0.98 per share.
|
|
•
|
Results for 2016 included a $141 million charge to increase deferred tax valuation allowances, or $0.24 per share.
|
|
•
|
The loss per share was $0.11 for 2016, and excluding the above items, adjusted profit was $3.42 per share. For 2015, profit per share was $4.18, and excluding restructuring costs and mark-to-market losses, adjusted profit was $5.35 per share.
|
|
•
|
Inventory declined about $900 million during the fourth quarter of 2016. For the full year, inventory decreased about $1.1 billion.
|
|
•
|
Machinery, Energy & Transportation (ME&T)
operating cash flow for 2016 was about $3.9 billion, more than sufficient to cover capital expenditures and dividends.
|
Restructuring Costs
In 2016, we continued to undertake a wide range of actions across the enterprise to lower our cost structure in response to weak economic conditions. Restructuring costs of $395 million in the fourth quarter of 2016 were related to restructuring programs across the company. During 2016, we incurred $1.019 billion in restructuring costs, primarily related to Resource Industries and
Energy & Transportation
. In 2017, we expect restructuring actions to continue and anticipate costs of about $500 million.
Notes:
|
•
|
Effective January 1, 2016, we made several changes that impacted the accounting for pension and other postemployment benefits. We also made changes to organizational accountabilities and internal reporting that impacted segment results. Our 2015 financial information has been recast to be consistent with the 2016 presentation.
|
|
•
|
Glossary of terms included on pages 47 to 49; first occurrence of terms shown in bold italics.
|
|
•
|
Information on non-GAAP financial measures is included on pages 62-63.
|
26
2016
COMPARED WITH
2015
CONSOLIDATED SALES AND REVENUES
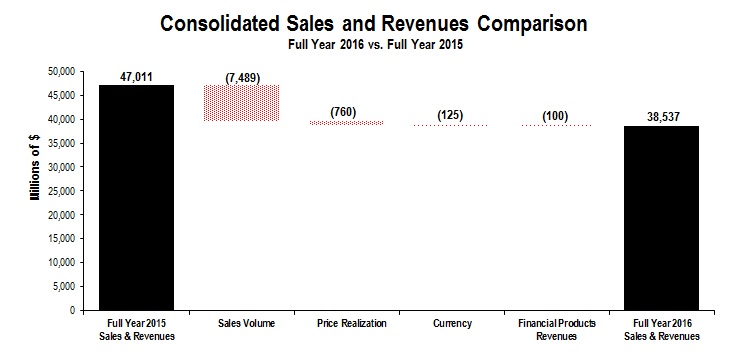
The chart above graphically illustrates reasons for the change in Consolidated Sales and Revenues between
2015
(at left) and
2016
(at right). Items favorably impacting sales and revenues appear as upward stair steps with the corresponding dollar amounts above each bar, while items negatively impacting sales and revenues appear as downward stair steps with dollar amounts reflected in parentheses above each bar. Caterpillar management utilizes these charts internally to visually communicate with the company's Board of Directors and employees.
Total sales and revenues were $38.537 billion in 2016, compared with $47.011 billion in 2015, a decline of $8.474 billion, or 18 percent. The decrease was primarily due to lower sales volume attributable to continued weak commodity prices globally and economic weakness in many countries. While sales for both new equipment and aftermarket parts declined, most of the decrease was for new equipment.
The unfavorable impact of price realization, primarily in
Construction Industries
, also contributed to the decline.
Sales volume was also unfavorably impacted by changes in dealer machine and engine inventories as inventories decreased about $1.6 billion in 2016 compared with a decrease of about $1.0 billion in 2015. The unfavorable impact of changes in dealer inventories was primarily in North America. Dealers are independent, and there could be many reasons for changes in their inventory levels, including their expectations of future demand and product delivery times. Dealers’ demand expectations take into account seasonal changes, macroeconomic conditions, machine rental rates and other factors. Delivery times can vary based on availability of product from Caterpillar factories and product distribution centers. We believe some of the expected dealer inventory reduction is a result of increased machine availability through our factories and product distribution centers. We do not expect dealers will reduce inventories in 2017 as much as they did in 2016. We believe the level of dealer inventories at the end of 2017 will depend on dealer expectations for business in 2018.
Sales declined in all regions.
In North America, sales decreased 19 percent due to lower end-user demand primarily driven by Construction Industries and Energy & Transportation, and the unfavorable impact of changes in dealer inventories, primarily in Construction Industries. In
EAME
, sales declined 22 percent, primarily in Africa/Middle East due to weak economic conditions resulting from low oil and other commodity prices and an uncertain investment environment. Sales decreased 29 percent in
Latin America
, primarily due to widespread economic weakness across the region. The most significant decreases were in Mexico and Brazil.
Asia/Pacific sales declined 9 percent, primarily due to lower end-user demand for Energy & Transportation applications and products used in mining, partially offset by an increase in demand for construction equipment mostly in China.
Energy & Transportation’s sales declined 22 percent, largely due to lower end-user demand for oil and gas and transportation applications. Construction Industries’ sales decreased 12 percent due to lower demand from end users, unfavorable price realization and the unfavorable impact of changes in dealer inventories.
Resource Industries’ sales declined 26 percent, mostly due to continued low end-user demand.
Financial Products’ segment
revenues were about flat.
27
CONSOLIDATED OPERATING PROFIT
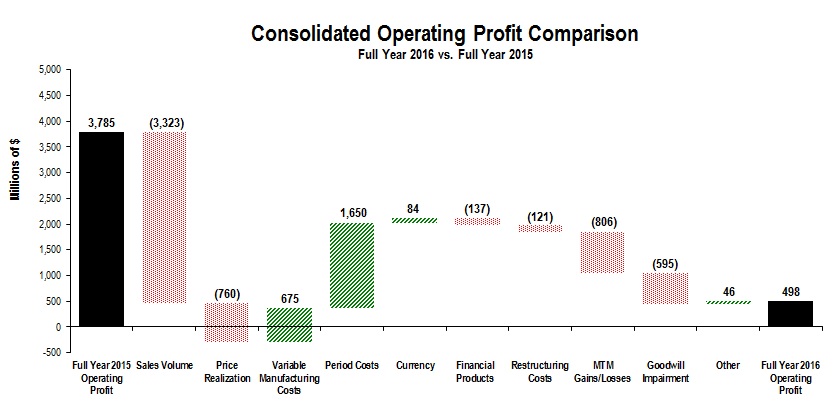
The chart above graphically illustrates reasons for the change in Consolidated Operating Profit between
2015
(at left) and
2016
(at right). Items favorably impacting operating profit
appear as upward stair steps with the corresponding dollar amounts above each bar, while items negatively impacting operating profit appear as downward stair steps with dollar amounts reflected in parentheses above each bar. Caterpillar management utilizes these charts internally to visually communicate with the company's Board of Directors and employees. The bar entitled Other includes
consolidating adjustments
and
Machinery, Energy & Transportation other operating (income) expenses
.
Operating profit for 2016 was $498 million, compared with $3.785 billion in 2015. The decrease in profit is primarily due to lower sales volume, including an unfavorable mix of products. Our expectation is that sales mix will continue to be unfavorable in 2017. The decrease in profit also includes an unfavorable impact from mark-to-market losses related to remeasurement of our pension and OPEB plans and a goodwill impairment charge in Resource Industries. In addition, price realization, Financial Products and restructuring costs were unfavorable. These items were partially offset by favorable
period costs
and
variable manufacturing costs
.
The unfavorable price realization resulted from competitive market conditions, primarily in Construction Industries. We saw competitive pressure during 2016 that started in the last half of 2015 driven by excess industry capacity, unfavorable
currency
pressure as the impact of the strong dollar benefited competitors based outside the United States and an overall weak economic environment. While we do not expect substantial price improvement in the coming months, we do expect price realization to be neutral to slightly positive in 2017.
Period costs were lower, primarily due to the impact from substantial restructuring and cost reduction actions and lower short-term incentive compensation expense. The reductions primarily impacted period manufacturing costs and selling, general and administrative expenses (SG&A). Variable manufacturing costs were favorable primarily due to improved material costs and the favorable impact of cost absorption. Cost absorption was favorable due to inventory decreasing more significantly in 2015 compared to the decrease in 2016.
Restructuring costs of $1.019 billion in 2016 were related to multiple restructuring actions across the company, primarily in Resource Industries and Energy & Transportation.
In 2015, restructuring costs were $898 million.
Short-term incentive compensation expense is directly related to financial and operational performance measured against targets set annually. Expense in 2016 was about $250 million as compared to about $585 million in 2015. For 2017, we expect short-term incentive compensation expense will be significantly higher than 2016.
Other Profit/Loss Items
|
•
|
Other income/expense
in 2016 was income of $146 million, compared with income of $161 million in 2015. The unfavorable change was primarily due to the absence of a gain of $120 million on the sale of the remaining 35 percent
|
28
interest in our former third-party logistics business. This was mostly offset by a favorable net impact from currency translation and hedging gains and losses. Currency translation and hedging net losses in 2016 were significantly less than the net losses in 2015.
|
•
|
The provision for income taxes
for 2016 reflects an annual effective tax rate of 36.4 percent compared to 25.5 percent for 2015, excluding the items discussed in the paragraph below. The increase is primarily due to the negative impact from the portion of the
Surface Mining & Technology
goodwill impairment not deductible for tax purposes offsetting a favorable geographic mix of profits from a tax perspective. The effective tax rate related to 2016 full-year adjusted profit before tax is 26 percent.
|
The provision for income taxes for 2016 also includes a $141 million non-cash charge for increases in the valuation allowance for U.S. state deferred tax assets due to recent U.S. GAAP losses expected to recur in 2017 in certain state jurisdictions and the weight given this negative objective evidence under income tax accounting guidance. The provision for income taxes for 2015 also included a $42 million net charge to adjust prior years’ U.S. taxes.
Segment Information
|
Sales and Revenues by Geographic Region
|
||||||||||||||||||||||||||||||||||
|
(Millions of dollars)
|
Total
|
%
Change
|
North
America
|
%
Change
|
Latin
America
|
%
Change
|
EAME
|
%
Change
|
Asia/
Pacific
|
%
Change
|
||||||||||||||||||||||||
|
2016
|
|
|
|
|
|
|
|
|
|
|
|
|
|
|
|
|
|
|
|
|
||||||||||||||
|
Construction Industries
1
|
$
|
15,612
|
|
(12
|
)%
|
$
|
7,529
|
|
(16
|
)%
|
$
|
1,059
|
|
(32
|
)%
|
$
|
3,270
|
|
(17
|
)%
|
$
|
3,754
|
|
13
|
%
|
|||||||||
|
Resource Industries
2
|
5,726
|
|
(26
|
)%
|
2,068
|
|
(30
|
)%
|
1,001
|
|
(19
|
)%
|
1,179
|
|
(33
|
)%
|
1,478
|
|
(17
|
)%
|
||||||||||||||
|
Energy & Transportation
3
|
14,411
|
|
(22
|
)%
|
6,680
|
|
(19
|
)%
|
1,104
|
|
(33
|
)%
|
4,201
|
|
(22
|
)%
|
2,426
|
|
(26
|
)%
|
||||||||||||||
|
All Other Segments
4
|
139
|
|
(32
|
)%
|
46
|
|
(42
|
)%
|
3
|
|
(79
|
)%
|
28
|
|
(46
|
)%
|
62
|
|
7
|
%
|
||||||||||||||
|
Corporate Items and Eliminations
|
(115
|
)
|
(98
|
)
|
(3
|
)
|
(9
|
)
|
(5
|
)
|
||||||||||||||||||||||||
|
Machinery, Energy & Transportation Sales
|
35,773
|
|
(19
|
)%
|
16,225
|
|
(19
|
)%
|
3,164
|
|
(29
|
)%
|
8,669
|
|
(22
|
)%
|
7,715
|
|
(9
|
)%
|
||||||||||||||
|
Financial Products Segment
|
2,993
|
|
(3
|
)%
|
1,862
|
|
3
|
%
|
336
|
|
(16
|
)%
|
401
|
|
(2
|
)%
|
394
|
|
(14
|
)%
|
||||||||||||||
|
Corporate Items and Eliminations
|
(229
|
)
|
(125
|
)
|
(45
|
)
|
(17
|
)
|
(42
|
)
|
||||||||||||||||||||||||
|
Financial Products Revenues
|
2,764
|
|
(3
|
)%
|
1,737
|
|
2
|
%
|
291
|
|
(19
|
)%
|
384
|
|
(1
|
)%
|
352
|
|
(16
|
)%
|
||||||||||||||
|
Consolidated Sales and Revenues
|
$
|
38,537
|
|
(18
|
)%
|
$
|
17,962
|
|
(18
|
)%
|
$
|
3,455
|
|
(28
|
)%
|
$
|
9,053
|
|
(21
|
)%
|
$
|
8,067
|
|
(9
|
)%
|
|||||||||
|
2015
|
|
|
|
|
|
|
|
|
|
|
|
|
|
|
|
|
|
|
||||||||||||||||
|
Construction Industries
1
|
$
|
17,797
|
|
$
|
9,006
|
|
$
|
1,546
|
|
$
|
3,930
|
|
$
|
3,315
|
|
|
|
|||||||||||||||||
|
Resource Industries
2
|
7,739
|
|
2,953
|
|
1,231
|
|
1,769
|
|
1,786
|
|
|
|
||||||||||||||||||||||
|
Energy & Transportation
3
|
18,519
|
|
8,204
|
|
1,651
|
|
5,365
|
|
3,299
|
|
|
|
||||||||||||||||||||||
|
All Other Segments
4
|
203
|
|
79
|
|
14
|
|
52
|
|
58
|
|
|
|
||||||||||||||||||||||
|
Corporate Items and Eliminations
|
(111
|
)
|
(118
|
)
|
2
|
|
—
|
|
5
|
|
||||||||||||||||||||||||
|
Machinery, Energy & Transportation Sales
|
44,147
|
|
|
|
20,124
|
|
|
|
4,444
|
|
|
|
11,116
|
|
|
|
8,463
|
|
|
|
||||||||||||||
|
Financial Products Segment
|
3,078
|
|
1,812
|
|
400
|
|
408
|
|
458
|
|
|
|
||||||||||||||||||||||
|
Corporate Items and Eliminations
|
(214
|
)
|
(111
|
)
|
(42
|
)
|
(22
|
)
|
(39
|
)
|
|
|
||||||||||||||||||||||
|
Financial Products Revenues
|
2,864
|
|
|
|
1,701
|
|
|
|
358
|
|
|
|
386
|
|
|
|
419
|
|
|
|
||||||||||||||
|
Consolidated Sales and Revenues
|
$
|
47,011
|
|
|
|
$
|
21,825
|
|
|
|
$
|
4,802
|
|
|
|
$
|
11,502
|
|
|
|
$
|
8,882
|
|
|
|
|||||||||
|
1
|
Does not include inter-segment sales of $78 million and $109 million in
2016
and
2015
, respectively.
|
|
2
|
Does not include inter-segment sales of $284 million and $332 million in
2016
and
2015
, respectively.
|
|
3
|
Does not include inter-segment sales of $2,540 million and $2,877 million in
2016
and
2015
, respectively.
|
|
4
|
Does not include inter-segment sales of $405 million and $390 million in
2016
and
2015
, respectively.
|
29
|
Sales and Revenues by Segment
|
||||||||||||||||||||||||||||||
|
(Millions of dollars)
|
2015
|
Sales
Volume
|
Price
Realization
|
Currency
|
Other
|
2016
|
$
Change
|
%
Change
|
||||||||||||||||||||||
|
Construction Industries
|
$
|
17,797
|
|
$
|
(1,632
|
)
|
$
|
(539
|
)
|
$
|
(14
|
)
|
$
|
—
|
|
$
|
15,612
|
|
$
|
(2,185
|
)
|
(12
|
)%
|
|||||||
|
Resource Industries
|
7,739
|
|
(1,852
|
)
|
(155
|
)
|
(6
|
)
|
—
|
|
5,726
|
|
(2,013
|
)
|
(26
|
)%
|
||||||||||||||
|
Energy & Transportation
|
18,519
|
|
(3,934
|
)
|
(68
|
)
|
(106
|
)
|
—
|
|
14,411
|
|
(4,108
|
)
|
(22
|
)%
|
||||||||||||||
|
All Other Segments
|
203
|
|
(63
|
)
|
—
|
|
(1
|
)
|
—
|
|
139
|
|
(64
|
)
|
(32
|
)%
|
||||||||||||||
|
Corporate Items and Eliminations
|
(111
|
)
|
(8
|
)
|
2
|
|
2
|
|
—
|
|
(115
|
)
|
(4
|
)
|
|
|
||||||||||||||
|
Machinery, Energy & Transportation Sales
|
44,147
|
|
(7,489
|
)
|
(760
|
)
|
(125
|
)
|
—
|
|
35,773
|
|
(8,374
|
)
|
(19
|
)%
|
||||||||||||||
|
Financial Products Segment
|
3,078
|
|
—
|
|
—
|
|
—
|
|
(85
|
)
|
2,993
|
|
(85
|
)
|
(3
|
)%
|
||||||||||||||
|
Corporate Items and Eliminations
|
(214
|
)
|
—
|
|
—
|
|
—
|
|
(15
|
)
|
(229
|
)
|
(15
|
)
|
|
|
||||||||||||||
|
Financial Products Revenues
|
2,864
|
|
—
|
|
—
|
|
—
|
|
(100
|
)
|
2,764
|
|
(100
|
)
|
(3
|
)%
|
||||||||||||||
|
Consolidated Sales and Revenues
|
$
|
47,011
|
|
$
|
(7,489
|
)
|
$
|
(760
|
)
|
$
|
(125
|
)
|
$
|
(100
|
)
|
$
|
38,537
|
|
$
|
(8,474
|
)
|
(18
|
)%
|
|||||||
|
Operating Profit (Loss) by Segment
|
||||||||||||||
|
(Millions of dollars)
|
2016
|
2015
|
$
Change
|
%
Change
|
||||||||||
|
Construction Industries
|
$
|
1,650
|
|
$
|
1,865
|
|
$
|
(215
|
)
|
(12
|
)%
|
|||
|
Resource Industries
|
(1,047
|
)
|
1
|
|
(1,048
|
)
|
(104,800
|
)%
|
||||||
|
Energy & Transportation
|
2,222
|
|
3,390
|
|
(1,168
|
)
|
(34
|
)%
|
||||||
|
All Other Segments
|
(77
|
)
|
(75
|
)
|
(2
|
)
|
(3
|
)%
|
||||||
|
Corporate Items and Eliminations
|
(2,659
|
)
|
(1,911
|
)
|
(748
|
)
|
|
|
||||||
|
Machinery, Energy & Transportation
|
89
|
|
3,270
|
|
(3,181
|
)
|
(97
|
)%
|
||||||
|
Financial Products Segment
|
702
|
|
809
|
|
(107
|
)
|
(13
|
)%
|
||||||
|
Corporate Items and Eliminations
|
(53
|
)
|
(35
|
)
|
(18
|
)
|
|
|
||||||
|
Financial Products
|
649
|
|
774
|
|
(125
|
)
|
(16
|
)%
|
||||||
|
Consolidating Adjustments
|
(240
|
)
|
(259
|
)
|
19
|
|
|
|
||||||
|
Consolidated Operating Profit
|
$
|
498
|
|
$
|
3,785
|
|
$
|
(3,287
|
)
|
(87
|
)%
|
|||
Construction Industries
Construction Industries’ sales were $15.612 billion in 2016, a decrease of $2.185 billion, or 12 percent, from 2015. The decrease in sales was primarily due to lower volume and unfavorable price realization. While sales declined for both new equipment and aftermarket parts, most of the decrease was for new equipment.
|
•
|
The sales volume decline was primarily due to a decrease in deliveries to end users and the unfavorable impact of changes in dealer inventories. Dealers lowered inventories more significantly in 2016 than in 2015.
|
|
•
|
Price realization was unfavorable $539 million due to competitive market conditions resulting from excess industry capacity and an overall weak economic environment.
|
Sales decreased in North America, EAME and Latin America and were higher in Asia/Pacific.
|
•
|
In North America, the sales decline was primarily due to lower end-user demand.
The sales decline was also due to a decrease in dealer inventories in 2016 compared to relatively flat inventories in 2015. Unfavorable price realization resulted from competitive market conditions. The availability of used equipment has negatively impacted sales in North America during 2016 and we expect some negative impact in 2017.
|
|
•
|
Lower sales in EAME were primarily due to lower end-user demand and the unfavorable impact of changes in dealer inventories. In addition, price realization was unfavorable across the region due to competitive market conditions. Dealer inventories decreased in 2016 while inventories remained flat in 2015. We expect sales in Africa/Middle East to be negatively impacted
|
30
in 2017 due to overall economic weakness and continued pressure on economies that rely on oil revenues to drive economic growth.
|
•
|
In Latin America, end-user demand was down across most of the region, with the most significant decline in Brazil due to weak economic conditions.
|
|
•
|
Sales in Asia/Pacific were higher as a result of an increase in end-user demand primarily in China stemming from increased government support in infrastructure and residential investment. In addition, the impact of changes in dealer inventories was favorable as inventories increased slightly in 2016 compared to a decrease in inventories in 2015.
|
Construction Industries’ profit was $1.650 billion in 2016, compared with $1.865 billion in 2015. The decrease in profit was primarily due to lower sales volume and unfavorable price realization resulting from competitive market conditions. The decline was partially offset by favorable costs, primarily due to the impact from restructuring and cost reduction actions, improved material costs, the favorable impact of cost absorption and the absence of an unfavorable impact from litigation in 2015. The impact of cost absorption was favorable as inventory decreased more significantly in 2015 than in 2016.
Resource Industries
Resource Industries’ sales were $5.726 billion in 2016, a decrease of $2.013 billion, or 26 percent, from 2015. The decline was almost entirely due to lower sales volume. Sales were lower for both new equipment and aftermarket parts, however, most of the decrease was for new equipment. Aftermarket parts sales have increased sequentially in each of the last three quarters.
The sales decrease was primarily due to lower end-user demand across all regions. While most commodity prices improved in the fourth quarter over a year earlier, current prices have not been sufficient to drive an increase in short-term demand for new equipment. We believe commodity prices must stabilize for a longer period of time to positively impact our sales. We believe idle mining trucks on customer sites are also having a negative impact on end-user demand. In 2016, mining customers continued to focus on improving productivity in existing mines and reducing their total capital expenditures, as they have for several years. We believe miners’ capital spending will be about flat in 2017 after several years of decline. However, we believe commodity prices at higher levels than a year ago, along with sequential improvements in part sales in each of the last three quarters of 2016 and improvements in quoting and order activity in the fourth quarter of 2016, reflect positive trends in Resource Industries that, if sustained, could positively impact future results.
Resource Industries incurred a loss of $1.047 billion in 2016, compared with profit of $1 million in 2015. The most significant item impacting 2016 was a goodwill impairment charge of $595 million related to the Surface Mining & Technology reporting unit. Excluding the impairment charge, the remaining unfavorable change was mostly due to lower sales volume and unfavorable price realization. These items were partially offset by lower costs due to the impact from restructuring and cost reduction actions, improved material costs and lower short-term incentive compensation expense.
Energy & Transportation
Energy & Transportation’s sales were $14.411 billion in 2016, a decrease of $4.108 billion, or 22 percent, from 2015. The decrease was almost entirely the result of lower sales volume. Sales decreased in all applications with oil and gas and transportation representing nearly 80 percent of the Energy & Transportation decline.
|
•
|
Oil and Gas
- Sales continued to decrease in all regions due to low oil prices. Although oil prices were low in 2015 and 2016, our sales during the first half of 2015 benefited from a strong order backlog. The sales decline was most significant in equipment used for production, drilling and well servicing.
|
|
•
|
Transportation
- Sales decreased in all geographic regions. The most significant decline was in North America, primarily due to significant weakness in the rail industry that we expect will persist in 2017. Rail remains challenged with low traffic volume and a significant number of idle locomotives. We believe our sales into the rail industry, including rail services and aftermarket, are being negatively impacted by idled fleets resulting from weak commodity prices. We expect the availability of our North American Tier 4 freight locomotive offering to positively impact sales in 2017. In Asia/Pacific, the decrease was due to the absence of a large sale of locomotives in 2015 and a decline in demand for equipment used in marine applications, primarily for work boats. Demand in Latin America and EAME were also negatively impacted by the weakness in the rail industry.
|
|
•
|
Power Generation
- Sales decreased in all regions, but primarily in EAME. The decline in EAME was primarily a result of continued weakness in the Middle East with continued low oil prices limiting investments. We expect low oil prices will continue to limit investments in oil-producing regions of Africa/Middle East in 2017. The declines in both North America and Asia/Pacific were primarily due to the absence of several large projects and weakness in power generation demand for oil and gas development. The decline in Latin America was primarily due to weak economic conditions.
|
31
|
•
|
Industrial
- Sales were lower in EAME, North America and Latin America and about flat in Asia Pacific. The decline in sales was primarily due to lower end-user demand for most industrial applications.
|
Energy & Transportation’s profit was $2.222 billion in 2016, compared with $3.390 billion in 2015. The decline was due to a decrease in sales volume, including an unfavorable mix of products. This was partially offset by lower costs primarily due to restructuring and cost reduction actions, favorable material costs and lower short-term incentive compensation expense.
Financial Products Segment
Financial Products’ revenues were $2.993 billion, a decrease of $85 million, or 3 percent, from 2015. The decline was primarily due to lower average
earning assets
in Asia/Pacific and Latin America, an unfavorable impact from returned or repossessed equipment, primarily in North America and lower average financing rates in Latin America. These decreases were partially offset by higher average financing rates and higher average earning assets in North America.
Financial Products’ profit was $702 million in 2016, compared with $809 million in 2015. The decrease was primarily due to an unfavorable impact from returned or repossessed equipment, an unfavorable impact from lower average earning assets, a decrease in net yield on average earning assets reflecting geographic mix changes and an increase in the provision for credit losses at Cat Financial. These unfavorable impacts were partially offset by a decrease in SG&A expenses.
At the end of 2016, past dues at Cat Financial were 2.38 percent, compared with 2.14 percent at the end of 2015. The increase in past dues was primarily driven by the European marine portfolio. Write-offs, net of recoveries, were $123 million for the full-year 2016, compared with $155 million for the full-year 2015.
As of December 31, 2016, Cat Financial's allowance for credit losses totaled $343 million, or 1.29 percent of net finance receivables, compared with $338 million, or 1.22 percent of net finance receivables at year-end 2015.
Corporate Items and Eliminations
Expense for corporate items and eliminations was $2.712 billion in 2016, which was an increase of $766 million compared with 2015. Corporate items and eliminations include: corporate-level expenses; restructuring costs; timing differences, as some expenses are reported in segment profit on a cash basis; retirement benefit costs other than service cost; currency differences for ME&T, as segment profit is reported using annual fixed exchange rates; cost of sales methodology differences as segments use a current cost methodology; and inter-segment eliminations.
The most significant item was the unfavorable impact of mark-to-market losses related to remeasurement of our pension and OPEB plans. Mark-to-market losses in 2016 were $985 million compared to mark-to-market losses of $179 million in 2015. The remaining decrease in expense of $40 million was primarily due to a favorable impact from methodology differences, partially offset by a $121 million increase in restructuring costs.
32
FOURTH QUARTER
2016
COMPARED WITH FOURTH QUARTER
2015
CONSOLIDATED SALES AND REVENUES
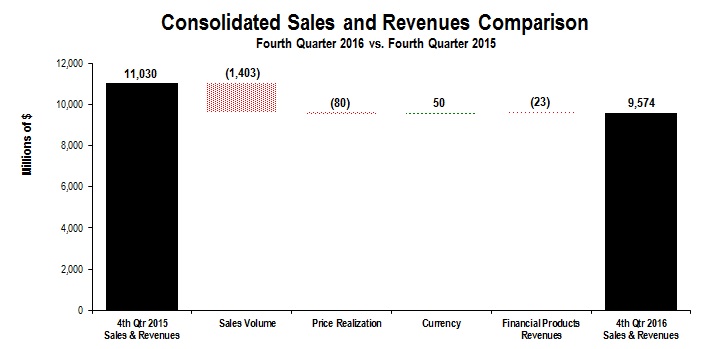
The chart above graphically illustrates reasons for the change in Consolidated Sales and Revenues between the fourth quarter of
2015
(at left) and the fourth quarter of
2016
(at right). Items favorably impacting sales and revenues appear as upward stair steps with the corresponding dollar amounts above each bar, while items negatively impacting sales and revenues appear as downward stair steps with dollar amounts reflected in parentheses above each bar. Caterpillar management utilizes these charts internally to visually communicate with the company's Board of Directors and employees.
Total sales and revenues were $9.574 billion in the fourth quarter of 2016, a decline of $1.456 billion, or 13 percent, compared with $11.030 billion in the fourth quarter of 2015. The decrease was almost entirely due to lower sales volume, resulting from lower end-user demand attributable to continued weak commodity prices globally and economic weakness in many countries. Although some commodity prices improved in the fourth quarter of 2016, the improvement was too recent to significantly impact our sales for the quarter. Sales for new equipment declined, while aftermarket parts sales were about flat. The unfavorable impact of price realization also contributed to the decline.
Sales declined in all regions except Asia/Pacific. In EAME, sales declined 30 percent primarily in Africa/Middle East due to weak economic conditions resulting from the continuing impact of low oil prices and an uncertain investment environment. In North America, sales decreased 15 percent primarily due to lower end-user demand for equipment used for infrastructure, the impact of continued low oil prices and an uncertain economic environment. Sales decreased 16 percent in Latin America primarily due to continued widespread economic weakness and inflation across the region. Asia/Pacific sales increased 10 percent primarily due to increased infrastructure and residential investment in China.
Energy & Transportation’s sales declined 15 percent largely due to lower end-user demand for most applications. Resource Industries’ sales declined 23 percent mostly due to continued low end-user demand. Construction Industries’ sales decreased 8 percent primarily due to lower demand from end users, partially offset by favorable changes in dealer inventories. Financial Products’ segment revenues were about flat with the fourth quarter of 2015.
33
CONSOLIDATED OPERATING PROFIT / (LOSS)
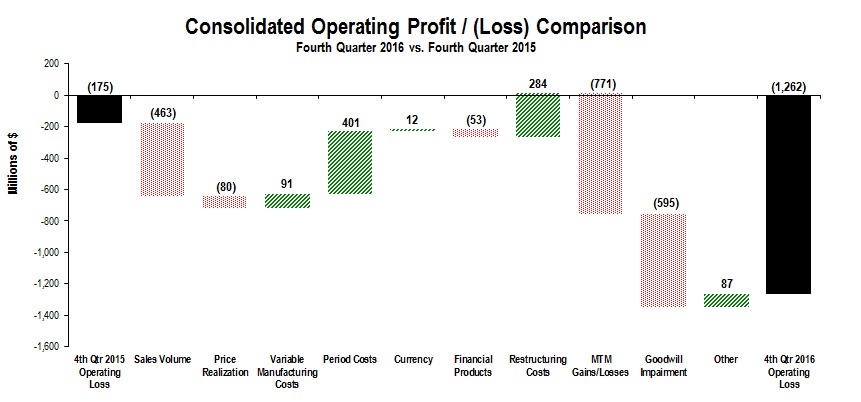
The chart above graphically illustrates reasons for the change in Consolidated Operating Profit (Loss) between the fourth quarter of
2015
(at left) and the fourth quarter of
2016
(at right). Items favorably impacting operating profit
appear as upward stair steps with the corresponding dollar amounts above each bar, while items negatively impacting operating profit appear as downward stair steps with dollar amounts reflected in parentheses above each bar. Caterpillar management utilizes these charts internally to visually communicate with the company's Board of Directors and employees. The bar entitled Other includes consolidating adjustments and Machinery, Energy & Transportation other operating (income) expenses.
Operating loss for the fourth quarter of 2016 was $1.262 billion, compared with a loss of $175 million in the fourth quarter of 2015, an unfavorable change of $1.087 billion. The most significant items were the unfavorable impact from mark-to-market losses related to pension and OPEB plans and a goodwill impairment charge in Resource Industries. Excluding these items, operating profit improved $279 million compared to the fourth quarter of 2015. The improvement was mostly due to lower period costs, a decrease in restructuring costs and favorable variable manufacturing costs, partially offset by lower sales volume. The unfavorable price realization resulted from competitive market conditions, primarily in Resource Industries.
Period costs were lower primarily due to substantial restructuring and cost reduction actions over the past year. The reductions impacted period manufacturing costs, selling, general and administrative expenses and research and development expenses about equally. Variable manufacturing costs were favorable mostly due to the impact of cost absorption as inventory decreased more significantly in the fourth quarter of 2015, compared to the fourth quarter of 2016.
Restructuring costs of $395 million in the fourth quarter of 2016 were related to restructuring programs across the company. In the fourth quarter of 2015, restructuring costs were $679 million, primarily related to a reduction in workforce.
Other Profit/Loss Items
|
▪
|
Other income/expense
in the fourth quarter of 2016 was income of $34 million, compared with income of $54 million in the fourth quarter of 2015. The unfavorable change was primarily due to lower gains from the sales of securities in the fourth quarter of 2016, compared to the fourth quarter of 2015, and the impact from currency
translation and hedging gains and losses. The unfavorable change in currency translation and hedging gains and losses was due to higher net losses in the fourth quarter of 2016, compared to the fourth quarter of 2015.
|
|
▪
|
The
provision for income taxes
in the fourth quarter reflects an annual effective tax rate of 36.4 percent compared to 25.5 percent for the full-year 2015, excluding the items discussed below. The effective tax rate related to 2016 full-year adjusted profit before tax is 26 percent.
|
The provision for income taxes for the fourth quarter of 2016 also includes a $170 million charge related to the change from the third-quarter estimated annual tax rate of 25 percent. The increase is primarily due to the negative impact from the portion of the Surface Mining & Technology goodwill impairment not deductible for tax purposes offsetting benefits related to the majority of pension and OPEB mark-to-market losses taxed at higher U.S. rates. In addition, the provision for income taxes for 2016 also includes a $141 million non-cash charge for increases in the valuation allowance for U.S. state deferred tax
34
assets due to recent U.S. GAAP losses expected to recur in 2017 in certain state jurisdictions and the weight given this negative objective evidence under income tax accounting guidance. The provision for income taxes for the fourth quarter of 2015 also included a benefit of $92 million related to the decrease from the third-quarter estimated annual tax rate, primarily due to the renewal in the fourth quarter of the U.S. research and development tax credit for 2015.
Segment Information
|
Sales and Revenues by Geographic Region
|
||||||||||||||||||||||||||||||||||
|
(Millions of dollars)
|
Total
|
%
Change
|
North
America
|
%
Change
|
Latin
America
|
%
Change
|
EAME
|
%
Change
|
Asia/
Pacific
|
%
Change
|
||||||||||||||||||||||||
|
Fourth Quarter 2016
|
|
|
|
|
|
|
|
|
|
|
|
|
|
|
|
|
|
|
|
|
||||||||||||||
|
Construction Industries
1
|
$
|
3,589
|
|
(8
|
)%
|
$
|
1,569
|
|
(16
|
)%
|
$
|
264
|
|
(11
|
)%
|
$
|
624
|
|
(34
|
)%
|
$
|
1,132
|
|
41
|
%
|
|||||||||
|
Resource Industries
2
|
1,443
|
|
(23
|
)%
|
471
|
|
(24
|
)%
|
221
|
|
(21
|
)%
|
297
|
|
(35
|
)%
|
454
|
|
(14
|
)%
|
||||||||||||||
|
Energy & Transportation
3
|
3,849
|
|
(15
|
)%
|
1,722
|
|
(11
|
)%
|
347
|
|
(16
|
)%
|
1,063
|
|
(26
|
)%
|
717
|
|
(5
|
)%
|
||||||||||||||
|
All Other Segments
4
|
32
|
|
(14
|
)%
|
11
|
|
(35
|
)%
|
—
|
|
(100
|
)%
|
5
|
|
(17
|
)%
|
16
|
|
23
|
%
|
||||||||||||||
|
Corporate Items and Eliminations
|
(28
|
)
|
—
|
|
(23
|
)
|
(2
|
)
|
(2
|
)
|
(1
|
)
|
||||||||||||||||||||||
|
Machinery, Energy & Transportation Sales
|
8,885
|
|
(14
|
)%
|
3,750
|
|
(15
|
)%
|
830
|
|
(16
|
)%
|
1,987
|
|
(30
|
)%
|
2,318
|
|
10
|
%
|
||||||||||||||
|
Financial Products Segment
|
742
|
|
(1
|
)%
|
464
|
|
3
|
%
|
83
|
|
(14
|
)%
|
99
|
|
2
|
%
|
96
|
|
(4
|
)%
|
||||||||||||||
|
Corporate Items and Eliminations
|
(53
|
)
|
(29
|
)
|
(9
|
)
|
(4
|
)
|
(11
|
)
|
||||||||||||||||||||||||
|
Financial Products Revenues
|
689
|
|
(3
|
)%
|
435
|
|
(2
|
)%
|
74
|
|
(12
|
)%
|
95
|
|
3
|
%
|
85
|
|
(6
|
)%
|
||||||||||||||
|
Consolidated Sales and Revenues
|
$
|
9,574
|
|
(13
|
)%
|
$
|
4,185
|
|
(14
|
)%
|
$
|
904
|
|
(16
|
)%
|
$
|
2,082
|
|
(29
|
)%
|
$
|
2,403
|
|
10
|
%
|
|||||||||
|
Fourth Quarter 2015
|
|
|
|
|
|
|
|
|
|
|
|
|
|
|
|
|
|
|
|
|
||||||||||||||
|
Construction Industries
1
|
$
|
3,905
|
|
$
|
1,863
|
|
$
|
298
|
|
$
|
942
|
|
$
|
802
|
|
|
|
|||||||||||||||||
|
Resource Industries
2
|
1,878
|
|
616
|
|
280
|
|
454
|
|
528
|
|
|
|
||||||||||||||||||||||
|
Energy & Transportation
3
|
4,544
|
|
1,944
|
|
411
|
|
1,431
|
|
758
|
|
|
|
||||||||||||||||||||||
|
All Other Segments
4
|
37
|
|
17
|
|
1
|
|
6
|
|
13
|
|
|
|
||||||||||||||||||||||
|
Corporate Items and Eliminations
|
(46
|
)
|
(47
|
)
|
—
|
|
—
|
|
1
|
|
||||||||||||||||||||||||
|
Machinery, Energy & Transportation Sales
|
10,318
|
|
|
|
4,393
|
|
|
|
990
|
|
|
|
2,833
|
|
|
|
2,102
|
|
|
|
||||||||||||||
|
Financial Products Segment
|
746
|
|
452
|
|
97
|
|
97
|
|
100
|
|
|
|
||||||||||||||||||||||
|
Corporate Items and Eliminations
|
(34
|
)
|
(6
|
)
|
(13
|
)
|
(5
|
)
|
(10
|
)
|
|
|
||||||||||||||||||||||
|
Financial Products Revenues
|
712
|
|
|
|
446
|
|
|
|
84
|
|
|
|
92
|
|
|
|
90
|
|
|
|
||||||||||||||
|
Consolidated Sales and Revenues
|
$
|
11,030
|
|
|
|
$
|
4,839
|
|
|
|
$
|
1,074
|
|
|
|
$
|
2,925
|
|
|
|
$
|
2,192
|
|
|
|
|||||||||
|
1
|
Does not include inter-segment sales of $31 million and $43 million in the fourth quarter
2016
and
2015
, respectively.
|
|
2
|
Does not include inter-segment sales of $87 million and $82 million in the fourth quarter
2016
and
2015
, respectively.
|
|
3
|
Does not include inter-segment sales of $621 million and $615 million in the fourth quarter
2016
and
2015
, respectively.
|
|
4
|
Does not include inter-segment sales of $117 million and $99 million in the fourth quarter
2016
and
2015
, respectively.
|
35
|
Sales and Revenues by Segment
|
||||||||||||||||||||||||||||||
|
(Millions of dollars)
|
Fourth Quarter 2015
|
Sales
Volume
|
Price
Realization
|
Currency
|
Other
|
Fourth Quarter 2016
|
$
Change
|
%
Change
|
||||||||||||||||||||||
|
Construction Industries
|
$
|
3,905
|
|
$
|
(363
|
)
|
$
|
1
|
|
$
|
46
|
|
$
|
—
|
|
$
|
3,589
|
|
$
|
(316
|
)
|
(8
|
)%
|
|||||||
|
Resource Industries
|
1,878
|
|
(388
|
)
|
(62
|
)
|
15
|
|
—
|
|
1,443
|
|
(435
|
)
|
(23
|
)%
|
||||||||||||||
|
Energy & Transportation
|
4,544
|
|
(663
|
)
|
(21
|
)
|
(11
|
)
|
—
|
|
3,849
|
|
(695
|
)
|
(15
|
)%
|
||||||||||||||
|
All Other Segments
|
37
|
|
(5
|
)
|
—
|
|
—
|
|
—
|
|
32
|
|
(5
|
)
|
(14
|
)%
|
||||||||||||||
|
Corporate Items and Eliminations
|
(46
|
)
|
16
|
|
2
|
|
—
|
|
—
|
|
(28
|
)
|
18
|
|
|
|
||||||||||||||
|
Machinery, Energy & Transportation Sales
|
10,318
|
|
(1,403
|
)
|
(80
|
)
|
50
|
|
—
|
|
8,885
|
|
(1,433
|
)
|
(14
|
)%
|
||||||||||||||
|
Financial Products Segment
|
746
|
|
—
|
|
—
|
|
—
|
|
(4
|
)
|
742
|
|
(4
|
)
|
(1
|
)%
|
||||||||||||||
|
Corporate Items and Eliminations
|
(34
|
)
|
—
|
|
—
|
|
—
|
|
(19
|
)
|
(53
|
)
|
(19
|
)
|
|
|
||||||||||||||
|
Financial Products Revenues
|
712
|
|
—
|
|
—
|
|
—
|
|
(23
|
)
|
689
|
|
(23
|
)
|
(3
|
)%
|
||||||||||||||
|
Consolidated Sales and Revenues
|
$
|
11,030
|
|
$
|
(1,403
|
)
|
$
|
(80
|
)
|
$
|
50
|
|
$
|
(23
|
)
|
$
|
9,574
|
|
$
|
(1,456
|
)
|
(13
|
)%
|
|||||||
|
Operating Profit (Loss) by Segment
|
||||||||||||||
|
(Millions of dollars)
|
Fourth Quarter 2016
|
Fourth Quarter 2015
|
$
Change
|
%
Change
|
||||||||||
|
Construction Industries
|
$
|
334
|
|
$
|
178
|
|
$
|
156
|
|
88
|
%
|
|||
|
Resource Industries
|
(711
|
)
|
(80
|
)
|
(631
|
)
|
(789
|
)%
|
||||||
|
Energy & Transportation
|
638
|
|
741
|
|
(103
|
)
|
(14
|
)%
|
||||||
|
All Other Segments
|
(34
|
)
|
(39
|
)
|
5
|
|
13
|
%
|
||||||
|
Corporate Items and Eliminations
|
(1,572
|
)
|
(1,088
|
)
|
(484
|
)
|
|
|
||||||
|
Machinery, Energy & Transportation
|
(1,345
|
)
|
(288
|
)
|
(1,057
|
)
|
(367
|
)%
|
||||||
|
Financial Products Segment
|
149
|
|
191
|
|
(42
|
)
|
(22
|
)%
|
||||||
|
Corporate Items and Eliminations
|
(9
|
)
|
(15
|
)
|
6
|
|
|
|
||||||
|
Financial Products
|
140
|
|
176
|
|
(36
|
)
|
(20
|
)%
|
||||||
|
Consolidating Adjustments
|
(57
|
)
|
(63
|
)
|
6
|
|
|
|
||||||
|
Consolidated Operating Profit (Loss)
|
$
|
(1,262
|
)
|
$
|
(175
|
)
|
$
|
(1,087
|
)
|
(621
|
)%
|
|||
Construction Industries
Construction Industries’ sales were $3.589 billion in the fourth quarter of 2016, a decrease of $316 million, or 8 percent, from the fourth quarter of 2015. The decrease was mostly due to lower volume. Sales declined for new equipment and were about flat for aftermarket parts.
|
▪
|
Sales volume declined primarily due to lower end-user demand, partially offset by a smaller decline in dealer inventories in the fourth quarter of 2016, compared with the fourth quarter of 2015.
|
Sales decreased in EAME, North America and Latin America and increased in Asia/Pacific.
|
▪
|
Sales in EAME decreased primarily due to lower end-user demand. The sales decline was primarily in oil-producing economies in Africa/Middle East due to continued low oil prices and an uncertain investment environment.
|
|
▪
|
In North America, the sales decline was primarily due to lower end-user demand. Although residential and non-residential building construction activity improved, we believe demand for new construction equipment has remained low due to end users’ utilization of existing used equipment.
|
|
▪
|
In Latin America, sales decreased slightly as lower end-user demand, attributable to weak economic conditions across the region, was partially offset by favorable changes in dealer inventories. Dealers reduced inventories more significantly in the fourth quarter of 2015 than in the fourth quarter of 2016.
|
|
▪
|
Sales in Asia/Pacific were higher as a result of an increase in end-user demand primarily in China stemming from increased government support for infrastructure and residential investment. In addition, changes in Asia/Pacific dealer inventories were
|
36
favorable as dealers increased inventories in the fourth quarter of 2016, compared with a decrease in the fourth quarter of 2015.
Construction Industries’ profit was $334 million in the fourth quarter of 2016, compared with $178 million in the fourth quarter of 2015. The increase in profit was primarily due to lower period costs and the absence of an unfavorable impact from litigation in the fourth quarter of 2015, partially offset by lower sales volume, which includes a favorable mix of products. The lower period costs were mostly a result of the favorable impact of restructuring and cost reduction actions.
Resource Industries
Resource Industries’ sales were $1.443 billion in the fourth quarter of 2016, a decrease of $435 million, or 23 percent, from the fourth quarter of 2015. The decline was primarily due to lower sales volume and the unfavorable impact of price realization resulting from competitive market conditions. Sales of new equipment decreased while sales of aftermarket parts increased slightly. Aftermarket parts sales have increased sequentially in each of the last three quarters.
The sales decrease was primarily due to lower end-user demand across all regions. While most commodity prices were higher in the fourth quarter of 2016 than in the fourth quarter of 2015, current prices have not been sufficient to drive much increase in short-term demand for new equipment. We believe commodity prices now need to stabilize for a longer period of time to positively impact our sales. Mining customers continued to focus on improving productivity in existing mines and reducing their total capital expenditures, as they have for several years. In addition, sales of heavy construction equipment are lower, primarily in North America.
Resource Industries incurred a loss of $711 million in the fourth quarter of 2016, compared with a loss of $80 million in the fourth quarter of 2015. The most significant item impacting the fourth quarter of 2016 was a goodwill impairment charge of $595 million related to the Surface Mining & Technology reporting unit. Excluding the impairment charge, the fourth quarter of 2016 operating loss was unfavorable $36 million, compared with the fourth quarter of 2015. The unfavorable change was due to lower sales volume and unfavorable price realization, mostly offset by the favorable impact of restructuring and cost reduction actions.
Energy & Transportation
Energy & Transportation’s sales were $3.849 billion in the fourth quarter of 2016, a decrease of $695 million, or 15 percent, from the fourth quarter of 2015. The decrease was primarily the result of lower sales volume.
|
▪
|
Transportation
- Sales decreased in North America, Asia/Pacific and EAME primarily due to continued weakness in the rail industry, with the most significant decline in North America. The North American rail industry continues to be depressed with a significant number of idle locomotives that impacted demand for rail services and aftermarket. The decline in Asia/Pacific was mostly due to lower demand for equipment used in marine applications, primarily for work boats. Sales in Latin America were about flat.
|
|
▪
|
Oil and Gas
- Sales decreased in much of the world due to the impact from low oil prices. The sales decline was primarily related to lower demand across all regions for equipment used for production, partially offset by increased demand for turbines used for gas compression.
|
|
▪
|
Power Generation
- Sales decreased in EAME and were about flat in all other regions. The decline in EAME was primarily a result of continued weakness in the Middle East with continued low oil prices limiting investments.
|
|
▪
|
Industrial
- Sales were about flat as an increase in Asia/Pacific was mostly offset by a decrease in EAME, both attributable to changes in end-user demand for most industrial applications.
|
Energy & Transportation’s profit was $638 million in the fourth quarter of 2016, compared with $741 million in the fourth quarter of 2015. The decline was primarily due to a decrease in sales volume, partially offset by the impact of restructuring and cost reduction actions and a favorable impact of cost absorption as inventory decreased more significantly in the fourth quarter of 2015 than the fourth quarter of 2016.
Financial Products Segment
Financial Products’ revenues were $742 million in the fourth quarter of 2016, a decrease of $4 million, or 1 percent, from the fourth quarter of 2015. The decline was primarily due to lower average earning assets in North America and Latin America, an unfavorable impact from returned or repossessed equipment primarily in North America and lower average financing rates in Latin America. These decreases were partially offset by higher average financing rates in North America.
37
Financial Products’ profit was $149 million in the fourth quarter of 2016, compared with $191 million in the fourth quarter of 2015. The decrease was primarily due to lower gains on sales of securities at Insurance Services and an unfavorable impact from returned or repossessed equipment.
Corporate Items and Eliminations
Expense for corporate items and eliminations was $1.581 billion in the fourth quarter of 2016, an increase of $478 million from the fourth quarter of 2015. Corporate items and eliminations include: corporate-level expenses; restructuring costs; timing differences, as some expenses are reported in segment profit on a cash basis; retirement benefit costs other than service cost; currency differences for ME&T, as segment profit is reported using annual fixed exchange rates; cost of sales methodology differences as segments use a current cost methodology; and inter-segment eliminations.
The increase was due to the unfavorable impact of higher mark-to-market losses related to our pension and OPEB plans. Mark-to-market losses in the fourth quarter of 2016 were $985 million, compared to mark-to-market losses of $214 million in the fourth quarter of 2015. This was partially offset by a decrease in restructuring costs of $284 million compared to the fourth quarter of 2015.
38
2015
COMPARED WITH
2014
CONSOLIDATED SALES AND REVENUES
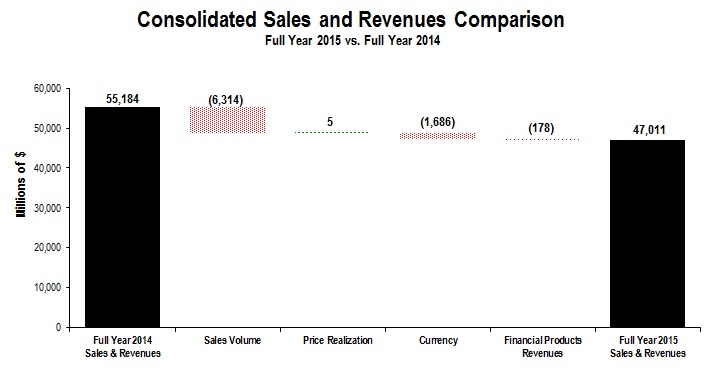
The chart above graphically illustrates reasons for the change in Consolidated Sales and Revenues between
2014
(at left) and
2015
(at right). Items favorably impacting sales and revenues appear as upward stair steps with the corresponding dollar amounts above each bar, while items negatively impacting sales and revenues appear as downward stair steps with dollar amounts reflected in parentheses above each bar. Caterpillar management utilizes these charts internally to visually communicate with the company's Board of Directors and employees.
Total sales and revenues were $47.011 billion in 2015, down $8.173 billion, or 15 percent, from 2014. The decrease was largely due to lower sales volume, primarily in Energy & Transportation and Construction Industries. Sales volume was also lower in Resource Industries. Currency had an unfavorable impact of $1.7 billion due to continued strengthening of the U.S. dollar against most currencies, with the largest impact from the euro. While sales for both new equipment and aftermarket parts declined in Energy & Transportation, Construction Industries and Resource Industries, most of the decrease was for new equipment. Financial Products’ revenues declined $178 million.
While price realization was about flat from 2014 to 2015, it was positive in the first half of 2015 and negative over the second half of 2015.
The two most significant reasons for the decline in sales and revenues from 2014 were weakening economic growth and substantially lower commodity prices. The impact of weak economic growth was most pronounced in developing countries, such as China and Brazil. Lower oil prices had a substantial negative impact on the portion of Energy & Transportation that supports oil drilling and well servicing, where new order rates in 2015 were down close to 90 percent from 2014.
The impact of changes in dealer machine and engine inventories was about flat. In total, dealer inventories decreased about $1 billion in both 2015 and 2014. Dealers are independent, and there could be many reasons for changes in their inventory levels. In general, dealers adjust inventory based on their expectations of future demand and product delivery times. Dealers’ demand expectations take into account seasonal changes, macroeconomic conditions and other factors. Delivery times can vary based on availability of product from Caterpillar factories and product distribution centers.
Sales declined in all regions. Sales in North America declined 11 percent, primarily in Energy & Transportation with the most significant decrease in rail applications. Sales also declined in Resource Industries and Construction Industries. In Asia/Pacific, sales declined 19 percent, primarily due to lower end-user demand for construction and mining equipment and oil and gas applications. The impact of currency was also unfavorable, as our sales in Japanese yen and Australian dollars translated into fewer U.S. dollars. In EAME, sales declined 14 percent, primarily due to the unfavorable impact of currency, as our sales in euros translated into fewer U.S. dollars. The remaining sales decline is primarily due to lower sales in Russia as a recession slowed demand and the absence of a large power generation project that occurred in 2014. Latin America sales decreased 28 percent due
39
to lower end-user demand, mostly for construction equipment. The decline was due to continued widespread economic weakness across the region with the most significant decline in Brazil due to continued weak construction activity resulting from depressed economic conditions.
By segment, sales decreased in Energy & Transportation, Construction Industries and Resource Industries. Energy & Transportation’s sales declined 17 percent with much of the decline a result of low oil prices. Construction Industries’ sales declined 14 percent, primarily due to lower end-user demand and the unfavorable impact of currency. Resource Industries’ sales declined 15 percent, primarily due to weaker demand for mining products, partially offset by the favorable impact of changes in dealer inventories, as dealer inventories decreased more in 2014 than in 2015. Financial Products' segment revenues decreased 7 percent, primarily due to lower average earning assets and lower average financing rates.
CONSOLIDATED OPERATING PROFIT
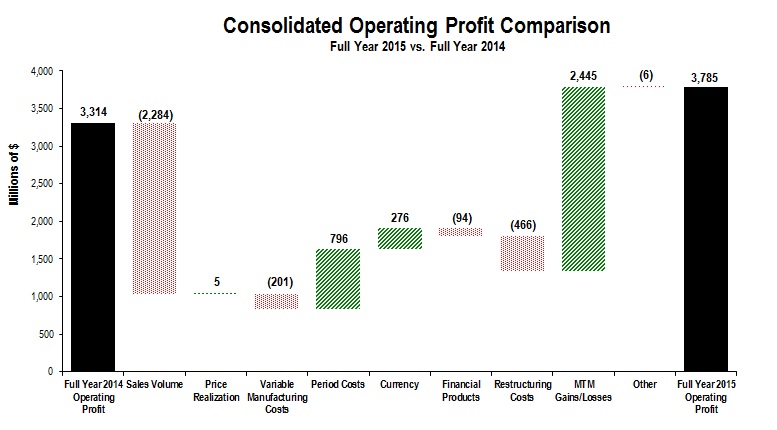
The chart above graphically illustrates reasons for the change in Consolidated Operating Profit between
2014
(at left) and
2015
(at right). Items favorably impacting operating profit appear as upward stair steps with the corresponding dollar amounts above each bar, while items negatively impacting operating profit appear as downward stair steps with dollar amounts reflected in parentheses above each bar. Caterpillar management utilizes these charts internally to visually communicate with the company's Board of Directors and employees. The bar entitled Other includes consolidating adjustments and Machinery, Energy & Transportation other operating (income) expenses.
Operating profit for 2015 was $3.785 billion, an increase of $471 million from 2014. The most significant item was the favorable impact of lower net mark-to-market losses related to our pension and OPEB plans. Remaining was a decline of $1.974 billion which was primarily the result of lower sales volume, higher restructuring costs and higher variable manufacturing costs, partially offset by lower period costs and the favorable impact of currency.
Restructuring costs of $898 million in 2015, included in corporate items, were primarily related to a reduction in workforce across the company. In 2014, restructuring costs were $432 million, primarily related to a workforce reduction at the Gosselies, Belgium, facility and other actions across the company. Our restructuring activities continued in 2015 as part of our efforts to optimize our cost structure and improve the efficiency of our operations.
Variable manufacturing costs were higher primarily due to the unfavorable impact of cost absorption as there was a more significant inventory decline in 2015 than 2014, and manufacturing inefficiencies driven by costs decreasing at a lower rate than production volume. These costs were partially offset by improved material costs due to declines in commodity prices and a focus on reducing the cost of components in our products.
Period costs were lower primarily due to lower incentive compensation expense, slightly offset by higher spending for new product introductions.
40
The favorable impact of currency was primarily due to the strengthening of the U.S. dollar in relation to the Japanese yen and British pound, as we are a net exporter from Japan and the United Kingdom.
Short-term incentive compensation expense related to 2015 was about $585 million compared to about $1.3 billion of short-term incentive compensation expense related to 2014. Short-term incentive compensation expense is directly related to financial and operational performance measured against targets set annually.
Other Profit/Loss Items
Other income/expense
was income of $161 million in 2015, compared with income of $322 million in 2014. The change was primarily due to the unfavorable net impact of currency translation and hedging gains and losses, partially offset by a gain of $120 million on the sale of the remaining 35 percent interest in our former third party logistics business. Translation and hedging losses in 2015 totaled $173 million primarily due to the Brazilian real and Japanese yen. In 2014, translation and hedging gains were $137 million primarily due to the euro.
The
provision for income taxes
for 2015 reflects an effective tax rate of 25.5 percent compared with 23.4 percent for 2014, excluding the items discussed below. The increase is primarily due to a less favorable geographic mix of profits from a tax perspective in 2015 as lower mark-to-market losses related to our pension and OPEB plans were partially offset by higher restructuring costs, both primarily at higher U.S. tax rates.
The provision for income taxes for 2015 also includes a $42 million net charge to increase unrecognized tax benefits by $68 million partially offset by a benefit of $26 million to record U.S. refund claims related to prior tax years currently under examination. Our consideration of decisions by the U.S. Court of Appeals for the Second Circuit in 2015 involving other taxpayers caused us to increase our unrecognized tax benefits related to foreign tax credits that arose as a result of certain financings.
The 2014 tax provision also included a benefit of $23 million for the release of a valuation allowance against the deferred tax assets of a non-U.S. subsidiary and a net benefit of $21 million to adjust prior years’ U.S. taxes and interest.
41
Segment Information
|
Sales and Revenues by Geographic Region
|
|||||||||||||||||||||||||||||||||||
|
(Millions of dollars)
|
Total
|
%
Change
|
North
America
|
%
Change
|
Latin
America
|
%
Change
|
EAME
|
%
Change
|
Asia/
Pacific
|
%
Change
|
|||||||||||||||||||||||||
|
2015
|
|
|
|
|
|
|
|
|
|
|
|
|
|
|
|
|
|
|
|
|
|||||||||||||||
|
Construction Industries
1
|
$
|
17,797
|
|
(14
|
)%
|
$
|
9,006
|
|
(2
|
)%
|
$
|
1,546
|
|
(41
|
)%
|
$
|
3,930
|
|
(12
|
)%
|
$
|
3,315
|
|
(24
|
)%
|
||||||||||
|
Resource Industries
2
|
7,739
|
|
(15
|
)%
|
2,953
|
|
(12
|
)%
|
1,231
|
|
(20
|
)%
|
1,769
|
|
(18
|
)%
|
1,786
|
|
(15
|
)%
|
|||||||||||||||
|
Energy & Transportation
3
|
18,519
|
|
(17
|
)%
|
8,204
|
|
(18
|
)%
|
1,651
|
|
(17
|
)%
|
5,365
|
|
(16
|
)%
|
3,299
|
|
(15
|
)%
|
|||||||||||||||
|
All Other Segments
4
|
203
|
|
(14
|
)%
|
79
|
|
(13
|
)%
|
14
|
|
(56
|
)%
|
52
|
|
16
|
%
|
58
|
|
(15
|
)%
|
|||||||||||||||
|
Corporate Items and Eliminations
|
(111
|
)
|
(118
|
)
|
2
|
|
—
|
|
5
|
|
|||||||||||||||||||||||||
|
Machinery, Energy & Transportation Sales
|
44,147
|
|
(15
|
)%
|
20,124
|
|
(11
|
)%
|
4,444
|
|
(28
|
)%
|
11,116
|
|
(14
|
)%
|
8,463
|
|
(19
|
)%
|
|||||||||||||||
|
Financial Products Segment
|
3,078
|
|
(7
|
)%
|
1,812
|
|
2
|
%
|
400
|
|
(15
|
)%
|
408
|
|
(17
|
)%
|
458
|
|
(20
|
)%
|
|||||||||||||||
|
Corporate Items and Eliminations
|
(214
|
)
|
(111
|
)
|
(42
|
)
|
(22
|
)
|
(39
|
)
|
|||||||||||||||||||||||||
|
Financial Products Revenues
|
2,864
|
|
(6
|
)%
|
1,701
|
|
4
|
%
|
358
|
|
(14
|
)%
|
386
|
|
(18
|
)%
|
419
|
|
(19
|
)%
|
|||||||||||||||
|
Consolidated Sales and Revenues
|
$
|
47,011
|
|
(15
|
)%
|
$
|
21,825
|
|
(10
|
)%
|
$
|
4,802
|
|
(27
|
)%
|
$
|
11,502
|
|
(15
|
)%
|
$
|
8,882
|
|
(19
|
)%
|
||||||||||
|
2014
|
|
|
|
|
|
|
|
|
|
|
|
|
|
|
|
|
|
|
|||||||||||||||||
|
Construction Industries
1
|
$
|
20,590
|
|
$
|
9,158
|
|
$
|
2,632
|
|
$
|
4,449
|
|
$
|
4,351
|
|
|
|
||||||||||||||||||
|
Resource Industries
2
|
9,134
|
|
3,342
|
|
1,531
|
|
2,153
|
|
2,108
|
|
|
|
|||||||||||||||||||||||
|
Energy & Transportation
3
|
22,306
|
|
10,058
|
|
1,978
|
|
6,378
|
|
3,892
|
|
|
|
|||||||||||||||||||||||
|
All Other Segments
4
|
236
|
|
91
|
|
32
|
|
45
|
|
68
|
|
|
|
|||||||||||||||||||||||
|
Corporate Items and Eliminations
|
(124
|
)
|
(90
|
)
|
(1
|
)
|
(34
|
)
|
1
|
|
|||||||||||||||||||||||||
|
Machinery, Energy & Transportation Sales
|
52,142
|
|
|
|
22,559
|
|
|
|
6,172
|
|
|
|
12,991
|
|
|
|
10,420
|
|
|
|
|||||||||||||||
|
Financial Products Segment
|
3,313
|
|
1,782
|
|
468
|
|
494
|
|
569
|
|
|
|
|||||||||||||||||||||||
|
Corporate Items and Eliminations
|
(271
|
)
|
(145
|
)
|
(51
|
)
|
(26
|
)
|
(49
|
)
|
|
|
|||||||||||||||||||||||
|
Financial Products Revenues
|
3,042
|
|
|
|
1,637
|
|
|
|
417
|
|
|
|
468
|
|
|
|
520
|
|
|
|
|||||||||||||||
|
Consolidated Sales and Revenues
|
$
|
55,184
|
|
|
|
$
|
24,196
|
|
|
|
$
|
6,589
|
|
|
|
$
|
13,459
|
|
|
|
$
|
10,940
|
|
|
|
||||||||||
|
1
|
Does not include inter-segment sales of $109 million and $124 million in
2015
and
2014
, respectively.
|
|
2
|
Does not include inter-segment sales of $332 million and $428 million in
2015
and
2014
, respectively.
|
|
3
|
Does not include inter-segment sales of $2,877 million and $3,386 million in
2015
and
2014
, respectively.
|
|
4
|
Does not include inter-segment sales of $390 million and $485 million in
2015
and
2014
, respectively.
|
42
|
Sales and Revenues by Segment
|
|||||||||||||||||||||||||||||||
|
(Millions of dollars)
|
2014
|
Sales
Volume
|
Price
Realization
|
Currency
|
Other
|
2015
|
$
Change
|
%
Change
|
|||||||||||||||||||||||
|
Construction Industries
|
$
|
20,590
|
|
$
|
(2,003
|
)
|
$
|
17
|
|
$
|
(807
|
)
|
$
|
—
|
|
$
|
17,797
|
|
$
|
(2,793
|
)
|
(14
|
)%
|
||||||||
|
Resource Industries
|
9,134
|
|
(1,133
|
)
|
(76
|
)
|
(186
|
)
|
—
|
|
7,739
|
|
(1,395
|
)
|
(15
|
)%
|
|||||||||||||||
|
Energy & Transportation
|
22,306
|
|
(3,166
|
)
|
63
|
|
(684
|
)
|
—
|
|
18,519
|
|
(3,787
|
)
|
(17
|
)%
|
|||||||||||||||
|
All Other Segments
|
236
|
|
(28
|
)
|
—
|
|
(5
|
)
|
—
|
|
203
|
|
(33
|
)
|
(14
|
)%
|
|||||||||||||||
|
Corporate Items and Eliminations
|
(124
|
)
|
16
|
|
1
|
|
(4
|
)
|
—
|
|
(111
|
)
|
13
|
|
|
|
|||||||||||||||
|
Machinery, Energy & Transportation Sales
|
52,142
|
|
(6,314
|
)
|
5
|
|
(1,686
|
)
|
—
|
|
44,147
|
|
(7,995
|
)
|
(15
|
)%
|
|||||||||||||||
|
Financial Products Segment
|
3,313
|
|
—
|
|
—
|
|
—
|
|
(235
|
)
|
3,078
|
|
(235
|
)
|
(7
|
)%
|
|||||||||||||||
|
Corporate Items and Eliminations
|
(271
|
)
|
—
|
|
—
|
|
—
|
|
57
|
|
(214
|
)
|
57
|
|
|
|
|||||||||||||||
|
Financial Products Revenues
|
3,042
|
|
—
|
|
—
|
|
—
|
|
(178
|
)
|
2,864
|
|
(178
|
)
|
(6
|
)%
|
|||||||||||||||
|
Consolidated Sales and Revenues
|
$
|
55,184
|
|
$
|
(6,314
|
)
|
$
|
5
|
|
$
|
(1,686
|
)
|
$
|
(178
|
)
|
$
|
47,011
|
|
$
|
(8,173
|
)
|
(15
|
)%
|
||||||||
|
Operating Profit (Loss) by Segment
|
|||||||||||||||
|
(Millions of dollars)
|
2015
|
2014
|
$ Change
|
% Change
|
|||||||||||
|
Construction Industries
|
$
|
1,865
|
|
$
|
2,133
|
|
$
|
(268
|
)
|
(13
|
)%
|
||||
|
Resource Industries
|
1
|
|
565
|
|
(564
|
)
|
(100
|
)%
|
|||||||
|
Energy & Transportation
|
3,390
|
|
4,287
|
|
(897
|
)
|
(21
|
)%
|
|||||||
|
All Other Segments
|
(75
|
)
|
19
|
|
(94
|
)
|
(495
|
)%
|
|||||||
|
Corporate Items and Eliminations
|
(1,911
|
)
|
(4,297
|
)
|
2,386
|
|
|
|
|||||||
|
Machinery, Energy & Transportation
|
3,270
|
|
2,707
|
|
563
|
|
21
|
%
|
|||||||
|
Financial Products Segment
|
809
|
|
901
|
|
(92
|
)
|
(10
|
)%
|
|||||||
|
Corporate Items and Eliminations
|
(35
|
)
|
(16
|
)
|
(19
|
)
|
|
|
|||||||
|
Financial Products
|
774
|
|
885
|
|
(111
|
)
|
(13
|
)%
|
|||||||
|
Consolidating Adjustments
|
(259
|
)
|
(278
|
)
|
19
|
|
|
|
|||||||
|
Consolidated Operating Profit
|
$
|
3,785
|
|
$
|
3,314
|
|
$
|
471
|
|
14
|
%
|
||||
Construction Industries
Construction Industries’ sales were $17.797 billion in 2015, a decrease of $2.793 billion, or 14 percent, from 2014. The sales decrease was due to lower sales volume and the unfavorable impact of currency. While sales for both new equipment and aftermarket parts declined, most of the decrease was for new equipment.
|
•
|
The decrease in sales volume was primarily due to lower deliveries to end users caused by widespread economic weakness primarily in developing countries.
|
|
•
|
The unfavorable currency impact was primarily from a weaker euro, Japanese yen and Brazilian real, as sales in these currencies translated into fewer U.S. dollars.
|
Sales decreased in all geographic regions.
|
•
|
In Asia/Pacific, the sales decline was primarily due to lower sales in China and Japan. In China, the lower sales resulted primarily from continued weak residential and nonresidential construction activity. Sales in Japan declined due to a weaker Japanese yen, as sales in yen translated into fewer U.S. dollars.
|
|
•
|
Decreases in Latin America were primarily related to lower demand due to continued weak construction activity with the most significant impact in Brazil. In addition, the absence of a large government order that occurred in 2014 and the unfavorable impact of a weaker Brazilian real contributed to the decline in sales in Brazil.
|
43
|
•
|
Sales declined in EAME primarily due to the unfavorable impact of currency, as sales in euros translated into fewer U.S. dollars.
|
|
•
|
In North America, the sales decline was due to both lower end-user demand and unfavorable changes in dealer inventory, as dealer inventories remained relatively flat in 2015 compared to an increase in 2014. Lack of investment in oil and gas-related construction activity and a decline in infrastructure spending were partially offset by stronger activity in residential and nonresidential building construction. We believe declines in construction activity related to oil and gas resulted in availability of existing construction equipment for other purposes.
|
Construction Industries’ profit was $1.865 billion in 2015, compared with $2.133 billion in 2014. The decrease in profit was primarily due to lower sales volume, partially offset by lower costs, and the favorable impact of currency. The decline in costs was primarily due to lower incentive compensation expense and improved material costs.
Resource Industries
Resource Industries’ sales were $7.739 billion in 2015, a decrease of $1.395 billion, or 15 percent, from 2014, primarily due to lower sales volume and the unfavorable impact of currency, mostly the euro and Australian dollar. Price realization was slightly unfavorable, resulting from a competitive pricing environment. Sales declined for both new equipment and aftermarket parts. We believe some mining companies were curtailing maintenance and rebuild activities.
Commodity prices were weak, and mining customers focused on improving productivity in existing mines and reducing their total capital expenditures as they did for the last several years. As a result, sales and new orders in Resource Industries weakened.
The sales volume decrease was partially offset by the favorable impact of changes in dealer inventories. As dealers reduced inventories in 2015, the reductions were less significant than in 2014.
Sales decreased in all geographic regions.
|
•
|
In EAME, the sales decline was primarily due to lower end-user demand and the unfavorable impact of currency due to a weaker euro, as sales in euro translated into fewer U.S. dollars. The decline was partially offset by the favorable impact of changes in dealer inventories. As dealers reduced inventories in 2015, the reductions were less significant than in 2014.
|
|
•
|
In North America, the sales decline was primarily due to lower end-user demand driven by lower sales of mining equipment partially offset by increases in sales of equipment used to support the quarry and aggregate industry and the favorable impact of changes in dealer inventories. As dealers reduced inventories in 2015, the reductions were less significant than in 2014.
|
|
•
|
Sales declined in Asia/Pacific primarily due to lower end-user demand and the unfavorable impact of currency, mostly due to the Australian dollar, as sales translated into fewer U.S. dollars, partially offset by the favorable impact of changes in dealer inventories. As dealers reduced inventories in 2015, the reductions were less significant than in 2014.
|
|
•
|
Decreases in Latin America were primarily related to continued weak mining activity and slightly unfavorable price realization resulting from a competitive pricing environment. The decline was partially offset by the favorable impact of changes in dealer inventories. As dealers reduced inventories in 2015, the reductions were less significant than in 2014.
|
Resource Industries’ profit was $1 million in 2015, compared with profit of $565 million in 2014. The decrease was primarily the result of lower sales volume, higher spending for new product introductions and unfavorable price realization, partially offset by improved material costs.
Energy & Transportation
Energy & Transportation’s sales were $18.519 billion in 2015, a decrease of $3.787 billion, or 17 percent, from 2014. The sales decrease was primarily due to lower sales volume and the unfavorable impact of currency, mainly from a weaker euro. Sales decreased in all geographic regions and across all applications.
|
•
|
Oil and Gas
- The sales decrease was driven by lower end-user demand as oil prices continued to decline. Sales decreased in all regions. In North America, sales were lower primarily due to a decline in end-user demand for reciprocating engines used in drilling, well servicing and gas compression applications. Sales declined in Asia/Pacific primarily from lower end-user demand for equipment used in drilling applications and the unfavorable impact of changes in dealer inventories as inventories decreased in 2015 and were about flat in 2014. In Latin America, sales were lower primarily due to the absence of a large project that occurred in 2014. Sales declined in EAME due to depressed oil prices and the unfavorable impact of currency, primarily from a weaker euro.
|
44
During the first half of 2015, sales remained at relatively high levels for equipment used in gas compression, well servicing and drilling because we started the year with a substantial order backlog. Sales declined during the second half of 2015 as orders from the backlog were shipped and new order levels were weak.
|
•
|
Transportation -
Sales decreased in North America and were about flat in all other geographic regions. In North America, sales into rail applications decreased primarily due to the absence of a Tier IV locomotive offering and lower sales of recyclable materials. The decline of recyclable materials was driven primarily by the year-over-year decrease in scrap prices and the lower volume of railcars available to scrap.
|
|
•
|
Power Generation
- Sales decreased in EAME and North America and were about flat in all other regions. In EAME, the sales decline was primarily due to lower end-user demand resulting from the absence of a large project that occurred in 2014, weak economic conditions and political instability in the region, and the negative impact of currency. Sales declined in North America mostly due to the absence of several large projects and unfavorable impact of changes in dealer inventories as inventories decreased in 2015 and were about flat in 2014.
|
|
•
|
Industrial
- Sales decreased in all regions except Latin America which was about flat. In EAME, sales decreased primarily due to lower end-user demand for engines used by original equipment manufacturers for agriculture and construction applications and the unfavorable impact of currency. In both Asia/Pacific and North America, lower demand for most industrial applications contributed to the sales decrease.
|
Energy & Transportation’s profit was $3.390 billion in 2015, compared with $4.287 billion in 2014. The decrease was primarily due to lower sales volume, which includes a favorable mix of products, partially offset by lower incentive compensation expense.
Variable manufacturing costs were about flat as improved material costs were about offset by the unfavorable impact of cost absorption and manufacturing inefficiencies driven by costs decreasing at a lower rate than production volume. The unfavorable impact of cost absorption resulted from a significant decrease in inventory in 2015, compared to an increase in inventory in 2014.
Period costs were favorable as lower incentive compensation expense was slightly offset by increases in program spending including for new product introductions.
Financial Products Segment
Financial Products’ revenues were $3.078 billion, a decrease of $235 million, or 7 percent, from 2014. The decline was primarily due to lower average earning assets and lower average financing rates. Average earning assets were down in Asia/Pacific, Latin America and EAME, partially offset by higher average earning assets in North America. Average financing rates decreased primarily in North America and EAME.
Financial Products’ profit was $809 million in 2015, compared with $901 million in 2014. The decrease was primarily due to a $68 million decrease in net yield on average earning assets reflecting changes in the geographic mix of margin and currency impacts and a $55 million unfavorable impact from lower average earning assets, partially offset by a $33 million decrease in the provision for credit losses at Cat Financial. The decrease in provision for credit losses at Cat Financial was primarily due to a favorable impact from changes in the allowance rate and a favorable impact from changes in portfolio balances, partially offset by an increase in write-offs, net of recoveries. The favorable impact from changes in the allowance rate was driven by changes in certain assumptions within the allowance for credit loss model. During 2015, as a result of management's review, the loss emergence period and loss given default assumptions were updated and resulted in a decrease to the allowance for credit losses of $66 million.
At the end of 2015, past dues at Cat Financial were 2.14 percent, compared with 2.17 percent at the end of 2014. Write-offs, net of recoveries, were $155 million for the full-year 2015, compared with $104 million for the full-year 2014. The increase in write-offs, net of recoveries, was primarily driven by the mining and marine portfolios.
As of December 31, 2015, Cat Financial's allowance for credit losses totaled $338 million, or 1.22 percent of net finance receivables, compared with $401 million, or 1.36 percent of net finance receivables, at year-end 2014.
Corporate Items and Eliminations
Expense for corporate items and eliminations was $1.946 billion in 2015, a decrease of $2.367 billion from 2014. Corporate items and eliminations include: corporate-level expenses; restructuring costs; timing differences, as some expenses are reported in segment profit on a cash basis; retirement benefit costs other than service cost; currency differences for ME&T, as segment profit is reported using annual fixed exchange rates, and inter-segment eliminations.
The most significant item was the favorable impact of net mark-to-market losses related to our pension and OPEB plans. Net mark-to-market losses in 2015 were $179 million compared to net mark-to-market losses of $2.624 billion in 2014. The remaining increase in expense in 2015 was primarily due to a $466 million increase in restructuring costs and an unfavorable impact from
45
methodology differences, partially offset by a favorable impact from timing differences and lower retirement benefits costs (excluding mark-to-market losses).
RESTRUCTURING COSTS
Restructuring costs for 2016, 2015 and 2014 were as follows:
|
(Millions of dollars)
|
2016
|
2015
|
2014
|
|||||||||
|
Employee separations
1
|
$
|
297
|
|
$
|
641
|
|
$
|
382
|
|
|||
|
Contract terminations
1
|
62
|
|
—
|
|
—
|
|
||||||
|
Long-lived asset impairments
1
|
391
|
|
127
|
|
48
|
|
||||||
|
Defined benefit retirement plan curtailment losses
1
|
7
|
|
82
|
|
2
|
|
||||||
|
Other
2
|
262
|
|
48
|
|
—
|
|
||||||
|
Total restructuring costs
|
$
|
1,019
|
|
$
|
898
|
|
$
|
432
|
|
|||
|
1
Recognized in Other operating (income) expenses.
|
||||||||||||
|
2
Represents costs related to our restructuring programs, primarily for inventory write-downs, accelerated depreciation, sales discounts, project management and equipment relocation and were recognized primarily in Cost of goods sold.
|
||||||||||||
The restructuring costs in 2016 were primarily related to actions in Resource Industries in response to continued weakness in the mining industry. In addition, costs resulted from our decision to discontinue production of on-highway vocational trucks and other restructuring actions across the company, most of which were related to our September 2015 announcement regarding significant restructuring and cost reduction actions to lower our operating costs in response to weak economic and business conditions in most of the industries we serve. The restructuring costs in 2015 were primarily related to several restructuring programs across the company. The restructuring costs in 2014 were primarily related to a reduction in workforce at our Gosselies, Belgium, facility.
Restructuring costs
are a reconciling item between Segment profit and Consolidated profit before taxes.
The following table summarizes the
2015
and
2016
employee separation activity:
|
(Millions of dollars)
|
|||
|
Liability balance at December 31, 2014
|
$
|
182
|
|
|
Increase in liability (separation charges)
|
641
|
|
|
|
Reduction in liability (payments)
|
(340
|
)
|
|
|
Liability balance at December 31, 2015
|
$
|
483
|
|
|
Increase in liability (separation charges)
|
297
|
|
|
|
Reduction in liability (payments)
|
(633
|
)
|
|
|
Liability balance at December 31, 2016
|
$
|
147
|
|
As part of our September 2015 announcement, we offered a voluntary retirement enhancement program to qualifying U.S. employees and various voluntary separation programs outside of the U.S. and implemented additional involuntary separation programs throughout the company. In 2016 and 2015, we incurred $100 million and $379 million of employee separation costs related to these programs, respectively. In addition, in 2015 we incurred $82 million of defined benefit retirement plan curtailment losses related to these programs. Substantially all of the employee separation costs related to this program were paid in 2016. We also incurred costs associated with the September 2015 announcement related to manufacturing facility consolidations and closures in 2016 and 2015 totaling $181 million and $108 million, respectively. The remaining liability balance as of
December 31, 2016
represents costs for other employee separation programs, most of which are expected to be paid in 2017.
In February 2016, we made the decision to discontinue production of on-highway vocational trucks within Energy & Transportation. Based on the business climate in the truck industry and a thorough evaluation of the business, the company decided it would withdraw from this market. We estimate restructuring costs incurred under the restructuring plan to be $110 million. In 2016, we recognized $104 million of restructuring costs primarily for long-lived asset impairments and sales discounts related to this restructuring plan. The remaining costs are expected to be recognized in 2017.
46
In the second half of 2016, we took additional restructuring actions in Resource Industries, including ending the production of track drills; pursuing strategic alternatives, including the possible divestiture of room and pillar products; consolidation of two product development divisions; and additional actions in response to ongoing weakness in the mining industry. We estimate restructuring costs incurred under these restructuring plans to be $385 million. For the year ended December 31, 2016, we incurred $369 million of restructuring costs related to these plans which included $164 million of long-lived asset impairments, $120 million of employee separation costs, $81 million of inventory write-downs and $4 million of other costs. The remaining costs are expected to be recognized in 2017.
In 2017, we expect to incur about $500 million of restructuring costs primarily related to ongoing manufacturing facility consolidations to lower our cost structure in response to weak economic conditions. No estimate of potential restructuring costs for contemplated actions at Gosselies, Belgium, or Aurora, Illinois, has been included. We are expecting about $450 million of cost reduction in 2017 from lower operating costs, primarily SG&A expenses and Cost of goods sold resulting from restructuring actions.
GLOSSARY OF TERMS
|
1.
|
All Other Segments
- Primarily includes activities such as: the business strategy, product management and development, and manufacturing of filters and fluids, undercarriage, tires and rims, ground engaging tools, fluid transfer products, precision seals and rubber, and sealing and connecting components primarily for Cat® products; parts distribution; distribution services responsible for dealer development and administration including a wholly owned dealer in Japan, dealer portfolio management and ensuring the most efficient and effective distribution of machines, engines and parts; digital investments for new customer and dealer solutions that integrate data analytics with state-of-the art digital technologies while transforming the buying experience.
|
|
2.
|
Consolidating Adjustments
- Elimination of transactions between Machinery, Energy & Transportation and Financial Products.
|
|
3.
|
Construction Industries
- A segment primarily responsible for supporting customers using machinery in infrastructure, forestry and building construction applications. Responsibilities include business strategy, product design, product management and development, manufacturing, marketing and sales and product support. The product portfolio includes backhoe loaders, small wheel loaders, small track-type tractors, skid steer loaders, multi-terrain loaders, mini excavators, compact wheel loaders, telehandlers, select work tools, small, medium and large track excavators, wheel excavators, medium wheel loaders, compact track loaders, medium track-type tractors, track-type loaders, motor graders, pipelayers, forestry and paving products and related parts.
|
|
4.
|
Currency
- With respect to sales and revenues, currency represents the translation impact on sales resulting from changes in foreign currency exchange rates versus the U.S. dollar. With respect to operating profit, currency represents the net translation impact on sales and operating costs resulting from changes in foreign currency exchange rates versus the U.S. dollar. Currency includes the impact on sales and operating profit for the Machinery, Energy & Transportation lines of business only; currency impacts on Financial Products’ revenues and operating profit are included in the Financial Products’ portions of the respective analyses. With respect to other income/expense, currency represents the effects of forward and option contracts entered into by the company to reduce the risk of fluctuations in exchange rates (hedging) and the net effect of changes in foreign currency exchange rates on our foreign currency assets and liabilities for consolidated results (translation).
|
|
5.
|
EAME
- A geographic region including Europe, Africa, the Middle East and the Commonwealth of Independent States (CIS).
|
|
6.
|
Earning Assets
- Assets consisting primarily of total finance receivables net of unearned income, plus equipment on operating leases, less accumulated depreciation at Cat Financial.
|
|
7.
|
Energy & Transportation
- A segment primarily responsible for supporting customers using reciprocating engines, turbines, diesel-electric locomotives and related parts across industries serving power generation, industrial, oil and gas and transportation applications, including marine and rail-related businesses. Responsibilities include business strategy, product design, product management and development, manufacturing, marketing and sales and product support of turbines and turbine-related services, reciprocating engine powered generator sets, integrated systems used in the electric power generation industry, reciprocating engines and integrated systems and solutions for the marine and oil and gas industries; reciprocating engines supplied to the industrial industry as well as Cat machinery; the remanufacturing of Cat engines and components and remanufacturing services for other companies; the business strategy, product design, product management and development, manufacturing, remanufacturing, leasing and service of diesel-electric locomotives and components and other rail-related products and services and product support of on-highway vocational trucks for North America.
|
47
|
8.
|
Financial Products Segment
-
Provides financing to customers and dealers for the purchase and lease of Cat and other equipment, as well as some financing for Caterpillar sales to dealers. Financing plans include operating and finance leases, installment sale contracts, working capital loans and wholesale financing plans. The segment also provides various forms of insurance to customers and dealers to help support the purchase and lease of our equipment. Financial Products segment profit is determined on a pretax basis and includes other income/expense items.
|
|
9.
|
Latin America
- A geographic region including Central and South American countries and Mexico.
|
|
10.
|
Machinery, Energy & Transportation (ME&T)
- Represents the aggregate total of Construction Industries, Resource Industries, Energy & Transportation and All Other Segments and related corporate items and eliminations.
|
|
11.
|
Machinery, Energy & Transportation Other Operating (Income) Expenses
-
Comprised primarily of gains/losses on disposal of long-lived assets, gains/losses on divestitures and legal settlements and accruals. Restructuring costs classified as other operating expenses on the Results of Operations are presented separately on the Operating Profit Comparison.
|
|
12.
|
Mark-to-Market (MTM) gains and losses
- For our defined benefit pension and OPEB plans, represents the net gain or loss of actual results differing from our assumptions and the effects of changing assumptions. These gains and losses are immediately recognized through earnings upon the annual remeasurement in the fourth quarter, or on an interim basis as triggering events warrant remeasurement.
|
|
13.
|
Pension and other postemployment benefits (OPEB)
- The company’s defined benefit pension and postretirement benefit plans.
|
|
14.
|
Period Costs
- Includes period manufacturing costs, ME&T selling, general and administrative (SG&A) and research and development (R&D) expenses excluding the impact of currency, exit-related costs that are included in restructuring costs (see definition below) and mark-to-market gains or losses (see definition above). Period manufacturing costs support production but are defined as generally not having a direct relationship to short-term changes in volume. Examples include machinery and equipment repair, depreciation on manufacturing assets, facility support, procurement, factory scheduling, manufacturing planning and operations management. SG&A and R&D costs are not linked to the production of goods or services and include marketing, legal and financial services and the development of new and significant improvements in products or processes.
|
|
15.
|
Price Realization
-
The impact of net price changes excluding currency and new product introductions. Price realization includes geographic mix of sales, which is the impact of changes in the relative weighting of sales prices between geographic regions.
|
|
16.
|
Resource Industries
- A segment primarily responsible for supporting customers using machinery in mining, quarry, waste, and material handling applications. Responsibilities include business strategy, product design, product management and development, manufacturing, marketing and sales and product support. The product portfolio includes large track-type tractors, large mining trucks, hard rock vehicles, longwall miners, electric rope shovels, draglines, hydraulic shovels, track and rotary drills, highwall miners, large wheel loaders, off-highway trucks, articulated trucks, wheel tractor scrapers, wheel dozers, landfill compactors, soil compactors, material handlers, continuous miners, scoops and haulers, hardrock continuous mining systems, select work tools, machinery components, electronics and control systems and related parts. In addition to equipment, Resource Industries also develops and sells technology products and services to provide customers fleet management, equipment management analytics and autonomous machine capabilities. Resource Industries also manages areas that provide services to other parts of the company, including integrated manufacturing and research and development.
|
|
17.
|
Restructuring Costs
- Primarily costs for employee separation costs, long-lived asset impairments and contract terminations. These costs are included in Other Operating (Income) Expenses. Restructuring costs also include other exit-related costs primarily for inventory write-downs, accelerated depreciation and equipment relocation (primarily included in Cost of goods sold) and sales discounts and payments to dealers and customers related to discontinued products (included in Sales of ME&T).
|
|
18.
|
Sales Volume
- With respect to sales and revenues, sales volume represents the impact of changes in the quantities sold for Machinery, Energy & Transportation as well as the incremental revenue impact of new product introductions, including emissions-related product updates. With respect to operating profit, sales volume represents the impact of changes in the quantities sold for Machinery, Energy & Transportation combined with product mix as well as the net operating profit impact of new product introductions, including emissions-related product updates. Product mix represents the net operating profit impact of changes in the relative weighting of Machinery, Energy & Transportation sales with respect to total sales.
|
48
|
19.
|
Surface Mining & Technology
- A goodwill reporting unit included in Resource Industries. Its product portfolio includes large mining trucks, electric rope shovels, draglines, hydraulic shovels and related parts. In addition to equipment, Surface Mining & Technology also develops and sells technology products and services to provide customer fleet management, equipment management analytics and autonomous machine capabilities.
|
|
20.
|
Variable Manufacturing Costs
-
Represents volume-adjusted costs excluding the impact of currency and restructuring costs (see definition above). Variable manufacturing costs are defined as having a direct relationship with the volume of production. This includes material costs, direct labor and other costs that vary directly with production volume such as freight, power to operate machines and supplies that are consumed in the manufacturing process.
|
LIQUIDITY AND CAPITAL RESOURCES
Sources of funds
We generate significant capital resources from operating activities, which are the primary source of funding for our ME&T operations. Funding for these businesses is also available from commercial paper and long-term debt issuances. Financial Products' operations are funded primarily from commercial paper, term debt issuances and collections from its existing portfolio. Despite continued weakness in many of the industries we serve, we had positive operating cash flow in 2016. On a consolidated basis, we ended 2016 with $7.17 billion of cash, an increase of $708 million from year-end 2015. We intend to maintain a strong cash and liquidity position.
Our cash balances are held in numerous locations throughout the world with approximately $5.2 billion held by our non-U.S. subsidiaries. Amounts held by non-U.S. subsidiaries are available for general corporate use. However, if cash held by non-U.S. subsidiaries were repatriated to the United States, U.S. tax would generally be payable net of any available foreign tax credits.
Consolidated operating cash flow for 2016 was $5.61 billion down from $6.68 billion in 2015. The decrease was primarily due to lower profit after adjustments for non-cash items. The most significant driver of lower earnings was a decrease in sales volume during 2016. Higher payments for employee separations in 2016 than 2015 also contributed to the decline in operating cash flow. Operating cash flow benefited from lower cash payments for short-term incentive compensation in 2016 than 2015 (a portion of this benefit was reflected in profit through lower accruals for incentive compensation expense in 2016). In addition, positive changes to working capital in 2016 favorably impacted operating cash flow. Within working capital, changes to accounts payable and customer advances had favorable impacts to cash flow but were partially offset by lower inventory reductions. These reductions in working capital were also primarily a result of lower sales volume. See further discussion of operating cash flow under ME&T and Financial Products.
Total debt as of December 31, 2016, was $36.78 billion, a decrease of $1.23 billion from year-end 2015. Debt related to Financial Products decreased $896 million, reflecting decreasing portfolio funding requirements. Debt related to ME&T decreased $334 million in 2016, due to the maturity of a long-term debt issuance.
We have three global credit facilities with a syndicate of banks totaling $10.50 billion (Credit Facility) available in the aggregate to both Caterpillar and Cat Financial for general liquidity purposes. Based on management's allocation decision, which can be revised from time to time, the portion of the Credit Facility available to ME&T as of December 31, 2016 was $2.75 billion. Our three Global Credit Facilities are:
|
•
|
The 364-day facility of $3.15 billion (of which $0.82 billion is available to ME&T) expires in September 2017.
|
|
•
|
The three-year facility, as amended in September 2016, of $2.73 billion (of which $0.72 billion is available to ME&T) expires in September 2019.
|
|
•
|
The five-year facility, as amended in September 2016, of $4.62 billion (of which $1.21 billion is available to ME&T) expires in September 2021.
|
At December 31, 2016, Caterpillar's consolidated net worth was $13.20 billion, which was above the $9.00 billion required under the Credit Facility. The consolidated net worth is defined as the consolidated stockholder's equity including preferred stock but excluding the pension and other postretirement benefits balance within Accumulated other comprehensive income (loss).
At December 31, 2016, Cat Financial's covenant interest coverage ratio was 1.92 to 1. This is above the 1.15 to 1 minimum ratio, calculated as (1) profit excluding income taxes, interest expense and net gain/(loss) from interest rate derivatives to (2) interest expense calculated at the end of each calendar quarter for the rolling four quarter period then most recently ended, required by the Credit Facility.
49
In addition, at December 31, 2016, Cat Financial's six-month covenant leverage ratio was 7.35 to 1 and year-end covenant leverage ratio was 7.60 to 1. This is below the maximum ratio of debt to net worth of 10 to 1, calculated (1) on a monthly basis as the average of the leverage ratios determined on the last day of each of the six preceding calendar months and (2) at each December 31, required by the Credit Facility.
In the event Caterpillar or Cat Financial does not meet one or more of their respective financial covenants under the Credit Facility in the future (and are unable to obtain a consent or waiver), the syndicate of banks may terminate the commitments allocated to the party that does not meet its covenants. Additionally, in such event, certain of Cat Financial's other lenders under other loan agreements where similar financial covenants or cross default provisions are applicable, may, at their election, choose to pursue remedies under those loan agreements, including accelerating the repayment of outstanding borrowings. At December 31, 2016, there were no borrowings under the Credit Facility.
Our total credit commitments and available credit as of
December 31, 2016
were:
|
|
December 31, 2016
|
|||||||||||
|
(Millions of dollars)
|
Consolidated
|
Machinery,
Energy &
Transportation
|
Financial
Products
|
|||||||||
|
Credit lines available:
|
|
|
|
|
|
|
||||||
|
Global credit facilities
|
$
|
10,500
|
|
$
|
2,750
|
|
$
|
7,750
|
|
|||
|
Other external
|
3,824
|
|
60
|
|
3,764
|
|
||||||
|
Total credit lines available
|
14,324
|
|
2,810
|
|
11,514
|
|
||||||
|
Less: Commercial paper outstanding
|
(6,135
|
)
|
(150
|
)
|
(5,985
|
)
|
||||||
|
Less: Utilized credit
|
(1,482
|
)
|
(59
|
)
|
(1,423
|
)
|
||||||
|
Available credit
|
$
|
6,707
|
|
$
|
2,601
|
|
$
|
4,106
|
|
|||
The other consolidated credit lines with banks as of
December 31, 2016
totaled $3.82 billion. These committed and uncommitted credit lines, which may be eligible for renewal at various future dates or have no specified expiration date, are used primarily by our subsidiaries for local funding requirements. Caterpillar or Cat Financial may guarantee subsidiary borrowings under these lines.
We receive debt ratings from the major rating agencies. In December 2016, Moody's Investors Service downgraded our long-term ratings to A3 from A2, and short-term ratings to Prime-2 from Prime-1. We do not expect the Moody's downgrade to have a material impact on our borrowing costs or our overall financial health. A further downgrade of our credit ratings by Moody's or one of the other major credit rating agencies would result in increased borrowing costs and could make access to certain credit markets more difficult. In the event economic conditions deteriorate such that access to debt markets becomes unavailable, our ME&T operations would rely on cash flow from operations, use of existing cash balances, borrowings from Cat Financial and access to our Credit Facility. Our Financial Products operations would rely on cash flow from its existing portfolio, existing cash balances, access to our Credit Facility and other credit line facilities of Cat Financial and potential borrowings from Caterpillar. In addition, we maintain a support agreement with Cat Financial, which requires Caterpillar to remain the sole owner of Cat Financial and may, under certain circumstances, require Caterpillar to make payments to Cat Financial should Cat Financial fail to maintain certain financial ratios.
Machinery, Energy & Transportation
Net cash provided by operating activities was $3.86 billion in 2016, compared with $5.18 billion in 2015. The decrease was primarily due to lower profit after adjustments for non-cash items. The most significant driver of lower earnings was a decrease in sales volume during 2016. Higher payments for employee separations in 2016 than 2015 also contributed to the decline in operating cash flow. Operating cash flow benefited from lower cash payments for short-term incentive compensation in 2016 than 2015 (a portion of this benefit was reflected in profit through lower accruals for incentive compensation expense in 2016). In addition, positive changes to working capital in 2016 favorably impacted operating cash flow. Within working capital, changes to accounts payable and customer advances had favorable impacts to cash flow but were partially offset by lower inventory reductions. These reductions in working capital were also primarily a result of lower sales volume.
Net cash used for investing activities in both 2016 and 2015 was $1.78 billion. Increased lending activity with Financial Products in 2016 was offset by lower capital expenditures versus 2015.
50
Net cash used for financing activities in 2016 was $2.13 billion, compared with net cash used of $4.24 billion in 2015. The favorable change was primarily due to the absence of common stock repurchases in 2016, as compared to 2015.
Although our short-term priorities for the use of cash may vary from time to time, as business conditions dictate, our long-term cash deployment strategy remains unchanged: to maintain a strong financial position in support of our credit rating, provide capital to support growth, appropriately fund employee benefit plans, pay dividends and repurchase common stock.
Strong financial position
—
A key measure of ME&T's financial strength used by management is ME&T's debt-to-capital ratio. Debt-to-capital is defined as short-term borrowings, long-term debt due within one year and long-term debt due after one year (debt) divided by the sum of debt and stockholders' equity. Debt also includes ME&T's long-term borrowings from Financial Products. The debt-to-capital ratio for ME&T was 41.0 percent at December 31, 2016, within our target range of 30 to 45 percent. The ME&T debt-to-capital ratio was 39.0 percent at December 31, 2015. The increase in the debt-to-capital ratio was due to a decrease in equity primarily resulting from dividend payments.
Capital to support growth
—
Capital expenditures during 2016 were $1.21 billion. We expect ME&T's capital expenditures in 2017 to be about flat with 2016.
Appropriately funded employee benefit plans
—
We made $329 million of contributions to our pension and OPEB plans in 2016 versus $350 million of contributions in 2015. We expect that required employee benefit plan contributions of approximately $610 million will be required in 2017. We believe we have adequate resources to fund our employee benefit plans.
Paying dividends
—
Dividends paid totaled $1.80 billion in 2016, representing 77 cents per share paid per quarter. Each quarter, our Board of Directors reviews the company's dividend for the applicable quarter. The Board evaluates the financial condition of the company and considers the economic outlook, corporate cash flow, the company's liquidity needs and the health and stability of global credit markets to determine whether to maintain or change the quarterly dividend.
Common stock repurchases
—
In January 2014, the Board of Directors approved an authorization to repurchase up to $10 billion of Caterpillar common stock (the 2014 Authorization), which will expire on December 31, 2018. We did not purchase any Caterpillar common stock in 2016. As of December 31, 2016, $5.47 billion remained available under the 2014 Authorization. Caterpillar's basic shares outstanding as of December 31, 2016 were 586 million.
Financial Products
Financial Products operating cash flow was $1.55 billion in 2016, compared with $1.39 billion in 2015. Net cash provided by investing activities in 2016 was $299 million, compared with cash used for investing activities of $1.02 billion in 2015. The change was primarily due to lower portfolio funding requirements. Net cash used for financing activities in 2016 was $1.07 billion, compared with $228 million in 2015. The change was primarily due to lower funding requirements for investing activities.
|
Dividends paid per common share
|
|||||||||||||
|
Quarter
|
2016
|
2015
|
2014
|
||||||||||
|
First
|
$
|
.770
|
|
$
|
.700
|
|
$
|
.600
|
|
||||
|
Second
|
.770
|
|
.700
|
|
.600
|
|
|||||||
|
Third
|
.770
|
|
.770
|
|
.700
|
|
|||||||
|
Fourth
|
.770
|
|
.770
|
|
.700
|
|
|||||||
|
|
$
|
3.080
|
|
$
|
2.940
|
|
$
|
2.600
|
|
||||
51
Contractual obligations
The company has committed cash outflow related to long-term debt, operating lease agreements, postretirement benefit obligations, purchase obligations, interest on long-term debt and other long-term contractual obligations. As of
December 31, 2016
, minimum payments for these obligations were:
|
(Millions of dollars)
|
2017
|
2018-2019
|
2020-2021
|
After 2021
|
Total
|
|||||||||||||||
|
Long-term debt:
|
|
|
|
|
|
|
|
|
|
|
||||||||||
|
Machinery, Energy & Transportation (excluding capital leases)
|
$
|
500
|
|
$
|
900
|
|
$
|
1,368
|
|
$
|
6,142
|
|
$
|
8,910
|
|
|||||
|
Machinery, Energy & Transportation-capital leases
|
7
|
|
12
|
|
26
|
|
30
|
|
75
|
|
||||||||||
|
Financial Products
|
6,158
|
|
9,052
|
|
2,833
|
|
2,491
|
|
20,534
|
|
||||||||||
|
Total long-term debt
1
|
6,665
|
|
9,964
|
|
4,227
|
|
8,663
|
|
29,519
|
|
||||||||||
|
Operating leases
|
211
|
|
267
|
|
142
|
|
176
|
|
796
|
|
||||||||||
|
Postretirement benefit obligations
2
|
595
|
|
1,630
|
|
1,680
|
|
4,595
|
|
8,500
|
|
||||||||||
|
Purchase obligations:
|
|
|
|
|
|
|
|
|
|
|
||||||||||
|
Accounts payable
3
|
4,614
|
|
—
|
|
—
|
|
—
|
|
4,614
|
|
||||||||||
|
Purchase orders
4
|
6,299
|
|
—
|
|
—
|
|
—
|
|
6,299
|
|
||||||||||
|
Other contractual obligations
5
|
271
|
|
416
|
|
325
|
|
133
|
|
1,145
|
|
||||||||||
|
Total purchase obligations
|
11,184
|
|
416
|
|
325
|
|
133
|
|
12,058
|
|
||||||||||
|
Interest on long-term debt
6
|
910
|
|
1,367
|
|
958
|
|
6,500
|
|
9,735
|
|
||||||||||
|
Other long-term obligations
7
|
373
|
|
573
|
|
186
|
|
91
|
|
1,223
|
|
||||||||||
|
Total contractual obligations
|
$
|
19,938
|
|
$
|
14,217
|
|
$
|
7,518
|
|
$
|
20,158
|
|
$
|
61,831
|
|
|||||
|
1
|
Amounts exclude debt issuance costs and fair value adjustments.
|
|
2
|
Amounts represent expected contributions to our pension and other postretirement benefit plans through 2026, offset by expected Medicare Part D subsidy receipts.
|
|
3
|
Amount represents invoices received and recorded as liabilities in 2016, but scheduled for payment in 2017. These represent short-term obligations made in the ordinary course of business.
|
|
4
|
Amount represents contractual obligations for material and services on order at December 31, 2016 but not yet delivered. These represent short-term obligations made in the ordinary course of business.
|
|
5
|
Amounts represent long-term commitments entered into with key suppliers for minimum purchases quantities.
|
|
6
|
Amounts represent estimated contractual interest payments on long-term debt, including capital lease interest payments.
|
|
7
|
Amounts represent contractual obligations primarily for logistics services agreements related to our former third party logistics business, software license and development contracts, IT consulting contracts and outsourcing contracts for benefit plan administration and software system support.
|
The total amount of gross unrecognized tax benefits for uncertain tax positions, including positions impacting only the timing of tax benefits, was $1,032 million at December 31, 2016. Payment of these obligations would result from settlements with taxing authorities. Due to the difficulty in determining the timing of settlements, these obligations are not included in the table above. We do not expect to make a tax payment related to these obligations within the next year that would significantly impact liquidity.
CRITICAL ACCOUNTING POLICIES
The preparation of financial statements in conformity with generally accepted accounting principles requires management to make estimates and assumptions that affect reported amounts. The more significant estimates include: residual values for leased assets, fair values for goodwill impairment tests, impairment of available-for-sale securities, warranty liability, stock-based compensation, reserves for product liability and insurance losses, postretirement benefits, post-sale discounts, credit losses and income taxes. We have incorporated many years of data into the determination of each of these estimates and we have not historically experienced significant adjustments. These assumptions are reviewed at least annually with the Audit Committee of the Board of Directors. Following are the methods and assumptions used in determining our estimates and an indication of the risks inherent in each.
52
Residual values for leased assets
– The residual values for Cat Financial’s leased assets, which are an estimate of the market value of leased equipment at the end of the lease term, are based on an analysis of historical wholesale market sales prices, projected forward on a level trend line without consideration for inflation or possible future pricing action. At the inception of the lease, residual values are estimated with consideration of the following critical factors: market size and demand, any known significant market/product trends, total expected hours of usage, machine configuration, application, location, model changes, quantities, past re-marketing experience, third-party residual guarantees and contractual customer purchase options. Many of these factors are gathered in an application survey that is completed prior to quotation. The lease agreement also clearly defines applicable return conditions and remedies for non-compliance, to ensure that the leased equipment will be in good operating condition upon return. Model changes and updates, as well as market strength and product acceptance, are monitored and adjustments are made to residual values in accordance with the significance of any such changes. Remarketing sales staff works closely with customers and dealers to manage the sale of lease returns and the recovery of residual exposure.
During the term of the equipment on operating leases, we evaluate our depreciation on a regular basis taking into consideration expected residual values at lease termination. Adjustments to depreciation expense reflecting revised estimates of expected residual values at the end of the lease terms are recorded prospectively on a straight-line basis. For finance leases, residual value adjustments are recognized through a reduction of finance revenue.
We evaluate the carrying value of equipment on operating leases for potential impairment when we determine a triggering event has occurred. When a triggering event occurs, a test for recoverability is performed by comparing projected undiscounted future cash flows to the carrying value of the equipment on operating leases. If the test for recoverability identifies a possible impairment, the fair value of the equipment on operating leases is measured in accordance with the fair value measurement framework. An impairment charge is recognized for the amount by which the carrying value of the equipment on operating leases exceeds its estimated fair value.
At December 31, 2016, the aggregate residual value of equipment on operating leases was $2.27 billion. Without consideration of other factors such as third-party residual guarantees or contractual customer purchase options, a 10% non-temporary decrease in the market value of our equipment subject to operating leases would reduce residual value estimates and result in the recognition of approximately $90 million of additional annual depreciation expense.
Fair values for goodwill impairment tests
– We test goodwill for impairment annually, at the reporting unit level, and whenever events or circumstances make it likely that an impairment may have occurred, such as a significant adverse change in the business climate or a decision to sell all or a portion of a reporting unit. We perform our annual goodwill impairment test as of October 1 and monitor for interim triggering events on an ongoing basis.
Goodwill is reviewed for impairment utilizing either a qualitative assessment or a two-step process. If we choose to perform a qualitative assessment and determine the fair value more likely than not exceeds the carrying value, no further evaluation is necessary. For reporting units where we perform the two-step process, the first step requires us to compare the fair value of each reporting unit, which we primarily determine using an income approach based on the present value of discounted cash flows, to the respective carrying value, which includes goodwill. If the fair value of the reporting unit exceeds its carrying value, the goodwill is not considered impaired. If the carrying value is higher than the fair value, there is an indication that an impairment may exist and the second step is required. In step two, the implied fair value of goodwill is calculated as the excess of the fair value of a reporting unit over the fair values assigned to its assets and liabilities. If the implied fair value of goodwill is less than the carrying value of the reporting unit's goodwill, the difference is recognized as an impairment loss.
The impairment test process requires valuation of the respective reporting unit, which we primarily determine using an income approach based on a discounted five year forecasted cash flow with a year-five residual value. The residual value is computed using the constant growth method, which values the forecasted cash flows in perpetuity. The income approach is supported by a reconciliation of our calculated fair value for Caterpillar to the company's market capitalization. The assumptions about future cash flows and growth rates are based on each reporting unit's long-term forecast and are subject to review and approval by senior management. A reporting unit’s discount rate is a risk-adjusted weighted average cost of capital, which we believe approximates the rate from a market participant's perspective. The estimated fair value could be impacted by changes in market conditions, interest rates, growth rates, tax rates, costs, pricing and capital expenditures. The fair value determination is categorized as Level 3 in the fair value hierarchy due to its use of internal projections and unobservable measurement inputs.
In 2015, our Resource Industries segment had two reporting units with goodwill: Hauling & Extraction and Material Handling & Underground. Effective January 1, 2016, product responsibility for off-highway trucks and wheel tractor scrapers transferred from Hauling & Extraction to Material Handling & Underground, and the former Hauling & Extraction reporting unit was renamed Surface Mining & Technology. As a result of the transfer in product responsibility, approximately $500 million of goodwill was
53
reassigned from Hauling & Extraction to Material Handling & Underground based on the relative fair value of the products transferred to the total fair value of Hauling & Extraction. After the reassignment of goodwill, Surface Mining & Technology and Material Handling & Underground had goodwill of approximately $1.2 billion and $2.4 billion, respectively, as of January 1, 2016. Because the former Hauling & Extraction reporting unit’s fair value was not substantially in excess of its carrying value as of October 1, 2015, we tested Surface Mining & Technology's goodwill for impairment as of January 1, 2016 and concluded that the fair value of the reporting unit continued to exceed its carrying value.
Our annual impairment tests completed in the fourth quarter of 2016 indicated the fair value of each reporting unit was substantially above its respective carrying value, including goodwill, with the exception of our Surface Mining & Technology reporting unit. Caterpillar’s market capitalization has remained significantly above the net book value of the Company.
The Surface Mining & Technology reporting unit, which primarily serves the mining industry, is a part of our Resource Industries segment. The goodwill assigned to this reporting unit is largely from our acquisition of Bucyrus International, Inc. in 2011. Its product portfolio includes large mining trucks, electric rope shovels, draglines, hydraulic shovels and related parts. In addition to equipment, Surface Mining & Technology also develops and sells technology products and services to provide customer fleet management, equipment management analytics and autonomous machine capabilities. The annual impairment test completed in the fourth quarter of 2016 indicated that the fair value of Surface Mining & Technology was below its carrying value requiring the second step of the goodwill impairment test process. We assigned the fair value to Surface Mining & Technology’s assets and liabilities using various valuation techniques that required assumptions about royalty rates, dealer attrition, technological obsolescence and discount rates. The resulting implied fair value of goodwill was below the carrying value. Accordingly, we recognized a goodwill impairment charge of $595 million, which resulted in goodwill of $629 million remaining for Surface Mining & Technology as of October 1, 2016. There was a $17 million tax benefit associated with this impairment charge. The mining industry has experienced significant weakness for several years as a result of low commodity prices. While we continue to expect the industry will improve, we believe the pace of the improvement will be slower and cash flows and profitability will be lower than previously forecasted. We believe the slow pace of improvement will in part be due to a large amount of equipment currently idled, particularly large mining trucks, some of which will be redeployed as end-user demand increases. In addition, we do not expect a dramatic increase in commodity prices, dampening the rate of growth in mining production and demand for our products. To reflect the gradual nature of the anticipated improvement, we used a ten year cash flow forecast period for the reporting unit rather than our typical five year forecast period.
In addition to Surface Mining & Technology, our Resource Industries segment has a reporting unit, Material Handling & Underground, which includes goodwill of approximately $2.4 billion as of October 1, 2016, also largely from our acquisition of Bucyrus International, Inc. in 2011. Material Handling & Underground’s product portfolio includes large track-type tractors, hard rock vehicles, longwall miners, track and rotary drills, highwall miners, large wheel loaders, off-highway trucks, articulated trucks, wheel-tractor scrapers, wheel dozers, landfill compactors, soil compactors, material handlers, continuous miners, scoops and haulers, hardrock continuous mining systems and related parts. The fair value of Material Handling & Underground remains substantially above its carrying value.
An unfavorable change in our expectations for the financial performance of our reporting units, particularly long-term growth and profitability, would reduce the fair value of our reporting units. The demand for our equipment and related parts is highly cyclical and significantly impacted by commodity prices, although the impact may vary by reporting unit. The energy and mining industries are major users of our products, including the coal, iron ore, gold, copper, oil and natural gas industries. Decisions to purchase our products are dependent upon the performance of those industries, which in turn are dependent in part on commodity prices. Lower commodity prices or industry specific circumstances that have a negative impact to the valuation assumptions may reduce the fair value of our reporting units. Should such events occur and it becomes more likely than not that a reporting unit's fair value has fallen below its carrying value, we will perform an interim goodwill impairment test(s), in addition to the annual impairment test. Future impairment tests may result in a goodwill impairment, depending on the outcome of both step one and step two of the impairment review process. A goodwill impairment would be reported as a non-cash charge to earnings.
Impairment of available-for-sale securities
–
Available-for-sale securities, primarily at Insurance Services, are reviewed at least quarterly to identify fair values below cost which may indicate that a security is impaired and should be written down to fair value.
For debt securities, once a security’s fair value is below cost we utilize data gathered by investment managers, external sources and internal research to monitor the performance of the security to determine whether an other-than-temporary impairment has occurred. These reviews, which include an analysis of whether it is more likely than not that we will be required to sell the security before its anticipated recovery, consist of both quantitative and qualitative analysis and require a degree of management judgment. Securities in a loss position are monitored and assessed at least quarterly based on severity and timing of loss and may be deemed other-than-temporarily impaired at any time. Once a security’s fair value has been 20 percent or more below its original
54
cost for six consecutive months, the security will be other-than-temporarily impaired unless there are sufficient facts and circumstances supporting otherwise.
For equity securities in a loss position, determining whether a security is other-than-temporarily impaired requires an analysis of that security's historical sector return as well as the volatility of that return. This information is utilized to estimate a security’s future fair value and to assess whether the security has the ability to recover to its original cost over a reasonable period of time. Both historical annualized sector returns and the volatility of those returns are applied over a two year period to arrive at these estimates.
For both debt and equity securities, qualitative factors are also considered in determining whether a security is other-than-temporarily impaired. These include reviews of the following: significant changes in the regulatory, economic or technological environment of the investee, significant changes in the general market condition of either the geographic area or the industry in which the investee operates, and length of time and the extent to which the fair value has been less than cost. These qualitative factors are subjective and require a degree of management judgment.
Warranty liability
– At the time a sale is recognized, we record estimated future warranty costs. The warranty liability is determined by applying historical claim rate experience to the current field population and dealer inventory. Generally, historical claim rates are based on actual warranty experience for each product by machine model/engine size by customer or dealer location (inside or outside North America). Specific rates are developed for each product shipment month and are updated monthly based on actual warranty claim experience. Warranty costs may differ from those estimated if actual claim rates are higher or lower than our historical rates.
Stock-based compensation
– We use a lattice-based option-pricing model to calculate the fair value of our stock options and SARs. The calculation of the fair value of the awards using the lattice-based option-pricing model is affected by our stock price on the date of grant as well as assumptions regarding the following:
|
•
|
Volatility is a measure of the amount by which the stock price is expected to fluctuate each year during the expected term of the award and is based on historical Caterpillar stock price movement and current implied volatilities from traded options on Caterpillar stock. The implied volatilities from traded options are impacted by changes in market conditions. An increase in the volatility would result in an increase in our expense.
|
|
•
|
The expected term represents the period of time that awards granted are expected to be outstanding and is an output of the lattice-based option-pricing model. In determining the expected term of the award, future exercise and forfeiture patterns are estimated from Caterpillar employee historical exercise behavior. These patterns are also affected by the vesting conditions of the award. Changes in the future exercise behavior of employees or in the vesting period of the award could result in a change in the expected term. An increase in the expected term would result in an increase to our expense.
|
|
•
|
The weighted-average dividend yield is based on Caterpillar’s historical dividend yields. As holders of stock options and SARs do not receive dividend payments, this could result in employees retaining the award for a longer period of time if dividend yields decrease or exercising the award sooner if dividend yields increase. A decrease in the dividend yield would result in an increase in our expense.
|
|
•
|
The risk-free interest rate is based on the U.S. Treasury yield curve in effect at time of grant. As the risk-free interest rate increases, the expected term increases, resulting in an increase in our expense.
|
The fair value of our RSUs and PRSUs is determined by reducing the stock price on the date of grant by the present value of the estimated dividends to be paid during the vesting period. The estimated dividends are based on Caterpillar’s quarterly dividend per share at the time of grant. A decrease in the dividend per share would result in an increase in our expense.
Stock-based compensation expense recognized during the period is based on the value of the number of awards that are expected to vest. In determining the stock-based compensation expense to be recognized, a forfeiture rate is applied to the fair value of the award. This rate represents the number of awards that are expected to be forfeited prior to vesting and is based on Caterpillar employee historical behavior. Changes in the future behavior of employees could impact this rate. A decrease in this rate would result in an increase in our expense. Stock-based compensation expense for PRSUs is based on the probable number of shares expected to vest. Changes in the expected probability of achieving performance targets in future periods may result in an increase or decrease in our expense.
Product liability and insurance loss reserve
– We determine these reserves based upon reported claims in process of settlement and actuarial estimates for losses incurred but not reported. Loss reserves, including incurred but not reported reserves, are based on estimates and ultimate settlements may vary significantly from such estimates due to increased claims frequency or severity over historical levels.
55
Postretirement benefits
– Primary actuarial assumptions were determined as follows:
|
•
|
The assumed discount rate is used to discount future benefit obligations back to today’s dollars. The U.S. discount rate is based on a benefit cash flow-matching approach and represents the rate at which our benefit obligations could effectively be settled as of our measurement date, December 31. The benefit cash flow-matching approach involves analyzing Caterpillar’s projected cash flows against a high quality bond yield curve, calculated using a wide population of corporate Aa bonds available on the measurement date. The very highest and lowest yielding bonds (top and bottom 10 percent) are excluded from the analysis. A similar approach is used to determine the assumed discount rate for our most significant non-U.S. plans. Discount rates are sensitive to changes in interest rates. A decrease in the discount rate would increase our obligation and future expense.
|
At December 31, 2015, we changed our method for calculating the service and interest cost components of net periodic benefit cost. Historically, these components were determined utilizing a single weighted-average discount rate based on the yield curve used to measure the benefit obligation at the beginning of the period. Beginning in 2016, we elected to utilize a full yield curve approach in the estimation of service and interest costs by applying the specific spot rates along the yield curve used in the determination of the benefit obligation to the relevant projected cash flows. We made this change to provide a more precise measurement of service and interest costs by improving the correlation between the projected cash flows to the corresponding spot rates along the yield curve. This change has no impact on our pension and other postretirement liabilities and has been accounted for prospectively as a change in accounting estimate beginning in the first quarter of 2016.
|
•
|
The expected long-term rate of return on plan assets is based on our estimate of long-term passive returns for equities and fixed income securities weighted by the allocation of our plan assets. Based on historical performance, we increase the passive returns due to our active management of the plan assets. This rate is impacted by changes in general market conditions, but because it represents a long-term rate, it is not significantly impacted by short-term market swings. Changes in our allocation of plan assets would also impact this rate. For example, a shift to more fixed income securities would lower the rate. A decrease in the rate would increase our expense. The expected return on plan assets is calculated using the fair value of plan assets as of our measurement date, December 31.
|
|
•
|
The expected rate of compensation increase is used to develop benefit obligations using projected pay at retirement. It represents average long-term salary increases. This rate is influenced by our long-term compensation policies. An increase in the rate would increase our obligation and expense.
|
|
•
|
The assumed health care trend rate represents the rate at which health care costs are assumed to increase and is based on historical and expected experience. Changes in our projections of future health care costs due to general economic conditions and those specific to health care (e.g., technology driven cost changes) will impact this trend rate. An increase in the trend rate would increase our obligation and expense.
|
The effects of actual results differing from our assumptions and the effects of changing assumptions are considered actuarial gains or losses. We recognize actuarial gains or losses immediately through earnings upon the annual remeasurement in the fourth quarter, or on an interim basis as triggering events warrant remeasurement.
See Note 12 for further information regarding the accounting for postretirement benefits.
Post-sale discount reserve
– We provide discounts to dealers through merchandising programs. We have numerous programs that are designed to promote the sale of our products. The most common dealer programs provide a discount when the dealer sells a product to a targeted end user. The amount of accrued post-sale discounts was $1,288 million and $1,191 million as of December 31,
2016
and
2015
, respectively. The reserve represents discounts that we expect to pay on previously sold units and is reviewed at least quarterly. The reserve is adjusted if discounts paid differ from those estimated. Historically, those adjustments have not been material.
Credit loss reserve
– The allowance for credit losses is an estimate of the losses inherent in our finance receivable portfolio and includes consideration of accounts that have been individually identified as impaired, as well as pools of finance receivables where it is probable that certain receivables in the pool are impaired but the individual accounts cannot yet be identified. In identifying and measuring impairment, management takes into consideration past loss experience, known and inherent risks in the portfolio, adverse situations that may affect the borrower’s ability to repay, estimated value of underlying collateral and current economic conditions.
56
Accounts are identified for individual review based on past-due status and information available about the customer, such as financial statements, news reports and published credit ratings, as well as general information regarding industry trends and the economic environment in which our customers operate. The allowance for credit losses attributable to finance receivables that are individually evaluated and determined to be impaired is based either on the present value of expected future cash flows discounted at the receivables’ effective interest rate or the fair value of the collateral for collateral-dependent receivables. In determining collateral value, we estimate the current fair market value of the collateral less selling costs. We also consider credit enhancements such as additional collateral and contractual third-party guarantees. The allowance for credit losses attributable to the remaining accounts not yet individually identified as impaired is estimated based on loss forecast models utilizing probabilities of default, our estimate of the loss emergence period and the estimated loss given default. In addition, qualitative factors not able to be fully captured in our loss forecast models including industry trends, macroeconomic factors and model imprecision are considered in the evaluation of the adequacy of the allowance for credit losses. These qualitative factors are subjective and require a degree of management judgment.
While management believes it has exercised prudent judgment and applied reasonable assumptions, there can be no assurance that in the future, changes in economic conditions or other factors would not cause changes in the financial health of our customers. If the financial health of our customers deteriorates, the timing and level of payments received could be impacted and therefore, could result in a change to our estimated losses.
Income taxes
– We are subject to the income tax laws of the many jurisdictions in which we operate. These tax laws are complex, and the manner in which they apply to our facts is sometimes open to interpretation. In establishing the provision for income taxes, we must make judgments about the application of these inherently complex tax laws.
Despite our belief that our tax return positions are consistent with applicable tax laws, we believe that taxing authorities could challenge certain positions. Settlement of any challenge can result in no change, a complete disallowance, or some partial adjustment reached through negotiations or litigation. We record tax benefits for uncertain tax positions based upon management’s evaluation of the information available at the reporting date. To be recognized in the financial statements, a tax benefit must be at least more likely than not of being sustained based on technical merits. The benefit for positions meeting the recognition threshold is measured as the largest benefit more likely than not of being realized upon ultimate settlement with a taxing authority that has full knowledge of all relevant information. Significant judgment is required in making these determinations and adjustments to unrecognized tax benefits may be necessary to reflect actual taxes payable upon settlement. Adjustments related to positions impacting the effective tax rate affect the provision for income taxes. Adjustments related to positions impacting the timing of deductions impact deferred tax assets and liabilities.
Our income tax positions and analysis are based on currently enacted tax law. Future changes in tax law could significantly impact the provision for income taxes, the amount of taxes payable, and the deferred tax asset and liability balances. Deferred tax assets generally represent tax benefits for tax deductions or credits available in future tax returns. Certain estimates and assumptions are required to determine whether it is more likely than not that all or some portion of the benefit of a deferred tax asset will not be realized. In making this assessment, management analyzes the trend of U.S. GAAP earnings and estimates the impact of future taxable income, reversing temporary differences and available prudent and feasible tax planning strategies. Should a change in facts or circumstances lead to a change in judgment about the ultimate realizability of a deferred tax asset, we record or adjust the related valuation allowance in the period that the change in facts and circumstances occurs, along with a corresponding increase or decrease in the provision for income taxes. The provision for income taxes for 2016 includes an increase in the valuation allowance for U.S. state deferred tax assets resulting in a $141 million non-cash charge, net of federal deferred tax adjustment at 35 percent. The primary driver of the increase is recent U.S. GAAP losses expected to recur in 2017 in certain state jurisdictions and the weight given this negative objective evidence under income tax accounting guidance. Reversal of the valuation allowance in the future is dependent on U.S. GAAP profitability in these state jurisdictions giving less weight in the analysis to mark-to-market adjustments to remeasure our pension and OPEB plans as we do not consider these adjustments indicative of ongoing earnings trends.
A provision for U.S. income taxes has not been recorded on undistributed profits of our non-U.S. subsidiaries that we have determined to be indefinitely reinvested outside the U.S. If management intentions or U.S. tax law changes in the future, there could be a significant negative impact on the provision for income taxes to record an incremental tax liability in the period the change occurs. A deferred tax asset is recognized only if we have definite plans to generate a U.S. tax benefit by repatriating earnings in the foreseeable future.
Income taxes are based on the statutory tax rate of the jurisdiction in which earnings are subject to taxation. That statutory rate may differ from the statutory tax rate of the jurisdiction in which that entity is incorporated. Taxes are paid in the jurisdictions where earnings are subject to taxation. The effective tax rate differs from the U.S. statutory rate in part due to indefinitely reinvested profits of non-U.S. subsidiaries being subject to statutory tax rates which are generally lower than the U.S. rate of 35
57
percent. The indefinitely reinvested profits of Caterpillar SARL (CSARL), primarily taxable in Switzerland, contribute the most significant amount of this difference. For tax years 2007 to 2012 including the impact of a loss carryback to 2005, the IRS has proposed to tax in the United States profits earned from certain parts transactions by CSARL based on the IRS examination team’s application of “substance-over-form” or “assignment-of-income” judicial doctrines. We are vigorously contesting the proposed increases to tax and penalties for these years of approximately $2 billion. We believe that the relevant transactions complied with applicable tax laws and did not violate judicial doctrines. The purchase of parts by CSARL from unrelated parties and the subsequent sale of those parts to unrelated dealers outside the United States have substantial legal, commercial, and economic consequences for the parties involved. We have filed U.S. income tax returns on this same basis for years after 2012. We currently believe the ultimate disposition of this matter will not have a material adverse effect on our consolidated financial position, liquidity or results of operations.
OTHER MATTERS
ENVIRONMENTAL AND LEGAL MATTERS
The Company is regulated by federal, state and international environmental laws governing our use, transport and disposal of substances and control of emissions. In addition to governing our manufacturing and other operations, these laws often impact the development of our products, including, but not limited to, required compliance with air emissions standards applicable to internal combustion engines. We have made, and will continue to make, significant research and development and capital expenditures to comply with these emissions standards.
We are engaged in remedial activities at a number of locations, often with other companies, pursuant to federal and state laws. When it is probable we will pay remedial costs at a site, and those costs can be reasonably estimated, the investigation, remediation, and operating and maintenance costs are accrued against our earnings. Costs are accrued based on consideration of currently available data and information with respect to each individual site, including available technologies, current applicable laws and regulations, and prior remediation experience. Where no amount within a range of estimates is more likely, we accrue the minimum. Where multiple potentially responsible parties are involved, we consider our proportionate share of the probable costs. In formulating the estimate of probable costs, we do not consider amounts expected to be recovered from insurance companies or others. We reassess these accrued amounts on a quarterly basis. The amount recorded for environmental remediation is not material and is included in Accrued expenses. We believe there is no more than a remote chance that a material amount for remedial activities at any individual site, or at all the sites in the aggregate, will be required.
On January 8, 2015, the Company received a grand jury subpoena from the U.S. District Court for the Central District of Illinois. The subpoena requests documents and information from the Company relating to, among other things, financial information concerning U.S. and non-U.S. Caterpillar subsidiaries (including undistributed profits of non-U.S. subsidiaries and the movement of cash among U.S. and non-U.S. subsidiaries). The Company has received additional subpoenas relating to this investigation requesting additional documents and information relating to, among other things, the purchase and resale of replacement parts by Caterpillar Inc. and non-U.S. Caterpillar subsidiaries, dividend distributions of certain non-U.S. Caterpillar subsidiaries, and Caterpillar SARL and related structures. The Company is cooperating with this investigation. The Company is unable to predict the outcome or reasonably estimate any potential loss; however, we currently believe that this matter will not have a material adverse effect on the Company’s consolidated results of operations, financial position or liquidity.
On September 10, 2014, the SEC issued to Caterpillar a subpoena seeking information concerning the Company’s accounting for the goodwill relating to its acquisition of Bucyrus International Inc. in 2011 and related matters. The Company has received additional subpoenas relating to this investigation, and the Company is cooperating with the SEC regarding its ongoing investigation. The Company is unable to predict the outcome or reasonably estimate any potential loss; however, we currently believe that this matter will not have a material adverse effect on the Company's consolidated results of operations, financial position or liquidity.
On March 20, 2014, Brazil’s Administrative Council for Economic Defense (CADE) published a Technical Opinion which named 18 companies and over 100 individuals as defendants, including two subsidiaries of Caterpillar Inc., MGE - Equipamentos e Serviços Ferroviários Ltda. (MGE) and Caterpillar Brasil Ltda. The publication of the Technical Opinion opened CADE's official administrative investigation into allegations that the defendants participated in anticompetitive bid activity for the construction and maintenance of metro and train networks in Brazil. While companies cannot be held criminally liable for anticompetitive conduct in Brazil, criminal charges have been brought against two current employees of MGE and one former employee of MGE involving the same conduct alleged by CADE. The Company has responded to all requests for information from the authorities. The Company is unable to predict the outcome or reasonably estimate the potential loss; however, we currently believe that this matter will not have a material adverse effect on the Company's consolidated results of operations, financial position or liquidity.
58
On October 24, 2013, Progress Rail received a grand jury subpoena from the U.S. District Court for the Central District of California. The subpoena requests documents and information from Progress Rail, United Industries Corporation, a wholly-owned subsidiary of Progress Rail, and Caterpillar Inc. relating to allegations that Progress Rail conducted improper or unnecessary railcar inspections and repairs and improperly disposed of parts, equipment, tools and other items. In connection with this subpoena, Progress Rail was informed by the U.S. Attorney for the Central District of California that it is a target of a criminal investigation into potential violations of environmental laws and alleged improper business practices. The Company is cooperating with the authorities and is currently in discussions regarding a potential resolution of the matter. Although the Company believes a loss is probable, we currently believe that this matter will not have a material adverse effect on the Company's consolidated results of operations, financial position or liquidity.
In addition, we are involved in other unresolved legal actions that arise in the normal course of business. The most prevalent of these unresolved actions involve disputes related to product design, manufacture and performance liability (including claimed asbestos and welding fumes exposure), contracts, employment issues, environmental matters or intellectual property rights. The aggregate range of reasonably possible losses in excess of accrued liabilities, if any, associated with these unresolved legal actions is not material. In some cases, we cannot reasonably estimate a range of loss because there is insufficient information regarding the matter. However, we believe there is no more than a remote chance that any liability arising from these matters would be material. Although it is not possible to predict with certainty the outcome of these unresolved legal actions, we believe that these actions will not individually or in the aggregate have a material adverse effect on our consolidated results of operations, financial position or liquidity.
RETIREMENT BENEFITS
We recognize mark-to-market gains and losses immediately through earnings upon the remeasurement of our pension and OPEB plans. Mark-to-market gains and losses represent the effects of actual results differing from our assumptions and the effects of changing assumptions. Changes in discount rates and differences between the actual return on plan assets and the expected return on plan assets generally have the largest impact on mark-to-market gains and losses.
We recognized expense of $957 million in 2016, expense of $292 million in 2015 and expense of $2.71 billion in 2014 related to our defined benefit pension and OPEB plans. The increase in expense in 2016 compared to 2015 was primarily due to a higher net mark-to-market loss in 2016 compared to 2015 and lower expected return on plan assets as a result of a lower asset base in 2016 compared to 2015 and a lower expected rate of return on plan assets. This was partially offset by lower interest costs primarily due to adoption of a full yield curve approach in the estimation of interest cost (discussed below) and lower service costs primarily due to fewer employees earning benefits under our plans as a result of the U.S. voluntary retirement enhancement program that was implemented in the fourth quarter 2015. The decrease in expense in 2015 compared to 2014 was primarily due to a lower net mark-to-market loss in 2015 compared to 2014.
The primary factors that resulted in mark-to-market losses for 2016, 2015 and 2014 are described below:
|
•
|
2016 net mark-to-market loss of $985 million
- Primarily due to lower discount rates at the end of 2016 compared to the end of 2015 and changes in our U.S. mortality assumption (discussed below). This was partially offset by the difference between the actual return on plan assets compared to the expected return on plan assets (U.S. pension plans had an actual rate of return of 7.8 percent compared to an expected rate of return of 6.9 percent).
|
|
•
|
2015 net mark-to-market loss of $179 million
- Primarily due to the difference between the actual return on plan assets compared to the expected return on plan assets (U.S. pension plans had an actual rate of return of (2.0) percent compared to an expected rate of return of 7.4 percent) which was partially offset by higher discount rates at the end of 2015 compared to 2014.
|
|
•
|
2014 net mark-to-market loss of $2.62 billion
- Primarily due to lower discount rates at the end of 2014 compared to the end of 2013 and changes to our U.S. mortality assumption (discussed below).
|
59
The net mark-to-market losses were in the following Results of Operations line items:
|
Years ended December 31,
|
||||||||||||
|
(Millions of dollars)
|
2016
|
2015
|
2014
|
|||||||||
|
Cost of goods sold
|
$
|
476
|
|
$
|
122
|
|
$
|
1,233
|
|
|||
|
Selling, general and administrative expenses
|
382
|
|
18
|
|
1,078
|
|
||||||
|
Research and development expenses
|
127
|
|
39
|
|
313
|
|
||||||
|
Total
|
$
|
985
|
|
$
|
179
|
|
$
|
2,624
|
|
|||
In the fourth quarter of 2014, the mortality assumption for our U.S. pension and OPEB plans was reviewed to consider the use of new tables that were released by the Society of Actuaries (SoA). As of December 31, 2014, the company adopted the new tables with modifications to reflect historical company specific mortality experience and its best estimate of future mortality improvements. The adoption of the new tables resulted in an increase in the life expectancy of plan participants and therefore an increase in our Liability for postemployment benefits of approximately $400 million. In the fourth quarter of 2016, the mortality assumption for our U.S. pension and OPEB plans was reviewed to consider the use of new mortality improvement projection scales that were released by the SoA. As of December 31, 2016, the company adopted the new mortality improvement projection scales which resulted in an increase in the life expectancy of plan participants and therefore an increase in our Liability for postemployment benefits of approximately $200 million.
At December 31, 2015, we changed our method for calculating the service and interest cost components of net periodic benefit cost. Historically, these components were determined utilizing a single weighted-average discount rate based on a yield curve used to measure the benefit obligation at the beginning of the period. Beginning in 2016, we elected to utilize a full yield curve approach in the estimation of service and interest costs by applying the specific spot rates along the yield curve used in the determination of the benefit obligation to the relevant projected cash flows. We made this change to provide a more precise measurement of service and interest costs by improving the correlation between the projected cash flows to the corresponding spot rates along the yield curve. Under the previous method the discount rate used for the service and interest components of cost would have been 4.2 percent for U.S. pensions, 3.2 percent for non-U.S. pension and 4.1 percent for OPEB. This change had no impact on our year-end defined benefit pension and OPEB obligations or our annual net periodic benefit cost as the lower service and interest costs were entirely offset in the actuarial loss (gain) reported. Compared to the method used in 2015, this change lowered service and interest costs by $180 million.
We expect our total defined benefit pension and OPEB expense (excluding the impact of mark-to-market gains and losses) to increase approximately $50 million in 2017.
In general, our strategy for both the U.S. and the non-U.S. pensions includes ongoing alignment of our investments to our liabilities, while reducing risk in our portfolio. For our U.S. pension plans, our year-end 2016 asset allocation was 41 percent equity securities, 56 percent fixed income securities and 3 percent other. Our current U.S. pension target asset allocations is 40 percent equity and 60 percent fixed income. The target allocations will be revisited periodically to reflect our overall objectives. The U.S. plans are rebalanced to plus or minus 5 percentage points of the target asset allocation ranges on a monthly basis.
The year-end 2016 asset allocation for our non-U.S. pension plans was 38 percent equity securities, 55 percent fixed income securities, 5 percent real estate and 2 percent other. The 2016 target allocation for our non-U.S. pension plans was 39 percent equity securities, 52 percent fixed income securities, 6 percent real estate and 3 percent other. The target allocations for each plan vary based upon local statutory requirements, demographics of the plan participants and funded status. The frequency of rebalancing for the non-U.S. plans varies depending on the plan.
Contributions to our pension and OPEB plans were $329 million and $350 million in 2016 and 2015, respectively. We expect to make approximately $610 million of contributions to our pension and OPEB plans in 2017. We believe we have adequate resources to fund both pension and OPEB plans.
Actuarial assumptions have a significant impact on both pension and OPEB expenses. The effects of a one percentage point change in our primary actuarial assumptions on 2016 benefit costs and year-end obligations are included in the table below.
60
Postretirement Benefit Plan Actuarial Assumptions Sensitivity
Following are the effects of a one percentage-point change in our primary pension and OPEB actuarial assumptions (included in the following table) on
2016
pension and other OPEB costs and obligations:
|
|
2016 Benefit Cost
|
Year-end Benefit Obligation
|
||||||||||||||
|
(Millions of dollars)
|
One percentage-
point increase
|
One percentage-
point decrease
|
One percentage-
point increase
|
One percentage-
point decrease
|
||||||||||||
|
Pension benefits:
|
|
|
|
|
|
|
|
|
||||||||
|
Assumed discount rate
|
$
|
54
|
|
$
|
(71
|
)
|
$
|
(2,328
|
)
|
$
|
2,864
|
|
||||
|
Expected rate of compensation increase
|
15
|
|
(13
|
)
|
109
|
|
(98
|
)
|
||||||||
|
Expected long-term rate of return on plan assets
|
(147
|
)
|
147
|
|
—
|
|
—
|
|
||||||||
|
Other postretirement benefits:
|
|
|
|
|
|
|
|
|
||||||||
|
Assumed discount rate
|
11
|
|
(13
|
)
|
(372
|
)
|
444
|
|
||||||||
|
Expected rate of compensation increase
|
—
|
|
—
|
|
1
|
|
(1
|
)
|
||||||||
|
Expected long-term rate of return on plan assets
|
(6
|
)
|
6
|
|
—
|
|
—
|
|
||||||||
|
Assumed health care cost trend rate
|
19
|
|
(15
|
)
|
178
|
|
(150
|
)
|
||||||||
|
Primary Actuarial Assumptions
|
|||||||||||||||||||||||||||
|
|
U.S. Pension Benefits
|
Non-U.S. Pension Benefits
|
Other Postretirement Benefits
|
||||||||||||||||||||||||
|
|
2016
|
2015
|
2014
|
2016
|
2015
|
2014
|
2016
|
2015
|
2014
|
||||||||||||||||||
|
Weighted-average assumptions used to determine benefit obligations, end of year:
|
|
|
|
|
|
|
|
|
|
|
|
|
|
|
|
|
|
|
|||||||||
|
Discount rate
|
4.0
|
%
|
4.2
|
%
|
3.8
|
%
|
2.5
|
%
|
3.2
|
%
|
3.3
|
%
|
4.0
|
%
|
4.1
|
%
|
3.9
|
%
|
|||||||||
|
Rate of compensation increase
|
4.0
|
%
|
4.0
|
%
|
4.0
|
%
|
4.0
|
%
|
3.8
|
%
|
4.0
|
%
|
4.0
|
%
|
4.0
|
%
|
4.0
|
%
|
|||||||||
|
Weighted-average assumptions used to determine net cost:
|
|
|
|
|
|
|
|
|
|
|
|
|
|
|
|
|
|
|
|||||||||
|
Discount rate used to measure service cost
|
4.5
|
%
|
3.8
|
%
|
4.6
|
%
|
2.9
|
%
|
3.3
|
%
|
4.1
|
%
|
4.2
|
%
|
3.9
|
%
|
4.6
|
%
|
|||||||||
|
Discount rate used to measure interest cost
|
3.4
|
%
|
3.8
|
%
|
4.6
|
%
|
2.8
|
%
|
3.3
|
%
|
4.1
|
%
|
3.3
|
%
|
3.9
|
%
|
4.6
|
%
|
|||||||||
|
Expected rate of return on plan assets
|
6.9
|
%
|
7.4
|
%
|
7.8
|
%
|
6.1
|
%
|
6.8
|
%
|
6.9
|
%
|
7.5
|
%
|
7.8
|
%
|
7.8
|
%
|
|||||||||
|
Rate of compensation increase
|
4.0
|
%
|
4.0
|
%
|
4.0
|
%
|
3.6
|
%
|
4.0
|
%
|
4.2
|
%
|
4.0
|
%
|
4.0
|
%
|
4.0
|
%
|
|||||||||
|
Health care cost trend rates at year-end:
|
|
|
|
|
|
|
|
|
|
|
|
|
|
|
|
|
|
|
|||||||||
|
Health care trend rate assumed for next year
|
6.6
|
%
|
6.5
|
%
|
6.6
|
%
|
|||||||||||||||||||||
|
Rate that the cost trend rate gradually declines to
|
5.0
|
%
|
5.0
|
%
|
5.0
|
%
|
|||||||||||||||||||||
|
Year that the cost trend rate reaches ultimate rate
|
2022
|
|
2021
|
|
2021
|
|
|||||||||||||||||||||
SENSITIVITY
Foreign Exchange Rate Sensitivity
Machinery, Energy & Transportation operations use foreign currency forward and option contracts to manage unmatched foreign currency cash inflow and outflow. Our objective is to minimize the risk of exchange rate movements that would reduce the U.S. dollar value of our foreign currency cash flow. Our policy allows for managing anticipated foreign currency cash flow for up to five years. Based on the anticipated and firmly committed cash inflow and outflow for our Machinery, Energy & Transportation operations for the next 12 months and the foreign currency derivative instruments in place at year-end, a hypothetical 10 percent weakening of the U.S. dollar relative to all other currencies would adversely affect our expected
2017
cash flow for our Machinery,
61
Energy & Transportation operations by approximately $143 million. Last year similar assumptions and calculations yielded a potential $318 million adverse impact on
2016
cash flow. We determine our net exposures by calculating the difference in cash inflow and outflow by currency and adding or subtracting outstanding foreign currency derivative instruments. We multiply these net amounts by 10 percent to determine the sensitivity.
Since our policy for Financial Products operations is to hedge the foreign exchange risk when the currency of our debt portfolio does not match the currency of our receivable portfolio, a 10 percent change in the value of the U.S. dollar relative to all other currencies would not have a material effect on our consolidated financial position, results of operations or cash flow. Neither our policy nor the effect of a 10 percent change in the value of the U.S. dollar has changed from that reported at the end of last year.
The effect of the hypothetical change in exchange rates ignores the effect this movement may have on other variables, including competitive risk. If it were possible to quantify this competitive impact, the results would probably be different from the sensitivity effects shown above. In addition, it is unlikely that all currencies would uniformly strengthen or weaken relative to the U.S. dollar. In reality, some currencies may weaken while others may strengthen. Our primary exposure (excluding competitive risk) is to exchange rate movements in the Japanese yen, euro, Chinese yuan, British pound and Australian dollar.
Interest Rate Sensitivity
For our Machinery, Energy & Transportation operations, we have the option to use interest rate swaps to lower the cost of borrowed funds by attaching fixed-to-floating interest rate swaps to fixed-rate debt, and by entering into forward rate agreements on future debt issuances. A hypothetical 100 basis point adverse move in interest rates along the entire interest rate yield curve would have a minimal impact to the
2017
pre-tax earnings of Machinery, Energy & Transportation. Last year, similar assumptions and calculations yielded a minimal impact to 2016 pre-tax earnings.
For our Financial Products operations, we use interest rate derivative instruments primarily to meet our match-funding objectives and strategies. We have a match-funding policy whereby the interest rate profile (fixed or floating rate) of our debt portfolio is matched to the interest rate profile of our earning asset portfolio (finance receivables and operating leases) within certain parameters. In connection with that policy, we use interest rate swap agreements to modify the debt structure. Match funding assists us in maintaining our interest rate spreads, regardless of the direction interest rates move.
In order to properly manage sensitivity to changes in interest rates, Financial Products measures the potential impact of different interest rate assumptions on pre-tax earnings. All on-balance sheet positions, including derivative financial instruments, are included in the analysis. The primary assumptions included in the analysis are that there are no new fixed rate assets or liabilities, the proportion of fixed rate debt to fixed rate assets remains unchanged and the level of floating rate assets and debt remain constant. An analysis of the December 31,
2016
balance sheet, using these assumptions, estimates the impact of a 100 basis point immediate and sustained adverse change in interest rates to have a potential $6 million adverse impact on 2017 pre-tax earnings. Last year, similar assumptions and calculations yielded a potential $13 million adverse impact to
2016
pre-tax earnings.
This analysis does not necessarily represent our current outlook of future market interest rate movement, nor does it consider any actions management could undertake in response to changes in interest rates. Accordingly, no assurance can be given that actual results would be consistent with the results of our estimate.
NON-GAAP FINANCIAL MEASURES
The following definitions are provided for the non-GAAP financial measures used in this report. These non-GAAP financial measures have no standardized meaning prescribed by U.S. GAAP and therefore are unlikely to be comparable to the calculation of similar measures for other companies. Management does not intend these items to be considered in isolation or as a substitute for the related GAAP measures.
We believe it is important to separately quantify the profit impact of several special items in order for our results to be meaningful to our readers. These items consist of (i) restructuring costs, which are incurred in the current year to generate longer term benefits, (ii) pension and OPEB mark-to-market losses resulting from plan remeasurements, (iii) goodwill impairment charges and (iv) state deferred tax valuation allowances. We do not consider these items indicative of earnings from ongoing business activities and believe the non-GAAP measure will provide useful perspective on underlying business results and trends, and a means to assess our period-over-period results.
Reconciliations of adjusted profit before taxes to the most directly comparable GAAP measure, consolidated profit before taxes, are as follows:
62
|
Three Months Ended December 31,
|
Twelve Months Ended December 31,
|
|||||||||||||||
|
(millions of dollars)
|
2016
|
2015
|
2016
|
2015
|
||||||||||||
|
Profit (Loss) before taxes
|
$
|
(1,348
|
)
|
$
|
(247
|
)
|
$
|
139
|
|
$
|
3,439
|
|
||||
|
Restructuring costs
|
$
|
395
|
|
$
|
679
|
|
$
|
1,019
|
|
$
|
898
|
|
||||
|
Mark-to-market losses
|
$
|
985
|
|
$
|
214
|
|
$
|
985
|
|
$
|
179
|
|
||||
|
Goodwill impairment
|
$
|
595
|
|
$
|
—
|
|
$
|
595
|
|
$
|
—
|
|
||||
|
Adjusted profit before taxes
|
$
|
627
|
|
$
|
646
|
|
$
|
2,738
|
|
$
|
4,516
|
|
||||
Reconciliations of adjusted profit per share to the most directly comparable GAAP measure, diluted profit per share, are as follows:
|
Three Months Ended December 31,
|
Twelve Months Ended December 31,
|
|||||||||||||||
|
2016
|
2015
|
2016
|
2015
|
|||||||||||||
|
Profit (Loss) per share - diluted
|
$
|
(2.00
|
)
|
$
|
(0.16
|
)
|
$
|
(0.11
|
)
|
$
|
4.18
|
|
||||
|
Per share restructuring costs
1
|
$
|
0.45
|
|
$
|
0.76
|
|
$
|
1.16
|
|
$
|
0.98
|
|
||||
|
Per share mark-to-market losses
1
|
$
|
1.14
|
|
$
|
0.23
|
|
$
|
1.15
|
|
$
|
0.19
|
|
||||
|
Per share goodwill impairment
2
|
$
|
0.98
|
|
$
|
—
|
|
$
|
0.98
|
|
$
|
—
|
|
||||
|
Per share state deferred tax valuation allowance
|
$
|
0.24
|
|
$
|
—
|
|
$
|
0.24
|
|
$
|
—
|
|
||||
|
Adjusted profit per share
|
$
|
0.83
|
|
$
|
0.83
|
|
$
|
3.42
|
|
$
|
5.35
|
|
||||
|
1
At statutory tax rates.
|
||||||||||||||||
|
2
Includes a $17 million tax benefit.
|
||||||||||||||||
|
Per share amounts computed using fully diluted shares outstanding except for consolidated loss per share, which was computed using basic shares outstanding
|
||||||||||||||||
Supplemental Consolidating Data
We are providing supplemental consolidating data for the purpose of additional analysis. The data has been grouped as follows:
Consolidated –
Caterpillar Inc. and its subsidiaries.
Machinery, Energy & Transportation –
Caterpillar defines Machinery, Energy & Transportation as it is presented in the supplemental data as Caterpillar Inc. and its subsidiaries with Financial Products accounted for on the equity basis. Machinery, Energy & Transportation information relates to the design, manufacturing and marketing of our products. Financial Products' information relates to the financing to customers and dealers for the purchase and lease of Caterpillar and other equipment. The nature of these businesses is different, especially with regard to the financial position and cash flow items. Caterpillar management utilizes this presentation internally to highlight these differences. We also believe this presentation will assist readers in understanding our business.
Financial Products –
Our finance and insurance subsidiaries, primarily Cat Financial and Insurance Services.
Consolidating Adjustments –
Eliminations of transactions between Machinery, Energy & Transportation and Financial Products.
Pages 64 to 66 reconcile Machinery, Energy & Transportation with Financial Products on the equity basis to Caterpillar Inc. consolidated financial information.
63
|
Supplemental Data for Results of Operations
|
|||||||||||||||||||||||||||||||||||||||||||||||||
|
For The Years Ended December 31
|
|||||||||||||||||||||||||||||||||||||||||||||||||
|
|
|
Supplemental consolidating data
|
|
||||||||||||||||||||||||||||||||||||||||||||||
|
|
Consolidated
|
Machinery,
Energy & Transportation
1
|
Financial
Products
|
Consolidating
Adjustments
|
|
||||||||||||||||||||||||||||||||||||||||||||
|
(Millions of dollars)
|
2016
|
2015
|
2014
|
2016
|
2015
|
2014
|
2016
|
2015
|
2014
|
2016
|
|
2015
|
|
2014
|
|
||||||||||||||||||||||||||||||||||
|
Sales and revenues:
|
|
|
|
|
|
|
|
|
|
|
|
|
|
|
|
|
|
|
|
|
|
|
|
|
|
|
|
||||||||||||||||||||||
|
Sales of Machinery, Energy & Transportation
|
$
|
35,773
|
|
$
|
44,147
|
|
$
|
52,142
|
|
$
|
35,773
|
|
$
|
44,147
|
|
$
|
52,142
|
|
$
|
—
|
|
$
|
—
|
|
$
|
—
|
|
$
|
—
|
|
|
$
|
—
|
|
|
$
|
—
|
|
|
||||||||||
|
Revenues of Financial Products
|
2,764
|
|
2,864
|
|
3,042
|
|
—
|
|
—
|
|
—
|
|
3,065
|
|
3,179
|
|
3,386
|
|
(301
|
)
|
2
|
(315
|
)
|
2
|
(344
|
)
|
2
|
||||||||||||||||||||||
|
Total sales and revenues
|
38,537
|
|
47,011
|
|
55,184
|
|
35,773
|
|
44,147
|
|
52,142
|
|
3,065
|
|
3,179
|
|
3,386
|
|
(301
|
)
|
(315
|
)
|
(344
|
)
|
|||||||||||||||||||||||||
|
Operating costs:
|
|
|
|
|
|
|
|
|
|
|
|
|
|
|
|
|
|
|
|
|
|
|
|
|
|
|
|
||||||||||||||||||||||
|
Cost of goods sold
|
28,309
|
|
33,546
|
|
40,718
|
|
28,311
|
|
33,548
|
|
40,720
|
|
—
|
|
—
|
|
—
|
|
(2
|
)
|
3
|
(2
|
)
|
3
|
(2
|
)
|
3
|
||||||||||||||||||||||
|
Selling, general and administrative expenses
|
4,686
|
|
4,951
|
|
6,529
|
|
4,129
|
|
4,389
|
|
5,930
|
|
573
|
|
588
|
|
635
|
|
(16
|
)
|
3
|
(26
|
)
|
3
|
(36
|
)
|
3
|
||||||||||||||||||||||
|
Research and development expenses
|
1,951
|
|
2,119
|
|
2,380
|
|
1,951
|
|
2,119
|
|
2,380
|
|
—
|
|
—
|
|
—
|
|
—
|
|
|
—
|
|
|
—
|
|
|
||||||||||||||||||||||
|
Interest expense of Financial Products
|
596
|
|
587
|
|
624
|
|
—
|
|
—
|
|
—
|
|
611
|
|
593
|
|
631
|
|
(15
|
)
|
4
|
(6
|
)
|
4
|
(7
|
)
|
4
|
||||||||||||||||||||||
|
Goodwill impairment charge
|
595
|
|
—
|
|
—
|
|
595
|
|
—
|
|
—
|
|
—
|
|
—
|
|
—
|
|
—
|
|
—
|
|
—
|
|
|||||||||||||||||||||||||
|
Other operating (income) expenses
|
1,902
|
|
2,023
|
|
1,619
|
|
698
|
|
821
|
|
405
|
|
1,232
|
|
1,224
|
|
1,235
|
|
(28
|
)
|
3
|
(22
|
)
|
3
|
(21
|
)
|
3
|
||||||||||||||||||||||
|
Total operating costs
|
38,039
|
|
43,226
|
|
51,870
|
|
35,684
|
|
40,877
|
|
49,435
|
|
2,416
|
|
2,405
|
|
2,501
|
|
(61
|
)
|
(56
|
)
|
(66
|
)
|
|||||||||||||||||||||||||
|
Operating profit
|
498
|
|
3,785
|
|
3,314
|
|
89
|
|
3,270
|
|
2,707
|
|
649
|
|
774
|
|
885
|
|
(240
|
)
|
(259
|
)
|
(278
|
)
|
|||||||||||||||||||||||||
|
Interest expense excluding Financial Products
|
505
|
|
507
|
|
484
|
|
553
|
|
550
|
|
526
|
|
—
|
|
—
|
|
—
|
|
(48
|
)
|
4
|
(43
|
)
|
4
|
(42
|
)
|
4
|
||||||||||||||||||||||
|
Other income (expense)
|
146
|
|
161
|
|
322
|
|
(89
|
)
|
(103
|
)
|
62
|
|
43
|
|
48
|
|
24
|
|
192
|
|
5
|
216
|
|
5
|
236
|
|
5
|
||||||||||||||||||||||
|
|
|
|
|
|
|
||||||||||||||||||||||||||||||||||||||||||||
|
Consolidated profit (loss) before taxes
|
139
|
|
3,439
|
|
3,152
|
|
(553
|
)
|
2,617
|
|
2,243
|
|
692
|
|
822
|
|
909
|
|
—
|
|
|
—
|
|
|
—
|
|
|
||||||||||||||||||||||
|
Provision (benefit) for income taxes
|
192
|
|
916
|
|
692
|
|
(24
|
)
|
686
|
|
432
|
|
216
|
|
230
|
|
260
|
|
—
|
|
|
—
|
|
|
—
|
|
|
||||||||||||||||||||||
|
Profit (loss) of consolidated companies
|
(53
|
)
|
2,523
|
|
2,460
|
|
(529
|
)
|
1,931
|
|
1,811
|
|
476
|
|
592
|
|
649
|
|
—
|
|
|
—
|
|
|
—
|
|
|
||||||||||||||||||||||
|
Equity in profit (loss) of unconsolidated affiliated companies
|
(6
|
)
|
—
|
|
8
|
|
(6
|
)
|
—
|
|
8
|
|
—
|
|
—
|
|
—
|
|
—
|
|
|
—
|
|
|
—
|
|
|
||||||||||||||||||||||
|
Equity in profit of Financial Products’ subsidiaries
|
—
|
|
—
|
|
—
|
|
470
|
|
591
|
|
640
|
|
—
|
|
—
|
|
—
|
|
(470
|
)
|
6
|
(591
|
)
|
6
|
(640
|
)
|
6
|
||||||||||||||||||||||
|
Profit (loss) of consolidated and affiliated companies
|
(59
|
)
|
2,523
|
|
2,468
|
|
(65
|
)
|
2,522
|
|
2,459
|
|
476
|
|
592
|
|
649
|
|
(470
|
)
|
(591
|
)
|
(640
|
)
|
|||||||||||||||||||||||||
|
Less: Profit (loss) attributable to noncontrolling interests
|
8
|
|
11
|
|
16
|
|
2
|
|
10
|
|
7
|
|
6
|
|
1
|
|
9
|
|
—
|
|
|
—
|
|
|
—
|
|
|
||||||||||||||||||||||
|
Profit (loss)
7
|
$
|
(67
|
)
|
$
|
2,512
|
|
$
|
2,452
|
|
$
|
(67
|
)
|
$
|
2,512
|
|
$
|
2,452
|
|
$
|
470
|
|
$
|
591
|
|
$
|
640
|
|
$
|
(470
|
)
|
$
|
(591
|
)
|
$
|
(640
|
)
|
|||||||||||||
|
1
|
Represents Caterpillar Inc. and its subsidiaries with Financial Products accounted for on the equity basis.
|
|
2
|
Elimination of Financial Products’ revenues earned from Machinery, Energy & Transportation.
|
|
3
|
Elimination of net expenses recorded by Machinery, Energy & Transportation paid to Financial Products.
|
|
4
|
Elimination of interest expense recorded between Financial Products and Machinery, Energy & Transportation.
|
|
5
|
Elimination of discount recorded by Machinery, Energy & Transportation on receivables sold to Financial Products and of interest earned between Machinery, Energy & Transportation and Financial Products.
|
|
6
|
Elimination of Financial Products’ profit due to equity method of accounting.
|
|
7
|
Profit (loss) attributable to common stockholders.
|
64
|
Supplemental Data for Financial Position
|
|||||||||||||||||||||||||||||||||
|
At December 31
|
Supplemental consolidating data
|
||||||||||||||||||||||||||||||||
|
|
Consolidated
|
Machinery,
Energy & Transportation
1
|
Financial
Products
|
Consolidating
Adjustments
|
|
||||||||||||||||||||||||||||
|
(Millions of dollars)
|
2016
|
2015
|
2016
|
2015
|
2016
|
2015
|
2016
|
|
2015
|
|
|||||||||||||||||||||||
|
Assets
|
|
|
|
|
|
|
|
|
|
|
|
|
|
|
|
|
|
|
|||||||||||||||
|
Current assets:
|
|
|
|
|
|
|
|
|
|
|
|
|
|
|
|
|
|
|
|||||||||||||||
|
Cash and short-term investments
|
$
|
7,168
|
|
$
|
6,460
|
|
$
|
5,257
|
|
$
|
5,340
|
|
$
|
1,911
|
|
$
|
1,120
|
|
$
|
—
|
|
|
$
|
—
|
|
|
|||||||
|
Receivables - trade and other
|
5,981
|
|
6,695
|
|
3,910
|
|
3,564
|
|
377
|
|
345
|
|
1,694
|
|
2,3
|
2,786
|
|
2,3
|
|||||||||||||||
|
Receivables - finance
|
8,522
|
|
8,991
|
|
—
|
|
—
|
|
11,934
|
|
12,891
|
|
(3,412
|
)
|
3
|
(3,900
|
)
|
3
|
|||||||||||||||
|
Prepaid expenses and other current assets
|
1,682
|
|
1,662
|
|
764
|
|
817
|
|
926
|
|
850
|
|
(8
|
)
|
4
|
(5
|
)
|
4
|
|||||||||||||||
|
Inventories
|
8,614
|
|
9,700
|
|
8,614
|
|
9,700
|
|
—
|
|
—
|
|
—
|
|
|
—
|
|
|
|||||||||||||||
|
Total current assets
|
31,967
|
|
33,508
|
|
18,545
|
|
19,421
|
|
15,148
|
|
15,206
|
|
(1,726
|
)
|
(1,119
|
)
|
|||||||||||||||||
|
Property, plant and equipment - net
|
15,322
|
|
16,090
|
|
10,899
|
|
11,888
|
|
4,423
|
|
4,202
|
|
—
|
|
|
—
|
|
|
|||||||||||||||
|
Long-term receivables - trade and other
|
1,029
|
|
1,170
|
|
177
|
|
121
|
|
138
|
|
215
|
|
714
|
|
2,3
|
834
|
|
2,3
|
|||||||||||||||
|
Long-term receivables - finance
|
13,556
|
|
13,651
|
|
—
|
|
—
|
|
14,300
|
|
14,516
|
|
(744
|
)
|
3
|
(865
|
)
|
3
|
|||||||||||||||
|
Investments in Financial Products subsidiaries
|
—
|
|
—
|
|
3,638
|
|
3,888
|
|
—
|
|
—
|
|
(3,638
|
)
|
5
|
(3,888
|
)
|
5
|
|||||||||||||||
|
Noncurrent deferred and refundable income taxes
|
2,790
|
|
2,489
|
|
3,648
|
|
3,208
|
|
89
|
|
74
|
|
(947
|
)
|
6
|
(793
|
)
|
6
|
|||||||||||||||
|
Intangible assets
|
2,349
|
|
2,821
|
|
2,344
|
|
2,815
|
|
5
|
|
6
|
|
—
|
|
|
—
|
|
|
|||||||||||||||
|
Goodwill
|
6,020
|
|
6,615
|
|
6,003
|
|
6,598
|
|
17
|
|
17
|
|
—
|
|
|
—
|
|
|
|||||||||||||||
|
Other assets
|
1,671
|
|
1,998
|
|
609
|
|
612
|
|
1,075
|
|
1,400
|
|
(13
|
)
|
4
|
(14
|
)
|
4
|
|||||||||||||||
|
Total assets
|
$
|
74,704
|
|
$
|
78,342
|
|
$
|
45,863
|
|
$
|
48,551
|
|
$
|
35,195
|
|
$
|
35,636
|
|
$
|
(6,354
|
)
|
$
|
(5,845
|
)
|
|||||||||
|
Liabilities
|
|
|
|
|
|
|
|
|
|
|
|
|
|
|
|
|
|
|
|||||||||||||||
|
Current liabilities:
|
|
|
|
|
|
|
|
|
|
|
|
|
|
|
|
|
|
|
|||||||||||||||
|
Short-term borrowings
|
$
|
7,303
|
|
$
|
6,967
|
|
$
|
209
|
|
$
|
9
|
|
$
|
7,094
|
|
$
|
6,958
|
|
$
|
—
|
|
$
|
—
|
|
|||||||||
|
Short-term borrowings with consolidated companies
|
—
|
|
—
|
|
—
|
|
—
|
|
1,637
|
|
1,096
|
|
(1,637
|
)
|
7
|
(1,096
|
)
|
7
|
|||||||||||||||
|
Accounts payable
|
4,614
|
|
5,023
|
|
4,506
|
|
4,848
|
|
189
|
|
193
|
|
(81
|
)
|
8
|
(18
|
)
|
8
|
|||||||||||||||
|
Accrued expenses
|
3,003
|
|
3,116
|
|
2,744
|
|
2,841
|
|
259
|
|
275
|
|
—
|
|
—
|
|
|||||||||||||||||
|
Accrued wages, salaries and employee benefits
|
1,296
|
|
1,994
|
|
1,268
|
|
1,951
|
|
28
|
|
43
|
|
—
|
|
|
—
|
|
|
|||||||||||||||
|
Customer advances
|
1,167
|
|
1,146
|
|
1,167
|
|
1,146
|
|
—
|
|
—
|
|
—
|
|
|
—
|
|
|
|||||||||||||||
|
Dividends payable
|
452
|
|
448
|
|
452
|
|
448
|
|
—
|
|
—
|
|
—
|
|
|
—
|
|
|
|||||||||||||||
|
Other current liabilities
|
1,635
|
|
1,671
|
|
1,245
|
|
1,315
|
|
399
|
|
373
|
|
(9
|
)
|
6,9
|
(17
|
)
|
6,9
|
|||||||||||||||
|
Long-term debt due within one year
|
6,662
|
|
5,877
|
|
507
|
|
517
|
|
6,155
|
|
5,360
|
|
—
|
|
|
—
|
|
|
|||||||||||||||
|
Total current liabilities
|
26,132
|
|
26,242
|
|
12,098
|
|
13,075
|
|
15,761
|
|
14,298
|
|
(1,727
|
)
|
(1,131
|
)
|
|||||||||||||||||
|
Long-term debt due after one year
|
22,818
|
|
25,169
|
|
8,466
|
|
8,991
|
|
14,382
|
|
16,209
|
|
(30
|
)
|
7
|
(31
|
)
|
7
|
|||||||||||||||
|
Liability for postemployment benefits
|
9,357
|
|
8,843
|
|
9,357
|
|
8,843
|
|
—
|
|
—
|
|
—
|
|
|
—
|
|
|
|||||||||||||||
|
Other liabilities
|
3,184
|
|
3,203
|
|
2,729
|
|
2,757
|
|
1,414
|
|
1,241
|
|
(959
|
)
|
6,9
|
(795
|
)
|
6,9
|
|||||||||||||||
|
Total liabilities
|
61,491
|
|
63,457
|
|
32,650
|
|
33,666
|
|
31,557
|
|
31,748
|
|
(2,716
|
)
|
(1,957
|
)
|
|||||||||||||||||
|
Commitments and contingencies
|
|
|
|
|
|
|
|
|
|
|
|
|
|
|
|
|
|
|
|||||||||||||||
|
Stockholders’ equity
|
|
|
|
|
|
|
|
|
|
|
|
|
|
|
|
|
|
|
|||||||||||||||
|
Common stock
|
5,277
|
|
5,238
|
|
5,277
|
|
5,238
|
|
918
|
|
911
|
|
(918
|
)
|
5
|
(911
|
)
|
5
|
|||||||||||||||
|
Treasury stock
|
(17,478
|
)
|
(17,640
|
)
|
(17,478
|
)
|
(17,640
|
)
|
—
|
|
—
|
|
—
|
|
|
—
|
|
|
|||||||||||||||
|
Profit employed in the business
|
27,377
|
|
29,246
|
|
27,377
|
|
29,246
|
|
3,585
|
|
3,747
|
|
(3,585
|
)
|
5
|
(3,747
|
)
|
5
|
|||||||||||||||
|
Accumulated other comprehensive income (loss)
|
(2,039
|
)
|
(2,035
|
)
|
(2,039
|
)
|
(2,035
|
)
|
(990
|
)
|
(896
|
)
|
990
|
|
5
|
896
|
|
5
|
|||||||||||||||
|
Noncontrolling interests
|
76
|
|
76
|
|
76
|
|
76
|
|
125
|
|
126
|
|
(125
|
)
|
5
|
(126
|
)
|
5
|
|||||||||||||||
|
Total stockholders’ equity
|
13,213
|
|
14,885
|
|
13,213
|
|
14,885
|
|
3,638
|
|
3,888
|
|
(3,638
|
)
|
(3,888
|
)
|
|||||||||||||||||
|
Total liabilities and stockholders’ equity
|
$
|
74,704
|
|
$
|
78,342
|
|
$
|
45,863
|
|
$
|
48,551
|
|
$
|
35,195
|
|
$
|
35,636
|
|
$
|
(6,354
|
)
|
$
|
(5,845
|
)
|
|||||||||
|
1
|
Represents Caterpillar Inc. and its subsidiaries with Financial Products accounted for on the equity basis.
|
|
2
|
Elimination of receivables between Machinery, Energy & Transportation and Financial Products.
|
|
3
|
Reclassification of Machinery, Energy & Transportation's trade receivables purchased by Financial Products and Financial Products' wholesale inventory receivables.
|
|
4
|
Elimination of Machinery, Energy & Transportation's insurance premiums that are prepaid to Financial Products.
|
|
5
|
Elimination of Financial Products’ equity which is accounted for by Machinery, Energy & Transportation on the equity basis.
|
|
6
|
Reclassification reflecting required netting of deferred tax assets/liabilities by taxing jurisdiction.
|
|
7
|
Elimination of debt between Machinery, Energy & Transportation and Financial Products.
|
|
8
|
Elimination of payables between Machinery, Energy & Transportation and Financial Products.
|
|
9
|
Elimination of prepaid insurance in Financial Products’ other liabilities.
|
65
|
Supplemental Data for Statement of Cash Flow
|
|||||||||||||||||||||||||||||||||
|
For the Years Ended December 31
|
|
Supplemental consolidating data
|
|
||||||||||||||||||||||||||||||
|
|
Consolidated
|
Machinery,
Energy & Transportation
1
|
Financial
Products
|
Consolidating
Adjustments
|
|
||||||||||||||||||||||||||||
|
(Millions of dollars)
|
2016
|
2015
|
2016
|
2015
|
2016
|
2015
|
2016
|
|
2015
|
|
|||||||||||||||||||||||
|
Cash flow from operating activities:
|
|
|
|
|
|
|
|
|
|
|
|
|
|
|
|
|
|
|
|||||||||||||||
|
Profit (loss) of consolidated and affiliated companies
|
$
|
(59
|
)
|
$
|
2,523
|
|
$
|
(65
|
)
|
$
|
2,522
|
|
$
|
476
|
|
$
|
592
|
|
$
|
(470
|
)
|
2
|
$
|
(591
|
)
|
2
|
|||||||
|
Adjustments for non-cash items:
|
|
|
|
|
|
|
|||||||||||||||||||||||||||
|
Depreciation and amortization
|
3,034
|
|
3,046
|
|
2,144
|
|
2,164
|
|
890
|
|
882
|
|
—
|
|
|
—
|
|
|
|||||||||||||||
|
Actuarial (gain) loss on pension and postretirement benefits
|
985
|
|
179
|
|
985
|
|
179
|
|
—
|
|
—
|
|
—
|
|
—
|
|
|||||||||||||||||
|
Provision (benefit) for deferred income taxes
|
(431
|
)
|
(307
|
)
|
(533
|
)
|
(425
|
)
|
111
|
|
118
|
|
(9
|
)
|
4
|
—
|
|
||||||||||||||||
|
Goodwill impairment charge
|
595
|
|
—
|
|
595
|
|
—
|
|
—
|
|
—
|
|
—
|
|
—
|
|
|||||||||||||||||
|
Other
|
856
|
|
453
|
|
687
|
|
343
|
|
(36
|
)
|
(138
|
)
|
205
|
|
4
|
248
|
|
4
|
|||||||||||||||
|
Financial Products' dividend in excess of profit
|
—
|
|
—
|
|
162
|
|
9
|
|
—
|
|
—
|
|
(162
|
)
|
3
|
(9
|
)
|
3
|
|||||||||||||||
|
Changes in assets and liabilities, net of acquisitions and divestitures:
|
|
|
|
|
|
|
|||||||||||||||||||||||||||
|
Receivables - trade and other
|
829
|
|
764
|
|
171
|
|
461
|
|
(34
|
)
|
(85
|
)
|
692
|
|
4,5
|
388
|
|
4,5
|
|||||||||||||||
|
Inventories
|
1,109
|
|
2,274
|
|
1,113
|
|
2,280
|
|
—
|
|
—
|
|
(4
|
)
|
4
|
(6
|
)
|
4
|
|||||||||||||||
|
Accounts payable
|
(200
|
)
|
(1,165
|
)
|
(168
|
)
|
(1,343
|
)
|
31
|
|
95
|
|
(63
|
)
|
4
|
83
|
|
4
|
|||||||||||||||
|
Accrued expenses
|
(201
|
)
|
(199
|
)
|
(142
|
)
|
(223
|
)
|
(59
|
)
|
11
|
|
—
|
|
13
|
|
4
|
||||||||||||||||
|
Accrued wages, salaries and employee benefits
|
(708
|
)
|
(389
|
)
|
(693
|
)
|
(390
|
)
|
(15
|
)
|
1
|
|
—
|
|
|
—
|
|
|
|||||||||||||||
|
Customer advances
|
(37
|
)
|
(501
|
)
|
(37
|
)
|
(501
|
)
|
—
|
|
—
|
|
—
|
|
|
—
|
|
|
|||||||||||||||
|
Other assets—net
|
224
|
|
143
|
|
77
|
|
192
|
|
145
|
|
(55
|
)
|
2
|
|
4
|
6
|
|
4
|
|||||||||||||||
|
Other liabilities—net
|
(388
|
)
|
(146
|
)
|
(439
|
)
|
(93
|
)
|
44
|
|
(34
|
)
|
7
|
|
4
|
(19
|
)
|
4
|
|||||||||||||||
|
Net cash provided by (used for) operating activities
|
5,608
|
|
6,675
|
|
3,857
|
|
5,175
|
|
1,553
|
|
1,387
|
|
198
|
|
113
|
|
|||||||||||||||||
|
Cash flow from investing activities:
|
|
|
|
|
|
|
|
|
|
|
|
|
|
|
|
|
|
|
|||||||||||||||
|
Capital expenditures—excluding equipment leased to others
|
(1,109
|
)
|
(1,388
|
)
|
(1,099
|
)
|
(1,373
|
)
|
(11
|
)
|
(16
|
)
|
1
|
|
4
|
1
|
|
4
|
|||||||||||||||
|
Expenditures for equipment leased to others
|
(1,819
|
)
|
(1,873
|
)
|
(107
|
)
|
(257
|
)
|
(1,760
|
)
|
(1,643
|
)
|
48
|
|
4
|
27
|
|
4
|
|||||||||||||||
|
Proceeds from disposals of leased assets and property, plant and equipment
|
899
|
|
760
|
|
125
|
|
114
|
|
805
|
|
655
|
|
(31
|
)
|
4
|
(9
|
)
|
4
|
|||||||||||||||
|
Additions to finance receivables
|
(9,339
|
)
|
(9,929
|
)
|
—
|
|
—
|
|
(11,862
|
)
|
(12,928
|
)
|
2,523
|
|
5
|
2,999
|
|
5,8
|
|||||||||||||||
|
Collections of finance receivables
|
9,369
|
|
9,247
|
|
—
|
|
—
|
|
12,341
|
|
12,227
|
|
(2,972
|
)
|
5
|
(2,980
|
)
|
5
|
|||||||||||||||
|
Net intercompany purchased receivables
|
—
|
|
—
|
|
—
|
|
—
|
|
399
|
|
745
|
|
(399
|
)
|
5
|
(745
|
)
|
5
|
|||||||||||||||
|
Proceeds from sale of finance receivables
|
127
|
|
136
|
|
—
|
|
—
|
|
127
|
|
136
|
|
—
|
|
—
|
|
|||||||||||||||||
|
Net intercompany borrowings
|
—
|
|
—
|
|
(542
|
)
|
—
|
|
1
|
|
1
|
|
541
|
|
6
|
(1
|
)
|
6
|
|||||||||||||||
|
Investments and acquisitions (net of cash acquired)
|
(191
|
)
|
(400
|
)
|
(191
|
)
|
(400
|
)
|
—
|
|
—
|
|
—
|
|
—
|
|
|||||||||||||||||
|
Proceeds from sale of businesses and investments (net of cash sold)
|
—
|
|
178
|
|
—
|
|
184
|
|
—
|
|
—
|
|
—
|
|
(6
|
)
|
8
|
||||||||||||||||
|
Proceeds from sale of securities
|
694
|
|
351
|
|
30
|
|
25
|
|
664
|
|
326
|
|
—
|
|
|
—
|
|
|
|||||||||||||||
|
Investments in securities
|
(391
|
)
|
(485
|
)
|
(24
|
)
|
(27
|
)
|
(367
|
)
|
(458
|
)
|
—
|
|
|
—
|
|
|
|||||||||||||||
|
Other—net
|
—
|
|
(114
|
)
|
31
|
|
(49
|
)
|
(38
|
)
|
(65
|
)
|
7
|
|
9
|
—
|
|
||||||||||||||||
|
Net cash provided by (used for) investing activities
|
(1,760
|
)
|
(3,517
|
)
|
(1,777
|
)
|
(1,783
|
)
|
299
|
|
(1,020
|
)
|
(282
|
)
|
|
(714
|
)
|
|
|||||||||||||||
|
Cash flow from financing activities:
|
|
|
|
|
|
|
|
|
|
|
|
|
|
|
|
|
|
|
|||||||||||||||
|
Dividends paid
|
(1,799
|
)
|
(1,757
|
)
|
(1,799
|
)
|
(1,757
|
)
|
(632
|
)
|
(600
|
)
|
632
|
|
7
|
600
|
|
7
|
|||||||||||||||
|
Distribution to noncontrolling interests
|
(8
|
)
|
(7
|
)
|
(8
|
)
|
(7
|
)
|
—
|
|
—
|
|
—
|
|
|
—
|
|
|
|||||||||||||||
|
Common stock issued, including treasury shares reissued
|
(23
|
)
|
33
|
|
(23
|
)
|
33
|
|
7
|
|
—
|
|
(7
|
)
|
9
|
—
|
|
||||||||||||||||
|
Treasury shares purchased
|
—
|
|
(2,025
|
)
|
—
|
|
(2,025
|
)
|
—
|
|
—
|
|
—
|
|
—
|
|
|||||||||||||||||
|
Excess tax benefit from stock-based compensation
|
28
|
|
24
|
|
28
|
|
24
|
|
—
|
|
—
|
|
—
|
|
|
—
|
|
|
|||||||||||||||
|
Net intercompany borrowings
|
—
|
|
—
|
|
(1
|
)
|
(1
|
)
|
542
|
|
—
|
|
(541
|
)
|
6
|
1
|
|
6
|
|||||||||||||||
|
Proceeds from debt issued (original maturities greater than three months)
|
5,115
|
|
5,132
|
|
6
|
|
3
|
|
5,109
|
|
5,129
|
|
—
|
|
|
—
|
|
|
|||||||||||||||
|
Payments on debt (original maturities greater than three months)
|
(6,565
|
)
|
(8,292
|
)
|
(533
|
)
|
(517
|
)
|
(6,032
|
)
|
(7,775
|
)
|
—
|
|
|
—
|
|
|
|||||||||||||||
|
Short-term borrowings - net (original maturities three months or less)
|
140
|
|
3,022
|
|
201
|
|
4
|
|
(61
|
)
|
3,018
|
|
—
|
|
|
—
|
|
|
|||||||||||||||
|
Net cash provided by (used for) financing activities
|
(3,112
|
)
|
(3,870
|
)
|
(2,129
|
)
|
(4,243
|
)
|
(1,067
|
)
|
(228
|
)
|
84
|
|
|
601
|
|
|
|||||||||||||||
|
Effect of exchange rate changes on cash
|
(28
|
)
|
(169
|
)
|
(34
|
)
|
(126
|
)
|
6
|
|
(43
|
)
|
—
|
|
|
—
|
|
|
|||||||||||||||
|
Increase (decrease) in cash and short-term investments
|
708
|
|
(881
|
)
|
(83
|
)
|
(977
|
)
|
791
|
|
96
|
|
—
|
|
|
—
|
|
|
|||||||||||||||
|
Cash and short-term investments at beginning of period
|
6,460
|
|
7,341
|
|
5,340
|
|
6,317
|
|
1,120
|
|
1,024
|
|
—
|
|
|
—
|
|
|
|||||||||||||||
|
Cash and short-term investments at end of period
|
$
|
7,168
|
|
$
|
6,460
|
|
$
|
5,257
|
|
$
|
5,340
|
|
$
|
1,911
|
|
$
|
1,120
|
|
$
|
—
|
|
|
$
|
—
|
|
|
|||||||
|
1
|
Represents Caterpillar Inc. and its subsidiaries with Financial Products accounted for on the equity basis.
|
|
2
|
Elimination of Financial Products’ profit after tax due to equity method of accounting.
|
|
3
|
Elimination of Financial Products' dividend to Machinery, Energy & Transportation in excess of Financial Products' profit.
|
|
4
|
Elimination of non-cash adjustments and changes in assets and liabilities related to consolidated reporting.
|
|
5
|
Reclassification of Financial Products' cash flow activity from investing to operating for receivables that arose from the sale of inventory.
|
|
6
|
Elimination of net proceeds and payments to/from Machinery, Energy & Transportation and Financial Products.
|
|
7
|
Elimination of dividend from Financial Products to Machinery, Energy & Transportation.
|
|
8
|
Elimination of proceeds received from Financial Products related to Machinery, Energy & Transportation’s sale of businesses and investments.
|
|
9
|
Elimination of change in investment and common stock related to Financial Products.
|
66
|
Item 7A.
|
Quantitative and Qualitative Disclosures About Market Risk.
|
Information required by Item 7A appears in Note 1 — “Operations and summary of significant accounting policies,” Note 3 — “Derivative financial instruments and risk management,” Note 18 — “Fair value disclosures” and Note 19 — “Concentration of credit risk” of Part II, Item 8 "Financial Statements and Supplementary Data." Other information required by Item 7A is included in Part II, Item 7 “Management’s Discussion and Analysis of Financial Condition and Results of Operations.”
67
|
Item 8.
|
Financial Statements and Supplementary Data.
|
MANAGEMENT’S REPORT ON
INTERNAL CONTROL OVER FINANCIAL REPORTING
The management of Caterpillar Inc. (company) is responsible for establishing and maintaining adequate internal control over financial reporting as such term is defined in Rule 13a-15(f) under the Exchange Act. Our internal control over financial reporting is a process designed to provide reasonable assurance regarding the reliability of our financial reporting and the preparation of financial statements for external purposes in accordance with generally accepted accounting principles. Our internal control over financial reporting includes those policies and procedures that (i) pertain to the maintenance of records that, in reasonable detail, accurately and fairly reflect the transactions and dispositions of the assets of the company; (ii) provide reasonable assurance that transactions are recorded as necessary to permit preparation of financial statements in accordance with generally accepted accounting principles, and that receipts and expenditures of the company are being made only in accordance with authorizations of management and directors of the company; and (iii) provide reasonable assurance regarding prevention or timely detection of unauthorized acquisition, use, or disposition of the company’s assets that could have a material effect on the financial statements.
Because of its inherent limitations, internal control over financial reporting may not prevent or detect misstatements. Also, projections of any evaluation of effectiveness to future periods are subject to the risk that controls may become inadequate because of changes in conditions, or that the degree of compliance with the policies or procedures may deteriorate.
Management assessed the effectiveness of the company’s internal control over financial reporting as of
December 31, 2016
. In making this assessment, we used the criteria set forth by the Committee of Sponsoring Organizations of the Treadway Commission (COSO) in
Internal Control—Integrated Framework
(2013). Based on our assessment we concluded that, as of
December 31, 2016
, the company’s internal control over financial reporting was effective based on those criteria.
The effectiveness of the company’s internal control over financial reporting as of
December 31, 2016
has been audited by PricewaterhouseCoopers LLP, an independent registered public accounting firm. Their report appears on page 69.
|
|
/s/ D. James Umpleby III
|
|
|
|
D. James Umpleby III
|
|
|
|
Chief Executive Officer
|
|
|
|
|
|
|
|
|
|
|
|
|
|
|
|
/s/ Bradley M. Halverson
|
|
|
|
Bradley M. Halverson
|
|
|
|
Group President
|
|
|
|
and Chief Financial Officer
|
|
|
|
|
|
|
|
|
|
|
|
February 15, 2017
|
|
68
REPORT OF INDEPENDENT REGISTERED PUBLIC ACCOUNTING FIRM
To the Board of Directors and Stockholders of Caterpillar Inc.:
In our opinion, the accompanying consolidated statement of financial position and the related consolidated statements of results of operations, comprehensive income, changes in stockholders’ equity, and of cash flow, including pages 70 through 155, present fairly, in all material respects, the financial position of Caterpillar Inc. and its subsidiaries
at
December 31, 2016 and 2015, and the results of their operations and their cash flows for each of the three years in the period ended December 31, 2016
in conformity with accounting principles generally accepted in the United States of America. Also in our opinion, the Company maintained, in all material respects, effective internal control over financial reporting as of December 31, 2016, based on criteria established in
Internal Control - Integrated Framework (2013)
issued by the Committee of Sponsoring Organizations of the Treadway Commission (COSO). The Company's management is responsible for these financial statements, for maintaining effective internal control over financial reporting and for its assessment of the effectiveness of internal control over financial reporting, included in Management's Report on Internal Control over Financial Reporting appearing on page 68. Our responsibility is to express opinions on these financial statements and on the Company's internal control over financial reporting based on our integrated audits. We conducted our audits in accordance with the standards of the Public Company Accounting Oversight Board (United States). Those standards require that we plan and perform the audits to obtain reasonable assurance about whether the financial statements are free of material misstatement and whether effective internal control over financial reporting was maintained in all material respects. Our audits of the financial statements included examining, on a test basis, evidence supporting the amounts and disclosures in the financial statements, assessing the accounting principles used and significant estimates made by management, and evaluating the overall financial statement presentation. Our audit of internal control over financial reporting included obtaining an understanding of internal control over financial reporting, assessing the risk that a material weakness exists, and testing and evaluating the design and operating effectiveness of internal control based on the assessed risk. Our audits also included performing such other procedures as we considered necessary in the circumstances. We believe that our audits provide a reasonable basis for our opinions.
As described in Note 1.B. to the consolidated financial statements, the Company changed the manner in which it accounts for pension and other postretirement benefit plans in 2016. As described in Note 1.K. to the consolidated financial statements, the Company changed its method of classifying deferred income taxes in the consolidated statement of financial position in 2016.
A company’s internal control over financial reporting is a process designed to provide reasonable assurance regarding the reliability of financial reporting and the preparation of financial statements for external purposes in accordance with generally accepted accounting principles. A company’s internal control over financial reporting includes those policies and procedures that (i) pertain to the maintenance of records that, in reasonable detail, accurately and fairly reflect the transactions and dispositions of the assets of the company; (ii) provide reasonable assurance that transactions are recorded as necessary to permit preparation of financial statements in accordance with generally accepted accounting principles, and that receipts and expenditures of the company are being made only in accordance with authorizations of management and directors of the company; and (iii) provide reasonable assurance regarding prevention or timely detection of unauthorized acquisition, use, or disposition of the company’s assets that could have a material effect on the financial statements.
Because of its inherent limitations, internal control over financial reporting may not prevent or detect misstatements. Also, projections of any evaluation of effectiveness to future periods are subject to the risk that controls may become inadequate because of changes in conditions, or that the degree of compliance with the policies or procedures may deteriorate.
/s/ PricewaterhouseCoopers LLP
Peoria, Illinois
February 15, 2017
69
|
STATEMENT 1
|
Caterpillar Inc.
|
||||||||||
|
Consolidated Results of Operations for the Years Ended
December 31
|
|||||||||||
|
(Dollars in millions except per share data)
|
|||||||||||
|
|
2016
|
2015
|
2014
|
||||||||
|
Sales and revenues:
|
|
|
|
|
|
|
|||||
|
Sales of Machinery, Energy & Transportation
|
$
|
35,773
|
|
$
|
44,147
|
|
$
|
52,142
|
|
||
|
Revenues of Financial Products
|
2,764
|
|
2,864
|
|
3,042
|
|
|||||
|
Total sales and revenues
|
38,537
|
|
47,011
|
|
55,184
|
|
|||||
|
Operating costs:
|
|
|
|
|
|
|
|||||
|
Cost of goods sold
|
28,309
|
|
33,546
|
|
40,718
|
|
|||||
|
Selling, general and administrative expenses
|
4,686
|
|
4,951
|
|
6,529
|
|
|||||
|
Research and development expenses
|
1,951
|
|
2,119
|
|
2,380
|
|
|||||
|
Interest expense of Financial Products
|
596
|
|
587
|
|
624
|
|
|||||
|
Goodwill impairment charge
|
595
|
|
—
|
|
—
|
|
|||||
|
Other operating (income) expenses
|
1,902
|
|
2,023
|
|
1,619
|
|
|||||
|
Total operating costs
|
38,039
|
|
43,226
|
|
51,870
|
|
|||||
|
Operating profit
|
498
|
|
3,785
|
|
3,314
|
|
|||||
|
Interest expense excluding Financial Products
|
505
|
|
507
|
|
484
|
|
|||||
|
Other income (expense)
|
146
|
|
161
|
|
322
|
|
|||||
|
Consolidated profit before taxes
|
139
|
|
3,439
|
|
3,152
|
|
|||||
|
Provision (benefit) for income taxes
|
192
|
|
916
|
|
692
|
|
|||||
|
Profit (loss) of consolidated companies
|
(53
|
)
|
2,523
|
|
2,460
|
|
|||||
|
Equity in profit (loss) of unconsolidated affiliated companies
|
(6
|
)
|
—
|
|
8
|
|
|||||
|
Profit (loss) of consolidated and affiliated companies
|
(59
|
)
|
2,523
|
|
2,468
|
|
|||||
|
Less: Profit (loss) attributable to noncontrolling interests
|
8
|
|
11
|
|
16
|
|
|||||
|
Profit (loss)
1
|
$
|
(67
|
)
|
$
|
2,512
|
|
$
|
2,452
|
|
||
|
Profit (loss) per common share
|
$
|
(0.11
|
)
|
$
|
4.23
|
|
$
|
3.97
|
|
||
|
Profit (loss) per common share — diluted
2,3
|
$
|
(0.11
|
)
|
$
|
4.18
|
|
$
|
3.90
|
|
||
|
Weighted-average common shares outstanding (millions)
|
|
|
|
|
|
|
|||||
|
- Basic
|
584.3
|
|
594.3
|
|
617.2
|
|
|||||
|
- Diluted
2,3
|
584.3
|
|
601.3
|
|
628.9
|
|
|||||
|
Cash dividends declared per common share
|
$
|
3.08
|
|
$
|
3.01
|
|
$
|
2.70
|
|
||
|
1
|
Profit (loss) attributable to common stockholders.
|
|
2
|
Diluted by assumed exercise of stock-based compensation awards, using the treasury stock method.
|
|
3
|
In 2016, the assumed exercise of stock-based compensation awards was not considered because the impact would be antidilutive.
|
|
See accompanying notes to Consolidated Financial Statements.
|
||||
70
|
STATEMENT 2
|
|
Caterpillar Inc.
|
|||||||||
|
Consolidated Comprehensive Income (Loss) for the Years Ended December 31
|
|||||||||||
|
(Millions of dollars)
|
|||||||||||
|
|
2016
|
2015
|
2014
|
||||||||
|
Profit (loss) of consolidated and affiliated companies
|
$
|
(59
|
)
|
$
|
2,523
|
|
$
|
2,468
|
|
||
|
Other comprehensive income (loss), net of tax:
|
|||||||||||
|
Foreign currency translation, net of tax (provision)/benefit of: 2016 - $(30); 2015 - $(82); 2014 - $(78)
|
(17
|
)
|
(973
|
)
|
(1,155
|
)
|
|||||
|
Pension and other postretirement benefits:
|
|||||||||||
|
Current year prior service credit (cost), net of tax (provision)/benefit of: 2016 - $(69); 2015 - $5; 2014 - $(2)
|
118
|
|
(3
|
)
|
4
|
|
|||||
|
Amortization of prior service (credit) cost, net of tax (provision)/benefit of: 2016 - $21; 2015 - $18; 2014 - $13
|
(35
|
)
|
(35
|
)
|
(25
|
)
|
|||||
|
Derivative financial instruments:
|
|||||||||||
|
Gains (losses) deferred, net of tax (provision)/benefit of: 2016 - $33; 2015 - $11; 2014 - $69
|
(62
|
)
|
(19
|
)
|
(118
|
)
|
|||||
|
(Gains) losses reclassified to earnings, net of tax (provision)/benefit of: 2016 - $2; 2015 - $(51); 2014 - $(2)
|
(3
|
)
|
88
|
|
4
|
|
|||||
|
Available-for-sale securities:
|
|||||||||||
|
Gains (losses) deferred, net of tax (provision)/benefit of: 2016 - $(12); 2015 - $9; 2014 - $(12)
|
26
|
|
(10
|
)
|
24
|
|
|||||
|
(Gains) losses reclassified to earnings, net of tax (provision)/benefit of: 2016 - $15; 2015 - $20; 2014 - $11
|
(31
|
)
|
(36
|
)
|
(24
|
)
|
|||||
|
Total other comprehensive income (loss), net of tax
|
(4
|
)
|
(988
|
)
|
(1,290
|
)
|
|||||
|
Comprehensive income (loss)
|
(63
|
)
|
1,535
|
|
1,178
|
|
|||||
|
Less: comprehensive income attributable to the noncontrolling interests
|
(8
|
)
|
1
|
|
(16
|
)
|
|||||
|
Comprehensive income (loss) attributable to stockholders
|
$
|
(71
|
)
|
$
|
1,536
|
|
$
|
1,162
|
|
||
|
See accompanying notes to Consolidated Financial Statements.
|
||||
71
|
STATEMENT 3
|
Caterpillar Inc.
|
||||||
|
Consolidated Financial Position at
December 31
|
|||||||
|
(Dollars in millions)
|
|||||||
|
|
2016
|
2015
|
|||||
|
Assets
|
|
|
|
|
|||
|
Current assets:
|
|
|
|
|
|||
|
Cash and short-term investments
|
$
|
7,168
|
|
$
|
6,460
|
|
|
|
Receivables
–
trade and other
|
5,981
|
|
6,695
|
|
|||
|
Receivables
–
finance
|
8,522
|
|
8,991
|
|
|||
|
Prepaid expenses and other current assets
|
1,682
|
|
1,662
|
|
|||
|
Inventories
|
8,614
|
|
9,700
|
|
|||
|
Total current assets
|
31,967
|
|
33,508
|
|
|||
|
Property, plant and equipment
–
net
|
15,322
|
|
16,090
|
|
|||
|
Long-term receivables
–
trade and other
|
1,029
|
|
1,170
|
|
|||
|
Long-term receivables
–
finance
|
13,556
|
|
13,651
|
|
|||
|
Noncurrent deferred and refundable income taxes
|
2,790
|
|
2,489
|
|
|||
|
Intangible assets
|
2,349
|
|
2,821
|
|
|||
|
Goodwill
|
6,020
|
|
6,615
|
|
|||
|
Other assets
|
1,671
|
|
1,998
|
|
|||
|
Total assets
|
$
|
74,704
|
|
$
|
78,342
|
|
|
|
Liabilities
|
|
|
|
|
|||
|
Current liabilities:
|
|
|
|
|
|||
|
Short-term borrowings:
|
|
|
|
|
|||
|
Machinery, Energy & Transportation
|
$
|
209
|
|
$
|
9
|
|
|
|
Financial Products
|
7,094
|
|
6,958
|
|
|||
|
Accounts payable
|
4,614
|
|
5,023
|
|
|||
|
Accrued expenses
|
3,003
|
|
3,116
|
|
|||
|
Accrued wages, salaries and employee benefits
|
1,296
|
|
1,994
|
|
|||
|
Customer advances
|
1,167
|
|
1,146
|
|
|||
|
Dividends payable
|
452
|
|
448
|
|
|||
|
Other current liabilities
|
1,635
|
|
1,671
|
|
|||
|
Long-term debt due within one year:
|
|
|
|
|
|||
|
Machinery, Energy & Transportation
|
507
|
|
517
|
|
|||
|
Financial Products
|
6,155
|
|
5,360
|
|
|||
|
Total current liabilities
|
26,132
|
|
26,242
|
|
|||
|
Long-term debt due after one year:
|
|
|
|
|
|||
|
Machinery, Energy & Transportation
|
8,436
|
|
8,960
|
|
|||
|
Financial Products
|
14,382
|
|
16,209
|
|
|||
|
Liability for postemployment benefits
|
9,357
|
|
8,843
|
|
|||
|
Other liabilities
|
3,184
|
|
3,203
|
|
|||
|
Total liabilities
|
61,491
|
|
63,457
|
|
|||
|
Commitments and contingencies (Notes 21 and 22)
|
|
|
|
|
|||
|
Stockholders’ equity
|
|
|
|
|
|||
|
Common stock of $1.00 par value:
|
|
|
|
|
|||
|
Authorized shares: 2,000,000,000
Issued shares: (2016 and 2015 – 814,894,624 shares) at paid-in amount |
5,277
|
|
5,238
|
|
|||
|
Treasury stock: (2016 – 228,408,600 shares; and 2015 - 232,572,734 shares) at cost
|
(17,478
|
)
|
(17,640
|
)
|
|||
|
Profit employed in the business
|
27,377
|
|
29,246
|
|
|||
|
Accumulated other comprehensive income (loss)
|
(2,039
|
)
|
(2,035
|
)
|
|||
|
Noncontrolling interests
|
76
|
|
76
|
|
|||
|
Total stockholders’ equity
|
13,213
|
|
14,885
|
|
|||
|
Total liabilities and stockholders’ equity
|
$
|
74,704
|
|
$
|
78,342
|
|
|
|
See accompanying notes to Consolidated Financial Statements.
|
||||
72
|
STATEMENT 4
|
|
Caterpillar Inc.
|
|||||||||||||||||||||
|
Changes in Consolidated Stockholders’ Equity for the Years Ended December 31
|
|||||||||||||||||||||||
|
(Dollars in millions)
|
|||||||||||||||||||||||
|
|
Common
stock
|
Treasury
stock
|
Profit
employed
in the
business
|
Accumulated
other
comprehensive
income (loss)
|
Noncontrolling
interests
|
Total
|
|||||||||||||||||
|
Balance at January 1, 2014
|
$
|
4,709
|
|
$
|
(11,854
|
)
|
$
|
27,725
|
|
$
|
231
|
|
$
|
67
|
|
$
|
20,878
|
|
|||||
|
Profit (loss) of consolidated and affiliated companies
|
—
|
|
—
|
|
2,452
|
|
—
|
|
16
|
|
2,468
|
|
|||||||||||
|
Foreign currency translation, net of tax
|
—
|
|
—
|
|
—
|
|
(1,155
|
)
|
—
|
|
(1,155
|
)
|
|||||||||||
|
Pension and other postretirement benefits, net of tax
|
—
|
|
—
|
|
—
|
|
(21
|
)
|
—
|
|
(21
|
)
|
|||||||||||
|
Derivative financial instruments, net of tax
|
—
|
|
—
|
|
—
|
|
(114
|
)
|
—
|
|
(114
|
)
|
|||||||||||
|
Available-for-sale securities, net of tax
|
—
|
|
—
|
|
—
|
|
—
|
|
—
|
|
—
|
|
|||||||||||
|
Change in ownership from noncontrolling interests
|
—
|
|
—
|
|
—
|
|
—
|
|
4
|
|
4
|
|
|||||||||||
|
Dividends declared
|
—
|
|
—
|
|
(1,662
|
)
|
—
|
|
—
|
|
(1,662
|
)
|
|||||||||||
|
Distribution to noncontrolling interests
|
—
|
|
—
|
|
—
|
|
—
|
|
(7
|
)
|
(7
|
)
|
|||||||||||
|
Common shares issued from treasury stock for stock-based compensation: 10,106,542
|
(127
|
)
|
366
|
|
—
|
|
—
|
|
—
|
|
239
|
|
|||||||||||
|
Stock-based compensation expense
|
254
|
|
—
|
|
—
|
|
—
|
|
—
|
|
254
|
|
|||||||||||
|
Net excess tax benefits from stock-based compensation
|
180
|
|
—
|
|
—
|
|
—
|
|
—
|
|
180
|
|
|||||||||||
|
Common shares repurchased: 41,762,325
1
|
—
|
|
(4,238
|
)
|
—
|
|
—
|
|
—
|
|
(4,238
|
)
|
|||||||||||
|
Balance at December 31, 2014
|
$
|
5,016
|
|
$
|
(15,726
|
)
|
$
|
28,515
|
|
$
|
(1,059
|
)
|
$
|
80
|
|
$
|
16,826
|
|
|||||
|
Profit (loss) of consolidated and affiliated companies
|
—
|
|
—
|
|
2,512
|
|
—
|
|
11
|
|
2,523
|
|
|||||||||||
|
Foreign currency translation, net of tax
|
—
|
|
—
|
|
—
|
|
(961
|
)
|
(12
|
)
|
(973
|
)
|
|||||||||||
|
Pension and other postretirement benefits, net of tax
|
—
|
|
—
|
|
—
|
|
(38
|
)
|
—
|
|
(38
|
)
|
|||||||||||
|
Derivative financial instruments, net of tax
|
—
|
|
—
|
|
—
|
|
69
|
|
—
|
|
69
|
|
|||||||||||
|
Available-for-sale securities, net of tax
|
—
|
|
—
|
|
—
|
|
(46
|
)
|
—
|
|
(46
|
)
|
|||||||||||
|
Dividends declared
|
—
|
|
—
|
|
(1,781
|
)
|
—
|
|
—
|
|
(1,781
|
)
|
|||||||||||
|
Distribution to noncontrolling interests
|
—
|
|
—
|
|
—
|
|
—
|
|
(7
|
)
|
(7
|
)
|
|||||||||||
|
Common shares issued from treasury stock for stock-based compensation: 2,931,595
|
(78
|
)
|
111
|
|
—
|
|
—
|
|
—
|
|
33
|
|
|||||||||||
|
Stock-based compensation expense
|
283
|
|
—
|
|
—
|
|
—
|
|
—
|
|
283
|
|
|||||||||||
|
Net excess tax benefits from stock-based compensation
|
10
|
|
—
|
|
—
|
|
—
|
|
—
|
|
10
|
|
|||||||||||
|
Common shares repurchased: 25,841,608
1
|
—
|
|
(2,025
|
)
|
—
|
|
—
|
|
—
|
|
(2,025
|
)
|
|||||||||||
|
Other
|
7
|
|
—
|
|
—
|
|
—
|
|
4
|
|
11
|
|
|||||||||||
|
Balance at December 31, 2015
|
$
|
5,238
|
|
$
|
(17,640
|
)
|
$
|
29,246
|
|
$
|
(2,035
|
)
|
$
|
76
|
|
$
|
14,885
|
|
|||||
(Continued)
73
|
STATEMENT 4
|
|
Caterpillar Inc.
|
|||||||||||||||||||||
|
Changes in Consolidated Stockholders’ Equity for the Years Ended December 31
|
|||||||||||||||||||||||
|
(Dollars in millions)
|
|||||||||||||||||||||||
|
|
Common
stock
|
Treasury
stock
|
Profit
employed
in the
business
|
Accumulated
other
comprehensive
income (loss)
|
Noncontrolling
interests
|
Total
|
|||||||||||||||||
|
Balance at December 31, 2015
|
$
|
5,238
|
|
$
|
(17,640
|
)
|
$
|
29,246
|
|
$
|
(2,035
|
)
|
$
|
76
|
|
$
|
14,885
|
|
|||||
|
Profit (loss) of consolidated and affiliated companies
|
—
|
|
—
|
|
(67
|
)
|
—
|
|
8
|
|
(59
|
)
|
|||||||||||
|
Foreign currency translation, net of tax
|
—
|
|
—
|
|
—
|
|
(17
|
)
|
—
|
|
(17
|
)
|
|||||||||||
|
Pension and other postretirement benefits, net of tax
|
—
|
|
—
|
|
—
|
|
83
|
|
—
|
|
83
|
|
|||||||||||
|
Derivative financial instruments, net of tax
|
—
|
|
—
|
|
—
|
|
(65
|
)
|
—
|
|
(65
|
)
|
|||||||||||
|
Available-for-sale securities, net of tax
|
—
|
|
—
|
|
—
|
|
(5
|
)
|
—
|
|
(5
|
)
|
|||||||||||
|
Change in ownership from noncontrolling interests
|
(2
|
)
|
—
|
|
—
|
|
—
|
|
2
|
|
—
|
|
|||||||||||
|
Dividends declared
|
—
|
|
—
|
|
(1,802
|
)
|
—
|
|
—
|
|
(1,802
|
)
|
|||||||||||
|
Distribution to noncontrolling interests
|
—
|
|
—
|
|
—
|
|
—
|
|
(10
|
)
|
(10
|
)
|
|||||||||||
|
Common shares issued from treasury stock for stock-based compensation: 4,164,134
|
(185
|
)
|
162
|
|
—
|
|
—
|
|
—
|
|
(23
|
)
|
|||||||||||
|
Stock-based compensation expense
|
218
|
|
—
|
|
—
|
|
—
|
|
—
|
|
218
|
|
|||||||||||
|
Net excess tax benefits from stock-based compensation
|
(6
|
)
|
—
|
|
—
|
|
—
|
|
—
|
|
(6
|
)
|
|||||||||||
|
Other
|
14
|
|
—
|
|
—
|
|
—
|
|
—
|
|
14
|
|
|||||||||||
|
Balance at December 31, 2016
|
$
|
5,277
|
|
$
|
(17,478
|
)
|
$
|
27,377
|
|
$
|
(2,039
|
)
|
$
|
76
|
|
$
|
13,213
|
|
|||||
|
1
|
See Note 16 regarding shares repurchased.
|
|
See accompanying notes to Consolidated Financial Statements.
|
||||
74
|
STATEMENT 5
|
|
Caterpillar Inc.
|
|||||||||
|
|
|||||||||||
|
(Millions of dollars)
|
|||||||||||
|
|
2016
|
2015
|
2014
|
||||||||
|
Cash flow from operating activities:
|
|
|
|
|
|
|
|||||
|
Profit (loss) of consolidated and affiliated companies
|
$
|
(59
|
)
|
$
|
2,523
|
|
$
|
2,468
|
|
||
|
Adjustments for non-cash items:
|
|
|
|
|
|
|
|||||
|
Depreciation and amortization
|
3,034
|
|
3,046
|
|
3,163
|
|
|||||
|
Actuarial (gain) loss on pension and postretirement benefits
|
985
|
|
179
|
|
2,624
|
|
|||||
|
Provision (benefit) for deferred income taxes
|
(431
|
)
|
(307
|
)
|
(954
|
)
|
|||||
|
Goodwill impairment charge
|
595
|
|
—
|
|
—
|
|
|||||
|
Other
|
856
|
|
453
|
|
470
|
|
|||||
|
Changes in assets and liabilities, net of acquisitions and divestitures:
|
|
|
|
|
|
|
|||||
|
Receivables
–
trade and other
|
829
|
|
764
|
|
163
|
|
|||||
|
Inventories
|
1,109
|
|
2,274
|
|
101
|
|
|||||
|
Accounts payable
|
(200
|
)
|
(1,165
|
)
|
222
|
|
|||||
|
Accrued expenses
|
(201
|
)
|
(199
|
)
|
(10
|
)
|
|||||
|
Accrued wages, salaries and employee benefits
|
(708
|
)
|
(389
|
)
|
901
|
|
|||||
|
Customer advances
|
(37
|
)
|
(501
|
)
|
(593
|
)
|
|||||
|
Other assets
–
net
|
224
|
|
143
|
|
(139
|
)
|
|||||
|
Other liabilities
–
net
|
(388
|
)
|
(146
|
)
|
(359
|
)
|
|||||
|
Net cash provided by (used for) operating activities
|
5,608
|
|
6,675
|
|
8,057
|
|
|||||
|
Cash flow from investing activities:
|
|
|
|
|
|
|
|||||
|
Capital expenditures
–
excluding equipment leased to others
|
(1,109
|
)
|
(1,388
|
)
|
(1,539
|
)
|
|||||
|
Expenditures for equipment leased to others
|
(1,819
|
)
|
(1,873
|
)
|
(1,840
|
)
|
|||||
|
Proceeds from disposals of leased assets and property, plant and equipment
|
899
|
|
760
|
|
904
|
|
|||||
|
Additions to finance receivables
|
(9,339
|
)
|
(9,929
|
)
|
(11,278
|
)
|
|||||
|
Collections of finance receivables
|
9,369
|
|
9,247
|
|
9,841
|
|
|||||
|
Proceeds from sale of finance receivables
|
127
|
|
136
|
|
177
|
|
|||||
|
Investments and acquisitions (net of cash acquired)
|
(191
|
)
|
(400
|
)
|
(30
|
)
|
|||||
|
Proceeds from sale of businesses and investments (net of cash sold)
|
—
|
|
178
|
|
199
|
|
|||||
|
Proceeds from sale of securities
|
694
|
|
351
|
|
810
|
|
|||||
|
Investments in securities
|
(391
|
)
|
(485
|
)
|
(825
|
)
|
|||||
|
Other
–
net
|
—
|
|
(114
|
)
|
(46
|
)
|
|||||
|
Net cash provided by (used for) investing activities
|
(1,760
|
)
|
(3,517
|
)
|
(3,627
|
)
|
|||||
|
Cash flow from financing activities:
|
|
|
|
|
|
|
|||||
|
Dividends paid
|
(1,799
|
)
|
(1,757
|
)
|
(1,620
|
)
|
|||||
|
Distribution to noncontrolling interests
|
(8
|
)
|
(7
|
)
|
(7
|
)
|
|||||
|
Contribution from noncontrolling interests
|
—
|
|
—
|
|
4
|
|
|||||
|
Common stock issued, including treasury shares reissued
|
(23
|
)
|
33
|
|
239
|
|
|||||
|
Treasury shares purchased
|
—
|
|
(2,025
|
)
|
(4,238
|
)
|
|||||
|
Excess tax benefit from stock-based compensation
|
28
|
|
24
|
|
182
|
|
|||||
|
Proceeds from debt issued (original maturities greater than three months):
|
|
|
|
|
|
|
|||||
|
- Machinery, Energy & Transportation
|
6
|
|
3
|
|
1,994
|
|
|||||
|
- Financial Products
|
5,109
|
|
5,129
|
|
8,655
|
|
|||||
|
Payments on debt (original maturities greater than three months):
|
|
|
|
|
|
|
|||||
|
- Machinery, Energy & Transportation
|
(533
|
)
|
(517
|
)
|
(785
|
)
|
|||||
|
- Financial Products
|
(6,032
|
)
|
(7,775
|
)
|
(8,463
|
)
|
|||||
|
Short-term borrowings
–
net (original maturities three months or less)
|
140
|
|
3,022
|
|
1,043
|
|
|||||
|
Net cash provided by (used for) financing activities
|
(3,112
|
)
|
(3,870
|
)
|
(2,996
|
)
|
|||||
|
Effect of exchange rate changes on cash
|
(28
|
)
|
(169
|
)
|
(174
|
)
|
|||||
|
Increase (decrease) in cash and short-term investments
|
708
|
|
(881
|
)
|
1,260
|
|
|||||
|
Cash and short-term investments at beginning of period
|
6,460
|
|
7,341
|
|
6,081
|
|
|||||
|
Cash and short-term investments at end of period
|
$
|
7,168
|
|
$
|
6,460
|
|
$
|
7,341
|
|
||
All short-term investments, which consist primarily of highly liquid investments with original maturities of three months or less, are considered to be cash equivalents.
Non-cash activities: In September 2016,
$381 million
of medium-term notes with varying interest rates and maturity dates were exchanged for
$366 million
of
1.93%
medium-term notes due in 2021 and
$15 million
of cash. In addition, a debt exchange premium of
$33 million
was paid and is included in the operating activities section of the Consolidated Statement of Cash Flow.
|
See accompanying notes to Consolidated Financial Statements.
|
||||
75
NOTES TO CONSOLIDATED FINANCIAL STATEMENTS
|
1.
|
Operations and summary of significant accounting policies
|
|
A.
|
Nature of operations
|
Information in our financial statements and related commentary are presented in the following categories:
Machinery, Energy & Transportation
– Represents the aggregate total of Construction Industries, Resource Industries, Energy & Transportation and All Other operating segments and related corporate items and eliminations.
Financial Products
– Primarily includes the company’s Financial Products Segment. This category includes Caterpillar Financial Services Corporation (Cat Financial), Caterpillar Financial Insurance Services (Insurance Services) and their respective subsidiaries.
Our products are sold primarily under the brands “Caterpillar,” “CAT,” design versions of “CAT” and “Caterpillar,” "EMD," “FG Wilson,” “MaK,” “MWM,” “Perkins,” “Progress Rail,” “SEM” and “Solar Turbines”.
We conduct operations in our Machinery, Energy & Transportation lines of business under highly competitive conditions, including intense price competition. We place great emphasis on the high quality and performance of our products and our dealers’ service support. Although no one competitor is believed to produce all of the same types of equipment that we do, there are numerous companies, large and small, which compete with us in the sale of each of our products.
Our machines are distributed principally through a worldwide organization of dealers (dealer network),
49
located in the United States and
123
located outside the United States, serving
190
countries. Reciprocating engines are sold principally through the dealer network and to other manufacturers for use in products. Some of the reciprocating engines manufactured by our subsidiary Perkins Engines Company Limited, are also sold through its worldwide network of
96
distributors covering
179
countries. The FG Wilson branded electric power generation systems manufactured by our subsidiary Caterpillar Northern Ireland Limited are sold through its worldwide network of
184
distributors covering
145
countries. Some of the large, medium speed reciprocating engines are also sold under the MaK brand through a worldwide network of
20
distributors covering
130
countries. Our dealers do not deal exclusively with our products; however, in most cases sales and servicing of our products are the dealers’ principal business. Some products, primarily turbines and locomotives, are sold directly to end customers through sales forces employed by the company. At times, these employees are assisted by independent sales representatives.
The Financial Products line of business also conducts operations under highly competitive conditions. Financing for users of Caterpillar products is available through a variety of competitive sources, principally commercial banks and finance and leasing companies. We offer various financing plans designed to increase the opportunity for sales of our products and generate financing income for our company. A significant portion of Financial Products activity is conducted in North America, with additional offices in Latin America, Europe and Asia/Pacific.
|
B.
|
Basis of presentation and change in accounting principle
|
The consolidated financial statements include the accounts of Caterpillar Inc. and its subsidiaries where we have a controlling financial interest.
Investments in companies where our ownership exceeds
20 percent
and we do not have a controlling interest or where the ownership is less than
20 percent
and for which we have a significant influence are accounted for by the equity method. See Note 9 for further discussion.
We consolidate all variable interest entities (VIEs) where Caterpillar Inc. is the primary beneficiary. For VIEs, we assess whether we are the primary beneficiary as prescribed by the accounting guidance on the consolidation of VIEs. The primary beneficiary of a VIE is the party that has both the power to direct the activities that most significantly impact the entity’s economic performance and the obligation to absorb losses or the right to receive benefits that could potentially be significant to the VIE. See Note 21 for further discussion on a consolidated VIE.
We have affiliates, suppliers and dealers that are VIEs of which we are not the primary beneficiary. Although we have provided financial support, we do not have the power to direct the activities that most significantly impact the economic performance of each entity. Our maximum exposure to loss from VIEs for which we are not the primary beneficiary was as follows:
76
|
|
December 31,
|
||||||||
|
(Millions of dollars)
|
2016
|
2015
|
|||||||
|
Receivables - trade and other
|
$
|
55
|
|
$
|
19
|
|
|||
|
Receivables - finance
|
174
|
|
466
|
|
|||||
|
Long-term receivables - finance
|
246
|
|
62
|
|
|||||
|
Investments in unconsolidated affiliated companies
|
31
|
|
35
|
|
|||||
|
Guarantees
|
210
|
|
175
|
|
|||||
|
Total
|
$
|
716
|
|
$
|
757
|
|
|||
In addition, Cat Financial has end-user customers that are VIEs of which we are not the primary beneficiary. Although we have provided financial support to these entities and therefore have a variable interest, we do not have the power to direct the activities that most significantly impact their economic performance. Our maximum exposure to loss from our involvement with these VIEs is limited to the credit risk inherently present in the financial support that we have provided. These risks are evaluated and reflected in our financial statements as part of our overall portfolio of finance receivables and related allowance for credit losses.
Shipping and handling costs are included in Cost of goods sold in Statement 1. Other operating (income) expenses primarily include Cat Financial’s depreciation of equipment leased to others, Insurance Services’ underwriting expenses, gains (losses) on disposal of long-lived assets, long-lived asset impairment charges, legal settlements and accruals, employee separation charges and benefit plan curtailment gains (losses).
Prepaid expenses and other current assets in Statement 3 include prepaid rent, prepaid insurance, prepaid and refundable income tax, assets held for sale, core to be returned for remanufacturing, restricted cash and other short-term investments, and other prepaid items.
Certain amounts for prior years have been reclassified to conform with the current-year financial statement presentation.
Change in Accounting Principle
Effective January 1, 2016, we changed our accounting principle for recognizing actuarial gains and losses and expected returns on plan assets for our defined benefit pension and other postretirement benefit plans. Prior to 2016, actuarial gains and losses were recognized as a component of Accumulated other comprehensive income (loss) and were generally amortized into earnings in future periods. Under the new principle, actuarial gains and losses are immediately recognized through net benefit cost upon the annual remeasurement in the fourth quarter, or on an interim basis as triggering events warrant remeasurement. In addition, we have changed our policy for recognizing the expected returns on plan assets from a market-related value method (based on a three-year smoothing of asset returns) to a fair value method. We believe these changes are preferable as they accelerate the recognition of changes in fair value of plan assets and actuarial gains and losses in our Consolidated Statement of Results of Operations, provide greater transparency of our economic obligations in accounting results and better align with the fair value principles by recognizing the effects of economic and interest rate changes on pension and other postretirement benefit assets and liabilities in the year in which the gains and losses are incurred. These changes have been applied retrospectively to prior years. As of January 1, 2014, the cumulative effect of the change resulted in a decrease of
$4.1 billion
in Profit employed in the business and a corresponding increase of
$4.1 billion
in Accumulated other comprehensive income (loss), both net of tax of
$2.4 billion
.
Following are the impacts to financial statement line items as a result of the change in accounting principle for the periods
presented in the accompanying consolidated financial statements:
77
|
Consolidated Statement of Results of Operations for the Years Ended December 31
|
|||||||||||||
|
(Dollars in millions except per share data)
|
2016
|
||||||||||||
|
As Reported
|
Previous Accounting Method
|
Effect of Accounting Change
|
|||||||||||
|
Cost of goods sold
|
$
|
28,309
|
|
$
|
28,074
|
|
$
|
235
|
|
||||
|
Selling, general and administrative expenses
|
$
|
4,686
|
|
$
|
4,441
|
|
$
|
245
|
|
||||
|
Research and development expenses
|
$
|
1,951
|
|
$
|
1,868
|
|
$
|
83
|
|
||||
|
Total operating costs
|
$
|
38,039
|
|
$
|
37,476
|
|
$
|
563
|
|
||||
|
Operating profit
|
$
|
498
|
|
$
|
1,061
|
|
$
|
(563
|
)
|
||||
|
Other income (expense)
|
$
|
146
|
|
$
|
50
|
|
$
|
96
|
|
||||
|
Consolidated profit before taxes
|
$
|
139
|
|
$
|
606
|
|
$
|
(467
|
)
|
||||
|
Provision (benefit) for income taxes
|
$
|
192
|
|
$
|
364
|
|
$
|
(172
|
)
|
||||
|
Profit (loss) of consolidated companies
|
$
|
(53
|
)
|
$
|
242
|
|
$
|
(295
|
)
|
||||
|
Profit (loss) of consolidated and affiliated companies
|
$
|
(59
|
)
|
$
|
236
|
|
$
|
(295
|
)
|
||||
|
Profit (loss)
|
$
|
(67
|
)
|
$
|
228
|
|
$
|
(295
|
)
|
||||
|
Profit (loss) per common share
|
$
|
(0.11
|
)
|
$
|
0.39
|
|
$
|
(0.50
|
)
|
||||
|
Profit (loss) per common share - diluted
|
$
|
(0.11
|
)
|
$
|
0.39
|
|
$
|
(0.50
|
)
|
||||
|
2015
|
|||||||||||||
|
Recast
|
Previously Reported
|
Effect of Accounting Change
|
|||||||||||
|
Cost of goods sold
|
$
|
33,546
|
|
$
|
33,742
|
|
$
|
(196
|
)
|
||||
|
Selling, general and administrative expenses
|
$
|
4,951
|
|
$
|
5,199
|
|
$
|
(248
|
)
|
||||
|
Research and development expenses
|
$
|
2,119
|
|
$
|
2,165
|
|
$
|
(46
|
)
|
||||
|
Other operating (income) expenses
|
$
|
2,023
|
|
$
|
2,062
|
|
$
|
(39
|
)
|
||||
|
Total operating costs
|
$
|
43,226
|
|
$
|
43,755
|
|
$
|
(529
|
)
|
||||
|
Operating profit
|
$
|
3,785
|
|
$
|
3,256
|
|
$
|
529
|
|
||||
|
Other income (expense)
|
$
|
161
|
|
$
|
106
|
|
$
|
55
|
|
||||
|
Consolidated profit before taxes
|
$
|
3,439
|
|
$
|
2,855
|
|
$
|
584
|
|
||||
|
Provision (benefit) for income taxes
|
$
|
916
|
|
$
|
742
|
|
$
|
174
|
|
||||
|
Profit (loss) of consolidated companies
|
$
|
2,523
|
|
$
|
2,113
|
|
$
|
410
|
|
||||
|
Profit (loss) of consolidated and affiliated companies
|
$
|
2,523
|
|
$
|
2,113
|
|
$
|
410
|
|
||||
|
Profit (loss)
|
$
|
2,512
|
|
$
|
2,102
|
|
$
|
410
|
|
||||
|
Profit (loss) per common share
|
$
|
4.23
|
|
$
|
3.54
|
|
$
|
0.69
|
|
||||
|
Profit (loss) per common share - diluted
|
$
|
4.18
|
|
$
|
3.50
|
|
$
|
0.68
|
|
||||
|
2014
|
|||||||||||||
|
Recast
|
Previously Reported
|
Effect of Accounting Change
|
|||||||||||
|
Cost of goods sold
|
$
|
40,718
|
|
$
|
39,767
|
|
$
|
951
|
|
||||
|
Selling, general and administrative expenses
|
$
|
6,529
|
|
$
|
5,697
|
|
$
|
832
|
|
||||
|
Research and development expenses
|
$
|
2,380
|
|
$
|
2,135
|
|
$
|
245
|
|
||||
|
Other operating (income) expenses
|
$
|
1,619
|
|
$
|
1,633
|
|
$
|
(14
|
)
|
||||
|
Total operating costs
|
$
|
51,870
|
|
$
|
49,856
|
|
$
|
2,014
|
|
||||
|
Operating profit
|
$
|
3,314
|
|
$
|
5,328
|
|
$
|
(2,014
|
)
|
||||
|
Other income (expense)
|
$
|
322
|
|
$
|
239
|
|
$
|
83
|
|
||||
|
Consolidated profit before taxes
|
$
|
3,152
|
|
$
|
5,083
|
|
$
|
(1,931
|
)
|
||||
|
Provision (benefit) for income taxes
|
$
|
692
|
|
$
|
1,380
|
|
$
|
(688
|
)
|
||||
|
Profit (loss) of consolidated companies
|
$
|
2,460
|
|
$
|
3,703
|
|
$
|
(1,243
|
)
|
||||
|
Profit (loss) of consolidated and affiliated companies
|
$
|
2,468
|
|
$
|
3,711
|
|
$
|
(1,243
|
)
|
||||
|
Profit (loss)
|
$
|
2,452
|
|
$
|
3,695
|
|
$
|
(1,243
|
)
|
||||
|
Profit (loss) per common share
|
$
|
3.97
|
|
$
|
5.99
|
|
$
|
(2.02
|
)
|
||||
|
Profit (loss) per common share - diluted
|
$
|
3.90
|
|
$
|
5.88
|
|
$
|
(1.98
|
)
|
||||
78
|
Consolidated Statement of Comprehensive Income for the Years Ended December 31
|
|||||||||||||
|
(Dollars in millions)
|
2016
|
||||||||||||
|
As Reported
|
Previous Accounting Method
|
Effect of Accounting Change
|
|||||||||||
|
Profit (loss) of consolidated and affiliated companies
|
$
|
(59
|
)
|
$
|
236
|
|
$
|
(295
|
)
|
||||
|
Foreign currency translation, net of tax
|
$
|
—
|
|
$
|
—
|
|
$
|
—
|
|
||||
|
Pension and other postretirement benefits:
|
|
||||||||||||
|
Current year actuarial gain (loss), net of tax
|
$
|
—
|
|
$
|
(621
|
)
|
$
|
621
|
|
||||
|
Amortization of actuarial (gain) loss, net of tax
|
$
|
—
|
|
$
|
326
|
|
$
|
(326
|
)
|
||||
|
Total other comprehensive income (loss), net of tax
|
$
|
(4
|
)
|
$
|
(299
|
)
|
$
|
295
|
|
||||
|
2015
|
|||||||||||||
|
Recast
|
Previously Reported
|
Effect of Accounting Change
|
|||||||||||
|
Profit (loss) of consolidated and affiliated companies
|
$
|
2,523
|
|
$
|
2,113
|
|
$
|
410
|
|
||||
|
Foreign currency translation, net of tax
|
$
|
(973
|
)
|
$
|
(977
|
)
|
$
|
4
|
|
||||
|
Pension and other postretirement benefits:
|
|
||||||||||||
|
Current year actuarial gain (loss), net of tax
|
$
|
—
|
|
$
|
(10
|
)
|
$
|
10
|
|
||||
|
Amortization of actuarial (gain) loss, net of tax
|
$
|
—
|
|
$
|
424
|
|
$
|
(424
|
)
|
||||
|
Total other comprehensive income (loss), net of tax
|
$
|
(988
|
)
|
$
|
(578
|
)
|
$
|
(410
|
)
|
||||
|
2014
|
|||||||||||||
|
Recast
|
Previously Reported
|
Effect of Accounting Change
|
|||||||||||
|
Profit (loss) of consolidated and affiliated companies
|
$
|
2,468
|
|
$
|
3,711
|
|
$
|
(1,243
|
)
|
||||
|
Foreign currency translation, net of tax
|
$
|
(1,155
|
)
|
$
|
(1,164
|
)
|
$
|
9
|
|
||||
|
Pension and other postretirement benefits:
|
|
||||||||||||
|
Current year actuarial gain (loss), net of tax
|
$
|
—
|
|
$
|
(1,578
|
)
|
$
|
1,578
|
|
||||
|
Amortization of actuarial (gain) loss, net of tax
|
$
|
—
|
|
$
|
344
|
|
$
|
(344
|
)
|
||||
|
Total other comprehensive income (loss), net of tax
|
$
|
(1,290
|
)
|
$
|
(2,533
|
)
|
$
|
1,243
|
|
||||
|
Consolidated Statement of Financial Position at December 31
|
|||||||||||||||||||||||||
|
(Dollars in millions)
|
2016
|
2015
|
|||||||||||||||||||||||
|
As Reported
|
Previous Accounting Method
|
Effect of Accounting Change
|
Recast
|
Previously Reported
|
Effect of Accounting Change
|
||||||||||||||||||||
|
Profit employed in the business
|
$
|
27,377
|
|
$
|
32,634
|
|
$
|
(5,257
|
)
|
$
|
29,246
|
|
$
|
34,208
|
|
$
|
(4,962
|
)
|
|||||||
|
Accumulated other comprehensive income (loss)
|
$
|
(2,039
|
)
|
$
|
(7,296
|
)
|
$
|
5,257
|
|
$
|
(2,035
|
)
|
$
|
(6,997
|
)
|
$
|
4,962
|
|
|||||||
79
|
Consolidated Statement of Changes in Stockholders' Equity for the Years Ended December 31
|
|||||||||||||
|
(Dollars in millions)
|
2016
|
||||||||||||
|
As Reported
|
Previous Accounting Method
|
Effect of Accounting Change
|
|||||||||||
|
Profit (loss) of consolidated and affiliated companies
|
$
|
(59
|
)
|
$
|
236
|
|
$
|
(295
|
)
|
||||
|
Pension and other postretirement benefits, net of tax
|
$
|
83
|
|
$
|
(212
|
)
|
$
|
295
|
|
||||
|
2015
|
|||||||||||||
|
Recast
|
Previously Reported
|
Effect of Accounting Change
|
|||||||||||
|
Profit (loss) of consolidated and affiliated companies
|
$
|
2,523
|
|
$
|
2,113
|
|
$
|
410
|
|
||||
|
Foreign currency translation, net of tax
|
$
|
(973
|
)
|
$
|
(977
|
)
|
$
|
4
|
|
||||
|
Pension and other postretirement benefits, net of tax
|
$
|
(38
|
)
|
$
|
376
|
|
$
|
(414
|
)
|
||||
|
2014
|
|||||||||||||
|
Recast
|
Previously Reported
|
Effect of Accounting Change
|
|||||||||||
|
Profit (loss) of consolidated and affiliated companies
|
$
|
2,468
|
|
$
|
3,711
|
|
$
|
(1,243
|
)
|
||||
|
Foreign currency translation, net of tax
|
$
|
(1,155
|
)
|
$
|
(1,164
|
)
|
$
|
9
|
|
||||
|
Pension and other postretirement benefits, net of tax
|
$
|
(21
|
)
|
$
|
(1,255
|
)
|
$
|
1,234
|
|
||||
80
|
Consolidated Statement of Cash Flow for the Years Ended December 31
|
|||||||||||||
|
(Millions of dollars)
|
2016
|
||||||||||||
|
Cash flow from operating activities:
|
As Reported
|
Previous Accounting Method
|
Effect of Accounting Change
|
||||||||||
|
Profit (loss) of consolidated and affiliated companies
|
$
|
(59
|
)
|
$
|
236
|
|
$
|
(295
|
)
|
||||
|
Adjustments for non-cash items:
|
|||||||||||||
|
Actuarial (gain) loss on pension and postretirement benefits
|
$
|
985
|
|
$
|
—
|
|
$
|
985
|
|
||||
|
Provision (benefit) for deferred income taxes
|
$
|
(431
|
)
|
$
|
—
|
|
$
|
(431
|
)
|
||||
|
Other
|
$
|
856
|
|
$
|
952
|
|
$
|
(96
|
)
|
||||
|
Changes in assets and liabilities, net of acquisitions and divestitures:
|
|||||||||||||
|
Other assets – net
|
$
|
224
|
|
$
|
46
|
|
$
|
178
|
|
||||
|
Other liabilities – net
|
$
|
(388
|
)
|
$
|
(47
|
)
|
$
|
(341
|
)
|
||||
|
2015
|
|||||||||||||
|
Cash flow from operating activities:
|
Recast
|
Previously Reported
|
Effect of Accounting Change
|
||||||||||
|
Profit (loss) of consolidated and affiliated companies
|
$
|
2,523
|
|
$
|
2,113
|
|
$
|
410
|
|
||||
|
Adjustments for non-cash items:
|
|||||||||||||
|
Actuarial (gain) loss on pension and postretirement benefits
|
$
|
179
|
|
$
|
—
|
|
$
|
179
|
|
||||
|
Provision (benefit) for deferred income taxes
|
$
|
(307
|
)
|
$
|
—
|
|
$
|
(307
|
)
|
||||
|
Other
|
$
|
453
|
|
$
|
508
|
|
$
|
(55
|
)
|
||||
|
Changes in assets and liabilities, net of acquisitions and divestitures:
|
|||||||||||||
|
Other assets – net
|
$
|
143
|
|
$
|
(220
|
)
|
$
|
363
|
|
||||
|
Other liabilities – net
|
$
|
(146
|
)
|
$
|
444
|
|
$
|
(590
|
)
|
||||
|
2014
|
|||||||||||||
|
Cash flow from operating activities:
|
Recast
|
Previously Reported
|
Effect of Accounting Change
|
||||||||||
|
Profit (loss) of consolidated and affiliated companies
|
$
|
2,468
|
|
$
|
3,711
|
|
$
|
(1,243
|
)
|
||||
|
Adjustments for non-cash items:
|
|||||||||||||
|
Actuarial (gain) loss on pension and postretirement benefits
|
$
|
2,624
|
|
$
|
—
|
|
$
|
2,624
|
|
||||
|
Provision (benefit) for deferred income taxes
|
$
|
(954
|
)
|
$
|
—
|
|
$
|
(954
|
)
|
||||
|
Other
|
$
|
470
|
|
$
|
553
|
|
$
|
(83
|
)
|
||||
|
Changes in assets and liabilities, net of acquisitions and divestitures:
|
|||||||||||||
|
Other assets – net
|
$
|
(139
|
)
|
$
|
(300
|
)
|
$
|
161
|
|
||||
|
Other liabilities – net
|
$
|
(359
|
)
|
$
|
146
|
|
$
|
(505
|
)
|
||||
The above tables include changes resulting from reclassifications between financial statement line items.
|
C.
|
Sales and revenue recognition
|
Sales of Machinery, Energy & Transportation are recognized and earned when all the following criteria are satisfied: (a) persuasive evidence of a sales arrangement exists; (b) price is fixed and determinable; (c) collectibility is reasonably assured; and (d) delivery has occurred. Persuasive evidence of an arrangement and a fixed or determinable price exist once we receive an order or contract from a customer or independently owned and operated dealer. We assess collectibility at the time of the sale and if collectibility is not reasonably assured, the sale is deferred and not recognized until collectibility is probable or payment is received. Typically, where product is produced and sold in the same country, title and risk of ownership transfer when the product is shipped. Products that are exported from a country for sale typically pass title and risk of ownership at the border of the destination country.
Sales of certain turbine machinery units, draglines and long wall roof supports are recognized under accounting for construction-type contracts, primarily using the percentage-of-completion method. Revenue is recognized based upon progress towards completion, which is estimated and continually updated over the course of construction. We provide for any loss that we expect to incur on these contracts when that loss is probable.
81
Our remanufacturing operations are primarily focused on the remanufacture of Cat engines and components and rail related products. In this business, used engines and related components (core) are inspected, cleaned and remanufactured. In connection with the sale of most of our remanufactured product, we collect a deposit from the dealer that is repaid if the dealer returns an acceptable core within a specified time period. Caterpillar owns and has title to the cores when they are returned from dealers. The rebuilt engine or component (the core plus any new content) is then sold as a remanufactured product to dealers and customers. Revenue is recognized pursuant to the same criteria as Machinery, Energy & Transportation sales noted above (title to the entire remanufactured product passes to the dealer upon sale). At the time of sale, the deposit is recognized in Other current liabilities in Statement 3. In addition, the core to be returned is recognized as an asset in Prepaid expenses and other current assets in Statement 3 at the estimated replacement cost (based on historical experience with useable cores). Upon receipt of an acceptable core, we repay the deposit and relieve the liability. The returned core is then included in inventory. In the event that the deposit is forfeited (i.e. upon failure by the dealer to return an acceptable core in the specified time period), we recognize the core deposit and the cost of the core in Sales and Cost of goods sold, respectively.
No right of return exists on sales of equipment. Replacement part returns are estimable and accrued at the time a sale is recognized.
We provide discounts to dealers through merchandising programs. We have numerous programs that are designed to promote the sale of our products. The most common dealer programs provide a discount when the dealer sells a product to a targeted end user. The cost of these discounts is estimated based on historical experience and known changes in merchandising programs and is reported as a reduction to sales when the product sale is recognized.
Our standard dealer invoice terms are established by marketing region. Our invoice terms for end-user customer sales are established by the responsible business unit. When a sale is made to a dealer, the dealer is responsible for payment even if the product is not sold to an end customer. Dealers and customers must make payment within the established invoice terms to avoid potential interest costs. Interest at or above prevailing market rates may be charged on any past due balance, and generally our practice is to not forgive this interest. In
2016
,
2015
and
2014
terms were extended to not more than
one year
for
$406 million
,
$635 million
and
$624 million
of receivables, respectively, which represent approximately
1 percent
of consolidated sales.
We establish a bad debt allowance for Machinery, Energy & Transportation receivables when it becomes probable that the receivable will not be collected. Our allowance for bad debts is not significant.
Revenues of Financial Products are generated primarily from finance revenue on finance receivables and rental payments on operating leases. Finance revenue is recorded over the life of the related finance receivable using the interest method, including the accretion of certain direct origination costs that are deferred. Revenue from rental payments received on operating leases is recognized on a straight-line basis over the term of the lease.
Recognition of finance revenue and rental revenue is suspended and the account is placed on non-accrual status when management determines that collection of future income is not probable (generally after
120 days
past due). Recognition is resumed, and previously suspended income is recognized, when the account becomes current and collection of remaining amounts is considered probable. See Note 6 for more information.
Sales and revenues are presented net of sales and other related taxes.
|
D.
|
Inventories
|
Inventories are stated at the lower of cost or market. Cost is principally determined using the last-in, first-out (LIFO) method. The value of inventories on the LIFO basis represented about
60 percent
of total inventories at
December 31, 2016
and
2015
.
If the FIFO (first-in, first-out) method had been in use, inventories would have been
$2,139 million
and
$2,498 million
higher than reported at
December 31, 2016
and
2015
, respectively.
82
|
E.
|
Depreciation and amortization
|
Depreciation of plant and equipment is computed principally using accelerated methods. Depreciation on equipment leased to others, primarily for Financial Products, is computed using the straight-line method over the term of the lease. The depreciable basis is the original cost of the equipment less the estimated residual value of the equipment at the end of the lease term. In
2016
,
2015
and
2014
, Cat Financial depreciation on equipment leased to others was
$841 million
,
$836 million
and
$872 million
, respectively, and was included in Other operating (income) expenses in Statement 1. In
2016
,
2015
and
2014
, consolidated depreciation expense was
$2,707 million
,
$2,705 million
and
$2,795 million
, respectively. Amortization of purchased finite-lived intangibles is computed principally using the straight-line method, generally not to exceed a period of
20 years
.
|
F.
|
Foreign currency translation
|
The functional currency for most of our Machinery, Energy & Transportation consolidated companies is the U.S. dollar. The functional currency for most of our Financial Products and affiliates accounted for under the equity method is the respective local currency. Gains and losses resulting from the remeasurement of foreign currency amounts to the functional currency are included in Other income (expense) in Statement 1. Gains and losses resulting from translating assets and liabilities from the functional currency to U.S. dollars are included in Accumulated other comprehensive income (loss) in Statement 3.
|
G.
|
Derivative financial instruments
|
Our earnings and cash flow are subject to fluctuations due to changes in foreign currency exchange rates, interest rates and commodity prices. Our Risk Management Policy (policy) allows for the use of derivative financial instruments to prudently manage foreign currency exchange rate, interest rate and commodity price exposures. Our policy specifies that derivatives are not to be used for speculative purposes. Derivatives that we use are primarily foreign currency forward, option, and cross currency contracts, interest rate swaps, and commodity forward and option contracts. All derivatives are recorded at fair value. See Note 3 for more information.
|
H.
|
Income taxes
|
The provision for income taxes is determined using the asset and liability approach taking into account guidance related to uncertain tax positions. Tax laws require items to be included in tax filings at different times than the items are reflected in the financial statements. A current liability is recognized for the estimated taxes payable for the current year. Deferred taxes represent the future tax consequences expected to occur when the reported amounts of assets and liabilities are recovered or paid. Deferred taxes are adjusted for enacted changes in tax rates and tax laws. Valuation allowances are recorded to reduce deferred tax assets when it is more likely than not that a tax benefit will not be realized.
|
I.
|
Goodwill
|
For acquisitions accounted for as a business combination, goodwill represents the excess of the cost over the fair value of the net assets acquired. We are required to test goodwill for impairment, at the reporting unit level, annually and when events or circumstances indicate the fair value of a reporting unit may be below its carrying value. A reporting unit is an operating segment or one level below an operating segment (referred to as a component) to which goodwill is assigned when initially recorded. We assign goodwill to reporting units based on our integration plans and the expected synergies resulting from the acquisition. Because Caterpillar is a highly integrated company, the businesses we acquire are sometimes combined with or integrated into existing reporting units. When changes occur in the composition of our operating segments or reporting units, goodwill is reassigned to the affected reporting units based on their relative fair values.
83
We test goodwill for impairment annually and whenever events or circumstances make it more likely than not that an impairment may have occurred. We perform our annual goodwill impairment test as of October 1 and monitor for interim triggering events on an ongoing basis. Goodwill is reviewed for impairment utilizing either a qualitative assessment or a two-step process. We have an option to make a qualitative assessment of a reporting unit’s goodwill for impairment. If we choose to perform a qualitative assessment and determine the fair value more likely than not exceeds the carrying value, no further evaluation is necessary. For reporting units where we perform the two-step process, the first step requires us to compare the fair value of each reporting unit, which we primarily determine using an income approach based on the present value of discounted cash flows, to the respective carrying value, which includes goodwill. If the fair value of the reporting unit exceeds its carrying value, the goodwill is not considered impaired. If the carrying value is higher than the fair value, there is an indication that an impairment may exist and the second step is required. In step two, the implied fair value of goodwill is calculated as the excess of the fair value of a reporting unit over the fair values assigned to its assets and liabilities. If the implied fair value of goodwill is less than the carrying value of the reporting unit’s goodwill, the difference is recognized as an impairment loss. See Note 10 for further details.
|
J.
|
Estimates in financial statements
|
The preparation of financial statements in conformity with accounting principles generally accepted in the United States of America requires management to make estimates and assumptions that affect reported amounts. The more significant estimates include: residual values for leased assets, fair values for goodwill impairment tests, impairment of available-for-sale securities, warranty liability, stock-based compensation and reserves for product liability and insurance losses, postretirement benefits, post-sale discounts, credit losses and income taxes.
|
K.
|
New accounting guidance
|
Revenue recognition -
In May 2014, the Financial Accounting Standards Board (FASB) issued new revenue recognition guidance to provide a single, comprehensive revenue recognition model for all contracts with customers. Under the new guidance, an entity will recognize revenue to depict the transfer of promised goods or services to customers at an amount that the entity expects to be entitled to in exchange for those goods or services. A five step model has been introduced for an entity to apply when recognizing revenue. The new guidance also includes enhanced disclosure requirements, and is effective January 1, 2018, with early adoption permitted for January 1, 2017. Entities have the option to apply the new guidance under a retrospective approach to each prior reporting period presented, or a modified retrospective approach with the cumulative effect of initially applying the new guidance recognized at the date of initial application within the Consolidated Statement of Changes in Stockholders' Equity. We plan to adopt the new guidance effective January 1, 2018. We have made substantial progress in our evaluation of the impact of the new standard. Under the new guidance, we anticipate sales of certain turbine machinery units will change to a point-in-time recognition model. Under current guidance, we account for these sales under an over-time model following the percentage-of-completion method as the product is manufactured. In addition, under the new guidance we will begin to recognize an asset for the value of expected replacement part returns. At this time we have not identified any impacts to our financial statements that we believe will be material in the year of adoption. We are still evaluating the impact to certain revenue streams within our Energy & Transportation and Resource Industries segments and expect that evaluation to be completed during the first half of 2017. Based on the current estimated impact to our financial statements, we plan to adopt the new guidance under the modified retrospective approach.
Variable interest entities (VIE) -
In February 2015, the FASB issued accounting guidance on the consolidation of VIEs. The new guidance revises previous guidance by establishing an analysis for determining whether a limited partnership or similar entity is a VIE and whether outsourced decision-maker fees are considered variable interests. In addition, the new guidance revises how a reporting entity evaluates economics and related parties when assessing who should consolidate a VIE. The guidance was effective January 1, 2016 and did not have a material impact on our financial statements.
Presentation of debt issuance costs -
In April 2015, the FASB issued accounting guidance which requires debt issuance costs to be presented in the balance sheet as a direct deduction from the carrying value of the associated debt liability. Prior to the issuance of the new guidance, debt issuance costs were required to be presented in the balance sheet as an asset. The guidance was effective January 1, 2016. We retrospectively adopted this guidance and as a result
$80 million
of debt issuance costs were reclassified from Other assets to Long-term debt due within one year and Long-term debt due after one year within Statement 3 as of December 31, 2015.
Fair value disclosures for investments in certain entities that calculate net asset value per share -
In May 2015, the FASB issued accounting guidance which removes the requirement to categorize within the fair value hierarchy investments measured at net asset value (or its equivalent) as a practical expedient for fair value. The new guidance requires that the amount of these investments continue to be disclosed to reconcile the fair value hierarchy disclosure to the balance sheet. The guidance
84
was effective January 1, 2016 and was applied retrospectively. The adoption did not have a material impact on our financial statements.
Simplifying the measurement of inventory -
In July 2015, the FASB issued accounting guidance which requires that inventory be measured at the lower of cost or net realizable value. Prior to the issuance of the new guidance, inventory was measured at the lower of cost or market. Replacing the concept of market with the single measurement of net realizable value is intended to create efficiencies for preparers. Inventory measured using the last-in, first-out (LIFO) method and the retail inventory method are not impacted by the new guidance. The guidance was effective January 1, 2017 and will be applied prospectively. We do not expect the adoption to have a material impact on our financial statements.
Simplifying the accounting for measurement-period adjustments -
In September 2015, the FASB issued accounting guidance which eliminates the requirement for an acquirer in a business combination to restate prior period financial statements for measurement period adjustments. An acquirer in a business combination is required to report provisional amounts when measurements are incomplete at the end of the reporting period covering the business combination. Prior to the issuance of the new guidance, an acquirer was required to adjust such provisional amounts by restating prior period financial statements. Under the new guidance, the acquirer will recognize the measurement-period adjustment in the period the adjustment is determined. The guidance was effective January 1, 2016 and was applied prospectively. The adoption did not have a material impact on our financial statements.
Recognition and measurement of financial assets and financial liabilities -
In January 2016, the FASB issued accounting guidance that affects the accounting for equity investments, financial liabilities accounted for under the fair value option and the presentation and disclosure requirements for financial instruments. Under the new guidance, all equity investments in unconsolidated entities (other than those accounted for using the equity method of accounting) will generally be measured at fair value through earnings. There will no longer be an available-for-sale classification for equity securities with readily determinable fair values. For financial liabilities when the fair value option has been elected, changes in fair value due to instrument-specific credit risk will be recognized separately in other comprehensive income. In addition, the FASB clarified guidance related to the valuation allowance assessment when recognizing deferred tax assets resulting from unrealized losses on available-for-sale debt securities. The new guidance is effective January 1, 2018, with the cumulative effect adjustment from initially applying the new guidance recognized in the Consolidated Statement of Financial Position as of the beginning of the year of adoption. The impact on our financial statements at the time of adoption will primarily be based on changes in the fair value of our available-for-sale equity securities subsequent to January 1, 2018, which will be recorded through earnings.
Lease accounting -
In February 2016, the FASB issued accounting guidance that revises the accounting for leases. Under the new guidance, lessees are required to recognize a right-of-use asset and a lease liability for all leases. The new guidance will continue to classify leases as either financing or operating, with classification affecting the pattern of expense recognition. The accounting applied by a lessor under the new guidance will be substantially equivalent to current lease accounting guidance. The new guidance is effective January 1, 2019 with early adoption permitted. The new standard is required to be applied with a modified retrospective approach to each prior reporting period presented and provides for certain practical expedients. We are in the process of evaluating the effect of the new guidance on our financial statements.
Stock-based compensation
-
In March 2016, the FASB issued accounting guidance to simplify several aspects of the accounting for share-based payments. The new guidance changes how reporting entities account for certain aspects of share-based payments, including the accounting for income taxes and the classification of the tax impact on the Consolidated Statement of Cash Flow. Under the new guidance all excess tax benefits and deficiencies during the period are to be recognized in income (rather than equity) on a prospective basis. The guidance removes the requirement to delay recognition of excess
85
tax benefits until it reduces income taxes currently payable. This change is required to be applied on a modified retrospective basis, resulting in a cumulative-effect adjustment to opening retained earnings in the period of adoption. In addition, Cash flows related to excess tax benefits will be included in Cash provided by operating activities and will no longer be separately classified as a financing activity. We will adopt this change retrospectively. The guidance was effective January 1, 2017. We do not expect the adoption to have a material impact on our financial statements.
Measurement of credit losses on financial instruments
-
In June 2016, the FASB issued accounting guidance to introduce a new model for recognizing credit losses on financial instruments based on an estimate of current expected credit losses. The new guidance will apply to loans, accounts receivable, trade receivables, other financial assets measured at amortized cost, loan commitments and other off-balance sheet credit exposures. The new guidance will also apply to debt securities and other financial assets measured at fair value through other comprehensive income. The new guidance is effective January 1, 2020, with early adoption permitted beginning January 1, 2019. We are in the process of evaluating the effect of the new guidance on our financial statements.
Classification for certain cash receipts and cash payments
-
In August 2016, the FASB issued accounting guidance related to the presentation and classification of certain transactions in the statement of cash flows where diversity in practice exists. The guidance is effective January 1, 2018 with early adoption permitted. We do not expect the adoption to have a material impact on our financial statements.
Tax accounting for intra-entity asset transfers
-
In October 2016, the FASB issued accounting guidance that will require the tax effects of intra-entity asset transfers to be recognized in the period when the transfer occurs. Under current guidance, the tax effects of intra-entity sales of assets are deferred until the transferred asset is sold to a third party or otherwise recovered through use. The new guidance does not apply to intra-entity transfers of inventory. The guidance is effective January 1, 2018 with early adoption permitted and is required to be applied on a modified retrospective basis through a cumulative effect adjustment to retained earnings as of the beginning of the period of adoption. We are in the process of evaluating the effect of the new guidance on our financial statements and do not expect to early adopt.
Classification of restricted cash
-
In November 2016, the FASB issued accounting guidance related to the presentation and classification of changes in restricted cash on the statement of cash flows where diversity in practice exists. The new standard is required to be applied with a retrospective approach. The guidance is effective January 1, 2018 with early adoption permitted. We do not expect the adoption to have a material impact on our financial statements.
Clarification on the definition of a business
-
In January 2017, the FASB issued accounting guidance to clarify the definition of a business with the objective of adding guidance to assist entities with evaluating whether transactions should be accounted for as acquisitions (or disposals) of assets or businesses. The guidance is effective January 1, 2018 with early adoption permitted. We plan to adopt this guidance January 1, 2017, and we do not expect the adoption to have a material impact on our financial statements.
Simplifying the measurement for goodwill -
In January 2017, the FASB issued guidance to simplify the accounting for goodwill impairment. The guidance removes Step 2 of the goodwill impairment test, which requires a hypothetical purchase price allocation. A goodwill impairment will now be the amount by which a reporting unit’s carrying value exceeds its fair value, not to exceed the carrying amount of goodwill. The new guidance will be applied prospectively and is effective January 1, 2020, with early adoption permitted beginning January 1, 2017. We are in the process of evaluating the effect of the new guidance on our financial statements.
|
2.
|
Stock-based compensation
|
Our stock-based compensation plans primarily provide for the granting of stock options, stock-settled stock appreciation rights (SARs), restricted stock units (RSUs) and performance-based restricted stock units (PRSUs) to Officers and other key employees, as well as non-employee Directors. Stock options permit a holder to buy Caterpillar stock at the stock’s price when the option was granted. SARs permit a holder the right to receive the value in shares of the appreciation in Caterpillar stock that occurred from the date the right was granted up to the date of exercise. RSUs are agreements to issue shares of Caterpillar stock at the time of vesting. PRSUs are similar to RSUs and include performance conditions in the vesting terms of the award.
Our long-standing practices and policies specify all stock-based compensation awards are approved by the Compensation Committee (the Committee) of the Board of Directors on the date of grant. The stock-based award approval process specifies the number of awards granted, the terms of the award and the grant date. The same terms and conditions are consistently applied to all employee grants, including Officers. The Committee approves all individual Officer grants. The number of
86
stock-based compensation awards included in an individual’s award is determined based on the methodology approved by the Committee. The exercise price methodology approved by the Committee is the closing price of the Company stock on the date of the grant. The 2014 grant was issued under the Caterpillar Inc. 2006 Long-Term Incentive Plan (approved by stockholders in June of 2006). In June of 2014, stockholders approved the Caterpillar Inc. 2014 Long-Term Incentive Plan under which all new stock-based compensation awards are granted.
Common stock issued from Treasury stock under the plans totaled
4,164,134
for
2016
,
2,931,595
for
2015
and
10,106,542
for
2014
. The total number of shares authorized for equity awards under the Caterpillar Inc. 2014 Long-Term Incentive Plan is
38,800,000
, of which
17,231,358
shares remained available for issuance as of December 31, 2016.
Awards granted prior to 2015 generally vest
three years
after the date of grant (cliff vesting). The awards granted in 2015 and 2016 generally vest according to a
three
-year graded vesting schedule. One-third of the award will become vested on the first anniversary of the grant date, one-third of the award will become vested on the second anniversary of the grant date and one-third of the award will become vested on the third anniversary of the grant date. Beginning in 2015, PRSUs were granted. PRSUs generally have a
three
-year performance period and cliff vest at the end of the period based upon achievement of performance targets established at the time of grant.
At grant, SARs and option awards have a term life of
ten years
. Upon separation from service, if the participant is
55 years
of age or older with more than
five years
of service, the participant meets the criteria for a “Long Service Separation” and all outstanding stock options, SARs and RSUs will immediately vest. Outstanding PRSUs granted to employees with a "Long Service Separation" will vest at the end of the performance period based upon achievement of the performance target. For awards granted prior to 2016, if the “Long Service Separation” criteria are met, the vested options/SARs will have a life that is the lesser of
ten years
from the original grant date or
five years
from the separation date. For awards granted in 2016, the vested options/SARs will have a life equal to
ten years
from the original grant date. Compensation expense is fully recognized immediately on the grant date for employees who met the criteria for a "Long Service Separation". For employees who become eligible for immediate vesting under a "Long Service Separation" subsequent to the grant date and prior to the completion of the vesting period, compensation expense is recognized over the period from grant date to the date eligibility is achieved.
Accounting guidance on share-based payments requires companies to estimate the fair value of options/SARs on the date of grant using an option-pricing model. The fair value of our option/SAR grants was estimated using a lattice-based option-pricing model. The lattice-based option-pricing model considers a range of assumptions related to volatility, risk-free interest rate and historical employee behavior. Expected volatility was based on historical Caterpillar stock price movement and current implied volatilities from traded options on Caterpillar stock. The risk-free rate was based on U.S. Treasury security yields at the time of grant. The weighted-average dividend yield was based on historical information. The expected life was determined from the lattice-based model. The lattice-based model incorporated exercise and post vesting forfeiture assumptions based on analysis of historical data. The following table provides the assumptions used in determining the fair value of the stock-based awards for the years ended December 31,
2016
,
2015
and
2014
, respectively.
|
|
Grant Year
|
|||||||
|
|
2016
|
2015
|
2014
|
|||||
|
Weighted-average dividend yield
|
3.2
|
%
|
2.3
|
%
|
2.2
|
%
|
||
|
Weighted-average volatility
|
31.1
|
%
|
28.4
|
%
|
28.2
|
%
|
||
|
Range of volatilities
|
22.5-33.4%
|
|
19.9-35.9%
|
|
18.4-36.2%
|
|
||
|
Range of risk-free interest rates
|
0.62-1.73%
|
|
0.22-2.08%
|
|
0.12-2.60%
|
|
||
|
Weighted-average expected lives
|
8 years
|
|
8 years
|
|
8 years
|
|
||
The fair value of RSU and PRSU grants was estimated by reducing the stock price on the date of grant by the present value of the estimated dividends to be paid during the vesting period. The estimated dividends are based on Caterpillar’s quarterly dividend per share at the time of the grant.
87
Please refer to Tables I and II below for additional information on our stock-based awards.
|
TABLE I — Financial Information Related to Stock-based Compensation
|
||||||||||||||||||||
|
|
Stock options / SARs
|
RSUs
|
PRSUs
|
|||||||||||||||||
|
|
Shares
|
Weighted-
Average
Exercise
Price
|
Shares
|
Weighted-
Average
Grant Date Fair Value
|
Shares
|
Weighted-
Average
Grant Date Fair Value
|
||||||||||||||
|
|
|
|
|
|
|
|
|
|
|
|
|
|||||||||
|
Outstanding at January 1, 2016
|
38,338,525
|
|
$
|
77.84
|
|
4,330,513
|
|
$
|
83.14
|
|
132,068
|
|
$
|
77.47
|
|
|||||
|
Granted to officers and key employees
1
|
4,243,272
|
|
$
|
74.77
|
|
1,085,505
|
|
$
|
68.04
|
|
614,347
|
|
$
|
64.71
|
|
|||||
|
Exercised
|
(6,931,189
|
)
|
$
|
57.78
|
|
—
|
|
$
|
—
|
|
—
|
|
$
|
—
|
|
|||||
|
Vested
|
—
|
|
$
|
—
|
|
(2,232,695
|
)
|
$
|
82.44
|
|
—
|
|
$
|
—
|
|
|||||
|
Forfeited / expired
|
(3,585,818
|
)
|
$
|
74.59
|
|
(112,309
|
)
|
$
|
77.71
|
|
(36,129
|
)
|
$
|
67.96
|
|
|||||
|
Outstanding at December 31, 2016
|
32,064,790
|
|
$
|
82.13
|
|
3,071,014
|
|
$
|
78.50
|
|
710,286
|
|
$
|
66.92
|
|
|||||
|
Exercisable at December 31, 2016
|
20,991,816
|
|
$
|
81.18
|
|
|||||||||||||||
|
Stock options/SARs outstanding and exercisable as of December 31, 2016:
|
||||||||||||||||||||||||||
|
|
Outstanding
|
Exercisable
|
||||||||||||||||||||||||
|
Exercise Prices
|
Shares Outstanding at 12/31/16
|
Weighted-
Average
Remaining
Contractual Life (Years)
|
Weighted-
Average
Exercise Price
|
Aggregate
Intrinsic Value
2
|
Shares Outstanding at 12/31/16
|
Weighted-
Average
Remaining
Contractual Life (Years)
|
Weighted-
Average
Exercise Price
|
Aggregate
Intrinsic Value
2
|
||||||||||||||||||
|
$22.17 - 57.85
|
5,405,540
|
|
2.83
|
$
|
45.64
|
|
$
|
255
|
|
5,405,540
|
|
2.83
|
$
|
45.64
|
|
$
|
255
|
|
||||||||
|
$63.04 - 74.77
|
5,220,662
|
|
7.42
|
$
|
74.23
|
|
97
|
|
1,368,924
|
|
2.45
|
$
|
72.70
|
|
27
|
|
||||||||||
|
$83.00 - 86.77
|
7,074,057
|
|
8.08
|
$
|
83.05
|
|
69
|
|
2,994,626
|
|
8.18
|
$
|
83.00
|
|
29
|
|
||||||||||
|
$88.51 - 96.31
|
8,576,789
|
|
6.49
|
$
|
92.88
|
|
14
|
|
5,434,984
|
|
6.09
|
$
|
90.90
|
|
14
|
|
||||||||||
|
$102.13 - 110.09
|
5,787,742
|
|
4.71
|
$
|
106.31
|
|
—
|
|
5,787,742
|
|
4.71
|
$
|
106.31
|
|
—
|
|
||||||||||
|
|
32,064,790
|
|
|
$
|
82.13
|
|
$
|
435
|
|
20,991,816
|
|
|
$
|
81.18
|
|
$
|
325
|
|
||||||||
|
1
|
No
SARs were granted during the year ended December 31,
2016
.
|
|
2
|
The difference between a stock award’s exercise price and the underlying stock’s closing market price at December 31,
2016
, for awards with market price greater than the exercise price. Amounts are in millions of dollars.
|
The computations of weighted-average exercise prices and aggregate intrinsic values are not applicable to RSUs or PRSUs since these awards represent an agreement to issue shares of stock at the time of vesting. At December 31,
2016
, there were
3,071,014
outstanding RSUs with a weighted average remaining contractual life of
1.2 years
and
710,286
outstanding PRSUs with a weighted-average remaining contractual life of
1.8 years
.
88
|
TABLE II— Additional Stock-based Award Information
|
||||||||||||
|
(Dollars in millions except per share data)
|
2016
|
2015
|
2014
|
|||||||||
|
Stock options/SARs activity:
|
|
|
|
|
|
|
||||||
|
Weighted-average fair value per share of stock awards granted
|
$
|
20.64
|
|
$
|
23.61
|
|
$
|
29.52
|
|
|||
|
Intrinsic value of stock awards exercised
|
$
|
185
|
|
$
|
93
|
|
$
|
649
|
|
|||
|
Fair value of stock awards vested
1
|
$
|
163
|
|
$
|
155
|
|
$
|
108
|
|
|||
|
Cash received from stock awards exercised
|
$
|
30
|
|
$
|
59
|
|
$
|
259
|
|
|||
|
RSUs activity:
|
|
|
|
|
|
|
||||||
|
Weighted-average fair value per share of stock awards granted
|
$
|
68.04
|
|
$
|
77.55
|
|
$
|
89.18
|
|
|||
|
Fair value of stock awards vested
2
|
$
|
162
|
|
$
|
109
|
|
$
|
106
|
|
|||
|
PRSUs activity:
|
|
|
|
|
|
|
||||||
|
Weighted-average fair value per share of stock awards granted
|
$
|
64.71
|
|
$
|
77.47
|
|
$
|
—
|
|
|||
|
Fair value of stock awards vested
2
|
$
|
—
|
|
$
|
—
|
|
$
|
—
|
|
|||
|
1
|
Based on the grant date fair value.
|
|
2
|
Based on the underlying stock's closing market price on the vesting date.
|
In accordance with guidance on share-based payments, stock-based compensation expense is based on the grant date fair value and is classified within Cost of goods sold, Selling, general and administrative expenses and Research and development expenses corresponding to the same line item as the cash compensation paid to respective employees, officers and non-employee directors. Stock-based compensation expense is recognized on a straight-line basis over the requisite service period for awards with terms that specify cliff or graded vesting and contain only service conditions. Stock-based compensation expense for PRSUs is based on the probable number of shares expected to vest and is recognized primarily on a straight-line basis.
Before tax, stock-based compensation expense for
2016
,
2015
and
2014
was
$218 million
,
$283 million
and
$254 million
, respectively, with a corresponding income tax benefit of
$61 million
,
$87 million
and
$79 million
, respectively.
The amount of stock-based compensation expense capitalized for the years ended December 31,
2016
,
2015
and
2014
did not have a significant impact on our financial statements.
At December 31,
2016
, there was
$170 million
of total unrecognized compensation cost from stock-based compensation arrangements granted under the plans, which is related to non-vested stock-based awards. The compensation expense is expected to be recognized over a weighted-average period of approximately
1.6 years
.
We currently use shares in treasury stock to satisfy share award exercises.
The cash tax benefits realized from stock awards exercised for
2016
,
2015
and
2014
were
$104 million
,
$68 million
and
$253 million
, respectively. We use the direct only method and tax law ordering approach to calculate the tax effects of stock-based compensation. In certain jurisdictions, tax deductions for exercises of stock-based awards did not generate a cash benefit. A tax benefit of approximately
$15 million
will be recorded in additional paid-in capital when these deductions reduce our future income taxes payable.
89
|
3.
|
Derivative financial instruments and risk management
|
Our earnings and cash flow are subject to fluctuations due to changes in foreign currency exchange rates, interest rates and commodity prices. Our Risk Management Policy (policy) allows for the use of derivative financial instruments to prudently manage foreign currency exchange rate, interest rate and commodity price exposures. Our policy specifies that derivatives are not to be used for speculative purposes. Derivatives that we use are primarily foreign currency forward, option and cross currency contracts, interest rate contracts and commodity forward and option contracts. Our derivative activities are subject to the management, direction and control of our senior financial officers. Risk management practices, including the use of financial derivative instruments, are presented to the Audit Committee of the Board of Directors at least annually.
All derivatives are recognized in Statement 3 at their fair value. On the date the derivative contract is entered into, we designate the derivative as (1) a hedge of the fair value of a recognized asset or liability (fair value hedge), (2) a hedge of a forecasted transaction or the variability of cash flow (cash flow hedge) or (3) an undesignated instrument. Changes in the fair value of a derivative that is qualified, designated and highly effective as a fair value hedge, along with the gain or loss on the hedged recognized asset or liability that is attributable to the hedged risk, are recorded in current earnings. Changes in the fair value of a derivative that is qualified, designated and highly effective as a cash flow hedge are recorded in Accumulated other comprehensive income (loss) (AOCI), to the extent effective, in Statement 3 until they are reclassified to earnings in the same period or periods during which the hedged transaction affects earnings. Changes in the fair value of undesignated derivative instruments and the ineffective portion of designated derivative instruments are reported in current earnings. Cash flows from designated derivative financial instruments are classified within the same category as the item being hedged on Statement 5. Cash flows from undesignated derivative financial instruments are included in the investing category on Statement 5.
We formally document all relationships between hedging instruments and hedged items, as well as the risk-management objective and strategy for undertaking various hedge transactions. This process includes linking all derivatives that are designated as fair value hedges to specific assets and liabilities in Statement 3 and linking cash flow hedges to specific forecasted transactions or variability of cash flow.
We also formally assess, both at the hedge’s inception and on an ongoing basis, whether the designated derivatives that are used in hedging transactions are highly effective in offsetting changes in fair values or cash flow of hedged items. When a derivative is determined not to be highly effective as a hedge or the underlying hedged transaction is no longer probable, we discontinue hedge accounting prospectively, in accordance with the derecognition criteria for hedge accounting.
|
A.
|
Foreign currency exchange rate risk
|
Foreign currency exchange rate movements create a degree of risk by affecting the U.S. dollar value of sales made and costs incurred in foreign currencies. Movements in foreign currency rates also affect our competitive position as these changes may affect business practices and/or pricing strategies of non-U.S.-based competitors. Additionally, we have balance sheet positions denominated in foreign currencies, thereby creating exposure to movements in exchange rates.
Our Machinery, Energy & Transportation operations purchase, manufacture and sell products in many locations around the world. As we have a diversified revenue and cost base, we manage our future foreign currency cash flow exposure on a net basis. We use foreign currency forward and option contracts to manage unmatched foreign currency cash inflow and outflow. Our objective is to minimize the risk of exchange rate movements that would reduce the U.S. dollar value of our foreign currency cash flow. Our policy allows for managing anticipated foreign currency cash flow for up to
five years
. As of
December 31, 2016
, the maximum term of these outstanding contracts was approximately
51 months
.
We generally designate as cash flow hedges at inception of the contract any Australian dollar, Brazilian real, British pound, Canadian dollar, Chinese yuan, euro, Indian rupee, Japanese yen, Mexican peso, Norwegian krona, Singapore dollar, Swiss franc, or Thailand baht forward or option contracts that meet the requirements for hedge accounting and the maturity extends beyond the current quarter-end. Designation is performed on a specific exposure basis to support hedge accounting. The remainder of Machinery, Energy & Transportation foreign currency contracts are undesignated.
As of
December 31, 2016
,
$52 million
of deferred net losses, net of tax, included in equity (AOCI in Statement 3), are expected to be reclassified to current earnings (Other income (expense) in Statement 1) over the next twelve months when earnings are affected by the hedged transactions. The actual amount recorded in Other income (expense) will vary based on exchange rates at the time the hedged transactions impact earnings.
In managing foreign currency risk for our Financial Products operations, our objective is to minimize earnings volatility resulting from conversion and the remeasurement of net foreign currency balance sheet positions, and future transactions
90
denominated in foreign currencies. Our policy allows the use of foreign currency forward, option and cross currency contracts to offset the risk of currency mismatch between our assets and liabilities, and exchange rate risk associated with future transactions denominated in foreign currencies. Our foreign currency forward, option and cross currency contracts are primarily undesignated. We designate fixed-to-fixed cross currency contracts as cash flow hedges to protect against movements in exchange rates on foreign currency fixed rate assets and liabilities.
|
B.
|
Interest rate risk
|
Interest rate movements create a degree of risk by affecting the amount of our interest payments and the value of our fixed-rate debt. Our practice is to use interest rate derivatives to manage our exposure to interest rate changes.
Our Machinery, Energy & Transportation operations generally use fixed-rate debt as a source of funding. Our objective is to minimize the cost of borrowed funds. Our policy allows us to enter into fixed-to-floating interest rate contracts and forward rate agreements to meet that objective. We designate fixed-to-floating interest rate contracts as fair value hedges at inception of the contract, and we designate certain forward rate agreements as cash flow hedges at inception of the contract.
Financial Products operations has a match-funding policy that addresses interest rate risk by aligning the interest rate profile (fixed or floating rate) of Cat Financial’s debt portfolio with the interest rate profile of their receivables portfolio within predetermined ranges on an ongoing basis. In connection with that policy, we use interest rate derivative instruments to modify the debt structure to match assets within the receivables portfolio. This matched funding reduces the volatility of margins between interest-bearing assets and interest-bearing liabilities, regardless of which direction interest rates move.
Our policy allows us to use fixed-to-floating, floating-to-fixed and floating-to-floating interest rate contracts to meet the match-funding objective. We designate fixed-to-floating interest rate contracts as fair value hedges to protect debt against changes in fair value due to changes in the benchmark interest rate. We designate most floating-to-fixed interest rate contracts as cash flow hedges to protect against the variability of cash flows due to changes in the benchmark interest rate.
We have, at certain times, liquidated fixed-to-floating and floating-to-fixed interest rate contracts at both Machinery, Energy & Transportation and Financial Products. The gains or losses associated with these contracts at the time of liquidation are amortized into earnings over the original term of the previously designated hedged item.
|
C.
|
Commodity price risk
|
Commodity price movements create a degree of risk by affecting the price we must pay for certain raw material. Our policy is to use commodity forward and option contracts to manage the commodity risk and reduce the cost of purchased materials.
Our Machinery, Energy & Transportation operations purchase base and precious metals embedded in the components we purchase from suppliers. Our suppliers pass on to us price changes in the commodity portion of the component cost. In addition, we are subject to price changes on energy products such as natural gas and diesel fuel purchased for operational use.
Our objective is to minimize volatility in the price of these commodities. Our policy allows us to enter into commodity forward and option contracts to lock in the purchase price of a portion of these commodities within a
five
-year horizon. All such commodity forward and option contracts are undesignated.
91
The location and fair value of derivative instruments reported in Statement 3 are as follows:
|
Consolidated
Statement of Financial Position Location
|
Asset (Liability) Fair Value
|
||||||||
|
(Millions of dollars)
|
Years ended December 31,
|
||||||||
|
|
|
2016
|
2015
|
||||||
|
Designated derivatives
|
|
|
|
|
|
||||
|
Foreign exchange contracts
|
|
|
|
|
|
||||
|
Machinery, Energy & Transportation
|
Receivables — trade and other
|
$
|
13
|
|
$
|
12
|
|
||
|
Machinery, Energy & Transportation
|
Accrued expenses
|
(93
|
)
|
(25
|
)
|
||||
|
Machinery, Energy & Transportation
|
Other liabilities
|
(36
|
)
|
—
|
|
||||
|
Financial Products
|
Long-term receivables — trade and other
|
29
|
|
—
|
|
||||
|
Financial Products
|
Accrued expenses
|
(3
|
)
|
—
|
|
||||
|
Interest rate contracts
|
|
|
|
|
|
||||
|
Financial Products
|
Receivables — trade and other
|
—
|
|
1
|
|
||||
|
Financial Products
|
Long-term receivables — trade and other
|
4
|
|
51
|
|
||||
|
Financial Products
|
Accrued expenses
|
(1
|
)
|
(4
|
)
|
||||
|
|
|
$
|
(87
|
)
|
$
|
35
|
|
||
|
Undesignated derivatives
|
|
|
|
|
|
||||
|
Foreign exchange contracts
|
|
|
|
|
|
||||
|
Machinery, Energy & Transportation
|
Receivables — trade and other
|
$
|
—
|
|
$
|
2
|
|
||
|
Machinery, Energy & Transportation
|
Accrued expenses
|
(30
|
)
|
(9
|
)
|
||||
|
Financial Products
|
Receivables — trade and other
|
39
|
|
3
|
|
||||
|
Financial Products
|
Long-term receivables — trade and other
|
—
|
|
36
|
|
||||
|
Financial Products
|
Accrued expenses
|
(4
|
)
|
(6
|
)
|
||||
|
Commodity contracts
|
|
|
|
|
|
||||
|
Machinery, Energy & Transportation
|
Receivables — trade and other
|
10
|
|
—
|
|
||||
|
Machinery, Energy & Transportation
|
Accrued expenses
|
—
|
|
(12
|
)
|
||||
|
|
|
$
|
15
|
|
$
|
14
|
|
||
The total notional amounts of the derivative instruments are as follows:
|
Years ended December 31,
|
||||||||
|
(Millions of dollars)
|
2016
|
2015
|
||||||
|
Machinery, Energy & Transportation
|
$
|
2,530
|
|
$
|
2,040
|
|
||
|
Financial Products
|
$
|
2,626
|
|
$
|
3,539
|
|
||
The notional amounts of the derivative financial instruments do not represent amounts exchanged by the parties. The amounts exchanged by the parties are calculated by reference to the notional amounts and by other terms of the derivatives, such as foreign currency exchange rates, interest rates or commodity prices.
92
The effect of derivatives designated as hedging instruments on Statement 1 is as follows:
|
Fair Value Hedges
|
|
Year ended December 31, 2016
|
||||||||
|
(Millions of dollars)
|
Classification
|
Gains (Losses)
on Derivatives
|
Gains (Losses)
on Borrowings
|
|||||||
|
Interest rate contracts
|
|
|
|
|
|
|||||
|
Financial Products
|
Other income (expense)
|
$
|
(12
|
)
|
$
|
11
|
|
|||
|
|
|
$
|
(12
|
)
|
$
|
11
|
|
|||
|
|
|
Year ended December 31, 2015
|
||||||||
|
|
Classification
|
Gains (Losses)
on Derivatives
|
Gains (Losses)
on Borrowings
|
|||||||
|
Interest rate contracts
|
|
|
|
|
|
|||||
|
Financial Products
|
Other income (expense)
|
$
|
(27
|
)
|
$
|
26
|
|
|||
|
|
|
$
|
(27
|
)
|
$
|
26
|
|
|||
|
|
|
Year ended December 31, 2014
|
||||||||
|
|
Classification
|
Gains (Losses)
on Derivatives
|
Gains (Losses)
on Borrowings
|
|||||||
|
Interest rate contracts
|
|
|
|
|
|
|||||
|
Financial Products
|
Other income (expense)
|
$
|
(41
|
)
|
$
|
23
|
|
|||
|
|
|
$
|
(41
|
)
|
$
|
23
|
|
|||
93
|
Cash Flow Hedges
|
|||||||||||||||
|
(Millions of dollars)
|
Year ended December 31, 2016
|
|
|||||||||||||
|
|
|
Recognized in Earnings
|
|
||||||||||||
|
Amount of
Gains (Losses) Recognized in AOCI (Effective Portion) |
Classification of
Gains (Losses)
|
Amount of Gains (Losses) Reclassified from AOCI to Earnings
|
Recognized in Earnings (Ineffective Portion)
|
|
|||||||||||
|
Foreign exchange contracts
|
|
|
|
|
|
|
|
|
|||||||
|
Machinery, Energy & Transportation
|
$
|
(118
|
)
|
Other income (expense)
|
$
|
(14
|
)
|
$
|
—
|
|
|
||||
|
Financial Products
|
15
|
|
Other income (expense)
|
28
|
|
—
|
|
||||||||
|
Interest rate contracts
|
|
|
|
|
|
|
|
|
|||||||
|
Machinery, Energy & Transportation
|
—
|
|
Interest expense excluding Financial Products
|
(6
|
)
|
—
|
|
|
|||||||
|
Financial Products
|
8
|
|
Interest expense of Financial Products
|
(3
|
)
|
—
|
|
||||||||
|
|
$
|
(95
|
)
|
|
$
|
5
|
|
$
|
—
|
|
|||||
|
|
Year ended December 31, 2015
|
|
|||||||||||||
|
|
|
Recognized in Earnings
|
|
||||||||||||
|
|
Amount of
Gains (Losses) Recognized in AOCI (Effective Portion) |
Classification of
Gains (Losses)
|
Amount of
Gains (Losses)
Reclassified
from AOCI to
Earnings
|
Recognized in Earnings (Ineffective Portion)
|
|
||||||||||
|
Foreign exchange contracts
|
|
|
|
|
|
|
|
|
|||||||
|
Machinery, Energy & Transportation
|
$
|
(33
|
)
|
Other income (expense)
|
$
|
(128
|
)
|
$
|
—
|
|
|
||||
|
Financial Products
|
—
|
|
Other income (expense)
|
1
|
|
—
|
|
||||||||
|
Interest rate contracts
|
|
|
|
|
|
|
|
|
|||||||
|
Machinery, Energy & Transportation
|
—
|
|
Interest expense excluding Financial Products
|
(6
|
)
|
—
|
|
|
|||||||
|
Financial Products
|
3
|
|
Interest expense of Financial Products
|
(6
|
)
|
—
|
|
||||||||
|
|
$
|
(30
|
)
|
|
$
|
(139
|
)
|
$
|
—
|
|
|
||||
|
|
Year ended December 31, 2014
|
|
|||||||||||||
|
|
|
Recognized in Earnings
|
|
||||||||||||
|
|
Amount of
Gains (Losses) Recognized in AOCI (Effective Portion) |
Classification of
Gains (Losses)
|
Amount of
Gains (Losses)
Reclassified
from AOCI to
Earnings
|
Recognized in Earnings (Ineffective Portion)
|
|
||||||||||
|
Foreign exchange contracts
|
|||||||||||||||
|
Machinery, Energy & Transportation
|
$
|
(118
|
)
|
Other income (expense)
|
$
|
5
|
|
$
|
—
|
|
|
||||
|
Interest rate contracts
|
|
|
|
|
|
|
|
|
|||||||
|
Machinery, Energy & Transportation
|
(63
|
)
|
Interest expense excluding Financial Products
|
(5
|
)
|
—
|
|
|
|||||||
|
Financial Products
|
(6
|
)
|
Interest expense of Financial Products
|
(6
|
)
|
—
|
|
||||||||
|
|
$
|
(187
|
)
|
$
|
(6
|
)
|
$
|
—
|
|
|
|||||
94
The effect of derivatives not designated as hedging instruments on Statement 1 is as follows:
|
|
|
Years ended December 31,
|
||||||||||||
|
(Millions of dollars)
|
Classification of Gains (Losses)
|
2016
|
2015
|
2014
|
||||||||||
|
Foreign exchange contracts
|
|
|
|
|
|
|
|
|||||||
|
Machinery, Energy & Transportation
|
Other income (expense)
|
$
|
(4
|
)
|
$
|
(32
|
)
|
$
|
(60
|
)
|
||||
|
Financial Products
|
Other income (expense)
|
(24
|
)
|
(34
|
)
|
(47
|
)
|
|||||||
|
Interest rate contracts
|
|
|
|
|
|
|
|
|||||||
|
Machinery, Energy & Transportation
|
Other income (expense)
|
2
|
|
2
|
|
2
|
|
|||||||
|
Commodity contracts
|
|
|
|
|
|
|
|
|||||||
|
Machinery, Energy & Transportation
|
Other income (expense)
|
16
|
|
(23
|
)
|
(15
|
)
|
|||||||
|
|
|
$
|
(10
|
)
|
$
|
(87
|
)
|
$
|
(120
|
)
|
||||
We enter into International Swaps and Derivatives Association (ISDA) master netting agreements within Machinery, Energy & Transportation and Financial Products that permit the net settlement of amounts owed under their respective derivative contracts. Under these master netting agreements, net settlement generally permits the company or the counterparty to determine the net amount payable for contracts due on the same date and in the same currency for similar types of derivative transactions. The master netting agreements generally also provide for net settlement of all outstanding contracts with a counterparty in the case of an event of default or a termination event.
Collateral is generally not required of the counterparties or of our company under the master netting agreements. As of
December 31, 2016
and
2015
,
no
cash collateral was received or pledged under the master netting agreements.
95
The effect of the net settlement provisions of the master netting agreements on our derivative balances upon an event of default or termination event is as follows:
|
December 31, 2016
|
Gross Amounts Not Offset in the Statement of Financial Position
|
||||||||||||||||||||||||
|
(Millions of dollars)
|
Gross Amount of Recognized Assets
|
Gross Amounts Offset in the Statement of Financial Position
|
Net Amount of Assets Presented in the Statement of Financial Position
|
Financial Instruments
|
Cash Collateral Received
|
Net Amount of Assets
|
|||||||||||||||||||
|
Derivatives
|
|||||||||||||||||||||||||
|
Machinery, Energy & Transportation
|
$
|
23
|
|
$
|
—
|
|
$
|
23
|
|
$
|
(21
|
)
|
$
|
—
|
|
$
|
2
|
|
|||||||
|
Financial Products
|
72
|
|
—
|
|
72
|
|
(7
|
)
|
—
|
|
65
|
|
|||||||||||||
|
Total
|
$
|
95
|
|
$
|
—
|
|
$
|
95
|
|
$
|
(28
|
)
|
$
|
—
|
|
$
|
67
|
|
|||||||
|
December 31, 2016
|
Gross Amounts Not Offset in the Statement of Financial Position
|
||||||||||||||||||||||||
|
(Millions of dollars)
|
Gross Amount of Recognized Liabilities
|
Gross Amounts Offset in the Statement of Financial Position
|
Net Amount of Liabilities Presented in the Statement of Financial Position
|
Financial Instruments
|
Cash Collateral Pledged
|
Net Amount of Liabilities
|
|||||||||||||||||||
|
Derivatives
|
|||||||||||||||||||||||||
|
Machinery, Energy & Transportation
|
$
|
(159
|
)
|
$
|
—
|
|
$
|
(159
|
)
|
$
|
21
|
|
$
|
—
|
|
$
|
(138
|
)
|
|||||||
|
Financial Products
|
(8
|
)
|
—
|
|
(8
|
)
|
7
|
|
—
|
|
(1
|
)
|
|||||||||||||
|
Total
|
$
|
(167
|
)
|
$
|
—
|
|
$
|
(167
|
)
|
$
|
28
|
|
$
|
—
|
|
$
|
(139
|
)
|
|||||||
|
December 31, 2015
|
Gross Amounts Not Offset in the Statement of Financial Position
|
||||||||||||||||||||||||
|
(Millions of dollars)
|
Gross Amount of Recognized Assets
|
Gross Amounts Offset in the Statement of Financial Position
|
Net Amount of Assets Presented in the Statement of Financial Position
|
Financial Instruments
|
Cash Collateral Received
|
Net Amount of Assets
|
|||||||||||||||||||
|
Derivatives
|
|||||||||||||||||||||||||
|
Machinery, Energy & Transportation
|
$
|
14
|
|
$
|
—
|
|
$
|
14
|
|
$
|
(14
|
)
|
$
|
—
|
|
$
|
—
|
|
|||||||
|
Financial Products
|
91
|
|
—
|
|
91
|
|
(5
|
)
|
—
|
|
86
|
|
|||||||||||||
|
Total
|
$
|
105
|
|
$
|
—
|
|
$
|
105
|
|
$
|
(19
|
)
|
$
|
—
|
|
$
|
86
|
|
|||||||
|
December 31, 2015
|
Gross Amounts Not Offset in the Statement of Financial Position
|
||||||||||||||||||||||||
|
(Millions of dollars)
|
Gross Amount of Recognized Liabilities
|
Gross Amounts Offset in the Statement of Financial Position
|
Net Amount of Liabilities Presented in the Statement of Financial Position
|
Financial Instruments
|
Cash Collateral Pledged
|
Net Amount of Liabilities
|
|||||||||||||||||||
|
Derivatives
|
|||||||||||||||||||||||||
|
Machinery, Energy & Transportation
|
$
|
(46
|
)
|
$
|
—
|
|
$
|
(46
|
)
|
$
|
14
|
|
$
|
—
|
|
$
|
(32
|
)
|
|||||||
|
Financial Products
|
(10
|
)
|
—
|
|
(10
|
)
|
5
|
|
—
|
|
(5
|
)
|
|||||||||||||
|
Total
|
$
|
(56
|
)
|
$
|
—
|
|
$
|
(56
|
)
|
$
|
19
|
|
$
|
—
|
|
$
|
(37
|
)
|
|||||||
96
|
4.
|
Other income (expense)
|
|
|
Years ended December 31,
|
|||||||||||
|
(Millions of dollars)
|
2016
|
2015
|
2014
|
|||||||||
|
Investment and interest income
|
$
|
74
|
|
$
|
65
|
|
$
|
66
|
|
|||
|
Foreign exchange gains (losses)
1
|
(57
|
)
|
(173
|
)
|
137
|
|
||||||
|
License fee income
|
92
|
|
111
|
|
128
|
|
||||||
|
Gains (losses) on sale of securities and affiliated companies
|
47
|
|
176
|
|
2
|
36
|
|
|||||
|
Miscellaneous income (loss)
|
(10
|
)
|
(18
|
)
|
(45
|
)
|
||||||
|
Total
|
$
|
146
|
|
$
|
161
|
|
$
|
322
|
|
|||
|
1
|
Includes gains (losses) from foreign exchange derivative contracts. See Note 3 for further details.
|
|
2
|
Includes pretax gain of
$120 million
related to the sale of Caterpillar's
35 percent
equity interest in the third party logistics business. See Note 9 for further details.
|
|
5.
|
Income taxes
|
|
The components of profit before taxes were:
|
||||||||||||
|
|
Years ended December 31,
|
|||||||||||
|
(Millions of dollars)
|
2016
|
2015
|
2014
|
|||||||||
|
U.S.
|
$
|
(2,053
|
)
|
$
|
636
|
|
$
|
276
|
|
|||
|
Non-U.S.
|
2,192
|
|
2,803
|
|
2,876
|
|
||||||
|
|
$
|
139
|
|
$
|
3,439
|
|
$
|
3,152
|
|
|||
Profit before taxes, as shown above, is based on the location of the entity to which such earnings are attributable. Where an entity’s earnings are subject to taxation, however, may not correlate solely to where an entity is located. Thus, the income tax provision shown below as U.S. or non-U.S. may not correspond to the earnings shown above.
|
The components of the provision (benefit) for income taxes were:
|
||||||||||||
|
|
Years ended December 31,
|
|||||||||||
|
(Millions of dollars)
|
2016
|
2015
|
2014
|
|||||||||
|
Current tax provision (benefit):
|
|
|
|
|
|
|
||||||
|
U.S.
1
|
$
|
(90
|
)
|
$
|
525
|
|
$
|
715
|
|
|||
|
Non-U.S.
|
718
|
|
656
|
|
883
|
|
||||||
|
State (U.S.)
|
(5
|
)
|
42
|
|
48
|
|
||||||
|
|
623
|
|
1,223
|
|
1,646
|
|
||||||
|
Deferred tax provision (benefit):
|
|
|
|
|
|
|
||||||
|
U.S.
1
|
(544
|
)
|
(367
|
)
|
(763
|
)
|
||||||
|
Non-U.S.
|
(108
|
)
|
66
|
|
(116
|
)
|
||||||
|
State (U.S.)
|
221
|
|
(6
|
)
|
(75
|
)
|
||||||
|
|
(431
|
)
|
(307
|
)
|
(954
|
)
|
||||||
|
Total provision (benefit) for income taxes
|
$
|
192
|
|
$
|
916
|
|
$
|
692
|
|
|||
|
1
Includes U.S. taxes related to non-U.S. profits.
|
||||||||||||
97
We paid net income tax and related interest of
$522 million
,
$1,143 million
and
$1,595 million
in
2016
,
2015
and
2014
, respectively.
Reconciliation of the U.S. federal statutory rate to effective rate:
|
Years ended December 31,
|
|||||||||||||||||||||
|
(Millions of dollars)
|
2016
|
2015
|
2014
|
||||||||||||||||||
|
Taxes at U.S. statutory rate
|
$
|
49
|
|
35.0
|
%
|
$
|
1,203
|
|
35.0
|
%
|
$
|
1,103
|
|
35.0
|
%
|
||||||
|
(Decreases) increases resulting from:
|
|
|
|
|
|
|
|
|
|
|
|
|
|||||||||
|
Non-U.S. subsidiaries taxed at other than 35%
|
(119
|
)
|
(85.6
|
)%
|
(236
|
)
|
(6.9
|
)%
|
(223
|
)
|
(7.1
|
)%
|
|||||||||
|
Nondeductible goodwill
|
191
|
|
137.4
|
%
|
—
|
|
—
|
%
|
—
|
|
—
|
%
|
|||||||||
|
State and local taxes, net of federal
|
(1
|
)
|
(0.7
|
)%
|
24
|
|
0.7
|
%
|
(17
|
)
|
(0.5
|
)%
|
|||||||||
|
Interest and penalties, net of tax
|
24
|
|
17.2
|
%
|
12
|
|
0.4
|
%
|
12
|
|
0.4
|
%
|
|||||||||
|
U.S. research and production incentives
|
(52
|
)
|
(37.4
|
)%
|
(95
|
)
|
(2.7
|
)%
|
(125
|
)
|
(4.0
|
)%
|
|||||||||
|
ESOP dividend tax benefit
|
(27
|
)
|
(19.4
|
)%
|
(27
|
)
|
(0.8
|
)%
|
(25
|
)
|
(0.8
|
)%
|
|||||||||
|
Other—net
|
(14
|
)
|
(10.1
|
)%
|
(7
|
)
|
(0.2
|
)%
|
11
|
|
0.4
|
%
|
|||||||||
|
|
51
|
|
36.4
|
%
|
874
|
|
25.5
|
%
|
736
|
|
23.4
|
%
|
|||||||||
|
Prior year tax and interest adjustments
|
—
|
|
—
|
%
|
42
|
|
1.2
|
%
|
(21
|
)
|
(0.7
|
)%
|
|||||||||
|
Valuation allowances
|
141
|
|
101.4
|
%
|
—
|
|
—
|
%
|
(23
|
)
|
(0.7
|
)%
|
|||||||||
|
Provision (benefit) for income taxes
|
$
|
192
|
|
137.8
|
%
|
$
|
916
|
|
26.7
|
%
|
$
|
692
|
|
22.0
|
%
|
||||||
The negative impact on the effective tax rate from the portion of the Surface Mining & Technology goodwill impairment not deductible for tax purposes is reported in the effective tax rate reconciliation line item above labeled "Nondeductible goodwill". Included in the line item above labeled "Non-U.S. subsidiaries taxed at other than 35%" are the effects of indefinitely reinvested earnings of non-U.S. subsidiaries taxed at local tax rates, changes in the amount of unrecognized tax benefits associated with these earnings, losses at non-U.S. subsidiaries without local tax benefits due to valuation allowances, and other permanent differences between tax and U.S. GAAP results. The indefinitely reinvested profits of Caterpillar SARL (CSARL), primarily taxable in Switzerland, contribute the most significant amount of this line item. Although not individually significant by jurisdiction, pre-tax permanent differences due to nondeductible net foreign exchange losses of non-U.S. subsidiaries were approximately
$130 million
in
2016
and
2015
and less than
$10 million
in
2014
.
The provision for income taxes for 2016 also includes an increase in the valuation allowance for U.S. state deferred tax assets resulting in a
$141 million
non-cash charge, net of federal deferred tax adjustment at
35 percent
. The primary driver of the increase is recent U.S. GAAP losses expected to recur in 2017 in certain state jurisdictions and the weight given this negative objective evidence under income tax accounting guidance.
The provision for income taxes for 2015 included a
$42 million
net charge to increase unrecognized tax benefits by
$68 million
offset by a benefit of
$26 million
to record U.S. refund claims related to prior tax years currently under examination. In the audit of 2007 to 2009 including the loss carryback to 2005, the U.S. Internal Revenue Service (IRS) disallowed approximately
$125 million
of foreign tax credits that arose as a result of certain financings unrelated to CSARL. Decisions of the U.S. Court of Appeals for the Second Circuit involving other taxpayers in 2015 caused us to conclude the benefits of this uncertain tax position were no longer more likely than not to be sustained based on technical merits resulting in an increase of
$68 million
to unrecognized tax benefits. We will continue to monitor ongoing court cases involving other taxpayers for information that may impact our analysis of this tax position.
The provision for income taxes for 2014 included a benefit of
$23 million
for the release of a valuation allowance against the deferred tax assets of a non-U.S. subsidiary and a net benefit of
$21 million
to adjust prior years' U.S. taxes and interest. The net benefit for prior years' U.S. taxes and interest included a
$33 million
benefit to reflect a settlement with the IRS related to 1992 through 1994 which resulted in a
$16 million
benefit to remeasure previously unrecognized tax benefits and a
$17 million
benefit to adjust related interest, net of tax. This benefit of
$33 million
was offset by a net charge of
$12 million
to adjust prior years' U.S. taxes that included a charge of
$55 million
to correct for an error which resulted in an understatement of tax liabilities for prior years. Management has concluded that the error was not material to any period presented.
98
We have recorded income tax expense at U.S. tax rates on all profits, except for undistributed profits of non-U.S. subsidiaries of approximately
$16 billion
which are considered indefinitely reinvested. Upon distribution of these profits in the form of dividends or otherwise, we would be subject to both U.S. income taxes (subject to an adjustment for foreign tax credits) and in some instances withholding taxes payable to the various non-U.S. jurisdictions. Determination of the amount of unrecognized deferred tax liability related to indefinitely reinvested profits is not feasible primarily due to our legal entity structure and the complexity of U.S. and local tax laws. If management intentions or U.S. tax law changes in the future, there could be a significant negative impact on the provision for income taxes to record an incremental tax liability in the period the change occurs. At
December 31, 2016
, cash and short-term investments held by non-U.S. subsidiaries was approximately
$5 billion
.
Accounting for income taxes under U.S. GAAP requires that individual tax-paying entities of the company offset all deferred tax liabilities and assets within each particular tax jurisdiction and present them as a noncurrent deferred tax liability or asset in the Consolidated Financial Position. Amounts in different tax jurisdictions cannot be offset against each other. The amount of deferred income taxes at December 31, included on the following lines in Statement 3, are as follows:
|
|
December 31,
|
|||||||
|
(Millions of dollars)
|
2016
|
2015
|
||||||
|
Assets:
|
|
|
|
|
||||
|
Noncurrent deferred and refundable income taxes
|
2,683
|
|
2,367
|
|
||||
|
Liabilities:
|
|
|
|
|
||||
|
Other liabilities
|
237
|
|
335
|
|
||||
|
Deferred income taxes—net
|
$
|
2,446
|
|
$
|
2,032
|
|
||
99
|
Deferred income tax assets and liabilities:
|
||||||||
|
|
December 31,
|
|||||||
|
(Millions of dollars)
|
2016
|
2015
|
||||||
|
Deferred income tax assets:
|
|
|
|
|
||||
|
Pension
|
$
|
1,887
|
|
$
|
1,694
|
|
||
|
Postemployment benefits other than pensions
|
1,318
|
|
1,339
|
|
||||
|
Tax carryforwards
|
1,999
|
|
1,098
|
|
||||
|
Warranty reserves
|
339
|
|
359
|
|
||||
|
Stock-based compensation
|
316
|
|
356
|
|
||||
|
Inventory
|
93
|
|
129
|
|
||||
|
Allowance for credit losses
|
209
|
|
203
|
|
||||
|
Post sale discounts
|
207
|
|
185
|
|
||||
|
Other employee compensation and benefits
|
262
|
|
269
|
|
||||
|
Other—net
|
476
|
|
427
|
|
||||
|
|
7,106
|
|
6,059
|
|
||||
|
Deferred income tax liabilities:
|
|
|
|
|
||||
|
Capital and intangible assets
|
(2,455
|
)
|
(2,561
|
)
|
||||
|
Bond discount
|
(223
|
)
|
(225
|
)
|
||||
|
Translation
|
(368
|
)
|
(343
|
)
|
||||
|
Other outside basis differences
|
(227
|
)
|
—
|
|
||||
|
Undistributed profits of non-U.S. subsidiaries
|
(285
|
)
|
(82
|
)
|
||||
|
|
(3,558
|
)
|
(3,211
|
)
|
||||
|
Valuation allowance for deferred tax assets
|
(1,102
|
)
|
(816
|
)
|
||||
|
Deferred income taxes—net
|
$
|
2,446
|
|
$
|
2,032
|
|
||
At
December 31, 2016
, approximately
$1,425 million
of U.S. state tax net operating losses (NOLs) and
$137 million
of U.S. state tax credit carryforwards were available. The state NOLs primarily expire between 2017 and 2036. The state tax credit carryforwards primarily expire over the next
five years
with certain carryforwards set to expire over the next
fifteen years
. In total, we have established a valuation allowance of
$442 million
related to certain of these carryforwards along with other U.S. state deferred tax assets.
At
December 31, 2016
, approximately
$920 million
of U.S. foreign tax credits were available for carryforward. These credits expire between 2025 and 2027.
At
December 31, 2016
, amounts and expiration dates of net operating loss carryforwards in various non-U.S. taxing jurisdictions were:
|
(Millions of dollars)
|
||||||||||||||||||||||||||
|
2017
|
2018
|
2019
|
2020-2022
|
2023-2037
|
Unlimited
|
Total
|
||||||||||||||||||||
|
$
|
3
|
|
$
|
64
|
|
$
|
159
|
|
$
|
470
|
|
$
|
168
|
|
$
|
3,191
|
|
$
|
4,055
|
|
||||||
At
December 31, 2016
, non-U.S. entities that have not yet demonstrated consistent and/or sustainable profitability to support the realization of net deferred tax assets have recorded valuation allowances of
$660 million
, including certain entities in Luxembourg.
A reconciliation of the beginning and ending amount of gross unrecognized tax benefits for uncertain tax positions, including positions impacting only the timing of tax benefits, follows.
100
|
Reconciliation of unrecognized tax benefits:
1
|
||||||||
|
|
Years ended December 31,
|
|||||||
|
(Millions of dollars)
|
2016
|
2015
|
||||||
|
Balance at January 1,
|
$
|
968
|
|
$
|
846
|
|
||
|
Additions for tax positions related to current year
|
73
|
|
73
|
|
||||
|
Additions for tax positions related to prior years
|
55
|
|
118
|
|
||||
|
Reductions for tax positions related to prior years
|
(36
|
)
|
(30
|
)
|
||||
|
Reductions for settlements
2
|
(24
|
)
|
(30
|
)
|
||||
|
Reductions for expiration of statute of limitations
|
(4
|
)
|
(9
|
)
|
||||
|
Balance at December 31,
|
$
|
1,032
|
|
$
|
968
|
|
||
|
Amount that, if recognized, would impact the effective tax rate
|
$
|
963
|
|
$
|
934
|
|
||
|
1
|
Foreign currency impacts are included within each line as applicable.
|
|
2
|
Includes cash payment or other reduction of assets to settle liability.
|
We classify interest and penalties on income taxes as a component of the provision for income taxes. We recognized a net provision for interest and penalties of
$34 million
,
$20 million
and
$3 million
during the years ended December 31,
2016
,
2015
and
2014
, respectively. The total amount of interest and penalties accrued was
$120 million
and
$79 million
as of
December 31, 2016
and
2015
, respectively.
In January 2015, we received a Revenue Agent's Report (RAR) from the IRS indicating the end of the field examination of our U.S. income tax returns for 2007 to 2009 including the impact of a loss carryback to 2005. The IRS field examination for 2010 to 2012 that began in 2015 is expected to be completed in 2017. In November 2016, we received notices of proposed adjustments from the IRS for the 2010 to 2012 exam. In both these audits, the IRS has proposed to tax in the United States profits earned from certain parts transactions by CSARL, based on the IRS examination team’s application of the “substance-over-form” or “assignment-of-income” judicial doctrines. We are vigorously contesting the proposed increases to tax and penalties for these years of approximately
$2 billion
. We believe that the relevant transactions complied with applicable tax laws and did not violate judicial doctrines. We have filed U.S. income tax returns on this same basis for years after 2012. Based on the information currently available, we do not anticipate a significant increase or decrease to our unrecognized tax benefits for this matter within the next 12 months. We currently believe the ultimate disposition of this matter will not have a material adverse effect on our consolidated financial position, liquidity or results of operations.
With the exception of a loss carryback to 2005, tax years prior to 2007 are generally no longer subject to U.S. tax assessment. In our major non-U.S. jurisdictions including Australia, Brazil, China, Germany, Japan, Switzerland, Singapore and the U.K., tax years are typically subject to examination for
three to eight years
. Due to the uncertainty related to the timing and potential outcome of audits, we cannot estimate the range of reasonably possible change in unrecognized tax benefits in the next 12 months.
|
6.
|
Cat Financial Financing Activities
|
|
A.
|
Wholesale inventory receivables
|
Wholesale inventory receivables are receivables of Cat Financial that arise when Cat Financial provides financing for a dealer’s purchase of inventory. These receivables are included in Receivables—trade and other and Long-term receivables—trade and other in Statement 3 and were
$1,727 million
and
$2,165 million
, at December 31,
2016
and
2015
, respectively.
101
|
Contractual maturities of outstanding wholesale inventory receivables:
|
||||||||||||||||
|
(Millions of dollars)
|
December 31, 2016
|
|||||||||||||||
|
Amounts Due In
|
Wholesale
Installment
Contracts
|
Wholesale
Finance
Leases
|
Wholesale
Notes
|
Total
|
||||||||||||
|
2017
|
$
|
147
|
|
$
|
60
|
|
$
|
765
|
|
$
|
972
|
|
||||
|
2018
|
114
|
|
42
|
|
205
|
|
361
|
|
||||||||
|
2019
|
75
|
|
27
|
|
127
|
|
229
|
|
||||||||
|
2020
|
40
|
|
14
|
|
8
|
|
62
|
|
||||||||
|
2021
|
13
|
|
5
|
|
4
|
|
22
|
|
||||||||
|
Thereafter
|
—
|
|
1
|
|
14
|
|
15
|
|
||||||||
|
|
389
|
|
149
|
|
1,123
|
|
1,661
|
|
||||||||
|
Guaranteed residual value
|
—
|
|
58
|
|
—
|
|
58
|
|
||||||||
|
Unguaranteed residual value
|
—
|
|
35
|
|
—
|
|
35
|
|
||||||||
|
Less: Unearned income
|
(7
|
)
|
(15
|
)
|
(5
|
)
|
(27
|
)
|
||||||||
|
Total
|
$
|
382
|
|
$
|
227
|
|
$
|
1,118
|
|
$
|
1,727
|
|
||||
Cat Financial’s wholesale inventory receivables generally may be repaid or refinanced without penalty prior to contractual maturity. Accordingly, this presentation should not be regarded as a forecast of future cash collections.
Please refer to Note 18 and Table III for fair value information.
|
B.
|
Finance receivables
|
Finance receivables are receivables of Cat Financial and are reported in Statement 3 net of an allowance for credit losses.
|
Contractual maturities of outstanding finance receivables:
|
||||||||||||||||
|
(Millions of dollars)
|
December 31, 2016
|
|||||||||||||||
|
Amounts Due In
|
Retail
Installment
Contracts
|
Retail Finance
Leases
|
Retail
Notes
|
Total
|
||||||||||||
|
2017
|
$
|
2,592
|
|
$
|
2,332
|
|
$
|
3,695
|
|
$
|
8,619
|
|
||||
|
2018
|
1,951
|
|
1,547
|
|
1,893
|
|
5,391
|
|
||||||||
|
2019
|
1,260
|
|
887
|
|
1,345
|
|
3,492
|
|
||||||||
|
2020
|
598
|
|
407
|
|
1,126
|
|
2,131
|
|
||||||||
|
2021
|
162
|
|
170
|
|
1,014
|
|
1,346
|
|
||||||||
|
Thereafter
|
8
|
|
78
|
|
1,009
|
|
1,095
|
|
||||||||
|
|
6,571
|
|
5,421
|
|
10,082
|
|
22,074
|
|
||||||||
|
Guaranteed residual value
|
—
|
|
295
|
|
—
|
|
295
|
|
||||||||
|
Unguaranteed residual value
|
—
|
|
750
|
|
—
|
|
750
|
|
||||||||
|
Less: Unearned income
|
(140
|
)
|
(503
|
)
|
(79
|
)
|
(722
|
)
|
||||||||
|
Total
|
$
|
6,431
|
|
$
|
5,963
|
|
$
|
10,003
|
|
$
|
22,397
|
|
||||
Cat Financial’s finance receivables generally may be repaid or refinanced without penalty prior to contractual maturity. Accordingly, this presentation should not be regarded as a forecast of future cash collections.
Please refer to Note 18 and Table III for fair value information.
102
|
C.
|
Allowance for credit losses
|
The allowance for credit losses is an estimate of the losses inherent in Cat Financial’s finance receivable portfolio and includes consideration of accounts that have been individually identified as impaired, as well as pools of finance receivables where it is probable that certain receivables in the pool are impaired but the individual accounts cannot yet be identified. In identifying and measuring impairment, management takes into consideration past loss experience, known and inherent risks in the portfolio, adverse situations that may affect the borrower’s ability to repay, estimated value of underlying collateral and current economic conditions.
Accounts are identified for individual review based on past-due status and using information available about the customer, such as financial statements, news reports and published credit ratings, as well as general information regarding industry trends and the economic environment in which Cat Financial’s customers operate. The allowance for credit losses attributable to finance receivables that are individually evaluated and determined to be impaired is based either on the present value of expected future cash flows discounted at the receivables' effective interest rate or the fair value of the collateral for collateral-dependent receivables. In determining collateral value, Cat Financial estimates the current fair market value of the collateral less selling costs. Cat Financial also considers credit enhancements such as additional collateral and contractual third-party guarantees. The allowance for credit losses attributable to the remaining accounts not yet individually identified as impaired is estimated based on loss forecast models utilizing probabilities of default, our estimate of the loss emergence period and the estimated loss given default. In addition, qualitative factors not able to be fully captured in the loss forecast models including industry trends, macroeconomic factors and model imprecision are considered in the evaluation of the adequacy of the allowance for credit losses. These qualitative factors are subjective and require a degree of management judgment.
Cat Financial’s allowance for credit losses is segregated into two portfolio segments:
|
•
|
Customer - Finance receivables with retail customers.
|
|
•
|
Dealer - Finance receivables with Caterpillar dealers.
|
A portfolio segment is the level at which the Company develops a systematic methodology for determining its allowance for credit losses.
Cat Financial further evaluates portfolio segments by the class of finance receivables, which is defined as a level of information (below a portfolio segment) in which the finance receivables have the same initial measurement attribute and a similar method for assessing and monitoring credit risk. Typically, Cat Financial’s finance receivables within a geographic area have similar credit risk profiles and methods for assessing and monitoring credit risk. Cat Financial’s classes, which align with management reporting for credit losses, are as follows:
|
•
|
North America - Finance receivables originated in the United States or Canada.
|
|
•
|
Europe - Finance receivables originated in Europe, Africa, Middle East and the Commonwealth of Independent States.
|
|
•
|
Asia Pacific - Finance receivables originated in Australia, New Zealand, China, Japan, South Korea and Southeast Asia.
|
|
•
|
Mining - Finance receivables related to large mining customers worldwide and project financing in various countries.
|
|
•
|
Latin America - Finance receivables originated in Central and South American countries and Mexico.
|
|
•
|
Caterpillar Power Finance - Finance receivables related to marine vessels with Caterpillar engines worldwide and Caterpillar electrical power generation, gas compression and co-generation systems and non-Caterpillar equipment that is powered by these systems worldwide.
|
An analysis of the allowance for credit losses was as follows:
103
|
(Millions of dollars)
|
December 31, 2016
|
|||||||||||
|
Customer
|
Dealer
|
Total
|
||||||||||
|
Allowance for Credit Losses:
|
|
|
|
|
|
|
||||||
|
Balance at beginning of year
|
$
|
327
|
|
$
|
9
|
|
$
|
336
|
|
|||
|
Receivables written off
|
(158
|
)
|
—
|
|
(158
|
)
|
||||||
|
Recoveries on receivables previously written off
|
35
|
|
—
|
|
35
|
|
||||||
|
Provision for credit losses
|
132
|
|
1
|
|
133
|
|
||||||
|
Other
|
(5
|
)
|
—
|
|
(5
|
)
|
||||||
|
Balance at end of year
|
$
|
331
|
|
$
|
10
|
|
$
|
341
|
|
|||
|
Individually evaluated for impairment
|
$
|
85
|
|
$
|
—
|
|
$
|
85
|
|
|||
|
Collectively evaluated for impairment
|
246
|
|
10
|
|
256
|
|
||||||
|
Ending Balance
|
$
|
331
|
|
$
|
10
|
|
$
|
341
|
|
|||
|
Recorded Investment in Finance Receivables:
|
|
|
|
|
|
|
||||||
|
Individually evaluated for impairment
|
$
|
786
|
|
$
|
—
|
|
$
|
786
|
|
|||
|
Collectively evaluated for impairment
|
18,236
|
|
3,375
|
|
21,611
|
|
||||||
|
Ending Balance
|
$
|
19,022
|
|
$
|
3,375
|
|
$
|
22,397
|
|
|||
|
(Millions of dollars)
|
December 31, 2015
|
|||||||||||
|
Customer
|
Dealer
|
Total
|
||||||||||
|
Allowance for Credit Losses:
|
|
|
|
|
|
|
||||||
|
Balance at beginning of year
|
$
|
388
|
|
$
|
10
|
|
$
|
398
|
|
|||
|
Receivables written off
|
(196
|
)
|
—
|
|
(196
|
)
|
||||||
|
Recoveries on receivables previously written off
|
41
|
|
—
|
|
41
|
|
||||||
|
Provision for credit losses
|
119
|
|
(1
|
)
|
118
|
|
||||||
|
Other
|
(25
|
)
|
—
|
|
(25
|
)
|
||||||
|
Balance at end of year
|
$
|
327
|
|
$
|
9
|
|
$
|
336
|
|
|||
|
Individually evaluated for impairment
|
$
|
65
|
|
$
|
—
|
|
$
|
65
|
|
|||
|
Collectively evaluated for impairment
|
262
|
|
9
|
|
271
|
|
||||||
|
Ending Balance
|
$
|
327
|
|
$
|
9
|
|
$
|
336
|
|
|||
|
Recorded Investment in Finance Receivables:
|
|
|
|
|
|
|
||||||
|
Individually evaluated for impairment
|
$
|
601
|
|
$
|
—
|
|
$
|
601
|
|
|||
|
Collectively evaluated for impairment
|
18,788
|
|
3,570
|
|
22,358
|
|
||||||
|
Ending Balance
|
$
|
19,389
|
|
$
|
3,570
|
|
$
|
22,959
|
|
|||
Credit quality of finance receivables
At origination, Cat Financial evaluates credit risk based on a variety of credit quality factors including prior payment experience, customer financial information, credit-rating agency ratings, loan-to-value ratios and other internal metrics. On an ongoing basis, Cat Financial monitors credit quality based on past-due status and collection experience as there is a meaningful correlation between the past-due status of customers and the risk of loss.
In determining past-due status, Cat Financial considers the entire finance receivable balance past due when any installment is over 30 days past due. The tables below summarize the recorded investment of finance receivables by aging category.
104
|
(Millions of dollars)
|
December 31, 2016
|
|||||||||||||||||||||||||||
|
31-60 Days Past Due
|
61-90 Days Past Due
|
91+
Days Past Due
|
Total Past
Due
|
Current
|
Total
Finance
Receivables
|
91+ Still
Accruing
|
||||||||||||||||||||||
|
Customer
|
|
|
|
|
|
|
|
|
|
|
|
|
|
|
||||||||||||||
|
North America
|
$
|
50
|
|
$
|
16
|
|
$
|
59
|
|
$
|
125
|
|
$
|
7,938
|
|
$
|
8,063
|
|
$
|
5
|
|
|||||||
|
Europe
|
16
|
|
12
|
|
39
|
|
67
|
|
2,388
|
|
2,455
|
|
6
|
|
||||||||||||||
|
Asia Pacific
|
17
|
|
7
|
|
15
|
|
39
|
|
1,435
|
|
1,474
|
|
4
|
|
||||||||||||||
|
Mining
|
3
|
|
2
|
|
63
|
|
68
|
|
1,756
|
|
1,824
|
|
2
|
|
||||||||||||||
|
Latin America
|
40
|
|
33
|
|
214
|
|
287
|
|
1,808
|
|
2,095
|
|
—
|
|
||||||||||||||
|
Caterpillar Power Finance
|
11
|
|
9
|
|
73
|
|
93
|
|
3,018
|
|
3,111
|
|
1
|
|
||||||||||||||
|
Dealer
|
|
|
|
|
|
|
|
|
|
|
||||||||||||||||||
|
North America
|
—
|
|
—
|
|
—
|
|
—
|
|
1,916
|
|
1,916
|
|
—
|
|
||||||||||||||
|
Europe
|
—
|
|
—
|
|
—
|
|
—
|
|
161
|
|
161
|
|
—
|
|
||||||||||||||
|
Asia Pacific
|
—
|
|
—
|
|
—
|
|
—
|
|
541
|
|
541
|
|
—
|
|
||||||||||||||
|
Mining
|
—
|
|
—
|
|
—
|
|
—
|
|
3
|
|
3
|
|
—
|
|
||||||||||||||
|
Latin America
|
—
|
|
—
|
|
—
|
|
—
|
|
752
|
|
752
|
|
—
|
|
||||||||||||||
|
Caterpillar Power Finance
|
—
|
|
—
|
|
—
|
|
—
|
|
2
|
|
2
|
|
—
|
|
||||||||||||||
|
Total
|
$
|
137
|
|
$
|
79
|
|
$
|
463
|
|
$
|
679
|
|
$
|
21,718
|
|
$
|
22,397
|
|
$
|
18
|
|
|||||||
|
(Millions of dollars)
|
December 31, 2015
|
|||||||||||||||||||||||||||
|
31-60 Days Past Due
|
61-90 Days Past Due
|
91+
Days Past Due
|
Total Past
Due
|
Current
|
Total
Finance
Receivables
|
91+ Still
Accruing
|
||||||||||||||||||||||
|
Customer
|
|
|
|
|
|
|
|
|
|
|
|
|
|
|
||||||||||||||
|
North America
|
$
|
45
|
|
$
|
12
|
|
$
|
30
|
|
$
|
87
|
|
$
|
7,850
|
|
$
|
7,937
|
|
$
|
4
|
|
|||||||
|
Europe
|
18
|
|
7
|
|
44
|
|
69
|
|
2,358
|
|
2,427
|
|
9
|
|
||||||||||||||
|
Asia Pacific
|
21
|
|
12
|
|
21
|
|
54
|
|
1,647
|
|
1,701
|
|
6
|
|
||||||||||||||
|
Mining
|
6
|
|
1
|
|
68
|
|
75
|
|
1,793
|
|
1,868
|
|
1
|
|
||||||||||||||
|
Latin America
|
45
|
|
31
|
|
199
|
|
275
|
|
1,998
|
|
2,273
|
|
—
|
|
||||||||||||||
|
Caterpillar Power Finance
|
—
|
|
1
|
|
35
|
|
36
|
|
3,147
|
|
3,183
|
|
2
|
|
||||||||||||||
|
Dealer
|
|
|
|
|
|
|
|
|
|
|
||||||||||||||||||
|
North America
|
—
|
|
—
|
|
—
|
|
—
|
|
2,209
|
|
2,209
|
|
—
|
|
||||||||||||||
|
Europe
|
—
|
|
—
|
|
—
|
|
—
|
|
149
|
|
149
|
|
—
|
|
||||||||||||||
|
Asia Pacific
|
—
|
|
—
|
|
—
|
|
—
|
|
552
|
|
552
|
|
—
|
|
||||||||||||||
|
Mining
|
—
|
|
—
|
|
—
|
|
—
|
|
4
|
|
4
|
|
—
|
|
||||||||||||||
|
Latin America
|
—
|
|
—
|
|
—
|
|
—
|
|
653
|
|
653
|
|
—
|
|
||||||||||||||
|
Caterpillar Power Finance
|
—
|
|
—
|
|
—
|
|
—
|
|
3
|
|
3
|
|
—
|
|
||||||||||||||
|
Total
|
$
|
135
|
|
$
|
64
|
|
$
|
397
|
|
$
|
596
|
|
$
|
22,363
|
|
$
|
22,959
|
|
$
|
22
|
|
|||||||
Impaired finance receivables
For all classes, a finance receivable is considered impaired, based on current information and events, if it is probable that Cat Financial will be unable to collect all amounts due according to the contractual terms. Impaired finance receivables include finance receivables that have been restructured and are considered to be troubled debt restructurings.
105
There were
no
impaired finance receivables as of December 31,
2016
,
2015
and
2014
for the Dealer portfolio segment. Cat Financial’s recorded investment in impaired finance receivables and the related unpaid principal balances and allowance for the Customer portfolio segment were as follows:
|
|
December 31, 2016
|
December 31, 2015
|
|||||||||||||||||||||
|
(Millions of dollars)
|
Recorded
Investment
|
Unpaid Principal Balance
|
Related
Allowance
|
Recorded
Investment |
Unpaid Principal Balance
|
Related
Allowance |
|||||||||||||||||
|
Impaired Finance Receivables With No Allowance Recorded
|
|
|
|
|
|
|
|
|
|
|
|
|
|||||||||||
|
North America
|
$
|
10
|
|
$
|
10
|
|
$
|
—
|
|
$
|
12
|
|
$
|
12
|
|
$
|
—
|
|
|||||
|
Europe
|
49
|
|
48
|
|
—
|
|
41
|
|
41
|
|
—
|
|
|||||||||||
|
Asia Pacific
|
3
|
|
2
|
|
—
|
|
1
|
|
1
|
|
—
|
|
|||||||||||
|
Mining
|
129
|
|
129
|
|
—
|
|
84
|
|
84
|
|
—
|
|
|||||||||||
|
Latin America
|
68
|
|
68
|
|
—
|
|
28
|
|
28
|
|
—
|
|
|||||||||||
|
Caterpillar Power Finance
|
271
|
|
271
|
|
—
|
|
242
|
|
241
|
|
—
|
|
|||||||||||
|
Total
|
$
|
530
|
|
$
|
528
|
|
$
|
—
|
|
$
|
408
|
|
$
|
407
|
|
$
|
—
|
|
|||||
|
Impaired Finance Receivables With An Allowance Recorded
|
|
|
|
|
|
|
|
|
|
|
|
|
|||||||||||
|
North America
|
$
|
61
|
|
$
|
60
|
|
$
|
22
|
|
$
|
14
|
|
$
|
13
|
|
$
|
4
|
|
|||||
|
Europe
|
7
|
|
7
|
|
3
|
|
11
|
|
10
|
|
5
|
|
|||||||||||
|
Asia Pacific
|
50
|
|
50
|
|
8
|
|
34
|
|
34
|
|
4
|
|
|||||||||||
|
Mining
|
—
|
|
—
|
|
—
|
|
11
|
|
11
|
|
3
|
|
|||||||||||
|
Latin America
|
93
|
|
104
|
|
34
|
|
53
|
|
53
|
|
21
|
|
|||||||||||
|
Caterpillar Power Finance
|
45
|
|
44
|
|
18
|
|
70
|
|
70
|
|
28
|
|
|||||||||||
|
Total
|
$
|
256
|
|
$
|
265
|
|
$
|
85
|
|
$
|
193
|
|
$
|
191
|
|
$
|
65
|
|
|||||
|
Total Impaired Finance Receivables
|
|
|
|
|
|
|
|
|
|
|
|
|
|||||||||||
|
North America
|
$
|
71
|
|
$
|
70
|
|
$
|
22
|
|
$
|
26
|
|
$
|
25
|
|
$
|
4
|
|
|||||
|
Europe
|
56
|
|
55
|
|
3
|
|
52
|
|
51
|
|
5
|
|
|||||||||||
|
Asia Pacific
|
53
|
|
52
|
|
8
|
|
35
|
|
35
|
|
4
|
|
|||||||||||
|
Mining
|
129
|
|
129
|
|
—
|
|
95
|
|
95
|
|
3
|
|
|||||||||||
|
Latin America
|
161
|
|
172
|
|
34
|
|
81
|
|
81
|
|
21
|
|
|||||||||||
|
Caterpillar Power Finance
|
316
|
|
315
|
|
18
|
|
312
|
|
311
|
|
28
|
|
|||||||||||
|
Total
|
$
|
786
|
|
$
|
793
|
|
$
|
85
|
|
$
|
601
|
|
$
|
598
|
|
$
|
65
|
|
|||||
106
|
Years ended December 31,
|
||||||||||||||||||||||||
|
|
2016
|
2015
|
2014
|
|||||||||||||||||||||
|
(Millions of dollars)
|
Average
Recorded
Investment
|
Interest
Income Recognized |
Average
Recorded
Investment
|
Interest
Income Recognized |
Average
Recorded
Investment
|
Interest
Income Recognized |
||||||||||||||||||
|
Impaired Finance Receivables With No Allowance Recorded
|
|
|
|
|
|
|
|
|
||||||||||||||||
|
North America
|
$
|
18
|
|
$
|
1
|
|
$
|
12
|
|
$
|
1
|
|
$
|
20
|
|
$
|
1
|
|
||||||
|
Europe
|
46
|
|
1
|
|
42
|
|
1
|
|
47
|
|
1
|
|
||||||||||||
|
Asia Pacific
|
2
|
|
—
|
|
2
|
|
—
|
|
3
|
|
—
|
|
||||||||||||
|
Mining
|
98
|
|
4
|
|
75
|
|
3
|
|
69
|
|
3
|
|
||||||||||||
|
Latin America
|
47
|
|
1
|
|
31
|
|
—
|
|
30
|
|
—
|
|
||||||||||||
|
Caterpillar Power Finance
|
270
|
|
11
|
|
170
|
|
5
|
|
164
|
|
6
|
|
||||||||||||
|
Total
|
$
|
481
|
|
$
|
18
|
|
$
|
332
|
|
$
|
10
|
|
$
|
333
|
|
$
|
11
|
|
||||||
|
Impaired Finance Receivables With An Allowance Recorded
|
|
|
|
|
|
|
|
|
||||||||||||||||
|
North America
|
$
|
34
|
|
$
|
—
|
|
$
|
9
|
|
$
|
—
|
|
$
|
9
|
|
$
|
—
|
|
||||||
|
Europe
|
11
|
|
1
|
|
14
|
|
1
|
|
21
|
|
1
|
|
||||||||||||
|
Asia Pacific
|
37
|
|
3
|
|
35
|
|
2
|
|
22
|
|
1
|
|
||||||||||||
|
Mining
|
13
|
|
—
|
|
39
|
|
1
|
|
90
|
|
7
|
|
||||||||||||
|
Latin America
|
66
|
|
2
|
|
56
|
|
3
|
|
36
|
|
1
|
|
||||||||||||
|
Caterpillar Power Finance
|
50
|
|
1
|
|
115
|
|
3
|
|
96
|
|
2
|
|
||||||||||||
|
Total
|
$
|
211
|
|
$
|
7
|
|
$
|
268
|
|
$
|
10
|
|
$
|
274
|
|
$
|
12
|
|
||||||
|
Total Impaired Finance Receivables
|
|
|
|
|
|
|
|
|
||||||||||||||||
|
North America
|
$
|
52
|
|
$
|
1
|
|
$
|
21
|
|
$
|
1
|
|
$
|
29
|
|
$
|
1
|
|
||||||
|
Europe
|
57
|
|
2
|
|
56
|
|
2
|
|
68
|
|
2
|
|
||||||||||||
|
Asia Pacific
|
39
|
|
3
|
|
37
|
|
2
|
|
25
|
|
1
|
|
||||||||||||
|
Mining
|
111
|
|
4
|
|
114
|
|
4
|
|
159
|
|
10
|
|
||||||||||||
|
Latin America
|
113
|
|
3
|
|
87
|
|
3
|
|
66
|
|
1
|
|
||||||||||||
|
Caterpillar Power Finance
|
320
|
|
12
|
|
285
|
|
8
|
|
260
|
|
8
|
|
||||||||||||
|
Total
|
$
|
692
|
|
$
|
25
|
|
$
|
600
|
|
$
|
20
|
|
$
|
607
|
|
$
|
23
|
|
||||||
Recognition of income is suspended and the finance receivable is placed on non-accrual status when management determines that collection of future income is not probable (generally after
120 days
past due). Recognition is resumed and previously suspended income is recognized when the finance receivable becomes current and collection of remaining amounts is considered probable. Payments received while the finance receivable is on non-accrual status are applied to interest and principal in accordance with the contractual terms.
As of
December 31, 2016
and
2015
there were
no
finance receivable on non-accrual status for the Dealer portfolio segment.
107
The recorded investment in customer finance receivable on non-accrual status was as follows:
|
December 31,
|
||||||||
|
(Millions of dollars)
|
2016
|
2015
|
||||||
|
North America
|
$
|
66
|
|
$
|
31
|
|
||
|
Europe
|
35
|
|
39
|
|
||||
|
Asia Pacific
|
12
|
|
15
|
|
||||
|
Mining
|
69
|
|
106
|
|
||||
|
Latin America
|
307
|
|
217
|
|
||||
|
Caterpillar Power Finance
|
90
|
|
77
|
|
||||
|
Total
|
$
|
579
|
|
$
|
485
|
|
||
Troubled Debt Restructurings
A restructuring of a finance receivable constitutes a troubled debt restructuring (TDR) when the lender grants a concession it would not otherwise consider to a borrower experiencing financial difficulties. Concessions granted may include extended contract maturities, inclusion of interest only periods, below market interest rates, extended skip payment periods and reduction of principal and/or accrued interest.
As of December 31, 2016 and December 31, 2015, there were
$11 million
and
$3 million
, respectively, of additional funds committed to lend to a borrower whose terms have been modified in a TDR.
108
There were
no
finance receivables modified as TDRs during the years ended
December 31, 2016
,
2015
or
2014
for the Dealer portfolio segment. Finance receivables in the Customer portfolio segment modified as TDRs during the years ended
December 31, 2016
,
2015
and
2014
were as follows:
|
(Millions of dollars)
|
Year ended December 31, 2016
|
|||||||||||
|
Number
of Contracts
|
Pre-TDR
Recorded Investment |
Post-TDR
Recorded Investment |
||||||||||
|
North America
|
25
|
|
$
|
25
|
|
$
|
25
|
|
||||
|
Europe
|
43
|
|
12
|
|
9
|
|
||||||
|
Asia Pacific
|
31
|
|
29
|
|
28
|
|
||||||
|
Mining
|
4
|
|
74
|
|
66
|
|
||||||
|
Latin America
1
|
437
|
|
118
|
|
82
|
|
||||||
|
Caterpillar Power Finance
|
34
|
|
196
|
|
177
|
|
||||||
|
Total
|
574
|
|
$
|
454
|
|
$
|
387
|
|
||||
|
Year ended December 31, 2015
|
||||||||||||
|
Number
of Contracts
|
Pre-TDR
Recorded Investment |
Post-TDR
Recorded Investment |
||||||||||
|
North America
|
14
|
|
$
|
1
|
|
$
|
1
|
|
||||
|
Europe
|
23
|
|
2
|
|
2
|
|
||||||
|
Asia Pacific
|
21
|
|
26
|
|
26
|
|
||||||
|
Mining
|
4
|
|
65
|
|
65
|
|
||||||
|
Latin America
|
11
|
|
1
|
|
2
|
|
||||||
|
Caterpillar Power Finance
|
21
|
|
259
|
|
242
|
|
||||||
|
Total
|
94
|
|
$
|
354
|
|
$
|
338
|
|
||||
|
Year ended December 31, 2014
|
||||||||||||
|
Number
of Contracts
|
Pre-TDR
Recorded Investment |
Post-TDR
Recorded Investment |
||||||||||
|
North America
|
34
|
|
$
|
12
|
|
$
|
7
|
|
||||
|
Europe
|
8
|
|
7
|
|
7
|
|
||||||
|
Asia Pacific
|
2
|
|
—
|
|
—
|
|
||||||
|
Mining
|
51
|
|
185
|
|
176
|
|
||||||
|
Latin America
|
51
|
|
32
|
|
31
|
|
||||||
|
Caterpillar Power Finance
|
18
|
|
137
|
|
139
|
|
||||||
|
Total
|
164
|
|
$
|
373
|
|
$
|
360
|
|
||||
|
1
|
In Latin America,
321
contracts with a pre-TDR recorded investment of
$94 million
and a post-TDR recorded investment of
$64 million
are related to
four
customers.
|
109
TDRs in the Customer portfolio segment with a payment default during the years ended
December 31, 2016
,
2015
and
2014
which had been modified within twelve months prior to the default date, were as follows:
|
(Millions of dollars)
|
Year ended December 31, 2016
|
Year ended December 31, 2015
|
Year ended December 31, 2014
|
|||||||||||||||||||
|
Number
of Contracts |
Post-TDR
Recorded Investment |
Number
of Contracts |
Post-TDR
Recorded Investment |
Number
of Contracts |
Post-TDR
Recorded Investment |
|||||||||||||||||
|
North America
|
17
|
|
$
|
3
|
|
12
|
|
$
|
1
|
|
11
|
|
$
|
1
|
|
|||||||
|
Europe
|
16
|
|
9
|
|
—
|
|
—
|
|
46
|
|
2
|
|
||||||||||
|
Asia Pacific
|
3
|
|
—
|
|
—
|
|
—
|
|
—
|
|
—
|
|
||||||||||
|
Latin America
|
7
|
|
3
|
|
12
|
|
1
|
|
11
|
|
1
|
|
||||||||||
|
Total
|
43
|
|
$
|
15
|
|
24
|
|
$
|
2
|
|
68
|
|
$
|
4
|
|
|||||||
|
7.
|
Inventories
|
Inventories (principally using the LIFO method) are comprised of the following:
|
|
December 31,
|
|||||||
|
(Millions of dollars)
|
2016
|
2015
|
||||||
|
Raw materials
|
$
|
2,102
|
|
$
|
2,467
|
|
||
|
Work-in-process
|
1,719
|
|
1,857
|
|
||||
|
Finished goods
|
4,576
|
|
5,122
|
|
||||
|
Supplies
|
217
|
|
254
|
|
||||
|
Total inventories
|
$
|
8,614
|
|
$
|
9,700
|
|
||
We had long-term material purchase obligations of approximately
$1,145 million
at
December 31, 2016
.
|
8.
|
Property, plant and equipment
|
|
|
December 31,
|
|||||||||
|
(Millions of dollars)
|
Useful
Lives (Years)
|
2016
|
2015
|
|||||||
|
Land
|
—
|
$
|
667
|
|
$
|
644
|
|
|||
|
Buildings and land improvements
|
20-45
|
7,383
|
|
7,242
|
|
|||||
|
Machinery, equipment and other
|
3-10
|
15,392
|
|
15,686
|
|
|||||
|
Software
|
3-7
|
1,641
|
|
1,636
|
|
|||||
|
Equipment leased to others
|
1-7
|
6,086
|
|
5,728
|
|
|||||
|
Construction-in-process
|
—
|
771
|
|
1,041
|
|
|||||
|
Total property, plant and equipment, at cost
|
|
31,940
|
|
31,977
|
|
|||||
|
Less: Accumulated depreciation
|
|
(16,618
|
)
|
(15,887
|
)
|
|||||
|
Property, plant and equipment–net
|
|
$
|
15,322
|
|
$
|
16,090
|
|
|||
We had commitments for the purchase or construction of capital assets of approximately
$142 million
at
December 31, 2016
.
110
|
Assets recorded under capital leases:
1
|
||||||||
|
December 31,
|
||||||||
|
(Millions of dollars)
|
2016
|
2015
|
||||||
|
Gross capital leases
2
|
$
|
99
|
|
$
|
124
|
|
||
|
Less: Accumulated depreciation
|
(22
|
)
|
(44
|
)
|
||||
|
Net capital leases
|
$
|
77
|
|
$
|
80
|
|
||
|
1
|
Included in Property, plant and equipment table above.
|
|
2
|
Consists primarily of machinery and equipment.
|
At
December 31, 2016
, scheduled minimum rental payments on assets recorded under capital leases were:
|
(Millions of dollars)
|
||||||||||||||||||||||
|
2017
|
2018
|
2019
|
2020
|
2021
|
Thereafter
|
|||||||||||||||||
|
$
|
7
|
|
$
|
6
|
|
$
|
6
|
|
$
|
6
|
|
$
|
20
|
|
$
|
30
|
|
|||||
|
Equipment leased to others (primarily by Cat Financial):
|
||||||||
|
|
December 31,
|
|||||||
|
(Millions of dollars)
|
2016
|
2015
|
||||||
|
Equipment leased to others–at original cost
|
$
|
6,086
|
|
$
|
5,728
|
|
||
|
Less: Accumulated depreciation
|
(1,659
|
)
|
(1,571
|
)
|
||||
|
Equipment leased to others–net
|
$
|
4,427
|
|
$
|
4,157
|
|
||
At
December 31, 2016
, scheduled minimum rental payments to be received for equipment leased to others were:
|
(Millions of dollars)
|
||||||||||||||||||||||
|
2017
|
2018
|
2019
|
2020
|
2021
|
Thereafter
|
|||||||||||||||||
|
$
|
892
|
|
$
|
600
|
|
$
|
349
|
|
$
|
167
|
|
$
|
67
|
|
$
|
64
|
|
|||||
|
9.
|
Investments in unconsolidated affiliated companies
|
Investments in unconsolidated affiliated companies, included in Other assets in Statement 3, were as follows:
|
Caterpillar’s investments in unconsolidated affiliated companies:
|
||||||||
|
|
December 31,
|
|||||||
|
(Millions of dollars)
|
2016
|
2015
|
||||||
|
Investments in equity method companies
|
$
|
192
|
|
$
|
203
|
|
||
|
Plus: Investments in cost method companies
|
57
|
|
43
|
|
||||
|
Total investments in unconsolidated affiliated companies
|
$
|
249
|
|
$
|
246
|
|
||
In February 2015, we sold our
35 percent
equity interest in the third party logistics business, formerly Caterpillar Logistics Services LLC, to an affiliate of The Goldman Sachs Group, Inc. and investment funds affiliated with Rhône Capital LLC for
$177 million
, which was comprised of
$167 million
in cash and a
$10 million
note receivable included in Long-term receivables - trade and other in Statement 3. As a result of the sale, we recognized a pretax gain of
$120 million
(included in Other income (expense)) and derecognized the carrying value of our noncontrolling interest of
$57 million
, which was previously included in Other assets in Statement 3. The gain on the disposal is included as a reconciling item between Segment profit
111
and Consolidated profit before taxes. The sale of this investment supports Caterpillar's increased focus on growth opportunities in its core businesses.
10. Intangible assets and goodwill
|
A.
|
Intangible assets
|
Intangible assets are comprised of the following:
|
|
|
December 31, 2016
|
||||||||||||
|
(Millions of dollars)
|
Weighted
Amortizable
Life (Years)
|
Gross
Carrying
Amount
|
Accumulated
Amortization
|
Net
|
||||||||||
|
Customer relationships
|
15
|
$
|
2,378
|
|
$
|
(934
|
)
|
$
|
1,444
|
|
||||
|
Intellectual property
|
11
|
1,496
|
|
(706
|
)
|
790
|
|
|||||||
|
Other
|
14
|
192
|
|
(77
|
)
|
115
|
|
|||||||
|
Total finite-lived intangible assets
|
14
|
$
|
4,066
|
|
$
|
(1,717
|
)
|
$
|
2,349
|
|
||||
|
|
|
December 31, 2015
|
||||||||||||
|
Weighted
Amortizable
Life (Years)
|
Gross
Carrying
Amount
|
Accumulated
Amortization
|
Net
|
|||||||||||
|
Customer relationships
|
15
|
$
|
2,489
|
|
$
|
(809
|
)
|
$
|
1,680
|
|
||||
|
Intellectual property
|
11
|
1,660
|
|
(626
|
)
|
1,034
|
|
|||||||
|
Other
|
12
|
174
|
|
(67
|
)
|
107
|
|
|||||||
|
Total finite-lived intangible assets
|
14
|
$
|
4,323
|
|
$
|
(1,502
|
)
|
$
|
2,821
|
|
||||
During 2015, we acquired finite-lived intangible assets of
$82 million
due to the purchase of Rail Product Solutions, Inc. See Note 24 for details on this acquisition.
Finite-lived intangible assets are amortized over their estimated useful lives and tested for impairment if events or changes in circumstances indicate that the asset may be impaired.
Gross customer relationship intangibles of
$96 million
and related accumulated amortization of
$27 million
as well as gross intellectual property intangibles of
$111 million
and related accumulated amortization of
$48 million
from the Resource Industries segment were impaired during 2016. The fair value of these intangibles was determined to be insignificant based on an income approach using expected cash flows. The fair value determination is categorized as Level 3 in the fair value hierarchy due to its use of internal projections and unobservable measurement inputs. The total impairment of
$132 million
was a result of restructuring activities and is included in Other operating (income) expense in Statement 1. See Note 25 for information on restructuring costs.
Amortization expense related to intangible assets was
$326 million
,
$337 million
and
$365 million
for
2016
,
2015
and
2014
, respectively.
As of
December 31, 2016
, amortization expense related to intangible assets is expected to be:
|
(Millions of dollars)
|
||||||||||||||||||||||
|
2017
|
2018
|
2019
|
2020
|
2021
|
Thereafter
|
|||||||||||||||||
|
$
|
313
|
|
$
|
308
|
|
$
|
303
|
|
$
|
292
|
|
$
|
275
|
|
$
|
858
|
|
|||||
112
|
B.
|
Goodwill
|
Our annual impairment tests completed in the fourth quarter of 2016 indicated the fair value of each reporting unit was substantially above its respective carrying value, including goodwill, with the exception of our Surface Mining & Technology reporting unit.
The Surface Mining & Technology reporting unit, which primarily serves the mining industry, is a part of our Resource Industries segment. The goodwill assigned to this reporting unit is largely from our acquisition of Bucyrus International, Inc. in 2011. Its product portfolio includes large mining trucks, electric rope shovels, draglines, hydraulic shovels and related parts. In addition to equipment, Surface Mining & Technology also develops and sells technology products and services to provide customer fleet management, equipment management analytics and autonomous machine capabilities. The annual impairment test completed in the fourth quarter of 2016 indicated that the fair value of Surface Mining & Technology was below its carrying value requiring the second step of the goodwill impairment test process. The fair value of Surface Mining & Technology was determined primarily using an income approach based on a discounted ten year cash flow. We assigned the fair value to Surface Mining & Technology’s assets and liabilities using various valuation techniques that required assumptions about royalty rates, dealer attrition, technological obsolescence and discount rates. The resulting implied fair value of goodwill was below the carrying value. Accordingly, we recognized a goodwill impairment charge of
$595 million
, which resulted in goodwill of
$629 million
remaining for Surface Mining & Technology as of October 1, 2016. The fair value determination is categorized as Level 3 in the fair value hierarchy due to its use of internal projections and unobservable measurement inputs. There was a
$17 million
tax benefit associated with this impairment charge. The mining industry has experienced significant weakness for several years as a result of low commodity prices. While we continue to expect the industry will improve, we believe the pace of the improvement will be slower and cash flows and profitability will be lower than previously forecasted. We believe the slow pace of improvement will in part be due to a large amount of equipment currently idled, particularly large mining trucks, some of which will be redeployed as end-user demand increases. In addition, we do not expect a dramatic increase in commodity prices, dampening the rate of growth in mining production and demand for our products. To reflect the gradual nature of the anticipated improvement, we used a ten year cash flow forecast period for the reporting unit rather than our typical five year forecast period.
There were
no
goodwill impairments during
2015
or
2014
.
During 2015, we acquired net assets with related goodwill aggregating
$133 million
primarily related to the purchases of Rail Product Solutions, Inc. (
$53 million
) and RDS Manufacturing, Inc. (
$59 million
). See Note 24 for details on these acquisitions.
As discussed in Note 23, effective January 1, 2016, we revised our reportable segments in line with the changes to our organization structure. As a result of these changes,
$118 million
of goodwill was reassigned to Energy & Transportation from All Other segments.
113
The changes in carrying amount of goodwill by reportable segment for the years ended December 31,
2016
and
2015
were as follows:
|
(Millions of dollars)
|
December 31, 2015
|
Acquisitions
1
|
Impairment Loss
|
Other Adjustments
2
|
December 31, 2016
|
|||||||||||||||
|
Construction Industries
|
||||||||||||||||||||
|
Goodwill
|
$
|
285
|
|
$
|
—
|
|
$
|
—
|
|
$
|
11
|
|
$
|
296
|
|
|||||
|
Impairment
|
(22
|
)
|
—
|
|
—
|
|
—
|
|
(22
|
)
|
||||||||||
|
Net goodwill
|
263
|
|
—
|
|
—
|
|
11
|
|
274
|
|
||||||||||
|
Resource Industries
|
||||||||||||||||||||
|
Goodwill
|
4,145
|
|
—
|
|
—
|
|
(35
|
)
|
4,110
|
|
||||||||||
|
Impairment
|
(580
|
)
|
—
|
|
(595
|
)
|
—
|
|
(1,175
|
)
|
||||||||||
|
Net goodwill
|
3,565
|
|
—
|
|
(595
|
)
|
(35
|
)
|
2,935
|
|
||||||||||
|
Energy & Transportation
|
||||||||||||||||||||
|
Goodwill
|
2,738
|
|
37
|
|
—
|
|
(19
|
)
|
2,756
|
|
||||||||||
|
All Other
3
|
||||||||||||||||||||
|
Goodwill
|
49
|
|
—
|
|
—
|
|
6
|
|
55
|
|
||||||||||
|
Consolidated total
|
||||||||||||||||||||
|
Goodwill
|
7,217
|
|
37
|
|
—
|
|
(37
|
)
|
7,217
|
|
||||||||||
|
Impairment
|
(602
|
)
|
—
|
|
(595
|
)
|
—
|
|
(1,197
|
)
|
||||||||||
|
Net goodwill
|
$
|
6,615
|
|
$
|
37
|
|
$
|
(595
|
)
|
$
|
(37
|
)
|
$
|
6,020
|
|
|||||
|
December 31, 2014
|
Acquisitions
1
|
Impairment Loss
|
Other Adjustments
2
|
December 31, 2015
|
||||||||||||||||
|
Construction Industries
|
||||||||||||||||||||
|
Goodwill
|
$
|
297
|
|
$
|
—
|
|
$
|
—
|
|
$
|
(12
|
)
|
$
|
285
|
|
|||||
|
Impairment
|
(22
|
)
|
—
|
|
—
|
|
—
|
|
(22
|
)
|
||||||||||
|
Net goodwill
|
275
|
|
—
|
|
—
|
|
(12
|
)
|
263
|
|
||||||||||
|
Resource Industries
|
||||||||||||||||||||
|
Goodwill
|
4,287
|
|
—
|
|
—
|
|
(142
|
)
|
4,145
|
|
||||||||||
|
Impairment
|
(580
|
)
|
—
|
|
—
|
|
—
|
|
(580
|
)
|
||||||||||
|
Net goodwill
|
3,707
|
|
—
|
|
—
|
|
(142
|
)
|
3,565
|
|
||||||||||
|
Energy & Transportation
|
||||||||||||||||||||
|
Goodwill
|
2,660
|
|
133
|
|
—
|
|
(55
|
)
|
2,738
|
|
||||||||||
|
All Other
3
|
||||||||||||||||||||
|
Goodwill
|
52
|
|
—
|
|
—
|
|
(3
|
)
|
49
|
|
||||||||||
|
Consolidated total
|
||||||||||||||||||||
|
Goodwill
|
7,296
|
|
133
|
|
—
|
|
(212
|
)
|
7,217
|
|
||||||||||
|
Impairment
|
(602
|
)
|
—
|
|
—
|
|
—
|
|
(602
|
)
|
||||||||||
|
Net goodwill
|
$
|
6,694
|
|
$
|
133
|
|
$
|
—
|
|
$
|
(212
|
)
|
$
|
6,615
|
|
|||||
|
1
|
See Note 24 for additional information.
|
|
2
|
Other adjustments are comprised primarily of foreign currency translation.
|
|
3
|
Includes All Other operating segments (See Note 23).
|
|
11.
|
Investments in debt and equity securities
|
We have investments in certain debt and equity securities, primarily at Insurance Services, that have been classified as available-for-sale and recorded at fair value. In addition, Insurance Services has an equity security investment in a real estate investment trust (REIT) which is recorded at fair value based on the net asset value (NAV) of the investment. These investments are primarily included in Other assets in Statement 3. Unrealized gains and losses arising from the revaluation of debt and equity securities are included, net of applicable deferred income taxes, in equity (Accumulated other comprehensive income (loss) in Statement 3). Realized gains and losses on sales of investments are generally determined using the specific identification method for debt and equity securities and are included in Other income (expense) in Statement 1.
114
The cost basis and fair value of debt and equity securities were as follows:
|
|
December 31, 2016
|
December 31, 2015
|
||||||||||||||||||||||
|
(Millions of dollars)
|
Cost
Basis
|
Unrealized
Pretax Net
Gains
(Losses)
|
Fair
Value
|
Cost
Basis
|
Unrealized
Pretax Net
Gains
(Losses)
|
Fair
Value
|
||||||||||||||||||
|
Government debt
|
|
|
|
|
|
|
|
|
|
|
|
|
||||||||||||
|
U.S. treasury bonds
|
$
|
9
|
|
$
|
—
|
|
$
|
9
|
|
$
|
9
|
|
$
|
—
|
|
$
|
9
|
|
||||||
|
Other U.S. and non-U.S. government bonds
|
60
|
|
—
|
|
60
|
|
71
|
|
1
|
|
72
|
|
||||||||||||
|
Corporate bonds
|
|
|
|
|
|
|
|
|
|
|
|
|
||||||||||||
|
Corporate bonds
|
489
|
|
3
|
|
492
|
|
701
|
|
7
|
|
708
|
|
||||||||||||
|
Asset-backed securities
|
90
|
|
—
|
|
90
|
|
129
|
|
—
|
|
129
|
|
||||||||||||
|
Mortgage-backed debt securities
|
|
|
|
|
|
|
|
|
||||||||||||||||
|
U.S. governmental agency
|
225
|
|
(2
|
)
|
223
|
|
291
|
|
1
|
|
292
|
|
||||||||||||
|
Residential
|
10
|
|
—
|
|
10
|
|
12
|
|
—
|
|
12
|
|
||||||||||||
|
Commercial
|
36
|
|
—
|
|
36
|
|
59
|
|
2
|
|
61
|
|
||||||||||||
|
Equity securities
|
|
|
|
|
|
|
|
|
||||||||||||||||
|
Large capitalization value
|
280
|
|
32
|
|
312
|
|
243
|
|
30
|
|
273
|
|
||||||||||||
|
Real estate investment trust (REIT)
|
77
|
|
2
|
|
79
|
|
25
|
|
—
|
|
25
|
|
||||||||||||
|
Smaller company growth
|
41
|
|
15
|
|
56
|
|
37
|
|
17
|
|
54
|
|
||||||||||||
|
Total
|
$
|
1,317
|
|
$
|
50
|
|
$
|
1,367
|
|
$
|
1,577
|
|
$
|
58
|
|
$
|
1,635
|
|
||||||
115
|
Available-for-sale investments in an unrealized loss position that are not other-than-temporarily impaired:
|
||||||||||||||||||||||||
|
|
December 31, 2016
|
|||||||||||||||||||||||
|
Less than 12 months
1
|
12 months or more
1
|
Total
|
||||||||||||||||||||||
|
(Millions of dollars)
|
Fair
Value
|
Unrealized
Losses
|
Fair
Value
|
Unrealized
Losses
|
Fair
Value
|
Unrealized
Losses
|
||||||||||||||||||
|
Corporate bonds
|
|
|
|
|
|
|
|
|
|
|
|
|
||||||||||||
|
Corporate bonds
|
$
|
131
|
|
$
|
1
|
|
$
|
13
|
|
$
|
—
|
|
$
|
144
|
|
$
|
1
|
|
||||||
|
Mortgage-backed debt securities
|
|
|
|
|
|
|
|
|
|
|
|
|
||||||||||||
|
U.S. governmental agency
|
167
|
|
2
|
|
11
|
|
—
|
|
178
|
|
2
|
|
||||||||||||
|
Equity securities
|
|
|
|
|
|
|
|
|
|
|
|
|
||||||||||||
|
Large capitalization value
|
68
|
|
6
|
|
11
|
|
2
|
|
79
|
|
8
|
|
||||||||||||
|
Smaller company growth
|
10
|
|
1
|
|
3
|
|
1
|
|
13
|
|
2
|
|
||||||||||||
|
Total
|
$
|
376
|
|
$
|
10
|
|
$
|
38
|
|
$
|
3
|
|
$
|
414
|
|
$
|
13
|
|
||||||
|
December 31, 2015
|
||||||||||||||||||||||||
|
Less than 12 months
1
|
12 months or more
1
|
Total
|
||||||||||||||||||||||
|
(Millions of dollars)
|
Fair
Value
|
Unrealized
Losses
|
Fair
Value
|
Unrealized
Losses
|
Fair
Value
|
Unrealized
Losses
|
||||||||||||||||||
|
Corporate bonds
|
|
|
|
|
|
|
|
|
|
|
|
|
||||||||||||
|
Corporate bonds
|
$
|
242
|
|
$
|
3
|
|
$
|
27
|
|
$
|
1
|
|
$
|
269
|
|
$
|
4
|
|
||||||
|
Asset-backed securities
|
84
|
|
1
|
|
10
|
|
1
|
|
94
|
|
2
|
|
||||||||||||
|
Mortgage-backed debt securities
|
|
|
|
|
|
|
|
|
|
|
|
|
||||||||||||
|
U.S. governmental agency
|
135
|
|
1
|
|
57
|
|
1
|
|
192
|
|
2
|
|
||||||||||||
|
Equity securities
|
|
|
|
|
||||||||||||||||||||
|
Large capitalization value
|
97
|
|
8
|
|
2
|
|
—
|
|
99
|
|
8
|
|
||||||||||||
|
Smaller company growth
|
14
|
|
1
|
|
—
|
|
—
|
|
14
|
|
1
|
|
||||||||||||
|
Total
|
$
|
572
|
|
$
|
14
|
|
$
|
96
|
|
$
|
3
|
|
$
|
668
|
|
$
|
17
|
|
||||||
|
1
|
Indicates length of time that individual securities have been in a continuous unrealized loss position.
|
Corporate Bonds.
The unrealized losses on our investments in corporate bonds relate to changes in interest rates and credit-related yield spreads since time of purchase. We do not intend to sell the investments and it is not likely that we will be required to sell the investments before recovery of their amortized cost basis. We do not consider these investments to be other-than-temporarily impaired as of
December 31, 2016
.
Mortgage-Backed Debt Securities.
The unrealized losses on our investments in mortgage-backed securities relate to changes in interest rates and credit-related yield spreads since time of purchase. We do not intend to sell the investments and it is not likely that we will be required to sell the investments before recovery of their amortized cost basis. We do not consider these investments to be other-than-temporarily impaired as of
December 31, 2016
.
Equity Securities.
The unrealized losses on our investments in equity securities relate to inherent risks of individual holdings and/or their respective sectors. We do not consider these investments to be other-than-temporarily impaired as of
December 31, 2016
.
The cost basis and fair value of the available-for-sale debt securities at
December 31, 2016
, by contractual maturity, is shown below. Expected maturities will differ from contractual maturities because borrowers may have the right to prepay and creditors may have the right to call obligations.
116
|
December 31, 2016
|
||||||||
|
(Millions of dollars)
|
Cost Basis
|
Fair Value
|
||||||
|
Due in one year or less
|
$
|
188
|
|
$
|
189
|
|
||
|
Due after one year through five years
|
421
|
|
423
|
|
||||
|
Due after five years through ten years
|
13
|
|
13
|
|
||||
|
Due after ten years
|
26
|
|
26
|
|
||||
|
U.S. governmental agency mortgage-backed securities
|
225
|
|
223
|
|
||||
|
Residential mortgage-backed securities
|
10
|
|
10
|
|
||||
|
Commercial mortgage-backed securities
|
36
|
|
36
|
|
||||
|
Total debt securities – available-for-sale
|
$
|
919
|
|
$
|
920
|
|
||
|
Sales of Securities:
|
||||||||||||
|
|
Years Ended December 31,
|
|||||||||||
|
(Millions of dollars)
|
2016
|
2015
|
2014
|
|||||||||
|
Proceeds from the sale of available-for-sale securities
|
$
|
694
|
|
$
|
351
|
|
$
|
434
|
|
|||
|
Gross gains from the sale of available-for-sale securities
|
$
|
55
|
|
$
|
64
|
|
$
|
38
|
|
|||
|
Gross losses from the sale of available-for-sale securities
|
$
|
4
|
|
$
|
2
|
|
$
|
2
|
|
|||
|
12.
|
Postemployment benefit plans
|
We provide defined benefit pension plans, defined contribution plans and/or other postretirement benefit plans (retirement health care and life insurance) to employees in many of our locations throughout the world. Our defined benefit pension plans provide a benefit based on years of service and/or the employee’s average earnings near retirement. Our defined contribution plans allow employees to contribute a portion of their salary to help save for retirement, and in most cases, we provide a matching contribution. The benefit obligation related to our non-U.S. defined benefit pension plans are for employees located primarily in Europe, Japan and Brazil. For other post retirement benefits (OPEB), substantially all of our benefit obligation is for employees located in the United States.
Our U.S. defined benefit pension plans for support and management employees were frozen for certain employees on December 31, 2010, and will freeze for remaining employees on December 31, 2019. On the respective transition dates employees move to a retirement benefit that provides a frozen pension benefit and a 401(k) plan that will include a matching contribution and a new annual employer contribution.
As discussed in Note 26, during 2015 the company offered a voluntary retirement enhancement program to qualifying U.S. employees. This voluntary program impacted employees participating in certain U.S. pension and OPEB plans and resulted in a curtailment loss of
$82 million
, recognized in Other operating (income) expenses in Statement 1.
At December 31, 2015, we changed our method for calculating the service and interest cost components of net periodic benefit cost. Historically, these components were determined utilizing a single weighted-average discount rate based on a yield curve used to measure the benefit obligation at the beginning of the period. Beginning in 2016, we elected to utilize a full yield curve approach in the estimation of service and interest costs by applying the specific spot rates along the yield curve used in the determination of the benefit obligation to the relevant projected cash flows. We made this change to provide a more precise measurement of service and interest costs by improving the correlation between the projected cash flows to the corresponding spot rates along the yield curve. Under the previous method the discount rate used for the service and interest components of cost would have been
4.2 percent
for U.S. pensions,
3.2 percent
for non-U.S. pension and
4.1 percent
for OPEB. This change had no impact on our year-end defined benefit pension and OPEB obligations or our annual net periodic benefit cost as the lower service and interest costs were entirely offset in the actuarial loss (gain) reported. Compared to the method used in 2015, this change lowered service and interest costs by
$180 million
. This change was accounted for prospectively as a change in accounting estimate.
117
|
A.
|
Benefit obligations
|
|
|
U.S. Pension Benefits
|
Non-U.S.
Pension Benefits
|
Other Postretirement
Benefits
|
|||||||||||||||||||||
|
(Millions of dollars)
|
2016
|
2015
|
2016
|
2015
|
2016
|
2015
|
||||||||||||||||||
|
Change in benefit obligation:
|
|
|
|
|
|
|
|
|
|
|
|
|
||||||||||||
|
Benefit obligation, beginning of year
|
$
|
15,792
|
|
$
|
16,249
|
|
$
|
4,355
|
|
$
|
4,801
|
|
$
|
4,313
|
|
$
|
4,938
|
|
||||||
|
Service cost
|
119
|
|
181
|
|
92
|
|
110
|
|
82
|
|
101
|
|
||||||||||||
|
Interest cost
|
517
|
|
608
|
|
117
|
|
146
|
|
131
|
|
181
|
|
||||||||||||
|
Plan amendments
|
—
|
|
—
|
|
(5
|
)
|
—
|
|
(188
|
)
|
3
|
|
||||||||||||
|
Actuarial losses (gains)
|
767
|
|
(384
|
)
|
512
|
|
(152
|
)
|
60
|
|
(625
|
)
|
||||||||||||
|
Foreign currency exchange rates
|
—
|
|
—
|
|
(369
|
)
|
(307
|
)
|
14
|
|
(43
|
)
|
||||||||||||
|
Participant contributions
|
—
|
|
—
|
|
7
|
|
8
|
|
57
|
|
52
|
|
||||||||||||
|
Benefits paid - gross
|
(970
|
)
|
(890
|
)
|
(238
|
)
|
(191
|
)
|
(388
|
)
|
(345
|
)
|
||||||||||||
|
Less: federal subsidy on benefits paid
|
—
|
|
—
|
|
—
|
|
—
|
|
11
|
|
11
|
|
||||||||||||
|
Curtailments, settlements and termination benefits
|
(7
|
)
|
28
|
|
1
|
|
(60
|
)
|
(4
|
)
|
40
|
|
||||||||||||
|
Benefit obligation, end of year
|
$
|
16,218
|
|
$
|
15,792
|
|
$
|
4,472
|
|
$
|
4,355
|
|
$
|
4,088
|
|
$
|
4,313
|
|
||||||
|
Accumulated benefit obligation, end of year
|
$
|
16,034
|
|
$
|
15,550
|
|
$
|
4,163
|
|
$
|
4,024
|
|
|
|
|
|
||||||||
|
Weighted-average assumptions used to
determine benefit obligation:
|
|
|
|
|
|
|
|
|
|
|
|
|
||||||||||||
|
Discount rate
|
4.0
|
%
|
4.2
|
%
|
2.5
|
%
|
3.2
|
%
|
4.0
|
%
|
4.1
|
%
|
||||||||||||
|
Rate of compensation increase
|
4.0
|
%
|
4.0
|
%
|
4.0
|
%
|
3.8
|
%
|
4.0
|
%
|
4.0
|
%
|
||||||||||||
The assumed discount rate is used to discount future benefit obligations back to today’s dollars. The U.S. discount rate is based on a benefit cash flow-matching approach and represents the rate at which our benefit obligations could effectively be settled as of our measurement date, December 31. The benefit cash flow-matching approach involves analyzing Caterpillar’s projected cash flows against a high quality bond yield curve, calculated using a wide population of corporate Aa bonds available on the measurement date. The very highest and lowest yielding bonds (top and bottom
10 percent
) are excluded from the analysis. A similar process is used to determine the assumed discount rate for our most significant non-U.S. plans. This rate is sensitive to changes in interest rates. A decrease in the discount rate would increase our obligation and future expense.
|
B.
|
Plan assets
|
|
|
U.S. Pension Benefits
|
Non-U.S.
Pension Benefits
|
Other Postretirement
Benefits
|
||||||||||||||||||||||||
|
(Millions of dollars)
|
2016
|
2015
|
2016
|
2015
|
2016
|
2015
|
|||||||||||||||||||||
|
Change in plan assets:
|
|
|
|
|
|
|
|
|
|
|
|
|
|||||||||||||||
|
Fair value of plan assets, beginning of year
|
$
|
11,440
|
|
$
|
12,530
|
|
$
|
3,890
|
|
$
|
4,100
|
|
$
|
650
|
|
$
|
776
|
|
|||||||||
|
Actual return on plan assets
|
860
|
|
(225
|
)
|
503
|
|
107
|
|
55
|
|
3
|
|
|||||||||||||||
|
Foreign currency exchange rates
|
—
|
|
—
|
|
(392
|
)
|
(234
|
)
|
—
|
|
—
|
|
|||||||||||||||
|
Company contributions
|
36
|
|
30
|
|
117
|
|
156
|
|
176
|
|
164
|
|
|||||||||||||||
|
Participant contributions
|
—
|
|
—
|
|
7
|
|
8
|
|
57
|
|
52
|
|
|||||||||||||||
|
Benefits paid
|
(970
|
)
|
(890
|
)
|
(238
|
)
|
(191
|
)
|
(388
|
)
|
(345
|
)
|
|||||||||||||||
|
Settlements and termination benefits
|
(12
|
)
|
(5
|
)
|
—
|
|
(56
|
)
|
—
|
|
—
|
|
|||||||||||||||
|
Fair value of plan assets, end of year
|
$
|
11,354
|
|
$
|
11,440
|
|
$
|
3,887
|
|
$
|
3,890
|
|
$
|
550
|
|
$
|
650
|
|
|||||||||
In general, our strategy for both the U.S. and non-U.S. pensions includes ongoing alignment of our investments to our liabilities, while reducing risk in our portfolio. The current U.S. pension target asset allocations are
40 percent
equities and
60 percent
fixed income. These target allocations will be revisited periodically to ensure that they reflect our overall objectives. The non-U.S. pension weighted-average target allocations are
39 percent
equities,
52 percent
fixed income,
6 percent
real estate
118
and
3 percent
other. The target allocations for each plan vary based upon local statutory requirements, demographics of plan participants and funded status. The non-U.S. plan assets are primarily invested in non-U.S. securities.
Our target allocations for the other postretirement benefit plans are
70 percent
equities and
30 percent
fixed income.
The U.S. plans are rebalanced to plus or minus
5
percentage points of the target asset allocation ranges on a monthly basis. The frequency of rebalancing for the non-U.S. plans varies depending on the plan. As a result of our diversification strategies, there are no significant concentrations of risk within the portfolio of investments.
The use of certain derivative instruments is permitted where appropriate and necessary for achieving overall investment policy objectives. The plans do not engage in derivative contracts for speculative purposes.
The accounting guidance on fair value measurements specifies a fair value hierarchy based upon the observability of inputs used in valuation techniques (Level 1, 2 and 3). See Note 18 for a discussion of the fair value hierarchy.
Fair values are determined as follows:
|
•
|
Equity securities are primarily based on valuations for identical instruments in active markets.
|
|
•
|
Fixed income securities are primarily based upon models that take into consideration such market-based factors as recent sales, risk-free yield curves and prices of similarly rated bonds.
|
|
•
|
Real estate is stated at the fund’s net asset value or at appraised value.
|
|
•
|
Cash, short-term instruments and other are based on the carrying amount, which approximates fair value, or the fund’s net asset value.
|
The fair value of the pension and other postretirement benefit plan assets by category is summarized below:
|
|
December 31, 2016
|
|||||||||||||||||||
|
(Millions of dollars)
|
Level 1
|
Level 2
|
Level 3
|
Measured at NAV
|
Total Assets at Fair Value
|
|||||||||||||||
|
U.S. Pension
|
|
|
|
|
|
|
|
|
|
|
||||||||||
|
Equity securities:
|
|
|
|
|
|
|
|
|
|
|
||||||||||
|
U.S. equities
|
$
|
2,816
|
|
$
|
—
|
|
$
|
5
|
|
$
|
174
|
|
$
|
2,995
|
|
|||||
|
Non-U.S. equities
|
1,653
|
|
5
|
|
—
|
|
—
|
|
1,658
|
|
||||||||||
|
Fixed income securities:
|
|
|
|
|
|
|
|
|
||||||||||||
|
U.S. corporate bonds
|
—
|
|
4,273
|
|
31
|
|
85
|
|
4,389
|
|
||||||||||
|
Non-U.S. corporate bonds
|
—
|
|
710
|
|
—
|
|
—
|
|
710
|
|
||||||||||
|
U.S. government bonds
|
—
|
|
647
|
|
—
|
|
—
|
|
647
|
|
||||||||||
|
U.S. governmental agency mortgage-backed securities
|
—
|
|
491
|
|
—
|
|
—
|
|
491
|
|
||||||||||
|
Non-U.S. government bonds
|
—
|
|
90
|
|
—
|
|
—
|
|
90
|
|
||||||||||
|
Real estate
|
—
|
|
—
|
|
10
|
|
—
|
|
10
|
|
||||||||||
|
Cash, short-term instruments and other
|
93
|
|
74
|
|
11
|
|
186
|
|
364
|
|
||||||||||
|
Total U.S. pension assets
|
$
|
4,562
|
|
$
|
6,290
|
|
$
|
57
|
|
$
|
445
|
|
$
|
11,354
|
|
|||||
119
|
|
December 31, 2015
|
|||||||||||||||||||
|
(Millions of dollars)
|
Level 1
|
Level 2
|
Level 3
|
Measured at NAV
|
Total Assets at Fair Value
|
|||||||||||||||
|
U.S. Pension
|
|
|
|
|
|
|
|
|
||||||||||||
|
Equity securities:
|
|
|
|
|
|
|
|
|
||||||||||||
|
U.S. equities
|
$
|
2,976
|
|
$
|
—
|
|
$
|
4
|
|
$
|
168
|
|
$
|
3,148
|
|
|||||
|
Non-U.S. equities
|
2,044
|
|
5
|
|
1
|
|
—
|
|
2,050
|
|
||||||||||
|
Fixed income securities:
|
|
|
|
|
|
|
|
|
||||||||||||
|
U.S. corporate bonds
|
—
|
|
3,872
|
|
42
|
|
132
|
|
4,046
|
|
||||||||||
|
Non-U.S. corporate bonds
|
—
|
|
575
|
|
—
|
|
—
|
|
575
|
|
||||||||||
|
U.S. government bonds
|
—
|
|
526
|
|
—
|
|
—
|
|
526
|
|
||||||||||
|
U.S. governmental agency mortgage-backed securities
|
—
|
|
627
|
|
—
|
|
—
|
|
627
|
|
||||||||||
|
Non-U.S. government bonds
|
—
|
|
65
|
|
—
|
|
—
|
|
65
|
|
||||||||||
|
Real estate
|
—
|
|
—
|
|
9
|
|
—
|
|
9
|
|
||||||||||
|
Cash, short-term instruments and other
|
157
|
|
28
|
|
3
|
|
206
|
|
394
|
|
||||||||||
|
Total U.S. pension assets
|
$
|
5,177
|
|
$
|
5,698
|
|
$
|
59
|
|
$
|
506
|
|
$
|
11,440
|
|
|||||
We have revised previously reported Level 2, Level 3 and Measured at NAV for U.S. Pension. Level 2 assets decreased
$141 million
, Level 3 assets increased
$9 million
and Measured at NAV increased
$132 million
for the U.S. Pension in 2015. The revision did not impact total assets. Management has concluded that the impact was not material to any period presented.
|
|
December 31, 2016
|
|||||||||||||||||||
|
(Millions of dollars)
|
Level 1
|
Level 2
|
Level 3
|
Measured at NAV
|
Total Assets at Fair Value
|
|||||||||||||||
|
Non-U.S. Pension
|
|
|
|
|
|
|
|
|
||||||||||||
|
Equity securities:
|
|
|
|
|
|
|
|
|
||||||||||||
|
U.S. equities
|
$
|
405
|
|
$
|
—
|
|
$
|
—
|
|
$
|
108
|
|
$
|
513
|
|
|||||
|
Non-U.S. equities
|
639
|
|
38
|
|
—
|
|
119
|
|
796
|
|
||||||||||
|
Global equities
1
|
122
|
|
34
|
|
—
|
|
—
|
|
156
|
|
||||||||||
|
Fixed income securities:
|
|
|
|
|
|
|
|
|
||||||||||||
|
U.S. corporate bonds
|
—
|
|
151
|
|
1
|
|
—
|
|
152
|
|
||||||||||
|
Non-U.S. corporate bonds
|
—
|
|
345
|
|
1
|
|
10
|
|
356
|
|
||||||||||
|
U.S. government bonds
|
—
|
|
44
|
|
—
|
|
—
|
|
44
|
|
||||||||||
|
Non-U.S. government bonds
|
—
|
|
1,172
|
|
—
|
|
—
|
|
1,172
|
|
||||||||||
|
Global fixed income
1
|
—
|
|
221
|
|
—
|
|
199
|
|
420
|
|
||||||||||
|
Real estate
|
—
|
|
179
|
|
—
|
|
—
|
|
179
|
|
||||||||||
|
Cash, short-term instruments and other
2
|
53
|
|
46
|
|
—
|
|
—
|
|
99
|
|
||||||||||
|
Total non-U.S. pension assets
|
$
|
1,219
|
|
$
|
2,230
|
|
$
|
2
|
|
$
|
436
|
|
$
|
3,887
|
|
|||||
120
|
|
December 31, 2015
|
|||||||||||||||||||
|
(Millions of dollars)
|
Level 1
|
Level 2
|
Level 3
|
Measured at NAV
|
Total Assets at Fair Value
|
|||||||||||||||
|
Non-U.S. Pension
|
|
|
|
|
|
|
|
|
||||||||||||
|
Equity securities:
|
|
|
|
|
|
|
|
|
||||||||||||
|
U.S. equities
|
$
|
426
|
|
$
|
—
|
|
$
|
—
|
|
$
|
118
|
|
$
|
544
|
|
|||||
|
Non-U.S. equities
|
680
|
|
29
|
|
2
|
|
123
|
|
834
|
|
||||||||||
|
Global equities
1
|
155
|
|
49
|
|
—
|
|
—
|
|
204
|
|
||||||||||
|
Fixed income securities:
|
|
|
|
|
|
|
|
|
||||||||||||
|
U.S. corporate bonds
|
—
|
|
135
|
|
3
|
|
—
|
|
138
|
|
||||||||||
|
Non-U.S. corporate bonds
|
—
|
|
389
|
|
2
|
|
11
|
|
402
|
|
||||||||||
|
U.S. government bonds
|
—
|
|
64
|
|
—
|
|
—
|
|
64
|
|
||||||||||
|
Non-U.S. government bonds
|
—
|
|
1,083
|
|
—
|
|
—
|
|
1,083
|
|
||||||||||
|
Global fixed income
1
|
—
|
|
166
|
|
—
|
|
175
|
|
341
|
|
||||||||||
|
Real estate
|
—
|
|
172
|
|
—
|
|
—
|
|
172
|
|
||||||||||
|
Cash, short-term instruments and other
2
|
61
|
|
47
|
|
—
|
|
—
|
|
108
|
|
||||||||||
|
Total non-U.S. pension assets
|
$
|
1,322
|
|
$
|
2,134
|
|
$
|
7
|
|
$
|
427
|
|
$
|
3,890
|
|
|||||
|
1
|
Includes funds that invest in both U.S. and non-U.S. securities.
|
|
2
|
Includes funds that invest in multiple asset classes, hedge funds and other.
|
|
|
December 31, 2016
|
|||||||||||||||||||
|
(Millions of dollars)
|
Level 1
|
Level 2
|
Level 3
|
Measured at NAV
|
Total Assets at Fair Value
|
|||||||||||||||
|
Other Postretirement Benefits
|
|
|
|
|
|
|
|
|
||||||||||||
|
Equity securities:
|
|
|
|
|
|
|
|
|
||||||||||||
|
U.S. equities
|
$
|
276
|
|
$
|
1
|
|
$
|
—
|
|
$
|
—
|
|
$
|
277
|
|
|||||
|
Non-U.S. equities
|
110
|
|
—
|
|
—
|
|
—
|
|
110
|
|
||||||||||
|
Fixed income securities:
|
|
|
|
|
|
|
|
|
||||||||||||
|
U.S. corporate bonds
|
—
|
|
69
|
|
—
|
|
1
|
|
70
|
|
||||||||||
|
Non-U.S. corporate bonds
|
—
|
|
17
|
|
—
|
|
—
|
|
17
|
|
||||||||||
|
U.S. government bonds
|
—
|
|
16
|
|
—
|
|
—
|
|
16
|
|
||||||||||
|
U.S. governmental agency mortgage-backed securities
|
—
|
|
31
|
|
—
|
|
—
|
|
31
|
|
||||||||||
|
Non-U.S. government bonds
|
—
|
|
4
|
|
—
|
|
—
|
|
4
|
|
||||||||||
|
Cash, short-term instruments and other
|
5
|
|
1
|
|
—
|
|
19
|
|
25
|
|
||||||||||
|
Total other postretirement benefit assets
|
$
|
391
|
|
$
|
139
|
|
$
|
—
|
|
$
|
20
|
|
$
|
550
|
|
|||||
121
|
|
December 31, 2015
|
|||||||||||||||||||
|
(Millions of dollars)
|
Level 1
|
Level 2
|
Level 3
|
Measured at NAV
|
Total Assets at Fair Value
|
|||||||||||||||
|
Other Postretirement Benefits
|
|
|
|
|
|
|
|
|
||||||||||||
|
Equity securities:
|
|
|
|
|
|
|
|
|
||||||||||||
|
U.S. equities
|
$
|
296
|
|
$
|
1
|
|
$
|
—
|
|
$
|
—
|
|
$
|
297
|
|
|||||
|
Non-U.S. equities
|
136
|
|
—
|
|
—
|
|
—
|
|
136
|
|
||||||||||
|
Fixed income securities:
|
|
|
|
|
|
|
|
|
||||||||||||
|
U.S. corporate bonds
|
—
|
|
83
|
|
—
|
|
4
|
|
87
|
|
||||||||||
|
Non-U.S. corporate bonds
|
—
|
|
18
|
|
—
|
|
—
|
|
18
|
|
||||||||||
|
U.S. government bonds
|
—
|
|
31
|
|
—
|
|
—
|
|
31
|
|
||||||||||
|
U.S. governmental agency mortgage-backed securities
|
—
|
|
45
|
|
—
|
|
—
|
|
45
|
|
||||||||||
|
Non-U.S. government bonds
|
—
|
|
4
|
|
—
|
|
—
|
|
4
|
|
||||||||||
|
Cash, short-term instruments and other
|
17
|
|
15
|
|
—
|
|
—
|
|
32
|
|
||||||||||
|
Total other postretirement benefit assets
|
$
|
449
|
|
$
|
197
|
|
$
|
—
|
|
$
|
4
|
|
$
|
650
|
|
|||||
122
Below are roll-forwards of assets measured at fair value using Level 3 inputs for the years ended
December 31, 2016
and
2015
. These instruments were valued using pricing models that, in management’s judgment, reflect the assumptions a market participant would use.
|
(Millions of dollars)
|
Equities
|
Fixed Income
|
Real Estate
|
Other
|
||||||||||||
|
U.S. Pension
|
|
|
|
|
|
|
|
|
||||||||
|
Balance at December 31, 2014
|
$
|
9
|
|
$
|
29
|
|
$
|
9
|
|
$
|
—
|
|
||||
|
Unrealized gains (losses)
|
(1
|
)
|
(1
|
)
|
—
|
|
—
|
|
||||||||
|
Realized gains (losses)
|
1
|
|
—
|
|
—
|
|
—
|
|
||||||||
|
Purchases, issuances and settlements, net
|
(4
|
)
|
16
|
|
—
|
|
2
|
|
||||||||
|
Transfers in and/or out of Level 3
|
—
|
|
(2
|
)
|
—
|
|
1
|
|
||||||||
|
Balance at December 31, 2015
|
$
|
5
|
|
$
|
42
|
|
$
|
9
|
|
$
|
3
|
|
||||
|
Unrealized gains (losses)
|
—
|
|
4
|
|
1
|
|
—
|
|
||||||||
|
Realized gains (losses)
|
—
|
|
(5
|
)
|
—
|
|
—
|
|
||||||||
|
Purchases, issuances and settlements, net
|
1
|
|
(9
|
)
|
—
|
|
8
|
|
||||||||
|
Transfers in and/or out of Level 3
|
(1
|
)
|
(1
|
)
|
—
|
|
—
|
|
||||||||
|
Balance at December 31, 2016
|
$
|
5
|
|
$
|
31
|
|
$
|
10
|
|
$
|
11
|
|
||||
|
Non-U.S. Pension
|
|
|
|
|
|
|
|
|
||||||||
|
Balance at December 31, 2014
|
$
|
—
|
|
$
|
11
|
|
$
|
39
|
|
$
|
—
|
|
||||
|
Unrealized gains (losses)
|
—
|
|
(1
|
)
|
(17
|
)
|
—
|
|
||||||||
|
Realized gains (losses)
|
—
|
|
—
|
|
15
|
|
—
|
|
||||||||
|
Purchases, issuances and settlements, net
|
—
|
|
—
|
|
(37
|
)
|
—
|
|
||||||||
|
Transfers in and/or out of Level 3
|
2
|
|
(5
|
)
|
—
|
|
—
|
|
||||||||
|
Balance at December 31, 2015
|
$
|
2
|
|
$
|
5
|
|
$
|
—
|
|
$
|
—
|
|
||||
|
Unrealized gains (losses)
|
—
|
|
—
|
|
—
|
|
—
|
|
||||||||
|
Realized gains (losses)
|
(1
|
)
|
—
|
|
—
|
|
—
|
|
||||||||
|
Purchases, issuances and settlements, net
|
(1
|
)
|
(1
|
)
|
—
|
|
—
|
|
||||||||
|
Transfers in and/or out of Level 3
|
—
|
|
(2
|
)
|
—
|
|
—
|
|
||||||||
|
Balance at December 31, 2016
|
$
|
—
|
|
$
|
2
|
|
$
|
—
|
|
$
|
—
|
|
||||
123
|
C.
|
Funded status
|
The funded status of the plans, reconciled to the amount reported on Statement 3, is as follows:
|
|
U.S. Pension Benefits
|
Non-U.S.
Pension Benefits
|
Other Postretirement Benefits
|
||||||||||||||||||||||||
|
(Millions of dollars)
|
2016
|
2015
|
2016
|
2015
|
2016
|
2015
|
|||||||||||||||||||||
|
End of Year
|
|
|
|
|
|
|
|
|
|
|
|
|
|||||||||||||||
|
Fair value of plan assets
|
$
|
11,354
|
|
$
|
11,440
|
|
$
|
3,887
|
|
$
|
3,890
|
|
$
|
550
|
|
$
|
650
|
|
|||||||||
|
Benefit obligations
|
16,218
|
|
15,792
|
|
4,472
|
|
4,355
|
|
4,088
|
|
4,313
|
|
|||||||||||||||
|
Over (under) funded status recognized in financial position
|
$
|
(4,864
|
)
|
$
|
(4,352
|
)
|
$
|
(585
|
)
|
$
|
(465
|
)
|
$
|
(3,538
|
)
|
$
|
(3,663
|
)
|
|||||||||
|
Components of net amount recognized in financial position:
|
|
|
|
|
|
|
|
|
|
|
|
|
|||||||||||||||
|
Other assets (non-current asset)
|
$
|
4
|
|
$
|
6
|
|
$
|
152
|
|
$
|
163
|
|
$
|
—
|
|
$
|
—
|
|
|||||||||
|
Accrued wages, salaries and employee benefits (current liability)
|
(35
|
)
|
(32
|
)
|
(20
|
)
|
(19
|
)
|
(162
|
)
|
(161
|
)
|
|||||||||||||||
|
Liability for postemployment benefits (non-current liability)
|
(4,833
|
)
|
(4,326
|
)
|
(717
|
)
|
(609
|
)
|
(3,376
|
)
|
(3,502
|
)
|
|||||||||||||||
|
Net liability recognized
|
$
|
(4,864
|
)
|
$
|
(4,352
|
)
|
$
|
(585
|
)
|
$
|
(465
|
)
|
$
|
(3,538
|
)
|
$
|
(3,663
|
)
|
|||||||||
|
Amounts recognized in Accumulated other comprehensive income (pre-tax) consist of:
|
|
|
|
|
|
|
|
|
|
|
|
|
|||||||||||||||
|
Prior service cost (credit)
|
$
|
—
|
|
$
|
1
|
|
$
|
(5
|
)
|
$
|
1
|
|
$
|
(85
|
)
|
$
|
39
|
|
|||||||||
The estimated amount of prior service cost (credit) that will be amortized from Accumulated other comprehensive income (loss) at
December 31, 2016
into net periodic benefit cost (pre-tax) in 2017 are as follows:
|
(Millions of dollars)
|
U.S.
Pension Benefits
|
Non-U.S.
Pension Benefits
|
Other
Postretirement
Benefits
|
|||||||||
|
Prior service cost (credit)
|
$
|
—
|
|
$
|
(1
|
)
|
$
|
(21
|
)
|
|||
The following amounts relate to our pension plans with projected benefit obligations in excess of plan assets:
|
|
U.S. Pension Benefits at Year-end
|
Non-U.S. Pension Benefits at Year-end
|
||||||||||||||
|
(Millions of dollars)
|
2016
|
2015
|
2016
|
2015
|
||||||||||||
|
Projected benefit obligation
|
$
|
16,163
|
|
$
|
15,734
|
|
$
|
4,098
|
|
$
|
1,818
|
|
||||
|
Accumulated benefit obligation
|
$
|
15,979
|
|
$
|
15,493
|
|
$
|
3,835
|
|
$
|
1,657
|
|
||||
|
Fair value of plan assets
|
$
|
11,295
|
|
$
|
11,377
|
|
$
|
3,361
|
|
$
|
1,190
|
|
||||
124
The following amounts relate to our pension plans with accumulated benefit obligations in excess of plan assets:
|
|
U.S. Pension Benefits at Year-end
|
Non-U.S. Pension Benefits at Year-end
|
||||||||||||||
|
(Millions of dollars)
|
2016
|
2015
|
2016
|
2015
|
||||||||||||
|
Projected benefit obligation
|
$
|
16,163
|
|
$
|
15,734
|
|
$
|
1,707
|
|
$
|
1,363
|
|
||||
|
Accumulated benefit obligation
|
$
|
15,979
|
|
$
|
15,493
|
|
$
|
1,607
|
|
$
|
1,320
|
|
||||
|
Fair value of plan assets
|
$
|
11,295
|
|
$
|
11,377
|
|
$
|
1,024
|
|
$
|
793
|
|
||||
The accumulated postretirement benefit obligation exceeds plan assets for all of our other postretirement benefit plans for all years presented.
|
D.
|
Expected contributions and benefit payments
|
Information about expected contributions and benefit payments for pension and other postretirement benefit plans is as follows:
|
(Millions of dollars)
|
U.S.
Pension Benefits
|
Non-U.S.
Pension Benefits
|
Other
Postretirement
Benefits
|
|||||||||
|
Employer contributions:
|
|
|
|
|
|
|
||||||
|
2017 (expected)
|
$
|
350
|
|
$
|
100
|
|
$
|
160
|
|
|||
|
Expected benefit payments:
|
|
|
|
|
|
|
||||||
|
2017
|
$
|
1,020
|
|
$
|
190
|
|
$
|
310
|
|
|||
|
2018
|
980
|
|
160
|
|
300
|
|
||||||
|
2019
|
990
|
|
160
|
|
300
|
|
||||||
|
2020
|
990
|
|
160
|
|
290
|
|
||||||
|
2021
|
990
|
|
170
|
|
280
|
|
||||||
|
2022-2026
|
4,900
|
|
970
|
|
1,320
|
|
||||||
|
Total
|
$
|
9,870
|
|
$
|
1,810
|
|
$
|
2,800
|
|
|||
The above table reflects the total employer contributions and benefits expected to be paid from the plan or from company assets and does not include the participants’ share of the cost. The expected benefit payments for our other postretirement benefits include payments for prescription drug benefits. Medicare Part D subsidy amounts expected to be received by the company which will offset other postretirement benefit payments are as follows:
|
(Millions of dollars)
|
2017
|
2018
|
2019
|
2020
|
2021
|
2022-2026
|
Total
|
|||||||||||||||||||||
|
Other postretirement benefits
|
$
|
15
|
|
$
|
15
|
|
$
|
20
|
|
$
|
20
|
|
$
|
20
|
|
$
|
95
|
|
$
|
185
|
|
|||||||
125
|
E.
|
Net periodic cost
|
|
|
U.S. Pension Benefits
|
Non-U.S. Pension Benefits
|
Other Postretirement Benefits
|
|||||||||||||||||||||||||||||||||
|
(Millions of dollars)
|
2016
|
2015
|
2014
|
2016
|
2015
|
2014
|
2016
|
2015
|
2014
|
|||||||||||||||||||||||||||
|
Components of net periodic benefit cost:
|
|
|
|
|
|
|
|
|
|
|
|
|
|
|
|
|
|
|
||||||||||||||||||
|
Service cost
|
$
|
119
|
|
$
|
181
|
|
$
|
157
|
|
$
|
92
|
|
$
|
110
|
|
$
|
109
|
|
$
|
82
|
|
$
|
101
|
|
$
|
82
|
|
|||||||||
|
Interest cost
|
517
|
|
608
|
|
648
|
|
117
|
|
146
|
|
185
|
|
131
|
|
181
|
|
213
|
|
||||||||||||||||||
|
Expected return on plan assets
1
|
(757
|
)
|
(890
|
)
|
(943
|
)
|
(227
|
)
|
(273
|
)
|
(271
|
)
|
(44
|
)
|
(56
|
)
|
(58
|
)
|
||||||||||||||||||
|
Curtailments and termination benefits
2
|
6
|
|
32
|
|
—
|
|
1
|
|
(1
|
)
|
2
|
|
(9
|
)
|
27
|
|
(4
|
)
|
||||||||||||||||||
|
Amortization of prior service cost (credit)
3
|
—
|
|
1
|
|
17
|
|
3
|
|
—
|
|
—
|
|
(59
|
)
|
(54
|
)
|
(55
|
)
|
||||||||||||||||||
|
Actuarial loss (gain)
4
|
664
|
|
732
|
|
2,088
|
|
262
|
|
8
|
|
345
|
|
59
|
|
(561
|
)
|
191
|
|
||||||||||||||||||
|
Total cost (benefit) included in operating profit
|
$
|
549
|
|
$
|
664
|
|
$
|
1,967
|
|
$
|
248
|
|
$
|
(10
|
)
|
$
|
370
|
|
$
|
160
|
|
$
|
(362
|
)
|
$
|
369
|
|
|||||||||
|
Other changes in plan assets and benefit obligations recognized in other comprehensive income (pre-tax):
|
|
|
|
|
|
|
|
|
|
|
|
|
|
|
|
|
|
|
||||||||||||||||||
|
Current year prior service cost (credit)
|
$
|
—
|
|
$
|
—
|
|
$
|
—
|
|
$
|
(3
|
)
|
$
|
(8
|
)
|
$
|
(4
|
)
|
$
|
(184
|
)
|
$
|
16
|
|
$
|
(2
|
)
|
|||||||||
|
Amortization of prior service (cost) credit
|
—
|
|
(1
|
)
|
(17
|
)
|
(3
|
)
|
—
|
|
—
|
|
59
|
|
54
|
|
55
|
|
||||||||||||||||||
|
Total recognized in other comprehensive income
|
—
|
|
(1
|
)
|
(17
|
)
|
(6
|
)
|
(8
|
)
|
(4
|
)
|
(125
|
)
|
70
|
|
53
|
|
||||||||||||||||||
|
Total recognized in net periodic cost and other comprehensive income
|
$
|
549
|
|
$
|
663
|
|
$
|
1,950
|
|
$
|
242
|
|
$
|
(18
|
)
|
$
|
366
|
|
$
|
35
|
|
$
|
(292
|
)
|
$
|
422
|
|
|||||||||
|
Weighted-average assumptions used to determine net cost:
|
|
|
|
|
|
|
|
|
|
|
|
|
|
|
|
|
|
|
||||||||||||||||||
|
Discount rate used to measure service cost
|
4.5
|
%
|
3.8
|
%
|
4.6
|
%
|
2.9
|
%
|
3.3
|
%
|
4.1
|
%
|
4.2
|
%
|
3.9
|
%
|
4.6
|
%
|
||||||||||||||||||
|
Discount rate used to measure interest cost
|
3.4
|
%
|
3.8
|
%
|
4.6
|
%
|
2.8
|
%
|
3.3
|
%
|
4.1
|
%
|
3.3
|
%
|
3.9
|
%
|
4.6
|
%
|
||||||||||||||||||
|
Expected rate of return on plan assets
5
|
6.9
|
%
|
7.4
|
%
|
7.8
|
%
|
6.1
|
%
|
6.8
|
%
|
6.9
|
%
|
7.5
|
%
|
7.8
|
%
|
7.8
|
%
|
||||||||||||||||||
|
Rate of compensation increase
|
4.0
|
%
|
4.0
|
%
|
4.0
|
%
|
3.6
|
%
|
4.0
|
%
|
4.2
|
%
|
4.0
|
%
|
4.0
|
%
|
4.0
|
%
|
||||||||||||||||||
|
1
|
Expected return on plan assets developed using the fair value of plan assets.
|
|
2
|
Curtailments and termination benefits were recognized in Other operating (income) expenses in Statement 1.
|
|
3
|
Prior service cost (credit) for both pension and other postretirement benefits are generally amortized using the straight-line method over the average remaining service period of active employees expected to receive benefits from the plan. For pension plans in which all or almost all of the plan's participants are inactive and other postretirement benefit plans in which all or almost all of the plan's participants are fully eligible for benefits under the plan, prior service cost (credit) are amortized using the straight-line method over the remaining life expectancy of those participants.
|
|
4
|
Actuarial loss (gain) represent the effects of actual results differing from our assumptions and the effects of changing assumptions. We recognize actuarial loss (gain) immediately through earnings upon the annual remeasurement in the fourth quarter, or on an interim basis as triggering events warrant remeasurement.
|
|
5
|
The weighted-average rates for 2017 are
6.7 percent
and
5.9 percent
for U.S. and non-U.S. pension plans, respectively.
|
The discount rates used in the determination of our service and interest cost components are determined by utilizing a full yield curve approach which applies specific spot rates along the yield curve used in the determination of the benefit obligation to the relevant projected cash flows. In 2015 and 2014, the discount rates used to determine these cost components were based on a single weighted-average discount rate based on the yield curve used to measure the benefit obligation at the beginning of the period.
126
Our U.S. expected long-term rate of return on plan assets is based on our estimate of long-term passive returns for equities and fixed income securities weighted by the allocation of our pension assets. Based on historical performance, we increase the passive returns due to our active management of the plan assets. To arrive at our expected long-term return, the amount added for active management was
0.90 percent
for
2016
and
0.95 percent
for
2015
and
1 percent
for
2014
. A similar process is used to determine this rate for our non-U.S. plans.
The assumed health care trend rate represents the rate at which health care costs are assumed to increase. We assumed a weighted-average increase of
6.5 percent
in our calculation of 2016 benefit expense. We expect a weighted-average increase of
6.6 percent
during 2017. The 2017 rates are assumed to decrease gradually to the ultimate health care trend rate of
5 percent
in
2022
. This rate represents
3 percent
general inflation plus
2 percent
additional health care inflation.
Assumed health care cost trend rates have a significant effect on the amounts reported for the health care plans. A one-percentage-point change in assumed health care cost trend rates would have the following effects:
|
(Millions of dollars)
|
One-percentage-
point increase
|
One-percentage-
point decrease
|
||||||
|
Effect on 2016 service and interest cost components of other postretirement benefit cost
|
$
|
19
|
|
$
|
(15
|
)
|
||
|
Effect on accumulated postretirement benefit obligation
|
$
|
178
|
|
$
|
(150
|
)
|
||
|
F.
|
Other postemployment benefit plans
|
We offer long-term disability benefits, continued health care for disabled employees, survivor income benefit insurance and supplemental unemployment benefits to substantially all U.S. employees.
|
G.
|
Defined contribution plans
|
We have both U.S. and non-U.S. employee defined contribution plans to help employees save for retirement. Our primary U.S. 401(k) plan allows eligible employees to contribute a portion of their cash compensation to the plan on a tax-deferred basis. Employees with frozen defined benefit pension accruals are eligible for matching contributions equal to
100 percent
of employee contributions to the plan up to
6 percent
of cash compensation and an annual employer contribution that ranges from
3
to
5 percent
of cash compensation (depending on years of service and age). Employees that are still accruing benefits under a defined benefit pension plan are eligible for matching contributions equal to
50 percent
of employee contributions up to
6 percent
of cash compensation. These 401(k) plans include various investment funds, including a non-leveraged employee stock ownership plan (ESOP). As of
December 31, 2016
and
2015
, the ESOP held
21.3 million
and
26.4 million
shares, respectively. All of the shares held by the ESOP were allocated to participant accounts. Dividends paid to participants are automatically reinvested into company shares unless the participant elects to have all or a portion of the dividend paid to the participant. Various other U.S. and non-U.S. defined contribution plans allow eligible employees to contribute a portion of their salary to the plans, and in most cases, we provide a matching contribution to the funds.
Total company costs related to U.S. and non-U.S. defined contribution plans were as follows:
|
(Millions of dollars)
|
2016
|
2015
|
2014
|
|||||||||
|
U.S. plans
|
$
|
301
|
|
$
|
267
|
|
$
|
301
|
|
|||
|
Non-U.S. plans
|
68
|
|
76
|
|
85
|
|
||||||
|
|
$
|
369
|
|
$
|
343
|
|
$
|
386
|
|
|||
127
|
H.
|
Summary of long-term liability:
|
|
|
December 31,
|
|||||||
|
(Millions of dollars)
|
2016
|
2015
|
||||||
|
Pensions:
|
|
|
|
|
||||
|
U.S. pensions
|
$
|
4,833
|
|
$
|
4,326
|
|
||
|
Non-U.S. pensions
|
717
|
|
609
|
|
||||
|
Total pensions
|
5,550
|
|
4,935
|
|
||||
|
Postretirement benefits other than pensions
|
3,376
|
|
3,502
|
|
||||
|
Other postemployment benefits
|
106
|
|
104
|
|
||||
|
Defined contribution
|
325
|
|
302
|
|
||||
|
|
$
|
9,357
|
|
$
|
8,843
|
|
||
|
13.
|
Short-term borrowings
|
|
|
December 31,
|
||||||||
|
(Millions of dollars)
|
2016
|
2015
|
|||||||
|
Machinery, Energy & Transportation:
|
|
|
|
|
|||||
|
Notes payable to banks
|
$
|
59
|
|
$
|
9
|
|
|||
|
Commercial paper
|
150
|
|
—
|
|
|||||
|
|
209
|
|
9
|
|
|||||
|
Financial Products:
|
|
|
|
|
|||||
|
Notes payable to banks
|
553
|
|
440
|
|
|||||
|
Commercial paper
|
5,985
|
|
5,811
|
|
|||||
|
Demand notes
|
556
|
|
707
|
|
|||||
|
|
7,094
|
|
6,958
|
|
|||||
|
Total short-term borrowings
|
$
|
7,303
|
|
$
|
6,967
|
|
|||
The weighted-average interest rates on short-term borrowings outstanding were:
|
|
December 31,
|
||||||
|
|
2016
|
2015
|
|||||
|
Notes payable to banks
|
7.0
|
%
|
9.2
|
%
|
|||
|
Commercial paper
|
0.9
|
%
|
0.5
|
%
|
|||
|
Demand notes
|
0.9
|
%
|
0.8
|
%
|
|||
Please refer to Note 18 and Table III for fair value information on short-term borrowings.
128
|
14.
|
|
|
|
December 31,
|
|||||||||
|
(Millions of dollars)
|
Effective Yield to Maturity
1
|
2016
|
2015
|
|||||||
|
Machinery, Energy & Transportation:
|
|
|
|
|
||||||
|
Notes—$1,250 million of 3.900% due 2021
2
|
4.01%
|
$
|
1,245
|
|
$
|
1,244
|
|
|||
|
Notes—$759 million of 5.200% due 2041
2
|
5.27%
|
752
|
|
751
|
|
|||||
|
Debentures—$500 million of 1.500% due 2017
2
|
1.63%
|
—
|
|
499
|
|
|||||
|
Debentures—$900 million of 7.900% due 2018
2
|
7.98%
|
899
|
|
899
|
|
|||||
|
Debentures—$120 million of 9.375% due 2021
|
9.41%
|
120
|
|
120
|
|
|||||
|
Debentures—$500 million of 2.600% due 2022
2
|
2.70%
|
498
|
|
497
|
|
|||||
|
Debentures—$82 million of 8.000% due 2023
|
8.06%
|
82
|
|
82
|
|
|||||
|
Debentures—$1,000 million of 3.400% due 2024
|
3.46%
|
996
|
|
996
|
|
|||||
|
Debentures—$193 million of 6.625% due 2028
2
|
6.68%
|
192
|
|
192
|
|
|||||
|
Debentures—$242 million of 7.300% due 2031
2
|
7.38%
|
241
|
|
240
|
|
|||||
|
Debentures—$307 million of 5.300% due 2035
2
|
8.64%
|
214
|
|
212
|
|
|||||
|
Debentures—$460 million of 6.050% due 2036
2
|
6.12%
|
456
|
|
456
|
|
|||||
|
Debentures—$65 million of 8.250% due 2038
2
|
8.38%
|
64
|
|
64
|
|
|||||
|
Debentures—$160 million of 6.950% due 2042
2
|
7.02%
|
159
|
|
159
|
|
|||||
|
Debentures—$1,722 million of 3.803% due 2042
2
|
6.39%
|
1,218
|
|
1,198
|
|
|||||
|
Debentures—$500 million of 4.300% due 2044
|
4.39%
|
493
|
|
493
|
|
|||||
|
Debentures—$500 million of 4.750% due 2064
|
4.81%
|
494
|
|
494
|
|
|||||
|
Debentures—$246 million of 7.375% due 2097
2
|
7.51%
|
242
|
|
242
|
|
|||||
|
Capital lease obligations
|
68
|
|
77
|
|
||||||
|
Other
|
3
|
|
45
|
|
||||||
|
Total Machinery, Energy & Transportation
|
8,436
|
|
8,960
|
|
||||||
|
Financial Products:
|
|
|
|
|
||||||
|
Medium-term notes
|
13,869
|
|
15,679
|
|
||||||
|
Other
|
513
|
|
530
|
|
||||||
|
Total Financial Products
|
14,382
|
|
16,209
|
|
||||||
|
Total long-term debt due after one year
|
$
|
22,818
|
|
$
|
25,169
|
|
||||
|
1
|
Effective yield to maturity includes the impact of discounts, premiums and debt issuance costs.
|
|
2
|
Redeemable at our option in whole or in part at any time at a redemption price equal to the greater of (i) 100% of the principal amount or (ii) the discounted present value of the notes or debentures, calculated in accordance with the terms of such notes or debentures.
|
All outstanding notes and debentures are unsecured and rank equally with one another.
Cat Financial's medium-term notes are offered by prospectus and are issued through agents at fixed and floating rates. Medium-term notes due after one year have a weighted average interest rate of
2.7%
with remaining maturities up to
11 years
at
December 31, 2016
. During September 2016,
$381 million
of medium-term notes with varying interest rates and maturity dates were exchanged for
$366 million
of
1.93%
medium-term notes due in 2021 and
$15 million
in cash. In addition, a debt exchange premium of
$33 million
was paid.
The above table includes
$78 million
of medium-term notes that can be called at par.
129
The aggregate amounts of maturities of long-term debt during each of the years 2017 through 2021, including amounts due within one year and classified as current, are:
|
|
December 31,
|
|||||||||||||||||||
|
(Millions of dollars)
|
2017
|
2018
|
2019
|
2020
|
2021
|
|||||||||||||||
|
Machinery, Energy & Transportation
|
$
|
507
|
|
$
|
905
|
|
$
|
6
|
|
$
|
6
|
|
$
|
1,385
|
|
|||||
|
Financial Products
|
6,155
|
|
5,359
|
|
3,680
|
|
1,144
|
|
1,682
|
|
||||||||||
|
|
$
|
6,662
|
|
$
|
6,264
|
|
$
|
3,686
|
|
$
|
1,150
|
|
$
|
3,067
|
|
|||||
Interest paid on short-term and long-term borrowings for
2016
,
2015
and 2014 was
$1,075 million
,
$1,047 million
and
$1,109 million
, respectively.
Please refer to Note 18 and Table III for fair value information on long-term debt.
|
15.
|
Credit commitments
|
|
|
December 31, 2016
|
|||||||||||
|
(Millions of dollars)
|
Consolidated
|
Machinery,
Energy &
Transportation
|
Financial
Products
|
|||||||||
|
Credit lines available:
|
|
|
|
|
|
|
||||||
|
Global credit facilities
|
$
|
10,500
|
|
$
|
2,750
|
|
$
|
7,750
|
|
|||
|
Other external
|
3,824
|
|
60
|
|
3,764
|
|
||||||
|
Total credit lines available
|
14,324
|
|
2,810
|
|
11,514
|
|
||||||
|
Less: Commercial paper outstanding
|
(6,135
|
)
|
(150
|
)
|
(5,985
|
)
|
||||||
|
Less: Utilized credit
|
(1,482
|
)
|
(59
|
)
|
(1,423
|
)
|
||||||
|
Available credit
|
$
|
6,707
|
|
$
|
2,601
|
|
$
|
4,106
|
|
|||
We have
three
global credit facilities with a syndicate of banks totaling
$10.50 billion
(Credit Facility) available in the aggregate to both Caterpillar and Cat Financial for general liquidity purposes. Based on management's allocation decision, which can be revised from time to time, the portion of the Credit Facility available to ME&T as of
December 31, 2016
was
$2.75 billion
. Our three Global Credit Facilities are:
|
•
|
The
364
-day facility of
$3.15 billion
(of which
$0.82 billion
is available to ME&T) expires in September 2017.
|
|
•
|
The
three
-year facility, as amended and restated in September 2016, of
$2.73 billion
(of which
$0.72 billion
is available to ME&T) expires in September 2019.
|
|
•
|
The
five
-year facility, as amended and restated in September 2016, of
$4.62 billion
(of which
$1.21 billion
is available to ME&T) expires in September 2021.
|
Other consolidated credit lines with banks as of
December 31, 2016
totaled
$3.82 billion
. These committed and uncommitted credit lines, which may be eligible for renewal at various future dates or have no specified expiration date, are used primarily by our subsidiaries for local funding requirements. Caterpillar or Cat Financial may guarantee subsidiary borrowings under these lines.
At
December 31, 2016
, Caterpillar's consolidated net worth was
$13.20 billion
, which was above the
$9.00 billion
required under the Credit Facility. The consolidated net worth is defined as the consolidated stockholder's equity including preferred stock but excluding the pension and other postretirement benefits balance within Accumulated other comprehensive income (loss).
At
December 31, 2016
, Cat Financial's covenant interest coverage ratio was
1.92
to
1
. This is above the
1.15
to
1
minimum ratio, calculated as (1) profit excluding income taxes, interest expense and net gain/(loss) from interest rate derivatives to
130
(2) interest expense calculated at the end of each calendar quarter for the rolling four quarter period then most recently ended, required by the Credit Facility.
In addition, at
December 31, 2016
, Cat Financial's six-month covenant leverage ratio was
7.35
to
1
and year-end covenant leverage ratio was
7.60
to
1
. This is below the maximum ratio of debt to net worth of
10
to
1
, calculated (1) on a monthly basis as the average of the leverage ratios determined on the last day of each of the six preceding calendar months and (2) at each December 31, required by the Credit Facility.
In the event Caterpillar or Cat Financial does not meet one or more of their respective financial covenants under the Credit Facility in the future (and are unable to obtain a consent or waiver), the syndicate of banks may terminate the commitments allocated to the party that does not meet its covenants. Additionally, in such event, certain of Cat Financial's other lenders under other loan agreements where similar financial covenants or cross default provisions are applicable, may, at their election, choose to pursue remedies under those loan agreements, including accelerating the repayment of outstanding borrowings. At
December 31, 2016
, there were
no
borrowings under the Credit Facility.
|
16.
|
Profit per share
|
|
Computations of profit per share:
|
||||||||||||
|
(Dollars in millions except per share data)
|
2016
|
2015
|
2014
|
|||||||||
|
Profit for the period (A)
1
|
$
|
(67
|
)
|
$
|
2,512
|
|
$
|
2,452
|
|
|||
|
Determination of shares (in millions):
|
|
|
|
|
|
|
||||||
|
Weighted average number of common shares outstanding (B)
|
584.3
|
|
594.3
|
|
617.2
|
|
||||||
|
Shares issuable on exercise of stock awards, net of shares assumed to be purchased out of proceeds at average market price
|
—
|
|
7.0
|
|
11.7
|
|
||||||
|
Average common shares outstanding for fully diluted computation (C)
2,3
|
584.3
|
|
601.3
|
|
628.9
|
|
||||||
|
Profit per share of common stock:
|
|
|
|
|
|
|
||||||
|
Assuming no dilution (A/B)
|
$
|
(0.11
|
)
|
$
|
4.23
|
|
$
|
3.97
|
|
|||
|
Assuming full dilution (A/C)
2,3
|
$
|
(0.11
|
)
|
$
|
4.18
|
|
$
|
3.90
|
|
|||
|
Shares outstanding as of December 31 (in millions)
|
586.5
|
|
582.3
|
|
606.2
|
|
||||||
|
1
|
Profit attributable to common stockholders.
|
|
2
|
Diluted by assumed exercise of stock-based compensation awards using the treasury stock method.
|
|
3
|
In 2016, the assumed exercise of stock-based compensation awards was not considered because the impact would be antidilutive.
|
SARs and stock options to purchase
32,064,790
,
22,169,133
and
10,266,682
common shares were outstanding in
2016
,
2015
and
2014
, respectively, which were not included in the computation of diluted earnings per share because the effect would have been antidilutive.
In February 2007, the Board of Directors authorized the repurchase of
$7.5 billion
of Caterpillar common stock (the 2007 Authorization), and in December 2011, the 2007 Authorization was extended through December 2015. In January 2014, we completed the 2007 Authorization and entered into a definitive agreement with Citibank, N.A. to purchase shares of our common stock under an accelerated stock repurchase transaction (January 2014 ASR Agreement), which was completed in March 2014. In accordance with the terms of the January 2014 ASR Agreement, a total of approximately
18.1 million
shares of our common stock were repurchased at an aggregate cost to Caterpillar of approximately
$1.7 billion
.
In January 2014, the Board approved a new authorization to repurchase up to
$10.0 billion
of Caterpillar common stock, which will expire on December 31, 2018. In July 2014, we entered into definitive agreements with Société Générale to purchase shares of our common stock under accelerated stock repurchase transactions (July 2014 ASR Agreements) which were completed in September 2014. In accordance with the terms of the July 2014 ASR Agreements, a total of approximately
23.7 million
shares of our common stock were repurchased at an aggregate cost to Caterpillar of
$2.5 billion
.
In July 2015, we entered into a definitive agreement with Citibank, N.A. to purchase shares of our common stock under an accelerated stock repurchase transaction (July 2015 ASR Agreement), which was completed in September 2015. Pursuant to the terms of the July 2015 ASR Agreement, a total of approximately
19.6 million
shares of our common stock were repurchased
131
at an aggregate cost to Caterpillar of
$1.5 billion
. For the year ended December 31, 2015, a total of
25.8 million
shares of our common stock were repurchased at an aggregate cost to Caterpillar of
$2.0 billion
.
We did not purchase any Caterpillar common stock during 2016. Through the end of 2016, approximately
$4.5 billion
of the
$10.0 billion
authorization was spent.
|
17.
|
Accumulated other comprehensive income (loss)
|
Comprehensive income and its components are presented in Statement 2. Changes in Accumulated other comprehensive income (loss), net of tax, included in Statement 4, consisted of the following:
|
(Millions of dollars)
|
Foreign currency translation
|
Pension and other postretirement benefits
|
Derivative financial instruments
|
Available-for-sale securities
|
Total
|
|||||||||||||||
|
Balance at December 31, 2013
|
$
|
163
|
|
$
|
(10
|
)
|
$
|
(5
|
)
|
$
|
83
|
|
$
|
231
|
|
|||||
|
Other comprehensive income (loss) before reclassifications
|
(1,155
|
)
|
4
|
|
(118
|
)
|
24
|
|
(1,245
|
)
|
||||||||||
|
Amounts reclassified from accumulated other comprehensive (income) loss
|
—
|
|
(25
|
)
|
4
|
|
(24
|
)
|
(45
|
)
|
||||||||||
|
Other comprehensive income (loss)
|
(1,155
|
)
|
(21
|
)
|
(114
|
)
|
—
|
|
(1,290
|
)
|
||||||||||
|
Balance at December 31, 2014
|
$
|
(992
|
)
|
$
|
(31
|
)
|
$
|
(119
|
)
|
$
|
83
|
|
$
|
(1,059
|
)
|
|||||
|
Other comprehensive income (loss) before reclassifications
|
(961
|
)
|
(3
|
)
|
(19
|
)
|
(10
|
)
|
(993
|
)
|
||||||||||
|
Amounts reclassified from accumulated other comprehensive (income) loss
|
—
|
|
(35
|
)
|
88
|
|
(36
|
)
|
17
|
|
||||||||||
|
Other comprehensive income (loss)
|
(961
|
)
|
(38
|
)
|
69
|
|
(46
|
)
|
(976
|
)
|
||||||||||
|
Balance at December 31, 2015
|
$
|
(1,953
|
)
|
$
|
(69
|
)
|
$
|
(50
|
)
|
$
|
37
|
|
$
|
(2,035
|
)
|
|||||
|
Other comprehensive income (loss) before reclassifications
|
(34
|
)
|
118
|
|
(62
|
)
|
26
|
|
48
|
|
||||||||||
|
Amounts reclassified from accumulated other comprehensive (income) loss
|
17
|
|
(35
|
)
|
(3
|
)
|
(31
|
)
|
(52
|
)
|
||||||||||
|
Other comprehensive income (loss)
|
(17
|
)
|
83
|
|
(65
|
)
|
(5
|
)
|
(4
|
)
|
||||||||||
|
Balance at December 31, 2016
|
$
|
(1,970
|
)
|
$
|
14
|
|
$
|
(115
|
)
|
$
|
32
|
|
$
|
(2,039
|
)
|
|||||
132
The effect of the reclassifications out of Accumulated other comprehensive income (loss) on Statement 1 is as follows:
|
Year ended December 31,
|
|||||||||||||||
|
(Millions of dollars)
|
Classification of income (expense)
|
2016
|
2015
|
2014
|
|||||||||||
|
Foreign currency translation:
|
|||||||||||||||
|
Gain (loss) on foreign currency translation
|
Other income (expense)
|
$
|
(17
|
)
|
$
|
—
|
|
$
|
—
|
|
|||||
|
Tax (provision) benefit
|
—
|
|
—
|
|
—
|
|
|||||||||
|
Reclassifications net of tax
|
$
|
(17
|
)
|
$
|
—
|
|
$
|
—
|
|
||||||
|
Pension and other postretirement benefits:
|
|||||||||||||||
|
Amortization of prior service credit (cost)
|
Note 12
1
|
$
|
56
|
|
$
|
53
|
|
$
|
38
|
|
|||||
|
Tax (provision) benefit
|
(21
|
)
|
(18
|
)
|
(13
|
)
|
|||||||||
|
Reclassifications net of tax
|
$
|
35
|
|
$
|
35
|
|
$
|
25
|
|
||||||
|
Derivative financial instruments:
|
|||||||||||||||
|
Foreign exchange contracts
|
Other income (expense)
|
$
|
14
|
|
$
|
(127
|
)
|
$
|
5
|
|
|||||
|
Interest rate contracts
|
Interest expense excluding Financial Products
|
(6
|
)
|
(6
|
)
|
(5
|
)
|
||||||||
|
Interest rate contracts
|
Interest expense of Financial Products
|
(3
|
)
|
(6
|
)
|
(6
|
)
|
||||||||
|
Reclassifications before tax
|
5
|
|
(139
|
)
|
(6
|
)
|
|||||||||
|
Tax (provision) benefit
|
(2
|
)
|
51
|
|
2
|
|
|||||||||
|
Reclassifications net of tax
|
$
|
3
|
|
$
|
(88
|
)
|
$
|
(4
|
)
|
||||||
|
Available-for-sale securities:
|
|||||||||||||||
|
Realized gain (loss) on sale of securities
|
Other income (expense)
|
$
|
46
|
|
$
|
56
|
|
$
|
35
|
|
|||||
|
Tax (provision) benefit
|
(15
|
)
|
(20
|
)
|
(11
|
)
|
|||||||||
|
Reclassifications net of tax
|
$
|
31
|
|
$
|
36
|
|
$
|
24
|
|
||||||
|
Total reclassifications from Accumulated other comprehensive income (loss)
|
$
|
52
|
|
$
|
(17
|
)
|
$
|
45
|
|
||||||
1
Amounts are included in the calculation of net periodic benefit cost. See Note 12 for additional information.
|
18.
|
Fair value disclosures
|
|
A.
|
Fair value measurements
|
The guidance on fair value measurements defines fair value as the exchange price that would be received for an asset or paid to transfer a liability (an exit price) in the principal or most advantageous market for the asset or liability in an orderly transaction between market participants. This guidance also specifies a fair value hierarchy based upon the observability of inputs used in valuation techniques. Observable inputs (highest level) reflect market data obtained from independent sources, while unobservable inputs (lowest level) reflect internally developed market assumptions. In accordance with this guidance, fair value measurements are classified under the following hierarchy:
|
•
|
Level 1
–
Quoted prices for identical instruments in active markets.
|
|
•
|
Level 2
– Quoted prices for similar instruments in active markets; quoted prices for identical or similar instruments in markets that are not active; and model-derived valuations in which all significant inputs or significant value-drivers are observable in active markets.
|
|
•
|
Level 3
– Model-derived valuations in which one or more significant inputs or significant value-drivers are unobservable.
|
133
When available, we use quoted market prices to determine fair value, and we classify such measurements within Level 1. In some cases where market prices are not available, we make use of observable market based inputs to calculate fair value, in which case the measurements are classified within Level 2. If quoted or observable market prices are not available, fair value is based upon valuations in which one or more significant inputs are unobservable, including internally developed models that use, where possible, current market-based parameters such as interest rates, yield curves and currency rates. These measurements are classified within Level 3.
Fair value measurements are classified according to the lowest level input or value-driver that is significant to the valuation. A measurement may therefore be classified within Level 3 even though there may be significant inputs that are readily observable.
Fair value measurement includes the consideration of nonperformance risk. Nonperformance risk refers to the risk that an obligation (either by a counterparty or Caterpillar) will not be fulfilled. For financial assets traded in an active market (Level 1 and certain Level 2), the nonperformance risk is included in the market price. For certain other financial assets and liabilities (certain Level 2 and Level 3), our fair value calculations have been adjusted accordingly.
Investments in debt and equity securities
Investments in certain debt and equity securities, primarily at Insurance Services, have been classified as available-for-sale and recorded at fair value. Fair values for our U.S. treasury bonds and large capitalization value and smaller company growth equity securities are based upon valuations for identical instruments in active markets. Fair values for other government bonds, corporate bonds and mortgage-backed debt securities are based upon models that take into consideration such market-based factors as recent sales, risk-free yield curves and prices of similarly rated bonds.
In addition, Insurance Services has an equity investment in a real estate investment trust (REIT) which is recorded at fair value based on the net asset value (NAV) of the investment.
See Note 11 for additional information on our investments in debt and equity securities.
Derivative financial instruments
The fair value of interest rate contracts is primarily based on models that utilize the appropriate market-based forward swap curves and zero-coupon interest rates to determine discounted cash flows. The fair value of foreign currency and commodity forward, option and cross currency contracts is based on a valuation model that discounts cash flows resulting from the differential between the contract price and the market-based forward rate.
134
Assets and liabilities measured on a recurring basis at fair value, primarily related to Financial Products, included in Statement 3 as of December 31,
2016
and
2015
are summarized below:
|
|
December 31, 2016
|
|||||||||||||||
|
(Millions of dollars)
|
Level 1
|
Level 2
|
Level 3
|
Total
Assets / Liabilities,
at Fair Value
|
||||||||||||
|
Assets
|
|
|
|
|
|
|
|
|
||||||||
|
Available-for-sale securities
|
|
|
|
|
|
|
|
|
||||||||
|
Government debt
|
|
|
|
|
|
|
|
|
||||||||
|
U.S. treasury bonds
|
$
|
9
|
|
$
|
—
|
|
$
|
—
|
|
$
|
9
|
|
||||
|
Other U.S. and non-U.S. government bonds
|
—
|
|
60
|
|
—
|
|
60
|
|
||||||||
|
Corporate bonds
|
|
|
|
|
|
|
||||||||||
|
Corporate bonds
|
—
|
|
492
|
|
—
|
|
492
|
|
||||||||
|
Asset-backed securities
|
—
|
|
90
|
|
—
|
|
90
|
|
||||||||
|
Mortgage-backed debt securities
|
|
|
|
|
|
|
||||||||||
|
U.S. governmental agency
|
—
|
|
223
|
|
—
|
|
223
|
|
||||||||
|
Residential
|
—
|
|
10
|
|
—
|
|
10
|
|
||||||||
|
Commercial
|
—
|
|
36
|
|
—
|
|
36
|
|
||||||||
|
Equity securities
|
|
|
||||||||||||||
|
Large capitalization value
|
312
|
|
—
|
|
—
|
|
312
|
|
||||||||
|
Smaller company growth
|
56
|
|
—
|
|
—
|
|
56
|
|
||||||||
|
Total available-for-sale securities
|
377
|
|
911
|
|
—
|
|
1,288
|
|
||||||||
|
REIT
|
—
|
|
—
|
|
79
|
|
79
|
|
||||||||
|
Derivative financial instruments, net
|
—
|
|
—
|
|
—
|
|
—
|
|
||||||||
|
Total Assets
|
$
|
377
|
|
$
|
911
|
|
$
|
79
|
|
$
|
1,367
|
|
||||
|
Liabilities
|
|
|
|
|
|
|
|
|
||||||||
|
Derivative financial instruments, net
|
$
|
—
|
|
$
|
72
|
|
$
|
—
|
|
$
|
72
|
|
||||
|
Total Liabilities
|
$
|
—
|
|
$
|
72
|
|
$
|
—
|
|
$
|
72
|
|
||||
135
|
|
December 31, 2015
|
|||||||||||||||
|
(Millions of dollars)
|
Level 1
|
Level 2
|
Level 3
|
Total
Assets / Liabilities,
at Fair Value
|
||||||||||||
|
Assets
|
|
|
|
|
|
|
|
|
||||||||
|
Available-for-sale securities
|
|
|
|
|
|
|
|
|
||||||||
|
Government debt
|
|
|
|
|
|
|
|
|
||||||||
|
U.S. treasury bonds
|
$
|
9
|
|
$
|
—
|
|
$
|
—
|
|
$
|
9
|
|
||||
|
Other U.S. and non-U.S. government bonds
|
—
|
|
72
|
|
—
|
|
72
|
|
||||||||
|
Corporate bonds
|
|
|
|
|
|
|
|
|
||||||||
|
Corporate bonds
|
—
|
|
708
|
|
—
|
|
708
|
|
||||||||
|
Asset-backed securities
|
—
|
|
129
|
|
—
|
|
129
|
|
||||||||
|
Mortgage-backed debt securities
|
|
|
|
|
|
|
|
|
||||||||
|
U.S. governmental agency
|
—
|
|
292
|
|
—
|
|
292
|
|
||||||||
|
Residential
|
—
|
|
12
|
|
—
|
|
12
|
|
||||||||
|
Commercial
|
—
|
|
61
|
|
—
|
|
61
|
|
||||||||
|
Equity securities
|
|
|
|
|
|
|
|
|
||||||||
|
Large capitalization value
|
273
|
|
—
|
|
—
|
|
273
|
|
||||||||
|
Smaller company growth
|
54
|
|
—
|
|
—
|
|
54
|
|
||||||||
|
Total available-for-sale securities
|
336
|
|
1,274
|
|
—
|
|
1,610
|
|
||||||||
|
REIT
|
—
|
|
—
|
|
25
|
|
25
|
|
||||||||
|
Derivative financial instruments, net
|
—
|
|
49
|
|
—
|
|
49
|
|
||||||||
|
Total Assets
|
$
|
336
|
|
$
|
1,323
|
|
$
|
25
|
|
$
|
1,684
|
|
||||
The fair value of our REIT investment is measured based on NAV, which is considered a Level 3 input. A roll-forward of our REIT investment for the year ended December 31,
2016
is as follows:
|
(Millions of dollars)
|
||||
|
Balance at December 31, 2015
|
$
|
25
|
|
|
|
Purchases of securities
|
50
|
|
||
|
Sale of securities
|
—
|
|
||
|
Gains (losses) included in Accumulated other comprehensive income (loss)
|
4
|
|
||
|
Balance at December 31, 2016
|
$
|
79
|
|
|
In addition to the amounts above, Cat Financial impaired loans are subject to measurement at fair value on a nonrecurring basis and are classified as Level 3 measurements. A loan is considered impaired when management determines that collection of contractual amounts due is not probable. In these cases, an allowance for credit losses may be established based either on the present value of expected future cash flows discounted at the receivables' effective interest rate, or the fair value of the collateral for collateral-dependent receivables. In determining collateral value, Cat Financial estimates the current fair market value of the collateral less selling costs. Cat Financial had impaired loans with a fair value of
$137 million
and
$91 million
for the years ended
December 31, 2016
and
2015
, respectively.
|
B.
|
Fair values of financial instruments
|
In addition to the methods and assumptions we use to record the fair value of financial instruments as discussed in the Fair value measurements section above, we used the following methods and assumptions to estimate the fair value of our financial instruments:
136
Cash and short-term investments
Carrying amount approximated fair value.
Restricted cash and short-term investments
Carrying amount approximated fair value. Restricted cash and short-term investments are included in Prepaid expenses and other current assets in Statement 3.
Finance receivables
Fair value was estimated by discounting the future cash flows using current rates, representative of receivables with similar remaining maturities.
Wholesale inventory receivables
Fair value was estimated by discounting the future cash flows using current rates, representative of receivables with similar remaining maturities.
Short-term borrowings
Carrying amount approximated fair value.
Long-term debt
Fair value for fixed and floating rate debt was estimated based on quoted market prices.
Guarantees
The fair value of guarantees is based upon our estimate of the premium a market participant would require to issue the same guarantee in a stand-alone arms-length transaction with an unrelated party. If quoted or observable market prices are not available, fair value is based upon internally developed models that utilize current market-based assumptions.
Please refer to the table below for the fair values of our financial instruments.
|
TABLE III—Fair Values of Financial Instruments
|
||||||||||||||||||||
|
|
2016
|
2015
|
|
|||||||||||||||||
|
(Millions of dollars)
|
Carrying
Amount
|
Fair
Value
|
Carrying
Amount
|
Fair
Value
|
Fair Value Levels
|
Reference
|
||||||||||||||
|
Assets at December 31,
|
|
|
|
|
|
|
|
|
|
|||||||||||
|
Cash and short-term investments
|
$
|
7,168
|
|
$
|
7,168
|
|
$
|
6,460
|
|
$
|
6,460
|
|
1
|
Statement 3
|
||||||
|
Restricted cash and short-term investments
|
31
|
|
31
|
|
52
|
|
52
|
|
1
|
Statement 3
|
||||||||||
|
Investments in debt and equity securities
|
1,367
|
|
1,367
|
|
1,635
|
|
1,635
|
|
1, 2 & 3
|
Notes 11 & 19
|
||||||||||
|
Finance receivables–net (excluding finance leases
1
)
|
16,172
|
|
16,056
|
|
16,515
|
|
16,551
|
|
3
|
Notes 6 & 19
|
||||||||||
|
Wholesale inventory receivables–net (excluding finance leases
1
)
|
1,500
|
|
1,464
|
|
1,821
|
|
1,775
|
|
3
|
Notes 6 & 19
|
||||||||||
|
Foreign currency contracts–net
|
—
|
|
—
|
|
13
|
|
13
|
|
2
|
Notes 3 & 19
|
||||||||||
|
Interest rate swaps–net
|
3
|
|
3
|
|
48
|
|
48
|
|
2
|
Notes 3 & 19
|
||||||||||
|
Commodity contracts–net
|
10
|
|
10
|
|
—
|
|
—
|
|
2
|
Notes 3 & 19
|
||||||||||
|
Liabilities at December 31,
|
|
|
|
|
|
|
|
|
|
|||||||||||
|
Short-term borrowings
|
7,303
|
|
7,303
|
|
6,967
|
|
6,967
|
|
1
|
Note 13
|
||||||||||
|
Long-term debt (including amounts due within one year):
|
|
|
|
|
|
|
|
|
|
|||||||||||
|
Machinery, Energy & Transportation
|
8,943
|
|
10,348
|
|
9,477
|
|
10,691
|
|
2
|
Note 14
|
||||||||||
|
Financial Products
|
20,537
|
|
20,724
|
|
21,569
|
|
21,904
|
|
2
|
Note 14
|
||||||||||
|
Foreign currency contracts–net
|
85
|
|
85
|
|
—
|
|
—
|
|
2
|
Notes 3 & 19
|
||||||||||
|
Commodity contracts–net
|
—
|
|
—
|
|
12
|
|
12
|
|
2
|
Notes 3 & 19
|
||||||||||
|
Guarantees
|
8
|
|
8
|
|
12
|
|
12
|
|
3
|
Note 21
|
||||||||||
|
1
|
Total excluded items have a net carrying value at
December 31, 2016
and
2015
of
$6,111 million
and
$6,452 million
, respectively.
|
137
|
19.
|
Concentration of credit risk
|
Financial instruments with potential credit risk consist primarily of trade and finance receivables and short-term and long-term investments. Additionally, to a lesser extent, we have a potential credit risk associated with counterparties to derivative contracts.
Trade receivables are primarily short-term receivables from independently owned and operated dealers and customers which arise in the normal course of business. We perform regular credit evaluations of our dealers and customers. Collateral generally is not required, and the majority of our trade receivables are unsecured. We do, however, when deemed necessary, make use of various devices such as security agreements and letters of credit to protect our interests. No single dealer or customer represents a significant concentration of credit risk.
Finance receivables and wholesale inventory receivables primarily represent receivables under installment sales contracts, receivables arising from leasing transactions and notes receivable. We generally maintain a secured interest in the equipment financed. No single customer or dealer represents a significant concentration of credit risk.
Short-term and long-term investments are held with high quality institutions and, by policy, the amount of credit exposure to any one institution is limited. Long-term investments, primarily included in Other assets in Statement 3, are comprised primarily of available-for-sale securities at Insurance Services.
For derivative contracts, collateral is generally not required of the counterparties or of our company. The company generally enters into International Swaps and Derivatives Association (ISDA) master netting agreements within Machinery, Energy & Transportation and Financial Products that permit the net settlement of amounts owed under their respective derivative contracts. Our exposure to credit loss in the event of nonperformance by the counterparties is limited to only those gains that we have recorded, but for which we have not yet received cash payment. The master netting agreements reduce the amount of loss the company would incur should the counterparties fail to meet their obligations. At December 31,
2016
and
2015
, the maximum exposure to credit loss was
$96 million
and
$105 million
, respectively, before the application of any master netting agreements.
Please refer to Note 18 and Table III above for fair value information.
|
20.
|
Operating leases
|
We lease certain computer and communications equipment, transportation equipment and other property through operating leases. Total rental expense for operating leases was
$375 million
,
$371 million
and
$391 million
for
2016
,
2015
and
2014
, respectively.
Minimum payments for operating leases having initial or remaining non-cancelable terms in excess of one year are:
|
Years ended December 31,
|
||||||||||||||||||||||||||
|
(Millions of dollars)
|
||||||||||||||||||||||||||
|
2017
|
2018
|
2019
|
2020
|
2021
|
Thereafter
|
Total
|
||||||||||||||||||||
|
$
|
211
|
|
$
|
160
|
|
$
|
107
|
|
$
|
81
|
|
$
|
61
|
|
$
|
176
|
|
$
|
796
|
|
||||||
|
21.
|
Guarantees and product warranty
|
Caterpillar dealer performance guarantees
We have provided an indemnity to a third-party insurance company for potential losses related to performance bonds issued on behalf of Caterpillar dealers. The bonds have varying terms and are issued to insure governmental agencies against nonperformance by certain dealers. We also provided guarantees to third-parties related to the performance of contractual obligations by certain Caterpillar dealers. These guarantees have varying terms and cover potential financial losses incurred by the third-parties resulting from the dealers’ nonperformance.
In 2016, we provided a guarantee to an end user related to the performance of contractual obligations by a Caterpillar dealer. Under the guarantee, which expires in 2025, non-performance by the Caterpillar dealer could require Caterpillar to satisfy
138
the contractual obligations by providing goods, services or financial compensation to the end user up to an annual designated cap.
Customer loan guarantees
We provide loan guarantees to third-party lenders for financing associated with machinery purchased by customers. These guarantees have varying terms and are secured by the machinery. In addition, Cat Financial participates in standby letters of credit issued to third parties on behalf of their customers. These standby letters of credit have varying terms and beneficiaries and are secured by customer assets.
Supplier consortium performance guarantee
We have provided a guarantee to one of our customers in Brazil related to the performance of contractual obligations by a supplier consortium to which one of our Caterpillar subsidiaries is a member. The guarantee covers potential damages (some of them capped) incurred by the customer resulting from the supplier consortium’s non-performance. The guarantee will expire when the supplier consortium performs all its contractual obligations, which is expected to be completed in 2025.
Third party logistics business lease guarantees
We have provided guarantees to third-party lessors for certain properties leased by a third party logistics business, formerly Caterpillar Logistics Services LCC, in which we sold our
35 percent
equity interest in the first quarter of 2015 (see Note 9). The guarantees are for the possibility that the third party logistics business would default on real estate lease payments. The guarantees were granted at lease inception and generally will expire at the end of the lease terms.
Two
dealer performance guarantees and a third party performance guarantee do not limit potential payment to end users related to indemnities and other commercial contractual obligations. For these unlimited guarantees, we are unable to estimate a maximum potential amount of future payments that could result from claims made.
No significant loss has been experienced or is anticipated under any of these guarantees. At December 31,
2016
and
2015
, the related liability was
$8 million
and
$12 million
, respectively. The maximum potential amount of future payments (undiscounted and without reduction for any amounts that may possibly be recovered under recourse or collateralized provisions) we could be required to make under the guarantees at December 31 are as follows:
|
(Millions of dollars)
|
2016
|
2015
|
||||||
|
Caterpillar dealer performance guarantees
|
$
|
1,384
|
|
$
|
216
|
|
||
|
Customer loan guarantees
|
51
|
|
47
|
|
||||
|
Supplier consortium performance guarantee
|
278
|
|
286
|
|
||||
|
Third party logistics business lease guarantees
|
87
|
|
107
|
|
||||
|
Other guarantees
|
56
|
|
25
|
|
||||
|
Total guarantees
|
$
|
1,856
|
|
$
|
681
|
|
||
Cat Financial provides guarantees to repurchase certain loans of Caterpillar dealers from a special-purpose corporation (SPC) that qualifies as a variable interest entity. The purpose of the SPC is to provide short-term working capital loans to Caterpillar dealers. This SPC issues commercial paper and uses the proceeds to fund its loan program. Cat Financial has a loan purchase agreement with the SPC that obligates Cat Financial to purchase certain loans that are not paid at maturity. Cat Financial receives a fee for providing this guarantee, which provides a source of liquidity for the SPC. Cat Financial is the primary beneficiary of the SPC as its guarantees result in Cat Financial having both the power to direct the activities that most significantly impact the SPC’s economic performance and the obligation to absorb losses, and therefore Cat Financial has consolidated the financial statements of the SPC. As of
December 31, 2016
and
2015
, the SPC’s assets of
$1,088 million
and
$1,211 million
, respectively, were primarily comprised of loans to dealers, and the SPC’s liabilities of
$1,087 million
and
$1,210 million
, respectively, were primarily comprised of commercial paper. The assets of the SPC are not available to pay Cat Financial's creditors. Cat Financial may be obligated to perform under the guarantee if the SPC experiences losses. No loss has been experienced or is anticipated under this loan purchase agreement.
Cat Financial is party to agreements in the normal course of business with selected customers and Caterpillar dealers in which they commit to provide a set dollar amount of financing on a pre-approved basis. They also provide lines of credit to certain customers and Caterpillar dealers, of which a portion remains unused as of the end of the period. Commitments and lines of
139
credit generally have fixed expiration dates or other termination clauses. It has been Cat Financial's experience that not all commitments and lines of credit will be used. Management applies the same credit policies when making commitments and granting lines of credit as it does for any other financing.
Cat Financial does not require collateral for these commitments/lines, but if credit is extended, collateral may be required upon funding. The amount of the unused commitments and lines of credit for dealers as of
December 31, 2016
and
2015
was
$12,775 million
and
$12,920 million
, respectively. The amount of the unused commitments and lines of credit for customers as of
December 31, 2016
and
2015
was
$3,340 million
and
$3,567 million
, respectively.
Our product warranty liability is determined by applying historical claim rate experience to the current field population and dealer inventory. Generally, historical claim rates are based on actual warranty experience for each product by machine model/engine size by customer or dealer location (inside or outside North America). Specific rates are developed for each product shipment month and are updated monthly based on actual warranty claim experience.
|
(Millions of dollars)
|
2016
|
2015
|
|||||||
|
Warranty liability, January 1
|
$
|
1,354
|
|
$
|
1,426
|
|
|||
|
Reduction in liability (payments)
|
(909
|
)
|
(874
|
)
|
|||||
|
Increase in liability (new warranties)
|
813
|
|
802
|
|
|||||
|
Warranty liability, December 31
|
$
|
1,258
|
|
$
|
1,354
|
|
|||
|
22.
|
Environmental and legal matters
|
The Company is regulated by federal, state and international environmental laws governing our use, transport and disposal of substances and control of emissions. In addition to governing our manufacturing and other operations, these laws often impact the development of our products, including, but not limited to, required compliance with air emissions standards applicable to internal combustion engines. We have made, and will continue to make, significant research and development and capital expenditures to comply with these emissions standards.
We are engaged in remedial activities at a number of locations, often with other companies, pursuant to federal and state laws. When it is probable we will pay remedial costs at a site, and those costs can be reasonably estimated, the investigation, remediation, and operating and maintenance costs are accrued against our earnings. Costs are accrued based on consideration of currently available data and information with respect to each individual site, including available technologies, current applicable laws and regulations, and prior remediation experience. Where no amount within a range of estimates is more likely, we accrue the minimum. Where multiple potentially responsible parties are involved, we consider our proportionate share of the probable costs. In formulating the estimate of probable costs, we do not consider amounts expected to be recovered from insurance companies or others. We reassess these accrued amounts on a quarterly basis. The amount recorded for environmental remediation is not material and is included in Accrued expenses. We believe there is no more than a remote chance that a material amount for remedial activities at any individual site, or at all the sites in the aggregate, will be required.
On January 8, 2015, the Company received a grand jury subpoena from the U.S. District Court for the Central District of Illinois. The subpoena requests documents and information from the Company relating to, among other things, financial information concerning U.S. and non-U.S. Caterpillar subsidiaries (including undistributed profits of non-U.S. subsidiaries and the movement of cash among U.S. and non-U.S. subsidiaries). The Company has received additional subpoenas relating to this investigation requesting additional documents and information relating to, among other things, the purchase and resale of replacement parts by Caterpillar Inc. and non-U.S. Caterpillar subsidiaries, dividend distributions of certain non-U.S. Caterpillar subsidiaries, and Caterpillar SARL and related structures. The Company is cooperating with this investigation. The Company is unable to predict the outcome or reasonably estimate any potential loss; however, we currently believe that this matter will not have a material adverse effect on the Company’s consolidated results of operations, financial position or liquidity.
On September 10, 2014, the SEC issued to Caterpillar a subpoena seeking information concerning the Company’s accounting for the goodwill relating to its acquisition of Bucyrus International Inc. in 2011 and related matters. The Company has received additional subpoenas relating to this investigation, and the Company is cooperating with the SEC regarding its ongoing investigation. The Company is unable to predict the outcome or reasonably estimate any potential loss; however, we currently
140
believe that this matter will not have a material adverse effect on the Company's consolidated results of operations, financial position or liquidity.
On March 20, 2014, Brazil’s Administrative Council for Economic Defense (CADE) published a Technical Opinion which named
18
companies and over
100
individuals as defendants, including
two
subsidiaries of Caterpillar Inc., MGE - Equipamentos e Serviços Ferroviários Ltda. (MGE) and Caterpillar Brasil Ltda. The publication of the Technical Opinion opened CADE's official administrative investigation into allegations that the defendants participated in anticompetitive bid activity for the construction and maintenance of metro and train networks in Brazil. While companies cannot be held criminally liable for anticompetitive conduct in Brazil, criminal charges have been brought against
two
current employees of MGE and
one
former employee of MGE involving the same conduct alleged by CADE. The Company has responded to all requests for information from the authorities. The Company is unable to predict the outcome or reasonably estimate the potential loss; however, we currently believe that this matter will not have a material adverse effect on the Company's consolidated results of operations, financial position or liquidity.
On October 24, 2013, Progress Rail received a grand jury subpoena from the U.S. District Court for the Central District of California. The subpoena requests documents and information from Progress Rail, United Industries Corporation, a wholly-owned subsidiary of Progress Rail, and Caterpillar Inc. relating to allegations that Progress Rail conducted improper or unnecessary railcar inspections and repairs and improperly disposed of parts, equipment, tools and other items. In connection with this subpoena, Progress Rail was informed by the U.S. Attorney for the Central District of California that it is a target of a criminal investigation into potential violations of environmental laws and alleged improper business practices. The Company is cooperating with the authorities and is currently in discussions regarding a potential resolution of the matter. Although the Company believes a loss is probable, we currently believe that this matter will not have a material adverse effect on the Company's consolidated results of operations, financial position or liquidity.
In addition, we are involved in other unresolved legal actions that arise in the normal course of business. The most prevalent of these unresolved actions involve disputes related to product design, manufacture and performance liability (including claimed asbestos and welding fumes exposure), contracts, employment issues, environmental matters or intellectual property rights. The aggregate range of reasonably possible losses in excess of accrued liabilities, if any, associated with these unresolved legal actions is not material. In some cases, we cannot reasonably estimate a range of loss because there is insufficient information regarding the matter. However, we believe there is no more than a remote chance that any liability arising from these matters would be material. Although it is not possible to predict with certainty the outcome of these unresolved legal actions, we believe that these actions will not individually or in the aggregate have a material adverse effect on our consolidated results of operations, financial position or liquidity.
|
23.
|
Segment information
|
|
A.
|
Basis for segment information
|
Our Executive Office is comprised of
five
Group Presidents, an Executive Vice President and a CEO. Group Presidents are accountable for a related set of end-to-end businesses that they manage. The Executive Vice President leads the Law and Public Policy Division. The CEO allocates resources and manages performance at the Group President level. As such, the CEO serves as our Chief Operating Decision Maker and operating segments are primarily based on the Group President reporting structure.
Three
of our operating segments, Construction Industries, Resource Industries and Energy & Transportation are led by Group Presidents.
One
operating segment, Financial Products, is led by a Group President who also has responsibility for Corporate Services. Corporate Services is a cost center primarily responsible for the performance of certain support functions globally and to provide centralized services; it does not meet the definition of an operating segment.
One
Group President leads
two
smaller operating segments that are included in the All Other operating segments. The Law and Public Policy Division is a cost center and does not meet the definition of an operating segment.
Effective January 1, 2016, we made the following changes to segment reporting. These changes were made to reflect changes in organizational accountabilities and refinements to our internal reporting.
|
•
|
Responsibility for remanufacturing of Cat engines and components and remanufacturing services for other companies moved from the All Other operating segments to Energy & Transportation.
|
|
•
|
Responsibility for business strategy, product management, development, manufacturing, marketing and product support for forestry and paving products moved from the All Other operating segments to Construction Industries.
|
141
|
•
|
Responsibility for business strategy, product management, development, manufacturing, marketing and product support for industrial and waste products moved from the All Other operating segments to Resource Industries.
|
|
•
|
Responsibility for sales and product support of on-highway vocational trucks for North America moved from the All Other operating segments to Energy & Transportation.
|
|
•
|
Internal charges for component manufacturing and logistics services provided by All Other operating segments to Construction Industries, Resource Industries and Energy & Transportation in excess of cost have been adjusted to approximate cost, resulting in a reduction in profit in the All Other operating segments and corresponding increases in profit in the other three segments.
|
|
•
|
Costs that previously had been included in Corporate costs, primarily for company-wide strategies such as information technology and manufacturing process transformation, have been included in the ME&T operating segments that benefit from the costs.
|
Segment information for 2015 and 2014 has been retrospectively adjusted to conform to the 2016 presentation.
B.
Description of segments
We have
six
operating segments, of which
four
are reportable segments. Following is a brief description of our reportable segments and the business activities included in the All Other operating segments:
Construction Industries
: A segment primarily responsible for supporting customers using machinery in infrastructure, forestry and building construction applications. Responsibilities include business strategy, product design, product management and development, manufacturing, marketing and sales and product support. The product portfolio includes backhoe loaders, small wheel loaders, small track-type tractors, skid steer loaders, multi-terrain loaders, mini excavators, compact wheel loaders, telehandlers, select work tools, small, medium and large track excavators, wheel excavators, medium wheel loaders, compact track loaders, medium track-type tractors, track-type loaders, motor graders, pipelayers, forestry products, paving products and related parts. Inter-segment sales are a source of revenue for this segment.
Resource Industries
:
A segment primarily responsible for supporting customers using machinery in mining, quarry, waste, and material handling applications. Responsibilities include business strategy, product design, product management and development, manufacturing, marketing and sales and product support. The product portfolio includes large track-type tractors, large mining trucks, hard rock vehicles, longwall miners, electric rope shovels, draglines, hydraulic shovels, track and rotary drills, highwall miners, large wheel loaders, off-highway trucks, articulated trucks, wheel tractor scrapers, wheel dozers, landfill compactors, soil compactors, material handlers, continuous miners, scoops and haulers, hardrock continuous mining systems, select work tools, machinery components, electronics and control systems and related parts. In addition to equipment, Resource Industries also develops and sells technology products and services to provide customers fleet management, equipment management analytics and autonomous machine capabilities. Resource Industries also manages areas that provide services to other parts of the company, including integrated manufacturing and research and development. Inter-segment sales are a source of revenue for this segment.
Energy & Transportation
: A segment primarily responsible for supporting customers using reciprocating engines, turbines, diesel-electric locomotives and related parts across industries serving power generation, industrial, oil and gas and transportation applications, including marine and rail-related businesses. Responsibilities include business strategy, product design, product management and development, manufacturing, marketing and sales and product support of turbines and turbine-related services, reciprocating engine powered generator sets, integrated systems used in the electric power generation industry, reciprocating engines and integrated systems and solutions for the marine and oil and gas industries; reciprocating engines supplied to the industrial industry as well as Cat machinery; the remanufacturing of Cat engines and components and remanufacturing services for other companies; the business strategy, product design, product management and development, manufacturing, remanufacturing, leasing and service of diesel-electric locomotives and components and other rail-related products and services and product support of on-highway vocational trucks for North America. Inter-segment sales are a source of revenue for this segment.
Financial Products Segment
: Provides financing to customers and dealers for the purchase and lease of Cat and other equipment, as well as some financing for Caterpillar sales to dealers. Financing plans include operating and finance leases, installment sale contracts, working capital loans and wholesale financing plans. The segment also provides various forms of insurance to customers and dealers to help support the purchase and lease of our equipment.
All Other operating segments
:
Primarily includes activities such as: the business strategy, product management and development, and manufacturing of filters and fluids, undercarriage, tires and rims, ground engaging tools, fluid transfer
142
products, precision seals and rubber, and sealing and connecting components primarily for Cat products; parts distribution; distribution services responsible for dealer development and administration including a wholly-owned dealer in Japan, dealer portfolio management and ensuring the most efficient and effective distribution of machines, engines and parts; digital investments for new customer and dealer solutions that integrate data analytics with state-of-the art digital technologies while transforming the buying experience. Results for the All Other operating segments are included as a reconciling item between reportable segments and consolidated external reporting.
C.
Segment measurement and reconciliations
There are several methodology differences between our segment reporting and our external reporting. The following is a list of the more significant methodology differences:
|
•
|
Machinery, Energy & Transportation segment net assets generally include inventories, receivables, property, plant and equipment, goodwill, intangibles, accounts payable, and customer advances. Liabilities other than accounts payable and customer advances are generally managed at the corporate level and are not included in segment operations. Financial Products Segment assets generally include all categories of assets.
|
|
•
|
Segment inventories and cost of sales are valued using a current cost methodology.
|
|
•
|
Goodwill allocated to segments is amortized using a fixed amount based on a
20
year useful life. This methodology difference only impacts segment assets; no goodwill amortization expense is included in segment profit. In addition, only a portion of goodwill for certain acquisitions made in 2011 or later has been allocated to segments.
|
|
•
|
The present value of future lease payments for certain Machinery, Energy & Transportation operating leases is included in segment assets. The estimated financing component of the lease payments is excluded.
|
|
•
|
Currency exposures for Machinery, Energy & Transportation are generally managed at the corporate level and the effects of changes in exchange rates on results of operations within the year are not included in segment profit. The net difference created in the translation of revenues and costs between exchange rates used for U.S. GAAP reporting and exchange rates used for segment reporting is recorded as a methodology difference.
|
|
•
|
Stock-based compensation expense is not included in segment profit.
|
|
•
|
Postretirement benefit expenses are split; segments are generally responsible for service and prior service costs, with the remaining elements of net periodic benefit cost included as a methodology difference.
|
|
•
|
Machinery, Energy & Transportation segment profit is determined on a pretax basis and excludes interest expense and other income/expense items. Financial Products Segment profit is determined on a pretax basis and includes other income/expense items.
|
Reconciling items are created based on accounting differences between segment reporting and our consolidated external reporting. Please refer to pages 146 to 151 for financial information regarding significant reconciling items. Most of our reconciling items are self-explanatory given the above explanations. For the reconciliation of profit, we have grouped the reconciling items as follows:
|
•
|
Corporate costs:
These costs are related to corporate requirements primarily for compliance and legal functions for the benefit of the entire organization.
|
|
•
|
Restructuring costs:
Primarily costs for employee separation costs, long-lived asset impairments and contract terminations. These costs are included in Other Operating (Income) Expenses. Restructuring costs also include other exit-related costs primarily for accelerated depreciation, equipment relocation, inventory write-downs, project management, and sales discounts and payments to dealers and customers related to discontinued products. A table, Reconciliation of Restructuring costs on page 148, has been included to illustrate how segment profit would have been impacted by the restructuring costs. See Note 25 for more information.
|
|
•
|
Methodology differences:
See previous discussion of significant accounting differences between segment reporting and consolidated external reporting.
|
143
|
•
|
Timing:
Timing differences in the recognition of costs between segment reporting and consolidated external reporting. For example, certain costs are reported on the cash basis for segment reporting and the accrual basis for consolidated external reporting.
|
144
|
Segment Information
|
||||||||||||||||||||||||||||
|
(Millions of dollars)
|
||||||||||||||||||||||||||||
|
Reportable Segments:
|
||||||||||||||||||||||||||||
|
|
External
sales and
revenues
|
Inter-
segment
sales and
revenues
|
Total sales
and
revenues
|
Depreciation
and
amortization
|
1
|
Segment
profit
|
Segment
assets at
December 31
|
Capital
expenditures
|
||||||||||||||||||||
|
2016
|
|
|
|
|
|
|
|
|
|
|
|
|
|
|
||||||||||||||
|
Construction Industries
|
$
|
15,612
|
|
$
|
78
|
|
$
|
15,690
|
|
$
|
458
|
|
$
|
1,650
|
|
$
|
5,367
|
|
$
|
186
|
|
|||||||
|
Resource Industries
|
5,726
|
|
284
|
|
6,010
|
|
607
|
|
(1,047
|
)
|
7,135
|
|
243
|
|
||||||||||||||
|
Energy & Transportation
|
14,411
|
|
2,540
|
|
16,951
|
|
677
|
|
2,222
|
|
7,791
|
|
519
|
|
||||||||||||||
|
Machinery, Energy & Transportation
|
$
|
35,749
|
|
$
|
2,902
|
|
$
|
38,651
|
|
$
|
1,742
|
|
$
|
2,825
|
|
$
|
20,293
|
|
$
|
948
|
|
|||||||
|
Financial Products Segment
|
2,993
|
|
—
|
|
2,993
|
|
849
|
|
702
|
|
35,224
|
|
1,638
|
|
||||||||||||||
|
Total
|
$
|
38,742
|
|
$
|
2,902
|
|
$
|
41,644
|
|
$
|
2,591
|
|
$
|
3,527
|
|
$
|
55,517
|
|
$
|
2,586
|
|
|||||||
|
2015
|
|
|
|
|
|
|
|
|
|
|
|
|
|
|
||||||||||||||
|
Construction Industries
|
$
|
17,797
|
|
$
|
109
|
|
$
|
17,906
|
|
$
|
505
|
|
$
|
1,865
|
|
$
|
6,176
|
|
$
|
276
|
|
|||||||
|
Resource Industries
|
7,739
|
|
332
|
|
8,071
|
|
643
|
|
1
|
|
8,931
|
|
303
|
|
||||||||||||||
|
Energy & Transportation
|
18,519
|
|
2,877
|
|
21,396
|
|
690
|
|
3,390
|
|
8,769
|
|
869
|
|
||||||||||||||
|
Machinery, Energy & Transportation
|
$
|
44,055
|
|
$
|
3,318
|
|
$
|
47,373
|
|
$
|
1,838
|
|
$
|
5,256
|
|
$
|
23,876
|
|
$
|
1,448
|
|
|||||||
|
Financial Products Segment
|
3,078
|
|
—
|
|
3,078
|
|
848
|
|
809
|
|
35,729
|
|
1,465
|
|
||||||||||||||
|
Total
|
$
|
47,133
|
|
$
|
3,318
|
|
$
|
50,451
|
|
$
|
2,686
|
|
$
|
6,065
|
|
$
|
59,605
|
|
$
|
2,913
|
|
|||||||
|
2014
|
|
|
|
|
|
|
|
|
|
|
|
|
|
|
||||||||||||||
|
Construction Industries
|
$
|
20,590
|
|
$
|
124
|
|
$
|
20,714
|
|
$
|
564
|
|
$
|
2,133
|
|
$
|
7,342
|
|
$
|
447
|
|
|||||||
|
Resource Industries
|
9,134
|
|
428
|
|
9,562
|
|
692
|
|
565
|
|
9,854
|
|
277
|
|
||||||||||||||
|
Energy & Transportation
|
22,306
|
|
3,386
|
|
25,692
|
|
696
|
|
4,287
|
|
8,661
|
|
669
|
|
||||||||||||||
|
Machinery, Energy & Transportation
|
$
|
52,030
|
|
$
|
3,938
|
|
$
|
55,968
|
|
$
|
1,952
|
|
$
|
6,985
|
|
$
|
25,857
|
|
$
|
1,393
|
|
|||||||
|
Financial Products Segment
|
3,313
|
|
—
|
|
3,313
|
|
885
|
|
901
|
|
36,969
|
|
1,634
|
|
||||||||||||||
|
Total
|
$
|
55,343
|
|
$
|
3,938
|
|
$
|
59,281
|
|
$
|
2,837
|
|
$
|
7,886
|
|
$
|
62,826
|
|
$
|
3,027
|
|
|||||||
|
1
|
We revised previously reported depreciation and amortization for Construction Industries and Resource Industries. Depreciation and amortization decreased for Construction Industries and increased for Resource Industries by
$58 million
and
$35 million
in 2015 and 2014, respectively. The revision did not impact segment profit. Management has concluded that the impact was not material to any period presented.
|
145
|
Reconciliation of Sales and Revenues:
|
||||||||||||||||
|
(Millions of dollars)
|
Machinery,
Energy &
Transportation
|
Financial
Products
|
Consolidating
Adjustments
|
Consolidated
Total
|
||||||||||||
|
2016
|
|
|
|
|
|
|
|
|
||||||||
|
Total external sales and revenues from reportable segments
|
$
|
35,749
|
|
$
|
2,993
|
|
$
|
—
|
|
$
|
38,742
|
|
||||
|
All Other operating segments
|
139
|
|
—
|
|
—
|
|
139
|
|
||||||||
|
Other
|
(115
|
)
|
72
|
|
(301
|
)
|
1
|
(344
|
)
|
|||||||
|
Total sales and revenues
|
$
|
35,773
|
|
$
|
3,065
|
|
$
|
(301
|
)
|
$
|
38,537
|
|
||||
|
2015
|
|
|
|
|
|
|
|
|
||||||||
|
Total external sales and revenues from reportable segments
|
$
|
44,055
|
|
$
|
3,078
|
|
$
|
—
|
|
$
|
47,133
|
|
||||
|
All Other operating segments
|
203
|
|
—
|
|
—
|
|
203
|
|
||||||||
|
Other
|
(111
|
)
|
101
|
|
(315
|
)
|
1
|
(325
|
)
|
|||||||
|
Total sales and revenues
|
$
|
44,147
|
|
$
|
3,179
|
|
$
|
(315
|
)
|
$
|
47,011
|
|
||||
|
2014
|
|
|
|
|
|
|
|
|
||||||||
|
Total external sales and revenues from reportable segments
|
$
|
52,030
|
|
$
|
3,313
|
|
$
|
—
|
|
$
|
55,343
|
|
||||
|
All Other operating segments
|
236
|
|
—
|
|
—
|
|
236
|
|
||||||||
|
Other
|
(124
|
)
|
73
|
|
(344
|
)
|
1
|
(395
|
)
|
|||||||
|
Total sales and revenues
|
$
|
52,142
|
|
$
|
3,386
|
|
$
|
(344
|
)
|
$
|
55,184
|
|
||||
|
1
|
Elimination of Financial Products revenues from Machinery, Energy & Transportation.
|
146
|
Reconciliation of consolidated profit before taxes:
|
||||||||||||
|
(Millions of dollars)
|
Machinery,
Energy &
Transportation
|
Financial
Products
|
Consolidated
Total
|
|||||||||
|
2016
|
|
|
|
|
|
|
||||||
|
Total profit from reportable segments
|
$
|
2,825
|
|
$
|
702
|
|
$
|
3,527
|
|
|||
|
All Other operating segments
|
(77
|
)
|
—
|
|
(77
|
)
|
||||||
|
Cost centers
|
8
|
|
—
|
|
8
|
|
||||||
|
Corporate costs
|
(527
|
)
|
—
|
|
(527
|
)
|
||||||
|
Timing
|
40
|
|
—
|
|
40
|
|
||||||
|
Restructuring costs
|
(1,014
|
)
|
(5
|
)
|
(1,019
|
)
|
||||||
|
Methodology differences:
|
|
|
|
|
|
|
||||||
|
Inventory/cost of sales
|
—
|
|
—
|
|
—
|
|
||||||
|
Postretirement benefit expense
|
(788
|
)
|
—
|
|
(788
|
)
|
||||||
|
Stock-based compensation expense
|
(209
|
)
|
(9
|
)
|
(218
|
)
|
||||||
|
Financing costs
|
(517
|
)
|
—
|
|
(517
|
)
|
||||||
|
Currency
|
(22
|
)
|
—
|
|
(22
|
)
|
||||||
|
Other income/expense methodology differences
|
(225
|
)
|
—
|
|
(225
|
)
|
||||||
|
Other methodology differences
|
(47
|
)
|
4
|
|
(43
|
)
|
||||||
|
Total consolidated profit before taxes
|
$
|
(553
|
)
|
$
|
692
|
|
$
|
139
|
|
|||
|
2015
|
|
|
|
|
|
|
||||||
|
Total profit from reportable segments
|
$
|
5,256
|
|
$
|
809
|
|
$
|
6,065
|
|
|||
|
All Other operating segments
|
(75
|
)
|
—
|
|
(75
|
)
|
||||||
|
Cost centers
|
20
|
|
—
|
|
20
|
|
||||||
|
Corporate costs
|
(600
|
)
|
—
|
|
(600
|
)
|
||||||
|
Timing
|
95
|
|
—
|
|
95
|
|
||||||
|
Restructuring costs
|
(881
|
)
|
(17
|
)
|
(898
|
)
|
||||||
|
Methodology differences:
|
|
|
|
|
|
|
||||||
|
Inventory/cost of sales
|
(100
|
)
|
—
|
|
(100
|
)
|
||||||
|
Postretirement benefit expense
|
131
|
|
—
|
|
131
|
|
||||||
|
Stock-based compensation expense
|
(270
|
)
|
(13
|
)
|
(283
|
)
|
||||||
|
Financing costs
|
(524
|
)
|
—
|
|
(524
|
)
|
||||||
|
Currency
|
(261
|
)
|
—
|
|
(261
|
)
|
||||||
|
Other income/expense methodology differences
|
(95
|
)
|
—
|
|
(95
|
)
|
||||||
|
Other methodology differences
|
(79
|
)
|
43
|
|
(36
|
)
|
||||||
|
Total consolidated profit before taxes
|
$
|
2,617
|
|
$
|
822
|
|
$
|
3,439
|
|
|||
|
2014
|
|
|
|
|
|
|
||||||
|
Total profit from reportable segments
|
$
|
6,985
|
|
$
|
901
|
|
$
|
7,886
|
|
|||
|
All Other operating segments
|
19
|
|
—
|
|
19
|
|
||||||
|
Cost centers
|
(12
|
)
|
—
|
|
(12
|
)
|
||||||
|
Corporate costs
|
(674
|
)
|
—
|
|
(674
|
)
|
||||||
|
Timing
|
(245
|
)
|
—
|
|
(245
|
)
|
||||||
|
Restructuring costs
|
(432
|
)
|
—
|
|
(432
|
)
|
||||||
|
Methodology differences:
|
|
|
|
|
|
|
||||||
|
Inventory/cost of sales
|
55
|
|
—
|
|
55
|
|
||||||
|
Postretirement benefit expense
|
(2,434
|
)
|
—
|
|
(2,434
|
)
|
||||||
|
Stock-based compensation expense
|
(242
|
)
|
(12
|
)
|
(254
|
)
|
||||||
|
Financing costs
|
(502
|
)
|
—
|
|
(502
|
)
|
||||||
|
Currency
|
31
|
|
—
|
|
31
|
|
||||||
|
Other income/expense methodology differences
|
(249
|
)
|
—
|
|
(249
|
)
|
||||||
|
Other methodology differences
|
(57
|
)
|
20
|
|
(37
|
)
|
||||||
|
Total consolidated profit before taxes
|
$
|
2,243
|
|
$
|
909
|
|
$
|
3,152
|
|
|||
147
Reconciliation of Restructuring costs:
As noted above, restructuring costs are a reconciling item between Segment profit and Consolidated profit before taxes. Had we included the amounts in the segments' results, the profit would have been as shown below:
|
Reconciliation of Restructuring costs:
|
||||||||||||
|
(Millions of dollars)
|
Segment
profit
|
Restructuring costs
|
Segment profit with
restructuring costs
|
|||||||||
|
2016
|
||||||||||||
|
Construction Industries
|
$
|
1,650
|
|
$
|
(41
|
)
|
$
|
1,609
|
|
|||
|
Resource Industries
|
(1,047
|
)
|
(540
|
)
|
(1,587
|
)
|
||||||
|
Energy & Transportation
|
2,222
|
|
(248
|
)
|
1,974
|
|
||||||
|
Financial Products Segment
|
702
|
|
(5
|
)
|
697
|
|
||||||
|
All Other operating segments
|
(77
|
)
|
(45
|
)
|
(122
|
)
|
||||||
|
Total
|
$
|
3,450
|
|
$
|
(879
|
)
|
$
|
2,571
|
|
|||
|
2015
|
||||||||||||
|
Construction Industries
|
$
|
1,865
|
|
$
|
(123
|
)
|
$
|
1,742
|
|
|||
|
Resource Industries
|
1
|
|
(305
|
)
|
(304
|
)
|
||||||
|
Energy & Transportation
|
3,390
|
|
(109
|
)
|
3,281
|
|
||||||
|
Financial Products Segment
|
809
|
|
(17
|
)
|
792
|
|
||||||
|
All Other operating segments
|
(75
|
)
|
(129
|
)
|
(204
|
)
|
||||||
|
Total
|
$
|
5,990
|
|
$
|
(683
|
)
|
$
|
5,307
|
|
|||
|
2014
|
||||||||||||
|
Construction Industries
|
$
|
2,133
|
|
$
|
(314
|
)
|
$
|
1,819
|
|
|||
|
Resource Industries
|
565
|
|
(72
|
)
|
493
|
|
||||||
|
Energy & Transportation
|
4,287
|
|
(33
|
)
|
4,254
|
|
||||||
|
Financial Products Segment
|
901
|
|
—
|
|
901
|
|
||||||
|
All Other operating segments
|
19
|
|
(6
|
)
|
13
|
|
||||||
|
Total
|
$
|
7,905
|
|
$
|
(425
|
)
|
$
|
7,480
|
|
|||
148
|
Reconciliation of Assets:
|
||||||||||||||||
|
(Millions of dollars)
|
Machinery,
Energy &
Transportation
|
Financial
Products
|
Consolidating
Adjustments
|
Consolidated
Total
|
||||||||||||
|
2016
|
|
|
|
|
|
|
|
|
||||||||
|
Total assets from reportable segments
|
$
|
20,293
|
|
$
|
35,224
|
|
$
|
—
|
|
$
|
55,517
|
|
||||
|
All Other operating segments
|
1,381
|
|
—
|
|
—
|
|
1,381
|
|
||||||||
|
Items not included in segment assets:
|
|
|
|
|
|
|
|
|
||||||||
|
Cash and short-term investments
|
5,257
|
|
—
|
|
—
|
|
5,257
|
|
||||||||
|
Intercompany receivables
|
1,713
|
|
—
|
|
(1,713
|
)
|
—
|
|
||||||||
|
Investment in Financial Products
|
3,638
|
|
—
|
|
(3,638
|
)
|
—
|
|
||||||||
|
Deferred income taxes
|
3,648
|
|
—
|
|
(947
|
)
|
2,701
|
|
||||||||
|
Goodwill and intangible assets
|
3,883
|
|
—
|
|
—
|
|
3,883
|
|
||||||||
|
Property, plant and equipment – net and other assets
|
1,645
|
|
—
|
|
—
|
|
1,645
|
|
||||||||
|
Operating lease methodology difference
|
(186
|
)
|
—
|
|
—
|
|
(186
|
)
|
||||||||
|
Liabilities included in segment assets
|
7,400
|
|
—
|
|
—
|
|
7,400
|
|
||||||||
|
Inventory methodology differences
|
(2,373
|
)
|
—
|
|
—
|
|
(2,373
|
)
|
||||||||
|
Other
|
(436
|
)
|
(29
|
)
|
(56
|
)
|
(521
|
)
|
||||||||
|
Total assets
|
$
|
45,863
|
|
$
|
35,195
|
|
$
|
(6,354
|
)
|
$
|
74,704
|
|
||||
|
2015
|
|
|
|
|
|
|
|
|
||||||||
|
Total assets from reportable segments
|
$
|
23,876
|
|
$
|
35,729
|
|
$
|
—
|
|
$
|
59,605
|
|
||||
|
All Other operating segments
|
1,405
|
|
—
|
|
—
|
|
1,405
|
|
||||||||
|
Items not included in segment assets:
|
|
|
|
|
|
|
|
|
||||||||
|
Cash and short-term investments
|
5,340
|
|
—
|
|
—
|
|
5,340
|
|
||||||||
|
Intercompany receivables
|
1,087
|
|
—
|
|
(1,087
|
)
|
—
|
|
||||||||
|
Investment in Financial Products
|
3,888
|
|
—
|
|
(3,888
|
)
|
—
|
|
||||||||
|
Deferred income taxes
|
3,208
|
|
—
|
|
(793
|
)
|
2,415
|
|
||||||||
|
Goodwill and intangible assets
|
3,571
|
|
—
|
|
—
|
|
3,571
|
|
||||||||
|
Property, plant and equipment – net and other assets
|
1,585
|
|
—
|
|
—
|
|
1,585
|
|
||||||||
|
Operating lease methodology difference
|
(213
|
)
|
—
|
|
—
|
|
(213
|
)
|
||||||||
|
Liabilities included in segment assets
|
8,017
|
|
—
|
|
—
|
|
8,017
|
|
||||||||
|
Inventory methodology differences
|
(2,646
|
)
|
—
|
|
—
|
|
(2,646
|
)
|
||||||||
|
Other
|
(567
|
)
|
(93
|
)
|
(77
|
)
|
(737
|
)
|
||||||||
|
Total assets
|
$
|
48,551
|
|
$
|
35,636
|
|
$
|
(5,845
|
)
|
$
|
78,342
|
|
||||
|
2014
|
|
|
|
|
|
|
|
|
||||||||
|
Total assets from reportable segments
|
$
|
25,857
|
|
$
|
36,969
|
|
$
|
—
|
|
$
|
62,826
|
|
||||
|
All Other operating segments
|
1,548
|
|
—
|
|
—
|
|
1,548
|
|
||||||||
|
Items not included in segment assets:
|
|
|
|
|
|
|
|
|
||||||||
|
Cash and short-term investments
|
6,317
|
|
—
|
|
—
|
|
6,317
|
|
||||||||
|
Intercompany receivables
|
1,185
|
|
—
|
|
(1,185
|
)
|
—
|
|
||||||||
|
Investment in Financial Products
|
4,488
|
|
—
|
|
(4,488
|
)
|
—
|
|
||||||||
|
Deferred income taxes
|
2,843
|
|
—
|
|
(633
|
)
|
2,210
|
|
||||||||
|
Goodwill and intangible assets
|
3,492
|
|
—
|
|
—
|
|
3,492
|
|
||||||||
|
Property, plant and equipment – net and other assets
|
1,766
|
|
—
|
|
—
|
|
1,766
|
|
||||||||
|
Operating lease methodology difference
|
(213
|
)
|
—
|
|
—
|
|
(213
|
)
|
||||||||
|
Liabilities included in segment assets
|
9,851
|
|
—
|
|
—
|
|
9,851
|
|
||||||||
|
Inventory methodology differences
|
(2,697
|
)
|
—
|
|
—
|
|
(2,697
|
)
|
||||||||
|
Other
|
(390
|
)
|
(143
|
)
|
(69
|
)
|
(602
|
)
|
||||||||
|
Total assets
|
$
|
54,047
|
|
$
|
36,826
|
|
$
|
(6,375
|
)
|
$
|
84,498
|
|
||||
149
|
Reconciliation of Depreciation and amortization:
|
||||||||||||
|
(Millions of dollars)
|
Machinery,
Energy &
Transportation
|
Financial
Products
|
Consolidated
Total
|
|||||||||
|
2016
|
|
|
|
|
|
|
||||||
|
Total depreciation and amortization from reportable segments
|
$
|
1,742
|
|
$
|
849
|
|
$
|
2,591
|
|
|||
|
Items not included in segment depreciation and amortization:
|
|
|
|
|
|
|
||||||
|
All Other operating segments
|
219
|
|
—
|
|
219
|
|
||||||
|
Cost centers
|
156
|
|
—
|
|
156
|
|
||||||
|
Other
|
27
|
|
41
|
|
68
|
|
||||||
|
Total depreciation and amortization
|
$
|
2,144
|
|
$
|
890
|
|
$
|
3,034
|
|
|||
|
2015
|
|
|
|
|
|
|
||||||
|
Total depreciation and amortization from reportable segments
|
$
|
1,838
|
|
$
|
848
|
|
$
|
2,686
|
|
|||
|
Items not included in segment depreciation and amortization:
|
|
|
|
|
|
|
||||||
|
All Other operating segments
|
205
|
|
—
|
|
205
|
|
||||||
|
Cost centers
|
154
|
|
—
|
|
154
|
|
||||||
|
Other
|
(33
|
)
|
34
|
|
1
|
|
||||||
|
Total depreciation and amortization
|
$
|
2,164
|
|
$
|
882
|
|
$
|
3,046
|
|
|||
|
2014
|
|
|
|
|
|
|
||||||
|
Total depreciation and amortization from reportable segments
|
$
|
1,952
|
|
$
|
885
|
|
$
|
2,837
|
|
|||
|
Items not included in segment depreciation and amortization:
|
|
|
|
|
|
|
||||||
|
All Other operating segments
|
187
|
|
—
|
|
187
|
|
||||||
|
Cost centers
|
147
|
|
—
|
|
147
|
|
||||||
|
Other
|
(33
|
)
|
25
|
|
(8
|
)
|
||||||
|
Total depreciation and amortization
|
$
|
2,253
|
|
$
|
910
|
|
$
|
3,163
|
|
|||
150
|
Reconciliation of Capital expenditures:
|
||||||||||||||||
|
(Millions of dollars)
|
Machinery,
Energy &
Transportation
|
Financial
Products
|
Consolidating
Adjustments
|
Consolidated
Total
|
||||||||||||
|
2016
|
|
|
|
|
|
|
|
|
||||||||
|
Total
capital expenditures from reportable segments
|
$
|
948
|
|
$
|
1,638
|
|
$
|
—
|
|
$
|
2,586
|
|
||||
|
Items not included in segment capital expenditures:
|
|
|
|
|
|
|
|
|
||||||||
|
All Other operating segments
|
182
|
|
—
|
|
—
|
|
182
|
|
||||||||
|
Cost centers
|
72
|
|
—
|
|
—
|
|
72
|
|
||||||||
|
Timing
|
153
|
|
—
|
|
—
|
|
153
|
|
||||||||
|
Other
|
(149
|
)
|
133
|
|
(49
|
)
|
(65
|
)
|
||||||||
|
Total capital expenditures
|
$
|
1,206
|
|
$
|
1,771
|
|
$
|
(49
|
)
|
$
|
2,928
|
|
||||
|
2015
|
|
|
|
|
|
|
|
|
||||||||
|
Total capital expenditures from reportable segments
|
$
|
1,448
|
|
$
|
1,465
|
|
$
|
—
|
|
$
|
2,913
|
|
||||
|
Items not included in segment capital expenditures:
|
|
|
|
|
|
|
|
|
||||||||
|
All Other operating segments
|
169
|
|
—
|
|
—
|
|
169
|
|
||||||||
|
Cost centers
|
195
|
|
—
|
|
—
|
|
195
|
|
||||||||
|
Timing
|
37
|
|
—
|
|
—
|
|
37
|
|
||||||||
|
Other
|
(219
|
)
|
194
|
|
(28
|
)
|
(53
|
)
|
||||||||
|
Total capital expenditures
|
$
|
1,630
|
|
$
|
1,659
|
|
$
|
(28
|
)
|
$
|
3,261
|
|
||||
|
2014
|
|
|
|
|
|
|
|
|
||||||||
|
Total capital expenditures from reportable segments
|
$
|
1,393
|
|
$
|
1,634
|
|
$
|
—
|
|
$
|
3,027
|
|
||||
|
Items not included in segment capital expenditures:
|
|
|
|
|
|
|
|
|
||||||||
|
All Other operating segments
|
192
|
|
—
|
|
—
|
|
192
|
|
||||||||
|
Cost centers
|
181
|
|
—
|
|
—
|
|
181
|
|
||||||||
|
Timing
|
21
|
|
—
|
|
—
|
|
21
|
|
||||||||
|
Other
|
(146
|
)
|
183
|
|
(79
|
)
|
(42
|
)
|
||||||||
|
Total capital expenditures
|
$
|
1,641
|
|
$
|
1,817
|
|
$
|
(79
|
)
|
$
|
3,379
|
|
||||
Enterprise-wide Disclosures:
Information about Geographic Areas:
|
|
|
|
|
Property, plant and equipment - net
|
||||||||||||||||
|
|
External sales and revenues
1
|
December 31,
|
||||||||||||||||||
|
(Millions of dollars)
|
2016
|
2015
|
2014
|
2016
|
|
2015
|
||||||||||||||
|
Inside United States
|
$
|
15,956
|
|
$
|
19,218
|
|
$
|
21,122
|
|
$
|
8,537
|
|
|
$
|
8,842
|
|
||||
|
Outside United States
|
22,581
|
|
|
27,793
|
|
|
34,062
|
|
|
6,785
|
|
|
7,248
|
|
||||||
|
Total
|
$
|
38,537
|
|
$
|
47,011
|
|
$
|
55,184
|
|
$
|
15,322
|
|
|
$
|
16,090
|
|
||||
|
1
|
Sales of Machinery, Energy & Transportation are based on dealer or customer location. Revenues from services provided are based on where service is rendered.
|
151
|
24.
|
Acquisitions
|
Kemper Valve & Fittings Corp.
On December 15, 2016, we acquired
100 percent
of the equity in privately held Kemper Valve & Fittings Corp. (Kemper). Kemper is headquartered in Island Lake, Illinois and designs, manufactures, sells, and services high pressure flow iron to the well service segment of the Oil & Gas industry. This acquisition will provide Caterpillar with a new product offering which will complement its existing products in the Oil & Gas industry. The purchase price, net of
$10 million
of acquired cash, consisted of
$94 million
paid at closing, which includes a preliminary net working capital adjustment of
$2 million
anticipated to be finalized in the first quarter of 2017 and
$8 million
payable in 2018. In addition, there is contingent consideration with a fair value of
$39 million
which is comprised of
two
components: 1) our expected use of a charitable contribution carry forward for U.S. tax purposes acquired from Kemper which has an estimated maximum payment of
$20 million
and 2) a specified industry performance index price target during the period from January 1, 2017 to December 31, 2021 which is capped at
$20 million
per year. The contingent consideration will be remeasured each reporting period at its estimated fair value with any adjustment included in Other operating (income) expenses in Statement 1.
The transaction was financed with available cash. Tangible assets as of the acquisition date were
$138 million
, recorded at their fair values, and included cash of
$10 million
, receivables of
$7 million
, net deferred tax assets of
$23 million
, inventories of
$56 million
, and property, plant and equipment of
$42 million
. Finite-lived intangible assets acquired of
$4 million
included developed technology and trade names. The finite lived intangible assets are being amortized on a straight-line basis over an amortization period of
10 years
. Liabilities assumed as of the acquisition date were
$3 million
, which represented their fair values. Goodwill of
$12 million
, non-deductible for income tax purposes, represented the excess of the consideration transferred over the net assets recognized and represented the estimated future economic benefits arising from other assets acquired that could not be individually identified and separately recognized. Factors that contributed to a purchase price resulting in the recognition of goodwill include Kemper’s strategic fit into our product portfolio, the opportunity to provide a complete line-up of high value products performing pressure pumping, and the acquired assembled workforce. These values represent a preliminary allocation of purchase price subject to finalization of post-closing procedures. The results of the acquired business for the period from the acquisition date are included in the accompanying consolidated financial statements and reported in the Energy & Transportation segment in Note 23. Assuming this transaction had been made at the beginning of any period presented, the consolidated pro forma results would not be materially different from reported results.
RDS Manufacturing, Inc.
In December 2015, we acquired
100 percent
of the stock of RDS Manufacturing, Inc. (RDS). RDS, located in Broken Arrow, Oklahoma, is a privately owned manufacturer of highly engineered turbomachinery parts, primarily for the turbine engine and aerospace markets. The acquisition of RDS is expected to help grow our turbine business and deepen our manufacturing expertise. The purchase price, net of
$1 million
of acquired cash and
$5 million
of trade receivables due from Caterpillar, was approximately
$85 million
. We paid
$74 million
at closing with an additional
$11 million
to be paid in December 2017.
The transaction was financed with available cash. Tangible assets acquired of
$28 million
, recorded at their fair values, were primarily inventories of
$12 million
and property, plant and equipment of
$16 million
. Liabilities assumed as of the acquisition date were
$2 million
, which represented their fair values. Goodwill of
$59 million
, substantially all of which is deductible for income tax purposes, represented the excess of the consideration transferred over the net assets recognized and represented the estimated future economic benefits arising from other assets acquired that could not be individually identified and separately recognized. Factors that contributed to a purchase price resulting in the recognition of goodwill include RDS’s strategic fit into our manufacturing and product portfolio and the acquired assembled workforce. The results of the acquired business for the period from the acquisition date are included in the accompanying consolidated financial statements and are reported in the Energy & Transportation segment. Assuming this transaction had been made at the beginning of any period presented, the consolidated pro forma results would not be materially different from reported results.
Rail Product Solutions, Inc.
In October 2015, we acquired
100 percent
of the stock in privately owned Rail Product Solutions, Inc. (RPS) from Amsted Rail Company, Inc. RPS is a leading North American provider of mission critical track fastening products and integrated fastening systems. The acquisition of RPS expands our portfolio of track related products and allows us to provide more comprehensive solutions to our customers. The purchase price was
$165 million
.
152
The transaction was financed with available cash. Tangible assets acquired of
$41 million
, recorded at their fair values, were primarily receivables of
$9 million
, inventories of
$6 million
, property, plant and equipment of
$17 million
and an investment in an unconsolidated affiliated company of
$9 million
. Finite-lived intangible assets acquired of
$82 million
were primarily customer relationships and are being amortized on a straight-line basis over a weighted average period of approximately
15 years
. Liabilities assumed as of the acquisition date were
$11 million
, which represented their fair values. Goodwill of
$53 million
, substantially all of which is deductible for income tax purposes, represented the excess of the consideration transferred over the net assets recognized and represented the estimated future economic benefits arising from other assets acquired that could not be individually identified and separately recognized. Factors that contributed to a purchase price resulting in the recognition of goodwill include RPS’s strategic fit into our product and services portfolio and the acquired assembled workforce. The results of the acquired business for the period from the acquisition date are included in the accompanying consolidated financial statements and are reported in the Energy & Transportation segment. Assuming this transaction had been made at the beginning of any period presented, the consolidated pro forma results would not be materially different from reported results.
25. Restructuring costs
Our accounting for employee separations is dependent upon how the particular program is designed. For voluntary programs, eligible separation costs are recognized at the time of employee acceptance unless the acceptance requires explicit approval by the Company. For involuntary programs, eligible costs are recognized when management has approved the program, the affected employees have been properly notified and the costs are estimable.
Restructuring costs for 2016, 2015 and 2014 were as follows:
|
(Millions of dollars)
|
2016
|
2015
|
2014
|
|||||||||
|
Employee separations
1
|
$
|
297
|
|
$
|
641
|
|
$
|
382
|
|
|||
|
Contract terminations
1
|
62
|
|
—
|
|
—
|
|
||||||
|
Long-lived asset impairments
1
|
391
|
|
127
|
|
48
|
|
||||||
|
Defined benefit retirement plan curtailment losses
1
|
7
|
|
82
|
|
2
|
|
||||||
|
Other
2
|
262
|
|
48
|
|
—
|
|
||||||
|
Total restructuring costs
|
$
|
1,019
|
|
$
|
898
|
|
$
|
432
|
|
|||
|
1
Recognized in Other operating (income) expenses.
|
||||||||||||
|
2
Represents costs related to our restructuring programs, primarily for inventory write-downs, accelerated depreciation, sales discounts, project management and equipment relocation and were recognized primarily in Cost of goods sold.
|
||||||||||||
The restructuring costs in 2016 were primarily related to actions in Resource Industries in response to continued weakness in the mining industry. In addition, costs resulted from our decision to discontinue production of on-highway vocational trucks within Energy & Transportation and other restructuring actions across the company, most of which were related to our September 2015 announcement regarding significant restructuring and cost reduction actions to lower our operating costs in response to weak economic and business conditions in most of the industries we serve. The restructuring costs in 2015 were primarily related to several restructuring programs across the company. The restructuring costs in 2014 were primarily related to a reduction in workforce at our Gosselies, Belgium, facility.
Restructuring costs are a reconciling item between Segment profit and Consolidated profit before taxes. See Note 23 for more information.
153
The following table summarizes the
2015
and
2016
employee separation activity:
|
(Millions of dollars)
|
|||
|
Liability balance at December 31, 2014
|
$
|
182
|
|
|
Increase in liability (separation charges)
|
641
|
|
|
|
Reduction in liability (payments)
|
(340
|
)
|
|
|
Liability balance at December 31, 2015
|
$
|
483
|
|
|
Increase in liability (separation charges)
|
297
|
|
|
|
Reduction in liability (payments)
|
(633
|
)
|
|
|
Liability balance at December 31, 2016
|
$
|
147
|
|
As part of our September 2015 announcement, we offered a voluntary retirement enhancement program to qualifying U.S. employees and various voluntary separation programs outside of the U.S. and implemented additional involuntary separation programs throughout the company. In 2016 and 2015, we incurred
$100 million
and
$379 million
of employee separation costs related to these programs, respectively. In addition, in 2015 we incurred
$82 million
of defined benefit retirement plan curtailment losses related to these programs. Substantially all of the employee separation costs related to this program were paid in 2016. We also incurred costs associated with the September 2015 announcement related to manufacturing facility consolidations and closures in 2016 and 2015 totaling
$181 million
and
$108 million
, respectively. The remaining liability balance as of
December 31, 2016
represents costs for other employee separation programs, most of which are expected to be paid in 2017.
In February 2016, we made the decision to discontinue production of on-highway vocational trucks. Based on the business climate in the truck industry and a thorough evaluation of the business, the company decided it would withdraw from this market. We estimate restructuring costs incurred under the restructuring plan to be
$110 million
. In 2016, we recognized
$104 million
of restructuring costs primarily for long-lived asset impairments and sales discounts related to this restructuring plan. The remaining costs are expected to be recognized in 2017.
In the second half of 2016, we took additional restructuring actions in Resource Industries, including ending the production of track drills; pursuing strategic alternatives, including the possible divestiture of room and pillar products; consolidation of two product development divisions; and additional actions in response to ongoing weakness in the mining industry. We estimate restructuring costs incurred under these restructuring plans to be
$385 million
. For the year ended December 31, 2016, we incurred
$369 million
of restructuring costs related to these plans which included
$164 million
of long-lived asset impairments,
$120 million
of employee separation costs,
$81 million
of inventory write-downs and
$4 million
of other costs. The remaining costs are expected to be recognized in 2017.
154
26. Selected quarterly financial results (unaudited)
|
|
2016 Quarter
|
||||||||||||||||
|
(Dollars in millions except per share data)
|
1st
|
2nd
|
3rd
|
4th
|
|||||||||||||
|
Sales and revenues
|
$
|
9,461
|
|
$
|
10,342
|
|
$
|
9,160
|
|
$
|
9,574
|
|
|||||
|
Less: Revenues
|
(681
|
)
|
(697
|
)
|
(697
|
)
|
(689
|
)
|
|||||||||
|
Sales
|
8,780
|
|
9,645
|
|
8,463
|
|
8,885
|
|
|||||||||
|
Cost of goods sold
|
6,822
|
|
7,419
|
|
6,527
|
|
7,541
|
|
|||||||||
|
Gross margin
|
1,958
|
|
2,226
|
|
1,936
|
|
1,344
|
|
|||||||||
|
Profit (loss)
1
|
$
|
271
|
|
$
|
550
|
|
$
|
283
|
|
$
|
(1,171
|
)
|
4,5,6,7
|
||||
|
Profit (loss) per common share
|
$
|
0.46
|
|
$
|
0.94
|
|
$
|
0.48
|
|
$
|
(2.00
|
)
|
|||||
|
Profit (loss) per common share–diluted
2
|
$
|
0.46
|
|
$
|
0.93
|
|
$
|
0.48
|
|
$
|
(2.00
|
)
|
3
|
||||
|
|
2015 Quarter
8
|
||||||||||||||||
|
|
1st
|
2nd
|
3rd
|
4th
|
|||||||||||||
|
Sales and revenues
|
$
|
12,702
|
|
$
|
12,317
|
|
$
|
10,962
|
|
$
|
11,030
|
|
|||||
|
Less: Revenues
|
(741
|
)
|
(734
|
)
|
(677
|
)
|
(712
|
)
|
|||||||||
|
Sales
|
11,961
|
|
11,583
|
|
10,285
|
|
10,318
|
|
|||||||||
|
Cost of goods sold
|
8,760
|
|
8,674
|
|
7,872
|
|
8,240
|
|
|||||||||
|
Gross margin
|
3,201
|
|
2,909
|
|
2,413
|
|
2,078
|
|
|||||||||
|
Profit (loss)
1
|
$
|
1,245
|
|
$
|
802
|
|
$
|
559
|
|
$
|
(94
|
)
|
4,5
|
||||
|
Profit (loss) per common share
|
$
|
2.06
|
|
$
|
1.33
|
|
$
|
0.95
|
|
$
|
(0.16
|
)
|
|||||
|
Profit (loss) per common share–diluted
2
|
$
|
2.03
|
|
$
|
1.31
|
|
$
|
0.94
|
|
$
|
(0.16
|
)
|
3
|
||||
|
1
|
Profit (loss) attributable to common stockholders.
|
|
2
|
Diluted by assumed exercise of stock-based compensation awards using the treasury stock method.
|
|
3
|
The assumed exercise of stock-based compensation awards was not considered because the impact would be antidilutive.
|
|
4
|
The fourth quarter of 2016 and fourth quarter of 2015 include pre-tax restructuring costs of
$395 million
and
$679 million
, respectively. See Note 26 for additional information on these costs.
|
|
5
|
The fourth quarter of 2016 and fourth quarter of 2015 include pre-tax pension and other postretirement benefit plan actuarial losses of
$985 million
and
$214 million
, respectively. See Note 12 for additional information on these costs.
|
|
6
|
The fourth quarter of 2016 includes a pre-tax goodwill impairment charge of
$595 million
. See Note 10 for additional information.
|
|
7
|
The fourth quarter of 2016 includes a deferred tax valuation allowance of
$141 million
. See Note 5 for additional information.
|
|
8
|
Reflects the change in accounting principle in Note 1B.
|
155
|
Item 9.
|
Changes in and Disagreements with Accountants on Accounting and Financial Disclosure.
|
Not Applicable.
|
Item 9A.
|
Controls and Procedures.
|
Disclosure Controls and Procedures
An evaluation was performed under the supervision and with the participation of the company's management, including the Chief Executive Officer (CEO) and Chief Financial Officer (CFO), of the effectiveness of the design and operation of the company's disclosure controls and procedures, as that term is defined in Rule 13a-15(e) under the Exchange Act, as of the end of the period covered by this annual report. Based on that evaluation, the CEO and CFO concluded that the company's disclosure controls and procedures are effective as of the end of the period covered by this annual report.
Management’s Report on Internal Control Over Financial Reporting
The management of Caterpillar Inc. (company) is responsible for establishing and maintaining adequate internal control over financial reporting as such term is defined in Rule 13a-15(f) under the Exchange Act. Our internal control over financial reporting is a process designed to provide reasonable assurance regarding the reliability of our financial reporting and the preparation of financial statements for external purposes in accordance with generally accepted accounting principles. Our internal control over financial reporting includes those policies and procedures that (i) pertain to the maintenance of records that, in reasonable detail, accurately and fairly reflect the transactions and dispositions of the assets of the company; (ii) provide reasonable assurance that transactions are recorded as necessary to permit preparation of financial statements in accordance with generally accepted accounting principles, and that receipts and expenditures of the company are being made only in accordance with authorizations of management and directors of the company; and (iii) provide reasonable assurance regarding prevention or timely detection of unauthorized acquisition, use, or disposition of the company’s assets that could have a material effect on the financial statements.
Because of its inherent limitations, internal control over financial reporting may not prevent or detect misstatements. Also, projections of any evaluation of effectiveness to future periods are subject to the risk that controls may become inadequate because of changes in conditions, or that the degree of compliance with the policies or procedures may deteriorate.
Management assessed the effectiveness of the company’s internal control over financial reporting as of
December 31, 2016
. In making this assessment, we used the criteria set forth by the Committee of Sponsoring Organizations of the Treadway Commission (COSO) in
Internal Control—Integrated Framework
(2013). Based on our assessment we concluded that, as of
December 31, 2016
, the company’s internal control over financial reporting was effective based on those criteria.
The effectiveness of the company’s internal control over financial reporting as of
December 31, 2016
has been audited by PricewaterhouseCoopers LLP, an independent registered public accounting firm. Their report appears on page 69 of Part II, Item 8 "Financial Statements and Supplementary Data."
Changes in Internal Control over Financial Reporting
During the last fiscal quarter, there has been no significant change in the company’s internal control over financial reporting that has materially affected, or is reasonably likely to materially affect, the company’s internal control over financial reporting.
|
Item 9B.
|
Other Information.
|
Not Applicable.
|
Item 10.
|
Directors, Executive Officers and Corporate Governance.
|
Identification of Directors and Business Experience
Information required by this Item is incorporated by reference from the
2017
Proxy Statement.
156
Identification of Executive Officers and Business Experience
Information required by this Item appears in Item 1C of this Form 10-K.
Family Relationships
There are no family relationships between the officers and directors of the company.
Legal Proceedings Involving Officers and Directors
Information required by this Item is incorporated by reference from the
2017
Proxy Statement.
Audit Committee Financial Expert
Information required by this Item is incorporated by reference from the
2017
Proxy Statement.
Identification of Audit Committee
Information required by this Item is incorporated by reference from the
2017
Proxy Statement.
Stockholder Recommendation of Board Nominees
Information required by this Item is incorporated by reference from the
2017
Proxy Statement.
Compliance with Section 16(a) of the Exchange Act
Information required by this Item relating to compliance with Section 16(a) of the Exchange Act is incorporated by reference from the
2017
Proxy Statement.
Code of Ethics
Our Worldwide Code of Conduct (Code), first published in 1974 and most recently updated in 2015, sets a high standard for honesty and ethical behavior by every employee, including the principal executive officer, principal financial officer, controller and principal accounting officer. The Code is posted on our website at www.Caterpillar.com/code. To obtain a copy of the Code at no charge, submit a written request to the Corporate Secretary at 100 NE Adams Street, Peoria, IL 61629-6490. We post on our website at www.Caterpillar.com/code any required amendments to or waivers granted under our Code pursuant to SEC or New York Stock Exchange disclosure rules.
|
Item 11.
|
Executive Compensation.
|
Information required by this Item is incorporated by reference from the
2017
Proxy Statement.
|
Item 12.
|
Security Ownership of Certain Beneficial Owners and Management and Related Stockholder Matters.
|
Information required by this Item relating to security ownership of certain beneficial owners and management is incorporated by reference from the
2017
Proxy Statement.
157
Information required by this Item relating to securities authorized for issuance under equity compensation plans is included in the following table:
Equity Compensation Plan Information
(as of
December 31, 2016
)
|
Plan category
|
(a)
Number of securities to be issued up on exercise of outstanding options, warrants and rights
|
(b)
Weighted-
average
exercise
price of outstanding options, warrants and rights
|
(c)
Number of securities remaining available for future issuance under equity compensation plans (excluding securities reflected in column (a))
|
|||||||
|
Equity compensation plans approved by security holders
|
36,418,843
|
|
$
|
82.13
|
|
17,231,358
|
|
|||
|
Equity compensation plans not approved by security holders
|
N/A
|
|
N/A
|
|
N/A
|
|
||||
|
Total
|
36,418,843
|
|
$
|
82.13
|
|
17,231,358
|
|
|||
|
Item 13.
|
Certain Relationships and Related Transactions, and Director Independence.
|
Information required by this Item is incorporated by reference from the
2017
Proxy Statement.
|
Item 14.
|
Principal Accountant Fees and Services.
|
Information required by this Item is incorporated by reference from the
2017
Proxy Statement.
158
|
Exhibits:
|
||
|
3.1
|
Restated Certificate of Incorporation, effective June 13, 2012 (incorporated by reference from Exhibit 3.1 to the the Company's Form 10-Q filed for the quarter ended June 30, 2012).
|
|
|
3.2
|
Bylaws amended and restated as of June 8, 2016 (incorporated by reference from Exhibit 3.1 to the Company's Current Report on Form 8-K filed June 10, 2016).
|
|
|
4.1
|
Indenture dated as of May 1, 1987, between Caterpillar Inc. and The First National Bank of Chicago, as Trustee (incorporated by reference from Exhibit 4.1 to Form S-3 (Registration No. 333-22041) filed February 19, 1997).
|
|
|
4.2
|
First Supplemental Indenture, dated as of June 1, 1989, between Caterpillar Inc. and The First National Bank of Chicago, as Trustee (incorporated by reference from Exhibit 4.2 to Form S-3 (Registration No. 333-22041) filed February 19, 1997).
|
|
|
4.3
|
Appointment of Citibank, N.A. as Successor Trustee, dated October 1, 1991, under the Indenture, as supplemented, dated as of May 1, 1987 (incorporated by reference from Exhibit 4.3 to Form S-3 (Registration No. 333-22041) filed February 19, 1997).
|
|
|
4.4
|
Second Supplemental Indenture, dated as of May 15, 1992, between Caterpillar Inc. and Citibank, N.A., as Successor Trustee (incorporated by reference from Exhibit 4.4 to Form S-3 (Registration No. 333-22041) filed February 19, 1997).
|
|
|
4.5
|
Third Supplemental Indenture, dated as of December 16, 1996, between Caterpillar Inc. and Citibank, N.A., as Successor Trustee (incorporated by reference from Exhibit 4.5 to Form S-3 (Registration No. 333-22041) filed February 19, 1997).
|
|
|
4.6
|
Tri-Party Agreement, dated as of November 2, 2006, between Caterpillar Inc., Citibank, N.A. and U.S. Bank National Association appointing U.S. Bank as Successor Trustee under the Indenture dated as of May 1, 1987, as amended and supplemented (incorporated by reference from Exhibit 4.6 to the Company's Annual Report on Form 10-K for the year ended December 31, 2006).
|
|
|
4.8
|
Form of 1.500% Senior Note due 2017 (incorporated by reference from Exhibit 4.2 to the Company's Current Report on Form 8-K, filed June 21, 2012).
|
|
|
4.9
|
Form of 2.600% Senior Note due 2022 (incorporated by reference from Exhibit 4.3 to the Company's Current Report on Form 8-K, filed June 21, 2012).
|
|
|
4.10
|
Form of 3.803% Rule 144A Global Debenture due 2042 (incorporated by reference from Exhibit 4.1 to the Company's Current Report on Form 8-K, filed August 28, 2012).
|
|
|
4.11
|
Form of 3.803% Regulation S Global Debenture due 2042 (incorporated by reference from Exhibit 4.2 to Form 8-K, filed August 28, 2012).
|
|
|
4.12
|
Form of 3.803% Global Debenture due 2042 (incorporated by reference from Exhibit 4.9 to Form S-4 filed on September 7, 2012).
|
|
|
4.13
|
Form of 3.40% Senior Note due 2024 (incorporated by reference from Exhibit 4.1 to the Company's Current Report on Form 8-K, filed on May 8, 2014).
|
|
|
4.14
|
Form of 4.30% Senior Note due 2044 (incorporated by reference from Exhibit 4.2 to the Company's Current Report on Form 8-K, filed on May 8, 2014).
|
|
|
4.15
|
Form of 4.75% Senior Note due 2064 (incorporated by reference from Exhibit 4.3 to the Company's Current Report on Form 8-K, filed on May 8, 2014).
|
|
|
10.1
|
Caterpillar Inc. 2006 Long-Term Incentive Plan as amended and restated through second amendment, dated August 22, 2013 (incorporated by reference from Exhibit 10.6 to the Company's Quarterly Report on Form 10-Q for the quarter ended September 30, 2013).*
|
|
|
10.2
|
Caterpillar Inc. 2014 Long-Term Incentive Plan, dated June 11, 2014 (incorporated by reference from Exhibit 10.1 to the Company's Current Report on Form 8-K, filed June 12, 2014). *
|
|
|
10.3
|
Caterpillar Inc. Executive Short Term Incentive Plan, dated June 11, 2014 (incorporated by reference from Exhibit 10.2 to the Company's Current Report on Form 8-K, filed June 12, 2014). *
|
|
|
10.4
|
First amendment to the Caterpillar Inc. Executive Short Term Incentive Plan, dated December 10, 2015. (incorporated by reference from Exhibit 10.5 to the Company's Annual Report on Form 10-K for the year ended December 31, 2015). *
|
|
|
10.5
|
Form of Restricted Stock Unit Award under Chairman’s Award Program pursuant to the 2006 Long-Term Incentive Plan, dated March 5, 2012 (incorporated by reference from Exhibit 10.3 to the Company's Annual Report on Form 10-K for the year ended December 31, 2012).*
|
|
159
|
10.6
|
Form of Stock Appreciation Right Award pursuant to the 2006 Long-Term Incentive Plan, dated March 5, 2012 (incorporated by reference from Exhibit 10.4 to Company's Annual Report on Form 10-K for the year ended December 31, 2012).*
|
|
|
10.7
|
Form of Stock Appreciation Right Award pursuant to the 2014 Long-Term Incentive Plan *
|
|
|
10.8
|
Form of Nonqualified Stock Option Award pursuant to the 2006 Long-Term Incentive Plan, dated March 5, 2012 (incorporated by reference from Exhibit 10.5 to the Company's Annual Report on Form 10-K for the year ended December 31, 2012).*
|
|
|
10.9
|
Form of Restricted Stock Unit Award pursuant to the 2014 Long-Term Incentive Plan (incorporated by reference from Exhibit 10.8 to the Company's Annual Report on Form 10-K for the year ended December 31, 2014).*
|
|
|
10.10
|
Form of Restricted Stock Unit Award pursuant to the 2014 Long-Term Incentive Plan for awards granted after 2016.*
|
|
|
10.11
|
Form of Restricted Stock Unit Award for Directors pursuant to the 2014 Long-Term Incentive Plan (incorporated by reference from Exhibit 10.11 to the Company's Annual Report on Form 10-K for the year ended December 31, 2014).*
|
|
|
10.12
|
Form of Restricted Stock Unit Award for Directors pursuant to the 2014 Long-Term Incentive Plan for awards granted after 2016.*
|
|
|
10.13
|
Form of Nonqualified Stock Option Award pursuant to the 2014 Long-Term Incentive Plan (incorporated by reference from Exhibit 10.9 to the Company's Annual Report on Form 10-K for the year ended December 31, 2014).*
|
|
|
10.14
|
Form of Nonqualified Stock Option Award pursuant to the 2014 Long-Term Incentive Plan for awards granted after 2015 (incorporated by reference from Exhibit 10.12 to the Company's Annual Report on Form 10-K for the year ended December 31, 2015).*
|
|
|
10.15
|
Form of Nonqualified Stock Option Award pursuant to the 2014 Long-Term Incentive Plan for awards granted after 2016.*
|
|
|
10.16
|
Form of Performance-Based Restricted Stock Unit Award pursuant to the 2014 Long-Term Incentive Plan (incorporated by reference from Exhibit 10.10 to the Company's Annual Report on Form 10-K for the year ended December 31, 2014 ).*
|
|
|
10.17
|
Form of Performance-Based Restricted Stock Unit Award pursuant to the 2014 Long-Term Incentive Plan for awards granted after 2015 (incorporated by reference from Exhibit 10.14 to the Company's Annual Report on Form 10-K for the year ended December 31, 2015).*
|
|
|
10.18
|
Form of Performance-Based Restricted Stock Unit Award pursuant to the 2014 Long-Term Incentive Plan for awards granted after 2016.*
|
|
|
10.19
|
Caterpillar Inc. Supplemental Retirement Plan (formerly known as the Caterpillar Inc. Supplemental Pension Benefit Plan), as amended and restated through fifth amendment, dated December 10, 2014 (incorporated by reference from Exhibit 10.12 to the Company's Annual Report on Form 10-K for the year ended December 31, 2014). *
|
|
|
10.20
|
Sixth amendment to the Caterpillar Inc. Supplemental Retirement Plan, dated December 10, 2015 (incorporated by reference from Exhibit 10.16 of the Company's Annual Report on Form 10-K for the year ended December 31, 2015).*
|
|
|
10.21
|
Caterpillar Inc. Supplemental Employees’ Investment Plan, as amended and restated through fifth amendment, dated December 10, 2014 (incorporated by reference from Exhibit 10.13 to the Company's Annual Report on Form 10-K for the year ended December 31, 2014).*
|
|
|
10.22
|
Caterpillar Inc. Directors’ Deferred Compensation Plan, as amended and restated effective January 1, 2005 (incorporated by reference from Exhibit 10.6 to the Company's Annual Report on Form 10-K for the year ended December 31, 2006).*
|
|
|
10.23
|
Caterpillar Inc. Directors’ Charitable Award Program, as amended and restated effective April 1, 2008 (incorporated by reference from Exhibit 10.7 to the Company's Annual Report on Form 10-K for the year ended December 31, 2008).*
|
|
|
10.24
|
Caterpillar Inc. Deferred Employees’ Investment Plan, as amended and restated through fifth amendment, dated December 10, 2014 (incorporated by reference from Exhibit 10.17 to the Company's Annual Report on Form 10-K for the year ended December 31, 2014).*
|
|
|
10.25
|
Caterpillar Inc. Supplemental Deferred Compensation Plan, as amended and restated through fourth amendment, dated December 10, 2014 (incorporated by reference from Exhibit 10.18 to the Company's Annual Report on Form 10-K for the year ended December 31, 2014).*
|
|
|
10.26
|
Solar Turbines Incorporated Managerial Retirement Objective Plan, as amended and restated through first amendment, dated December 10, 2014 (incorporated by reference from Exhibit 10.19 to the Company's Annual Report on Form 10-K for the year ended December 31, 2014).*
|
|
160
|
10.27
|
Solar Turbines Incorporated Pension Plan for European Foreign Service Employees, as amended and restated, effective January 1, 2015 (incorporated by reference from Exhibit 10.1 to the Company's Quarterly Report on Form 10-Q for the quarter ended March 31, 2015).*
|
|
|
10.28
|
Time Share Agreement dated May 6, 2011 (incorporated by reference from Exhibit 10.3 to the Company's Quarterly Report on Form 10-Q for the quarter ended March 31, 2011).*
|
|
|
10.29
|
Time Share Agreement dated January 10, 2017.*
|
|
|
10.30
|
Executive Separation and General Release Agreement, dated August 24, 2016, between Caterpillar Inc. and David P. Bozeman.*
|
|
|
10.31
|
364-Day Credit Agreement dated September 8, 2016 (2016 364-Day Credit Agreement) among the Company, Caterpillar Financial Services Corporation, Caterpillar International Finance Limited, Caterpillar Finance Kabushiki Kaisha, certain financial institutions named therein, Citibank, N.A., as Agent, Citibank Europe plc, as Local Currency Agent, and The Bank of Tokyo-Mitsubishi UFJ, Ltd., as Japan Local Currency Agent (incorporated by reference from Exhibit 99.1 to the Company’s Current Report on Form 8-K, filed September 14, 2016).
|
|
|
10.32
|
Local Currency Addendum, dated as of September 8, 2016, to the 2016 364-Day Credit Agreement among the Company, Caterpillar Financial Services Corporation, Caterpillar International Finance Limited, the Local Currency Banks named therein, Citibank, N.A. and Citibank Europe plc (incorporated by reference from Exhibit 99.2 to the Company’s Current Report on Form 8-K, filed September 14, 2016).
|
|
|
10.33
|
Japan Local Currency Addendum, dated as of September 8, 2016 to the 2016 364-Day Credit Agreement among the Company, Caterpillar Financial Services Corporation, Caterpillar Finance Kabushiki Kaisha, the Japan Local Currency Banks named therein, Citibank, N.A. and The Bank of Tokyo-Mitsubishi UFJ, Ltd. (incorporated by reference from Exhibit 99.3 to the Company’s Current Report on Form 8-K, filed September 14, 2016).
|
|
|
10.34
|
Amended and Restated Credit Agreement (3-Year Facility), dated as of September 10, 2015, by and among the Company, Caterpillar Financial Services Corporation, Caterpillar International Finance Limited and Caterpillar Finance Corporation, the Banks named therein, Local Currency Banks and Japan Local Currency Banks party thereto, Citibank, N.A., as Agent, Citibank International Limited, as Local Currency Agent, and The Bank of Tokyo-Mitsubishi UFJ, Ltd., as Japan Local Currency Agent (incorporated by reference from Exhibit 99.4 to the Company’s Current Report on Form 8-K filed September 16, 2015).
|
|
|
10.35
|
Local Currency Addendum to the 3-Year Facility among the Company, Caterpillar Financial Services Corporation, Caterpillar International Finance Limited, the Local Currency Banks named therein, Citibank, N.A. and Citibank International Limited (incorporated by reference from Exhibit 99.5 to the Company’s Current Report on Form 8-K filed September 16, 2015).
|
|
|
10.36
|
Japan Local Currency Addendum to the 3-Year Facility among the Company, Caterpillar Financial Services Corporation, Caterpillar Finance Corporation, the Japan Local Currency Banks named therein, Citibank, N.A. and The Bank of Tokyo-Mitsubishi UFJ, Ltd. (incorporated by reference from Exhibit 99.6 to the Company’s Current Report on Form 8-K filed September 16, 2015).
|
|
|
10.37
|
Omnibus Amendment No. 1 to the Amended and Restated 3-Year Facility, Amendment No. 1 to the Local Currency Addendum and Amendment No. 1 to the Japan Local Currency Addendum, dated as of September 8, 2016 (incorporated by reference from Exhibit 99.4 to the Company's Current Report on Form 8-K filed September 14, 2016).
|
|
|
10.38
|
Amended and Restated Credit Agreement (5-Year Facility), dated as of September 10, 2015, by and among the Company, Caterpillar Financial Services Corporation, Caterpillar International Finance Limited and Caterpillar Finance Corporation, the Banks named therein, Local Currency Banks and Japan Local Currency Banks party thereto, Citibank, N.A., as Agent, Citibank International Limited, as Local Currency Agent, and The Bank of Tokyo-Mitsubishi UFJ, Ltd., as Japan Local Currency Agent (incorporated by reference from Exhibit 99.7 to the Company’s Current Report on Form 8-K filed September 16, 2015).
|
|
|
10.39
|
Local Currency Addendum to the 5-Year Facility among the Company, Caterpillar Financial Services Corporation, Caterpillar International Finance Limited, the Local Currency Banks named therein, Citibank, N.A. and Citibank International Limited (incorporated by reference from Exhibit 99.8 to the Company’s Current Report on Form 8-K, filed September 16, 2015).
|
|
|
10.40
|
Japan Local Currency Addendum to the 5-Year Facility among the Company, Caterpillar Financial Services Corporation, Caterpillar Finance Corporation, the Japan Local Currency Banks named therein, Citibank, N.A. and The Bank of Tokyo-Mitsubishi UFJ, Ltd. (incorporated by reference from Exhibit 99.9 to the Company’s Current Report on Form 8-K, filed September 16, 2015).
|
|
|
10.41
|
Omnibus Amendment No. 1 to the Amended and Restated 5-Year Facility, Amendment No. 1 to the Local Currency Addendum and Amendment No. 1 to the Japan Local Currency Addendum, dated as of September 8, 2016 (incorporated by reference from Exhibit 99.5 to the Company's Current Report on Form 8-K filed September 14, 2016).
|
|
|
11
|
Information required to be presented in Exhibit 11 is provided in Note 16 — "Profit per share" of Part II, Item 8 "Financial Statements and Supplementary Data."
|
|
|
12
|
Computation of Ratios of Earnings to Fixed Charges.
|
|
|
21
|
Subsidiaries and Affiliates of the Registrant.
|
|
|
23
|
Consent of Independent Registered Public Accounting Firm.
|
|
161
|
31.1
|
Certification of D. James Umpleby III, Chief Executive Officer of Caterpillar Inc., pursuant to Section 302 of the Sarbanes-Oxley Act of 2002.
|
|
|
31.2
|
Certification of Bradley M. Halverson, Group President and Chief Financial Officer of Caterpillar Inc., pursuant to Section 302 of the Sarbanes-Oxley Act of 2002.
|
|
|
32
|
Certification of D. James Umpleby III, Chief Executive Officer of Caterpillar Inc. and Bradley M. Halverson, Group President and Chief Financial Officer of Caterpillar Inc., pursuant to Section 906 of the Sarbanes-Oxley Act of 2002.
|
|
|
101.INS
|
XBRL Instance Document.
|
|
|
101.SCH
|
XBRL Taxonomy Extension Schema Document.
|
|
|
101.CAL
|
XBRL Taxonomy Extension Calculation Linkbase Document.
|
|
|
101.DEF
|
XBRL Taxonomy Extension Definition Linkbase Document.
|
|
|
101.LAB
|
XBRL Taxonomy Extension Label Linkbase Document.
|
|
|
101.PRE
|
XBRL Taxonomy Extension Presentation Linkbase Document.
|
|
*Management contracts and compensatory plans and arrangements required to be filed as exhibits pursuant to Item 15(b) of this report.
Unless otherwise indicated, all filings referenced above on Forms 10-K, 10-Q and 8-K are contained in SEC File No. 001-00768.
None.
162
Form 10-K
SIGNATURES
Pursuant to the requirements of Section 13 or 15(d) of the Securities Exchange Act of 1934, the registrant has duly caused this report to be signed on its behalf by the undersigned, thereunto duly authorized.
|
|
CATERPILLAR INC.
|
|
|
|
(Registrant)
|
|
|
|
|
|
|
February 15, 2017
|
By:
|
/s/ James B. Buda
|
|
|
|
James B. Buda, Executive Vice President, Law and Public Policy
|
Pursuant to the requirements of the Securities Exchange Act of 1934, this report has been signed below by the following persons on behalf of the Registrant and in the capacities and on the dates indicated.
|
|
|
Chairman
|
|
February 15, 2017
|
/s/ Douglas R. Oberhelman
|
|
|
|
(Douglas R. Oberhelman)
|
|
|
|
|
|
|
February 15, 2017
|
/s/ D. James Umpleby III
|
Chief Executive Officer
|
|
(D. James Umpleby III)
|
||
|
|
|
Group President and
|
|
February 15, 2017
|
/s/ Bradley M. Halverson
|
Chief Financial Officer
|
|
|
(Bradley M. Halverson)
|
|
|
|
|
|
|
|
|
Chief Accounting Officer
|
|
February 15, 2017
|
/s/ Jananne A. Copeland
|
|
|
|
(Jananne A. Copeland)
|
|
|
|
|
|
|
|
|
|
|
February 15, 2017
|
/s/ David L. Calhoun
|
Director
|
|
|
(David L. Calhoun)
|
|
|
|
|
|
|
|
|
|
163
|
February 15, 2017
|
/s/ Daniel M. Dickinson
|
Director
|
|
|
(Daniel M. Dickinson)
|
|
|
|
|
|
|
February 15, 2017
|
/s/ Juan Gallardo
|
Director
|
|
|
(Juan Gallardo)
|
|
|
|
|
|
|
|
|
|
|
February 15, 2017
|
/s/ Jesse J. Greene, Jr.
|
Director
|
|
|
(Jesse J. Greene, Jr.)
|
|
|
|
|
|
|
|
|
|
|
February 15, 2017
|
/s/ Jon M. Huntsman, Jr.
|
Director
|
|
(Jon M. Huntsman, Jr. )
|
||
|
February 15, 2017
|
/s/ Dennis A. Muilenburg
|
Director
|
|
|
(Dennis A. Muilenburg)
|
|
|
|
|
|
|
|
|
|
|
February 15, 2017
|
/s/ William A. Osborn
|
Director
|
|
|
(William A. Osborn)
|
|
|
February 15, 2017
|
/s/ Debra L. Reed
|
Director
|
|
(Debra L. Reed)
|
||
|
|
|
|
|
February 15, 2017
|
/s/ Edward B. Rust, Jr.
|
Director
|
|
|
(Edward B. Rust, Jr.)
|
|
|
|
|
|
|
|
|
|
|
February 15, 2017
|
/s/ Susan C. Schwab
|
Director
|
|
|
(Susan C. Schwab)
|
|
|
|
|
|
|
|
|
|
|
February 15, 2017
|
/s/ Miles D. White
|
Director
|
|
|
(Miles D. White)
|
|
164
TABLE OF CONTENTS
Part IItem 1. BusinessItem 1A. Risk FactorsItem 1B. Unresolved Staff CommentsItem 1C. Executive Officers Of The RegistrantItem 2. PropertiesItem 3. Legal ProceedingsItem 4. Mine Safety DisclosuresPart IIItem 5. Market For Registrant S Common Equity, Related Stockholder Matters and Issuer Purchases Of Equity SecuritiesItem 6. Selected Financial DataItem 7. Management S Discussion and Analysis Of Financial Condition and Results Of OperationsItem 7A. Quantitative and Qualitative Disclosures About Market RiskItem 8. Financial Statements and Supplementary DataItem 9. Changes in and Disagreements with Accountants on Accounting and Financial DisclosureItem 9A. Controls and ProceduresItem 9B. Other InformationPart IIIItem 10. Directors, Executive Officers and Corporate GovernanceItem 11. Executive CompensationItem 12. Security Ownership Of Certain Beneficial Owners and Management and Related Stockholder MattersItem 13. Certain Relationships and Related Transactions, and Director IndependenceItem 14. Principal Accountant Fees and ServicesPart IVItem 15. Exhibits and Financial Statement SchedulesItem 16. Form 10-k Summary