|
|
|
|
|
|
|
|
|
|
|
|
|
|
|
|
|
|
|
|
|
|
|
|
|
|
|
|
|
|
|
|
|
|
|
|
|
|
|
|
|
|
|
|
|
|
|
|
|
|
|
|
|
|
|
|
|
|
|
UNITED STATES
SECURITIES AND EXCHANGE COMMISSION
Washington, D.C. 20549
![]()
FORM 10-Q
[X] QUARTERLY REPORT PURSUANT TO SECTION 13 OR 15(d) OF THE SECURITIES EXCHANGE ACT OF 1934
For the quarterly period ended September 30, 2011
OR
[ ] TRANSITION REPORT PURSUANT TO SECTION 13 OR 15(d) OF THE SECURITIES EXCHANGE ACT OF 1934
For the transition period from to
Commission File Number: 1-768
CATERPILLAR INC.
(Exact name of registrant as specified in its charter)
|
Delaware (State or other jurisdiction of incorporation) |
|
37-0602744 (IRS Employer I.D. No.) |
|
|
|
|
|
100 NE Adams Street, Peoria, Illinois (Address of principal executive offices) |
|
61629 (Zip Code) |
Registrant’s telephone number, including area code:
(309) 675-1000
Indicate by check mark whether the registrant (1) has filed all reports required to be filed by Section 13 or 15(d) of the Securities Exchange Act of 1934 during the preceding 12 months (or for such shorter period that the registrant was required to file such reports), and (2) has been subject to such filing requirements for the past 90 days. Yes x No ¨
Indicate by check mark whether the registrant has submitted electronically and posted on its corporate Web site, if any, every Interactive Data File required to be submitted and posted pursuant to Rule 405 of Regulation S-T (§232.405 of this chapter) during the preceding 12 months (or for such shorter period that the registrant was required to submit and post such files). Yes x No ¨
Indicate by check mark whether the registrant is a large accelerated filer, an accelerated filer, a non-accelerated filer, or a smaller reporting company. See definitions of “large accelerated filer”, “accelerated filer” and “smaller reporting company” in Rule 12b-2 of the Exchange Act. (Check one):
|
Large accelerated filer |
x |
|
Accelerated filer |
o |
|
|
|
|
|
|
|
Non-accelerated filer |
o |
|
Smaller reporting company |
o |
Indicate by check mark whether the registrant is a shell company (as defined in Rule 12b-2 of the Exchange Act). Yes o No x
At September 30, 2011, 646,620,369 shares of common stock of the registrant were outstanding.
|
|
|
||
|
|
3 |
||
|
Management’s Discussion and Analysis of Financial Condition and Results of Operations |
|
50 |
|
|
|
86 |
||
|
|
86 |
||
|
|
|
|
|
|
|
|
||
|
|
87 |
||
|
Item 1A. |
Risk Factors |
|
* |
|
|
87 |
||
|
Item 3. |
Defaults Upon Senior Securities |
|
* |
|
Item 4. |
Removed and Reserved |
|
* |
|
Item 5. |
Other Information |
|
* |
|
|
88 |
||
* Item omitted because no answer is called for or item is not applicable.
Caterpillar Inc.
(Unaudited)
(Dollars in millions except per share data)
|
|
|
Three Months Ended
|
|
||
|
|
|
2011 |
|
2010 |
|
|
Sales and revenues: |
|
|
|
|
|
|
Sales of Machinery and Power Systems |
|
$15,023 |
|
$10,452 |
|
|
Revenues of Financial Products |
|
693 |
|
682 |
|
|
Total sales and revenues |
|
15,716 |
|
11,134 |
|
|
|
|
|
|
|
|
|
Operating costs: |
|
|
|
|
|
|
Cost of goods sold |
|
11,455 |
|
7,752 |
|
|
Selling, general and administrative expenses |
|
1,360 |
|
1,148 |
|
|
Research and development expenses |
|
584 |
|
510 |
|
|
Interest expense of Financial Products |
|
211 |
|
227 |
|
|
Other operating (income) expenses |
|
347 |
|
310 |
|
|
Total operating costs |
|
13,957 |
|
9,947 |
|
|
|
|
|
|
|
|
|
Operating profit (loss) |
|
1,759 |
|
1,187 |
|
|
|
|
|
|
|
|
|
Interest expense excluding Financial Products |
|
112 |
|
85 |
|
|
Other income (expense) |
|
(13) |
|
1 |
|
|
|
|
|
|
|
|
|
Consolidated profit (loss) before taxes |
|
1,634 |
|
1,103 |
|
|
|
|
|
|
|
|
|
Provision (benefit) for income taxes |
|
474 |
|
295 |
|
|
Profit (loss) of consolidated companies |
|
1,160 |
|
808 |
|
|
|
|
|
|
|
|
|
Equity in profit (loss) of unconsolidated affiliated companies |
|
(6) |
|
(7) |
|
|
|
|
|
|
|
|
|
Profit (loss) of consolidated and affiliated companies |
|
1,154 |
|
801 |
|
|
|
|
|
|
|
|
|
Less: Profit (loss) attributable to noncontrolling interests |
|
13 |
|
9 |
|
|
|
|
|
|
|
|
|
Profit (loss) 1 |
|
$1,141 |
|
$792 |
|
|
|
|
|
|
|
|
|
|
|
|
|
|
|
|
Profit (loss) per common share |
|
$1.76 |
|
$1.25 |
|
|
|
|
|
|
|
|
|
Profit (loss) per common share — diluted 2 |
|
$1.71 |
|
$1.22 |
|
|
|
|
|
|
|
|
|
Weighted-average common shares outstanding (millions) |
|
|
|
|
|
|
- Basic |
|
646.6 |
|
632.6 |
|
|
- Diluted 2 |
|
666.0 |
|
651.6 |
|
|
|
|
|
|
|
|
|
Cash dividends declared per common share |
|
$— |
|
$— |
|
|
|
|
|
|
|
|
1 Profit (loss) attributable to common stockholders.
2 Diluted by assumed exercise of stock-based compensation awards using the treasury stock method.
See accompanying notes to Consolidated Financial Statements.
Caterpillar Inc.
Consolidated Statement of Results of Operations
(Unaudited)
(Dollars in millions except per share data)
|
|
|
Nine Months Ended
|
|
||
|
|
|
2011 |
|
2010 |
|
|
Sales and revenues: |
|
|
|
|
|
|
Sales of Machinery and Power Systems |
|
$40,835 |
|
$27,726 |
|
|
Revenues of Financial Products |
|
2,060 |
|
2,055 |
|
|
Total sales and revenues |
|
42,895 |
|
29,781 |
|
|
|
|
|
|
|
|
|
Operating costs: |
|
|
|
|
|
|
Cost of goods sold |
|
30,815 |
|
21,018 |
|
|
Selling, general and administrative expenses |
|
3,716 |
|
3,139 |
|
|
Research and development expenses |
|
1,693 |
|
1,362 |
|
|
Interest expense of Financial Products |
|
623 |
|
694 |
|
|
Other operating (income) expenses |
|
855 |
|
896 |
|
|
Total operating costs |
|
37,702 |
|
27,109 |
|
|
|
|
|
|
|
|
|
Operating profit (loss) |
|
5,193 |
|
2,672 |
|
|
|
|
|
|
|
|
|
Interest expense excluding Financial Products |
|
289 |
|
268 |
|
|
Other income (expense) |
|
(157) |
|
114 |
|
|
|
|
|
|
|
|
|
Consolidated profit (loss) before taxes |
|
4,747 |
|
2,518 |
|
|
|
|
|
|
|
|
|
Provision (benefit) for income taxes |
|
1,304 |
|
735 |
|
|
Profit (loss) of consolidated companies |
|
3,443 |
|
1,783 |
|
|
|
|
|
|
|
|
|
Equity in profit (loss) of unconsolidated affiliated companies |
|
(24) |
|
(13) |
|
|
|
|
|
|
|
|
|
Profit (loss) of consolidated and affiliated companies |
|
3,419 |
|
1,770 |
|
|
|
|
|
|
|
|
|
Less: Profit (loss) attributable to noncontrolling interests |
|
38 |
|
38 |
|
|
|
|
|
|
|
|
|
Profit (loss) 1 |
|
$3,381 |
|
$1,732 |
|
|
|
|
|
|
|
|
|
Profit (loss) per common share |
|
$5.25 |
|
$2.75 |
|
|
|
|
|
|
|
|
|
Profit (loss) per common share — diluted 2 |
|
$5.08 |
|
$2.68 |
|
|
|
|
|
|
|
|
|
Weighted-average common shares outstanding (millions) |
|
|
|
|
|
|
- Basic |
|
644.3 |
|
629.6 |
|
|
- Diluted 2 |
|
666.1 |
|
647.0 |
|
|
|
|
|
|
|
|
|
Cash dividends declared per common share |
|
$0.90 |
|
$0.86 |
|
|
|
|
|
|
|
|
1 Profit (loss) attributable to common stockholders.
2 Diluted by assumed exercise of stock-based compensation awards using the treasury stock method.
See accompanying notes to Consolidated Financial Statements.
Caterpillar Inc .
(Unaudited)
(Dollars in millions)
|
|
|
September 30,
|
|
December 31,
|
|
|
Assets |
|
|
|
|
|
|
Current assets: |
|
|
|
|
|
|
Cash and short-term investments |
|
$3,229 |
|
$3,592 |
|
|
Receivables – trade and other |
|
9,386 |
|
8,494 |
|
|
Receivables – finance |
|
7,920 |
|
8,298 |
|
|
Deferred and refundable income taxes |
|
1,122 |
|
931 |
|
|
Prepaid expenses and other current assets |
|
795 |
|
908 |
|
|
Inventories |
|
14,412 |
|
9,587 |
|
|
Total current assets |
|
36,864 |
|
31,810 |
|
|
Property, plant and equipment – net |
|
13,397 |
|
12,539 |
|
|
Long-term receivables – trade and other |
|
1,283 |
|
793 |
|
|
Long-term receivables – finance |
|
11,445 |
|
11,264 |
|
|
Investments in unconsolidated affiliated companies |
|
121 |
|
164 |
|
|
Noncurrent deferred and refundable income taxes |
|
806 |
|
2,493 |
|
|
Intangible assets |
|
4,529 |
|
805 |
|
|
Goodwill |
|
7,778 |
|
2,614 |
|
|
Other assets |
|
1,544 |
|
1,538 |
|
|
Total assets |
|
$77,767 |
|
$64,020 |
|
|
|
|
|
|
|
|
|
Liabilities |
|
|
|
|
|
|
Current liabilities: |
|
|
|
|
|
|
Short-term borrowings: |
|
|
|
|
|
|
Machinery and Power Systems |
|
$366 |
|
$204 |
|
|
Financial Products |
|
3,548 |
|
3,852 |
|
|
Accounts payable |
|
7,524 |
|
5,856 |
|
|
Accrued expenses |
|
3,186 |
|
2,880 |
|
|
Accrued wages, salaries and employee benefits |
|
2,062 |
|
1,670 |
|
|
Customer advances |
|
2,745 |
|
1,831 |
|
|
Dividends payable |
|
— |
|
281 |
|
|
Other current liabilities |
|
2,193 |
|
1,521 |
|
|
Long-term debt due within one year: |
|
|
|
|
|
|
Machinery and Power Systems |
|
72 |
|
495 |
|
|
Financial Products |
|
3,522 |
|
3,430 |
|
|
Total current liabilities |
|
25,218 |
|
22,020 |
|
|
Long-term debt due after one year: |
|
|
|
|
|
|
Machinery and Power Systems |
|
8,903 |
|
4,505 |
|
|
Financial Products |
|
17,878 |
|
15,932 |
|
|
Liability for postemployment benefits |
|
7,494 |
|
7,584 |
|
|
Other liabilities |
|
3,570 |
|
2,654 |
|
|
Total liabilities |
|
63,063 |
|
52,695 |
|
|
Commitments and contingencies (Notes 10 and 12) |
|
|
|
|
|
|
Redeemable noncontrolling interest |
|
491 |
|
461 |
|
|
Stockholders’ equity |
|
|
|
|
|
|
Common stock of $1.00 par value: |
|
|
|
|
|
|
Authorized shares: 2,000,000,000 Issued shares: (9/30/11 and 12/31/10 – 814,894,624) at paid-in amount |
|
4,229 |
|
3,888 |
|
|
Treasury stock (9/30/11 – 168,274,255 shares; 12/31/10 – 176,071,910 shares) at cost |
|
(10,299) |
|
(10,397) |
|
|
Profit employed in the business |
|
24,251 |
|
21,384 |
|
|
Accumulated other comprehensive income (loss) |
|
(4,019) |
|
(4,051) |
|
|
Noncontrolling interests |
|
51 |
|
40 |
|
|
Total stockholders’ equity |
|
14,213 |
|
10,864 |
|
|
Total liabilities, redeemable noncontrolling interest and stockholders’ equity |
|
$77,767 |
|
$64,020 |
|
See accompanying notes to Consolidated Financial Statements.
Caterpillar Inc.
Consolidated Statement of Changes in Stockholders’ Equity
(Unaudited)
(Dollars in millions)
|
|
|
Common
|
|
Treasury
|
|
Profit
|
|
Accumulated
|
|
Noncontrolling
|
|
Total |
|
Comprehensive
|
|
|
Nine Months Ended September 30, 2010 |
|
|
|
|
|
|
|
|
|
|
|
|
|
|
|
|
Balance at December 31, 2009 |
|
$3,439 |
|
$(10,646) |
|
$19,711 |
|
$(3,764) |
|
$83 |
|
$8,823 |
|
|
|
|
Adjustment to adopt consolidation of variable interest entities 1 |
|
— |
|
— |
|
(6) |
|
3 |
|
— |
|
(3) |
|
|
|
|
Balance at January 1, 2010 |
|
$3,439 |
|
$(10,646) |
|
$19,705 |
|
$(3,761) |
|
$83 |
|
$8,820 |
|
|
|
|
Profit (loss) of consolidated and affiliated companies |
|
— |
|
— |
|
1,732 |
|
— |
|
38 |
|
1,770 |
|
$1,770 |
|
|
Foreign currency translation, net of tax of $51 |
|
— |
|
— |
|
— |
|
(40) |
|
14 |
|
(26) |
|
(26) |
|
|
Pension and other postretirement benefits |
|
|
|
|
|
|
|
|
|
|
|
|
|
|
|
|
Current year actuarial gain (loss), net of tax of $500 3 |
|
— |
|
— |
|
— |
|
(857) |
|
— |
|
(857) |
|
(857) |
|
|
Amortization of actuarial (gain) loss, net of tax of $121 |
|
— |
|
— |
|
— |
|
218 |
|
3 |
|
221 |
|
221 |
|
|
Current year prior service (cost) credit, net of tax of $1 3 |
|
— |
|
— |
|
— |
|
(1) |
|
— |
|
(1) |
|
(1) |
|
|
Amortization of prior service (credit) cost, net of tax of $9 |
|
— |
|
— |
|
— |
|
(11) |
|
— |
|
(11) |
|
(11) |
|
|
Amortization of transition (asset) obligation, net of tax of $0 |
|
— |
|
— |
|
— |
|
1 |
|
— |
|
1 |
|
1 |
|
|
Derivative financial instruments |
|
|
|
|
|
|
|
|
|
|
|
|
|
|
|
|
Gains (losses) deferred, net of tax of $15 |
|
— |
|
— |
|
— |
|
(29) |
|
— |
|
(29) |
|
(29) |
|
|
(Gains) losses reclassified to earnings, net of tax of $16 |
|
— |
|
— |
|
— |
|
32 |
|
— |
|
32 |
|
32 |
|
|
Available-for-sale securities |
|
|
|
|
|
|
|
|
|
|
|
|
|
|
|
|
Gains (losses) deferred, net of tax of $23 |
|
— |
|
— |
|
— |
|
35 |
|
— |
|
35 |
|
35 |
|
|
(Gains) losses reclassified to earnings, net of tax of $0 |
|
— |
|
— |
|
— |
|
1 |
|
— |
|
1 |
|
1 |
|
|
Change in ownership from noncontrolling interests |
|
(68) |
|
— |
|
— |
|
— |
|
(66) |
|
(134) |
|
— |
|
|
Dividends declared |
|
— |
|
— |
|
(542) |
|
— |
|
— |
|
(542) |
|
— |
|
|
Common shares issued from treasury stock for stock-based compensation: 8,502,582 |
|
37 |
|
156 |
|
— |
|
— |
|
— |
|
193 |
|
— |
|
|
Common shares issued from treasury stock for benefit plans: 1,447,500 4 |
|
66 |
|
27 |
|
— |
|
— |
|
— |
|
93 |
|
— |
|
|
Stock-based compensation expense |
|
196 |
|
— |
|
— |
|
— |
|
— |
|
196 |
|
— |
|
|
Net excess tax benefits from stock-based compensation |
|
87 |
|
— |
|
— |
|
— |
|
— |
|
87 |
|
— |
|
|
Cat Japan share redemption 2 |
|
— |
|
— |
|
60 |
|
— |
|
(34) |
|
26 |
|
— |
|
|
Balance at September 30, 2010 |
|
$3,757 |
|
$(10,463) |
|
$20,955 |
|
$(4,412) |
|
$38 |
|
$9,875 |
|
$1,136 |
|
|
|
|
|
|
|
|
|
|
|
|
|
|
|
|
|
|
|
Nine Months Ended September 30, 2011 |
|
|
|
|
|
|
|
|
|
|
|
|
|
|
|
|
Balance at December 31, 2010 |
|
$3,888 |
|
$(10,397) |
|
$21,384 |
|
$(4,051) |
|
$40 |
|
$10,864 |
|
|
|
|
Profit (loss) of consolidated and affiliated companies |
|
— |
|
— |
|
3,381 |
|
— |
|
38 |
|
3,419 |
|
3,419 |
|
|
Foreign currency translation, net of tax of $15 |
|
— |
|
— |
|
— |
|
(244) |
|
32 |
|
(212) |
|
(212) |
|
|
Pension and other postretirement benefits |
|
|
|
|
|
|
|
|
|
|
|
|
|
|
|
|
Amortization of actuarial (gain) loss, net of tax of $158 |
|
— |
|
— |
|
— |
|
300 |
|
(1) |
|
299 |
|
299 |
|
|
Amortization of prior service (credit) cost, net of tax of $9 |
|
— |
|
— |
|
— |
|
(15) |
|
— |
|
(15) |
|
(15) |
|
|
Amortization of transition (asset) obligation, net of tax of $1 |
|
— |
|
— |
|
— |
|
1 |
|
— |
|
1 |
|
1 |
|
|
Derivative financial instruments |
|
|
|
|
|
|
|
|
|
|
|
|
|
|
|
|
Gains (losses) deferred, net of tax of $15 |
|
— |
|
— |
|
— |
|
24 |
|
— |
|
24 |
|
24 |
|
|
(Gains) losses reclassified to earnings, net of tax of $14 |
|
— |
|
— |
|
— |
|
(21) |
|
— |
|
(21) |
|
(21) |
|
|
Available-for-sale securities |
|
|
|
|
|
|
|
|
|
|
|
|
|
|
|
|
Gains (losses) deferred, net of tax of $8 |
|
— |
|
— |
|
— |
|
(11) |
|
— |
|
(11) |
|
(11) |
|
|
(Gains) losses reclassified to earnings, net of tax of $0 |
|
— |
|
— |
|
— |
|
(2) |
|
— |
|
(2) |
|
(2) |
|
|
Change in ownership from noncontrolling interests |
|
— |
|
— |
|
— |
|
— |
|
4 |
|
4 |
|
— |
|
|
Dividends declared |
|
— |
|
— |
|
(581) |
|
— |
|
— |
|
(581) |
|
— |
|
|
Distribution to noncontrolling interests |
|
— |
|
— |
|
— |
|
— |
|
(3) |
|
(3) |
|
— |
|
|
Common shares issued from treasury stock for stock-based compensation: 7,797,655 |
|
12 |
|
98 |
|
— |
|
— |
|
— |
|
110 |
|
— |
|
|
Stock-based compensation expense |
|
163 |
|
— |
|
— |
|
— |
|
— |
|
163 |
|
— |
|
|
Net excess tax benefits from stock-based compensation |
|
166 |
|
— |
|
— |
|
— |
|
— |
|
166 |
|
— |
|
|
Cat Japan share redemption 2 |
|
— |
|
— |
|
67 |
|
— |
|
(59) |
|
8 |
|
— |
|
|
Balance at September 30, 2011 |
|
$4,229 |
|
$(10,299) |
|
$24,251 |
|
$(4,019) |
|
$51 |
|
$14,213 |
|
$3,482 |
|
1 See Note 15 for additional information.
2 See Note 16 regarding the Cat Japan share redemption.
3 Changes in amounts due to plan re-measurements. See Note 9 for additional information.
4 See Note 9 regarding shares issued for benefit plans.
See accompanying notes to Consolidated Financial Statements.
Caterpillar Inc.
(Unaudited)
(Millions of dollars)
|
|
|
Nine Months Ended
|
||
|
|
|
2011 |
|
2010 |
|
Cash flow from operating activities: |
|
|
|
|
|
Profit (loss) of consolidated and affiliated companies |
|
$3,419 |
|
$1,770 |
|
Adjustments for non-cash items: |
|
|
|
|
|
Depreciation and amortization |
|
1,832 |
|
1,681 |
|
Other |
|
558 |
|
345 |
|
Changes in assets and liabilities, net of acquisitions and divestitures: |
|
|
|
|
|
Receivables – trade and other |
|
(254) |
|
(1,337) |
|
Inventories |
|
(2,716) |
|
(2,086) |
|
Accounts payable |
|
1,308 |
|
1,966 |
|
Accrued expenses |
|
134 |
|
7 |
|
Accrued wages, salaries and employee benefits |
|
275 |
|
647 |
|
Customer advances |
|
333 |
|
183 |
|
Other assets – net |
|
(74) |
|
131 |
|
Other liabilities – net |
|
700 |
|
(360) |
|
Net cash provided by (used for) operating activities |
|
5,515 |
|
2,947 |
|
|
|
|
|
|
|
Cash flow from investing activities: |
|
|
|
|
|
Capital expenditures – excluding equipment leased to others |
|
(1,515) |
|
(957) |
|
Expenditures for equipment leased to others |
|
(984) |
|
(708) |
|
Proceeds from disposals of leased assets and property, plant and equipment |
|
922 |
|
1,101 |
|
Additions to finance receivables |
|
(7,091) |
|
(6,121) |
|
Collections of finance receivables |
|
6,503 |
|
6,424 |
|
Proceeds from sale of finance receivables |
|
106 |
|
13 |
|
Investments and acquisitions (net of cash acquired) |
|
(7,413) |
|
(1,111) |
|
Proceeds from sale of businesses and investments (net of cash sold) |
|
21 |
|
— |
|
Proceeds from sale of available-for-sale securities |
|
180 |
|
141 |
|
Investments in available-for-sale securities |
|
(216) |
|
(129) |
|
Other – net |
|
37 |
|
130 |
|
Net cash provided by (used for) investing activities |
|
(9,450) |
|
(1,217) |
|
|
|
|
|
|
|
Cash flow from financing activities: |
|
|
|
|
|
Dividends paid |
|
(862) |
|
(804) |
|
Distribution to noncontrolling interests |
|
(3) |
|
— |
|
Common stock issued, including treasury shares reissued |
|
110 |
|
193 |
|
Excess tax benefit from stock-based compensation |
|
169 |
|
89 |
|
Acquisitions of noncontrolling interests |
|
— |
|
(132) |
|
Proceeds from debt issued (original maturities greater than three months): |
|
|
|
|
|
– Machinery and Power Systems |
|
4,544 |
|
190 |
|
– Financial Products |
|
8,703 |
|
5,738 |
|
Payments on debt (original maturities greater than three months): |
|
|
|
|
|
– Machinery and Power Systems |
|
(2,203) |
|
(1,185) |
|
– Financial Products |
|
(6,080) |
|
(8,031) |
|
Short-term borrowings – net (original maturities three months or less) |
|
(766) |
|
(330) |
|
Net cash provided by (used for) financing activities |
|
3,612 |
|
(4,272) |
|
Effect of exchange rate changes on cash |
|
(40) |
|
(60) |
|
Increase (decrease) in cash and short-term investments |
|
(363) |
|
(2,602) |
|
|
|
|
|
|
|
Cash and short-term investments at beginning of period |
|
3,592 |
|
4,867 |
|
Cash and short-term investments at end of period |
|
$3,229 |
|
$2,265 |
All short-term investments, which consist primarily of highly liquid investments with original maturities of three months or less, are considered to be cash equivalents .
See accompanying notes to Consolidated Financial Statements.
NOTES TO CONSOLIDATED FINANCIAL STATEMENTS
(Unaudited)
1. A. Basis of Presentation
In the opinion of management, the accompanying financial statements include all adjustments, consisting only of normal recurring adjustments, necessary for a fair statement of (a) the consolidated results of operations for the three and nine month periods ended September 30, 2011 and 2010, (b) the consolidated financial position at September 30, 2011 and December 31, 2010, (c) the consolidated changes in stockholders’ equity for the nine month periods ended September 30, 2011 and 2010, and (d) the consolidated statement of cash flow for the nine month periods ended September 30, 2011 and 2010. The financial statements have been prepared in conformity with generally accepted accounting principles in the United States of America (U.S. GAAP) and pursuant to the rules and regulations of the Securities and Exchange Commission (SEC). Certain amounts for prior periods have been reclassified to conform to the current period financial statement presentation.
Interim results are not necessarily indicative of results for a full year. The information included in this Form 10-Q should be read in conjunction with the audited financial statements and notes thereto included in our Company’s annual report on Form 10-K for the year ended December 31, 2010, as supplemented by the Company’s current report on Form 8-K filed on May 23, 2011 (2010 Form 10-K) to reflect the change in our reportable segments as discussed in Note 14.
The Company revised previously reported cash flows from operating and investing activities for the nine month period ended September 30, 2010 to adjust for the impact of accrued but unpaid capital expenditures. Cash provided by operating activities increased from the amount previously reported by $115 million for the nine month period ended September 30, 2010, and cash flow from investing activities decreased by the same amount. Management has concluded that the impact was not material to the nine month period.
The December 31, 2010 financial position data included herein is derived from the audited consolidated financial statements included in the 2010 Form 10-K but does not include all disclosures required by U.S. GAAP.
B. Nature of Operations
Information in our financial statements and related commentary are presented in the following categories:
Machinery and Power Systems – Represents the aggregate total of Construction Industries, Resource Industries, Power Systems, and All Other segments and related corporate items and eliminations.
Financial Products – Primarily includes the company’s Financial Products Segment. This category includes Caterpillar Financial Services Corporation (Cat Financial), Caterpillar Insurance Holdings Inc. (Cat Insurance) and their respective subsidiaries.
As discussed in Note 14 – Segment Information, during the first quarter of 2011, we revised our reportable segments in line with the changes to our organizational structure that were announced during 2010. The 2010 financial information has been retrospectively adjusted to conform to the 2011 presentation.
C. Accumulated Other Comprehensive Income (Loss)
Comprehensive income (loss) and its components are presented in Consolidated Statement of Changes in Stockholders’ Equity. Accumulated other comprehensive income (loss), net of tax, consisted of the following:
|
(Millions of dollars) |
|
September 30,
|
|
September 30,
|
|
|
Foreign currency translation |
|
$307 |
|
$564 |
|
|
Pension and other postretirement benefits |
|
(4,409) |
|
(5,089) |
|
|
Derivative financial instruments |
|
48 |
|
63 |
|
|
Available-for-sale securities |
|
35 |
|
50 |
|
|
Total accumulated other comprehensive income (loss) |
|
$(4,019) |
|
$(4,412) |
|
|
|
|
|
|
|
|
2. New Accounting Guidance
Fair value measurements - In January 2010, the FASB issued accounting guidance that requires the gross presentation of activity within the Level 3 fair value measurement roll forward and details of transfers in and out of Level 1 and 2 fair value measurements. It also clarifies existing disclosure requirements regarding the level of disaggregation of fair value measurements and disclosures on inputs. We adopted this new accounting guidance for the quarterly period ended March 31, 2010. The adoption of this guidance did not have a material impact on our financial statements. See Note 17 for additional information.
Accounting for transfers of financial assets - In June 2009, the FASB issued accounting guidance on accounting for transfers of financial assets. This guidance amends previous guidance and includes: the elimination of the qualifying special-purpose entity (QSPE) concept; a new participating interest definition that must be met for transfers of portions of financial assets to be eligible for sale accounting; clarifications and changes to the derecognition criteria for a transfer to be accounted for as a sale; and a change to the amount of recognized gain or loss on a transfer of financial assets accounted for as a sale when beneficial interests are received by the transferor. Additionally, the guidance requires extensive new disclosures regarding an entity’s involvement in a transfer of financial assets. Finally, existing QSPEs (prior to the effective date of this guidance) must be evaluated for consolidation by reporting entities in accordance with the applicable consolidation guidance upon the elimination of this concept. We adopted this new guidance on January 1, 2010. The adoption of this guidance did not have a material impact on our financial statements. See Note 15 for additional information.
Consolidation of variable interest entities - In June 2009, the FASB issued accounting guidance on the consolidation of VIEs. This new guidance revises previous guidance by eliminating the exemption for qualifying special purpose entities, by establishing a new approach for determining who should consolidate a VIE and by changing when it is necessary to reassess who should consolidate a VIE. We adopted this new guidance on January 1, 2010. The adoption of this guidance resulted in the consolidation of QSPEs related to Cat Financial’s asset-backed securitization program that were previously not recorded on our consolidated financial statements. The restricted assets (Receivables-finance, Long-term receivables-finance, Prepaid expenses and other current assets, and Other assets) of the consolidated QSPEs totaled $324 million at January 1, 2010. The liabilities (Accrued expenses, Long-term debt due within one year-Financial Products and Long-term debt due after one year-Financial Products) of the consolidated QSPEs totaled $327 million at January 1, 2010. See Note 15 for additional information.
Disclosures about the credit quality of financing receivables and the allowance for credit losses - In July 2010, the FASB issued accounting guidance on disclosures about the credit quality of financing receivables and the allowance for credit losses. The guidance expands disclosures for the allowance for credit losses and financing receivables by requiring entities to disclose information at disaggregated levels. It also requires disclosure of credit quality indicators, past due information and modifications of financing receivables. Also, in April 2011, the FASB issued guidance clarifying when a restructuring of a receivable should be considered a troubled debt restructuring by providing additional guidance for determining whether the creditor has granted a concession and whether the debtor is experiencing financial difficulties. For end of period balances, the new disclosures were effective December 31, 2010 and did not have a material impact on our financial statements. For activity during a reporting period, the disclosures were effective January 1, 2011 and did not have a material impact on our financial statements. The disclosures related to modifications of financing receivables, as well as the guidance clarifying when a restructured receivable should be considered a troubled debt restructuring were effective July 1, 2011 and did not have a material impact on our financial statements. See Note 15 for additional information.
Presentation of comprehensive income – In June 2011, the FASB issued accounting guidance on the presentation of comprehensive income. The guidance provides two options for presenting net income and other comprehensive income. The total of comprehensive income, the components of net income, and the components of other comprehensive income may be presented in either a single continuous statement of comprehensive income or in two separate but consecutive statements. This guidance will be effective January 1, 2012 and we do not expect the adoption to have a material impact on our financial statements.
3. Stock-Based Compensation
Accounting for stock-based compensation requires that the cost resulting from all stock-based payments be recognized in the financial statements based on the grant date fair value of the award. Stock-based compensation primarily consists of stock-settled stock appreciation rights (SARs), restricted stock units (RSUs) and stock options. We recognized pretax stock-based compensation cost in the amount of $52 million and $163 million for the three and nine months ended September 30, 2011, respectively; and $58 million and $196 million for the three and nine months ended September 30, 2010, respectively.
The following table illustrates the type and fair value of the stock-based compensation awards granted during the nine month periods ended September 30, 2011 and 2010, respectively:
|
|
|
2011 |
|
2010 |
|
||||
|
|
|
# Granted |
|
Fair Value
|
|
# Granted |
|
Fair Value
|
|
|
SARs |
|
2,722,689 |
|
$36.73 |
|
7,125,210 |
|
$22.31 |
|
|
RSUs |
|
1,082,032 |
|
97.51 |
|
1,711,771 |
|
53.35 |
|
|
Stock options |
|
237,906 |
|
36.73 |
|
431,271 |
|
22.31 |
|
|
|
|
|
|
|
|
|
|
|
|
The stock price on the date of grant was $102.13 and $57.85 for 2011 and 2010, respectively.
The following table provides the assumptions used in determining the fair value of the stock-based awards for the nine month periods ended September 30, 2011 and 2010, respectively:
|
|
|
Grant Year |
|||
|
|
|
2011 |
|
2010 |
|
|
Weighted-average dividend yield |
|
2.22% |
|
2.32% |
|
|
Weighted-average volatility |
|
32.7% |
|
36.4% |
|
|
Range of volatilities |
|
20.9-45.4% |
|
35.2-51.8% |
|
|
Range of risk-free interest rates |
|
0.25-3.51% |
|
0.32-3.61% |
|
|
Weighted-average expected lives |
|
8 years |
|
7 years |
|
|
|
|
|
|
|
|
As of September 30, 2011, the total remaining unrecognized compensation cost related to nonvested stock-based compensation awards was $184 million, which will be amortized over the weighted-average remaining requisite service periods of approximately 2.0 years.
4. Derivative Financial Instruments and Risk Management
Our earnings and cash flow are subject to fluctuations due to changes in foreign currency exchange rates, interest rates and commodity prices. In addition, the amount of Caterpillar stock that can be repurchased under our stock repurchase program is impacted by movements in the price of the stock. Our Risk Management Policy (policy) allows for the use of derivative financial instruments to prudently manage foreign currency exchange rate, interest rate, commodity price and Caterpillar stock price exposures. Our policy specifies that derivatives are not to be used for speculative purposes. Derivatives that we use are primarily foreign currency forward and option contracts, interest rate swaps, commodity forward and option contracts, and stock repurchase contracts. Our derivative activities are subject to the management, direction and control of our senior financial officers. Risk management practices, including the use of financial derivative instruments, are presented to the Audit Committee of the Board of Directors at least annually.
All derivatives are recognized on the Consolidated Statement of Financial Position at their fair value. On the date the derivative contract is entered into, we designate the derivative as (1) a hedge of the fair value of a recognized asset or liability (fair value hedge), (2) a hedge of a forecasted transaction or the variability of cash flow to be paid (cash flow hedge), or (3) an undesignated instrument. Changes in the fair value of a derivative that is qualified, designated and highly effective as a fair value hedge, along with the gain or loss on the hedged recognized asset or liability that is attributable to the hedged risk, are recorded in current earnings. Changes in the fair value of a derivative that is qualified, designated and highly effective as a cash flow hedge are recorded in Accumulated other comprehensive income (loss) (AOCI) on the Consolidated Statement of Financial Position until they are reclassified to earnings in the same period or periods during which the hedged transaction affects earnings. Changes in the fair value of undesignated derivative instruments and the ineffective portion of designated derivative instruments are reported in current earnings. Cash flow from designated derivative financial instruments is classified within the same category as the item being hedged on the Consolidated Statement of Cash Flow. Cash flow from undesignated derivative financial instruments is included in the investing category on the Consolidated Statement of Cash Flow.
We formally document all relationships between hedging instruments and hedged items, as well as the risk-management objective and strategy for undertaking various hedge transactions. This process includes linking all derivatives that are designated as fair value hedges to specific assets and liabilities on the Consolidated Statement of Financial Position and linking cash flow hedges to specific forecasted transactions or variability of cash flow.
We also formally assess, both at the hedge’s inception and on an ongoing basis, whether the designated derivatives that are used in hedging transactions are highly effective in offsetting changes in fair values or cash flow of hedged items. When a derivative is determined not to be highly effective as a hedge or the underlying hedged transaction is no longer probable, we discontinue hedge accounting prospectively, in accordance with the derecognition criteria for hedge accounting.
Foreign Currency Exchange Rate Risk
Foreign currency exchange rate movements create a degree of risk by affecting the U.S. dollar value of sales made and costs incurred in foreign currencies. Movements in foreign currency rates also affect our competitive position as these changes may affect business practices and/or pricing strategies of non-U.S.-based competitors. Additionally, we have balance sheet positions denominated in foreign currencies, thereby creating exposure to movements in exchange rates.
Our Machinery and Power Systems operations purchase, manufacture and sell products in many locations around the world. As we have a diversified revenue and cost base, we manage our future foreign currency cash flow exposure on a net basis. We use foreign currency forward and option contracts to manage unmatched foreign currency cash inflow and outflow. Our objective is to minimize the risk of exchange rate movements that would reduce the U.S. dollar value of our foreign currency cash flow. Our policy allows for managing anticipated foreign currency cash flow for up to five years.
We generally designate as cash flow hedges at inception of the contract any Australian dollar, Brazilian real, British pound, Canadian dollar, Chinese yuan, euro, Indian rupee, Japanese yen, Mexican peso, Singapore dollar or Swiss franc forward or option contracts that meet the requirements for hedge accounting and the maturity extends beyond the current quarter-end. Designation is performed on a specific exposure basis to support hedge accounting. The remainder of Machinery and Power Systems foreign currency contracts are undesignated, including any hedges designed to protect our competitive exposure. Periodically we also designate as fair value hedges specific euro forward contracts used to hedge firm commitments.
As of September 30, 2011, $34 million of deferred net gains, net of tax, included in equity (Accumulated other comprehensive income (loss) in the Consolidated Statement of Financial Position), are expected to be reclassified to current earnings (Other income (expense) in the Consolidated Statement of Results of Operations) over the next twelve months when earnings are affected by the hedged transactions. The actual amount recorded in Other income (expense) will vary based on exchange rates at the time the hedged transactions impact earnings.
In managing foreign currency risk for our Financial Products operations, our objective is to minimize earnings volatility resulting from conversion and the remeasurement of net foreign currency balance sheet positions. Our policy allows the use of foreign currency forward and option contracts to offset the risk of currency mismatch between our receivables and debt. All such foreign currency forward and option contracts are undesignated.
Interest Rate Risk
Interest rate movements create a degree of risk by affecting the amount of our interest payments and the value of our fixed-rate debt. Our practice is to use interest rate derivatives to manage our exposure to interest rate changes and, in some cases, lower the cost of borrowed funds.
Our Machinery and Power Systems operations generally use fixed-rate debt as a source of funding. Our objective is to minimize the cost of borrowed funds. Our policy allows us to enter into fixed-to-floating interest rate swaps and forward rate agreements to meet that objective with the intent to designate as fair value hedges at inception of the contract all fixed-to-floating interest rate swaps. Designation as a hedge of the fair value of our fixed-rate debt is performed to support hedge accounting.
Financial Products operations has a match-funding policy that addresses interest rate risk by aligning the interest rate profile (fixed or floating rate) of Cat Financial’s debt portfolio with the interest rate profile of their receivables portfolio within predetermined ranges on an ongoing basis. In connection with that policy, we use interest rate derivative instruments to modify the debt structure to match assets within the receivables portfolio. This matched funding reduces the volatility of margins between interest-bearing assets and interest-bearing liabilities, regardless of which direction interest rates move.
Our policy allows us to use fixed-to-floating, floating-to-fixed, and floating-to-floating interest rate swaps to meet the match-funding objective. We designate fixed-to-floating interest rate swaps as fair value hedges to protect debt against changes in fair value due to changes in the benchmark interest rate. We designate most floating-to-fixed interest rate swaps as cash flow hedges to protect against the variability of cash flows due to changes in the benchmark interest rate.
As of September 30, 2011, $5 million of deferred net losses, net of tax, included in equity (Accumulated other comprehensive income (loss) in the Consolidated Statement of Financial Position), related to Financial Products floating-to-fixed interest rate swaps, are expected to be reclassified to current earnings (Interest expense of Financial Products in the Consolidated Statement of Results of Operations) over the next twelve months. The actual amount recorded in Interest expense of Financial Products will vary based on interest rates at the time the hedged transactions impact earnings.
We have, at certain times, liquidated fixed-to-floating and floating-to-fixed interest rate swaps at both Machinery and Power Systems and Financial Products. The gains or losses associated with these swaps at the time of liquidation are amortized into earnings over the original term of the previously designated hedged item.
In anticipation of issuing debt to finance our acquisition of Bucyrus International, Inc., we entered into interest rate swaps to manage our exposure to interest rate changes. For the nine months ended September 30, 2011, we recognized a net loss of $149 million in connection with these swaps, which was included in Other income (expense) in the Consolidated Statement of Results of Operations. The contracts were liquidated in conjunction with our issuance of senior notes in May 2011, therefore, there were no gains or losses for the three months ended September 30, 2011. These contracts were not designated as hedging instruments, and therefore, did not receive hedge accounting treatment.
Commodity Price Risk
Commodity price movements create a degree of risk by affecting the price we must pay for certain raw material. Our policy is to use commodity forward and option contracts to manage the commodity risk and reduce the cost of purchased materials.
Our Machinery and Power Systems operations purchase base and precious metals embedded in the components we purchase from suppliers. Our suppliers pass on a share of the price changes in the commodity portion of the component cost. In addition, we are subject to price changes on energy products such as natural gas and diesel fuel purchased for operational use.
Our objective is to minimize volatility in the price of these commodities. Our policy allows us to enter into commodity forward and option contracts to lock in the purchase price of a portion of these commodities within a five-year horizon. All such commodity forward and option contracts are undesignated.
The location and fair value of derivative instruments reported in the Consolidated Statement of Financial Position are as follows:
|
(Millions of dollars) |
|
|
|
|
|
|
|
|
|
|
|
|
Asset (Liability) Fair Value |
|
||
|
|
|
Statement of Financial Position Location |
|
September 30, 2011 |
|
December 31, 2010 |
|
|
Designated derivatives |
|
|
|
|
|
|
|
|
Foreign exchange contracts |
|
|
|
|
|
|
|
|
Machinery and Power Systems |
|
Receivables – trade and other |
|
$65 |
|
$65 |
|
|
Machinery and Power Systems |
|
Long-term receivables – trade and other |
|
57 |
|
52 |
|
|
Machinery and Power Systems |
|
Accrued expenses |
|
(58) |
|
(66) |
|
|
Machinery and Power Systems |
|
Other liabilities |
|
(4) |
|
(1) |
|
|
Interest rate contracts |
|
|
|
|
|
|
|
|
Machinery and Power Systems |
|
Receivables – trade and other |
|
— |
|
1 |
|
|
Financial Products |
|
Receivables – trade and other |
|
11 |
|
14 |
|
|
Financial Products |
|
Long-term receivables – trade and other |
|
258 |
|
197 |
|
|
Financial Products |
|
Accrued expenses |
|
(7) |
|
(18) |
|
|
|
|
|
|
$322 |
|
$244 |
|
|
|
|
|
|
|
|
|
|
|
Undesignated derivatives |
|
|
|
|
|
|
|
|
Foreign exchange contracts |
|
|
|
|
|
|
|
|
Machinery and Power Systems |
|
Receivables – trade and other |
|
$81 |
|
$120 |
|
|
Machinery and Power Systems |
|
Long-term receivables – trade and other |
|
1 |
|
— |
|
|
Machinery and Power Systems |
|
Accrued expenses |
|
(31) |
|
(46) |
|
|
Machinery and Power Systems |
|
Other liabilities |
|
(90) |
|
(58) |
|
|
Financial Products |
|
Receivables – trade and other |
|
13 |
|
6 |
|
|
Financial Products |
|
Accrued expenses |
|
(20) |
|
(9) |
|
|
Interest rate contracts |
|
|
|
|
|
|
|
|
Machinery and Power Systems |
|
Accrued expenses |
|
— |
|
(6) |
|
|
Financial Products |
|
Accrued expenses |
|
(1) |
|
(1) |
|
|
Commodity contracts |
|
|
|
|
|
|
|
|
Machinery and Power Systems |
|
Receivables – trade and other |
|
3 |
|
17 |
|
|
Machinery and Power Systems |
|
Accrued expenses |
|
(17) |
|
— |
|
|
|
|
|
|
$(61) |
|
$23 |
|
The effect of derivatives designated as hedging instruments on the Consolidated Statement of Results of Operations is as follows:
|
Fair Value Hedges (Millions of dollars) |
|
|
|
|
|
|
|
||||
|
|
|
|
|
Three Months Ended September 30,
|
|
Nine Months Ended September 30,
|
|
||||
|
|
|
Classification |
|
Gains (Losses)
|
|
Gains (Losses)
|
|
Gains (Losses)
|
|
Gains (Losses)
|
|
|
Interest rate contracts |
|
|
|
|
|
|
|
|
|
|
|
|
Machinery and Power Systems |
|
Other income (expense) |
|
$— |
|
$— |
|
$(1) |
|
$1 |
|
|
Financial Products |
|
Other income (expense) |
|
70 |
|
(77) |
|
59 |
|
(65) |
|
|
|
|
|
|
$70 |
|
$(77) |
|
$58 |
|
$(64) |
|
|
|
|
|
|
Three Months Ended September 30,
|
|
Nine Months Ended September 30,
|
|
||||
|
|
|
Classification |
|
Gains (Losses)
|
|
Gains (Losses)
|
|
Gains (Losses)
|
|
Gains (Losses)
|
|
|
Interest rate contracts |
|
|
|
|
|
|
|
|
|
|
|
|
Financial Products |
|
Other income (expense) |
|
$63 |
|
$(61) |
|
$204 |
|
$(195) |
|
|
|
|
|
|
$63 |
|
$(61) |
|
$204 |
|
$(195) |
|
|
|
|
|
|
|
|
|
|
|
|
|
|
|
Cash Flow Hedges (Millions of dollars) |
|
|
|
|
|
|
|
|
|
|
|
|
Three Months Ended September 30, 2011 |
|
||||||
|
|
|
|
|
Recognized in Earnings |
|
||||
|
|
|
Amount of Gains
|
|
Classification of
|
|
Amount of Gains
|
|
Recognized
|
|
|
Foreign exchange contracts |
|
|
|
|
|
|
|
|
|
|
Machinery and Power Systems |
|
$62 |
|
Other income (expense) |
|
$43 |
|
$— |
|
|
Interest rate contracts |
|
|
|
|
|
|
|
|
|
|
Machinery and Power Systems |
|
— |
|
Other income (expense) |
|
(1) |
|
— |
|
|
Financial Products |
|
(4) |
|
Interest expense of Financial Products |
|
(3) |
|
(2) 1 |
|
|
|
|
$58 |
|
|
|
$39 |
|
$(2) |
|
|
|
|
Three Months Ended September 30, 2010 |
|
||||||
|
|
|
|
|
Recognized in Earnings |
|
||||
|
|
|
Amount of Gains
|
|
Classification of
|
|
Amount of Gains
|
|
Recognized
|
|
|
Foreign exchange contracts |
|
|
|
|
|
|
|
|
|
|
Machinery and Power Systems |
|
$37 |
|
Other income (expense) |
|
$15 |
|
$1 |
|
|
Interest rate contracts |
|
|
|
|
|
|
|
|
|
|
Machinery and Power Systems |
|
— |
|
Other income (expense) |
|
(1) |
|
— |
|
|
Financial Products |
|
(2) |
|
Interest expense of Financial Products |
|
(10) |
|
(2) 1 |
|
|
|
|
$35 |
|
|
|
$4 |
|
$(1) |
|
|
|
|
Nine Months Ended September 30, 2011 |
|
||||||
|
|
|
|
|
Recognized in Earnings |
|
||||
|
|
|
Amount of Gains
|
|
Classification of
|
|
Amount of Gains
|
|
Recognized
|
|
|
Foreign exchange contracts |
|
|
|
|
|
|
|
|
|
|
Machinery and Power Systems |
|
$44 |
|
Other income (expense) |
|
$52 |
|
$— |
|
|
Interest rate contracts |
|
|
|
|
|
|
|
|
|
|
Machinery and Power Systems |
|
— |
|
Other income (expense) |
|
(2) |
|
— |
|
|
Financial Products |
|
(5) |
|
Interest expense of Financial Products |
|
(15) |
|
(1) 1 |
|
|
|
|
$39 |
|
|
|
$35 |
|
$(1) |
|
|
|
|
Nine Months Ended September 30, 2010 |
|
||||||
|
|
|
|
|
Recognized in Earnings |
|
||||
|
|
|
Amount of Gains
|
|
Classification of
|
|
Amount of Gains
|
|
Recognized
|
|
|
Foreign exchange contracts |
|
|
|
|
|
|
|
|
|
|
Machinery and Power Systems |
|
$(36) |
|
Other income (expense) |
|
$(4) |
|
$1 |
|
|
Interest rate contracts |
|
|
|
|
|
|
|
|
|
|
Machinery and Power Systems |
|
— |
|
Other income (expense) |
|
(2) |
|
— |
|
|
Financial Products |
|
(8) |
|
Interest expense of Financial Products |
|
(42) |
|
(1) 1 |
|
|
|
|
$(44) |
|
|
|
$(48) |
|
$— |
|
|
|
|
|
|
|
|
|
|
|
|
|
1 The classification of the ineffective portion recognized in earnings is included in Other income (expense). |
|||||||||
|
|
|
|
|
|
|
|
|
|
|
The effect of derivatives not designated as hedging instruments on the Consolidated Statement of Results of Operations is as follows:
|
(Millions of dollars) |
|
|
|
|
|
|
|
|
|
|
Classification of Gains (Losses) |
|
Three Months Ended
|
|
Nine Months Ended
|
|
|
Foreign exchange contracts |
|
|
|
|
|
|
|
|
Machinery and Power Systems |
|
Other income (expense) |
|
$(1) |
|
$46 |
|
|
Financial Products |
|
Other income (expense) |
|
(10) |
|
(12) |
|
|
Interest rate contracts |
|
|
|
|
|
|
|
|
Machinery and Power Systems |
|
Other income (expense) |
|
— |
|
(149) |
|
|
Commodity contracts |
|
|
|
|
|
|
|
|
Machinery and Power Systems |
|
Other income (expense) |
|
(23) |
|
(21) |
|
|
|
|
|
|
$(34) |
|
$(136) |
|
|
|
|
Classification of Gains (Losses) |
|
Three Months Ended
|
|
Nine Months Ended
|
|
|
Foreign exchange contracts |
|
|
|
|
|
|
|
|
Machinery and Power Systems |
|
Other income (expense) |
|
$(21) |
|
$(14) |
|
|
Financial Products |
|
Other income (expense) |
|
12 |
|
23 |
|
|
Interest rate contracts |
|
|
|
|
|
|
|
|
Machinery and Power Systems |
|
Other income (expense) |
|
— |
|
(2) |
|
|
Financial Products |
|
Other income (expense) |
|
2 |
|
3 |
|
|
Commodity contracts |
|
|
|
|
|
|
|
|
Machinery and Power Systems |
|
Other income (expense) |
|
10 |
|
7 |
|
|
|
|
|
|
$3 |
|
$17 |
|
|
|
|
|
|
|
|
|
|
Stock Repurchase Risk
Payments for stock repurchase derivatives are accounted for as a reduction in stockholders’ equity. In February 2007, the Board of Directors authorized a $7.5 billion stock repurchase program, expiring on December 31, 2011. The amount of Caterpillar stock that can be repurchased under the authorization is impacted by movements in the price of the stock. In August 2007, the Board of Directors authorized the use of derivative contracts to reduce stock repurchase price volatility. There were no stock repurchase derivatives outstanding for the three and nine months ended September 30, 2011 or 2010.
5. Inventories
Inventories (principally using the last-in, first-out (LIFO) method) are comprised of the following:
|
(Millions of dollars) |
|
September 30,
|
|
December 31,
|
|
|
Raw materials |
|
$3,649 |
|
$2,766 |
|
|
Work-in-process |
|
3,020 |
|
1,483 |
|
|
Finished goods |
|
7,474 |
|
5,098 |
|
|
Supplies |
|
269 |
|
240 |
|
|
Total inventories |
|
$14,412 |
|
$9,587 |
|
|
|
|
|
|
|
|
During the third quarter of 2011, we acquired $2,305 million of inventory (valued using the first-in, first-out (FIFO) method) as a result of the acquisition of Bucyrus International, Inc. See Note 18 for details on this business combination.
6. Investments in Unconsolidated Affiliated Companies
Combined financial information of the unconsolidated affiliated companies accounted for by the equity method (generally on a lag of 3 months or less) was as follows:
|
Results of Operations of unconsolidated affiliated companies
:
|
|
Three Months Ended
|
|
Nine Months Ended
|
|
||||
|
|
|
2011 |
|
2010 |
|
2011 |
|
2010 |
|
|
Sales |
|
$302 |
|
$216 |
|
$741 |
|
$580 |
|
|
Cost of sales |
|
257 |
|
171 |
|
616 |
|
445 |
|
|
Gross profit |
|
$45 |
|
$45 |
|
$125 |
|
$135 |
|
|
|
|
|
|
|
|
|
|
|
|
|
Profit (loss) |
|
$(12) |
|
$(10) |
|
$(46) |
|
$(12) |
|
|
|
|
|
|
|
|
|
|
|
|
|
Financial Position of unconsolidated affiliated companies: ( Millions of dollars ) |
|
September 30,
|
|
December 31,
|
|
|
Assets: |
|
|
|
|
|
|
Current assets |
|
$310 |
|
$414 |
|
|
Property, plant and equipment — net |
|
172 |
|
196 |
|
|
Other assets |
|
7 |
|
39 |
|
|
|
|
489 |
|
649 |
|
|
Liabilities: |
|
|
|
|
|
|
Current liabilities |
|
202 |
|
274 |
|
|
Long-term debt due after one year |
|
74 |
|
72 |
|
|
Other liabilities |
|
12 |
|
40 |
|
|
|
|
288 |
|
386 |
|
|
Equity |
|
$201 |
|
$263 |
|
|
1 The decrease is due to the sale of our ownership in NC 2 Global LLC (NC 2 ), which occurred on September 29, 2011. |
|
Caterpillar’s investments in unconsolidated affiliated companies: (Millions of dollars) |
|
September 30,
|
|
December 31,
|
|
|
Investments in equity method companies |
|
$99 |
|
$135 |
|
|
Plus: Investments in cost method companies |
|
22 |
|
29 |
|
|
Total investments in unconsolidated affiliated companies |
|
$121 |
|
$164 |
|
|
|
|
|
|
|
|
7. Intangible Assets and Goodwill
A. Intangible assets
Intangible assets are comprised of the following:
|
|
|
|
|
September 30, 2011 |
|
||||
|
(Millions of dollars) |
|
Weighted
|
|
Gross
|
|
Accumulated
|
|
Net |
|
|
Customer relationships |
|
15 |
|
$2,929 |
|
$(173) |
|
$2,756 |
|
|
Intellectual property |
|
12 |
|
1,775 |
|
(208) |
|
1,567 |
|
|
Other |
|
11 |
|
277 |
|
(89) |
|
188 |
|
|
Total finite-lived intangible assets |
|
14 |
|
4,981 |
|
(470) |
|
4,511 |
|
|
Indefinite-lived intangible assets - In-process research & development |
|
|
|
18 |
|
— |
|
18 |
|
|
Total intangible assets |
|
|
|
$4,999 |
|
$(470) |
|
$4,529 |
|
|
|
|
|
|
December 31, 2010 |
|
||||
|
(Millions of dollars) |
|
Weighted
|
|
Gross
|
|
Accumulated
|
|
Net |
|
|
Customer relationships |
|
17 |
|
$630 |
|
$(108) |
|
$522 |
|
|
Intellectual property |
|
9 |
|
306 |
|
(166) |
|
140 |
|
|
Other |
|
13 |
|
197 |
|
(72) |
|
125 |
|
|
Total finite-lived intangible assets |
|
14 |
|
1,133 |
|
(346) |
|
787 |
|
|
Indefinite-lived intangible assets - In-process research & development |
|
|
|
18 |
|
— |
|
18 |
|
|
Total intangible assets |
|
|
|
$1,151 |
|
$(346) |
|
$805 |
|
|
|
|
|
|
|
|
|
|
|
|
During the third quarter of 2011, we acquired finite-lived intangible assets aggregating $3,941 million due to purchases of Bucyrus International, Inc. and Pyroban Group Ltd. See Note 18 for details on these business combinations.
Amortization expense for the three and nine months ended September 30, 2011 was $91 million and $135 million, respectively. Amortization expense for the three and nine months ended September 30, 2010 was $20 million and $52 million, respectively. Amortization expense related to intangible assets is expected to be:
|
(Millions of dollars) |
|||||||||||
|
2011 |
|
2012 |
|
2013 |
|
2014 |
|
2015 |
|
Thereafter |
|
|
$229 |
|
$376 |
|
$368 |
|
$365 |
|
$360 |
|
$2,966 |
|
|
|
|
|
|
|
|
|
|
|
|
|
|
B. Goodwill
During the third quarter of 2011, we recorded goodwill of $5,286 million related to the acquisitions of Bucyrus International, Inc. and Pyroban Group Ltd. See Note 18 for details on these business combinations.
We test goodwill for impairment annually and whenever events or circumstances make it more likely than not that an impairment may have occurred. We perform our annual goodwill impairment test as of October 1 and monitor for interim triggering events on an ongoing basis. Goodwill is reviewed for impairment utilizing a two-step process. The first step requires us to compare the fair value of each reporting unit, which we primarily determine using an income approach based on the present value of discounted cash flows, to the respective carrying value, which includes goodwill. If the fair value of the reporting unit exceeds its carrying value, the goodwill is not considered impaired. If the carrying value is greater than the fair value, there is an indication that an impairment may exist and the second step is required. Additionally, if the carrying amount of a reporting unit is zero or negative, the second step of the goodwill impairment test is also required if an analysis of qualitative factors indicates it more likely than not that a goodwill impairment exists. In step two, the implied fair value of goodwill is calculated as the excess of the fair value of a reporting unit over the fair values assigned to its assets and liabilities. If the implied fair value of goodwill is less than the carrying value of the reporting unit’s goodwill, the difference is recognized as an impairment loss. No goodwill was impaired during the three and nine months ended September 30, 2011 or 2010.
As discussed in Note 14 – Segment Information, during the first quarter of 2011, we revised our reportable segments in line with the changes to our organizational structure that were announced during 2010. Our reporting units did not change as a result of the changes to our reportable segments.
The changes in the carrying amount of the goodwill by reportable segment for the nine months ended September 30, 2011 were as follows:
|
(Millions of dollars) |
|
|
|
|
|
|
|
|
|
|
|
|
|
|
Construction
|
|
Resource
|
|
Power
|
|
Other |
|
Consolidated
|
|
|
Balance at December 31, 2010 |
|
$357 |
|
$51 |
|
$2,077 |
|
$129 |
|
$2,614 |
|
|
Business acquisitions 1 |
|
— |
|
5,263 |
|
23 |
|
— |
|
5,286 |
|
|
Business divestitures 2 |
|
— |
|
— |
|
— |
|
(12) |
|
(12) |
|
|
Other adjustments 3 |
|
24 |
|
(133) |
|
(1) |
|
— |
|
(110) |
|
|
Balance at September 30, 2011 |
|
$381 |
|
$5,181 |
|
$2,099 |
|
$117 |
|
$7,778 |
|
1 Purchase of Bucyrus International, Inc. and Pyroban Group Ltd. See Note 18 for additional details.
2 Sale of Carter Machinery. See Note 18 for additional details.
3 Other adjustments are comprised primarily of foreign currency translation.
|
|
|
|
|
|
|
|
|
|
|
|
|
8. Available-For-Sale Securities
We have investments in certain debt and equity securities, primarily at Cat Insurance, that have been classified as available-for-sale and recorded at fair value based upon quoted market prices. These fair values are primarily included in Other assets in the Consolidated Statement of Financial Position. Unrealized gains and losses arising from the revaluation of available-for-sale securities are included, net of applicable deferred income taxes, in equity (Accumulated other comprehensive income (loss) in the Consolidated Statement of Financial Position). Realized gains and losses on sales of investments are generally determined using the FIFO (first-in, first-out) method for debt instruments and the specific identification method for equity securities. Realized gains and losses are included in Other income (expense) in the Consolidated Statement of Results of Operations.
|
|
|
September 30, 2011 |
|
December 31, 2010 |
|
||||||||
|
|
|
|
|
Unrealized |
|
|
|
|
|
Unrealized |
|
|
|
|
|
|
|
|
Pretax Net |
|
|
|
|
|
Pretax Net |
|
|
|
|
(Millions of dollars) |
|
Cost
|
|
Gains
|
|
Fair
|
|
Cost
|
|
Gains
|
|
Fair
|
|
|
Government debt |
|
|
|
|
|
|
|
|
|
|
|
|
|
|
U.S. treasury bonds |
|
$10 |
|
$— |
|
$10 |
|
$12 |
|
$— |
|
$12 |
|
|
Other U.S. and non-U.S. government bonds |
|
72 |
|
2 |
|
74 |
|
76 |
|
1 |
|
77 |
|
|
|
|
|
|
|
|
|
|
|
|
|
|
|
|
|
Corporate bonds |
|
|
|
|
|
|
|
|
|
|
|
|
|
|
Corporate bonds |
|
526 |
|
30 |
|
556 |
|
481 |
|
30 |
|
511 |
|
|
Asset-backed securities |
|
117 |
|
(1) |
|
116 |
|
136 |
|
— |
|
136 |
|
|
|
|
|
|
|
|
|
|
|
|
|
|
|
|
|
Mortgage-backed debt securities |
|
|
|
|
|
|
|
|
|
|
|
|
|
|
U.S. governmental agency mortgage-backed securities |
|
274 |
|
16 |
|
290 |
|
258 |
|
15 |
|
273 |
|
|
Residential mortgage-backed securities |
|
36 |
|
(4) |
|
32 |
|
43 |
|
(3) |
|
40 |
|
|
Commercial mortgage-backed securities |
|
156 |
|
1 |
|
157 |
|
164 |
|
4 |
|
168 |
|
|
|
|
|
|
|
|
|
|
|
|
|
|
|
|
|
Equity securities |
|
|
|
|
|
|
|
|
|
|
|
|
|
|
Large capitalization value |
|
116 |
|
6 |
|
122 |
|
100 |
|
22 |
|
122 |
|
|
Smaller company growth |
|
21 |
|
6 |
|
27 |
|
23 |
|
8 |
|
31 |
|
|
Total |
|
$1,328 |
|
$56 |
|
$1,384 |
|
$1,293 |
|
$77 |
|
$1,370 |
|
|
|
|
|
|
|
|
|
|
|
|
|
|
|
|
During the three and nine months ended September 30, 2011, charges for other-than-temporary declines in the market value of securities were $4 million. During the three and nine months ended September 30, 2010, charges for other-than-temporary declines in the market value of securities were $1 million and $2 million, respectively. These charges were accounted for as realized losses and were included in Other income (expense) in the Consolidated Statement of Results of Operations. The cost basis of the impacted securities was adjusted to reflect these charges.
|
Investments in an unrealized loss position that are not other-than-temporarily impaired: |
|
|
|
September 30, 2011 |
|
||||||||||
|
|
|
Less than 12 months 1 |
|
12 months or more 1 |
|
Total |
|
||||||
|
(Millions of dollars) |
|
Fair
|
|
Unrealized
|
|
Fair
|
|
Unrealized
|
|
Fair
|
|
Unrealized
|
|
|
Corporate bonds |
|
|
|
|
|
|
|
|
|
|
|
|
|
|
Corporate bonds |
|
$65 |
|
$1 |
|
$— |
|
$— |
|
$65 |
|
$1 |
|
|
Asset-backed securities |
|
— |
|
— |
|
17 |
|
5 |
|
17 |
|
5 |
|
|
|
|
|
|
|
|
|
|
|
|
|
|
|
|
|
Mortgage-backed debt securities |
|
|
|
|
|
|
|
|
|
|
|
|
|
|
Residential mortgage-backed securities |
|
— |
|
— |
|
18 |
|
4 |
|
18 |
|
4 |
|
|
Commercial mortgage-backed securities |
|
14 |
|
2 |
|
7 |
|
2 |
|
21 |
|
4 |
|
|
|
|
|
|
|
|
|
|
|
|
|
|
|
|
|
Equity securities |
|
|
|
|
|
|
|
|
|
|
|
|
|
|
Large capitalization value |
|
49 |
|
9 |
|
5 |
|
1 |
|
54 |
|
10 |
|
|
Small company growth |
|
5 |
|
1 |
|
— |
|
— |
|
5 |
|
1 |
|
|
Total |
|
$133 |
|
$13 |
|
$47 |
|
$12 |
|
$180 |
|
$25 |
|
|
|
|
December 31, 2010 |
|
||||||||||
|
|
|
Less than 12 months 1 |
|
12 months or more 1 |
|
Total |
|
||||||
|
|
|
Fair
|
|
Unrealized
|
|
Fair
|
|
Unrealized
|
|
Fair
|
|
Unrealized
|
|
|
Corporate bonds |
|
|
|
|
|
|
|
|
|
|
|
|
|
|
Asset-backed securities |
|
$19 |
|
$— |
|
$19 |
|
$4 |
|
$38 |
|
$4 |
|
|
|
|
|
|
|
|
|
|
|
|
|
|
|
|
|
Mortgage-backed debt securities |
|
|
|
|
|
|
|
|
|
|
|
|
|
|
Residential mortgage-backed securities |
|
2 |
|
— |
|
25 |
|
4 |
|
27 |
|
4 |
|
|
Commercial mortgage-backed securities |
|
3 |
|
— |
|
14 |
|
1 |
|
17 |
|
1 |
|
|
|
|
|
|
|
|
|
|
|
|
|
|
|
|
|
Equity securities |
|
|
|
|
|
|
|
|
|
|
|
|
|
|
Large capitalization value |
|
14 |
|
1 |
|
12 |
|
2 |
|
26 |
|
3 |
|
|
Total |
|
$38 |
|
$1 |
|
$70 |
|
$11 |
|
$108 |
|
$12 |
|
|
1 Indicates length of time that individual securities have been in a continuous unrealized loss position. |
|
|
Corporate Bonds. The unrealized losses on our investments in corporate bonds and asset-backed securities relate primarily to changes in interest rates and credit-related yield spreads since time of purchase. We do not intend to sell the investments and it is not likely that we will be required to sell the investments before recovery of their amortized cost basis. We do not consider these investments to be other-than-temporarily impaired as of September 30, 2011.
Equity Securities. Cat Insurance maintains a well-diversified equity portfolio consisting of two specific mandates: large capitalization value stocks and smaller company growth stocks. U.S. equity valuations were notably lower for the three months ended September 30, 2011 due to concerns over Europe’s debt crisis and a potential global slowdown. In each case where unrealized losses exist, we believe the respective company’s management is taking corrective action in order to increase shareholder value. We do not consider these investments to be other-than-temporarily impaired as of September 30, 2011.
The fair value of the available-for-sale debt securities at September 30, 2011, by contractual maturity, is shown below. Expected maturities will differ from contractual maturities because borrowers may have the right to prepay and creditors may have the right to call obligations.
|
(Millions of dollars) |
|
Fair Value |
|
|
Due in one year or less |
|
$78 |
|
|
Due after one year through five years |
|
$465 |
|
|
Due after five years through ten years |
|
$211 |
|
|
Due after ten years |
|
$481 |
|
|
|
|
|
|
|
|
|
|
|
|
|
||||
|
Sales of Securities |
|
|
|
|
|
||||
|
|
|
Three Months Ended September 30, |
|
Nine Months Ended
|
|
||||
|
(Millions of dollars) |
|
2011 |
|
2010 |
|
2011 |
|
2010 |
|
|
Proceeds from the sale of available-for-sale securities |
|
$58 |
|
$51 |
|
$180 |
|
$141 |
|
|
Gross gains from the sale of available-for-sale securities |
|
$1 |
|
$— |
|
$3 |
|
$1 |
|
|
Gross losses from the sale of available-for-sale securities |
|
$— |
|
$— |
|
$1 |
|
$— |
|
|
|
|
|
|
|
|
|
|
|
|
9. Postretirement Benefits
A. Pension and postretirement benefit costs
As announced in August 2010, on January 1, 2011, our retirement benefits for U.S. support and management employees began transitioning from defined benefit pension plans to defined contribution plans. The transition date was determined for each employee based upon age and years of service or proximity to retirement. Pension benefit accruals were frozen for certain employees on December 31, 2010, and will freeze for remaining employees on December 31, 2019. As of these dates employees will move to the new retirement benefit that will provide a frozen pension benefit and a 401(k) plan that will include a matching contribution and a new annual employer contribution. The plan change required a re-measurement as of August 31, 2010, which resulted in an increase in our Liability for postemployment benefits of $1.32 billion and a decrease in Accumulated other comprehensive income (loss) of $831 million net of tax. The increase in the liability was due to a decline in the discount rate and lower than expected asset returns at the re-measurement date. Curtailment expense of $28 million was also recognized for the three and nine months ended September 30, 2010 as a result of the plan change.
In March 2010, the Patient Protection and Affordable Care Act (the PPACA) and the Health Care and Education Reconciliation Act of 2010 (H.R. 4872) which amends certain provisions of the PPACA were signed into law. As discussed in Note 13, the Medicare Part D retiree drug subsidies effectively become taxable beginning in 2013.
|
(Millions of dollars) |
|
U.S. Pension
|
|
Non-U.S. Pension
|
|
Other
|
|
||||||
|
|
|
September 30, |
|
September 30, |
|
September 30, |
|
||||||
|
|
|
2011 |
|
2010 |
|
2011 |
|
2010 |
|
2011 |
|
2010 |
|
|
For the three months ended: |
|
|
|
|
|
|
|
|
|
|
|
|
|
|
Components of net periodic benefit cost: |
|
|
|
|
|
|
|
|
|
|
|
|
|
|
Service cost |
|
$41 |
|
$53 |
|
$28 |
|
$23 |
|
$21 |
|
$17 |
|
|
Interest cost |
|
164 |
|
162 |
|
45 |
|
42 |
|
64 |
|
62 |
|
|
Expected return on plan assets |
|
(200) |
|
(193) |
|
(50) |
|
(50) |
|
(18) |
|
(24) |
|
|
Amortization of: |
|
|
|
|
|
|
|
|
|
|
|
|
|
|
Transition obligation (asset) |
|
— |
|
— |
|
— |
|
— |
|
1 |
|
— |
|
|
Prior service cost (credit) 1 |
|
5 |
|
6 |
|
1 |
|
1 |
|
(14) |
|
(14) |
|
|
Net actuarial loss (gain) |
|
112 |
|
96 |
|
18 |
|
17 |
|
27 |
|
9 |
|
|
Net periodic benefit cost |
|
122 |
|
124 |
|
42 |
|
33 |
|
81 |
|
50 |
|
|
Curtailments, settlements and special termination benefits 2 |
|
— |
|
28 |
|
— |
|
9 |
|
— |
|
— |
|
|
Total cost included in operating profit |
|
$122 |
|
$152 |
|
$42 |
|
$42 |
|
$81 |
|
$50 |
|
|
For the nine months ended: |
|
|
|
|
|
|
|
|
|
|
|
|
|
|
Components of net periodic benefit cost: |
|
|
|
|
|
|
|
|
|
|
|
|
|
|
Service cost |
|
$118 |
|
$150 |
|
$83 |
|
$69 |
|
$62 |
|
$50 |
|
|
Interest cost |
|
488 |
|
495 |
|
132 |
|
124 |
|
190 |
|
184 |
|
|
Expected return on plan assets |
|
(598) |
|
(574) |
|
(150) |
|
(148) |
|
(53) |
|
(70) |
|
|
Amortization of: |
|
|
|
|
|
|
|
|
|
|
|
|
|
|
Transition obligation (asset) |
|
— |
|
— |
|
— |
|
— |
|
2 |
|
1 |
|
|
Prior service cost (credit) 1 |
|
15 |
|
20 |
|
2 |
|
1 |
|
(41) |
|
(41) |
|
|
Net actuarial loss (gain) |
|
338 |
|
271 |
|
54 |
|
51 |
|
81 |
|
25 |
|
|
Net periodic benefit cost |
|
361 |
|
362 |
|
121 |
|
97 |
|
241 |
|
149 |
|
|
Curtailments, settlements and special termination benefits 2 |
|
— |
|
28 |
|
9 |
|
17 |
|
— |
|
— |
|
|
Total cost included in operating profit |
|
$361 |
|
$390 |
|
$130 |
|
$114 |
|
$241 |
|
$149 |
|
|
|
|
|
|
|
|
|
|
|
|
|
|
|
|
|
Weighted-average assumptions used to determine net cost: |
|
|
|
|
|
|
|
|
|
|
|
||
|
Discount rate |
|
5.1% |
|
5.6% |
|
4.6% |
|
4.8% |
|
5.0% |
|
5.6% |
|
|
Expected return on plan assets |
|
8.5% |
|
8.5% |
|
7.1% |
|
7.0% |
|
8.5% |
|
8.5% |
|
|
Rate of compensation increase |
|
4.5% |
|
4.5% |
|
4.2% |
|
4.2% |
|
4.4% |
|
4.4% |
|
1 Prior service costs for both pension and other postretirement benefits are generally amortized using the straight-line method over the average remaining service period to the full retirement eligibility date of employees expected to receive benefits from the plan amendment. For other postretirement benefit plans in which all or almost all of the plan’s participants are fully eligible for benefits under the plan, prior service costs are amortized using the straight-line method over the remaining life expectancy of those participants.
2 Curtailments, settlements and special termination benefits were recognized in Other operating (income) expenses in the Consolidated Statement of Results of Operations.
We made $105 million and $340 million of contributions to our U.S. and non-U.S. pension plans during the three and nine months ended September 30, 2011, respectively. We currently anticipate full-year 2011 contributions of approximately $440 million. We made $409 million and $957 million of contributions to our U.S. and non-U.S. pension plans during the three and nine months ended September 30, 2010, respectively.
B. Defined contribution benefit costs
From June 2009 to October 2010, we funded our employer matching contribution for certain U.S. defined contribution plans in Caterpillar stock, held as treasury stock. For the three and nine months ended September 30, 2010, we made $31 million (0.5 million shares) and $93 million (1.5 million shares) of matching contributions in Caterpillar stock, respectively.
On January 1, 2011, matching contributions to our U.S. 401(k) plan changed for certain employees that are still accruing benefits under a defined benefit pension plan. Matching contributions changed from 100% of employee contributions to the plan up to six percent of their compensation to 50% of employee contributions up to six percent of compensation. For employees whose defined benefit pension accruals were frozen as of December 31, 2010, we began providing a new annual employer contribution in 2011, which ranges from three to five percent of compensation, depending on years of service and age.
Total company costs related to U.S. and non-U.S. defined contribution plans were as follows:
|
|
|
Three Months Ended September 30, |
|
Nine Months Ended September 30, |
|
||||
|
(Millions of dollars) |
|
2011 |
|
2010 |
|
2011 |
|
2010 |
|
|
U.S. Plans |
|
$3 |
|
$77 |
|
$135 |
|
$160 |
|
|
Non-U.S. Plans |
|
14 |
|
8 |
|
40 |
|
24 |
|
|
|
|
$17 |
|
$85 |
|
$175 |
|
$184 |
|
|
|
|
|
|
|
|
|
|
|
|
10. Guarantees and Product Warranty
We have provided an indemnity to a third-party insurance company for potential losses related to performance bonds issued on behalf of Caterpillar dealers. The bonds are issued to insure governmental agencies against nonperformance by certain dealers. We also provided guarantees to a third party related to the performance of contractual obligations by certain Caterpillar dealers. The guarantees cover potential financial losses incurred by the third party resulting from the dealers’ nonperformance.
We provide loan guarantees to third-party lenders for financing associated with machinery purchased by customers. These guarantees have varying terms and are secured by the machinery. In addition, Cat Financial participates in standby letters of credit issued to third parties on behalf of their customers. These standby letters of credit have varying terms and beneficiaries and are secured by customer assets.
Cat Financial has provided a limited indemnity to a third-party bank resulting from the assignment of certain leases to that bank. The indemnity is for the possibility that the insurers of these leases would become insolvent. The indemnity expires December 15, 2012 and is unsecured.
No loss has been experienced or is anticipated under any of these guarantees. At September 30, 2011 and December 31, 2010, the related liability was $7 million and $10 million, respectively. The maximum potential amount of future payments (undiscounted and without reduction for any amounts that may possibly be recovered under recourse or collateralized provisions) we could be required to make under the guarantees are as follows:
|
(Millions of dollars) |
|
September 30, |
|
December 31, |
|
|
|
|
2011 |
|
2010 |
|
|
Guarantees with Caterpillar dealers |
|
$149 |
|
$185 |
|
|
Guarantees with customers |
|
155 |
|
170 |
|
|
Limited indemnity |
|
12 |
|
17 |
|
|
Guarantees – other |
|
29 |
|
48 |
|
|
Total guarantees |
|
$345 |
|
$420 |
|
|
|
|
|
|
|
|
Cat Financial provides guarantees to repurchase certain loans of Caterpillar dealers from a special-purpose corporation (SPC) that qualifies as a variable interest entity. The purpose of the SPC is to provide short-term working capital loans to Caterpillar dealers. This SPC issues commercial paper and uses the proceeds to fund its loan program. Cat Financial has a loan purchase agreement with the SPC that obligates Cat Financial to purchase certain loans that are not paid at maturity. Cat Financial receives a fee for providing this guarantee, which provides a source of liquidity for the SPC. Cat Financial is the primary beneficiary of the SPC as our guarantees result in Cat Financial having both the power to direct the activities that most significantly impact the SPC’s economic performance and the obligation to absorb losses, and therefore Cat Financial has consolidated the financial statements of the SPC. As of September 30, 2011 and December 31, 2010, the SPC’s assets of $579 million and $365 million, respectively, are primarily comprised of loans to dealers and the SPC’s liabilities of $579 million and $365 million, respectively are primarily comprised of commercial paper. No loss has been experienced or is anticipated under this loan purchase agreement. Cat Financial’s assets are not available to pay creditors of the SPC, except to the extent Cat Financial may be obligated to perform under the guarantee, and assets of the SPC are not available to pay Cat Financial’s creditors.
Our product warranty liability is determined by applying historical claim rate experience to the current field population and dealer inventory. Generally, historical claim rates are based on actual warranty experience for each product by machine model/engine size. Specific rates are developed for each product build month and are updated monthly based on actual warranty claim experience. During the third quarter of 2011, the increase in liability (new warranties) included approximately $177 million due to the purchase of Bucyrus.
|
(Millions of dollars) |
|
2011 |
|
|
Warranty liability, January 1 |
|
$1,035 |
|
|
Reduction in liability (payments) |
|
(673) |
|
|
Increase in liability (new warranties) |
|
933 |
|
|
Warranty liability, September 30 |
|
$1,295 |
|
|
|
|
|
|
|
(Millions of dollars) |
|
2010 |
|
|
Warranty liability, January 1 |
|
$1,049 |
|
|
Reduction in liability (payments) |
|
(855) |
|
|
Increase in liability (new warranties) |
|
841 |
|
|
Warranty liability, December 31 |
|
$1,035 |
|
|
|
|
|
|
11. Computations of Profit Per Share
|
(Dollars in millions except per share data) |
|
Three Months Ended
|
|
Nine Months Ended
|
|
|||||
|
|
|
2011 |
|
2010 |
|
2011 |
|
2010 |
|
|
|
I. |
Profit (loss) for the period (A) 1 : |
|
$1,141 |
|
$792 |
|
$3,381 |
|
$1,732 |
|
|
|
|
|
|
|
|
|
|
|
|
|
|
II. |
Determination of shares (in millions): |
|
|
|
|
|
|
|
|
|
|
|
Weighted-average number of common shares outstanding (B) |
|
646.6 |
|
632.6 |
|
644.3 |
|
629.6 |
|
|
|
Shares issuable on exercise of stock awards, net of shares assumed to be purchased out of proceeds at average market price |
|
19.4 |
|
19.0 |
|
21.8 |
|
17.4 |
|
|
|
Average common shares outstanding for fully diluted computation (C) 2 |
|
666.0 |
|
651.6 |
|
666.1 |
|
647.0 |
|
|
|
|
|
|
|
|
|
|
|
|
|
|
III. |
Profit (loss) per share of common stock: |
|
|
|
|
|
|
|
|
|
|
|
Assuming no dilution (A/B) |
|
$1.76 |
|
$1.25 |
|
$5.25 |
|
$2.75 |
|
|
|
Assuming full dilution (A/C) 2 |
|
$1.71 |
|
$1.22 |
|
$5.08 |
|
$2.68 |
|
|
|
||||||||||
|
1 Profit (loss) attributable to common stockholders. 2 Diluted by assumed exercise of stock-based compensation awards using the treasury stock method.
|
||||||||||
SARs and stock options to purchase 2,904,815 common shares were outstanding for both the three and nine months ended September 30, 2011, but were not included in the computation of diluted earnings per share because the effect would have been anti-dilutive. For the three and nine months ended September 30, 2010, there were outstanding SARs and stock options to purchase 4,853,298 and 21,652,360 common shares, respectively, but were not included in the computation of diluted earnings per share because the effect would have been anti-dilutive.
12. Environmental and Legal Matters
The company is regulated by federal, state and international environmental laws governing our use, transport and disposal of substances and control of emissions. In addition to governing our manufacturing and other operations, these laws often impact the development of our products, including, but not limited to, required compliance with air emissions standards applicable to internal combustion engines. Compliance with these existing laws has not had a material impact on our capital expenditures, earnings or global competitive position.
We are engaged in remedial activities at a number of locations, often with other companies, pursuant to federal and state laws. When it is probable we will pay remedial costs at a site and those costs can be reasonably estimated, the costs are charged against our earnings. In formulating that estimate, we do not consider amounts expected to be recovered from insurance companies or others. The amount recorded for environmental remediation is not material and is included in Accrued expenses in the Consolidated Statement of Financial Position.
We cannot reasonably estimate costs at sites in the very early stages of remediation. Currently, we have a few sites in the very early stages of remediation, and there is no more than a remote chance that a material amount for remedial activities at any individual site, or at all sites in the aggregate, will be required.
We have disclosed certain individual legal proceedings in this filing. Additionally, we are involved in other unresolved legal actions that arise in the normal course of business. The most prevalent of these unresolved actions involve disputes related to product design, manufacture and performance liability (including claimed asbestos and welding fumes exposure), contracts, employment issues, environmental matters or intellectual property rights. The aggregate range of reasonably possible losses in excess of accrued liabilities, if any, associated with these unresolved legal actions is not material. In some cases, we cannot reasonably estimate a range of loss because there is insufficient information regarding the matter. However, there is no more than a remote chance that any liability arising from these matters would be material. Although it is not possible to predict with certainty the outcome of these unresolved legal actions, we believe that these actions will not individually or in the aggregate have a material adverse effect on our consolidated results of operations, financial position or liquidity.
On May 14, 2007, the U.S. Environmental Protection Agency (EPA) issued a Notice of Violation to Caterpillar Inc., alleging various violations of Clean Air Act Sections 203, 206 and 207. EPA claims that Caterpillar violated such sections by shipping engines and catalytic converter after-treatment devices separately, introducing into commerce a number of uncertified and/or misbuilt engines, and failing to timely report emissions-related defects. On July 9, 2010, the Department of Justice issued a penalty demand to Caterpillar seeking a civil penalty of $3.2 million and implementation of injunctive relief involving expanded use of certain technologies. On July 28, 2011, EPA and the U.S. Department of Justice filed and lodged a civil complaint and consent decree with the U.S. District Court for the District of Columbia (Court) regarding the matter. Caterpillar has agreed to the terms of the consent decree, which require payment of a civil penalty of $2.55 million, retirement of a small number of emissions credits and expanded defect-related reporting. On September 7, 2011, the Court entered the consent decree, making it effective on that date, and Caterpillar has paid the penalty due to the United States in accordance with the decree terms. Under the terms of the consent decree, and subject to a settlement agreement, $510,000 of the stipulated $2.55 million penalty will be paid to the California Air Resources Board relating to engines covered by the consent decree that were placed into service in California.
On February 8, 2009, an incident at Caterpillar’s Joliet, Illinois facility resulted in the release of approximately 3,000 gallons of wastewater into the Des Plaines River. In coordination with state and federal authorities, appropriate remediation measures have been taken. On February 23, 2009, the Illinois Attorney General filed a Complaint in Will County Circuit Court containing seven counts of violations of state environmental laws and regulations. Caterpillar settled this matter with the State of Illinois in 2010, resolving all allegations in the Complaint. This settlement does not have a material adverse impact on our consolidated results of operations, financial position, or liquidity. In addition, on March 5, 2009, the EPA served Caterpillar with a Notice of Intent to file a Civil Administrative Action (notice), indicating the EPA’s intent to seek civil penalties for alleged violations of the Clean Water Act and Oil Pollution Act. On January 25, 2010, the EPA issued a revised notice seeking civil penalties in the amount of $167,800. Caterpillar settled this matter with the EPA on July 12, 2011, resolving all allegations in the notice. This settlement did not have a material adverse impact on our consolidated results of operations, financial position or liquidity.
In May 2010, an incident at Caterpillar’s Gosselies, Belgium facility resulted in the release of wastewater into the Perupont River. In coordination with local authorities, appropriate remediation measures have been taken. In January 2011, Caterpillar learned that the public prosecutor for the Belgian administrative district of Charleroi had referred the matter to an examining magistrate of the civil court of Charleroi for further investigation. Caterpillar is cooperating with the Belgian authorities on this investigation. At this time, it is unlikely that penalties will be assessed, and any penalties are unlikely to exceed $100,000. Management does not believe this matter will have a material adverse impact on our consolidated results of operations, financial position or liquidity.
13. Income Taxes
The provision for income taxes reflects an estimated annual effective tax rate of 29 percent for the first nine months of 2011 compared to 28 percent for the first nine months of 2010, excluding the discrete items discussed below. The 2011 estimated annual effective tax rate of 29 percent is higher than the comparable full-year 2010 rate of 25 percent primarily due to an expected change in our geographic mix of profits from a tax perspective.
The provision for income taxes for 2011 also includes a benefit of $113 million due to planned repatriation of non-U.S. earnings with available foreign tax credits in excess of the U.S. tax liability on the dividend offset by a $41 million increase in prior year unrecognized tax benefits. The 2010 provision for income taxes included a charge of $90 million due to the enactment of U.S. healthcare legislation, effectively making government subsidies received for Medicare equivalent prescription drug coverage taxable, offset by a $34 million benefit related to the recognition of refund claims for prior tax years and a $26 million benefit for the release of a valuation allowance.
It is reasonably possible that changes in the amount of valuation allowances against deferred tax assets of certain non-U.S. entities may be required in the next twelve months.
14. Segment Information
A. Basis for segment information
In the first quarter of 2011, we implemented revised internal financial measurements in line with changes to our organizational structure that were announced during 2010. Our previous structure used a matrix organization comprised of multiple profit and cost center divisions. There were twenty-five operating segments, twelve of which were reportable segments. These segments were led by vice-presidents that were managed by Caterpillar’s Executive Office (comprised of our CEO and Group Presidents), which served as our Chief Operating Decision Maker. As part of the strategy revision, Group Presidents were given accountability for a related set of end-to-end businesses that they manage, a significant change for the company. The CEO allocates resources and manages performance at the Group President level. As such, the CEO now serves as our Chief Operating Decision Maker and operating segments are primarily based on the Group President reporting structure.
Three of our operating segments, Construction Industries, Resource Industries and Power Systems, are led by Group Presidents. One operating segment, Financial Products, is led by a Group President who has responsibility for Corporate Services. Corporate Services is a cost center primarily responsible for the performance of certain support functions globally and to provide centralized services; it does not meet the definition of an operating segment. One Group President leads three smaller operating segments that are included in All Other operating segments.
The segment information for 2010 has been retrospectively adjusted to conform to the 2011 presentation.
B. Description of segments
We have seven operating segments, of which four are reportable segments. Following is a brief description of our reportable segments and the business activities included in all other operating segments:
Construction Industries : A segment primarily responsible for supporting customers using machinery in infrastructure and building construction applications. Responsibilities include business strategy, product design, product management and development, manufacturing, marketing, sales and product support. The product portfolio includes backhoe loaders, small wheel loaders, small track-type tractors, skid steer loaders, multi-terrain loaders, mini excavators, compact wheel loaders, select work tools, small, medium and large track excavators, wheel excavators, medium wheel loaders, medium track-type tractors, track-type loaders, motor graders, pipelayers and related parts. In addition, Construction Industries has responsibility for Power Systems and components in Japan and an integrated manufacturing cost center that supports Machinery and Power Systems businesses. Inter-segment sales are a source of revenue for this segment.
Resource Industries : A segment primarily responsible for supporting customers using machinery in mining and quarrying applications. Responsibilities include business strategy, product design, product management and development, manufacturing, marketing and sales and product support. The product portfolio includes large track-type tractors, large mining trucks, underground mining equipment, tunnel boring equipment, large wheel loaders, quarry and construction trucks, articulated trucks, wheel tractor scrapers, wheel dozers, compactors, select work tools, forestry products, paving products, machinery components and electronics and control systems. In addition, Resource Industries manages areas that provide services to other parts of the company, including integrated manufacturing, research and development and coordination of the Caterpillar Production System. On July 8, 2011, the acquisition of Bucyrus was completed. This added the responsibility for business strategy, product design, product management and development, manufacturing, marketing and sales and product support for electric rope shovels, draglines, hydraulic shovels, drills, highwall miners and large electric drive mining trucks to Resource Industries. In addition, Bucyrus acquisition costs impacting operating profit are included in this segment. Inter-segment sales are a source of revenue for this segment.
Power Systems : A segment primarily responsible for supporting customers using reciprocating engines, turbines and related parts across industries serving electric power, industrial, petroleum and marine applications as well as rail-related businesses. Responsibilities include business strategy, product design, product management and development, manufacturing, marketing, sales and product support of reciprocating engine powered generator sets, integrated systems used in the electric power generation industry, reciprocating engines and integrated systems and solutions for the marine and petroleum industries; reciprocating engines supplied to the industrial industry as well as Caterpillar machinery; the business strategy, product design, product management and development, manufacturing, marketing, sales and product support of turbines and turbine related services; the business strategy, product design, product management and development, manufacturing, remanufacturing, maintenance, marketing, sales, leasing and service of diesel-electric locomotives and components and other rail-related products and services . Inter-segment sales are a source of revenue for this segment.
Financial Products Segment : Provides financing to customers and dealers for the purchase and lease of Caterpillar and other equipment, as well as some financing for Caterpillar sales to dealers. Financing plans include operating and finance leases, installment sale contracts, working capital loans and wholesale financing plans. The division also provides various forms of insurance to customers and dealers to help support the purchase and lease of our equipment.
All Other : Primarily includes activities such as: the remanufacturing of Cat engines and components and remanufacturing services for other companies as well as the business strategy, product management, development, manufacturing, marketing and product support of undercarriage, specialty products, hardened bar stock components and ground engaging tools primarily for Caterpillar products; logistics services for Caterpillar and other companies; the product management, development, marketing, sales and product support of on-highway vocational trucks for North America (U.S. & Canada only); distribution services responsible for dealer development and administration, dealer portfolio management and ensuring the most efficient and effective distribution of machines, engines and parts; and the 50/50 joint venture with Navistar (NC 2 ) until it became a wholly owned subsidiary of Navistar effective September 29, 2011. Inter-segment sales are a source of revenue for this segment. Results for All Other operating segments are included as reconciling items between reportable segments and consolidated external reporting.
C. Segment measurement and reconciliations
There are several methodology differences between our segment reporting and our external reporting. The following is a list of the more significant methodology differences:
· Machinery and Power Systems segment net assets generally include inventories, receivables, property, plant and equipment, goodwill, intangibles and accounts payable. Liabilities other than accounts payable are generally managed at the corporate level and are not included in segment operations. Financial Products Segment assets generally include all categories of assets.
· Segment inventories and cost of sales are valued using a current cost methodology.
· Goodwill is amortized using a fixed amount based on a twenty year useful life. This methodology difference only impacts segment assets; no goodwill amortization expense is included in segment profit.
· The present value of future lease payments for certain Machinery and Power Systems operating leases is included in segment assets. The estimated financing component of the lease payments is excluded.
· Currency exposures for Machinery and Power Systems are generally managed at the corporate level and the effects of changes in exchange rates on results of operations within the year are not included in segment profit. The net difference created in the translation of revenues and costs between exchange rates used for U.S. GAAP reporting and exchange rates used for segment reporting are recorded as a methodology difference.
· Postretirement benefit expenses are split; segments are generally responsible for service and prior service costs, with the remaining elements of net periodic benefit cost included as a methodology difference.
· Machinery and Power Systems segment profit is determined on a pretax basis and excludes interest expense, gains and losses on interest rate swaps and other income/expense items. Financial Products Segment profit is determined on a pretax basis and includes other income/expense items.
Reconciling items are created based on accounting differences between segment reporting and our consolidated external reporting. Please refer to pages 29 to 34 for financial information regarding significant reconciling items. Most of our reconciling items are self-explanatory given the above explanations. For the reconciliation of profit (loss), we have grouped the reconciling items as follows:
· Corporate costs: These costs are related to corporate requirements and strategies that are considered to be for the benefit of the entire organization.
· Methodology differences: See previous discussion of significant accounting differences between segment reporting and consolidated external reporting.
· Timing: Timing differences in the recognition of costs between segment reporting and consolidated external reporting.
Reportable Segments
Three Months Ended September 30,
(Millions of dollars)
|
|
|
|
|
||||||||||||
|
|
|
2011 |
|
||||||||||||
|
|
|
External
|
|
Inter-
|
|
Total sales
|
|
Depreciation
|
|
Segment
|
|
Segment
|
|
Capital
|
|
|
Construction Industries |
|
$4,900 |
|
$162 |
|
$5,062 |
|
$136 |
|
$496 |
|
$7,390 |
|
$234 |
|
|
Resource Industries |
|
4,599 |
|
290 |
|
4,889 |
|
155 |
|
745 |
|
14,903 |
|
159 |
|
|
Power Systems |
|
5,075 |
|
600 |
|
5,675 |
|
133 |
|
794 |
|
8,216 |
|
279 |
|
|
Machinery and Power Systems |
|
$14,574 |
|
$1,052 |
|
$15,626 |
|
$424 |
|
$2,035 |
|
$30,509 |
|
$672 |
|
|
Financial Products Segment |
|
757 |
|
— |
|
757 |
|
177 |
|
145 |
|
31,116 |
|
311 |
|
|
Total |
|
$15,331 |
|
$1,052 |
|
$16,383 |
|
$601 |
|
$2,180 |
|
$61,625 |
|
$983 |
|
|
|
|
|
|
|
|
|
|
|
|
|
|
|
|
|
|
|
|
|
|
|
|
|
|
|
|
|
|
|
|
|
|
|
|
|
|
2010 |
|
||||||||||||
|
|
|
External
|
|
Inter-
|
|
Total sales
|
|
Depreciation
|
|
Segment
|
|
Segment
|
|
Capital
|
|
|
Construction Industries |
|
$3,466 |
|
$179 |
|
$3,645 |
|
$123 |
|
$246 |
|
$6,927 |
|
$124 |
|
|
Resource Industries |
|
2,262 |
|
206 |
|
2,468 |
|
70 |
|
538 |
|
3,892 |
|
68 |
|
|
Power Systems |
|
4,196 |
|
485 |
|
4,681 |
|
132 |
|
694 |
|
8,321 |
|
92 |
|
|
Machinery and Power Systems |
|
$9,924 |
|
$870 |
|
$10,794 |
|
$325 |
|
$1,478 |
|
$19,140 |
|
$284 |
|
|
Financial Products Segment |
|
737 |
|
— |
|
737 |
|
175 |
|
108 |
|
30,346 |
|
290 |
|
|
Total |
|
$10,661 |
|
$870 |
|
$11,531 |
|
$500 |
|
$1,586 |
|
$49,486 |
|
$574 |
|
|
|
|
|
|
|
|
|
|
|
|
|
|
|
|
|
|
Reportable Segments
Nine Months Ended September 30,
(Millions of dollars)
|
|
|
2011 |
|
||||||||||||
|
|
|
External
|
|
Inter-
|
|
Total sales
|
|
Depreciation
|
|
Segment
|
|
Segment
|
|
Capital
|
|
|
Construction Industries |
|
$14,312 |
|
$433 |
|
$14,745 |
|
$382 |
|
$1,522 |
|
$7,390 |
|
$471 |
|
|
Resource Industries |
|
10,573 |
|
848 |
|
11,421 |
|
298 |
|
2,337 |
|
14,903 |
|
320 |
|
|
Power Systems |
|
14,442 |
|
1,695 |
|
16,137 |
|
398 |
|
2,230 |
|
8,216 |
|
496 |
|
|
Machinery and Power Systems |
|
$39,327 |
|
$2,976 |
|
$42,303 |
|
$1,078 |
|
$6,089 |
|
$30,509 |
|
$1,287 |
|
|
Financial Products Segment |
|
2,251 |
|
— |
|
2,251 |
|
535 |
|
453 |
|
31,116 |
|
830 |
|
|
Total |
|
$41,578 |
|
$2,976 |
|
$44,554 |
|
$1,613 |
|
$6,542 |
|
$61,625 |
|
$2,117 |
|
|
|
|
2010 |
|
||||||||||||
|
|
|
External
|
|
Inter-
|
|
Total sales
|
|
Depreciation
|
|
Segment
|
|
Segment
|
|
Capital
|
|
|
Construction Industries |
|
$9,469 |
|
$481 |
|
$9,950 |
|
$377 |
|
$496 |
|
$6,927 |
|
$288 |
|
|
Resource Industries |
|
5,860 |
|
552 |
|
6,412 |
|
210 |
|
1,183 |
|
3,892 |
|
139 |
|
|
Power Systems |
|
10,873 |
|
1,129 |
|
12,002 |
|
358 |
|
1,580 |
|
8,321 |
|
274 |
|
|
Machinery and Power Systems |
|
$26,202 |
|
$2,162 |
|
$28,364 |
|
$945 |
|
$3,259 |
|
$19,140 |
|
$701 |
|
|
Financial Products Segment |
|
2,220 |
|
— |
|
2,220 |
|
538 |
|
324 |
|
30,346 |
|
677 |
|
|
Total |
|
$28,422 |
|
$2,162 |
|
$30,584 |
|
$1,483 |
|
$3,583 |
|
$49,486 |
|
$1,378 |
|
|
Reconciliation of Sales and revenues: |
|
|
|
|
|
|
|
|
|
|
(Millions of dollars) |
|
Machinery
|
|
Financial
|
|
Consolidating
|
|
Consolidated
|
|
|
Three Months Ended September 30, 2011: |
|
|
|
|
|
|
|
|
|
|
Total external sales and revenues from reportable segments |
|
$14,574 |
|
$757 |
|
$— |
|
$15,331 |
|
|
All other operating segments |
|
461 |
|
— |
|
— |
|
461 |
|
|
Other |
|
(12) |
|
17 |
|
(81) 1 |
|
(76) |
|
|
Total sales and revenues |
|
$15,023 |
|
$774 |
|
$(81) |
|
$15,716 |
|
|
|
|
|
|
|
|
|
|
|
|
|
Three Months Ended September 30, 2010: |
|
|
|
|
|
|
|
|
|
|
Total external sales and revenues from reportable segments |
|
$9,924 |
|
$737 |
|
$— |
|
$10,661 |
|
|
All other operating segments |
|
550 |
|
— |
|
— |
|
550 |
|
|
Other |
|
(22) |
|
12 |
|
(67) 1 |
|
(77) |
|
|
Total sales and revenues |
|
$10,452 |
|
$749 |
|
$(67) |
|
$11,134 |
|
1 Elimination of Financial Products revenues from Machinery and Power Systems.
|
Reconciliation of Sales and revenues: |
|
|
|
|
|
|
|
|
|
|
(Millions of dollars) |
|
Machinery
|
|
Financial
|
|
Consolidating
|
|
Consolidated
|
|
|
Nine Months Ended September 30, 2011: |
|
|
|
|
|
|
|
|
|
|
Total external sales and revenues from reportable segments |
|
$39,327 |
|
$2,251 |
|
$— |
|
$41,578 |
|
|
All other operating segments |
|
1,525 |
|
— |
|
— |
|
1,525 |
|
|
Other |
|
(17) |
|
40 |
|
(231) 1 |
|
(208) |
|
|
Total sales and revenues |
|
$40,835 |
|
$2,291 |
|
$(231) |
|
$42,895 |
|
|
|
|
|
|
|
|
|
|
|
|
|
Nine Months Ended September 30, 2010: |
|
|
|
|
|
|
|
|
|
|
Total external sales and revenues from reportable segments |
|
$26,202 |
|
$2,220 |
|
$— |
|
$28,422 |
|
|
All other operating segments |
|
1,573 |
|
— |
|
— |
|
1,573 |
|
|
Other |
|
(49) |
|
28 |
|
(193) 1 |
|
(214) |
|
|
Total sales and revenues |
|
$27,726 |
|
$2,248 |
|
$(193) |
|
$29,781 |
|
1 Elimination of Financial Products revenues from Machinery and Power Systems.
|
Reconciliation of Consolidated profit (loss) before taxes: |
|
|
|
|
|
|
|
|
(Millions of dollars) |
|
Machinery
|
|
Financial
|
|
Consolidated
|
|
|
Three Months Ended September 30, 2011: |
|
|
|
|
|
|
|
|
Total profit from reportable segments |
|
$2,035 |
|
$145 |
|
$2,180 |
|
|
All other operating segments |
|
234 |
|
— |
|
234 |
|
|
Cost centers |
|
30 |
|
— |
|
30 |
|
|
Corporate costs |
|
(332) |
|
— |
|
(332) |
|
|
Timing |
|
12 |
|
— |
|
12 |
|
|
Methodology differences: |
|
|
|
|
|
|
|
|
Inventory/cost of sales |
|
(21) |
|
— |
|
(21) |
|
|
Postretirement benefit expense |
|
(110) |
|
— |
|
(110) |
|
|
Financing costs |
|
(116) |
|
— |
|
(116) |
|
|
Equity in profit of unconsolidated affiliated companies |
|
6 |
|
— |
|
6 |
|
|
Currency |
|
(188) |
|
— |
|
(188) |
|
|
Other income/expense methodology differences |
|
(54) |
|
— |
|
(54) |
|
|
Other methodology differences |
|
(7) |
|
— |
|
(7) |
|
|
Total profit (loss) before taxes |
|
$1,489 |
|
$145 |
|
$1,634 |
|
|
|
|
|
|
|
|
|
|
|
Three Months Ended September 30, 2010: |
|
|
|
|
|
|
|
|
Total profit from reportable segments |
|
$1,478 |
|
$108 |
|
$1,586 |
|
|
All other operating segments |
|
200 |
|
— |
|
200 |
|
|
Cost centers |
|
(3) |
|
— |
|
(3) |
|
|
Corporate costs |
|
(238) |
|
— |
|
(238) |
|
|
Timing |
|
(97) |
|
— |
|
(97) |
|
|
Methodology differences: |
|
|
|
|
|
|
|
|
Postretirement benefit expense |
|
(224) |
|
— |
|
(224) |
|
|
Financing costs |
|
(79) |
|
— |
|
(79) |
|
|
Equity in profit of unconsolidated affiliated companies |
|
7 |
|
— |
|
7 |
|
|
Currency |
|
(22) |
|
— |
|
(22) |
|
|
Interest rate swaps |
|
(1) |
|
— |
|
(1) |
|
|
Other income/expense methodology differences |
|
(29) |
|
— |
|
(29) |
|
|
Other methodology differences |
|
1 |
|
2 |
|
3 |
|
|
Total profit (loss) before taxes |
|
$993 |
|
$110 |
|
$1,103 |
|
|
|
|
|
|
|
|
|
|
|
Reconciliation of Consolidated profit (loss) before taxes: |
|
|
|
|
|
|
|
|
(Millions of dollars) |
|
Machinery
|
|
Financial
|
|
Consolidated
|
|
|
Nine Months Ended September 30, 2011: |
|
|
|
|
|
|
|
|
Total profit from reportable segments |
|
$6,089 |
|
$453 |
|
$6,542 |
|
|
All other operating segments |
|
601 |
|
— |
|
601 |
|
|
Cost centers |
|
28 |
|
— |
|
28 |
|
|
Corporate costs |
|
(900) |
|
— |
|
(900) |
|
|
Timing |
|
(157) |
|
— |
|
(157) |
|
|
Methodology differences: |
|
|
|
|
|
|
|
|
Inventory/cost of sales |
|
1 |
|
— |
|
1 |
|
|
Postretirement benefit expense |
|
(468) |
|
— |
|
(468) |
|
|
Financing costs |
|
(294) |
|
— |
|
(294) |
|
|
Equity in profit of unconsolidated affiliated companies |
|
24 |
|
— |
|
24 |
|
|
Currency |
|
(263) |
|
— |
|
(263) |
|
|
Interest rate swaps |
|
(149) |
|
— |
|
(149) |
|
|
Other income/expense methodology differences |
|
(210) |
|
— |
|
(210) |
|
|
Other methodology differences |
|
(11) |
|
3 |
|
(8) |
|
|
Total profit (loss) before taxes |
|
$4,291 |
|
$456 |
|
$4,747 |
|
|
|
|
|
|
|
|
|
|
|
Nine Months Ended September 30, 2010: |
|
|
|
|
|
|
|
|
Total profit from reportable segments |
|
$3,259 |
|
$324 |
|
$3,583 |
|
|
All other operating segments |
|
580 |
|
— |
|
580 |
|
|
Cost centers |
|
(8) |
|
— |
|
(8) |
|
|
Corporate costs |
|
(708) |
|
— |
|
(708) |
|
|
Timing |
|
(209) |
|
— |
|
(209) |
|
|
Methodology differences: |
|
|
|
|
|
|
|
|
Inventory/cost of sales |
|
38 |
|
— |
|
38 |
|
|
Postretirement benefit expense |
|
(467) |
|
— |
|
(467) |
|
|
Financing costs |
|
(248) |
|
— |
|
(248) |
|
|
Equity in profit of unconsolidated affiliated companies |
|
13 |
|
— |
|
13 |
|
|
Currency |
|
23 |
|
— |
|
23 |
|
|
Interest rate swaps |
|
(3) |
|
— |
|
(3) |
|
|
Other income/expense methodology differences |
|
(79) |
|
— |
|
(79) |
|
|
Other methodology differences |
|
(2) |
|
5 |
|
3 |
|
|
Total profit (loss) before taxes |
|
$2,189 |
|
$329 |
|
$2,518 |
|
|
|
|
|
|
|
|
|
|
|
Reconciliation of Assets: |
|
|
|
|
|
|
|
|
|
|
(Millions of dollars) |
|
Machinery
|
|
Financial
|
|
Consolidating
|
|
Consolidated
|
|
|
September 30, 2011: |
|
|
|
|
|
|
|
|
|
|
Total assets from reportable segments |
|
$30,509 |
|
$31,116 |
|
$— |
|
$61,625 |
|
|
All other operating segments |
|
2,010 |
|
— |
|
— |
|
2,010 |
|
|
Items not included in segment assets: |
|
|
|
|
|
|
|
|
|
|
Cash and short-term investments |
|
1,649 |
|
— |
|
— |
|
1,649 |
|
|
Intercompany receivables |
|
69 |
|
— |
|
(69) |
|
— |
|
|
Investment in Financial Products |
|
3,965 |
|
— |
|
(3,965) |
|
— |
|
|
Deferred income taxes |
|
2,262 |
|
— |
|
(485) |
|
1,777 |
|
|
Goodwill, intangible assets and other assets |
|
1,635 |
|
— |
|
— |
|
1,635 |
|
|
Operating lease methodology difference |
|
(514) |
|
— |
|
— |
|
(514) |
|
|
Liabilities included in segment assets |
|
11,450 |
|
— |
|
— |
|
11,450 |
|
|
Inventory methodology differences |
|
(2,633) |
|
— |
|
— |
|
(2,633) |
|
|
Other |
|
1,103 |
|
(220) |
|
(115) |
|
768 |
|
|
Total assets |
|
$51,505 |
|
$30,896 |
|
$(4,634) |
|
$77,767 |
|
|
|
|
|
|
|
|
|
|
|
|
|
December 31, 2010: |
|
|
|
|
|
|
|
|
|
|
Total assets from reportable segments |
|
$19,140 |
|
$30,346 |
|
$— |
|
$49,486 |
|
|
All other operating segments |
|
2,472 |
|
— |
|
— |
|
2,472 |
|
|
Items not included in segment assets: |
|
|
|
|
|
|
|
|
|
|
Cash and short-term investments |
|
1,825 |
|
— |
|
— |
|
1,825 |
|
|
Intercompany receivables |
|
618 |
|
— |
|
(618) |
|
— |
|
|
Investment in Financial Products |
|
4,275 |
|
— |
|
(4,275) |
|
— |
|
|
Deferred income taxes |
|
3,745 |
|
— |
|
(519) |
|
3,226 |
|
|
Goodwill, intangible assets and other assets |
|
1,511 |
|
— |
|
— |
|
1,511 |
|
|
Operating lease methodology difference |
|
(567) |
|
— |
|
— |
|
(567) |
|
|
Liabilities included in segment assets |
|
8,758 |
|
— |
|
— |
|
8,758 |
|
|
Inventory methodology differences |
|
(2,913) |
|
— |
|
— |
|
(2,913) |
|
|
Other |
|
627 |
|
(233) |
|
(172) |
|
222 |
|
|
Total assets |
|
$39,491 |
|
$30,113 |
|
$(5,584) |
|
$64,020 |
|
|
|
|
|
|
|
|
|
|
|
|
|
Reconciliations of Depreciation and amortization: |
|
|
|
|
|
|
|
|
|
|
(Millions of dollars) |
|
Machinery
|
|
Financial
|
|
Consolidating
|
|
Consolidated
|
|
|
Three Months Ended September 30, 2011: |
|
|
|
|
|
|
|
|
|
|
Total depreciation and amortization from reportable segments |
|
$424 |
|
$177 |
|
$— |
|
$601 |
|
|
Items not included in segment depreciation and amortization: |
|
|
|
|
|
|
|
|
|
|
All other operating segments |
|
42 |
|
— |
|
— |
|
42 |
|
|
Cost centers |
|
26 |
|
— |
|
— |
|
26 |
|
|
Other |
|
(15) |
|
4 |
|
— |
|
(11) |
|
|
Total depreciation and amortization |
|
$477 |
|
$181 |
|
$— |
|
$658 |
|
|
|
|
|
|
|
|
|
|
|
|
|
Three Months Ended September 30, 2010: |
|
|
|
|
|
|
|
|
|
|
Total depreciation and amortization from reportable segments |
|
$325 |
|
$175 |
|
$— |
|
$500 |
|
|
Items not included in segment depreciation and amortization: |
|
|
|
|
|
|
|
|
|
|
All other operating segments |
|
48 |
|
— |
|
— |
|
48 |
|
|
Cost centers |
|
23 |
|
— |
|
— |
|
23 |
|
|
Other |
|
(8) |
|
2 |
|
— |
|
(6) |
|
|
Total depreciation and amortization from reportable segments |
|
$388 |
|
$177 |
|
$— |
|
$565 |
|
|
|
|
|
|
|
|
|
|
|
|
|
Reconciliations of Depreciation and amortization: |
|
|
|
|
|
|
|
|
|
|
(Millions of dollars) |
|
Machinery
|
|
Financial
|
|
Consolidating
|
|
Consolidated
|
|
|
Nine Months Ended September 30, 2011: |
|
|
|
|
|
|
|
|
|
|
Total depreciation and amortization from reportable segments |
|
$1,078 |
|
$535 |
|
$— |
|
$1,613 |
|
|
Items not included in segment depreciation and amortization: |
|
|
|
|
|
|
|
|
|
|
All other operating segments |
|
128 |
|
— |
|
— |
|
128 |
|
|
Cost centers |
|
74 |
|
— |
|
— |
|
74 |
|
|
Other |
|
7 |
|
10 |
|
— |
|
17 |
|
|
Total depreciation and amortization |
|
$1,287 |
|
$545 |
|
$— |
|
$1,832 |
|
|
|
|
|
|
|
|
|
|
|
|
|
Nine Months Ended September 30, 2010: |
|
|
|
|
|
|
|
|
|
|
Total depreciation and amortization from reportable segments |
|
$945 |
|
$538 |
|
$— |
|
$1,483 |
|
|
Items not included in segment depreciation and amortization: |
|
|
|
|
|
|
|
|
|
|
All other operating segments |
|
144 |
|
— |
|
— |
|
144 |
|
|
Cost centers |
|
72 |
|
— |
|
— |
|
72 |
|
|
Other |
|
(23) |
|
5 |
|
— |
|
(18) |
|
|
Total depreciation and amortization |
|
$1,138 |
|
$543 |
|
$— |
|
$1,681 |
|
|
|
|
|
|
|
|
|
|
|
|
|
Reconciliations of Capital expenditures: |
|
|
|
|
|
|
|
|
|
|
(Millions of dollars) |
|
Machinery
|
|
Financial
|
|
Consolidating
|
|
Consolidated
|
|
|
Three Months Ended September 30, 2011: |
|
|
|
|
|
|
|
|
|
|
Total capital expenditures from reportable segments |
|
$672 |
|
$311 |
|
$— |
|
$983 |
|
|
Items not included in segment capital expenditures: |
|
|
|
|
|
|
|
|
|
|
All other operating segments |
|
84 |
|
— |
|
— |
|
84 |
|
|
Cost centers |
|
31 |
|
— |
|
— |
|
31 |
|
|
Timing |
|
(89) |
|
— |
|
— |
|
(89) |
|
|
Other |
|
(88) |
|
92 |
|
(18) |
|
(14) |
|
|
Total capital expenditures |
|
$610 |
|
$403 |
|
$(18) |
|
$995 |
|
|
|
|
|
|
|
|
|
|
|
|
|
Three Months Ended September 30, 2010: |
|
|
|
|
|
|
|
|
|
|
Total capital expenditures from reportable segments |
|
$284 |
|
$290 |
|
$— |
|
$574 |
|
|
Items not included in segment capital expenditures: |
|
|
|
|
|
|
|
|
|
|
All other operating segments |
|
115 |
|
— |
|
— |
|
115 |
|
|
Cost centers |
|
24 |
|
— |
|
— |
|
24 |
|
|
Timing |
|
(53) |
|
— |
|
— |
|
(53) |
|
|
Other |
|
(6) |
|
7 |
|
(20) |
|
(19) |
|
|
Total capital expenditures |
|
$364 |
|
$297 |
|
$(20) |
|
$641 |
|
|
|
|
|
|
|
|
|
|
|
|
|
Reconciliations of Capital expenditures: |
|
|
|
|
|
|
|
|
|
|
(Millions of dollars) |
|
Machinery
|
|
Financial
|
|
Consolidating
|
|
Consolidated
|
|
|
Nine Months Ended September 30, 2011: |
|
|
|
|
|
|
|
|
|
|
Total capital expenditures from reportable segments |
|
$1,287 |
|
$830 |
|
$— |
|
$2,117 |
|
|
Items not included in segment capital expenditures: |
|
|
|
|
|
|
|
|
|
|
All other operating segments |
|
173 |
|
— |
|
— |
|
173 |
|
|
Cost centers |
|
72 |
|
— |
|
— |
|
72 |
|
|
Timing |
|
151 |
|
— |
|
— |
|
151 |
|
|
Other |
|
(98) |
|
147 |
|
(63) |
|
(14) |
|
|
Total capital expenditures |
|
$1,585 |
|
$977 |
|
$(63) |
|
$2,499 |
|
|
|
|
|
|
|
|
|
|
|
|
|
Nine Months Ended September 30, 2010: |
|
|
|
|
|
|
|
|
|
|
Total capital expenditures from reportable segments |
|
$701 |
|
$677 |
|
$— |
|
$1,378 |
|
|
Items not included in segment capital expenditures: |
|
|
|
|
|
|
|
|
|
|
All other operating segments |
|
170 |
|
— |
|
— |
|
170 |
|
|
Cost centers |
|
48 |
|
— |
|
— |
|
48 |
|
|
Timing |
|
115 |
|
— |
|
— |
|
115 |
|
|
Other |
|
(10) |
|
18 |
|
(54) |
|
(46) |
|
|
Total capital expenditures |
|
$1,024 |
|
$695 |
|
$(54) |
|
$1,665 |
|
|
|
|
|
|
|
|
|
|
|
|
15. Cat Financial Financing Activities
A. Credit quality of financing receivables and allowance for credit losses
Cat Financial adopted the accounting guidance on disclosures about the credit quality of financing receivables and the allowance for credit losses as of December 31, 2010. See Note 2 for additional information. This guidance requires information to be disclosed at disaggregated levels, defined as portfolio segments and classes.
Cat Financial applies a systematic methodology to determine the allowance for credit losses for finance receivables. Based upon Cat Financial’s analysis of credit losses and risk factors, portfolio segments are as follows:
· Customer - Finance receivables with the customer.
· Dealer - Finance receivables with Caterpillar dealers.
Cat Financial further evaluates portfolio segments by the class of finance receivables, which is defined as a level of information (below a portfolio segment) in which the finance receivables have the same initial measurement attribute and a similar method for assessing and monitoring credit risk. Typically, Cat Financial’s finance receivables within a geographic area have similar credit risk profiles and methods for assessing and monitoring credit risk. Cat Financial’s classes, which align with management reporting, are as follows:
· North America - Finance receivables originated in the United States or Canada.
· Europe - Finance receivables originated in Europe, Africa, Middle East and the Commonwealth of Independent States.
· Asia Pacific - Finance receivables originated in Australia, New Zealand, China, Japan, South Korea and Southeast Asia, as well as large mining customers worldwide.
· Latin America - Finance receivables originated in Central and South American countries and Mexico.
· Global Power Finance - Finance receivables related to marine vessels with Caterpillar engines worldwide and Caterpillar electrical power generation, gas compression and co-generation systems and non-Caterpillar equipment that is powered by these systems worldwide.
Impaired loans and finance leases
For all classes, a lo an or finance lease is considered impaired, based on current information and events, if it is probable that Cat Financial will be unable to collect all amounts due according to the contractual terms of the loan or finance lease. Loans and finance leases reviewed for impairment include loans and finance leases that are past due, non-performing or in bankruptcy. Recognition of income is suspended and the loan or finance lease is placed on non-accrual status when management determines that collection of future income is not probable (generally after 120 days past due). Accrual is resumed, and previously suspended income is recognized, when the loan or finance lease becomes contractually current
and/or collection doubts are removed. Cash receipts on impaired loans or finance leases are recorded against the receivable and then to any unrecognized income.
There were no impaired loans or finance leases as of September 30, 2011 and December 31, 2010, for the Dealer portfolio segment. The average recorded investment for impaired loans and finance leases for the Dealer portfolio segment was $16 million and $25 million, respectively, for the three and nine months ended September 30, 2010, all of which was in the Europe finance receivable class.
Individually impaired loans and finance leases for customers were as follows:
|
|
|
|
|
|
|
||||||||
|
(Millions of dollars) |
|
As of September 30, 2011 |
|
As of December 31, 2010 |
|
||||||||
|
|
|
Recorded
|
|
Unpaid
|
|
Related
|
|
Recorded
|
|
Unpaid
|
|
Related
|
|
|
|
|
|
|
|
|
|
|
|
|
|
|
|
|
|
Impaired Loans and Finance Leases With No Allowance Recorded 1 |
|
|
|
|
|
|
|
|
|
|
|
|
|
|
Customer |
|
|
|
|
|
|
|
|
|
|
|
|
|
|
North America |
|
$84 |
|
$82 |
|
$— |
|
$87 |
|
$87 |
|
$— |
|
|
Europe |
|
4 |
|
3 |
|
— |
|
6 |
|
4 |
|
— |
|
|
Asia Pacific |
|
14 |
|
13 |
|
— |
|
13 |
|
13 |
|
— |
|
|
Latin America |
|
8 |
|
8 |
|
— |
|
3 |
|
3 |
|
— |
|
|
Global Power Finance |
|
196 |
|
196 |
|
— |
|
174 |
|
174 |
|
— |
|
|
Total |
|
$306 |
|
$302 |
|
$— |
|
$283 |
|
$281 |
|
$— |
|
|
|
|
|
|
|
|
|
|
|
|
|
|
|
|
|
Impaired Loans and Finance Leases With An Allowance Recorded |
|
|
|
|
|
|
|
|
|
|
|
|
|
|
Customer |
|
|
|
|
|
|
|
|
|
|
|
|
|
|
North America |
|
$110 |
|
$105 |
|
$25 |
|
$191 |
|
$185 |
|
$44 |
|
|
Europe |
|
39 |
|
35 |
|
13 |
|
62 |
|
57 |
|
15 |
|
|
Asia Pacific |
|
21 |
|
21 |
|
4 |
|
27 |
|
27 |
|
7 |
|
|
Latin America |
|
24 |
|
24 |
|
5 |
|
44 |
|
43 |
|
9 |
|
|
Global Power Finance |
|
104 |
|
103 |
|
18 |
|
34 |
|
33 |
|
4 |
|
|
Total |
|
$298 |
|
$288 |
|
$65 |
|
$358 |
|
$345 |
|
$79 |
|
|
|
|
|
|
|
|
|
|
|
|
|
|
|
|
|
Total Impaired Loans and Finance Leases |
|
|
|
|
|
|
|
|
|
|
|
|
|
|
Customer |
|
|
|
|
|
|
|
|
|
|
|
|
|
|
North America |
|
$194 |
|
$187 |
|
$25 |
|
$278 |
|
$272 |
|
$44 |
|
|
Europe |
|
43 |
|
38 |
|
13 |
|
68 |
|
61 |
|
15 |
|
|
Asia Pacific |
|
35 |
|
34 |
|
4 |
|
40 |
|
40 |
|
7 |
|
|
Latin America |
|
32 |
|
32 |
|
5 |
|
47 |
|
46 |
|
9 |
|
|
Global Power Finance |
|
300 |
|
299 |
|
18 |
|
208 |
|
207 |
|
4 |
|
|
Total |
|
$604 |
|
$590 |
|
$65 |
|
$641 |
|
$626 |
|
$79 |
|
|
1 No related allowance for credit losses due to sufficient collateral value. |
|
|
|
|
|
|
|
|
|
||||
|
|
|
Three Months Ended September 30,
|
|
Three Months Ended September 30,
|
|
||||
|
(Millions of dollars) |
|
Average Recorded
|
|
Interest Income
|
|
Average Recorded
|
|
Interest Income
|
|
|
|
|
|
|
|
|
|
|
|
|
|
Impaired Loans and Finance Leases With No Allowance Recorded 1 |
|
|
|
|
|
|
|
|
|
|
Customer |
|
|
|
|
|
|
|
|
|
|
North America |
|
$92 |
|
$1 |
|
$43 |
|
$1 |
|
|
Europe |
|
5 |
|
— |
|
4 |
|
— |
|
|
Asia Pacific |
|
13 |
|
1 |
|
7 |
|
1 |
|
|
Latin America |
|
12 |
|
— |
|
4 |
|
— |
|
|
Global Power Finance |
|
231 |
|
— |
|
113 |
|
— |
|
|
Total |
|
$353 |
|
$2 |
|
$171 |
|
$2 |
|
|
|
|
|
|
|
|
|
|
|
|
|
Impaired Loans and Finance Leases With An Allowance Recorded |
|
|
|
|
|
|
|
|
|
|
Customer |
|
|
|
|
|
|
|
|
|
|
North America |
|
$125 |
|
$— |
|
$270 |
|
$2 |
|
|
Europe |
|
44 |
|
1 |
|
84 |
|
1 |
|
|
Asia Pacific |
|
18 |
|
— |
|
41 |
|
— |
|
|
Latin America |
|
40 |
|
— |
|
37 |
|
1 |
|
|
Global Power Finance |
|
126 |
|
— |
|
10 |
|
— |
|
|
Total |
|
$353 |
|
$1 |
|
$442 |
|
$4 |
|
|
|
|
|
|
|
|
|
|
|
|
|
Total Impaired Loans and Finance Leases |
|
|
|
|
|
|
|
|
|
|
Customer |
|
|
|
|
|
|
|
|
|
|
North America |
|
$217 |
|
$1 |
|
$313 |
|
$3 |
|
|
Europe |
|
49 |
|
1 |
|
88 |
|
1 |
|
|
Asia Pacific |
|
31 |
|
1 |
|
48 |
|
1 |
|
|
Latin America |
|
52 |
|
— |
|
41 |
|
1 |
|
|
Global Power Finance |
|
357 |
|
— |
|
123 |
|
— |
|
|
Total |
|
$706 |
|
$3 |
|
$613 |
|
$6 |
|
|
|
|
|
|
|
|
|
|
|
|
|
1 No related allowance for credit losses due to sufficient collateral value. |
|||||||||
|
|
|||||||||
|
|
|
|
|
|
|
||||
|
|
|
Nine Months Ended September 30,
|
|
Nine Months Ended September 30,
|
|
||||
|
(Millions of dollars) |
|
Average Recorded
|
|
Interest Income
|
|
Average Recorded
|
|
Interest Income
|
|
|
|
|
|
|
|
|
|
|
|
|
|
Impaired Loans and Finance Leases With No Allowance Recorded 1 |
|
|
|
|
|
|
|
|
|
|
Customer |
|
|
|
|
|
|
|
|
|
|
North America |
|
$93 |
|
$3 |
|
$29 |
|
$1 |
|
|
Europe |
|
6 |
|
— |
|
7 |
|
— |
|
|
Asia Pacific |
|
13 |
|
1 |
|
7 |
|
1 |
|
|
Latin America |
|
8 |
|
— |
|
4 |
|
— |
|
|
Global Power Finance |
|
223 |
|
1 |
|
74 |
|
— |
|
|
Total |
|
$343 |
|
$5 |
|
$121 |
|
$2 |
|
|
|
|
|
|
|
|
|
|
|
|
|
Impaired Loans and Finance Leases With An Allowance Recorded |
|
|
|
|
|
|
|
|
|
|
Customer |
|
|
|
|
|
|
|
|
|
|
North America |
|
$160 |
|
$4 |
|
$292 |
|
$9 |
|
|
Europe |
|
53 |
|
2 |
|
90 |
|
3 |
|
|
Asia Pacific |
|
21 |
|
1 |
|
44 |
|
2 |
|
|
Latin America |
|
44 |
|
2 |
|
34 |
|
2 |
|
|
Global Power Finance |
|
79 |
|
— |
|
13 |
|
— |
|
|
Total |
|
$357 |
|
$9 |
|
$473 |
|
$16 |
|
|
|
|
|
|
|
|
|
|
|
|
|
Total Impaired Loans and Finance Leases |
|
|
|
|
|
|
|
|
|
|
Customer |
|
|
|
|
|
|
|
|
|
|
North America |
|
$253 |
|
$7 |
|
$321 |
|
$10 |
|
|
Europe |
|
59 |
|
2 |
|
97 |
|
3 |
|
|
Asia Pacific |
|
34 |
|
2 |
|
51 |
|
3 |
|
|
Latin America |
|
52 |
|
2 |
|
38 |
|
2 |
|
|
Global Power Finance |
|
302 |
|
1 |
|
87 |
|
— |
|
|
Total |
|
$700 |
|
$14 |
|
$594 |
|
$18 |
|
|
|
|
|
|
|
|
|
|
|
|
|
1 No related allowance for credit losses due to sufficient collateral value. |
|||||||||
|
|
|||||||||
Non-accrual and past due loans and finance leases
For all classes, Cat Financial considers a loan or finance lease past due if any portion of a contractual payment is due and unpaid for more than 30 days. Recognition of income is suspended and the loan or finance lease is placed on non-accrual status when management determines that collection of future income is not probable (generally after 120 days past due). Accrual is resumed, and previously suspended income is recognized, when the loan or finance lease becomes contractually current and/or collection doubts are removed.
As of September 30, 2011 and December 31, 2010, there were no loans or finance leases on non-accrual status for the Dealer portfolio segment.
The investment in customer loans and finance leases on non-accrual status was as follows:
|
(Millions of dollars) |
|
|
|
|
|
|
|
|
September 30, 2011 |
|
December 31, 2010 |
|
|
Customer |
|
|
|
|
|
|
North America |
|
$149 |
|
$217 |
|
|
Europe |
|
112 |
|
89 |
|
|
Asia Pacific |
|
39 |
|
31 |
|
|
Latin America |
|
116 |
|
139 |
|
|
Global Power Finance |
|
211 |
|
163 |
|
|
Total |
|
$627 |
|
$639 |
|
|
|
|
|
|
|
|
Past due loans and finance leases were as follows:
|
(Millions of dollars) |
|
|
|
|
|
|
|
|
|
|
|
|
|
|
|
|
|
|
September 30, 2011 |
|
||||||||||||
|
|
|
31-60 |
|
61-90 |
|
91+ |
|
Total Past
|
|
Current |
|
Total
|
|
91+ Still
|
|
|
Customer |
|
|
|
|
|
|
|
|
|
|
|
|
|
|
|
|
North America |
|
$89 |
|
$31 |
|
$138 |
|
$258 |
|
$5,214 |
|
$5,472 |
|
$13 |
|
|
Europe |
|
31 |
|
18 |
|
113 |
|
162 |
|
2,142 |
|
2,304 |
|
10 |
|
|
Asia Pacific |
|
59 |
|
23 |
|
53 |
|
135 |
|
4,028 |
|
4,163 |
|
16 |
|
|
Latin America |
|
45 |
|
17 |
|
104 |
|
166 |
|
2,267 |
|
2,433 |
|
— |
|
|
Global Power Finance |
|
52 |
|
16 |
|
111 |
|
179 |
|
2,739 |
|
2,918 |
|
10 |
|
|
Dealer |
|
|
|
|
|
|
|
|
|
|
|
|
|
|
|
|
North America |
|
— |
|
— |
|
— |
|
— |
|
1,735 |
|
1,735 |
|
— |
|
|
Europe |
|
— |
|
— |
|
— |
|
— |
|
64 |
|
64 |
|
— |
|
|
Asia Pacific |
|
— |
|
— |
|
— |
|
— |
|
155 |
|
155 |
|
— |
|
|
Latin America |
|
— |
|
— |
|
— |
|
— |
|
478 |
|
478 |
|
— |
|
|
Total |
|
$276 |
|
$105 |
|
$519 |
|
$900 |
|
$18,822 |
|
$19,722 |
|
$49 |
|
|
|
|
|
|
|
|
|
|
|
|
|
|
|
|
|
|
|
(Millions of dollars) |
|
|
|
|
|
|
|
|
|
|
|
|
|
|
|
|
|
|
December 31, 2010 |
|
||||||||||||
|
|
|
31-60 |
|
61-90 |
|
91+ |
|
Total Past
|
|
Current |
|
Total
|
|
91+ Still
|
|
|
Customer |
|
|
|
|
|
|
|
|
|
|
|
|
|
|
|
|
North America |
|
$139 |
|
$44 |
|
$228 |
|
$411 |
|
$6,037 |
|
$6,448 |
|
$27 |
|
|
Europe |
|
27 |
|
12 |
|
106 |
|
145 |
|
2,365 |
|
2,510 |
|
26 |
|
|
Asia Pacific |
|
63 |
|
17 |
|
37 |
|
117 |
|
3,412 |
|
3,529 |
|
12 |
|
|
Latin America |
|
44 |
|
16 |
|
144 |
|
204 |
|
2,222 |
|
2,426 |
|
1 |
|
|
Global Power Finance |
|
18 |
|
17 |
|
54 |
|
89 |
|
2,978 |
|
3,067 |
|
25 |
|
|
Dealer |
|
|
|
|
|
|
|
|
|
|
|
|
|
|
|
|
North America |
|
— |
|
— |
|
— |
|
— |
|
1,291 |
|
1,291 |
|
— |
|
|
Europe |
|
— |
|
— |
|
— |
|
— |
|
41 |
|
41 |
|
— |
|
|
Asia Pacific |
|
— |
|
— |
|
— |
|
— |
|
151 |
|
151 |
|
— |
|
|
Latin America |
|
— |
|
— |
|
— |
|
— |
|
457 |
|
457 |
|
— |
|
|
Global Power Finance |
|
— |
|
— |
|
— |
|
— |
|
3 |
|
3 |
|
— |
|
|
Total |
|
$291 |
|
$106 |
|
$569 |
|
$966 |
|
$18,957 |
|
$19,923 |
|
$91 |
|
|
|
|
|
|
|
|
|
|
|
|
|
|
|
|
|
|
Allowance for credit loss activity
In estimating the allowance for credit losses, Cat Financial reviews loans and finance leases that are past due, non-performing or in bankruptcy.
|
(Millions of dollars) |
|
|
|
|
|
|
|
|
|
|
September 30, 2011 |
|
||||
|
|
|
|
|
|
|
|
|
|
Allowance for Credit Losses: |
|
Customer |
|
Dealer |
|
Total |
|
|
Balance at beginning of year |
|
$357 |
|
$5 |
|
$362 |
|
|
Provision for credit losses |
|
119 |
|
1 |
|
120 |
|
|
Receivables written off |
|
(159) |
|
— |
|
(159) |
|
|
Recoveries on receivables previously written off |
|
39 |
|
— |
|
39 |
|
|
Adjustment due to sale of receivables |
|
(1) |
|
— |
|
(1) |
|
|
Foreign currency translation adjustment |
|
(2) |
|
— |
|
(2) |
|
|
Balance at end of period |
|
$353 |
|
$6 |
|
$359 |
|
|
|
|
|
|
|
|
|
|
|
Allowance for Credit Losses: |
|
|
|
|
|
|
|
|
Individually evaluated for impairment |
|
$65 |
|
$— |
|
$65 |
|
|
Collectively evaluated for impairment |
|
288 |
|
6 |
|
294 |
|
|
Ending Balance |
|
$353 |
|
$6 |
|
$359 |
|
|
|
|
|
|
|
|
|
|
|
Recorded Investment in Finance Receivables: |
|
|
|
|
|
|
|
|
Individually evaluated for impairment |
|
$604 |
|
$— |
|
$604 |
|
|
Collectively evaluated for impairment |
|
16,686 |
|
2,432 |
|
19,118 |
|
|
Ending Balance |
|
$17,290 |
|
$2,432 |
|
$19,722 |
|
|
|
|
|
|
|
|
|
|
|
(Millions of dollars) |
|
|
|
|
|
|
|
|
|
|
December 31, 2010 |
|
||||
|
|
|
|
|
|
|
|
|
|
Allowance for Credit Losses: |
|
|
|
|
|
Total |
|
|
Balance at beginning of year |
|
|
|
|
|
$376 |
|
|
Provision for credit losses |
|
|
|
|
|
205 |
|
|
Receivables written off |
|
|
|
|
|
(288) |
|
|
Recoveries on receivables previously written off |
|
|
|
|
|
51 |
|
|
Adjustment to adopt consolidation of variable-interest entities |
|
|
|
|
|
18 |
|
|
Balance at end of year |
|
|
|
|
|
$362 |
|
|
|
|
|
|
|
|
|
|
|
Allowance for Credit Losses: |
|
Customer |
|
Dealer |
|
Total |
|
|
Individually evaluated for impairment |
|
$79 |
|
$— |
|
$79 |
|
|
Collectively evaluated for impairment |
|
278 |
|
5 |
|
283 |
|
|
Ending Balance |
|
$357 |
|
$5 |
|
$362 |
|
|
|
|
|
|
|
|
|
|
|
Recorded Investment in Finance Receivables: |
|
|
|
|
|
|
|
|
Individually evaluated for impairment |
|
$641 |
|
$— |
|
$641 |
|
|
Collectively evaluated for impairment |
|
17,339 |
|
1,943 |
|
19,282 |
|
|
Ending Balance |
|
$17,980 |
|
$1,943 |
|
$19,923 |
|
|
|
|
|
|
|
|
|
|
Credit quality of finance receivables
The credit quality of finance receivables is reviewed on a monthly basis. Credit quality indicators include performing and non-performing. Non-performing is defined as finance receivables currently over 120 days past due and/or on non-accrual status or in bankruptcy. Finance receivables not meeting the criteria listed above are considered performing. Non-performing receivables have the highest probability for credit loss. The allowance for credit losses attributable to non-performing receivables is based on the most probable source of repayment, which is normally the liquidation of collateral. In determining collateral value, Cat Financial estimates the current fair market value of the collateral and considers credit enhancements such as additional collateral and third-party guarantees.
The recorded investment in performing and non-performing finance receivables was as follows:
|
(Millions of dollars) |
|
|
|
September 30, 2011 |
|
December 31, 2010 |
|
||||||||
|
|
|
Customer |
|
Dealer |
|
Total |
|
Customer |
|
Dealer |
|
Total |
|
|
Performing |
|
|
|
|
|
|
|
|
|
|
|
|
|
|
North America |
|
$5,323 |
|
$1,735 |
|
$7,058 |
|
$6,231 |
|
$1,291 |
|
$7,522 |
|
|
Europe |
|
2,192 |
|
64 |
|
2,256 |
|
2,421 |
|
41 |
|
2,462 |
|
|
Asia Pacific |
|
4,124 |
|
155 |
|
4,279 |
|
3,498 |
|
151 |
|
3,649 |
|
|
Latin America |
|
2,317 |
|
478 |
|
2,795 |
|
2,287 |
|
457 |
|
2,744 |
|
|
Global Power Finance |
|
2,707 |
|
— |
|
2,707 |
|
2,904 |
|
3 |
|
2,907 |
|
|
Total Performing |
|
$16,663 |
|
$2,432 |
|
$19,095 |
|
$17,341 |
|
$1,943 |
|
$19,284 |
|
|
|
|
|
|
|
|
|
|
|
|
|
|
|
|
|
Non-Performing |
|
|
|
|
|
|
|
|
|
|
|
|
|
|
North America |
|
$149 |
|
$— |
|
$149 |
|
$217 |
|
$— |
|
$217 |
|
|
Europe |
|
112 |
|
— |
|
112 |
|
89 |
|
— |
|
89 |
|
|
Asia Pacific |
|
39 |
|
— |
|
39 |
|
31 |
|
— |
|
31 |
|
|
Latin America |
|
116 |
|
— |
|
116 |
|
139 |
|
— |
|
139 |
|
|
Global Power Finance |
|
211 |
|
— |
|
211 |
|
163 |
|
— |
|
163 |
|
|
Total Non-Performing |
|
$627 |
|
$— |
|
$627 |
|
$639 |
|
$— |
|
$639 |
|
|
|
|
|
|
|
|
|
|
|
|
|
|
|
|
|
Performing & Non-Performing |
|
|
|
|
|
|
|
|
|
|
|
|
|
|
North America |
|
$5,472 |
|
$1,735 |
|
$7,207 |
|
$6,448 |
|
$1,291 |
|
$7,739 |
|
|
Europe |
|
2,304 |
|
64 |
|
2,368 |
|
2,510 |
|
41 |
|
2,551 |
|
|
Asia Pacific |
|
4,163 |
|
155 |
|
4,318 |
|
3,529 |
|
151 |
|
3,680 |
|
|
Latin America |
|
2,433 |
|
478 |
|
2,911 |
|
2,426 |
|
457 |
|
2,883 |
|
|
Global Power Finance |
|
2,918 |
|
— |
|
2,918 |
|
3,067 |
|
3 |
|
3,070 |
|
|
Total |
|
$17,290 |
|
$2,432 |
|
$19,722 |
|
$17,980 |
|
$1,943 |
|
$19,923 |
|
|
|
|
|
|
|
|
|
|
|
|
|
|
|
Troubled Debt Restructurings
A restructuring of a loan or finance lease receivable constitutes a troubled debt restructuring (TDR) when the lender grants a concession it would not otherwise consider to a borrower experiencing financial difficulties. Concessions granted may include extended contract maturities, inclusion of interest only periods, below market interest rates, and extended skip payment periods.
TDRs are reviewed along with other receivables as part of management’s ongoing evaluation of the adequacy of the allowance for credit losses. The allowance for credit losses attributable to TDRs is based on the most probable source of repayment, which is normally the liquidation of collateral. In determining collateral value, Cat Financial estimates the current fair market value of the collateral and factors in credit enhancements such as additional collateral and third-party guarantees.
There were no loans or finance lease receivables modified as TDRs during the three or nine months ended September 30, 2011 for the Dealer portfolio segment.
Loan and finance lease receivables modified as TDRs during the three and nine months ended September 30, 2011, were as follows:
|
(Dollars in millions) |
|
|
|
|
|
|
|
|
|
|
|
|
|
|
|
|
Three Months Ended September 30, 2011 |
|
Nine Months Ended September 30, 2011 |
|
||||||||
|
|
|
Number
|
|
Pre-TDR
|
|
Post-TDR
|
|
Number
|
|
Pre-TDR
|
|
Post-TDR
|
|
|
Customer |
|
|
|
|
|
|
|
|
|
|
|
|
|
|
North America |
|
14 |
|
$2 |
|
$2 |
|
53 |
|
$11 |
|
$11 |
|
|
Europe |
|
— |
|
— |
|
— |
|
6 |
|
7 |
|
7 |
|
|
Latin America |
|
— |
|
— |
|
— |
|
12 |
|
10 |
|
10 |
|
|
Global Power Finance 1,2 |
|
— |
|
— |
|
— |
|
31 |
|
113 |
|
113 |
|
|
Total 3 |
|
14 |
|
$2 |
|
$2 |
|
102 |
|
$141 |
|
$141 |
|
|
|
|||||||||||||
|
1 During the nine months ended September 30, 2011, $11 million of additional funds were subsequently loaned to a borrower whose terms had been modified in a TDR. The $11 million of additional funds is not reflected in the table above. At September 30, 2011, remaining commitments to lend additional funds to a borrower whose terms have been modified in a TDR were $2 million. 2 Three customers comprise $104 million of the $113 million pre-TDR and post-TDR outstanding recorded investment for the nine months ended September 30, 2011. 3 Modifications include extended contract maturities, inclusion of interest only periods, below market interest rates, and extended skip payment periods. |
|||||||||||||
TDRs with a payment default during the three and nine months ended September 30, 2011, which had been modified within twelve months prior to the default date, were as follows:
|
(Dollars in millions) |
|
Three Months Ended
|
|
Nine Months Ended
|
|
||||
|
|
|
Number of
|
|
Post-TDR
|
|
Number of
|
|
Post-TDR
|
|
|
|
|
|
|
|
|
|
|
|
|
|
Customer |
|
|
|
|
|
|
|
|
|
|
North America |
|
3 |
|
$16 |
|
44 |
|
$25 |
|
|
Europe |
|
— |
|
— |
|
1 |
|
1 |
|
|
Latin America |
|
7 |
|
4 |
|
7 |
|
4 |
|
|
Global Power Finance |
|
5 |
|
65 |
|
14 |
|
70 |
|
|
Total |
|
15 |
|
$85 |
|
66 |
|
$100 |
|
|
|
|
|
|
|
|
|
|
|
|
B. Securitized Retail Installment Sale Contracts and Finance Leases
Cat Financial periodically transfers certain finance receivables relating to retail installment sale contracts and finance leases to SPEs as part of their asset-backed securitization program. The SPEs have limited purposes and generally are only permitted to purchase the finance receivables, issue asset-backed securities and make payments on the securities. The SPEs only issue a single series of securities and generally are dissolved when those securities have been paid in full. The SPEs issue debt to pay for the finance receivables they acquire from Cat Financial. The primary source for repayment of the debt is the cash flows generated from the finance receivables owned by the SPEs. The assets of the SPEs are legally isolated and are not available to pay the creditors of Cat Financial. Cat Financial retains interests in the securitization transactions, including subordinated certificates issued by the SPEs, rights to cash reserves and residual interests. For bankruptcy analysis purposes, Cat Financial has sold the finance receivables to the SPEs in a true sale and the SPEs are separate legal entities. The investors and the SPEs have no recourse to any of Cat Financial’s other assets for failure of debtors to pay when due.
In accordance with the new consolidation accounting guidance adopted January 1, 2010, these SPEs were concluded to be VIEs. Cat Financial determined that it was the primary beneficiary based on its power to direct activities through its role as servicer and its obligation to absorb losses and right to receive benefits and therefore consolidated the entities using the carrying amounts of the SPEs’ assets and liabilities.
On April 25, 2011, Cat Financial exercised a clean-up call on their only outstanding asset-backed securitization transaction. As a result, Cat Financial had no assets or liabilities related to a consolidated SPE as of September 30, 2011. The restricted assets (Receivables-finance, Long-term receivables-finance, Prepaid expenses and other current assets, and Other assets) of
the consolidated SPEs totaled $136 million at December 31, 2010. The liabilities (Accrued expenses and Long-term debt due within one year-Financial Products) of the consolidated SPEs totaled $73 million at December 31, 2010.
16. Redeemable Noncontrolling Interest — Caterpillar Japan Ltd.
On August 1, 2008, Shin Caterpillar Mitsubishi Ltd. (SCM) completed the first phase of a share redemption plan whereby SCM redeemed half of Mitsubishi Heavy Industries (MHI’s) shares in SCM. This resulted in Caterpillar owning 67 percent of the outstanding shares of SCM and MHI owning the remaining 33 percent. As part of the share redemption, SCM was renamed Caterpillar Japan Ltd. (Cat Japan) and we consolidated its financial statements. Both Cat Japan and MHI have options, exercisable beginning August 1, 2013, to require the redemption of the remaining shares owned by MHI, which if exercised, would make Caterpillar the sole owner of Cat Japan.
The remaining 33 percent of Cat Japan owned by MHI has been reported as redeemable noncontrolling interest and classified as mezzanine equity (temporary equity) in the Consolidated Statement of Financial Position. The redeemable noncontrolling interest is reported at its estimated redemption value. Any adjustment to the redemption value impacts Profit employed in the business, but does not impact Profit (loss). If the fair value of the redeemable noncontrolling interest falls below the redemption value, profit available to common stockholders would be reduced by the difference between the redemption value and the fair value. This would result in lower profit in the profit per common share computation in that period. Reductions impacting the profit per common share computation may be partially or fully reversed in subsequent periods if the fair value of the redeemable noncontrolling interest increases relative to the redemption value. Such increases in profit per common share would be limited to cumulative prior reductions. As Cat Japan’s functional currency is the Japanese yen, changes in exchange rates affect the reported amount of the redeemable noncontrolling interest. During the nine months ended September 30, 2011, the estimated redemption value decreased by $8 million, resulting in adjustments to the carrying value of the redeemable noncontrolling interest with a corresponding increase to Profit employed in the business. This decrease in the estimated redemption value was offset by the strengthening of Japanese yen against the U.S. dollar, resulting in a $30 million net increase of the redeemable noncontrolling interest. For the nine months ended September 30, 2010, the estimated redemption value decreased, resulting in an adjustment to the carrying value of the redeemable noncontrolling interest. Profit employed in the business increased by $26 million due to this adjustment. As of September 30, 2011, the fair value of the redeemable noncontrolling interest remained greater than the estimated redemption value.
We estimate the fair value of the redeemable noncontrolling interest using a discounted five year forecasted cash flow with a year-five residual value. Based on our current expectations for Cat Japan, we expect the fair value of the redeemable noncontrolling interest to remain greater than the redemption value. However, if economic conditions deteriorate and Cat Japan’s business forecast is negatively impacted, it is possible that the fair value of the redeemable noncontrolling interest may fall below the estimated redemption value. Should this occur, profit would be reduced in the profit per common share computation by the difference between the redemption value and the fair value. Lower long-term growth rates, reduced long-term profitability as well as changes in interest rates, costs, pricing, capital expenditures and general market conditions may reduce the fair value of the redeemable noncontrolling interest.
With the consolidation of Cat Japan’s results of operations, 33 percent of Cat Japan’s comprehensive income or loss is attributed to the redeemable noncontrolling interest, impacting its carrying value. Because the redeemable noncontrolling interest must be reported at its estimated future redemption value, the impact from attributing the comprehensive income or loss is offset by adjusting the carrying value to the redemption value. This adjustment impacts Profit employed in the business, but not Profit (loss). For the nine months ended September 30, 2011, the carrying value had increased by $59 million due to Cat Japan’s comprehensive income. This resulted in an offsetting adjustment of $59 million to decrease the carrying value to the redemption value and a corresponding increase to Profit employed in the business. For the nine months ended September 30, 2010, the carrying value had increased by $34 million due to Cat Japan’s comprehensive income. This resulted in an offsetting adjustment of $34 million to decrease the carrying value to the redemption value and a corresponding increase to Profit employed in the business. At September 30, 2011 and December 31, 2010 the redeemable noncontrolling interest was $491 million and $461 million, respectively.
17. Fair Value Measurements
A. Fair value measurements
The guidance on fair value measurements defines fair value as the exchange price that would be received for an asset or paid to transfer a liability (an exit price) in the principal or most advantageous market for the asset or liability in an orderly transaction between market participants. This guidance also specifies a fair value hierarchy based upon the observability of inputs used in valuation techniques. Observable inputs (highest level) reflect market data obtained from independent sources,
while unobservable inputs (lowest level) reflect internally developed market assumptions. In accordance with this guidance, fair value measurements are classified under the following hierarchy:
· Level 1 — Quoted prices for identical instruments in active markets.
· Level 2 — Quoted prices for similar instruments in active markets; quoted prices for identical or similar instruments in markets that are not active; and model-derived valuations in which all significant inputs or significant value-drivers are observable in active markets.
· Level 3 — Model-derived valuations in which one or more significant inputs or significant value-drivers are unobservable.
When available, we use quoted market prices to determine fair value, and we classify such measurements within Level 1. In some cases where market prices are not available, we make use of observable market based inputs to calculate fair value, in which case the measurements are classified within Level 2. If quoted or observable market prices are not available, fair value is based upon internally developed models that use, where possible, current market-based parameters such as interest rates, yield curves and currency rates. These measurements are classified within Level 3.
Fair value measurements are classified according to the lowest level input or value-driver that is significant to the valuation. A measurement may therefore be classified within Level 3 even though there may be significant inputs that are readily observable.
The guidance on fair value measurements expanded the definition of fair value to include the consideration of nonperformance risk. Nonperformance risk refers to the risk that an obligation (either by a counterparty or Caterpillar) will not be fulfilled. For our financial assets traded in an active market (Level 1 and certain Level 2), the nonperformance risk is included in the market price. For certain other financial assets and liabilities (Level 2 and 3), our fair value calculations have been adjusted accordingly.
Available-for-sale securities
Our available-for-sale securities, primarily at Cat Insurance, include a mix of equity and debt instruments (see Note 8 for additional information). Fair values for our U.S. treasury bonds and equity securities are based upon valuations for identical instruments in active markets. Fair values for other government bonds, corporate bonds and mortgage-backed debt securities are based upon models that take into consideration such market-based factors as recent sales, risk-free yield curves and prices of similarly rated bonds.
Derivative financial instruments
The fair value of interest rate swap derivatives is primarily based on models that utilize the appropriate market-based forward swap curves and zero-coupon interest rates to determine discounted cash flows. The fair value of foreign currency and commodity forward and option contracts is based on a valuation model that discounts cash flows resulting from the differential between the contract price and the market-based forward rate.
Securitized retained interests
The fair value of securitized retained interests is based upon a valuation model that calculates the present value of future expected cash flows using key assumptions for credit losses, prepayment rates and discount rates. These assumptions are based on our historical experience, market trends and anticipated performance relative to the particular assets securitized.
Guarantees
The fair value of guarantees is based upon the premium we would require to issue the same guarantee in a stand-alone arms-length transaction with an unrelated party. If quoted or observable market prices are not available, fair value is based upon internally developed models that utilize current market-based assumptions.
Assets and liabilities measured on a recurring basis at fair value, primarily related to Financial Products, included in our Consolidated Statement of Financial Position as of September 30, 2011 and December 31, 2010 are summarized below:
|
(Millions of dollars) |
|
September 30, 2011 |
|
||||||
|
|
|
Level 1 |
|
Level 2 |
|
Level 3 |
|
Total
|
|
|
Assets |
|
|
|
|
|
|
|
|
|
|
Available-for-sale securities |
|
|
|
|
|
|
|
|
|
|
Government debt |
|
|
|
|
|
|
|
|
|
|
U.S. treasury bonds |
|
$10 |
|
$— |
|
$— |
|
$10 |
|
|
Other U.S. and non-U.S. government bonds |
|
— |
|
74 |
|
— |
|
74 |
|
|
Corporate bonds |
|
|
|
|
|
|
|
|
|
|
Corporate bonds |
|
— |
|
556 |
|
— |
|
556 |
|
|
Asset-backed securities |
|
— |
|
116 |
|
— |
|
116 |
|
|
Mortgage-backed debt securities |
|
|
|
|
|
|
|
|
|
|
U.S. governmental agency mortgage-backed securities |
|
— |
|
290 |
|
— |
|
290 |
|
|
Residential mortgage-backed securities |
|
— |
|
32 |
|
— |
|
32 |
|
|
Commercial mortgage-backed securities |
|
— |
|
157 |
|
— |
|
157 |
|
|
Equity securities |
|
|
|
|
|
|
|
|
|
|
Large capitalization value |
|
122 |
|
— |
|
— |
|
122 |
|
|
Smaller company growth |
|
27 |
|
— |
|
— |
|
27 |
|
|
Total available-for-sale securities |
|
159 |
|
1,225 |
|
— |
|
1,384 |
|
|
Derivative financial instruments, net |
|
— |
|
261 |
|
— |
|
261 |
|
|
Total Assets |
|
$159 |
|
$1,486 |
|
$— |
|
$1,645 |
|
|
Liabilities |
|
|
|
|
|
|
|
|
|
|
Guarantees |
|
$— |
|
$— |
|
$7 |
|
$7 |
|
|
Total Liabilities |
|
$— |
|
$— |
|
$7 |
|
$7 |
|
|
|
|
|
|
|
|
|
|
|
|
|
(Millions of dollars) |
|
December 31, 2010 |
|
||||||
|
|
|
Level 1 |
|
Level 2 |
|
Level 3 |
|
Total
|
|
|
Assets |
|
|
|
|
|
|
|
|
|
|
Available-for-sale securities |
|
|
|
|
|
|
|
|
|
|
Government debt |
|
|
|
|
|
|
|
|
|
|
U.S. treasury bonds |
|
$12 |
|
$— |
|
$— |
|
$12 |
|
|
Other U.S. and non-U.S. government bonds |
|
— |
|
77 |
|
— |
|
77 |
|
|
Corporate bonds |
|
|
|
|
|
|
|
|
|
|
Corporate bonds |
|
— |
|
511 |
|
— |
|
511 |
|
|
Asset-backed securities |
|
— |
|
136 |
|
— |
|
136 |
|
|
Mortgage-backed debt securities |
|
|
|
|
|
|
|
|
|
|
U.S. governmental agency mortgage-backed securities |
|
— |
|
273 |
|
— |
|
273 |
|
|
Residential mortgage-backed securities |
|
— |
|
40 |
|
— |
|
40 |
|
|
Commercial mortgage-backed securities |
|
— |
|
168 |
|
— |
|
168 |
|
|
Equity securities |
|
|
|
|
|
|
|
|
|
|
Large capitalization value |
|
122 |
|
— |
|
— |
|
122 |
|
|
Smaller company growth |
|
31 |
|
— |
|
— |
|
31 |
|
|
Total available-for-sale securities |
|
165 |
|
1,205 |
|
— |
|
1,370 |
|
|
Derivative financial instruments, net |
|
— |
|
267 |
|
— |
|
267 |
|
|
Total Assets |
|
$165 |
|
$1,472 |
|
$— |
|
$1,637 |
|
|
Liabilities |
|
|
|
|
|
|
|
|
|
|
Guarantees |
|
$— |
|
$— |
|
$10 |
|
$10 |
|
|
Total Liabilities |
|
$— |
|
$— |
|
$10 |
|
$10 |
|
|
|
|
|
|
|
|
|
|
|
|
Below are roll-forwards of assets and liabilities measured at fair value using Level 3 inputs for the nine months ended September 30, 2011 and 2010. These instruments were valued using pricing models that, in management’s judgment, reflect the assumptions of a marketplace participant.
|
(Millions of dollars) |
|
Securitized
|
|
Guarantees |
|
|
Balance at December 31, 2010 |
|
$— |
|
$10 |
|
|
Issuance of guarantees |
|
— |
|
2 |
|
|
Expiration of guarantees |
|
— |
|
(5) |
|
|
Balance at September 30, 2011 |
|
$— |
|
$7 |
|
|
|
|
|
|
|
|
|
Balance at December 31, 2009 |
|
$102 |
|
$17 |
|
|
Adjustment to adopt accounting for variable-interest entities |
|
(102) |
|
— |
|
|
Issuance of guarantees |
|
— |
|
6 |
|
|
Expiration of guarantees |
|
— |
|
(6) |
|
|
Balance at September 30, 2010 |
|
$— |
|
$17 |
|
|
|
|
|
|
|
|
In addition to the amounts above, Cat Financial had impaired loans with a fair value of $185 million and $171 million as of September 30, 2011 and December 31, 2010, respectively. A loan is considered impaired when management determines that collection of contractual amounts due is not probable. In these cases, an allowance for credit losses is established based primarily on the fair value of associated collateral. As the collateral’s fair value is based on observable market prices and/or current appraised values, the impaired loans are classified as Level 2 measurements.
B. Fair values of financial instruments
In addition to the methods and assumptions we use to record the fair value of financial instruments as discussed in the Fair value measurements section above, we used the following methods and assumptions to estimate the fair value of our financial instruments.
Cash and short-term investments
Carrying amount approximated fair value.
Restricted cash and short-term investments
Carrying amount approximated fair value. Restricted cash and short-term investments are included in Prepaid expenses and other current assets in the Consolidated Statement of Financial Position.
Finance receivables
Fair value was estimated by discounting the future cash flows using current rates, representative of receivables with similar remaining maturities.
Wholesale inventory receivables
Fair value was estimated by discounting the future cash flows using current rates, representative of receivables with similar remaining maturities.
Short-term borrowings
Carrying amount approximated fair value.
Long-term debt
Fair value for Machinery and Power Systems fixed rate debt was estimated based on quoted market prices. For Financial Products, fixed and floating rate debt was estimated based on quoted market prices.
Please refer to the table below for the fair values of our financial instruments.
|
Fair Values of Financial Instruments |
|||||||||||
|
|
|
|
|
|
|
|
|
|
|
|
|
|
|
|
September 30, |
|
December 31, |
|
|
|
||||
|
|
|
2011 |
|
2010 |
|
|
|
||||
|
(Millions of dollars) |
|
Carrying
|
|
Fair
|
|
Carrying
|
|
Fair
|
|
Reference |
|
|
Assets |
|
|
|
|
|
|
|
|
|
|
|
|
Cash and short-term investments |
|
$3,229 |
|
$3,229 |
|
$3,592 |
|
$3,592 |
|
|
|
|
Restricted cash and short-term investments |
|
10 |
|
10 |
|
91 |
|
91 |
|
|
|
|
Available-for-sale securities |
|
1,384 |
|
1,384 |
|
1,370 |
|
1,370 |
|
Note 8 |
|
|
Finance receivables—net (excluding finance leases 1 ) |
|
12,452 |
|
12,283 |
|
12,568 |
|
12,480 |
|
Note 15 |
|
|
Wholesale inventory receivables—net (excluding finance leases 1 ) |
|
1,377 |
|
1,300 |
|
1,062 |
|
1,017 |
|
Note 15 |
|
|
Foreign currency contracts—net |
|
14 |
|
14 |
|
63 |
|
63 |
|
Note 4 |
|
|
Interest rate swaps—net |
|
261 |
|
261 |
|
187 |
|
187 |
|
Note 4 |
|
|
Commodity contracts—net |
|
— |
|
— |
|
17 |
|
17 |
|
Note 4 |
|
|
|
|
|
|
|
|
|
|
|
|
|
|
|
Liabilities |
|
|
|
|
|
|
|
|
|
|
|
|
Short-term borrowings |
|
3,914 |
|
3,914 |
|
4,056 |
|
4,056 |
|
|
|
|
Long-term debt (including amounts due within one year) |
|
|
|
|
|
|
|
|
|
|
|
|
Machinery and Power Systems |
|
8,975 |
|
10,743 |
|
5,000 |
|
5,968 |
|
|
|
|
Financial Products |
|
21,400 |
|
22,434 |
|
19,362 |
|
20,364 |
|
|
|
|
Commodity contracts—net |
|
14 |
|
14 |
|
— |
|
— |
|
Note 4 |
|
|
Guarantees |
|
7 |
|
7 |
|
10 |
|
10 |
|
Note 10 |
|
|
|
|
|
|
|
|
|
|
|
|
|
|
|
1 Total excluded items have a net carrying value at September 30, 2011 and December 31, 2010 of $7,304 million and $7,292 million, respectively. |
|||||||||||
18. Business Combinations and Divestitures
Bucyrus International, Inc.
On July 8, 2011, we completed our acquisition of Bucyrus International, Inc. (Bucyrus). Bucyrus is a designer, manufacturer and marketer of mining equipment for the surface and underground mining industries. The total purchase price was approximately $8.8 billion, consisting of $7.4 billion for the purchase of all outstanding shares of Bucyrus common stock at $92 per share and $1.6 billion of assumed Bucyrus debt, substantially all of which was repaid subsequent to closing, net of $0.2 billion of acquired cash.
We funded the acquisition using available cash, commercial paper borrowings and approximately $4.5 billion of long-term debt issued in May 2011. On May 24, 2011, we issued $500 million of Floating Rate Senior Notes (Three-month USD LIBOR plus 0.10%) due in 2012 and $750 million of Floating Rate Senior Notes (Three-month USD LIBOR plus 0.17%) due in 2013. The interest rates for the Floating Rate Senior Notes will be reset quarterly. We also issued $750 million of 1.375% Senior Notes due in 2014, $1.25 billion of 3.90% Senior Notes due in 2021, and $1.25 billion of 5.20% Senior Notes due in 2041. The Notes are unsecured obligations of Caterpillar and rank equally with all other senior unsecured indebtedness.
Bucyrus contributed sales of $1,135 million and a pretax loss of $200 million (inclusive of deal-related and integration costs) for the three months ended September 30, 2011. The results of the acquired business for the period from the acquisition date are included in the accompanying consolidated financial statements and are reported in the “Resource Industries” segment in Note 14.
For the six months ended June 30, 2011, we recorded acquisition costs of $249 million, which were primarily comprised of losses on interest rate swaps of $149 million and bridge financing costs of $54 million. For the three months ended September 30, 2011, we recorded additional deal-related and integration costs of $122 million, which were primarily comprised of severance and integration costs.
The following table summarizes the assets acquired and liabilities assumed as of the acquisition date at estimated fair value. These values represent a preliminary allocation of the purchase price subject to finalization of post-closing procedures, which may result in further adjustments to the values presented below.
|
(Millions of dollars) |
|
July 8, 2011 |
|
|
Assets |
|
|
|
|
Cash |
|
$203 |
|
|
Receivables – Trade & Other |
|
693 |
|
|
Prepaid expenses |
|
154 |
|
|
Inventories |
|
2,305 |
|
|
Property, plant and equipment – net |
|
692 |
|
|
Intangible assets |
|
3,901 |
|
|
Goodwill |
|
5,263 |
|
|
Other assets |
|
48 |
|
|
Liabilities |
|
|
|
|
Short-term borrowings |
|
24 |
|
|
Current portion - long-term debt |
|
16 |
|
|
Accounts payable |
|
444 |
|
|
Accrued expenses |
|
405 |
|
|
Customer advances |
|
668 |
|
|
Other current liabilities |
|
426 |
|
|
Long-term debt |
|
1,514 |
|
|
Other liabilities |
|
2,308 |
|
|
Net assets acquired |
|
$7,454 |
|
|
|
|
|
|
The following table is a summary of the fair value estimates of the acquired identifiable intangible assets, weighted—average useful lives, and balance of accumulated amortization as of September 30, 2011:
|
(Millions of dollars) |
|
Estimated fair value of
|
|
Weighted-average
|
|
Accumulated
|
|
|
Customer relationships |
|
$2,337 |
|
15 |
|
$36 |
|
|
Intellectual property |
|
1,489 |
|
12 |
|
28 |
|
|
Other |
|
75 |
|
4 |
|
4 |
|
|
Total |
|
$3,901 |
|
14 |
|
$68 |
|
|
|
|
|
|
|
|
|
|
The identifiable intangibles recorded as a result of the acquisition have been amortized from the acquisition date. Estimated aggregate amortization expense for the remainder of 2011 and the five succeeding years and thereafter is as follows:
|
(Millions of dollars) |
|||||||||||||
|
2011 |
|
2012 |
|
2013 |
|
2014 |
|
2015 |
|
2016 |
|
Thereafter |
|
|
$75 |
|
$299 |
|
$299 |
|
$299 |
|
$290 |
|
$280 |
|
$2,291 |
|
|
|
|
|
|
|
|
|
|
|
|
|
|
|
|
Goodwill in the amount of $5,263 million was recorded for the acquisition of Bucyrus and is included in the Resource Industries segment. Goodwill is calculated as the excess of the consideration transferred over the net assets recognized and represents the estimated future economic benefits arising from other assets acquired that could not be individually identified and separately recognized. Goodwill will not be amortized, but will be tested for impairment at least annually. Less than $400 million of the goodwill is deductible for tax purposes. Goodwill largely consists of expected synergies resulting from the acquisition. Key areas of expected cost savings include elimination of redundant selling, general and administrative expenses and increased purchasing power for raw materials and supplies. We also anticipate the acquisition will produce growth synergies as a result of the combined businesses’ broader product portfolio in the mining industry.
A single estimate of fair value results from a complex series of judgments about future events and uncertainties and relies heavily on estimates and assumptions. The judgments used to determine the estimated fair value assigned to each class of assets acquired and liabilities assumed, as well as asset lives, can materially impact our results of operations.
The unaudited pro forma results presented below include the effects of the Bucyrus acquisition as if it had occurred as of January 1, 2010. The unaudited pro forma results reflect certain adjustments related to the acquisition, such as the
amortization associated with estimates for the acquired intangible assets, fair value adjustments for inventory, contracts and the impact of acquisition financing. The 2011 supplemental pro forma earnings were adjusted to exclude $362 million of acquisition related costs, including consulting, legal, and advisory fees, severance costs and financing expense prior to debt issuance. The 2011 supplemental pro forma earnings were adjusted to exclude $160 million of nonrecurring expense related to the fair value adjustment to acquisition-date inventory and $25 million acceleration of Bucyrus stock compensation expense. The 2010 supplemental pro forma earnings were adjusted to include acquisition related costs and fair value adjustments to acquisition-date inventory.
The pro forma results do not include any anticipated synergies or other expected benefits of the acquisition. Accordingly, the unaudited pro forma financial information below is not necessarily indicative of either future results of operations or results that might have been achieved had the acquisition been completed on the dates indicated.
|
(Dollars in millions except per share data) |
|
Three months ended
|
|
Nine months ended
|
|
||||
|
|
|
2011 |
|
2010 |
|
2011 |
|
2010 |
|
|
Total Sales and revenues |
|
$15,811 |
|
$12,071 |
|
$45,038 |
|
$32,194 |
|
|
Profit (loss) |
|
$1,290 |
|
$825 |
|
$3,751 |
|
$1,340 |
|
|
Profit (loss) per common share |
|
$1.99 |
|
$1.30 |
|
$5.82 |
|
$2.13 |
|
|
Profit (loss) per common share — diluted |
|
$1.94 |
|
$1.27 |
|
$5.63 |
|
$2.07 |
|
Pyroban Group Limited
In August 2011, we acquired 100 percent of the stock of Pyroban Group Limited (Pyroban) for approximately $69 million. Pyroban is a leading provider of explosion protection safety solutions to the oil, gas, industrial and material handling markets headquartered in the United Kingdom with additional locations in the Netherlands, France, Singapore and China. We expect this acquisition will allow us to grow our existing position in the oil and gas industry and provide further differentiation versus competition.
The transaction was financed with available cash. Net tangible assets acquired and liabilities assumed of $6 million were recorded at their fair values. Finite-lived intangible assets acquired of $40 million included customer relationships and trademarks are being amortized on a straight-line basis over a weighted-average amortization period of approximately 15 years. Goodwill of $23 million, non-deductible for income tax purposes, represents the excess of cost over the fair value of net tangible and finite-lived intangible assets acquired. The results of the acquired business for the period from the acquisition date are included in the accompanying consolidated financial statements and reported in the “Power Systems” segment in Note 14. Assuming this transaction had been made at the beginning of any period presented, the consolidated pro forma results would not be materially different from reported results.
Balfour Beatty’s Trackwork Business
In May 2011, we acquired 100 percent of the assets and certain liabilities of the United Kingdom trackwork business from Balfour Beatty Rail Limited for approximately $60 million. The trackwork division specializes in the design and manufacture of special trackwork and associated products for the United Kingdom and international rail markets. The acquisition supports our strategic initiative to expand the scope and product range of our rail business.
The transaction was financed with available cash. Tangible assets acquired of $82 million, recorded at their fair values, included receivables of $18 million, inventory of $12 million, and property, plant and equipment of $52 million. Liabilities assumed of $22 million, recorded at their fair values, primarily were accounts payable of $10 million and accrued expenses of $10 million. The results of the acquired business for the period from the acquisition date are included in the accompanying consolidated financial statements and are reported in the “Power Systems” segment in Note 14. Assuming this transaction had been made at the beginning of any period presented, the consolidated pro forma results would not be materially different from reported results.
Carter Machinery
In March 2011, we sold 100 percent of the equity in Carter Machinery Company Inc. for $358 million. Carter Machinery is a Caterpillar dealership headquartered in Salem, Virginia, and has operations and stores covering Virginia and nine counties in southeast West Virginia. The current senior management of Carter Machinery, which led the buy-out of Carter Machinery
from Caterpillar, remained in place. A retired Caterpillar Vice President is now CEO and principal owner of Carter Machinery. Caterpillar had owned Carter Machinery since 1988. Carter Machinery was the only dealership in the United States that was not independently owned. Continued Caterpillar ownership did not align with our comprehensive business strategy, resulting in the sale.
As part of the divestiture, Cat Financial provided $348 million of financing to the buyer. The loan is included in Receivables – finance and Long-term receivables – finance in the Consolidated Statement of Financial Position. We recorded a pre-tax gain of $18 million included in Other operating (income) expenses in the Consolidated Statement of Results of Operations. The sale does not qualify as discontinued operations because Caterpillar expects significant continuing direct cash flows from Carter Machinery after the divestiture. The sale of Carter Machinery was not material to our results of operations, financial position or cash flow.
19. Subsequent Events
Motoren-Werke Mannheim (MWM)
On October 31, 2011, we completed our acquisition of MWM Holding GmbH (MWM). Headquartered in Mannheim, Germany, MWM is a provider of natural gas and alternative fuel engines and decentralized energy solutions. The total purchase price was approximately €580 million (approximately $800 million), which includes a preliminary working capital adjustment anticipated to be finalized in the fourth quarter. The purchase price was funded with available cash.
Due to the limited time since the date of the acquisition, the initial accounting for this business combination is incomplete as of the date of this filing. As such, we are not able to make certain business combination disclosures at this time including amounts to be recognized at the acquisition date for the major classes of assets acquired and liabilities assumed, including pre-acquisition contingencies, goodwill and other intangibles.
Overview
We reported third-quarter 2011 profit per share of $1.71, a 40-percent improvement from $1.22 per share in the third quarter of 2010. Profit was $1.141 billion in the third quarter of 2011, an increase of 44 percent from $792 million in the third quarter of 2010. Sales and revenues of $15.716 billion were up 41 percent from $11.134 billion in the third quarter of 2010. Excluding the impacts of the acquisition of Bucyrus International, Inc. (Bucyrus), profit was $1.93 per share, a 58-percent improvement from $1.22 per share in the third quarter of 2010. Sales and revenues excluding Bucyrus were $14.581 billion, a 31-percent improvement from the third quarter of 2010.
Profit per share for the nine months ended September 30, 2011 was $5.08 per share, an increase of $2.40 per share from a profit of $2.68 per share for the nine months ended September 30, 2010. Profit of $3.381 billion was 95 percent higher than profit of $1.732 billion for the nine months ended September 30, 2010. Sales and revenues of $42.895 billion were up 44 percent from $29.781 for the nine months ended September 30, 2010. Excluding the impacts of the acquisition of Bucyrus, profit was $5.54 per share, a 107-percent improvement from $2.68 per share for the nine months ended September 30, 2010. Sales and revenues excluding Bucyrus were $41.760 billion, a 40-percent improvement from the nine months ended September 30, 2010.
Customer demand around the world continues to improve, and our sales and revenues in the third quarter were the highest of any previous quarter. In addition, excluding the impact of Bucyrus, our profit was the highest of any previous quarter in our history. As a result, we continue to make investments in our business to support our expected long-term growth opportunities.
Highlights for the third quarter of 2011 include:
· Third-quarter sales and revenues were $15.716 billion, which included $1.135 billion of sales related to the Bucyrus acquisition. Sales and revenues excluding Bucyrus were $14.581 billion, up more than 30 percent from the third quarter of 2010.
· Profit per share was $1.71, including a negative impact of $0.22 due to the acquisition of Bucyrus. Profit per share excluding Bucyrus was $1.93, up 58 percent from the third quarter of 2010.
· Machinery and Power Systems (M&PS) operating cash flow was $6.148 billion through the first three quarters of 2011, compared with $3.330 billion in the first three quarters of 2010—an increase of 85 percent.
· M&PS debt-to-capital ratio was 41.1 percent at the end of the third quarter of 2011, down from 42.6 percent at the end of the second quarter of 2011.
Notes:
- Glossary of terms is included on pages 66-67; first occurrence of terms shown in bold italics.
- Information on non-GAAP financial measures is included on page 76.
Consolidated Results of Operations
THREE MONTHS ENDED SEPTEMBER 30, 2011 COMPARED WITH THREE MONTHS ENDED SEPTEMBER 30, 2010
CONSOLIDATED SALES AND REVENUES
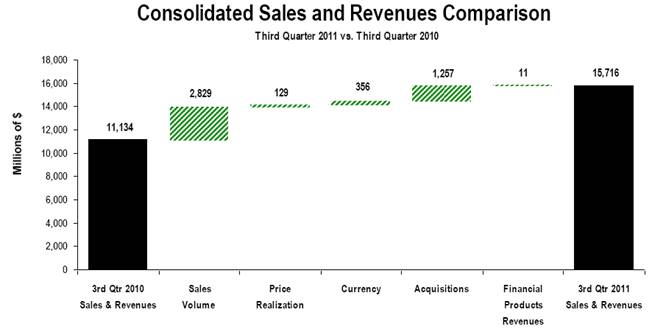
The chart above graphically illustrates reasons for the change in Consolidated Sales and Revenues between the third quarter of 2010 (at left) and the third quarter of 2011 (at right). Items favorably impacting sales and revenues appear as upward stair steps with the corresponding dollar amounts above each bar, while items negatively impacting sales and revenues appear as downward stair steps with dollar amounts reflected in parentheses above each bar. The bar entitled Sales Volume includes the sales impact of the divestiture of Carter Machinery Company, Inc. (Carter). Caterpillar management utilizes these charts internally to visually communicate with the company’s Board of Directors and employees.
Total sales and revenues were $15.716 billion in the third quarter of 2011, an increase of $4.582 billion, or 41 percent, from the third quarter of 2010.
The improvement was largely a result of $2.829 billion higher sales volume . While sales for new equipment and after-market parts improved, the most significant increase was for new equipment. Price realization improved $129 million, and c urrency impacts added $356 million. Bucyrus, which was acquired during the third quarter of 2011, added a further $1.135 billion in sales. Sales for Electro-Motive Diesel (EMD), which was acquired during the third quarter of 2010, increased $122 million. Financial Products revenues improved slightly.
The improvement in sales volume occurred across the world in all geographic regions and in nearly all segments. The volume increase was primarily the result of higher deliveries to end users. Dealer-reported new machine inventory levels were up more than $650 million during the quarter, while they were up about $200 million during the third quarter of 2010. Dealer-reported inventory in months of supply was higher than the end of the third quarter of 2010 but similar to the historical average.
Growth in the global economy improved demand for commodities, and commodity prices remained attractive for investment. This was positive for mining in all regions of the world.
Construction activity continued to grow in many developing countries. In developed countries, despite a continued weak level of construction activity, sales increased as a result of customers upgrading machine fleets and replacing some older equipment and dealers refreshing some equipment in their rental fleets .
Power Systems sales increased as a result of worldwide economic growth, energy prices at levels that encouraged continued investment, higher sales for our rail products and services and increased demand from industrial engine customers that manufacture agricultural and construction equipment.
CONSOLIDATED OPERATING PROFIT
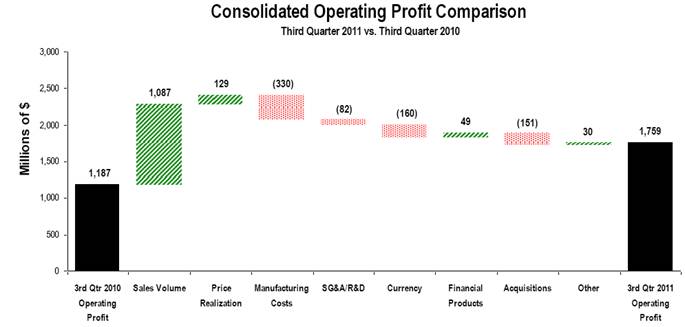
The chart above graphically illustrates reasons for the change in Consolidated Operating Profit between the third quarter of 2010 (at left) and the third quarter of 2011 (at right). Items favorably impacting operating profit appear as upward stair steps with the corresponding dollar amounts above each bar, while items negatively impacting operating profit appear as downward stair steps with dollar amounts reflected in parentheses above each bar. Caterpillar management utilizes these charts internally to visually communicate with the company’s Board of Directors and employees. The bar entitled Other includes the operating profit impact of the divestiture of Carter and consolidating adjustments and Machinery and Power Systems other operating (income) expenses .
Operating profit for the third quarter of 2011 was $1.759 billion compared with $1.187 billion for the third quarter of 2010. The improvement was primarily the result of higher sales volume and better price realization. The improvements were partially offset by higher manufacturing costs , the negative impact of currency, acquisitions, and higher selling, general and administrative (SG&A) and research and development (R&D) expenses.
Manufacturing costs were up $330 million, primarily due to higher period costs related to increased production volume, capacity expansion programs and higher incentive compensation. Material and freight costs were up from the third quarter of 2010. The increase in material costs was primarily due to higher steel costs.
SG&A and R&D expenses increased 6 percent, which we believe demonstrates strong cost control given the significant increase in sales. The $82 million increase was primarily due to higher volume, increased costs to support product programs and higher incentive compensation, partially offset by a favorable change in mark-to-market deferred compensation expense.
Currency had a $160 million unfavorable impact on operating profit as the benefit from $356 million on sales was more than offset by a negative $516 million impact on costs. The unfavorable currency impact was primarily due to the Japanese yen and the British pound.
Financial Products’ operating profit improved by $49 million.
Operating profit was negatively impacted by $143 million related to Bucyrus, while EMD negatively impacted operating profit by $8 million.
Short-term incentive compensation was about $315 million for the third quarter 2011 compared to about $240 million in the third quarter of 2010.
Sales and revenues increased $4.582 billion from the third quarter of 2010 to the third quarter of 2011, and operating profit increased $572 million. The resulting incremental operating profit rate is 12 percent. Excluding the acquisition of EMD and Bucyrus, incremental operating profit was 22 percent. Excluding the acquisition of EMD, Bucyrus and currency impacts, incremental operating profit was 30 percent.
Other Profit/Loss Items
· Interest expense excluding Financial Products increased $27 million from the third quarter of 2010 due to debt issued to complete the acquisition of Bucyrus.
· Other income/expense was expense of $13 million compared with income of $1 million in the third quarter of 2010.
· The provision for income taxes in the third quarter reflects an estimated annual effective tax rate of 29 percent compared with 28 percent for the third quarter of 2010. The third quarter of 2010 tax provision also included a $14 million benefit related to a decrease in the estimated annual effective tax rate. The 2011 estimated effective tax rate of 29 percent is higher than the comparable full-year 2010 rate of 25 percent primarily due to an expected change in our geographic mix of profits from a tax perspective.
Segment Information
Sales and Revenues by Geographic Region
|
(Millions of dollars) |
|
Total |
|
%
|
|
North
|
|
%
|
|
Latin
|
|
%
|
|
EAME |
|
%
|
|
Asia/
|
|
%
|
|
|
Third Quarter 2011 |
|
|
|
|
|
|
|
|
|
|
|
|
|
|
|
|
|
|
|
|
|
|
Construction Industries 1 |
|
$4,900 |
|
41% |
|
$1,549 |
|
35% |
|
$812 |
|
53% |
|
$1,104 |
|
55% |
|
$1,435 |
|
33% |
|
|
Resource Industries 2 |
|
4,599 |
|
103% |
|
1,318 |
|
66% |
|
845 |
|
64% |
|
980 |
|
133% |
|
1,456 |
|
173% |
|
|
Power Systems 3 |
|
5,075 |
|
21% |
|
2,173 |
|
34% |
|
534 |
|
(12)% |
|
1,536 |
|
26% |
|
832 |
|
11% |
|
|
All Other Segments 4 |
|
461 |
|
(16)% |
|
188 |
|
(39)% |
|
20 |
|
(35)% |
|
150 |
|
19% |
|
103 |
|
20% |
|
|
Corporate Items and Eliminations |
|
(12) |
|
|
|
(12) |
|
|
|
— |
|
|
|
— |
|
|
|
— |
|
|
|
|
Machinery & Power Systems Sales |
|
15,023 |
|
44% |
|
5,216 |
|
35% |
|
2,211 |
|
31% |
|
3,770 |
|
53% |
|
3,826 |
|
56% |
|
|
|
|
|
|
|
|
|
|
|
|
|
|
|
|
|
|
|
|
|
|
|
|
|
Financial Products Segment |
|
757 |
|
3% |
|
413 |
|
(7)% |
|
98 |
|
26% |
|
110 |
|
8% |
|
136 |
|
18% |
|
|
Corporate Items and Eliminations |
|
(64) |
|
|
|
(37) |
|
|
|
(12) |
|
|
|
(7) |
|
|
|
(8) |
|
|
|
|
Financial Products Revenues |
|
693 |
|
2% |
|
376 |
|
(4)% |
|
86 |
|
15% |
|
103 |
|
1% |
|
128 |
|
14% |
|
|
|
|
|
|
|
|
|
|
|
|
|
|
|
|
|
|
|
|
|
|
|
|
|
Consolidated Sales and Revenues |
|
$15,716 |
|
41% |
|
$5,592 |
|
32% |
|
$2,297 |
|
31% |
|
$3,873 |
|
51% |
|
$3,954 |
|
55% |
|
|
|
|
|
|
|
|
|
|
|
|
|
|
|
|
|
|
|
|
|
|
|
|
|
|
|
|
|
|
|
|
|
|
|
|
|
|
|
|
|
|
|
|
|
|
|
|
Third Quarter 2010 |
|
|
|
|
|
|
|
|
|
|
|
|
|
|
|
|
|
|
|
|
|
|
Construction Industries 1 |
|
$3,466 |
|
|
|
$1,146 |
|
|
|
$531 |
|
|
|
$710 |
|
|
|
$1,079 |
|
|
|
|
Resource Industries 2 |
|
2,262 |
|
|
|
793 |
|
|
|
516 |
|
|
|
420 |
|
|
|
533 |
|
|
|
|
Power Systems 3 |
|
4,196 |
|
|
|
1,623 |
|
|
|
606 |
|
|
|
1,218 |
|
|
|
749 |
|
|
|
|
All Other Segments 4 |
|
550 |
|
|
|
307 |
|
|
|
31 |
|
|
|
126 |
|
|
|
86 |
|
|
|
|
Corporate Items and Eliminations |
|
(22) |
|
|
|
(14) |
|
|
|
— |
|
|
|
(6) |
|
|
|
(2) |
|
|
|
|
Machinery & Power Systems Sales |
|
10,452 |
|
|
|
3,855 |
|
|
|
1,684 |
|
|
|
2,468 |
|
|
|
2,445 |
|
|
|
|
|
|
|
|
|
|
|
|
|
|
|
|
|
|
|
|
|
|
|
|
|
|
|
Financial Products Segment |
|
737 |
|
|
|
442 |
|
|
|
78 |
|
|
|
102 |
|
|
|
115 |
|
|
|
|
Corporate Items and Eliminations |
|
(55) |
|
|
|
(49) |
|
|
|
(3) |
|
|
|
— |
|
|
|
(3) |
|
|
|
|
Financial Products Revenues |
|
682 |
|
|
|
393 |
|
|
|
75 |
|
|
|
102 |
|
|
|
112 |
|
|
|
|
|
|
|
|
|
|
|
|
|
|
|
|
|
|
|
|
|
|
|
|
|
|
|
Consolidated Sales and Revenues |
|
$11,134 |
|
|
|
$4,248 |
|
|
|
$1,759 |
|
|
|
$2,570 |
|
|
|
$2,557 |
|
|
|
1 Does not include inter-segment sales of $162 million and $179 million in the third quarter 2011 and 2010, respectively.
2 Does not include inter-segment sales of $290 million and $206 million in the third quarter 2011 and 2010, respectively.
3 Does not include inter-segment sales of $600 million and $485 million in the third quarter 2011 and 2010, respectively.
4 Does not include inter-segment sales of $913 million and $748 million in the third quarter 2011 and 2010, respectively.
Sales and Revenues by Segment
|
(Millions of dollars) |
|
Third
|
|
Sales
|
|
Price
|
|
Currency |
|
Acquisitions |
|
Other |
|
Third
|
|
$
|
|
%
|
|
|
|
|
|
|
|
|
|
|
|
|
|
|
|
|
|
|
|
|
|
|
|
Construction Industries |
|
$3,466 |
|
$1,196 |
|
$51 |
|
$187 |
|
$— |
|
$— |
|
$4,900 |
|
$1,434 |
|
41% |
|
|
Resource Industries |
|
2,262 |
|
1,124 |
|
27 |
|
51 |
|
1,135 |
|
— |
|
4,599 |
|
2,337 |
|
103% |
|
|
Power Systems |
|
4,196 |
|
595 |
|
64 |
|
98 |
|
122 |
|
— |
|
5,075 |
|
879 |
|
21% |
|
|
All Other Segments |
|
550 |
|
(109) |
|
— |
|
20 |
|
— |
|
— |
|
461 |
|
(89) |
|
(16)% |
|
|
Corporate Items and Eliminations |
|
(22) |
|
23 |
|
(13) |
|
— |
|
— |
|
— |
|
(12) |
|
10 |
|
|
|
|
Machinery & Power Systems Sales |
|
10,452 |
|
2,829 |
|
129 |
|
356 |
|
1,257 |
|
— |
|
15,023 |
|
4,571 |
|
44% |
|
|
|
|
|
|
|
|
|
|
|
|
|
|
|
|
|
|
|
|
|
|
|
Financial Products Segment |
|
737 |
|
— |
|
— |
|
— |
|
— |
|
20 |
|
757 |
|
20 |
|
3% |
|
|
Corporate Items and Eliminations |
|
(55) |
|
— |
|
— |
|
— |
|
— |
|
(9) |
|
(64) |
|
(9) |
|
|
|
|
Financial Products Revenues |
|
682 |
|
— |
|
— |
|
— |
|
— |
|
11 |
|
693 |
|
11 |
|
2% |
|
|
|
|
|
|
|
|
|
|
|
|
|
|
|
|
|
|
|
|
|
|
|
Consolidated Sales and Revenues |
|
$11,134 |
|
$2,829 |
|
$129 |
|
$356 |
|
$1,257 |
|
$11 |
|
$15,716 |
|
$4,582 |
|
41% |
|
Operating Profit by Segment
|
(Millions of dollars) |
|
Third
|
|
Third
|
|
$ Change |
|
%
|
|
|
Construction Industries |
|
$496 |
|
$246 |
|
$250 |
|
102% |
|
|
Resource Industries |
|
745 |
|
538 |
|
207 |
|
38% |
|
|
Power Systems |
|
794 |
|
694 |
|
100 |
|
14% |
|
|
All Other Segments |
|
234 |
|
200 |
|
34 |
|
17% |
|
|
Corporate Items and Eliminations |
|
(589) |
|
(532) |
|
(57) |
|
|
|
|
Machinery & Power Systems |
|
1,680 |
|
1,146 |
|
534 |
|
47% |
|
|
|
|
|
|
|
|
|
|
|
|
|
Financial Products Segment |
|
145 |
|
108 |
|
37 |
|
34% |
|
|
Corporate Items and Eliminations |
|
— |
|
(12) |
|
12 |
|
|
|
|
Financial Products |
|
145 |
|
96 |
|
49 |
|
51% |
|
|
Consolidating Adjustments |
|
(66) |
|
(55) |
|
(11) |
|
|
|
|
Consolidated Operating Profit |
|
$1,759 |
|
$1,187 |
|
$572 |
|
48% |
|
Construction Industries
Construction Industries’ sales were $4.900 billion in the third quarter of 2011, an increase of $1.434 billion, or 41 percent, from the third quarter of 2010. The improvement in sales was a result of significantly higher sales volume in all geographic regions and across all major products. While sales for new equipment and after-market parts improved, the most significant increase was for new equipment. In addition to volume, sales were higher as a result of currency impacts from a weaker U.S. dollar.
Continuing economic growth in most developing countries resulted in higher sales overall. New machine sales were above or near record levels across much of the developing world. China was an exception, where machine industry sales to end users were lower in the third quarter of 2011 than in the third quarter of 2010 as a result of economic tightening by the Chinese government to reduce inflation. However, our sales in China were higher in the third quarter of 2011 than in the third quarter of 2010 as dealer deliveries to end users, while down, held up better than the industry overall, and machine production was sufficient to allow dealers to build inventory for the upcoming selling season.
In most developed countries, sales increased significantly despite relatively weak construction activity. The improvement in sales was largely driven by the need for customers to upgrade machine fleets and replace older equipment and dealers refreshing some equipment in their rental fleets. Despite the increase from a year ago, sales of new machines to customers in developed countries remain significantly below previous peak levels. The size of rental fleets increased slightly from post-recession lows, but the average age remained near the historical high.
Construction Industries’ profit was $496 million in the third quarter of 2011 compared with $246 million in the third quarter of 2010. The increase in profit was primarily due to higher sales volume, which included the impact of an unfavorable mix of products, and improved price realization. The benefit from higher sales was partially offset by increased period manufacturing costs and higher freight and variable labor costs. The period cost increase is primarily due to higher production volume and start-up costs associated with global capacity expansion.
Resource Industries
Resource Industries’ sales were $4.599 billion in the third quarter of 2011, an increase of $2.337 billion, or 103 percent, from the third quarter of 2010. About half of the sales increase was from the acquisition of Bucyrus during the third quarter of 2011, and about half was from higher sales volume.
Metals prices softened during the third quarter of 2011 in response to economic concerns, but production continued to increase. While commodity prices have decreased from previously high levels, we believe prices remain favorable for investment, and that is driving significant demand for our large mining products and improved parts sales.
Bucyrus sales were $1.135 billion in the third quarter of 2011, with $266 million in North America, $185 million in Latin America , $248 million in EAME and $436 million in Asia/Pacific.
Resource Industries’ profit was $745 million in the third quarter of 2011 compared with $538 million in the third quarter of 2010. The acquisition of Bucyrus negatively impacted profit by $143 million.
Excluding Bucyrus, Resource Industries’ profit increased $350 million, primarily due to higher sales volume. The improvement was partially offset by higher manufacturing and R&D costs. The increase in manufacturing costs was primarily due to higher period, freight and material costs.
Power Systems
Power Systems’ sales were $5.075 billion in the third quarter of 2011, an increase of $879 million, or 21 percent, from the third quarter of 2010. The improvement was a result of higher sales volume for both new equipment and parts, the acquisition of EMD, currency and price realization. Sales were up in all geographic regions except for Latin America, which declined as a result of the absence of two large orders for turbines in the third quarter of 2010.
Worldwide demand for energy at price levels that encourage continued investment has resulted in higher demand for engines and turbines for petroleum applications. Sales of our rail products and services and industrial engines also increased.
Power Systems’ profit was $794 million in the third quarter of 2011 compared with $694 million in the third quarter of 2010. The improvement was primarily due to higher sales volume, which included the impact of an unfavorable mix of products, and improved price realization. The improvements were partially offset by higher manufacturing costs, primarily driven by higher period costs and facility start-up expenses, and SG&A expense.
Sales for EMD, which was acquired on August 2, 2010, increased $122 million, and profit for EMD decreased by $6 million.
Financial Products Segment
Financial Products’ revenues were $757 million, an increase of $20 million, or 3 percent, from the third quarter of 2010. The increase was primarily due to the impact from higher average earning assets and higher miscellaneous net revenues, partially offset by an unfavorable impact from lower interest rates on new and existing finance receivables.
Financial Products’ profit was $145 million in the third quarter of 2011, compared with $108 million in the third quarter of 2010. The increase was primarily due to a $17 million decrease in provision expense at Cat Financial, a $14 million favorable impact from miscellaneous net revenues and a $13 million favorable impact from higher net yield on average earning assets.
At the end of the third quarter of 2011, past dues at Cat Financial were 3.54 percent, a decrease from 3.73 percent at the end of the second quarter of 2011, 3.87 percent at the end of 2010 and 4.88 percent at the end of the third quarter of 2010. Write-offs, net of recoveries, were $50 million for the third quarter of 2011, down from $78 million in the third quarter of 2010.
As of September 30, 2011, Cat Financial’s allowance for credit losses totaled $362 million, or 1.49 percent of net finance receivables, compared with $363 million, or 1.57 percent of net finance receivables, at year-end 2010. The allowance for credit losses as of September 30, 2010, was $367 million, which was 1.61 percent of net finance receivables.
Corporate Items and Eliminations
Expense for corporate items and eliminations was $589 million in the third quarter of 2011, an increase of $45 million from the third quarter of 2010. Corporate items and eliminations include corporate-level expenses; timing differences, as some expenses are reported in segment profit on a cash basis; retirement benefit costs other than service cost; currency differences, as segment profit is reported using annual fixed exchange rates, and inter-segment eliminations.
Segment profit for 2011 is based on fixed exchange rates set at the beginning of 2011, while segment profit for 2010 is based on fixed exchange rates set at the beginning of 2010. The difference in actual exchange rates compared with fixed exchange rates is included in Corporate items and eliminations and is not reflected in segment profit. The increased expense for Corporate items and eliminations includes currency differences not allocated to segments, as third-quarter 2011 actual exchange rates were unfavorable compared with 2011 fixed exchange rates. In addition, corporate level expenses increased, but were partially offset by favorable impacts of timing differences and mark-to-market deferred compensation expense.
NINE MONTHS ENDED SEPTEMBER 30, 2011 COMPARED WITH NINE MONTHS ENDED SEPTEMBER 30, 2010
CONSOLIDATED SALES AND REVENUES
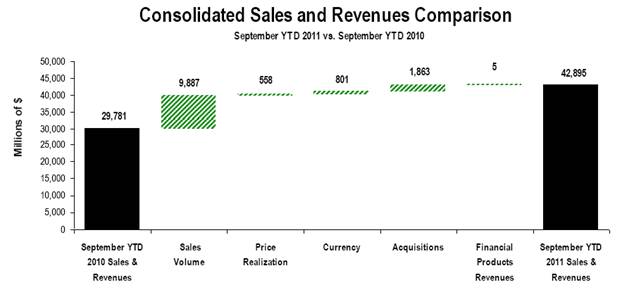
The chart above graphically illustrates reasons for the change in Consolidated Sales and Revenues between the nine months ended September 30, 2010 (at left) and the nine months ended September 30, 2011 (at right). Items favorably impacting sales and revenues appear as upward stair steps with the corresponding dollar amounts above each bar, while items negatively impacting sales and revenues appear as downward stair steps with dollar amounts reflected in parentheses above each bar. The bar entitled Sales Volume includes the sales impact of the divestiture of Carter. Caterpillar management utilizes these charts internally to visually communicate with the company’s Board of Directors and employees.
Total sales and revenues were $42.895 billion in the nine months ended September 30, 2011, an increase of $13.114 billion, or 44 percent, from the nine months ended September 30, 2010.
The improvement was largely a result of $9.887 billion higher sales volume. While sales for new equipment and after-market parts improved, the most significant increase was for new equipment. Currency impacts added $801 million in sales, and price realization improved $558 million. Bucyrus, which was acquired during the third quarter of 2011, added a further $1.135 billion in sales. Sales for EMD, which was acquired during the third quarter of 2010, increased sales by $728 million. Financial Products revenues were about flat.
The improvement in sales volume occurred across the world in all geographic regions and in nearly all segments. The volume increase was primarily the result of higher deliveries to end users. Dealer-reported new machine inventory levels increased about $1.800 billion during the first nine months of 2011 and were higher in all regions. By product category, machines for mining have
increased the most and account for about 40 percent of the year-to-date increase. Dealer-reported new machine inventory levels increased modestly, about $150 million, during the first nine months of 2010.
Growth in the global economy improved demand for commodities and commodity prices remained attractive for investment. This was positive for mining in all regions of the world.
Construction activity continued to grow in most developing countries. In developed countries, despite a continued weak level of construction activity, sales increased as a result of customers upgrading machine fleets and replacing some older equipment and dealers refreshing some equipment in their rental fleets .
Power Systems sales increased as a result of worldwide economic growth, energy prices at levels that encourage continued investment, strong demand for electric power and increased demand from industrial engine customers that manufacture agricultural and construction equipment.
CONSOLIDATED OPERATING PROFIT
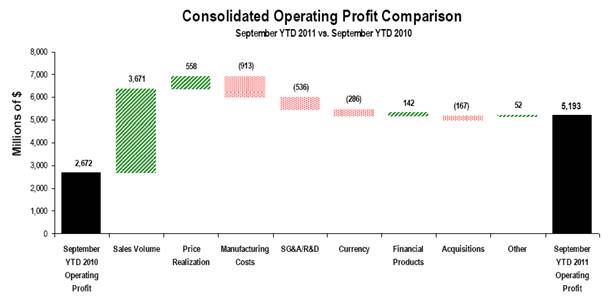
The chart above graphically illustrates reasons for the change in Consolidated Operating Profit between the nine months ended September 30, 2010 (at left) and the nine months ended September 30, 2011 (at right). Items favorably impacting operating profit appear as upward stair steps with the corresponding dollar amounts above each bar, while items negatively impacting operating profit appear as downward stair steps with dollar amounts reflected in parentheses above each bar. Caterpillar management utilizes these charts internally to visually communicate with the company’s Board of Directors and employees. The bar entitled Other includes the operating profit impact of the divestiture of Carter and consolidating adjustments and Machinery and Power Systems other operating (income) expenses.
Operating profit for the nine months ended September 30, 2011 was $5.193 billion compared with $2.672 billion for the nine months ended September 30, 2010. The improvement was primarily the result of higher sales volume and better price realization. The improvements were partially offset by higher manufacturing costs, higher SG&A and R&D expenses and the negative impact of currency.
Manufacturing costs were up $913 million, primarily due to higher period costs related to increased production volume, capacity expansion programs and higher incentive compensation. Material and freight costs were up from the first nine months of 2010. The increase in material was primarily due to higher steel costs.
SG&A and R&D increased by $536 million primarily due to increased costs to support product programs, higher incentive compensation and higher volume. Currency had a $286 million unfavorable impact on operating profit as the benefit from $801 million on sales was more than offset by a negative $1.087 billion impact on costs. The unfavorable currency impact was primarily due to the Japanese yen. Financial Products’ operating profit improved by $142 million.
Operating profit was negatively impacted by $178 million related to Bucyrus, while the acquisition of EMD increased operating profit by $11 million.
Short-term incentive compensation was about $840 million for the first nine months of 2011 compared to about $545 million in the first nine months of 2010.
Sales and revenues increased $13.114 billion from the first nine months of 2010 to the first nine months of 2011, and operating profit increased $2.521 billion. The resulting incremental operating profit rate is 19 percent. Excluding the acquisition of EMD and Bucyrus, incremental operating profit was 24 percent. Excluding the acquisition of EMD, Bucyrus and currency impacts, incremental operating profit was 28 percent.
Other Profit/Loss Items
· Interest expense excluding Financial Products increased $21 million from the first nine months of 2010 due to debt issued to complete the acquisition of Bucyrus.
· Other income/expense was expense of $157 million compared with income of $114 million in the first nine months of 2010. The unfavorable change was primarily a result of losses on interest rate swaps put in place in anticipation of issuing debt for the acquisition of Bucyrus and costs for the bridge financing facility related to the Bucyrus acquisition.
· The provision for income taxes reflects an estimated annual effective tax rate of 29 percent for the first nine months 2011 compared to 28 percent for the first nine months of 2010, excluding the discrete items discussed below. The 2011 estimated annual effective tax rate of 29 percent is higher than the comparable full-year 2010 rate of 25 percent primarily due to an expected change in our geographic mix of profits from a tax perspective.
The provision for income taxes for 2011 also includes a net benefit of $72 million due to planned repatriation of non-U.S. earnings with available foreign tax credits in excess of the U.S. tax liability on the dividend offset by an increase in prior year unrecognized tax benefits. The 2010 provision for income taxes included a net charge of $30 million due to the enactment of U.S. healthcare legislation, effectively making government subsidies received for Medicare equivalent prescription drug coverage taxable, offset by refund claims for prior tax years and a release of a valuation allowance.
· Equity in profit/loss of unconsolidated affiliated companies negatively impacted profit by $11 million compared to the first nine months of 2010. The change was primarily related to NC 2 , our joint venture with Navistar.
Segment Information
Sales and Revenues by Geographic Region
|
(Millions of dollars) |
|
Total |
|
%
|
|
North
|
|
%
|
|
Latin
|
|
%
|
|
EAME |
|
%
|
|
Asia/
|
|
%
|
|
|
Nine months ended September 30, 2011 |
|
|
|
|
|
|
|
|
|
|
|
|
|
|
|
|
|
|
|
|
|
|
Construction Industries 1 |
|
$14,312 |
|
51% |
|
$4,242 |
|
53% |
|
$2,268 |
|
57% |
|
$3,546 |
|
74% |
|
$4,256 |
|
32% |
|
|
Resource Industries 2 |
|
10,573 |
|
80% |
|
3,269 |
|
66% |
|
2,060 |
|
59% |
|
2,266 |
|
108% |
|
2,978 |
|
98% |
|
|
Power Systems 3 |
|
14,442 |
|
33% |
|
6,128 |
|
38% |
|
1,641 |
|
25% |
|
4,059 |
|
33% |
|
2,614 |
|
27% |
|
|
All Other Segments 4 |
|
1,525 |
|
(3)% |
|
735 |
|
(16)% |
|
77 |
|
(11)% |
|
440 |
|
10% |
|
273 |
|
32% |
|
|
Corporate Items and Eliminations |
|
(17) |
|
|
|
(17) |
|
|
|
— |
|
|
|
— |
|
|
|
— |
|
|
|
|
Machinery & Power Systems Sales |
|
40,835 |
|
47% |
|
14,357 |
|
43% |
|
6,046 |
|
46% |
|
10,311 |
|
57% |
|
10,121 |
|
45% |
|
|
|
|
|
|
|
|
|
|
|
|
|
|
|
|
|
|
|
|
|
|
|
|
|
Financial Products Segment |
|
2,251 |
|
1% |
|
1,274 |
|
(5)% |
|
267 |
|
18% |
|
328 |
|
1% |
|
382 |
|
18% |
|
|
Corporate Items and Eliminations |
|
(191) |
|
|
|
(133) |
|
|
|
(22) |
|
|
|
(15) |
|
|
|
(21) |
|
|
|
|
Financial Products Revenues |
|
2,060 |
|
—% |
|
1,141 |
|
(5)% |
|
245 |
|
12% |
|
313 |
|
(3)% |
|
361 |
|
15% |
|
|
|
|
|
|
|
|
|
|
|
|
|
|
|
|
|
|
|
|
|
|
|
|
|
Consolidated Sales and Revenues |
|
$42,895 |
|
44% |
|
$15,498 |
|
38% |
|
$6,291 |
|
44% |
|
$10,624 |
|
54% |
|
$10,482 |
|
44% |
|
|
|
|
|
|
|
|
|
|
|
|
|
|
|
|
|
|
|
|
|
|
|
|
|
|
|
|
|
|
|
|
|
|
|
|
|
|
|
|
|
|
|
|
|
|
|
|
Nine months ended September 30, 2010 |
|
|
|
|
|
|
|
|
|
|
|
|
|
|
|
|
|
|
|
|
|
|
Construction Industries 1 |
|
$9,469 |
|
|
|
$2,774 |
|
|
|
$1,447 |
|
|
|
$2,035 |
|
|
|
$3,213 |
|
|
|
|
Resource Industries 2 |
|
5,860 |
|
|
|
1,967 |
|
|
|
1,298 |
|
|
|
1,089 |
|
|
|
1,506 |
|
|
|
|
Power Systems 3 |
|
10,873 |
|
|
|
4,440 |
|
|
|
1,316 |
|
|
|
3,056 |
|
|
|
2,061 |
|
|
|
|
All Other Segments 4 |
|
1,573 |
|
|
|
880 |
|
|
|
87 |
|
|
|
399 |
|
|
|
207 |
|
|
|
|
Corporate Items and Eliminations |
|
(49) |
|
|
|
(24) |
|
|
|
(8) |
|
|
|
(11) |
|
|
|
(6) |
|
|
|
|
Machinery & Power Systems Sales |
|
27,726 |
|
|
|
10,037 |
|
|
|
4,140 |
|
|
|
6,568 |
|
|
|
6,981 |
|
|
|
|
|
|
|
|
|
|
|
|
|
|
|
|
|
|
|
|
|
|
|
|
|
|
|
Financial Products Segment |
|
2,220 |
|
|
|
1,345 |
|
|
|
227 |
|
|
|
324 |
|
|
|
324 |
|
|
|
|
Corporate Items and Eliminations |
|
(165) |
|
|
|
(148) |
|
|
|
(8) |
|
|
|
— |
|
|
|
(9) |
|
|
|
|
Financial Products Revenues |
|
2,055 |
|
|
|
1,197 |
|
|
|
219 |
|
|
|
324 |
|
|
|
315 |
|
|
|
|
|
|
|
|
|
|
|
|
|
|
|
|
|
|
|
|
|
|
|
|
|
|
|
Consolidated Sales and Revenues |
|
$29,781 |
|
|
|
$11,234 |
|
|
|
$4,359 |
|
|
|
$6,892 |
|
|
|
$7,296 |
|
|
|
1 Does not include inter-segment sales of $433 million and $481 million for the nine months ended September 30, 2011 and 2010, respectively.
2 Does not include inter-segment sales of $848 million and $552 million for the nine months ended September 30, 2011 and 2010, respectively.
3 Does not include inter-segment sales of $1.695 billion and $1.129 billion for the nine months ended September 30, 2011 and 2010, respectively.
4 Does not include inter-segment sales of $2.548 billion and $2.046 billion for the nine months ended September 30, 2011 and 2010, respectively.
Sales and Revenues by Segment
|
(Millions of dollars) |
|
Nine
|
|
Sales
|
|
Price
|
|
Currency |
|
Acquisitions |
|
Other |
|
Nine
|
|
$
|
|
%
|
|
|
|
|
|
|
|
|
|
|
|
|
|
|
|
|
|
|
|
|
|
|
|
Construction Industries |
|
$9,469 |
|
$4,208 |
|
$195 |
|
$440 |
|
$— |
|
$— |
|
$14,312 |
|
$4,843 |
|
51% |
|
|
Resource Industries |
|
5,860 |
|
3,301 |
|
166 |
|
111 |
|
1,135 |
|
— |
|
10,573 |
|
4,713 |
|
80% |
|
|
Power Systems |
|
10,873 |
|
2,470 |
|
162 |
|
209 |
|
728 |
|
— |
|
14,442 |
|
3,569 |
|
33% |
|
|
All Other Segments |
|
1,573 |
|
(97) |
|
8 |
|
41 |
|
— |
|
— |
|
1,525 |
|
(48) |
|
(3)% |
|
|
Corporate Items and Eliminations |
|
(49) |
|
5 |
|
27 |
|
— |
|
— |
|
— |
|
(17) |
|
32 |
|
|
|
|
Machinery & Power Systems Sales |
|
27,726 |
|
9,887 |
|
558 |
|
801 |
|
1,863 |
|
— |
|
40,835 |
|
13,109 |
|
47% |
|
|
|
|
|
|
|
|
|
|
|
|
|
|
|
|
|
|
|
|
|
|
|
Financial Products Segment |
|
2,220 |
|
— |
|
— |
|
— |
|
— |
|
31 |
|
2,251 |
|
31 |
|
1% |
|
|
Corporate Items and Eliminations |
|
(165) |
|
— |
|
— |
|
— |
|
— |
|
(26) |
|
(191) |
|
(26) |
|
|
|
|
Financial Products Revenues |
|
2,055 |
|
— |
|
— |
|
— |
|
— |
|
5 |
|
2,060 |
|
5 |
|
—% |
|
|
|
|
|
|
|
|
|
|
|
|
|
|
|
|
|
|
|
|
|
|
|
Consolidated Sales and Revenues |
|
$29,781 |
|
$9,887 |
|
$558 |
|
$801 |
|
$1,863 |
|
$5 |
|
$42,895 |
|
$13,114 |
|
44% |
|
Operating Profit by Segment
|
(Millions of dollars) |
|
Nine months ended
|
|
Nine months ended
|
|
$ Change |
|
%
|
|
|
Construction Industries |
|
$1,522 |
|
$496 |
|
$1,026 |
|
207% |
|
|
Resource Industries |
|
2,337 |
|
1,183 |
|
1,154 |
|
98% |
|
|
Power Systems |
|
2,230 |
|
1,580 |
|
650 |
|
41% |
|
|
All Other Segments |
|
601 |
|
580 |
|
21 |
|
4% |
|
|
Corporate Items and Eliminations |
|
(1,736) |
|
(1,296) |
|
(440) |
|
|
|
|
Machinery & Power Systems |
|
4,954 |
|
2,543 |
|
2,411 |
|
95% |
|
|
|
|
|
|
|
|
|
|
|
|
|
Financial Products Segment |
|
453 |
|
324 |
|
129 |
|
40% |
|
|
Corporate Items and Eliminations |
|
(26) |
|
(39) |
|
13 |
|
|
|
|
Financial Products |
|
427 |
|
285 |
|
142 |
|
50% |
|
|
Consolidating Adjustments |
|
(188) |
|
(156) |
|
(32) |
|
|
|
|
Consolidated Operating Profit |
|
$5,193 |
|
$2,672 |
|
$2,521 |
|
94% |
|
Construction Industries
Construction Industries’ sales were $14.312 billion in the first nine months of 2011, an increase of $4.843 billion, or 51 percent, from the first nine months of 2010. The improvement in sales was a result of significantly higher sales volume in all geographic regions and across all major products. While sales for new equipment and after-market parts improved, the most significant increase was for new equipment. In addition to volume, sales were higher as a result of currency impacts from a weaker U.S. dollar.
Continuing economic growth in most developing countries resulted in higher sales overall. New machine sales were above or near record levels across much of the developing world. While demand for product was strong, the supply of many excavator models, which are key products for construction across the world, is limited by our capacity.
In most developed countries, sales increased significantly despite relatively weak construction activity. The improvement in sales was largely driven by the need for customers to upgrade machine fleets and replace older equipment and dealers refreshing some equipment in their rental fleets. Despite the increase from a year ago, sales of new machines to customers in developed countries remain weak and significantly below previous peak levels. The size of rental fleets increased slightly from post-recession lows, but the average age remained near the historical high.
Construction Industries’ profit was $1.522 billion in the first nine months of 2011 compared with $496 million in the first nine months of 2010. The increase in profit was primarily due to higher sales volume, which included the impact of an unfavorable mix of products, and improved price realization. The benefit from higher sales was partially offset by higher period manufacturing and freight costs. The period cost increase is primarily due to higher production volume and start-up costs associated with global capacity expansion. SG&A expenses were about flat despite the large increase in sales volume.
Resource Industries
Resource Industries’ sales were $10.573 billion in the first nine months of 2011, an increase of $4.713 billion, or 80 percent, from the first nine months of 2010. About three quarters of the sales increase was from higher sales volume and one quarter was from the acquisition of Bucyrus during the third quarter of 2011.
Growth in the global economy increased demand for commodities and commodity production increased prices. Metals prices averaged 26 percent higher through the first nine months of 2011. While commodity prices have decreased from previously high levels, we believe prices remain favorable for investment, which significantly increased demand for our large mining products and improved parts sales.
Bucyrus sales were $1.135 billion in the first nine months of 2011, with $266 million in North America, $185 million in Latin America, $248 million in EAME and $436 million in Asia/Pacific.
Resource Industries’ profit was $2.337 billion in the first nine months of 2011 compared with $1.183 billion in the first nine months of 2010. The acquisition of Bucyrus lowered profit by $178 million.
Excluding Bucyrus, Resource Industries’ profit increased $1.332 billion, primarily due to higher sales volume. The improvement was partially offset by higher manufacturing and R&D costs. The increase in manufacturing costs was primarily due to higher period, material and freight costs.
Power Systems
Power Systems’ sales were $14.442 billion in the first nine months of 2011, an increase of $3.569 billion, or 33 percent, from the first nine months of 2010. Most of the improvement was a result of higher sales volume and the acquisition of EMD. Sales were up in all geographic regions.
Worldwide demand for energy at price levels that encourage continued investment resulted in higher demand for engines and turbines for petroleum applications. Electric power continued to improve as a result of worldwide economic growth. Sales of our industrial engines and rail products and services also increased.
Power Systems’ profit was $2.230 billion in the first nine months of 2011 compared with $1.580 billion in the first nine months of 2010. The improvement was primarily due to higher sales volume, which included the impact of an unfavorable mix of products, and improved price realization. The improvements were partially offset by higher manufacturing costs and SG&A and R&D expenses. The higher manufacturing costs were primarily driven by higher period costs, while freight, material and facility start-up expenses also increased.
Sales for EMD, which was acquired on August 2, 2010, increased $728 million, and profit for EMD increased $21 million.
Financial Products Segment
Financial Products’ revenues were $2.251 billion in the first nine months of 2011, an increase of $31 million, from the first nine months of 2010. The increase was primarily due to a favorable impact from higher average earning assets, a favorable change from returned or repossessed equipment, and higher miscellaneous net revenues, partially offset by an unfavorable impact from lower interest rates on new and existing finance receivables and a decrease in Cat Insurance revenues.
Financial Products’ profit was $453 million in the first nine months of 2011 compared with $324 million in the first nine months of 2010. The increase was primarily due to a $45 million favorable impact from higher net yield on average earning assets, a $42 million favorable impact from miscellaneous net revenues, a $36 million decrease in provision expense at Cat Financial, and a $32 million
favorable change from returned or repossessed equipment. These increases were partially offset by a $36 million increase in SG&A expenses (excluding provision expense at Cat Financial).
Corporate Items and Eliminations
Expense for corporate items and eliminations was $1.762 billion in the first nine months of 2011, an increase of $427 million from the first nine months of 2010. Corporate items and eliminations include corporate-level expenses; timing differences, as some expenses are reported in segment profit on a cash basis; retirement benefit costs other than service cost; currency differences, as segment profit is reported using annual fixed exchange rates, and inter-segment eliminations.
Segment profit for 2011 is based on fixed exchange rates set at the beginning of 2011, while segment profit for 2010 is based on fixed exchange rates set at the beginning of 2010. The difference in actual exchange rates compared with fixed exchange rates is included in Corporate items and eliminations and is not reflected in segment profit. The increased expense for Corporate items and eliminations includes currency differences not allocated to segments, as 2011 actual exchange rates were unfavorable compared with 2011 fixed exchange rates. In addition, corporate level expenses increased.
Bucyrus International, Inc.
On July 8, 2011, we completed our acquisition of Bucyrus International, Inc. (Bucyrus). Bucyrus is a designer, manufacturer and marketer of mining equipment for the surface and underground mining industries. The total purchase price was approximately $8.8 billion, consisting of $7.4 billion for the purchase of all outstanding shares of Bucyrus common stock at $92 per share and $1.6 billion of assumed Bucyrus debt, substantially all of which was repaid subsequent to closing, net of $0.2 billion of acquired cash.
We funded the acquisition using available cash, commercial paper borrowings and approximately $4.5 billion of long-term debt issued in May 2011. On May 24, 2011, we issued $500 million of Floating Rate Senior Notes (Three-month USD LIBOR plus 0.10%) due in 2012 and $750 million of Floating Rate Senior Notes (Three-month USD LIBOR plus 0.17%) due in 2013. The interest rates for the Floating Rate Senior Notes will be reset quarterly. We also issued $750 million of 1.375% Senior Notes due in 2014, $1.25 billion of 3.90% Senior Notes due in 2021, and $1.25 billion of 5.20% Senior Notes due in 2041. The Notes are unsecured obligations of Caterpillar and rank equally with all other senior unsecured indebtedness.
Bucyrus contributed sales of $1,135 million and a pretax loss of $200 million (inclusive of deal-related and integration costs) for the three months ended September 30, 2011. The results of the acquired business for the period from the acquisition date are included in the accompanying consolidated financial statements and are reported in the “Resource Industries” segment.
For the six months ended June 30, 2011, we recorded acquisition costs of $249 million, which were primarily comprised of losses on interest rate swaps of $149 million and bridge financing costs of $54 million. For the three months ended September 30, 2011, we recorded additional deal-related and integration costs of $122 million, which were primarily comprised of severance and integration costs.
Impact of Bucyrus on Consolidated Profit (Loss) Before Tax
(Millions of Dollars except per share data)
|
Impact by Results of Operations Line Item |
|
First Half |
|
Third Quarter |
|
Year-to-Date |
|
|
Sales |
|
$ — |
|
$1,135 |
|
$1,135 |
|
|
Cost of goods sold |
|
— |
|
1,019 |
|
1,019 |
|
|
SG&A |
|
35 |
|
170 |
|
205 |
|
|
R&D |
|
— |
|
12 |
|
12 |
|
|
Other operating costs |
|
— |
|
77 |
|
77 |
|
|
Operating profit (loss) |
|
(35) |
|
(143) |
|
(178) |
|
|
Interest expense |
|
11 |
|
33 |
|
44 |
|
|
Other income (expense) |
|
(203) |
|
(24) |
|
(227) |
|
|
Profit (loss) before tax |
|
$(249) |
|
$(200) |
|
$(449) |
|
|
|
|
|
|
|
|
|
|
|
Impact by Category |
|
|
|
|
|
|
|
|
Operating profit excluding acquisition costs |
|
$ — |
|
$195 |
|
$195 |
|
|
Incremental intangible amortization |
|
— |
|
56 |
|
56 |
|
|
Inventory step-up |
|
— |
|
160 |
|
160 |
|
|
Deal-related & integration costs |
|
35 |
|
122 |
|
157 |
|
|
Impact on operating profit (loss) |
|
(35) |
|
(143) |
|
(178) |
|
|
Interest expense |
|
11 |
|
33 |
|
44 |
|
|
Other income (expense) |
|
(203) |
|
(24) |
|
(227) |
|
|
Impact on profit (loss) before tax |
|
$(249) |
|
$(200) |
|
$(449) |
|
|
|
|
|
|
|
|
|
|
|
Profit per share Bucyrus impact |
|
$(0.24) |
|
$(0.22) |
|
$(0.46) |
|
The following table summarizes the assets acquired and liabilities assumed as of the acquisition date at estimated fair value. These values represent a preliminary allocation of the purchase price subject to finalization of post-closing procedures, which may result in further adjustments to the values presented below.
|
(Millions of dollars) |
|
July 8, 2011 |
|
|
Assets |
|
|
|
|
Cash |
|
$203 |
|
|
Receivables – Trade & Other |
|
693 |
|
|
Prepaid expenses |
|
154 |
|
|
Inventories |
|
2,305 |
|
|
Property, plant and equipment – net |
|
692 |
|
|
Intangible assets |
|
3,901 |
|
|
Goodwill |
|
5,263 |
|
|
Other assets |
|
48 |
|
|
Liabilities |
|
|
|
|
Short-term borrowings |
|
24 |
|
|
Current portion - long-term debt |
|
16 |
|
|
Accounts payable |
|
444 |
|
|
Accrued expenses |
|
405 |
|
|
Customer advances |
|
668 |
|
|
Other current liabilities |
|
426 |
|
|
Long-term debt |
|
1,514 |
|
|
Other liabilities |
|
2,308 |
|
|
Net assets acquired |
|
$7,454 |
|
|
|
|
|
|
The following table is a summary of the fair value estimates of the acquired identifiable intangible assets, weighted–average useful lives, and balance of accumulated amortization as of September 30, 2011:
|
(Millions of dollars) |
|
Estimated fair value of
|
|
Weighted-average
|
|
Accumulated
|
|
|
Customer relationships |
|
$2,337 |
|
15 |
|
$36 |
|
|
Intellectual property |
|
1,489 |
|
12 |
|
28 |
|
|
Other |
|
75 |
|
4 |
|
4 |
|
|
Total |
|
$3,901 |
|
14 |
|
$68 |
|
|
|
|
|
|
|
|
|
|
The identifiable intangibles recorded as a result of the acquisition have been amortized from the acquisition date. Estimated aggregate amortization expense for the remainder of 2011 and the five succeeding years and thereafter is as follows:
|
(Millions of dollars) |
|||||||||||||
|
2011 |
|
2012 |
|
2013 |
|
2014 |
|
2015 |
|
2016 |
|
Thereafter |
|
|
$75 |
|
$299 |
|
$299 |
|
$299 |
|
$290 |
|
$280 |
|
$2,291 |
|
|
|
|
|
|
|
|
|
|
|
|
|
|
|
|
Goodwill in the amount of $5,263 million was recorded for the acquisition of Bucyrus and is included in the Resource Industries segment. Goodwill is calculated as the excess of the consideration transferred over the net assets recognized and represents the estimated future economic benefits arising from other assets acquired that could not be individually identified and separately recognized. Goodwill will not be amortized, but will be tested for impairment at least annually. Less than $400 million of the goodwill is deductible for tax purposes. Goodwill largely consists of expected synergies resulting from the acquisition. Key areas of expected cost savings include elimination of redundant selling, general and administrative expenses and increased purchasing power for raw materials and supplies. We also anticipate the acquisition will produce growth synergies as a result of the combined businesses’ broader product portfolio in the mining industry.
A single estimate of fair value results from a complex series of judgments about future events and uncertainties and relies heavily on estimates and assumptions. The judgments used to determine the estimated fair value assigned to each class of assets acquired and liabilities assumed, as well as asset lives, can materially impact our results of operations.
The unaudited pro forma results presented below include the effects of the Bucyrus acquisition as if it had occurred as of January 1, 2010. The unaudited pro forma results reflect certain adjustments related to the acquisition, such as the amortization associated with estimates for the acquired intangible assets, fair value adjustments for inventory, contracts and the impact of acquisition financing. The 2011 supplemental pro forma earnings were adjusted to exclude $362 million of acquisition related costs, including consulting, legal, and advisory fees, severance costs and financing expense prior to debt issuance. The 2011 supplemental pro forma earnings were adjusted to exclude $160 million of nonrecurring expense related to the fair value adjustment to acquisition-date inventory and $25 million acceleration of Bucyrus stock compensation expense. The 2010 supplemental pro forma earnings were adjusted to include acquisition related costs and fair value adjustments to acquisition-date inventory.
The pro forma results do not include any anticipated synergies or other expected benefits of the acquisition. Accordingly, the unaudited pro forma financial information below is not necessarily indicative of either future results of operations or results that might have been achieved had the acquisition been completed on the dates indicated.
|
(Dollars in millions except per share data) |
|
Three months ended
|
|
Nine months ended
|
|
||||
|
|
|
2011 |
|
2010 |
|
2011 |
|
2010 |
|
|
Total Sales and revenues |
|
$15,811 |
|
$12,071 |
|
$45,038 |
|
$32,194 |
|
|
Profit (loss) |
|
$1,290 |
|
$825 |
|
$3,751 |
|
$1,340 |
|
|
Profit (loss) per common share |
|
$1.99 |
|
$1.30 |
|
$5.82 |
|
$2.13 |
|
|
Profit (loss) per common share — diluted |
|
$1.94 |
|
$1.27 |
|
$5.63 |
|
$2.07 |
|
GLOSSARY OF TERMS
1. All Other Segments – Primarily includes activities such as: the remanufacturing of Cat engines and components and remanufacturing services for other companies as well as the product management, development, manufacturing, marketing and product support of undercarriage, specialty products, hardened bar stock components and ground engaging tools primarily for Caterpillar products; logistics services for Caterpillar and other companies; the product management, development, marketing, sales and product support of on-highway vocational trucks for North America (U.S. & Canada only); distribution services responsible for dealer development and administration, dealer portfolio management and ensuring the most efficient and effective distribution of machines, engines and parts; and the 50/50 joint venture with Navistar (NC 2 ) until it became a wholly owned subsidiary of Navistar effective September 29, 2011.
2. Bucyrus Impact – This includes Bucyrus results as a wholly owned subsidiary of Caterpillar since the acquisition date of July 8, 2011, and acquisition-related costs incurred during 2011. Bucyrus acquisition costs relate to losses on interest rate swaps put in place in anticipation of issuing debt for the acquisition, costs for a bridge financing facility, integration costs (including severance-related costs), advisory and legal costs and interest expense on new debt.
3. Caterpillar Production System – The Caterpillar Production System is the common Order-to-Delivery process being implemented enterprise-wide to achieve our safety, quality, velocity, earnings and growth goals.
4. Consolidating Adjustments – Eliminations of transactions between Machinery and Power Systems and Financial Products.
5. Construction Industries – A segment responsible for small and core construction machines. Responsibility includes business strategy, product design, product management and development, manufacturing, marketing, and sales and product support. The product portfolio includes backhoe loaders, small wheel loaders, small track-type tractors, skid steer loaders, multi-terrain loaders, mini excavators, compact wheel loaders, select work tools, small, medium and large track excavators, wheel excavators, medium wheel loaders, medium track-type tractors, track-type loaders, motor graders and pipe layers. In addition, Construction Industries has responsibility for Power Systems and components in Japan and an integrated manufacturing cost center that supports Machinery and Power Systems businesses.
6. Currency – With respect to sales and revenues, currency represents the translation impact on sales resulting from changes in foreign currency exchange rates versus the U.S. dollar. With respect to operating profit, currency represents the net translation impact on sales and operating costs resulting from changes in foreign currency exchange rates versus the U.S. dollar. Currency includes the impact on sales and operating profit for the Machinery and Power Systems lines of business only; currency impacts on Financial Products revenues and operating profit are included in the Financial Products portions of the respective analyses. With respect to other income/expense, currency represents the effects of forward and option contracts entered into by the company to reduce the risk of fluctuations in exchange rates and the net effect of changes in foreign currency exchange rates on our foreign currency assets and liabilities for consolidated results.
7. Debt-to-Capital Ratio – A key measure of financial strength used by both management and our credit rating agencies. The metric is a ratio of Machinery and Power Systems debt (short-term borrowings plus long-term debt) and redeemable noncontrolling interest to the sum of Machinery and Power Systems debt, redeemable noncontrolling interest and stockholders’ equity.
8. EAME – A geographic region including Europe, Africa, the Middle East and the Commonwealth of Independent States (CIS).
9. Earning Assets – Assets consisting primarily of total finance receivables net of unearned income, plus equipment on operating leases, less accumulated depreciation at Cat Financial.
10. Financial Products Segment – Provides financing to customers and dealers for the purchase and lease of Caterpillar and other equipment, as well as some financing for Caterpillar sales to dealers. Financing plans include operating and finance leases, installment sale contracts, working capital loans and wholesale financing plans. The division also provides various forms of insurance to customers and dealers to help support the purchase and lease of our equipment.
11. Latin America – Geographic region including Central and South American countries and Mexico.
12. Machinery and Power Systems (M&PS) – Represents the aggregate total of Construction Industries, Resource Industries, Power Systems, and All Other segments and related corporate items and eliminations.
13. Machinery and Power Systems Other Operating (Income) Expenses – Comprised primarily of gains/losses on disposal of long-lived assets, long-lived asset impairment charges, pension curtailment charges and employee redundancy costs.
14. Manufacturing Costs – Manufacturing costs exclude the impacts of currency and represent the volume-adjusted change for variable costs and the absolute dollar change for period manufacturing costs. Variable manufacturing costs are defined as having a direct relationship with the volume of production. This includes material costs, direct labor and other costs that vary directly with production volume such as freight, power to operate machines and supplies that are consumed in the manufacturing process. Period manufacturing costs support production but are defined as generally not having a direct relationship to short-term changes in volume. Examples include machinery and equipment repair, depreciation on manufacturing assets, facility support, procurement, factory scheduling, manufacturing planning and operations management.
15. Power Systems – A segment responsible for the product management, development, manufacturing, marketing, sales and product support of reciprocating engine powered generator sets, integrated systems used in the electric power generation industry, reciprocating engines and integrated systems and solutions for the marine and petroleum industries; reciprocating engines supplied to the industrial industry as well as Caterpillar machinery; the product management, development, manufacturing, marketing, sales and product support of turbines and turbine-related services; the development, manufacturing, remanufacturing, maintenance, leasing and service of diesel-electric locomotives and components and other rail-related products and services.
16. Price Realization – The impact of net price changes excluding currency and new product introductions. Consolidated price realization includes the impact of changes in the relative weighting of sales between geographic regions.
17. Resource Industries – A segment responsible for business strategy, product design, product management and development, manufacturing, marketing and sales and product support for large track-type tractors, large mining trucks, underground mining equipment, tunnel boring equipment, large wheel loaders, quarry and construction trucks, articulated trucks, wheel tractor scrapers, wheel dozers, compactors, select work tools, forestry products, paving products, machinery components and electronics and control systems. In addition, Resource Industries manages areas that provide services to other parts of the company, including integrated manufacturing, research and development and coordination of the Caterpillar Production System. On July 8, 2011, the acquisition of Bucyrus International was completed. This added the responsibility for business strategy, product design, product management and development, manufacturing, marketing and sales and product support for electric rope shovels, draglines, hydraulic shovels, drills, highwall miners and large electric drive mining trucks to Resource Industries. In addition, Bucyrus acquisition costs impacting operating profit are included in this segment.
18. Sales Volume – With respect to sales and revenues, sales volume represents the impact of changes in the quantities sold for Machinery and Power Systems as well as the incremental revenue impact of new product introductions, including emissions-related product updates. With respect to operating profit, sales volume represents the impact of changes in the quantities sold for Machinery and Power Systems combined with product mix as well as the net operating profit impact of new product introductions, including emissions-related product updates. Product mix represents the net operating profit impact of changes in the relative weighting of Machinery and Power Systems sales with respect to total sales.
LIQUIDITY AND CAPITAL RESOURCES
Sources of funds
We generate significant capital resources from operating activities, which are the primary source of funding for our Machinery and Power Systems operations. Funding for these businesses is also provided by commercial paper and long-term debt issuances. Financial Products operations are funded primarily from commercial paper, term debt issuances and collections from their existing portfolio. Throughout the third quarter of 2011, we experienced favorable liquidity conditions in both our Machinery and Power Systems and Financial Products operations. On a consolidated basis, we ended the third quarter of 2011 with $3.2 billion of cash, a decrease of $0.4 billion from year-end 2010. Our cash balances are held in numerous locations throughout the world. We expect to meet our U.S. funding needs without repatriating non-U.S. cash and incurring incremental U.S. taxes.
Consolidated operating cash flow for the first nine months of 2011 was $5.52 billion, up from $2.95 billion for the same period a year ago. Operating cash flow in the first nine months of 2011 benefited from profit of consolidated and affiliated companies of $3.42 billion, an increase in accounts payable resulting primarily from higher material purchases, and customer advances. Partially offsetting these items were higher inventories, primarily related to higher production volumes, as well as the payment of short-term incentive compensation to employees during the first quarter of 2011. Operating cash flow in the first nine months of 2010 benefited from profit of consolidated and affiliated companies of $1.77 billion and an increase in accounts payable, reflecting higher levels of material purchases for a production ramp-up to meet increasing demand. This was offset by an increase in inventory, also related to
production ramp-up, and higher receivables. See further discussion of operating cash flow under Machinery and Power Systems and Financial Products.
Total debt as of September 30, 2011, was $34.29 billion, an increase of $5.87 billion from year-end 2010. Debt related to Machinery and Power Systems increased $4.14 billion in the first nine months of 2011, primarily due to the issuance of $4.5 billion of debt in May 2011 to fund the Bucyrus acquisition. Debt related to Financial Products increased $1.73 billion reflecting increasing portfolio balances at Cat Financial.
We have three global credit facilities with a syndicate of banks totaling $8.5 billion (Credit Facility) available in the aggregate to both Caterpillar and Cat Financial to support their commercial paper programs in the event those programs become unavailable and for general liquidity purposes. Based on management’s allocation decision, which can be revised from time to time, the portion of the Credit Facility available to Cat Financial as of September 30, 2011 was $6.5 billion.
· In September 2011, we renewed the 364-day facility. The amount was decreased from $3.52 billion to $2.55 billion and expires in September 2012.
· In September 2011, we replaced the $1.62 billion five-year facility expiring in September 2012 with a larger five-year facility of $3.86 billion that expires in September 2016.
· The four-year facility of $2.09 billion expires in September 2014.
At September 30, 2011, Caterpillar’s consolidated net worth was $18.62 billion, which was above the $9.00 billion required under the Credit Facility. The consolidated net worth is defined as the consolidated stockholder’s equity including preferred stock but excluding the pension and other postretirement benefits balance within Accumulated other comprehensive income (loss).
At September 30, 2011, Cat Financial’s covenant interest coverage ratio was 1.55 to 1. This is above the 1.15 to 1 minimum ratio calculated as (1) profit excluding income taxes, interest expense and net gain/(loss) from interest rate derivatives to (2) interest expense calculated at the end of each calendar quarter for the rolling four quarter period then most recently ended.
In addition, at September 30, 2011, Cat Financial’s covenant leverage ratio was 7.69 to 1. This is below the maximum ratio of debt to net worth of 10 to 1, calculated (1) on a monthly basis as the average of the leverage ratios determined on the last day of each of the six preceding calendar months and (2) at each December 31 required by the Credit Facility.
In the event Caterpillar or Cat Financial does not meet one or more of their respective financial covenants under the Credit Facility in the future (and are unable to obtain a consent or waiver), the bank group may terminate the commitments allocated to the party that does not meet its covenants. Additionally, in such event, certain of Cat Financial’s other lenders under other loan agreements where similar financial covenants or cross default provisions are applicable, may, at their election, choose to pursue remedies under those loan agreements, including accelerating the repayment of outstanding borrowings. At September 30, 2011, there were no borrowings under the Credit Facility.
Our total credit commitments as of September 30, 2011 were:
|
|
|
|
|
|
|
|
|
|
|
|
September 30, 2011 |
|
||||
|
(Millions of dollars) |
|
Consolidated |
|
Machinery
|
|
Financial
|
|
|
Credit lines available: |
|
|
|
|
|
|
|
|
Global credit facilities |
|
$8,500 |
|
$2,000 |
|
$6,500 |
|
|
Other external |
|
4,508 |
|
743 |
|
3,765 |
|
|
Total credit lines available |
|
13,008 |
|
2,743 |
|
10,265 |
|
|
Less: Global credit facilities supporting commercial paper |
|
(2,550) |
|
— |
|
(2,550) |
|
|
Less: Utilized credit |
|
(2,070) |
|
(25) |
|
(2,045) |
|
|
Available credit |
|
$8,388 |
|
$2,718 |
|
$5,670 |
|
|
|
|
|
|
|
|
|
|
Other consolidated credit lines with banks as of September 30, 2011 totaled $4.51 billion. These committed and uncommitted credit lines, which may be eligible for renewal at various future dates or have no specified expiration date, are used primarily by our subsidiaries for local funding requirements. Caterpillar or Cat Financial may guarantee subsidiary borrowings under these lines.
In the event that Caterpillar or Cat Financial, or any of their debt securities, experiences a credit rating downgrade, it would likely result in an increase in our borrowing costs and make access to certain credit markets more difficult. In the event economic conditions deteriorate such that access to debt markets becomes unavailable, our Machinery and Power Systems operations would rely on cash flow from operations, use of existing cash balances, borrowings from Cat Financial and access to our Credit Facility. Our Financial Products operations would rely on cash flow from its existing portfolio, utilization of existing cash balances, access to our Credit Facility and other credit line facilities of Cat Financial and potential borrowings from Caterpillar. In addition, we maintain a support agreement with Cat Financial, which requires Caterpillar to remain the sole owner of Cat Financial and may, under certain circumstances, require Caterpillar to make payments to Cat Financial should Cat Financial fail to maintain certain financial ratios.
Machinery and Power Systems
Net cash provided by operating activities was $6.15 billion in the first nine months of 2011, higher than any full year in our history, compared with $3.33 billion in the first nine months of 2010. The change was primarily due to favorable changes in receivables and increased profit, partially offset by more significant increases in inventories, less significant increases in accounts payable, and short-term incentive compensation payments in 2011. Profit of consolidated and affiliated companies in the first nine months of 2011 was $3.41 billion compared with $1.76 billion for the same period a year ago. During the first nine months of 2011, receivables declined primarily due to increased sales of receivables to Cat Financial to provide cash to fund the Bucyrus acquisition. In addition, accounts payable and inventories increased, primarily reflecting higher material purchases for continued increases in production. During the first nine months of 2010, we experienced sharply increased demand and a production ramp-up, resulting in an increase in accounts payable and customer advances, which was more than offset by increases in inventory and receivables. Net cash used for investing activities in the first nine months of 2011 was $7.97 billion compared with net cash used for investing activities of $2.56 billion for the same period in 2010. The change was primarily due to the use of cash for the acquisition of Bucyrus and higher capital expenditures, partially offset by loan repayments from Cat Financial and proceeds from the divestiture of Carter Machinery in the first nine months of 2011, compared with payments for the acquisition of EMD and net loans to Cat Financial in the first nine months of 2010. Net cash provided by financing activities in the first nine months of 2011 was $1.74 billion, primarily a result of long-term debt issued in May 2011 to fund the Bucyrus acquisition, partially offset by the repayment of Bucyrus’ term loan and other long-term debt for $2.20 billion as well as dividend payments. During the same period in 2010, net cash used for financing activities was $2.16 billion, primarily driven by payments on long-term debt and dividend payments.
Our priorities for the use of cash are maintaining a strong financial position that helps maintain our credit rating, providing capital to support growth, appropriately funding employee benefit plans, paying dividends and repurchasing common stock with excess cash.
Strong financial position – A key measure of Machinery and Power Systems’ financial strength used by both management and our credit rating agencies is Machinery and Power Systems’ debt-to-capital ratio. Debt-to-capital is defined as short-term borrowings, long-term debt due within one year, redeemable noncontrolling interest and long-term debt due after one year (debt) divided by the sum of debt (including redeemable noncontrolling interest) and stockholders’ equity. Debt also includes borrowings from Financial Products. The debt-to-capital ratio for Machinery and Power Systems was 41.1 percent at September 30, 2011, within our target range of 30 to 45 percent, compared with 34.8 percent at December 31, 2010. Higher debt levels due to the $4.5 billion long-term debt issuance in May 2011, partially offset by profit during the first nine months of 2011, contributed to the increase in the debt-to-capital ratio.
Capital to support growth – Capital expenditures during the first nine months of 2011 were $1.59 billion, an increase of $561 million compared with the first nine months of 2010. On July 8, 2011, we completed the acquisition of Bucyrus for approximately $8.8 billion. The Bucyrus transaction value consisted of a payment to Bucyrus shareholders of $7.4 billion and the assumption of debt of $1.6 billion, net of $0.2 billion of acquired cash. The Bucyrus acquisition was funded with available cash, commercial paper and the proceeds from the $4.5 billion May 2011 long-term debt issuance. On October 31, 2011, we completed our acquisition of MWM Holding GmbH (MWM) for approximately euro 580 million (approximately $800 million). The acquisition of MWM was funded with available cash.
Appropriately funded employee benefit plans – We contributed $340 million to our pension plans during the first nine months of 2011. We currently anticipate full-year 2011 contributions of approximately $440 million.
Paying dividends – Dividends paid totaled $862 million in the first nine months of 2011, representing 44 cents per share paid in the first and second quarters and 46 cents per share paid in the third quarter. Each quarter, our Board of Directors reviews the company’s dividend for the applicable quarter. The Board evaluates the financial condition of the company and considers the economic outlook, corporate cash flow, the company’s liquidity needs, and the health and stability of global credit markets to determine whether to maintain or change the quarterly dividend. On June 8, 2011, we increased the quarterly cash dividend 4.5 percent to 46 cents per share.
Common stock repurchases – Pursuant to the February 2007 Board-authorized stock repurchase program, which expires on December 31, 2011, $3.8 billion of the $7.5 billion authorized was spent through 2008. The stock repurchase program has been suspended since the first quarter of 2009. We do not currently expect to buy back stock in 2011 due to the size of the Bucyrus acquisition, MWM acquisition and planned capital expenditures. Common shares outstanding as of September 30, 2011 were approximately 647 million.
Financial Products
Financial Products operating cash flow was $891 million through the first nine months of 2011, compared with $623 million for the same period a year ago. Net cash used in investing activities through the first nine months of 2011 was $1.74 billion, compared with $793 million source of cash for the same period in 2010. This change is primarily the result of higher additions to finance receivables at Cat Financial, partially offset by higher collections. The increased activity is primarily due to higher purchases of trade receivables from Caterpillar and subsequent collections of those receivables. Net cash provided by financing activities was $618 million through the first nine months of 2011, compared with a $2.57 billion use of cash for the same period in 2010, primarily related to higher funding requirements, partially offset by the net impact of intercompany borrowings.
Cat Financial continued to experience favorable liquidity conditions and market access across all key global funding markets during the third quarter of 2011. Commercial Paper (CP) market liquidity and pricing continued to be very favorable, with $2.6 billion in CP balances outstanding at quarter-end supported by the Credit Facility. During the third quarter of 2011, Cat Financial issued term debt in three global markets, including $773 million in medium-term notes, ¥2.3 billion in Chinese yuan and $56.3 million in Argentine pesos. To maintain a strong liquidity position, Cat Financial held cash balances at the end of the third quarter of 2011 totaling $1.5 billion.
CRITICAL ACCOUNTING POLICIES
The preparation of financial statements in conformity with generally accepted accounting principles requires management to make estimates and assumptions that affect reported amounts. The more significant estimates include: residual values for leased assets, fair values for goodwill impairment tests, impairment of available-for-sale securities, warranty liability, stock-based compensation, reserves for product liability and insurance losses, postretirement benefits, post-sale discounts, credit losses and income taxes. We have incorporated many years of data into the determination of each of these estimates and we have not historically experienced significant adjustments. These assumptions are reviewed at least annually with the Audit Committee of the Board of Directors. Following are the methods and assumptions used in determining our estimates and an indication of the risks inherent in each.
Residual values for leased assets — The residual values for Cat Financial’s leased assets, which are based upon the estimated wholesale market value of leased equipment at the time of the expiration of the lease, are based on a careful analysis of historical wholesale market sales prices, projected forward on a level trend line without consideration for inflation or possible future pricing action. At the inception of the lease, residual values are derived from consideration of the following critical factors: market size and demand, any known significant market/product trends, total expected hours of usage, machine configuration, application, location, model changes, quantities and past re-marketing experience, third-party residual guarantees and contractual customer purchase options. During the term of the leases, residual amounts are monitored. If estimated market values reflect a non-temporary impairment due to economic factors, obsolescence or other adverse circumstances, the residuals are adjusted to the lower estimated values by a charge to earnings. For equipment on operating leases, the charge is recognized through depreciation expense. For finance leases, it is recognized through a reduction of finance revenue.
Fair values for goodwill impairment tests — We test goodwill for impairment annually, at the reporting unit level, and whenever events or circumstances make it likely that an impairment may have occurred, such as a significant adverse change in the business climate or a decision to sell all or a portion of a reporting unit. We perform our annual goodwill impairment test as of October 1 and monitor for interim triggering events on an ongoing basis.
Goodwill is reviewed for impairment utilizing a two-step process. The first step requires us to compare the fair value of each reporting unit to the respective carrying value, which includes goodwill. If the fair value of the reporting unit exceeds its carrying value, the goodwill is not considered impaired. If the carrying value is greater than the fair value, there is an indication that an impairment may exist and the second step is required. Additionally, if the carrying amount of a reporting unit is zero or negative, the second step of the goodwill impairment test is also required if an analysis of qualitative factors indicates it more likely than not that a goodwill impairment exists. In step two, the implied fair value of the goodwill is calculated as the excess of the fair value of a
reporting unit over the fair values assigned to its assets and liabilities. If the implied fair value of goodwill is less than the carrying value of the reporting unit’s goodwill, the difference is recognized as an impairment loss.
The impairment test process requires valuation of the respective reporting unit, which we primarily determine using an income approach based on a discounted five year forecasted cash flow with a year-five residual value. The residual value is computed using the constant growth method, which values the forecasted cash flows in perpetuity. The income approach is supported by a reconciliation of our calculated fair value for Caterpillar to the company’s market capitalization. The assumptions about future cash flows and growth rates are based on each reporting unit’s long-term forecast and are subject to review and approval by senior management. The discount rate is based on our weighted average cost of capital, which we believe approximates the rate from a market participant’s perspective. The estimated fair value could be impacted by changes in market conditions, interest rates, growth rates, tax rates, costs, pricing and capital expenditures.
A prolonged economic downturn resulting in lower long-term growth rates and reduced long-term profitability may reduce the fair value of our reporting units. Industry specific events or circumstances that have a negative impact to the valuation assumptions may also reduce the fair value of our reporting units. Should such events occur and it becomes more likely than not that a reporting unit’s fair value has fallen below its carrying value, we will perform an interim goodwill impairment test(s), in addition to the annual impairment test. Future impairment tests may result in a goodwill impairment, depending on the outcome of both step one and step two of the impairment review process. A goodwill impairment would be reported as a non-cash charge to earnings.
Impairment of available-for-sale securities — Available-for-sale securities, primarily at Cat Insurance, are reviewed at least quarterly to identify fair values below cost which may indicate that a security is impaired and should be written down to fair value.
For debt securities, once a security’s fair value is below cost we utilize data gathered by investment managers, external sources and internal research to monitor the performance of the security to determine whether an other-than-temporary impairment has occurred. These reviews, which include an analysis of whether it is more likely than not that we will be required to sell the security before its anticipated recovery, consist of both quantitative and qualitative analysis and require a degree of management judgment. Securities in a loss position are monitored and assessed at least quarterly based on severity of loss and may be deemed other-than-temporarily impaired at any time. Once a security’s fair value has been twenty percent or more below its original cost for six consecutive months, the security will be other-than-temporarily impaired unless there are sufficient facts and circumstances supporting otherwise.
For equity securities in a loss position, determining whether the security is other-than-temporarily impaired requires an analysis of the securities’ historical sector returns and volatility. This information is utilized to estimate the security’s future fair value to assess whether the security has the ability to recover to its original cost over a reasonable period of time as follows:
· Historical annualized sector returns over a two-year period are analyzed to estimate the security’s fair value over the next two years.
· The volatility factor for the security is applied to the sector historical returns to further estimate the fair value of the security over the next two years.
In the event the estimated future fair value is less than the original cost, qualitative factors are then considered in determining whether a security is other-than-temporarily impaired, which includes reviews of the following: significant changes in the regulatory, economic or technological environment of the investee, significant changes in the general market condition of either the geographic area or the industry in which the investee operates, and length of time and the extent to which the fair value has been less than cost. These qualitative factors are subjective and require a degree of management judgment.
Warranty liability — At the time a sale is recognized, we record estimated future warranty costs. The warranty liability is determined by applying historical claim rate experience to the current field population and dealer inventory. Generally, historical claim rates are based on actual warranty experience for each product by machine model/engine size. Specific rates are developed for each product build month and are updated monthly based on actual warranty claim experience. Warranty costs may differ from those estimated if actual claim rates are higher or lower than our historical rates.
Stock-based compensation — We use a lattice-based option-pricing model to calculate the fair value of our stock options and SARs. The calculation of the fair value of the awards using the lattice-based option-pricing model is affected by our stock price on the date of grant as well as assumptions regarding the following:
· Volatility is a measure of the amount by which the stock price is expected to fluctuate each year during the expected term of the award and is based on historical and current implied volatilities from traded options on Caterpillar stock.
The implied volatilities from traded options are impacted by changes in market conditions. An increase in the volatility would result in an increase in our expense.
· The expected term represents the period of time that awards granted are expected to be outstanding and is an output of the lattice-based option-pricing model. In determining the expected term of the award, future exercise and forfeiture patterns are estimated from Caterpillar employee historical exercise behavior. These patterns are also affected by the vesting conditions of the award. Changes in the future exercise behavior of employees or in the vesting period of the award could result in a change in the expected term. An increase in the expected term would result in an increase in our expense.
· The weighted-average dividend yield is based on Caterpillar’s historical dividend yields. As holders of stock-based awards do not receive dividend payments, this could result in employees retaining the award for a longer period of time if dividend yields decrease or exercising the award sooner if dividend yields increase. A decrease in the dividend yield would result in an increase in our expense.
· The risk-free interest rate is based on the U.S. Treasury yield curve in effect at time of grant. As the risk-free interest rate increases, the expected term increases, resulting in an increase in our expense.
The fair value of our RSUs is determined by reducing the stock price on the date of grant by the present value of the estimated dividends to be paid during the vesting period. The estimated dividends are based on Caterpillar’s weighted-average dividend yields. A decrease in the dividend yield would result in an increase in our expense.
Stock-based compensation expense recognized during the period is based on the value of the number of awards that are expected to vest. In determining the stock-based compensation expense to be recognized, a forfeiture rate is applied to the fair value of the award. This rate represents the number of awards that are expected to be forfeited prior to vesting and is based on Caterpillar employee historical behavior. Changes in the future behavior of employees could impact this rate. A decrease in this rate would result in an increase in our expense.
Product liability and insurance loss reserve — We determine these reserves based upon reported claims in process of settlement and actuarial estimates for losses incurred but not reported. Loss reserves, including incurred but not reported reserves, are based on estimates and ultimate settlements may vary significantly from such estimates due to increased claims frequency or severity over historical levels.
Postretirement benefits — Primary actuarial assumptions were determined as follows:
· The U.S. expected long-term rate of return on plan assets is based on our estimate of long-term passive returns for equities and fixed income securities weighted by the allocation of our plan assets. Based on historical performance, we increase the passive returns due to our active management of the plan assets. A similar process is used to determine the rate for our non-U.S. pension plans. This rate is impacted by changes in general market conditions, but because it represents a long-term rate, it is not significantly impacted by short-term market swings. Changes in our allocation of plan assets would also impact this rate. For example, a shift to more fixed income securities would lower the rate. A decrease in the rate would increase our expense.
· The assumed discount rate is used to discount future benefit obligations back to today’s dollars. The U.S. discount rate is based on a benefit cash flow-matching approach and represents the rate at which our benefit obligations could effectively be settled as of our measurement date, December 31. The benefit cash flow-matching approach involves analyzing Caterpillar’s projected cash flows against a high quality bond yield curve, calculated using a wide population of corporate Aa bonds available on the measurement date. The very highest and lowest yielding bonds (top and bottom 10 percent) are excluded from the analysis. A similar approach is used to determine the assumed discount rate for our most significant non-U.S. plans. This rate is sensitive to changes in interest rates. A decrease in the discount rate would increase our obligation and future expense.
· The expected rate of compensation increase is used to develop benefit obligations using projected pay at retirement. It represents average long-term salary increases. This rate is influenced by our long-term compensation policies. An increase in the rate would increase our obligation and expense.
· The assumed health care trend rate represents the rate at which health care costs are assumed to increase and is based on historical and expected experience. Changes in our projections of future health care costs due to general economic conditions and those specific to health care (e.g., technology driven cost changes) will impact this trend rate. An increase in the trend rate would increase our obligation and expense.
Post-sale discount reserve — We provide discounts to dealers through merchandising programs. We have numerous programs that are designed to promote the sale of our products. The most common dealer programs provide a discount when the dealer sells a product to a targeted end user. The amount of accrued post-sale discounts was $831 million and $779 million as of September 30,
2011 and December 31, 2010 respectively. The reserve represents discounts that we expect to pay on previously sold units and is reviewed at least quarterly. The reserve is adjusted if discounts paid differ from those estimated. Historically, those adjustments have not been material.
Credit loss reserve — Management’s ongoing evaluation of the adequacy of the allowance for credit losses considers both impaired and unimpaired finance receivables and takes into consideration past loss experience, known and inherent risks in the portfolio, adverse situations that may affect the borrower’s ability to repay, estimated value of underlying collateral and current economic conditions. In estimating probable losses we review accounts that are past due, non-performing, in bankruptcy or otherwise identified as at risk for potential credit loss including accounts which have been modified. Accounts are identified as at risk for potential credit loss using information available about the customer, such as financial statements, news reports and published credit ratings as well as general information regarding industry trends and the general economic environment.
The allowance for credit losses attributable to specific accounts is based on the most probable source of repayment, which is normally the liquidation of collateral. In determining collateral value we estimate current fair value of collateral and consider credit enhancements such as additional collateral and third-party guarantees. The allowance for credit losses attributable to the remaining accounts is a general allowance based upon the risk in the portfolio, primarily using probabilities of default and an estimate of associated losses. In addition, qualitative factors not able to be fully captured in previous analysis including industry trends, macroeconomic factors and model imprecision are considered in the evaluation of the adequacy of the allowance for credit losses. These qualitative factors are subjective and require a degree of management judgment.
While management believes it has exercised prudent judgment and applied reasonable assumptions, there can be no assurance that in the future, changes in economic conditions or other factors would not cause changes in the financial health of our customers. If the financial health of our customer deteriorates, the timing and level of payments received could be impacted and therefore, could result in a change to our estimated losses.
Income tax reserve — We are subject to the income tax laws of the many jurisdictions in which we operate. These tax laws are complex, and the manner in which they apply to our facts is sometimes open to interpretation. In establishing the provision for income taxes, we must make judgments about the application of these inherently complex tax laws.
Despite our belief that our tax return positions are consistent with applicable tax laws, we believe that taxing authorities could challenge certain positions. Settlement of any challenge can result in no change, a complete disallowance, or some partial adjustment reached through negotiations or litigation. We record tax benefits for uncertain tax positions based upon management’s evaluation of the information available at the reporting date. To be recognized in the financial statements, a tax benefit must be at least more likely than not of being sustained based on technical merits. The benefit for positions meeting the recognition threshold is measured as the largest benefit more likely than not of being realized upon ultimate settlement with a taxing authority that has full knowledge of all relevant information. Significant judgment is required in making these determinations and adjustments to unrecognized tax benefits may be necessary to reflect actual taxes payable upon settlement. Adjustments related to positions impacting the effective tax rate affect the provision for income taxes. Adjustments related to positions impacting the timing of deductions impact deferred tax assets and liabilities.
Our income tax positions and analysis are based on currently enacted tax law. Future changes in tax law could significantly impact the provision for income taxes, the amount of taxes payable, and the deferred tax asset and liability balances. Deferred tax assets generally represent tax benefits for tax deductions or credits available in future tax returns. Certain estimates and assumptions are required to determine whether it is more likely than not that all or some portion of the benefit of a deferred tax asset will not be realized. In making this assessment, management analyzes and estimates the impact of future taxable income, reversing temporary differences and available prudent and feasible tax planning strategies. Should a change in facts or circumstances lead to a change in judgment about the ultimate realizability of a deferred tax asset, we record or adjust the related valuation allowance in the period that the change in facts and circumstances occurs, along with a corresponding increase or decrease in the provision for income taxes.
A provision for U.S. income taxes has not been recorded on undistributed profits of our non-U.S. subsidiaries that we have determined to be indefinitely reinvested outside the U.S. If management intentions or U.S. tax law changes in the future, there may be a significant negative impact on the provision for income taxes in the period the change occurs.
GLOBAL WORKFORCE
Caterpillar worldwide full-time employment was 121,513 at the end of the third quarter of 2011 compared with 102,336 at the end of the third quarter of 2010, an increase of 19,177 full-time employees. In addition, we increased the flexible workforce by 7,117 for a total increase in the global workforce of 26,294.
We increased our workforce primarily to support higher sales volume across all geographic regions. In addition, acquisitions, primarily Bucyrus, added 12,397 people, while the sale of Carter Machinery in the first quarter of 2011 reduced the workforce by 1,157 people.
OTHER MATTERS
Environmental and Legal Matters
The company is regulated by federal, state and international environmental laws governing our use, transport and disposal of substances and control of emissions. In addition to governing our manufacturing and other operations, these laws often impact the development of our products, including, but not limited to, required compliance with air emissions standards applicable to internal combustion engines. Compliance with these existing laws has not had a material impact on our capital expenditures, earnings or global competitive position.
We are engaged in remedial activities at a number of locations, often with other companies, pursuant to federal and state laws. When it is probable we will pay remedial costs at a site and those costs can be reasonably estimated, the costs are charged against our earnings. In formulating that estimate, we do not consider amounts expected to be recovered from insurance companies or others. The amount recorded for environmental remediation is not material and is included in Accrued expenses in the Consolidated Statement of Financial Position.
We cannot reasonably estimate costs at sites in the very early stages of remediation. Currently, we have a few sites in the very early stages of remediation, and there is no more than a remote chance that a material amount for remedial activities at any individual site, or at all sites in the aggregate, will be required.
We have disclosed certain individual legal proceedings in this filing. Additionally, we are involved in other unresolved legal actions that arise in the normal course of business. The most prevalent of these unresolved actions involve disputes related to product design, manufacture and performance liability (including claimed asbestos and welding fumes exposure), contracts, employment issues, environmental matters or intellectual property rights. The aggregate range of reasonably possible losses in excess of accrued liabilities, if any, associated with these unresolved legal actions is not material. In some cases, we cannot reasonably estimate a range of loss because there is insufficient information regarding the matter. However, there is no more than a remote chance that any liability arising from these matters would be material. Although it is not possible to predict with certainty the outcome of these unresolved legal actions, we believe that these actions will not individually or in the aggregate have a material adverse effect on our consolidated results of operations, financial position or liquidity.
On May 14, 2007, the U.S. Environmental Protection Agency (EPA) issued a Notice of Violation to Caterpillar Inc., alleging various violations of Clean Air Act Sections 203, 206 and 207. EPA claims that Caterpillar violated such sections by shipping engines and catalytic converter after-treatment devices separately, introducing into commerce a number of uncertified and/or misbuilt engines, and failing to timely report emissions-related defects. On July 9, 2010, the Department of Justice issued a penalty demand to Caterpillar seeking a civil penalty of $3.2 million and implementation of injunctive relief involving expanded use of certain technologies. On July 28, 2011, EPA and the U.S. Department of Justice filed and lodged a civil complaint and consent decree with the U.S. District Court for the District of Columbia (Court) regarding the matter. Caterpillar has agreed to the terms of the consent decree, which require payment of a civil penalty of $2.55 million, retirement of a small number of emissions credits and expanded defect-related reporting. On September 7, 2011, the Court entered the consent decree, making it effective on that date, and Caterpillar has paid the penalty due to the United States in accordance with the decree terms. Under the terms of the consent decree, and subject to a settlement agreement, $510,000 of the stipulated $2.55 million penalty will be paid to the California Air Resources Board relating to engines covered by the consent decree that were placed into service in California.
On February 8, 2009, an incident at Caterpillar’s Joliet, Illinois facility resulted in the release of approximately 3,000 gallons of wastewater into the Des Plaines River. In coordination with state and federal authorities, appropriate remediation measures have been taken. On February 23, 2009, the Illinois Attorney General filed a Complaint in Will County Circuit Court containing seven counts of violations of state environmental laws and regulations. Caterpillar settled this matter with the State of Illinois in 2010, resolving all allegations in the Complaint. This settlement does not have a material adverse impact on our consolidated results of operations, financial position, or liquidity. In addition, on March 5, 2009, the EPA served Caterpillar with a Notice of Intent to file a Civil
Administrative Action (notice), indicating the EPA’s intent to seek civil penalties for alleged violations of the Clean Water Act and Oil Pollution Act. On January 25, 2010, the EPA issued a revised notice seeking civil penalties in the amount of $167,800. Caterpillar settled this matter with the EPA on July 12, 2011, resolving all allegations in the notice. This settlement does not have a material adverse impact on our consolidated results of operations, financial position or liquidity.
In May 2010, an incident at Caterpillar’s Gosselies, Belgium facility resulted in the release of wastewater into the Perupont River. In coordination with local authorities, appropriate remediation measures have been taken. In January 2011, Caterpillar learned that the public prosecutor for the Belgian administrative district of Charleroi had referred the matter to an examining magistrate of the civil court of Charleroi for further investigation. Caterpillar is cooperating with the Belgian authorities on this investigation. At this time, it is unlikely that penalties will be assessed, and any penalties are unlikely to exceed $100,000. Management does not believe this matter will have a material adverse impact on our consolidated results of operations, financial position or liquidity.
Retirement Benefits
We recognized pension expense of $164 million and $491 million for the three and nine months ended September 30, 2011, as compared to $194 million and $504 million for the three and nine months ended September 30, 2010. The decrease in expense is due to lower service cost and $28 million in curtailment expense recognized in 2010 due to changes in our U.S. pension plans (discussed below), partially offset by increased amortization of net actuarial losses due to lower discount rates at the end of 2010 and significant asset losses in 2008. Accounting guidance on retirement benefits requires companies to discount future benefit obligations back to today’s dollars using a discount rate that is based on high-quality fixed-income investments. A decrease in the discount rate increases the pension benefit obligation, while an increase in the discount rate decreases the pension benefit obligation. This increase or decrease in the pension benefit obligation is recognized in Accumulated other comprehensive income (loss) and subsequently amortized into earnings as an actuarial gain or loss. The guidance also requires companies to use an expected long-term rate of asset return for computing current year pension expense. Differences between the actual and expected returns are also recognized in Accumulated other comprehensive income (loss) and subsequently amortized into earnings as actuarial gains and losses. As of September 30, 2011, total actuarial losses, recognized in Accumulated other comprehensive income (loss), related to pensions were $5.69 billion. The majority of the actuarial losses are due to lower discount rates, losses from other demographic and economic assumptions over the past several years and plan asset losses.
Other postretirement benefit expense was $81 million and $241 million for the three and nine months ended September 30, 2011, as compared to $50 million and $149 million for the three and nine months ended September 30, 2010. The increase in expense was primarily the result of increased amortization of net actuarial losses due to lower discount rates at the end of 2010 and changes in our health care trend assumption, partially offset by gains from lower than expected health care costs. Actuarial losses, recognized in Accumulated other comprehensive income (loss), for other postretirement benefit plans were $1.11 billion at September 30, 2011. These losses mainly reflect changes in our health care trend assumption and several years of declining discount rates, partially offset by gains from lower than expected health care costs.
Actuarial losses for both pensions and other postretirement benefits will be impacted in future periods by actual asset returns, actual health care inflation, discount rate changes, actual demographic experience and other factors that impact these expenses. These losses, reported in Accumulated other comprehensive income (loss), will be amortized as a component of net periodic benefit cost on a straight-line basis over the average remaining service period of active employees expected to receive benefits under the benefit plans. At the end of 2010, the average remaining service period of active employees was 11 years for our U.S. pension plans, 15 years for our non-U.S. pension plans and 7 years for other postretirement benefit plans.
In March 2010, the Patient Protection and Affordable Care Act (the PPACA) and the Health Care and Education Reconciliation Act of 2010 (H.R. 4872) which amends certain provisions of the PPACA were signed into law. The Medicare Part D retiree drug subsidies effectively become taxable beginning in 2013.
In August 2010, we announced changes in our U.S. support and management pension plans. On January 1, 2011, retirement benefits for U.S. support and management employees began transitioning from defined benefit pension plans to defined contribution plans. The transition date was determined for each employee based upon age and years of service or proximity to retirement. Pension benefit accruals were frozen for certain employees on December 31, 2010, and will freeze for remaining employees on December 31, 2019. As of these dates, employees will move to the new retirement benefit that will provide a frozen pension benefit and a 401(k) plan that will include a matching contribution and a new annual employer contribution. The plan change required a re-measurement as of August 31, 2010, which resulted in an increase in our Liability for postemployment benefits of $1.32 billion and a decrease in Accumulated other comprehensive income (loss) of $831 million net of tax. The increase in the liability was due to a decline in the discount rate and lower than expected asset returns at the re-measurement date. Curtailment expense of $28 million was also recognized for the three and nine months ended September 30, 2010 as a result of the plan change.
Accounting guidance requires recognition of the overfunded or underfunded status of pension and other postretirement benefit plans on the balance sheet. Based on year-to-date negative plan asset returns as of September 30, 2011 and lower discount rates (approximately 4.40 percent for our U.S. plans), we would be required to recognize an increase in our underfunded status of approximately $4.0 billion at December 31, 2011. This would result in an increase in our Liability for postemployment benefits of approximately $4.0 billion and a decrease in Accumulated other comprehensive income (loss) of approximately $2.6 billion net of tax. It is difficult to predict the adjustment amount, as it is dependent on several factors including the discount rate, actual returns on plan assets and other actuarial assumptions. Final determination will only be known on the measurement date, which is December 31, 2011.
We expect our total defined benefit expense to increase approximately $100 million in 2011 as compared to 2010. This increase in expense is primarily due to increased amortization of net actuarial losses due to lower discount rates at the end of 2010, significant asset losses in 2008 and changes in our health care trend assumption. These increases are partially offset by a decrease in pension service cost and $28 million of curtailment expense recognized in 2010 due to the changes in our U.S. pension plans.
We made $105 million and $340 million of contributions to our U.S. and non-U.S. pension plans during the three and nine months ended September 30, 2011, respectively. We currently anticipate full-year 2011 contributions of approximately $440 million. We made $409 million and $957 million of contributions to our U.S. and non-U.S. pension plans during the three and nine months ended September 30, 2010, respectively.
Order Backlog
The dollar amount of backlog believed to be firm was approximately $28.6 billion at September 30, 2011 and $18.7 billion at December 31, 2010. Of the total backlog, approximately $4.4 billion at September 30, 2011 and $2.8 billion at December 31, 2010 was not expected to be filled in the following twelve months. The acquisition of Bucyrus International, Inc. in July 2011 increased the order backlog by approximately $4.2 billion.
NON-GAAP FINANCIAL MEASURES
The following definitions are provided for “non-GAAP financial measures” in connection with Item 10(e) of Regulation S-K issued by the Securities and Exchange Commission. These non-GAAP financial measures have no standardized meaning prescribed by U.S. GAAP and therefore are unlikely to be comparable to the calculation of similar measures for other companies. Management does not intend these items to be considered in isolation or substitutes for the related GAAP measures.
Bucyrus-Related Profit-Per-Share Impacts
We acquired Bucyrus International, Inc. on July 8, 2011. The third quarter loss was primarily due to inventory step-up, deal-related and integration costs (including severance-related costs), incremental amortization of intangible assets and interest expense, partially offset by operating profit from ongoing operations. We believe it is important to separately quantify the sales and revenues and profit-per-share impacts in order for our 2011 actual results to be meaningful to our readers and more comparable to prior period results. Reconciliation of sales and revenues and profit per share excluding Bucyrus impacts to the most directly comparable GAAP measure, is as follows:
|
(Dollars in billions except per share data) |
|
Third Quarter 2011 |
|
Nine Months Ended
|
|
|
|
|
|
|
|
|
|
Sales and Revenues |
|
$15.716 |
|
$42.895 |
|
|
|
|
|
|
|
|
|
Bucryus Sales impact |
|
1.135 |
|
1.135 |
|
|
|
|
|
|
|
|
|
Sales and Revenues excluding Bucyrus |
|
$14.581 |
|
$41.760 |
|
|
|
|
|
|
|
|
|
Profit per share |
|
$1.71 |
|
$5.08 |
|
|
|
|
|
|
|
|
|
Profit per share Bucyrus impact |
|
0.22 |
|
0.46 |
|
|
|
|
|
|
|
|
|
Profit per share excluding Bucyrus |
|
$1.93 |
|
$5.54 |
|
|
|
|
|
|
|
|
Supplemental Consolidating Data
We are providing supplemental consolidating data for the purpose of additional analysis. The data has been grouped as follows:
Consolidated – Caterpillar Inc. and its subsidiaries.
Machinery and Power Systems – The Machinery and Power Systems data contained in the schedules on pages 78 to 85 are “non-GAAP financial measures” as defined by the Securities and Exchange Commission in Item 10(e) of Regulation S-K. This non-GAAP financial measure has no standardized meaning prescribed by U.S. GAAP, and therefore, is unlikely to be comparable with the calculation of similar measures for other companies. Management does not intend this item to be considered in isolation or as a substitute for the related GAAP measure. Caterpillar defines Machinery and Power Systems as it is presented in the supplemental data as Caterpillar Inc. and its subsidiaries with Financial Products accounted for on the equity basis. Machinery and Power Systems information relates to the design, manufacture and marketing of our products. Financial Products information relates to the financing to customers and dealers for the purchase and lease of Caterpillar and other equipment. The nature of these businesses is different especially with regard to the financial position and cash flow items. Caterpillar management utilizes this presentation internally to highlight these differences. We also believe this presentation will assist readers in understanding our business.
Financial Products – Our finance and insurance subsidiaries, primarily Cat Financial and Cat Insurance.
Consolidating Adjustments – Eliminations of transactions between Machinery and Power Systems and Financial Products.
Pages 78 to 85 reconcile Machinery and Power Systems with Financial Products on the equity basis to Caterpillar Inc. consolidated financial information.
Caterpillar Inc.
Supplemental Data for Results of Operations
For The Three Months Ended September 30, 2011
(Unaudited)
(Millions of dollars)
|
|
|
|
|
Supplemental Consolidating Data |
|
||||
|
|
|
Consolidated |
|
Machinery
|
|
Financial
|
|
Consolidating
|
|
|
Sales and revenues: |
|
|
|
|
|
|
|
|
|
|
Sales of Machinery and Power Systems |
|
$15,023 |
|
$15,023 |
|
$— |
|
$— |
|
|
Revenues of Financial Products |
|
693 |
|
— |
|
774 |
|
(81) 2 |
|
|
Total sales and revenues |
|
15,716 |
|
15,023 |
|
774 |
|
(81) |
|
|
|
|
|
|
|
|
|
|
|
|
|
Operating costs: |
|
|
|
|
|
|
|
|
|
|
Cost of goods sold |
|
11,455 |
|
11,455 |
|
— |
|
— |
|
|
Selling, general and administrative expenses |
|
1,360 |
|
1,217 |
|
151 |
|
(8) 3 |
|
|
Research and development expenses |
|
584 |
|
584 |
|
— |
|
— |
|
|
Interest expense of Financial Products |
|
211 |
|
— |
|
211 |
|
— 4 |
|
|
Other operating (income) expenses |
|
347 |
|
87 |
|
267 |
|
(7) 3 |
|
|
Total operating costs |
|
13,957 |
|
13,343 |
|
629 |
|
(15) |
|
|
|
|
|
|
|
|
|
|
|
|
|
Operating profit (loss) |
|
1,759 |
|
1,680 |
|
145 |
|
(66) |
|
|
|
|
|
|
|
|
|
|
|
|
|
Interest expense excluding Financial Products |
|
112 |
|
123 |
|
— |
|
(11) 4 |
|
|
Other income (expense) |
|
(13) |
|
(68) |
|
— |
|
55 5 |
|
|
|
|
|
|
|
|
|
|
|
|
|
Consolidated profit (loss) before taxes |
|
1,634 |
|
1,489 |
|
145 |
|
— |
|
|
|
|
|
|
|
|
|
|
|
|
|
Provision (benefit) for income taxes |
|
474 |
|
437 |
|
37 |
|
— |
|
|
Profit (loss) of consolidated companies |
|
1,160 |
|
1,052 |
|
108 |
|
— |
|
|
|
|
|
|
|
|
|
|
|
|
|
Equity in profit (loss) of unconsolidated affiliated companies |
|
(6) |
|
(6) |
|
— |
|
— |
|
|
Equity in profit of Financial Products’ subsidiaries |
|
— |
|
104 |
|
— |
|
(104) 6 |
|
|
|
|
|
|
|
|
|
|
|
|
|
Profit (loss) of consolidated and affiliated companies |
|
1,154 |
|
1,150 |
|
108 |
|
(104) |
|
|
|
|
|
|
|
|
|
|
|
|
|
Less: Profit (loss) attributable to noncontrolling interests |
|
13 |
|
9 |
|
4 |
|
— |
|
|
|
|
|
|
|
|
|
|
|
|
|
Profit (loss) 7 |
|
$1,141 |
|
$1,141 |
|
$104 |
|
$(104) |
|
1 Represents Caterpillar Inc. and its subsidiaries with Financial Products accounted for on the equity basis.
2 Elimination of Financial Products’ revenues earned from Machinery and Power Systems.
3 Elimination of net expenses recorded by Machinery and Power Systems paid to Financial Products.
4 Elimination of interest expense recorded between Financial Products and Machinery and Power Systems.
5 Elimination of discount recorded by Machinery and Power Systems on receivables sold to Financial Products and of interest earned between Machinery and Power Systems and Financial Products.
6 Elimination of Financial Products’ profit due to equity method of accounting.
7 Profit (loss) attributable to common stockholders.
Caterpillar Inc.
Supplemental Data for Results of Operations
For The Three Months Ended September 30, 2010
(Unaudited)
(Millions of dollars)
|
|
|
|
|
Supplemental Consolidating Data |
|
||||
|
|
|
Consolidated |
|
Machinery
|
|
Financial
|
|
Consolidating
|
|
|
Sales and revenues: |
|
|
|
|
|
|
|
|
|
|
Sales of Machinery and Power Systems |
|
$10,452 |
|
$10,452 |
|
$— |
|
$— |
|
|
Revenues of Financial Products |
|
682 |
|
— |
|
749 |
|
(67) 2 |
|
|
Total sales and revenues |
|
11,134 |
|
10,452 |
|
749 |
|
(67) |
|
|
|
|
|
|
|
|
|
|
|
|
|
Operating costs: |
|
|
|
|
|
|
|
|
|
|
Cost of goods sold |
|
7,752 |
|
7,752 |
|
— |
|
— |
|
|
Selling, general and administrative expenses |
|
1,148 |
|
999 |
|
152 |
|
(3) 3 |
|
|
Research and development expenses |
|
510 |
|
510 |
|
— |
|
— |
|
|
Interest expense of Financial Products |
|
227 |
|
— |
|
228 |
|
(1) 4 |
|
|
Other operating (income) expenses |
|
310 |
|
45 |
|
273 |
|
(8) 3 |
|
|
Total operating costs |
|
9,947 |
|
9,306 |
|
653 |
|
(12) |
|
|
|
|
|
|
|
|
|
|
|
|
|
Operating profit (loss) |
|
1,187 |
|
1,146 |
|
96 |
|
(55) |
|
|
|
|
|
|
|
|
|
|
|
|
|
Interest expense excluding Financial Products |
|
85 |
|
101 |
|
— |
|
(16) 4 |
|
|
Other income (expense) |
|
1 |
|
(52) |
|
14 |
|
39 5 |
|
|
|
|
|
|
|
|
|
|
|
|
|
Consolidated profit (loss) before taxes |
|
1,103 |
|
993 |
|
110 |
|
— |
|
|
|
|
|
|
|
|
|
|
|
|
|
Provision (benefit) for income taxes |
|
295 |
|
275 |
|
20 |
|
— |
|
|
Profit (loss) of consolidated companies |
|
808 |
|
718 |
|
90 |
|
— |
|
|
|
|
|
|
|
|
|
|
|
|
|
Equity in profit (loss) of unconsolidated affiliated companies |
|
(7) |
|
(7) |
|
— |
|
— |
|
|
Equity in profit of Financial Products’ subsidiaries |
|
— |
|
87 |
|
— |
|
(87) 6 |
|
|
|
|
|
|
|
|
|
|
|
|
|
Profit (loss) of consolidated and affiliated companies |
|
801 |
|
798 |
|
90 |
|
(87) |
|
|
|
|
|
|
|
|
|
|
|
|
|
Less: Profit (loss) attributable to noncontrolling interests |
|
9 |
|
6 |
|
3 |
|
— |
|
|
|
|
|
|
|
|
|
|
|
|
|
Profit (loss) 7 |
|
$792 |
|
$792 |
|
$87 |
|
$(87) |
|
1 Represents Caterpillar Inc. and its subsidiaries with Financial Products accounted for on the equity basis.
2 Elimination of Financial Products’ revenues earned from Machinery and Power Systems.
3 Elimination of net expenses recorded by Machinery and Power Systems paid to Financial Products.
4 Elimination of interest expense recorded between Financial Products and Machinery and Power Systems.
5 Elimination of discount recorded by Machinery and Power Systems on receivables sold to Financial Products and of interest earned between Machinery and Power Systems and Financial Products.
6 Elimination of Financial Products’ profit due to equity method of accounting.
7 Profit (loss) attributable to common stockholders.
Caterpillar Inc.
Supplemental Data for Results of Operations
For The Nine Months Ended September 30, 2011
(Unaudited)
(Millions of dollars)
|
|
|
|
|
Supplemental Consolidating Data |
|
||||
|
|
|
Consolidated |
|
Machinery
|
|
Financial
|
|
Consolidating
|
|
|
Sales and revenues: |
|
|
|
|
|
|
|
|
|
|
Sales of Machinery and Power Systems |
|
$40,835 |
|
$40,835 |
|
$— |
|
$— |
|
|
Revenues of Financial Products |
|
2,060 |
|
— |
|
2,291 |
|
(231) 2 |
|
|
Total sales and revenues |
|
42,895 |
|
40,835 |
|
2,291 |
|
(231) |
|
|
|
|
|
|
|
|
|
|
|
|
|
Operating costs: |
|
|
|
|
|
|
|
|
|
|
Cost of goods sold |
|
30,815 |
|
30,815 |
|
— |
|
— |
|
|
Selling, general and administrative expenses |
|
3,716 |
|
3,287 |
|
444 |
|
(15) 3 |
|
|
Research and development expenses |
|
1,693 |
|
1,693 |
|
— |
|
— |
|
|
Interest expense of Financial Products |
|
623 |
|
— |
|
624 |
|
(1) 4 |
|
|
Other operating (income) expenses |
|
855 |
|
86 |
|
796 |
|
(27) 3 |
|
|
Total operating costs |
|
37,702 |
|
35,881 |
|
1,864 |
|
(43) |
|
|
|
|
|
|
|
|
|
|
|
|
|
Operating profit (loss) |
|
5,193 |
|
4,954 |
|
427 |
|
(188) |
|
|
|
|
|
|
|
|
|
|
|
|
|
Interest expense excluding Financial Products |
|
289 |
|
321 |
|
— |
|
(32) 4 |
|
|
Other income (expense) |
|
(157) |
|
(342) |
|
29 |
|
156 5 |
|
|
|
|
|
|
|
|
|
|
|
|
|
Consolidated profit (loss) before taxes |
|
4,747 |
|
4,291 |
|
456 |
|
— |
|
|
|
|
|
|
|
|
|
|
|
|
|
Provision (benefit) for income taxes |
|
1,304 |
|
1,184 |
|
120 |
|
— |
|
|
Profit (loss) of consolidated companies |
|
3,443 |
|
3,107 |
|
336 |
|
— |
|
|
|
|
|
|
|
|
|
|
|
|
|
Equity in profit (loss) of unconsolidated affiliated companies |
|
(24) |
|
(24) |
|
— |
|
— |
|
|
Equity in profit of Financial Products’ subsidiaries |
|
— |
|
324 |
|
— |
|
(324) 6 |
|
|
|
|
|
|
|
|
|
|
|
|
|
Profit (loss) of consolidated and affiliated companies |
|
3,419 |
|
3,407 |
|
336 |
|
(324) |
|
|
|
|
|
|
|
|
|
|
|
|
|
Less: Profit (loss) attributable to noncontrolling interests |
|
38 |
|
26 |
|
12 |
|
— |
|
|
|
|
|
|
|
|
|
|
|
|
|
Profit (loss) 7 |
|
$3,381 |
|
$3,381 |
|
$324 |
|
$(324) |
|
1 Represents Caterpillar Inc. and its subsidiaries with Financial Products accounted for on the equity basis.
2 Elimination of Financial Products’ revenues earned from Machinery and Power Systems.
3 Elimination of net expenses recorded by Machinery and Power Systems paid to Financial Products.
4 Elimination of interest expense recorded between Financial Products and Machinery and Power Systems.
5 Elimination of discount recorded by Machinery and Power Systems on receivables sold to Financial Products and of interest earned between Machinery and Power Systems and Financial Products.
6 Elimination of Financial Products’ profit due to equity method of accounting.
7 Profit (loss) attributable to common stockholders.
Caterpillar Inc.
Supplemental Data for Results of Operations
For The Nine Months Ended September 30, 2010
(Unaudited)
(Millions of dollars)
|
|
|
|
|
Supplemental Consolidating Data |
||||
|
|
|
Consolidated |
|
Machinery
|
|
Financial
|
|
Consolidating
|
|
|
|
|
|
|
|
|
|
|
|
Sales and revenues: |
|
|
|
|
|
|
|
|
|
Sales of Machinery and Power Systems |
|
$27,726 |
|
$27,726 |
|
$— |
|
$— |
|
Revenues of Financial Products |
|
2,055 |
|
— |
|
2,248 |
|
(193) 2 |
|
Total sales and revenues |
|
29,781 |
|
27,726 |
|
2,248 |
|
(193) |
|
|
|
|
|
|
|
|
|
|
|
Operating costs: |
|
|
|
|
|
|
|
|
|
Cost of goods sold |
|
21,018 |
|
21,018 |
|
— |
|
— |
|
Selling, general and administrative expenses |
|
3,139 |
|
2,715 |
|
441 |
|
(17) 3 |
|
Research and development expenses |
|
1,362 |
|
1,362 |
|
— |
|
— |
|
Interest expense of Financial Products |
|
694 |
|
— |
|
696 |
|
(2) 4 |
|
Other operating (income) expenses |
|
896 |
|
88 |
|
826 |
|
(18) 3 |
|
Total operating costs |
|
27,109 |
|
25,183 |
|
1,963 |
|
(37) |
|
|
|
|
|
|
|
|
|
|
|
Operating profit (loss) |
|
2,672 |
|
2,543 |
|
285 |
|
(156) |
|
|
|
|
|
|
|
|
|
|
|
Interest expense excluding Financial Products |
|
268 |
|
325 |
|
— |
|
(57) 4 |
|
Other income (expense) |
|
114 |
|
(29) |
|
44 |
|
99 5 |
|
|
|
|
|
|
|
|
|
|
|
Consolidated profit (loss) before taxes |
|
2,518 |
|
2,189 |
|
329 |
|
— |
|
|
|
|
|
|
|
|
|
|
|
Provision (benefit) for income taxes |
|
735 |
|
670 |
|
65 |
|
— |
|
Profit (loss) of consolidated companies |
|
1,783 |
|
1,519 |
|
264 |
|
— |
|
|
|
|
|
|
|
|
|
|
|
Equity in profit (loss) of unconsolidated affiliated companies |
|
(13) |
|
(13) |
|
— |
|
— |
|
Equity in profit of Financial Products’ subsidiaries |
|
— |
|
256 |
|
— |
|
(256) 6 |
|
|
|
|
|
|
|
|
|
|
|
Profit (loss) of consolidated and affiliated companies |
|
1,770 |
|
1,762 |
|
264 |
|
(256) |
|
|
|
|
|
|
|
|
|
|
|
Less: Profit (loss) attributable to noncontrolling interests |
|
38 |
|
30 |
|
8 |
|
— |
|
|
|
|
|
|
|
|
|
|
|
Profit (loss) 7 |
|
$1,732 |
|
$1,732 |
|
$256 |
|
$(256) |
1 Represents Caterpillar Inc. and its subsidiaries with Financial Products accounted for on the equity basis.
2 Elimination of Financial Products’ revenues earned from Machinery and Power Systems.
3 Elimination of net expenses recorded by Machinery and Power Systems paid to Financial Products.
4 Elimination of interest expense recorded between Financial Products and Machinery and Power Systems.
5 Elimination of discount recorded by Machinery and Power Systems on receivables sold to Financial Products and of interest earned between Machinery and Power Systems and Financial Products.
6 Elimination of Financial Products’ profit due to equity method of accounting.
7 Profit (loss) attributable to common stockholders.
Caterpillar Inc.
Supplemental Data for Financial Position
At September 30, 2011
(Unaudited)
(Millions of dollars)
|
|
|
|
|
Supplemental Consolidating Data |
||||
|
|
|
Consolidated |
|
Machinery
|
|
Financial
|
|
Consolidating
|
|
Assets |
|
|
|
|
|
|
|
|
|
Current assets: |
|
|
|
|
|
|
|
|
|
Cash and short-term investments |
|
$3,229 |
|
$1,649 |
|
$1,580 |
|
$— |
|
Receivables – trade and other |
|
9,386 |
|
5,308 |
|
396 |
|
3,682 2,3 |
|
Receivables – finance |
|
7,920 |
|
— |
|
11,743 |
|
(3,823) 3 |
|
Deferred and refundable income taxes |
|
1,122 |
|
1,074 |
|
48 |
|
— |
|
Prepaid expenses and other current assets |
|
795 |
|
381 |
|
426 |
|
(12) 4 |
|
Inventories |
|
14,412 |
|
14,412 |
|
— |
|
— |
|
Total current assets |
|
36,864 |
|
22,824 |
|
14,193 |
|
(153) |
|
|
|
|
|
|
|
|
|
|
|
Property, plant and equipment – net |
|
13,397 |
|
10,529 |
|
2,868 |
|
— |
|
Long-term receivables – trade and other |
|
1,283 |
|
291 |
|
300 |
|
692 2,3 |
|
Long-term receivables – finance |
|
11,445 |
|
— |
|
12,168 |
|
(723) 3 |
|
Investments in unconsolidated affiliated companies |
|
121 |
|
121 |
|
— |
|
— |
|
Investments in Financial Products subsidiaries |
|
— |
|
3,965 |
|
— |
|
(3,965) 5 |
|
Noncurrent deferred and refundable income taxes |
|
806 |
|
1,188 |
|
103 |
|
(485) 6 |
|
Intangible assets |
|
4,529 |
|
4,520 |
|
9 |
|
— |
|
Goodwill |
|
7,778 |
|
7,761 |
|
17 |
|
— |
|
Other assets |
|
1,544 |
|
306 |
|
1,238 |
|
— |
|
Total assets |
|
$77,767 |
|
$51,505 |
|
$30,896 |
|
$(4,634) |
|
|
|
|
|
|
|
|
|
|
|
Liabilities |
|
|
|
|
|
|
|
|
|
Current liabilities: |
|
|
|
|
|
|
|
|
|
Short-term borrowings |
|
$3,914 |
|
$412 |
|
$3,548 |
|
$(46) 7 |
|
Accounts payable |
|
7,524 |
|
7,428 |
|
189 |
|
(93) 8 |
|
Accrued expenses |
|
3,186 |
|
2,779 |
|
421 |
|
(14) 9 |
|
Accrued wages, salaries and employee benefits |
|
2,062 |
|
2,033 |
|
29 |
|
— |
|
Customer advances |
|
2,745 |
|
2,745 |
|
— |
|
— |
|
Dividends payable |
|
— |
|
— |
|
— |
|
— |
|
Other current liabilities |
|
2,193 |
|
1,800 |
|
401 |
|
(8) 6 |
|
Long-term debt due within one year |
|
3,594 |
|
72 |
|
3,522 |
|
— |
|
Total current liabilities |
|
25,218 |
|
17,269 |
|
8,110 |
|
(161) |
|
Long-term debt due after one year |
|
26,781 |
|
8,934 |
|
17,878 |
|
(31) 7 |
|
Liability for postemployment benefits |
|
7,494 |
|
7,494 |
|
— |
|
— |
|
Other liabilities |
|
3,570 |
|
3,104 |
|
943 |
|
(477) 6 |
|
Total liabilities |
|
63,063 |
|
36,801 |
|
26,931 |
|
(669) |
|
Commitments and contingencies |
|
|
|
|
|
|
|
|
|
Redeemable noncontrolling interest |
|
491 |
|
491 |
|
— |
|
— |
|
Stockholders’ equity |
|
|
|
|
|
|
|
|
|
Common stock |
|
4,229 |
|
4,229 |
|
906 |
|
(906) 5 |
|
Treasury stock |
|
(10,299) |
|
(10,299) |
|
— |
|
— |
|
Profit employed in the business |
|
24,251 |
|
24,251 |
|
2,751 |
|
(2,751) 5 |
|
Accumulated other comprehensive income (loss) |
|
(4,019) |
|
(4,019) |
|
210 |
|
(210) 5 |
|
Noncontrolling interests |
|
51 |
|
51 |
|
98 |
|
(98) 5 |
|
Total stockholders’ equity |
|
14,213 |
|
14,213 |
|
3,965 |
|
(3,965) |
|
Total liabilities, redeemable noncontrolling interest and stockholders’ equity |
|
$77,767 |
|
$51,505 |
|
$30,896 |
|
$(4,634) |
1 Represents Caterpillar Inc. and its subsidiaries with Financial Products accounted for on the equity basis.
2 Elimination of receivables between Machinery and Power Systems and Financial Products.
3 Reclassification of Machinery and Power Systems’ trade receivables purchased by Cat Financial and Cat Financial’s wholesale inventory receivables.
4 Elimination of Machinery and Power Systems’ insurance premiums that are prepaid to Financial Products.
5 Elimination of Financial Products’ equity which is accounted for by Machinery and Power Systems on the equity basis.
6 Reclassification reflecting required netting of deferred tax assets / liabilities by taxing jurisdiction.
7 Elimination of debt between Machinery and Power Systems and Financial Products.
8 Elimination of payables between Machinery and Power Systems and Financial Products.
9 Elimination of prepaid insurance in Financial Products’ accrued expenses.
Caterpillar Inc.
Supplemental Data for Financial Position
At December 31, 2010
(Unaudited)
(Millions of dollars)
|
|
|
|
|
Supplemental Consolidating Data |
||||
|
|
|
Consolidated |
|
Machinery
|
|
Financial
|
|
Consolidating
|
|
Assets |
|
|
|
|
|
|
|
|
|
Current assets: |
|
|
|
|
|
|
|
|
|
Cash and short-term investments |
|
$3,592 |
|
$1,825 |
|
$1,767 |
|
$— |
|
Receivables – trade and other |
|
8,494 |
|
5,893 |
|
482 |
|
2,119 2,3 |
|
Receivables – finance |
|
8,298 |
|
— |
|
11,158 |
|
(2,860) 3 |
|
Deferred and refundable income taxes |
|
931 |
|
823 |
|
108 |
|
— |
|
Prepaid expenses and other current assets |
|
908 |
|
371 |
|
550 |
|
(13) 4 |
|
Inventories |
|
9,587 |
|
9,587 |
|
— |
|
— |
|
Total current assets |
|
31,810 |
|
18,499 |
|
14,065 |
|
(754) |
|
|
|
|
|
|
|
|
|
|
|
Property, plant and equipment – net |
|
12,539 |
|
9,662 |
|
2,877 |
|
— |
|
Long-term receivables – trade and other |
|
793 |
|
271 |
|
236 |
|
286 2,3 |
|
Long-term receivables – finance |
|
11,264 |
|
— |
|
11,586 |
|
(322) 3 |
|
Investments in unconsolidated affiliated companies |
|
164 |
|
156 |
|
8 |
|
— |
|
Investments in Financial Products subsidiaries |
|
— |
|
4,275 |
|
— |
|
(4,275) 5 |
|
Noncurrent deferred and refundable income taxes |
|
2,493 |
|
2,922 |
|
90 |
|
(519) 6 |
|
Intangible assets |
|
805 |
|
795 |
|
10 |
|
— |
|
Goodwill |
|
2,614 |
|
2,597 |
|
17 |
|
— |
|
Other assets |
|
1,538 |
|
314 |
|
1,224 |
|
— |
|
Total assets |
|
$64,020 |
|
$39,491 |
|
$30,113 |
|
$(5,584) |
|
|
|
|
|
|
|
|
|
|
|
Liabilities |
|
|
|
|
|
|
|
|
|
Current liabilities: |
|
|
|
|
|
|
|
|
|
Short-term borrowings |
|
$4,056 |
|
$306 |
|
$4,452 |
|
$(702) 7 |
|
Accounts payable |
|
5,856 |
|
5,717 |
|
177 |
|
(38) 8 |
|
Accrued expenses |
|
2,880 |
|
2,422 |
|
470 |
|
(12) 9 |
|
Accrued wages, salaries and employee benefits |
|
1,670 |
|
1,642 |
|
28 |
|
— |
|
Customer advances |
|
1,831 |
|
1,831 |
|
— |
|
— |
|
Dividends payable |
|
281 |
|
281 |
|
— |
|
— |
|
Other current liabilities |
|
1,521 |
|
1,142 |
|
393 |
|
(14) 6 |
|
Long-term debt due within one year |
|
3,925 |
|
495 |
|
3,430 |
|
— |
|
Total current liabilities |
|
22,020 |
|
13,836 |
|
8,950 |
|
(766) |
|
Long-term debt due after one year |
|
20,437 |
|
4,543 |
|
15,932 |
|
(38) 7 |
|
Liability for postemployment benefits |
|
7,584 |
|
7,584 |
|
— |
|
— |
|
Other liabilities |
|
2,654 |
|
2,203 |
|
956 |
|
(505) 6 |
|
Total liabilities |
|
52,695 |
|
28,166 |
|
25,838 |
|
(1,309) |
|
Commitments and contingencies |
|
|
|
|
|
|
|
|
|
Redeemable noncontrolling interest |
|
461 |
|
461 |
|
— |
|
— |
|
Stockholders’ equity |
|
|
|
|
|
|
|
|
|
Common stock |
|
3,888 |
|
3,888 |
|
902 |
|
(902) 5 |
|
Treasury stock |
|
(10,397) |
|
(10,397) |
|
— |
|
— |
|
Profit employed in the business |
|
21,384 |
|
21,384 |
|
3,027 |
|
(3,027) 5 |
|
Accumulated other comprehensive income (loss) |
|
(4,051) |
|
(4,051) |
|
263 |
|
(263) 5 |
|
Noncontrolling interests |
|
40 |
|
40 |
|
83 |
|
(83) 5 |
|
Total stockholders’ equity |
|
10,864 |
|
10,864 |
|
4,275 |
|
(4,275) |
|
Total liabilities, redeemable noncontrolling interest and stockholders’ equity |
|
$64,020 |
|
$39,491 |
|
$30,113 |
|
$(5,584) |
1 Represents Caterpillar Inc. and its subsidiaries with Financial Products accounted for on the equity basis.
2 Elimination of receivables between Machinery and Power Systems and Financial Products.
3 Reclassification of Machinery and Power Systems’ trade receivables purchased by Cat Financial and Cat Financial’s wholesale inventory receivables.
4 Elimination of Machinery and Power Systems’ insurance premiums that are prepaid to Financial Products.
5 Elimination of Financial Products’ equity which is accounted for by Machinery and Power Systems on the equity basis.
6 Reclassification reflecting required netting of deferred tax assets / liabilities by taxing jurisdiction.
7 Elimination of debt between Machinery and Power Systems and Financial Products.
8 Elimination of payables between Machinery and Power Systems and Financial Products.
9 Elimination of prepaid insurance in Financial Products’ accrued expenses.
Caterpillar Inc.
Supplemental Data for Cash Flow
For The Nine Months Ended September 30, 2011
(Unaudited)
(Millions of dollars)
|
|
|
|
|
Supplemental Consolidating Data |
||||
|
|
|
Consolidated |
|
Machinery
|
|
Financial
|
|
Consolidating
|
|
Cash flow from operating activities: |
|
|
|
|
|
|
|
|
|
Profit (loss) of consolidated and affiliated companies |
|
$3,419 |
|
$3,407 |
|
$336 |
|
$(324) 2 |
|
Adjustments for non-cash items: |
|
|
|
|
|
|
|
|
|
Depreciation and amortization |
|
1,832 |
|
1,287 |
|
545 |
|
— |
|
Other |
|
558 |
|
454 |
|
(74) |
|
178 4 |
|
Financial Products’ dividend in excess of profit |
|
— |
|
276 |
|
— |
|
(276) 3 |
|
Changes in assets and liabilities, net of acquisitions and divestitures: |
|
|
|
|
|
|
|
|
|
Receivables - trade and other |
|
(254) |
|
764 |
|
26 |
|
(1,044) 4,5 |
|
Inventories |
|
(2,716) |
|
(2,716) |
|
— |
|
— |
|
Accounts payable |
|
1,308 |
|
1,351 |
|
12 |
|
(55) 4 |
|
Accrued expenses |
|
134 |
|
149 |
|
(13) |
|
(2) 4 |
|
Accrued wages, salaries and employee benefits |
|
275 |
|
274 |
|
1 |
|
— |
|
Customer advances |
|
333 |
|
333 |
|
— |
|
— |
|
Other assets – net |
|
(74) |
|
(92) |
|
53 |
|
(35) 4 |
|
Other liabilities – net |
|
700 |
|
661 |
|
5 |
|
34 4 |
|
Net cash provided by (used for) operating activities |
|
5,515 |
|
6,148 |
|
891 |
|
(1,524) |
|
Cash flow from investing activities: |
|
|
|
|
|
|
|
|
|
Capital expenditures - excluding equipment leased to others |
|
(1,515) |
|
(1,510) |
|
(5) |
|
— |
|
Expenditures for equipment leased to others |
|
(984) |
|
(75) |
|
(972) |
|
63 4 |
|
Proceeds from disposals of leased assets and property, plant and equipment |
|
922 |
|
107 |
|
886 |
|
(71) 4 |
|
Additions to finance receivables |
|
(7,091) |
|
— |
|
(35,196) |
|
28,105 5,9 |
|
Collections of finance receivables |
|
6,503 |
|
— |
|
33,329 |
|
(26,826) 5 |
|
Proceeds from sale of finance receivables |
|
106 |
|
— |
|
106 |
|
— |
|
Net intercompany borrowings |
|
— |
|
600 |
|
62 |
|
(662) 6 |
|
Investments and acquisitions (net of cash acquired) |
|
(7,413) |
|
(7,413) |
|
— |
|
— |
|
Proceeds from sale of businesses and investments (net of cash sold) |
|
21 |
|
357 |
|
11 |
|
(347) 9 |
|
Proceeds from sale of available-for-sale securities |
|
180 |
|
10 |
|
170 |
|
— |
|
Investments in available-for-sale securities |
|
(216) |
|
(9) |
|
(207) |
|
— |
|
Other – net |
|
37 |
|
(39) |
|
72 |
|
4 7 |
|
Net cash provided by (used for) investing activities |
|
(9,450) |
|
(7,972) |
|
(1,744) |
|
266 |
|
Cash flow from financing activities: |
|
|
|
|
|
|
|
|
|
Dividends paid |
|
(862) |
|
(862) |
|
(600) |
|
600 8 |
|
Distribution to noncontrolling interests |
|
(3) |
|
(3) |
|
— |
|
— |
|
Common stock issued, including treasury shares reissued |
|
110 |
|
110 |
|
4 |
|
(4) 7 |
|
Excess tax benefit from stock-based compensation |
|
169 |
|
169 |
|
— |
|
— |
|
Net intercompany borrowings |
|
— |
|
(62) |
|
(600) |
|
662 6 |
|
Proceeds from debt issued (original maturities greater than three months) |
|
13,247 |
|
4,544 |
|
8,703 |
|
— |
|
Payments on debt (original maturities greater than three months) |
|
(8,283) |
|
(2,203) |
|
(6,080) |
|
— |
|
Short-term borrowings – net (original maturities three months or less) |
|
(766) |
|
43 |
|
(809) |
|
— |
|
Net cash provided by (used for) financing activities |
|
3,612 |
|
1,736 |
|
618 |
|
1,258 |
|
Effect of exchange rate changes on cash |
|
(40) |
|
(88) |
|
48 |
|
— |
|
Increase (decrease) in cash and short-term investments |
|
(363) |
|
(176) |
|
(187) |
|
— |
|
Cash and short-term investments at beginning of period |
|
3,592 |
|
1,825 |
|
1,767 |
|
— |
|
Cash and short-term investments at end of period |
|
$3,229 |
|
$1,649 |
|
$1,580 |
|
$— |
1 Represents Caterpillar Inc. and its subsidiaries with Financial Products accounted for on the equity basis.
2 Elimination of Financial Products’ profit after tax due to equity method of accounting.
3 Elimination of Financial Products’ dividend to Machinery and Power Systems in excess of Financial Products’ profit.
4 Elimination of non-cash adjustments and changes in assets and liabilities related to consolidated reporting.
5 Reclassification of Cat Financial’s cash flow activity from investing to operating for receivables that arose from the sale of inventory.
6 Elimination of net proceeds and payments to/from Machinery and Power Systems and Financial Products.
7 Elimination of change in investment and common stock related to Financial Products.
8 Elimination of dividend from Financial Products to Machinery and Power Systems.
9 Elimination of proceeds received from Financial Products related to Machinery and Power Systems’ sale of Carter Machinery.
Caterpillar Inc.
Supplemental Data for Cash Flow
For The Nine Months Ended September 30, 2010
(Unaudited)
(Millions of dollars)
|
|
|
|
|
Supplemental Consolidating Data |
||||
|
|
|
Consolidated |
|
Machinery
|
|
Financial
|
|
Consolidating
|
|
Cash flow from operating activities: |
|
|
|
|
|
|
|
|
|
Profit (loss) of consolidated and affiliated companies |
|
$1,770 |
|
$1,762 |
|
$264 |
|
$(256) 2 |
|
Adjustments for non-cash items: |
|
|
|
|
|
|
|
|
|
Depreciation and amortization |
|
1,681 |
|
1,138 |
|
543 |
|
— |
|
Other |
|
345 |
|
363 |
|
(106) |
|
88 4 |
|
Financial Products’ dividend in excess of profit |
|
— |
|
344 |
|
— |
|
(344) 3 |
|
Changes in assets and liabilities, net of acquisitions and divestitures: |
|
|
|
|
|
|
|
|
|
Receivables - trade and other |
|
(1,337) |
|
(906) |
|
42 |
|
(473) 4,5 |
|
Inventories |
|
(2,086) |
|
(2,084) |
|
— |
|
(2) 4 |
|
Accounts payable |
|
1,966 |
|
1,970 |
|
14 |
|
(18) 4 |
|
Accrued expenses |
|
7 |
|
37 |
|
(44) |
|
14 4 |
|
Accrued wages, salaries and employee benefits |
|
647 |
|
633 |
|
14 |
|
— |
|
Customer advances |
|
183 |
|
183 |
|
— |
|
— |
|
Other assets – net |
|
131 |
|
93 |
|
(3) |
|
41 4 |
|
Other liabilities – net |
|
(360) |
|
(203) |
|
(101) |
|
(56) 4 |
|
Net cash provided by (used for) operating activities |
|
2,947 |
|
3,330 |
|
623 |
|
(1,006) |
|
Cash flow from investing activities: |
|
|
|
|
|
|
|
|
|
Capital expenditures - excluding equipment leased to others |
|
(957) |
|
(962) |
|
(4) |
|
9 4 |
|
Expenditures for equipment leased to others |
|
(708) |
|
(62) |
|
(691) |
|
45 4 |
|
Proceeds from disposals of leased assets and property, plant and equipment |
|
1,101 |
|
101 |
|
1,037 |
|
(37) 4 |
|
Additions to finance receivables |
|
(6,121) |
|
— |
|
(19,168) |
|
13,047 5 |
|
Collections of finance receivables |
|
6,424 |
|
— |
|
19,082 |
|
(12,658) 5 |
|
Proceeds from sale of finance receivables |
|
13 |
|
— |
|
13 |
|
— |
|
Net intercompany borrowings |
|
— |
|
(574) |
|
447 |
|
127 6 |
|
Investments and acquisitions (net of cash acquired) |
|
(1,111) |
|
(1,079) |
|
(32) |
|
— |
|
Proceeds from sale of available-for-sale securities |
|
141 |
|
6 |
|
135 |
|
— |
|
Investments in available-for-sale securities |
|
(129) |
|
(3) |
|
(126) |
|
— |
|
Other – net |
|
130 |
|
10 |
|
100 |
|
20 7 |
|
Net cash provided by (used for) investing activities |
|
(1,217) |
|
(2,563) |
|
793 |
|
553 |
|
Cash flow from financing activities: |
|
|
|
|
|
|
|
|
|
Dividends paid |
|
(804) |
|
(804) |
|
(600) |
|
600 8 |
|
Common stock issued, including treasury shares reissued |
|
193 |
|
193 |
|
20 |
|
(20) 7 |
|
Excess tax benefit from stock-based compensation |
|
89 |
|
89 |
|
— |
|
— |
|
Acquisitions of noncontrolling interests |
|
(132) |
|
(132) |
|
— |
|
— |
|
Net intercompany borrowings |
|
— |
|
(447) |
|
574 |
|
(127) 6 |
|
Proceeds from debt issued (original maturities greater than three months) |
|
5,928 |
|
190 |
|
5,738 |
|
— |
|
Payments on debt (original maturities greater than three months) |
|
(9,216) |
|
(1,185) |
|
(8,031) |
|
— |
|
Short-term borrowings – net (original maturities three months or less) |
|
(330) |
|
(60) |
|
(270) |
|
— |
|
Net cash provided by (used for) financing activities |
|
(4,272) |
|
(2,156) |
|
(2,569) |
|
453 |
|
Effect of exchange rate changes on cash |
|
(60) |
|
(15) |
|
(45) |
|
— |
|
Increase (decrease) in cash and short-term investments |
|
(2,602) |
|
(1,404) |
|
(1,198) |
|
— |
|
Cash and short-term investments at beginning of period |
|
4,867 |
|
2,239 |
|
2,628 |
|
— |
|
Cash and short-term investments at end of period |
|
$2,265 |
|
$835 |
|
$1,430 |
|
$— |
1 Represents Caterpillar Inc. and its subsidiaries with Financial Products accounted for on the equity basis.
2 Elimination of Financial Products’ profit after tax due to equity method of accounting.
3 Elimination of Financial Products’ dividend to Machinery and Power Systems in excess of Financial Products’ profit.
4 Elimination of non-cash adjustments and changes in assets and liabilities related to consolidated reporting.
5 Reclassification of Cat Financial’s cash flow activity from investing to operating for receivables that arose from the sale of inventory.
6 Elimination of net proceeds and payments to/from Machinery and Power Systems and Financial Products.
7 Elimination of change in investment and common stock related to Financial Products.
8 Elimination of dividend from Financial Products to Machinery and Power Systems.
Forward-looking Statements
Certain statements in this release relate to future events and expectations and are forward-looking statements within the meaning of the Private Securities Litigation Reform Act of 1995. These statements are subject to known and unknown factors that may cause Caterpillar’s actual results to be different from those expressed or implied in the forward-looking statements. Words such as “believe,” “estimate,” “will be,” “will,” “would,” “expect,” “anticipate,” “plan,” “project,” “intend,” “could,” “should” or other similar words or expressions often identify forward-looking statements. All statements other than statements of historical fact are forward-looking statements, including, without limitation, statements regarding our outlook, projections, forecasts or trend descriptions. These statements do not guarantee future performance, and Caterpillar does not undertake to update its forward-looking statements.
It is important to note that Caterpillar’s actual results may differ materially from those described or implied in its forward-looking statements based on a number of factors, including, but not limited to: (i) global economic conditions and economic conditions in the industries and markets Caterpillar serves; (ii) government monetary or fiscal policies and government spending on infrastructure; (iii) commodity or component price increases and/or limited availability of raw materials and component products, including steel; (iv) Caterpillar’s and its customers’, dealers’ and suppliers’ ability to access and manage liquidity; (v) political and economic risks associated with our global operations, including changes in laws, regulations or government policies, currency restrictions, restrictions on repatriation of earnings, burdensome tariffs or quotas, national and international conflict, including terrorist acts and political and economic instability or civil unrest in the countries in which Caterpillar operates; (vi) Caterpillar’s and Cat Financial’s ability to maintain their respective credit ratings, material increases in either company’s cost of borrowing or an inability of either company to access capital markets; (vii) financial condition and credit worthiness of Cat Financial’s customers; (viii) inability to realize expected benefits from acquisitions and divestitures, including the acquisition of Bucyrus International, Inc.; (ix) international trade and investment policies, such as import quotas, capital controls or tariffs; (x) the possibility that Caterpillar’s introduction of Tier 4 emissions compliant machines and engines is not successful; (xi) market acceptance of Caterpillar’s products and services; (xii) effects of changes in the competitive environment, which may include decreased market share, lack of acceptance of price increases, and/or negative changes to our geographic and product mix of sales; (xiii) union disputes or other employee relations issues; (xiv) Caterpillar’s ability to successfully implement the Caterpillar Production System or other productivity initiatives; (xv) adverse changes in sourcing practices of our dealers or original equipment manufacturers; (xvi) compliance costs associated with environmental laws and regulations; (xvii) alleged or actual violations of trade or anti-corruption laws and regulations; (xviii) additional tax expense or exposure; (xix) currency fluctuations, particularly increases and decreases in the U.S. dollar against other currencies; (xx) failure of Caterpillar or Cat Financial to comply with financial covenants in their respective credit facilities; (xxi) increased funding obligations under our pension plans; (xxii) significant legal proceedings, claims, lawsuits or investigations; (xxiii) imposition of operational restrictions or compliance requirements if carbon emissions legislation and/or regulations are adopted; (xxiv) changes in accounting standards or adoption of new accounting standards; (xxv) adverse effects of natural disasters; and (xxvi) other factors described in more detail under “Item 1A. Risk Factors” in Part I of our Form 10-K filed with the SEC on February 22, 2011 for the year ended December 31, 2010. This filing is available on our website at www.caterpillar.com/secfilings.
The information required by this Item is incorporated by reference from Note 4 — “Derivative Financial Instruments and Risk Management” included in Part I, Item 1 and Management’s Discussion and Analysis included in Part I, Item 2 of this Form 10-Q.
Evaluation of disclosure controls and procedures
An evaluation was performed under the supervision and with the participation of the company’s management, including the Chief Executive Officer (CEO) and Chief Financial Officer (CFO), of the effectiveness of the design and operation of the company’s disclosure controls and procedures as of the end of the period covered by this quarterly report. Based on that evaluation, the company’s management, including the CEO and CFO, concluded that the company’s disclosure controls and procedures are effective as of the end of the period covered by this quarterly report.
Changes in internal control over financial reporting
Except for the change noted below, there has been no change in the company’s internal control over financial reporting during the third quarter 2011 that has materially affected, or is reasonably likely to materially affect, the company’s internal control over financial reporting.
In July 2011, we acquired 100 percent of the equity in Bucyrus International, Inc. (Bucyrus). As part of the post-closing integration, we are engaged in refining and harmonizing the internal controls and processes of the acquired business with those of the company. Management intends to exclude the internal controls of Bucyrus from its annual assessment of the effectiveness of the company’s internal control over financial reporting (Section 404 of the Sarbanes-Oxley Act) for 2011. This exclusion is in accordance with the general guidance issued by the Securities and Exchange Commission that an assessment of a recent business combination may be omitted from management’s report on internal control over financial reporting in the year of consolidation.
We also plan to exclude Motoren-Werke Mannheim (MWM) from our annual assessment of the effectiveness of the company’s internal control over financial reporting for 2011.
The information required by this Item is incorporated by reference from Note 12 included in Part I, Item 1 of this Form 10-Q.
Issuer Purchases of Equity Securities
No shares were repurchased during the third quarter 2011.
Other Purchases of Equity Securities
|
Period |
|
Total Number
|
|
Average Price
|
|
Total Number
|
|
Approximate Dollar
|
|
|
July 1-31, 2011 |
|
2,758 |
|
$105.15 |
|
NA |
|
NA |
|
|
August 1-31, 2011 |
|
10,621 |
|
$103.24 |
|
NA |
|
NA |
|
|
September 1-30, 2011 |
|
8,946 |
|
$87.04 |
|
NA |
|
NA |
|
|
Total |
|
22,325 |
|
$96.98 |
|
|
|
|
|
1 Represents shares delivered back to issuer for the payment of taxes resulting from the vesting of restricted stock units and the exercise of stock options by employees and Directors.
Non-U.S. Employee Stock Purchase Plans
We have 30 employee stock purchase plans administered outside the United States for our non-U.S. employees. As of September 30, 2011 those plans had approximately 11,600 active participants in the aggregate. During the third quarter of 2011, approximately 124,852 shares of Caterpillar common stock or foreign denominated equivalents were distributed under the plans. Participants in some foreign plans have the option of receiving non-U.S. share certificates (foreign-denominated equivalents) in lieu of U.S. shares of Caterpillar common stock upon withdrawal from the plan. These equivalent certificates are tradable only on the local stock market and are included in our determination of shares outstanding.
Distributions of Caterpillar stock under the plans are exempt from registration under the Securities Act of 1933 (Act) pursuant to 17 CFR 230.903.
|
10.1 |
|
Credit Agreement (2011 364-Day Credit Agreement), dated as of September 15, 2011, among the Company, Cat Financial, Caterpillar International Finance Limited and Caterpillar Finance Corporation, certain financial institutions named therein, Citibank, N.A., as Agent, Citibank International plc, as Local Currency Agent, and The Bank of Tokyo-Mitsubishi UFJ, Ltd., as Japan Local Currency Agent (incorporated by reference from Exhibit 99.1 to the Company’s Current Report on Form 8-K filed September 16, 2011). |
|
|
|
|
|
10.2 |
|
Local Currency Addendum, dated as of September 15, 2011, to the 2011 364-Day Credit Agreement (incorporated by reference from Exhibit 99.2 to the Company’s Current Report on Form 8-K filed September 16, 2011). |
|
|
|
|
|
10.3 |
|
Japan Local Currency Addendum, dated as of September 15, 2011, to the 2011 364-Day Credit Agreement (incorporated by reference from Exhibit 99.3 to the Company’s Current Report on Form 8-K filed September 16, 2011). |
|
|
|
|
|
10.4 |
|
Credit Agreement (2011 5-Year Credit Agreement), dated as of September 15, 2011, among the Company, Cat Financial, Caterpillar International Finance Limited and Caterpillar Finance Corporation, certain financial institutions named therein, Citibank, N.A., as Agent, Citibank International plc, as Local Currency Agent, and The Bank of Tokyo-Mitsubishi UFJ, Ltd., as Japan Local Currency Agent (incorporated by reference from Exhibit 99.4 to the Company’s Current Report on Form 8-K filed September 16, 2011). |
|
|
|
|
|
10.5 |
|
Local Currency Addendum, dated as of September 15, 2011, to the 2011 5-Year Credit Agreement (incorporated by reference from Exhibit 99.5 to the Company’s Current Report on Form 8-K filed September 16, 2011). |
|
|
|
|
|
10.6 |
|
Japan Local Currency Addendum, dated as of September 15, 2011, to the 2011 5-Year Credit Agreement (incorporated by reference from Exhibit 99.6 to the Company’s Current Report on Form 8-K filed September 16, 2011). |
|
|
|
|
|
10.7 |
|
Amendment No. 1, dated as of September 15, 2011, to the Credit Agreement (4-Year Facility), dated as of September 16, 2010, by and among the Company, Cat Financial, Caterpillar International Finance Limited and Caterpillar Finance Corporation, the Banks named therein, Local Currency Banks and Japan Local Currency Banks party thereto, Citibank, N.A., as Agent, Citibank International plc, as Local Currency Agent, and The Bank of Tokyo-Mitsubishi UFJ, Ltd., as Japan Local Currency Agent (incorporated by reference from Exhibit 99.7 to the Company’s Current Report on Form 8-K filed September 16, 2011). |
|
|
|
|
|
11 |
|
Computations of Earnings per Share (included in Note 11 of this Form 10-Q filed for the quarter ended September 30, 2011). |
|
|
|
|
|
31.1 |
|
Certification of Douglas R. Oberhelman, Chairman and Chief Executive Officer of Caterpillar Inc., as required pursuant to Section 302 of the Sarbanes-Oxley Act of 2002. |
|
|
|
|
|
31.2 |
|
Certification of Edward J. Rapp, Group President and Chief Financial Officer of Caterpillar Inc., as required pursuant to Section 302 of the Sarbanes-Oxley Act of 2002. |
|
|
|
|
|
32 |
|
Certification of Douglas R. Oberhelman, Chairman and Chief Executive Officer of Caterpillar Inc. and Edward J. Rapp, Group President and Chief Financial Officer of Caterpillar Inc., as required pursuant to Section 906 of the Sarbanes-Oxley Act of 2002. |
|
|
|
|
|
101.INS |
|
XBRL Instance Document |
|
|
|
|
|
101.SCH |
|
XBRL Taxonomy Extension Schema Document |
|
|
|
|
|
101.CAL |
|
XBRL Taxonomy Extension Calculation Linkbase Document |
|
|
|
|
|
101.DEF |
|
XBRL Taxonomy Extension Definition Linkbase Document |
|
|
|
|
|
101.LAB |
|
XBRL Taxonomy Extension Label Linkbase Document |
|
|
|
|
|
101.PRE |
|
XBRL Taxonomy Extension Presentation Linkbase Document |
SIGNATURES
Pursuant to the requirements of the Securities Exchange Act of 1934, the Registrant has duly caused this report to be signed on its behalf by the undersigned thereunto duly authorized.
|
|
CATERPILLAR INC. |
|
|
|
|
|
|
|
|
|
|
November 4, 2011 |
/s/ Douglas R. Oberhelman |
Chairman and Chief Executive Officer |
|
|
(Douglas R. Oberhelman) |
|
|
|
|
|
|
|
|
|
|
November 4, 2011 |
/s/ Edward J. Rapp |
Group President and Chief Financial Officer |
|
|
(Edward J. Rapp) |
|
|
|
|
|
|
|
|
|
|
November 4, 2011 |
/s/ James B. Buda |
Senior Vice President and Chief Legal Officer |
|
|
(James B. Buda) |
|
|
|
|
|
|
|
|
|
|
November 4, 2011 |
/s/ Jananne A. Copeland |
Corporate Controller and Chief Accounting Officer |
|
|
(Jananne A. Copeland) |
|
EXHIBIT INDEX
|
Exhibit No. |
|
Description |
|
|
|
|
|
10.1 |
|
Credit Agreement (2011 364-Day Credit Agreement), dated as of September 15, 2011, among the Company, Cat Financial, Caterpillar International Finance Limited and Caterpillar Finance Corporation, certain financial institutions named therein, Citibank, N.A., as Agent, Citibank International plc, as Local Currency Agent, and The Bank of Tokyo-Mitsubishi UFJ, Ltd., as Japan Local Currency Agent (incorporated by reference from Exhibit 99.1 to the Company’s Current Report on Form 8-K filed September 16, 2011). |
|
|
|
|
|
10.2 |
|
Local Currency Addendum, dated as of September 15, 2011, to the 2011 364-Day Credit Agreement (incorporated by reference from Exhibit 99.2 to the Company’s Current Report on Form 8-K filed September 16, 2011). |
|
|
|
|
|
10.3 |
|
Japan Local Currency Addendum, dated as of September 15, 2011, to the 2011 364-Day Credit Agreement (incorporated by reference from Exhibit 99.3 to the Company’s Current Report on Form 8-K filed September 16, 2011). |
|
|
|
|
|
10.4 |
|
Credit Agreement (2011 5-Year Credit Agreement), dated as of September 15, 2011, among the Company, Cat Financial, Caterpillar International Finance Limited and Caterpillar Finance Corporation, certain financial institutions named therein, Citibank, N.A., as Agent, Citibank International plc, as Local Currency Agent, and The Bank of Tokyo-Mitsubishi UFJ, Ltd., as Japan Local Currency Agent (incorporated by reference from Exhibit 99.4 to the Company’s Current Report on Form 8-K filed September 16, 2011). |
|
|
|
|
|
10.5 |
|
Local Currency Addendum, dated as of September 15, 2011, to the 2011 5-Year Credit Agreement (incorporated by reference from Exhibit 99.5 to the Company’s Current Report on Form 8-K filed September 16, 2011). |
|
|
|
|
|
10.6 |
|
Japan Local Currency Addendum, dated as of September 15, 2011, to the 2011 5-Year Credit Agreement (incorporated by reference from Exhibit 99.6 to the Company’s Current Report on Form 8-K filed September 16, 2011). |
|
|
|
|
|
10.7 |
|
Amendment No. 1, dated as of September 15, 2011, to the Credit Agreement (4-Year Facility), dated as of September 16, 2010, by and among the Company, Cat Financial, Caterpillar International Finance Limited and Caterpillar Finance Corporation, the Banks named therein, Local Currency Banks and Japan Local Currency Banks party thereto, Citibank, N.A., as Agent, Citibank International plc, as Local Currency Agent, and The Bank of Tokyo-Mitsubishi UFJ, Ltd., as Japan Local Currency Agent (incorporated by reference from Exhibit 99.7 to the Company’s Current Report on Form 8-K filed September 16, 2011). |
|
|
|
|
|
11 |
|
Computations of Earnings per Share (included in Note 11 of this Form 10-Q filed for the quarter ended September 30, 2011). |
|
|
|
|
|
31.1 |
|
Certification of Douglas R. Oberhelman, Chairman and Chief Executive Officer of Caterpillar Inc., as required pursuant to Section 302 of the Sarbanes-Oxley Act of 2002. |
|
|
|
|
|
31.2 |
|
Certification of Edward J. Rapp, Group President and Chief Financial Officer of Caterpillar Inc., as required pursuant to Section 302 of the Sarbanes-Oxley Act of 2002. |
|
|
|
|
|
32 |
|
Certification of Douglas R. Oberhelman, Chairman and Chief Executive Officer of Caterpillar Inc. and Edward J. Rapp, Group President and Chief Financial Officer of Caterpillar Inc., as required pursuant to Section 906 of the Sarbanes-Oxley Act of 2002. |
|
|
|
|
|
101.INS |
|
XBRL Instance Document |
|
|
|
|
|
101.SCH |
|
XBRL Taxonomy Extension Schema Document |
|
101.CAL |
|
XBRL Taxonomy Extension Calculation Linkbase Document |
|
|
|
|
|
101.DEF |
|
XBRL Taxonomy Extension Definition Linkbase Document |
|
|
|
|
|
101.LAB |
|
XBRL Taxonomy Extension Label Linkbase Document |
|
|
|
|
|
101.PRE |
|
XBRL Taxonomy Extension Presentation Linkbase Document |