CATERPILLAR INC
10-Ks and 10-Qs
|
|
|
|
|
|
|
|
|
|
|
|
|
|
|
|
|
|
|
|
|
|
|
|
|
|
|
|
|
|
|
|
|
|
|
|
|
|
|
|
|
|
|
|
|
|
|
|
|
|
|
|
|
|
|
|
|
|
|
UNITED STATES
SECURITIES AND EXCHANGE COMMISSION
Washington, D.C. 20549

FORM 10-Q
[X] QUARTERLY REPORT PURSUANT TO SECTION 13 OR 15(d) OF THE SECURITIES EXCHANGE ACT OF 1934
For the quarterly period ended
June 30, 2013
OR
[ ] TRANSITION REPORT PURSUANT TO SECTION 13 OR 15(d) OF THE SECURITIES EXCHANGE ACT OF 1934
For the transition period from to
Commission File Number: 1-768
CATERPILLAR INC.
(Exact name of registrant as specified in its charter)
|
Delaware
(State or other jurisdiction of incorporation)
|
|
37-0602744
(IRS Employer I.D. No.)
|
|
|
|
|
|
100 NE Adams Street, Peoria, Illinois
(Address of principal executive offices)
|
|
61629
(Zip Code)
|
Registrant’s telephone number, including area code:
(309) 675-1000
Indicate by check mark whether the registrant (1) has filed all reports required to be filed by Section 13 or 15(d) of the Securities Exchange Act of 1934 during the preceding 12 months (or for such shorter period that the registrant was required to file such reports), and (2) has been subject to such filing requirements for the past 90 days. Yes
x
No
¨
Indicate by check mark whether the registrant has submitted electronically and posted on its corporate Web site, if any, every Interactive Data File required to be submitted and posted pursuant to Rule 405 of Regulation S-T (§232.405 of this chapter) during the preceding 12 months (or for such shorter period that the registrant was required to submit and post such files). Yes
x
No
¨
Indicate by check mark whether the registrant is a large accelerated filer, an accelerated filer, a non-accelerated filer, or a smaller reporting company. See definitions of “large accelerated filer”, “accelerated filer” and “smaller reporting company” in Rule 12b-2 of the Exchange Act. (Check one):
|
Large accelerated filer
|
x
|
Accelerated filer
|
o
|
|
|
|
|
|
|
Non-accelerated filer
|
o
|
Smaller reporting company
|
o
|
Indicate by check mark whether the registrant is a shell company (as defined in Rule 12b-2 of the Exchange Act). Yes
o
No
x
At
June 30, 2013
,
647,615,068
shares of common stock of the registrant were outstanding.
Table of Contents
|
|
||
|
|
|
|
|
|
||
|
Item 1A.
|
Risk Factors
|
*
|
|
Item 3.
|
Defaults Upon Senior Securities
|
*
|
|
Item 5.
|
Other Information
|
*
|
* Item omitted because no answer is called for or item is not applicable.
2
Caterpillar Inc.
(Unaudited)
(Dollars in millions except per share data)
|
|
Three Months Ended
June 30, |
||||||
|
|
2013
|
2012
|
|||||
|
Sales and revenues:
|
|
|
|||||
|
Sales of Machinery and Power Systems
|
$
|
13,886
|
|
$
|
16,684
|
|
|
|
Revenues of Financial Products
|
735
|
|
690
|
|
|||
|
Total sales and revenues
|
14,621
|
|
17,374
|
|
|||
|
Operating costs:
|
|
|
|
|
|||
|
Cost of goods sold
|
10,773
|
|
12,280
|
|
|||
|
Selling, general and administrative expenses
|
1,421
|
|
1,517
|
|
|||
|
Research and development expenses
|
548
|
|
632
|
|
|||
|
Interest expense of Financial Products
|
185
|
|
198
|
|
|||
|
Other operating (income) expenses
|
137
|
|
131
|
|
|||
|
Total operating costs
|
13,064
|
|
14,758
|
|
|||
|
Operating profit
|
1,557
|
|
2,616
|
|
|||
|
Interest expense excluding Financial Products
|
120
|
|
110
|
|
|||
|
Other income (expense)
|
(84
|
)
|
70
|
|
|||
|
Consolidated profit before taxes
|
1,353
|
|
2,576
|
|
|||
|
Provision (benefit) for income taxes
|
387
|
|
872
|
|
|||
|
Profit of consolidated companies
|
966
|
|
1,704
|
|
|||
|
Equity in profit (loss) of unconsolidated affiliated companies
|
(1
|
)
|
5
|
|
|||
|
Profit of consolidated and affiliated companies
|
965
|
|
1,709
|
|
|||
|
Less: Profit (loss) attributable to noncontrolling interests
|
5
|
|
10
|
|
|||
|
Profit
1
|
$
|
960
|
|
$
|
1,699
|
|
|
|
Profit per common share
|
$
|
1.48
|
|
$
|
2.60
|
|
|
|
Profit per common share – diluted
2
|
$
|
1.45
|
|
$
|
2.54
|
|
|
|
Weighted-average common shares outstanding (millions)
|
|
|
|
|
|||
|
– Basic
|
649.9
|
|
652.9
|
|
|||
|
– Diluted
2
|
662.7
|
|
669.6
|
|
|||
|
Cash dividends declared per common share
|
$
|
1.12
|
|
$
|
0.98
|
|
|
1
Profit attributable to common stockholders.
2
Diluted by assumed exercise of stock-based compensation awards using the treasury stock method.
See accompanying notes to Consolidated Financial Statements.
3
Caterpillar Inc
.
Consolidated Statement of Comprehensive Income
(Unaudited)
(Dollars in millions)
|
|
Three Months Ended
June 30, |
||||||
|
|
2013
|
2012
|
|||||
|
Profit of consolidated and affiliated companies
|
$
|
965
|
|
$
|
1,709
|
|
|
|
Other comprehensive income (loss), net of tax:
|
|||||||
|
Foreign currency translation, net of tax (provision)/benefit of: 2013 - $29; 2012 - $(33)
|
(180
|
)
|
(339
|
)
|
|||
|
Pension and other postretirement benefits:
|
|
||||||
|
Current year actuarial gain (loss), net of tax (provision)/benefit of: 2013 - $(6); 2012 - $(2)
|
12
|
|
5
|
|
|||
|
Amortization of actuarial (gain) loss, net of tax (provision)/benefit of: 2013 - $(67); 2012 - $(60)
|
130
|
|
113
|
|
|||
|
Amortization of prior service (credit) cost, net of tax (provision)/benefit of: 2013 - $4; 2012 - $4
|
(9
|
)
|
(7
|
)
|
|||
|
Derivative financial instruments:
|
|||||||
|
Gains (losses) deferred, net of tax (provision)/benefit of: 2013 - $(5); 2012 - $0
|
7
|
|
(2
|
)
|
|||
|
(Gains) losses reclassified to earnings, net of tax (provision)/benefit of: 2013 - $(12); 2012 - $(2)
|
22
|
|
3
|
|
|||
|
Available-for-sale securities:
|
|||||||
|
Gains (losses) deferred, net of tax (provision)/benefit of: 2013 - $6; 2012 - $4
|
(10
|
)
|
(5
|
)
|
|||
|
(Gains) losses reclassified to earnings, net of tax (provision)/benefit of: 2013 - $0; 2012 - $0
|
1
|
|
—
|
|
|||
|
Total other comprehensive income (loss), net of tax
|
(27
|
)
|
(232
|
)
|
|||
|
Comprehensive income
|
938
|
|
1,477
|
|
|||
|
Less: comprehensive income attributable to the noncontrolling interests
|
(7
|
)
|
(2
|
)
|
|||
|
Comprehensive income attributable to stockholders
|
$
|
931
|
|
$
|
1,475
|
|
|
See accompanying notes to Consolidated Financial Statements.
4
Caterpillar Inc.
Consolidated Statement of Results of Operations
(Unaudited)
(Dollars in millions except per share data)
|
|
Six Months Ended
June 30, |
||||||
|
|
2013
|
2012
|
|||||
|
Sales and revenues:
|
|
|
|||||
|
Sales of Machinery and Power Systems
|
$
|
26,370
|
|
$
|
31,972
|
|
|
|
Revenues of Financial Products
|
1,461
|
|
1,383
|
|
|||
|
Total sales and revenues
|
27,831
|
|
33,355
|
|
|||
|
Operating costs:
|
|
|
|
|
|||
|
Cost of goods sold
|
20,412
|
|
23,517
|
|
|||
|
Selling, general and administrative expenses
|
2,811
|
|
2,857
|
|
|||
|
Research and development expenses
|
1,110
|
|
1,219
|
|
|||
|
Interest expense of Financial Products
|
374
|
|
402
|
|
|||
|
Other operating (income) expenses
|
349
|
|
421
|
|
|||
|
Total operating costs
|
25,056
|
|
28,416
|
|
|||
|
Operating profit
|
2,775
|
|
4,939
|
|
|||
|
Interest expense excluding Financial Products
|
240
|
|
223
|
|
|||
|
Other income (expense)
|
(55
|
)
|
158
|
|
|||
|
Consolidated profit before taxes
|
2,480
|
|
4,874
|
|
|||
|
Provision (benefit) for income taxes
|
633
|
|
1,561
|
|
|||
|
Profit of consolidated companies
|
1,847
|
|
3,313
|
|
|||
|
Equity in profit (loss) of unconsolidated affiliated companies
|
—
|
|
7
|
|
|||
|
Profit of consolidated and affiliated companies
|
1,847
|
|
3,320
|
|
|||
|
Less: Profit (loss) attributable to noncontrolling interests
|
7
|
|
35
|
|
|||
|
Profit
1
|
$
|
1,840
|
|
$
|
3,285
|
|
|
|
Profit per common share
|
$
|
2.82
|
|
$
|
5.04
|
|
|
|
Profit per common share – diluted
2
|
$
|
2.76
|
|
$
|
4.90
|
|
|
|
Weighted-average common shares outstanding (millions)
|
|
|
|||||
|
– Basic
|
652.4
|
|
651.3
|
|
|||
|
– Diluted
2
|
666.6
|
|
669.9
|
|
|||
|
Cash dividends declared per common share
|
$
|
1.12
|
|
$
|
0.98
|
|
|
1
Profit attributable to common stockholders.
2
Diluted by assumed exercise of stock-based compensation awards using the treasury stock method.
See accompanying notes to Consolidated Financial Statements.
5
Caterpillar Inc
.
Consolidated Statement of Comprehensive Income
(Unaudited)
(Dollars in millions)
|
|
Six Months Ended
June 30, |
||||||
|
|
2013
|
2012
|
|||||
|
Profit of consolidated and affiliated companies
|
$
|
1,847
|
|
$
|
3,320
|
|
|
|
Other comprehensive income (loss), net of tax:
|
|||||||
|
Foreign currency translation, net of tax (provision)/benefit of: 2013 - $8; 2012 - $(16)
|
(546
|
)
|
(158
|
)
|
|||
|
Pension and other postretirement benefits:
|
|||||||
|
Current year actuarial gain (loss), net of tax (provision)/benefit of: 2013 - $(16); 2012 - $(8)
|
27
|
|
15
|
|
|||
|
Amortization of actuarial (gain) loss, net of tax (provision)/benefit of: 2013 - $(134); 2012 - $(120)
|
259
|
|
226
|
|
|||
|
Current year prior service credit (cost), net of tax (provision)/benefit of: 2013 - $0; 2012 - $2
|
—
|
|
(3
|
)
|
|||
|
Amortization of prior service (credit) cost, net of tax (provision)/benefit of: 2013 - $9; 2012 - $8
|
(18
|
)
|
(15
|
)
|
|||
|
Amortization of transition (asset) obligation, net of tax (provision)/benefit of: 2013 - $0; 2012 - $0
|
1
|
|
1
|
|
|||
|
Derivative financial instruments:
|
|||||||
|
Gains (losses) deferred, net of tax (provision)/benefit of: 2013 - $13; 2012 - $16
|
(24
|
)
|
(28
|
)
|
|||
|
(Gains) losses reclassified to earnings, net of tax (provision)/benefit of: 2013 - $(19); 2012 - $(1)
|
33
|
|
1
|
|
|||
|
Available-for-sale securities:
|
|||||||
|
Gains (losses) deferred, net of tax (provision)/benefit of: 2013 - $(2); 2012 - $(5)
|
5
|
|
16
|
|
|||
|
(Gains) losses reclassified to earnings, net of tax (provision)/benefit of: 2013 - $0; 2012 - $0
|
—
|
|
(2
|
)
|
|||
|
Total other comprehensive income (loss), net of tax
|
(263
|
)
|
53
|
|
|||
|
Comprehensive income
|
1,584
|
|
3,373
|
|
|||
|
Less: comprehensive income attributable to the noncontrolling interests
|
(9
|
)
|
(17
|
)
|
|||
|
Comprehensive income attributable to the stockholders
|
$
|
1,575
|
|
$
|
3,356
|
|
|
See accompanying notes to Consolidated Financial Statements.
6
Caterpillar Inc
.
(Unaudited)
(Dollars in millions)
|
|
June 30,
2013 |
December 31,
2012 |
|||||
|
Assets
|
|
|
|||||
|
Current assets:
|
|
|
|
|
|||
|
Cash and short-term investments
|
$
|
6,110
|
|
$
|
5,490
|
|
|
|
Receivables – trade and other
|
9,396
|
|
10,092
|
|
|||
|
Receivables – finance
|
8,946
|
|
8,860
|
|
|||
|
Deferred and refundable income taxes
|
1,540
|
|
1,547
|
|
|||
|
Prepaid expenses and other current assets
|
924
|
|
988
|
|
|||
|
Inventories
|
13,889
|
|
15,547
|
|
|||
|
Total current assets
|
40,805
|
|
42,524
|
|
|||
|
Property, plant and equipment – net
|
16,352
|
|
16,461
|
|
|||
|
Long-term receivables – trade and other
|
1,230
|
|
1,316
|
|
|||
|
Long-term receivables – finance
|
14,240
|
|
14,029
|
|
|||
|
Investments in unconsolidated affiliated companies
|
288
|
|
272
|
|
|||
|
Noncurrent deferred and refundable income taxes
|
2,153
|
|
2,011
|
|
|||
|
Intangible assets
|
3,764
|
|
4,016
|
|
|||
|
Goodwill
|
6,814
|
|
6,942
|
|
|||
|
Other assets
|
1,729
|
|
1,785
|
|
|||
|
Total assets
|
$
|
87,375
|
|
$
|
89,356
|
|
|
|
Liabilities
|
|
|
|
|
|||
|
Current liabilities:
|
|
|
|
|
|||
|
Short-term borrowings:
|
|
|
|
|
|||
|
Machinery and Power Systems
|
$
|
392
|
|
$
|
636
|
|
|
|
Financial Products
|
5,119
|
|
4,651
|
|
|||
|
Accounts payable
|
6,343
|
|
6,753
|
|
|||
|
Accrued expenses
|
3,501
|
|
3,667
|
|
|||
|
Accrued wages, salaries and employee benefits
|
1,296
|
|
1,911
|
|
|||
|
Customer advances
|
2,738
|
|
2,978
|
|
|||
|
Dividends payable
|
388
|
|
—
|
|
|||
|
Other current liabilities
|
1,782
|
|
2,055
|
|
|||
|
Long-term debt due within one year:
|
|
|
|
|
|||
|
Machinery and Power Systems
|
1,112
|
|
1,113
|
|
|||
|
Financial Products
|
7,248
|
|
5,991
|
|
|||
|
Total current liabilities
|
29,919
|
|
29,755
|
|
|||
|
Long-term debt due after one year:
|
|
|
|
|
|||
|
Machinery and Power Systems
|
7,949
|
|
8,666
|
|
|||
|
Financial Products
|
17,731
|
|
19,086
|
|
|||
|
Liability for postemployment benefits
|
10,866
|
|
11,085
|
|
|||
|
Other liabilities
|
3,232
|
|
3,182
|
|
|||
|
Total liabilities
|
69,697
|
|
71,774
|
|
|||
|
Commitments and contingencies (Notes 10 and 13)
|
|
|
|
|
|||
|
Stockholders’ equity
|
|
|
|
|
|||
|
Common stock of $1.00 par value:
|
|
|
|
|
|||
|
Authorized shares: 2,000,000,000
Issued shares: (6/30/13 and 12/31/12 – 814,894,624) at paid-in amount |
4,591
|
|
4,481
|
|
|||
|
Treasury stock (6/30/13 – 167,279,556 shares; 12/31/12 – 159,846,131 shares) at cost
|
(10,940
|
)
|
(10,074
|
)
|
|||
|
Profit employed in the business
|
30,668
|
|
29,558
|
|
|||
|
Accumulated other comprehensive income (loss)
|
(6,698
|
)
|
(6,433
|
)
|
|||
|
Noncontrolling interests
|
57
|
|
50
|
|
|||
|
Total stockholders’ equity
|
17,678
|
|
17,582
|
|
|||
|
Total liabilities and stockholders’ equity
|
$
|
87,375
|
|
$
|
89,356
|
|
|
See accompanying notes to Consolidated Financial Statements.
7
Caterpillar Inc.
Consolidated Statement of Changes in Stockholders’ Equity
(Unaudited)
(Dollars in millions)
|
|
Common
stock
|
Treasury
stock
|
Profit
employed
in the
business
|
Accumulated
other
comprehensive
income (loss)
|
Noncontrolling
interests
|
Total
|
|||||||||||||||||
|
Six Months Ended June 30, 2012
|
|
|
|
|
|
|
|||||||||||||||||
|
Balance at December 31, 2011
|
$
|
4,273
|
|
$
|
(10,281
|
)
|
$
|
25,219
|
|
$
|
(6,328
|
)
|
$
|
46
|
|
$
|
12,929
|
|
|||||
|
Profit of consolidated and affiliated companies
|
—
|
|
—
|
|
3,285
|
|
—
|
|
35
|
|
3,320
|
|
|||||||||||
|
Foreign currency translation, net of tax
|
—
|
|
—
|
|
—
|
|
(134
|
)
|
(24
|
)
|
(158
|
)
|
|||||||||||
|
Pension and other postretirement benefits, net of tax
|
—
|
|
—
|
|
—
|
|
219
|
|
5
|
|
224
|
|
|||||||||||
|
Derivative financial instruments, net of tax
|
—
|
|
—
|
|
—
|
|
(27
|
)
|
—
|
|
(27
|
)
|
|||||||||||
|
Available-for-sale securities, net of tax
|
—
|
|
—
|
|
—
|
|
13
|
|
1
|
|
14
|
|
|||||||||||
|
Change in ownership from noncontrolling interests
|
—
|
|
—
|
|
—
|
|
—
|
|
7
|
|
7
|
|
|||||||||||
|
Dividends declared
|
—
|
|
—
|
|
(639
|
)
|
—
|
|
—
|
|
(639
|
)
|
|||||||||||
|
Distribution to noncontrolling interests
|
—
|
|
—
|
|
—
|
|
—
|
|
(5
|
)
|
(5
|
)
|
|||||||||||
|
Common shares issued from treasury stock for stock-based compensation: 5,735,352
|
(117
|
)
|
142
|
|
—
|
|
—
|
|
—
|
|
25
|
|
|||||||||||
|
Stock-based compensation expense
|
135
|
|
—
|
|
—
|
|
—
|
|
—
|
|
135
|
|
|||||||||||
|
Net excess tax benefits from stock-based compensation
|
156
|
|
—
|
|
—
|
|
—
|
|
—
|
|
156
|
|
|||||||||||
|
Cat Japan share redemption
1
|
(74
|
)
|
—
|
|
(23
|
)
|
107
|
|
(10
|
)
|
—
|
|
|||||||||||
|
Balance at June 30, 2012
|
$
|
4,373
|
|
$
|
(10,139
|
)
|
$
|
27,842
|
|
$
|
(6,150
|
)
|
$
|
55
|
|
$
|
15,981
|
|
|||||
|
Six Months Ended June 30, 2013
|
|
|
|
|
|
|
|
|
|
|
|
|
|||||||||||
|
Balance at December 31, 2012
|
$
|
4,481
|
|
$
|
(10,074
|
)
|
$
|
29,558
|
|
$
|
(6,433
|
)
|
$
|
50
|
|
$
|
17,582
|
|
|||||
|
Profit of consolidated and affiliated companies
|
—
|
|
—
|
|
1,840
|
|
—
|
|
7
|
|
1,847
|
|
|||||||||||
|
Foreign currency translation, net of tax
|
—
|
|
—
|
|
—
|
|
(548
|
)
|
2
|
|
(546
|
)
|
|||||||||||
|
Pension and other postretirement benefits, net of tax
|
—
|
|
—
|
|
—
|
|
269
|
|
—
|
|
269
|
|
|||||||||||
|
Derivative financial instruments, net of tax
|
—
|
|
—
|
|
—
|
|
9
|
|
—
|
|
9
|
|
|||||||||||
|
Available-for-sale securities, net of tax
|
—
|
|
—
|
|
—
|
|
5
|
|
—
|
|
5
|
|
|||||||||||
|
Change in ownership from noncontrolling interests
|
(6
|
)
|
—
|
|
—
|
|
—
|
|
6
|
|
—
|
|
|||||||||||
|
Dividends declared
|
—
|
|
—
|
|
(730
|
)
|
—
|
|
—
|
|
(730
|
)
|
|||||||||||
|
Distribution to noncontrolling interests
|
—
|
|
—
|
|
—
|
|
—
|
|
(8
|
)
|
(8
|
)
|
|||||||||||
|
Common shares issued from treasury stock for stock-based compensation: 4,108,681
|
(78
|
)
|
134
|
|
—
|
|
—
|
|
—
|
|
56
|
|
|||||||||||
|
Stock-based compensation expense
|
132
|
|
—
|
|
—
|
|
—
|
|
—
|
|
132
|
|
|||||||||||
|
Net excess tax benefits from stock-based compensation
|
62
|
|
—
|
|
—
|
|
—
|
|
—
|
|
62
|
|
|||||||||||
|
Common shares repurchased: 11,542,106
2
|
—
|
|
(1,000
|
)
|
—
|
|
—
|
|
—
|
|
(1,000
|
)
|
|||||||||||
|
Balance at June 30, 2013
|
$
|
4,591
|
|
$
|
(10,940
|
)
|
$
|
30,668
|
|
$
|
(6,698
|
)
|
$
|
57
|
|
$
|
17,678
|
|
|||||
|
1
|
See Notes 12 and 17 regarding the Cat Japan share redemption.
|
|
2
|
See Note 11 regarding shares repurchased.
|
See accompanying notes to Consolidated Financial Statements.
8
Caterpillar Inc.
(Unaudited)
(Millions of dollars)
|
|
Six Months Ended
June 30, |
||||||
|
|
2013
|
2012
|
|||||
|
Cash flow from operating activities:
|
|
|
|||||
|
Profit of consolidated and affiliated companies
|
$
|
1,847
|
|
$
|
3,320
|
|
|
|
Adjustments for non-cash items:
|
|
|
|
|
|||
|
Depreciation and amortization
|
1,484
|
|
1,350
|
|
|||
|
Other
|
236
|
|
(59
|
)
|
|||
|
Changes in assets and liabilities, net of acquisitions and divestitures:
|
|
|
|
|
|||
|
Receivables – trade and other
|
431
|
|
37
|
|
|||
|
Inventories
|
1,364
|
|
(2,939
|
)
|
|||
|
Accounts payable
|
222
|
|
299
|
|
|||
|
Accrued expenses
|
(129
|
)
|
86
|
|
|||
|
Accrued wages, salaries and employee benefits
|
(580
|
)
|
(753
|
)
|
|||
|
Customer advances
|
(212
|
)
|
434
|
|
|||
|
Other assets – net
|
(100
|
)
|
63
|
|
|||
|
Other liabilities – net
|
30
|
|
140
|
|
|||
|
Net cash provided by (used for) operating activities
|
4,593
|
|
1,978
|
|
|||
|
Cash flow from investing activities:
|
|
|
|
|
|||
|
Capital expenditures – excluding equipment leased to others
|
(1,387
|
)
|
(1,508
|
)
|
|||
|
Expenditures for equipment leased to others
|
(810
|
)
|
(787
|
)
|
|||
|
Proceeds from disposals of leased assets and property, plant and equipment
|
358
|
|
543
|
|
|||
|
Additions to finance receivables
|
(5,544
|
)
|
(5,942
|
)
|
|||
|
Collections of finance receivables
|
4,548
|
|
4,298
|
|
|||
|
Proceeds from sale of finance receivables
|
89
|
|
85
|
|
|||
|
Investments and acquisitions (net of cash acquired)
|
(26
|
)
|
(517
|
)
|
|||
|
Proceeds from sale of businesses and investments (net of cash sold)
|
100
|
|
308
|
|
|||
|
Proceeds from sale of available-for-sale securities
|
207
|
|
177
|
|
|||
|
Investments in available-for-sale securities
|
(267
|
)
|
(199
|
)
|
|||
|
Other – net
|
(68
|
)
|
38
|
|
|||
|
Net cash provided by (used for) investing activities
|
(2,800
|
)
|
(3,504
|
)
|
|||
|
Cash flow from financing activities:
|
|
|
|
|
|||
|
Dividends paid
|
(342
|
)
|
(598
|
)
|
|||
|
Distribution to noncontrolling interests
|
(8
|
)
|
(5
|
)
|
|||
|
Common stock issued, including treasury shares reissued
|
56
|
|
25
|
|
|||
|
Treasury shares purchased
|
(1,000
|
)
|
—
|
|
|||
|
Excess tax benefit from stock-based compensation
|
62
|
|
156
|
|
|||
|
Acquisitions of redeemable noncontrolling interests
|
—
|
|
(444
|
)
|
|||
|
Proceeds from debt issued (original maturities greater than three months):
|
|
|
|
|
|||
|
Machinery and Power Systems
|
119
|
|
1,662
|
|
|||
|
Financial Products
|
5,067
|
|
7,357
|
|
|||
|
Payments on debt (original maturities greater than three months):
|
|
|
|
|
|||
|
Machinery and Power Systems
|
(1,003
|
)
|
(211
|
)
|
|||
|
Financial Products
|
(5,300
|
)
|
(4,794
|
)
|
|||
|
Short-term borrowings – net (original maturities three months or less)
|
1,217
|
|
553
|
|
|||
|
Net cash provided by (used for) financing activities
|
(1,132
|
)
|
3,701
|
|
|||
|
Effect of exchange rate changes on cash
|
(41
|
)
|
(129
|
)
|
|||
|
Increase (decrease) in cash and short-term investments
|
620
|
|
2,046
|
|
|||
|
Cash and short-term investments at beginning of period
|
5,490
|
|
3,057
|
|
|||
|
Cash and short-term investments at end of period
|
$
|
6,110
|
|
$
|
5,103
|
|
|
All short-term investments, which consist primarily of highly liquid investments with original maturities of three months or less, are considered to be cash equivalents
.
See accompanying notes to Consolidated Financial Statements.
9
NOTES TO CONSOLIDATED FINANCIAL STATEMENTS
(Unaudited)
|
1.
|
A. Basis of Presentation
|
In the opinion of management, the accompanying financial statements include all adjustments, consisting only of normal recurring adjustments, necessary for a fair statement of (a) the consolidated results of operations for the
three and six
month periods ended
June 30, 2013
and
2012
, (b) the consolidated comprehensive income for the
three and six
month periods ended
June 30, 2013
and
2012
, (c) the consolidated financial position at
June 30, 2013
and
December 31, 2012
, (d) the consolidated changes in stockholders’ equity for the
six
month periods ended
June 30, 2013
and
2012
, and (e) the consolidated cash flow for the
six
month periods ended
June 30, 2013
and
2012
. The financial statements have been prepared in conformity with generally accepted accounting principles in the United States of America (U.S. GAAP) and pursuant to the rules and regulations of the Securities and Exchange Commission. Certain amounts for prior periods have been reclassified to conform to the current period financial statement presentation.
We have revised previously reported cash flows from operating and financing activities for the six month period ended June 30, 2012 to correct for the impact of interest payments on certain Cat Financial bank borrowings. Cash provided by operating activities decreased from the amounts previously reported by
$29 million
for the six month period ended June 30, 2012, and cash provided by financing activities increased by the same amount. Revisions will be made to previously reported amounts in future filings. Cash provided by operating activities will decrease by
$57 million
and
$53 million
for the years ended December 31, 2012 and 2011, respectively, and the unaudited cash flows from operating activities will decrease by
$44 million
for the nine month period ended September 30, 2012. Cash provided by financing activities will increase by the same amounts for the respective periods. Management has concluded that the impact was not material to any quarterly or annual period.
Interim results are not necessarily indicative of results for a full year. The information included in this Form 10-Q should be read in conjunction with the audited financial statements and notes thereto included in our Company’s annual report on Form 10-K for the year ended
December 31, 2012
(
2012
Form 10-K).
The
December 31, 2012
financial position data included herein is derived from the audited consolidated financial statements included in the
2012
Form 10-K but does not include all disclosures required by U.S. GAAP.
B. Nature of Operations
Information in our financial statements and related commentary are presented in the following categories:
Machinery and Power Systems
– Represents the aggregate total of Construction Industries, Resource Industries, Power Systems, and All Other segments and related corporate items and eliminations.
Financial Products
– Primarily includes the company’s Financial Products Segment. This category includes Caterpillar Financial Services Corporation (Cat Financial), Caterpillar Insurance Holdings Inc. (Cat Insurance) and their respective subsidiaries.
2.
New Accounting Guidance
Disclosures about offsetting assets and liabilities –
In December 2011, the Financial Accounting Standards Board (FASB) issued accounting guidance on disclosures about offsetting assets and liabilities. The guidance requires entities to disclose both gross and net information about instruments and transactions that are offset in the statement of financial position, as well as instruments and transactions that are subject to an enforceable master netting arrangement or similar agreement. In January 2013, the FASB issued guidance clarifying the scope of the disclosures to apply only to derivatives, including bifurcated embedded derivatives, repurchase and reverse repurchase agreements, and securities lending and securities borrowing transactions. This guidance was effective January 1, 2013, with retrospective application required. The guidance did not have a material impact on our financial statements. See Note 4 for additional information.
Indefinite-lived intangible assets impairment testing
–
In July 2012, the FASB issued accounting guidance on the testing of indefinite-lived intangible assets for impairment. The guidance allows entities to first perform a qualitative assessment to determine the likelihood of an impairment for an indefinite-lived intangible asset and whether it is necessary
10
to perform the quantitative impairment assessment currently required. This guidance was effective January 1, 2013 and did not have a material impact on our financial statements.
Reporting of amounts reclassified out of accumulated other comprehensive income –
In February 2013, the FASB issued accounting guidance on the reporting of reclassifications out of accumulated other comprehensive income. The guidance requires an entity to present, either on the face of the statement where net income is presented or in the notes, significant amounts reclassified out of accumulated other comprehensive income by the respective line items of net income if the amount is reclassified to net income in its entirety in the same reporting period. For other amounts not required to be reclassified in their entirety to net income in the same reporting period, a cross reference to other disclosures that provide additional detail about the reclassification amounts is required. This guidance was effective January 1, 2013 and did not have a material impact on our financial statements. See Note 12 for additional information.
Joint and several liability arrangements –
In February 2013,
the FASB issued accounting guidance on the recognition, measurement and disclosure of obligations resulting from joint and several liability arrangements. The guidance requires an entity to measure obligations resulting from joint and several liability arrangements for which the total amount of the obligation within the scope of this guidance is fixed at the reporting date, as the sum of the amount the reporting entity agreed to pay on the basis of its arrangement among its co-obligors and any additional amount the reporting entity expects to pay on behalf of its co-obligors. The entity is also required to disclose the nature and amount of the obligation as well as any other information about those obligations. This guidance is effective January 1, 2014, with retrospective application required. We do not expect the adoption to have a material impact on our financial statements.
Parent's accounting for the cumulative translation adjustment upon derecognition of certain subsidiaries or groups of assets within a foreign entity or of an investment in a foreign entity –
In March 2013, the FASB issued accounting guidance on the parent's accounting for the cumulative translation adjustment (CTA) upon derecognition of certain subsidiaries or groups of assets within a foreign entity or of an investment in a foreign entity. The new standard clarifies existing guidance regarding when the CTA should be released into earnings upon various deconsolidation and consolidation transactions. This guidance is effective January 1, 2014. We do not expect the adoption to have a material impact on our financial statements.
Presentation of an unrecognized tax benefit when a net operating loss carryforward, a similar tax loss, or a tax credit carryforward exists –
In July 2013, the FASB issued accounting guidance on the financial statement presentation of an unrecognized tax benefit when a net operating loss carryforward, a similar tax loss, or a tax credit carryforward exists. The guidance requires an unrecognized tax benefit, or a portion of an unrecognized tax benefit, to be presented as a reduction to a deferred tax asset for a net operating loss carryforward, a similar tax loss, or a tax credit carryforward in the financial statements if available under the applicable tax jurisdiction. The guidance is effective January 1, 2014. We do not expect the adoption to have a material impact on our financial statements.
3.
Stock-Based Compensation
Accounting for stock-based compensation requires that the cost resulting from all stock-based payments be recognized in the financial statements based on the grant date fair value of the award. Stock-based compensation primarily consists of stock options, restricted stock units (RSUs) and stock-settled stock appreciation rights (SARs). We recognized pretax stock-based compensation cost in the amount of
$83 million
and
$132 million
for the
three and six
months ended
June 30, 2013
, respectively; and
$88 million
and
$135 million
for the
three and six
months ended
June 30, 2012
, respectively.
The following table illustrates the type and fair value of the stock-based compensation awards granted during the
six
month periods ended
June 30, 2013
and
2012
, respectively:
|
|
2013
|
2012
|
|||||||||||
|
|
Shares Granted
|
Fair Value
Per Award
|
Shares Granted
|
Fair Value
Per Award
|
|||||||||
|
Stock options
|
4,276,060
|
|
$
|
28.34
|
|
3,224,203
|
|
$
|
39.20
|
|
|||
|
RSUs
|
1,614,870
|
|
$
|
84.05
|
|
1,429,939
|
|
$
|
104.61
|
|
|||
The stock price on the date of grant was
$89.75
and
$110.09
for
2013
and
2012
, respectively.
11
The following table provides the assumptions used in determining the fair value of the stock-based awards for the
six
month periods ended
June 30, 2013
and
2012
, respectively:
|
|
Grant Year
|
||
|
|
2013
|
2012
|
|
|
Weighted-average dividend yield
|
2.13%
|
2.16%
|
|
|
Weighted-average volatility
|
30.6%
|
35.0%
|
|
|
Range of volatilities
|
23.4-40.6%
|
33.3-40.4%
|
|
|
Range of risk-free interest rates
|
0.16-1.88%
|
0.17-2.00%
|
|
|
Weighted-average expected lives
|
8 years
|
7 years
|
|
As of
June 30, 2013
, the total remaining unrecognized compensation cost related to nonvested stock-based compensation awards was
$301 million
, which will be amortized over the weighted-average remaining requisite service periods of approximately
2.2
years.
4.
Derivative Financial Instruments and Risk Management
Our earnings and cash flow are subject to fluctuations due to changes in foreign currency exchange rates, interest rates and commodity prices. Our Risk Management Policy (policy) allows for the use of derivative financial instruments to prudently manage foreign currency exchange rate, interest rate and commodity price exposures. Our policy specifies that derivatives are not to be used for speculative purposes. Derivatives that we use are primarily foreign currency forward, option, and cross currency contracts, interest rate swaps, and commodity forward and option contracts. Our derivative activities are subject to the management, direction and control of our senior financial officers. Risk management practices, including the use of financial derivative instruments, are presented to the Audit Committee of the Board of Directors at least annually.
All derivatives are recognized on the Consolidated Statement of Financial Position at their fair value. On the date the derivative contract is entered into, we designate the derivative as (1) a hedge of the fair value of a recognized asset or liability (fair value hedge), (2) a hedge of a forecasted transaction or the variability of cash flow to be paid (cash flow hedge), or (3) an undesignated instrument. Changes in the fair value of a derivative that is qualified, designated and highly effective as a fair value hedge, along with the gain or loss on the hedged recognized asset or liability that is attributable to the hedged risk, are recorded in current earnings. Changes in the fair value of a derivative that is qualified, designated and highly effective as a cash flow hedge are recorded in Accumulated other comprehensive income (loss) (AOCI), to the extent effective, on the Consolidated Statement of Financial Position until they are reclassified to earnings in the same period or periods during which the hedged transaction affects earnings. Changes in the fair value of undesignated derivative instruments and the ineffective portion of designated derivative instruments are reported in current earnings. Cash flow from designated derivative financial instruments are classified within the same category as the item being hedged on the Consolidated Statement of Cash Flow. Cash flow from undesignated derivative financial instruments are included in the investing category on the Consolidated Statement of Cash Flow.
We formally document all relationships between hedging instruments and hedged items, as well as the risk-management objective and strategy for undertaking various hedge transactions. This process includes linking all derivatives that are designated as fair value hedges to specific assets and liabilities on the Consolidated Statement of Financial Position and linking cash flow hedges to specific forecasted transactions or variability of cash flow.
We also formally assess, both at the hedge’s inception and on an ongoing basis, whether the designated derivatives that are used in hedging transactions are highly effective in offsetting changes in fair values or cash flow of hedged items. When a derivative is determined not to be highly effective as a hedge or the underlying hedged transaction is no longer probable, we discontinue hedge accounting prospectively, in accordance with the derecognition criteria for hedge accounting.
Foreign Currency Exchange Rate Risk
Foreign currency exchange rate movements create a degree of risk by affecting the U.S. dollar value of sales made and costs incurred in foreign currencies. Movements in foreign currency rates also affect our competitive position as these changes may affect business practices and/or pricing strategies of non-U.S.-based competitors. Additionally, we have balance sheet positions denominated in foreign currencies, thereby creating exposure to movements in exchange rates.
12
Our Machinery and Power Systems operations purchase, manufacture and sell products in many locations around the world. As we have a diversified revenue and cost base, we manage our future foreign currency cash flow exposure on a net basis. We use foreign currency forward and option contracts to manage unmatched foreign currency cash inflow and outflow. Our objective is to minimize the risk of exchange rate movements that would reduce the U.S. dollar value of our foreign currency cash flow. Our policy allows for managing anticipated foreign currency cash flow for up to
five
years.
We generally designate as cash flow hedges at inception of the contract any Australian dollar, Brazilian real, British pound, Canadian dollar, Chinese yuan, euro, Indian rupee, Japanese yen, Mexican peso, Singapore dollar or Swiss franc forward or option contracts that meet the requirements for hedge accounting and the maturity extends beyond the current quarter-end. Designation is performed on a specific exposure basis to support hedge accounting. The remainder of Machinery and Power Systems foreign currency contracts are undesignated, including any hedges designed to protect our competitive exposure.
As of
June 30, 2013
,
$19 million
of deferred net losses, net of tax, included in equity (AOCI in the Consolidated Statement of Financial Position), are expected to be reclassified to current earnings (Other income (expense) in the Consolidated Statement of Results of Operations) over the next twelve months when earnings are affected by the hedged transactions. The actual amount recorded in Other income (expense) will vary based on exchange rates at the time the hedged transactions impact earnings.
In managing foreign currency risk for our Financial Products operations, our objective is to minimize earnings volatility resulting from conversion and the remeasurement of net foreign currency balance sheet positions, and future transactions denominated in foreign currencies. Our policy allows the use of foreign currency forward, option and cross currency contracts to offset the risk of currency mismatch between our receivables and debt, and exchange rate risk associated with future transactions denominated in foreign currencies. Substantially all such foreign currency forward, option and cross currency contracts are undesignated.
Interest Rate Risk
Interest rate movements create a degree of risk by affecting the amount of our interest payments and the value of our fixed-rate debt. Our practice is to use interest rate derivatives to manage our exposure to interest rate changes and, in some cases, lower the cost of borrowed funds.
Our Machinery and Power Systems operations generally use fixed-rate debt as a source of funding. Our objective is to minimize the cost of borrowed funds. Our policy allows us to enter into fixed-to-floating interest rate swaps and forward rate agreements to meet that objective with the intent to designate as fair value hedges at inception of the contract all fixed-to-floating interest rate swaps. Designation as a hedge of the fair value of our fixed-rate debt is performed to support hedge accounting.
Financial Products operations has a match-funding policy that addresses interest rate risk by aligning the interest rate profile (fixed or floating rate) of Cat Financial’s debt portfolio with the interest rate profile of their receivables portfolio within predetermined ranges on an ongoing basis. In connection with that policy, we use interest rate derivative instruments to modify the debt structure to match assets within the receivables portfolio. This matched funding reduces the volatility of margins between interest-bearing assets and interest-bearing liabilities, regardless of which direction interest rates move.
Our policy allows us to use fixed-to-floating, floating-to-fixed, and floating-to-floating interest rate swaps to meet the match-funding objective. We designate fixed-to-floating interest rate swaps as fair value hedges to protect debt against changes in fair value due to changes in the benchmark interest rate. We designate most floating-to-fixed interest rate swaps as cash flow hedges to protect against the variability of cash flows due to changes in the benchmark interest rate.
As of
June 30, 2013
,
$3 million
of deferred net losses, net of tax, included in equity (AOCI in the Consolidated Statement of Financial Position), related to Financial Products floating-to-fixed interest rate swaps, are expected to be reclassified to current earnings (Interest expense of Financial Products in the Consolidated Statement of Results of Operations) over the next twelve months. The actual amount recorded in Interest expense of Financial Products will vary based on interest rates at the time the hedged transactions impact earnings.
13
We have, at certain times, liquidated fixed-to-floating and floating-to-fixed interest rate swaps at both Machinery and Power Systems and Financial Products. The gains or losses associated with these swaps at the time of liquidation are amortized into earnings over the original term of the previously designated hedged item.
Commodity Price Risk
Commodity price movements create a degree of risk by affecting the price we must pay for certain raw material. Our policy is to use commodity forward and option contracts to manage the commodity risk and reduce the cost of purchased materials.
Our Machinery and Power Systems operations purchase base and precious metals embedded in the components we purchase from suppliers. Our suppliers pass on to us price changes in the commodity portion of the component cost. In addition, we are subject to price changes on energy products such as natural gas and diesel fuel purchased for operational use.
Our objective is to minimize volatility in the price of these commodities. Our policy allows us to enter into commodity forward and option contracts to lock in the purchase price of a portion of these commodities within a
five
-year horizon. All such commodity forward and option contracts are undesignated.
The location and fair value of derivative instruments reported in the Consolidated Statement of Financial Position are as follows:
|
(Millions of dollars)
|
|
|
|
||||||
|
|
Consolidated Statement of Financial
|
Asset (Liability) Fair Value
|
|||||||
|
|
Position Location
|
June 30, 2013
|
December 31, 2012
|
||||||
|
Designated derivatives
|
|
|
|
||||||
|
Foreign exchange contracts
|
|
|
|
|
|
||||
|
Machinery and Power Systems
|
Receivables – trade and other
|
$
|
27
|
|
$
|
28
|
|
||
|
Machinery and Power Systems
|
Accrued expenses
|
(57
|
)
|
(66
|
)
|
||||
|
Interest rate contracts
|
|
|
|
||||||
|
Financial Products
|
Receivables – trade and other
|
19
|
|
17
|
|
||||
|
Financial Products
|
Long-term receivables – trade and other
|
134
|
|
209
|
|
||||
|
Financial Products
|
Accrued expenses
|
(6
|
)
|
(8
|
)
|
||||
|
|
|
$
|
117
|
|
$
|
180
|
|
||
|
Undesignated derivatives
|
|
|
|
|
|
||||
|
Foreign exchange contracts
|
|
|
|
|
|
||||
|
Machinery and Power Systems
|
Receivables – trade and other
|
$
|
65
|
|
$
|
31
|
|
||
|
Machinery and Power Systems
|
Accrued expenses
|
(71
|
)
|
(63
|
)
|
||||
|
Financial Products
|
Receivables – trade and other
|
14
|
|
10
|
|
||||
|
Financial Products
|
Accrued expenses
|
(3
|
)
|
(6
|
)
|
||||
|
Interest rate contracts
|
|
|
|
||||||
|
Financial Products
|
Receivables – trade and other
|
3
|
|
2
|
|
||||
|
Financial Products
|
Accrued expenses
|
—
|
|
(1
|
)
|
||||
|
Commodity contracts
|
|
|
|
||||||
|
Machinery and Power Systems
|
Receivables – trade and other
|
—
|
|
1
|
|
||||
|
Machinery and Power Systems
|
Accrued expenses
|
(3
|
)
|
—
|
|
||||
|
|
|
$
|
5
|
|
$
|
(26
|
)
|
||
14
The effect of derivatives designated as hedging instruments on the Consolidated Statement of Results of Operations is as follows:
|
Fair Value Hedges
(Millions of dollars)
|
|
|
|
||||||||||||||
|
|
|
Three Months Ended
June 30, 2013 |
Three Months Ended
June 30, 2012 |
||||||||||||||
|
|
Classification
|
Gains (Losses)
on Derivatives
|
Gains (Losses)
on Borrowings
|
Gains (Losses)
on Derivatives
|
Gains (Losses)
on Borrowings
|
||||||||||||
|
Interest rate contracts
|
|
|
|
|
|
|
|||||||||||
|
Financial Products
|
Other income (expense)
|
$
|
(49
|
)
|
$
|
50
|
|
$
|
6
|
|
$
|
(5
|
)
|
||||
|
|
|
$
|
(49
|
)
|
$
|
50
|
|
$
|
6
|
|
$
|
(5
|
)
|
||||
|
|
|
Six Months Ended
June 30, 2013 |
Six Months Ended
June 30, 2012 |
||||||||||||||
|
|
Classification
|
Gains (Losses)
on Derivatives
|
Gains (Losses)
on Borrowings
|
Gains (Losses)
on Derivatives
|
Gains (Losses)
on Borrowings
|
||||||||||||
|
Interest rate contracts
|
|
|
|
|
|
||||||||||||
|
Financial Products
|
Other income (expense)
|
$
|
(78
|
)
|
$
|
80
|
|
$
|
(3
|
)
|
$
|
10
|
|
||||
|
|
|
$
|
(78
|
)
|
$
|
80
|
|
$
|
(3
|
)
|
$
|
10
|
|
||||
15
|
Cash Flow Hedges
(Millions of dollars)
|
|
|
|
|
||||||||||
|
|
Three Months Ended June 30, 2013
|
|||||||||||||
|
|
|
Recognized in Earnings
|
||||||||||||
|
|
Amount of Gains
(Losses) Recognized
in AOCI
(Effective Portion)
|
Classification of
Gains (Losses)
|
Amount of
Gains (Losses)
Reclassified
from AOCI to
Earnings
|
Recognized
in Earnings
(Ineffective
Portion)
|
||||||||||
|
Foreign exchange contracts
|
|
|
|
|
|
|
|
|||||||
|
Machinery and Power Systems
|
$
|
9
|
|
Other income (expense)
|
$
|
(31
|
)
|
|
$
|
—
|
|
|||
|
Interest rate contracts
|
||||||||||||||
|
Machinery and Power Systems
|
—
|
|
Other income (expense)
|
(1
|
)
|
—
|
|
|||||||
|
Financial Products
|
3
|
|
Interest expense of Financial Products
|
(2
|
)
|
—
|
|
|
||||||
|
|
$
|
12
|
|
|
$
|
(34
|
)
|
$
|
—
|
|
||||
|
|
Three Months Ended June 30, 2012
|
|||||||||||||
|
|
|
Recognized in Earnings
|
||||||||||||
|
|
Amount of Gains
(Losses) Recognized
in AOCI
(Effective Portion)
|
Classification of
Gains (Losses)
|
Amount of
Gains (Losses)
Reclassified
from AOCI to
Earnings
|
Recognized
in Earnings
(Ineffective
Portion)
|
||||||||||
|
Foreign exchange contracts
|
|
|
|
|
||||||||||
|
Machinery and Power Systems
|
$
|
—
|
|
Other income (expense)
|
$
|
(4
|
)
|
$
|
—
|
|
||||
|
Interest rate contracts
|
|
|
|
|
|
|
|
|||||||
|
Financial Products
|
(2
|
)
|
Interest expense of Financial Products
|
(1
|
)
|
(1
|
)
|
1
|
||||||
|
|
$
|
(2
|
)
|
|
$
|
(5
|
)
|
$
|
(1
|
)
|
||||
|
|
Six Months Ended June 30, 2013
|
|||||||||||||
|
|
|
Recognized in Earnings
|
||||||||||||
|
|
Amount of Gains
(Losses) Recognized
in AOCI
(Effective Portion)
|
Classification of
Gains (Losses)
|
Amount of
Gains (Losses)
Reclassified
from AOCI to
Earnings
|
Recognized
in Earnings
(Ineffective
Portion)
|
||||||||||
|
Foreign exchange contracts
|
|
|
|
|
||||||||||
|
Machinery and Power Systems
|
$
|
(40
|
)
|
Other income (expense)
|
$
|
(48
|
)
|
2
|
$
|
—
|
|
|||
|
Interest rate contracts
|
|
|
|
|
|
|||||||||
|
Machinery and Power Systems
|
—
|
|
Other income (expense)
|
(1
|
)
|
—
|
|
|||||||
|
Financial Products
|
3
|
|
Interest expense of Financial Products
|
(3
|
)
|
—
|
|
|
||||||
|
|
$
|
(37
|
)
|
|
$
|
(52
|
)
|
$
|
—
|
|
||||
|
|
Six Months Ended June 30, 2012
|
|||||||||||||
|
|
|
Recognized in Earnings
|
||||||||||||
|
|
Amount of Gains
(Losses) Recognized
in AOCI
(Effective Portion)
|
Classification of
Gains (Losses)
|
Amount of
Gains (Losses)
Reclassified
from AOCI to
Earnings
|
Recognized
in Earnings
(Ineffective
Portion)
|
||||||||||
|
Foreign exchange contracts
|
|
|
|
|
||||||||||
|
Machinery and Power Systems
|
$
|
(42
|
)
|
Other income (expense)
|
$
|
1
|
|
$
|
—
|
|
||||
|
Interest rate contracts
|
|
|
|
|
|
|
|
|||||||
|
Machinery and Power Systems
|
—
|
|
Other income (expense)
|
(1
|
)
|
—
|
|
|||||||
|
Financial Products
|
(2
|
)
|
Interest expense of Financial Products
|
(2
|
)
|
(1
|
)
|
1
|
||||||
|
|
$
|
(44
|
)
|
|
$
|
(2
|
)
|
$
|
(1
|
)
|
||||
|
1
|
The ineffective portion recognized in earnings is included in Other income (expense).
|
|
2
|
Includes
$3 million
loss reclassified from AOCI to Other income (expense) in 2013 as certain derivatives were dedesignated as the related transactions are no longer probable to occur.
|
16
The effect of derivatives not designated as hedging instruments on the Consolidated Statement of Results of Operations is as follows:
|
(Millions of dollars)
|
|
|
|
||||||
|
|
Classification of Gains (Losses)
|
Three Months Ended
June 30, 2013 |
Three Months Ended
June 30, 2012 |
||||||
|
Foreign exchange contracts
|
|
|
|||||||
|
Machinery and Power Systems
|
Other income (expense)
|
$
|
12
|
|
$
|
(35
|
)
|
||
|
Financial Products
|
Other income (expense)
|
16
|
|
(5
|
)
|
||||
|
Commodity contracts
|
|
|
|
||||||
|
Machinery and Power Systems
|
Other income (expense)
|
(3
|
)
|
(6
|
)
|
||||
|
|
|
$
|
25
|
|
$
|
(46
|
)
|
||
|
|
Classification of Gains (Losses)
|
Six Months Ended
June 30, 2013 |
Six Months Ended
June 30, 2012 |
||||||
|
Foreign exchange contracts
|
|
|
|||||||
|
Machinery and Power Systems
|
Other income (expense)
|
$
|
(8
|
)
|
$
|
30
|
|
||
|
Financial Products
|
Other income (expense)
|
1
|
|
2
|
|
||||
|
Commodity contracts
|
|
||||||||
|
Machinery and Power Systems
|
Other income (expense)
|
(4
|
)
|
—
|
|
||||
|
|
|
$
|
(11
|
)
|
$
|
32
|
|
||
We enter into International Swaps and Derivatives Association (ISDA) master netting agreements within Machinery & Power Systems and Financial Products that permit the net settlement of amounts owed under their respective derivative contracts. Under these master netting agreements, net settlement generally permits the company or the counterparty to determine the net amount payable for contracts due on the same date and in the same currency for similar types of derivative transactions. The master netting agreements generally also provide for net settlement of all outstanding contracts with a counterparty in the case of an event of default or a termination event.
Collateral is generally not required of the counterparties or of our company under the master netting agreements. As of
June 30, 2013
and
December 31, 2012
, no cash collateral was received or pledged under the master netting agreements.
17
The effect of the net settlement provisions of the master netting agreements on our derivative balances upon an event of default or termination event is as follows:
|
June 30, 2013
|
Gross Amounts Not Offset in the Statement of Financial Position
|
|||||||||||||||||||||||
|
(Millions of dollars)
|
Gross Amount of Recognized Assets
|
Gross Amounts Offset in the Statement of Financial Position
|
Net Amount of Assets Presented in the Statement of Financial Position
|
Financial Instruments
|
Cash Collateral Received
|
Net Amount of Assets
|
||||||||||||||||||
|
Derivatives
|
||||||||||||||||||||||||
|
Machinery & Power Systems
|
$
|
92
|
|
$
|
—
|
|
$
|
92
|
|
$
|
(84
|
)
|
$
|
—
|
|
$
|
8
|
|
||||||
|
Financial Products
|
170
|
|
—
|
|
170
|
|
(8
|
)
|
—
|
|
162
|
|
||||||||||||
|
Total
|
$
|
262
|
|
$
|
—
|
|
$
|
262
|
|
$
|
(92
|
)
|
$
|
—
|
|
$
|
170
|
|
||||||
|
June 30, 2013
|
Gross Amounts Not Offset in the Statement of Financial Position
|
|||||||||||||||||||||||
|
(Millions of dollars)
|
Gross Amount of Recognized Liabilities
|
Gross Amounts Offset in the Statement of Financial Position
|
Net Amount of Liabilities Presented in the Statement of Financial Position
|
Financial Instruments
|
Cash Collateral Pledged
|
Net Amount of Liabilities
|
||||||||||||||||||
|
Derivatives
|
||||||||||||||||||||||||
|
Machinery & Power Systems
|
$
|
(131
|
)
|
$
|
—
|
|
$
|
(131
|
)
|
$
|
84
|
|
$
|
—
|
|
$
|
(47
|
)
|
||||||
|
Financial Products
|
(9
|
)
|
—
|
|
(9
|
)
|
8
|
|
—
|
|
(1
|
)
|
||||||||||||
|
Total
|
$
|
(140
|
)
|
$
|
—
|
|
$
|
(140
|
)
|
$
|
92
|
|
$
|
—
|
|
$
|
(48
|
)
|
||||||
|
December 31, 2012
|
Gross Amounts Not Offset in the Statement of Financial Position
|
|||||||||||||||||||||||
|
(Millions of dollars)
|
Gross Amount of Recognized Assets
|
Gross Amounts Offset in the Statement of Financial Position
|
Net Amount of Assets Presented in the Statement of Financial Position
|
Financial Instruments
|
Cash Collateral Received
|
Net Amount of Assets
|
||||||||||||||||||
|
Derivatives
|
||||||||||||||||||||||||
|
Machinery & Power Systems
|
$
|
60
|
|
$
|
—
|
|
$
|
60
|
|
$
|
(59
|
)
|
$
|
—
|
|
$
|
1
|
|
||||||
|
Financial Products
|
238
|
|
—
|
|
238
|
|
(12
|
)
|
—
|
|
226
|
|
||||||||||||
|
Total
|
$
|
298
|
|
$
|
—
|
|
$
|
298
|
|
$
|
(71
|
)
|
$
|
—
|
|
$
|
227
|
|
||||||
|
December 31, 2012
|
Gross Amounts Not Offset in the Statement of Financial Position
|
|||||||||||||||||||||||
|
(Millions of dollars)
|
Gross Amount of Recognized Liabilities
|
Gross Amounts Offset in the Statement of Financial Position
|
Net Amount of Liabilities Presented in the Statement of Financial Position
|
Financial Instruments
|
Cash Collateral Pledged
|
Net Amount of Liabilities
|
||||||||||||||||||
|
Derivatives
|
||||||||||||||||||||||||
|
Machinery & Power Systems
|
$
|
(129
|
)
|
$
|
—
|
|
$
|
(129
|
)
|
$
|
59
|
|
$
|
—
|
|
$
|
(70
|
)
|
||||||
|
Financial Products
|
(15
|
)
|
—
|
|
(15
|
)
|
12
|
|
—
|
|
(3
|
)
|
||||||||||||
|
Total
|
$
|
(144
|
)
|
$
|
—
|
|
$
|
(144
|
)
|
$
|
71
|
|
$
|
—
|
|
$
|
(73
|
)
|
||||||
18
5.
Inventories
Inventories (principally using the last-in, first-out (LIFO) method) are comprised of the following:
|
(Millions of dollars)
|
June 30,
2013 |
December 31,
2012 |
|||||
|
Raw materials
|
$
|
3,310
|
|
$
|
3,573
|
|
|
|
Work-in-process
|
2,606
|
|
2,920
|
|
|||
|
Finished goods
|
7,697
|
|
8,767
|
|
|||
|
Supplies
|
276
|
|
287
|
|
|||
|
Total inventories
|
$
|
13,889
|
|
$
|
15,547
|
|
|
6.
Investments in Unconsolidated Affiliated Companies
Combined financial information of the unconsolidated affiliated companies accounted for by the equity method (generally on a lag of 3 months or less) was as follows:
|
Results of Operations of unconsolidated affiliated companies:
(Millions of dollars)
|
Three Months Ended
June 30, |
Six Months Ended
June 30, |
|||||||||||||
|
|
2013
|
2012
|
2013
|
2012
|
|||||||||||
|
Sales
|
$
|
309
|
|
$
|
206
|
|
$
|
567
|
|
$
|
372
|
|
|||
|
Cost of sales
|
233
|
|
160
|
|
438
|
|
286
|
|
|||||||
|
Gross profit
|
$
|
76
|
|
$
|
46
|
|
$
|
129
|
|
$
|
86
|
|
|||
|
Profit (loss)
|
$
|
(22
|
)
|
$
|
12
|
|
$
|
(25
|
)
|
$
|
22
|
|
|||
|
Financial Position of unconsolidated affiliated companies:
(
Millions of dollars
)
|
June 30,
2013 |
December 31,
2012 |
|||||
|
Assets:
|
|
|
|
|
|||
|
Current assets
|
$
|
672
|
|
$
|
715
|
|
|
|
Property, plant and equipment – net
|
723
|
|
529
|
|
|||
|
Other assets
|
499
|
|
616
|
|
|||
|
|
1,894
|
|
1,860
|
|
|||
|
Liabilities:
|
|
|
|
|
|||
|
Current liabilities
|
422
|
|
443
|
|
|||
|
Long-term debt due after one year
|
869
|
|
708
|
|
|||
|
Other liabilities
|
157
|
|
170
|
|
|||
|
|
1,448
|
|
1,321
|
|
|||
|
Equity
|
$
|
446
|
|
$
|
539
|
|
|
|
Caterpillar’s investments in unconsolidated affiliated companies:
(Millions of dollars)
|
June 30,
2013 |
December 31,
2012 |
|||||
|
Investments in equity method companies
|
$
|
278
|
|
$
|
256
|
|
|
|
Plus: Investments in cost method companies
|
10
|
|
16
|
|
|||
|
Total investments in unconsolidated affiliated companies
|
$
|
288
|
|
$
|
272
|
|
|
The change in the results of operations amounts for the three and six months ended June 30, 2013 as compared to June 30, 2012 primarily relates to the third party logistics business, in which Caterpillar sold a majority interest on July 31, 2012. Under the terms of the agreement, Caterpillar retained a
35 percent
equity interest.
19
7.
Intangible Assets and Goodwill
A. Intangible assets
Intangible assets are comprised of the following:
|
|
|
June 30, 2013
|
|||||||||||
|
(Millions of dollars)
|
Weighted
Amortizable
Life (Years)
|
Gross
Carrying
Amount
|
Accumulated
Amortization
|
Net
|
|||||||||
|
Customer relationships
|
15
|
$
|
2,700
|
|
$
|
(457
|
)
|
$
|
2,243
|
|
|||
|
Intellectual property
|
11
|
1,762
|
|
(415
|
)
|
1,347
|
|
||||||
|
Other
|
10
|
277
|
|
(121
|
)
|
156
|
|
||||||
|
Total finite-lived intangible assets
|
14
|
4,739
|
|
(993
|
)
|
3,746
|
|
||||||
|
Indefinite-lived intangible assets - In-process research & development
|
|
18
|
|
—
|
|
18
|
|
||||||
|
Total intangible assets
|
|
$
|
4,757
|
|
$
|
(993
|
)
|
$
|
3,764
|
|
|||
|
|
|
December 31, 2012
|
|||||||||||
|
Weighted
Amortizable
Life (Years)
|
Gross
Carrying
Amount
|
Accumulated
Amortization
|
Net
|
||||||||||
|
Customer relationships
|
15
|
$
|
2,756
|
|
$
|
(377
|
)
|
$
|
2,379
|
|
|||
|
Intellectual property
|
12
|
1,767
|
|
(342
|
)
|
1,425
|
|
||||||
|
Other
|
10
|
299
|
|
(105
|
)
|
194
|
|
||||||
|
Total finite-lived intangible assets
|
13
|
4,822
|
|
(824
|
)
|
3,998
|
|
||||||
|
Indefinite-lived intangible assets - In-process research & development
|
|
18
|
|
—
|
|
18
|
|
||||||
|
Total intangible assets
|
|
$
|
4,840
|
|
$
|
(824
|
)
|
$
|
4,016
|
|
|||
Customer relationship intangibles of
$54 million
, net of accumulated amortization of
$7 million
, were reclassified from Intangible assets to held for sale and/or divested during
2013
, primarily related to the divestiture of portions of the Bucyrus distribution business, and are not included in the
June 30, 2013
balances in the table above. See Note 20 for additional information on assets held for sale.
Amortization expense for both the
three and six
months ended
June 30, 2013
was
$91 million
and
$185 million
, respectively. Amortization expense for the
three and six
months ended
June 30, 2012
was
$99 million
and
$193 million
, respectively. Amortization expense related to intangible assets is expected to be:
|
(Millions of dollars)
|
||||||||||
|
2013
|
2014
|
2015
|
2016
|
2017
|
Thereafter
|
|||||
|
$367
|
$365
|
$364
|
$354
|
$351
|
$2,148
|
|||||
B. Goodwill
Goodwill of
$29 million
was reclassified to held for sale and/or divested during the
six
months ended
June 30, 2013
, primarily related to the divestiture of portions of the Bucyrus distribution business and the sale of certain Power Systems assets that were accounted for as a business, and is not included in the
June 30, 2013
balance in the table below. See Note 20 for additional information on divestitures and assets held for sale.
We test goodwill for impairment annually and whenever events or circumstances make it more likely than not that an impairment may have occurred. We perform our annual goodwill impairment test as of October 1 and monitor for interim triggering events on an ongoing basis. Goodwill is reviewed for impairment utilizing a qualitative assessment or a two-step process. We have an option to make a qualitative assessment of a reporting unit's goodwill for impairment. If we choose to perform a qualitative assessment and determine the fair value more likely than not exceeds the carrying value, no further evaluation is necessary. For reporting units where we perform the two-step process, the first step requires us to compare the fair value of each reporting unit, which we primarily determine using an income approach based on the
20
present value of discounted cash flows, to the respective carrying value, which includes goodwill. If the fair value of the reporting unit exceeds its carrying value, the goodwill is not considered impaired. If the carrying value is higher than the fair value, there is an indication that an impairment may exist and the second step is required. In step two, the implied fair value of goodwill is calculated as the excess of the fair value of a reporting unit over the fair values assigned to its assets and liabilities. If the implied fair value of goodwill is less than the carrying value of the reporting unit's goodwill, the difference is recognized as an impairment loss.
No
goodwill for reporting units was impaired during the
three and six
months ended
June 30, 2013
or
2012
.
The changes in the carrying amount of the goodwill by reportable segment for the
six
months ended
June 30, 2013
were as follows:
|
(Millions of dollars)
|
|
|
|
|||||||||||||
|
|
December 31,
2012 |
Held for Sale and Business Divestitures
1
|
Other Adjustments
2
|
June 30,
2013 |
||||||||||||
|
Construction Industries
|
|
|
||||||||||||||
|
Goodwill
|
$
|
382
|
|
$
|
—
|
|
$
|
(51
|
)
|
$
|
331
|
|
||||
|
Resource Industries
|
||||||||||||||||
|
Goodwill
|
4,559
|
|
(19
|
)
|
(41
|
)
|
4,499
|
|
||||||||
|
Impairments
|
(602
|
)
|
—
|
|
—
|
|
(602
|
)
|
||||||||
|
Net goodwill
|
3,957
|
|
(19
|
)
|
(41
|
)
|
3,897
|
|
||||||||
|
Power Systems
|
||||||||||||||||
|
Goodwill
|
2,486
|
|
(10
|
)
|
(7
|
)
|
2,469
|
|
||||||||
|
All Other
3
|
||||||||||||||||
|
Goodwill
|
117
|
|
—
|
|
—
|
|
117
|
|
||||||||
|
Consolidated total
|
||||||||||||||||
|
Goodwill
|
7,544
|
|
(29
|
)
|
(99
|
)
|
7,416
|
|
||||||||
|
Impairments
|
(602
|
)
|
—
|
|
—
|
|
(602
|
)
|
||||||||
|
Net goodwill
|
$
|
6,942
|
|
$
|
(29
|
)
|
$
|
(99
|
)
|
$
|
6,814
|
|
||||
1
See Note 20 for additional details.
2
Other adjustments are comprised primarily of foreign currency translation.
3
Includes All Other operating segment (See Note 15).
8.
Available-For-Sale Securities
We have investments in certain debt and equity securities, primarily at Cat Insurance, that have been classified as available-for-sale and recorded at fair value based upon quoted market prices. These investments are primarily included in Other assets in the Consolidated Statement of Financial Position. Unrealized gains and losses arising from the revaluation of available-for-sale securities are included, net of applicable deferred income taxes, in equity (Accumulated other comprehensive income (loss) in the Consolidated Statement of Financial Position). Realized gains and losses on sales of investments are generally determined using the FIFO (first-in, first-out) method for debt instruments and the specific identification method for equity securities. Realized gains and losses are included in Other income (expense) in the Consolidated Statement of Results of Operations.
21
|
|
June 30, 2013
|
December 31, 2012
|
|||||||||||||||||||||
|
(Millions of dollars)
|
Cost
Basis
|
Unrealized Pretax Net Gains
(Losses)
|
Fair
Value
|
Cost
Basis
|
Unrealized Pretax Net Gains
(Losses)
|
Fair
Value
|
|||||||||||||||||
|
Government debt
|
|
|
|
|
|
|
|||||||||||||||||
|
U.S. treasury bonds
|
$
|
10
|
|
$
|
—
|
|
$
|
10
|
|
$
|
10
|
|
$
|
—
|
|
$
|
10
|
|
|||||
|
Other U.S. and non-U.S. government bonds
|
119
|
|
1
|
|
120
|
|
144
|
|
2
|
|
146
|
|
|||||||||||
|
Corporate bonds
|
|
|
|
|
|
|
|
|
|
|
|||||||||||||
|
Corporate bonds
|
659
|
|
23
|
|
682
|
|
626
|
|
38
|
|
664
|
|
|||||||||||
|
Asset-backed securities
|
80
|
|
—
|
|
80
|
|
96
|
|
—
|
|
96
|
|
|||||||||||
|
Mortgage-backed debt securities
|
|
|
|
|
|
|
|||||||||||||||||
|
U.S. governmental agency
|
358
|
|
1
|
|
359
|
|
291
|
|
8
|
|
299
|
|
|||||||||||
|
Residential
|
22
|
|
—
|
|
22
|
|
26
|
|
(1
|
)
|
25
|
|
|||||||||||
|
Commercial
|
97
|
|
6
|
|
103
|
|
117
|
|
10
|
|
127
|
|
|||||||||||
|
Equity securities
|
|
|
|
|
|
|
|||||||||||||||||
|
Large capitalization value
|
157
|
|
63
|
|
220
|
|
147
|
|
38
|
|
185
|
|
|||||||||||
|
Smaller company growth
|
22
|
|
20
|
|
42
|
|
22
|
|
12
|
|
34
|
|
|||||||||||
|
Total
|
$
|
1,524
|
|
$
|
114
|
|
$
|
1,638
|
|
$
|
1,479
|
|
$
|
107
|
|
$
|
1,586
|
|
|||||
During the
three and six
months ended
June 30, 2013
and
2012
, charges for other-than-temporary declines in the market values of securities were
$1 million
. These charges were accounted for as realized losses and were included in Other income (expense) in the Consolidated Statement of Results of Operations. The cost basis for the impacted securities was adjusted to reflect these charges.
22
|
Investments in an unrealized loss position that are not other-than-temporarily impaired:
|
|||||||||||||||||||||||
|
|
June 30, 2013
|
||||||||||||||||||||||
|
|
Less than 12 months
1
|
12 months or more
1
|
Total
|
||||||||||||||||||||
|
(Millions of dollars)
|
Fair
Value
|
Unrealized
Losses
|
Fair
Value
|
Unrealized
Losses
|
Fair
Value
|
Unrealized
Losses
|
|||||||||||||||||
|
Corporate bonds
|
|
|
|
|
|
|
|||||||||||||||||
|
Corporate bonds
|
$
|
197
|
|
$
|
3
|
|
$
|
—
|
|
$
|
—
|
|
$
|
197
|
|
$
|
3
|
|
|||||
|
Asset-backed securities
|
8
|
|
—
|
|
20
|
|
2
|
|
28
|
|
2
|
|
|||||||||||
|
Mortgage-backed debt securities
|
|||||||||||||||||||||||
|
U.S. governmental agency
|
196
|
|
5
|
|
25
|
|
1
|
|
221
|
|
6
|
|
|||||||||||
|
Equity securities
|
|||||||||||||||||||||||
|
Large capitalization value
|
18
|
|
1
|
|
4
|
|
1
|
|
22
|
|
2
|
|
|||||||||||
|
Total
|
$
|
419
|
|
$
|
9
|
|
$
|
49
|
|
$
|
4
|
|
$
|
468
|
|
$
|
13
|
|
|||||
|
|
December 31, 2012
|
||||||||||||||||||||||
|
|
Less than 12 months
1
|
12 months or more
1
|
Total
|
||||||||||||||||||||
|
(Millions of dollars)
|
Fair
Value
|
Unrealized
Losses
|
Fair
Value
|
Unrealized
Losses
|
Fair
Value
|
Unrealized
Losses
|
|||||||||||||||||
|
Corporate bonds
|
|
|
|
|
|
|
|||||||||||||||||
|
Asset-backed securities
|
$
|
—
|
|
$
|
—
|
|
$
|
20
|
|
$
|
3
|
|
$
|
20
|
|
$
|
3
|
|
|||||
|
Mortgage-backed debt securities
|
|
|
|
|
|
|
|
|
|
|
|
|
|||||||||||
|
U.S. governmental agency
|
84
|
|
1
|
|
15
|
|
—
|
|
99
|
|
1
|
|
|||||||||||
|
Residential
|
—
|
|
—
|
|
14
|
|
1
|
|
14
|
|
1
|
|
|||||||||||
|
Equity securities
|
|
|
|
|
|
|
|
|
|
|
|
|
|||||||||||
|
Large capitalization value
|
25
|
|
2
|
|
10
|
|
1
|
|
35
|
|
3
|
|
|||||||||||
|
Total
|
$
|
109
|
|
$
|
3
|
|
$
|
59
|
|
$
|
5
|
|
$
|
168
|
|
$
|
8
|
|
|||||
1
Indicates length of time that individual securities have been in a continuous unrealized loss position.
Corporate Bonds.
The unrealized losses on our investments in corporate bonds and asset-backed securities relate to changes in interest rates and credit-related yield spreads since time of purchase. We do not intend to sell the investments and it is not likely that we will be required to sell the investments before recovery of their amortized cost basis. We do not consider these investments to be other-than-temporarily impaired as of
June 30, 2013
.
Equity Securities.
Cat Insurance maintains a well-diversified equity portfolio consisting of two specific mandates: large capitalization value stocks and smaller company growth stocks. U.S. equity valuations were generally higher during the second quarter of 2013 on generally favorable economic data driven by improving employment conditions and improvements in the housing sector. The unrealized losses on investments in equity securities relate to uneven sector participation in the market recovery. We do not consider these investments to be other-than-temporarily impaired as of
June 30, 2013
.
The cost basis and fair value of the available-for-sale debt securities at
June 30, 2013
, by contractual maturity, is shown below. Expected maturities will differ from contractual maturities because borrowers may have the right to prepay and creditors may have the right to call obligations.
23
|
June 30, 2013
|
|||||||
|
(Millions of dollars)
|
Cost Basis
|
Fair Value
|
|||||
|
Due in one year or less
|
$
|
213
|
|
$
|
216
|
|
|
|
Due after one year through five years
|
588
|
|
608
|
|
|||
|
Due after five years through ten years
|
35
|
|
38
|
|
|||
|
Due after ten years
|
32
|
|
30
|
|
|||
|
U.S. governmental agency mortgage-backed securities
|
358
|
|
359
|
|
|||
|
Residential mortgage-backed securities
|
22
|
|
22
|
|
|||
|
Commercial mortgage-backed securities
|
97
|
|
103
|
|
|||
|
Total debt securities – available-for-sale
|
$
|
1,345
|
|
$
|
1,376
|
|
|
|
|
|
|
|||||
|
Sales of Securities:
|
|
|
|||||||||||||
|
|
Three Months Ended
June 30, |
Six Months Ended
June 30, |
|||||||||||||
|
(Millions of dollars)
|
2013
|
2012
|
2013
|
2012
|
|||||||||||
|
Proceeds from the sale of available-for-sale securities
|
$
|
109
|
|
$
|
65
|
|
$
|
207
|
|
$
|
177
|
|
|||
|
Gross gains from the sale of available-for-sale securities
|
$
|
1
|
|
$
|
1
|
|
$
|
2
|
|
$
|
3
|
|
|||
|
Gross losses from the sale of available-for-sale securities
|
$
|
1
|
|
$
|
—
|
|
$
|
1
|
|
$
|
—
|
|
|||
9.
Postretirement Benefits
A. Pension and postretirement benefit costs
In February 2012, we announced the closure of the Electro-Motive Diesel facility located in London, Ontario. As a result of the closure, we recognized a
$37 million
other postretirement benefits curtailment gain. This excludes a
$21 million
loss of a third-party receivable for other postretirement benefits that was eliminated due to the closure. In addition, a
$10 million
special termination benefit expense was recognized related to statutory pension benefits required to be paid to certain affected employees. As a result, a net gain of
$6 million
related to the facility closure was recognized in Other operating (income) expenses in the Consolidated Statement of Results of Operations for the six months ended June 30, 2012.
24
|
(Millions of dollars)
|
U.S. Pension
Benefits
|
Non-U.S. Pension
Benefits
|
Other
Postretirement
Benefits
|
||||||||||||||||||||
|
|
June 30,
|
June 30,
|
June 30,
|
||||||||||||||||||||
|
|
2013
|
2012
|
2013
|
2012
|
2013
|
2012
|
|||||||||||||||||
|
For the three months ended:
|
|
|
|
|
|
|
|||||||||||||||||
|
Components of net periodic benefit cost:
|
|
|
|
|
|
|
|||||||||||||||||
|
Service cost
|
$
|
49
|
|
$
|
46
|
|
$
|
31
|
|
$
|
28
|
|
$
|
31
|
|
$
|
22
|
|
|||||
|
Interest cost
|
144
|
|
154
|
|
42
|
|
46
|
|
49
|
|
56
|
|
|||||||||||
|
Expected return on plan assets
|
(208
|
)
|
(203
|
)
|
(58
|
)
|
(53
|
)
|
(14
|
)
|
(16
|
)
|
|||||||||||
|
Amortization of:
|
|
|
|
|
|
|
|||||||||||||||||
|
Prior service cost (credit)
1
|
5
|
|
5
|
|
1
|
|
—
|
|
(19
|
)
|
(16
|
)
|
|||||||||||
|
Net actuarial loss (gain)
1
|
137
|
|
124
|
|
33
|
|
24
|
|
27
|
|
25
|
|
|||||||||||
|
Net periodic benefit cost
|
127
|
|
126
|
|
49
|
|
45
|
|
74
|
|
71
|
|
|||||||||||
|
Curtailments, settlements and special termination benefits
2
|
—
|
|
—
|
|
3
|
|
12
|
|
—
|
|
—
|
|
|||||||||||
|
Total cost included in operating profit
|
$
|
127
|
|
$
|
126
|
|
$
|
52
|
|
$
|
57
|
|
$
|
74
|
|
$
|
71
|
|
|||||
|
For the six months ended:
|
|||||||||||||||||||||||
|
Components of net periodic benefit cost:
|
|||||||||||||||||||||||
|
Service cost
|
$
|
98
|
|
$
|
92
|
|
$
|
62
|
|
$
|
56
|
|
$
|
55
|
|
$
|
46
|
|
|||||
|
Interest cost
|
289
|
|
308
|
|
85
|
|
91
|
|
98
|
|
111
|
|
|||||||||||
|
Expected return on plan assets
|
(416
|
)
|
(406
|
)
|
(117
|
)
|
(107
|
)
|
(28
|
)
|
(32
|
)
|
|||||||||||
|
Amortization of:
|
|
|
|
|
|
|
|||||||||||||||||
|
Transition obligation (asset)
|
—
|
|
—
|
|
—
|
|
—
|
|
1
|
|
1
|
|
|||||||||||
|
Prior service cost (credit)
1
|
9
|
|
10
|
|
1
|
|
—
|
|
(37
|
)
|
(33
|
)
|
|||||||||||
|
Net actuarial loss (gain)
1
|
273
|
|
248
|
|
66
|
|
48
|
|
54
|
|
50
|
|
|||||||||||
|
Net periodic benefit cost
|
253
|
|
252
|
|
97
|
|
88
|
|
143
|
|
143
|
|
|||||||||||
|
Curtailments, settlements and special termination benefits
2
|
—
|
|
—
|
|
3
|
|
22
|
|
—
|
|
(40
|
)
|
|||||||||||
|
Total cost included in operating profit
|
$
|
253
|
|
$
|
252
|
|
$
|
100
|
|
$
|
110
|
|
$
|
143
|
|
$
|
103
|
|
|||||
|
Weighted-average assumptions used to determine net cost:
|
|||||||||||||||||||||||
|
Discount rate
|
3.7
|
%
|
4.3
|
%
|
3.7
|
%
|
4.3
|
%
|
3.7
|
%
|
4.3
|
%
|
|||||||||||
|
Expected return on plan assets
|
7.8
|
%
|
8.0
|
%
|
6.7
|
%
|
7.1
|
%
|
7.8
|
%
|
8.0
|
%
|
|||||||||||
|
Rate of compensation increase
|
4.5
|
%
|
4.5
|
%
|
3.9
|
%
|
3.9
|
%
|
4.4
|
%
|
4.4
|
%
|
|||||||||||
|
1
|
Prior service cost (credit) and net actuarial loss (gain) for both pension and other postretirement benefits are generally amortized using the straight-line method over the average remaining service period to the full retirement eligibility date of employees expected to receive benefits from the plan. For pension plans in which all or almost all of the plan's participants are inactive and other postretirement benefit plans in which all or almost all of the plan's participants are fully eligible for benefits under the plan, prior service cost (credit) and net actuarial loss (gain) are amortized using the straight-line method over the remaining life expectancy of those participants.
|
|
2
|
Curtailments, settlements and special termination benefits were recognized in Other operating (income) expenses in the Consolidated Statement of Results of Operations.
|
We made
$138 million
and
$280 million
of contributions to our pension plans during the
three and six
months ended
June 30, 2013
, respectively. We currently anticipate full-year 2013 contributions of approximately
$480 million
, all of which are required. We made
$119 million
and
$293 million
of contributions to our pension plans during the
three and six
months ended
June 30, 2012
, respectively.
25
B. Defined contribution benefit costs
Total company costs related to our defined contribution plans were as follows:
|
|
Three Months Ended
June 30, |
Six Months Ended
June 30, |
|||||||||||||
|
(Millions of dollars)
|
2013
|
2012
|
2013
|
2012
|
|||||||||||
|
U.S. Plans
|
$
|
61
|
|
$
|
33
|
|
$
|
144
|
|
$
|
134
|
|
|||
|
Non-U.S. Plans
|
17
|
|
17
|
|
31
|
|
31
|
|
|||||||
|
|
$
|
78
|
|
$
|
50
|
|
$
|
175
|
|
$
|
165
|
|
|||
10.
Guarantees and Product Warranty
We have provided an indemnity to a third-party insurance company for potential losses related to performance bonds issued on behalf of Caterpillar dealers. The bonds are issued to insure governmental agencies against nonperformance by certain dealers. We also provided guarantees to a third-party related to the performance of contractual obligations by certain Caterpillar dealers. The guarantees cover potential financial losses incurred by the third-party resulting from the dealers’ nonperformance.
We provide loan guarantees to third-party lenders for financing associated with machinery purchased by customers. These guarantees have varying terms and are secured by the machinery. In addition, Cat Financial participates in standby letters of credit issued to third parties on behalf of their customers. These standby letters of credit have varying terms and beneficiaries and are secured by customer assets.
We have provided a guarantee to one of our customers in Brazil related to the performance of contractual obligations by a supplier consortium to which one of our Caterpillar subsidiaries is a member. The guarantees cover potential damages (some of them capped) incurred by the customer resulting from the supplier consortium’s non-performance. The guarantee will expire when the supplier consortium performs all its contractual obligations, which is expected to be completed in 2022.
We have provided guarantees to third-party lessors for certain properties leased by Cat Logistics Services, LLC, in which we sold a
65 percent
equity interest in the third quarter of 2012. The guarantees are for the possibility that the third party logistics business would default on real estate lease payments. The guarantees were granted at lease inception, which was prior to the divestiture, and generally will expire at the end of the lease terms.
No loss has been experienced or is anticipated under any of these guarantees. At
June 30, 2013
and
December 31, 2012
, the related liability was
$14 million
. The maximum potential amount of future payments (undiscounted and without reduction for any amounts that may possibly be recovered under recourse or collateralized provisions) we could be required to make under the guarantees are as follows:
|
(Millions of dollars)
|
June 30,
2013 |
December 31,
2012 |
|||||
|
Caterpillar dealer guarantees
|
$
|
181
|
|
$
|
180
|
|
|
|
Customer guarantees
|
56
|
|
77
|
|
|||
|
Customer guarantees – supplier consortium
|
347
|
|
—
|
|
|||
|
Third party logistics business guarantees
|
162
|
|
176
|
|
|||
|
Other guarantees
|
35
|
|
53
|
|
|||
|
Total guarantees
|
$
|
781
|
|
$
|
486
|
|
|
Cat Financial provides guarantees to repurchase certain loans of Caterpillar dealers from a special-purpose corporation (SPC) that qualifies as a variable interest entity. The purpose of the SPC is to provide short-term working capital loans to Caterpillar dealers. This SPC issues commercial paper and uses the proceeds to fund its loan program. Cat Financial has a loan purchase agreement with the SPC that obligates Cat Financial to purchase certain loans that are not paid at maturity. Cat Financial receives a fee for providing this guarantee, which provides a source of liquidity for the SPC. Cat Financial is the primary beneficiary of the SPC as their guarantees result in Cat Financial having both the power to direct
26
the activities that most significantly impact the SPC’s economic performance and the obligation to absorb losses, and therefore Cat Financial has consolidated the financial statements of the SPC. As of
June 30, 2013
and
December 31, 2012
, the SPC’s assets of
$889 million
and
$927 million
, respectively, are primarily comprised of loans to dealers and the SPC’s liabilities of
$889 million
and
$927 million
, respectively, are primarily comprised of commercial paper. The assets of the SPC are not available to pay Cat Financial's creditors. Cat Financial may be obligated to perform under the guarantee if the SPC experiences losses. No loss has been experienced or is anticipated under this loan purchase agreement.
Our product warranty liability is determined by applying historical claim rate experience to the current field population and dealer inventory. Generally, historical claim rates are based on actual warranty experience for each product by machine model/engine size. Specific rates are developed for each product build month and are updated monthly based on actual warranty claim experience.
|
(Millions of dollars)
|
2013
|
||
|
Warranty liability, January 1
|
$
|
1,477
|
|
|
Reduction in liability (payments)
|
(455
|
)
|
|
|
Increase in liability (new warranties)
|
390
|
|
|
|
Warranty liability, June 30
|
$
|
1,412
|
|
|
|
|
|
|
|
(Millions of dollars)
|
2012
|
||
|
Warranty liability, January 1
|
$
|
1,308
|
|
|
Reduction in liability (payments)
|
(920
|
)
|
|
|
Increase in liability (new warranties)
|
1,089
|
|
|
|
Warranty liability, December 31
|
$
|
1,477
|
|
|
|
|
|
|
11.
Profit Per Share
|
Computations of profit per share:
|
Three Months Ended
June 30,
|
Six Months Ended
June 30, |
|||||||||||||||
|
(Dollars in millions except per share data)
|
2013
|
2012
|
2013
|
2012
|
|||||||||||||
|
Profit for the period (A)
1
:
|
$
|
960
|
|
$
|
1,699
|
|
$
|
1,840
|
|
$
|
3,285
|
|
|||||
|
Determination of shares (in millions):
|
|
|
|||||||||||||||
|
Weighted-average number of common shares outstanding (B)
|
649.9
|
|
652.9
|
|
652.4
|
|
651.3
|
|
|||||||||
|
Shares issuable on exercise of stock awards, net of shares assumed to be purchased out of proceeds at average market price
|
12.8
|
|
16.7
|
|
14.2
|
|
18.6
|
|
|||||||||
|
Average common shares outstanding for fully diluted computation (C)
2
|
662.7
|
|
669.6
|
|
666.6
|
|
669.9
|
|
|||||||||
|
Profit per share of common stock:
|
|
|
|
|
|||||||||||||
|
Assuming no dilution (A/B)
|
$
|
1.48
|
|
$
|
2.60
|
|
$
|
2.82
|
|
$
|
5.04
|
|
|||||
|
Assuming full dilution (A/C)
2
|
$
|
1.45
|
|
$
|
2.54
|
|
$
|
2.76
|
|
$
|
4.90
|
|
|||||
|
Shares outstanding as of June 30 (in millions)
|
647.6
|
|
653.3
|
|
|||||||||||||
|
1
|
Profit attributable to common stockholders.
|
|
2
|
Diluted by assumed exercise of stock-based compensation awards using the treasury stock method.
|
SARs and stock options to purchase
10,350,280
and
10,256,295
common shares were outstanding for the
three and six
months ended
June 30, 2013
, respectively, which were not included in the computation of diluted earnings per share because the effect would have been antidilutive. For the
three and six
months ended
June 30, 2012
, there were outstanding SARs and stock options to purchase
6,091,056
common shares which were antidilutive.
In February 2007, the Board of Directors authorized the repurchase of
$7.5 billion
of Caterpillar stock, and in December 2011, the authorization was extended through December 31, 2015. In April 2013, we entered into a definitive agreement with Citibank, N.A. to purchase shares of our common stock under an accelerated stock repurchase transaction (April
27
ASR Agreement), which was completed in June 2013. In accordance with the terms of the April ASR Agreement, a total of
11.5 million
shares of our common stock were repurchased at an aggregate cost to Caterpillar of
$1.0 billion
. Through the end of the second quarter of 2013,
$4.8 billion
of the
$7.5 billion
authorization was spent.
In July 2013, we entered into a definitive agreement with Société Générale to purchase shares of our common stock under an accelerated stock repurchase transaction (July ASR Agreement). See Note 22 for additional information regarding the terms of the July ASR Agreement.
12.
Accumulated Other Comprehensive Income (Loss)
Comprehensive income and its components are presented in the Consolidated Statement of Comprehensive Income. Changes in Accumulated other comprehensive income (loss), net of tax, included in the Consolidated Statement of Changes in Stockholders’ Equity, consisted of the following:
|
(Millions of dollars)
|
Foreign currency translation
|
Pension and other postretirement benefits
|
Derivative financial instruments
|
Available-for-sale securities
|
Total
|
|||||||||||||||
|
Balance at June 30, 2012
1
|
$
|
239
|
|
$
|
(6,410
|
)
|
$
|
(37
|
)
|
$
|
58
|
|
$
|
(6,150
|
)
|
|||||
|
Three Months Ended June 30, 2013
|
||||||||||||||||||||
|
Balance at March 31, 2013
|
$
|
90
|
|
$
|
(6,778
|
)
|
$
|
(62
|
)
|
$
|
81
|
|
$
|
(6,669
|
)
|
|||||
|
Other comprehensive income (loss) before reclassifications
|
(182
|
)
|
12
|
|
7
|
|
(10
|
)
|
(173
|
)
|
||||||||||
|
Amounts reclassified from accumulated other comprehensive (income) loss
|
—
|
|
121
|
|
22
|
|
1
|
|
144
|
|
||||||||||
|
Other comprehensive income (loss)
|
(182
|
)
|
133
|
|
29
|
|
(9
|
)
|
(29
|
)
|
||||||||||
|
Balance at June 30, 2013
|
$
|
(92
|
)
|
$
|
(6,645
|
)
|
$
|
(33
|
)
|
$
|
72
|
|
$
|
(6,698
|
)
|
|||||
|
Six Months Ended June 30, 2013
|
||||||||||||||||||||
|
Balance at December 31, 2012
|
$
|
456
|
|
$
|
(6,914
|
)
|
$
|
(42
|
)
|
$
|
67
|
|
$
|
(6,433
|
)
|
|||||
|
Other comprehensive income (loss) before reclassifications
|
(548
|
)
|
27
|
|
(24
|
)
|
5
|
|
(540
|
)
|
||||||||||
|
Amounts reclassified from accumulated other comprehensive (income) loss
|
—
|
|
242
|
|
33
|
|
—
|
|
275
|
|
||||||||||
|
Other comprehensive income (loss)
|
(548
|
)
|
269
|
|
9
|
|
5
|
|
(265
|
)
|
||||||||||
|
Balance at June 30, 2013
|
$
|
(92
|
)
|
$
|
(6,645
|
)
|
$
|
(33
|
)
|
$
|
72
|
|
$
|
(6,698
|
)
|
|||||
|
1
|
In conjunction with the Cat Japan share redemption, to reflect the increase in our ownership interest in Cat Japan from
67 percent
to
100 percent
,
$107 million
was reclassified to Accumulated other comprehensive income (loss) from other components of stockholders' equity and was not included in Comprehensive income during the second quarter of 2012. The amount was comprised of foreign currency translation of
$167 million
, pension and other postretirement benefits of
$(61) million
and available-for-sale securities of
$1 million
.
|
The effect of the reclassifications out of Accumulated other comprehensive income (loss) on the Consolidated Statement of Results of Operations is as follows:
28
|
(Millions of dollars)
|
Classification of
income (expense)
|
Three Months Ended
June 30, 2013 |
Six Months Ended
June 30, 2013 |
|||||||
|
Pension and other postretirement benefits:
|
||||||||||
|
Amortization of actuarial gain (loss)
|
Note 9
1
|
$
|
(197
|
)
|
$
|
(393
|
)
|
|||
|
Amortization of prior service credit (cost)
|
Note 9
1
|
13
|
|
27
|
|
|||||
|
Amortization of transition asset (obligation)
|
Note 9
1
|
—
|
|
(1
|
)
|
|||||
|
Reclassifications before tax
|
(184
|
)
|
(367
|
)
|
||||||
|
Tax (provision) benefit
|
63
|
|
125
|
|
||||||
|
Reclassifications net of tax
|
$
|
(121
|
)
|
$
|
(242
|
)
|
||||
|
Derivative financial instruments:
|
||||||||||
|
Foreign exchange contracts
|
Other income (expense)
|
$
|
(31
|
)
|
$
|
(48
|
)
|
|||
|
Interest rate contracts
|
Other income (expense)
|
(1
|
)
|
(1
|
)
|
|||||
|
Interest rate contracts
|
Interest expense of Financial Products
|
(2
|
)
|
(3
|
)
|
|||||
|
Reclassifications before tax
|
(34
|
)
|
(52
|
)
|
||||||
|
Tax (provision) benefit
|
12
|
|
19
|
|
||||||
|
Reclassifications net of tax
|
$
|
(22
|
)
|
$
|
(33
|
)
|
||||
|
Available-for-sale securities:
|
||||||||||
|
Realized gain (loss)
|
Other income (expense)
|
$
|
(1
|
)
|
$
|
—
|
|
|||
|
Tax (provision) benefit
|
—
|
|
—
|
|
||||||
|
Reclassifications net of tax
|
$
|
(1
|
)
|
$
|
—
|
|
||||
|
Total reclassifications from Accumulated other comprehensive income (loss)
|
$
|
(144
|
)
|
$
|
(275
|
)
|
||||
1
Amounts are included in the calculation of net periodic benefit cost. See Note 9 for additional information.
13.
Environmental and Legal Matters
The company is regulated by federal, state and international environmental laws governing our use, transport and disposal of substances and control of emissions. In addition to governing our manufacturing and other operations, these laws often impact the development of our products, including, but not limited to, required compliance with air emissions standards applicable to internal combustion engines. We have made, and will continue to make, significant research and development and capital expenditures to comply with these emissions standards.
We are engaged in remedial activities at a number of locations, often with other companies, pursuant to federal and state laws. When it is probable we will pay remedial costs at a site and those costs can be reasonably estimated, the costs are accrued against our earnings. In formulating that estimate, we do not consider amounts expected to be recovered from insurance companies or others. The amount recorded for environmental remediation is not material and is included in Accrued expenses in the Consolidated Statement of Financial Position.
We cannot reasonably estimate costs at sites in the very early stages of remediation. Currently, we have a few sites in the very early stages of remediation, and there is no more than a remote chance that a material amount for remedial activities at any individual site, or at all sites in the aggregate, will be required.
We are also involved in unresolved legal actions that arise in the normal course of business. The most prevalent of these unresolved actions involve disputes related to product design, manufacture and performance liability (including claimed asbestos and welding fumes exposure), contracts, employment issues, environmental matters or intellectual property rights. The aggregate range of reasonably possible losses in excess of accrued liabilities, if any, associated with these unresolved legal actions is not material. In some cases, we cannot reasonably estimate a range of loss because there is insufficient information regarding the matter. However, there is no more than a remote chance that any liability arising from these matters would be material. Although it is not possible to predict with certainty the outcome of these unresolved
29
legal actions, we believe that these actions will not individually or in the aggregate have a material adverse effect on our consolidated results of operations, financial position or liquidity.
14.
Income Taxes
The provision for income taxes for the first six months of 2013 reflects an estimated annual effective tax rate o
f
29 percent
compared with
30.5 percent
for
2012
, excluding the items discussed below. The decrease is primarily due to the U.S. research and development tax credit that was expired in 2012 along with expected changes in our geographic mix of profits from a tax perspective.
The 2013 tax provision also includes a benefit of
$87 million
primarily related to the research and development tax credit that was retroactively extended for 2012. This compares to a
$75 million
negative impact related to nondeductible goodwill in the first half of 2012.
15.
Segment Information
A. Basis for segment information
Our Executive Office is comprised of
five
Group Presidents, a Senior Vice President and a CEO. Group Presidents are accountable for a related set of end-to-end businesses that they manage. The Senior Vice President leads the Caterpillar Enterprise System Group, which was formed during the second quarter of 2013 with the goal of improving our manufacturing and supply chain capabilities, driving sustained improvements in customer deliveries, improving operational efficiencies and building on recent product quality improvements. The CEO allocates resources and manages performance at the Group President level. As such, the CEO serves as our Chief Operating Decision Maker and operating segments are primarily based on the Group President reporting structure.
Three
of our operating segments, Construction Industries, Resource Industries and Power Systems, are led by Group Presidents.
One
operating segment, Financial Products, is led by a Group President who has responsibility for Corporate Services. Corporate Services is a cost center primarily responsible for the performance of certain support functions globally and to provide centralized services; it does not meet the definition of an operating segment. The Caterpillar Enterprise System Group is also a cost center and does not meet the definition of an operating segment.
One
Group President leads a smaller operating segment that is included in the All Other operating segment.
B. Description of segments
We have
five
operating segments, of which
four
are reportable segments. Following is a brief description of our reportable segments and the business activities included in the All Other operating segment:
Construction Industries
: A segment primarily responsible for supporting customers using machinery in infrastructure and building construction applications. Responsibilities include business strategy, product design, product management and development, manufacturing, marketing, and sales and product support. The product portfolio includes backhoe loaders, small wheel loaders, small track-type tractors, skid steer loaders, multi-terrain loaders, mini excavators, compact wheel loaders, select work tools, small, medium and large track excavators, wheel excavators, medium wheel loaders, medium track-type tractors, track-type loaders, motor graders and pipe layers. In addition, Construction Industries has responsibility for Power Systems and three wholly-owned dealers in Japan and an integrated manufacturing cost center. Inter-segment sales are a source of revenue for this segment.
Resource Industries
:
A segment primarily responsible for supporting customers using machinery in mining and quarrying applications. Responsibilities include business strategy, product design, product management and development, manufacturing, marketing and sales and product support. The product portfolio includes large track-type tractors, large mining trucks, underground mining equipment, electric rope shovels, draglines, hydraulic shovels, drills, highwall miners, tunnel boring equipment, large wheel loaders, off-highway trucks, articulated trucks, wheel tractor scrapers, wheel dozers, select work tools, forestry products, paving products, industrial and waste products, machinery components and electronics and control systems. Resource Industries also manages areas that provide services to other parts of the company, including integrated manufacturing and research and development. In addition, segment profit includes the impact from divestiture of portions of the Bucyrus distribution business and the acquisition of ERA Mining Machinery Limited, including its wholly-owned subsidiary Zhengzhou Siwei Mechanical & Electrical Manufacturing Co., Ltd., commonly known as Siwei,
30
which was completed during the second quarter of 2012. Siwei primarily designs, manufactures, sells and supports underground coal mining equipment in China. Inter-segment sales are a source of revenue for this segment.
Power Systems
: A segment primarily responsible for supporting customers using reciprocating engines, turbines and related parts across industries serving electric power, industrial, petroleum and marine applications as well as rail-related businesses. Responsibilities include business strategy, product design, product management, development, manufacturing, marketing, sales and product support of reciprocating engine powered generator sets, integrated systems used in the electric power generation industry, reciprocating engines and integrated systems and solutions for the marine and petroleum industries; reciprocating engines supplied to the industrial industry as well as Caterpillar machinery; the business strategy, product design, product management, development, manufacturing, marketing, sales and product support of turbines and turbine-related services; the development, manufacturing, remanufacturing, maintenance, leasing and service of diesel-electric locomotives and components and other rail-related products and services. Inter-segment sales are a source of revenue for this segment.
Financial Products Segment
: Provides financing to customers and dealers for the purchase and lease of Caterpillar and other equipment, as well as some financing for Caterpillar sales to dealers. Financing plans include operating and finance leases, installment sale contracts, working capital loans and wholesale financing plans. The segment also provides various forms of insurance to customers and dealers to help support the purchase and lease of our equipment.
All Other
:
Primarily includes activities such as: the remanufacturing of Cat engines and components and remanufacturing services for other companies as well as the product management, development, manufacturing, marketing and product support of undercarriage, specialty products, hardened bar stock components and ground engaging tools primarily for Caterpillar products; logistics services; the product management, development, marketing, sales and product support of on-highway vocational trucks for North America; distribution services responsible for dealer development and administration, dealer portfolio management and ensuring the most efficient and effective distribution of machines, engines and parts. On July 31, 2012, we sold a majority interest in Caterpillar's third party logistics business. Inter-segment sales are a source of revenue for this segment. Results for the All Other operating segment are included as a reconciling item between reportable segments and consolidated external reporting.
C.
Segment measurement and reconciliations
There are several methodology differences between our segment reporting and our external reporting. The following is a list of the more significant methodology differences:
|
•
|
Machinery and Power Systems segment net assets generally include inventories, receivables, property, plant and equipment, goodwill, intangibles and accounts payable. Liabilities other than accounts payable are generally managed at the corporate level and are not included in segment operations. Financial Products Segment assets generally include all categories of assets.
|
|
•
|
Segment inventories and cost of sales are valued using a current cost methodology.
|
|
•
|
Goodwill allocated to segments is amortized using a fixed amount based on a
20
year useful life. This methodology difference only impacts segment assets; no goodwill amortization expense is included in segment profit. In addition, only a portion of goodwill for certain acquisitions made in 2011 or later has been allocated to segments.
|
|
•
|
The present value of future lease payments for certain Machinery and Power Systems operating leases is included in segment assets. The estimated financing component of the lease payments is excluded.
|
|
•
|
Currency exposures for Machinery and Power Systems are generally managed at the corporate level and the effects of changes in exchange rates on results of operations within the year are not included in segment profit. The net difference created in the translation of revenues and costs between exchange rates used for U.S. GAAP reporting and exchange rates used for segment reporting are recorded as a methodology difference.
|
|
•
|
Postretirement benefit expenses are split; segments are generally responsible for service and prior service costs, with the remaining elements of net periodic benefit cost included as a methodology difference.
|
31
|
•
|
Machinery and Power Systems segment profit is determined on a pretax basis and excludes interest expense, gains and losses on interest rate swaps and other income/expense items. Financial Products Segment profit is determined on a pretax basis and includes other income/expense items.
|
Reconciling items are created based on accounting differences between segment reporting and our consolidated external reporting. Please refer to pages 34 to 39 for financial information regarding significant reconciling items. Most of our reconciling items are self-explanatory given the above explanations. For the reconciliation of profit, we have grouped the reconciling items as follows:
|
•
|
Corporate costs:
These costs are related to corporate requirements and strategies that are considered to be for the benefit of the entire organization.
|
|
•
|
Methodology differences:
See previous discussion of significant accounting differences between segment reporting and consolidated external reporting.
|
|
•
|
Timing:
Timing differences in the recognition of costs between segment reporting and consolidated external reporting.
|
|
Reportable Segments
|
|||||||||||||||||||||||||||
|
Three Months Ended June 30,
|
|||||||||||||||||||||||||||
|
(Millions of dollars)
|
|||||||||||||||||||||||||||
|
|
2013
|
||||||||||||||||||||||||||
|
|
External
sales and
revenues
|
Inter-
segment
sales and
revenues
|
Total sales
and
revenues
|
Depreciation
and
amortization
|
Segment
profit
|
Segment
assets at June 30
|
Capital
expenditures
|
||||||||||||||||||||
|
Construction Industries
|
$
|
4,850
|
|
$
|
113
|
|
$
|
4,963
|
|
$
|
143
|
|
$
|
362
|
|
$
|
8,725
|
|
$
|
136
|
|
||||||
|
Resource Industries
|
3,571
|
|
233
|
|
3,804
|
|
186
|
|
550
|
|
12,000
|
|
145
|
|
|||||||||||||
|
Power Systems
|
5,263
|
|
461
|
|
5,724
|
|
156
|
|
955
|
|
9,080
|
|
161
|
|
|||||||||||||
|
Machinery and Power Systems
|
$
|
13,684
|
|
$
|
807
|
|
$
|
14,491
|
|
$
|
485
|
|
$
|
1,867
|
|
$
|
29,805
|
|
$
|
442
|
|
||||||
|
Financial Products Segment
|
806
|
|
—
|
|
806
|
|
188
|
|
233
|
|
36,931
|
|
451
|
|
|||||||||||||
|
Total
|
$
|
14,490
|
|
$
|
807
|
|
$
|
15,297
|
|
$
|
673
|
|
$
|
2,100
|
|
$
|
66,736
|
|
$
|
893
|
|
||||||
|
|
2012
|
||||||||||||||||||||||||||
|
|
External
sales and
revenues
|
Inter-
segment
sales and
revenues
|
Total sales
and
revenues
|
Depreciation
and
amortization
|
Segment
profit
|
Segment
assets at
December 31
|
Capital
expenditures
|
||||||||||||||||||||
|
Construction Industries
|
$
|
5,340
|
|
$
|
123
|
|
$
|
5,463
|
|
$
|
139
|
|
$
|
688
|
|
$
|
10,393
|
|
$
|
219
|
|
||||||
|
Resource Industries
|
5,390
|
|
328
|
|
5,718
|
|
168
|
|
1,426
|
|
13,455
|
|
242
|
|
|||||||||||||
|
Power Systems
|
5,511
|
|
680
|
|
6,191
|
|
147
|
|
982
|
|
9,323
|
|
237
|
|
|||||||||||||
|
Machinery and Power Systems
|
$
|
16,241
|
|
$
|
1,131
|
|
$
|
17,372
|
|
$
|
454
|
|
$
|
3,096
|
|
$
|
33,171
|
|
$
|
698
|
|
||||||
|
Financial Products Segment
|
764
|
|
—
|
|
764
|
|
177
|
|
188
|
|
36,563
|
|
457
|
|
|||||||||||||
|
Total
|
$
|
17,005
|
|
$
|
1,131
|
|
$
|
18,136
|
|
$
|
631
|
|
$
|
3,284
|
|
$
|
69,734
|
|
$
|
1,155
|
|
||||||
32
|
Reportable Segments
|
|||||||||||||||||||||||||||
|
Six Months Ended June 30,
|
|||||||||||||||||||||||||||
|
(Millions of dollars)
|
|||||||||||||||||||||||||||
|
|
2013
|
||||||||||||||||||||||||||
|
|
External
sales and
revenues
|
Inter-
segment
sales and
revenues
|
Total sales
and
revenues
|
Depreciation
and
amortization
|
Segment
profit
|
Segment
assets at
June 30
|
Capital
expenditures
|
||||||||||||||||||||
|
Construction Industries
|
$
|
9,047
|
|
$
|
224
|
|
$
|
9,271
|
|
$
|
281
|
|
$
|
601
|
|
$
|
8,725
|
|
$
|
260
|
|
||||||
|
Resource Industries
|
7,247
|
|
453
|
|
7,700
|
|
366
|
|
1,027
|
|
12,000
|
|
252
|
|
|||||||||||||
|
Power Systems
|
9,668
|
|
857
|
|
10,525
|
|
307
|
|
1,553
|
|
9,080
|
|
265
|
|
|||||||||||||
|
Machinery and Power Systems
|
$
|
25,962
|
|
$
|
1,534
|
|
$
|
27,496
|
|
$
|
954
|
|
$
|
3,181
|
|
$
|
29,805
|
|
$
|
777
|
|
||||||
|
Financial Products Segment
|
1,601
|
|
—
|
|
1,601
|
|
368
|
|
506
|
|
36,931
|
|
771
|
|
|||||||||||||
|
Total
|
$
|
27,563
|
|
$
|
1,534
|
|
$
|
29,097
|
|
$
|
1,322
|
|
$
|
3,687
|
|
$
|
66,736
|
|
$
|
1,548
|
|
||||||
|
|
2012
|
||||||||||||||||||||||||||
|
|
External
sales and
revenues
|
Inter-
segment
sales and
revenues
|
Total sales
and
revenues
|
Depreciation
and
amortization
|
Segment
profit
|
Segment
assets at
December 31
|
Capital
expenditures
|
||||||||||||||||||||
|
Construction Industries
|
$
|
10,402
|
|
$
|
253
|
|
$
|
10,655
|
|
$
|
270
|
|
$
|
1,304
|
|
$
|
10,393
|
|
$
|
350
|
|
||||||
|
Resource Industries
|
10,168
|
|
656
|
|
10,824
|
|
331
|
|
2,594
|
|
13,455
|
|
374
|
|
|||||||||||||
|
Power Systems
|
10,498
|
|
1,355
|
|
11,853
|
|
285
|
|
1,794
|
|
9,323
|
|
366
|
|
|||||||||||||
|
Machinery and Power Systems
|
$
|
31,068
|
|
$
|
2,264
|
|
$
|
33,332
|
|
$
|
886
|
|
$
|
5,692
|
|
$
|
33,171
|
|
$
|
1,090
|
|
||||||
|
Financial Products Segment
|
1,525
|
|
—
|
|
1,525
|
|
351
|
|
393
|
|
36,563
|
|
800
|
|
|||||||||||||
|
Total
|
$
|
32,593
|
|
$
|
2,264
|
|
$
|
34,857
|
|
$
|
1,237
|
|
$
|
6,085
|
|
$
|
69,734
|
|
$
|
1,890
|
|
||||||
33
|
Reconciliation of Sales and revenues:
|
|
|
|
|
|||||||||||
|
(Millions of dollars)
|
Machinery
and Power
Systems
|
Financial
Products
|
Consolidating
Adjustments
|
Consolidated
Total
|
|||||||||||
|
Three Months Ended June 30, 2013
|
|
|
|
|
|||||||||||
|
Total external sales and revenues from reportable segments
|
$
|
13,684
|
|
$
|
806
|
|
$
|
—
|
|
$
|
14,490
|
|
|||
|
All Other operating segment
|
211
|
|
—
|
|
—
|
|
211
|
|
|||||||
|
Other
|
(9
|
)
|
17
|
|
(88
|
)
|
1
|
(80
|
)
|
||||||
|
Total sales and revenues
|
$
|
13,886
|
|
$
|
823
|
|
$
|
(88
|
)
|
$
|
14,621
|
|
|||
|
Three Months Ended June 30, 2012
|
|
|
|
|
|
|
|
|
|||||||
|
Total external sales and revenues from reportable segments
|
$
|
16,241
|
|
$
|
764
|
|
$
|
—
|
|
$
|
17,005
|
|
|||
|
All Other operating segment
|
454
|
|
—
|
|
—
|
|
454
|
|
|||||||
|
Other
|
(11
|
)
|
16
|
|
(90
|
)
|
1
|
(85
|
)
|
||||||
|
Total sales and revenues
|
$
|
16,684
|
|
$
|
780
|
|
$
|
(90
|
)
|
$
|
17,374
|
|
|||
|
1
Elimination of Financial Products revenues from Machinery and Power Systems.
|
|||||||||||||||
|
Reconciliation of Sales and revenues:
|
|
|
|
|
|||||||||||
|
(Millions of dollars)
|
Machinery
and Power
Systems
|
Financial
Products
|
Consolidating
Adjustments
|
Consolidated
Total
|
|||||||||||
|
Six Months Ended June 30, 2013
|
|
|
|
|
|||||||||||
|
Total external sales and revenues from reportable segments
|
$
|
25,962
|
|
$
|
1,601
|
|
$
|
—
|
|
$
|
27,563
|
|
|||
|
All Other operating segment
|
428
|
|
—
|
|
—
|
|
428
|
|
|||||||
|
Other
|
(20
|
)
|
36
|
|
(176
|
)
|
1
|
(160
|
)
|
||||||
|
Total sales and revenues
|
$
|
26,370
|
|
$
|
1,637
|
|
$
|
(176
|
)
|
$
|
27,831
|
|
|||
|
Six Months Ended June 30, 2012
|
|
|
|
|
|
|
|
|
|||||||
|
Total external sales and revenues from reportable segments
|
$
|
31,068
|
|
$
|
1,525
|
|
$
|
—
|
|
$
|
32,593
|
|
|||
|
All Other operating segment
|
928
|
|
—
|
|
—
|
|
928
|
|
|||||||
|
Other
|
(24
|
)
|
32
|
|
(174
|
)
|
1
|
(166
|
)
|
||||||
|
Total sales and revenues
|
$
|
31,972
|
|
$
|
1,557
|
|
$
|
(174
|
)
|
$
|
33,355
|
|
|||
|
1
Elimination of Financial Products revenues from Machinery and Power Systems.
|
|||||||||||||||
34
|
Reconciliation of Consolidated profit before taxes:
|
|
|
|
||||||||
|
(Millions of dollars)
|
Machinery
and Power
Systems
|
Financial
Products
|
Consolidated
Total
|
||||||||
|
Three Months Ended June 30, 2013
|
|
|
|
||||||||
|
Total profit from reportable segments
|
$
|
1,867
|
|
$
|
233
|
|
$
|
2,100
|
|
||
|
All Other operating segment
|
185
|
|
—
|
|
185
|
|
|||||
|
Cost centers
|
19
|
|
—
|
|
19
|
|
|||||
|
Corporate costs
|
(411
|
)
|
—
|
|
(411
|
)
|
|||||
|
Timing
|
(66
|
)
|
—
|
|
(66
|
)
|
|||||
|
Methodology differences:
|
|
|
|
|
|||||||
|
Inventory/cost of sales
|
(67
|
)
|
—
|
|
(67
|
)
|
|||||
|
Postretirement benefit expense
|
(166
|
)
|
—
|
|
(166
|
)
|
|||||
|
Financing costs
|
(117
|
)
|
—
|
|
(117
|
)
|
|||||
|
Equity in (profit) loss of unconsolidated affiliated companies
|
1
|
|
—
|
|
1
|
|
|||||
|
Currency
|
(54
|
)
|
—
|
|
(54
|
)
|
|||||
|
Other income/expense methodology differences
|
(68
|
)
|
—
|
|
(68
|
)
|
|||||
|
Other methodology differences
|
—
|
|
(3
|
)
|
(3
|
)
|
|||||
|
Total consolidated profit before taxes
|
$
|
1,123
|
|
$
|
230
|
|
$
|
1,353
|
|
||
|
Three Months Ended June 30, 2012
|
|
|
|
|
|
|
|||||
|
Total profit from reportable segments
|
$
|
3,096
|
|
$
|
188
|
|
$
|
3,284
|
|
||
|
All Other operating segment
|
188
|
|
—
|
|
188
|
|
|||||
|
Cost centers
|
(11
|
)
|
—
|
|
(11
|
)
|
|||||
|
Corporate costs
|
(400
|
)
|
—
|
|
(400
|
)
|
|||||
|
Timing
|
(137
|
)
|
—
|
|
(137
|
)
|
|||||
|
Methodology differences:
|
|
|
|||||||||
|
Inventory/cost of sales
|
(21
|
)
|
—
|
|
(21
|
)
|
|||||
|
Postretirement benefit expense
|
(145
|
)
|
—
|
|
(145
|
)
|
|||||
|
Financing costs
|
(112
|
)
|
—
|
|
(112
|
)
|
|||||
|
Equity in (profit) loss of unconsolidated affiliated companies
|
(5
|
)
|
—
|
|
(5
|
)
|
|||||
|
Currency
|
9
|
|
—
|
|
9
|
|
|||||
|
Other income/expense methodology differences
|
(74
|
)
|
—
|
|
(74
|
)
|
|||||
|
Other methodology differences
|
4
|
|
(4
|
)
|
—
|
|
|||||
|
Total consolidated profit before taxes
|
$
|
2,392
|
|
$
|
184
|
|
$
|
2,576
|
|
||
35
|
Reconciliation of Consolidated profit before taxes:
|
|
|
|
||||||||
|
(Millions of dollars)
|
Machinery
and Power
Systems
|
Financial
Products
|
Consolidated
Total
|
||||||||
|
Six Months Ended June 30, 2013
|
|
|
|
||||||||
|
Total profit from reportable segments
|
$
|
3,181
|
|
$
|
506
|
|
$
|
3,687
|
|
||
|
All Other operating segment
|
377
|
|
—
|
|
377
|
|
|||||
|
Cost centers
|
58
|
|
—
|
|
58
|
|
|||||
|
Corporate costs
|
(784
|
)
|
—
|
|
(784
|
)
|
|||||
|
Timing
|
(19
|
)
|
—
|
|
(19
|
)
|
|||||
|
Methodology differences:
|
|
|
|||||||||
|
Inventory/cost of sales
|
(103
|
)
|
—
|
|
(103
|
)
|
|||||
|
Postretirement benefit expense
|
(331
|
)
|
—
|
|
(331
|
)
|
|||||
|
Financing costs
|
(241
|
)
|
—
|
|
(241
|
)
|
|||||
|
Currency
|
(39
|
)
|
—
|
|
(39
|
)
|
|||||
|
Other income/expense methodology differences
|
(120
|
)
|
—
|
|
(120
|
)
|
|||||
|
Other methodology differences
|
(19
|
)
|
14
|
|
(5
|
)
|
|||||
|
Total consolidated profit before taxes
|
$
|
1,960
|
|
$
|
520
|
|
$
|
2,480
|
|
||
|
Six Months Ended June 30, 2012
|
|
|
|
|
|
|
|||||
|
Total profit from reportable segments
|
$
|
5,692
|
|
$
|
393
|
|
$
|
6,085
|
|
||
|
All Other operating segment
|
406
|
|
—
|
|
406
|
|
|||||
|
Cost centers
|
23
|
|
—
|
|
23
|
|
|||||
|
Corporate costs
|
(760
|
)
|
—
|
|
(760
|
)
|
|||||
|
Timing
|
(288
|
)
|
—
|
|
(288
|
)
|
|||||
|
Methodology differences:
|
|||||||||||
|
Inventory/cost of sales
|
(35
|
)
|
—
|
|
(35
|
)
|
|||||
|
Postretirement benefit expense
|
(331
|
)
|
—
|
|
(331
|
)
|
|||||
|
Financing costs
|
(227
|
)
|
—
|
|
(227
|
)
|
|||||
|
Equity in (profit) loss of unconsolidated affiliated companies
|
(7
|
)
|
—
|
|
(7
|
)
|
|||||
|
Currency
|
140
|
|
—
|
|
140
|
|
|||||
|
Other income/expense methodology differences
|
(135
|
)
|
—
|
|
(135
|
)
|
|||||
|
Other methodology differences
|
6
|
|
(3
|
)
|
3
|
|
|||||
|
Total consolidated profit before taxes
|
$
|
4,484
|
|
$
|
390
|
|
$
|
4,874
|
|
||
36
|
Reconciliation of Assets:
|
|
|
|
|
|||||||||||
|
(Millions of dollars)
|
Machinery
and Power
Systems
|
Financial
Products
|
Consolidating
Adjustments
|
Consolidated
Total
|
|||||||||||
|
June 30, 2013
|
|
|
|
|
|||||||||||
|
Total assets from reportable segments
|
$
|
29,805
|
|
$
|
36,931
|
|
$
|
—
|
|
$
|
66,736
|
|
|||
|
All Other operating segment
|
1,501
|
|
—
|
|
—
|
|
1,501
|
|
|||||||
|
Items not included in segment assets:
|
|
|
|
|
|
|
|
|
|||||||
|
Cash and short-term investments
|
3,974
|
|
—
|
|
—
|
|
3,974
|
|
|||||||
|
Intercompany receivables
|
238
|
|
—
|
|
(238
|
)
|
—
|
|
|||||||
|
Investment in Financial Products
|
4,537
|
|
—
|
|
(4,537
|
)
|
—
|
|
|||||||
|
Deferred income taxes
|
4,038
|
|
—
|
|
(489
|
)
|
3,549
|
|
|||||||
|
Goodwill and intangible assets
|
3,445
|
|
—
|
|
—
|
|
3,445
|
|
|||||||
|
Property, plant and equipment – net and other assets
|
970
|
|
—
|
|
—
|
|
970
|
|
|||||||
|
Operating lease methodology difference
|
(292
|
)
|
—
|
|
—
|
|
(292
|
)
|
|||||||
|
Liabilities included in segment assets
|
10,478
|
|
—
|
|
—
|
|
10,478
|
|
|||||||
|
Inventory methodology differences
|
(2,635
|
)
|
—
|
|
—
|
|
(2,635
|
)
|
|||||||
|
Other
|
(176
|
)
|
(99
|
)
|
(76
|
)
|
(351
|
)
|
|||||||
|
Total assets
|
$
|
55,883
|
|
$
|
36,832
|
|
$
|
(5,340
|
)
|
$
|
87,375
|
|
|||
|
December 31, 2012
|
|
|
|
|
|
|
|
|
|||||||
|
Total assets from reportable segments
|
$
|
33,171
|
|
$
|
36,563
|
|
$
|
—
|
|
$
|
69,734
|
|
|||
|
All Other operating segment
|
1,499
|
|
—
|
|
—
|
|
1,499
|
|
|||||||
|
Items not included in segment assets:
|
|
|
|
|
|
|
|
|
|||||||
|
Cash and short-term investments
|
3,306
|
|
—
|
|
—
|
|
3,306
|
|
|||||||
|
Intercompany receivables
|
303
|
|
—
|
|
(303
|
)
|
—
|
|
|||||||
|
Investment in Financial Products
|
4,433
|
|
—
|
|
(4,433
|
)
|
—
|
|
|||||||
|
Deferred income taxes
|
3,926
|
|
—
|
|
(516
|
)
|
3,410
|
|
|||||||
|
Goodwill and intangible assets
|
3,145
|
|
—
|
|
—
|
|
3,145
|
|
|||||||
|
Property, plant and equipment – net and other assets
|
668
|
|
—
|
|
—
|
|
668
|
|
|||||||
|
Operating lease methodology difference
|
(329
|
)
|
—
|
|
—
|
|
(329
|
)
|
|||||||
|
Liabilities included in segment assets
|
11,293
|
|
—
|
|
—
|
|
11,293
|
|
|||||||
|
Inventory methodology differences
|
(2,949
|
)
|
—
|
|
—
|
|
(2,949
|
)
|
|||||||
|
Other
|
(182
|
)
|
(107
|
)
|
(132
|
)
|
(421
|
)
|
|||||||
|
Total assets
|
$
|
58,284
|
|
$
|
36,456
|
|
$
|
(5,384
|
)
|
$
|
89,356
|
|
|||
37
|
Reconciliations of Depreciation and amortization:
|
|
|
|
||||||||
|
(Millions of dollars)
|
Machinery
and Power
Systems
|
Financial
Products
|
Consolidated
Total
|
||||||||
|
Three Months Ended June 30, 2013
|
|
|
|
||||||||
|
Total depreciation and amortization from reportable segments
|
$
|
485
|
|
$
|
188
|
|
$
|
673
|
|
||
|
Items not included in segment depreciation and amortization:
|
|
|
|
|
|
|
|||||
|
All Other operating segment
|
42
|
|
—
|
|
42
|
|
|||||
|
Cost centers
|
34
|
|
—
|
|
34
|
|
|||||
|
Other
|
5
|
|
7
|
|
12
|
|
|||||
|
Total depreciation and amortization
|
$
|
566
|
|
$
|
195
|
|
$
|
761
|
|
||
|
Three Months Ended June 30, 2012
|
|
|
|
|
|
|
|||||
|
Total depreciation and amortization from reportable segments
|
$
|
454
|
|
$
|
177
|
|
$
|
631
|
|
||
|
Items not included in segment depreciation and amortization:
|
|
|
|
|
|
|
|||||
|
All Other operating segment
|
41
|
|
—
|
|
41
|
|
|||||
|
Cost centers
|
22
|
|
—
|
|
22
|
|
|||||
|
Other
|
(11
|
)
|
6
|
|
(5
|
)
|
|||||
|
Total depreciation and amortization
|
$
|
506
|
|
$
|
183
|
|
$
|
689
|
|
||
|
Reconciliations of Depreciation and amortization:
|
|
|
|
||||||||
|
(Millions of dollars)
|
Machinery
and Power
Systems
|
Financial
Products
|
Consolidated
Total
|
||||||||
|
Six Months Ended June 30, 2013
|
|
|
|
||||||||
|
Total depreciation and amortization from reportable segments
|
$
|
954
|
|
$
|
368
|
|
$
|
1,322
|
|
||
|
Items not included in segment depreciation and amortization:
|
|
|
|||||||||
|
All Other operating segment
|
84
|
|
—
|
|
84
|
|
|||||
|
Cost centers
|
68
|
|
—
|
|
68
|
|
|||||
|
Other
|
(2
|
)
|
12
|
|
10
|
|
|||||
|
Total depreciation and amortization
|
$
|
1,104
|
|
$
|
380
|
|
$
|
1,484
|
|
||
|
Six Months Ended June 30, 2012
|
|
|
|
|
|
|
|||||
|
Total depreciation and amortization from reportable segments
|
$
|
886
|
|
$
|
351
|
|
$
|
1,237
|
|
||
|
Items not included in segment depreciation and amortization:
|
|
|
|||||||||
|
All Other operating segment
|
84
|
|
—
|
|
84
|
|
|||||
|
Cost centers
|
41
|
|
—
|
|
41
|
|
|||||
|
Other
|
(23
|
)
|
11
|
|
(12
|
)
|
|||||
|
Total depreciation and amortization
|
$
|
988
|
|
$
|
362
|
|
$
|
1,350
|
|
||
38
|
Reconciliations of Capital expenditures:
|
|
|
|
|
|||||||||||
|
(Millions of dollars)
|
Machinery
and Power
Systems
|
Financial
Products
|
Consolidating
Adjustments
|
Consolidated
Total
|
|||||||||||
|
Three Months Ended June 30, 2013
|
|
|
|
|
|
|
|
|
|||||||
|
Total capital expenditures from reportable segments
|
$
|
442
|
|
$
|
451
|
|
$
|
—
|
|
$
|
893
|
|
|||
|
Items not included in segment capital expenditures:
|
|
|
|
|
|
|
|
|
|||||||
|
All Other operating segment
|
71
|
|
—
|
|
—
|
|
71
|
|
|||||||
|
Cost centers
|
47
|
|
—
|
|
—
|
|
47
|
|
|||||||
|
Timing
|
(8
|
)
|
—
|
|
—
|
|
(8
|
)
|
|||||||
|
Other
|
(52
|
)
|
32
|
|
(18
|
)
|
(38
|
)
|
|||||||
|
Total capital expenditures
|
$
|
500
|
|
$
|
483
|
|
$
|
(18
|
)
|
$
|
965
|
|
|||
|
Three Months Ended June 30, 2012
|
|
|
|
|
|
|
|
|
|||||||
|
Total capital expenditures from reportable segments
|
$
|
698
|
|
$
|
457
|
|
$
|
—
|
|
$
|
1,155
|
|
|||
|
Items not included in segment capital expenditures:
|
|
|
|
|
|
|
|
|
|||||||
|
All Other operating segment
|
90
|
|
—
|
|
—
|
|
90
|
|
|||||||
|
Cost centers
|
65
|
|
—
|
|
—
|
|
65
|
|
|||||||
|
Timing
|
(81
|
)
|
—
|
|
—
|
|
(81
|
)
|
|||||||
|
Other
|
(91
|
)
|
57
|
|
(29
|
)
|
(63
|
)
|
|||||||
|
Total capital expenditures
|
$
|
681
|
|
$
|
514
|
|
$
|
(29
|
)
|
$
|
1,166
|
|
|||
|
Reconciliations of Capital expenditures:
|
|
|
|
|
|||||||||||
|
(Millions of dollars)
|
Machinery
and Power
Systems
|
Financial
Products
|
Consolidating
Adjustments
|
Consolidated
Total
|
|||||||||||
|
Six Months Ended June 30, 2013
|
|
|
|
|
|
|
|
|
|||||||
|
Total capital expenditures from reportable segments
|
$
|
777
|
|
$
|
771
|
|
$
|
—
|
|
$
|
1,548
|
|
|||
|
Items not included in segment capital expenditures:
|
|
|
|
|
|||||||||||
|
All Other operating segment
|
112
|
|
—
|
|
—
|
|
112
|
|
|||||||
|
Cost centers
|
74
|
|
—
|
|
—
|
|
74
|
|
|||||||
|
Timing
|
526
|
|
—
|
|
—
|
|
526
|
|
|||||||
|
Other
|
(76
|
)
|
48
|
|
(35
|
)
|
(63
|
)
|
|||||||
|
Total capital expenditures
|
$
|
1,413
|
|
$
|
819
|
|
$
|
(35
|
)
|
$
|
2,197
|
|
|||
|
Six Months Ended June 30, 2012
|
|
|
|
|
|
|
|
|
|||||||
|
Total capital expenditures from reportable segments
|
$
|
1,090
|
|
$
|
800
|
|
$
|
—
|
|
$
|
1,890
|
|
|||
|
Items not included in segment capital expenditures:
|
|
|
|
|
|||||||||||
|
All Other operating segment
|
154
|
|
—
|
|
—
|
|
154
|
|
|||||||
|
Cost centers
|
103
|
|
—
|
|
—
|
|
103
|
|
|||||||
|
Timing
|
321
|
|
—
|
|
—
|
|
321
|
|
|||||||
|
Other
|
(123
|
)
|
74
|
|
(124
|
)
|
(173
|
)
|
|||||||
|
Total capital expenditures
|
$
|
1,545
|
|
$
|
874
|
|
$
|
(124
|
)
|
$
|
2,295
|
|
|||
39
16.
Cat Financial Financing Activities
Credit quality of financing receivables and allowance for credit losses
Cat Financial applies a systematic methodology to determine the allowance for credit losses for finance receivables. Based upon Cat Financial’s analysis of credit losses and risk factors, portfolio segments are as follows:
|
•
|
Customer – Finance receivables with retail customers.
|
|
•
|
Dealer – Finance receivables with Caterpillar dealers.
|
Cat Financial further evaluates portfolio segments by the class of finance receivables, which is defined as a level of information (below a portfolio segment) in which the finance receivables have the same initial measurement attribute and a similar method for assessing and monitoring credit risk. Typically, Cat Financial’s finance receivables within a geographic area have similar credit risk profiles and methods for assessing and monitoring credit risk. Cat Financial’s classes, which align with management reporting for credit losses, are as follows:
|
•
|
North America – Finance receivables originated in the United States or Canada.
|
|
•
|
Europe – Finance receivables originated in Europe, Africa, Middle East and the Commonwealth of Independent States.
|
|
•
|
Asia Pacific – Finance receivables originated in Australia, New Zealand, China, Japan, South Korea and Southeast Asia.
|
|
•
|
Mining – Finance receivables related to large mining customers worldwide.
|
|
•
|
Latin America – Finance receivables originated in Central and South American countries and Mexico.
|
|
•
|
Caterpillar Power Finance – Finance receivables related to marine vessels with Caterpillar engines worldwide and Caterpillar electrical power generation, gas compression and co-generation systems and non-Caterpillar equipment that is powered by these systems worldwide.
|
Impaired loans and finance leases
For all classes, a loan or finance lease is considered impaired, based on current information and events, if it is probable that Cat Financial will be unable to collect all amounts due according to the contractual terms of the loan or finance lease. Loans and finance leases reviewed for impairment include loans and finance leases that are past due, non-performing or in bankruptcy. Recognition of income is suspended and the loan or finance lease is placed on non-accrual status when management determines that collection of future income is not probable (generally after
120 days
past due except in locations where local regulatory requirements dictate a different method, or in instances in which relevant information is known that warrants placing the loan or finance lease on non-accrual status). Accrual is resumed, and previously suspended income is recognized, when the loan or finance lease becomes contractually current and/or collection doubts are removed. Cash receipts on impaired loans or finance leases are recorded against the receivable and then to any unrecognized income.
During the second quarter of 2013, Cat Financial changed the classification of certain loans and finance leases previously reported as impaired. While these loans and finance leases had been incorrectly reported as impaired, the related allowance for these loans and finance leases was appropriately measured; therefore, this change had no impact on the allowance for credit losses. The impact of incorrectly reporting these loans and finance leases as impaired was not considered material to previously issued financial statements; however, prior period impaired loan and finance lease balances have been revised throughout Notes 16 and 18.
There were
no
impaired loans or finance leases as of
June 30, 2013
or
December 31, 2012
, for the Dealer portfolio segment. The average recorded investment for impaired loans and finance leases for the Dealer portfolio segment was
zero
for the
three and six
months ended
June 30, 2013
and
2012
.
Individually impaired loans and finance leases for the Customer portfolio segment were as follows:
40
|
June 30, 2013
|
December 31, 2012
|
||||||||||||||||||||||
|
(Millions of dollars)
|
Recorded
Investment
|
Unpaid
Principal
Balance
|
Related
Allowance
|
Recorded
Investment
|
Unpaid
Principal
Balance
|
Related
Allowance
|
|||||||||||||||||
|
Impaired Loans and Finance Leases With No Allowance Recorded
|
|
|
|
|
|
|
|
|
|
|
|
|
|||||||||||
|
Customer
|
|
|
|
|
|
|
|
|
|
|
|
|
|||||||||||
|
North America
|
$
|
27
|
|
$
|
25
|
|
$
|
—
|
|
$
|
28
|
|
$
|
27
|
|
$
|
—
|
|
|||||
|
Europe
|
48
|
|
48
|
|
—
|
|
45
|
|
45
|
|
—
|
|
|||||||||||
|
Asia Pacific
|
5
|
|
4
|
|
—
|
|
2
|
|
2
|
|
—
|
|
|||||||||||
|
Mining
|
1
|
|
1
|
|
—
|
|
1
|
|
1
|
|
—
|
|
|||||||||||
|
Latin America
|
10
|
|
10
|
|
—
|
|
7
|
|
7
|
|
—
|
|
|||||||||||
|
Caterpillar Power Finance
|
270
|
|
270
|
|
—
|
|
295
|
|
295
|
|
—
|
|
|||||||||||
|
Total
|
$
|
361
|
|
$
|
358
|
|
$
|
—
|
|
$
|
378
|
|
$
|
377
|
|
$
|
—
|
|
|||||
|
Impaired Loans and Finance Leases With An Allowance Recorded
|
|
|
|
|
|
|
|
|
|
|
|
|
|||||||||||
|
Customer
|
|
|
|
|
|
|
|
|
|
|
|
|
|||||||||||
|
North America
|
$
|
11
|
|
$
|
8
|
|
$
|
3
|
|
$
|
25
|
|
$
|
23
|
|
$
|
7
|
|
|||||
|
Europe
|
22
|
|
18
|
|
8
|
|
28
|
|
26
|
|
11
|
|
|||||||||||
|
Asia Pacific
|
14
|
|
14
|
|
3
|
|
19
|
|
19
|
|
4
|
|
|||||||||||
|
Mining
|
—
|
|
—
|
|
—
|
|
—
|
|
—
|
|
—
|
|
|||||||||||
|
Latin America
|
35
|
|
36
|
|
15
|
|
30
|
|
30
|
|
8
|
|
|||||||||||
|
Caterpillar Power Finance
|
166
|
|
162
|
|
48
|
|
113
|
|
109
|
|
24
|
|
|||||||||||
|
Total
|
$
|
248
|
|
$
|
238
|
|
$
|
77
|
|
$
|
215
|
|
$
|
207
|
|
$
|
54
|
|
|||||
|
Total Impaired Loans and Finance Leases
|
|
|
|
|
|
|
|
|
|
|
|
|
|||||||||||
|
Customer
|
|
|
|
|
|
|
|
|
|
|
|
|
|||||||||||
|
North America
|
$
|
38
|
|
$
|
33
|
|
$
|
3
|
|
$
|
53
|
|
$
|
50
|
|
|
$
|
7
|
|
||||
|
Europe
|
70
|
|
66
|
|
8
|
|
73
|
|
71
|
|
|
11
|
|
||||||||||
|
Asia Pacific
|
19
|
|
18
|
|
3
|
|
21
|
|
21
|
|
|
4
|
|
||||||||||
|
Mining
|
1
|
|
1
|
|
—
|
|
1
|
|
1
|
|
—
|
|
|||||||||||
|
Latin America
|
45
|
|
46
|
|
15
|
|
37
|
|
37
|
|
|
8
|
|
||||||||||
|
Caterpillar Power Finance
|
436
|
|
432
|
|
48
|
|
408
|
|
404
|
|
|
24
|
|
||||||||||
|
Total
|
$
|
609
|
|
$
|
596
|
|
$
|
77
|
|
$
|
593
|
|
$
|
584
|
|
$
|
54
|
|
|||||
41
|
|
Three Months Ended June 30, 2013
|
Three Months Ended June 30, 2012
|
|||||||||||||
|
(Millions of dollars)
|
Average Recorded
Investment
|
Interest Income
Recognized
|
Average Recorded
Investment
|
Interest Income
Recognized
|
|||||||||||
|
Impaired Loans and Finance Leases With No Allowance Recorded
|
|
|
|
|
|
|
|
|
|||||||
|
Customer
|
|
|
|
|
|
|
|
|
|||||||
|
North America
|
$
|
28
|
|
$
|
2
|
|
$
|
57
|
|
$
|
—
|
|
|||
|
Europe
|
45
|
|
—
|
|
45
|
|
—
|
|
|||||||
|
Asia Pacific
|
5
|
|
—
|
|
3
|
|
—
|
|
|||||||
|
Mining
|
4
|
|
—
|
|
8
|
|
—
|
|
|||||||
|
Latin America
|
9
|
|
—
|
|
5
|
|
—
|
|
|||||||
|
Caterpillar Power Finance
|
287
|
|
1
|
|
203
|
|
1
|
|
|||||||
|
Total
|
$
|
378
|
|
$
|
3
|
|
$
|
321
|
|
$
|
1
|
|
|||
|
Impaired Loans and Finance Leases With An Allowance Recorded
|
|
|
|
|
|
|
|
|
|||||||
|
Customer
|
|
|
|
|
|
|
|
|
|||||||
|
North America
|
$
|
17
|
|
$
|
—
|
|
$
|
26
|
|
$
|
—
|
|
|||
|
Europe
|
21
|
|
—
|
|
23
|
|
—
|
|
|||||||
|
Asia Pacific
|
16
|
|
—
|
|
14
|
|
—
|
|
|||||||
|
Mining
|
2
|
|
—
|
|
—
|
|
—
|
|
|||||||
|
Latin America
|
41
|
|
—
|
|
17
|
|
—
|
|
|||||||
|
Caterpillar Power Finance
|
151
|
|
—
|
|
79
|
|
—
|
|
|||||||
|
Total
|
$
|
248
|
|
$
|
—
|
|
$
|
159
|
|
$
|
—
|
|
|||
|
Total Impaired Loans and Finance Leases
|
|
|
|
|
|
|
|
|
|||||||
|
Customer
|
|
|
|
|
|
|
|
|
|||||||
|
North America
|
$
|
45
|
|
$
|
2
|
|
$
|
83
|
|
$
|
—
|
|
|||
|
Europe
|
66
|
|
—
|
|
68
|
|
—
|
|
|||||||
|
Asia Pacific
|
21
|
|
—
|
|
17
|
|
—
|
|
|||||||
|
Mining
|
6
|
|
—
|
|
8
|
|
—
|
|
|||||||
|
Latin America
|
50
|
|
—
|
|
22
|
|
—
|
|
|||||||
|
Caterpillar Power Finance
|
438
|
|
1
|
|
282
|
|
1
|
|
|||||||
|
Total
|
$
|
626
|
|
$
|
3
|
|
$
|
480
|
|
$
|
1
|
|
|||
|
|
|||||||||||||||
42
|
|
Six Months Ended June 30, 2013
|
Six Months Ended June 30, 2012
|
|||||||||||||
|
(Millions of dollars)
|
Average Recorded
Investment
|
Interest Income
Recognized
|
Average Recorded
Investment
|
Interest Income
Recognized
|
|||||||||||
|
Impaired Loans and Finance Leases With No Allowance Recorded
|
|
|
|
|
|
|
|
|
|||||||
|
Customer
|
|
|
|
|
|
|
|
|
|||||||
|
North America
|
$
|
28
|
|
$
|
3
|
|
$
|
63
|
|
$
|
1
|
|
|||
|
Europe
|
45
|
|
—
|
|
45
|
|
—
|
|
|||||||
|
Asia Pacific
|
5
|
|
—
|
|
3
|
|
—
|
|
|||||||
|
Mining
|
3
|
|
—
|
|
8
|
|
—
|
|
|||||||
|
Latin America
|
9
|
|
—
|
|
6
|
|
—
|
|
|||||||
|
Caterpillar Power Finance
|
286
|
|
1
|
|
191
|
|
2
|
|
|||||||
|
Total
|
$
|
376
|
|
$
|
4
|
|
$
|
316
|
|
$
|
3
|
|
|||
|
Impaired Loans and Finance Leases With An Allowance Recorded
|
|
|
|
|
|
|
|
|
|||||||
|
Customer
|
|
|
|
|
|
|
|
|
|||||||
|
North America
|
$
|
20
|
|
$
|
—
|
|
$
|
26
|
|
$
|
—
|
|
|||
|
Europe
|
24
|
|
1
|
|
24
|
|
—
|
|
|||||||
|
Asia Pacific
|
17
|
|
1
|
|
13
|
|
1
|
|
|||||||
|
Mining
|
1
|
|
—
|
|
—
|
|
—
|
|
|||||||
|
Latin America
|
38
|
|
1
|
|
18
|
|
—
|
|
|||||||
|
Caterpillar Power Finance
|
139
|
|
—
|
|
80
|
|
—
|
|
|||||||
|
Total
|
$
|
239
|
|
$
|
3
|
|
$
|
161
|
|
$
|
1
|
|
|||
|
Total Impaired Loans and Finance Leases
|
|
|
|
|
|
|
|
|
|||||||
|
Customer
|
|
|
|
|
|
|
|
|
|||||||
|
North America
|
$
|
48
|
|
$
|
3
|
|
$
|
89
|
|
$
|
1
|
|
|||
|
Europe
|
69
|
|
1
|
|
69
|
|
—
|
|
|||||||
|
Asia Pacific
|
22
|
|
1
|
|
16
|
|
1
|
|
|||||||
|
Mining
|
4
|
|
—
|
|
8
|
|
—
|
|
|||||||
|
Latin America
|
47
|
|
1
|
|
24
|
|
—
|
|
|||||||
|
Caterpillar Power Finance
|
425
|
|
1
|
|
271
|
|
2
|
|
|||||||
|
Total
|
$
|
615
|
|
$
|
7
|
|
$
|
477
|
|
$
|
4
|
|
|||
Non-accrual and past due loans and finance leases
For all classes, Cat Financial considers a loan or finance lease past due if any portion of a contractual payment is due and unpaid for more than
30 days
. Recognition of income is suspended and the loan or finance lease is placed on non-accrual status when management determines that collection of future income is not probable (generally after
120 days
past due except in locations where local regulatory requirements dictate a different method, or in instances in which relevant information is known that warrants placing the loan or finance lease on non-accrual status). Accrual is resumed, and previously suspended income is recognized, when the loan or finance lease becomes contractually current and/or collection doubts are removed.
As of
June 30, 2013
and
December 31, 2012
, there were
no
loans or finance leases on non-accrual status for the Dealer portfolio segment.
The investment in customer loans and finance leases on non-accrual status was as follows:
43
|
(Millions of dollars)
|
|
|
|||||
|
|
June 30, 2013
|
December 31, 2012
|
|||||
|
Customer
|
|
|
|
|
|||
|
North America
|
$
|
37
|
|
$
|
59
|
|
|
|
Europe
|
38
|
|
38
|
|
|||
|
Asia Pacific
|
45
|
|
36
|
|
|||
|
Mining
|
12
|
|
12
|
|
|||
|
Latin America
|
197
|
|
148
|
|
|||
|
Caterpillar Power Finance
|
182
|
|
220
|
|
|||
|
Total
|
$
|
511
|
|
$
|
513
|
|
|
Aging related to loans and finance leases was as follows:
|
(Millions of dollars)
|
|
|
|
|
|
|
|
||||||||||||||||||||
|
|
June 30, 2013
|
||||||||||||||||||||||||||
|
|
31-60
Days
Past Due
|
61-90
Days
Past Due
|
91+
Days
Past Due
|
Total Past
Due
|
Current
|
Total
Finance
Receivables
|
91+ Still
Accruing
|
||||||||||||||||||||
|
Customer
|
|
|
|
|
|
|
|
|
|
|
|
|
|
|
|||||||||||||
|
North America
|
$
|
26
|
|
$
|
6
|
|
$
|
29
|
|
$
|
61
|
|
$
|
6,059
|
|
$
|
6,120
|
|
$
|
1
|
|
||||||
|
Europe
|
32
|
|
13
|
|
39
|
|
84
|
|
2,553
|
|
2,637
|
|
12
|
|
|||||||||||||
|
Asia Pacific
|
79
|
|
29
|
|
59
|
|
167
|
|
2,868
|
|
3,035
|
|
14
|
|
|||||||||||||
|
Mining
|
3
|
|
—
|
|
12
|
|
15
|
|
2,183
|
|
2,198
|
|
—
|
|
|||||||||||||
|
Latin America
|
66
|
|
33
|
|
173
|
|
272
|
|
2,459
|
|
2,731
|
|
—
|
|
|||||||||||||
|
Caterpillar Power Finance
|
10
|
|
40
|
|
109
|
|
159
|
|
3,030
|
|
3,189
|
|
18
|
|
|||||||||||||
|
Dealer
|
|
|
|
|
|
|
|
|
|
|
|
|
|
|
|||||||||||||
|
North America
|
—
|
|
—
|
|
—
|
|
—
|
|
2,147
|
|
2,147
|
|
—
|
|
|||||||||||||
|
Europe
|
—
|
|
—
|
|
—
|
|
—
|
|
169
|
|
169
|
|
—
|
|
|||||||||||||
|
Asia Pacific
|
1
|
|
—
|
|
—
|
|
1
|
|
566
|
|
567
|
|
—
|
|
|||||||||||||
|
Mining
|
—
|
|
—
|
|
—
|
|
—
|
|
1
|
|
1
|
|
—
|
|
|||||||||||||
|
Latin America
|
—
|
|
—
|
|
—
|
|
—
|
|
806
|
|
806
|
|
—
|
|
|||||||||||||
|
Caterpillar Power Finance
|
—
|
|
—
|
|
—
|
|
—
|
|
1
|
|
1
|
|
—
|
|
|||||||||||||
|
Total
|
$
|
217
|
|
$
|
121
|
|
$
|
421
|
|
$
|
759
|
|
$
|
22,842
|
|
$
|
23,601
|
|
$
|
45
|
|
||||||
|
(Millions of dollars)
|
|
|
|
|
|
|
|
||||||||||||||||||||
|
|
December 31, 2012
|
||||||||||||||||||||||||||
|
|
31-60
Days
Past Due
|
61-90
Days
Past Due
|
91+
Days
Past Due
|
Total Past
Due
|
Current
|
Total
Finance
Receivables
|
91+ Still
Accruing
|
||||||||||||||||||||
|
Customer
|
|
|
|
|
|
|
|
|
|
|
|
|
|
|
|||||||||||||
|
North America
|
$
|
35
|
|
$
|
8
|
|
$
|
52
|
|
$
|
95
|
|
$
|
5,872
|
|
$
|
5,967
|
|
$
|
—
|
|
||||||
|
Europe
|
23
|
|
9
|
|
36
|
|
68
|
|
2,487
|
|
2,555
|
|
6
|
|
|||||||||||||
|
Asia Pacific
|
53
|
|
19
|
|
54
|
|
126
|
|
2,912
|
|
3,038
|
|
18
|
|
|||||||||||||
|
Mining
|
—
|
|
1
|
|
12
|
|
13
|
|
1,960
|
|
1,973
|
|
—
|
|
|||||||||||||
|
Latin America
|
62
|
|
19
|
|
138
|
|
219
|
|
2,500
|
|
2,719
|
|
—
|
|
|||||||||||||
|
Caterpillar Power Finance
|
15
|
|
14
|
|
126
|
|
155
|
|
3,017
|
|
3,172
|
|
4
|
|
|||||||||||||
|
Dealer
|
|
|
|
|
|
|
|
|
|
|
|
|
|
|
|||||||||||||
|
North America
|
—
|
|
—
|
|
—
|
|
—
|
|
2,063
|
|
2,063
|
|
—
|
|
|||||||||||||
|
Europe
|
—
|
|
—
|
|
—
|
|
—
|
|
185
|
|
185
|
|
—
|
|
|||||||||||||
|
Asia Pacific
|
—
|
|
—
|
|
—
|
|
—
|
|
751
|
|
751
|
|
—
|
|
|||||||||||||
|
Mining
|
—
|
|
—
|
|
—
|
|
—
|
|
1
|
|
1
|
|
—
|
|
|||||||||||||
|
Latin America
|
—
|
|
—
|
|
—
|
|
—
|
|
884
|
|
884
|
|
—
|
|
|||||||||||||
|
Total
|
$
|
188
|
|
$
|
70
|
|
$
|
418
|
|
$
|
676
|
|
$
|
22,632
|
|
$
|
23,308
|
|
$
|
28
|
|
||||||
44
Allowance for credit loss activity
In estimating the allowance for credit losses, Cat Financial reviews loans and finance leases that are past due, non-performing or in bankruptcy. An analysis of the allowance for credit losses was as follows:
|
(Millions of dollars)
|
|
|
|
||||||||
|
|
June 30, 2013
|
||||||||||
|
Allowance for Credit Losses:
|
Customer
|
Dealer
|
Total
|
||||||||
|
Balance at beginning of year
|
$
|
414
|
|
$
|
9
|
|
$
|
423
|
|
||
|
Receivables written off
|
(64
|
)
|
—
|
|
(64
|
)
|
|||||
|
Recoveries on receivables previously written off
|
27
|
|
—
|
|
27
|
|
|||||
|
Provision for credit losses
|
39
|
|
1
|
|
40
|
|
|||||
|
Other
|
(7
|
)
|
—
|
|
(7
|
)
|
|||||
|
Balance at end of period
|
$
|
409
|
|
$
|
10
|
|
$
|
419
|
|
||
|
|
|
|
|
|
|
||||||
|
Individually evaluated for impairment
|
$
|
77
|
|
$
|
—
|
|
$
|
77
|
|
||
|
Collectively evaluated for impairment
|
332
|
|
10
|
|
342
|
|
|||||
|
Ending Balance
|
$
|
409
|
|
$
|
10
|
|
$
|
419
|
|
||
|
Recorded Investment in Finance Receivables:
|
|
|
|
|
|
|
|||||
|
Individually evaluated for impairment
|
$
|
609
|
|
$
|
—
|
|
$
|
609
|
|
||
|
Collectively evaluated for impairment
|
19,301
|
|
3,691
|
|
22,992
|
|
|||||
|
Ending Balance
|
$
|
19,910
|
|
$
|
3,691
|
|
$
|
23,601
|
|
||
|
(Millions of dollars)
|
|
|
|
||||||||
|
|
December 31, 2012
|
||||||||||
|
Allowance for Credit Losses:
|
Customer
|
Dealer
|
Total
|
||||||||
|
Balance at beginning of year
|
$
|
360
|
|
$
|
6
|
|
$
|
366
|
|
||
|
Receivables written off
|
(149
|
)
|
—
|
|
(149
|
)
|
|||||
|
Recoveries on receivables previously written off
|
47
|
|
—
|
|
47
|
|
|||||
|
Provision for credit losses
|
157
|
|
3
|
|
160
|
|
|||||
|
Other
|
(1
|
)
|
—
|
|
(1
|
)
|
|||||
|
Balance at end of year
|
$
|
414
|
|
$
|
9
|
|
$
|
423
|
|
||
|
Individually evaluated for impairment
|
$
|
54
|
|
$
|
—
|
|
$
|
54
|
|
||
|
Collectively evaluated for impairment
|
360
|
|
9
|
|
369
|
|
|||||
|
Ending Balance
|
$
|
414
|
|
$
|
9
|
|
$
|
423
|
|
||
|
Recorded Investment in Finance Receivables:
|
|
|
|
|
|
|
|||||
|
Individually evaluated for impairment
|
$
|
593
|
|
$
|
—
|
|
$
|
593
|
|
||
|
Collectively evaluated for impairment
|
18,831
|
|
3,884
|
|
22,715
|
|
|||||
|
Ending Balance
|
$
|
19,424
|
|
$
|
3,884
|
|
$
|
23,308
|
|
||
Credit quality of finance receivables
The credit quality of finance receivables is reviewed on a monthly basis. Credit quality indicators include performing and non-performing. Non-performing is defined as finance receivables currently over
120 days
past due and/or on non-accrual status or in bankruptcy. Finance receivables not meeting the criteria listed above are considered performing. Non-performing receivables have the highest probability for credit loss. The allowance for credit losses attributable to non-performing receivables is based on the most probable source of repayment, which is normally the liquidation of collateral. In determining collateral value, Cat Financial estimates the current fair market value of the collateral. In addition, Cat Financial considers credit enhancements such as additional collateral and contractual third-party guarantees in determining the allowance for credit losses attributable to non-performing receivables.
The recorded investment in performing and non-performing finance receivables was as follows:
45
|
(Millions of dollars)
|
|||||||||||||||||||||||
|
|
June 30, 2013
|
December 31, 2012
|
|||||||||||||||||||||
|
|
Customer
|
Dealer
|
Total
|
Customer
|
Dealer
|
Total
|
|||||||||||||||||
|
Performing
|
|
|
|
|
|
|
|
|
|
|
|
|
|||||||||||
|
North America
|
$
|
6,083
|
|
$
|
2,147
|
|
$
|
8,230
|
|
$
|
5,908
|
|
$
|
2,063
|
|
$
|
7,971
|
|
|||||
|
Europe
|
2,599
|
|
169
|
|
2,768
|
|
2,517
|
|
185
|
|
2,702
|
|
|||||||||||
|
Asia Pacific
|
2,990
|
|
567
|
|
3,557
|
|
3,002
|
|
751
|
|
3,753
|
|
|||||||||||
|
Mining
|
2,186
|
|
1
|
|
2,187
|
|
1,961
|
|
1
|
|
1,962
|
|
|||||||||||
|
Latin America
|
2,534
|
|
806
|
|
3,340
|
|
2,571
|
|
884
|
|
3,455
|
|
|||||||||||
|
Caterpillar Power Finance
|
3,007
|
|
1
|
|
3,008
|
|
2,952
|
|
—
|
|
2,952
|
|
|||||||||||
|
Total Performing
|
$
|
19,399
|
|
$
|
3,691
|
|
$
|
23,090
|
|
$
|
18,911
|
|
$
|
3,884
|
|
$
|
22,795
|
|
|||||
|
Non-Performing
|
|
|
|
|
|
|
|
|
|
|
|
|
|||||||||||
|
North America
|
$
|
37
|
|
$
|
—
|
|
$
|
37
|
|
$
|
59
|
|
$
|
—
|
|
$
|
59
|
|
|||||
|
Europe
|
38
|
|
—
|
|
38
|
|
38
|
|
—
|
|
38
|
|
|||||||||||
|
Asia Pacific
|
45
|
|
—
|
|
45
|
|
36
|
|
—
|
|
36
|
|
|||||||||||
|
Mining
|
12
|
|
—
|
|
12
|
|
12
|
|
—
|
|
12
|
|
|||||||||||
|
Latin America
|
197
|
|
—
|
|
197
|
|
148
|
|
—
|
|
148
|
|
|||||||||||
|
Caterpillar Power Finance
|
182
|
|
—
|
|
182
|
|
220
|
|
—
|
|
220
|
|
|||||||||||
|
Total Non-Performing
|
$
|
511
|
|
$
|
—
|
|
$
|
511
|
|
$
|
513
|
|
$
|
—
|
|
$
|
513
|
|
|||||
|
Performing & Non-Performing
|
|
|
|
|
|
|
|
|
|
|
|
|
|||||||||||
|
North America
|
$
|
6,120
|
|
$
|
2,147
|
|
$
|
8,267
|
|
$
|
5,967
|
|
$
|
2,063
|
|
$
|
8,030
|
|
|||||
|
Europe
|
2,637
|
|
169
|
|
2,806
|
|
2,555
|
|
185
|
|
2,740
|
|
|||||||||||
|
Asia Pacific
|
3,035
|
|
567
|
|
3,602
|
|
3,038
|
|
751
|
|
3,789
|
|
|||||||||||
|
Mining
|
2,198
|
|
1
|
|
2,199
|
|
1,973
|
|
1
|
|
1,974
|
|
|||||||||||
|
Latin America
|
2,731
|
|
806
|
|
3,537
|
|
2,719
|
|
884
|
|
3,603
|
|
|||||||||||
|
Caterpillar Power Finance
|
3,189
|
|
1
|
|
3,190
|
|
3,172
|
|
—
|
|
3,172
|
|
|||||||||||
|
Total
|
$
|
19,910
|
|
$
|
3,691
|
|
$
|
23,601
|
|
$
|
19,424
|
|
$
|
3,884
|
|
$
|
23,308
|
|
|||||
Troubled Debt Restructurings
A restructuring of a loan or finance lease receivable constitutes a troubled debt restructuring (TDR) when the lender grants a concession it would not otherwise consider to a borrower experiencing financial difficulties. Concessions granted may include extended contract maturities, inclusion of interest only periods, below market interest rates, and extended skip payment periods.
TDRs are reviewed along with other receivables as part of management’s ongoing evaluation of the adequacy of the allowance for credit losses. The allowance for credit losses attributable to TDRs is based on the most probable source of repayment, which is normally the liquidation of collateral. In determining collateral value, Cat Financial estimates the current fair market value of the collateral. In addition, Cat Financial factors in credit enhancements such as additional collateral and contractual third-party guarantees in determining the allowance for credit losses attributable to TDRs.
There were
no
loans or finance lease receivables modified as TDRs during the
three and six
months ended
June 30, 2013
or
2012
for the Dealer portfolio segment.
Loan and finance lease receivables in the Customer portfolio segment modified as TDRs during the
three and six
months ended
June 30, 2013
and
2012
, were as follows:
46
|
(Dollars in millions)
|
|
|
|
|||||||||||||||||||||||||
|
|
Three Months Ended June 30, 2013
|
Three Months Ended June 30, 2012
|
||||||||||||||||||||||||||
|
|
Number
of
Contracts
|
Pre-TDR
Outstanding
Recorded
Investment
|
Post-TDR
Outstanding
Recorded
Investment
|
Number
of
Contracts
|
Pre-TDR
Outstanding
Recorded
Investment
|
Post-TDR
Outstanding
Recorded
Investment
|
||||||||||||||||||||||
|
Customer
|
|
|
|
|
|
|
|
|
|
|
||||||||||||||||||
|
North America
|
22
|
|
$
|
2
|
|
$
|
3
|
|
18
|
|
$
|
2
|
|
$
|
2
|
|
||||||||||||
|
Europe
|
8
|
|
1
|
|
1
|
|
—
|
|
—
|
|
—
|
|
||||||||||||||||
|
Latin America
|
6
|
|
1
|
|
1
|
|
—
|
|
—
|
|
—
|
|
||||||||||||||||
|
Total
2
|
36
|
|
$
|
4
|
|
$
|
5
|
|
18
|
|
$
|
2
|
|
$
|
2
|
|
||||||||||||
|
|
Six Months Ended June 30, 2013
|
Six Months Ended June 30, 2012
|
||||||||||||||||||||||||||
|
|
Number
of
Contracts
|
Pre-TDR
Outstanding
Recorded
Investment
|
Post-TDR
Outstanding
Recorded
Investment
|
Number
of
Contracts
|
Pre-TDR
Outstanding
Recorded
Investment
|
Post-TDR
Outstanding
Recorded
Investment
|
||||||||||||||||||||||
|
Customer
|
|
|
|
|
|
|
|
|
|
|
||||||||||||||||||
|
North America
|
32
|
|
$
|
4
|
|
$
|
5
|
|
41
|
|
$
|
4
|
|
$
|
4
|
|
||||||||||||
|
Europe
|
8
|
|
1
|
|
1
|
|
7
|
|
7
|
|
7
|
|
||||||||||||||||
|
Latin America
|
6
|
|
1
|
|
1
|
|
—
|
|
—
|
|
—
|
|
||||||||||||||||
|
Caterpillar Power Finance
1
|
4
|
|
36
|
|
37
|
|
5
|
|
32
|
|
32
|
|
||||||||||||||||
|
Total
2
|
50
|
|
$
|
42
|
|
$
|
44
|
|
53
|
|
$
|
43
|
|
$
|
43
|
|
||||||||||||
|
1
|
During the
three and six
months ended
June 30, 2013
,
$7 million
and
$12 million
, respectively, of additional funds were subsequently loaned to a borrower whose terms had been modified in a TDR. The
$7 million
and
$12 million
of additional funds are not reflected in the table above as no incremental modifications have been made with the borrower during the period presented. At
June 30, 2013
, remaining commitments to lend additional funds to a borrower whose terms have been modified in a TDR were
$19 million
.
|
|
2
|
Modifications include extended contract maturities, inclusion of interest only periods, below market interest rates, and extended skip payment periods.
|
TDRs in the Customer portfolio segment with a payment default during the
three and six
months ended
June 30, 2013
and
2012
, which had been modified within twelve months prior to the default date, were as follows:
|
(Dollars in millions)
|
Three Months Ended June 30, 2013
|
Three Months Ended June 30, 2012
|
|||||||||||
|
|
Number of
Contracts
|
Post-TDR
Recorded
Investment
|
Number of
Contracts
|
Post-TDR
Recorded
Investment
|
|||||||||
|
Customer
|
|
|
|
|
|||||||||
|
North America
|
5
|
|
$
|
1
|
|
14
|
|
$
|
1
|
|
|||
|
Caterpillar Power Finance
|
—
|
|
—
|
|
2
|
|
2
|
|
|||||
|
Total
|
5
|
|
$
|
1
|
|
16
|
|
$
|
3
|
|
|||
|
Six Months Ended June 30, 2013
|
Six Months Ended June 30, 2012
|
||||||||||||
|
|
Number of
Contracts
|
Post-TDR
Recorded
Investment
|
Number of
Contracts
|
Post-TDR
Recorded
Investment
|
|||||||||
|
Customer
|
|
|
|
|
|||||||||
|
North America
|
13
|
|
$
|
3
|
|
25
|
|
$
|
2
|
|
|||
|
Caterpillar Power Finance
|
2
|
|
3
|
|
16
|
|
21
|
|
|||||
|
Total
|
15
|
|
$
|
6
|
|
41
|
|
$
|
23
|
|
|||
47
17.
Redeemable Noncontrolling Interest – Caterpillar Japan Ltd.
On
August 1, 2008
, Shin Caterpillar Mitsubishi Ltd. (SCM) completed the first phase of a share redemption plan whereby SCM redeemed half of Mitsubishi Heavy Industries' (MHI’s) shares in SCM. This resulted in Caterpillar owning
67 percent
of the outstanding shares of SCM and MHI owning the remaining
33 percent
. As part of the share redemption, SCM was renamed Caterpillar Japan Ltd. (Cat Japan) and we consolidated its financial statements. On
April 2, 2012
, we redeemed the remaining
33 percent
interest at its carrying amount, resulting in Caterpillar becoming the sole owner of Cat Japan. Caterpillar paid
$444 million
(
36.5 billion
Japanese Yen) to acquire the remaining equity interest held in Cat Japan by MHI.
18.
Fair Value Measurements
A.
Fair value measurements
The guidance on fair value measurements defines fair value as the exchange price that would be received for an asset or paid to transfer a liability (an exit price) in the principal or most advantageous market for the asset or liability in an orderly transaction between market participants. This guidance also specifies a fair value hierarchy based upon the observability of inputs used in valuation techniques. Observable inputs (highest level) reflect market data obtained from independent sources, while unobservable inputs (lowest level) reflect internally developed market assumptions. In accordance with this guidance, fair value measurements are classified under the following hierarchy:
|
•
|
Level 1
–
Quoted prices for identical instruments in active markets.
|
|
•
|
Level 2
– Quoted prices for similar instruments in active markets; quoted prices for identical or similar instruments in markets that are not active; and model-derived valuations in which all significant inputs or significant value-drivers are observable in active markets.
|
|
•
|
Level 3
– Model-derived valuations in which one or more significant inputs or significant value-drivers are unobservable.
|
When available, we use quoted market prices to determine fair value, and we classify such measurements within Level 1. In some cases where market prices are not available, we make use of observable market based inputs to calculate fair value, in which case the measurements are classified within Level 2. If quoted or observable market prices are not available, fair value is based upon internally developed models that use, where possible, current market-based parameters such as interest rates, yield curves and currency rates. These measurements are classified within Level 3.
Fair value measurements are classified according to the lowest level input or value-driver that is significant to the valuation. A measurement may therefore be classified within Level 3 even though there may be significant inputs that are readily observable.
Fair value measurement includes the consideration of nonperformance risk. Nonperformance risk refers to the risk that an obligation (either by a counterparty or Caterpillar) will not be fulfilled. For financial assets traded in an active market (Level 1 and certain Level 2), the nonperformance risk is included in the market price. For certain other financial assets and liabilities (certain Level 2 and Level 3), our fair value calculations have been adjusted accordingly.
Available-for-sale securities
Our available-for-sale securities, primarily at Cat Insurance, include a mix of equity and debt instruments (see Note 8 for additional information). Fair values for our U.S. treasury bonds and equity securities are based upon valuations for identical instruments in active markets. Fair values for other government bonds, corporate bonds and mortgage-backed debt securities are based upon models that take into consideration such market-based factors as recent sales, risk-free yield curves and prices of similarly rated bonds.
Derivative financial instruments
The fair value of interest rate swap derivatives is primarily based on models that utilize the appropriate market-based forward swap curves and zero-coupon interest rates to determine discounted cash flows. The fair value of foreign currency and commodity forward, option and cross currency contracts is based on a valuation model that discounts cash flows resulting from the differential between the contract price and the market-based forward rate.
48
Guarantees
The fair value of guarantees is based upon our estimate of the premium a market participant would require to issue the same guarantee in a stand-alone arms-length transaction with an unrelated party. If quoted or observable market prices are not available, fair value is based upon internally developed models that utilize current market-based assumptions.
Assets and liabilities measured on a recurring basis at fair value, primarily related to Financial Products, included in our Consolidated Statement of Financial Position as of
June 30, 2013
and
December 31, 2012
are summarized below:
|
(Millions of dollars)
|
June 30, 2013
|
||||||||||||||
|
|
Level 1
|
Level 2
|
Level 3
|
Total
Assets / Liabilities,
at Fair Value
|
|||||||||||
|
Assets
|
|
|
|
|
|
|
|
|
|||||||
|
Available-for-sale securities
|
|
|
|
|
|
|
|
|
|||||||
|
Government debt
|
|
|
|
|
|
|
|
|
|||||||
|
U.S. treasury bonds
|
$
|
10
|
|
$
|
—
|
|
$
|
—
|
|
$
|
10
|
|
|||
|
Other U.S. and non-U.S. government bonds
|
—
|
|
120
|
|
—
|
|
120
|
|
|||||||
|
Corporate bonds
|
|
|
|
|
|
|
|
|
|||||||
|
Corporate bonds
|
—
|
|
682
|
|
—
|
|
682
|
|
|||||||
|
Asset-backed securities
|
—
|
|
80
|
|
—
|
|
80
|
|
|||||||
|
Mortgage-backed debt securities
|
|
|
|
|
|
|
|
|
|||||||
|
U.S. governmental agency
|
—
|
|
359
|
|
—
|
|
359
|
|
|||||||
|
Residential
|
—
|
|
22
|
|
—
|
|
22
|
|
|||||||
|
Commercial
|
—
|
|
103
|
|
—
|
|
103
|
|
|||||||
|
Equity securities
|
|
|
|
|
|
|
|
|
|||||||
|
Large capitalization value
|
220
|
|
—
|
|
—
|
|
220
|
|
|||||||
|
Smaller company growth
|
42
|
|
—
|
|
—
|
|
42
|
|
|||||||
|
Total available-for-sale securities
|
272
|
|
1,366
|
|
—
|
|
1,638
|
|
|||||||
|
Derivative financial instruments, net
|
—
|
|
122
|
|
—
|
|
122
|
|
|||||||
|
Total Assets
|
$
|
272
|
|
$
|
1,488
|
|
$
|
—
|
|
$
|
1,760
|
|
|||
|
Liabilities
|
|
|
|
|
|
|
|
|
|||||||
|
Guarantees
|
$
|
—
|
|
$
|
—
|
|
$
|
14
|
|
$
|
14
|
|
|||
|
Total Liabilities
|
$
|
—
|
|
$
|
—
|
|
$
|
14
|
|
$
|
14
|
|
|||
49
|
(Millions of dollars)
|
December 31, 2012
|
||||||||||||||
|
|
Level 1
|
Level 2
|
Level 3
|
Total
Assets / Liabilities,
at Fair Value
|
|||||||||||
|
Assets
|
|
|
|
|
|
|
|
|
|||||||
|
Available-for-sale securities
|
|
|
|
|
|
|
|
|
|||||||
|
Government debt
|
|
|
|
|
|
|
|
|
|||||||
|
U.S. treasury bonds
|
$
|
10
|
|
$
|
—
|
|
$
|
—
|
|
$
|
10
|
|
|||
|
Other U.S. and non-U.S. government bonds
|
—
|
|
146
|
|
—
|
|
146
|
|
|||||||
|
Corporate bonds
|
|
|
|
|
|
|
|
|
|||||||
|
Corporate bonds
|
—
|
|
664
|
|
—
|
|
664
|
|
|||||||
|
Asset-backed securities
|
—
|
|
96
|
|
—
|
|
96
|
|
|||||||
|
Mortgage-backed debt securities
|
|
|
|
|
|
|
|
|
|||||||
|
U.S. governmental agency
|
—
|
|
299
|
|
—
|
|
299
|
|
|||||||
|
Residential
|
—
|
|
25
|
|
—
|
|
25
|
|
|||||||
|
Commercial
|
—
|
|
127
|
|
—
|
|
127
|
|
|||||||
|
Equity securities
|
|
|
|
|
|
|
|
|
|||||||
|
Large capitalization value
|
185
|
|
—
|
|
—
|
|
185
|
|
|||||||
|
Smaller company growth
|
34
|
|
—
|
|
—
|
|
34
|
|
|||||||
|
Total available-for-sale securities
|
229
|
|
1,357
|
|
—
|
|
1,586
|
|
|||||||
|
Derivative financial instruments, net
|
—
|
|
154
|
|
—
|
|
154
|
|
|||||||
|
Total Assets
|
$
|
229
|
|
$
|
1,511
|
|
$
|
—
|
|
$
|
1,740
|
|
|||
|
Liabilities
|
|
|
|
|
|
|
|
|
|||||||
|
Guarantees
|
$
|
—
|
|
$
|
—
|
|
$
|
14
|
|
$
|
14
|
|
|||
|
Total Liabilities
|
$
|
—
|
|
$
|
—
|
|
$
|
14
|
|
$
|
14
|
|
|||
Below are roll-forwards of liabilities measured at fair value using Level 3 inputs for the
six
months ended
June 30, 2013
and
2012
. These instruments were valued using pricing models that, in management’s judgment, reflect the assumptions of a marketplace participant.
|
(Millions of dollars)
|
Guarantees
|
|||
|
Balance at December 31, 2012
|
$
|
14
|
|
|
|
Issuance of guarantees
|
6
|
|
||
|
Expiration of guarantees
|
(6
|
)
|
||
|
Balance at June 30, 2013
|
$
|
14
|
|
|
|
Balance at December 31, 2011
|
$
|
7
|
|
|
|
Acquisitions
|
6
|
|
||
|
Issuance of guarantees
|
3
|
|
||
|
Expiration of guarantees
|
(1
|
)
|
||
|
Balance at June 30, 2012
|
$
|
15
|
|
|
In addition to the amounts above, Cat Financial impaired loans are subject to measurement at fair value on a nonrecurring basis. A loan is considered impaired when management determines that collection of contractual amounts due is not probable. In these cases, an allowance for credit losses may be established based primarily on the fair value of associated collateral. As the collateral’s fair value is based on observable market prices and/or current appraised values, the impaired loans are classified as Level 2 measurements. Cat Financial had impaired loans with a fair value of
$131 million
and
$117 million
as of
June 30, 2013
and
December 31, 2012
, respectively.
50
B.
Fair values of financial instruments
In addition to the methods and assumptions we use to record the fair value of financial instruments as discussed in the Fair value measurements section above, we used the following methods and assumptions to estimate the fair value of our financial instruments:
Cash and short-term investments
Carrying amount approximated fair value.
Restricted cash and short-term investments
Carrying amount approximated fair value. Restricted cash and short-term investments are included in Prepaid expenses and other current assets in the Consolidated Statement of Financial Position.
Finance receivables
Fair value was estimated by discounting the future cash flows using current rates, representative of receivables with similar remaining maturities.
Wholesale inventory receivables
Fair value was estimated by discounting the future cash flows using current rates, representative of receivables with similar remaining maturities.
Short-term borrowings
Carrying amount approximated fair value.
Long-term debt
Fair value for fixed and floating rate debt was estimated based on quoted market prices.
Please refer to the table below for the fair values of our financial instruments.
|
Fair Value of Financial Instruments
|
||||||||||||||||||||
|
|
June 30, 2013
|
December 31, 2012
|
|
|||||||||||||||||
|
(Millions of dollars)
|
Carrying
Amount
|
Fair
Value
|
Carrying
Amount
|
Fair
Value
|
Fair Value Levels
|
Reference
|
||||||||||||||
|
Assets
|
|
|
|
|
|
|
|
|
|
|||||||||||
|
Cash and short-term investments
|
$
|
6,110
|
|
$
|
6,110
|
|
$
|
5,490
|
|
$
|
5,490
|
|
1
|
|
||||||
|
Restricted cash and short-term investments
|
77
|
|
77
|
|
53
|
|
53
|
|
1
|
|
||||||||||
|
Available-for-sale securities
|
1,638
|
|
1,638
|
|
1,586
|
|
1,586
|
|
1 & 2
|
Note 8
|
||||||||||
|
Finance receivables – net (excluding finance leases
1
)
|
15,626
|
|
15,560
|
|
15,404
|
|
15,359
|
|
2
|
Note 16
|
||||||||||
|
Wholesale inventory receivables – net (excluding finance leases
1
)
|
1,534
|
|
1,469
|
|
1,674
|
|
1,609
|
|
2
|
Note 16
|
||||||||||
|
Interest rate swaps – net
|
150
|
|
150
|
|
219
|
|
219
|
|
2
|
Note 4
|
||||||||||
|
Commodity contracts – net
|
—
|
|
—
|
|
1
|
|
1
|
|
2
|
Note 4
|
||||||||||
|
|
||||||||||||||||||||
|
Liabilities
|
|
|
|
|
|
|
|
|
|
|||||||||||
|
Short-term borrowings
|
5,511
|
|
5,511
|
|
5,287
|
|
5,287
|
|
1
|
|
||||||||||
|
Long-term debt (including amounts due within one year)
|
|
|
|
|
|
|
|
|
|
|||||||||||
|
Machinery and Power Systems
|
9,061
|
|
10,456
|
|
9,779
|
|
11,969
|
|
2
|
|
||||||||||
|
Financial Products
|
24,979
|
|
25,607
|
|
25,077
|
|
26,063
|
|
2
|
|
||||||||||
|
Foreign currency contracts – net
|
25
|
|
25
|
|
66
|
|
66
|
|
2
|
Note 4
|
||||||||||
|
Commodity contracts – net
|
3
|
|
3
|
|
—
|
|
—
|
|
2
|
Note 4
|
||||||||||
|
Guarantees
|
14
|
|
14
|
|
14
|
|
14
|
|
3
|
Note 10
|
||||||||||
|
1
|
Total excluded items have a net carrying value at
June 30, 2013
and
December 31, 2012
of
$8,058 million
and
$7,959 million
, respectively.
|
51
|
19.
|
Acquisitions
|
ERA Mining Machinery Limited (Siwei)
During the second quarter of 2012, Caterpillar, through its wholly-owned subsidiary Caterpillar (Luxembourg) Investment Co. S.A. (CAT Lux), completed a tender offer to acquire the issued shares of ERA Mining Machinery Limited (Siwei), including its wholly-owned subsidiary Zhengzhou Siwei Mechanical Manufacturing Co., Ltd. Substantially all of the issued shares of Siwei, a public company listed on the Hong Kong Exchange, were acquired at the end of May 2012. In October 2012, the remaining shares of Siwei common stock were acquired for approximately
$7 million
in cash. Siwei primarily designs, manufactures, sells and supports underground coal mining equipment in mainland China and is known for its expertise in manufacturing mining roof support equipment. The acquisition supports Caterpillar's long-term commitment to invest in China in order to support our growing base of Chinese customers and will further expand our underground mining business both inside and outside of China.
The tender offer allowed Siwei shareholders to choose between
two
types of consideration in exchange for their shares. The alternatives were either cash consideration of HK
$0.88
or a HK
$1.00
loan note issued by CAT Lux to the former shareholders of Siwei that provided, subject to its terms, for the holder to receive on redemption a minimum of HK
$0.75
up to a maximum of HK
$1.15
depending on Siwei's consolidated gross profit for 2012 and 2013. Approximately
4 billion
Siwei shares were tendered for the cash alternative and approximately
1.6 billion
Siwei shares were tendered for the loan note alternative. The purchase price of approximately
$677 million
was comprised of net cash paid of approximately
$444 million
(
$475 million
in cash paid for shares and to cancel share options less cash acquired of
$31 million
), the fair value of the loan notes of
$152 million
, approximately
$168 million
of assumed third-party short term borrowings and notes payable, a loan and interest payable to Caterpillar from Siwei of
$51 million
, less restricted cash acquired of approximately
$138 million
. The noncontrolling interest for the outstanding shares not tendered was approximately
$7 million
.
The transaction was financed with available cash and included the issuance of loan notes to certain former shareholders of Siwei, which had a debt component and a portion that was contingent consideration. The
$152 million
fair value represented the minimum redemption amount of the debt component payable in April 2013.
Tangible assets as of the acquisition date and after giving effect to the adjustments described below were
$598 million
, recorded at their fair values, and primarily included cash of
$31 million
, restricted cash of
$138 million
, receivables of
$184 million
, inventory of
$77 million
and property, plant and equipment of
$94 million
. Finite-lived intangible assets acquired of
$112 million
were primarily related to customer relationships and also included trade names. The finite-lived intangible assets are being amortized on a straight-line basis over a weighted average amortization period of approximately
14 years
. Liabilities assumed as of the acquisition date and after giving effect to the adjustments described below were
$626 million
, recorded at their fair values, and primarily included accounts payable of
$352 million
, third-party short term borrowings and notes payable of
$168 million
and accrued expenses of
$37 million
. Additionally, deferred tax liabilities were
$25 million
. Goodwill of
$625 million
, substantially all of which is non-deductible for income tax purposes, represented the excess of the consideration transferred over the net assets recognized and represented the estimated future economic benefits arising from other assets acquired that could not be individually identified and separately recognized. Goodwill will not be amortized, but will be tested for impairment at least annually. Factors that contributed to a purchase price resulting in the recognition of goodwill include expected cost savings primarily from increased purchasing power for raw materials, improved working capital management, expanded underground mining equipment sales opportunities in China and internationally, along with the acquired assembled workforce. The results of the acquired business for the period from the acquisition date are included in the accompanying consolidated financial statements and are reported in the Resource Industries segment. Assuming this transaction had been made at the beginning of any period presented, the consolidated pro forma results would not be materially different from reported results.
In November 2012, Caterpillar became aware of inventory accounting discrepancies at Siwei which led to an internal investigation. Caterpillar's investigation determined that Siwei had engaged in accounting misconduct prior to Caterpillar's acquisition of Siwei in mid-2012. The accounting misconduct included inappropriate accounting practices involving improper cost allocation that resulted in overstated profit and improper revenue recognition practices involving early and, at times unsupported, revenue recognition. Due to the identified accounting misconduct that occurred before the acquisition, measurement period adjustments were made to the fair value of the acquired assets and assumed liabilities during the fourth quarter of 2012. The fair values presented above are a final allocation of the purchase price and reflect these changes, which are primarily comprised of a decrease in finite-lived intangible assets of
$82 million
, a decrease in
52
receivables of
$29 million
, a decrease in inventory of
$17 million
and a net increase in liabilities of
$23 million
, resulting in an increase in goodwill of
$149 million
.
Because of the accounting misconduct identified in the fourth quarter of 2012, Siwei's goodwill was tested for impairment as of November 30, 2012. We determined the carrying value of Siwei, which is a separate reporting unit, exceeded its fair value at the measurement date, requiring step two in the impairment test process. The fair value of the Siwei reporting unit was determined primarily using an income approach based on the present value of discounted cash flows. We assigned the fair value to the reporting unit's assets and liabilities and determined the implied fair value of goodwill was substantially below the carrying value of the reporting unit's goodwill. Accordingly, we recognized a
$580 million
goodwill impairment charge, which resulted in goodwill of approximately
$45 million
remaining for Siwei. The goodwill impairment was a result of changes in the assumptions used to determine the fair value resulting from the accounting misconduct that occurred before the acquisition. There was no tax benefit associated with this impairment charge. The Siwei goodwill impairment charge was reported in the fourth quarter of 2012 in the Resource Industries segment.
In May 2013, Caterpillar and its wholly-owned subsidiaries CAT Lux and Siwei entered into a settlement agreement with
two
former directors of Siwei and
two
other parties with an interest in the settlement, including Mining Machinery Limited (MML). The agreement settles the dispute between the parties which arose from Caterpillar's determination that Siwei senior managers had engaged in accounting misconduct for several years prior to Caterpillar's announcement of the completion of its tender offer for Siwei in the second quarter of 2012.
Under the terms of the settlement agreement, the parties agreed that (i) the loan notes issued by CAT Lux (and guaranteed by Caterpillar) as a portion of the Siwei purchase price and held by MML and (ii) loans made by the
two
former Siwei directors to Siwei prior to its acquisition by Caterpillar would all be canceled and discharged in exchange for payments by CAT Lux to MML and the
two
former directors in an aggregate amount of approximately
$30 million
. As of the settlement in May 2013, the loan notes had a book value of approximately
$152 million
and the obligation related to the loans by the
two
former directors was approximately
$13 million
. The settlement agreement contains a mutual release and discharge of the parties' respective claims with respect to the dispute and contains an agreement by Caterpillar and CAT Lux not to pursue any such claims against either the auditors or former directors of Siwei. The settlement and discharge of the loan obligations resulted in the recognition of a gain of approximately
$135 million
reported in Other operating (income) expenses in the Consolidated Statement of Results of Operations and is included in the Resource Industries segment.
20.
Divestitures and Assets Held for Sale
Bucyrus Distribution Business Divestiture
In conjunction with our acquisition of Bucyrus in July 2011, we announced our intention to sell the Bucyrus distribution business to Caterpillar dealers that support mining customers around the world in a series of individual transactions. Bucyrus predominantly employed a direct to end customer model to sell and support products. The intention is for all Bucyrus products to be sold and serviced by Caterpillar dealers, consistent with our long-held distribution strategy. These transitions are occurring in phases based on the mining business opportunity within each dealer territory.
As portions of the Bucyrus distribution business are sold or classified as held for sale, they will not qualify as discontinued operations because Caterpillar expects significant continuing direct cash flows from the Caterpillar dealers after the divestitures. The gain or loss on disposal, along with the continuing operations of these disposal groups, will be reported in the Resource Industries segment. Goodwill will be allocated to each disposal group using the relative fair value method. The value of the customer relationship intangibles related to each portion of the Bucyrus distribution business to be sold will be included in the disposal groups. The disposal groups will be recorded at the lower of their carrying value or fair value less cost to sell. The portions of the distribution business that were sold were not material to our results of operations, financial position or cash flow.
We completed
two
sale transactions during the first quarter of 2013 and
one
during the second quarter of 2013 whereby we sold portions of the Bucyrus distribution business to Caterpillar dealers for an aggregate price of
$77 million
. After-tax profit was unfavorably impacted in the first half of 2013 by
$44 million
as a result of the Bucyrus distribution divestiture activities. This is comprised of
$31 million
of gains related to the sales transactions, a
$34 million
unfavorable adjustment due to a change in estimate to increase the reserve for parts returns related to prior sale transactions (included in Other operating (income) expenses) and costs incurred related to the Bucyrus distribution divestiture activities of
$57 million
(included in Selling, general and administrative expenses), offset by an income tax benefit of
$16 million
.
53
Assets sold in the first half of 2013 included customer relationship intangibles of
$11 million
, inventory of
$6 million
and allocated goodwill of
$16 million
related to the divested portions of the Bucyrus distribution business.
As of June 30, 2013,
six
divestiture transactions were classified as held for sale and are expected to close in 2013. Current assets held for sale were included in Prepaid expenses and other current assets and non-current assets held for sale were included in Other assets in the Consolidated Statement of Financial Position.
The major classes of assets held for sale for a portion of the Bucyrus distribution business were as follows:
|
(Millions of dollars)
|
June 30,
2013 |
December 31,
2012 |
|||||
|
Inventories
|
$
|
43
|
|
$
|
30
|
|
|
|
Current assets
|
$
|
43
|
|
$
|
30
|
|
|
|
Property, plant and equipment – net
|
$
|
11
|
|
$
|
—
|
|
|
|
Intangible assets
|
68
|
|
32
|
|
|||
|
Goodwill
|
54
|
|
52
|
|
|||
|
Non-current assets
|
$
|
133
|
|
$
|
84
|
|
|
21.
Employee Separation Charges
In
2012
, we reported employee separation charges of
$94 million
in Other operating (income) expenses in the Consolidated Statement of Results of Operations primarily related to the closure of the Electro-Motive Diesel facility located in London, Ontario and separation programs in Europe. The majority of the charges were related to the Power Systems segment.
For the
three and six
months ended
June 30, 2013
, we recognized employee separation charges of
$16 million
and
$23 million
, respectively, in Other operating (income) expenses in the Consolidated Statement of Results of Operations primarily related to separation programs in North America and Europe. The charges were related primarily to the Resource Industries and Power Systems segments.
Our accounting for separations was dependent upon how the particular program was designed. For voluntary programs, eligible separation costs were recognized at the time of employee acceptance. For involuntary programs, eligible costs were recognized when management had approved the program, the affected employees had been properly notified and the costs were estimable.
The following table summarizes the
2012
and
2013
separation activity:
|
(Millions of dollars)
|
||||
|
Total
|
||||
|
Liability balance at December 31, 2011
|
$
|
90
|
|
|
|
Increase in liability (separation charges)
|
94
|
|
||
|
Reduction in liability (payments and other adjustments)
|
(155
|
)
|
||
|
Liability balance at December 31, 2012
|
$
|
29
|
|
|
|
Increase in liability (separation charges)
|
23
|
|
||
|
Reduction in liability (payments and other adjustments)
|
(23
|
)
|
||
|
Liability balance at June 30, 2013
|
$
|
29
|
|
|
The remaining liability balances as of
June 30, 2013
represent costs for employees that have either not yet separated from the Company or their full severance has not yet been paid. The majority of these remaining costs are expected to be paid in
2013
and 2014.
54
22.
Subsequent Event
On July 29, 2013, we entered into a definitive agreement with Société Générale to purchase shares of our common stock under an accelerated stock repurchase transaction (July ASR Agreement). Pursuant to the terms of the July ASR Agreement, we have agreed to repurchase
$1.0 billion
of our common stock from Société Générale, with an immediate delivery of approximately
11.4 million
shares. The final number of shares to be repurchased and the aggregate cost to Caterpillar will be based on Caterpillar's volume-weighted average stock price during the term of the transaction, which is expected to be completed in September 2013.
55
Overview
We reported second-quarter 2013 sales and revenues of $14.621 billion, a 16 percent decrease from second-quarter 2012 sales and revenues of $17.374 billion. Profit per share for the second quarter of 2013 was $1.45, a 43 percent decrease from second-quarter 2012 profit per share of $2.54. Profit was $960 million in the quarter, a decrease of 43 percent from $1.699 billion in the second quarter of 2012.
Sales and revenues for the six months ended June 30, 2013 were $27.831 billion, down $5.524 billion, or 17 percent, from $33.355 billion for the six months ended June 30, 2012. Profit per share for the six months ended June 30, 2013 was $2.76, a 44 percent decrease from the six months ended June 30, 2012 profit per share of $4.90. Profit was $1.840 billion in the six months ended June 30, 2013, a decrease of 44 percent from $3.285 billion for the six months ended June 30, 2012.
Highlights for the second quarter of 2013 include:
|
•
|
Second-quarter sales and revenues of $14.621 billion were 16 percent lower than the second quarter of 2012. About half of the decline in sales and revenues was a result of changes in dealer inventory. In addition, machine dealer deliveries to end users declined, primarily in
Resource Industries
.
|
|
•
|
Profit per share was $1.45 in the second quarter of 2013, down $1.09 from the second quarter of 2012.
|
|
•
|
Power Systems
is currently our largest segment in terms of sales and profit.
|
|
•
|
Our inventory continued to decline in the second quarter of 2013. It was about $1.2 billion below the end of the first quarter of 2013 and $1.7 billion below year-end 2012.
|
|
•
|
Machinery and Power Systems (M&PS)
operating cash flow was $3.049 billion in the second quarter of 2013, compared with $1.281 billion in the second quarter of 2012.
|
|
•
|
M&PS
debt-to-capital ratio
was 34.9 percent, down from 36.4 percent at the end of the first quarter of 2013.
|
|
•
|
During the second quarter of 2013, we resumed our stock repurchase program and repurchased $1 billion of stock.
|
During the second quarter of 2013, we announced the formation of the Caterpillar Enterprise System Group with the goal of improving our manufacturing and supply chain capabilities, driving sustained improvements in customer deliveries, improving operational efficiencies and building on recent product quality improvements.
Notes:
|
•
|
Glossary of terms is included on pages 70-71; first occurrence of terms shown in bold italics.
|
|
•
|
Information on non-GAAP financial measures is included on page 80.
|
56
Consolidated Results of Operations
THREE MONTHS ENDED JUNE 30, 2013 COMPARED WITH THREE MONTHS ENDED JUNE 30, 2012
CONSOLIDATED SALES AND REVENUES
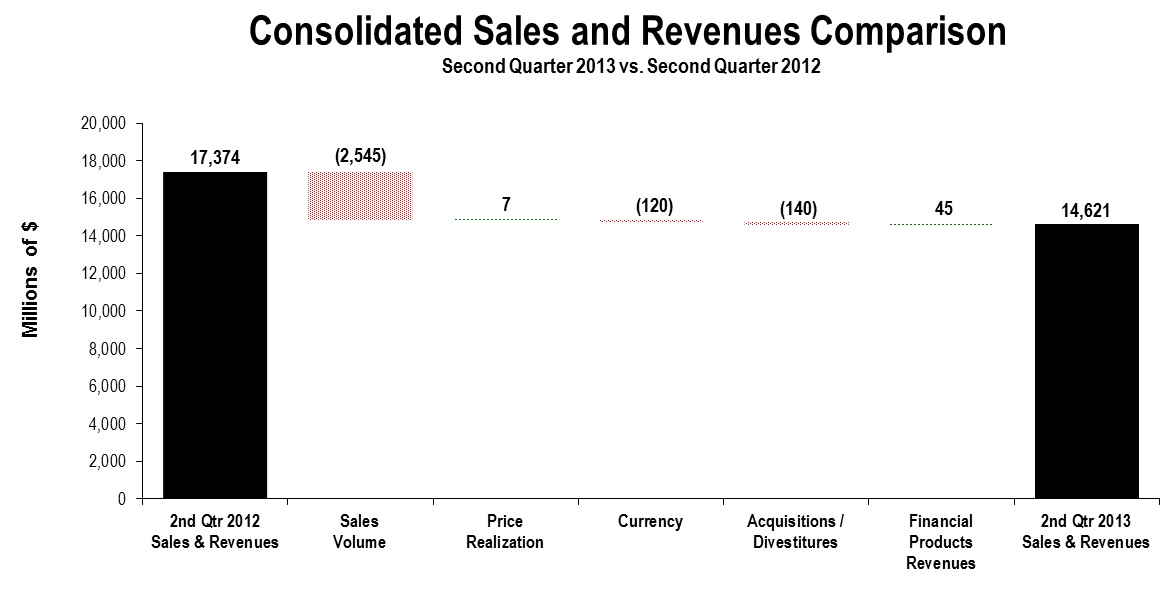
The chart above graphically illustrates reasons for the change in Consolidated Sales and Revenues between the second quarter of 2012 (at left) and the second quarter of 2013 (at right). Items favorably impacting sales and revenues appear as upward stair steps with the corresponding dollar amounts above each bar, while items negatively impacting sales and revenues appear as downward stair steps with dollar amounts reflected in parentheses above each bar. Caterpillar management utilizes these charts internally to visually communicate with the company's Board of Directors and employees.
Sales and Revenues
Total sales and revenues were $14.621 billion in the second quarter of 2013, a decrease of $2.753 billion, or 16 percent, from the second quarter of 2012. When reviewing the change in sales and revenues, we focus on the following perspectives:
|
•
|
Reason for the change:
Sales volume
decreased $2.545 billion with the most significant decline in Resource Industries. About half of the total volume decrease was related to changes in dealer machine inventory and the remainder was primarily a result of lower machine dealer deliveries to end users. During the second quarter of 2012, dealers increased machine inventory about $300 million in anticipation of higher demand. In the second quarter of 2013, dealers reduced their machine inventory by about $1 billion. Most of the decline was related to Resource Industries' products, as dealers adjusted inventory levels in response to lower end-user demand. The decline in dealer inventory was more than we expected as dealers satisfied more of their second-quarter machine demand from their inventory. We believe that slower economic growth and continued uncertainty regarding economic recoveries have influenced dealer inventory levels and end-user demand.
|
In months of supply, dealer machine inventory is currently low by historic standards. However, dealers are utilizing inventory from our product distribution centers at a higher rate, primarily for
Construction Industries'
products, and are positioned to reduce inventory even further in 2013. While we expect substantial reductions in dealer machine inventory from both Construction Industries and Resource Industries, we believe more than half of the decline in the second half of the year will be related to Resource Industries' products as the mining industry continues to reduce capital expenditures. For the full-year 2012, dealer machine inventory increased $1.2 billion.
In addition, the net impact of acquisitions and divestitures was unfavorable $140 million mainly due to the absence of our third party logistics business, and the impact of
currency
was unfavorable $120 million. These decreases were partially offset by increased Financial Products' revenues of $45 million.
Price realization
was about flat.
57
While sales for both new equipment and aftermarket parts declined, most of the decrease was for new equipment. In the context of the total sales decrease, the decline in aftermarket parts was not a significant factor.
|
•
|
Sales by geographic region: While sales declined in all geographic regions, the most significant reduction was in Asia/Pacific. The Asia/Pacific decline was primarily related to lower Australian mining sales in our Resource Industries segment. While sales in Asia/Pacific declined overall, sales in China increased. During the quarter, our total sales in China excluding acquisitions were about 20 percent higher than the second quarter of 2012.
|
|
•
|
Sales by segment: Sales decreased in all segments. The most significant decrease was in Resource Industries, with sales down 34 percent resulting primarily from changes in dealer inventory and weaker demand in mining. Construction Industries'
sales decreased 9 percent, and Power Systems' sales were 5 percent lower.
Financial Products segment
revenues were up 5 percent.
|
CONSOLIDATED OPERATING PROFIT
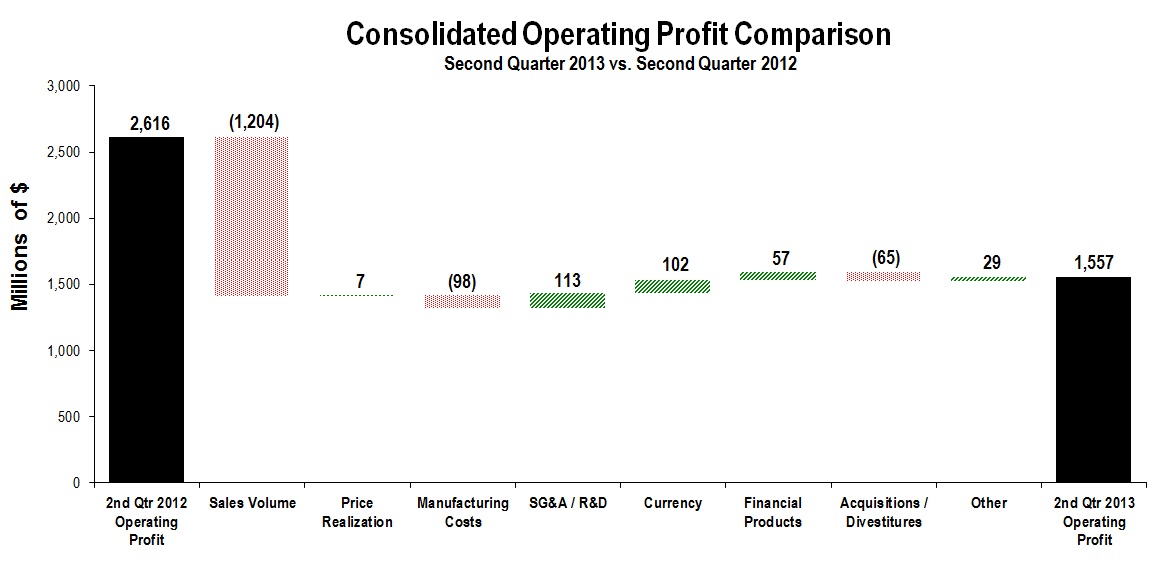
The chart above graphically illustrates reasons for the change in Consolidated Operating Profit between the second quarter of 2012 (at left) and the second quarter of 2013 (at right). Items favorably impacting operating profit
appear as upward stair steps with the corresponding dollar amounts above each bar, while items negatively impacting operating profit appear as downward stair steps with dollar amounts reflected in parentheses above each bar. Caterpillar management utilizes these charts internally to visually communicate with the company's Board of Directors and employees. The bar entitled Other includes
consolidating adjustments
and
Machinery and Power Systems other operating (income) expenses
.
Operating profit for the second quarter of 2013 was $1.557 billion, a decline of $1.059 billion from the second quarter of 2012. The decrease was primarily the result of lower sales volume, which included an unfavorable mix of products.
Manufacturing costs
and the impact of acquisitions and divestitures were also unfavorable to operating profit. These items were partially offset by a decline in SG&A and R&D expenses and the favorable impact of currency.
Manufacturing costs increased $98 million. The increase was primarily due to unfavorable changes in cost absorption resulting from a decrease in inventory during the second quarter of 2013 and an increase in inventory during the second quarter of 2012. This unfavorable impact was partially offset by lower material costs and a decrease in incentive compensation expense.
The decline in inventory in the second quarter of 2013 was more than we previously expected. Dealers increasingly used inventory from our product distribution centers to meet end-user demand, primarily for Construction Industries' products. Resource Industries' inventory declined in the second quarter more than anticipated as we continued to align our inventory with expected demand. In addition, we believe better product availability has contributed to the decline in inventory for both segments as the time from dealer order to product delivery is shorter than a year ago. We expect that our inventory will end 2013 near the level we ended the second quarter. As such, we do not expect a significant unfavorable impact related to inventory cost absorption during the second half of 2013.
58
Despite the significant decline in sales volume, manufacturing inefficiencies were only slightly unfavorable due to cost reduction initiatives including temporary factory shutdowns, rolling layoffs throughout much of the company and reductions in our flexible workforce. We expect to expand our cost reduction initiatives during the second half of the year.
Acquisitions and divestitures negatively impacted operating profit by $65 million. The second quarter of 2012 included substantial pre-tax gains on the sale of portions of the Bucyrus distribution business, while the impact on the second quarter of 2013 was negative. This was partially offset by the $135 million favorable impact from the settlement with the previous owners of our
Siwei
acquisition.
SG&A and R&D expenses were lower primarily due to decreased incentive compensation expense and lower discretionary and program costs. We expect lower expenses from additional cost reduction actions during the second half of 2013.
The favorable impact of currency was mostly due to the Japanese yen. We have a sizable manufacturing presence in Japan, and while some of this production is sold in Japan, we are a net exporter, and, therefore, a weaker yen provides a cost benefit.
The second-quarter short-term incentive compensation expense related to 2013 was about $125 million, and we expect the full year will be about $500 million. Short-term incentive compensation in the second quarter of 2012 was about $265 million, and full-year 2012 was about $825 million.
Other Profit/Loss Items
|
•
|
Other income/expense
was expense of
$84 million compared with income of $70 million in the second quarter of 2012. The change was primarily due to the unfavorable impact of currency translation and hedging gains and losses. Translation and hedging losses in the second quarter of 2013 totaled $134 million, with most of the impact from translation losses. In the second quarter of 2012, we had translation and hedging losses of $2 million. Most of the impact in the second quarter of 2013 was a result of our net asset/liability positions and exchange rate movements in the Japanese yen, Brazilian real, Australian dollar and euro.
|
|
•
|
The provision for income taxes
in the second quarter of 2013 reflects an estimated annual effective tax rate of 29 percent compared with 30.5 percent for 2012, excluding the items discussed below. The decrease is primarily due to the U.S. research and development tax credit that was expired in 2012, along with expected changes in our geographic mix of profits from a tax perspective.
|
The tax provision for the second quarter of 2013 also includes a benefit of $6 million for a decrease in the 2013 estimated annual effective tax rate from 29.5 to 29 percent. The tax provision for the second quarter of 2012 included a negative impact of $87 million related to nondeductible goodwill and an increase in the estimated annual effective tax rate.
59
Segment Information
|
Sales and Revenues by Geographic Region
|
|
(Millions of dollars)
|
Total
|
%
Change
|
North
America
|
%
Change
|
Latin
America
|
%
Change
|
EAME
|
%
Change
|
Asia/
Pacific
|
%
Change
|
||||||||||||||||||||||||
|
Second Quarter 2013
|
|
|
|
|
|
|
|
|
|
|
|
|
|
|
|
|
|
|
|
|
||||||||||||||
|
Construction Industries
1
|
$
|
4,850
|
|
(9
|
)%
|
$
|
1,989
|
|
1
|
%
|
$
|
701
|
|
(4
|
)%
|
$
|
1,044
|
|
(22
|
)%
|
$
|
1,116
|
|
(15
|
)%
|
|||||||||
|
Resource Industries
2
|
3,571
|
|
(34
|
)%
|
1,198
|
|
(25
|
)%
|
630
|
|
(28
|
)%
|
879
|
|
(23
|
)%
|
864
|
|
(52
|
)%
|
||||||||||||||
|
Power Systems
3
|
5,263
|
|
(5
|
)%
|
2,215
|
|
(7
|
)%
|
568
|
|
(8
|
)%
|
1,352
|
|
(8
|
)%
|
1,128
|
|
8
|
%
|
||||||||||||||
|
All Other Segment
4
|
211
|
|
(54
|
)%
|
136
|
|
(37
|
)%
|
6
|
|
(65
|
)%
|
36
|
|
(73
|
)%
|
33
|
|
(61
|
)%
|
||||||||||||||
|
Corporate Items and Eliminations
|
(9
|
)
|
—
|
|
(12
|
)
|
1
|
|
1
|
|
1
|
|
||||||||||||||||||||||
|
Machinery & Power Systems Sales
|
13,886
|
|
(17
|
)%
|
5,526
|
|
(10
|
)%
|
1,906
|
|
(15
|
)%
|
3,312
|
|
(19
|
)%
|
3,142
|
|
(26
|
)%
|
||||||||||||||
|
Financial Products Segment
|
806
|
|
5
|
%
|
418
|
|
3
|
%
|
109
|
|
10
|
%
|
120
|
|
8
|
%
|
159
|
|
7
|
%
|
||||||||||||||
|
Corporate Items and Eliminations
|
(71
|
)
|
(41
|
)
|
(10
|
)
|
(8
|
)
|
(12
|
)
|
||||||||||||||||||||||||
|
Financial Products Revenues
|
735
|
|
7
|
%
|
377
|
|
5
|
%
|
99
|
|
9
|
%
|
112
|
|
9
|
%
|
147
|
|
7
|
%
|
||||||||||||||
|
Consolidated Sales and Revenues
|
$
|
14,621
|
|
(16
|
)%
|
$
|
5,903
|
|
(9
|
)%
|
$
|
2,005
|
|
(14
|
)%
|
$
|
3,424
|
|
(18
|
)%
|
$
|
3,289
|
|
(25
|
)%
|
|||||||||
|
Second Quarter 2012
|
|
|
|
|
|
|
|
|
|
|
|
|
|
|
|
|
|
|
|
|
||||||||||||||
|
Construction Industries
1
|
$
|
5,340
|
|
$
|
1,966
|
|
$
|
731
|
|
$
|
1,332
|
|
$
|
1,311
|
|
|
|
|||||||||||||||||
|
Resource Industries
2
|
5,390
|
|
1,589
|
|
876
|
|
1,142
|
|
1,783
|
|
|
|
||||||||||||||||||||||
|
Power Systems
3
|
5,511
|
|
2,373
|
|
618
|
|
1,474
|
|
1,046
|
|
|
|
||||||||||||||||||||||
|
All Other Segment
4
|
454
|
|
217
|
|
17
|
|
135
|
|
85
|
|
|
|
||||||||||||||||||||||
|
Corporate Items and Eliminations
|
(11
|
)
|
(13
|
)
|
—
|
|
1
|
|
1
|
|
||||||||||||||||||||||||
|
Machinery & Power Systems Sales
|
16,684
|
|
|
|
6,132
|
|
|
|
2,242
|
|
|
|
4,084
|
|
|
|
4,226
|
|
|
|
||||||||||||||
|
Financial Products Segment
|
764
|
|
406
|
|
99
|
|
111
|
|
148
|
|
|
|
||||||||||||||||||||||
|
Corporate Items and Eliminations
|
(74
|
)
|
(48
|
)
|
(8
|
)
|
(8
|
)
|
(10
|
)
|
|
|
||||||||||||||||||||||
|
Financial Products Revenues
|
690
|
|
|
|
358
|
|
|
|
91
|
|
|
|
103
|
|
|
|
138
|
|
|
|
||||||||||||||
|
Consolidated Sales and Revenues
|
$
|
17,374
|
|
|
|
$
|
6,490
|
|
|
|
$
|
2,333
|
|
|
|
$
|
4,187
|
|
|
|
$
|
4,364
|
|
|
|
|||||||||
|
1
|
Does not include inter-segment sales of $113 million and $123 million in second-quarter 2013 and 2012, respectively.
|
|
2
|
Does not include inter-segment sales of $233 million and $328 million in second-quarter 2013 and 2012, respectively.
|
|
3
|
Does not include inter-segment sales of $461 million and $680 million in second-quarter 2013 and 2012, respectively.
|
|
4
|
Does not include inter-segment sales of $809 million and $927 million in second-quarter 2013 and 2012, respectively.
|
60
|
Sales and Revenues by Segment
|
||||||||||||||||||||||||||||||||||
|
(Millions of dollars)
|
Second Quarter 2012
|
Sales
Volume
|
Price
Realization
|
Currency
|
Acquisitions/Divestitures
|
Other
|
Second Quarter 2013
|
$
Change
|
%
Change
|
|||||||||||||||||||||||||
|
Construction Industries
|
$
|
5,340
|
|
$
|
(357
|
)
|
$
|
(46
|
)
|
$
|
(87
|
)
|
$
|
—
|
|
$
|
—
|
|
$
|
4,850
|
|
$
|
(490
|
)
|
(9
|
)%
|
||||||||
|
Resource Industries
|
5,390
|
|
(1,813
|
)
|
(17
|
)
|
(15
|
)
|
26
|
|
—
|
|
3,571
|
|
(1,819
|
)
|
(34
|
)%
|
||||||||||||||||
|
Power Systems
|
5,511
|
|
(300
|
)
|
68
|
|
(16
|
)
|
—
|
|
—
|
|
5,263
|
|
(248
|
)
|
(5
|
)%
|
||||||||||||||||
|
All Other Segment
|
454
|
|
(77
|
)
|
1
|
|
(1
|
)
|
(166
|
)
|
—
|
|
211
|
|
(243
|
)
|
(54
|
)%
|
||||||||||||||||
|
Corporate Items and Eliminations
|
(11
|
)
|
2
|
|
1
|
|
(1
|
)
|
—
|
|
—
|
|
(9
|
)
|
2
|
|
|
|
||||||||||||||||
|
Machinery & Power Systems Sales
|
16,684
|
|
(2,545
|
)
|
7
|
|
(120
|
)
|
(140
|
)
|
—
|
|
13,886
|
|
(2,798
|
)
|
(17
|
)%
|
||||||||||||||||
|
Financial Products Segment
|
764
|
|
—
|
|
—
|
|
—
|
|
—
|
|
42
|
|
806
|
|
42
|
|
5
|
%
|
||||||||||||||||
|
Corporate Items and Eliminations
|
(74
|
)
|
—
|
|
—
|
|
—
|
|
—
|
|
3
|
|
(71
|
)
|
3
|
|
|
|
||||||||||||||||
|
Financial Products Revenues
|
690
|
|
—
|
|
—
|
|
—
|
|
—
|
|
45
|
|
735
|
|
45
|
|
7
|
%
|
||||||||||||||||
|
Consolidated Sales and Revenues
|
$
|
17,374
|
|
$
|
(2,545
|
)
|
$
|
7
|
|
$
|
(120
|
)
|
$
|
(140
|
)
|
$
|
45
|
|
$
|
14,621
|
|
$
|
(2,753
|
)
|
(16
|
)%
|
||||||||
|
Operating Profit by Segment
|
||||||||||||||
|
(Millions of dollars)
|
Second Quarter 2013
|
Second Quarter 2012
|
$
Change
|
%
Change
|
||||||||||
|
Construction Industries
|
$
|
362
|
|
$
|
688
|
|
$
|
(326
|
)
|
(47
|
)%
|
|||
|
Resource Industries
|
550
|
|
1,426
|
|
(876
|
)
|
(61
|
)%
|
||||||
|
Power Systems
|
955
|
|
982
|
|
(27
|
)
|
(3
|
)%
|
||||||
|
All Other Segment
|
185
|
|
188
|
|
(3
|
)
|
(2
|
)%
|
||||||
|
Corporate Items and Eliminations
|
(665
|
)
|
(778
|
)
|
113
|
|
|
|
||||||
|
Machinery & Power Systems
|
1,387
|
|
2,506
|
|
(1,119
|
)
|
(45
|
)%
|
||||||
|
Financial Products Segment
|
233
|
|
188
|
|
45
|
|
24
|
%
|
||||||
|
Corporate Items and Eliminations
|
8
|
|
(4
|
)
|
12
|
|
|
|
||||||
|
Financial Products
|
241
|
|
184
|
|
57
|
|
31
|
%
|
||||||
|
Consolidating Adjustments
|
(71
|
)
|
(74
|
)
|
3
|
|
|
|
||||||
|
Consolidated Operating Profit
|
$
|
1,557
|
|
$
|
2,616
|
|
$
|
(1,059
|
)
|
(40
|
)%
|
|||
Construction Industries
Construction Industries' sales were $4.850 billion in the second quarter of 2013, a decrease of $490 million, or 9 percent, from the second quarter of 2012. The sales decrease was mainly due to lower volume resulting primarily from changes in dealer machine inventory. Dealer-reported machine inventory was about flat during the second quarter of 2012 compared with a decrease during the second quarter of 2013. Dealers are utilizing inventory from our product distribution centers at a higher rate allowing them to maintain inventory levels below historical averages. We expect dealers to reduce their machine inventory further in the second half of 2013 as they continue to utilize inventory from our product distribution centers. Dealer deliveries to end users were about flat compared with the second quarter of 2012. The impact of currency and price realization were also negative to sales. Sales of new equipment declined, and sales of aftermarket parts were about flat.
Sales declined in all geographic regions except North America. In North America, increased dealer deliveries to end users resulting from some increases in construction-related spending in the United States were about offset by changes in dealer inventory. Construction in the United States, while showing signs of improvement, is still far below the high levels in 2006 and 2007. The decline in
EAME
was primarily due to changes in dealer inventory, and construction activity in Europe remains low. In Asia/Pacific, sales increases in China were more than offset by sales declines in other countries due to slower economic growth. In China, our second-quarter sales improved versus the second quarter of 2012, while the overall industry declined. Our market position for excavators sold in China has also improved. Although the worldwide construction industry is showing some signs of improvement, it remains relatively depressed from a historical standpoint, which is negative for the construction equipment industry.
61
Construction Industries' profit was $362 million in the second quarter of 2013 compared with $688 million in the second quarter of 2012. The decrease in profit was primarily due to lower sales volume, which included an unfavorable mix of products, increased manufacturing costs and unfavorable price realization. Higher manufacturing costs were driven by unfavorable changes in cost absorption resulting from a decrease in inventory during the second quarter of 2013 and an increase in inventory during the second quarter of 2012. Price realization was unfavorable due to discounting with the most significant impact from a large government order in Brazil.
Resource Industries
Resource Industries' sales were $3.571 billion in the second quarter of 2013, a decrease of $1.819 billion, or 34 percent, from the second quarter of 2012, mainly due to decreases in sales volume. The decline in sales volume was primarily due to changes in dealer machine inventory. Dealers significantly reduced machine inventory during the second quarter of 2013 to better align their inventory levels with expected demand. This compares with an increase in dealer machine inventory during the second quarter of 2012. The decline in sales volume was also impacted by a decrease in dealer deliveries to end users as mining companies reduced their capital expenditures. Although industry data indicates that mine production in 2013 is higher than it was in 2012, capital expenditures by mining companies, which include equipment purchases, have been reduced across the industry. As a result, new orders for mining equipment continued to be weak and were below the second quarter of 2012, and continued substantial reductions in dealer machine inventory are expected during the second half of 2013. Sales decreased in every region of the world. The most significant decline was in Asia/Pacific, where about half of the worldwide dealer inventory impacts occurred. Increased discounting in Asia/Pacific more than offset favorable price realization in other regions of the world.
While sales for both new equipment and aftermarket parts declined, most of the decrease was for new mining equipment. In the context of the total sales decrease for Resource Industries, the decline in aftermarket parts was not a significant factor. Although collectively, sales of equipment for the forestry, paving and quarry and aggregate industries declined, most of the decline in Resource Industries' sales in the second quarter was mining equipment. While dealer deliveries to end users have declined, sales of our equipment are doing better than the equipment industry overall.
Resource Industries' profit was $550 million in the second quarter of 2013 compared with $1.426 billion in the second quarter of 2012. The decrease was primarily the result of lower sales volume, which included an unfavorable mix of products, increased manufacturing costs and an unfavorable impact from acquisitions and divestitures, partially offset by lower SG&A and R&D expenses.
The increase in manufacturing costs was driven by unfavorable changes in cost absorption resulting from a decrease in inventory during the second quarter of 2013 and an increase in inventory during the second quarter of 2012, as well as inefficiencies driven by lower production in the second quarter of 2013. These impacts were partially offset by favorable material costs.
Acquisitions and divestitures negatively impacted profit by $33 million. The second quarter of 2012 included substantial pre-tax gains on the sale of portions of the Bucyrus distribution business, while the impact on the second quarter of 2013 was negative. This was partially offset by the $135 million favorable impact from the settlement relating to our Siwei acquisition.
Decreases in SG&A and R&D expenses were driven by cost-reduction measures implemented in response to lower volumes as well as lower incentive compensation expense.
Due to the substantial decline in Resource Industries' sales and the uncertainty around when cyclical recovery will resume, we have taken substantial action to adjust production levels and to reduce costs. We expect to take additional action in the second half of the year with the intention of further reducing costs and driving operational improvement.
Power Systems
Power Systems' sales were $5.263 billion in the second quarter of 2013, a decrease of $248 million, or 5 percent, from the second quarter of 2012. The decrease was primarily the result of lower volume, partially offset by higher price realization. The lower sales were mainly due to decreases in electric power and petroleum applications. Sales declines in electric power applications were driven by dealers reducing their inventory levels in the second quarter of 2013, compared with dealers increasing inventory levels in the second quarter of 2012. Decreases in petroleum application sales were driven by declines in dealer deliveries to end users for drilling and well servicing. Sales of marine and industrial engines have improved.
Sales decreased in all regions except Asia/Pacific. In North America, the sales decrease was primarily due to declines in dealer deliveries to end users for petroleum well servicing. In EAME, the sales decrease was primarily due to reductions in dealer inventory for electric power applications. The improvement in Asia/Pacific was primarily due to increased drilling activities in the region and higher turbine sales in Australia, partially offset by lower demand for electric power applications.
Power Systems' profit was $955 million in the second quarter of 2013 compared with $982 million in the second quarter of 2012. The decrease was primarily due to lower sales volume, partially offset by lower costs, including incentive compensation expense, and favorable price realization.
62
Financial Products Segment
Financial Products' revenues were $806 million, an increase of $42 million, or 5 percent, from the second quarter of 2012. The increase was primarily due to the favorable impact from higher average
earning assets
across all geographic regions and an increase in Cat Insurance revenues, primarily in North America. These increases were partially offset by the unfavorable impact from lower average financing rates on new and existing finance receivables and operating leases, primarily in North America.
Financial Products' profit was $233 million in the second quarter of 2013, compared with $188 million in the second quarter of 2012. The increase was primarily due to a $31 million favorable impact from higher average earning assets and a $31 million favorable impact from lower claims experience at Cat Insurance, which includes favorable reserve adjustments. These increases were partially offset by a $22 million unfavorable impact from currency gains and losses.
At the end of the second quarter of 2013, past dues at Cat Financial were 2.64 percent compared with 2.52 percent at the end of the first quarter of 2013, 2.26 percent at the end of 2012 and 3.35 percent at the end of the second quarter of 2012. Although past dues have improved when compared with the second quarter of 2012, the increase from the end of 2012 and from the first quarter of 2013 reflects higher past dues in Cat Financial's Latin American, Asia/Pacific and European portfolios. Write-offs, net of recoveries, were $27 million for the second quarter of 2013, up from $16 million for the second quarter of 2012.
As of June 30, 2013, Cat Financial's allowance for credit losses totaled $422 million or 1.46 percent of net finance receivables, compared with $426 million or 1.49 percent of net finance receivables at year-end 2012. The allowance for credit losses as of June 30, 2012, was $393 million or 1.47 percent of net finance receivables.
All Other Segment
All Other Segment
includes groups that provide services such as component manufacturing, remanufacturing and logistics.
The decrease in sales was primarily due to the absence of our third party logistics business, which was sold in the third quarter of 2012. Lower profit was also the result of the absence of our third party logistics business, partially offset by lower expenses.
Corporate Items and Eliminations
Expense for corporate items and eliminations was $657 million in the second quarter of 2013, a decrease of $125 million from the second quarter of 2012. Corporate items and eliminations include: corporate-level expenses; timing differences, as some expenses are reported in segment profit on a cash basis; retirement benefit costs other than service cost; currency differences for M&PS, as segment profit is reported using annual fixed exchange rates; and inter-segment eliminations.
The decrease in expense from the second quarter of 2012 was primarily due to favorable impacts from timing and currency. Segment profit for 2013 is based on fixed exchange rates set at the beginning of 2013, while segment profit for 2012 is based on fixed exchange rates set at the beginning of 2012. The difference in actual exchange rates compared with fixed exchange rates is included in corporate items and eliminations and is not reflected in segment profit.
63
SIX MONTHS ENDED JUNE 30, 2013 COMPARED WITH SIX MONTHS ENDED JUNE 30, 2012
CONSOLIDATED SALES AND REVENUES
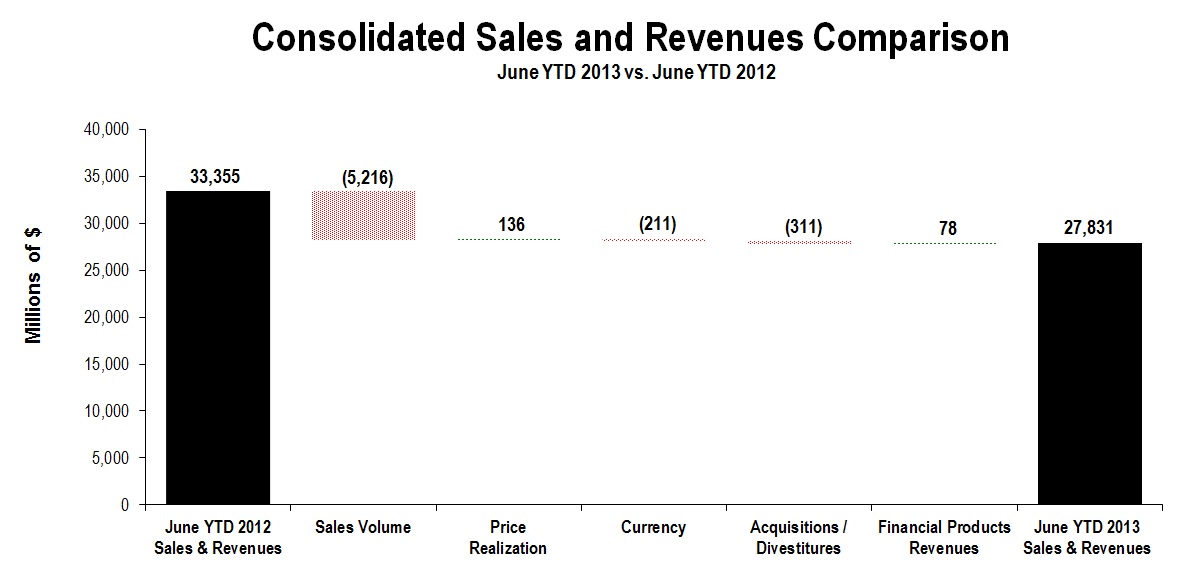
The chart above graphically illustrates reasons for the change in Consolidated Sales and Revenues between the six months ended June 30, 2012 (at left) and the six months ended June 30, 2013 (at right). Items favorably impacting sales and revenues appear as upward stair steps with the corresponding dollar amounts above each bar, while items negatively impacting sales and revenues appear as downward stair steps with dollar amounts reflected in parentheses above each bar. Caterpillar management utilizes these charts internally to visually communicate with the company's Board of Directors and employees.
Total sales and revenues were $27.831 billion for the six months ended June 30, 2013, a decrease of $5.524 billion, or 17 percent, from the six months ended June 30, 2012. When reviewing the change in sales and revenues, we focus on the following perspectives:
|
•
|
Reason for the change: Sales volume decreased $5.216 billion with the most significant decline in Resource Industries. More than half of the total volume decrease was related to changes in dealer machine inventory, and the remainder was primarily due to lower machine dealer deliveries to end users. During the six months ended June 30, 2012, dealers increased machine inventory about $1.2 billion in anticipation of higher demand. In the six months ended June 30, 2013, dealers reduced their machine inventory by about $1.7 billion. Most of the decline was related to Resource Industries' products, as dealers adjusted inventory levels in response to lower end-user demand. We believe that slower economic growth and continued uncertainty regarding economic recoveries have influenced dealer inventory levels and end-user demand levels.
|
In addition, the net impact of acquisitions and divestitures was unfavorable $311 million mainly due to the absence of our third party logistics business, and the impact of currency was unfavorable $211 million. These decreases were partially offset by favorable price realization of $136 million and increased Financial Products' revenues of $78 million.
While sales for both new equipment and aftermarket parts declined, the more significant decrease was for new equipment. In the context of the total sales decrease, the decline in aftermarket parts was not a significant factor.
|
•
|
Sales by geographic region: Sales declined in all geographic regions, with the most significant reductions in Asia/Pacific and North America. While sales in Asia/Pacific declined overall, sales in China excluding acquisitions increased 12 percent from the first half of 2012. The decline in Asia/Pacific was primarily related to lower mining sales in our Resource Industries segment, with the most significant decrease occurring in Australia. Sales were lower for all segments in North America, with about half of the decline due to lower mining sales.
|
|
•
|
Sales by segment: Sales decreased in all segments. The most significant decrease was in Resource Industries, with sales down 29 percent primarily from dealer inventory changes and weaker demand in mining. Construction Industries' sales decreased 13 percent, and Power Systems' sales were 8 percent lower. Financial Products' segment revenues were up 5 percent.
|
64
CONSOLIDATED OPERATING PROFIT
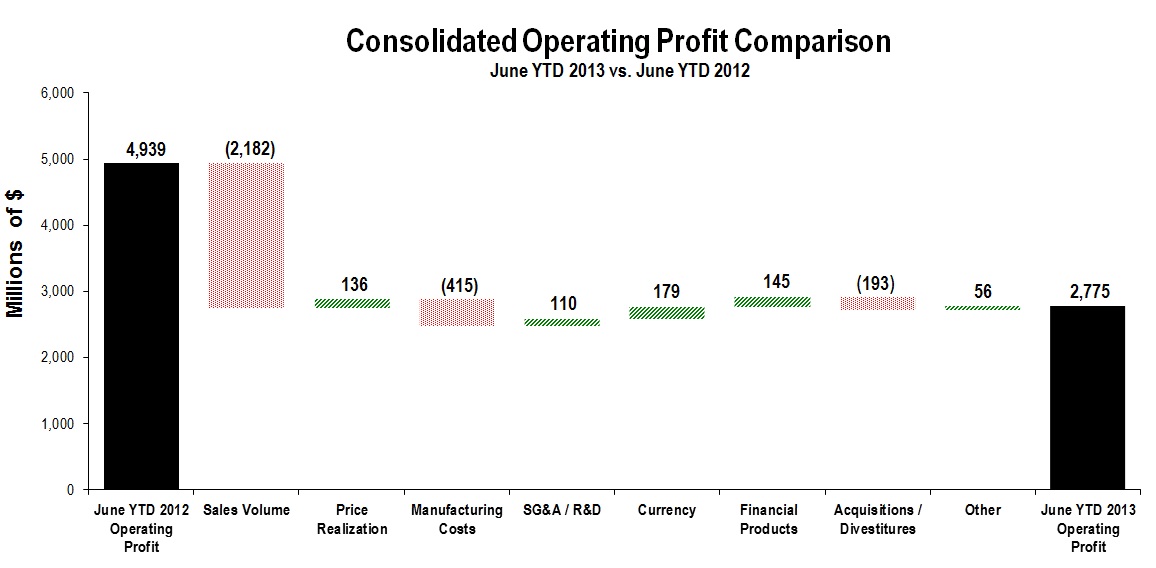
The chart above graphically illustrates reasons for the change in Consolidated Operating Profit between the six months ended June 30, 2012 (at left) and the six months ended June 30, 2013 (at right). Items favorably impacting operating profit
appear as upward stair steps with the corresponding dollar amounts above each bar, while items negatively impacting operating profit appear as downward stair steps with dollar amounts reflected in parentheses above each bar. Caterpillar management utilizes these charts internally to visually communicate with the company's Board of Directors and employees. The bar entitled Other includes consolidating adjustments and Machinery and Power Systems other operating (income) expenses.
Operating profit for the six months ended June 30, 2013 was $2.775 billion compared with $4.939 billion for the six months ended June 30, 2012. The decrease was primarily the result of lower sales volume, which included an unfavorable mix of products. Manufacturing costs and the impact of acquisitions and divestitures were also unfavorable to operating profit.
Manufacturing costs increased $415 million. The increase was primarily due to unfavorable changes in cost absorption resulting from a decrease in inventory during the six months ended June 30, 2013 and an increase in inventory during the six months ended June 30, 2012. This unfavorable impact was partially offset by lower material costs.
We reduced inventory in both the fourth quarter of 2012 and the first half of 2013. The groundwork for these reductions began in mid-2012 as economic indicators began to soften and actions were needed to bring inventory levels in line with expected demand. Based on softening economic conditions worldwide and the amount of finished goods we had available in our product distribution centers, dealers also took action to lower their inventories. As a result, new orders from dealers declined sharply in the third quarter of 2012, and we began lowering production schedules and incoming material purchases from suppliers around the world. While production schedules began to decline in the third quarter, the most significant impacts on production and inventory, including rolling plant shutdowns at a number of facilities, occurred in the fourth quarter of 2012 and continued into the first half of 2013. Inventory for all segments declined during the fourth quarter of 2012, and the decline during the six months ended June 30, 2013 was primarily in Construction Industries.
Acquisitions and divestitures negatively impacted operating profit by $193 million. The six months ended June 30, 2012 included substantial pre-tax gains on the sale of portions of the Bucyrus distribution business, while the impact on the six months ended June 30, 2013 was negative. The absence of profit from our third party logistics business, which was sold in the third quarter of 2012, was unfavorable to operating profit. The $135 million favorable impact from the settlement with the previous owners of our Siwei acquisition was partially offset by other operating losses at Siwei.
Currency favorably impacted operating profit by $179 million, mostly due to the Japanese yen. We have a sizeable manufacturing presence in Japan, and while some of this production is sold in Japan, we are a net exporter, and, therefore, a weaker yen provides a cost benefit.
In addition, Financial Products' operating profit increased $145 million, and the impact of price realization was favorable $136 million primarily from our Power Systems segment. The decline in SG&A and R&D expenses was positive to operating profit $110 million, mostly due to decreased incentive compensation expense, partially offset by higher wage and benefit inflation.
65
Short term incentive compensation expense related to the six months ended June 30, 2013 was about $250 million compared with about $500 million in the six months ended June 30, 2012.
Other Profit/Loss Items
|
•
|
Other income/expense
was expense of
$55 million compared with income of $158 million in the six months ended June 30, 2012. The change was primarily due to the unfavorable impact of currency translation and hedging gains and losses. Translation and hedging losses in the six months ended June 30, 2013 totaled $158 million, with over half of the impact from translation losses. In the six months ended June 30, 2012, we had translation and hedging gains of $28 million. Most of the impact in the six months ended June 30, 2013 was a result of our net asset/liability positions and exchange rate movements primarily for the Japanese yen.
|
|
•
|
The provision for income taxes
for the first six months of 2013 reflects an estimated annual effective tax rate of 29 percent compared with 30.5 percent for 2012, excluding the items discussed below. The decrease is primarily due to the U.S. research and development tax credit that was expired in 2012 along with expected changes in our geographic mix of profits from a tax perspective.
|
The 2013 tax provision also includes a benefit of $87 million primarily related to the research and development tax credit that was retroactively extended for 2012. This compares to a $75 million negative impact related to nondeductible goodwill in the first half of 2012.
66
Segment Information
|
Sales and Revenues by Geographic Region
|
|
(Millions of dollars)
|
Total
|
%
Change
|
North
America
|
%
Change
|
Latin
America
|
%
Change
|
EAME
|
%
Change
|
Asia/
Pacific
|
%
Change
|
||||||||||||||||||||||||
|
Six months ended June 30, 2013
|
|
|
|
|
|
|
|
|
|
|
|
|
|
|
|
|
|
|
|
|
||||||||||||||
|
Construction Industries
1
|
$
|
9,047
|
|
(13
|
)%
|
$
|
3,514
|
|
(6
|
)%
|
$
|
1,296
|
|
(9
|
)%
|
$
|
1,997
|
|
(22
|
)%
|
$
|
2,240
|
|
(16
|
)%
|
|||||||||
|
Resource Industries
2
|
7,247
|
|
(29
|
)%
|
2,231
|
|
(29
|
)%
|
1,389
|
|
(11
|
)%
|
1,802
|
|
(17
|
)%
|
1,825
|
|
(44
|
)%
|
||||||||||||||
|
Power Systems
3
|
9,668
|
|
(8
|
)%
|
4,030
|
|
(11
|
)%
|
993
|
|
(10
|
)%
|
2,588
|
|
(9
|
)%
|
2,057
|
|
4
|
%
|
||||||||||||||
|
All Other Segment
4
|
428
|
|
(54
|
)%
|
293
|
|
(34
|
)%
|
14
|
|
(63
|
)%
|
68
|
|
(76
|
)%
|
53
|
|
(69
|
)%
|
||||||||||||||
|
Corporate Items and Eliminations
|
(20
|
)
|
(25
|
)
|
1
|
|
2
|
|
2
|
|
||||||||||||||||||||||||
|
Machinery & Power Systems Sales
|
26,370
|
|
(18
|
)%
|
10,043
|
|
(15
|
)%
|
3,693
|
|
(11
|
)%
|
6,457
|
|
(18
|
)%
|
6,177
|
|
(24
|
)%
|
||||||||||||||
|
Financial Products Segment
|
1,601
|
|
5
|
%
|
821
|
|
2
|
%
|
219
|
|
11
|
%
|
245
|
|
8
|
%
|
316
|
|
7
|
%
|
||||||||||||||
|
Corporate Items and Eliminations
|
(140
|
)
|
(78
|
)
|
(16
|
)
|
(14
|
)
|
(32
|
)
|
||||||||||||||||||||||||
|
Financial Products Revenues
|
1,461
|
|
6
|
%
|
743
|
|
4
|
%
|
203
|
|
12
|
%
|
231
|
|
9
|
%
|
284
|
|
3
|
%
|
||||||||||||||
|
Consolidated Sales and Revenues
|
$
|
27,831
|
|
(17
|
)%
|
$
|
10,786
|
|
(14
|
)%
|
$
|
3,896
|
|
(10
|
)%
|
$
|
6,688
|
|
(17
|
)%
|
$
|
6,461
|
|
(23
|
)%
|
|||||||||
|
Six months ended June 30, 2012
|
|
|
|
|
|
|
|
|
|
|
|
|
|
|
|
|
|
|
||||||||||||||||
|
Construction Industries
1
|
$
|
10,402
|
|
$
|
3,746
|
|
$
|
1,421
|
|
$
|
2,565
|
|
$
|
2,670
|
|
|
|
|||||||||||||||||
|
Resource Industries
2
|
10,168
|
|
3,149
|
|
1,566
|
|
2,172
|
|
3,281
|
|
|
|
||||||||||||||||||||||
|
Power Systems
3
|
10,498
|
|
4,551
|
|
1,109
|
|
2,851
|
|
1,987
|
|
|
|
||||||||||||||||||||||
|
All Other Segment
4
|
928
|
|
442
|
|
38
|
|
279
|
|
169
|
|
|
|
||||||||||||||||||||||
|
Corporate Items and Eliminations
|
(24
|
)
|
(24
|
)
|
—
|
|
—
|
|
—
|
|
||||||||||||||||||||||||
|
Machinery & Power Systems Sales
|
31,972
|
|
|
|
11,864
|
|
|
|
4,134
|
|
|
|
7,867
|
|
|
|
8,107
|
|
|
|
||||||||||||||
|
Financial Products Segment
|
1,525
|
|
807
|
|
197
|
|
227
|
|
294
|
|
|
|
||||||||||||||||||||||
|
Corporate Items and Eliminations
|
(142
|
)
|
(94
|
)
|
(15
|
)
|
(15
|
)
|
(18
|
)
|
|
|
||||||||||||||||||||||
|
Financial Products Revenues
|
1,383
|
|
|
|
713
|
|
|
|
182
|
|
|
|
212
|
|
|
|
276
|
|
|
|
||||||||||||||
|
Consolidated Sales and Revenues
|
$
|
33,355
|
|
|
|
$
|
12,577
|
|
|
|
$
|
4,316
|
|
|
|
$
|
8,079
|
|
|
|
$
|
8,383
|
|
|
|
|||||||||
|
1
|
Does not include inter-segment sales of $224 million and $253 million for the six months ended June 30, 2013 and 2012, respectively.
|
|
2
|
Does not include inter-segment sales of $453 million and $656 million for the six months ended June 30, 2013 and 2012, respectively.
|
|
3
|
Does not include inter-segment sales of $857 million and $1,355 million for the six months ended June 30, 2013 and 2012, respectively.
|
|
4
|
Does not include inter-segment sales of $1,578 million and $1,834 million for the six months ended June 30, 2013 and 2012, respectively.
|
67
|
Sales and Revenues by Segment
|
||||||||||||||||||||||||||||||||||
|
(Millions of dollars)
|
Six months ended June 30, 2012
|
Sales
Volume
|
Price
Realization
|
Currency
|
Acquisitions/Divestitures
|
Other
|
Six months ended June 30, 2013
|
$
Change
|
%
Change
|
|||||||||||||||||||||||||
|
Construction Industries
|
$
|
10,402
|
|
$
|
(1,193
|
)
|
$
|
(4
|
)
|
$
|
(158
|
)
|
$
|
—
|
|
$
|
—
|
|
$
|
9,047
|
|
$
|
(1,355
|
)
|
(13
|
)%
|
||||||||
|
Resource Industries
|
10,168
|
|
(2,943
|
)
|
35
|
|
(31
|
)
|
18
|
|
—
|
|
7,247
|
|
(2,921
|
)
|
(29
|
)%
|
||||||||||||||||
|
Power Systems
|
10,498
|
|
(916
|
)
|
106
|
|
(20
|
)
|
—
|
|
—
|
|
9,668
|
|
(830
|
)
|
(8
|
)%
|
||||||||||||||||
|
All Other Segment
|
928
|
|
(170
|
)
|
—
|
|
(1
|
)
|
(329
|
)
|
—
|
|
428
|
|
(500
|
)
|
(54
|
)%
|
||||||||||||||||
|
Corporate Items and Eliminations
|
(24
|
)
|
6
|
|
(1
|
)
|
(1
|
)
|
—
|
|
—
|
|
(20
|
)
|
4
|
|
|
|
||||||||||||||||
|
Machinery & Power Systems Sales
|
31,972
|
|
(5,216
|
)
|
136
|
|
(211
|
)
|
(311
|
)
|
—
|
|
26,370
|
|
(5,602
|
)
|
(18
|
)%
|
||||||||||||||||
|
Financial Products Segment
|
1,525
|
|
—
|
|
—
|
|
—
|
|
—
|
|
76
|
|
1,601
|
|
76
|
|
5
|
%
|
||||||||||||||||
|
Corporate Items and Eliminations
|
(142
|
)
|
—
|
|
—
|
|
—
|
|
—
|
|
2
|
|
(140
|
)
|
2
|
|
|
|
||||||||||||||||
|
Financial Products Revenues
|
1,383
|
|
—
|
|
—
|
|
—
|
|
—
|
|
78
|
|
1,461
|
|
78
|
|
6
|
%
|
||||||||||||||||
|
Consolidated Sales and Revenues
|
$
|
33,355
|
|
$
|
(5,216
|
)
|
$
|
136
|
|
$
|
(211
|
)
|
$
|
(311
|
)
|
$
|
78
|
|
$
|
27,831
|
|
$
|
(5,524
|
)
|
(17
|
)%
|
||||||||
|
Operating Profit by Segment
|
||||||||||||||
|
(Millions of dollars)
|
Six months ended June 30, 2013
|
Six months ended June 30, 2012
|
$ Change
|
%
Change
|
||||||||||
|
Construction Industries
|
$
|
601
|
|
$
|
1,304
|
|
$
|
(703
|
)
|
(54
|
)%
|
|||
|
Resource Industries
|
1,027
|
|
2,594
|
|
(1,567
|
)
|
(60
|
)%
|
||||||
|
Power Systems
|
1,553
|
|
1,794
|
|
(241
|
)
|
(13
|
)%
|
||||||
|
All Other Segment
|
377
|
|
406
|
|
(29
|
)
|
(7
|
)%
|
||||||
|
Corporate Items and Eliminations
|
(1,168
|
)
|
(1,395
|
)
|
227
|
|
|
|
||||||
|
Machinery & Power Systems
|
2,390
|
|
4,703
|
|
(2,313
|
)
|
(49
|
)%
|
||||||
|
Financial Products Segment
|
506
|
|
393
|
|
113
|
|
29
|
%
|
||||||
|
Corporate Items and Eliminations
|
17
|
|
(15
|
)
|
32
|
|
|
|
||||||
|
Financial Products
|
523
|
|
378
|
|
145
|
|
38
|
%
|
||||||
|
Consolidating Adjustments
|
(138
|
)
|
(142
|
)
|
4
|
|
|
|
||||||
|
Consolidated Operating Profit
|
$
|
2,775
|
|
$
|
4,939
|
|
$
|
(2,164
|
)
|
(44
|
)%
|
|||
Construction Industries
Construction Industries' sales were $9.047 billion in the six months ended June 30, 2013, a decrease of $1.355 billion, or 13 percent, from the six months ended June 30, 2012. The sales decrease was mainly due to lower volume resulting primarily from changes in dealer machine inventory and decreases in dealer deliveries to end users. Dealer-reported machine inventory decreased in the six months ended June 30, 2013 and increased in the six months ended June 30, 2012. Dealers are utilizing inventory from our product distribution centers at a higher rate allowing them to maintain inventory levels below historical averages. Sales of new equipment declined, and sales of aftermarket parts were about flat.
Sales declined in all geographic regions, primarily due to lower sales in EAME and Asia/Pacific. The lower sales in EAME were primarily due to changes in dealer inventory, and construction activity in Europe remains low. In Asia/Pacific, changes in dealer inventory and decreases in dealer deliveries to end users had about the same impact on sales. In China, our sales increased while the overall industry declined. Increases in China were more than offset by sales declines in other countries due to slower economic growth. Although the worldwide construction industry is showing some signs of improvement, it remains relatively depressed from a historical standpoint, which is negative for the construction equipment industry.
Construction Industries' profit was $601 million in the six months ended June 30, 2013 compared with $1.304 billion in the six months ended June 30, 2012. The decrease in profit was primarily due to lower sales volume, including an unfavorable mix of products, and increased manufacturing costs. Higher manufacturing costs were driven primarily by unfavorable changes in cost absorption resulting from a decrease in inventory during the six months ended June 30, 2013 and an increase in inventory during the six months ended June 30, 2012, partially offset by lower material costs.
68
Resource Industries
Resource Industries' sales were $7.247 billion in the six months ended June 30, 2013, a decrease of $2.921 billion, or 29 percent, from the six months ended June 30, 2012, mainly due to decreases in sales volume. The decline in sales volume was primarily due to changes in dealer machine inventory. Dealers significantly reduced machine inventory during the six months ended June 30, 2013 to better align their inventory levels with expected demand. This compares with an increase in dealer machine inventory during the six months ended June 30, 2012. The decline in sales volume was also impacted by a decrease in dealer deliveries to end users as mining companies reduced their capital expenditures. Although industry data indicates that mine production in 2013 is higher than it was in 2012, capital expenditures by mining companies which include equipment purchases have been reduced across the mining industry. As a result, new orders for mining equipment continued to be weak and were below the first half of 2012, and continued substantial reductions in dealer machine inventory are expected during the second half of 2013. Sales decreased in every region of the world. The most significant decline was in Asia/Pacific, where nearly half of the worldwide dealer inventory impacts occurred.
While sales for both new equipment and aftermarket parts declined, most of the decrease was for new mining equipment. In the context of the total sales decrease for Resource Industries, the decline in aftermarket parts was not a significant factor. Although collectively, sales of equipment for the forestry, paving and quarry and aggregate industries declined, most of the decline in Resource Industries' sales in the six months ended June 30, 2013 was mining equipment. While dealer deliveries to end users have declined, sales of our equipment are doing better than the equipment industry overall.
Resource Industries' profit was $1.027 billion in the six months ended June 30, 2013 compared with $2.594 billion in the six months ended June 30, 2012. The decrease was primarily the result of lower sales volume, increased manufacturing costs and the unfavorable impact of acquisitions and divestitures, partially offset by lower SG&A and R&D expenses.
The increase in manufacturing costs was primarily driven by unfavorable changes in cost absorption resulting from a decrease in inventory during the six months ended June 30, 2013 and an increase in inventory during the six months ended June 30, 2012.
Acquisitions and divestitures negatively impacted profit by $132 million. The six months ended June 30, 2012 included substantial pre-tax gains on the sale of portions of the Bucyrus distribution business, while the impact on the six months ended June 30, 2013 was negative. The $135 million favorable impact from the settlement with the previous owners of our Siwei acquisition was partially offset by other operating losses at Siwei.
Decreases in SG&A and R&D expenses were driven by cost-reduction measures implemented in response to lower volumes as well as lower incentive compensation expense.
Due to the substantial decline in Resource Industries' sales and the uncertainty around when cyclical recovery will resume, we have taken substantial action to adjust production levels and to reduce costs. We expect to take additional action in the second half of the year with the intention of further reducing costs and driving operational improvement.
Power Systems
Power Systems' sales were $9.668 billion for the six months ended June 30, 2013, a decrease of $830 million, or 8 percent, compared with the six months ended June 30, 2012. The decrease was primarily the result of lower volume, partially offset by higher price realization. The lower sales were mainly due to decreases in electric power and petroleum applications. Sales declines in electric power applications were primarily driven by dealers reducing their inventory levels for the six months ended June 30, 2013, compared with dealers increasing inventory levels for the six months ended June 30, 2012. Decreases in petroleum application sales were driven by declines in dealer deliveries to end users for drilling and well servicing.
Sales decreased in all regions except Asia/Pacific where sales were about flat. In North America, the sales decrease was primarily due to declines in dealer deliveries to end users with the largest decline in petroleum drilling and well servicing applications. In EAME, the sales decrease was primarily due to changes in dealer inventory for electric power applications.
Power Systems' profit was $1.553 billion for the six months ended June 30, 2013 compared with $1.794 billion for the six months ended June 30, 2012. The decrease was primarily due to lower sales volume, which included a favorable mix of products, partially offset by favorable price realization and lower incentive compensation expense.
Financial Products Segment
Financial Products' revenues were $1.601 billion for the six months ended June 30, 2013, an increase of $76 million, or 5 percent, from the six months ended June 30, 2012. The increase was primarily due to the favorable impact from higher average earning assets across all geographic regions and an increase in Cat Insurance revenues, primarily in North America. These increases were partially offset by the unfavorable impact from lower average financing rates on new and existing finance receivables and operating leases across all geographic regions.
69
Financial Products' profit of $506 million in the first half of 2013 was up $113 million from the first half of 2012. The increase was primarily due to an $80 million favorable impact from lower claims experience at Cat Insurance, which includes favorable reserve adjustments, and a $65 million favorable impact from higher average earning assets. These increases were partially offset by a $23 million unfavorable impact from currency gains and losses.
All Other Segment
All Other Segment includes groups that provide services such as component manufacturing, remanufacturing and logistics.
The decrease in sales was primarily due to the absence of our third party logistics business, which was sold in the third quarter of 2012. Lower profit was also primarily the result of the absence of our third party logistics business, partially offset by lower expenses.
Corporate Items and Eliminations
Expense for corporate items and eliminations was $1.151 billion in the six months ended June 30, 2013, a decrease of $259 million from the six months ended June 30, 2012. Corporate items and eliminations include: corporate-level expenses; timing differences, as some expenses are reported in segment profit on a cash basis; retirement benefit costs other than service cost; currency differences for M&PS, as segment profit is reported using annual fixed exchange rates; and inter-segment eliminations.
The decrease in expense from the six months ended June 30, 2012 was primarily due to timing differences.
GLOSSARY OF TERMS
|
1.
|
All Other Segment
- Primarily includes activities such as: the remanufacturing of Cat engines and components and remanufacturing services for other companies as well as the product management, development, manufacturing, marketing and product support of undercarriage, specialty products, hardened bar stock components and ground engaging tools primarily for Caterpillar products; logistics services; the product management, development, marketing, sales and product support of on-highway vocational trucks for North America; distribution services responsible for dealer development and administration, dealer portfolio management and ensuring the most efficient and effective distribution of machines, engines and parts. On July 31, 2012, we sold a majority interest in Caterpillar's third party logistics business.
|
|
2.
|
Consolidating Adjustments
- Eliminations of transactions between Machinery and Power Systems and Financial Products.
|
|
3.
|
Construction Industries
- A segment primarily responsible for supporting customers using machinery in infrastructure and building construction applications. Responsibilities include business strategy, product design, product management and development, manufacturing, marketing, and sales and product support. The product portfolio includes backhoe loaders, small wheel loaders, small track-type tractors, skid steer loaders, multi-terrain loaders, mini excavators, compact wheel loaders, select work tools, small, medium and large track excavators, wheel excavators, medium wheel loaders, medium track-type tractors, track-type loaders, motor graders and pipe layers. In addition, Construction Industries has responsibility for Power Systems and three wholly-owned dealers in Japan and an integrated manufacturing cost center.
|
|
4.
|
Currency
- With respect to sales and revenues, currency represents the translation impact on sales resulting from changes in foreign currency exchange rates versus the U.S. dollar. With respect to operating profit, currency represents the net translation impact on sales and operating costs resulting from changes in foreign currency exchange rates versus the U.S. dollar. Currency includes the impact on sales and operating profit for the Machinery and Power Systems lines of business only; currency impacts on Financial Products revenues and operating profit are included in the Financial Products portions of the respective analyses. With respect to other income/expense, currency represents the effects of forward and option contracts entered into by the company to reduce the risk of fluctuations in exchange rates and the net effect of changes in foreign currency exchange rates on our foreign currency assets and liabilities for consolidated results.
|
|
5.
|
Debt-to-Capital Ratio
- A key measure of Machinery and Power Systems' financial strength used by both management and our credit rating agencies. The metric is defined as Machinery and Power Systems' short-term borrowings, long-term debt due within one year and long-term debt due after one year (debt) divided by the sum of Machinery and Power Systems' debt and stockholders' equity. Debt also includes Machinery and Power Systems' borrowings from Financial Products.
|
|
6.
|
EAME
- A geographic region including Europe, Africa, the Middle East and the Commonwealth of Independent States (CIS).
|
|
7.
|
Earning Assets
- Assets consisting primarily of total finance receivables net of unearned income, plus equipment on operating leases, less accumulated depreciation at Cat Financial.
|
70
|
8.
|
Financial Products Segment
-
Provides financing to customers and dealers for the purchase and lease of Caterpillar and other equipment, as well as some financing for Caterpillar sales to dealers. Financing plans include operating and finance leases, installment sale contracts, working capital loans and wholesale financing plans. The segment also provides various forms of insurance to customers and dealers to help support the purchase and lease of our equipment.
|
|
9.
|
Latin America
- Geographic region including Central and South American countries and Mexico.
|
|
10.
|
Machinery and Power Systems (M&PS)
- Represents the aggregate total of Construction Industries, Resource Industries, Power Systems and All Other Segment and related corporate items and eliminations.
|
|
11.
|
Machinery and Power Systems Other Operating (Income) Expenses
- Comprised primarily of gains/losses on disposal of long-lived assets, long-lived asset impairment charges, pension curtailment charges and employee redundancy costs.
|
|
12.
|
Manufacturing Costs
- Manufacturing costs exclude the impacts of currency and represent the volume-adjusted change for variable costs and the absolute dollar change for period manufacturing costs. Variable manufacturing costs are defined as having a direct relationship with the volume of production. This includes material costs, direct labor and other costs that vary directly with production volume such as freight, power to operate machines and supplies that are consumed in the manufacturing process. Period manufacturing costs support production but are defined as generally not having a direct relationship to short-term changes in volume. Examples include machinery and equipment repair, depreciation on manufacturing assets, facility support, procurement, factory scheduling, manufacturing planning and operations management.
|
|
13.
|
Power Systems
- A segment primarily responsible for supporting customers using reciprocating engines, turbines and related parts across industries serving electric power, industrial, petroleum and marine applications as well as rail-related businesses. Responsibilities include business strategy, product design, product management, development, manufacturing, marketing, sales and product support of reciprocating engine powered generator sets, integrated systems used in the electric power generation industry, reciprocating engines and integrated systems and solutions for the marine and petroleum industries; reciprocating engines supplied to the industrial industry as well as Caterpillar machinery; the business strategy, product design, product management, development, manufacturing, marketing, sales and product support of turbines and turbine-related services; the development, manufacturing, remanufacturing, maintenance, leasing, and service of diesel-electric locomotives and components and other rail-related products and services.
|
|
14.
|
Price Realization
- The impact of net price changes excluding currency and new product introductions. Consolidated price realization includes the impact of changes in the relative weighting of sales between geographic regions.
|
|
15.
|
Resource Industries
- A segment primarily responsible for supporting customers using machinery in mining and quarrying applications. Responsibilities include business strategy, product design, product management and development, manufacturing, marketing and sales and product support. The product portfolio includes large track-type tractors, large mining trucks, underground mining equipment, electric rope shovels, draglines, hydraulic shovels, drills, highwall miners, tunnel boring equipment, large wheel loaders, off-highway trucks, articulated trucks, wheel tractor scrapers, wheel dozers, select work tools, forestry products, paving products, industrial and waste products, machinery components and electronics and control systems. Resource Industries also manages areas that provide services to other parts of the company, including integrated manufacturing and research and development. In addition, segment profit includes the impact from divestiture of portions of the Bucyrus distribution business and the acquisition of Siwei.
|
|
16.
|
Sales Volume
- With respect to sales and revenues, sales volume represents the impact of changes in the quantities sold for Machinery and Power Systems as well as the incremental revenue impact of new product introductions, including emissions-related product updates. With respect to operating profit, sales volume represents the impact of changes in the quantities sold for Machinery and Power Systems combined with product mix as well as the net operating profit impact of new product introductions, including emissions-related product updates. Product mix represents the net operating profit impact of changes in the relative weighting of Machinery and Power Systems sales with respect to total sales.
|
|
17.
|
Siwei
- ERA Mining Machinery Limited, including its wholly-owned subsidiary Zhengzhou Siwei Mechanical & Electrical Manufacturing Co., Ltd., commonly known as Siwei, which was acquired during the second quarter of 2012. Siwei primarily designs, manufactures, sells and supports underground coal mining equipment in China and is included in our Resource Industries segment.
|
71
LIQUIDITY AND CAPITAL RESOURCES
Sources of funds
We generate significant capital resources from operating activities, which are the primary source of funding for our Machinery and Power Systems' operations. Funding for these businesses is also provided by commercial paper and long-term debt issuances. Financial Products' operations are funded primarily from commercial paper, term debt issuances and collections from the existing portfolio. Throughout the first half of 2013, we experienced favorable liquidity conditions globally in both our Machinery and Power Systems and Financial Products' operations. On a consolidated basis, we ended the second quarter of 2013 with $6.11 billion of cash, an increase of $620 million from year-end 2012. Our cash balances are held in numerous locations throughout the world with approximately $3 billion held by our non-U.S. subsidiaries. Amounts held outside the United States are available for general corporate use and could be used in the United States without incurring significant additional U.S. taxes.
Consolidated operating cash flow for the first half of 2013 was $4.59 billion, up from $1.98 billion for the same period a year ago. The increase was primarily due to changes in inventory. During the first half of 2013, inventory decreased in order to align with current demand levels, whereas during the same period of 2012, inventory increased in anticipation of higher sales. Favorable inventory changes were partially offset by lower profit and changes in customer advances. See further discussion of operating cash flow under Machinery and Power Systems and Financial Products.
Total debt as of June 30, 2013 was $39.55 billion, a decrease of $592 million from year-end 2012. Debt related to Financial Products increased $370 million, primarily at Cat Financial, reflecting increasing portfolio balances. Debt related to Machinery and Power Systems decreased $962 million from year-end 2012, primarily due to payments on matured long-term debt.
We have three global credit facilities with a syndicate of banks totaling $10.00 billion (Credit Facility) available in the aggregate to both Caterpillar and Cat Financial for general liquidity purposes. Based on management's allocation decision, which can be revised from time to time, the portion of the Credit Facility available to Machinery and Power Systems as of June 30, 2013 was $2.75 billion.
|
•
|
The 364-day facility of $3.00 billion (of which $0.82 billion is available to Machinery and Power Systems) expires in September 2013.
|
|
•
|
The 2010 four-year facility, as amended, of $2.60 billion (of which $0.72 billion is available to Machinery and Power Systems) expires in September 2015.
|
|
•
|
The 2011 five-year facility, as amended, of $4.40 billion (of which $1.21 billion is available to Machinery and Power Systems) expires in September 2017.
|
At June 30, 2013, Caterpillar's consolidated net worth was $24.32 billion, which was above the $9.00 billion required under the Credit Facility. The consolidated net worth is defined in the Credit Facility as the consolidated stockholders' equity including preferred stock but excluding the pension and other postretirement benefits balance within Accumulated other comprehensive income (loss).
At June 30, 2013, Cat Financial's covenant interest coverage ratio was 1.77 to 1. This is above the 1.15 to 1 minimum ratio calculated as (1) profit excluding income taxes, interest expense and net gain/(loss) from interest rate derivatives to (2) interest expense calculated at the end of each calendar quarter for the rolling four quarter period then most recently ended, required by the Credit Facility.
In addition, at June 30, 2013, Cat Financial's covenant leverage ratio was 8.47 to 1. This is below the maximum ratio of debt to net worth of 10 to 1, calculated (1) on a monthly basis as the average of the leverage ratios determined on the last day of each of the six preceding calendar months and (2) at each December 31, required by the Credit Facility.
In the event Caterpillar or Cat Financial does not meet one or more of their respective financial covenants under the Credit Facility in the future (and are unable to obtain a consent or waiver), the bank group may terminate the commitments allocated to the party that does not meet its covenants. Additionally, in such event, certain of Cat Financial's other lenders under other loan agreements where similar financial covenants or cross default provisions are applicable, may, at their election, choose to pursue remedies under those loan agreements, including accelerating the repayment of outstanding borrowings. At June 30, 2013, there were no borrowings under the Credit Facility.
Our total credit commitments as of June 30, 2013 were:
72
|
|
June 30, 2013
|
||||||||||
|
(Millions of dollars)
|
Consolidated
|
Machinery
and Power
Systems
|
Financial
Products
|
||||||||
|
Credit lines available:
|
|
|
|
|
|
|
|||||
|
Global credit facilities
|
$
|
10,000
|
|
$
|
2,750
|
|
$
|
7,250
|
|
||
|
Other external
|
5,207
|
|
602
|
|
4,605
|
|
|||||
|
Total credit lines available
|
15,207
|
|
3,352
|
|
11,855
|
|
|||||
|
Less: Commercial paper outstanding
|
(3,948
|
)
|
—
|
|
(3,948
|
)
|
|||||
|
Less: Utilized credit
|
(2,463
|
)
|
(392
|
)
|
(2,071
|
)
|
|||||
|
Available credit
|
$
|
8,796
|
|
$
|
2,960
|
|
$
|
5,836
|
|
||
Other consolidated credit lines with banks as of June 30, 2013 totaled $5.21 billion. These committed and uncommitted credit lines, which may be eligible for renewal at various future dates or have no specified expiration date, are used primarily by our subsidiaries for local funding requirements. Caterpillar or Cat Financial may guarantee subsidiary borrowings under these lines.
In the event that Caterpillar or Cat Financial, or any of their debt securities, experiences a credit rating downgrade, it would likely result in an increase in our borrowing costs and make access to certain credit markets more difficult. In the event economic conditions deteriorate such that access to debt markets becomes unavailable, our Machinery and Power Systems' operations would rely on cash flow from operations, use of existing cash balances, borrowings from Cat Financial and access to our Credit Facility. Our Financial Products' operations would rely on cash flow from its existing portfolio, utilization of existing cash balances, access to our Credit Facility and other credit line facilities of Cat Financial and potential borrowings from Caterpillar. In addition, we maintain a support agreement with Cat Financial, which requires Caterpillar to remain the sole owner of Cat Financial and which may, under certain circumstances, require Caterpillar to make payments to Cat Financial should Cat Financial fail to maintain certain financial ratios.
Machinery and Power Systems
Net cash provided by operating activities was $4.14 billion in the first half of 2013, compared with $1.52 billion for the same period in 2012. The increase was primarily due to changes in inventory. During the first half of 2013 inventory decreased in order to align with current demand levels, whereas during the same period of 2012, inventory increased in anticipation of higher sales. In addition, changes in receivables had a positive impact on operating cash flow. These favorable items were partially offset by lower profit and customer advances.
Net cash used for investing activities in the first half of 2013 was $1.30 billion, compared with $1.14 billion for the same period in 2012. Cash proceeds from the sale of portions of the Bucyrus distribution business were lower during the first half of 2013 as compared with the first half of 2012. Cash paid for investments and acquisitions was higher in 2012, primarily due to the acquisition of Siwei.
Net cash used for financing activities in the first half of 2013 was $2.15 billion, compared with net cash provided by financing activities of $630 million in the first half of 2012. The change was primarily due to the net issuance of long-term debt in the first half of 2012 as compared with the net payment of long-term debt in the first half of 2013. In addition, during the second quarter of 2013, $1 billion of stock was repurchased.
Our priorities for the use of cash are maintaining a strong financial position that helps maintain our credit rating, providing capital to support growth, appropriately funding employee benefit plans, paying dividends and repurchasing common stock with excess cash.
Strong financial position
–
A key measure of Machinery and Power Systems' financial strength used by both management and our credit rating agencies is Machinery and Power Systems' debt-to-capital ratio. Debt-to-capital is defined as short-term borrowings, long-term debt due within one year and long-term debt due after one year (debt) divided by the sum of debt and stockholders' equity. Debt also includes Machinery and Power Systems borrowings from Financial Products. The debt-to-capital ratio for Machinery and Power Systems was 34.9 percent at June 30, 2013, within our target range of 30 to 45 percent, compared with 37.4 percent at December 31, 2012. Payments on debt during the first half of 2013 were the primary contributor to the reduction in the debt-to-capital ratio.
73
Capital to support growth
–
Capital expenditures were $1.41 billion during the first half of 2013, compared to $1.55 billion for the same period in 2012. We expect capital expenditures for 2013 to be less than $3.0 billion.
Appropriately funded employee benefit plans
–
We made $280 million of contributions to our pension plans during the six months ended June 30, 2013. We currently anticipate full-year 2013 contributions of approximately $480 million, all of which are required. We made $293 million of contributions to our pension plans during the six months ended June 30, 2012.
Paying dividends
–
Dividends paid totaled $342 million in the second quarter of 2013, representing 52 cents per share paid. During the first quarter of 2013, there was no dividend payment, as it was accelerated into the fourth quarter of 2012. Each quarter, our Board of Directors reviews the company's dividend for the applicable quarter. The Board evaluates the financial condition of the company and considers the economic outlook, corporate cash flow, the company's liquidity needs and the health and stability of global credit markets to determine whether to maintain or change the quarterly dividend. On June 12, 2013, we increased the quarterly cash dividend 15 percent to 60 cents per share.
Common stock repurchases
–
In February 2007, the Board of Directors authorized the repurchase of $7.5 billion of Caterpillar stock, and in December 2011, the authorization was extended through December 2015. In April of this year, we announced our intention to repurchase approximately $1 billion of stock, which we completed in June. Through the end of the second quarter of 2013, $4.8 billion of the $7.5 billion authorization was spent, leaving $2.7 billion in the authorization. Basic shares outstanding as of June 30, 2013 were 648 million.
On July 29, 2013, we entered into a definitive agreement with Société Générale to purchase shares of our common stock under an accelerated stock repurchase transaction. Pursuant to the accelerated stock repurchase agreement, we have agreed to repurchase $1.0 billion of our common stock from Société Générale, with an immediate delivery of approximately 11.4 million shares. The final number of shares to be repurchased and the aggregate cost to Caterpillar will be based on Caterpillar's volume-weighted average stock price during the term of the transaction, which is expected to be completed in September 2013.
Financial Products
Financial Products' operating cash flow was $569 million in the first half of 2013, compared with $530 million for the same period a year ago. Net cash used for investing activities was $1.48 billion for the first half of 2013, compared with $2.12 billion for the same period in 2012. The change was primarily due to less net cash used for finance receivables due to slower growth in Cat Financial's portfolio. Net cash provided by financing activities was $883 million for the first half of 2013, compared with $2.76 billion for the same period in 2012. The change was primarily due to lower debt issuances needed to maintain Cat Financial's desired cash position and lower funding requirements for investing activities.
CRITICAL ACCOUNTING POLICIES
The preparation of financial statements in conformity with generally accepted accounting principles requires management to make estimates and assumptions that affect reported amounts. The more significant estimates include: residual values for leased assets, fair values for goodwill impairment tests, impairment of available-for-sale securities, warranty liability, stock-based compensation, reserves for product liability and insurance losses, postretirement benefits, post-sale discounts, credit losses and income taxes. We have incorporated many years of data into the determination of each of these estimates and we have not historically experienced significant adjustments. These assumptions are reviewed at least annually with the Audit Committee of the Board of Directors. Following are the methods and assumptions used in determining our estimates and an indication of the risks inherent in each.
Residual values for leased assets
– The residual values for Cat Financial’s leased assets, which are based upon the estimated wholesale market value of leased equipment at the time of the expiration of the lease, are based on a careful analysis of historical wholesale market sales prices, projected forward on a level trend line without consideration for inflation or possible future pricing action. At the inception of the lease, residual values are derived from consideration of the following critical factors: market size and demand, any known significant market/product trends, total expected hours of usage, machine configuration, application, location, model changes, quantities and past re-marketing experience, third-party residual guarantees and contractual customer purchase options. Many of these factors are gathered in an application survey that is completed prior to quotation. The lease agreement also clearly defines applicable return conditions and remedies for non-compliance, to ensure that the leased equipment will be in good operating condition upon return. Model changes and updates, as well as market strength and product acceptance, are monitored and adjustments are made to residual values in accordance with the significance of any such changes. Remarketing sales staff works closely with customers and dealers to manage the sale of lease returns and the recovery of residual exposure.
74
During the term of the leases, residual amounts are monitored. If estimated market values reflect a non-temporary impairment due to economic factors, obsolescence or other adverse circumstances, the residuals are adjusted to the lower estimated values by a charge to earnings. For equipment on operating leases, the charge is recognized through depreciation expense. For finance leases, it is recognized through a reduction of finance revenue.
Fair values for goodwill impairment tests
– We test goodwill for impairment annually, at the reporting unit level, and whenever events or circumstances make it likely that an impairment may have occurred, such as a significant adverse change in the business climate or a decision to sell all or a portion of a reporting unit. We perform our annual goodwill impairment test as of October 1 and monitor for interim triggering events on an ongoing basis.
Goodwill is reviewed for impairment utilizing a qualitative assessment or a two-step process. We have an option to make a qualitative assessment of a reporting unit's goodwill for impairment. If we choose to perform a qualitative assessment and determine the fair value more likely than not exceeds the carrying value, no further evaluation is necessary. For reporting units where we perform the two-step process, the first step requires us to compare the fair value of each reporting unit, which we primarily determine using an income approach based on the present value of discounted cash flows, to the respective carrying value, which includes goodwill. If the fair value of the reporting unit exceeds its carrying value, the goodwill is not considered impaired. If the carrying value is higher than the fair value, there is an indication that an impairment may exist and the second step is required. In step two, the implied fair value of goodwill is calculated as the excess of the fair value of a reporting unit over the fair values assigned to its assets and liabilities. If the implied fair value of goodwill is less than the carrying value of the reporting unit's goodwill, the difference is recognized as an impairment loss.
The impairment test process requires valuation of the respective reporting unit, which we primarily determine using an income approach based on a discounted five year forecasted cash flow with a year-five residual value. The residual value is computed using the constant growth method, which values the forecasted cash flows in perpetuity. The income approach is supported by a reconciliation of our calculated fair value for Caterpillar to the company's market capitalization. The assumptions about future cash flows and growth rates are based on each reporting unit's long-term forecast and are subject to review and approval by senior management. The discount rate is a risk-adjusted weighted average cost of capital, which we believe approximates the rate from a market participant's perspective. The estimated fair value could be impacted by changes in market conditions, interest rates, growth rates, tax rates, costs, pricing and capital expenditures.
A prolonged economic downturn resulting in lower long-term growth rates and reduced long-term profitability may reduce the fair value of our reporting units. Industry specific events or circumstances that have a negative impact to the valuation assumptions may also reduce the fair value of our reporting units. Should such events occur and it becomes more likely than not that a reporting unit's fair value has fallen below its carrying value, we will perform an interim goodwill impairment test(s), in addition to the annual impairment test. Future impairment tests may result in a goodwill impairment, depending on the outcome of both step one and step two of the impairment review process. A goodwill impairment would be reported as a non-cash charge to earnings.
Impairment of available-for-sale securities
–
Available-for-sale securities, primarily at Cat Insurance, are reviewed at least quarterly to identify fair values below cost which may indicate that a security is impaired and should be written down to fair value.
For debt securities, once a security’s fair value is below cost we utilize data gathered by investment managers, external sources and internal research to monitor the performance of the security to determine whether an other-than-temporary impairment has occurred. These reviews, which include an analysis of whether it is more likely than not that we will be required to sell the security before its anticipated recovery, consist of both quantitative and qualitative analysis and require a degree of management judgment. Securities in a loss position are monitored and assessed at least quarterly based on severity and timing of loss and may be deemed other-than-temporarily impaired at any time. Once a security’s fair value has been 20 percent or more below its original cost for six consecutive months, the security will be other-than-temporarily impaired unless there are sufficient facts and circumstances supporting otherwise.
For equity securities in a loss position, determining whether a security is other-than-temporarily impaired requires an analysis of that security's historical sector return as well as the volatility of that return. This information is utilized to estimate a security’s future fair value and to assess whether the security has the ability to recover to its original cost over a reasonable period of time. Both historical annualized sector returns and the volatility of those returns are considered over a two year period to arrive at these estimates.
For both debt and equity securities, qualitative factors are also considered in determining whether a security is other-than-temporarily impaired. These include reviews of the following: significant changes in the regulatory, economic or technological environment
75
of the investee, significant changes in the general market condition of either the geographic area or the industry in which the investee operates, and length of time and the extent to which the fair value has been less than cost. These qualitative factors are subjective and require a degree of management judgment.
Warranty liability
– At the time a sale is recognized, we record estimated future warranty costs. The warranty liability is determined by applying historical claim rate experience to the current field population and dealer inventory. Generally, historical claim rates are based on actual warranty experience for each product by machine model/engine size. Specific rates are developed for each product build month and are updated monthly based on actual warranty claim experience. Warranty costs may differ from those estimated if actual claim rates are higher or lower than our historical rates.
Stock-based compensation
– We use a lattice-based option-pricing model to calculate the fair value of our stock options and SARs. The calculation of the fair value of the awards using the lattice-based option-pricing model is affected by our stock price on the date of grant as well as assumptions regarding the following:
|
•
|
Volatility is a measure of the amount by which the stock price is expected to fluctuate each year during the expected term of the award and is based on historical Caterpillar stock price movement and current implied volatilities from traded options on Caterpillar stock. The implied volatilities from traded options are impacted by changes in market conditions. An increase in the volatility would result in an increase in our expense.
|
|
•
|
The expected term represents the period of time that awards granted are expected to be outstanding and is an output of the lattice-based option-pricing model. In determining the expected term of the award, future exercise and forfeiture patterns are estimated from Caterpillar employee historical exercise behavior. These patterns are also affected by the vesting conditions of the award. Changes in the future exercise behavior of employees or in the vesting period of the award could result in a change in the expected term. An increase in the expected term would result in an increase to our expense.
|
|
•
|
The weighted-average dividend yield is based on Caterpillar’s historical dividend yields. As holders of stock-based awards do not receive dividend payments, this could result in employees retaining the award for a longer period of time if dividend yields decrease or exercising the award sooner if dividend yields increase. A decrease in the dividend yield would result in an increase in our expense.
|
|
•
|
The risk-free interest rate is based on the U.S. Treasury yield curve in effect at time of grant. As the risk-free interest rate increases, the expected term increases, resulting in an increase in our expense.
|
The fair value of our RSUs is determined by reducing the stock price on the date of grant by the present value of the estimated dividends to be paid during the vesting period. The estimated dividends are based on Caterpillar’s weighted-average dividend yields. A decrease in the dividend yield would result in an increase in our expense.
Stock-based compensation expense recognized during the period is based on the value of the number of awards that are expected to vest. In determining the stock-based compensation expense to be recognized, a forfeiture rate is applied to the fair value of the award. This rate represents the number of awards that are expected to be forfeited prior to vesting and is based on Caterpillar employee historical behavior. Changes in the future behavior of employees could impact this rate. A decrease in this rate would result in an increase in our expense.
Product liability and insurance loss reserve
– We determine these reserves based upon reported claims in process of settlement and actuarial estimates for losses incurred but not reported. Loss reserves, including incurred but not reported reserves, are based on estimates and ultimate settlements may vary significantly from such estimates due to increased claims frequency or severity over historical levels.
Postretirement benefits
– Primary actuarial assumptions were determined as follows:
|
•
|
The U.S. expected long-term rate of return on plan assets is based on our estimate of long-term passive returns for equities and fixed income securities weighted by the allocation of our plan assets. Based on historical performance, we increase the passive returns due to our active management of the plan assets. A similar process is used to determine the rate for our non-U.S. pension plans. This rate is impacted by changes in general market conditions, but because it represents a long-term rate, it is not significantly impacted by short-term market swings. Changes in our allocation of plan assets would also impact this rate. For example, a shift to more fixed income securities would lower the rate. A decrease in the rate would increase our expense.
|
|
•
|
The assumed discount rate is used to discount future benefit obligations back to today’s dollars. The U.S. discount rate is based on a benefit cash flow-matching approach and represents the rate at which our benefit obligations could effectively be settled as of our measurement date, December 31. The benefit cash flow-matching approach involves analyzing
|
76
Caterpillar’s projected cash flows against a high quality bond yield curve, calculated using a wide population of corporate Aa bonds available on the measurement date. The very highest and lowest yielding bonds (top and bottom 10 percent) are excluded from the analysis. A similar approach is used to determine the assumed discount rate for our most significant non-U.S. plans. This rate is sensitive to changes in interest rates. A decrease in the discount rate would increase our obligation and future expense.
|
•
|
The expected rate of compensation increase is used to develop benefit obligations using projected pay at retirement. It represents average long-term salary increases. This rate is influenced by our long-term compensation policies. An increase in the rate would increase our obligation and expense.
|
|
•
|
The assumed health care trend rate represents the rate at which health care costs are assumed to increase and is based on historical and expected experience. Changes in our projections of future health care costs due to general economic conditions and those specific to health care (e.g., technology driven cost changes) will impact this trend rate. An increase in the trend rate would increase our obligation and expense.
|
Post-sale discount reserve
– We provide discounts to dealers through merchandising programs. We have numerous programs that are designed to promote the sale of our products. The most common dealer programs provide a discount when the dealer sells a product to a targeted end user. The amount of accrued post-sale discounts was $1.10 billion and $1.07 billion as of
June 30, 2013
and
December 31, 2012
respectively. The reserve represents discounts that we expect to pay on previously sold units and is reviewed at least quarterly. The reserve is adjusted if discounts paid differ from those estimated. Historically, those adjustments have not been material.
Credit loss reserve
– Management's ongoing evaluation of the adequacy of the allowance for credit losses considers both impaired and unimpaired finance receivables and takes into consideration past loss experience, known and inherent risks in the portfolio, adverse situations that may affect the borrower's ability to repay, estimated value of underlying collateral and current economic conditions. In estimating probable credit losses, we review accounts that are past due, non-performing, in bankruptcy or otherwise identified as at risk for potential credit loss including accounts which have been modified. Accounts are identified as at risk for potential credit loss using information available about the customer, such as financial statements, news reports and published credit ratings, as well as general information regarding industry trends and the economic environment in which our customers operate.
The allowance for credit losses attributable to specific accounts is based on the most probable source of repayment, which is normally the liquidation of collateral. In determining collateral value, we estimate the current fair market value of the collateral. In addition, consideration is given to credit enhancements such as additional collateral and contractual third-party guarantees in determining the allowance for credit losses attributable to non-performing receivables. The allowance for credit losses attributable to the remaining accounts is a general allowance based upon the risk in the portfolio, primarily using probabilities of default and an estimate of associated losses. In addition, qualitative factors not able to be fully ca
ptured in previous analysis including industry trends, macroeconomic factors and model imprecision are considered in the evaluation of the adequacy of the allowance for credit losses. These qualitative factors are subjective and require a degree of management judgment.
While management believes it has exercised prudent judgment and applied reasonable assumptions, there can be no assurance that in the future, changes in economic conditions or other factors would not cause changes in the financial health of our customers. If the financial health of our customer deteriorates, the timing and level of payments received could be impacted and therefore, could result in a change to our estimated losses.
Income tax reserve
– We are subject to the income tax laws of the many jurisdictions in which we operate. These tax laws are complex, and the manner in which they apply to our facts is sometimes open to interpretation. In establishing the provision for income taxes, we must make judgments about the application of these inherently complex tax laws.
Despite our belief that our tax return positions are consistent with applicable tax laws, we believe that taxing authorities could challenge certain positions. Settlement of any challenge can result in no change, a complete disallowance, or some partial adjustment reached through negotiations or litigation. We record tax benefits for uncertain tax positions based upon management’s evaluation of the information available at the reporting date. To be recognized in the financial statements, a tax benefit must be at least more likely than not of being sustained based on technical merits. The benefit for positions meeting the recognition threshold is measured as the largest benefit more likely than not of being realized upon ultimate settlement with a taxing authority that has full knowledge of all relevant information. Significant judgment is required in making these determinations and adjustments to unrecognized tax benefits may be necessary to reflect actual taxes payable upon settlement. Adjustments related to positions impacting the effective tax rate affect the provision for income taxes. Adjustments related to positions impacting the timing of deductions impact deferred tax assets and liabilities.
77
Our income tax positions and analysis are based on currently enacted tax law. Future changes in tax law could significantly impact the provision for income taxes, the amount of taxes payable, and the deferred tax asset and liability balances. Deferred tax assets generally represent tax benefits for tax deductions or credits available in future tax returns. Certain estimates and assumptions are required to determine whether it is more likely than not that all or some portion of the benefit of a deferred tax asset will not be realized. In making this assessment, management analyzes and estimates the impact of future taxable income, reversing temporary differences and available prudent and feasible tax planning strategies. Should a change in facts or circumstances lead to a change in judgment about the ultimate realizability of a deferred tax asset, we record or adjust the related valuation allowance in the period that the change in facts and circumstances occurs, along with a corresponding increase or decrease in the provision for income taxes.
A provision for U.S. income taxes has not been recorded on undistributed profits of our non-U.S. subsidiaries that we have determined to be indefinitely reinvested outside the U.S. If management intentions or U.S. tax law changes in the future, there may be a significant negative impact on the provision for income taxes to record an incremental tax liability in the period the change occurs. A deferred tax asset is recognized only if we have definite plans to generate a U.S. tax benefit by repatriating earnings in the foreseeable future.
GLOBAL WORKFORCE
Caterpillar worldwide full-time employment was
122,402 a
t the end of the second quarter of 2013 compared with 132,825 at the end of the second quarter of 2012, a decrease of
10,423 f
ull-time employees. The flexible workforce decreased
9,633
for a total decrease in the global workforce of 20,056.
The decrease was the result of lower production and divestitures. Divestitures, including the sale of a majority interest in our third party logistics business and portions of the Bucyrus distribution business, decreased the global workforce by 6,572.
OTHER MATTERS
Environmental and Legal Matters
The company is regulated by federal, state and international environmental laws governing our use, transport and disposal of substances and control of emissions. In addition to governing our manufacturing and other operations, these laws often impact the development of our products, including, but not limited to, required compliance with air emissions standards applicable to internal combustion engines. We have made, and will continue to make, significant research and development and capital expenditures to comply with these emissions standards.
We are engaged in remedial activities at a number of locations, often with other companies, pursuant to federal and state laws. When it is probable we will pay remedial costs at a site and those costs can be reasonably estimated, the costs are accrued against our earnings. In formulating that estimate, we do not consider amounts expected to be recovered from insurance companies or others. The amount recorded for environmental remediation is not material and is included in Accrued expenses in the Consolidated Statement of Financial Position.
We cannot reasonably estimate costs at sites in the very early stages of remediation. Currently, we have a few sites in the very early stages of remediation, and there is no more than a remote chance that a material amount for remedial activities at any individual site, or at all sites in the aggregate, will be required.
We are also involved in unresolved legal actions that arise in the normal course of business. The most prevalent of these unresolved actions involve disputes related to product design, manufacture and performance liability (including claimed asbestos and welding fumes exposure), contracts, employment issues, environmental matters or intellectual property rights. The aggregate range of reasonably possible losses in excess of accrued liabilities, if any, associated with these unresolved legal actions is not material. In some cases, we cannot reasonably estimate a range of loss because there is insufficient information regarding the matter. However, there is no more than a remote chance that any liability arising from these matters would be material. Although it is not possible to predict with certainty the outcome of these unresolved legal actions, we believe that these actions will not individually or in the aggregate have a material adverse effect on our consolidated results of operations, financial position or liquidity.
Retirement Benefits
We recognized pension expense of $179 million and $353 million for the three and six months ended June 30, 2013, as compared to $183 million and $362 million for the three and six months ended June 30, 2012. The decrease in expense for the six months ended June 30, 2013, is primarily due to lower interest costs, higher expected return on plan assets due to higher asset levels and
78
$10 million of special termination benefits related to the closure of the Electro-Motive Diesel facility (discussed below) recognized in the first quarter 2012. The decrease in expense was partially offset by higher amortization of net actuarial losses primarily due to lower discount rates at the end of 2012. Accounting guidance on retirement benefits requires companies to discount future benefit obligations back to today's dollars using a discount rate that is based on high-quality fixed-income investments. A decrease in the discount rate increases the pension benefit obligation, while an increase in the discount rate decreases the pension benefit obligation. This increase or decrease in the pension benefit obligation is recognized in Accumulated other comprehensive income (loss) and subsequently amortized into earnings as an actuarial gain or loss. The guidance also requires companies to use an expected long-term rate of return on plan assets for computing current year pension expense. Differences between the actual and expected returns are also recognized in Accumulated other comprehensive income (loss) and subsequently amortized into earnings as actuarial gains and losses. As of June 30, 2013, total actuarial losses, recognized in Accumulated other comprehensive income (loss), related to pensions were $8.81 billion. The majority of the actuarial losses are due to lower discount rates, plan asset losses and losses from other demographic and economic assumptions over the past several years.
Other postretirement benefit expense was $74 million and $143 million for the three and six months ended June 30, 2013, as compared to $71 million and $103 million for the three and six months ended June 30, 2012. The increase in expense for the six months ended June 30, 2013, was primarily the result of $40 million of curtailment gains recognized in the first quarter 2012, of which $37 million is related to the closure of the Electro-Motive Diesel facility discussed below. Actuarial losses that were recognized in Accumulated other comprehensive income (loss) for other postretirement benefit plans were $1.47 billion at June 30, 2013. These losses reflect several years of declining discount rates, changes in our health care trend assumption and plan asset losses, partially offset by gains from lower than expected health care costs.
Actuarial losses for both pensions and other postretirement benefits will be impacted in future periods by actual asset returns, actual health care inflation, discount rate changes, actual demographic experience and other factors that impact these expenses. These losses, reported in Accumulated other comprehensive income (loss), will generally be amortized as a component of net periodic benefit cost on a straight-line basis over the average remaining service period of active employees expected to receive benefits under the plans. For pension and other postretirement benefit plans in which all or almost all of the plan's participants are inactive or fully eligible for benefits under the plan, respectively, prior service cost (credit) and net actuarial loss (gain) are amortized using the straight-line method over the remaining life expectancy of those participants. At the end of 2012, the average remaining service period of active employees or life expectancy for fully eligible or inactive participants was 11 years for our U.S. and non-U.S. pension plans and 10 years for other postretirement benefit plans. We expect our total amortization of net actuarial losses to increase approximately $90 million in 2013 as compared to 2012, primarily due to a decrease in discount rates during 2012 and plan asset losses during 2011, partially offset by higher amortization of plan asset gains from 2010 and 2012.
In February 2012, we announced the closure of the Electro-Motive Diesel facility located in London, Ontario. As a result of the closure, we recognized a $37 million other postretirement benefits curtailment gain. This excludes a $21 million loss of a third-party receivable for other postretirement benefits that was eliminated due to the closure. In addition, a $10 million special termination benefit expense was recognized related to statutory pension benefits required to be paid to certain affected employees. As a result, a net gain of $6 million related to the facility closure was recognized in Other operating (income) expenses for the six months ended June 30, 2012.
We expect our total pension and other postretirement benefits expense to increase approximately $40 million in 2013. Excluding the 2012 curtailment gain related to the closure of the Electro-Motive Diesel facility our total benefit expense is expected to remain flat in 2013.
We made $138 million and $280 million of contributions to our pension plans during the three and six months ended June 30, 2013. We currently anticipate full-year 2013 contributions of approximately $480 million, all of which are required. We made $119 million and $293 million of contributions to our pension plans during the three and six months ended June 30, 2012.
Order Backlog
The dollar amount of backlog believed to be firm was approximatel
y $19.1 billion at June 30, 2013 and $20.4 billion
at March 31, 2013. Decrease
s for Resource Industries and Power Systems were partially offset by an increase for Construction Industries.
Compared to the end of the second quarter of 2012, the order backlog declined significantly, primarily due to a reduction in mining-related products within Resource Industries.
The dollar amount of backlog believed to be firm was approximately $20.2 billion at December 31, 2012. Of the total backlog, approximately
$4.0 billion
at June 30, 2013 and March 31, 2013, respectively, and
$4.5 billion
at December 31, 2012 was not expected to be filled in the following twelve months.
79
NON-GAAP FINANCIAL MEASURES
The following definitions are provided for “non-GAAP financial measures” in connection with Item 10(e) of Regulation S-K issued by the Securities and Exchange Commission. These non-GAAP financial measures have no standardized meaning prescribed by U.S. GAAP and therefore are unlikely to be comparable to the calculation of similar measures for other companies. Management does not intend these items to be considered in isolation or substituted for the related GAAP measures.
Supplemental Consolidating Data
We are providing supplemental consolidating data for the purpose of additional analysis. The data has been grouped as follows:
Consolidated –
Caterpillar Inc. and its subsidiaries.
Machinery and Power Systems –
Caterpillar defines Machinery and Power Systems as it is presented in the supplemental data as Caterpillar Inc. and its subsidiaries with Financial Products accounted for on the equity basis. Machinery and Power Systems information relates to the design, manufacture and marketing of our products. Financial Products information relates to the financing to customers and dealers for the purchase and lease of Caterpillar and other equipment. The nature of these businesses is different especially with regard to the financial position and cash flow items. Caterpillar management utilizes this presentation internally to highlight these differences. We also believe this presentation will assist readers in understanding our business.
Financial Products –
Our finance and insurance subsidiaries, primarily Cat Financial and Cat Insurance.
Consolidating Adjustments –
Eliminations of transactions between Machinery and Power Systems and Financial Products.
Pages
81 to 88
reconcile Machinery and Power Systems with Financial Products on the equity basis to Caterpillar Inc. consolidated financial information.
80
Caterpillar Inc.
Supplemental Data for Results of Operations
For The
Three Months Ended June 30, 2013
(Unaudited)
(Millions of dollars)
|
|
|
Supplemental Consolidating Data
|
|||||||||||||||
|
|
Consolidated
|
Machinery
and Power
Systems
1
|
Financial
Products
|
Consolidating
Adjustments
|
|||||||||||||
|
Sales and revenues:
|
|
|
|
|
|
|
|
|
|||||||||
|
Sales of Machinery and Power Systems
|
$
|
13,886
|
|
$
|
13,886
|
|
$
|
—
|
|
$
|
—
|
|
|||||
|
Revenues of Financial Products
|
735
|
|
—
|
|
823
|
|
(88
|
)
|
2
|
|
|||||||
|
Total sales and revenues
|
14,621
|
|
13,886
|
|
823
|
|
(88
|
)
|
|||||||||
|
Operating costs:
|
|
|
|
|
|
|
|
|
|||||||||
|
Cost of goods sold
|
10,773
|
|
10,773
|
|
—
|
|
—
|
|
|||||||||
|
Selling, general and administrative expenses
|
1,421
|
|
1,278
|
|
150
|
|
(7
|
)
|
3
|
|
|||||||
|
Research and development expenses
|
548
|
|
548
|
|
—
|
|
—
|
|
|||||||||
|
Interest expense of Financial Products
|
185
|
|
—
|
|
187
|
|
(2
|
)
|
4
|
|
|||||||
|
Other operating (income) expenses
|
137
|
|
(100
|
)
|
245
|
|
(8
|
)
|
3
|
|
|||||||
|
Total operating costs
|
13,064
|
|
12,499
|
|
582
|
|
(17
|
)
|
|||||||||
|
Operating profit
|
1,557
|
|
1,387
|
|
241
|
|
(71
|
)
|
|||||||||
|
Interest expense excluding Financial Products
|
120
|
|
130
|
|
—
|
|
(10
|
)
|
4
|
|
|||||||
|
Other income (expense)
|
(84
|
)
|
(134
|
)
|
(11
|
)
|
61
|
|
5
|
|
|||||||
|
Consolidated profit before taxes
|
1,353
|
|
1,123
|
|
230
|
|
—
|
|
|||||||||
|
Provision (benefit) for income taxes
|
387
|
|
317
|
|
70
|
|
—
|
|
|||||||||
|
Profit of consolidated companies
|
966
|
|
806
|
|
160
|
|
—
|
|
|||||||||
|
Equity in profit (loss) of unconsolidated affiliated companies
|
(1
|
)
|
(1
|
)
|
—
|
|
—
|
|
|||||||||
|
Equity in profit of Financial Products’ subsidiaries
|
—
|
|
157
|
|
—
|
|
(157
|
)
|
6
|
|
|||||||
|
Profit of consolidated and affiliated companies
|
965
|
|
962
|
|
160
|
|
(157
|
)
|
|||||||||
|
Less: Profit (loss) attributable to noncontrolling interests
|
5
|
|
2
|
|
3
|
|
—
|
|
|||||||||
|
Profit
7
|
$
|
960
|
|
$
|
960
|
|
$
|
157
|
|
$
|
(157
|
)
|
|||||
|
1
|
Represents Caterpillar Inc. and its subsidiaries with Financial Products accounted for on the equity basis.
|
|
2
|
Elimination of Financial Products’ revenues earned from Machinery and Power Systems.
|
|
3
|
Elimination of net expenses recorded by Machinery and Power Systems paid to Financial Products.
|
|
4
|
Elimination of interest expense recorded between Financial Products and Machinery and Power Systems.
|
|
5
|
Elimination of discount recorded by Machinery and Power Systems on receivables sold to Financial Products and of interest earned between Machinery and Power Systems and Financial Products.
|
|
6
|
Elimination of Financial Products’ profit due to equity method of accounting.
|
|
7
|
Profit attributable to common stockholders.
|
81
Caterpillar Inc.
Supplemental Data for Results of Operations
For The
Six Months Ended June 30, 2013
(Unaudited)
(Millions of dollars)
|
|
|
Supplemental Consolidating Data
|
|||||||||||||||
|
|
Consolidated
|
Machinery
and Power
Systems
1
|
Financial
Products
|
Consolidating
Adjustments
|
|||||||||||||
|
Sales and revenues:
|
|
|
|
|
|
|
|
|
|||||||||
|
Sales of Machinery and Power Systems
|
$
|
26,370
|
|
$
|
26,370
|
|
$
|
—
|
|
$
|
—
|
|
|||||
|
Revenues of Financial Products
|
1,461
|
|
—
|
|
1,637
|
|
(176
|
)
|
2
|
|
|||||||
|
Total sales and revenues
|
27,831
|
|
26,370
|
|
1,637
|
|
(176
|
)
|
|||||||||
|
Operating costs:
|
|
|
|
|
|
|
|
|
|||||||||
|
Cost of goods sold
|
20,412
|
|
20,412
|
|
—
|
|
—
|
|
|||||||||
|
Selling, general and administrative expenses
|
2,811
|
|
2,553
|
|
279
|
|
(21
|
)
|
3
|
|
|||||||
|
Research and development expenses
|
1,110
|
|
1,110
|
|
—
|
|
—
|
|
|||||||||
|
Interest expense of Financial Products
|
374
|
|
—
|
|
378
|
|
(4
|
)
|
4
|
|
|||||||
|
Other operating (income) expenses
|
349
|
|
(95
|
)
|
457
|
|
(13
|
)
|
3
|
|
|||||||
|
Total operating costs
|
25,056
|
|
23,980
|
|
1,114
|
|
(38
|
)
|
|||||||||
|
Operating profit
|
2,775
|
|
2,390
|
|
523
|
|
(138
|
)
|
|||||||||
|
Interest expense excluding Financial Products
|
240
|
|
261
|
|
—
|
|
(21
|
)
|
4
|
|
|||||||
|
Other income (expense)
|
(55
|
)
|
(169
|
)
|
(3
|
)
|
117
|
|
5
|
|
|||||||
|
Consolidated profit before taxes
|
2,480
|
|
1,960
|
|
520
|
|
—
|
|
|||||||||
|
Provision (benefit) for income taxes
|
633
|
|
485
|
|
148
|
|
—
|
|
|||||||||
|
Profit of consolidated companies
|
1,847
|
|
1,475
|
|
372
|
|
—
|
|
|||||||||
|
Equity in profit (loss) of unconsolidated affiliated companies
|
—
|
|
—
|
|
—
|
|
—
|
|
|||||||||
|
Equity in profit of Financial Products’ subsidiaries
|
—
|
|
366
|
|
—
|
|
(366
|
)
|
6
|
|
|||||||
|
Profit of consolidated and affiliated companies
|
1,847
|
|
1,841
|
|
372
|
|
(366
|
)
|
|||||||||
|
Less: Profit (loss) attributable to noncontrolling interests
|
7
|
|
1
|
|
6
|
|
—
|
|
|||||||||
|
Profit
7
|
$
|
1,840
|
|
$
|
1,840
|
|
$
|
366
|
|
$
|
(366
|
)
|
|||||
|
1
|
Represents Caterpillar Inc. and its subsidiaries with Financial Products accounted for on the equity basis.
|
|
2
|
Elimination of Financial Products’ revenues earned from Machinery and Power Systems.
|
|
3
|
Elimination of net expenses recorded by Machinery and Power Systems paid to Financial Products.
|
|
4
|
Elimination of interest expense recorded between Financial Products and Machinery and Power Systems.
|
|
5
|
Elimination of discount recorded by Machinery and Power Systems on receivables sold to Financial Products and of interest earned between Machinery and Power Systems and Financial Products.
|
|
6
|
Elimination of Financial Products’ profit due to equity method of accounting.
|
|
7
|
Profit attributable to common stockholders.
|
82
Caterpillar Inc.
Supplemental Data for Results of Operations
For The
Three Months Ended June 30, 2012
(Unaudited)
(Millions of dollars)
|
|
|
Supplemental Consolidating Data
|
|||||||||||||||
|
|
Consolidated
|
Machinery
and Power
Systems
1
|
Financial
Products
|
Consolidating
Adjustments
|
|||||||||||||
|
Sales and revenues:
|
|
|
|
|
|
|
|
|
|||||||||
|
Sales of Machinery and Power Systems
|
$
|
16,684
|
|
$
|
16,684
|
|
$
|
—
|
|
$
|
—
|
|
|||||
|
Revenues of Financial Products
|
690
|
|
—
|
|
780
|
|
(90
|
)
|
2
|
|
|||||||
|
Total sales and revenues
|
17,374
|
|
16,684
|
|
780
|
|
(90
|
)
|
|||||||||
|
Operating costs:
|
|
|
|
|
|
|
|
|
|||||||||
|
Cost of goods sold
|
12,280
|
|
12,280
|
|
—
|
|
—
|
|
|||||||||
|
Selling, general and administrative expenses
|
1,517
|
|
1,373
|
|
150
|
|
(6
|
)
|
3
|
|
|||||||
|
Research and development expenses
|
632
|
|
632
|
|
—
|
|
—
|
|
|||||||||
|
Interest expense of Financial Products
|
198
|
|
—
|
|
198
|
|
—
|
|
4
|
|
|||||||
|
Other operating (income) expenses
|
131
|
|
(107
|
)
|
248
|
|
(10
|
)
|
3
|
|
|||||||
|
Total operating costs
|
14,758
|
|
14,178
|
|
596
|
|
(16
|
)
|
|||||||||
|
Operating profit
|
2,616
|
|
2,506
|
|
184
|
|
(74
|
)
|
|||||||||
|
Interest expense excluding Financial Products
|
110
|
|
121
|
|
—
|
|
(11
|
)
|
4
|
|
|||||||
|
Other income (expense)
|
70
|
|
7
|
|
—
|
|
63
|
|
5
|
|
|||||||
|
Consolidated profit before taxes
|
2,576
|
|
2,392
|
|
184
|
|
—
|
|
|||||||||
|
Provision (benefit) for income taxes
|
872
|
|
819
|
|
53
|
|
—
|
|
|||||||||
|
Profit of consolidated companies
|
1,704
|
|
1,573
|
|
131
|
|
—
|
|
|||||||||
|
Equity in profit (loss) of unconsolidated affiliated companies
|
5
|
|
5
|
|
—
|
|
—
|
|
|||||||||
|
Equity in profit of Financial Products’ subsidiaries
|
—
|
|
130
|
|
—
|
|
(130
|
)
|
6
|
|
|||||||
|
Profit of consolidated and affiliated companies
|
1,709
|
|
1,708
|
|
131
|
|
(130
|
)
|
|||||||||
|
Less: Profit (loss) attributable to noncontrolling interests
|
10
|
|
9
|
|
1
|
|
—
|
|
|||||||||
|
Profit
7
|
$
|
1,699
|
|
$
|
1,699
|
|
$
|
130
|
|
$
|
(130
|
)
|
|||||
|
1
|
Represents Caterpillar Inc. and its subsidiaries with Financial Products accounted for on the equity basis.
|
|
2
|
Elimination of Financial Products’ revenues earned from Machinery and Power Systems.
|
|
3
|
Elimination of net expenses recorded by Machinery and Power Systems paid to Financial Products.
|
|
4
|
Elimination of interest expense recorded between Financial Products and Machinery and Power Systems.
|
|
5
|
Elimination of discount recorded by Machinery and Power Systems on receivables sold to Financial Products and of interest earned between Machinery and Power Systems and Financial Products.
|
|
6
|
Elimination of Financial Products’ profit due to equity method of accounting.
|
|
7
|
Profit attributable to common stockholders.
|
83
Caterpillar Inc.
Supplemental Data for Results of Operations
For The
Six Months Ended June 30, 2012
(Unaudited)
(Millions of dollars)
|
|
|
Supplemental Consolidating Data
|
|||||||||||||||
|
|
Consolidated
|
Machinery
and Power
Systems
1
|
Financial
Products
|
Consolidating
Adjustments
|
|||||||||||||
|
Sales and revenues:
|
|
|
|
|
|
|
|
|
|||||||||
|
Sales of Machinery and Power Systems
|
$
|
31,972
|
|
$
|
31,972
|
|
$
|
—
|
|
$
|
—
|
|
|||||
|
Revenues of Financial Products
|
1,383
|
|
—
|
|
1,557
|
|
(174
|
)
|
2
|
|
|||||||
|
Total sales and revenues
|
33,355
|
|
31,972
|
|
1,557
|
|
(174
|
)
|
|||||||||
|
Operating costs:
|
|
|
|
|
|
|
|
|
|||||||||
|
Cost of goods sold
|
23,517
|
|
23,517
|
|
—
|
|
—
|
|
|||||||||
|
Selling, general and administrative expenses
|
2,857
|
|
2,597
|
|
277
|
|
(17
|
)
|
3
|
|
|||||||
|
Research and development expenses
|
1,219
|
|
1,219
|
|
—
|
|
—
|
|
|||||||||
|
Interest expense of Financial Products
|
402
|
|
—
|
|
402
|
|
—
|
|
4
|
|
|||||||
|
Other operating (income) expenses
|
421
|
|
(64
|
)
|
500
|
|
(15
|
)
|
3
|
|
|||||||
|
Total operating costs
|
28,416
|
|
27,269
|
|
1,179
|
|
(32
|
)
|
|||||||||
|
Operating profit
|
4,939
|
|
4,703
|
|
378
|
|
(142
|
)
|
|||||||||
|
Interest expense excluding Financial Products
|
223
|
|
246
|
|
—
|
|
(23
|
)
|
4
|
|
|||||||
|
Other income (expense)
|
158
|
|
27
|
|
12
|
|
119
|
|
5
|
|
|||||||
|
Consolidated profit before taxes
|
4,874
|
|
4,484
|
|
390
|
|
—
|
|
|||||||||
|
Provision (benefit) for income taxes
|
1,561
|
|
1,449
|
|
112
|
|
—
|
|
|||||||||
|
Profit of consolidated companies
|
3,313
|
|
3,035
|
|
278
|
|
—
|
|
|||||||||
|
Equity in profit (loss) of unconsolidated affiliated companies
|
7
|
|
7
|
|
—
|
|
—
|
|
|||||||||
|
Equity in profit of Financial Products’ subsidiaries
|
—
|
|
273
|
|
—
|
|
(273
|
)
|
6
|
|
|||||||
|
Profit of consolidated and affiliated companies
|
3,320
|
|
3,315
|
|
278
|
|
(273
|
)
|
|||||||||
|
Less: Profit (loss) attributable to noncontrolling interests
|
35
|
|
30
|
|
5
|
|
—
|
|
|||||||||
|
Profit
7
|
$
|
3,285
|
|
$
|
3,285
|
|
$
|
273
|
|
$
|
(273
|
)
|
|||||
|
1
|
Represents Caterpillar Inc. and its subsidiaries with Financial Products accounted for on the equity basis.
|
|
2
|
Elimination of Financial Products’ revenues earned from Machinery and Power Systems.
|
|
3
|
Elimination of net expenses recorded by Machinery and Power Systems paid to Financial Products.
|
|
4
|
Elimination of interest expense recorded between Financial Products and Machinery and Power Systems.
|
|
5
|
Elimination of discount recorded by Machinery and Power Systems on receivables sold to Financial Products and of interest earned between Machinery and Power Systems and Financial Products.
|
|
6
|
Elimination of Financial Products’ profit due to equity method of accounting.
|
|
7
|
Profit attributable to common stockholders.
|
84
Caterpillar Inc.
Supplemental Data for Financial Position
At
June 30, 2013
(Unaudited)
(Millions of dollars)
|
|
|
Supplemental Consolidating Data
|
||||||||||||||
|
|
Consolidated
|
Machinery
and Power
Systems
1
|
Financial
Products
|
Consolidating
Adjustments
|
||||||||||||
|
Assets
|
|
|
|
|
||||||||||||
|
Current assets:
|
|
|
|
|
||||||||||||
|
Cash and short-term investments
|
$
|
6,110
|
|
$
|
3,974
|
|
$
|
2,136
|
|
$
|
—
|
|
||||
|
Receivables – trade and other
|
9,396
|
|
4,819
|
|
381
|
|
4,196
|
|
2,3
|
|||||||
|
Receivables – finance
|
8,946
|
|
—
|
|
13,408
|
|
(4,462
|
)
|
3
|
|||||||
|
Deferred and refundable income taxes
|
1,540
|
|
1,492
|
|
48
|
|
—
|
|
||||||||
|
Prepaid expenses and other current assets
|
924
|
|
428
|
|
509
|
|
(13
|
)
|
4
|
|||||||
|
Inventories
|
13,889
|
|
13,889
|
|
—
|
|
—
|
|
||||||||
|
Total current assets
|
40,805
|
|
24,602
|
|
16,482
|
|
(279
|
)
|
||||||||
|
Property, plant and equipment – net
|
16,352
|
|
12,814
|
|
3,538
|
|
—
|
|
||||||||
|
Long-term receivables – trade and other
|
1,230
|
|
165
|
|
287
|
|
778
|
|
2,3
|
|||||||
|
Long-term receivables – finance
|
14,240
|
|
—
|
|
15,053
|
|
(813
|
)
|
3
|
|||||||
|
Investments in unconsolidated affiliated companies
|
288
|
|
288
|
|
—
|
|
—
|
|
||||||||
|
Investments in Financial Products subsidiaries
|
—
|
|
4,537
|
|
—
|
|
(4,537
|
)
|
5
|
|||||||
|
Noncurrent deferred and refundable income taxes
|
2,153
|
|
2,543
|
|
99
|
|
(489
|
)
|
6
|
|||||||
|
Intangible assets
|
3,764
|
|
3,756
|
|
8
|
|
—
|
|
||||||||
|
Goodwill
|
6,814
|
|
6,797
|
|
17
|
|
—
|
|
||||||||
|
Other assets
|
1,729
|
|
381
|
|
1,348
|
|
—
|
|
||||||||
|
Total assets
|
$
|
87,375
|
|
$
|
55,883
|
|
$
|
36,832
|
|
$
|
(5,340
|
)
|
||||
|
Liabilities
|
|
|
|
|
|
|
|
|
||||||||
|
Current liabilities:
|
|
|
|
|
|
|
|
|
||||||||
|
Short-term borrowings
|
$
|
5,511
|
|
$
|
392
|
|
$
|
5,304
|
|
$
|
(185
|
)
|
7
|
|||
|
Accounts payable
|
6,343
|
|
6,231
|
|
193
|
|
(81
|
)
|
8
|
|||||||
|
Accrued expenses
|
3,501
|
|
3,171
|
|
343
|
|
(13
|
)
|
9
|
|||||||
|
Accrued wages, salaries and employee benefits
|
1,296
|
|
1,272
|
|
24
|
|
—
|
|
||||||||
|
Customer advances
|
2,738
|
|
2,738
|
|
—
|
|
—
|
|
||||||||
|
Dividends payable
|
388
|
|
388
|
|
—
|
|
—
|
|
||||||||
|
Other current liabilities
|
1,782
|
|
1,258
|
|
531
|
|
(7
|
)
|
6
|
|||||||
|
Long-term debt due within one year
|
8,360
|
|
1,112
|
|
7,248
|
|
—
|
|
||||||||
|
Total current liabilities
|
29,919
|
|
16,562
|
|
13,643
|
|
(286
|
)
|
||||||||
|
Long-term debt due after one year
|
25,680
|
|
7,984
|
|
17,731
|
|
(35
|
)
|
7
|
|||||||
|
Liability for postemployment benefits
|
10,866
|
|
10,866
|
|
—
|
|
—
|
|
||||||||
|
Other liabilities
|
3,232
|
|
2,793
|
|
921
|
|
(482
|
)
|
6
|
|||||||
|
Total liabilities
|
69,697
|
|
38,205
|
|
32,295
|
|
(803
|
)
|
||||||||
|
Commitments and contingencies
|
|
|
|
|
|
|
|
|
||||||||
|
Stockholders’ equity
|
|
|
|
|
|
|
|
|
||||||||
|
Common stock
|
4,591
|
|
4,591
|
|
906
|
|
(906
|
)
|
5
|
|||||||
|
Treasury stock
|
(10,940
|
)
|
(10,940
|
)
|
—
|
|
—
|
|
||||||||
|
Profit employed in the business
|
30,668
|
|
30,668
|
|
3,451
|
|
(3,451
|
)
|
5
|
|||||||
|
Accumulated other comprehensive income (loss)
|
(6,698
|
)
|
(6,698
|
)
|
66
|
|
(66
|
)
|
5
|
|||||||
|
Noncontrolling interests
|
57
|
|
57
|
|
114
|
|
(114
|
)
|
5
|
|||||||
|
Total stockholders’ equity
|
17,678
|
|
17,678
|
|
4,537
|
|
(4,537
|
)
|
||||||||
|
Total liabilities and stockholders’ equity
|
$
|
87,375
|
|
$
|
55,883
|
|
$
|
36,832
|
|
$
|
(5,340
|
)
|
||||
|
1
|
Represents Caterpillar Inc. and its subsidiaries with Financial Products accounted for on the equity basis.
|
|
2
|
Elimination of receivables between Machinery and Power Systems and Financial Products.
|
|
3
|
Reclassification of Machinery and Power Systems’ trade receivables purchased by Financial Products and Financial Products’ wholesale inventory receivables.
|
|
4
|
Elimination of Machinery and Power Systems’ insurance premiums that are prepaid to Financial Products.
|
|
5
|
Elimination of Financial Products’ equity which is accounted for by Machinery and Power Systems on the equity basis.
|
|
6
|
Reclassification reflecting required netting of deferred tax assets / liabilities by taxing jurisdiction.
|
|
7
|
Elimination of debt between Machinery and Power Systems and Financial Products.
|
|
8
|
Elimination of payables between Machinery and Power Systems and Financial Products.
|
|
9
|
Elimination of prepaid insurance in Financial Products’ accrued expenses.
|
85
Caterpillar Inc.
Supplemental Data for Financial Position
At
December 31, 2012
(Unaudited)
(Millions of dollars)
|
|
|
Supplemental Consolidating Data
|
||||||||||||||
|
|
Consolidated
|
Machinery
and Power
Systems
1
|
Financial
Products
|
Consolidating
Adjustments
|
||||||||||||
|
Assets
|
|
|
|
|
||||||||||||
|
Current assets:
|
|
|
|
|
||||||||||||
|
Cash and short-term investments
|
$
|
5,490
|
|
$
|
3,306
|
|
$
|
2,184
|
|
$
|
—
|
|
||||
|
Receivables – trade and other
|
10,092
|
|
5,634
|
|
445
|
|
4,013
|
|
2,3
|
|||||||
|
Receivables – finance
|
8,860
|
|
—
|
|
13,259
|
|
(4,399
|
)
|
3
|
|||||||
|
Deferred and refundable income taxes
|
1,547
|
|
1,501
|
|
46
|
|
—
|
|
||||||||
|
Prepaid expenses and other current assets
|
988
|
|
547
|
|
454
|
|
(13
|
)
|
4
|
|||||||
|
Inventories
|
15,547
|
|
15,547
|
|
—
|
|
—
|
|
||||||||
|
Total current assets
|
42,524
|
|
26,535
|
|
16,388
|
|
(399
|
)
|
||||||||
|
Property, plant and equipment – net
|
16,461
|
|
13,058
|
|
3,403
|
|
—
|
|
||||||||
|
Long-term receivables – trade and other
|
1,316
|
|
195
|
|
284
|
|
837
|
|
2,3
|
|||||||
|
Long-term receivables – finance
|
14,029
|
|
—
|
|
14,902
|
|
(873
|
)
|
3
|
|||||||
|
Investments in unconsolidated affiliated companies
|
272
|
|
272
|
|
—
|
|
—
|
|
||||||||
|
Investments in Financial Products subsidiaries
|
—
|
|
4,433
|
|
—
|
|
(4,433
|
)
|
5
|
|||||||
|
Noncurrent deferred and refundable income taxes
|
2,011
|
|
2,422
|
|
105
|
|
(516
|
)
|
6
|
|||||||
|
Intangible assets
|
4,016
|
|
4,008
|
|
8
|
|
—
|
|
||||||||
|
Goodwill
|
6,942
|
|
6,925
|
|
17
|
|
—
|
|
||||||||
|
Other assets
|
1,785
|
|
436
|
|
1,349
|
|
—
|
|
||||||||
|
Total assets
|
$
|
89,356
|
|
$
|
58,284
|
|
$
|
36,456
|
|
$
|
(5,384
|
)
|
||||
|
Liabilities
|
|
|
|
|
|
|
|
|
||||||||
|
Current liabilities:
|
|
|
|
|
|
|
|
|
||||||||
|
Short-term borrowings
|
$
|
5,287
|
|
$
|
668
|
|
$
|
4,859
|
|
$
|
(240
|
)
|
7
|
|||
|
Accounts payable
|
6,753
|
|
6,718
|
|
178
|
|
(143
|
)
|
8
|
|||||||
|
Accrued expenses
|
3,667
|
|
3,258
|
|
422
|
|
(13
|
)
|
9
|
|||||||
|
Accrued wages, salaries and employee benefits
|
1,911
|
|
1,876
|
|
35
|
|
—
|
|
||||||||
|
Customer advances
|
2,978
|
|
2,978
|
|
—
|
|
—
|
|
||||||||
|
Dividends payable
|
—
|
|
—
|
|
—
|
|
—
|
|
||||||||
|
Other current liabilities
|
2,055
|
|
1,561
|
|
502
|
|
(8
|
)
|
6
|
|||||||
|
Long-term debt due within one year
|
7,104
|
|
1,113
|
|
5,991
|
|
—
|
|
||||||||
|
Total current liabilities
|
29,755
|
|
18,172
|
|
11,987
|
|
(404
|
)
|
||||||||
|
Long-term debt due after one year
|
27,752
|
|
8,705
|
|
19,086
|
|
(39
|
)
|
7
|
|||||||
|
Liability for postemployment benefits
|
11,085
|
|
11,085
|
|
—
|
|
—
|
|
||||||||
|
Other liabilities
|
3,182
|
|
2,740
|
|
950
|
|
(508
|
)
|
6
|
|||||||
|
Total liabilities
|
71,774
|
|
40,702
|
|
32,023
|
|
(951
|
)
|
||||||||
|
Commitments and contingencies
|
|
|
|
|
|
|
|
|
||||||||
|
Stockholders’ equity
|
|
|
|
|
|
|
|
|
||||||||
|
Common stock
|
4,481
|
|
4,481
|
|
906
|
|
(906
|
)
|
5
|
|||||||
|
Treasury stock
|
(10,074
|
)
|
(10,074
|
)
|
—
|
|
—
|
|
||||||||
|
Profit employed in the business
|
29,558
|
|
29,558
|
|
3,185
|
|
(3,185
|
)
|
5
|
|||||||
|
Accumulated other comprehensive income (loss)
|
(6,433
|
)
|
(6,433
|
)
|
236
|
|
(236
|
)
|
5
|
|||||||
|
Noncontrolling interests
|
50
|
|
50
|
|
106
|
|
(106
|
)
|
5
|
|||||||
|
Total stockholders’ equity
|
17,582
|
|
17,582
|
|
4,433
|
|
(4,433
|
)
|
||||||||
|
Total liabilities and stockholders’ equity
|
$
|
89,356
|
|
$
|
58,284
|
|
$
|
36,456
|
|
$
|
(5,384
|
)
|
||||
|
1
|
Represents Caterpillar Inc. and its subsidiaries with Financial Products accounted for on the equity basis.
|
|
2
|
Elimination of receivables between Machinery and Power Systems and Financial Products.
|
|
3
|
Reclassification of Machinery and Power Systems’ trade receivables purchased by Financial Products and Financial Products’ wholesale inventory receivables.
|
|
4
|
Elimination of Machinery and Power Systems’ insurance premiums that are prepaid to Financial Products.
|
|
5
|
Elimination of Financial Products’ equity which is accounted for by Machinery and Power Systems on the equity basis.
|
|
6
|
Reclassification reflecting required netting of deferred tax assets / liabilities by taxing jurisdiction.
|
|
7
|
Elimination of debt between Machinery and Power Systems and Financial Products.
|
|
8
|
Elimination of payables between Machinery and Power Systems and Financial Products.
|
|
9
|
Elimination of prepaid insurance in Financial Products’ accrued expenses.
|
86
Caterpillar Inc.
Supplemental Data for Cash Flow
For The
Six Months Ended June 30, 2013
(Unaudited)
(Millions of dollars)
|
|
|
Supplemental Consolidating Data
|
||||||||||||||
|
|
Consolidated
|
Machinery
and Power
Systems
1
|
Financial
Products
|
Consolidating
Adjustments
|
||||||||||||
|
Cash flow from operating activities:
|
|
|
|
|
||||||||||||
|
Profit of consolidated and affiliated companies
|
$
|
1,847
|
|
$
|
1,841
|
|
$
|
372
|
|
$
|
(366
|
)
|
2
|
|||
|
Adjustments for non-cash items:
|
|
|
|
|
|
|
|
|
||||||||
|
Depreciation and amortization
|
1,484
|
|
1,104
|
|
380
|
|
—
|
|
||||||||
|
Undistributed profit of Financial Products
|
—
|
|
(266
|
)
|
—
|
|
266
|
|
3
|
|||||||
|
Other
|
236
|
|
140
|
|
(41
|
)
|
137
|
|
4
|
|||||||
|
Changes in assets and liabilities, net of acquisitions and divestitures:
|
|
|||||||||||||||
|
Receivables - trade and other
|
431
|
|
635
|
|
5
|
|
(209
|
)
|
4,5
|
|||||||
|
Inventories
|
1,364
|
|
1,368
|
|
—
|
|
(4
|
)
|
4
|
|||||||
|
Accounts payable
|
222
|
|
204
|
|
(44
|
)
|
62
|
|
4
|
|||||||
|
Accrued expenses
|
(129
|
)
|
(47
|
)
|
(82
|
)
|
—
|
|
||||||||
|
Accrued wages, salaries and employee benefits
|
(580
|
)
|
(569
|
)
|
(11
|
)
|
—
|
|
||||||||
|
Customer advances
|
(212
|
)
|
(212
|
)
|
—
|
|
—
|
|
||||||||
|
Other assets – net
|
(100
|
)
|
(71
|
)
|
(2
|
)
|
(27
|
)
|
4
|
|||||||
|
Other liabilities – net
|
30
|
|
11
|
|
(8
|
)
|
27
|
|
4
|
|||||||
|
Net cash provided by (used for) operating activities
|
4,593
|
|
4,138
|
|
569
|
|
(114
|
)
|
||||||||
|
Cash flow from investing activities:
|
|
|
|
|
|
|
|
|
||||||||
|
Capital expenditures - excluding equipment leased to others
|
(1,387
|
)
|
(1,379
|
)
|
(8
|
)
|
—
|
|
||||||||
|
Expenditures for equipment leased to others
|
(810
|
)
|
(34
|
)
|
(811
|
)
|
35
|
|
4
|
|||||||
|
Proceeds from disposals of leased assets and property, plant and equipment
|
358
|
|
47
|
|
324
|
|
(13
|
)
|
4
|
|||||||
|
Additions to finance receivables
|
(5,544
|
)
|
—
|
|
(6,917
|
)
|
1,373
|
|
5, 8
|
|||||||
|
Collections of finance receivables
|
4,548
|
|
—
|
|
5,966
|
|
(1,418
|
)
|
5
|
|||||||
|
Net intercompany purchased receivables
|
—
|
|
—
|
|
(63
|
)
|
63
|
|
5
|
|||||||
|
Proceeds from sale of finance receivables
|
89
|
|
—
|
|
90
|
|
(1
|
)
|
5
|
|||||||
|
Net intercompany borrowings
|
—
|
|
—
|
|
35
|
|
(35
|
)
|
6
|
|||||||
|
Investments and acquisitions (net of cash acquired)
|
(26
|
)
|
(26
|
)
|
—
|
|
—
|
|
||||||||
|
Proceeds from sale of businesses and investments (net of cash sold)
|
100
|
|
125
|
|
—
|
|
(25
|
)
|
8
|
|||||||
|
Proceeds from sale of available-for-sale securities
|
207
|
|
14
|
|
193
|
|
—
|
|
||||||||
|
Investments in available-for-sale securities
|
(267
|
)
|
(11
|
)
|
(256
|
)
|
—
|
|
||||||||
|
Other – net
|
(68
|
)
|
(38
|
)
|
(30
|
)
|
—
|
|
||||||||
|
Net cash provided by (used for) investing activities
|
(2,800
|
)
|
(1,302
|
)
|
(1,477
|
)
|
(21
|
)
|
||||||||
|
Cash flow from financing activities:
|
|
|
|
|
|
|
|
|
||||||||
|
Dividends paid
|
(342
|
)
|
(342
|
)
|
(100
|
)
|
100
|
|
7
|
|||||||
|
Distribution to noncontrolling interests
|
(8
|
)
|
(8
|
)
|
—
|
|
—
|
|
||||||||
|
Common stock issued, including treasury shares reissued
|
56
|
|
56
|
|
—
|
|
—
|
|
||||||||
|
Treasury shares purchased
|
(1,000
|
)
|
(1,000
|
)
|
—
|
|
—
|
|
||||||||
|
Excess tax benefit from stock-based compensation
|
62
|
|
62
|
|
—
|
|
—
|
|
||||||||
|
Net intercompany borrowings
|
—
|
|
(35
|
)
|
—
|
|
35
|
|
6
|
|||||||
|
Proceeds from debt issued (original maturities greater than three months)
|
5,186
|
|
119
|
|
5,067
|
|
—
|
|
||||||||
|
Payments on debt (original maturities greater than three months)
|
(6,303
|
)
|
(1,003
|
)
|
(5,300
|
)
|
—
|
|
||||||||
|
Short-term borrowings – net (original maturities three months or less)
|
1,217
|
|
1
|
|
1,216
|
|
—
|
|
||||||||
|
Net cash provided by (used for) financing activities
|
(1,132
|
)
|
(2,150
|
)
|
883
|
|
135
|
|
||||||||
|
Effect of exchange rate changes on cash
|
(41
|
)
|
(18
|
)
|
(23
|
)
|
—
|
|
||||||||
|
Increase (decrease) in cash and short-term investments
|
620
|
|
668
|
|
(48
|
)
|
—
|
|
||||||||
|
Cash and short-term investments at beginning of period
|
5,490
|
|
3,306
|
|
2,184
|
|
—
|
|
||||||||
|
Cash and short-term investments at end of period
|
$
|
6,110
|
|
$
|
3,974
|
|
$
|
2,136
|
|
$
|
—
|
|
||||
|
1
|
Represents Caterpillar Inc. and its subsidiaries with Financial Products accounted for on the equity basis.
|
|
2
|
Elimination of Financial Products’ profit after tax due to equity method of accounting.
|
|
3
|
Elimination of non-cash adjustment for the undistributed earnings from Financial Products.
|
|
4
|
Elimination of non-cash adjustments and changes in assets and liabilities related to consolidated reporting.
|
|
5
|
Reclassification of Financial Products' cash flow activity from investing to operating for receivables that arose from the sale of inventory.
|
|
6
|
Elimination of net proceeds and payments to/from Machinery and Power Systems and Financial Products.
|
|
7
|
Elimination of dividend from Financial Products to Machinery and Power Systems.
|
|
8
|
Elimination of proceeds received from Financial Products related to Machinery and Power Systems' sale of portions of the Bucyrus distribution businesses to Cat Dealers.
|
87
Caterpillar Inc.
Supplemental Data for Cash Flow
For The
Six Months Ended June 30, 2012
(Unaudited)
(Millions of dollars)
|
|
|
Supplemental Consolidating Data
|
||||||||||||||
|
|
Consolidated
|
Machinery
and Power
Systems
1
|
Financial
Products
|
Consolidating
Adjustments
|
||||||||||||
|
Cash flow from operating activities:
|
|
|
|
|
||||||||||||
|
Profit of consolidated and affiliated companies
|
$
|
3,320
|
|
$
|
3,315
|
|
$
|
278
|
|
$
|
(273
|
)
|
2
|
|||
|
Adjustments for non-cash items:
|
|
|
|
|
|
|
|
|
||||||||
|
Depreciation and amortization
|
1,350
|
|
988
|
|
362
|
|
—
|
|
||||||||
|
Undistributed profit of Financial Products
|
—
|
|
(23
|
)
|
—
|
|
23
|
|
3
|
|||||||
|
Other
|
(59
|
)
|
(66
|
)
|
(94
|
)
|
101
|
|
4
|
|||||||
|
Changes in assets and liabilities, net of acquisitions and divestitures:
|
|
|
|
|
|
|
|
|
||||||||
|
Receivables - trade and other
|
37
|
|
(36
|
)
|
(21
|
)
|
94
|
|
4,5
|
|||||||
|
Inventories
|
(2,939
|
)
|
(2,893
|
)
|
—
|
|
(46
|
)
|
4
|
|||||||
|
Accounts payable
|
299
|
|
290
|
|
(24
|
)
|
33
|
|
4
|
|||||||
|
Accrued expenses
|
86
|
|
119
|
|
(34
|
)
|
1
|
|
4
|
|||||||
|
Accrued wages, salaries and employee benefits
|
(753
|
)
|
(739
|
)
|
(14
|
)
|
—
|
|
||||||||
|
Customer advances
|
434
|
|
434
|
|
—
|
|
—
|
|
||||||||
|
Other assets – net
|
63
|
|
52
|
|
1
|
|
10
|
|
4
|
|||||||
|
Other liabilities – net
|
140
|
|
74
|
|
76
|
|
(10
|
)
|
4
|
|||||||
|
Net cash provided by (used for) operating activities
|
1,978
|
|
1,515
|
|
530
|
|
(67
|
)
|
||||||||
|
Cash flow from investing activities:
|
|
|
|
|
|
|
|
|
||||||||
|
Capital expenditures - excluding equipment leased to others
|
(1,508
|
)
|
(1,500
|
)
|
(8
|
)
|
—
|
|
||||||||
|
Expenditures for equipment leased to others
|
(787
|
)
|
(45
|
)
|
(866
|
)
|
124
|
|
4,9
|
|||||||
|
Proceeds from disposals of leased assets and property, plant and equipment
|
543
|
|
63
|
|
491
|
|
(11
|
)
|
4
|
|||||||
|
Additions to finance receivables
|
(5,942
|
)
|
—
|
|
(10,012
|
)
|
4,070
|
|
5,8,9
|
|||||||
|
Collections of finance receivables
|
4,298
|
|
—
|
|
8,016
|
|
(3,718
|
)
|
5,9
|
|||||||
|
Net intercompany purchased receivables
|
—
|
|
—
|
|
117
|
|
(117
|
)
|
5
|
|||||||
|
Proceeds from sale of finance receivables
|
85
|
|
—
|
|
85
|
|
—
|
|
||||||||
|
Net intercompany borrowings
|
—
|
|
—
|
|
63
|
|
(63
|
)
|
6
|
|||||||
|
Investments and acquisitions (net of cash acquired)
|
(517
|
)
|
(461
|
)
|
—
|
|
(56
|
)
|
9
|
|||||||
|
Proceeds from sale of business and investments (net of cash sold)
|
308
|
|
783
|
|
—
|
|
(475
|
)
|
8
|
|||||||
|
Proceeds from sale of available-for-sale securities
|
177
|
|
19
|
|
158
|
|
—
|
|
||||||||
|
Investments in available-for-sale securities
|
(199
|
)
|
(4
|
)
|
(195
|
)
|
—
|
|
||||||||
|
Other – net
|
38
|
|
8
|
|
30
|
|
—
|
|
||||||||
|
Net cash provided by (used for) investing activities
|
(3,504
|
)
|
(1,137
|
)
|
(2,121
|
)
|
(246
|
)
|
||||||||
|
Cash flow from financing activities:
|
|
|
|
|
|
|
|
|
||||||||
|
Dividends paid
|
(598
|
)
|
(598
|
)
|
(250
|
)
|
250
|
|
7
|
|||||||
|
Distribution to noncontrolling interests
|
(5
|
)
|
(5
|
)
|
—
|
|
—
|
|
||||||||
|
Common stock issued, including treasury shares reissued
|
25
|
|
25
|
|
—
|
|
—
|
|
||||||||
|
Excess tax benefit from stock-based compensation
|
156
|
|
156
|
|
—
|
|
—
|
|
||||||||
|
Acquisitions of redeemable noncontrolling interests
|
(444
|
)
|
(444
|
)
|
—
|
|
—
|
|
||||||||
|
Net intercompany borrowings
|
—
|
|
(63
|
)
|
—
|
|
63
|
|
6
|
|||||||
|
Proceeds from debt issued (original maturities greater than three months)
|
9,019
|
|
1,662
|
|
7,357
|
|
—
|
|
||||||||
|
Payments on debt (original maturities greater than three months)
|
(5,005
|
)
|
(211
|
)
|
(4,794
|
)
|
—
|
|
||||||||
|
Short-term borrowings – net (original maturities three months or less)
|
553
|
|
108
|
|
445
|
|
—
|
|
||||||||
|
Net cash provided by (used for) financing activities
|
3,701
|
|
630
|
|
2,758
|
|
313
|
|
||||||||
|
Effect of exchange rate changes on cash
|
(129
|
)
|
(27
|
)
|
(102
|
)
|
—
|
|
||||||||
|
Increase (decrease) in cash and short-term investments
|
2,046
|
|
981
|
|
1,065
|
|
—
|
|
||||||||
|
Cash and short-term investments at beginning of period
|
3,057
|
|
1,829
|
|
1,228
|
|
—
|
|
||||||||
|
Cash and short-term investments at end of period
|
$
|
5,103
|
|
$
|
2,810
|
|
$
|
2,293
|
|
$
|
—
|
|
||||
|
1
|
Represents Caterpillar Inc. and its subsidiaries with Financial Products accounted for on the equity basis.
|
|
2
|
Elimination of Financial Products' profit after tax due to equity method of accounting.
|
|
3
|
Elimination of non-cash adjustment for the undistributed earnings from Financial Products.
|
|
4
|
Elimination of non-cash adjustments and changes in assets and liabilities related to consolidated reporting.
|
|
5
|
Reclassification of Financial Products' cash flow activity from investing to operating for receivables that arose from the sale of inventory.
|
|
6
|
Elimination of net proceeds and payments to/from Machinery and Power Systems and Financial Products.
|
|
7
|
Elimination of dividend from Financial Products to Machinery and Power Systems.
|
|
8
|
Elimination of proceeds received from Financial Products related to Machinery and Power Systems' sale of portions of the Bucyrus distribution businesses to Cat dealers.
|
|
9
|
Reclassification of Financial Products' payments related to Machinery and Power Systems' acquisition of Caterpillar Tohoku Limited.
|
88
Forward-looking Statements
Certain statements in this Form 10-Q relate to future events and expectations and are forward-looking statements within the meaning of the Private Securities Litigation Reform Act of 1995. Words such as “believe,” “estimate,” “will be,” “will,” “would,” “expect,” “anticipate,” “plan,” “project,” “intend,” “could,” “should” or other similar words or expressions often identify forward-looking statements. All statements other than statements of historical fact are forward-looking statements, including, without limitation, statements regarding our outlook, projections, forecasts or trend descriptions. These statements do not guarantee future performance, and we do not undertake to update our forward-looking statements.
Caterpillar's actual results may differ materially from those described or implied in our forward-looking statements based on a number of factors, including, but not limited to: (i) global economic conditions and economic conditions in the industries and markets we serve; (ii) government monetary or fiscal policies and infrastructure spending; (iii) commodity or component price increases, fluctuations in demand for our products, or limited availability of raw materials and component products, including steel; (iv) our and our customers', dealers' and suppliers' ability to access and manage liquidity; (v) political and economic risks and instability, including national or international conflicts and civil unrest; (vi) our and Cat Financial's ability to: maintain credit ratings, avoid material increases in borrowing costs, and access capital markets; (vii) the financial condition and credit worthiness of Cat Financial's customers; (viii) changes in interest rates or market liquidity; (ix) changes in financial services regulation; (x) inability to realize expected benefits from acquisitions, including ERA Mining Machinery Limited, and divestitures, including the divestiture of the Bucyrus International, Inc. distribution business to our independent dealers; (xi) international trade and investment policies; (xii) market acceptance of our products and services; (xiii) changes in the competitive environment, including market share, pricing and geographic and product mix of sales; (xiv) successful implementation of capacity expansion projects, cost reduction initiatives and efficiency or productivity initiatives, including the Caterpillar Production System; (xv) inventory management decisions and sourcing practices of our dealers or original equipment manufacturers; (xvi) compliance with environmental laws and regulations; (xvii) alleged or actual violations of trade or anti-corruption laws and regulations; (xviii) additional tax expense or exposure; (xix) currency fluctuations; (xx) our or Cat Financial's compliance with financial covenants; (xxi) increased pension plan funding obligations; (xxii) union disputes or other labor matters; (xxiii) significant legal proceedings, claims, lawsuits or investigations; (xxiv) compliance requirements imposed if carbon emissions legislation and/or regulations are adopted; (xxv) changes in accounting standards; (xxvi) failure or breach of information technology security; (xxvii) adverse effects of natural disasters; and (xxviii) other factors described in more detail under “Item 1A. Risk Factors” in our Form 10-K filed with the SEC on February 19, 2013 for the year ended December 31, 2012. This filing is available on our website at
www.caterpillar.com/secfilings
.
The information required by this Item is incorporated by reference from Note 4 – “Derivative Financial Instruments and Risk Management” included in Part I, Item 1 and Management’s Discussion and Analysis included in Part I, Item 2 of this Form 10-Q.
Evaluation of disclosure controls and procedures
An evaluation was performed under the supervision and with the participation of the company’s management, including the Chief Executive Officer (CEO) and Chief Financial Officer (CFO), of the effectiveness of the design and operation of the company’s disclosure controls and procedures, as that term is defined in Rule 13a-15(e) under the Securities Exchange Act of 1934, as amended, as of the end of the period covered by this quarterly report. Based on that evaluation, the company’s management, including the CEO and CFO, concluded that the company’s disclosure controls and procedures are effective as of the end of the period covered by this quarterly report.
Changes in internal control over financial reporting
During the
second
quarter of 201
3, there has been no change in the co
mpany's internal control over financial reporting that has materially affected, or is reasonably likely to materially affect, the company’s internal control over financial reporting.
89
The information required by this Item is incorporated by reference from Note 13 included in Part I, Item 1 of this Form 10-Q.
Issuer Purchases of Equity Securities
|
Period
1
|
Total Number
of Shares
Purchased
|
Average Price
Paid per Share
|
Total Number
of Shares Purchased
Under the Program
|
Approximate Dollar
Value of Shares that
may yet be Purchased
under the Program (dollars in billions)
2
|
||||||||||
|
April 1-30, 2013
|
11,118,269
|
|
$
|
86.64
|
|
11,118,269
|
|
$
|
2.775
|
|
||||
|
May 1-31, 2013
|
—
|
|
$
|
—
|
|
—
|
|
$
|
—
|
|
||||
|
June 1-30, 2013
|
423,837
|
|
$
|
86.64
|
|
423,837
|
|
$
|
2.739
|
|
||||
|
Total
|
11,542,106
|
|
$
|
86.64
|
|
11,542,106
|
|
|
|
|||||
|
1
|
In April 2013, we entered into a definitive agreement with Citibank, N.A. to purchase shares of our common stock under an accelerated stock repurchase transaction (April ASR Agreement). Pursuant to the terms of the April ASR Agreement, a total of 11.5 million shares of our common stock were repurchased at an aggregate cost to Caterpillar of $1.0 billion. In July 2013, we entered into a definitive agreement with Société Générale to purchase $1.0 billion of our common stock under an accelerated stock repurchase transaction.
|
|
2
|
In February 2007, the Board of Directors authorized the repurchase of $7.5 billion of Caterpillar stock, and in December 2011, the authorization was extended through December 31, 2015. Through the end of the second quarter of 2013, $4.8 billion of the $7.5 billion authorization was spent.
|
Other Purchases of Equity Securities
|
Period
|
Total Number
of Shares
Purchased
1
|
Average Price
Paid per Share
|
Total Number
of Shares Purchased
Under the Program
|
Approximate Dollar
Value of Shares that
may yet be Purchased
under the Program
|
|||||||
|
April 1-30, 2013
|
7,760
|
|
$
|
86.05
|
|
NA
|
NA
|
||||
|
May 1-31, 2013
|
8,749
|
|
$
|
85.55
|
|
NA
|
NA
|
||||
|
June 1-30, 2013
|
—
|
|
$
|
—
|
|
NA
|
NA
|
||||
|
Total
|
16,509
|
|
$
|
85.79
|
|
|
|
||||
|
1
|
Represents shares delivered back to issuer for the payment of taxes resulting from the vesting of restricted stock units and the exercise of stock options by employees and Directors.
|
Non-U.S. Employee Stock Purchase Plans
We have 28 employee stock purchase plans administered outside the United States for our non-U.S. employees. As of June 30, 2013, those plans had approximately 14,000 active participants in the aggregate. During the second quarter of 2013, approximately 260,000 shares of Caterpillar common stock or foreign denominated equivalents were distributed under the plans. Participants in some foreign plans have the option of receiving non-U.S. share certificates (foreign-denominated equivalents) in lieu of U.S. shares of Caterpillar common stock upon withdrawal from the plan. These equivalent certificates are tradable only on the local stock market and are included in our determination of shares outstanding.
Distributions of Caterpillar stock under the plans are exempt from registration under the Securities Act of 1933 (Act) pursuant to 17 CFR 230.903.
90
Information concerning mine safety violations or other regulatory matters required by Section 1503(a) of the Dodd-Frank Wall Street Reform and Consumer Protection Act and Item 104 of Regulation S-K (17 CFR 229.104) is included in Exhibit 95 to this quarterly report.
|
11
|
Computations of Earnings per Share (included in Note 11 of this Form 10-Q filed for the quarter ended June 30, 2013).
|
|
|
31.1
|
Certification of Douglas R. Oberhelman, Chairman and Chief Executive Officer of Caterpillar Inc., as required pursuant to Section 302 of the Sarbanes-Oxley Act of 2002.
|
|
|
31.2
|
Certification of Bradley M. Halverson, Group President and Chief Financial Officer of Caterpillar Inc., as required pursuant to Section 302 of the Sarbanes-Oxley Act of 2002.
|
|
|
32
|
Certification of Douglas R. Oberhelman, Chairman and Chief Executive Officer of Caterpillar Inc. and Bradley M. Halverson, Group President and Chief Financial Officer of Caterpillar Inc., as required pursuant to Section 906 of the Sarbanes-Oxley Act of 2002.
|
|
|
95
|
Mine Safety Disclosures
|
|
|
101.INS
|
|
XBRL Instance Document
|
|
|
|
|
|
101.SCH
|
|
XBRL Taxonomy Extension Schema Document
|
|
|
|
|
|
101.CAL
|
|
XBRL Taxonomy Extension Calculation Linkbase Document
|
|
|
|
|
|
101.DEF
|
|
XBRL Taxonomy Extension Definition Linkbase Document
|
|
|
|
|
|
101.LAB
|
|
XBRL Taxonomy Extension Label Linkbase Document
|
|
|
|
|
|
101.PRE
|
|
XBRL Taxonomy Extension Presentation Linkbase Document
|
91
SIGNATURES
Pursuant to the requirements of the Securities Exchange Act of 1934, the Registrant has duly caused this report to be signed on its behalf by the undersigned thereunto duly authorized.
|
|
CATERPILLAR INC.
|
|
|
|
|
|
|
|
|
|
|
August 2, 2013
|
/s/Douglas R. Oberhelman
|
Chairman and Chief Executive Officer
|
|
|
(Douglas R. Oberhelman)
|
|
|
|
|
|
|
|
|
|
|
August 2, 2013
|
/s/Bradley M. Halverson
|
Group President and Chief Financial Officer
|
|
|
(Bradley M. Halverson)
|
|
|
|
|
|
|
|
|
|
|
August 2, 2013
|
/s/James B. Buda
|
Executive Vice President, Law and Public Policy
|
|
|
(James B. Buda)
|
|
|
|
|
|
|
|
|
|
|
August 2, 2013
|
/s/Jananne A. Copeland
|
Chief Accounting Officer
|
|
|
(Jananne A. Copeland)
|
|
92
EXHIBIT INDEX
|
Exhibit No.
|
Description
|
|
|
11
|
Computations of Earnings per Share (included in Note 11 of this Form 10-Q filed for the quarter ended June 30, 2013).
|
|
|
|
|
|
|
31.1
|
Certification of Douglas R. Oberhelman, Chairman and Chief Executive Officer of Caterpillar Inc., as required pursuant to Section 302 of the Sarbanes-Oxley Act of 2002.
|
|
|
31.2
|
Certification of Bradley M. Halverson, Group President and Chief Financial Officer of Caterpillar Inc., as required pursuant to Section 302 of the Sarbanes-Oxley Act of 2002.
|
|
|
32
|
Certification of Douglas R. Oberhelman, Chairman and Chief Executive Officer of Caterpillar Inc. and Bradley M. Halverson, Group President and Chief Financial Officer of Caterpillar Inc., as required pursuant to Section 906 of the Sarbanes-Oxley Act of 2002.
|
|
|
95
|
Mine Safety Disclosures
|
|
|
101.INS
|
XBRL Instance Document
|
|
|
101.SCH
|
XBRL Taxonomy Extension Schema Document
|
|
|
101.CAL
|
XBRL Taxonomy Extension Calculation Linkbase Document
|
|
|
101.DEF
|
XBRL Taxonomy Extension Definition Linkbase Document
|
|
|
101.LAB
|
XBRL Taxonomy Extension Label Linkbase Document
|
|
|
101.PRE
|
XBRL Taxonomy Extension Presentation Linkbase Document
|
|
93
TABLE OF CONTENTS
Part I. Financial InformationItem 1. Financial StatementsItem 2. Management S Discussion and Analysis Of Financial Condition and Results Of OperationsItem 3. Quantitative and Qualitative Disclosures About Market RiskItem 4. Controls and ProceduresPart II. Other InformationItem 1. Legal ProceedingsItem 2. Unregistered Sales Of Equity Securities and Use Of ProceedsItem 4. Mine Safety DisclosuresItem 6. Exhibits