CATERPILLAR INC
10-Ks and 10-Qs
|
|
|
|
|
|
|
|
|
|
|
|
|
|
|
|
|
|
|
|
|
|
|
|
|
|
|
|
|
|
|
|
|
|
|
|
|
|
|
|
|
|
|
|
|
|
|
|
|
|
|
|
|
|
|
|
|
|
|
UNITED STATES
SECURITIES AND EXCHANGE COMMISSION
Washington, D.C. 20549

FORM
10-Q
For the quarterly period ended
September 30, 2021
OR
For the transition period from to
Commission File Number:
1-768
(Exact name of registrant as specified in its charter)
|
|
|
|||||||||||||
| (State or other jurisdiction of incorporation) | (IRS Employer I.D. No.) | |||||||||||||
|
|
|
|
|
|
||||||||||
| (Address of principal executive offices) | (Zip Code) | |||||||||||||
Registrant’s telephone number, including area code:
(
224
)
551-4000
Former Name, Former Address and Former Fiscal Year, if Changed Since Last Report:
N/A
Securities registered pursuant to Section 12(b) of the Act:
| Title of each class | Trading Symbol (s) | Name of each exchange on which registered | |||||||||
|
|
|
|
¹ | ||||||||
|
|
|
|
|||||||||
|
|
|
|
|||||||||
¹ In addition to the New York Stock Exchange, Caterpillar common stock is also listed on stock exchanges in France and Switzerland.
Indicate by check mark whether the registrant (1) has filed all reports required to be filed by Section 13 or 15(d) of the Securities Exchange Act of 1934 during the preceding 12 months (or for such shorter period that the registrant was required to file such reports), and (2) has been subject to such filing requirements for the past 90 days.
Yes
☒
No
☐
Indicate by check mark whether the registrant has submitted electronically every Interactive Data File required to be submitted pursuant to Rule 405 of Regulation S-T (§232.405 of this chapter) during the preceding 12 months (or for such shorter period that the registrant was required to submit such files).
Yes
☒
No
☐
Indicate by check mark whether the registrant is a large accelerated filer, an accelerated filer, a non-accelerated filer, smaller reporting company, or an emerging growth company. See definitions of “large accelerated filer,” “accelerated filer,” “smaller reporting company,” and “emerging growth company” in Rule 12b-2 of the Exchange Act.
|
|
☒ | Accelerated filer | ☐ | ||||||||
| Non-accelerated filer | ☐ | Smaller reporting company |
|
||||||||
| Emerging growth company |
|
||||||||||
If an emerging growth company, indicate by check mark if the registrant has elected not to use the extended transition period for complying with any new or revised financial accounting standards provided pursuant to Section 13(a) of the Exchange Act.
☐
Indicate by check mark whether the registrant is a shell company (as defined in Rule 12b-2 of the Exchange Act). Yes
☐
No
☒
At September 30, 2021,
540,941,600
shares of common stock of the registrant were outstanding.
Table of Contents
| Item 3. | Defaults Upon Senior Securities | * | ||||||
| Item 4. | Mine Safety Disclosures | * | ||||||
| Item 5. | * | |||||||
* Item omitted because no answer is called for or item is not applicable.
2
Part I. FINANCIAL INFORMATION
Item 1. Financial Statements
Caterpillar Inc.
Consolidated Statement of Results of Operations
(Unaudited)
(Dollars in millions except per share data)
| Three Months Ended September 30 | |||||||||||
| 2021 | 2020 | ||||||||||
| Sales and revenues: | |||||||||||
| Sales of Machinery, Energy & Transportation | $ |
|
$ |
|
|||||||
| Revenues of Financial Products |
|
|
|||||||||
| Total sales and revenues |
|
|
|||||||||
| Operating costs: | |||||||||||
| Cost of goods sold |
|
|
|||||||||
| Selling, general and administrative expenses |
|
|
|||||||||
| Research and development expenses |
|
|
|||||||||
| Interest expense of Financial Products |
|
|
|||||||||
| Other operating (income) expenses |
|
|
|||||||||
| Total operating costs |
|
|
|||||||||
| Operating profit |
|
|
|||||||||
| Interest expense excluding Financial Products |
|
|
|||||||||
| Other income (expense) |
|
|
|||||||||
| Consolidated profit before taxes |
|
|
|||||||||
| Provision (benefit) for income taxes |
|
|
|||||||||
| Profit of consolidated companies |
|
|
|||||||||
| Equity in profit (loss) of unconsolidated affiliated companies |
|
(
|
|||||||||
| Profit of consolidated and affiliated companies |
|
|
|||||||||
| Less: Profit (loss) attributable to noncontrolling interests |
|
|
|||||||||
|
Profit
1
|
$ |
|
$ |
|
|||||||
| Profit per common share | $ |
|
$ |
|
|||||||
|
Profit per common share – diluted
2
|
$ |
|
$ |
|
|||||||
| Weighted-average common shares outstanding (millions) | |||||||||||
| – Basic |
|
|
|||||||||
|
– Diluted
2
|
|
|
|||||||||
1
Profit attributable to common shareholders.
2
Diluted by assumed exercise of stock-based compensation awards using the treasury stock method.
See accompanying notes to Consolidated Financial Statements.
3
Caterpillar Inc
.
Consolidated Statement of Comprehensive Income
(Unaudited)
(Dollars in millions)
| Three Months Ended September 30 | |||||||||||
| 2021 | 2020 | ||||||||||
| Profit of consolidated and affiliated companies | $ |
|
$ |
|
|||||||
| Other comprehensive income (loss), net of tax (Note 13): | |||||||||||
| Foreign currency translation: |
(
|
|
|||||||||
| Pension and other postretirement benefits: |
(
|
(
|
|||||||||
| Derivative financial instruments: |
(
|
|
|||||||||
| Available-for-sale securities: |
(
|
|
|||||||||
| Total other comprehensive income (loss), net of tax |
(
|
|
|||||||||
| Comprehensive income |
|
|
|||||||||
| Less: comprehensive income attributable to the noncontrolling interests |
|
|
|||||||||
| Comprehensive income attributable to shareholders | $ |
|
$ |
|
|||||||
See accompanying notes to Consolidated Financial Statements.
4
Caterpillar Inc.
Consolidated Statement of Results of Operations
(Unaudited)
(Dollars in millions except per share data)
| Nine Months Ended September 30 | |||||||||||
| 2021 | 2020 | ||||||||||
| Sales and revenues: | |||||||||||
| Sales of Machinery, Energy & Transportation | $ |
|
$ |
|
|||||||
| Revenues of Financial Products |
|
|
|||||||||
| Total sales and revenues |
|
|
|||||||||
| Operating costs: | |||||||||||
| Cost of goods sold |
|
|
|||||||||
| Selling, general and administrative expenses |
|
|
|||||||||
| Research and development expenses |
|
|
|||||||||
| Interest expense of Financial Products |
|
|
|||||||||
| Other operating (income) expenses |
|
|
|||||||||
| Total operating costs |
|
|
|||||||||
| Operating profit |
|
|
|||||||||
| Interest expense excluding Financial Products |
|
|
|||||||||
| Other income (expense) |
|
|
|||||||||
| Consolidated profit before taxes |
|
|
|||||||||
| Provision (benefit) for income taxes |
|
|
|||||||||
| Profit of consolidated companies |
|
|
|||||||||
| Equity in profit (loss) of unconsolidated affiliated companies |
|
|
|||||||||
| Profit of consolidated and affiliated companies |
|
|
|||||||||
| Less: Profit (loss) attributable to noncontrolling interests |
|
|
|||||||||
|
Profit
1
|
$ |
|
$ |
|
|||||||
| Profit per common share | $ |
|
$ |
|
|||||||
|
Profit per common share – diluted
2
|
$ |
|
$ |
|
|||||||
| Weighted-average common shares outstanding (millions) | |||||||||||
| – Basic |
|
|
|||||||||
|
– Diluted
2
|
|
|
|||||||||
1
Profit attributable to common shareholders.
2
Diluted by assumed exercise of stock-based compensation awards using the treasury stock method.
See accompanying notes to Consolidated Financial Statements.
5
Caterpillar Inc
.
Consolidated Statement of Comprehensive Income
(Unaudited)
(Dollars in millions)
| Nine Months Ended September 30 | |||||||||||
| 2021 | 2020 | ||||||||||
| Profit of consolidated and affiliated companies | $ |
|
$ |
|
|||||||
| Other comprehensive income (loss), net of tax (Note 13): | |||||||||||
| Foreign currency translation: |
(
|
|
|||||||||
| Pension and other postretirement benefits: |
(
|
(
|
|||||||||
| Derivative financial instruments: |
(
|
|
|||||||||
| Available-for-sale securities: |
(
|
|
|||||||||
| Total other comprehensive income (loss), net of tax |
(
|
|
|||||||||
| Comprehensive income |
|
|
|||||||||
| Less: comprehensive income attributable to the noncontrolling interests |
|
|
|||||||||
| Comprehensive income attributable to shareholders | $ |
|
$ |
|
|||||||
See accompanying notes to Consolidated Financial Statements.
6
Caterpillar Inc
.
Consolidated Statement of Financial Position
(Unaudited)
(Dollars in millions)
|
September 30,
2021 |
December 31,
2020 |
||||||||||
| Assets | |||||||||||
| Current assets: | |||||||||||
| Cash and cash equivalents | $ |
|
$ |
|
|||||||
| Receivables – trade and other |
|
|
|||||||||
| Receivables – finance |
|
|
|||||||||
| Prepaid expenses and other current assets |
|
|
|||||||||
| Inventories |
|
|
|||||||||
| Total current assets |
|
|
|||||||||
| Property, plant and equipment – net |
|
|
|||||||||
| Long-term receivables – trade and other |
|
|
|||||||||
| Long-term receivables – finance |
|
|
|||||||||
| Noncurrent deferred and refundable income taxes |
|
|
|||||||||
| Intangible assets |
|
|
|||||||||
| Goodwill |
|
|
|||||||||
| Other assets |
|
|
|||||||||
| Total assets | $ |
|
$ |
|
|||||||
| Liabilities | |||||||||||
| Current liabilities: | |||||||||||
| Short-term borrowings: | |||||||||||
| Machinery, Energy & Transportation | $ |
|
$ |
|
|||||||
| Financial Products |
|
|
|||||||||
| Accounts payable |
|
|
|||||||||
| Accrued expenses |
|
|
|||||||||
| Accrued wages, salaries and employee benefits |
|
|
|||||||||
| Customer advances |
|
|
|||||||||
| Dividends payable |
|
|
|||||||||
| Other current liabilities |
|
|
|||||||||
| Long-term debt due within one year: | |||||||||||
| Machinery, Energy & Transportation |
|
|
|||||||||
| Financial Products |
|
|
|||||||||
| Total current liabilities |
|
|
|||||||||
| Long-term debt due after one year: | |||||||||||
| Machinery, Energy & Transportation |
|
|
|||||||||
| Financial Products |
|
|
|||||||||
| Liability for postemployment benefits |
|
|
|||||||||
| Other liabilities |
|
|
|||||||||
| Total liabilities |
|
|
|||||||||
| Commitments and contingencies (Notes 11 and 14) |
|
|
|||||||||
| Shareholders’ equity | |||||||||||
|
Common stock of $
|
|||||||||||
|
Authorized shares:
Issued shares: (9/30/21 and 12/31/20 –
|
|
|
|||||||||
|
Treasury stock (9/30/21 –
|
(
|
(
|
|||||||||
| Profit employed in the business |
|
|
|||||||||
| Accumulated other comprehensive income (loss) |
(
|
(
|
|||||||||
| Noncontrolling interests |
|
|
|||||||||
| Total shareholders’ equity |
|
|
|||||||||
| Total liabilities and shareholders’ equity | $ |
|
$ |
|
|||||||
See accompanying notes to Consolidated Financial Statements.
7
Caterpillar Inc.
Consolidated Statement of Changes in Shareholders’ Equity
(Unaudited)
(Dollars in millions)
|
Common
stock |
Treasury
stock |
Profit
employed in the business |
Accumulated
other comprehensive income (loss) |
Noncontrolling
interests |
Total | ||||||||||||||||||||||||||||||
| Three Months Ended September 30, 2020 | |||||||||||||||||||||||||||||||||||
| Balance at June 30, 2020 | $ |
|
$ |
(
|
$ |
|
$ |
(
|
$ |
|
$ |
|
|||||||||||||||||||||||
| Profit of consolidated and affiliated companies |
|
|
|
|
|
|
|||||||||||||||||||||||||||||
| Foreign currency translation, net of tax |
|
|
|
|
|
|
|||||||||||||||||||||||||||||
| Pension and other postretirement benefits, net of tax |
|
|
|
(
|
|
(
|
|||||||||||||||||||||||||||||
| Derivative financial instruments, net of tax |
|
|
|
|
|
|
|||||||||||||||||||||||||||||
| Available-for-sale securities, net of tax |
|
|
|
|
|
|
|||||||||||||||||||||||||||||
|
Common shares issued from treasury stock for stock-based compensation:
|
|
|
|
|
|
|
|||||||||||||||||||||||||||||
| Stock-based compensation expense |
|
|
|
|
|
|
|||||||||||||||||||||||||||||
| Other |
|
|
(
|
|
(
|
|
|||||||||||||||||||||||||||||
| Balance at September 30, 2020 | $ |
|
$ |
(
|
$ |
|
$ |
(
|
$ |
|
$ |
|
|||||||||||||||||||||||
| Three Months Ended September 30, 2021 | |||||||||||||||||||||||||||||||||||
| Balance at June 30, 2021 | $ |
|
$ |
(
|
$ |
|
$ |
(
|
$ |
|
$ |
|
|||||||||||||||||||||||
| Profit of consolidated and affiliated companies |
|
|
|
|
|
|
|||||||||||||||||||||||||||||
| Foreign currency translation, net of tax |
|
|
|
(
|
|
(
|
|||||||||||||||||||||||||||||
| Pension and other postretirement benefits, net of tax |
|
|
|
(
|
|
(
|
|||||||||||||||||||||||||||||
| Derivative financial instruments, net of tax |
|
|
|
(
|
|
(
|
|||||||||||||||||||||||||||||
| Available-for-sale securities, net of tax |
|
|
|
(
|
|
(
|
|||||||||||||||||||||||||||||
| Change in ownership from noncontrolling interests |
|
|
|
|
(
|
(
|
|||||||||||||||||||||||||||||
| Dividends declared |
|
|
|
|
|
|
|||||||||||||||||||||||||||||
| Distribution to noncontrolling interests |
|
|
|
|
(
|
(
|
|||||||||||||||||||||||||||||
|
Common shares issued from treasury stock for stock-based compensation:
|
(
|
|
|
|
|
(
|
|||||||||||||||||||||||||||||
| Stock-based compensation expense |
|
|
|
|
|
|
|||||||||||||||||||||||||||||
|
Common shares repurchased:
|
|
(
|
|
|
|
(
|
|||||||||||||||||||||||||||||
| Other |
|
(
|
|
|
(
|
|
|||||||||||||||||||||||||||||
| Balance at September 30, 2021 | $ |
|
$ |
(
|
$ |
|
$ |
(
|
$ |
|
$ |
|
|||||||||||||||||||||||
1
See Note 12 for additional information.
See accompanying notes to Consolidated Financial Statements.
8
Caterpillar Inc.
Consolidated Statement of Changes in Shareholders’ Equity
(Unaudited)
(Dollars in millions)
|
Common
stock |
Treasury
stock |
Profit
employed in the business |
Accumulated
other comprehensive income (loss) |
Noncontrolling
interests |
Total | ||||||||||||||||||||||||||||||
| Nine Months Ended September 30, 2020 | |||||||||||||||||||||||||||||||||||
| Balance at December 31, 2019 | $ |
|
$ |
(
|
$ |
|
$ |
(
|
$ |
|
$ |
|
|||||||||||||||||||||||
| Adjustments to adopt new accounting guidance | |||||||||||||||||||||||||||||||||||
| Credit losses |
|
|
(
|
|
|
(
|
|||||||||||||||||||||||||||||
| Balance at January 1, 2020 |
|
(
|
|
(
|
|
|
|||||||||||||||||||||||||||||
| Profit of consolidated and affiliated companies |
|
|
|
|
|
|
|||||||||||||||||||||||||||||
| Foreign currency translation, net of tax |
|
|
|
|
|
|
|||||||||||||||||||||||||||||
| Pension and other postretirement benefits, net of tax |
|
|
|
(
|
|
(
|
|||||||||||||||||||||||||||||
| Derivative financial instruments, net of tax |
|
|
|
|
|
|
|||||||||||||||||||||||||||||
| Available-for-sale securities, net of tax |
|
|
|
|
|
|
|||||||||||||||||||||||||||||
|
Dividends declared
1
|
|
|
(
|
|
|
(
|
|||||||||||||||||||||||||||||
|
Common shares issued from treasury stock for stock-based compensation:
|
(
|
|
|
|
|
|
|||||||||||||||||||||||||||||
| Stock-based compensation expense |
|
|
|
|
|
|
|||||||||||||||||||||||||||||
|
Common shares repurchased:
|
|
(
|
|
|
|
(
|
|||||||||||||||||||||||||||||
| Other |
|
(
|
(
|
|
(
|
|
|||||||||||||||||||||||||||||
| Balance at September 30, 2020 | $ |
|
$ |
(
|
$ |
|
$ |
(
|
$ |
|
$ |
|
|||||||||||||||||||||||
| Nine Months Ended September 30, 2021 | |||||||||||||||||||||||||||||||||||
| Balance at December 31, 2020 | $ |
|
$ |
(
|
$ |
|
$ |
(
|
$ |
|
$ |
|
|||||||||||||||||||||||
| Profit of consolidated and affiliated companies |
|
|
|
|
|
|
|||||||||||||||||||||||||||||
| Foreign currency translation, net of tax |
|
|
|
(
|
|
(
|
|||||||||||||||||||||||||||||
| Pension and other postretirement benefits, net of tax |
|
|
|
(
|
|
(
|
|||||||||||||||||||||||||||||
| Derivative financial instruments, net of tax |
|
|
|
(
|
|
(
|
|||||||||||||||||||||||||||||
| Available-for-sale securities, net of tax |
|
|
|
(
|
|
(
|
|||||||||||||||||||||||||||||
| Change in ownership from noncontrolling interests |
|
|
|
|
(
|
(
|
|||||||||||||||||||||||||||||
|
Dividends declared
1
|
|
|
(
|
|
|
(
|
|||||||||||||||||||||||||||||
| Distribution to noncontrolling interests |
|
|
|
|
(
|
(
|
|||||||||||||||||||||||||||||
|
Common shares issued from treasury stock for stock-based compensation:
|
(
|
|
|
|
|
|
|||||||||||||||||||||||||||||
| Stock-based compensation expense |
|
|
|
|
|
|
|||||||||||||||||||||||||||||
|
Common shares repurchased:
|
|
(
|
|
|
|
(
|
|||||||||||||||||||||||||||||
| Other |
|
|
|
|
(
|
|
|||||||||||||||||||||||||||||
| Balance at September 30, 2021 | $ |
|
$ |
(
|
$ |
|
$ |
(
|
$ |
|
$ |
|
|||||||||||||||||||||||
1
Dividends per share of common stock of $
2.14
and $
2.06
were declared in the nine months ended September 30, 2021 and 2020, respectively.
2
See Note 12 for additional information
.
See accompanying notes to Consolidated Financial Statements.
9
Caterpillar Inc.
Consolidated Statement of Cash Flow
(Unaudited)
(Millions of dollars)
| Nine Months Ended September 30 | |||||||||||
| 2021 | 2020 | ||||||||||
| Cash flow from operating activities: | |||||||||||
| Profit of consolidated and affiliated companies | $ |
|
$ |
|
|||||||
| Adjustments for non-cash items: | |||||||||||
| Depreciation and amortization |
|
|
|||||||||
| Net gain on remeasurement of pension obligations |
|
(
|
|||||||||
| Provision (benefit) for deferred income taxes |
(
|
(
|
|||||||||
| Other |
|
|
|||||||||
| Changes in assets and liabilities, net of acquisitions and divestitures: | |||||||||||
| Receivables – trade and other |
(
|
|
|||||||||
| Inventories |
(
|
(
|
|||||||||
| Accounts payable |
|
(
|
|||||||||
| Accrued expenses |
|
(
|
|||||||||
| Accrued wages, salaries and employee benefits |
|
(
|
|||||||||
| Customer advances |
|
|
|||||||||
| Other assets – net |
|
(
|
|||||||||
| Other liabilities – net |
(
|
(
|
|||||||||
| Net cash provided by (used for) operating activities |
|
|
|||||||||
| Cash flow from investing activities: | |||||||||||
| Capital expenditures – excluding equipment leased to others |
(
|
(
|
|||||||||
| Expenditures for equipment leased to others |
(
|
(
|
|||||||||
| Proceeds from disposals of leased assets and property, plant and equipment |
|
|
|||||||||
| Additions to finance receivables |
(
|
(
|
|||||||||
| Collections of finance receivables |
|
|
|||||||||
| Proceeds from sale of finance receivables |
|
|
|||||||||
| Investments and acquisitions (net of cash acquired) |
(
|
(
|
|||||||||
| Proceeds from sale of businesses and investments (net of cash sold) |
|
|
|||||||||
| Proceeds from sale of securities |
|
|
|||||||||
| Investments in securities |
(
|
(
|
|||||||||
| Other – net |
(
|
(
|
|||||||||
| Net cash provided by (used for) investing activities |
(
|
(
|
|||||||||
| Cash flow from financing activities: | |||||||||||
| Dividends paid |
(
|
(
|
|||||||||
| Common stock issued, including treasury shares reissued |
|
|
|||||||||
| Common shares repurchased |
(
|
(
|
|||||||||
| Proceeds from debt issued (original maturities greater than three months): | |||||||||||
| Machinery, Energy & Transportation |
|
|
|||||||||
| Financial Products |
|
|
|||||||||
| Payments on debt (original maturities greater than three months): | |||||||||||
| Machinery, Energy & Transportation |
(
|
(
|
|||||||||
| Financial Products |
(
|
(
|
|||||||||
| Short-term borrowings – net (original maturities three months or less) |
|
(
|
|||||||||
| Other – net |
(
|
(
|
|||||||||
| Net cash provided by (used for) financing activities |
(
|
(
|
|||||||||
| Effect of exchange rate changes on cash |
(
|
(
|
|||||||||
| Increase (decrease) in cash, cash equivalents and restricted cash |
|
|
|||||||||
| Cash, cash equivalents and restricted cash at beginning of period |
|
|
|||||||||
| Cash, cash equivalents and restricted cash at end of period | $ |
|
$ |
|
|||||||
Cash equivalents primarily represent short-term, highly liquid investments with original maturities of generally three months or less
.
See accompanying notes to Consolidated Financial Statements.
10
NOTES TO CONSOLIDATED FINANCIAL STATEMENTS
(Unaudited)
1.
A. Nature of operations
Information in our financial statements and related commentary are presented in the following categories:
Machinery, Energy & Transportation
(ME&T) – We define ME&T as Caterpillar Inc. and its subsidiaries, excluding Financial Products. ME&T’s information relates to the design, manufacturing and marketing of our products.
Financial Products
– We define Financial Products as our finance and insurance subsidiaries, primarily Caterpillar Financial Services Corporation (Cat Financial) and Caterpillar Insurance Holdings Inc. (Insurance Services). Financial Products’ information relates to the financing to customers and dealers for the purchase and lease of Caterpillar and other equipment.
B. Basis of presentation
In the opinion of management, the accompanying unaudited financial statements include all adjustments, consisting only of normal recurring adjustments, necessary for a fair statement of (a) the consolidated results of operations for the three and nine months ended September 30, 2021 and 2020, (b) the consolidated comprehensive income for the three and nine months ended September 30, 2021 and 2020, (c) the consolidated financial position at September 30, 2021 and December 31, 2020, (d) the consolidated changes in shareholders’ equity for the three and nine months ended September 30, 2021 and 2020 and (e) the consolidated cash flow for the nine months ended September 30, 2021 and 2020. The financial statements have been prepared in conformity with generally accepted accounting principles in the United States of America (U.S. GAAP) and pursuant to the rules and regulations of the Securities and Exchange Commission (SEC).
Interim results are not necessarily indicative of results for a full year. The information included in this Form 10-Q should be read in conjunction with the audited financial statements and notes thereto included in our company’s annual report on Form 10-K for the year ended December 31, 2020 (2020 Form 10-K).
The December 31, 2020 financial position data included herein is derived from the audited consolidated financial statements included in the 2020 Form 10-K but does not include all disclosures required by U.S. GAAP. Certain amounts for prior periods have been reclassified to conform to the current period financial statement presentation.
2.
New accounting guidance
A. Adoption of new accounting standards
Reference rate reform
(Accounting Standards Update (ASU) 2020-04) – In March 2020, the Financial Accounting Standards Board (FASB) issued accounting guidance to ease the potential burden in accounting for reference rate reform related activities that impact debt, leases, derivatives and other contracts. The guidance is optional and may be elected over time as reference rate reform activities occur between March 12, 2020 through December 31, 2022. In January 2021, we elected to adopt optional expedients impacting our derivative instruments. In addition, in October 2021, we elected to adopt optional expedients for contract modifications. The adoption of the optional expedients will not have a material impact on our financial statements.
11
We adopted the following ASUs effective January 1, 2021, none of which had a material impact on our financial statements:
| ASU | Description | ||||
| 2020-01 | Investments - Equity securities, equity method and joint ventures and derivatives and hedging | ||||
| 2020-08 | Codification improvements – Receivables - Nonrefundable fees and other costs | ||||
| 2021-01 | Reference rate reform - Scope | ||||
B. Accounting standards issued but not yet adopted
We consider the applicability and impact of all ASUs. We assessed the ASUs and determined that they either were not applicable or were not expected to have a material impact on our financial statements.
3.
Sales and revenue contract information
Trade receivables represent amounts due from dealers and end users for the sale of our products. In addition, Cat Financial provides wholesale inventory financing for a dealer’s purchase of inventory. We include wholesale inventory receivables in Receivables – trade and other and Long-term receivables – trade and other in the Consolidated Statement of Financial Position. Short-term trade receivables from dealers and end users were $
6,476
million, $
6,310
million and $
7,648
million as of September 30, 2021, December 31, 2020 and December 31, 2019, respectively. We recognize short-term trade receivables from dealers and end users in Receivables – trade and other in the Consolidated Statement of Financial Position. Long-term trade receivables from dealers and end users were $
667
million, $
657
million and $
693
million as of September 30, 2021, December 31, 2020 and December 31, 2019, respectively. We recognize long-term trade receivables from dealers and end users in Long-term receivables – trade and other in the Consolidated Statement of Financial Position.
We invoice in advance of recognizing the sale of certain products. We recognize advanced customer payments as a contract liability in Customer advances and Other liabilities in the Consolidated Statement of Financial Position. Contract liabilities were $
1,577
million, $
1,526
million and $
1,654
million as of September 30, 2021, December 31, 2020 and December 31, 2019, respectively. We reduce the contract liability when revenue is recognized. During the three and nine months ended September 30, 2021, we recognized $
121
million and $
795
million, respectively, of revenue that was recorded as a contract liability at the beginning of 2021. During the three and nine months ended September 30, 2020, we recognized $
144
million and $
843
million, respectively, of revenue that was recorded as a contract liability at the beginning of 2020.
As of September 30, 2021, we have entered into contracts with dealers and end users for which sales have not been recognized as we have not satisfied our performance obligations and transferred control of the products. The dollar amount of unsatisfied performance obligations for contracts with an original duration greater than one year is $
5.8
billion, with about one-third of the amount expected to be completed and revenue recognized in the
twelve months
following September 30, 2021. We have elected the practical expedient not to disclose unsatisfied performance obligations with an original contract duration of one year or less. Contracts with an original duration of one year or less are primarily sales to dealers for machinery, engines and replacement parts.
See Note 16 for further disaggregated sales and revenues information.
4.
Stock-based compensation
Accounting for stock-based compensation requires that the cost resulting from all stock-based payments be recognized in the financial statements based on the grant date fair value of the award. Our stock-based compensation primarily consists of stock options, restricted stock units (RSUs) and performance-based restricted stock units (PRSUs).
We recognized pretax stock-based compensation expense of $
58
million and $
169
million for the three and nine months ended September 30, 2021, respectively, and $
55
million and $
169
million for the three and nine months ended September 30, 2020, respectively.
12
The following table illustrates the type and fair value of the stock-based compensation awards granted during the nine months ended September 30, 2021 and 2020, respectively:
| Nine Months Ended September 30, 2021 | Nine Months Ended September 30, 2020 | ||||||||||||||||||||||||||||||||||
| Shares Granted | Weighted-Average Fair Value Per Share | Weighted-Average Grant Date Stock Price | Shares Granted | Weighted-Average Fair Value Per Share | Weighted-Average Grant Date Stock Price | ||||||||||||||||||||||||||||||
| Stock options |
|
$ |
|
$ |
|
|
$ |
|
$ |
|
|||||||||||||||||||||||||
| RSUs |
|
$ |
|
$ |
|
|
$ |
|
$ |
|
|||||||||||||||||||||||||
| PRSUs |
|
$ |
|
$ |
|
|
$ |
|
$ |
|
|||||||||||||||||||||||||
The following table provides the assumptions used in determining the fair value of the stock-based awards for the nine months ended September 30, 2021 and 2020, respectively:
| Grant Year | |||||||||||
| 2021 | 2020 | ||||||||||
| Weighted-average dividend yield |
|
|
|||||||||
| Weighted-average volatility |
|
|
|||||||||
| Range of volatilities |
|
|
|||||||||
| Range of risk-free interest rates |
|
|
|||||||||
| Weighted-average expected lives |
|
|
|||||||||
5.
Derivative financial instruments and risk management
Our earnings and cash flow are subject to fluctuations due to changes in foreign currency exchange rates, interest rates and commodity prices. Our Risk Management Policy (policy) allows for the use of derivative financial instruments to prudently manage foreign currency exchange rate, interest rate and commodity price exposures. Our policy specifies that derivatives are not to be used for speculative purposes. Derivatives that we use are primarily foreign currency forward, option and cross currency contracts, interest rate contracts and commodity forward and option contracts. Our derivative activities are subject to the management, direction and control of our senior financial officers. We present at least annually to the Audit Committee of the Board of Directors on our risk management practices, including our use of financial derivative instruments.
We recognize all derivatives at their fair value on the Consolidated Statement of Financial Position. On the date the derivative contract is entered into, we designate the derivative as (1) a hedge of the fair value of a recognized asset or liability (fair value hedge), (2) a hedge of a forecasted transaction or the variability of cash flow (cash flow hedge) or (3) an undesignated instrument. We record in current earnings changes in the fair value of a derivative that is qualified, designated and highly effective as a fair value hedge, along with the gain or loss on the hedged recognized asset or liability that is attributable to the hedged risk. We record in Accumulated other comprehensive income (loss) (AOCI) changes in the fair value of a derivative that is qualified, designated and highly effective as a cash flow hedge, to the extent effective, on the Consolidated Statement of Financial Position until we reclassify them to earnings in the same period or periods during which the hedged transaction affects earnings. We report changes in the fair value of undesignated derivative instruments in current earnings. We classify cash flows from designated derivative financial instruments within the same category as the item being hedged on the Consolidated Statement of Cash Flow. We include cash flows from undesignated derivative financial instruments in the investing category on the Consolidated Statement of Cash Flow.
We formally document all relationships between hedging instruments and hedged items, as well as the risk-management objective and strategy for undertaking various hedge transactions. This process includes linking all derivatives that are designated as fair value hedges to specific assets and liabilities on the Consolidated Statement of Financial Position and linking cash flow hedges to specific forecasted transactions or variability of cash flow.
13
We also formally assess, both at the hedge’s inception and on an ongoing basis, whether the designated derivatives that are used in hedging transactions are highly effective in offsetting changes in fair values or cash flow of hedged items. When a derivative is determined not to be highly effective as a hedge or the underlying hedged transaction is no longer probable, we discontinue hedge accounting prospectively, in accordance with the derecognition criteria for hedge accounting.
Foreign Currency Exchange Rate Risk
Foreign currency exchange rate movements create a degree of risk by affecting the U.S. dollar value of sales made and costs incurred in foreign currencies. Movements in foreign currency rates also affect our competitive position as these changes may affect business practices and/or pricing strategies of non-U.S.-based competitors. Additionally, we have balance sheet positions denominated in foreign currencies, thereby creating exposure to movements in exchange rates.
Our ME&T operations purchase, manufacture and sell products in many locations around the world. As we have a diversified revenue and cost base, we manage our future foreign currency cash flow exposure on a net basis. We use foreign currency forward and option contracts to manage unmatched foreign currency cash inflow and outflow. Our objective is to minimize the risk of exchange rate movements that would reduce the U.S. dollar value of our foreign currency cash flow. Our policy allows for managing anticipated foreign currency cash flow for up to approximately
five years
. As of September 30, 2021, the maximum term of these outstanding contracts was approximately
60
months.
We generally designate as cash flow hedges at inception of the contract any Australian dollar, Brazilian real, British pound, Canadian dollar, Chinese yuan, Indian rupee, Japanese yen, Mexican peso, Norwegian Krona, Singapore dollar or Thailand baht forward or option contracts that meet the requirements for hedge accounting and the maturity extends beyond the current quarter-end. We perform designation on a specific exposure basis to support hedge accounting. The remainder of ME&T foreign currency contracts are undesignated.
In managing foreign currency risk for our Financial Products operations, our objective is to minimize earnings volatility resulting from conversion and the remeasurement of net foreign currency balance sheet positions and future transactions denominated in foreign currencies. Our policy allows the use of foreign currency forward, option and cross currency contracts to offset the risk of currency mismatch between our assets and liabilities and exchange rate risk associated with future transactions denominated in foreign currencies. Our foreign currency forward and option contracts are primarily undesignated. We designate fixed-to-fixed cross currency contracts as cash flow hedges to protect against movements in exchange rates on foreign currency fixed-rate assets and liabilities.
Interest Rate Risk
Interest rate movements create a degree of risk by affecting the amount of our interest payments and the value of our fixed-rate debt. Our practice is to use interest rate contracts to manage our exposure to interest rate changes.
Our ME&T operations generally use fixed-rate debt as a source of funding. Our objective is to minimize the cost of borrowed funds. Our policy allows us to enter into fixed-to-floating interest rate contracts and forward rate agreements to meet that objective. We designate fixed-to-floating interest rate contracts as fair value hedges at inception of the contract, and we designate certain forward rate agreements as cash flow hedges at inception of the contract.
Financial Products operations has a match-funding policy that addresses interest rate risk by aligning the interest rate profile (fixed or floating rate and duration) of Cat Financial’s debt portfolio with the interest rate profile of our receivables portfolio within predetermined ranges on an ongoing basis. In connection with that policy, we use interest rate derivative instruments to modify the debt structure to match assets within the receivables portfolio. This matched funding reduces the volatility of margins between interest-bearing assets and interest-bearing liabilities, regardless of which direction interest rates move.
Our policy allows us to use fixed-to-floating, floating-to-fixed and floating-to-floating interest rate contracts to meet the match-funding objective. We designate fixed-to-floating interest rate contracts as fair value hedges to protect debt against changes in fair value due to changes in the benchmark interest rate. We designate most floating-to-fixed interest rate contracts as cash flow hedges to protect against the variability of cash flows due to changes in the benchmark interest rate.
14
We have, at certain times, liquidated fixed-to-floating and floating-to-fixed interest rate contracts at both ME&T and Financial Products. We amortize the gains or losses associated with these contracts at the time of liquidation into earnings over the original term of the previously designated hedged item.
Commodity Price Risk
Commodity price movements create a degree of risk by affecting the price we must pay for certain raw materials. Our policy is to use commodity forward and option contracts to manage the commodity risk and reduce the cost of purchased materials.
Our ME&T operations purchase base and precious metals embedded in the components we purchase from suppliers. Our suppliers pass on to us price changes in the commodity portion of the component cost. In addition, we are subject to price changes on energy products such as natural gas and diesel fuel purchased for operational use.
Our objective is to minimize volatility in the price of these commodities. Our policy allows us to enter into commodity forward and option contracts to lock in the purchase price of a portion of these commodities within a
five-year
horizon. All such commodity forward and option contracts are undesignated.
The location and fair value of derivative instruments reported in the Consolidated Statement of Financial Position were as follows:
|
(Millions of dollars)
|
Consolidated Statement of Financial | Asset (Liability) Fair Value | |||||||||||||||
| Position Location | September 30, 2021 | December 31, 2020 | |||||||||||||||
| Designated derivatives | |||||||||||||||||
| Foreign exchange contracts | |||||||||||||||||
| Machinery, Energy & Transportation | Receivables – trade and other | $ |
|
$ |
|
||||||||||||
| Machinery, Energy & Transportation | Long-term receivables – trade and other |
|
|
||||||||||||||
| Machinery, Energy & Transportation | Accrued expenses |
(
|
(
|
||||||||||||||
| Machinery, Energy & Transportation | Other liabilities |
(
|
(
|
||||||||||||||
| Financial Products | Receivables – trade and other |
|
|
||||||||||||||
| Financial Products | Long-term receivables – trade and other |
|
|
||||||||||||||
| Financial Products | Accrued expenses |
(
|
(
|
||||||||||||||
| Interest rate contracts | |||||||||||||||||
| Machinery, Energy & Transportation | Long-term receivables – trade and other |
|
|
||||||||||||||
| Financial Products | Receivables – trade and other |
|
|
||||||||||||||
| Financial Products | Long-term receivables – trade and other |
|
|
||||||||||||||
| Financial Products | Accrued expenses |
(
|
(
|
||||||||||||||
| $ |
|
$ |
|
||||||||||||||
| Undesignated derivatives | |||||||||||||||||
| Foreign exchange contracts | |||||||||||||||||
| Machinery, Energy & Transportation | Receivables – trade and other | $ |
|
$ |
|
||||||||||||
| Machinery, Energy & Transportation | Long-term receivables – trade and other |
|
|
||||||||||||||
| Machinery, Energy & Transportation | Accrued expenses |
(
|
(
|
||||||||||||||
| Financial Products | Receivables – trade and other |
|
|
||||||||||||||
| Financial Products | Long-term receivables – trade and other |
|
|
||||||||||||||
| Financial Products | Accrued expenses |
(
|
(
|
||||||||||||||
| Commodity contracts | |||||||||||||||||
| Machinery, Energy & Transportation | Receivables – trade and other |
|
|
||||||||||||||
| Machinery, Energy & Transportation | Long-term receivables – trade and other |
|
|
||||||||||||||
| Machinery, Energy & Transportation | Accrued expenses |
(
|
|
||||||||||||||
| Machinery, Energy & Transportation | Other liabilities |
(
|
|
||||||||||||||
| $ |
|
$ |
(
|
||||||||||||||
15
The total notional amounts of the derivative instruments were as follows:
| (Millions of dollars) | September 30, 2021 | December 31, 2020 | ||||||||||||
| Machinery, Energy & Transportation | $ |
|
$ |
|
||||||||||
| Financial Products | $ |
|
$ |
|
||||||||||
The notional amounts of the derivative financial instruments do not represent amounts exchanged by the parties. We calculate the amounts exchanged by the parties by referencing the notional amounts and by other terms of the derivatives, such as foreign currency exchange rates, interest rates or commodity prices.
The effect of derivatives designated as hedging instruments on the Consolidated Statement of Results of Operations was as follows:
| Cash Flow Hedges | |||||||||||||||||||||||
| Three Months Ended September 30, 2021 | |||||||||||||||||||||||
| Recognized in Earnings | |||||||||||||||||||||||
|
(Millions of dollars)
|
Amount of Gains
(Losses) Recognized
in AOCI
|
Classification of
Gains (Losses) |
Amount of Gains
(Losses) Reclassified from AOCI |
Amount of the line items in the Consolidated Statement of Results of Operations | |||||||||||||||||||
| Foreign exchange contracts | |||||||||||||||||||||||
| Machinery, Energy & Transportation | $ |
(
|
Sales of Machinery, Energy & Transportation | $ |
|
$ |
|
||||||||||||||||
| Cost of goods sold |
|
|
|||||||||||||||||||||
| Financial Products |
|
Interest expense of Financial Products |
(
|
|
|||||||||||||||||||
| Other income (expense) |
|
|
|||||||||||||||||||||
| Interest rate contracts | |||||||||||||||||||||||
| Financial Products |
|
Interest expense of Financial Products |
(
|
|
|||||||||||||||||||
| $ |
|
$ |
|
||||||||||||||||||||
| Three Months Ended September 30, 2020 | |||||||||||||||||||||||
| Recognized in Earnings | |||||||||||||||||||||||
|
Amount of Gains
(Losses) Recognized in AOCI |
Classification of
Gains (Losses) |
Amount of Gains
(Losses) Reclassified from AOCI |
Amount of the line items in the Consolidated Statement of Results of Operations | ||||||||||||||||||||
| Foreign exchange contracts | |||||||||||||||||||||||
| Machinery, Energy & Transportation | $ |
|
Sales of Machinery, Energy & Transportation | $ |
(
|
$ |
|
||||||||||||||||
| Cost of goods sold |
(
|
|
|||||||||||||||||||||
| Financial Products |
(
|
Interest expense of Financial Products |
|
|
|||||||||||||||||||
| Other income (expense) |
(
|
|
|||||||||||||||||||||
| Interest rate contracts | |||||||||||||||||||||||
| Machinery, Energy & Transportation |
|
Interest expense excluding Financial Products |
(
|
|
|||||||||||||||||||
| Financial Products |
|
Interest expense of Financial Products |
(
|
|
|||||||||||||||||||
| $ |
|
$ |
(
|
||||||||||||||||||||
16
| Cash Flow Hedges | |||||||||||||||||||||||
| Nine Months Ended September 30, 2021 | |||||||||||||||||||||||
| Recognized in Earnings | |||||||||||||||||||||||
|
(Millions of dollars)
|
Amount of Gains
(Losses) Recognized
in AOCI
|
Classification of
Gains (Losses) |
Amount of Gains
(Losses) Reclassified from AOCI |
Amount of the line items in the Consolidated Statement of Results of Operations | |||||||||||||||||||
| Foreign exchange contracts | |||||||||||||||||||||||
| Machinery, Energy & Transportation | $ |
(
|
Sales of Machinery, Energy & Transportation | $ |
(
|
$ |
|
||||||||||||||||
| Cost of goods sold |
|
|
|||||||||||||||||||||
| Financial Products |
|
Interest expense of Financial Products |
(
|
|
|||||||||||||||||||
| Other income (expense) |
|
|
|||||||||||||||||||||
| Interest rate contracts | |||||||||||||||||||||||
| Machinery, Energy & Transportation |
|
Interest expense excluding Financial Products |
(
|
|
|||||||||||||||||||
| Financial Products |
|
Interest expense of Financial Products |
(
|
|
|||||||||||||||||||
| $ |
|
$ |
|
||||||||||||||||||||
| Nine Months Ended September 30, 2020 | |||||||||||||||||||||||
| Recognized in Earnings | |||||||||||||||||||||||
|
Amount of Gains
(Losses) Recognized in AOCI |
Classification of
Gains (Losses) |
Amount of Gains
(Losses) Reclassified from AOCI |
Amount of the line items in the Consolidated Statement of Results of Operations | ||||||||||||||||||||
| Foreign exchange contracts | |||||||||||||||||||||||
| Machinery, Energy & Transportation | $ |
(
|
Sales of Machinery, Energy & Transportation | $ |
|
$ |
|
||||||||||||||||
| Cost of goods sold |
(
|
|
|||||||||||||||||||||
| Financial Products |
|
Interest expense of Financial Products |
|
|
|||||||||||||||||||
| Other income (expense) |
(
|
|
|||||||||||||||||||||
| Interest rate contracts | |||||||||||||||||||||||
| Machinery, Energy & Transportation |
(
|
Interest expense excluding Financial Products |
(
|
|
|||||||||||||||||||
| Financial Products |
(
|
Interest expense of Financial Products |
(
|
|
|||||||||||||||||||
| $ |
(
|
$ |
(
|
||||||||||||||||||||
17
The effect of derivatives not designated as hedging instruments on the Consolidated Statement of Results of Operations was as follows:
|
(Millions of dollars)
|
Classification of Gains (Losses) | Three Months Ended September 30, 2021 | Three Months Ended September 30, 2020 | ||||||||||||||
| Foreign exchange contracts | |||||||||||||||||
| Machinery, Energy & Transportation | Other income (expense) | $ |
|
$ |
|
||||||||||||
| Financial Products | Other income (expense) |
|
(
|
||||||||||||||
| Commodity contracts | |||||||||||||||||
| Machinery, Energy & Transportation | Other income (expense) |
(
|
|
||||||||||||||
| $ |
|
$ |
(
|
||||||||||||||
| Classification of Gains (Losses) | Nine Months Ended September 30, 2021 | Nine Months Ended September 30, 2020 | |||||||||||||||
| Foreign exchange contracts | |||||||||||||||||
| Machinery, Energy & Transportation | Other income (expense) | $ |
|
$ |
|
||||||||||||
| Financial Products | Other income (expense) |
|
|
||||||||||||||
| Commodity contracts | |||||||||||||||||
| Machinery, Energy & Transportation | Other income (expense) |
|
(
|
||||||||||||||
| $ |
|
$ |
|
||||||||||||||
We enter into International Swaps and Derivatives Association (ISDA) master netting agreements within ME&T and Financial Products that permit the net settlement of amounts owed under their respective derivative contracts. Under these master netting agreements, net settlement generally permits the company or the counterparty to determine the net amount payable for contracts due on the same date and in the same currency for similar types of derivative transactions. The master netting agreements generally also provide for net settlement of all outstanding contracts with a counterparty in the case of an event of default or a termination event.
Collateral is generally not required of the counterparties or of our company under the master netting agreements. As of September 30, 2021 and December 31, 2020, no cash collateral was received or pledged under the master netting agreements.
18
The effect of the net settlement provisions of the master netting agreements on our derivative balances upon an event of default or termination event was as follows:
| September 30, 2021 | Gross Amounts Not Offset in the Statement of Financial Position | |||||||||||||||||||||||||||||||||||||
| (Millions of dollars) | Gross Amount of Recognized Assets | Gross Amounts Offset in the Statement of Financial Position | Net Amount of Assets Presented in the Statement of Financial Position | Financial Instruments | Cash Collateral Received | Net Amount of Assets | ||||||||||||||||||||||||||||||||
| Derivatives | ||||||||||||||||||||||||||||||||||||||
|
Machinery, Energy & Transportation
|
$ |
|
$ |
|
$ |
|
$ |
(
|
$ |
|
$ |
|
||||||||||||||||||||||||||
| Financial Products |
|
|
|
(
|
|
|
||||||||||||||||||||||||||||||||
| Total | $ |
|
$ |
|
$ |
|
$ |
(
|
$ |
|
$ |
|
||||||||||||||||||||||||||
| September 30, 2021 | Gross Amounts Not Offset in the Statement of Financial Position | |||||||||||||||||||||||||||||||||||||
| (Millions of dollars) | Gross Amount of Recognized Liabilities | Gross Amounts Offset in the Statement of Financial Position | Net Amount of Liabilities Presented in the Statement of Financial Position | Financial Instruments | Cash Collateral Pledged | Net Amount of Liabilities | ||||||||||||||||||||||||||||||||
| Derivatives | ||||||||||||||||||||||||||||||||||||||
|
Machinery, Energy & Transportation
|
$ |
(
|
$ |
|
$ |
(
|
$ |
|
$ |
|
$ |
(
|
||||||||||||||||||||||||||
| Financial Products |
(
|
|
(
|
|
|
(
|
||||||||||||||||||||||||||||||||
| Total | $ |
(
|
$ |
|
$ |
(
|
$ |
|
$ |
|
$ |
(
|
||||||||||||||||||||||||||
| December 31, 2020 | Gross Amounts Not Offset in the Statement of Financial Position | |||||||||||||||||||||||||||||||||||||
| (Millions of dollars) | Gross Amount of Recognized Assets | Gross Amounts Offset in the Statement of Financial Position | Net Amount of Assets Presented in the Statement of Financial Position | Financial Instruments | Cash Collateral Received | Net Amount of Assets | ||||||||||||||||||||||||||||||||
| Derivatives | ||||||||||||||||||||||||||||||||||||||
|
Machinery, Energy & Transportation
|
$ |
|
$ |
|
$ |
|
$ |
(
|
$ |
|
$ |
|
||||||||||||||||||||||||||
| Financial Products |
|
|
|
(
|
|
|
||||||||||||||||||||||||||||||||
| Total | $ |
|
$ |
|
$ |
|
$ |
(
|
$ |
|
$ |
|
||||||||||||||||||||||||||
| December 31, 2020 | Gross Amounts Not Offset in the Statement of Financial Position | |||||||||||||||||||||||||||||||||||||
| (Millions of dollars) | Gross Amount of Recognized Liabilities | Gross Amounts Offset in the Statement of Financial Position | Net Amount of Liabilities Presented in the Statement of Financial Position | Financial Instruments | Cash Collateral Pledged | Net Amount of Liabilities | ||||||||||||||||||||||||||||||||
| Derivatives | ||||||||||||||||||||||||||||||||||||||
|
Machinery, Energy & Transportation
|
$ |
(
|
$ |
|
$ |
(
|
$ |
|
$ |
|
$ |
|
||||||||||||||||||||||||||
| Financial Products |
(
|
|
(
|
|
|
(
|
||||||||||||||||||||||||||||||||
| Total | $ |
(
|
$ |
|
$ |
(
|
$ |
|
$ |
|
$ |
(
|
||||||||||||||||||||||||||
19
6.
Inventories
Inventories (principally using the last-in, first-out (LIFO) method) were comprised of the following:
| (Millions of dollars) |
September 30,
2021 |
December 31,
2020 |
|||||||||
| Raw materials | $ |
|
$ |
|
|||||||
| Work-in-process |
|
|
|||||||||
| Finished goods |
|
|
|||||||||
| Supplies |
|
|
|||||||||
| Total inventories | $ |
|
$ |
|
|||||||
7.
Intangible assets and goodwill
A. Intangible assets
Intangible assets were comprised of the following:
| September 30, 2021 | |||||||||||||||||||||||
| (Millions of dollars) |
Weighted
Amortizable Life (Years) |
Gross
Carrying Amount |
Accumulated
Amortization |
Net | |||||||||||||||||||
| Customer relationships |
|
$ |
|
$ |
(
|
$ |
|
||||||||||||||||
| Intellectual property |
|
|
(
|
|
|||||||||||||||||||
| Other |
|
|
(
|
|
|||||||||||||||||||
| Total finite-lived intangible assets |
|
$ |
|
$ |
(
|
$ |
|
||||||||||||||||
| December 31, 2020 | |||||||||||||||||||||||
|
Weighted
Amortizable Life (Years) |
Gross
Carrying Amount |
Accumulated
Amortization |
Net | ||||||||||||||||||||
| Customer relationships |
|
$ |
|
$ |
(
|
$ |
|
||||||||||||||||
| Intellectual property |
|
|
(
|
|
|||||||||||||||||||
| Other |
|
|
(
|
|
|||||||||||||||||||
| Total finite-lived intangible assets |
|
$ |
|
$ |
(
|
$ |
|
||||||||||||||||
Amortization expense for the three and nine months ended September 30, 2021 was $
75
million and $
228
million, respectively. Amortization expense for the three and nine months ended September 30, 2020 was $
78
million and $
236
million, respectively.
Amortization expense related to intangible assets is expected to be:
| (Millions of dollars) | ||||||||||||||||||||||||||||||||
| Remaining Three Months of 2021 | 2022 | 2023 | 2024 | 2025 | Thereafter | |||||||||||||||||||||||||||
|
$
|
$
|
$
|
$
|
$
|
$
|
|||||||||||||||||||||||||||
B. Goodwill
20
The changes in carrying amount of goodwill by reportable segment for the nine months ended September 30, 2021 were as follows:
| (Millions of dollars) |
December 31,
2020 |
Acquisitions
1
|
Other Adjustments
2
|
September 30,
2021 |
||||||||||||||||||||||
| Construction Industries | ||||||||||||||||||||||||||
| Goodwill | $ |
|
$ |
|
$ |
(
|
$ |
|
||||||||||||||||||
| Impairments |
(
|
— | — |
(
|
||||||||||||||||||||||
| Net goodwill |
|
|
(
|
|
||||||||||||||||||||||
| Resource Industries | ||||||||||||||||||||||||||
| Goodwill |
|
|
(
|
|
||||||||||||||||||||||
| Impairments |
(
|
— | — |
(
|
||||||||||||||||||||||
| Net goodwill |
|
|
(
|
|
||||||||||||||||||||||
| Energy & Transportation | ||||||||||||||||||||||||||
| Goodwill |
|
|
(
|
|
||||||||||||||||||||||
|
All Other
3
|
||||||||||||||||||||||||||
| Goodwill |
|
— |
(
|
|
||||||||||||||||||||||
| Consolidated total | ||||||||||||||||||||||||||
| Goodwill |
|
|
(
|
|
||||||||||||||||||||||
| Impairments |
(
|
— | — |
(
|
||||||||||||||||||||||
| Net goodwill | $ |
|
$ |
|
$ |
(
|
$ |
|
||||||||||||||||||
1
See Note 21 for additional details.
2
Other adjustments are comprised primarily of foreign currency translation.
3
Includes All Other operating segment (See Note 16).
8.
Investments in debt and equity securities
We have investments in certain debt and equity securities, primarily at Insurance Services, which we record at fair value and primarily include in Other assets in the Consolidated Statement of Financial Position.
We classify debt securities primarily as available-for-sale. We include the unrealized gains and losses arising from the revaluation of available-for-sale debt securities, net of applicable deferred income taxes, in equity (AOCI in the Consolidated Statement of Financial Position). We include the unrealized gains and losses arising from the revaluation of the equity securities in Other income (expense) in the Consolidated Statement of Results of Operations. We generally determine realized gains and losses on sales of investments using the specific identification method for available-for-sale debt and equity securities and include them in Other income (expense) in the Consolidated Statement of Results of Operations.
21
|
Available-for-sale debt securities
|
September 30, 2021 | December 31, 2020 | |||||||||||||||||||||||||||||||||
| (Millions of dollars) |
Cost
Basis
|
Unrealized Pretax Net Gains
(Losses)
|
Fair
Value
|
Cost
Basis
|
Unrealized Pretax Net Gains
(Losses)
|
Fair
Value
|
|||||||||||||||||||||||||||||
| Government debt | |||||||||||||||||||||||||||||||||||
| U.S. treasury bonds | $ |
|
$ |
|
$ |
|
$ |
|
$ |
|
$ |
|
|||||||||||||||||||||||
| Other U.S. and non-U.S. government bonds |
|
|
|
|
|
|
|||||||||||||||||||||||||||||
| Corporate bonds | |||||||||||||||||||||||||||||||||||
| Corporate bonds |
|
|
|
|
|
|
|||||||||||||||||||||||||||||
| Asset-backed securities |
|
|
|
|
|
|
|||||||||||||||||||||||||||||
| Mortgage-backed debt securities | |||||||||||||||||||||||||||||||||||
| U.S. governmental agency |
|
|
|
|
|
|
|||||||||||||||||||||||||||||
| Residential |
|
|
|
|
|
|
|||||||||||||||||||||||||||||
| Commercial |
|
|
|
|
|
|
|||||||||||||||||||||||||||||
| Total available-for-sale debt securities | $ |
|
$ |
|
$ |
|
$ |
|
$ |
|
$ |
|
|||||||||||||||||||||||
| Available-for-sale debt securities in an unrealized loss position: | |||||||||||||||||||||||||||||||||||
| September 30, 2021 | |||||||||||||||||||||||||||||||||||
|
Less than 12 months
1
|
12 months or more
1
|
Total | |||||||||||||||||||||||||||||||||
| (Millions of dollars) |
Fair
Value
|
Unrealized
Losses |
Fair
Value
|
Unrealized
Losses |
Fair
Value
|
Unrealized
Losses |
|||||||||||||||||||||||||||||
| Corporate bonds | |||||||||||||||||||||||||||||||||||
| Corporate bonds | $ |
|
$ |
|
$ |
|
$ |
|
$ |
|
$ |
|
|||||||||||||||||||||||
| Total | $ |
|
$ |
|
$ |
|
$ |
|
$ |
|
$ |
|
|||||||||||||||||||||||
| December 31, 2020 | |||||||||||||||||||||||||||||||||||
|
Less than 12 months
1
|
12 months or more
1
|
Total | |||||||||||||||||||||||||||||||||
| (Millions of dollars) |
Fair
Value
|
Unrealized
Losses |
Fair
Value
|
Unrealized
Losses |
Fair
Value
|
Unrealized
Losses |
|||||||||||||||||||||||||||||
| Corporate bonds | |||||||||||||||||||||||||||||||||||
| Corporate bonds | $ |
|
$ |
|
$ |
|
$ |
|
$ |
|
$ |
|
|||||||||||||||||||||||
| Total | $ |
|
$ |
|
$ |
|
$ |
|
$ |
|
$ |
|
|||||||||||||||||||||||
|
1
Indicates the length of time that individual securities have been in a continuous unrealized loss position.
|
|||||||||||||||||||||||||||||||||||
Corporate Bonds
The unrealized losses on our investments in corporate bonds relate to changes in interest rates and credit-related yield spreads since time of purchase. We do not intend to sell the investments, and it is not likely that we will be required to sell the investments before recovery of their amortized cost basis. In addition, we did not expect credit-related losses on these investments as of September 30, 2021.
22
The cost basis and fair value of available-for-sale debt securities at September 30, 2021, by contractual maturity, are shown below. Expected maturities will differ from contractual maturities because borrowers may have the right to prepay and creditors may have the right to call obligations.
| September 30, 2021 | |||||||||||
| (Millions of dollars) | Cost Basis | Fair Value | |||||||||
| Due in one year or less | $ |
|
$ |
|
|||||||
| Due after one year through five years |
|
|
|||||||||
| Due after five years through ten years |
|
|
|||||||||
| Due after ten years |
|
|
|||||||||
| U.S. governmental agency mortgage-backed securities |
|
|
|||||||||
| Residential mortgage-backed securities |
|
|
|||||||||
| Commercial mortgage-backed securities |
|
|
|||||||||
| Total debt securities – available-for-sale | $ |
|
$ |
|
|||||||
| Sales of available-for-sale debt securities: | |||||||||||||||||||||||
| Three Months Ended September 30 | Nine Months Ended September 30 | ||||||||||||||||||||||
| (Millions of dollars) | 2021 | 2020 | 2021 | 2020 | |||||||||||||||||||
| Proceeds from the sale of available-for-sale securities | $ |
|
$ |
|
$ |
|
$ |
|
|||||||||||||||
| Gross gains from the sale of available-for-sale securities |
|
|
|
|
|||||||||||||||||||
| Gross losses from the sale of available-for-sale securities |
|
|
|
|
|||||||||||||||||||
In addition, we had $
543
million of investments in time deposits classified as held-to-maturity debt securities as of September 30, 2021. All these investments mature within one year and we include them in Prepaid expenses and other current assets in the Consolidated Statement of Financial Position. We did
not
have any investments classified as held-to-maturity debt securities as of December 31, 2020. We record held-to-maturity debt securities at amortized cost, which approximates fair value. We did
not
have any unrealized gains or losses on these securities as of September 30, 2021 and December 31, 2020.
For the three months ended September 30, 2021 and 2020, the net unrealized gains (losses) for equity securities held at September 30, 2021 and 2020 were $
46
million and $
9
million, respectively. For the nine months ended September 30, 2021 and 2020, the net unrealized gains (losses) for equity securities held at September 30, 2021 and 2020 were $
65
million and $(
1
) million, respectively.
23
9.
Postretirement benefits
A. Pension and postretirement benefit costs
|
U.S. Pension
Benefits
|
Non-U.S. Pension
Benefits
|
Other
Postretirement
Benefits
|
|||||||||||||||||||||||||||||||||
|
(Millions of dollars)
|
September 30 | September 30 | September 30 | ||||||||||||||||||||||||||||||||
| 2021 | 2020 | 2021 | 2020 | 2021 | 2020 | ||||||||||||||||||||||||||||||
| For the three months ended: | |||||||||||||||||||||||||||||||||||
| Components of net periodic benefit cost: | |||||||||||||||||||||||||||||||||||
| Service cost | $ |
|
$ |
|
$ |
|
$ |
|
$ |
|
$ |
|
|||||||||||||||||||||||
| Interest cost |
|
|
|
|
|
|
|||||||||||||||||||||||||||||
| Expected return on plan assets |
(
|
(
|
(
|
(
|
(
|
(
|
|||||||||||||||||||||||||||||
| Amortization of prior service cost (credit) |
|
|
|
|
(
|
(
|
|||||||||||||||||||||||||||||
|
(Gain) loss on remeasurement of pension obligations
1
|
|
(
|
|
|
|
|
|||||||||||||||||||||||||||||
|
Curtailments, settlements and termination benefits
1
|
|
|
|
|
|
|
|||||||||||||||||||||||||||||
|
Net periodic benefit cost (benefit)
2
|
$ |
(
|
$ |
(
|
$ |
(
|
$ |
|
$ |
|
$ |
|
|||||||||||||||||||||||
| For the nine months ended: | |||||||||||||||||||||||||||||||||||
| Components of net periodic benefit cost: | |||||||||||||||||||||||||||||||||||
| Service cost | $ |
|
$ |
|
$ |
|
$ |
|
$ |
|
$ |
|
|||||||||||||||||||||||
| Interest cost |
|
|
|
|
|
|
|||||||||||||||||||||||||||||
| Expected return on plan assets |
(
|
(
|
(
|
(
|
(
|
(
|
|||||||||||||||||||||||||||||
| Amortization of prior service cost (credit) |
|
|
|
|
(
|
(
|
|||||||||||||||||||||||||||||
|
(Gain) loss on remeasurement of pension obligations
1
|
|
|
|
(
|
|
|
|||||||||||||||||||||||||||||
|
Curtailments, settlements and termination benefits
1
|
|
|
|
|
|
|
|||||||||||||||||||||||||||||
|
Net periodic benefit cost (benefit)
2
|
$ |
(
|
$ |
(
|
$ |
(
|
$ |
(
|
$ |
|
$ |
|
|||||||||||||||||||||||
1
Total lump-sum transfers out of certain pension plans exceeded the service and interest cost for 2020, which required us to follow settlement accounting and remeasure the plans' obligations as of March 31, 2020, June 30, 2020 and September 30, 2020.
2
The service cost component is included in Operating costs in the Consolidated Statement of Results of Operations. All other components are included in Other income (expense) in the Consolidated Statement of Results of Operations.
We made $
69
million and $
229
million of contributions to our pension and other postretirement plans during the three and nine months ended September 30, 2021, respectively. We currently anticipate full-year 2021 contributions of approximately $
310
million.
B. Defined contribution benefit costs
Total company costs related to our defined contribution plans, which are included in Operating Costs in the Consolidated Statement of Results of Operations, were as follows:
| Three Months Ended September 30 | Nine Months Ended September 30 | ||||||||||||||||||||||
| (Millions of dollars) | 2021 | 2020 | 2021 | 2020 | |||||||||||||||||||
| U.S. Plans | $ |
|
$ |
|
$ |
|
$ |
|
|||||||||||||||
| Non-U.S. Plans |
|
|
|
|
|||||||||||||||||||
| $ |
|
$ |
|
$ |
|
$ |
|
||||||||||||||||
The increase in the U.S. defined contribution benefit costs for the nine months ended September 30, 2021 was primarily due to the fair value adjustments related to our non-qualified deferred compensation plans.
24
10.
Leases
Revenues from finance and operating leases, primarily included in Revenues of Financial Products on the Consolidated Statement of Results of Operations, were as follows:
| (Millions of dollars) | ||||||||||||||||||||||||||
| Three Months Ended September 30 | Nine Months Ended September 30 | |||||||||||||||||||||||||
| 2021 | 2020 | 2021 | 2020 | |||||||||||||||||||||||
| Finance lease revenue | $ |
|
$ |
|
$ |
|
$ |
|
||||||||||||||||||
| Operating lease revenue |
|
|
|
|
||||||||||||||||||||||
| Total | $ |
|
$ |
|
$ |
|
$ |
|
||||||||||||||||||
11.
Guarantees and product warranty
Caterpillar dealer performance guarantees
We have provided an indemnity to a third-party insurance company for potential losses related to performance bonds issued on behalf of Caterpillar dealers. The bonds have varying terms and are issued to insure governmental agencies against nonperformance by certain dealers. We also provided guarantees to third-parties related to the performance of contractual obligations by certain Caterpillar dealers. These guarantees have varying terms and cover potential financial losses incurred by the third parties resulting from the dealers’ nonperformance.
In 2016, we provided a guarantee to an end user related to the performance of contractual obligations by a Caterpillar dealer. Under the guarantee, which expires in 2025, non-performance by the Caterpillar dealer could require Caterpillar to satisfy the contractual obligations by providing goods, services or financial compensation to the end user up to an annual designated cap.
Supplier consortium performance guarantee
We have provided a guarantee to a customer in Europe related to the performance of contractual obligations by a supplier consortium to which one of our Caterpillar subsidiaries is a member. The guarantee covers potential damages incurred by the customer resulting from the supplier consortium's non-performance. The damages are capped except for failure of the consortium to meet certain obligations outlined in the contract in the normal course of business. The guarantee will expire when the supplier consortium performs all of its contractual obligations, which is expected to be completed in 2022.
We have dealer performance guarantees and third-party performance guarantees that do not limit potential payment to end users related to indemnities and other commercial contractual obligations. In addition, we have entered into contracts involving industry standard indemnifications that do not limit potential payment. For these unlimited guarantees, we are unable to estimate a maximum potential amount of future payments that could result from claims made.
No significant loss has been experienced or is anticipated under any of these guarantees. At both September 30, 2021 and December 31, 2020, the related recorded liability was $
5
million.
The maximum potential amount of future payments (undiscounted and without reduction for any amounts that may possibly be recovered under recourse or collateralized provisions) we could be required to make under the guarantees was as follows:
| (Millions of dollars) |
September 30,
2021 |
December 31,
2020 |
|||||||||
| Caterpillar dealer performance guarantees | $ |
|
$ |
|
|||||||
| Supplier consortium performance guarantee |
|
|
|||||||||
| Other guarantees |
|
|
|||||||||
| Total guarantees | $ |
|
$ |
|
|||||||
25
Cat Financial provides guarantees to purchase certain loans of Caterpillar dealers from a special-purpose corporation (SPC) that qualifies as a variable interest entity. The purpose of the SPC is to provide short-term working capital loans to Caterpillar dealers. This SPC issues commercial paper and uses the proceeds to fund its loan program. Cat Financial receives a fee for providing this guarantee. Cat Financial is the primary beneficiary of the SPC as its guarantees result in Cat Financial having both the power to direct the activities that most significantly impact the SPC’s economic performance and the obligation to absorb losses, and therefore Cat Financial has consolidated the financial statements of the SPC. As of September 30, 2021 and December 31, 2020, the SPC’s assets of $
899
million and $
1,026
million, respectively, were primarily comprised of loans to dealers, and the SPC’s liabilities of $
899
million and $
1,025
million, respectively, were primarily comprised of commercial paper. The assets of the SPC are not available to pay Cat Financial’s creditors. Cat Financial may be obligated to perform under the guarantee if the SPC experiences losses. No loss has been experienced or is anticipated under this loan purchase agreement.
We determine our product warranty liability by applying historical claim rate experience to the current field population and dealer inventory. Generally, we base historical claim rates on actual warranty experience for each product by machine model/engine size by customer or dealer location (inside or outside North America).
We develop specific rates for each product shipment month and update them monthly based on actual warranty claim experience.
|
First Nine Months
|
|||||||||||
| (Millions of dollars) | 2021 | 2020 | |||||||||
| Warranty liability, beginning of period | $ |
|
$ |
|
|||||||
| Reduction in liability (payments) |
(
|
(
|
|||||||||
| Increase in liability (new warranties) |
|
|
|||||||||
| Warranty liability, end of period | $ |
|
$ |
|
|||||||
12.
Profit per share
| Computations of profit per share: | Three Months Ended September 30 | Nine Months Ended September 30 | |||||||||||||||||||||||||||
| (Dollars in millions except per share data) | 2021 | 2020 | 2021 | 2020 | |||||||||||||||||||||||||
|
Profit for the period (A)
1
|
$ |
|
$ |
|
$ |
|
$ |
|
|||||||||||||||||||||
| Determination of shares (in millions): | |||||||||||||||||||||||||||||
| Weighted-average number of common shares outstanding (B) |
|
|
|
|
|||||||||||||||||||||||||
| Shares issuable on exercise of stock awards, net of shares assumed to be purchased out of proceeds at average market price |
|
|
|
|
|||||||||||||||||||||||||
|
Average common shares outstanding for fully diluted computation (C)
2
|
|
|
|
|
|||||||||||||||||||||||||
| Profit per share of common stock: | |||||||||||||||||||||||||||||
| Assuming no dilution (A/B) | $ |
|
$ |
|
$ |
|
$ |
|
|||||||||||||||||||||
|
Assuming full dilution (A/C)
2
|
$ |
|
$ |
|
$ |
|
$ |
|
|||||||||||||||||||||
| Shares outstanding as of September 30 (in millions) |
|
|
|||||||||||||||||||||||||||
|
1
Profit attributable to common shareholders.
|
|||||||||||||||||||||||||||||
|
2
Diluted by assumed exercise of stock-based compensation awards using the treasury stock method.
|
|||||||||||||||||||||||||||||
For the three and nine months ended September 30, 2021 and 2020, we excluded
1.1
million and
4.8
million of outstanding stock options, respectively, from the computation of diluted earnings per share because the effect would have been antidilutive.
In July 2018, the Board approved a share repurchase authorization (the 2018 Authorization) of up to $
10.0
billion of Caterpillar common stock effective January 1, 2019, with no expiration. As of September 30, 2021, approximately $
3.1
billion remained available under the 2018 Authorization.
26
13.
Accumulated other comprehensive income (loss)
27
| Three Months Ended September 30 | Nine Months Ended September 30 | ||||||||||||||||||||||
| (Millions of dollars) | 2021 | 2020 | 2021 | 2020 | |||||||||||||||||||
| Foreign currency translation: | |||||||||||||||||||||||
| Beginning balance | $ |
(
|
$ |
(
|
$ |
(
|
$ |
(
|
|||||||||||||||
| Gains (losses) on foreign currency translation |
(
|
|
(
|
|
|||||||||||||||||||
| Less: Tax provision /(benefit) |
|
(
|
|
(
|
|||||||||||||||||||
| Net gains (losses) on foreign currency translation |
(
|
|
(
|
|
|||||||||||||||||||
| (Gains) losses reclassified to earnings |
|
|
|
|
|||||||||||||||||||
| Less: Tax provision /(benefit) |
|
|
|
|
|||||||||||||||||||
| Net (gains) losses reclassified to earnings |
|
|
|
|
|||||||||||||||||||
| Other comprehensive income (loss), net of tax |
(
|
|
(
|
|
|||||||||||||||||||
| Ending balance | $ |
(
|
$ |
(
|
$ |
(
|
$ |
(
|
|||||||||||||||
| Pension and other postretirement benefits | |||||||||||||||||||||||
| Beginning balance | $ |
(
|
$ |
(
|
$ |
(
|
$ |
(
|
|||||||||||||||
| Current year prior service credit (cost) |
|
(
|
|
|
|||||||||||||||||||
| Less: Tax provision /(benefit) |
|
(
|
|
(
|
|||||||||||||||||||
| Net current year prior service credit (cost) |
|
(
|
|
|
|||||||||||||||||||
| Amortization of prior service (credit) cost |
(
|
(
|
(
|
(
|
|||||||||||||||||||
| Less: Tax provision /(benefit) |
(
|
(
|
(
|
(
|
|||||||||||||||||||
| Net amortization of prior service (credit) cost |
(
|
(
|
(
|
(
|
|||||||||||||||||||
| Other comprehensive income (loss), net of tax |
(
|
(
|
(
|
(
|
|||||||||||||||||||
| Ending balance | $ |
(
|
$ |
(
|
$ |
(
|
$ |
(
|
|||||||||||||||
| Derivative financial instruments | |||||||||||||||||||||||
| Beginning balance | $ |
|
$ |
(
|
$ |
|
$ |
(
|
|||||||||||||||
| Gains (losses) deferred |
|
|
|
(
|
|||||||||||||||||||
| Less: Tax provision /(benefit) |
|
|
|
(
|
|||||||||||||||||||
| Net gains (losses) deferred |
|
|
|
(
|
|||||||||||||||||||
| (Gains) losses reclassified to earnings |
(
|
|
(
|
|
|||||||||||||||||||
| Less: Tax provision /(benefit) |
(
|
|
(
|
|
|||||||||||||||||||
| Net (gains) losses reclassified to earnings |
(
|
|
(
|
|
|||||||||||||||||||
| Other comprehensive income (loss), net of tax |
(
|
|
(
|
|
|||||||||||||||||||
| Ending balance | $ |
(
|
$ |
(
|
$ |
(
|
$ |
(
|
|||||||||||||||
| Available-for-sale securities | |||||||||||||||||||||||
| Beginning balance | $ |
|
$ |
|
$ |
|
$ |
|
|||||||||||||||
| Gains (losses) deferred |
(
|
|
(
|
|
|||||||||||||||||||
| Less: Tax provision /(benefit) |
|
|
(
|
|
|||||||||||||||||||
| Net gains (losses) deferred |
(
|
|
(
|
|
|||||||||||||||||||
| (Gains) losses reclassified to earnings |
(
|
|
(
|
|
|||||||||||||||||||
| Less: Tax provision /(benefit) |
|
|
(
|
|
|||||||||||||||||||
| Net (gains) losses reclassified to earnings |
(
|
|
(
|
|
|||||||||||||||||||
| Other comprehensive income (loss), net of tax |
(
|
|
(
|
|
|||||||||||||||||||
| Ending balance | $ |
|
$ |
|
$ |
|
$ |
|
|||||||||||||||
|
Total AOCI Ending Balance at September 30
|
$ |
(
|
$ |
(
|
$ |
(
|
$ |
(
|
|||||||||||||||
28
14.
Environmental and legal matters
The Company is regulated by federal, state and international environmental laws governing its use, transport and disposal of substances and control of emissions. In addition to governing our manufacturing and other operations, these laws often impact the development of our products, including, but not limited to, required compliance with air emissions standards applicable to internal combustion engines. We have made, and will continue to make, significant research and development and capital expenditures to comply with these emissions standards.
We are engaged in remedial activities at a number of locations, often with other companies, pursuant to federal and state laws. When it is probable we will pay remedial costs at a site, and those costs can be reasonably estimated, we accrue the investigation, remediation, and operating and maintenance costs against our earnings. We accrue costs based on consideration of currently available data and information with respect to each individual site, including available technologies, current applicable laws and regulations, and prior remediation experience. Where no amount within a range of estimates is more likely, we accrue the minimum. Where multiple potentially responsible parties are involved, we consider our proportionate share of the probable costs. In formulating the estimate of probable costs, we do not consider amounts expected to be recovered from insurance companies or others. We reassess these accrued amounts on a quarterly basis. The amount recorded for environmental remediation is not material and is included in Accrued expenses in the Consolidated Statement of Financial Position. We believe there is no more than a remote chance that a material amount for remedial activities at any individual site, or at all the sites in the aggregate, will be required.
On January 7, 2015, the Company received a grand jury subpoena from the U.S. District Court for the Central District of Illinois. The subpoena requested documents and information from the Company relating to, among other things, financial information concerning U.S. and non-U.S. Caterpillar subsidiaries (including undistributed profits of non-U.S. subsidiaries and the movement of cash among U.S. and non-U.S. subsidiaries). The Company has received additional subpoenas relating to this investigation requesting additional documents and information relating to, among other things, the purchase and resale of replacement parts by Caterpillar Inc. and non-U.S. Caterpillar subsidiaries, dividend distributions of certain non-U.S. Caterpillar subsidiaries, and Caterpillar SARL (CSARL) and related structures. On March 2-3, 2017, agents with the Department of Commerce, the Federal Deposit Insurance Corporation and the Internal Revenue Service executed search and seizure warrants at
three
facilities of the Company in the Peoria, Illinois area, including its former corporate headquarters. The warrants identify, and agents seized, documents and information related to, among other things, the export of products from the United States, the movement of products between the United States and Switzerland, the relationship between Caterpillar Inc. and CSARL, and sales outside the United States. It is the Company’s understanding that the warrants, which concern both tax and export activities, are related to the ongoing grand jury investigation. The Company is continuing to cooperate with this investigation. The Company is unable to predict the outcome or reasonably estimate any potential loss; however, we currently believe that this matter will not have a material adverse effect on the Company’s consolidated results of operations, financial position or liquidity.
In addition, we are involved in other unresolved legal actions that arise in the normal course of business. The most prevalent of these unresolved actions involve disputes related to product design, manufacture and performance liability (including claimed asbestos exposure), contracts, employment issues, environmental matters, intellectual property rights, taxes (other than income taxes) and securities laws. The aggregate range of reasonably possible losses in excess of accrued liabilities, if any, associated with these unresolved legal actions is not material. In some cases, we cannot reasonably estimate a range of loss because there is insufficient information regarding the matter. However, we believe there is no more than a remote chance that any liability arising from these matters would be material. Although it is not possible to predict with certainty the outcome of these unresolved legal actions, we believe that these actions will not individually or in the aggregate have a material adverse effect on our consolidated results of operations, financial position or liquidity.
15.
Income taxes
The provision for income taxes for the nine months ended September 30, 2021 reflected an estimated annual tax rate of
25
percent, compared with
31
percent for the nine months ended September 30, 2020, excluding the discrete items discussed in the following paragraph. The comparative tax rate for full-year 2020 was approximately
28
percent. The decrease in the estimated annual tax rate from full-year 2020 was primarily related to changes in the expected geographic mix of profits from a tax perspective for 2021.
29
In addition, we recorded a discrete tax benefit of $
61
million for the nine months ended September 30, 2021, compared with $
21
million for the nine months ended September 30, 2020, for the settlement of stock-based compensation awards with associated tax deductions in excess of cumulative U.S. GAAP compensation expense. The company also recorded a discrete tax benefit of $
36
million to reflect changes in estimates related to prior year U.S. taxes for the nine months ended September 30, 2021 compared to $
80
million for the nine months ended September 30, 2020. Finally, we recorded a $
10
million tax charge related to the $
55
million of remeasurement net gain resulting from the settlements of pension obligations for the nine months ended September 30, 2020.
On January 31, 2018, we received a Revenue Agent’s Report from the Internal Revenue Service (IRS) indicating the end of the field examination of our U.S. income tax returns for 2010 to 2012. In the audits of 2007 to 2012 including the impact of a loss carryback to 2005, the IRS has proposed to tax in the United States profits earned from certain parts transactions by Caterpillar SARL (CSARL), based on the IRS examination team’s application of the “substance-over-form” or “assignment-of-income” judicial doctrines. We are vigorously contesting the proposed increases to tax and penalties for these years of approximately $
2.3
billion. We believe that the relevant transactions complied with applicable tax laws and did not violate judicial doctrines. We have filed U.S. income tax returns on this same basis for years after 2012. Based on the information currently available, we do not anticipate a significant change to our unrecognized tax benefits for this position within the next 12 months. We currently believe the ultimate disposition of this matter will not have a material adverse effect on our consolidated financial position, liquidity or results of operations.
16.
Segment information
A. Basis for segment information
Our Executive Office is comprised of a Chief Executive Officer (CEO),
four
Group Presidents, a Chief Financial Officer (CFO), a Chief Legal Officer and General Counsel and a Chief Human Resources Officer. The Group Presidents and CFO are accountable for a related set of end-to-end businesses that they manage. The Chief Legal Officer and General Counsel leads the Law, Security and Public Policy Division. The Chief Human Resources Officer leads the Human Resources Organization. The CEO allocates resources and manages performance at the Group President/CFO level. As such, the CEO serves as our Chief Operating Decision Maker, and operating segments are primarily based on the Group President/CFO reporting structure.
B. Description of segments
We have
five
operating segments, of which
four
are reportable segments. Following is a brief description of our reportable segments and the business activities included in the All Other operating segment:
Construction Industries
: A segment primarily responsible for supporting customers using machinery in infrastructure and building construction applications. Responsibilities include business strategy, product design, product management and development, manufacturing, marketing and sales and product support. The product portfolio includes asphalt pavers; backhoe loaders; compactors; cold planers; compact track and multi-terrain loaders; mini, small, medium and large track excavators; motor graders; pipelayers; road reclaimers; skid steer loaders; telehandlers; small and medium track-type tractors; track-type loaders; utility vehicles; wheel excavators; compact, small and medium wheel loaders; and related parts and work tools. Inter-segment sales are a source of revenue for this segment.
30
Resource Industries
:
A segment primarily responsible for supporting customers using machinery in mining, heavy construction and quarry and aggregates. Responsibilities include business strategy, product design, product management and development, manufacturing, marketing and sales and product support. The product portfolio includes large track-type tractors; large mining trucks; hard rock vehicles; longwall miners; electric rope shovels; draglines; hydraulic shovels; rotary drills; large wheel loaders; off-highway trucks; articulated trucks; wheel tractor scrapers; wheel dozers; landfill compactors; soil compactors; select work tools; machinery components; electronics and control systems and related parts. In addition to equipment, Resource Industries also develops and sells technology products and services to provide customers fleet management, equipment management analytics, autonomous machine capabilities, safety services and mining performance solutions. Resource Industries also manages areas that provide services to other parts of the company, including integrated manufacturing, research and development for drivetrains, hydraulic systems, electronics and software for Cat machines and engines. Inter-segment sales are a source of revenue for this segment.
Energy & Transportation
: A segment primarily responsible for supporting customers using reciprocating engines, turbines, diesel-electric locomotives and related services across industries serving Oil and Gas, Power Generation, Industrial and Transportation applications, including marine- and rail-related businesses. Responsibilities include business strategy, product design, product management and development, manufacturing, marketing and sales and product support. The product and services portfolio includes turbines, centrifugal gas compressors, and turbine-related services; reciprocating engine-powered generator sets; integrated systems used in the electric power generation industry; reciprocating engines and integrated systems and solutions for the marine and oil and gas industries; reciprocating engines supplied to the industrial industry as well as Cat machinery; and diesel-electric locomotives and components and other rail-related products and services, including remanufacturing and leasing. Responsibilities also include the remanufacturing of Caterpillar reciprocating engines and components and remanufacturing services for other companies; and product support of on-highway vocational trucks for North America. Inter-segment sales are a source of revenue for this segment.
Financial Products Segment
: Provides financing alternatives to customers and dealers around the world for Caterpillar products, as well as financing for vehicles, power generation facilities and marine vessels that, in most cases, incorporate Caterpillar products. Financing plans include operating and finance leases, installment sale contracts, repair/rebuild financing, working capital loans and wholesale financing plans. The segment also provides insurance and risk management products and services that help customers and dealers manage their business risk. Insurance and risk management products offered include physical damage insurance, inventory protection plans, extended service coverage and maintenance plans for machines and engines, and dealer property and casualty insurance. The various forms of financing, insurance and risk management products offered to customers and dealers help support the purchase and lease of Caterpillar equipment. The segment also earns revenues from ME&T, but the related costs are not allocated to operating segments. Financial Products’ segment profit is determined on a pretax basis and includes other income/expense items.
All Other operating segment
:
Primarily includes activities such as: business strategy; product management and development; manufacturing and sourcing of filters and fluids, undercarriage, ground-engaging tools, fluid transfer products, precision seals, rubber sealing and connecting components primarily for Cat® products; parts distribution; integrated logistics solutions; distribution services responsible for dealer development and administration, including a wholly owned dealer in Japan; dealer portfolio management and ensuring the most efficient and effective distribution of machines, engines and parts; brand management and marketing strategy; and digital investments for new customer and dealer solutions that integrate data analytics with state-of-the-art digital technologies while transforming the buying experience. Results for the All Other operating segment are included as a reconciling item between reportable segments and consolidated external reporting.
C. Segment measurement and reconciliations
There are several methodology differences between our segment reporting and our external reporting. The following is a list of the more significant methodology differences:
•
ME&T segment net assets generally include inventories, receivables, property, plant and equipment, goodwill, intangibles, accounts payable and customer advances. We generally manage at the corporate level liabilities other than accounts payable and customer advances, and we do not include these in segment operations. Financial Products Segment assets generally include all categories of assets.
•
We value segment inventories and cost of sales using a current cost methodology.
31
•
We amortize goodwill allocated to segments using a fixed amount based on a
20
-year useful life. This methodology difference only impacts segment assets. We do not include goodwill amortization expense in segment profit. In addition, we have allocated to segments only a portion of goodwill for certain acquisitions made in 2011 or later.
•
We generally manage currency exposures for ME&T at the corporate level and do not include in segment profit the effects of changes in exchange rates on results of operations within the year. We report the net difference created in the translation of revenues and costs between exchange rates used for U.S. GAAP reporting and exchange rates used for segment reporting as a methodology difference.
•
We do not include stock-based compensation expense in segment profit.
•
Postretirement benefit expenses are split; segments are generally responsible for service costs, with the remaining elements of net periodic benefit cost included as a methodology difference.
•
We determine ME&T segment profit on a pretax basis and exclude interest expense and most other income/expense items. We determine Financial Products Segment profit on a pretax basis and include other income/expense items.
Reconciling items are created based on accounting differences between segment reporting and our consolidated external reporting. Please refer to pages 33 to 36 for financial information regarding significant reconciling items. Most of our reconciling items are self-explanatory given the above explanations. For the reconciliation of profit, we have grouped the reconciling items as follows:
•
Corporate costs:
These costs are related to corporate requirements primarily for compliance and legal functions for the benefit of the entire organization.
•
Restructuring costs:
May include costs for employee separation, long-lived asset impairments and contract terminations. These costs are included in Other operating (income) expenses except for defined-benefit plan curtailment losses and special termination benefits, which are included in Other income (expense). Restructuring costs also include other exit-related costs, which may consist of accelerated depreciation, inventory write-downs, building demolition, equipment relocation and project management costs and LIFO inventory decrement benefits from inventory liquidations at closed facilities, all of which are primarily included in Cost of goods sold. Only certain restructuring costs in 2020 are excluded from segment profit. See Note 20 for more information.
•
Methodology differences:
See previous discussion of significant accounting differences between segment reporting and consolidated external reporting.
•
Timing:
Timing differences in the recognition of costs between segment reporting and consolidated external reporting. For example, we report certain costs on the cash basis for segment reporting and the accrual basis for consolidated external reporting.
32
| Sales and Revenues by Geographic Region | ||||||||||||||||||||||||||||||||||||||||||||
| (Millions of dollars) |
North
America |
Latin
America |
EAME |
Asia/
Pacific |
External Sales and Revenues | Intersegment Sales and Revenues | Total Sales and Revenues | |||||||||||||||||||||||||||||||||||||
| Three Months Ended September 30, 2021 | ||||||||||||||||||||||||||||||||||||||||||||
| Construction Industries | $ |
|
$ |
|
$ |
|
$ |
|
$ |
|
$ |
(
|
$ |
|
||||||||||||||||||||||||||||||
| Resource Industries |
|
|
|
|
|
|
|
|||||||||||||||||||||||||||||||||||||
| Energy & Transportation |
|
|
|
|
|
|
|
|||||||||||||||||||||||||||||||||||||
| Financial Products Segment |
|
|
|
|
|
1
|
|
|
||||||||||||||||||||||||||||||||||||
| Total sales and revenues from reportable segments |
|
|
|
|
|
|
|
|||||||||||||||||||||||||||||||||||||
| All Other operating segment |
|
|
|
|
|
|
|
|||||||||||||||||||||||||||||||||||||
| Corporate Items and Eliminations |
(
|
(
|
(
|
(
|
(
|
(
|
(
|
|||||||||||||||||||||||||||||||||||||
| Total Sales and Revenues | $ |
|
$ |
|
$ |
|
$ |
|
$ |
|
$ | — | $ |
|
||||||||||||||||||||||||||||||
| Three Months Ended September 30, 2020 | ||||||||||||||||||||||||||||||||||||||||||||
| Construction Industries | $ |
|
$ |
|
$ |
|
$ |
|
$ |
|
$ |
|
$ |
|
||||||||||||||||||||||||||||||
| Resource Industries |
|
|
|
|
|
|
|
|||||||||||||||||||||||||||||||||||||
| Energy & Transportation |
|
|
|
|
|
|
|
|||||||||||||||||||||||||||||||||||||
| Financial Products Segment |
|
|
|
|
|
1
|
|
|
||||||||||||||||||||||||||||||||||||
| Total sales and revenues from reportable segments |
|
|
|
|
|
|
|
|||||||||||||||||||||||||||||||||||||
| All Other operating segment |
|
|
|
|
|
|
|
|||||||||||||||||||||||||||||||||||||
| Corporate Items and Eliminations |
(
|
(
|
(
|
(
|
(
|
(
|
(
|
|||||||||||||||||||||||||||||||||||||
| Total Sales and Revenues | $ |
|
$ |
|
$ |
|
$ |
|
$ |
|
$ | — | $ |
|
||||||||||||||||||||||||||||||
1
Includes revenues from Construction Industries, Resource Industries, Energy & Transportation and All Other operating segment of $
87
million and $
81
million in the three months ended September 30, 2021 and 2020, respectively.
| Sales and Revenues by Geographic Region | ||||||||||||||||||||||||||||||||||||||||||||
| (Millions of dollars) |
North
America |
Latin
America |
EAME |
Asia/
Pacific |
External Sales and Revenues | Intersegment Sales and Revenues | Total Sales and Revenues | |||||||||||||||||||||||||||||||||||||
| Nine Months Ended September 30, 2021 | ||||||||||||||||||||||||||||||||||||||||||||
| Construction Industries | $ |
|
$ |
|
$ |
|
$ |
|
$ |
|
$ |
|
$ |
|
||||||||||||||||||||||||||||||
| Resource Industries |
|
|
|
|
|
|
|
|||||||||||||||||||||||||||||||||||||
| Energy & Transportation |
|
|
|
|
|
|
|
|||||||||||||||||||||||||||||||||||||
| Financial Products Segment |
|
|
|
|
|
1
|
|
|
||||||||||||||||||||||||||||||||||||
| Total sales and revenues from reportable segments |
|
|
|
|
|
|
|
|||||||||||||||||||||||||||||||||||||
| All Other operating segment |
|
|
|
|
|
|
|
|||||||||||||||||||||||||||||||||||||
| Corporate Items and Eliminations |
(
|
(
|
(
|
(
|
(
|
(
|
(
|
|||||||||||||||||||||||||||||||||||||
| Total Sales and Revenues | $ |
|
$ |
|
$ |
|
$ |
|
$ |
|
$ | — | $ |
|
||||||||||||||||||||||||||||||
| Nine Months Ended September 30, 2020 | ||||||||||||||||||||||||||||||||||||||||||||
| Construction Industries | $ |
|
$ |
|
$ |
|
$ |
|
$ |
|
$ |
|
$ |
|
||||||||||||||||||||||||||||||
| Resource Industries |
|
|
|
|
|
|
|
|||||||||||||||||||||||||||||||||||||
| Energy & Transportation |
|
|
|
|
|
|
|
|||||||||||||||||||||||||||||||||||||
| Financial Products Segment |
|
|
|
|
|
1
|
|
|
||||||||||||||||||||||||||||||||||||
| Total sales and revenues from reportable segments |
|
|
|
|
|
|
|
|||||||||||||||||||||||||||||||||||||
| All Other operating segment |
|
|
|
|
|
|
|
|||||||||||||||||||||||||||||||||||||
| Corporate Items and Eliminations |
(
|
(
|
(
|
(
|
(
|
(
|
(
|
|||||||||||||||||||||||||||||||||||||
| Total Sales and Revenues | $ |
|
$ |
|
$ |
|
$ |
|
$ |
|
$ | — | $ |
|
||||||||||||||||||||||||||||||
1
Includes revenues from Construction Industries, Resource Industries, Energy & Transportation and All Other operating segment of $
263
million and $
274
million in the nine months ended September 30, 2021 and 2020, respectively.
33
For the three and nine months ended September 30, 2021 and 2020, Energy & Transportation segment sales by end user application were as follows:
| Energy & Transportation External Sales | ||||||||||||||||||||||||||
| Three Months Ended September 30 | Nine Months Ended September 30 | |||||||||||||||||||||||||
| (Millions of dollars) | 2021 | 2020 | 2021 | 2020 | ||||||||||||||||||||||
| Oil and gas | $ |
|
$ |
|
$ |
|
$ |
|
||||||||||||||||||
| Power generation |
|
|
|
|
||||||||||||||||||||||
| Industrial |
|
|
|
|
||||||||||||||||||||||
| Transportation |
|
|
|
|
||||||||||||||||||||||
| Energy & Transportation External Sales | $ |
|
$ |
|
$ |
|
$ |
|
||||||||||||||||||
| Reconciliation of Consolidated profit before taxes: | |||||||||||||||||||||||
| (Millions of dollars) | Three Months Ended September 30 | Nine Months Ended September 30 | |||||||||||||||||||||
| 2021 | 2020 | 2021 | 2020 | ||||||||||||||||||||
| Profit from reportable segments: | |||||||||||||||||||||||
| Construction Industries | $ |
|
$ |
|
$ |
|
$ |
|
|||||||||||||||
| Resource Industries |
|
|
|
|
|||||||||||||||||||
| Energy & Transportation |
|
|
|
|
|||||||||||||||||||
| Financial Products Segment |
|
|
|
|
|||||||||||||||||||
| Total profit from reportable segments |
|
|
|
|
|||||||||||||||||||
| Profit from All Other operating segment |
|
|
(
|
|
|||||||||||||||||||
| Cost centers |
|
|
|
|
|||||||||||||||||||
| Corporate costs |
(
|
(
|
(
|
(
|
|||||||||||||||||||
| Timing |
(
|
(
|
(
|
(
|
|||||||||||||||||||
| Restructuring costs |
(
|
(
|
(
|
(
|
|||||||||||||||||||
| Methodology differences: | |||||||||||||||||||||||
| Inventory/cost of sales |
|
(
|
|
(
|
|||||||||||||||||||
| Postretirement benefit expense |
|
(
|
|
|
|||||||||||||||||||
| Stock-based compensation expense |
(
|
(
|
(
|
(
|
|||||||||||||||||||
| Financing costs |
(
|
(
|
(
|
(
|
|||||||||||||||||||
| Currency |
|
(
|
|
(
|
|||||||||||||||||||
| Other income/expense methodology differences |
(
|
(
|
(
|
(
|
|||||||||||||||||||
| Other methodology differences |
|
|
(
|
(
|
|||||||||||||||||||
| Total consolidated profit before taxes | $ |
|
$ |
|
$ |
|
$ |
|
|||||||||||||||
34
| Reconciliation of Assets: | |||||||||||
| (Millions of dollars) | September 30, 2021 | December 31, 2020 | |||||||||
| Assets from reportable segments: | |||||||||||
| Construction Industries | $ |
|
$ |
|
|||||||
| Resource Industries |
|
|
|||||||||
| Energy & Transportation |
|
|
|||||||||
| Financial Products Segment |
|
|
|||||||||
| Total assets from reportable segments |
|
|
|||||||||
| Assets from All Other operating segment |
|
|
|||||||||
| Items not included in segment assets: | |||||||||||
| Cash and cash equivalents |
|
|
|||||||||
| Deferred income taxes |
|
|
|||||||||
| Goodwill and intangible assets |
|
|
|||||||||
| Property, plant and equipment – net and other assets |
|
|
|||||||||
| Inventory methodology differences |
(
|
(
|
|||||||||
| Liabilities included in segment assets |
|
|
|||||||||
| Other |
(
|
(
|
|||||||||
| Total assets | $ |
|
$ |
|
|||||||
| Reconciliation of Depreciation and amortization: | |||||||||||||||||||||||
| (Millions of dollars) | |||||||||||||||||||||||
| Three Months Ended September 30 | Nine Months Ended September 30 | ||||||||||||||||||||||
| 2021 | 2020 | 2021 | 2020 | ||||||||||||||||||||
| Depreciation and amortization from reportable segments: | |||||||||||||||||||||||
| Construction Industries | $ |
|
$ |
|
$ |
|
$ |
|
|||||||||||||||
| Resource Industries |
|
|
|
|
|||||||||||||||||||
| Energy & Transportation |
|
|
|
|
|||||||||||||||||||
| Financial Products Segment |
|
|
|
|
|||||||||||||||||||
| Total depreciation and amortization from reportable segments |
|
|
|
|
|||||||||||||||||||
| Items not included in segment depreciation and amortization: | |||||||||||||||||||||||
| All Other operating segment |
|
|
|
|
|||||||||||||||||||
| Cost centers |
|
|
|
|
|||||||||||||||||||
| Other |
|
|
|
|
|||||||||||||||||||
| Total depreciation and amortization | $ |
|
$ |
|
$ |
|
$ |
|
|||||||||||||||
35
| Reconciliation of Capital expenditures: | |||||||||||||||||||||||
| (Millions of dollars) | |||||||||||||||||||||||
| Three Months Ended September 30 | Nine Months Ended September 30 | ||||||||||||||||||||||
| 2021 | 2020 | 2021 | 2020 | ||||||||||||||||||||
| Capital expenditures from reportable segments: | |||||||||||||||||||||||
| Construction Industries | $ |
|
$ |
|
$ |
|
$ |
|
|||||||||||||||
| Resource Industries |
|
|
|
|
|||||||||||||||||||
| Energy & Transportation |
|
|
|
|
|||||||||||||||||||
| Financial Products Segment |
|
|
|
|
|||||||||||||||||||
| Total capital expenditures from reportable segments |
|
|
|
|
|||||||||||||||||||
| Items not included in segment capital expenditures: | |||||||||||||||||||||||
| All Other operating segment |
|
|
|
|
|||||||||||||||||||
| Cost centers |
|
|
|
|
|||||||||||||||||||
| Timing |
(
|
|
|
|
|||||||||||||||||||
| Other |
|
|
(
|
(
|
|||||||||||||||||||
| Total capital expenditures | $ |
|
$ |
|
$ |
|
$ |
|
|||||||||||||||
17.
Cat Financial financing activities
Allowance for credit losses
Portfolio segments
A portfolio segment is the level at which Cat Financial develops a systematic methodology for determining its allowance for credit losses. Cat Financial's portfolio segments and related methods for estimating expected credit losses are as follows:
Customer
Cat Financial provides loans and finance leases to end-user customers primarily for the purpose of financing new and used Caterpillar machinery, engines and equipment for commercial use, the majority of which operate in construction-related industries. Cat Financial also provides financing for vehicles, power generation facilities and marine vessels that, in most cases, incorporate Caterpillar products. The average original term of Cat Financial's customer finance receivable portfolio was approximately 50 months with an average remaining term of approximately 27 months as of September 30, 2021.
Cat Financial typically maintains a security interest in financed equipment and requires physical damage insurance coverage on the financed equipment, both of which provide Cat Financial with certain rights and protections. If Cat Financial's collection efforts fail to bring a defaulted account current, Cat Financial generally can repossess the financed equipment, after satisfying local legal requirements, and sell it within the Caterpillar dealer network or through third-party auctions.
Cat Financial estimates the allowance for credit losses related to its customer finance receivables based on loss forecast models utilizing probabilities of default and the estimated loss given default based on past loss experience adjusted for current conditions and reasonable and supportable forecasts capturing country and industry-specific economic factors.
During the three and nine months ended September 30, 2021, Cat Financial's forecasts for the markets in which it operates reflected a general improvement in economic conditions, which had deteriorated due to the COVID-19 pandemic, resulting from a growing economy, improved unemployment rates and a decrease in delinquencies. The company believes the economic forecasts employed represent reasonable and supportable forecasts, followed by a reversion to long-term trends.
Dealer
Cat Financial provides financing to Caterpillar dealers in the form of wholesale financing plans. Cat Financial's wholesale financing plans provide assistance to dealers by financing their mostly new Caterpillar equipment inventory and rental fleets on a secured and unsecured basis. In addition, Cat Financial provides a variety of secured and unsecured loans to Caterpillar dealers.
36
Cat Financial estimates the allowance for credit losses for dealer finance receivables based on historical loss rates with consideration of current economic conditions and reasonable and supportable forecasts.
In general, Cat Financial's Dealer portfolio segment has not historically experienced large increases or decreases in credit losses based on changes in economic conditions due to its close working relationships with the dealers and their financial strength. Therefore, Cat Financial made no adjustments to historical loss rates during the three and nine months ended September 30, 2021.
Classes of finance receivables
Cat Financial further evaluates portfolio segments by the class of finance receivables, which is defined as a level of information (below a portfolio segment) in which the finance receivables have the same initial measurement attribute and a similar method for assessing and monitoring credit risk. Cat Financial's classes, which align with management reporting for credit losses, are as follows:
•
North America
- Finance receivables originated in the United States and Canada.
•
EAME
- Finance receivables originated in Europe, Africa, the Middle East and the Commonwealth of Independent States.
•
Asia/Pacific
- Finance receivables originated in Australia, New Zealand, China, Japan, Southeast Asia and India.
•
Mining
- Finance receivables related to large mining customers worldwide.
•
Latin America
- Finance receivables originated in Mexico and Central and South American countries.
•
Caterpillar Power Finance
- Finance receivables originated worldwide related to marine vessels with Caterpillar engines and Caterpillar electrical power generation, gas compression and co-generation systems and non-Caterpillar equipment that is powered by these systems.
Receivable balances, including accrued interest, are written off against the allowance for credit losses when, in the judgment of management, they are considered uncollectible (generally upon repossession of the collateral). The amount of the write-off is determined by comparing the fair value of the collateral, less cost to sell, to the amortized cost. Subsequent recoveries, if any, are credited to the allowance for credit losses when received.
37
An analysis of the allowance for credit losses was as follows:
| (Millions of dollars) | Three Months Ended September 30, 2021 | Three Months Ended September 30, 2020 | |||||||||||||||||||||||||||||||||
| Allowance for Credit Losses: | Customer | Dealer | Total | Customer | Dealer | Total | |||||||||||||||||||||||||||||
| Beginning balance | $ |
|
$ |
|
$ |
|
$ |
|
$ |
|
$ |
|
|||||||||||||||||||||||
| Write-offs |
(
|
|
(
|
(
|
|
(
|
|||||||||||||||||||||||||||||
| Recoveries |
|
|
|
|
|
|
|||||||||||||||||||||||||||||
| Provision for credit losses |
|
|
|
|
|
|
|||||||||||||||||||||||||||||
| Other |
(
|
|
(
|
|
|
|
|||||||||||||||||||||||||||||
| Ending balance | $ |
|
$ |
|
$ |
|
$ |
|
$ |
|
$ |
|
|||||||||||||||||||||||
| Nine Months Ended September 30, 2021 | Nine Months Ended September 30, 2020 | ||||||||||||||||||||||||||||||||||
| Allowance for Credit Losses: | Customer | Dealer | Total | Customer | Dealer | Total | |||||||||||||||||||||||||||||
| Beginning balance | $ |
|
$ |
|
$ |
|
$ |
|
$ |
|
$ |
|
|||||||||||||||||||||||
|
Adjustment to adopt new accounting guidance
1
|
|
|
|
|
|
|
|||||||||||||||||||||||||||||
| Write-offs |
(
|
|
(
|
(
|
|
(
|
|||||||||||||||||||||||||||||
| Recoveries |
|
|
|
|
|
|
|||||||||||||||||||||||||||||
| Provision for credit losses |
|
|
|
|
|
|
|||||||||||||||||||||||||||||
| Other |
(
|
|
(
|
(
|
|
(
|
|||||||||||||||||||||||||||||
| Ending balance | $ |
|
$ |
|
$ |
|
$ |
|
$ |
|
$ |
|
|||||||||||||||||||||||
| Individually evaluated | $ |
|
$ |
|
$ |
|
$ |
|
$ |
|
$ |
|
|||||||||||||||||||||||
| Collectively evaluated |
|
|
|
|
|
|
|||||||||||||||||||||||||||||
| Ending Balance | $ |
|
$ |
|
$ |
|
$ |
|
$ |
|
$ |
|
|||||||||||||||||||||||
| Finance Receivables: | |||||||||||||||||||||||||||||||||||
| Individually evaluated | $ |
|
$ |
|
$ |
|
$ |
|
$ |
|
$ |
|
|||||||||||||||||||||||
| Collectively evaluated |
|
|
|
|
|
|
|||||||||||||||||||||||||||||
| Ending Balance | $ |
|
$ |
|
$ |
|
$ |
|
$ |
|
$ |
|
|||||||||||||||||||||||
|
1
Adjustment to adopt new accounting guidance related to credit losses.
|
|||||||||||||||||||||||||||||||||||
Credit quality of finance receivables
At origination, Cat Financial evaluates credit risk based on a variety of credit quality factors including prior payment experience, customer financial information, credit ratings, loan-to-value ratios, probabilities of default, industry trends, macroeconomic factors and other internal metrics. On an ongoing basis, Cat Financial monitors credit quality based on past-due status as there is a meaningful correlation between the past-due status of customers and the risk of loss. In determining past-due status, Cat Financial considers the entire finance receivable past due when any installment is over
30
days past due.
Customer
38
| (Millions of dollars) | September 30, 2021 | ||||||||||||||||||||||||||||||||||||||||||||||
| 2021 | 2020 | 2019 | 2018 | 2017 | Prior |
Revolving
Finance Receivables |
Total Finance Receivables | ||||||||||||||||||||||||||||||||||||||||
| North America | |||||||||||||||||||||||||||||||||||||||||||||||
| Current | $ |
|
$ |
|
$ |
|
$ |
|
$ |
|
$ |
|
$ |
|
$ |
|
|||||||||||||||||||||||||||||||
| 31-60 days past due |
|
|
|
|
|
|
|
|
|||||||||||||||||||||||||||||||||||||||
| 61-90 days past due |
|
|
|
|
|
|
|
|
|||||||||||||||||||||||||||||||||||||||
| 91+ days past due |
|
|
|
|
|
|
|
|
|||||||||||||||||||||||||||||||||||||||
| EAME | |||||||||||||||||||||||||||||||||||||||||||||||
| Current |
|
|
|
|
|
|
|
|
|||||||||||||||||||||||||||||||||||||||
| 31-60 days past due |
|
|
|
|
|
|
|
|
|||||||||||||||||||||||||||||||||||||||
| 61-90 days past due |
|
|
|
|
|
|
|
|
|||||||||||||||||||||||||||||||||||||||
| 91+ days past due |
|
|
|
|
|
|
|
|
|||||||||||||||||||||||||||||||||||||||
| Asia/Pacific | |||||||||||||||||||||||||||||||||||||||||||||||
| Current |
|
|
|
|
|
|
|
|
|||||||||||||||||||||||||||||||||||||||
| 31-60 days past due |
|
|
|
|
|
|
|
|
|||||||||||||||||||||||||||||||||||||||
| 61-90 days past due |
|
|
|
|
|
|
|
|
|||||||||||||||||||||||||||||||||||||||
| 91+ days past due |
|
|
|
|
|
|
|
|
|||||||||||||||||||||||||||||||||||||||
| Mining | |||||||||||||||||||||||||||||||||||||||||||||||
| Current |
|
|
|
|
|
|
|
|
|||||||||||||||||||||||||||||||||||||||
| 31-60 days past due |
|
|
|
|
|
|
|
|
|||||||||||||||||||||||||||||||||||||||
| 61-90 days past due |
|
|
|
|
|
|
|
|
|||||||||||||||||||||||||||||||||||||||
| 91+ days past due |
|
|
|
|
|
|
|
|
|||||||||||||||||||||||||||||||||||||||
| Latin America | |||||||||||||||||||||||||||||||||||||||||||||||
| Current |
|
|
|
|
|
|
|
|
|||||||||||||||||||||||||||||||||||||||
| 31-60 days past due |
|
|
|
|
|
|
|
|
|||||||||||||||||||||||||||||||||||||||
| 61-90 days past due |
|
|
|
|
|
|
|
|
|||||||||||||||||||||||||||||||||||||||
| 91+ days past due |
|
|
|
|
|
|
|
|
|||||||||||||||||||||||||||||||||||||||
| Caterpillar Power Finance | |||||||||||||||||||||||||||||||||||||||||||||||
| Current |
|
|
|
|
|
|
|
|
|||||||||||||||||||||||||||||||||||||||
| 31-60 days past due |
|
|
|
|
|
|
|
|
|||||||||||||||||||||||||||||||||||||||
| 61-90 days past due |
|
|
|
|
|
|
|
|
|||||||||||||||||||||||||||||||||||||||
| 91+ days past due |
|
|
|
|
|
|
|
|
|||||||||||||||||||||||||||||||||||||||
| Total Customer | $ |
|
$ |
|
$ |
|
$ |
|
$ |
|
$ |
|
$ |
|
$ |
|
|||||||||||||||||||||||||||||||
39
| (Millions of dollars) | December 31, 2020 | ||||||||||||||||||||||||||||||||||||||||||||||
| 2020 | 2019 | 2018 | 2017 | 2016 | Prior |
Revolving
Finance Receivables |
Total Finance Receivables | ||||||||||||||||||||||||||||||||||||||||
| North America | |||||||||||||||||||||||||||||||||||||||||||||||
| Current | $ |
|
$ |
|
$ |
|
$ |
|
$ |
|
$ |
|
$ |
|
$ |
|
|||||||||||||||||||||||||||||||
| 31-60 days past due |
|
|
|
|
|
|
|
|
|||||||||||||||||||||||||||||||||||||||
| 61-90 days past due |
|
|
|
|
|
|
|
|
|||||||||||||||||||||||||||||||||||||||
| 91+ days past due |
|
|
|
|
|
|
|
|
|||||||||||||||||||||||||||||||||||||||
| EAME | |||||||||||||||||||||||||||||||||||||||||||||||
| Current |
|
|
|
|
|
|
|
|
|||||||||||||||||||||||||||||||||||||||
| 31-60 days past due |
|
|
|
|
|
|
|
|
|||||||||||||||||||||||||||||||||||||||
| 61-90 days past due |
|
|
|
|
|
|
|
|
|||||||||||||||||||||||||||||||||||||||
| 91+ days past due |
|
|
|
|
|
|
|
|
|||||||||||||||||||||||||||||||||||||||
| Asia/Pacific | |||||||||||||||||||||||||||||||||||||||||||||||
| Current |
|
|
|
|
|
|
|
|
|||||||||||||||||||||||||||||||||||||||
| 31-60 days past due |
|
|
|
|
|
|
|
|
|||||||||||||||||||||||||||||||||||||||
| 61-90 days past due |
|
|
|
|
|
|
|
|
|||||||||||||||||||||||||||||||||||||||
| 91+ days past due |
|
|
|
|
|
|
|
|
|||||||||||||||||||||||||||||||||||||||
| Mining | |||||||||||||||||||||||||||||||||||||||||||||||
| Current |
|
|
|
|
|
|
|
|
|||||||||||||||||||||||||||||||||||||||
| 31-60 days past due |
|
|
|
|
|
|
|
|
|||||||||||||||||||||||||||||||||||||||
| 61-90 days past due |
|
|
|
|
|
|
|
|
|||||||||||||||||||||||||||||||||||||||
| 91+ days past due |
|
|
|
|
|
|
|
|
|||||||||||||||||||||||||||||||||||||||
| Latin America | |||||||||||||||||||||||||||||||||||||||||||||||
| Current |
|
|
|
|
|
|
|
|
|||||||||||||||||||||||||||||||||||||||
| 31-60 days past due |
|
|
|
|
|
|
|
|
|||||||||||||||||||||||||||||||||||||||
| 61-90 days past due |
|
|
|
|
|
|
|
|
|||||||||||||||||||||||||||||||||||||||
| 91+ days past due |
|
|
|
|
|
|
|
|
|||||||||||||||||||||||||||||||||||||||
| Caterpillar Power Finance | |||||||||||||||||||||||||||||||||||||||||||||||
| Current |
|
|
|
|
|
|
|
|
|||||||||||||||||||||||||||||||||||||||
| 31-60 days past due |
|
|
|
|
|
|
|
|
|||||||||||||||||||||||||||||||||||||||
| 61-90 days past due |
|
|
|
|
|
|
|
|
|||||||||||||||||||||||||||||||||||||||
| 91+ days past due |
|
|
|
|
|
|
|
|
|||||||||||||||||||||||||||||||||||||||
| Total Customer | $ |
|
$ |
|
$ |
|
$ |
|
$ |
|
$ |
|
$ |
|
$ |
|
|||||||||||||||||||||||||||||||
Finance receivables in the Customer portfolio segment are substantially secured by collateral, primarily in the form of Caterpillar and other machinery. For those contracts where the borrower is experiencing financial difficulty, repayment of the outstanding amounts is generally expected to be provided through the operation or repossession and sale of the machinery.
Dealer
As of September 30, 2021, Cat Financial's total amortized cost of finance receivables within the Dealer portfolio segment was current, with the exception of $
78
million that was 91+ days past due in Latin America, all of which was originated in 2017. As of December 31, 2020, Cat Financial's total amortized cost of finance receivables within the Dealer portfolio segment was current, with the exception of $
81
million that was 91+ days past due in Latin America. Of these past due receivables, $
78
million were originated in 2017 and $
3
million were originated prior to 2016.
40
Non-accrual finance receivables
Recognition of income is suspended and the finance receivable is placed on non-accrual status when management determines that collection of future income is not probable. Contracts on non-accrual status are generally more than
120
days past due or have been restructured in a troubled debt restructuring (TDR). Recognition is resumed and previously suspended income is recognized when the collection of remaining amounts is considered probable. Payments received while the finance receivable is on non-accrual status are applied to interest and principal in accordance with the contractual terms. Interest earned but uncollected prior to the receivable being placed on non-accrual status is written off through Provision for credit losses when, in the judgment of management, it is considered uncollectible.
In Cat Financial's Customer portfolio segment, finance receivables which were on non-accrual status and finance receivables over 90 days past due and still accruing income were as follows:
| September 30, 2021 | December 31, 2020 | ||||||||||||||||||||||||||||||||||
| Amortized Cost | Amortized Cost | ||||||||||||||||||||||||||||||||||
|
(Millions of dollars)
|
Non-accrual
With an Allowance |
Non-accrual
Without an Allowance |
91+ Still
Accruing |
Non-accrual
With an Allowance |
Non-accrual
Without an Allowance |
91+ Still
Accruing |
|||||||||||||||||||||||||||||
| North America | $ |
|
$ |
|
$ |
|
$ |
|
$ |
|
$ |
|
|||||||||||||||||||||||
| EAME |
|
|
|
|
|
|
|||||||||||||||||||||||||||||
| Asia/Pacific |
|
|
|
|
|
|
|||||||||||||||||||||||||||||
| Mining |
|
|
|
|
|
|
|||||||||||||||||||||||||||||
| Latin America |
|
|
|
|
|
|
|||||||||||||||||||||||||||||
| Caterpillar Power Finance |
|
|
|
|
|
|
|||||||||||||||||||||||||||||
| Total | $ |
|
$ |
|
$ |
|
$ |
|
$ |
|
$ |
|
|||||||||||||||||||||||
There was $
1
million and $
2
million of interest income recognized during the three months ended September 30, 2021 and 2020, respectively, for customer finance receivables on non-accrual status. There was $
9
million and $
8
million of interest income recognized during the nine months ended September 30, 2021 and 2020, respectively, for customer finance receivables on non-accrual status.
As of September 30, 2021 and December 31, 2020, finance receivables in Cat Financial's Dealer portfolio segment on non-accrual status were $
78
million and $
81
million, respectively, all of which was in Latin America. There were
no
finance receivables in Cat Financial's Dealer portfolio segment more than 90 days past due and still accruing income as of September 30, 2021 and December 31, 2020 and
no
interest income was recognized on dealer finance receivables on non-accrual status during the three and nine months ended September 30, 2021 and 2020.
Troubled debt restructurings
A restructuring of a finance receivable constitutes a TDR when the lender grants a concession it would not otherwise consider to a borrower experiencing financial difficulties. Concessions granted may include extended contract maturities, inclusion of interest only periods, below market interest rates, payment deferrals and reduction of principal and/or accrued interest. Cat Financial individually evaluates TDR contracts and establishes an allowance based on the present value of expected future cash flows discounted at the receivable's effective interest rate, the fair value of the collateral for collateral-dependent receivables or the observable market price of the receivable.
41
There were
no
finance receivables modified as TDRs during the three and nine months ended September 30, 2021 and 2020 for the Dealer portfolio segment.
Cat Financial’s finance receivables in the Customer portfolio segment modified as TDRs were as follows:
| (Millions of dollars) | Three Months Ended September 30, 2021 | Three Months Ended September 30, 2020 | |||||||||||||||||||||
|
Pre-TDR
Amortized Cost |
Post-TDR
Amortized Cost |
Pre-TDR
Amortized Cost |
Post-TDR
Amortized Cost |
||||||||||||||||||||
| Customer | |||||||||||||||||||||||
| North America | $ |
|
$ |
|
$ |
|
$ |
|
|||||||||||||||
| EAME |
|
|
|
|
|||||||||||||||||||
| Asia/Pacific |
|
|
|
|
|||||||||||||||||||
| Mining |
|
|
|
|
|||||||||||||||||||
| Latin America |
|
|
|
|
|||||||||||||||||||
|
Caterpillar Power Finance
|
|
|
|
|
|||||||||||||||||||
| Total | $ |
|
$ |
|
$ |
|
$ |
|
|||||||||||||||
| Nine Months Ended September 30, 2021 | Nine Months Ended September 30, 2020 | ||||||||||||||||||||||
|
Pre-TDR
Amortized Cost |
Post-TDR
Amortized Cost |
Pre-TDR
Amortized Cost |
Post-TDR
Amortized Cost |
||||||||||||||||||||
| North America | $ |
|
$ |
|
$ |
|
$ |
|
|||||||||||||||
| EAME |
|
|
|
|
|||||||||||||||||||
| Asia/Pacific |
|
|
|
|
|||||||||||||||||||
| Mining |
|
|
|
|
|||||||||||||||||||
| Latin America |
|
|
|
|
|||||||||||||||||||
| Caterpillar Power Finance |
|
|
|
|
|||||||||||||||||||
|
Total
|
$ |
|
$ |
|
$ |
|
$ |
|
|||||||||||||||
The Post-TDR amortized costs in the Customer portfolio segment with a payment default (defined as 91+ days past due) which had been modified within twelve months prior to the default date, were as follows:
| Three Months Ended September 30 | Nine Months Ended September 30 | ||||||||||||||||||||||
| Customer | 2021 | 2020 | 2021 | 2020 | |||||||||||||||||||
| North America | $ |
|
$ |
|
$ |
|
$ |
|
|||||||||||||||
| EAME |
|
|
|
|
|||||||||||||||||||
| Asia/Pacific |
|
|
|
|
|||||||||||||||||||
| Mining |
|
|
|
|
|||||||||||||||||||
| Latin America |
|
|
|
|
|||||||||||||||||||
| Caterpillar Power Finance |
|
|
|
|
|||||||||||||||||||
| Total | $ |
|
$ |
|
$ |
|
$ |
|
|||||||||||||||
42
18.
Fair value disclosures
A.
Fair value measurements
The guidance on fair value measurements defines fair value as the exchange price that would be received for an asset or paid to transfer a liability (an exit price) in the principal or most advantageous market for the asset or liability in an orderly transaction between market participants. This guidance also specifies a fair value hierarchy based upon the observability of inputs used in valuation techniques. Observable inputs (highest level) reflect market data obtained from independent sources, while unobservable inputs (lowest level) reflect internally developed market assumptions. In accordance with this guidance, fair value measurements are classified under the following hierarchy:
•
Level 1
–
Quoted prices for identical instruments in active markets.
•
Level 2
– Quoted prices for similar instruments in active markets; quoted prices for identical or similar instruments in markets that are not active; and model-derived valuations in which all significant inputs or significant value-drivers are observable in active markets.
•
Level 3
– Model-derived valuations in which one or more significant inputs or significant value-drivers are unobservable.
When available, we use quoted market prices to determine fair value, and we classify such measurements within Level 1. In some cases where market prices are not available, we make use of observable market based inputs to calculate fair value, in which case the measurements are classified within Level 2. If quoted or observable market prices are not available, fair value is based upon valuations in which one or more significant inputs are unobservable, including internally developed models that use, where possible, current market-based parameters such as interest rates, yield curves and currency rates. These measurements are classified within Level 3.
We classify fair value measurements according to the lowest level input or value-driver that is significant to the valuation. We may therefore classify a measurement within Level 3 even though there may be significant inputs that are readily observable.
Fair value measurement includes the consideration of nonperformance risk. Nonperformance risk refers to the risk that an obligation (either by a counterparty or Caterpillar) will not be fulfilled. For financial assets traded in an active market (Level 1 and certain Level 2), the nonperformance risk is included in the market price. For certain other financial assets and liabilities (certain Level 2 and Level 3), our fair value calculations have been adjusted accordingly.
Investments in debt and equity securities
We have investments in certain debt and equity securities, primarily at Insurance Services, that are recorded at fair value. Fair values for our U.S. treasury bonds and large capitalization value and smaller company growth equity securities are based upon valuations for identical instruments in active markets. Fair values for other government bonds, corporate bonds and mortgage-backed debt securities are based upon models that take into consideration such market-based factors as recent sales, risk-free yield curves and prices of similarly rated bonds.
We also have investments in time deposits classified as held-to-maturity debt securities. The fair value of these investments is based upon valuations observed in less active markets than Level 1. These investments have a maturity of less than one year and are recorded at amortized costs, which approximate fair value.
In addition, Insurance Services has an equity investment in a real estate investment trust (REIT) which is recorded at fair value based on the net asset value (NAV) of the investment and is not classified within the fair value hierarchy.
See Note 8 for additional information on our investments in debt and equity securities.
Derivative financial instruments
The fair value of interest rate contracts is primarily based on a standard industry accepted valuation model that utilizes the appropriate market-based forward swap curves and zero-coupon interest rates to determine discounted cash flows. The fair value of foreign currency and commodity forward, option and cross currency contracts is based on standard industry accepted valuation models that discount cash flows resulting from the differential between the contract price and the market-based forward rate.
43
Assets and liabilities measured on a recurring basis at fair value, primarily related to Financial Products, included in our Consolidated Statement of Financial Position as of September 30, 2021 and December 31, 2020 were as follows:
| September 30, 2021 | |||||||||||||||||||||||||||||
|
(Millions of dollars)
|
Level 1 | Level 2 | Level 3 | Measured at NAV |
Total
Assets / Liabilities, at Fair Value |
||||||||||||||||||||||||
| Assets | |||||||||||||||||||||||||||||
| Debt securities | |||||||||||||||||||||||||||||
| Government debt | |||||||||||||||||||||||||||||
| U.S. treasury bonds | $ |
|
$ | — | $ | — | $ | — | $ |
|
|||||||||||||||||||
| Other U.S. and non-U.S. government bonds | — |
|
— | — |
|
||||||||||||||||||||||||
| Corporate bonds | |||||||||||||||||||||||||||||
| Corporate bonds | — |
|
— | — |
|
||||||||||||||||||||||||
| Asset-backed securities | — |
|
— | — |
|
||||||||||||||||||||||||
| Mortgage-backed debt securities | |||||||||||||||||||||||||||||
| U.S. governmental agency | — |
|
— | — |
|
||||||||||||||||||||||||
| Residential | — |
|
— | — |
|
||||||||||||||||||||||||
| Commercial | — |
|
— | — |
|
||||||||||||||||||||||||
| Total debt securities |
|
|
— | — |
|
||||||||||||||||||||||||
| Equity securities | |||||||||||||||||||||||||||||
| Large capitalization value |
|
— | — | — |
|
||||||||||||||||||||||||
| Smaller company growth |
|
— | — | — |
|
||||||||||||||||||||||||
| REIT | — | — | — |
|
|
||||||||||||||||||||||||
| Total equity securities |
|
— | — |
|
|
||||||||||||||||||||||||
| Derivative financial instruments, net | — |
|
— | — |
|
||||||||||||||||||||||||
| Total assets | $ |
|
$ |
|
$ | — | $ |
|
$ |
|
|||||||||||||||||||
44
| December 31, 2020 | |||||||||||||||||||||||||||||
|
(Millions of dollars)
|
Level 1 | Level 2 | Level 3 | Measured at NAV |
Total
Assets / Liabilities, at Fair Value |
||||||||||||||||||||||||
| Assets | |||||||||||||||||||||||||||||
| Debt securities | |||||||||||||||||||||||||||||
| Government debt | |||||||||||||||||||||||||||||
| U.S. treasury bonds | $ |
|
$ | — | $ | — | $ | — | $ |
|
|||||||||||||||||||
| Other U.S. and non-U.S. government bonds | — |
|
— | — |
|
||||||||||||||||||||||||
| Corporate bonds | |||||||||||||||||||||||||||||
| Corporate bonds | — |
|
— | — |
|
||||||||||||||||||||||||
| Asset-backed securities | — |
|
— | — |
|
||||||||||||||||||||||||
| Mortgage-backed debt securities | |||||||||||||||||||||||||||||
| U.S. governmental agency | — |
|
— | — |
|
||||||||||||||||||||||||
| Residential | — |
|
— | — |
|
||||||||||||||||||||||||
| Commercial | — |
|
— | — |
|
||||||||||||||||||||||||
| Total debt securities |
|
|
— | — |
|
||||||||||||||||||||||||
| Equity securities | |||||||||||||||||||||||||||||
| Large capitalization value |
|
— | — | — |
|
||||||||||||||||||||||||
| Smaller company growth |
|
— | — | — |
|
||||||||||||||||||||||||
| REIT | — | — | — |
|
|
||||||||||||||||||||||||
| Total equity securities |
|
— | — |
|
|
||||||||||||||||||||||||
| Total assets | $ |
|
$ |
|
$ | — | $ |
|
$ |
|
|||||||||||||||||||
| Liabilities | |||||||||||||||||||||||||||||
| Derivative financial instruments, net | $ | — | $ |
|
$ | — | $ | — | $ |
|
|||||||||||||||||||
| Total liabilities | $ | — | $ |
|
$ | — | $ | — | $ |
|
|||||||||||||||||||
In addition to the amounts above, certain Cat Financial loans are subject to measurement at fair value on a nonrecurring basis and are classified as Level 3 measurements. A loan is measured at fair value when management determines that collection of contractual amounts due is not probable and the loan is individually evaluated. In these cases, an allowance for credit losses may be established based either on the present value of expected future cash flows discounted at the receivables’ effective interest rate, the fair value of the collateral for collateral-dependent receivables, or the observable market price of the receivable. In determining collateral value, Cat Financial estimates the current fair market value of the collateral less selling costs. Cat Financial had loans carried at fair value of $
150
million and $
243
million as of September 30, 2021 and December 31, 2020, respectively.
B.
Fair values of financial instruments
In addition to the methods and assumptions we use to record the fair value of financial instruments as discussed in the Fair value measurements section above, we use the following methods and assumptions to estimate the fair value of our financial instruments:
Cash and cash equivalents
Carrying amount approximates fair value.
Restricted cash and short-term investments
Carrying amount approximates fair value. We include restricted cash and short-term investments in Prepaid expenses and other current assets in the Consolidated Statement of Financial Position.
Finance receivables
We estimate fair value by discounting the future cash flows using current rates, representative of receivables with similar remaining maturities.
Wholesale inventory receivables
We estimate fair value by discounting the future cash flows using current rates, representative of receivables with similar remaining maturities.
45
Short-term borrowings
Carrying amount approximates fair value.
Long-term debt
We estimate fair value for fixed and floating rate debt based on quoted market prices.
Guarantees
The fair value of guarantees is based upon our estimate of the premium a market participant would require to issue the same guarantee in a stand-alone arms-length transaction with an unrelated party. If quoted or observable market prices are not available, fair value is based upon internally developed models that utilize current market-based assumptions.
Fair values of our financial instruments were as follows:
| Fair Value of Financial Instruments | ||||||||||||||||||||||||||||||||||||||
| September 30, 2021 | December 31, 2020 | |||||||||||||||||||||||||||||||||||||
| (Millions of dollars) |
Carrying
Amount
|
Fair
Value
|
Carrying
Amount
|
Fair
Value
|
Fair Value Levels | Reference | ||||||||||||||||||||||||||||||||
| Assets | ||||||||||||||||||||||||||||||||||||||
| Cash and cash equivalents | $ |
|
$ |
|
$ |
|
$ |
|
1 | |||||||||||||||||||||||||||||
|
Restricted cash and short-term investments
1
|
|
|
|
|
1 & 2 | Note 8 | ||||||||||||||||||||||||||||||||
| Investments in AFS debt and equity securities |
|
|
|
|
1 & 2 | Note 8 | ||||||||||||||||||||||||||||||||
|
Finance receivables – net (excluding finance leases
2
)
|
|
|
|
|
3 | Note 17 | ||||||||||||||||||||||||||||||||
|
Wholesale inventory receivables – net (excluding finance leases
2
)
|
|
|
|
|
3 | |||||||||||||||||||||||||||||||||
| Foreign currency contracts – net |
|
|
|
|
2 | Note 5 | ||||||||||||||||||||||||||||||||
| Interest rate contracts – net |
|
|
|
|
2 | Note 5 | ||||||||||||||||||||||||||||||||
| Commodity contracts – net |
|
|
|
|
2 | Note 5 | ||||||||||||||||||||||||||||||||
| Liabilities | ||||||||||||||||||||||||||||||||||||||
| Short-term borrowings |
|
|
|
|
1 | |||||||||||||||||||||||||||||||||
|
Long-term debt (including amounts due within one year)
|
||||||||||||||||||||||||||||||||||||||
| Machinery, Energy & Transportation |
|
|
|
|
2 | |||||||||||||||||||||||||||||||||
| Financial Products |
|
|
|
|
2 | |||||||||||||||||||||||||||||||||
| Foreign currency contracts – net |
|
|
|
|
2 | Note 5 | ||||||||||||||||||||||||||||||||
| Guarantees |
|
|
|
|
3 | Note 11 | ||||||||||||||||||||||||||||||||
1
Includes time deposits of $
543
million as of September 30, 2021. There were
no
time deposits as of December 31, 2020. See Note 8 for additional information.
2
Represents finance leases and failed sale leasebacks of $
8,065
million and $
7,961
million at September 30, 2021 and
December 31, 2020, respectively.
46
19.
Other income (expense)
| Three Months Ended September 30 | Nine Months Ended September 30 | |||||||||||||||||||||||||
| (Millions of dollars) | 2021 | 2020 | 2021 | 2020 | ||||||||||||||||||||||
| Investment and interest income | $ |
|
$ |
|
$ |
|
$ |
|
||||||||||||||||||
|
Foreign exchange gains (losses)
1
|
|
(
|
|
(
|
||||||||||||||||||||||
| License fee income |
|
|
|
|
||||||||||||||||||||||
| Net periodic pension and OPEB income (cost), excluding service cost |
|
|
2
|
|
|
2
|
||||||||||||||||||||
| Gains (losses) on securities |
|
|
|
(
|
||||||||||||||||||||||
| Miscellaneous income (loss) |
(
|
|
|
(
|
||||||||||||||||||||||
| Total | $ |
|
$ |
|
$ |
|
$ |
|
||||||||||||||||||
1
Includes gains (losses) from foreign exchange derivative contracts. See Note 5 for further details.
2
Includes a net remeasurement loss of $(
77
) million and a net remeasurement gain of $
55
million for the three and nine months ended September 30, 2020, respectively, from the settlement of certain pension obligations. See Note 9 for further details.
20.
Restructuring costs
Our accounting for employee separations is dependent upon how the particular program is designed. For voluntary programs, we recognize eligible separation costs at the time of employee acceptance unless the acceptance requires explicit approval by the company. For involuntary programs, we recognize eligible costs when management has approved the program, the affected employees have been properly notified and the costs are estimable.
Restructuring costs for the three and nine months ended September 30, 2021 and 2020 were as follows:
| (Millions of dollars) | Three Months Ended September 30 | Nine Months Ended September 30 | |||||||||||||||||||||
| 2021 | 2020 | 2021 | 2020 | ||||||||||||||||||||
|
Employee separations
1
|
$ |
|
$ |
|
$ |
|
$ |
|
|||||||||||||||
|
Contract terminations
1
|
|
|
|
|
|||||||||||||||||||
|
Long-lived asset impairments
1
|
|
|
|
|
|||||||||||||||||||
|
Other
2
|
|
|
|
|
|||||||||||||||||||
| Total restructuring costs | $ |
|
$ |
|
$ |
|
$ |
|
|||||||||||||||
|
1
Recognized in Other operating (income) expenses.
|
|||||||||||||||||||||||
|
2
Represents costs related to our restructuring programs, primarily for accelerated depreciation, inventory write-downs, equipment relocation and project management, all of which are primarily included in Cost of goods sold.
|
|||||||||||||||||||||||
For the nine months ended September 30, 2021, the restructuring costs were primarily related to actions across the company including strategic actions to address certain product lines. For the nine months ended September 30, 2020, the restructuring costs were primarily related to various voluntary and involuntary employee separation programs implemented across the company and strategic actions to address certain product lines, which were partially offset by a gain on the sale of a manufacturing facility that had been closed.
In 2021, all restructuring costs are excluded from segment profit. In 2020, only certain restructuring costs were excluded from segment profit.
Restructuring costs included in segment profit were as follows:
47
| Three Months Ended September 30 | Nine Months Ended September 30 | ||||||||||||||||||||||
| (Millions of dollars) | 2021 | 2020 | 2021 | 2020 | |||||||||||||||||||
| Construction Industries | $ |
|
$ |
|
$ |
|
$ |
|
|||||||||||||||
| Resource Industries |
|
|
|
|
|||||||||||||||||||
| Energy & Transportation |
|
|
|
|
|||||||||||||||||||
| Financial Products Segment |
|
|
|
|
|||||||||||||||||||
The following table summarizes the 2021 and 2020 employee separation activity:
| (Millions of dollars) | Nine Months Ended September 30 | |||||||||||||
| 2021 | 2020 | |||||||||||||
| Liability balance, beginning of period | $ |
|
$ |
|
||||||||||
| Increase in liability (separation charges) |
|
|
||||||||||||
| Reduction in liability (payments) |
(
|
(
|
||||||||||||
| Liability balance, end of period | $ |
|
$ |
|
||||||||||
21.
Acquisitions
SPM Oil & Gas
On February 1, 2021, Caterpillar completed the acquisition of varying equity interests and assets of the Weir Group PLC, collectively known as SPM Oil & Gas (SPM). Headquartered near Fort Worth, Texas, SPM Oil & Gas produces a full line of pumps, flow iron, consumable parts, wellhead and pressure control products that are offered via an extensive global network of service centers. This acquisition, included in the Energy & Transportation segment, is consistent with our strategy of providing our customers expanded offerings and services which will now be one of the broadest in the well service industry. The purchase price, net of $
22
million of acquired cash, was approximately $
361
million.
We financed the transaction with available cash. Tangible assets as of the acquisition date were $
515
million, recorded at their fair values, and primarily included cash of $
22
million, receivables of $
101
million, inventories of $
159
million, leased assets of $
105
million, and property, plant, and equipment of $
117
million. Finite-lived intangible assets acquired of $
23
million included developed technology and trade names and will be amortized on a straight-line basis over a weighted-average amortization period of approximately
8
years. Liabilities assumed as of the acquisition date were $
187
million, recorded at their fair values, and primarily included lease liabilities of $
105
million and accounts payable of $
33
million. Goodwill of $
32
million represented the excess of the consideration transferred over the net assets acquired. These values represent a preliminary allocation of purchase price subject to finalization of post-closing procedures. Assuming this transaction had been made at the beginning of any period presented, the consolidated pro forma results would not be materially different from reported results.
48
Item 2. Management’s Discussion and Analysis of Financial Condition and Results of Operations
This Management’s Discussion and Analysis of Financial Condition and Results of Operations should be read in conjunction with our unaudited financial statements and related notes included elsewhere in this report and our discussion of significant risks to the company’s business under Part I, Item 1A. Risk Factors of the
2020 Form 10-K
.
Highlights for the third quarter of 2021 include:
•
Total sales and revenues for the third quarter of 2021 were $12.397 billion, an increase of $2.516 billion, or 25 percent, compared with $9.881 billion in the third quarter of 2020. Sales were higher across the three primary segments.
•
Operating profit margin was 13.4 percent for the third quarter of 2021, compared with 10.0 percent for the third quarter of 2020.
Adjusted operating profit margin
was 13.7 percent for the third quarter of 2021, compared with 11.1 percent for the third quarter of 2020.
•
Third-quarter 2021 profit per share was $2.60, and excluding the items in the table below,
adjusted profit per share
was $2.66. Third-quarter 2020 profit per share was $1.22, and excluding the items in the table below, adjusted profit per share was $1.52.
•
Caterpillar ended the third quarter of 2021 with $9.4 billion of enterprise cash.
Highlights for the nine months ended September 30, 2021 include:
•
Total sales and revenues were $37.173 billion for the nine months ended September 30, 2021, an increase of $6.660 billion, or 22 percent, compared with $30.513 billion for the nine months ended September 30, 2020.
•
Operating profit margin was 14.2 percent for the nine months ended September 30, 2021, compared with 10.4 percent for the nine months ended September 30, 2020. Adjusted operating profit margin was 14.5 percent for the nine months ended September 30, 2021, compared with 11.4 percent for the nine months ended September 30, 2020.
•
Profit per share for the nine months ended September 30, 2021, was $7.94, and excluding the items in the table below, adjusted profit per share was $8.13. Profit per share for the nine months ended September 30, 2020 was $4.05, and excluding the items in the table below, adjusted profit per share was $4.44.
•
Enterprise operating cash flow was $5.8 billion for the nine months ended September 30, 2021.
•
In order for our results to be more meaningful to our readers, we have separately quantified the impact of several significant items. A detailed reconciliation of GAAP to non-GAAP financial measures is included on page 69.
| Three Months Ended September 30, 2021 | Three Months Ended September 30, 2020 | Nine Months Ended September 30, 2021 | Nine Months Ended September 30, 2020 | |||||||||||||||||||||||||||||||||||
| (Dollars in millions except per share data) | Profit Before Taxes |
Profit
Per Share |
Profit Before Taxes |
Profit
Per Share |
Profit Before Taxes |
Profit
Per Share |
Profit Before Taxes |
Profit
Per Share |
||||||||||||||||||||||||||||||
| Profit................................................................................ | $ | 1,775 | $ | 2.60 | $ | 863 | $ | 1.22 | $ | 5,642 | $ | 7.94 | $ | 3,054 | $ | 4.05 | ||||||||||||||||||||||
|
Restructuring costs
........................................................
|
35 | 0.06 | 112 | 0.18 | 124 | 0.19 | 296 | 0.48 | ||||||||||||||||||||||||||||||
| Remeasurement (gains) losses of pension obligations.... | — | — | 77 | 0.12 | — | — | (55) | (0.08) | ||||||||||||||||||||||||||||||
| Adjusted profit................................................................. | $ | 1,810 | $ | 2.66 | $ | 1,052 | $ | 1.52 | $ | 5,766 | $ | 8.13 | $ | 3,295 | $ | 4.44 | ||||||||||||||||||||||
Overview
Total sales and revenues for the third quarter of 2021 were $12.397 billion, an increase of $2.516 billion, or 25 percent, compared with $9.881 billion in the third quarter of 2020. The increase was primarily due to higher
sales volume
driven by higher end-user demand for equipment and
services
and the impact from changes in
dealer inventories
, along with favorable
price realization
. Dealers decreased inventories by $600 million during the third quarter of 2020, compared with a decrease of $300 million during the third quarter of 2021. Sales were higher across the three primary segments.
Third-quarter 2021 profit per share was $2.60, compared with $1.22 profit per share in the third quarter of 2020. Profit per share for both quarters included restructuring costs, while the third quarter of 2020 also included a pre-tax net remeasurement loss of $77 million, or $0.12 per share, resulting from the settlements of pension obligations. Profit for the third quarter of 2021 was $1.426 billion, an increase of $758 million, or 113 percent, compared with $668 million for the third quarter of 2020. The increase was primarily due to higher sales volume and favorable
price realization.
49
Sales and revenues were $37.173 billion for the nine months ended September 30, 2021, an increase of $6.660 billion, or 22 percent, compared with $30.513 billion for the nine months ended September 30, 2020. Profit per share for the nine months ended September 30, 2021, was $7.94, an increase of $3.89, or 96 percent, compared with $4.05 for the nine months ended September 30, 2020. Profit per share for both periods included restructuring costs, while the nine months ended September 30, 2020, also included a pre-tax remeasurement net gain of $55 million, or $0.08 per share, resulting from the settlements of pension obligations. Profit for the nine months ended September 30, 2021, was $4.369 billion, an increase of $2.151 billion, or 97 percent, compared with $2.218 billion for the nine months ended September 30, 2020.
Response to COVID-19 and Global Business Conditions
:
We continue to implement safeguards in our facilities to protect team members, including increased frequency of cleaning and disinfecting, social distancing practices and other measures consistent with specific governmental requirements and guidance from health authorities. We’ve offered assistance to some governments and public health authorities in the vaccine distribution process, and as vaccines become available, we are assisting in onsite vaccine distribution for employees in some of our facilities.
We continue to monitor a variety of external factors including the ongoing impact of the COVID-19 pandemic around the world, supply chain disruptions and associated cost and labor pressures. Areas of particular focus include certain components, transportation and raw materials. Transportation shortages have resulted in delays and increased costs. In addition, our suppliers are dealing with availability issues and freight delays, which leads to pressure on production in our facilities. Contingency plans have been developed and continue to be modified to minimize supply chain challenges that may impact our ability to meet increasing customer demand. To help mitigate supply chain challenges, we have proactively redirected components and altered our assembly processes. We continue to assess the environment and are taking appropriate price actions in response to rising costs. We will continue to monitor the situation as conditions remain fluid and evolve, but we expect these pressures to continue into next year.
Notes:
•
Glossary of terms is included on pages 62 - 64; first occurrence of terms shown in bold italics.
•
Information on non-GAAP financial measures is included on page 69.
•
Certain amounts may not add due to rounding.
50
Consolidated Results of Operations
THREE MONTHS ENDED SEPTEMBER 30, 2021 COMPARED WITH THREE MONTHS ENDED SEPTEMBER 30, 2020
CONSOLIDATED SALES AND REVENUES
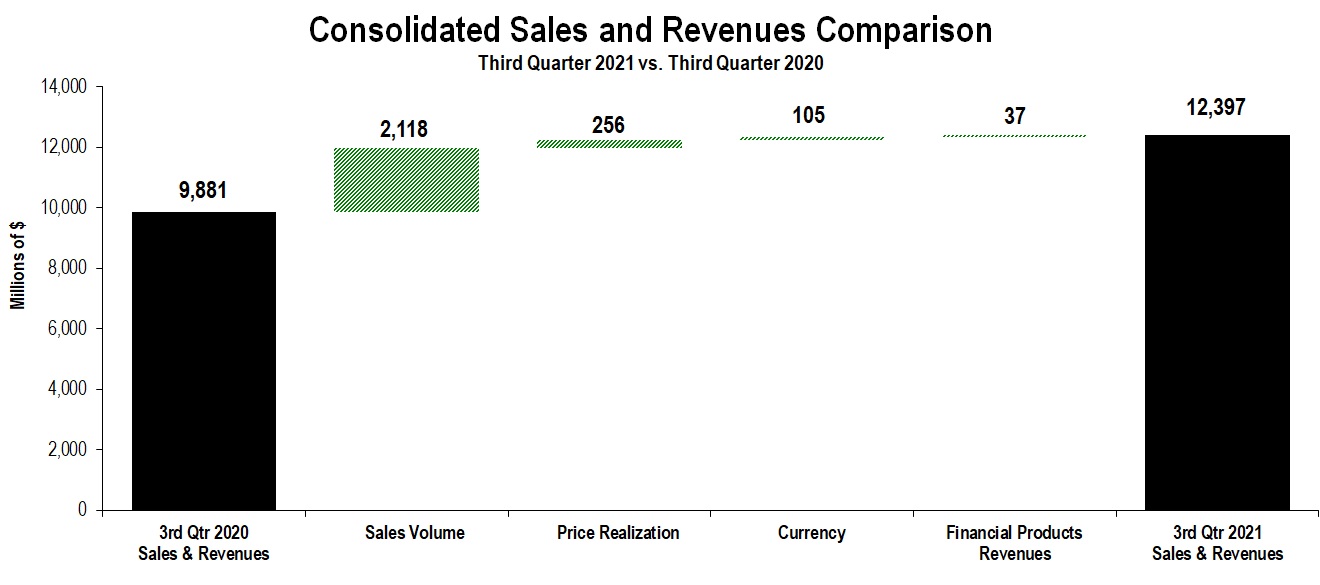
The chart above graphically illustrates reasons for the change in consolidated sales and revenues between the third quarter of 2020 (at left) and the third quarter of 2021 (at right). Caterpillar management utilizes these charts internally to visually communicate with the company’s Board of Directors and employees.
Total sales and revenues for the third quarter of 2021 were $12.397 billion, an increase of $2.516 billion, or 25 percent, compared with $9.881 billion in the third quarter of 2020. The increase was primarily due to higher sales volume driven by higher end-user demand for equipment and services and the impact from changes in dealer inventories, along with favorable price realization. Dealers decreased inventories by $600 million during the third quarter of 2020, compared with a decrease of $300 million during the third quarter of 2021.
Sales were higher across the three primary segments.
North America sales increased 31 percent due to higher end-user demand for equipment and services, the impact of changes in dealer inventories and favorable price realization. Dealers decreased inventories more during the third quarter of 2020 than during the third quarter of 2021.
Sales increased 77 percent in
Latin America
due to higher end-user demand for equipment and services across most of the region, the impact of changes in dealer inventories and favorable price realization. Dealers decreased inventories more during the third quarter of 2020 than during the third quarter of 2021.
EAME
sales increased 24 percent due to higher end-user demand for equipment and services, the impact of changes in dealer inventories, favorable price realization and favorable
currency
impacts primarily related to the euro and British pound. Dealers decreased inventories during the third quarter of 2020, compared to remaining about flat during the third quarter of 2021.
Asia/Pacific sales increased 8 percent driven by higher end-user demand for equipment and services, partially offset by the impacts from changes in dealer inventories. Dealers decreased inventories during the third quarter of 2021, compared with an increase during the third quarter of 2020.
Dealers decreased inventories by $600 million during the third quarter of 2020, compared with a decrease of $300 million during the third quarter of 2021. Dealers are independent, and the reasons for changes in their inventory levels vary, including their expectations of future demand and product delivery times. Dealers’ demand expectations take into account seasonal changes, macroeconomic conditions, machine rental rates and other factors. Delivery times can vary based on availability of product from Caterpillar factories and product distribution centers. We do not expect a significant dealer inventory increase in 2021.
51
| Sales and Revenues by Segment | |||||||||||||||||||||||||||||||||||||||||||||||
| (Millions of dollars) | Third Quarter 2020 |
Sales
Volume |
Price
Realization |
Currency | Inter-Segment / Other | Third Quarter 2021 |
$
Change |
%
Change |
|||||||||||||||||||||||||||||||||||||||
| Construction Industries | $ | 4,056 | $ | 957 | $ | 218 | $ | 38 | $ | (14) | $ | 5,255 | $ | 1,199 | 30 | % | |||||||||||||||||||||||||||||||
| Resource Industries | 1,816 | 522 | 43 | 22 | 3 | 2,406 | 590 | 32 | % | ||||||||||||||||||||||||||||||||||||||
| Energy & Transportation | 4,161 | 628 | (6) | 44 | 250 | 5,077 | 916 | 22 | % | ||||||||||||||||||||||||||||||||||||||
| All Other Segment | 106 | 10 | (1) | 1 | 3 | 119 | 13 | 12 | % | ||||||||||||||||||||||||||||||||||||||
| Corporate Items and Eliminations | (911) | 1 | 2 | — | (242) | (1,150) | (239) | ||||||||||||||||||||||||||||||||||||||||
|
Machinery, Energy & Transportation
Sales
|
9,228 | 2,118 | 256 | 105 | — | 11,707 | 2,479 | 27 | % | ||||||||||||||||||||||||||||||||||||||
| Financial Products Segment | 724 | — | — | — | 38 | 762 | 38 | 5 | % | ||||||||||||||||||||||||||||||||||||||
| Corporate Items and Eliminations | (71) | — | — | — | (1) | (72) | (1) | ||||||||||||||||||||||||||||||||||||||||
|
Financial Products
Revenues
|
653 | — | — | — | 37 | 690 | 37 | 6 | % | ||||||||||||||||||||||||||||||||||||||
| Consolidated Sales and Revenues | $ | 9,881 | $ | 2,118 | $ | 256 | $ | 105 | $ | 37 | $ | 12,397 | $ | 2,516 | 25 | % | |||||||||||||||||||||||||||||||
| Sales and Revenues by Geographic Region | ||
| North America | Latin America | EAME | Asia/Pacific | External Sales and Revenues | Inter-Segment | Total Sales and Revenues | |||||||||||||||||||||||||||||||||||||||||||||||||||||||||||||||||||||||||||||
| (Millions of dollars) | $ | % Chg | $ | % Chg | $ | % Chg | $ | % Chg | $ | % Chg | $ | % Chg | $ | % Chg | |||||||||||||||||||||||||||||||||||||||||||||||||||||||||||||||||||||
| Third Quarter 2021 | |||||||||||||||||||||||||||||||||||||||||||||||||||||||||||||||||||||||||||||||||||
| Construction Industries | $ | 2,417 | 36 | % | $ | 528 | 130 | % | $ | 1,240 | 56 | % | $ | 1,076 | (13 | %) | $ | 5,261 | 30 | % | $ | (6) | (175 | %) | $ | 5,255 | 30 | % | |||||||||||||||||||||||||||||||||||||||||||||||||||||||
| Resource Industries | 674 | 38 | % | 417 | 55 | % | 456 | 19 | % | 744 | 32 | % | 2,291 | 34 | % | 115 | 3 | % | 2,406 | 32 | % | ||||||||||||||||||||||||||||||||||||||||||||||||||||||||||||||
| Energy & Transportation | 1,924 | 21 | % | 329 | 49 | % | 1,144 | 3 | % | 744 | 34 | % | 4,141 | 19 | % | 936 | 36 | % | 5,077 | 22 | % | ||||||||||||||||||||||||||||||||||||||||||||||||||||||||||||||
| All Other Segment | 18 | 80 | % | — | (100 | %) | 3 | 200 | % | 14 | 8 | % | 35 | 40 | % | 84 | 4 | % | 119 | 12 | % | ||||||||||||||||||||||||||||||||||||||||||||||||||||||||||||||
| Corporate Items and Eliminations | (19) | — | — | (2) | (21) | (1,129) | (1,150) | ||||||||||||||||||||||||||||||||||||||||||||||||||||||||||||||||||||||||||||
| Machinery, Energy & Transportation Sales | 5,014 | 31 | % | 1,274 | 77 | % | 2,843 | 24 | % | 2,576 | 8 | % | 11,707 | 27 | % | — | — | 11,707 | 27 | % | |||||||||||||||||||||||||||||||||||||||||||||||||||||||||||||||
| Financial Products Segment | 478 | 7 | % | 68 | 8 | % | 105 | 5 | % | 111 | (2 | %) | 762 |
1
|
5 | % | — | — | 762 | 5 | % | ||||||||||||||||||||||||||||||||||||||||||||||||||||||||||||||
| Corporate Items and Eliminations | (37) | (13) | (9) | (13) | (72) | — | (72) | ||||||||||||||||||||||||||||||||||||||||||||||||||||||||||||||||||||||||||||
| Financial Products Revenues | 441 | 7 | % | 55 | 4 | % | 96 | 7 | % | 98 | (1 | %) | 690 | 6 | % | — | — | 690 | 6 | % | |||||||||||||||||||||||||||||||||||||||||||||||||||||||||||||||
| Consolidated Sales and Revenues | $ | 5,455 | 28 | % | $ | 1,329 | 72 | % | $ | 2,939 | 23 | % | $ | 2,674 | 8 | % | $ | 12,397 | 25 | % | $ | — | — | $ | 12,397 | 25 | % | ||||||||||||||||||||||||||||||||||||||||||||||||||||||||
| Third Quarter 2020 | |||||||||||||||||||||||||||||||||||||||||||||||||||||||||||||||||||||||||||||||||||
| Construction Industries | $ | 1,781 | $ | 230 | $ | 796 | $ | 1,241 | $ | 4,048 | $ | 8 | $ | 4,056 | |||||||||||||||||||||||||||||||||||||||||||||||||||||||||||||||||||||
| Resource Industries | 487 | 269 | 384 | 564 | 1,704 | 112 | 1,816 | ||||||||||||||||||||||||||||||||||||||||||||||||||||||||||||||||||||||||||||
| Energy & Transportation | 1,584 | 221 | 1,113 | 557 | 3,475 | 686 | 4,161 | ||||||||||||||||||||||||||||||||||||||||||||||||||||||||||||||||||||||||||||
| All Other Segment | 10 | 1 | 1 | 13 | 25 | 81 | 106 | ||||||||||||||||||||||||||||||||||||||||||||||||||||||||||||||||||||||||||||
| Corporate Items and Eliminations | (22) | (2) | — | — | (24) | (887) | (911) | ||||||||||||||||||||||||||||||||||||||||||||||||||||||||||||||||||||||||||||
| Machinery, Energy & Transportation Sales | 3,840 | 719 | 2,294 | 2,375 | 9,228 | — | 9,228 | ||||||||||||||||||||||||||||||||||||||||||||||||||||||||||||||||||||||||||||
| Financial Products Segment | 448 | 63 | 100 | 113 | 724 |
1
|
— | 724 | |||||||||||||||||||||||||||||||||||||||||||||||||||||||||||||||||||||||||||
| Corporate Items and Eliminations | (37) | (10) | (10) | (14) | (71) | — | (71) | ||||||||||||||||||||||||||||||||||||||||||||||||||||||||||||||||||||||||||||
| Financial Products Revenues | 411 | 53 | 90 | 99 | 653 | — | 653 | ||||||||||||||||||||||||||||||||||||||||||||||||||||||||||||||||||||||||||||
| Consolidated Sales and Revenues | $ | 4,251 | $ | 772 | $ | 2,384 | $ | 2,474 | $ | 9,881 | $ | — | $ | 9,881 | |||||||||||||||||||||||||||||||||||||||||||||||||||||||||||||||||||||
1
Includes revenues from Machinery, Energy & Transportation of $87 million and $81 million in the third quarter of 2021 and 2020, respectively.
52
CONSOLIDATED OPERATING PROFIT
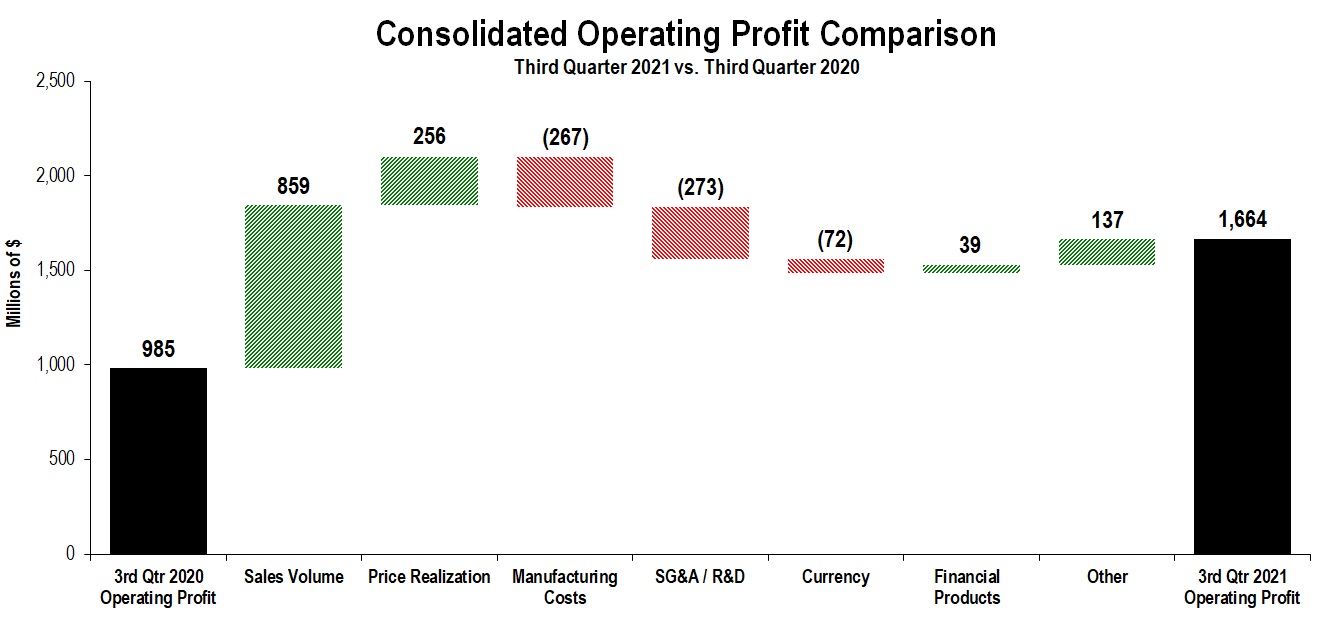
The chart above graphically illustrates reasons for the change in consolidated operating profit between the third quarter of 2020 (at left) and the third quarter of 2021 (at right). Caterpillar management utilizes these charts internally to visually communicate with the company’s Board of Directors and employees. The bar titled Other includes
consolidating adjustments
and
Machinery, Energy & Transportation other operating (income) expenses
.
Operating profit for the third quarter of 2021 was $1.664 billion, an increase of $679 million, or 69 percent, compared with $985 million in the third quarter of 2020. The increase was primarily due to higher sales volume and favorable price realization, partially offset by higher selling, general and administrative (SG&A) and research and development (R&D) expenses as well as higher
manufacturing costs
.
Unfavorable manufacturing costs reflected higher variable labor and burden, primarily freight, higher period manufacturing and material costs, partially offset by favorable cost absorption and lower warranty expense. Cost absorption was favorable as inventory increased during the third quarter of 2021, compared with remaining about flat during the third quarter of 2020.
The increase in both SG&A/R&D expenses and period manufacturing costs was mainly driven by higher short-term incentive compensation expense, which was reinstated in 2021, and investments aligned with the company's strategy for profitable growth, including acquisition-related expenses.
Short-term incentive compensation expense, which was reinstated in 2021, was about $350 million in the third quarter, compared to no short-term incentive compensation expense recognized in the third quarter of 2020.
Operating profit margin was 13.4 percent for the third quarter of 2021, compared with 10.0 percent for the third quarter of 2020.
| Profit (Loss) by Segment | |||||||||||||||||||||||
| (Millions of dollars) | Third Quarter 2021 | Third Quarter 2020 |
$
Change |
%
Change
|
|||||||||||||||||||
| Construction Industries | $ | 859 | $ | 585 | $ | 274 | 47 | % | |||||||||||||||
| Resource Industries | 297 | 167 | 130 | 78 | % | ||||||||||||||||||
| Energy & Transportation | 696 | 492 | 204 | 41 | % | ||||||||||||||||||
| All Other Segment | 5 | 27 | (22) | (81 | %) | ||||||||||||||||||
| Corporate Items and Eliminations | (286) | (346) | 60 | ||||||||||||||||||||
| Machinery, Energy & Transportation | 1,571 | 925 | 646 | 70 | % | ||||||||||||||||||
| Financial Products Segment | 173 | 142 | 31 | 22 | % | ||||||||||||||||||
| Corporate Items and Eliminations | (7) | (15) | 8 | ||||||||||||||||||||
| Financial Products | 166 | 127 | 39 | 31 | % | ||||||||||||||||||
| Consolidating Adjustments | (73) | (67) | (6) | ||||||||||||||||||||
| Consolidated Operating Profit | $ | 1,664 | $ | 985 | $ | 679 | 69 | % | |||||||||||||||
53
Other Profit/Loss and Tax Items
▪
Interest expense excluding Financial Products in the third quarter of 2021 was $114 million, compared with $136 million in the third quarter of 2020. The decrease was due to lower average debt outstanding during the third quarter of 2021, compared with the third quarter of 2020.
▪
Other income (expense) in the third quarter of 2021 was income of $225 million, compared with income of $14 million in the third quarter of 2020. The change was primarily due to favorable impacts from foreign currency exchange gains (losses), the absence of remeasurement losses resulting from the settlements of pension obligations that occurred in the third quarter of 2020 and favorable
pension and other postemployment benefit (OPEB)
plan costs.
The company experienced foreign currency exchange net gains in the third quarter of 2021, primarily due to the euro, compared with net losses in the third quarter of 2020.
▪
The provision for income taxes for the third quarter of 2021 reflected a lower estimated annual tax rate of 25 percent, compared with 31 percent for the third quarter of 2020, excluding the discrete items discussed below. The comparative tax rate for full-year 2020 was approximately 28 percent. The decrease in the estimated annual tax rate from full-year 2020 was primarily related to changes in the expected geographic mix of profits from a tax perspective for 2021.
In the third quarter of 2021, the company recorded a $39 million benefit due to the change from the second-quarter estimated annual tax rate of 26 percent. In addition, the company recorded discrete tax benefits of $36 million to reflect changes in estimates related to prior year U.S. taxes in the third quarter of 2021 compared to $80 million in the third quarter of 2020. In the third quarter of 2020, a discrete tax benefit of $13 million was recorded for the settlement of stock-based compensation awards with associated tax deductions in excess of cumulative U.S. GAAP compensation expense along with a $12 million tax benefit related to the $77 million of remeasurement losses resulting from the settlements of pension obligations.
Construction Industries
Construction Industries’ total sales were $5.255 billion in the third quarter of 2021, an increase of $1.199 billion, or 30 percent, compared with $4.056 billion in the third quarter of 2020. The increase was due to higher sales volume and favorable price realization. The increase in sales volume was driven by higher end-user demand and the impact from changes in dealer inventories. Overall, dealers decreased inventories more during the third quarter of 2020 than during the third quarter of 2021.
▪
In North America, sales increased due to higher sales volume and favorable price realization. Higher sales volume was driven by higher end-user demand from improving non-residential construction, as well as continued strength in residential construction and the impact from changes in dealer inventories. Dealers decreased inventories more during the third quarter of 2020 than during the third quarter of 2021.
▪
Sales increased in Latin America mostly due to higher sales volume led by the impact of changes in dealer inventories and higher end-user demand across the region. Dealers decreased inventories during the third quarter of 2020, compared with an increase during the third quarter of 2021.
▪
In EAME, sales increased due to higher sales volume from the impact of changes in dealer inventories and higher end-user demand. Dealers decreased inventories during the third quarter of 2020, compared with an increase during the third quarter of 2021.
▪
Sales decreased in Asia/Pacific mainly due to lower sales volume, reflecting the impact of changes in dealer inventory. Dealers decreased inventories during the third quarter of 2021, compared with an increase during the third quarter of 2020. Lower sales in China, driven by lower end-user demand and impacts of changes in dealer inventory, were partially offset by increased sales across the rest of the region.
Construction Industries’ profit was $859 million in the third quarter of 2021, an increase of $274 million, or 47 percent, compared with $585 million in the third quarter of 2020. The increase was mainly due to higher sales volume and favorable price realization, partially offset by unfavorable manufacturing costs, which largely reflected higher variable labor and burden, primarily freight, and material costs.
Construction Industries’ profit as a percent of total sales was 16.3 percent in the third quarter of 2021, compared with 14.4 percent in the third quarter of 2020.
Resource Industries
Resource Industries’ total sales were $2.406 billion in the third quarter of 2021, an increase of $590 million, or 32 percent, compared with $1.816 billion in the third quarter of 2020. The increase was primarily due to higher sales volume driven by higher end-user demand for equipment and aftermarket parts, partially offset by the impacts of changes in dealer inventories.
54
Dealers decreased inventories more during the third quarter of 2021 than during the third quarter of 2020. End-user demand was higher in both mining and heavy construction and quarry and aggregates.
Resource Industries’ profit was $297 million in the third quarter of 2021, an increase of $130 million, or 78 percent, compared with $167 million in the third quarter of 2020. The increase was mainly due to higher sales volume and favorable price realization, partially offset by unfavorable manufacturing costs. Increased manufacturing costs reflected higher variable labor and burden, primarily freight, and material costs.
Resource Industries’ profit as a percent of total sales was 12.3 percent in the third quarter of 2021, compared with 9.2 percent in the third quarter of 2020.
Energy & Transportation
| Sales by Application | ||||||||||||||||||||||||||
| (Millions of dollars) | Third Quarter 2021 | Third Quarter 2020 |
$
Change |
%
Change
|
||||||||||||||||||||||
| Oil and Gas | $ | 1,088 | $ | 734 | $ | 354 | 48 | % | ||||||||||||||||||
| Power Generation | 1,010 | 1,034 | (24) | (2 | %) | |||||||||||||||||||||
| Industrial | 948 | 730 | 218 | 30 | % | |||||||||||||||||||||
| Transportation | 1,095 | 977 | 118 | 12 | % | |||||||||||||||||||||
| External Sales | 4,141 | 3,475 | 666 | 19 | % | |||||||||||||||||||||
| Inter-segment | 936 | 686 | 250 | 36 | % | |||||||||||||||||||||
| Total Sales | $ | 5,077 | $ | 4,161 | $ | 916 | 22 | % | ||||||||||||||||||
Energy & Transportation’s total sales were $5.077 billion in the third quarter of 2021, an increase of $916 million, or 22 percent, compared with $4.161 billion in the third quarter of 2020. Sales increased across all applications and inter-segment sales except Power Generation, which decreased slightly.
•
Oil and Gas – Sales increased for reciprocating engines aftermarket parts, primarily in North America, turbines and turbine-related services and reciprocating engines used in gas compression.
•
Power Generation – Sales decreased slightly due to timing of turbines and turbine-related services. Reciprocating engines were about flat compared to the third quarter of 2020, with aftermarket parts slightly higher offset by slightly lower engine sales.
•
Industrial – Sales were up due to higher demand across all regions.
•
Transportation – Sales increased in rail services and marine.
Energy & Transportation’s profit was $696 million in the third quarter of 2021, an increase of $204 million, or 41 percent, compared with $492 million in the third quarter of 2020. The increase was due to higher sales volume, partially offset by unfavorable manufacturing costs and higher SG&A/R&D expenses. Increased manufacturing costs were mainly driven by higher variable labor and burden, primarily freight, period manufacturing costs and material, partially offset by the absence of inventory write-downs that occurred in the third quarter of 2020. In addition, segment profit was favorably impacted by other operating income/expense.
Both SG&A/R&D expenses and period manufacturing costs were driven by higher short-term incentive compensation expense and investments aligned with growth initiatives, including acquisition-related expenses.
Energy & Transportation’s profit as a percent of total sales was 13.7 percent in the third quarter of 2021, compared with 11.8 percent in the third quarter of 2020.
Financial Products Segment
Financial Products’ segment revenues were $762 million in the third quarter of 2021, an increase of $38 million, or 5 percent, from the third quarter of 2020.
Financial Products’ segment profit was $173 million in the third quarter of 2021, an increase of $31 million, or 22 percent, compared with $142 million in the third quarter of 2020. The increase was mainly due to a favorable impact from returned or repossessed equipment, lower provision for credit losses at Cat Financial and higher net yield on average
earning assets
. These favorable impacts were partially offset by an increase in SG&A expenses primarily due to higher short-term incentive compensation expense.
55
At the end of the third quarter of 2021, past dues at Cat Financial were 2.41 percent, compared with 3.81 percent at the end of the third quarter of 2020. Past dues decreased across all portfolio segments as global markets generally improved. Write-offs, net of recoveries, were $76 million for the third quarter of 2021, compared with $125 million for the third quarter of 2020. As of September 30, 2021, Cat Financial's allowance for credit losses totaled $378 million, or 1.41 percent of finance receivables, compared with $402 million, or 1.46 percent of finance receivables, at June 30, 2021. The allowance for credit losses at year-end 2020 was $479 million, or 1.77 percent of finance receivables.
Corporate Items and Eliminations
Expense for corporate items and eliminations was $293 million in the third quarter of 2021, a decrease of $68 million from the third quarter of 2020. Higher corporate costs were more than offset by lower restructuring costs, favorable impacts of segment methodology differences and a favorable change in fair value adjustments related to deferred compensation plans.
56
NINE MONTHS ENDED SEPTEMBER 30, 2021 COMPARED WITH NINE MONTHS ENDED SEPTEMBER 30, 2020
CONSOLIDATED SALES AND REVENUES
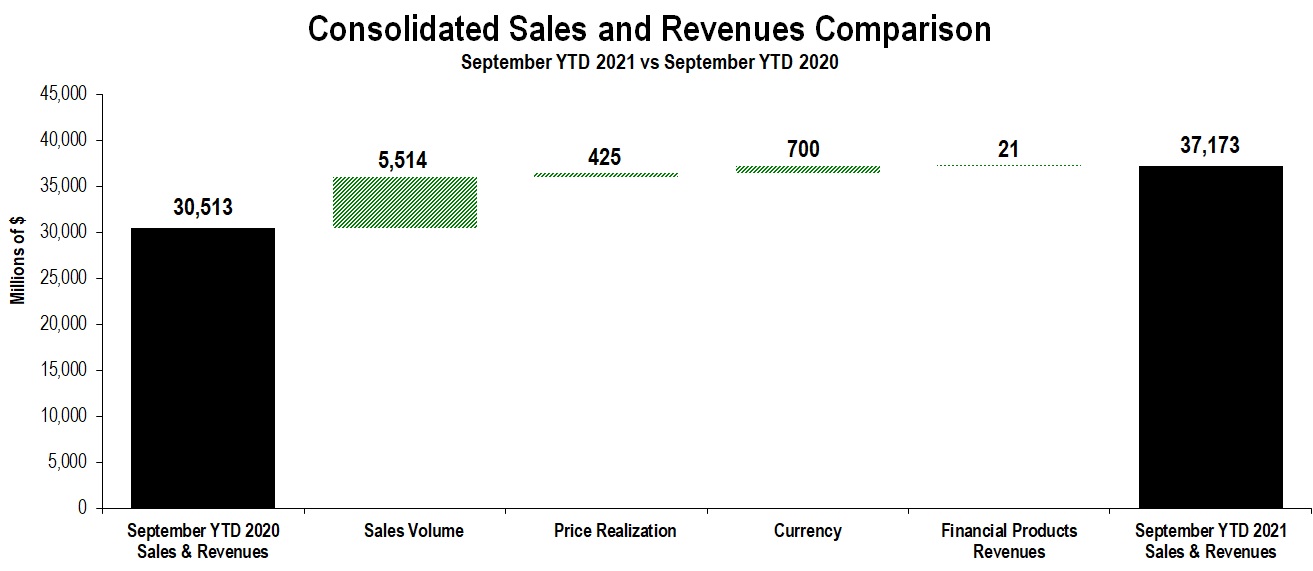
The chart above graphically illustrates reasons for the change in consolidated sales and revenues between the nine months ended September 30, 2020 (at left) and the nine months ended September 30, 2021 (at right). Caterpillar management utilizes these charts internally to visually communicate with the company’s Board of Directors and employees.
Total sales and revenues were $37.173 billion for the nine months ended September 30, 2021, an increase of $6.660 billion, or 22 percent, compared with $30.513 billion for the nine months ended September 30, 2020. The increase was primarily due to higher sales volume driven by higher end-user demand for equipment and services and the impact from changes in dealer inventories. Dealers decreased inventories about $1.8 billion during the nine months ended September 30, 2020, compared with remaining about flat during the nine months ended September 30, 2021. Favorable currency impacts related to the euro, Australian dollar and Chinese yuan also contributed to the sales improvement, along with favorable price realization.
Sales were higher in the three primary segments and across all regions.
North America sales increased 21 percent driven by higher end-user demand for equipment and services and the impact from changes in dealer inventories. Dealers decreased inventories more during the nine months ended September 30, 2020, than during the nine months ended September 30, 2021.
Sales increased 57 percent in Latin America due to higher end-user demand for equipment and services and the impact from changes in dealer inventories. Dealers decreased inventories during the nine months ended September 30, 2020, compared with an increase during the nine months ended September 30, 2021.
EAME sales increased 24 percent due to higher end-user demand for equipment and services, the impact from changes in dealer inventories and favorable currency impacts related to a stronger euro and British pound. Dealers increased inventories more during the nine months ended September 30, 2021, than during the nine months ended September 30, 2020.
Asia/Pacific sales increased 17 percent driven by higher end-user demand for equipment and services, the impact from changes in dealer inventories and favorable currency impacts related to a stronger Australian dollar and Chinese yuan. Dealers decreased inventories more during the nine months ended September 30, 2020, than during the nine months ended September 30, 2021.
Dealers decreased inventories about $1.8 billion during the nine months ended September 30, 2020, compared with remaining about flat during the nine months ended September 30, 2021. Dealers are independent, and the reasons for changes in their inventory levels vary, including their expectations of future demand and product delivery times. Dealers’ demand expectations take into account seasonal changes, macroeconomic conditions, machine rental rates and other factors. Delivery times can vary based on availability of product from Caterpillar factories and product distribution centers. We do not expect a significant dealer inventory increase in 2021.
57
| Sales and Revenues by Segment | |||||||||||||||||||||||||||||||||||||||||||||||
| (Millions of dollars) | Nine Months Ended September 30, 2020 |
Sales
Volume |
Price
Realization |
Currency | Inter-Segment / Other | Nine Months Ended September 30, 2021 |
$
Change |
%
Change |
|||||||||||||||||||||||||||||||||||||||
| Construction Industries | $ | 12,410 | $ | 3,134 | $ | 433 | $ | 346 | $ | 47 | $ | 16,370 | $ | 3,960 | 32 | % | |||||||||||||||||||||||||||||||
| Resource Industries | 5,726 | 1,366 | (21) | 121 | 9 | 7,201 | 1,475 | 26 | % | ||||||||||||||||||||||||||||||||||||||
| Energy & Transportation | 12,659 | 1,043 | 13 | 229 | 615 | 14,559 | 1,900 | 15 | % | ||||||||||||||||||||||||||||||||||||||
| All Other Segment | 330 | 23 | (1) | 4 | 21 | 377 | 47 | 14 | % | ||||||||||||||||||||||||||||||||||||||
| Corporate Items and Eliminations | (2,673) | (52) | 1 | — | (692) | (3,416) | (743) | ||||||||||||||||||||||||||||||||||||||||
| Machinery, Energy & Transportation Sales | 28,452 | 5,514 | 425 | 700 | — | 35,091 | 6,639 | 23 | % | ||||||||||||||||||||||||||||||||||||||
| Financial Products Segment | 2,301 | — | — | — | (4) | 2,297 | (4) | — | % | ||||||||||||||||||||||||||||||||||||||
| Corporate Items and Eliminations | (240) | — | — | — | 25 | (215) | 25 | ||||||||||||||||||||||||||||||||||||||||
| Financial Products Revenues | 2,061 | — | — | — | 21 | 2,082 | 21 | 1 | % | ||||||||||||||||||||||||||||||||||||||
| Consolidated Sales and Revenues | $ | 30,513 | $ | 5,514 | $ | 425 | $ | 700 | $ | 21 | $ | 37,173 | $ | 6,660 | 22 | % | |||||||||||||||||||||||||||||||
| Sales and Revenues by Geographic Region | ||
| North America | Latin America | EAME | Asia/Pacific | External Sales and Revenues | Inter-Segment | Total Sales and Revenues | |||||||||||||||||||||||||||||||||||||||||||||||||||||||||||||||||||||||||||||
| (Millions of dollars) | $ | % Chg | $ | % Chg | $ | % Chg | $ | % Chg | $ | % Chg | $ | % Chg | $ | % Chg | |||||||||||||||||||||||||||||||||||||||||||||||||||||||||||||||||||||
| Nine Months Ended September 30, 2021 | |||||||||||||||||||||||||||||||||||||||||||||||||||||||||||||||||||||||||||||||||||
| Construction Industries | $ | 7,041 | 29 | % | $ | 1,350 | 91 | % | $ | 3,612 | 38 | % | $ | 4,302 | 20 | % | $ | 16,305 | 32 | % | $ | 65 | 261 | % | $ | 16,370 | 32 | % | |||||||||||||||||||||||||||||||||||||||||||||||||||||||
| Resource Industries | 2,130 | 26 | % | 1,309 | 52 | % | 1,455 | 26 | % | 1,965 | 17 | % | 6,859 | 27 | % | 342 | 3 | % | 7,201 | 26 | % | ||||||||||||||||||||||||||||||||||||||||||||||||||||||||||||||
| Energy & Transportation | 5,698 | 11 | % | 835 | 25 | % | 3,433 | 11 | % | 1,953 | 13 | % | 11,919 | 12 | % | 2,640 | 30 | % | 14,559 | 15 | % | ||||||||||||||||||||||||||||||||||||||||||||||||||||||||||||||
| All Other Segment | 42 | 91 | % | 1 | (75 | %) | 10 | (41 | %) | 54 | 42 | % | 107 | 32 | % | 270 | 8 | % | 377 | 14 | % | ||||||||||||||||||||||||||||||||||||||||||||||||||||||||||||||
| Corporate Items and Eliminations | (89) | (1) | (1) | (8) | (99) | (3,317) | (3,416) | ||||||||||||||||||||||||||||||||||||||||||||||||||||||||||||||||||||||||||||
| Machinery, Energy & Transportation Sales | 14,822 | 21 | % | 3,494 | 57 | % | 8,509 | 24 | % | 8,266 | 17 | % | 35,091 | 23 | % | — | — | % | 35,091 | 23 | % | ||||||||||||||||||||||||||||||||||||||||||||||||||||||||||||||
| Financial Products Segment | 1,442 | (2 | %) | 195 | 1 | % | 301 | 1 | % | 359 | 4 | % | 2,297 |
1
|
— | % | — | — | % | 2,297 | — | % | |||||||||||||||||||||||||||||||||||||||||||||||||||||||||||||
| Corporate Items and Eliminations | (99) | (35) | (26) | (55) | (215) | — | (215) | ||||||||||||||||||||||||||||||||||||||||||||||||||||||||||||||||||||||||||||
| Financial Products Revenues | 1,343 | 1 | % | 160 | (1 | %) | 275 | 2 | % | 304 | 2 | % | 2,082 | 1 | % | — | — | % | 2,082 | 1 | % | ||||||||||||||||||||||||||||||||||||||||||||||||||||||||||||||
| Consolidated Sales and Revenues | $ | 16,165 | 19 | % | $ | 3,654 | 53 | % | $ | 8,784 | 23 | % | $ | 8,570 | 17 | % | $ | 37,173 | 22 | % | $ | — | — | % | $ | 37,173 | 22 | % | |||||||||||||||||||||||||||||||||||||||||||||||||||||||
| Nine Months Ended September 30, 2020 | |||||||||||||||||||||||||||||||||||||||||||||||||||||||||||||||||||||||||||||||||||
| Construction Industries | $ | 5,470 | $ | 707 | $ | 2,618 | $ | 3,597 | $ | 12,392 | $ | 18 | $ | 12,410 | |||||||||||||||||||||||||||||||||||||||||||||||||||||||||||||||||||||
| Resource Industries | 1,690 | 859 | 1,158 | 1,686 | 5,393 | 333 | 5,726 | ||||||||||||||||||||||||||||||||||||||||||||||||||||||||||||||||||||||||||||
| Energy & Transportation | 5,138 | 667 | 3,095 | 1,734 | 10,634 | 2,025 | 12,659 | ||||||||||||||||||||||||||||||||||||||||||||||||||||||||||||||||||||||||||||
| All Other Segment | 22 | 4 | 17 | 38 | 81 | 249 | 330 | ||||||||||||||||||||||||||||||||||||||||||||||||||||||||||||||||||||||||||||
| Corporate Items and Eliminations | (35) | (5) | (4) | (4) | (48) | (2,625) | (2,673) | ||||||||||||||||||||||||||||||||||||||||||||||||||||||||||||||||||||||||||||
| Machinery, Energy & Transportation Sales | 12,285 | 2,232 | 6,884 | 7,051 | 28,452 | — | 28,452 | ||||||||||||||||||||||||||||||||||||||||||||||||||||||||||||||||||||||||||||
| Financial Products Segment | 1,466 | 193 | 298 | 344 | 2,301 |
1
|
— | 2,301 | |||||||||||||||||||||||||||||||||||||||||||||||||||||||||||||||||||||||||||
| Corporate Items and Eliminations | (134) | (31) | (28) | (47) | (240) | — | (240) | ||||||||||||||||||||||||||||||||||||||||||||||||||||||||||||||||||||||||||||
| Financial Products Revenues | 1,332 | 162 | 270 | 297 | 2,061 | — | 2,061 | ||||||||||||||||||||||||||||||||||||||||||||||||||||||||||||||||||||||||||||
| Consolidated Sales and Revenues | $ | 13,617 | $ | 2,394 | $ | 7,154 | $ | 7,348 | $ | 30,513 | $ | — | $ | 30,513 | |||||||||||||||||||||||||||||||||||||||||||||||||||||||||||||||||||||
1
Includes revenues from Machinery, Energy & Transportation of $263 million and $274 million in the nine months ended September 30, 2021 and 2020, respectively.
58
CONSOLIDATED OPERATING PROFIT
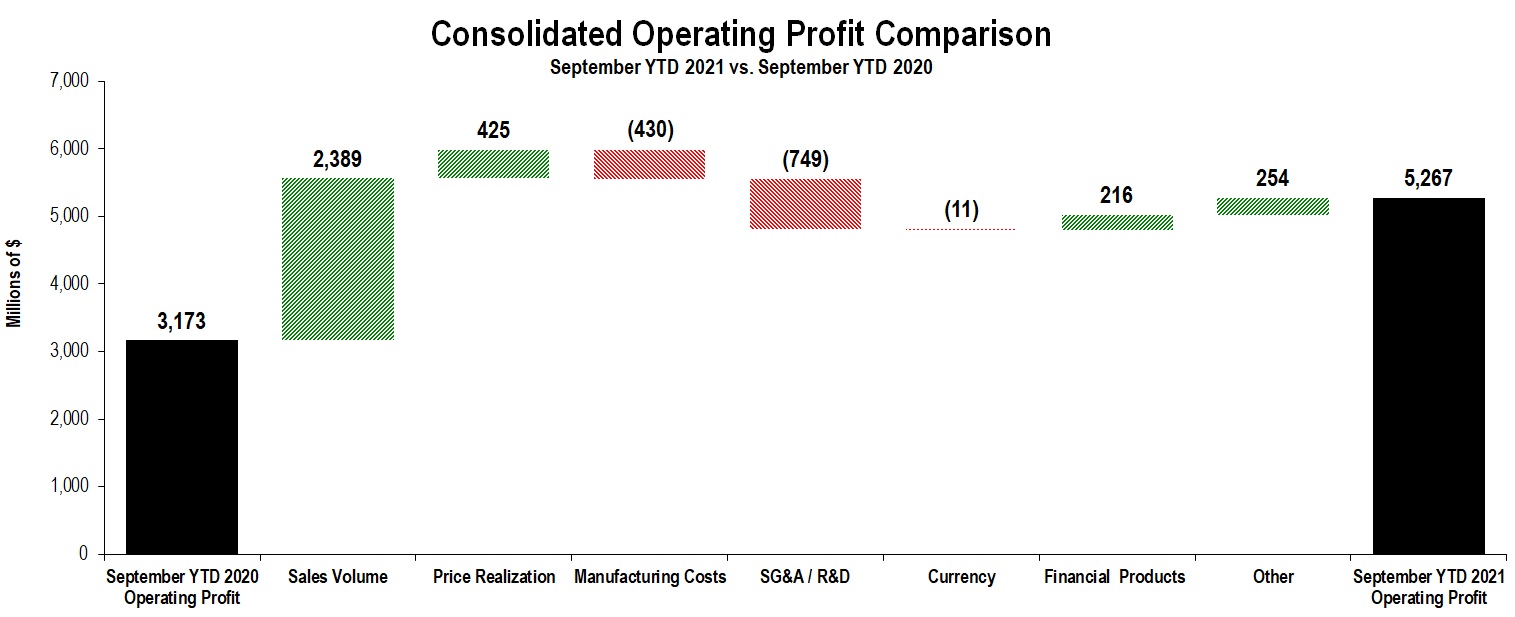
The chart above graphically illustrates reasons for the change in consolidated operating profit between the nine months ended September 30, 2020 (at left) and the nine months ended September 30, 2021 (at right). Caterpillar management utilizes these charts internally to visually communicate with the company’s Board of Directors and employees. The bar titled Other includes consolidating adjustments and Machinery, Energy & Transportation’s other operating (income) expenses.
Operating profit for the nine months ended September 30, 2021, was $5.267 billion, an increase of $2.094 billion, or 66 percent, compared with $3.173 billion for the nine months ended September 30, 2020. The increase was due to higher sales volume, favorable price realization, lower restructuring expenses (included in other) and higher profit from Financial Products, partially offset by higher SG&A/R&D expenses and unfavorable manufacturing costs.
The increase in SG&A/R&D expenses was driven by higher short-term incentive compensation expense, which was reinstated in 2021.
Unfavorable manufacturing costs reflected increased period manufacturing costs primarily due to higher short-term incentive compensation expense and higher labor-related costs. Higher variable labor and burden, primarily freight, and higher material costs were mostly offset by favorable cost absorption and lower warranty expense. Cost absorption was favorable as inventory increased more during the nine months ended September 30, 2021, than during the nine months ended September 30, 2020.
Short-term incentive compensation expense, which was reinstated in 2021, was $1.1 billion for the nine months ended September 30, 2021, compared to no short-term incentive compensation expense recognized for the nine months ended September 30, 2020. For 2021, short-term incentive compensation expense is expected to be about $1.4 billion, compared to no short-term incentive compensation expense recognized in 2020. Short-term incentive compensation expense is directly related to financial and operational performance, measured against targets set annually.
Operating profit margin was 14.2 percent for the nine months ended September 30, 2021, compared with 10.4 percent for the nine months ended September 30, 2020.
| Profit by Segment | |||||||||||||||||||||||
| (Millions of dollars) | Nine Months Ended September 30, 2021 | Nine Months Ended September 30, 2020 |
$
Change |
%
Change
|
|||||||||||||||||||
| Construction Industries | $ | 2,918 | $ | 1,743 | $ | 1,175 | 67 | % | |||||||||||||||
| Resource Industries | 986 | 623 | 363 | 58 | % | ||||||||||||||||||
| Energy & Transportation | 2,093 | 1,718 | 375 | 22 | % | ||||||||||||||||||
| All Other Segment | (2) | 31 | (33) | n/a | |||||||||||||||||||
| Corporate Items and Eliminations | (1,107) | (1,100) | (7) | ||||||||||||||||||||
| Machinery, Energy & Transportation | 4,888 | 3,015 | 1,873 | 62 | % | ||||||||||||||||||
| Financial Products Segment | 660 | 395 | 265 | 67 | % | ||||||||||||||||||
| Corporate Items and Eliminations | (55) | (6) | (49) | ||||||||||||||||||||
| Financial Products | 605 | 389 | 216 | 56 | % | ||||||||||||||||||
| Consolidating Adjustments | (226) | (231) | 5 | ||||||||||||||||||||
| Consolidated Operating Profit | $ | 5,267 | $ | 3,173 | $ | 2,094 | 66 | % | |||||||||||||||
59
Other Profit/Loss and Tax Items
▪
Interest expense excluding Financial Products for the nine months ended September 30, 2021, was $376 million, compared with $384 million for the nine months ended September 30, 2020. The decrease was due to lower average debt outstanding during the nine months ended September 30, 2021, compared with the nine months ended September 30, 2020.
▪
Other income/expense for the nine months ended September 30, 2021, was income of $751 million, compared with income of $265 million for the nine months ended September 30, 2020. The change was primarily due to favorable impacts from foreign currency exchange gains (losses), favorable OPEB plan costs and favorable impacts from unrealized gains (losses) on marketable securities.
The company experienced foreign currency exchange net gains in the nine months ended September 30, 2021, compared with net losses in the nine months ended September 30, 2020. The favorable impact of unrealized gains (losses) on marketable securities was due to unrealized gains in the nine months ended September 30, 2021, compared with unrealized losses in the nine months ended September 30, 2020.
▪
The provision for income taxes for the nine months ended September 30, 2021 reflected an estimated annual tax rate of 25 percent, compared with 31 percent for the nine months ended September 30, 2020, excluding the discrete items discussed in the following paragraph. The comparative tax rate for full-year 2020 was approximately 28 percent. The decrease in the estimated annual tax rate from full-year 2020 was primarily related to changes in the expected geographic mix of profits from a tax perspective for 2021.
In addition, we recorded a discrete tax benefit of $61 million for the nine months ended September 30, 2021, compared with $21 million for the nine months ended September 30, 2020, for the settlement of stock-based compensation awards with associated tax deductions in excess of cumulative U.S. GAAP compensation expense. The company also recorded a discrete tax benefit of $36 million to reflect changes in estimates related to prior year U.S. taxes for the nine months ended September 30, 2021, compared to $80 million for the nine months ended September 30, 2020. Finally, we recorded a $10 million tax charge related to the $55 million of remeasurement net gain resulting from the settlements of pension obligations for the nine months ended September 30, 2020.
Construction Industries
Construction Industries’ total sales were $16.370 billion for the nine months ended September 30, 2021, an increase of $3.960 billion, or 32 percent, compared with $12.410 billion for the nine months ended September 30, 2020. The increase was due to higher sales volume, favorable price realization and favorable currency impacts related to the euro, Chinese yuan and Australian dollar. The increase in sales volume was driven by higher end-user demand for equipment and aftermarket parts and the impact from changes in dealer inventories. Dealers decreased inventories during the nine months ended September 30, 2020, compared with an increase during the nine months ended September 30, 2021.
•
In North America, sales increased due to higher end-user demand, the impact from changes in dealer inventories and favorable price realization. Dealers decreased inventories more during the nine months ended September 30, 2020, than during the nine months ended September 30, 2021.
•
Sales increased in Latin America primarily due to the impact from changes in dealer inventories and higher end-user demand. Dealers decreased inventories during the nine months ended September 30, 2020, compared with an increase during the nine months ended September 30, 2021.
•
In EAME, sales increased due to higher end-user demand, the impact from changes in dealer inventories and favorable currency impacts from a stronger euro and British pound. Dealers increased inventories more during the nine months ended September 30, 2021, than during the nine months ended September 30, 2020.
•
Sales increased in Asia/Pacific due to higher end-user demand for equipment and aftermarket parts, favorable currency impacts related to the Chinese yuan and Australian dollar and the impact from changes in dealer inventories. Dealers decreased inventories more during the nine months ended September 30, 2020, than during the nine months ended September 30, 2021.
Construction Industries’ profit was $2.918 billion for the nine months ended September 30, 2021, an increase of $1.175 billion, or 67 percent, compared with $1.743 billion for the nine months ended September 30, 2020. The increase was mainly due to higher sales volume and favorable price realization, partially offset by unfavorable manufacturing costs and higher SG&A/R&D expenses.
Unfavorable manufacturing costs reflected higher period manufacturing costs and material. The increase in period manufacturing costs was driven by higher short-term incentive compensation expense and higher labor costs. Higher SG&A/R&D expenses were driven primarily by higher short-term incentive compensation expense, partially offset by other cost reductions.
60
Construction Industries’ profit as a percent of total sales was 17.8 percent for the nine months ended September 30, 2021, compared with 14.0 percent for the nine months ended September 30, 2020.
Resource Industries
Resource Industries’ total sales were $7.201 billion for the nine months ended September 30, 2021, an increase of $1.475 billion, or 26 percent, compared with $5.726 billion for the nine months ended September 30, 2020. The increase was due to higher sales volume driven by higher end-user demand for equipment and aftermarket parts and the impact from changes in dealer inventories. Dealers decreased inventories more during the nine months ended September 30, 2020, than during the nine months ended September 30, 2021. End-user demand was higher in mining, as well as heavy construction and quarry and aggregates.
Resource Industries’ profit was $986 million for the nine months ended September 30, 2021, an increase of $363 million, or 58 percent, compared with $623 million for the nine months ended September 30, 2020. The increase was mainly due to higher sales volume, partially offset by higher SG&A/R&D expenses. The increase in SG&A/R&D expenses was driven by higher short-term incentive compensation expense.
Resource Industries’ profit as a percent of total sales was 13.7 percent for the nine months ended September 30, 2021, compared with 10.9 percent for the nine months ended September 30, 2020.
Energy & Transportation
| Sales by Application | ||||||||||||||||||||||||||
| (Millions of dollars) | Nine Months Ended September 30, 2021 | Nine Months Ended September 30, 2020 |
$
Change |
%
Change |
||||||||||||||||||||||
| Oil and Gas | $ | 3,140 | $ | 2,622 | $ | 518 | 20 | % | ||||||||||||||||||
| Power Generation | 3,025 | 2,783 | 242 | 9 | % | |||||||||||||||||||||
| Industrial | 2,660 | 2,209 | 451 | 20 | % | |||||||||||||||||||||
| Transportation | 3,094 | 3,020 | 74 | 2 | % | |||||||||||||||||||||
| External Sales | 11,919 | 10,634 | 1,285 | 12 | % | |||||||||||||||||||||
| Inter-Segment | 2,640 | 2,025 | 615 | 30 | % | |||||||||||||||||||||
| Total Sales | $ | 14,559 | $ | 12,659 | $ | 1,900 | 15 | % | ||||||||||||||||||
Energy & Transportation’s total sales were $14.559 billion for the nine months ended September 30, 2021, an increase of $1.900 billion, or 15 percent, compared with $12.659 billion for the nine months ended September 30, 2020. Sales increased across all applications.
•
Oil and Gas – Sales increased mainly due to higher sales of reciprocating engine aftermarket parts in all regions as well as higher sales in turbines and turbine related services.
•
Power Generation – Sales increased due to higher sales in large reciprocating engines, primarily datacenters, and aftermarket parts. Sales also increased due to favorable currency impacts.
•
Industrial – Sales were up due to higher demand across all regions.
•
Transportation – Sales increased slightly due to favorable currency impacts and marine. The increase was partially offset by lower sales of locomotives and related services.
Energy & Transportation’s profit was $2.093 billion for the nine months ended September 30, 2021, an increase of $375 million, or 22 percent, compared with $1.718 billion for the nine months ended September 30, 2020. The increase was due to higher sales volume, partially offset by higher SG&A/R&D expenses and unfavorable manufacturing costs. Increased manufacturing costs were mainly driven by higher period manufacturing costs and higher variable labor and burden, primarily freight, partially offset by the absence of inventory write-downs that occurred in the third quarter of 2020. In addition, segment profit was favorably impacted by other operating income/expense.
The increase in both SG&A/R&D expenses and period manufacturing costs was primarily due to higher short-term incentive compensation expense and acquisition-related expenses.
Energy & Transportation’s profit as a percent of total sales was 14.4 percent for the nine months ended September 30, 2021, compared with 13.6 percent for the nine months ended September 30, 2020.
61
Financial Products Segment
Financial Products’ segment revenues were $2.297 billion for the nine months ended September 30, 2021, a decrease of $4 million from the nine months ended September 30, 2020.
Financial Products’ segment profit was $660 million for the nine months ended September 30, 2021, an increase of $265 million, or 67 percent, compared with $395 million for the nine months ended September 30, 2020. The increase was primarily due to lower provision for credit losses at Cat Financial, a favorable impact from equity securities in Insurance Services, a favorable impact from returned or repossessed equipment and higher net yield on average earning assets. These favorable impacts were partially offset by an increase in SG&A expenses primarily due to higher short-term incentive compensation expense.
Corporate Items and Eliminations
Expense for corporate items and eliminations was $1.162 billion in the nine months ended September 30, 2021, an increase of $56 million from the nine months ended September 30, 2020. Favorable impacts of segment reporting methodology differences and lower restructuring costs were more than offset by higher corporate costs, higher expenses due to timing differences and an unfavorable change in fair value adjustments related to deferred compensation plans.
RESTRUCTURING COSTS
We expect to incur from $150 million to $200 million of restructuring costs in 2021. We expect that prior restructuring actions will result in an incremental benefit to operating costs, primarily Cost of goods sold and SG&A expenses of about $200 million in 2021 compared with 2020.
Additional information related to restructuring costs is included in Note 20 - "Restructuring Costs" of Part I, Item 1 "Financial Statements".
GLOSSARY OF TERMS
1.
Adjusted Operating Profit Margin
– Operating profit excluding restructuring costs as a percent of sales and revenues.
2.
Adjusted Profit Per Share
– Profit per share excluding remeasurement gains/losses resulting from the settlements of pension obligations in 2020 and restructuring costs.
3.
All Other Segment
– Primarily includes activities such as: business strategy; product management and development; manufacturing and sourcing of filters and fluids, undercarriage, ground-engaging tools, fluid transfer products, precision seals, rubber sealing and connecting components primarily for Cat® products; parts distribution; integrated logistics solutions; distribution services responsible for dealer development and administration, including a wholly owned dealer in Japan; dealer portfolio management and ensuring the most efficient and effective distribution of machines, engines and parts; brand management and marketing strategy; and digital investments for new customer and dealer solutions that integrate data analytics with state-of-the-art digital technologies while transforming the buying experience.
4.
Consolidating Adjustments
– Elimination of transactions between Machinery, Energy & Transportation and Financial Products.
5.
Construction Industries
– A segment primarily responsible for supporting customers using machinery in infrastructure and building construction applications. Responsibilities include business strategy, product design, product management and development, manufacturing, marketing and sales and product support. The product portfolio includes asphalt pavers; backhoe loaders; compactors; cold planers; compact track and multi-terrain loaders; mini, small, medium and large track excavators; motor graders; pipelayers; road reclaimers; skid steer loaders; telehandlers; small and medium track-type tractors; track-type loaders; utility vehicles; wheel excavators; compact, small and medium wheel loaders; and related parts and work tools.
6.
Corporate Items and Eliminations
– Includes corporate-level expenses, timing differences (as some expenses are reported in segment profit on a cash basis), methodology differences between segment and consolidated external reporting, certain restructuring costs, and inter-segment eliminations.
62
7.
Currency
– With respect to sales and revenues, currency represents the translation impact on sales resulting from changes in foreign currency exchange rates versus the U.S. dollar. With respect to operating profit, currency represents the net translation impact on sales and operating costs resulting from changes in foreign currency exchange rates versus the U.S. dollar. Currency only includes the impact on sales and operating profit for the Machinery, Energy & Transportation lines of business; currency impacts on Financial Products revenues and operating profit are included in the Financial Products portions of the respective analyses. With respect to other income/expense, currency represents the effects of forward and option contracts entered into by the company to reduce the risk of fluctuations in exchange rates (hedging) and the net effect of changes in foreign currency exchange rates on our foreign currency assets and liabilities for consolidated results (translation).
8.
Dealer Inventories
– Represents dealer machine and engine inventories, excluding aftermarket parts.
9.
EAME
– A geographic region including Europe, Africa, the Middle East and the Commonwealth of Independent States (CIS).
10.
Earning Assets
– Assets consisting primarily of total finance receivables net of unearned income, plus equipment on operating leases, less accumulated depreciation at Cat Financial.
11.
Energy & Transportation
– A segment primarily responsible for supporting customers using reciprocating engines, turbines, diesel-electric locomotives and related services across industries serving Oil and Gas, Power Generation, Industrial and Transportation applications, including marine- and rail-related businesses. Responsibilities include business strategy, product design, product management and development, manufacturing, marketing and sales and product support. The product and services portfolio includes turbines, centrifugal gas compressors, and turbine-related services; reciprocating engine-powered generator sets; integrated systems used in the electric power generation industry; reciprocating engines and integrated systems and solutions for the marine and oil and gas industries; reciprocating engines supplied to the industrial industry as well as Cat machinery; and diesel-electric locomotives and components and other rail-related products and services, including remanufacturing and leasing. Responsibilities also include the remanufacturing of Caterpillar reciprocating engines and components and remanufacturing services for other companies; and product support of on-highway vocational trucks for North America.
12.
Financial Products
– The company defines Financial Products as our finance and insurance subsidiaries, primarily Caterpillar Financial Services Corporation (Cat Financial) and Caterpillar Insurance Holdings Inc. (Insurance Services). Financial Products’ information relates to the financing to customers and dealers for the purchase and lease of Caterpillar and other equipment.
13.
Financial Products Segment
– Provides financing alternatives to customers and dealers around the world for Caterpillar products, as well as financing for vehicles, power generation facilities and marine vessels that, in most cases, incorporate Caterpillar products. Financing plans include operating and finance leases, installment sale contracts, repair/rebuild financing, working capital loans and wholesale financing plans. The segment also provides insurance and risk management products and services that help customers and dealers manage their business risk. Insurance and risk management products offered include physical damage insurance, inventory protection plans, extended service coverage and maintenance plans for machines and engines, and dealer property and casualty insurance. The various forms of financing, insurance and risk management products offered to customers and dealers help support the purchase and lease of Caterpillar equipment. The segment also earns revenues from Machinery, Energy & Transportation, but the related costs are not allocated to operating segments. Financial Products’ segment profit is determined on a pretax basis and includes other income/expense items.
14.
Latin America
– A geographic region including Central and South American countries and Mexico.
15.
Machinery, Energy & Transportation (ME&T)
– The company defines ME&T as Caterpillar Inc. and its subsidiaries, excluding Financial Products. ME&T’s information relates to the design, manufacturing and marketing of its products.
16.
Machinery, Energy & Transportation Other Operating (Income) Expenses
– Comprised primarily of gains/losses on disposal of long-lived assets, gains/losses on divestitures and legal settlements, and accruals.
17.
Manufacturing Costs
– Manufacturing costs exclude the impacts of currency and represent the volume-adjusted change for variable costs and the absolute dollar change for period manufacturing costs. Variable manufacturing costs are defined as having a direct relationship with the volume of production. This includes material costs, direct labor and other costs that vary directly with production volume, such as freight, power to operate machines and supplies that are consumed in the manufacturing process. Period manufacturing costs support production but are defined as generally not having a direct relationship to short-term changes in volume. Examples include machinery and equipment repair, depreciation on manufacturing assets, facility support, procurement, factory scheduling, manufacturing planning and operations management.
63
18.
Mark-to-market gains/losses
– Represents the net gain or loss of actual results differing from the company’s assumptions and the effects of changing assumptions for our defined benefit pension and OPEB plans. These gains and losses are immediately recognized through earnings upon the annual remeasurement in the fourth quarter, or on an interim basis as triggering events warrant remeasurement.
19.
Pension and Other Postemployment Benefit (OPEB)
– The company’s defined-benefit pension and postretirement benefit plans.
20.
Price Realization
– The impact of net price changes excluding currency and new product introductions. Price realization includes geographic mix of sales, which is the impact of changes in the relative weighting of sales prices between geographic regions.
21.
Resource Industries
– A segment primarily responsible for supporting customers using machinery in mining, heavy construction and quarry and aggregates. Responsibilities include business strategy, product design, product management and development, manufacturing, marketing and sales and product support. The product portfolio includes large track-type tractors; large mining trucks; hard rock vehicles; longwall miners; electric rope shovels; draglines; hydraulic shovels; rotary drills; large wheel loaders; off-highway trucks; articulated trucks; wheel tractor scrapers; wheel dozers; landfill compactors; soil compactors; select work tools; machinery components; electronics and control systems and related parts. In addition to equipment, Resource Industries also develops and sells technology products and services to provide customers fleet management, equipment management analytics, autonomous machine capabilities, safety services and mining performance solutions. Resource Industries also manages areas that provide services to other parts of the company, including integrated manufacturing, research and development for drivetrains, hydraulic systems, electronics and software for Cat machines and engines.
22.
Restructuring Costs
– May include costs for employee separation, long-lived asset impairments and contract terminations. These costs are included in Other operating (income) expenses except for defined-benefit plan curtailment losses and special termination benefits, which are included in Other income (expense). Restructuring costs also include other exit-related costs, which may consist of accelerated depreciation, inventory write-downs, building demolition, equipment relocation and project management costs and LIFO inventory decrement benefits from inventory liquidations at closed facilities, all of which are primarily included in Cost of goods sold.
23.
Sales Volume
– With respect to sales and revenues, sales volume represents the impact of changes in the quantities sold for Machinery, Energy & Transportation as well as the incremental sales impact of new product introductions, including emissions-related product updates. With respect to operating profit, sales volume represents the impact of changes in the quantities sold for Machinery, Energy & Transportation combined with product mix as well as the net operating profit impact of new product introductions, including emissions-related product updates. Product mix represents the net operating profit impact of changes in the relative weighting of Machinery, Energy & Transportation sales with respect to total sales. The impact of sales volume on segment profit includes inter-segment sales.
24.
Services
– Enterprise services include, but are not limited to, aftermarket parts, Financial Products revenues and other service-related revenues. Machinery, Energy & Transportation segments exclude most Financial Products revenues.
LIQUIDITY AND CAPITAL RESOURCES
Sources of funds
We generate significant capital resources from operating activities, which are the primary source of funding for our ME&T operations. Funding for these businesses is also available from commercial paper and long-term debt issuances. Financial Products’ operations are funded primarily from commercial paper, term debt issuances and collections from its existing portfolio. We had positive operating cash flow in the first nine months of 2021 within both our ME&T and Financial Products' operations. On a consolidated basis, we ended the first nine months of 2021 with $9.45 billion of cash, an increase of $94 million from year-end 2020. We intend to maintain a strong cash and liquidity position.
Consolidated operating cash flow for the first nine months of 2021 was $5.79 billion, up $1.53 billion compared to the same period last year. The increase was primarily due to higher profit before taxes adjusted for non-cash items, including higher accruals for short-term incentive compensation. In addition, lower payments for short-term incentive compensation favorably impacted cash flow. Partially offsetting these items were increased working capital requirements during the first nine months of 2021 compared to the same period last year. Within working capital, changes in inventory and accounts receivable unfavorably impacted cash flow but were partially offset by favorable changes in accounts payable and accrued expenses.
64
Total debt as of September 30, 2021 was $36.78 billion, a decrease of $379 million from year-end 2020. Debt related to ME&T decreased $1.37 billion in the first nine months of 2021 due to the repayment of debt. In addition, during the first quarter of 2021, we issued $500 million of ten-year bonds at 1.9 percent and utilized the net proceeds to redeem all of our $500 million 2.6 percent notes due in 2022. Debt related to Financial Products increased $993 million, primarily due to an increase in commercial paper due to short term funding needs.
As of September 30, 2021, we had three global credit facilities with a syndicate of banks totaling $10.50 billion (Credit Facility) available in the aggregate to both Caterpillar and Cat Financial for general liquidity purposes. Based on management’s allocation decision, which can be revised from time to time, the portion of the Credit Facility available to ME&T as of September 30, 2021 was $2.75 billion. Information on our Credit Facility is as follows:
•
In September 2021, we entered into a new 364-day facility. The 364-day facility of $3.15 billion (of which $824 million is available to ME&T) expires in September 2022.
•
In September 2021, we amended and restated the three-year facility (as amended and restated, the "three-year facility"). The three-year facility of $2.73 billion (of which $715 million is available to ME&T) expires in September 2024.
•
In September 2021, we amended and restated the five-year facility (as amended and restated, the "five-year facility"). The five-year facility of $4.62 billion (of which $1.21 billion is available to ME&T) expires in September 2026.
At September 30, 2021, Caterpillar’s consolidated net worth was $16.75 billion, which was above the $9.00 billion required under the Credit Facility. The consolidated net worth is defined in the Credit Facility as the consolidated shareholders’ equity including preferred stock but excluding the pension and other postretirement benefits balance within Accumulated other comprehensive income (loss).
At September 30, 2021, Cat Financial’s covenant interest coverage ratio was 2.31 to 1. This was above the 1.15 to 1 minimum ratio calculated as (1) profit excluding income taxes, interest expense and net gain (loss) from interest rate derivatives to (2) interest expense calculated at the end of each calendar quarter for the rolling four quarter period then most recently ended, required by the Credit Facility.
In addition, at September 30, 2021, Cat Financial’s six-month covenant leverage ratio was 7.06 to 1. This was below the maximum ratio of debt to net worth of 10 to 1, calculated (1) on a monthly basis as the average of the leverage ratios determined on the last day of each of the six preceding calendar months and (2) at each December 31, required by the Credit Facility.
In the event Caterpillar or Cat Financial does not meet one or more of their respective financial covenants under the Credit Facility in the future (and are unable to obtain a consent or waiver), the syndicate of banks may terminate the commitments allocated to the party that does not meet its covenants. Additionally, in such event, certain of Cat Financial’s other lenders under other loan agreements where similar financial covenants or cross default provisions are applicable may, at their election, choose to pursue remedies under those loan agreements, including accelerating the repayment of outstanding borrowings. At September 30, 2021, there were no borrowings under the Credit Facility.
Our total credit commitments and available credit as of September 30, 2021 were:
| September 30, 2021 | |||||||||||||||||
| (Millions of dollars) | Consolidated |
Machinery,
Energy & Transportation |
Financial
Products |
||||||||||||||
| Credit lines available: | |||||||||||||||||
| Global credit facilities | $ | 10,500 | $ | 2,750 | $ | 7,750 | |||||||||||
| Other external | 3,278 | 184 | 3,094 | ||||||||||||||
| Total credit lines available | 13,778 | 2,934 | 10,844 | ||||||||||||||
| Less: Commercial paper outstanding | (2,619) | — | (2,619) | ||||||||||||||
| Less: Utilized credit | (669) | — | (669) | ||||||||||||||
| Available credit | $ | 10,490 | $ | 2,934 | $ | 7,556 | |||||||||||
The other external consolidated credit lines with banks as of September 30, 2021 totaled $3.28 billion. These committed and uncommitted credit lines, which may be eligible for renewal at various future dates or have no specified expiration date, are used primarily by our subsidiaries for local funding requirements. Caterpillar or Cat Financial may guarantee subsidiary borrowings under these lines.
65
We receive debt ratings from the major credit rating agencies. Moody’s, Fitch and S&P maintain a “mid-A” debt rating. A downgrade of our credit ratings by any of the major credit rating agencies would result in increased borrowing costs and could make access to certain credit markets more difficult. In the event economic conditions deteriorate such that access to debt markets becomes unavailable, ME&T’s operations would rely on cash flow from operations, use of existing cash balances, borrowings from Cat Financial and access to our committed credit facilities. Our Financial Products’ operations would rely on cash flow from its existing portfolio, existing cash balances, access to our committed credit facilities and other credit line facilities of Cat Financial, and potential borrowings from Caterpillar. In addition, we maintain a support agreement with Cat Financial, which requires Caterpillar to remain the sole owner of Cat Financial and may, under certain circumstances, require Caterpillar to make payments to Cat Financial should Cat Financial fail to maintain certain financial ratios.
We facilitate voluntary supply chain finance programs (the “Programs”) through participating financial institutions. The Programs are available to a wide range of suppliers and allows them the option to manage their cash flow. We are not a party to the agreements between the participating financial institutions and the suppliers in connection with the Programs. The range of payment terms we negotiate with our suppliers is consistent, irrespective of whether a supplier participates in the Programs. The amounts payable to participating financial institutions for suppliers who voluntarily participate in the Programs and included in Accounts payable in the Consolidated Statement of Financial Position were $725 million and $533 million at September 30, 2021 and December 31, 2020, respectively. The amounts settled through the Programs and paid to participating financial institutions were $2.9 billion and $2.4 billion during the first nine months of 2021 and 2020, respectively. We account for payments made under the Programs, the same as our other Accounts payable, as a reduction to our cash flows from operations. We do not believe that changes in the availability of supply chain financing will have a significant impact on our liquidity.
Machinery, Energy & Transportation
Net cash provided by operating activities was $4.90 billion in the first nine months of 2021, compared with $2.07 billion for the same period in 2020. The increase was primarily due to higher profit before taxes adjusted for non-cash items, including higher accruals for short-term incentive compensation. In addition, lower payments for short-term incentive compensation favorably impacted cash flow. Partially offsetting these items were increased working capital requirements during the first nine months of 2021 compared to the same period last year. Within working capital, changes in inventory and accounts receivable unfavorably impacted cash flow but were partially offset by favorable changes in accounts payable and accrued expenses.
Net cash used by investing activities in the first nine months of 2021 was $487 million, compared with net cash used of $66 million in the first nine months of 2020. The change was primarily due to increased investment activity mostly offset by increased activity related to intercompany lending with Financial Products. During 2021, we invested $543 million in bank time deposits with varying maturity dates within one year. We also acquired the Oil & Gas division of the Weir Group PLC for $361 million, net of cash acquired, in February 2021.
Net cash used for financing activities during the first nine months of 2021 was $4.67 billion, compared with net cash used of $742 million in the same period of 2020. The change was primarily due to the repayment of debt and lower proceeds from debt issuances. In addition, during the first nine months of 2021, we repurchased $1.62 billion of Caterpillar common stock compared with $1.13 billion during the same period a year ago.
While our short-term priorities for the use of cash may vary from time to time as business needs and conditions dictate, our long-term cash deployment strategy is focused on the following priorities. Our top priority is to maintain a strong financial position in support of a mid-A rating. Next, we intend to fund operational requirements and commitments. Then, we intend to fund priorities that profitably grow the company and return capital to shareholders through dividend growth and share repurchases. Additional information on cash deployment is as follows:
Strong financial position
–
Our top priority is to maintain a strong financial position in support of a mid-A rating. We track a diverse group of financial metrics that focus on liquidity, leverage, cash flow and margins which align with our cash deployment actions and the various methodologies used by the major credit rating agencies.
Operational excellence and commitments
–
Capital expenditures were $693 million during the first nine months of 2021, compared to $685 million for the same period in 2020. We expect ME&T’s capital expenditures in 2021 to be about $1.0 billion to $1.1 billion. We made $229 million of contributions to our pension and other postretirement benefit plans during the first nine months of 2021. We currently anticipate full-year 2021 contributions of approximately $310 million. In comparison, we made $217 million of contributions to our pension and other postretirement benefit plans during the first nine months of 2020.
Fund strategic growth initiatives and return capital to shareholders
–
We intend to utilize our liquidity and debt capacity to fund targeted investments that drive long-term profitable growth focused in the areas of expanded offerings and services, including acquisitions.
66
As part of our capital allocation strategy, ME&T free cash flow is a liquidity measure we use to determine the cash generated and available for financing activities including debt repayments, dividends and share repurchases. We define ME&T free cash flow as cash from ME&T operations excluding discretionary pension and other postretirement benefit plan contributions less capital expenditures. A goal of our capital allocation strategy is to return substantially all ME&T free cash flow to shareholders through the cycles in the form of dividends and share repurchases, while maintaining our mid-A rating.
Our share repurchase plans are subject to the company’s cash deployment priorities and are evaluated on an ongoing basis considering the financial condition of the company and the economic outlook, corporate cash flow, the company’s liquidity needs, and the health and stability of global credit markets. The timing and amount of future repurchases may vary depending on market conditions and investing priorities. In July 2018, the Board of Directors approved an authorization to repurchase up to $10 billion of Caterpillar common stock (the 2018 Authorization) effective January 1, 2019, with no expiration. In the second quarter of 2021, we resumed our share repurchase program under the 2018 Authorization. In the first nine months of 2021, we repurchased $1.62 billion of Caterpillar common stock, with $3.1 billion remaining under the 2018 Authorization as of September 30, 2021. Our basic shares outstanding as of September 30, 2021 were approximately 541 million.
Each quarter, our Board of Directors reviews the company’s dividend for the applicable quarter. The Board evaluates the financial condition of the company and considers the economic outlook, corporate cash flow, the company’s liquidity needs, and the health and stability of global credit markets to determine whether to maintain or change the quarterly dividend. In October 2021, the Board of Directors approved maintaining our quarterly dividend at $1.11 per share and we continue to expect our strong financial position to support the dividend. Dividends paid totaled $1.73 billion in the first nine months of 2021.
Financial Products
Financial Products operating cash flow was $1.10 billion in the first nine months of 2021, compared with $1.04 billion for the same period a year ago. Net cash used for investing activities was $468 million for the first nine months of 2021, compared with net cash provided of $885 million for the same period in 2020. The change was primarily due to portfolio related activity. Net cash used for financing activities was $289 million for the first nine months of 2021 compared with $2.10 billion for the same period in 2020. The change was primarily due to higher portfolio funding requirements.
RECENT ACCOUNTING PRONOUNCEMENTS
For a discussion of recent accounting pronouncements, see Part I, Item 1. Note 2 - “New accounting guidance”.
CRITICAL ACCOUNTING ESTIMATES
For a discussion of the company’s critical accounting estimates, see Part II, Item 7. Management’s Discussion and Analysis of Financial Condition and Results of Operations in our 2020 Annual Report on Form 10-K. There have been no significant changes to our critical accounting estimates since our 2020 Annual Report on Form 10-K.
OTHER MATTERS
Information related to legal proceedings appears in Note 14—Environmental and Legal Matters of Part II, Item 8 “Financial Statements and Supplementary Data.”
Retirement Benefits
We recognize mark-to-market gains and losses immediately through earnings upon the remeasurement of our pension and OPEB plans.
Mark-to-market gains and losses
represent the effects of actual results differing from our assumptions and the effects of changing assumptions. We will record the annual mark-to-market adjustment as of the measurement date, December 31, 2021. The discount rates for our U.S. pension plans were 2.8 percent and 2.4 percent as of September 30, 2021 and December 31, 2020, respectively. Asset returns as of September 30, 2021 for our U.S. pension plans were 1.5 percent compared to an expected return on plan assets for 2021 of 4.2 percent. It is difficult to predict the December 31, 2021 adjustment amount, as it is dependent on several factors including discount rate, actual returns on plan assets and other actuarial assumptions.
67
Order Backlog
At the end of the third quarter of 2021, the dollar amount of backlog believed to be firm was approximately $20.6 billion, about $2.2 billion higher than the second quarter of 2021. The order backlog increased across the three primary segments, with the largest increase in Resource Industries. Of the total backlog at September 30, 2021, approximately $3.9 billion was not expected to be filled in the following twelve months.
68
NON-GAAP FINANCIAL MEASURES
We provide the following definitions for the non-GAAP financial measures used in this report. These non-GAAP financial measures have no standardized meaning prescribed by U.S. GAAP and therefore are unlikely to be comparable to the calculation of similar measures for other companies. Management does not intend these items to be considered in isolation or as a substitute for the related GAAP measures.
We believe it is important to separately quantify the profit impact of two significant items in order for our results to be meaningful to our readers. These items consist of (i) restructuring costs, which were incurred to generate longer-term benefits and (ii) remeasurement (gains) losses resulting from the settlements of pension obligations in 2020. We do not consider these items indicative of earnings from ongoing business activities and believe the non-GAAP measure provides investors with useful perspective on underlying business results and trends and aids with assessing our period-over-period results. In addition, we provide a calculation of ME&T free cash flow as we believe it is an important measure for investors to determine the cash generation available for financing activities including debt repayments, dividends and share repurchases.
Reconciliations of adjusted results to the most directly comparable GAAP measures are as follows:
| (Dollars in millions except per share data) | Operating Profit | Operating Profit Margin | Profit Before Taxes | Provision (Benefit) for Income Taxes | Effective Tax Rate | Profit | Profit per Share | |||||||||||||||||||||||||||||||||||||
| Three Months Ended September 30, 2021 - U.S. GAAP | $ | 1,664 | 13.4 | % | $ | 1,775 | $ | 368 | 20.7 | % | $ | 1,426 | $ | 2.60 | ||||||||||||||||||||||||||||||
| Restructuring costs | 35 | 0.3 | % | 35 | 6 | 15.0 | % | 29 | $ | 0.06 | ||||||||||||||||||||||||||||||||||
| Three Months Ended September 30, 2021 - Adjusted | $ | 1,699 | 13.7 | % | $ | 1,810 | $ | 374 | 20.7 | % | $ | 1,455 | $ | 2.66 | ||||||||||||||||||||||||||||||
| Three Months Ended September 30, 2020 - U.S. GAAP | $ | 985 | 10.0 | % | $ | 863 | $ | 187 | 21.7 | % | $ | 668 | $ | 1.22 | ||||||||||||||||||||||||||||||
| Restructuring costs | 112 | 1.1 | % | 112 | 13 | 12.0 | % | 99 | $ | 0.18 | ||||||||||||||||||||||||||||||||||
| Remeasurement (gains) losses of pension obligations | — | — | % | 77 | 12 | 15.6 | % | 65 | $ | 0.12 | ||||||||||||||||||||||||||||||||||
| Three Months Ended September 30, 2020 - Adjusted | $ | 1,097 | 11.1 | % | $ | 1,052 | $ | 212 | 20.2 | % | $ | 832 | $ | 1.52 | ||||||||||||||||||||||||||||||
| Nine Months Ended September 30, 2021 - U.S. GAAP | $ | 5,267 | 14.2 | % | $ | 5,642 | $ | 1,313 | 23.3 | % | $ | 4,369 | $ | 7.94 | ||||||||||||||||||||||||||||||
| Restructuring costs | 124 | 0.3 | % | 124 | 19 | 15.0 | % | 105 | $ | 0.19 | ||||||||||||||||||||||||||||||||||
| Nine Months Ended September 30, 2021 - Adjusted | $ | 5,391 | 14.5 | % | $ | 5,766 | $ | 1,332 | 23.1 | % | $ | 4,474 | $ | 8.13 | ||||||||||||||||||||||||||||||
| Nine Months Ended September 30, 2020 - U.S. GAAP | $ | 3,173 | 10.4 | % | $ | 3,054 | $ | 839 | 27.5 | % | $ | 2,218 | $ | 4.05 | ||||||||||||||||||||||||||||||
| Restructuring costs | 296 | 1.0 | % | 296 | 35 | 12.0 | % | 261 | $ | 0.48 | ||||||||||||||||||||||||||||||||||
| Remeasurement (gains) losses of pension obligations | — | — | % | (55) | (10) | 18.2 | % | (45) | $ | (0.08) | ||||||||||||||||||||||||||||||||||
| Nine Months Ended September 30, 2020 - Adjusted | $ | 3,469 | 11.4 | % | $ | 3,295 | $ | 864 | 26.2 | % | $ | 2,434 | $ | 4.44 | ||||||||||||||||||||||||||||||
Reconciliations of ME&T free cash flow to the most directly comparable GAAP measure, net cash provided by operating activities are as follows:
| (Millions of dollars) | Nine Months Ended September 30 | ||||||||||
| 2021 | 2020 | ||||||||||
|
ME&T net cash provided by operating activities
1
|
$ | 4,899 | $ | 2,065 | |||||||
| ME&T capital expenditures | $ | (693) | $ | (685) | |||||||
| ME&T free cash flow | $ | 4,206 | $ | 1,380 | |||||||
|
1
See reconciliation of ME&T net cash provided by operating activities to consolidated net cash provided by operating activities on pages 77 - 78.
|
|||||||||||
69
Supplemental Consolidating Data
We are providing supplemental consolidating data for the purpose of additional analysis. The data has been grouped as follows:
Consolidated –
Caterpillar Inc. and its subsidiaries.
Machinery, Energy & Transportation –
We define ME&T as it is presented in the supplemental data as Caterpillar Inc. and its subsidiaries, excluding Financial Products. ME&T’s information relates to the design, manufacturing and marketing of our products.
Financial Products –
We define Financial Products as it is presented in the supplemental data as our finance and insurance subsidiaries, primarily Caterpillar Financial Services Corporation (Cat Financial) and Caterpillar Insurance Holdings Inc. (Insurance Services). Financial Products’ information relates to the financing to customers and dealers for the purchase and lease of Caterpillar and other equipment.
Consolidating Adjustments –
Eliminations of transactions between ME&T and Financial Products.
The nature of the ME&T and Financial Products businesses is different, especially with regard to the financial position and cash flow items. Caterpillar management utilizes this presentation internally to highlight these differences. We believe this presentation will assist readers in understanding our business.
Pages 71 to 78 reconcile ME&T and Financial Products to Caterpillar Inc. consolidated financial information. Certain amounts for prior periods have been reclassified to conform to the current period presentation.
70
Caterpillar Inc.
Supplemental Data for Results of Operations
For the Three Months Ended September 30, 2021
(Unaudited)
(Millions of dollars)
| Supplemental Consolidating Data | ||||||||||||||||||||||||||
| Consolidated |
Machinery,
Energy & Transportation |
Financial
Products |
Consolidating
Adjustments |
|||||||||||||||||||||||
| Sales and revenues: | ||||||||||||||||||||||||||
| Sales of Machinery, Energy & Transportation | $ | 11,707 | $ | 11,707 | $ | — | $ | — | ||||||||||||||||||
| Revenues of Financial Products | 690 | — | 787 | (97) |
1
|
|||||||||||||||||||||
| Total sales and revenues | 12,397 | 11,707 | 787 | (97) | ||||||||||||||||||||||
| Operating costs: | ||||||||||||||||||||||||||
| Cost of goods sold | 8,617 | 8,618 | — | (1) |
2
|
|||||||||||||||||||||
| Selling, general and administrative expenses | 1,340 | 1,147 | 200 | (7) |
2
|
|||||||||||||||||||||
| Research and development expenses | 427 | 427 | — | — | ||||||||||||||||||||||
| Interest expense of Financial Products | 111 | — | 111 | — | ||||||||||||||||||||||
| Other operating (income) expenses | 238 | (56) | 310 | (16) |
2
|
|||||||||||||||||||||
| Total operating costs | 10,733 | 10,136 | 621 | (24) | ||||||||||||||||||||||
| Operating profit | 1,664 | 1,571 | 166 | (73) | ||||||||||||||||||||||
| Interest expense excluding Financial Products | 114 | 114 | — | — | ||||||||||||||||||||||
| Other income (expense) | 225 | 143 | 9 | 73 |
3
|
|||||||||||||||||||||
| Consolidated profit before taxes | 1,775 | 1,600 | 175 | — | ||||||||||||||||||||||
| Provision (benefit) for income taxes | 368 | 331 | 37 | — | ||||||||||||||||||||||
| Profit of consolidated companies | 1,407 | 1,269 | 138 | — | ||||||||||||||||||||||
| Equity in profit (loss) of unconsolidated affiliated companies | 21 | 23 | — | (2) |
4
|
|||||||||||||||||||||
| Profit of consolidated and affiliated companies | 1,428 | 1,292 | 138 | (2) | ||||||||||||||||||||||
| Less: Profit (loss) attributable to noncontrolling interests | 2 | 1 | 3 | (2) |
5
|
|||||||||||||||||||||
|
Profit
6
|
$ | 1,426 | $ | 1,291 | $ | 135 | $ | — | ||||||||||||||||||
1
Elimination of Financial Products’ revenues earned from ME&T.
2
Elimination of net expenses recorded by ME&T paid to Financial Products.
3
Elimination of discount recorded by ME&T on receivables sold to Financial Products and of interest earned between ME&T and Financial Products as well as dividends paid by Financial Products to ME&T.
4
Elimination of equity profit (loss) earned from Financial Products’ subsidiaries partially owned by ME&T subsidiaries.
5
Elimination of noncontrolling interest profit (loss) recorded by Financial Products for subsidiaries partially owned by ME&T subsidiaries.
6
Profit attributable to common shareholders.
71
Caterpillar Inc.
Supplemental Data for Results of Operations
For the Nine Months Ended September 30, 2021
(Unaudited)
(Millions of dollars)
| Supplemental Consolidating Data | ||||||||||||||||||||||||||
| Consolidated | Machinery, Energy & Transportation |
Financial
Products |
Consolidating
Adjustments |
|||||||||||||||||||||||
| Sales and revenues: | ||||||||||||||||||||||||||
| Sales of Machinery, Energy & Transportation | $ | 35,091 | $ | 35,091 | $ | — | $ | — | ||||||||||||||||||
| Revenues of Financial Products | 2,082 | — | 2,371 | (289) |
1
|
|||||||||||||||||||||
| Total sales and revenues | 37,173 | 35,091 | 2,371 | (289) | ||||||||||||||||||||||
| Operating costs: | ||||||||||||||||||||||||||
| Cost of goods sold | 25,510 | 25,515 | — | (5) |
2
|
|||||||||||||||||||||
| Selling, general and administrative expenses | 3,943 | 3,471 | 483 | (11) |
2
|
|||||||||||||||||||||
| Research and development expenses | 1,247 | 1,247 | — | — | ||||||||||||||||||||||
| Interest expense of Financial Products | 352 | — | 352 | — |
|
|||||||||||||||||||||
| Other operating (income) expenses | 854 | (30) | 931 | (47) |
2
|
|||||||||||||||||||||
| Total operating costs | 31,906 | 30,203 | 1,766 | (63) | ||||||||||||||||||||||
| Operating profit | 5,267 | 4,888 | 605 | (226) | ||||||||||||||||||||||
| Interest expense excluding Financial Products | 376 | 376 | — | — | ||||||||||||||||||||||
| Other income (expense) | 751 | 819 | 56 | (124) |
3
|
|||||||||||||||||||||
| Consolidated profit before taxes | 5,642 | 5,331 | 661 | (350) | ||||||||||||||||||||||
| Provision (benefit) for income taxes | 1,313 | 1,158 | 155 | — | ||||||||||||||||||||||
| Profit of consolidated companies | 4,329 | 4,173 | 506 | (350) | ||||||||||||||||||||||
| Equity in profit (loss) of unconsolidated affiliated companies | 44 | 52 | — | (8) |
4
|
|||||||||||||||||||||
| Profit of consolidated and affiliated companies | 4,373 | 4,225 | 506 | (358) | ||||||||||||||||||||||
| Less: Profit (loss) attributable to noncontrolling interests | 4 | 3 | 9 | (8) |
5
|
|||||||||||||||||||||
|
Profit
6
|
$ | 4,369 | $ | 4,222 | $ | 497 | $ | (350) | ||||||||||||||||||
1
Elimination of Financial Products’ revenues earned from ME&T.
2
Elimination of net expenses recorded by ME&T paid to Financial Products.
3
Elimination of discount recorded by ME&T on receivables sold to Financial Products and of interest earned between ME&T and Financial Products as well as dividends paid by Financial Products to ME&T.
4
Elimination of equity profit (loss) earned from Financial Products’ subsidiaries partially owned by ME&T subsidiaries.
5
Elimination of noncontrolling interest profit (loss) recorded by Financial Products for subsidiaries partially owned by ME&T subsidiaries.
6
Profit attributable to common shareholders.
72
Caterpillar Inc.
Supplemental Data for Results of Operations
For the Three Months Ended September 30, 2020
(Unaudited)
(Millions of dollars)
| Supplemental Consolidating Data | ||||||||||||||||||||||||||
| Consolidated |
Machinery,
Energy & Transportation |
Financial
Products |
Consolidating
Adjustments |
|||||||||||||||||||||||
| Sales and revenues: | ||||||||||||||||||||||||||
| Sales of Machinery, Energy & Transportation | $ | 9,228 | $ | 9,228 | $ | — | $ | — | ||||||||||||||||||
| Revenues of Financial Products | 653 | — | 740 | (87) |
1
|
|||||||||||||||||||||
| Total sales and revenues | 9,881 | 9,228 | 740 | (87) | ||||||||||||||||||||||
| Operating costs: | ||||||||||||||||||||||||||
| Cost of goods sold | 6,919 | 6,921 | — | (2) |
2
|
|||||||||||||||||||||
| Selling, general and administrative expenses | 1,126 | 943 | 189 | (6) |
2
|
|||||||||||||||||||||
| Research and development expenses | 344 | 344 | — | — | ||||||||||||||||||||||
| Interest expense of Financial Products | 137 | — | 137 | — |
|
|||||||||||||||||||||
| Other operating (income) expenses | 370 | 95 | 287 | (12) |
2
|
|||||||||||||||||||||
| Total operating costs | 8,896 | 8,303 | 613 | (20) | ||||||||||||||||||||||
| Operating profit | 985 | 925 | 127 | (67) | ||||||||||||||||||||||
| Interest expense excluding Financial Products | 136 | 136 | — | — | ||||||||||||||||||||||
| Other income (expense) | 14 | (62) | 9 | 67 |
3
|
|||||||||||||||||||||
| Consolidated profit before taxes | 863 | 727 | 136 | — | ||||||||||||||||||||||
| Provision (benefit) for income taxes | 187 | 133 | 54 | — | ||||||||||||||||||||||
| Profit of consolidated companies | 676 | 594 | 82 | — | ||||||||||||||||||||||
| Equity in profit (loss) of unconsolidated affiliated companies | (5) | (4) | — | (1) |
4
|
|||||||||||||||||||||
| Profit of consolidated and affiliated companies | 671 | 590 | 82 | (1) | ||||||||||||||||||||||
| Less: Profit (loss) attributable to noncontrolling interests | 3 | — | 4 | (1) |
5
|
|||||||||||||||||||||
|
Profit
6
|
$ | 668 | $ | 590 | $ | 78 | $ | — | ||||||||||||||||||
1
Elimination of Financial Products’ revenues earned from ME&T.
2
Elimination of net expenses recorded by ME&T paid to Financial Products.
3
Elimination of discount recorded by ME&T on receivables sold to Financial Products and of interest earned between ME&T and Financial Products as well as dividends paid by Financial Products to ME&T.
4
Elimination of equity profit (loss) earned from Financial Products’ subsidiaries partially owned by ME&T subsidiaries.
5
Elimination of noncontrolling interest profit (loss) recorded by Financial Products for subsidiaries partially owned by ME&T subsidiaries.
6
Profit attributable to common shareholders.
73
Caterpillar Inc.
Supplemental Data for Results of Operations
For the Nine Months Ended September 30, 2020
(Unaudited)
(Millions of dollars)
| Supplemental Consolidating Data | ||||||||||||||||||||||||||
| Consolidated |
Machinery,
Energy & Transportation |
Financial
Products |
Consolidating
Adjustments |
|||||||||||||||||||||||
| Sales and revenues: | ||||||||||||||||||||||||||
| Sales of Machinery, Energy & Transportation | $ | 28,452 | $ | 28,452 | $ | — | $ | — | ||||||||||||||||||
| Revenues of Financial Products | 2,061 | — | 2,350 | (289) |
1
|
|||||||||||||||||||||
| Total sales and revenues | 30,513 | 28,452 | 2,350 | (289) | ||||||||||||||||||||||
| Operating costs: | ||||||||||||||||||||||||||
| Cost of goods sold | 21,298 | 21,302 | — | (4) |
2
|
|||||||||||||||||||||
| Selling, general and administrative expenses | 3,426 | 2,867 | 572 | (13) |
2
|
|||||||||||||||||||||
| Research and development expenses | 1,041 | 1,041 | — | — | ||||||||||||||||||||||
| Interest expense of Financial Products | 461 | — | 462 | (1) |
3
|
|||||||||||||||||||||
| Other operating (income) expenses | 1,114 | 227 | 927 | (40) |
2
|
|||||||||||||||||||||
| Total operating costs | 27,340 | 25,437 | 1,961 | (58) | ||||||||||||||||||||||
| Operating profit | 3,173 | 3,015 | 389 | (231) | ||||||||||||||||||||||
| Interest expense excluding Financial Products | 384 | 383 | — | 1 |
3
|
|||||||||||||||||||||
| Other income (expense) | 265 | 60 | (7) | 212 |
4
|
|||||||||||||||||||||
| Consolidated profit before taxes | 3,054 | 2,692 | 382 | (20) | ||||||||||||||||||||||
| Provision (benefit) for income taxes | 839 | 720 | 119 | — | ||||||||||||||||||||||
| Profit of consolidated companies | 2,215 | 1,972 | 263 | (20) | ||||||||||||||||||||||
| Equity in profit (loss) of unconsolidated affiliated companies | 8 | 18 | — | (10) |
5
|
|||||||||||||||||||||
| Profit of consolidated and affiliated companies | 2,223 | 1,990 | 263 | (30) | ||||||||||||||||||||||
| Less: Profit (loss) attributable to noncontrolling interests | 5 | 2 | 13 | (10) |
6
|
|||||||||||||||||||||
|
Profit
7
|
$ | 2,218 | $ | 1,988 | $ | 250 | $ | (20) | ||||||||||||||||||
1
Elimination of Financial Products’ revenues earned from ME&T.
2
Elimination of net expenses recorded by ME&T paid to Financial Products.
3
Elimination of interest expense recorded between Financial Products and ME&T.
4
Elimination of discount recorded by ME&T on receivables sold to Financial Products and of interest earned between ME&T and Financial Products as well as dividends paid by Financial Products to ME&T.
5
Elimination of equity profit (loss) earned from Financial Products’ subsidiaries partially owned by ME&T subsidiaries.
6
Elimination of noncontrolling interest profit (loss) recorded by Financial Products for subsidiaries partially owned by ME&T subsidiaries.
7
Profit attributable to common shareholders.
74
Caterpillar Inc.
Supplemental Data for Financial Position
At September 30, 2021
(Unaudited)
(Millions of dollars)
| Supplemental Consolidating Data | ||||||||||||||||||||||||||
| Consolidated |
Machinery,
Energy & Transportation |
Financial
Products |
Consolidating
Adjustments |
|||||||||||||||||||||||
| Assets | ||||||||||||||||||||||||||
| Current assets: | ||||||||||||||||||||||||||
| Cash and cash equivalents | $ | 9,446 | $ | 8,554 | $ | 892 | $ | — | ||||||||||||||||||
| Receivables – trade and other | 7,647 | 3,175 | 430 | 4,042 |
1,2
|
|||||||||||||||||||||
| Receivables – finance | 8,919 | — | 13,095 | (4,176) |
2
|
|||||||||||||||||||||
| Prepaid expenses and other current assets | 2,215 | 1,831 | 425 | (41) |
3
|
|||||||||||||||||||||
| Inventories | 13,666 | 13,666 | — | — | ||||||||||||||||||||||
| Total current assets | 41,893 | 27,226 | 14,842 | (175) | ||||||||||||||||||||||
| Property, plant and equipment – net | 11,904 | 7,957 | 3,947 | — | ||||||||||||||||||||||
| Long-term receivables – trade and other | 1,273 | 389 | 215 | 669 |
1,2
|
|||||||||||||||||||||
| Long-term receivables – finance | 12,605 | — | 13,301 | (696) |
2
|
|||||||||||||||||||||
| Noncurrent deferred and refundable income taxes | 1,744 | 2,279 | 105 | (640) |
4
|
|||||||||||||||||||||
| Intangible assets | 1,121 | 1,121 | — | — | ||||||||||||||||||||||
| Goodwill | 6,353 | 6,353 | — | — | ||||||||||||||||||||||
| Other assets | 3,891 | 3,233 | 1,869 | (1,211) |
5
|
|||||||||||||||||||||
| Total assets | $ | 80,784 | $ | 48,558 | $ | 34,279 | $ | (2,053) | ||||||||||||||||||
| Liabilities | ||||||||||||||||||||||||||
| Current liabilities: | ||||||||||||||||||||||||||
| Short-term borrowings | $ | 3,247 | $ | — | $ | 3,247 | $ | — | ||||||||||||||||||
| Accounts payable | 7,218 | 7,112 | 240 | (134) |
6
|
|||||||||||||||||||||
| Accrued expenses | 3,579 | 3,234 | 345 | — | ||||||||||||||||||||||
| Accrued wages, salaries and employee benefits | 2,075 | 2,031 | 44 | — | ||||||||||||||||||||||
| Customer advances | 1,155 | 1,155 | — | — | ||||||||||||||||||||||
| Other current liabilities | 2,319 | 1,694 | 689 | (64) |
4,7
|
|||||||||||||||||||||
| Long-term debt due within one year | 6,383 | 48 | 6,335 | — | ||||||||||||||||||||||
| Total current liabilities | 25,976 | 15,274 | 10,900 | (198) | ||||||||||||||||||||||
| Long-term debt due after one year | 27,154 | 9,786 | 17,395 | (27) |
8
|
|||||||||||||||||||||
| Liability for postemployment benefits | 6,395 | 6,394 | 1 | — | ||||||||||||||||||||||
| Other liabilities | 4,564 | 3,905 | 1,371 | (712) |
4
|
|||||||||||||||||||||
| Total liabilities | 64,089 | 35,359 | 29,667 | (937) | ||||||||||||||||||||||
| Commitments and contingencies | ||||||||||||||||||||||||||
| Shareholders’ equity | ||||||||||||||||||||||||||
| Common stock | 6,352 | 6,352 | 919 | (919) |
9
|
|||||||||||||||||||||
| Treasury stock | (26,608) | (26,608) | — | — | ||||||||||||||||||||||
| Profit employed in the business | 38,361 | 34,138 | 4,212 | 11 |
9
|
|||||||||||||||||||||
| Accumulated other comprehensive income (loss) | (1,440) | (715) | (725) | — | ||||||||||||||||||||||
| Noncontrolling interests | 30 | 32 | 206 | (208) |
9
|
|||||||||||||||||||||
| Total shareholders’ equity | 16,695 | 13,199 | 4,612 | (1,116) | ||||||||||||||||||||||
| Total liabilities and shareholders’ equity | $ | 80,784 | $ | 48,558 | $ | 34,279 | $ | (2,053) | ||||||||||||||||||
1
Elimination of receivables between ME&T and Financial Products.
2
Reclassification of ME&T’s trade receivables purchased by Financial Products and Financial Products’ wholesale inventory receivables.
3
Elimination of ME&T’s insurance premiums that are prepaid to Financial Products.
4
Reclassification reflecting required netting of deferred tax assets/liabilities by taxing jurisdiction.
5
Elimination of other intercompany assets between ME&T and Financial Products.
6
Elimination of payables between ME&T and Financial Products.
7
Elimination of prepaid insurance in Financial Products’ other liabilities.
8
Elimination of debt between ME&T and Financial Products.
9
Eliminations associated with ME&T’s investments in Financial Products’ subsidiaries.
75
Caterpillar Inc.
Supplemental Data for Financial Position
At December 31, 2020
(Unaudited)
(Millions of dollars)
| Supplemental Consolidating Data | ||||||||||||||||||||||||||
| Consolidated |
Machinery,
Energy & Transportation |
Financial
Products |
Consolidating
Adjustments |
|||||||||||||||||||||||
| Assets | ||||||||||||||||||||||||||
| Current assets: | ||||||||||||||||||||||||||
| Cash and cash equivalents | $ | 9,352 | $ | 8,822 | $ | 530 | $ | — | ||||||||||||||||||
| Receivables – trade and other | 7,317 | 3,846 | 397 | 3,074 |
1,2
|
|||||||||||||||||||||
| Receivables – finance | 9,463 | — | 13,681 | (4,218) |
2
|
|||||||||||||||||||||
| Prepaid expenses and other current assets | 1,930 | 1,376 | 624 | (70) |
3
|
|||||||||||||||||||||
| Inventories | 11,402 | 11,402 | — | — | ||||||||||||||||||||||
| Total current assets | 39,464 | 25,446 | 15,232 | (1,214) | ||||||||||||||||||||||
| Property, plant and equipment – net | 12,401 | 8,309 | 4,092 | — | ||||||||||||||||||||||
| Long-term receivables – trade and other | 1,185 | 363 | 164 | 658 |
1,2
|
|||||||||||||||||||||
| Long-term receivables – finance | 12,222 | — | 12,895 | (673) |
2
|
|||||||||||||||||||||
| Noncurrent deferred and refundable income taxes | 1,523 | 2,058 | 110 | (645) |
4
|
|||||||||||||||||||||
| Intangible assets | 1,308 | 1,308 | — | — | ||||||||||||||||||||||
| Goodwill | 6,394 | 6,394 | — | — | ||||||||||||||||||||||
| Other assets | 3,827 | 3,158 | 1,871 | (1,202) |
5
|
|||||||||||||||||||||
| Total assets | $ | 78,324 | $ | 47,036 | $ | 34,364 | $ | (3,076) | ||||||||||||||||||
| Liabilities | ||||||||||||||||||||||||||
| Current liabilities: | ||||||||||||||||||||||||||
| Short-term borrowings | $ | 2,015 | $ | 10 | $ | 2,005 | $ | — | ||||||||||||||||||
| Short-term borrowings with consolidated companies | — | — | 1,000 | (1,000) |
6
|
|||||||||||||||||||||
| Accounts payable | 6,128 | 6,060 | 212 | (144) |
7
|
|||||||||||||||||||||
| Accrued expenses | 3,642 | 3,099 | 543 | — | ||||||||||||||||||||||
| Accrued wages, salaries and employee benefits | 1,096 | 1,081 | 15 | — | ||||||||||||||||||||||
| Customer advances | 1,108 | 1,108 | — | — | ||||||||||||||||||||||
| Dividends payable | 562 | 562 | — | — | ||||||||||||||||||||||
| Other current liabilities | 2,017 | 1,530 | 580 | (93) |
4,8
|
|||||||||||||||||||||
| Long-term debt due within one year | 9,149 | 1,420 | 7,729 | — | ||||||||||||||||||||||
| Total current liabilities | 25,717 | 14,870 | 12,084 | (1,237) | ||||||||||||||||||||||
| Long-term debt due after one year | 25,999 | 9,764 | 16,250 | (15) |
6
|
|||||||||||||||||||||
| Liability for postemployment benefits | 6,872 | 6,872 | — | — | ||||||||||||||||||||||
| Other liabilities | 4,358 | 3,691 | 1,385 | (718) |
4
|
|||||||||||||||||||||
| Total liabilities | 62,946 | 35,197 | 29,719 | (1,970) | ||||||||||||||||||||||
| Commitments and contingencies | ||||||||||||||||||||||||||
| Shareholders’ equity | ||||||||||||||||||||||||||
| Common stock | 6,230 | 6,230 | 919 | (919) |
9
|
|||||||||||||||||||||
| Treasury stock | (25,178) | (25,178) | — | — | ||||||||||||||||||||||
| Profit employed in the business | 35,167 | 31,091 | 4,065 | 11 |
9
|
|||||||||||||||||||||
| Accumulated other comprehensive income (loss) | (888) | (352) | (536) | — | ||||||||||||||||||||||
| Noncontrolling interests | 47 | 48 | 197 | (198) |
9
|
|||||||||||||||||||||
| Total shareholders’ equity | 15,378 | 11,839 | 4,645 | (1,106) | ||||||||||||||||||||||
| Total liabilities and shareholders’ equity | $ | 78,324 | $ | 47,036 | $ | 34,364 | $ | (3,076) | ||||||||||||||||||
1
Elimination of receivables between ME&T and Financial Products.
2
Reclassification of ME&T’s trade receivables purchased by Financial Products and Financial Products’ wholesale inventory receivables.
3
Elimination of ME&T’s insurance premiums that are prepaid to Financial Products.
4
Reclassification reflecting required netting of deferred tax assets/liabilities by taxing jurisdiction.
5
Elimination of other intercompany assets between ME&T and Financial Products.
6
Elimination of debt between ME&T and Financial Products.
7
Elimination of payables between ME&T and Financial Products.
8
Elimination of prepaid insurance in Financial Products’ other liabilities.
9
Eliminations associated with ME&T’s investments in Financial Products’ subsidiaries.
76
Caterpillar Inc.
Supplemental Data for Cash Flow
For the Nine Months Ended September 30, 2021
(Unaudited)
(Millions of dollars)
| Supplemental Consolidating Data | ||||||||||||||||||||||||||
| Consolidated |
Machinery,
Energy & Transportation |
Financial
Products |
Consolidating
Adjustments |
|||||||||||||||||||||||
| Cash flow from operating activities: | ||||||||||||||||||||||||||
| Profit of consolidated and affiliated companies | $ | 4,373 | $ | 4,225 | $ | 506 | $ | (358) |
1, 5
|
|||||||||||||||||
| Adjustments for non-cash items: | ||||||||||||||||||||||||||
| Depreciation and amortization | 1,766 | 1,162 | 604 | — | ||||||||||||||||||||||
| Provision (benefit) for deferred income taxes | (321) | (255) | (66) | — | ||||||||||||||||||||||
| Other | 102 | 104 | (135) | 133 |
2
|
|||||||||||||||||||||
| Changes in assets and liabilities, net of acquisitions and divestitures: | ||||||||||||||||||||||||||
| Receivables – trade and other | (326) | (338) | 40 | (28) |
2, 3
|
|||||||||||||||||||||
| Inventories | (2,195) | (2,194) | — | (1) |
2
|
|||||||||||||||||||||
| Accounts payable | 1,232 | 1,194 | 28 | 10 |
2
|
|||||||||||||||||||||
| Accrued expenses | 46 | 117 | (71) | — | ||||||||||||||||||||||
| Accrued wages, salaries and employee benefits | 934 | 905 | 29 | — | ||||||||||||||||||||||
| Customer advances | 39 | 39 | — | — | ||||||||||||||||||||||
| Other assets – net | 138 | 133 | 24 | (19) |
2
|
|||||||||||||||||||||
| Other liabilities – net | (2) | (193) | 144 | 47 |
2
|
|||||||||||||||||||||
| Net cash provided by (used for) operating activities | 5,786 | 4,899 | 1,103 | (216) | ||||||||||||||||||||||
| Cash flow from investing activities: | ||||||||||||||||||||||||||
| Capital expenditures – excluding equipment leased to others | (673) | (670) | (11) | 8 |
2
|
|||||||||||||||||||||
| Expenditures for equipment leased to others | (1,014) | (23) | (997) | 6 |
2
|
|||||||||||||||||||||
| Proceeds from disposals of leased assets and property, plant and equipment | 877 | 71 | 818 | (12) |
2
|
|||||||||||||||||||||
| Additions to finance receivables | (9,603) | — | (10,292) | 689 |
3
|
|||||||||||||||||||||
| Collections of finance receivables | 9,221 | — | 9,946 | (725) |
3
|
|||||||||||||||||||||
| Net intercompany purchased receivables | — | — | 100 | (100) |
3
|
|||||||||||||||||||||
| Proceeds from sale of finance receivables | 44 | — | 44 | — | ||||||||||||||||||||||
| Net intercompany borrowings | — | 1,000 | 3 | (1,003) |
4
|
|||||||||||||||||||||
| Investments and acquisitions (net of cash acquired) | (449) | (449) | — | — | ||||||||||||||||||||||
| Proceeds from sale of businesses and investments (net of cash sold) | 23 | 23 | — | — | ||||||||||||||||||||||
| Proceeds from sale of securities | 424 | 44 | 380 | — | ||||||||||||||||||||||
| Investments in securities | (934) | (542) | (392) | — | ||||||||||||||||||||||
| Other – net | (8) | 59 | (67) | — | ||||||||||||||||||||||
| Net cash provided by (used for) investing activities | (2,092) | (487) | (468) | (1,137) | ||||||||||||||||||||||
| Cash flow from financing activities: | ||||||||||||||||||||||||||
| Dividends paid | (1,733) | (1,733) | (350) | 350 |
5
|
|||||||||||||||||||||
| Common stock issued, including treasury shares reissued | 122 | 122 | — | — | ||||||||||||||||||||||
| Common shares repurchased | (1,622) | (1,622) | — | — | ||||||||||||||||||||||
| Net intercompany borrowings | — | (3) | (1,000) | 1,003 |
4
|
|||||||||||||||||||||
| Proceeds from debt issued (original maturities greater than three months) | 6,931 | 494 | 6,437 | — | ||||||||||||||||||||||
| Payments on debt (original maturities greater than three months) | (8,620) | (1,910) | (6,710) | — | ||||||||||||||||||||||
| Short-term borrowings – net (original maturities three months or less) | 1,324 | (10) | 1,334 | — | ||||||||||||||||||||||
| Other – net | (4) | (4) | — | — | ||||||||||||||||||||||
| Net cash provided by (used for) financing activities | (3,602) | (4,666) | (289) | 1,353 | ||||||||||||||||||||||
| Effect of exchange rate changes on cash | (9) | (14) | 5 | — | ||||||||||||||||||||||
| Increase (decrease) in cash, cash equivalents and restricted cash | 83 | (268) | 351 | — | ||||||||||||||||||||||
| Cash, cash equivalents and restricted cash at beginning of period | 9,366 | 8,822 | 544 | — | ||||||||||||||||||||||
| Cash, cash equivalents and restricted cash at end of period | $ | 9,449 | $ | 8,554 | $ | 895 | $ | — | ||||||||||||||||||
1
Elimination of equity profit earned from Financial Products' subsidiaries partially owned by ME&T subsidiaries.
2
Elimination of non-cash adjustments and changes in assets and liabilities related to consolidated reporting.
3
Reclassification of Financial Products’
cash flow activity from investing to operating for receivables that arose from the sale of inventory.
4
Elimination of net proceeds and payments to/from ME&T and Financial Products.
5
Elimination of dividend activity between Financial Products and ME&T.
77
Caterpillar Inc.
Supplemental Data for Cash Flow
For the Nine Months Ended September 30, 2020
(Unaudited)
(Millions of dollars)
| Supplemental Consolidating Data | ||||||||||||||||||||||||||
| Consolidated |
Machinery,
Energy & Transportation |
Financial
Products |
Consolidating
Adjustments |
|||||||||||||||||||||||
| Cash flow from operating activities: | ||||||||||||||||||||||||||
| Profit of consolidated and affiliated companies | $ | 2,223 | $ | 1,990 | $ | 263 | $ | (30) |
1,5
|
|||||||||||||||||
| Adjustments for non-cash items: | ||||||||||||||||||||||||||
| Depreciation and amortization | 1,815 | 1,217 | 598 | — | ||||||||||||||||||||||
| Net gain on remeasurement of pension obligations | (55) | (55) | — | — | ||||||||||||||||||||||
| Provision (benefit) for deferred income taxes | (38) | (5) | (33) | — | ||||||||||||||||||||||
| Other | 919 | 494 | 167 | 258 |
2
|
|||||||||||||||||||||
| Changes in assets and liabilities, net of acquisitions and divestitures: | ||||||||||||||||||||||||||
| Receivables – trade and other | 1,473 | 616 | (54) | 911 |
2, 3
|
|||||||||||||||||||||
| Inventories | (139) | (130) | — | (9) |
2
|
|||||||||||||||||||||
| Accounts payable | (596) | (599) | (6) | 9 |
2
|
|||||||||||||||||||||
| Accrued expenses | (286) | (314) | 28 | — | ||||||||||||||||||||||
| Accrued wages, salaries and employee benefits | (547) | (512) | (35) | — | ||||||||||||||||||||||
| Customer advances | 13 | 13 | — | — | ||||||||||||||||||||||
| Other assets – net | (15) | (136) | 26 | 95 |
2
|
|||||||||||||||||||||
| Other liabilities – net | (512) | (514) | 83 | (81) |
2
|
|||||||||||||||||||||
| Net cash provided by (used for) operating activities | 4,255 | 2,065 | 1,037 | 1,153 | ||||||||||||||||||||||
| Cash flow from investing activities: | ||||||||||||||||||||||||||
| Capital expenditures – excluding equipment leased to others | (686) | (687) | (11) | 12 |
2
|
|||||||||||||||||||||
| Expenditures for equipment leased to others | (805) | 2 | (823) | 16 |
2
|
|||||||||||||||||||||
| Proceeds from disposals of leased assets and property, plant and equipment | 550 | 119 | 451 | (20) |
2
|
|||||||||||||||||||||
| Additions to finance receivables | (9,278) | — | (10,234) | 956 |
3
|
|||||||||||||||||||||
| Collections of finance receivables | 9,656 | — | 10,822 | (1,166) |
3
|
|||||||||||||||||||||
| Net intercompany purchased receivables | — | — | 971 | (971) |
3
|
|||||||||||||||||||||
| Proceeds from sale of finance receivables | 37 | — | 37 | — | ||||||||||||||||||||||
| Net intercompany borrowings | — | 599 | 6 | (605) |
4
|
|||||||||||||||||||||
| Investments and acquisitions (net of cash acquired) | (93) | (93) | — | — | ||||||||||||||||||||||
| Proceeds from sale of businesses and investments (net of cash sold) | 13 | 13 | — | — | ||||||||||||||||||||||
| Proceeds from sale of securities | 239 | 17 | 222 | — | ||||||||||||||||||||||
| Investments in securities | (512) | (15) | (497) | — | ||||||||||||||||||||||
| Other – net | (80) | (21) | (59) | — | ||||||||||||||||||||||
| Net cash provided by (used for) investing activities | (959) | (66) | 885 | (1,778) | ||||||||||||||||||||||
| Cash flow from financing activities: | ||||||||||||||||||||||||||
| Dividends paid | (1,683) | (1,683) | (20) | 20 |
5
|
|||||||||||||||||||||
| Common stock issued, including treasury shares reissued | 110 | 110 | — | — | ||||||||||||||||||||||
| Common shares repurchased | (1,130) | (1,130) | — | — | ||||||||||||||||||||||
| Net intercompany borrowings | — | (6) | (599) | 605 |
4
|
|||||||||||||||||||||
| Proceeds from debt issued (original maturities greater than three months) | 9,418 | 1,991 | 7,427 | — | ||||||||||||||||||||||
| Payments on debt (original maturities greater than three months) | (6,789) | (18) | (6,771) | — | ||||||||||||||||||||||
| Short-term borrowings – net (original maturities three months or less) | (2,138) | (5) | (2,133) | — | ||||||||||||||||||||||
| Other – net | (1) | (1) | — | — | ||||||||||||||||||||||
| Net cash provided by (used for) financing activities | (2,213) | (742) | (2,096) | 625 | ||||||||||||||||||||||
| Effect of exchange rate changes on cash | (56) | (47) | (9) | — | ||||||||||||||||||||||
| Increase (decrease) in cash, cash equivalents and restricted cash | 1,027 | 1,210 | (183) | — | ||||||||||||||||||||||
| Cash, cash equivalents and restricted cash at beginning of period | 8,292 | 7,302 | 990 | — | ||||||||||||||||||||||
| Cash, cash equivalents and restricted cash at end of period | $ | 9,319 | $ | 8,512 | $ | 807 | $ | — | ||||||||||||||||||
1
Elimination of equity profit earned from Financial Products' subsidiaries partially owned by ME&T subsidiaries.
2
Elimination of non-cash adjustments and changes in assets and liabilities related to consolidated reporting.
3
Reclassification of Financial Products’ cash flow activity from investing to operating for receivables that arose from the sale of inventory.
4
Elimination of net proceeds and payments to/from ME&T and Financial Products.
5
Elimination of dividend activity between Financial Products and ME&T.
78
Forward-looking Statements
Certain statements in this Form 10-Q relate to future events and expectations and are forward-looking statements within the meaning of the Private Securities Litigation Reform Act of 1995. Words such as “believe,” “estimate,” “will be,” “will,” “would,” “expect,” “anticipate,” “plan,” “forecast,” “target,” “guide,” “project,” “intend,” “could,” “should” or other similar words or expressions often identify forward-looking statements. All statements other than statements of historical fact are forward-looking statements, including, without limitation, statements regarding our outlook, projections, forecasts or trend descriptions. These statements do not guarantee future performance and speak only as of the date they are made, and we do not undertake to update our forward-looking statements.
Caterpillar’s actual results may differ materially from those described or implied in our forward-looking statements based on a number of factors, including, but not limited to: (i) global and regional economic conditions and economic conditions in the industries we serve; (ii) commodity price changes, material price increases, fluctuations in demand for our products or significant shortages of material; (iii) government monetary or fiscal policies; (iv) political and economic risks, commercial instability and events beyond our control in the countries in which we operate; (v) international trade policies and their impact on demand for our products and our competitive position, including the imposition of new tariffs or changes in existing tariff rates; (vi) our ability to develop, produce and market quality products that meet our customers’ needs; (vii) the impact of the highly competitive environment in which we operate on our sales and pricing; (viii) information technology security threats and computer crime; (ix) inventory management decisions and sourcing practices of our dealers and our OEM customers; (x) a failure to realize, or a delay in realizing, all of the anticipated benefits of our acquisitions, joint ventures or divestitures; (xi) union disputes or other employee relations issues; (xii) adverse effects of unexpected events; (xiii) disruptions or volatility in global financial markets limiting our sources of liquidity or the liquidity of our customers, dealers and suppliers; (xiv) failure to maintain our credit ratings and potential resulting increases to our cost of borrowing and adverse effects on our cost of funds, liquidity, competitive position and access to capital markets; (xv) our Financial Products segment’s risks associated with the financial services industry; (xvi) changes in interest rates or market liquidity conditions; (xvii) an increase in delinquencies, repossessions or net losses of Cat Financial’s customers; (xviii) currency fluctuations; (xix) our or Cat Financial’s compliance with financial and other restrictive covenants in debt agreements; (xx) increased pension plan funding obligations; (xxi) alleged or actual violations of trade or anti-corruption laws and regulations; (xxii) additional tax expense or exposure, including the impact of U.S. tax reform; (xxiii) significant legal proceedings, claims, lawsuits or government investigations; (xxiv) new regulations or changes in financial services regulations; (xxv) compliance with environmental laws and regulations; (xxvi) the duration and geographic spread of, business disruptions caused by, and the overall global economic impact of, the COVID-19 pandemic; and (xxvii) other factors described in more detail under the section entitled "Part I - Item 1A. Risk Factors" of Caterpillar's Annual Report on Form 10-K for the fiscal year ended December 31, 2020, as such factors may be updated from time to time in Caterpillar's periodic filings with the Securities and Exchange Commission.
Item 3. Quantitative and Qualitative Disclosures About Market Risk
The information required by this Item is incorporated by reference from Note 5 – “Derivative financial instruments and risk management” included in Part I, Item 1 and Management’s Discussion and Analysis included in Part I, Item 2 of this Form 10-Q.
Item 4. Controls and Procedures
Evaluation of disclosure controls and procedures
An evaluation was performed under the supervision and with the participation of the company’s management, including the Chief Executive Officer (CEO) and Chief Financial Officer (CFO), of the effectiveness of the design and operation of the company’s disclosure controls and procedures, as that term is defined in Rule 13a-15(e) under the Securities Exchange Act of 1934, as amended, as of the end of the period covered by this quarterly report. Based on that evaluation, the CEO and CFO concluded that the company’s disclosure controls and procedures were effective as of the end of the period covered by this quarterly report.
Changes in internal control over financial reporting
During the third quarter of 2021, there has been no change in the company’s internal control over financial reporting that has materially affected, or is reasonably likely to materially affect, the company’s internal control over financial reporting.
79
PART II. OTHER INFORMATION
Item 1. Legal Proceedings
The information required by this Item is incorporated by reference from Note 14 – “Environmental and legal matters” included in Part I, Item 1 of this Form 10-Q.
Item 1A. Risk Factors
There have been no material changes to the risk factors we previously disclosed in our Annual Report on
Form 10-K
for the year ended December 31, 2020.
Item 2. Unregistered Sales of Equity Securities and Use of Proceeds
Issuer Purchases of Equity Securities
| Period |
Total Number
of Shares
Purchased
2,3
|
Average Price
Paid per Share
2,3
|
Total Number
of Shares Purchased as Part of Publicly Announced Program |
Approximate Dollar
Value of Shares that
may yet be Purchased
under the Program (in billions)
1
|
||||||||||||||||||||||
| July 1-31, 2021 | 2,134,721 | $ | 211.64 | 2,134,721 | $ | 4.064 | ||||||||||||||||||||
| August 1-31, 2021 | 3,117,946 | $ | 207.19 | 3,117,946 | $ | 3.418 | ||||||||||||||||||||
| September 1-30, 2021 | 1,357,771 | $ | 201.53 | 1,357,771 | $ | 3.144 | ||||||||||||||||||||
| Total | 6,610,438 | $ | 207.46 | 6,610,438 | ||||||||||||||||||||||
|
1
In July 2018, the Board approved a share repurchase authorization of up to $10.0 billion of Caterpillar common stock effective January 1, 2019, with no expiration (the 2018 Authorization). As of September 30, 2021, approximately $3.1 billion remained available under the 2018 Authorization.
|
||||||||||||||||||||||||||
|
2
During the third quarter of 2021, we entered into an ASR with a third-party financial institution to purchase $750 million of our common stock. In August 2021, upon payment of the $750 million to the financial institution, we received 2.9 million shares. In September 2021, upon final settlement of the ASR, we received an additional 0.7 million shares. In total, we repurchased 3.6 million shares under this ASR at an average price per share of $206.21.
|
||||||||||||||||||||||||||
|
3
In July, August and September of 2021, we repurchased 2.2 million, 0.2 million and 0.6 million shares respectively, for an aggregate of $622 million in open market transactions at an average price per share of $211.64, $208.70 and $200.00, respectively.
|
||||||||||||||||||||||||||
Non-U.S. Employee Stock Purchase Plans
As of September 30, 2021, we had 28 employee stock purchase plans (the “EIP Plans”) that are administered outside the United States for our non-U.S. employees, which had approximately 12,000 active participants in the aggregate. During the third quarter of 2021, approximately 73,000 shares of Caterpillar common stock were purchased by the EIP Plans pursuant to the terms of such plans.
80
Item 6. Exhibits
The agreements and other documents filed as exhibits to this report are not intended to provide factual information or other disclosure other than with respect to the terms of the agreements or other documents themselves, and you should not rely on them for that purpose. In particular, any representations and warranties made by us in these agreements or other documents were made solely within the specific context of the relevant agreement or document and may not describe the actual state of affairs as of the date they were made or at any other time.
81
SIGNATURES
Pursuant to the requirements of the Securities Exchange Act of 1934, the Registrant has duly caused this report to be signed on its behalf by the undersigned thereunto duly authorized.
| CATERPILLAR INC. | ||||||||
| November 3, 2021 | /s/ D. James Umpleby III | Chairman of the Board & Chief Executive Officer | ||||||
| D. James Umpleby III | ||||||||
| November 3, 2021 | /s/ Andrew R.J. Bonfield | Chief Financial Officer | ||||||
| Andrew R.J. Bonfield | ||||||||
| November 3, 2021 | /s/ Suzette M. Long | Chief Legal Officer and General Counsel | ||||||
| Suzette M. Long | ||||||||
| November 3, 2021 | /s/ G. Michael Marvel | Chief Accounting Officer | ||||||
| G. Michael Marvel | ||||||||
82
TABLE OF CONTENTS
Part I. Financial InformationItem 1. Financial StatementsItem 2. Management S Discussion and Analysis Of Financial Condition and Results Of OperationsItem 3. Quantitative and Qualitative Disclosures About Market RiskItem 4. Controls and ProceduresPart II. Other InformationItem 1. Legal ProceedingsItem 1A. Risk FactorsItem 2. Unregistered Sales Of Equity Securities and Use Of ProceedsItem 6. Exhibits